🔥 Would you like to save this?
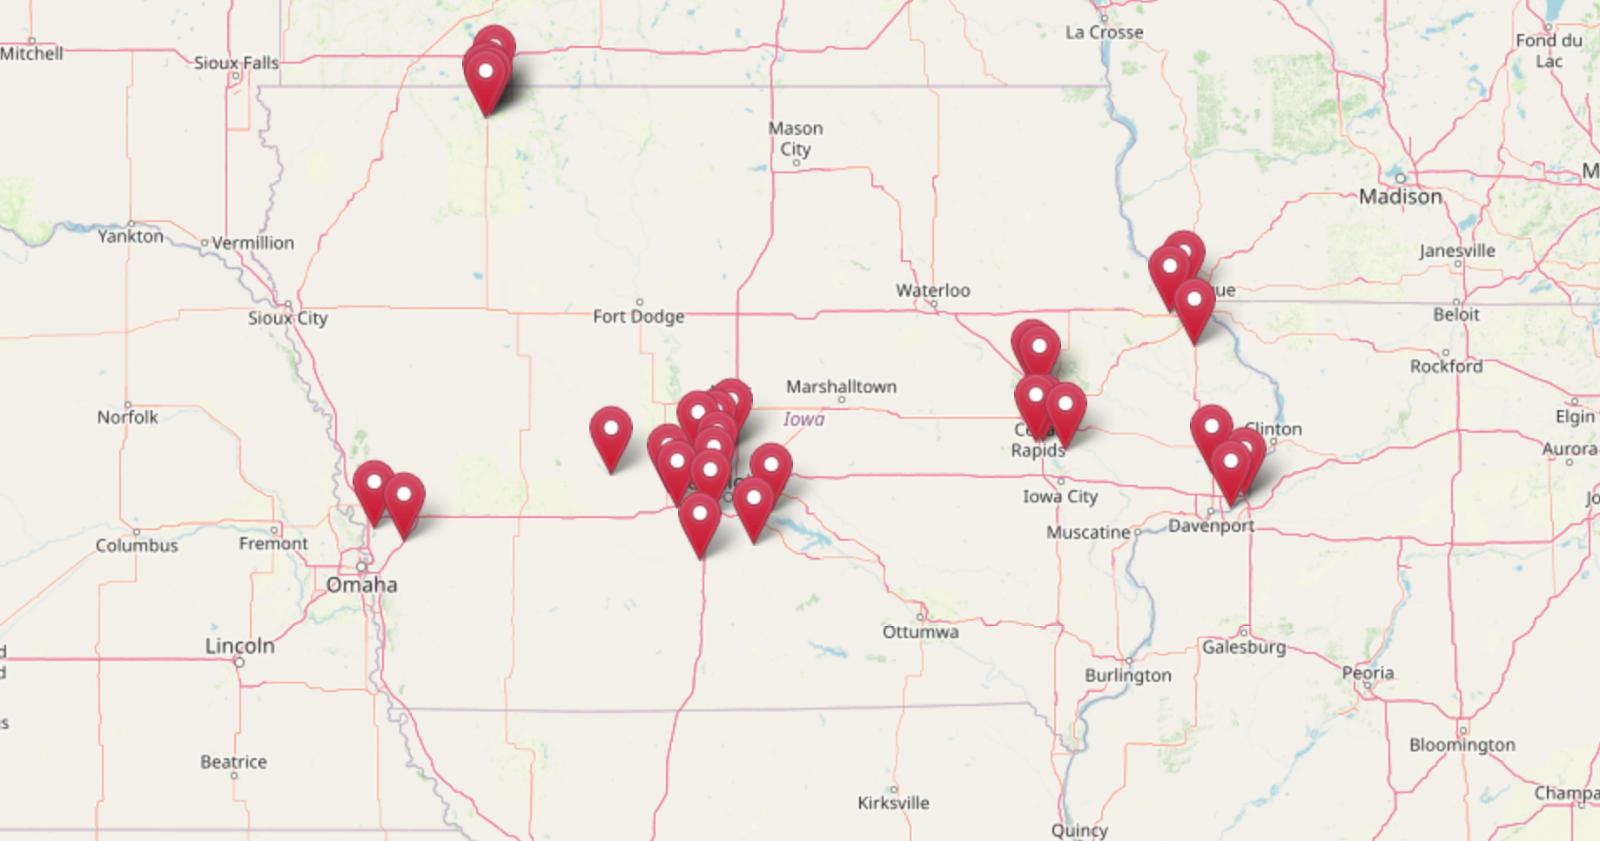
Iowa’s most expensive towns don’t look like your typical luxury markets — but the numbers tell a different story. According to Zillow’s Home Value Index, the top 30 towns in the state now have median home prices well above $375,000, with some pushing past $750,000. Many of these spots were considered affordable just a decade ago, but pandemic-era demand, shrinking inventory, and lifestyle shifts have sent prices soaring.
Lakefront escapes in the Iowa Great Lakes region dominate the upper tier, joined by Des Moines suburbs and college town enclaves near Iowa City. Whether it’s the lure of water views, excellent schools, or access to jobs without sacrificing small-town charm, these communities have emerged as Iowa’s most desirable — and priciest — places to buy a home.
In order to come up with the very specific design ideas, we create most designs with the assistance of state-of-the-art AI interior design software. Also, assume links that take you off the site are affiliate links such as links to Amazon. this means we may earn a commission if you buy something.
30. Underwood – 91% Home Price Increase Since 2010
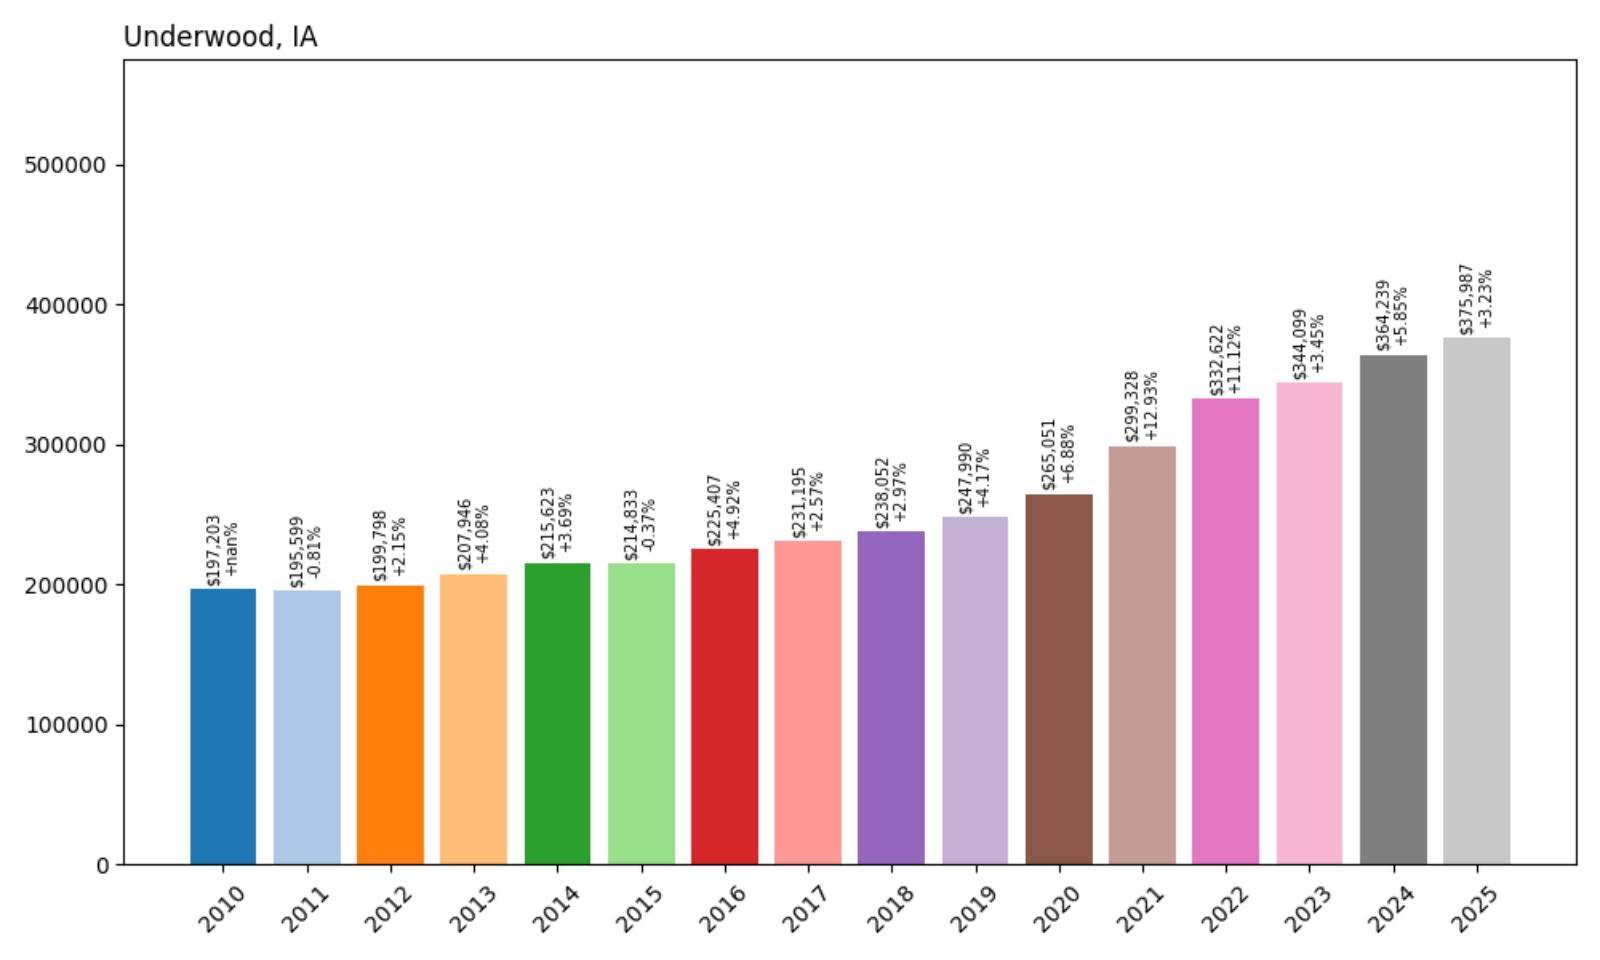
- 2010: $197,203
- 2011: $195,599 (−$1,605, −0.81% from previous year)
- 2012: $199,798 (+$4,199, +2.15% from previous year)
- 2013: $207,946 (+$8,148, +4.08% from previous year)
- 2014: $215,623 (+$7,678, +3.69% from previous year)
- 2015: $214,833 (−$790, −0.37% from previous year)
- 2016: $225,407 (+$10,574, +4.92% from previous year)
- 2017: $231,195 (+$5,789, +2.57% from previous year)
- 2018: $238,052 (+$6,856, +2.97% from previous year)
- 2019: $247,990 (+$9,938, +4.17% from previous year)
- 2020: $265,051 (+$17,061, +6.88% from previous year)
- 2021: $299,328 (+$34,276, +12.93% from previous year)
- 2022: $332,622 (+$33,295, +11.12% from previous year)
- 2023: $344,099 (+$11,477, +3.45% from previous year)
- 2024: $364,239 (+$20,140, +5.85% from previous year)
- 2025: $375,987 (+$11,748, +3.23% from previous year)
Underwood’s housing market demonstrates steady appreciation with notable acceleration during the pandemic years. The town experienced its strongest growth between 2020 and 2022, when home values jumped from $265,051 to $332,622. Current median home prices of $375,987 reflect continued demand in this western Iowa community, though growth has moderated from the explosive gains seen in recent years.
Underwood – Small Town Appeal Near Omaha Metro
Located in Pottawattamie County near the Nebraska border, Underwood benefits from its proximity to the Omaha metropolitan area while maintaining a small-town atmosphere. The community of fewer than 1,000 residents offers rural living with urban convenience, attracting families seeking affordable alternatives to Omaha suburbs. Local amenities include well-maintained parks and recreational facilities that appeal to young families.
The town’s strategic location along major transportation corridors has contributed to its housing market stability. Underwood sits approximately 20 miles northeast of Omaha, making it an attractive option for commuters who work in Nebraska but prefer Iowa’s tax structure and community feel. The steady price appreciation reflects growing recognition of the area’s value proposition, particularly among buyers priced out of pricier metro markets.
29. Asbury – 69% Home Price Increase Since 2010
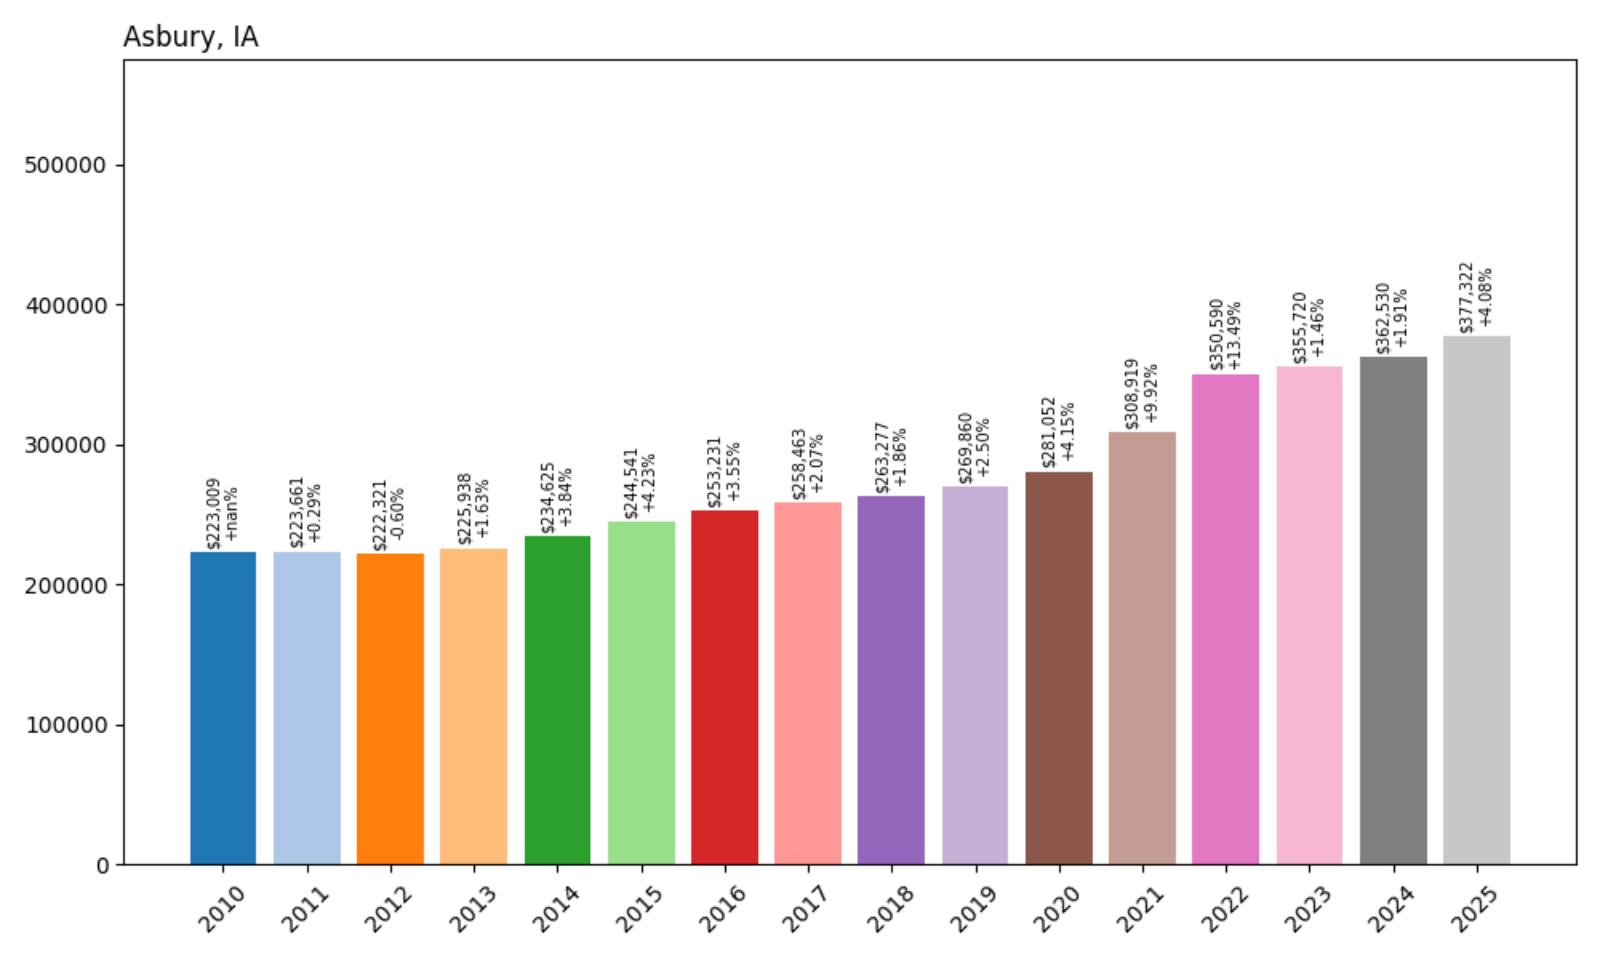
- 2010: $223,009
- 2011: $223,661 (+$652, +0.29% from previous year)
- 2012: $222,321 (−$1,340, −0.60% from previous year)
- 2013: $225,938 (+$3,617, +1.63% from previous year)
- 2014: $234,625 (+$8,687, +3.84% from previous year)
- 2015: $244,541 (+$9,916, +4.23% from previous year)
- 2016: $253,231 (+$8,690, +3.55% from previous year)
- 2017: $258,463 (+$5,233, +2.07% from previous year)
- 2018: $263,277 (+$4,813, +1.86% from previous year)
- 2019: $269,860 (+$6,583, +2.50% from previous year)
- 2020: $281,052 (+$11,192, +4.15% from previous year)
- 2021: $308,919 (+$27,867, +9.92% from previous year)
- 2022: $350,590 (+$41,671, +13.49% from previous year)
- 2023: $355,720 (+$5,130, +1.46% from previous year)
- 2024: $362,530 (+$6,810, +1.91% from previous year)
- 2025: $377,322 (+$14,792, +4.08% from previous year)
Asbury’s housing market shows consistent growth patterns with significant acceleration after 2020. The most dramatic increase occurred in 2022, when home values surged by over $41,000, representing a 13.49% single-year gain. Today’s median price of $377,322 reflects the community’s position as an established suburban destination in eastern Iowa, with recent growth suggesting continued buyer interest despite slowing appreciation rates.
Asbury – Dubuque County Suburban Growth
Situated in Dubuque County, Asbury has evolved from a rural township into a thriving suburban community of approximately 5,000 residents. The city’s location just southwest of Dubuque provides easy access to employment centers while offering newer housing developments and modern amenities. Asbury’s planned growth approach has attracted families seeking contemporary homes with updated features and larger lot sizes than typically available in older urban areas.
The community’s appeal stems from its combination of suburban convenience and small-town character. Asbury features well-designed residential neighborhoods, quality schools, and recreational facilities that cater to active families. The steady price appreciation reflects the area’s desirability among buyers seeking alternatives to Dubuque’s historic neighborhoods, particularly those prioritizing newer construction and modern layouts over older architectural styles.
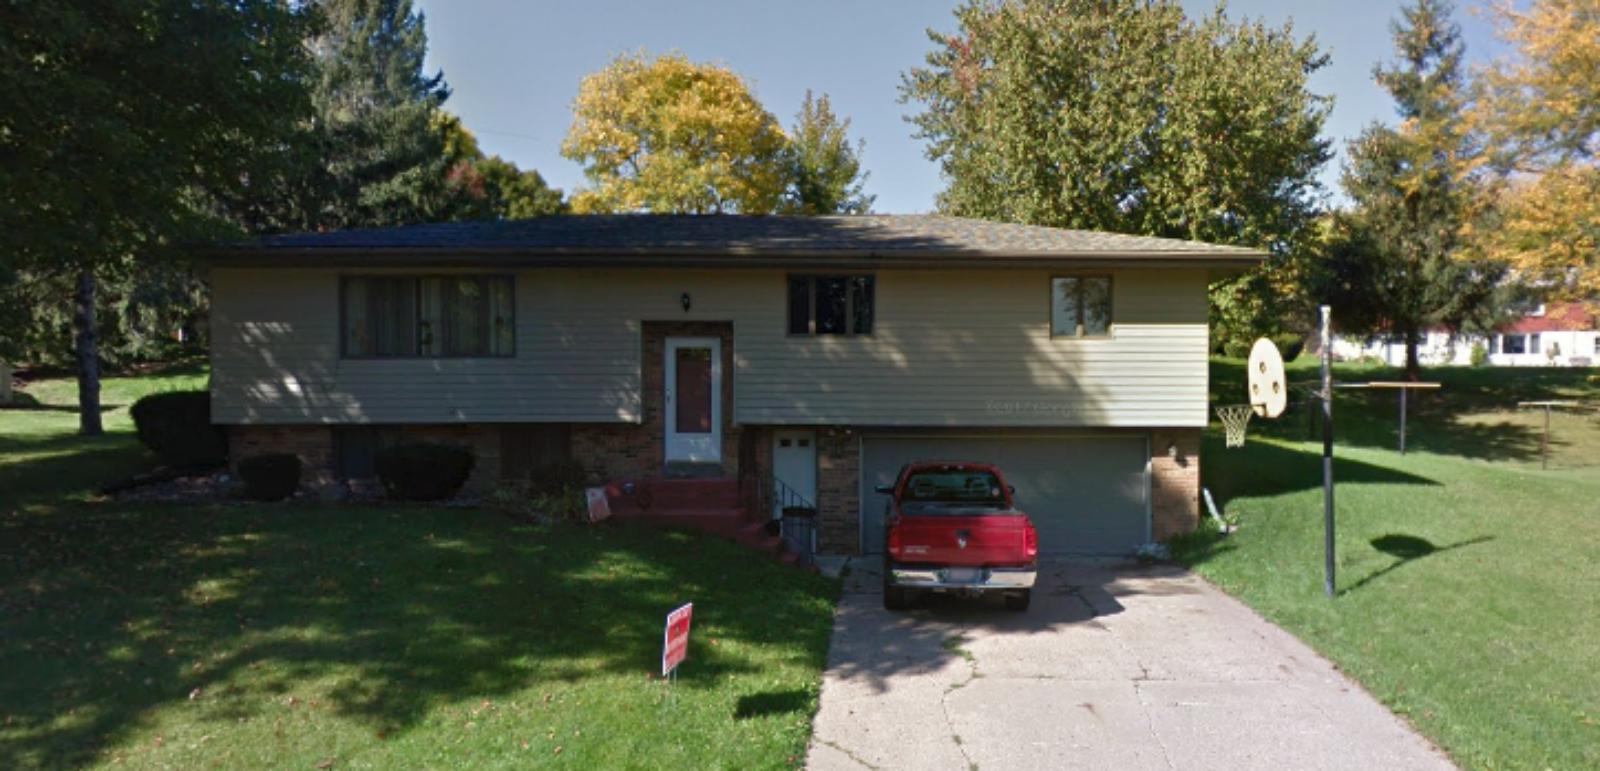
28. Le Claire – 85% Home Price Increase Since 2010
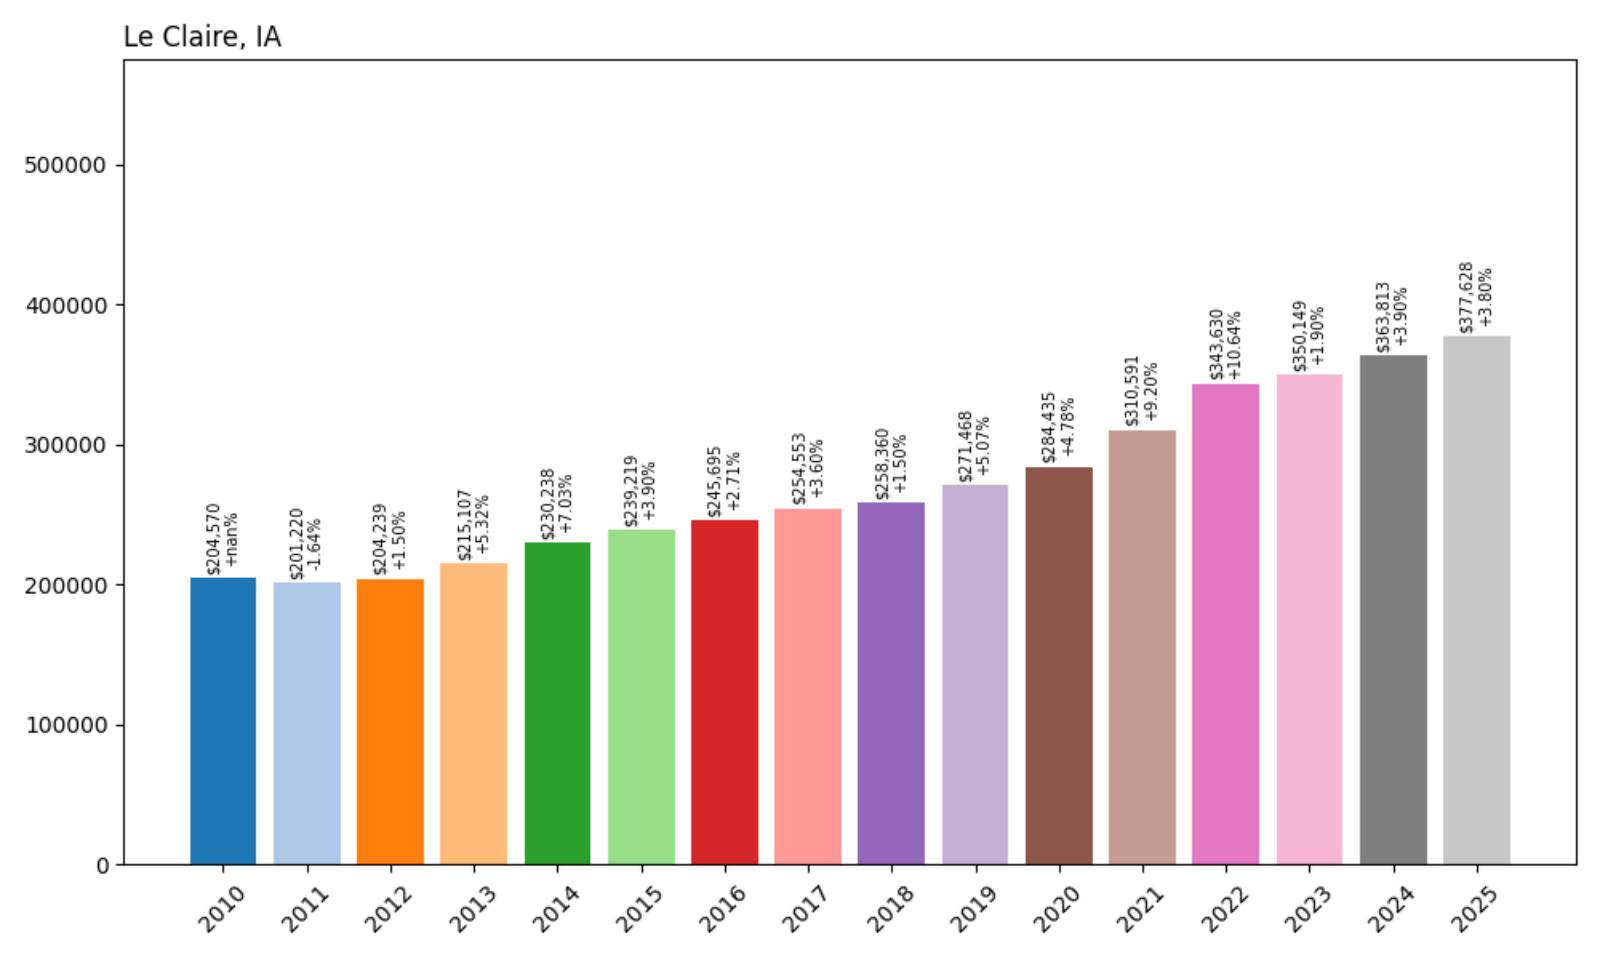
- 2010: $204,570
- 2011: $201,220 (−$3,350, −1.64% from previous year)
- 2012: $204,239 (+$3,019, +1.50% from previous year)
- 2013: $215,107 (+$10,868, +5.32% from previous year)
- 2014: $230,238 (+$15,131, +7.03% from previous year)
- 2015: $239,219 (+$8,980, +3.90% from previous year)
- 2016: $245,695 (+$6,477, +2.71% from previous year)
- 2017: $254,553 (+$8,857, +3.60% from previous year)
- 2018: $258,360 (+$3,807, +1.50% from previous year)
- 2019: $271,468 (+$13,108, +5.07% from previous year)
- 2020: $284,435 (+$12,967, +4.78% from previous year)
- 2021: $310,591 (+$26,156, +9.20% from previous year)
- 2022: $343,630 (+$33,039, +10.64% from previous year)
- 2023: $350,149 (+$6,519, +1.90% from previous year)
- 2024: $363,813 (+$13,664, +3.90% from previous year)
- 2025: $377,628 (+$13,815, +3.80% from previous year)
Le Claire’s housing market demonstrates remarkable consistency in appreciation, with particularly strong performance during 2021-2022 when values jumped from $284,435 to $343,630. The current median price of $377,628 represents steady growth that has continued even as many markets have cooled. The community’s 85% total appreciation since 2010 reflects sustained demand for Mississippi River waterfront living and historic charm.
Le Claire – Historic Riverfront Community
Located along the Mississippi River in Scott County, Le Claire combines historic significance with modern amenities to create a unique residential market. The city of approximately 4,000 residents celebrates its riverboat heritage while offering contemporary lifestyle options. Buffalo Bill Cody’s birthplace adds cultural cache, while the annual tugboat festival and antique shops draw visitors year-round. The combination of water access, historic character, and proximity to the Quad Cities makes Le Claire particularly appealing to buyers seeking distinctive properties.
The steady price appreciation reflects Le Claire’s success in balancing preservation with progress. New residential developments complement the historic downtown, creating housing options for various income levels while maintaining the community’s character. The city’s location between Davenport and Bettendorf provides employment access while offering a more relaxed pace of life. Recreational opportunities along the Mississippi River, including boating and fishing, add to the area’s appeal for outdoor enthusiasts.
27. Riverdale – 77% Home Price Increase Since 2010

- 2010: $218,060
- 2011: $214,274 (−$3,785, −1.74% from previous year)
- 2012: $225,375 (+$11,101, +5.18% from previous year)
- 2013: $237,770 (+$12,395, +5.50% from previous year)
- 2014: $248,965 (+$11,196, +4.71% from previous year)
- 2015: $255,666 (+$6,700, +2.69% from previous year)
- 2016: $263,226 (+$7,560, +2.96% from previous year)
- 2017: $273,607 (+$10,381, +3.94% from previous year)
- 2018: $271,794 (−$1,812, −0.66% from previous year)
- 2019: $286,792 (+$14,997, +5.52% from previous year)
- 2020: $296,171 (+$9,379, +3.27% from previous year)
- 2021: $326,301 (+$30,130, +10.17% from previous year)
- 2022: $358,735 (+$32,434, +9.94% from previous year)
- 2023: $366,735 (+$8,001, +2.23% from previous year)
- 2024: $376,409 (+$9,674, +2.64% from previous year)
- 2025: $385,737 (+$9,328, +2.48% from previous year)
Riverdale’s housing market shows steady appreciation with notable strength during the pandemic era. The community experienced its most significant gains between 2021 and 2022, when values increased by over $62,000 across two years. Current median prices of $385,737 reflect the area’s continued desirability, with moderate but consistent growth suggesting a stable market foundation.
Riverdale – Scott County Suburban Excellence
Positioned in Scott County near Bettendorf, Riverdale represents planned suburban development at its finest. This small community of approximately 700 residents offers larger lot sizes and newer construction than typically found in established urban areas. The city’s careful growth management has created an exclusive feel while maintaining accessibility to Quad Cities employment and entertainment options. Riverdale’s appeal lies in its combination of privacy and convenience, attracting professionals and families seeking upscale suburban living.
The community’s housing market strength reflects its position as a premium residential destination. Well-maintained neighborhoods feature contemporary homes with modern amenities, while the city’s location provides quick access to Interstate highways and commercial districts. Riverdale’s commitment to maintaining high development standards has preserved property values and created a sense of exclusivity that appeals to discerning buyers. The steady appreciation pattern suggests confidence in the area’s long-term desirability and growth potential.
26. Zwingle – 85% Home Price Increase Since 2016
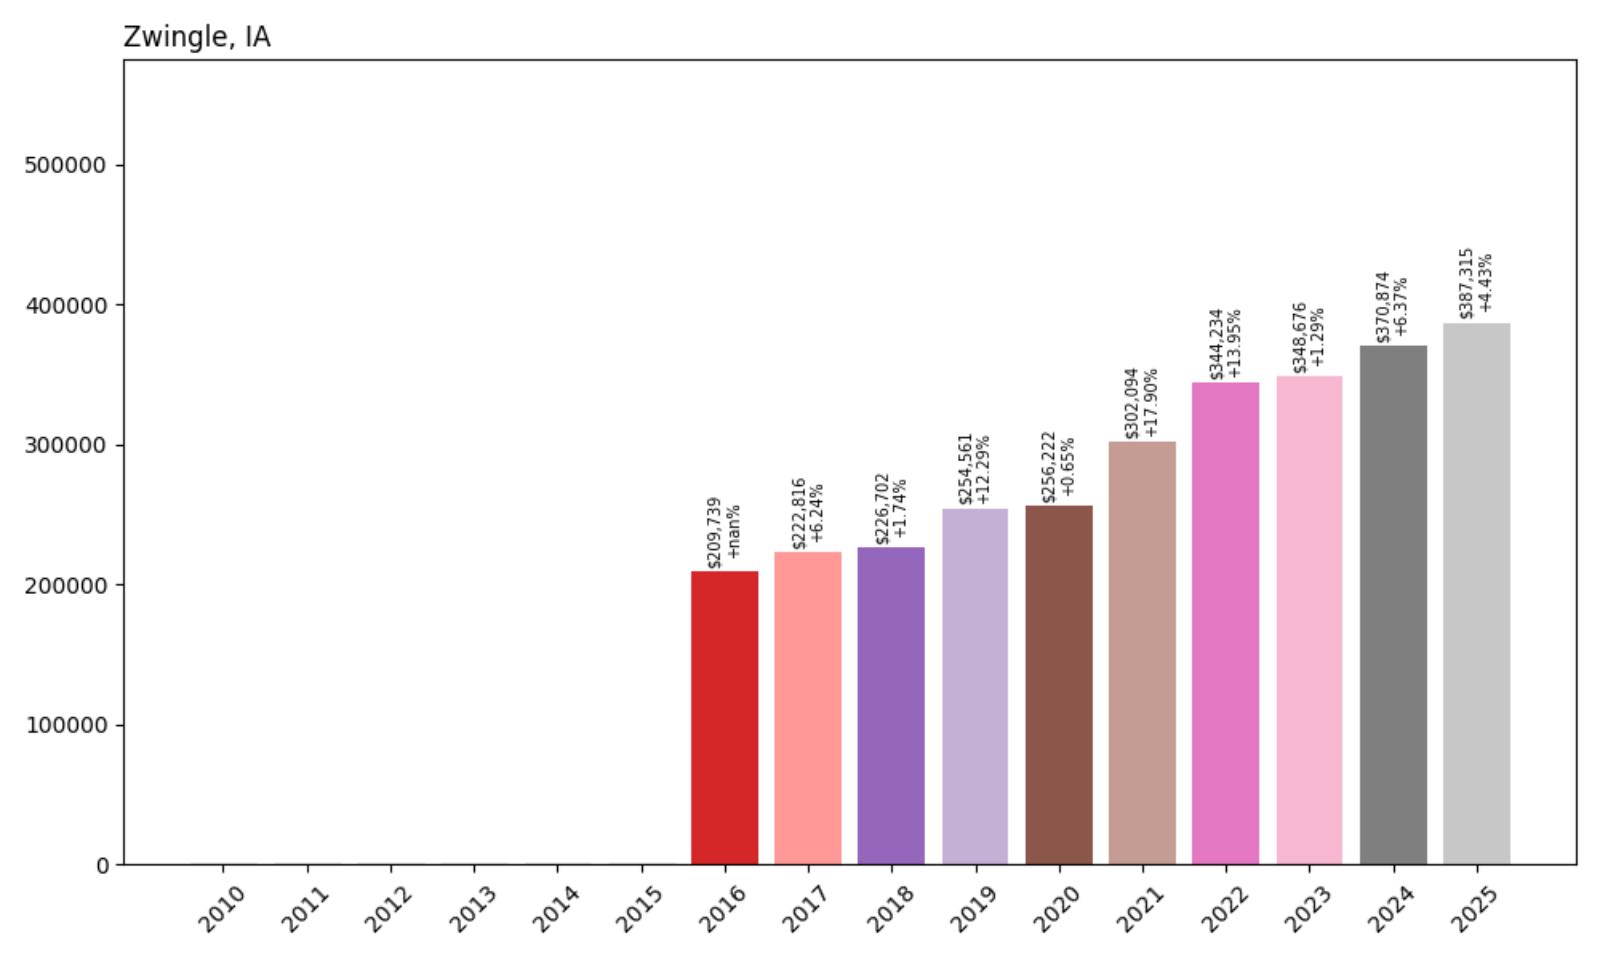
- 2016: $209,739
- 2017: $222,816 (+$13,078, +6.24% from previous year)
- 2018: $226,702 (+$3,886, +1.74% from previous year)
- 2019: $254,561 (+$27,858, +12.29% from previous year)
- 2020: $256,222 (+$1,662, +0.65% from previous year)
- 2021: $302,094 (+$45,871, +17.90% from previous year)
- 2022: $344,234 (+$42,140, +13.95% from previous year)
- 2023: $348,676 (+$4,442, +1.29% from previous year)
- 2024: $370,874 (+$22,198, +6.37% from previous year)
- 2025: $387,315 (+$16,441, +4.43% from previous year)
Zwingle’s housing data begins in 2016, showing explosive growth that peaked during 2021-2022 when values increased by nearly $88,000 over two years. The 17.90% gain in 2021 represents one of the strongest single-year performances in the dataset. Current median prices of $387,315 demonstrate continued momentum, with the community achieving 85% appreciation in less than a decade of recorded data.
Zwingle – Rural Dubuque County Retreat
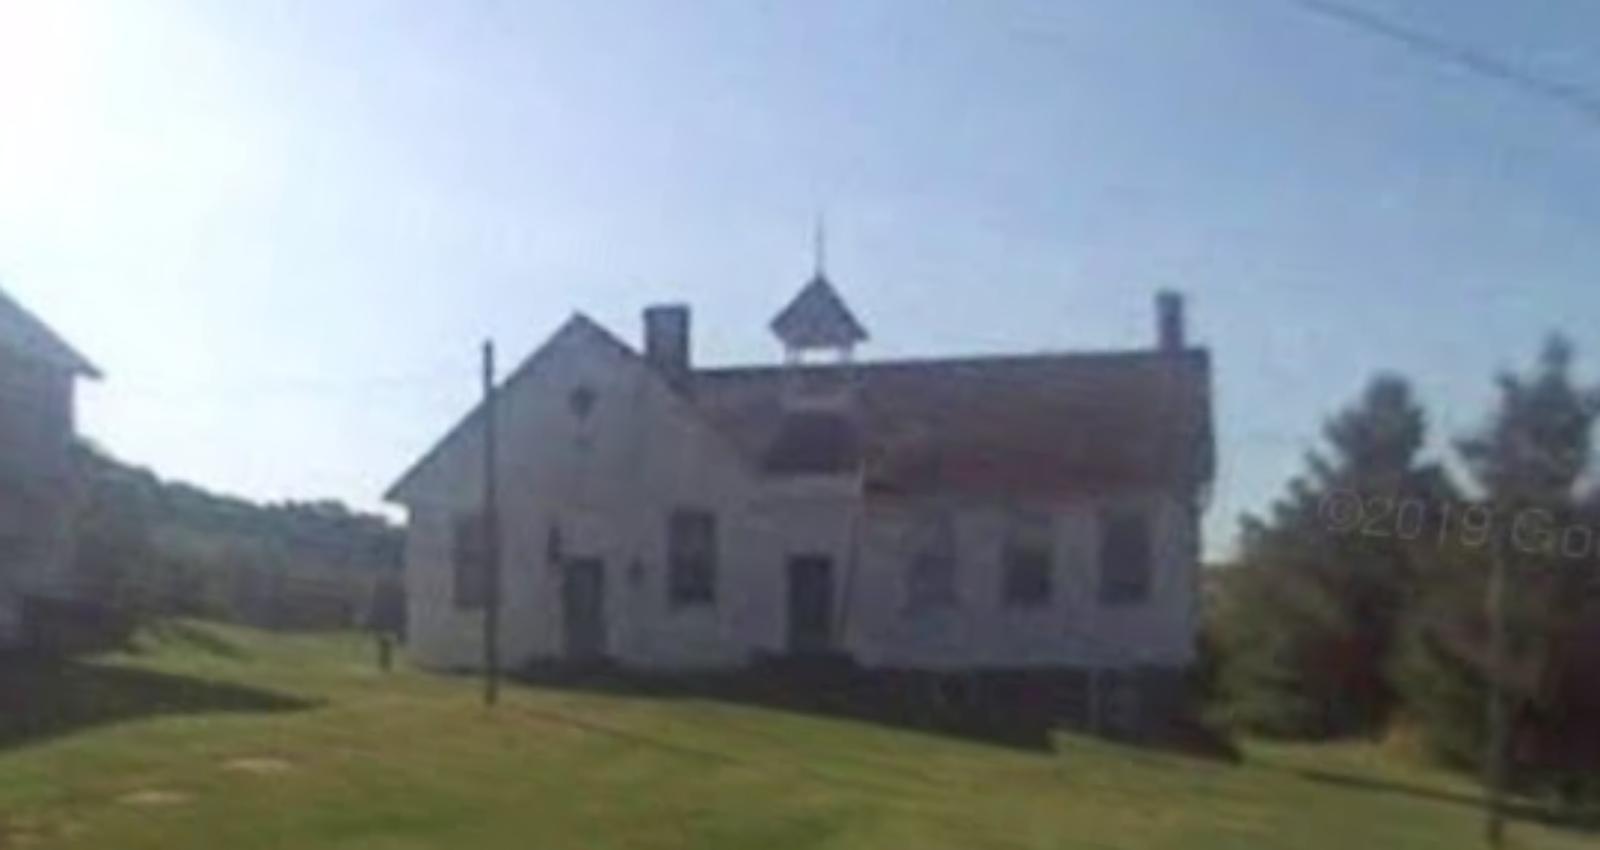
Located in rural Dubuque County, Zwingle offers country living with reasonable access to urban amenities. This small community has attracted buyers seeking larger properties and rural lifestyle while maintaining commuting distance to Dubuque employment centers. The dramatic price appreciation since 2016 reflects growing demand for rural properties and the premium buyers place on privacy, space, and natural settings. Zwingle’s appeal has grown as remote work options have made rural living more practical for professionals.
The housing market surge in Zwingle mirrors broader trends toward rural and suburban migration that accelerated during the pandemic. Buyers attracted to the area typically seek properties with acreage, modern amenities, and scenic settings that provide escape from urban density. The community’s proximity to recreational areas and outdoor activities adds to its appeal for families and retirees. The sustained price growth suggests continued recognition of Zwingle’s value proposition among buyers prioritizing space and tranquility over urban convenience.
25. Saint Charles – 173% Home Price Increase Since 2010
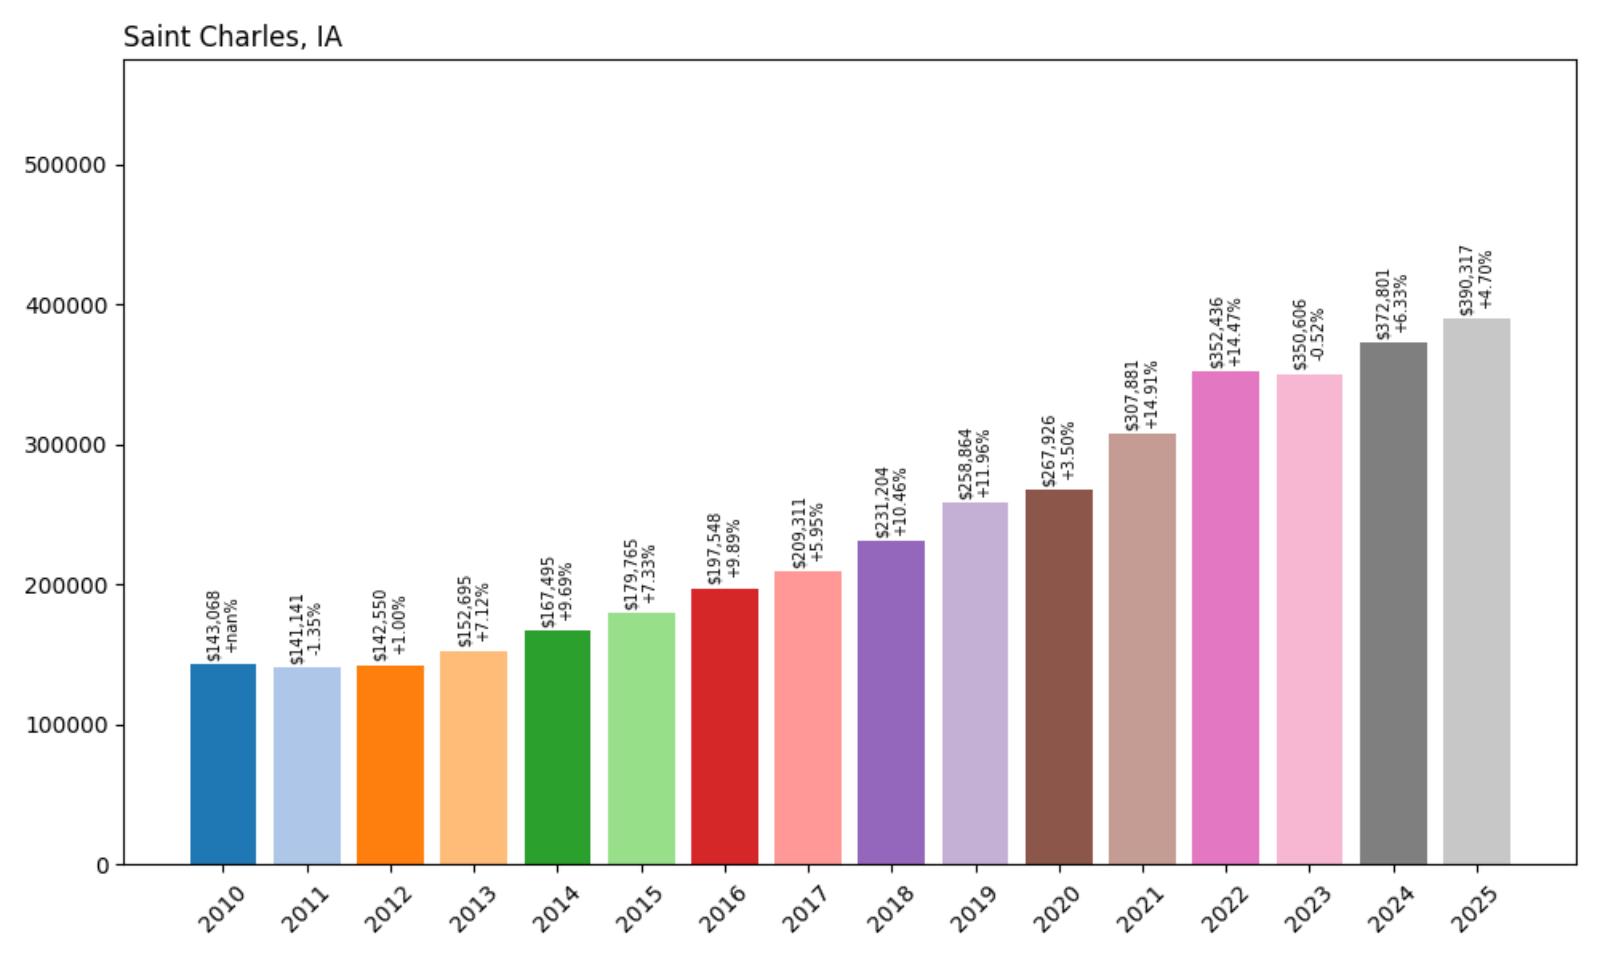
- 2010: $143,068
- 2011: $141,141 (−$1,927, −1.35% from previous year)
- 2012: $142,550 (+$1,409, +1.00% from previous year)
- 2013: $152,695 (+$10,145, +7.12% from previous year)
- 2014: $167,495 (+$14,801, +9.69% from previous year)
- 2015: $179,765 (+$12,269, +7.33% from previous year)
- 2016: $197,548 (+$17,784, +9.89% from previous year)
- 2017: $209,311 (+$11,762, +5.95% from previous year)
- 2018: $231,204 (+$21,893, +10.46% from previous year)
- 2019: $258,864 (+$27,660, +11.96% from previous year)
- 2020: $267,926 (+$9,062, +3.50% from previous year)
- 2021: $307,881 (+$39,955, +14.91% from previous year)
- 2022: $352,436 (+$44,555, +14.47% from previous year)
- 2023: $350,606 (−$1,831, −0.52% from previous year)
- 2024: $372,801 (+$22,195, +6.33% from previous year)
- 2025: $390,317 (+$17,517, +4.70% from previous year)
Saint Charles demonstrates the most dramatic price appreciation in this group, with values nearly tripling since 2010. The community experienced consistent double-digit growth between 2016 and 2022, with particularly strong performance in 2021-2022 when prices jumped from $267,926 to $352,436. Current median prices of $390,317 represent extraordinary 173% growth, reflecting transformation from an affordable rural community to a premium residential destination.
Saint Charles – Madison County Success Story
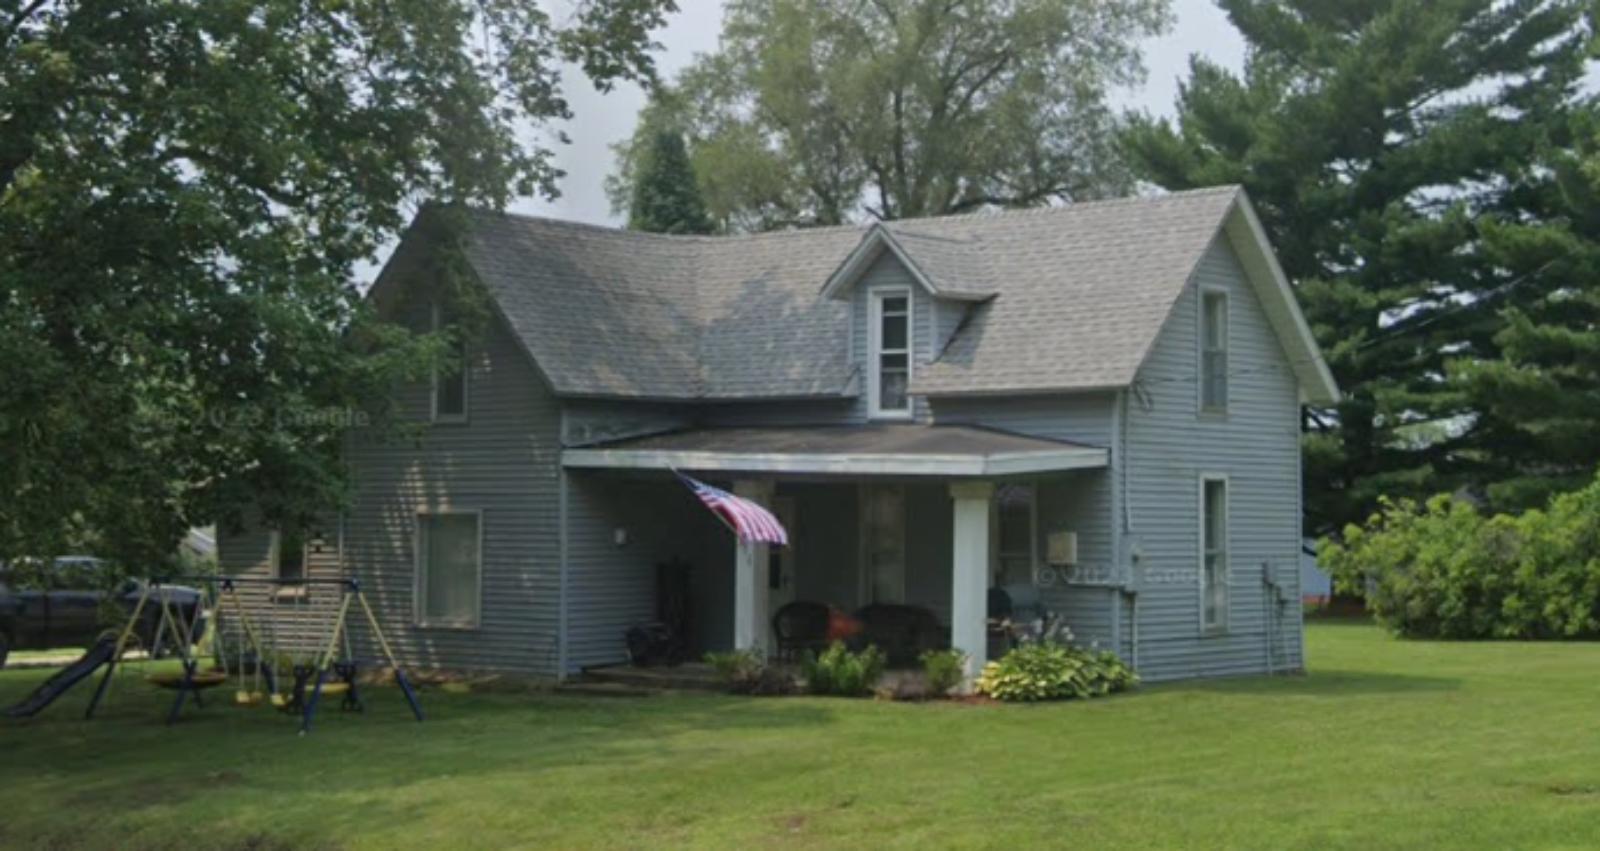
Located in Madison County south of Des Moines, Saint Charles has evolved from a small agricultural community into a sought-after residential destination. The town’s proximity to the state capital, combined with rural character and modern amenities, has attracted families and professionals seeking alternatives to urban living. Saint Charles benefits from excellent schools and recreational facilities while maintaining the tight-knit community feel that appeals to buyers prioritizing quality of life over urban conveniences.
The remarkable price appreciation reflects Saint Charles’s successful transition into a commuter community for Des Moines professionals. Improved transportation access and residential development have expanded housing options while preserving the area’s small-town character. The community’s appeal has grown significantly among families seeking larger homes and properties at more affordable prices than available closer to the metro core. Recent growth patterns suggest continued confidence in the area’s potential and desirability among buyers seeking suburban alternatives.
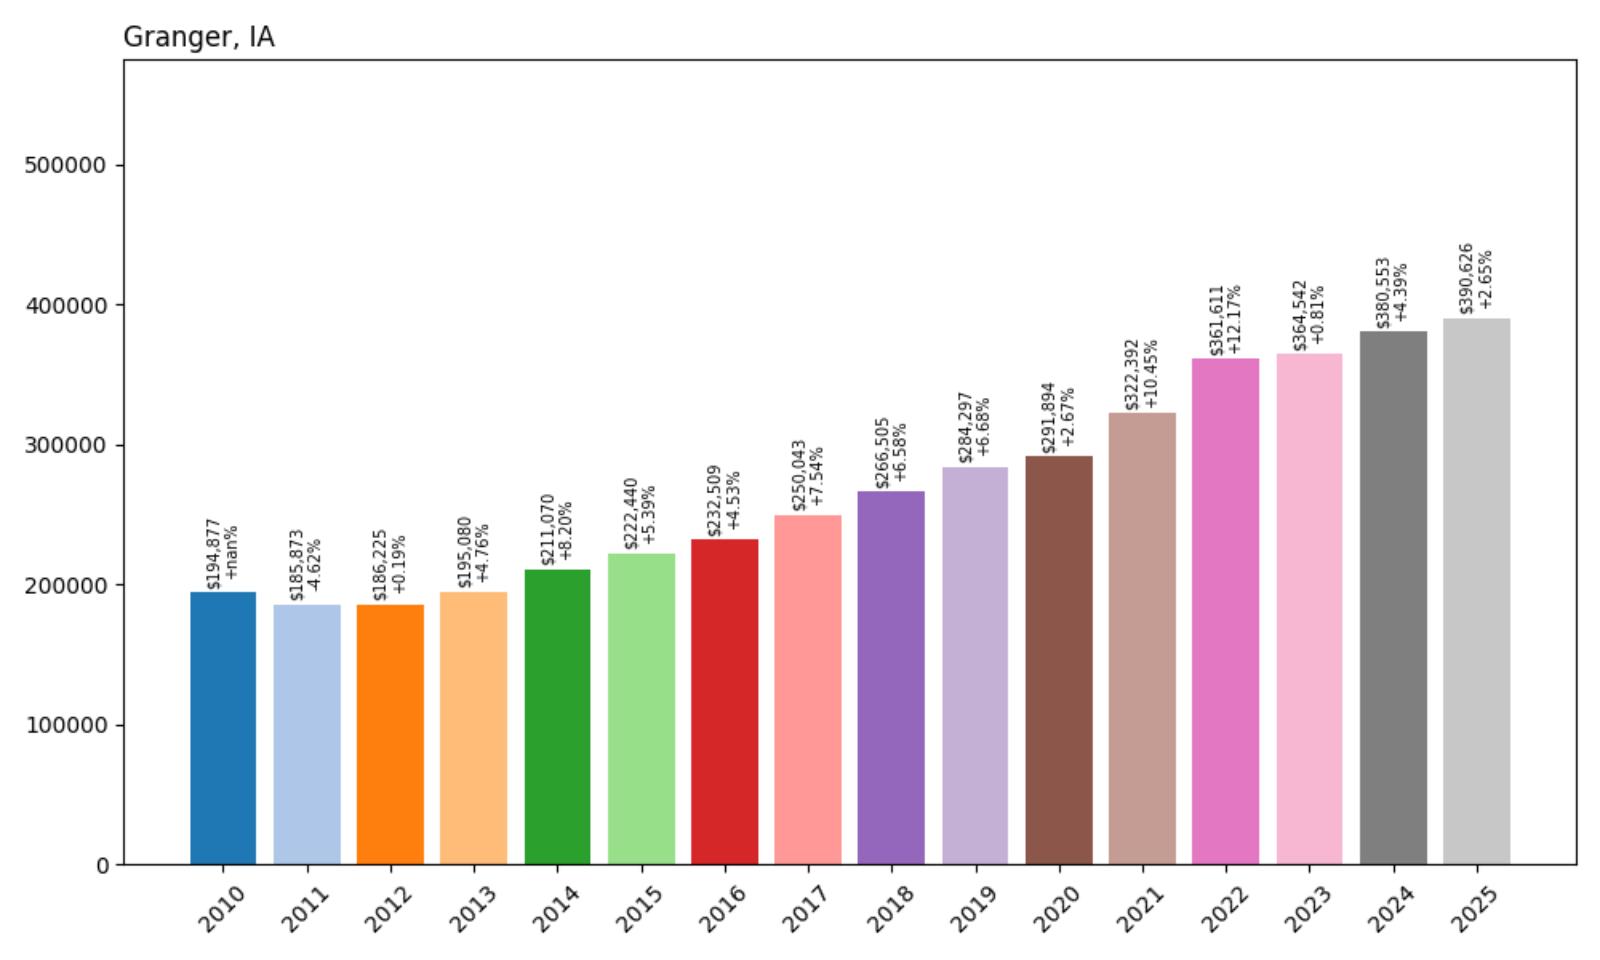
24. Granger – 100% Home Price Increase Since 2010
🔥 Would you like to save this?
- 2010: $194,877
- 2011: $185,873 (−$9,003, −4.62% from previous year)
- 2012: $186,225 (+$351, +0.19% from previous year)
- 2013: $195,080 (+$8,856, +4.76% from previous year)
- 2014: $211,070 (+$15,990, +8.20% from previous year)
- 2015: $222,440 (+$11,370, +5.39% from previous year)
- 2016: $232,509 (+$10,069, +4.53% from previous year)
- 2017: $250,043 (+$17,534, +7.54% from previous year)
- 2018: $266,505 (+$16,463, +6.58% from previous year)
- 2019: $284,297 (+$17,792, +6.68% from previous year)
- 2020: $291,894 (+$7,597, +2.67% from previous year)
- 2021: $322,392 (+$30,497, +10.45% from previous year)
- 2022: $361,611 (+$39,219, +12.17% from previous year)
- 2023: $364,542 (+$2,931, +0.81% from previous year)
- 2024: $380,553 (+$16,011, +4.39% from previous year)
- 2025: $390,626 (+$10,073, +2.65% from previous year)
Granger achieved a perfect doubling of home values since 2010, with consistent appreciation throughout the period. The community saw particularly strong growth between 2017 and 2019, followed by explosive gains during 2021-2022 when values increased by nearly $70,000. Current median prices of $390,626 reflect steady demand for this Dallas County community, with moderate recent growth suggesting market stabilization at premium levels.
Granger – Dallas County’s Rising Star
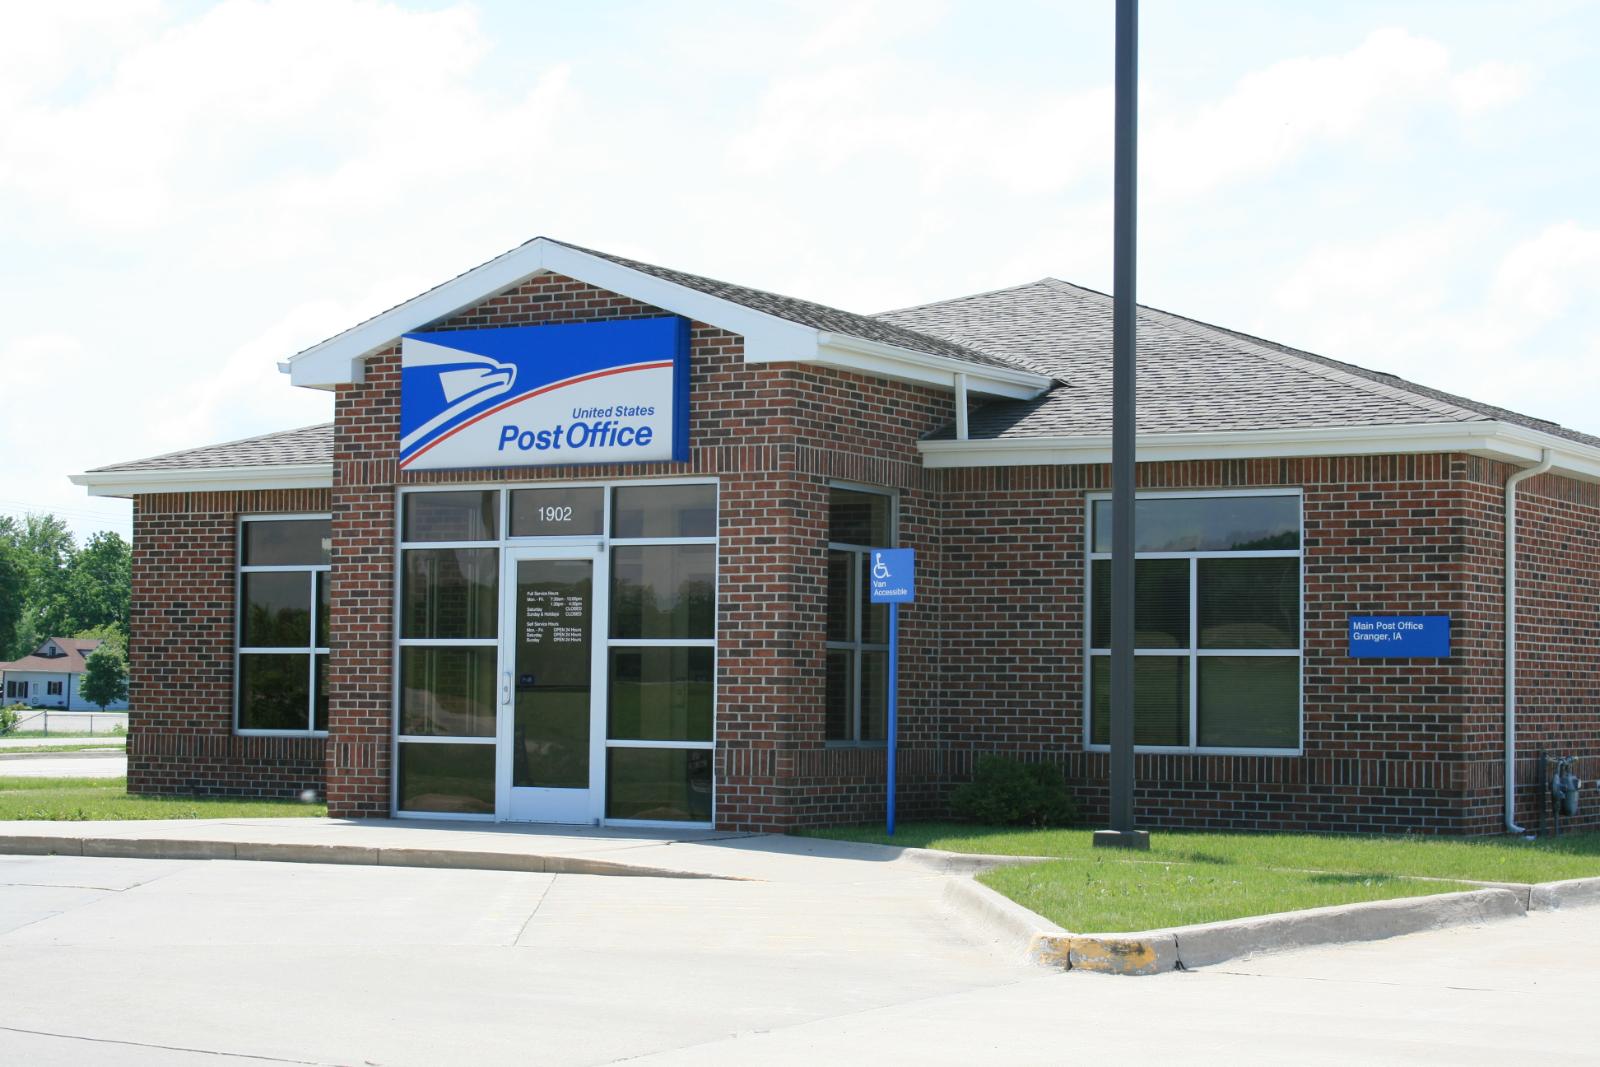
Situated in Dallas County northwest of Des Moines, Granger has emerged as a premier suburban destination for families seeking quality schools and modern amenities. The community of approximately 1,500 residents benefits from excellent access to Interstate highways while maintaining small-town character. Granger’s strategic location provides easy commutes to Des Moines employment centers while offering newer housing developments and recreational facilities that appeal to young professionals and growing families.
The doubling of home values since 2010 reflects Granger’s successful transformation into a sought-after residential community. The area’s appeal stems from its combination of rural setting and suburban conveniences, including quality schools and recreational facilities. Recent residential developments have attracted buyers seeking contemporary homes with modern features and larger lot sizes. The steady price appreciation demonstrates continued confidence in Granger’s growth potential and long-term desirability among families prioritizing education quality and community involvement.
23. Long Grove – 90% Home Price Increase Since 2010

- 2010: $206,257
- 2011: $201,100 (−$5,157, −2.50% from previous year)
- 2012: $208,381 (+$7,281, +3.62% from previous year)
- 2013: $220,149 (+$11,767, +5.65% from previous year)
- 2014: $231,425 (+$11,276, +5.12% from previous year)
- 2015: $244,441 (+$13,016, +5.62% from previous year)
- 2016: $253,505 (+$9,065, +3.71% from previous year)
- 2017: $267,127 (+$13,621, +5.37% from previous year)
- 2018: $272,694 (+$5,568, +2.08% from previous year)
- 2019: $287,000 (+$14,306, +5.25% from previous year)
- 2020: $299,297 (+$12,296, +4.28% from previous year)
- 2021: $323,132 (+$23,835, +7.96% from previous year)
- 2022: $360,104 (+$36,972, +11.44% from previous year)
- 2023: $364,127 (+$4,023, +1.12% from previous year)
- 2024: $376,168 (+$12,041, +3.31% from previous year)
- 2025: $392,323 (+$16,156, +4.29% from previous year)
Long Grove shows remarkably consistent appreciation throughout the study period, with steady gains averaging 5-6% annually before accelerating during 2021-2022. The community’s 90% total appreciation reflects sustained demand for Scott County living, with current median prices of $392,323 representing continued growth momentum. The consistency of appreciation suggests a stable and desirable housing market that has attracted steady buyer interest over time.
Long Grove – Scott County Stability
Located in Scott County near the Quad Cities metropolitan area, Long Grove offers suburban living with easy access to employment and entertainment options. The community of approximately 800 residents provides a rural atmosphere while maintaining proximity to urban amenities. Long Grove’s appeal lies in its combination of affordable living costs relative to larger cities and access to quality schools and recreational facilities. The area attracts families and professionals seeking alternatives to urban density without sacrificing convenience.
The steady 90% price appreciation since 2010 reflects Long Grove’s consistent appeal among buyers seeking value and quality of life. The community benefits from its location between Davenport and rural areas, providing residents with choices for employment, shopping, and recreation. Local amenities include parks and recreational facilities that serve active families, while the area’s agricultural heritage provides scenic settings and rural character. The reliable appreciation pattern suggests continued confidence in Long Grove’s desirability and growth potential.
22. Robins – 60% Home Price Increase Since 2010
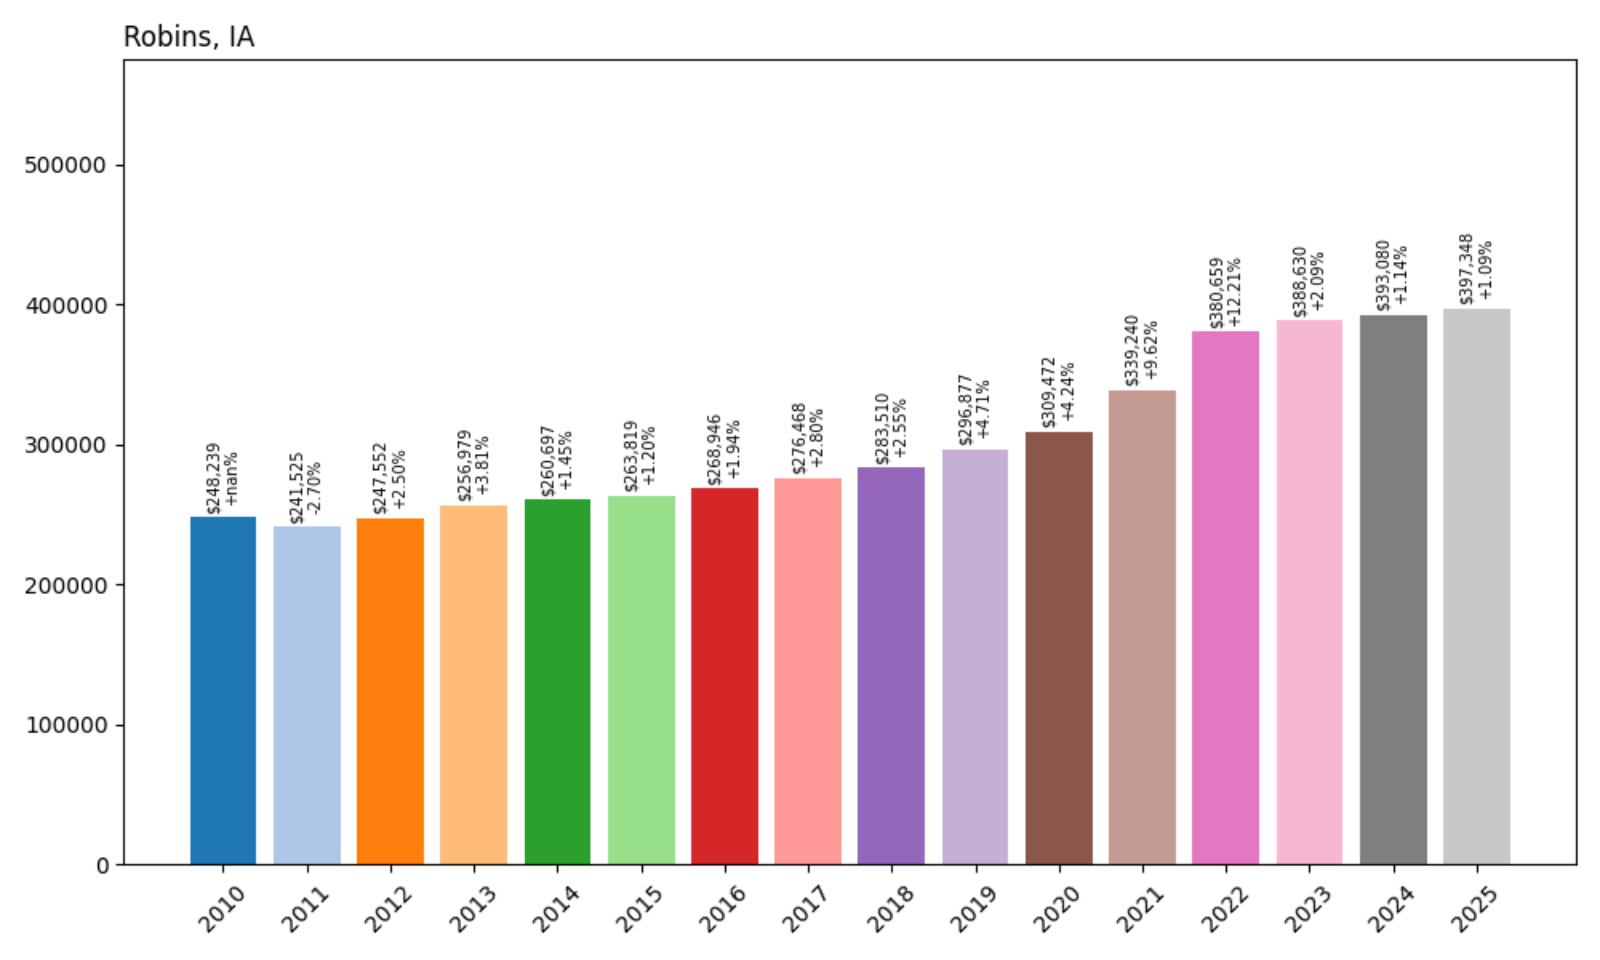
- 2010: $248,239
- 2011: $241,525 (−$6,714, −2.70% from previous year)
- 2012: $247,552 (+$6,027, +2.50% from previous year)
- 2013: $256,979 (+$9,427, +3.81% from previous year)
- 2014: $260,697 (+$3,718, +1.45% from previous year)
- 2015: $263,819 (+$3,122, +1.20% from previous year)
- 2016: $268,946 (+$5,127, +1.94% from previous year)
- 2017: $276,468 (+$7,522, +2.80% from previous year)
- 2018: $283,510 (+$7,042, +2.55% from previous year)
- 2019: $296,877 (+$13,367, +4.71% from previous year)
- 2020: $309,472 (+$12,595, +4.24% from previous year)
- 2021: $339,240 (+$29,767, +9.62% from previous year)
- 2022: $380,659 (+$41,419, +12.21% from previous year)
- 2023: $388,630 (+$7,971, +2.09% from previous year)
- 2024: $393,080 (+$4,450, +1.14% from previous year)
- 2025: $397,348 (+$4,268, +1.09% from previous year)
Robins demonstrates moderate but consistent appreciation, starting from a higher baseline than many communities in the study. The 60% total growth reflects steady demand for this Linn County community, with the most significant gains occurring during 2021-2022. Current median prices of $397,348 show the market has stabilized at premium levels, with recent modest growth suggesting a mature and established housing market.
Robins – Linn County’s Family Destination
Located in Linn County adjacent to Cedar Rapids, Robins has established itself as a premier family-oriented community. The city of approximately 3,500 residents offers excellent schools, recreational facilities, and modern amenities while maintaining easy access to Cedar Rapids employment and cultural opportunities. Robins’ planned development approach has created well-designed neighborhoods with contemporary homes and community spaces that appeal to professionals and families seeking suburban convenience.
The steady 60% appreciation reflects Robins’ reputation as a stable and desirable residential destination. The community’s focus on family amenities, including quality schools and recreational programs, has attracted buyers prioritizing education and community involvement. Robins benefits from its proximity to Cedar Rapids while offering newer housing stock and suburban lifestyle options. The moderate but consistent price growth demonstrates the area’s established appeal and suggests continued confidence among buyers seeking proven suburban communities.
21. Adel – 159% Home Price Increase Since 2010
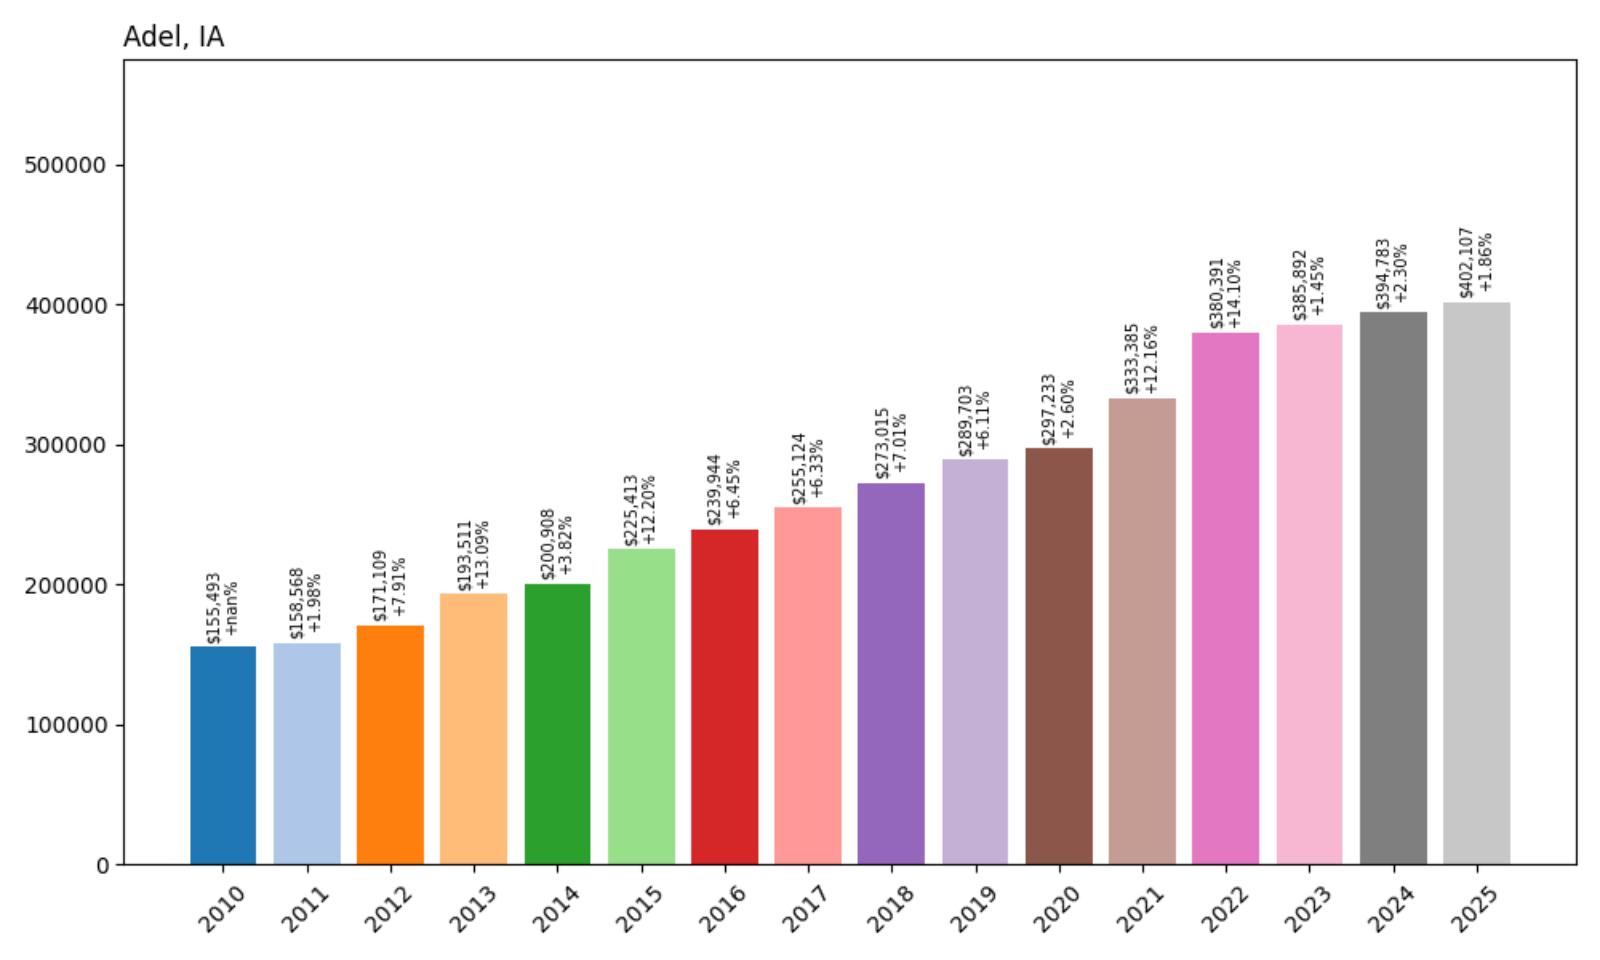
- 2010: $155,493
- 2011: $158,568 (+$3,075, +1.98% from previous year)
- 2012: $171,109 (+$12,541, +7.91% from previous year)
- 2013: $193,511 (+$22,402, +13.09% from previous year)
- 2014: $200,908 (+$7,397, +3.82% from previous year)
- 2015: $225,413 (+$24,505, +12.20% from previous year)
- 2016: $239,944 (+$14,532, +6.45% from previous year)
- 2017: $255,124 (+$15,180, +6.33% from previous year)
- 2018: $273,015 (+$17,891, +7.01% from previous year)
- 2019: $289,703 (+$16,688, +6.11% from previous year)
- 2020: $297,233 (+$7,529, +2.60% from previous year)
- 2021: $333,385 (+$36,152, +12.16% from previous year)
- 2022: $380,391 (+$47,006, +14.10% from previous year)
- 2023: $385,892 (+$5,501, +1.45% from previous year)
- 2024: $394,783 (+$8,891, +2.30% from previous year)
- 2025: $402,107 (+$7,324, +1.86% from previous year)
Adel showcases exceptional growth with 159% appreciation since 2010, transforming from one of the most affordable communities to a premium destination. The town experienced consistent high-single-digit growth through 2019, followed by explosive gains in 2021-2022 when values jumped from $297,233 to $380,391. Current median prices of $402,107 reflect Adel’s evolution into a sought-after Dallas County community with sustained buyer demand despite recent market moderation.
Adel – Dallas County’s Crown Jewel
Located in Dallas County west of Des Moines, Adel has emerged as one of Iowa’s most desirable suburban communities. The city of approximately 5,500 residents combines small-town charm with modern amenities, excellent schools, and recreational facilities that attract families from across the metro area. Adel’s strategic location provides easy access to Des Moines employment while offering a more relaxed pace of life and strong community connections that appeal to buyers seeking alternatives to urban living.
The remarkable 159% price appreciation reflects Adel’s successful transformation into a premier residential destination. The community’s appeal stems from its excellent school system, which consistently ranks among Iowa’s best, and recreational amenities including well-maintained parks and sports facilities. Adel’s downtown revitalization efforts have created a vibrant commercial district that complements the residential appeal. The sustained price growth demonstrates continued confidence in the area’s quality of life and long-term potential among families prioritizing education and community involvement.
20. Alleman – 78% Home Price Increase Since 2010
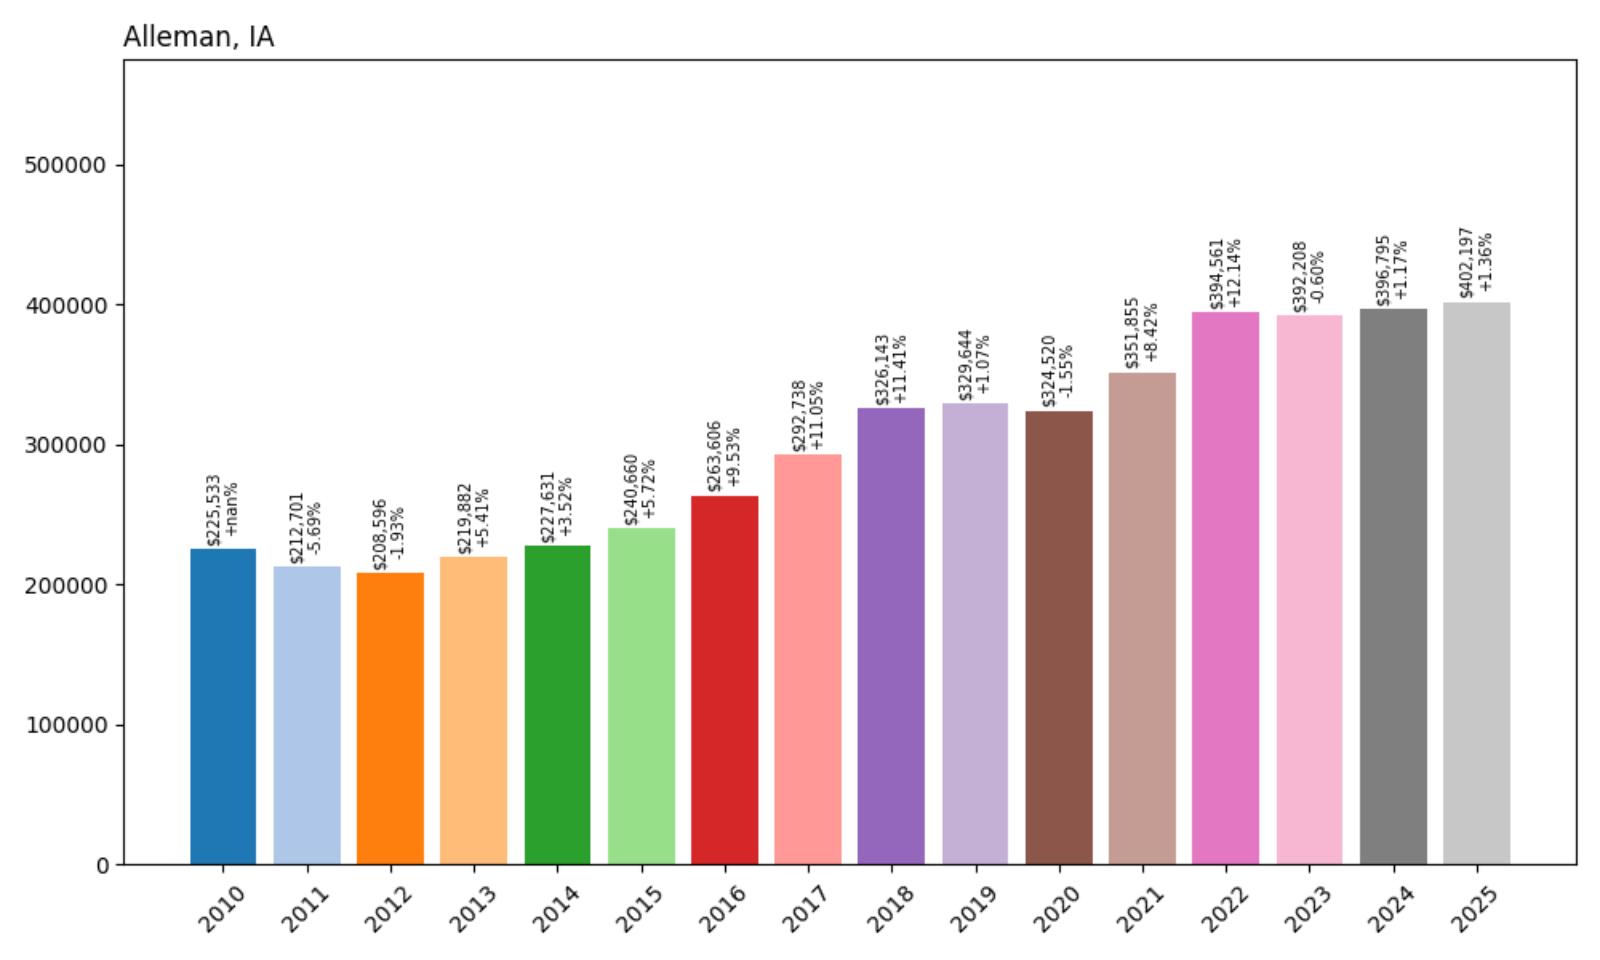
- 2010: $225,533
- 2011: $212,701 (−$12,832, −5.69% from previous year)
- 2012: $208,596 (−$4,105, −1.93% from previous year)
- 2013: $219,882 (+$11,286, +5.41% from previous year)
- 2014: $227,631 (+$7,749, +3.52% from previous year)
- 2015: $240,660 (+$13,028, +5.72% from previous year)
- 2016: $263,606 (+$22,947, +9.53% from previous year)
- 2017: $292,738 (+$29,131, +11.05% from previous year)
- 2018: $326,143 (+$33,406, +11.41% from previous year)
- 2019: $329,644 (+$3,501, +1.07% from previous year)
- 2020: $324,520 (−$5,124, −1.55% from previous year)
- 2021: $351,855 (+$27,335, +8.42% from previous year)
- 2022: $394,561 (+$42,706, +12.14% from previous year)
- 2023: $392,208 (−$2,353, −0.60% from previous year)
- 2024: $396,795 (+$4,587, +1.17% from previous year)
- 2025: $402,197 (+$5,402, +1.36% from previous year)
Alleman demonstrates volatile early performance with significant acceleration between 2016-2018, when values increased by over $60,000. The community experienced a brief plateau around 2019-2020 before resuming growth during the pandemic years. Current median prices of $402,197 represent 78% total appreciation, with recent stability suggesting the market has found equilibrium at premium levels.
Alleman – Polk County’s Emerging Market
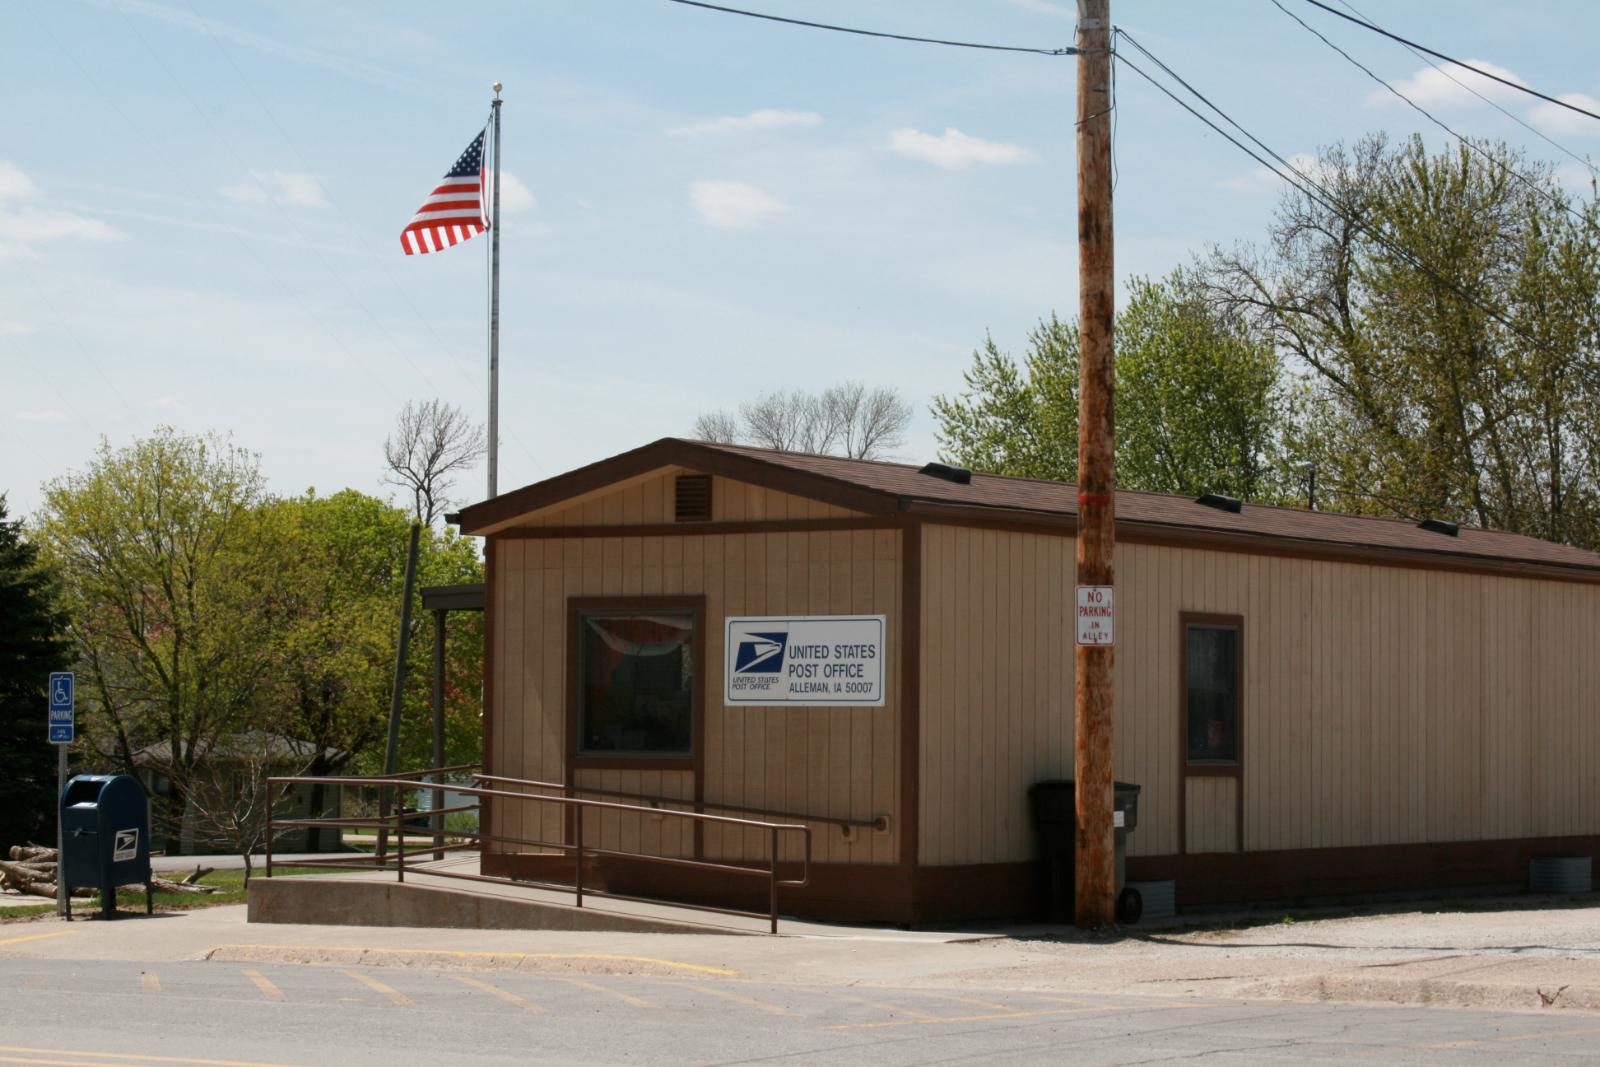
Situated in rural Polk County north of Des Moines, Alleman offers country living with metropolitan access. This small community of fewer than 500 residents provides an escape from urban density while maintaining reasonable commuting distance to Des Moines employment centers. Alleman’s appeal has grown significantly among buyers seeking larger properties, privacy, and rural amenities without completely sacrificing urban conveniences. The area attracts families and professionals who prioritize space and tranquility over immediate access to city services.
The 78% price appreciation reflects growing recognition of Alleman’s value proposition in the greater Des Moines market. The community benefits from Polk County’s strong economic foundation while offering rural lifestyle advantages that have become increasingly valuable to buyers. Recent market stability suggests Alleman has established itself as a premium rural destination with sustainable demand. The area’s continued appeal stems from its combination of privacy, natural settings, and accessibility to metropolitan amenities.
19. Johnston – 73% Home Price Increase Since 2010

- 2010: $234,130
- 2011: $224,439 (−$9,690, −4.14% from previous year)
- 2012: $226,260 (+$1,821, +0.81% from previous year)
- 2013: $238,598 (+$12,338, +5.45% from previous year)
- 2014: $248,736 (+$10,139, +4.25% from previous year)
- 2015: $259,216 (+$10,480, +4.21% from previous year)
- 2016: $273,756 (+$14,540, +5.61% from previous year)
- 2017: $284,792 (+$11,036, +4.03% from previous year)
- 2018: $292,596 (+$7,805, +2.74% from previous year)
- 2019: $299,822 (+$7,226, +2.47% from previous year)
- 2020: $304,363 (+$4,541, +1.51% from previous year)
- 2021: $336,800 (+$32,437, +10.66% from previous year)
- 2022: $377,854 (+$41,055, +12.19% from previous year)
- 2023: $387,120 (+$9,266, +2.45% from previous year)
- 2024: $397,991 (+$10,870, +2.81% from previous year)
- 2025: $404,516 (+$6,526, +1.64% from previous year)
Johnston shows steady, measured growth throughout most of the study period, with notable acceleration during 2021-2022 when values increased by over $73,000. The 73% total appreciation reflects Johnston’s established position as a premier Des Moines suburb, with current median prices of $404,516 demonstrating continued demand for this Polk County community. Recent moderate growth suggests market maturity and stability.
Johnston – Premier Des Moines Suburb
Located in Polk County directly north of Des Moines, Johnston has long been recognized as one of Iowa’s most desirable suburban communities. The city of approximately 24,000 residents offers excellent schools, extensive recreational facilities, and well-planned neighborhoods that attract professionals and families seeking upscale suburban living. Johnston’s proximity to downtown Des Moines provides easy access to employment and cultural opportunities while maintaining a distinct community identity and small-town feel despite its size.
The steady 73% appreciation reflects Johnston’s established reputation as a premium residential destination. The community’s appeal stems from its excellent school district, which consistently ranks among Iowa’s best, and comprehensive recreational amenities including parks, trails, and sports facilities. Johnston’s planned development approach has created diverse housing options while preserving green space and community character. The reliable price growth demonstrates sustained confidence in Johnston’s quality of life and long-term desirability among families prioritizing education, safety, and community amenities.
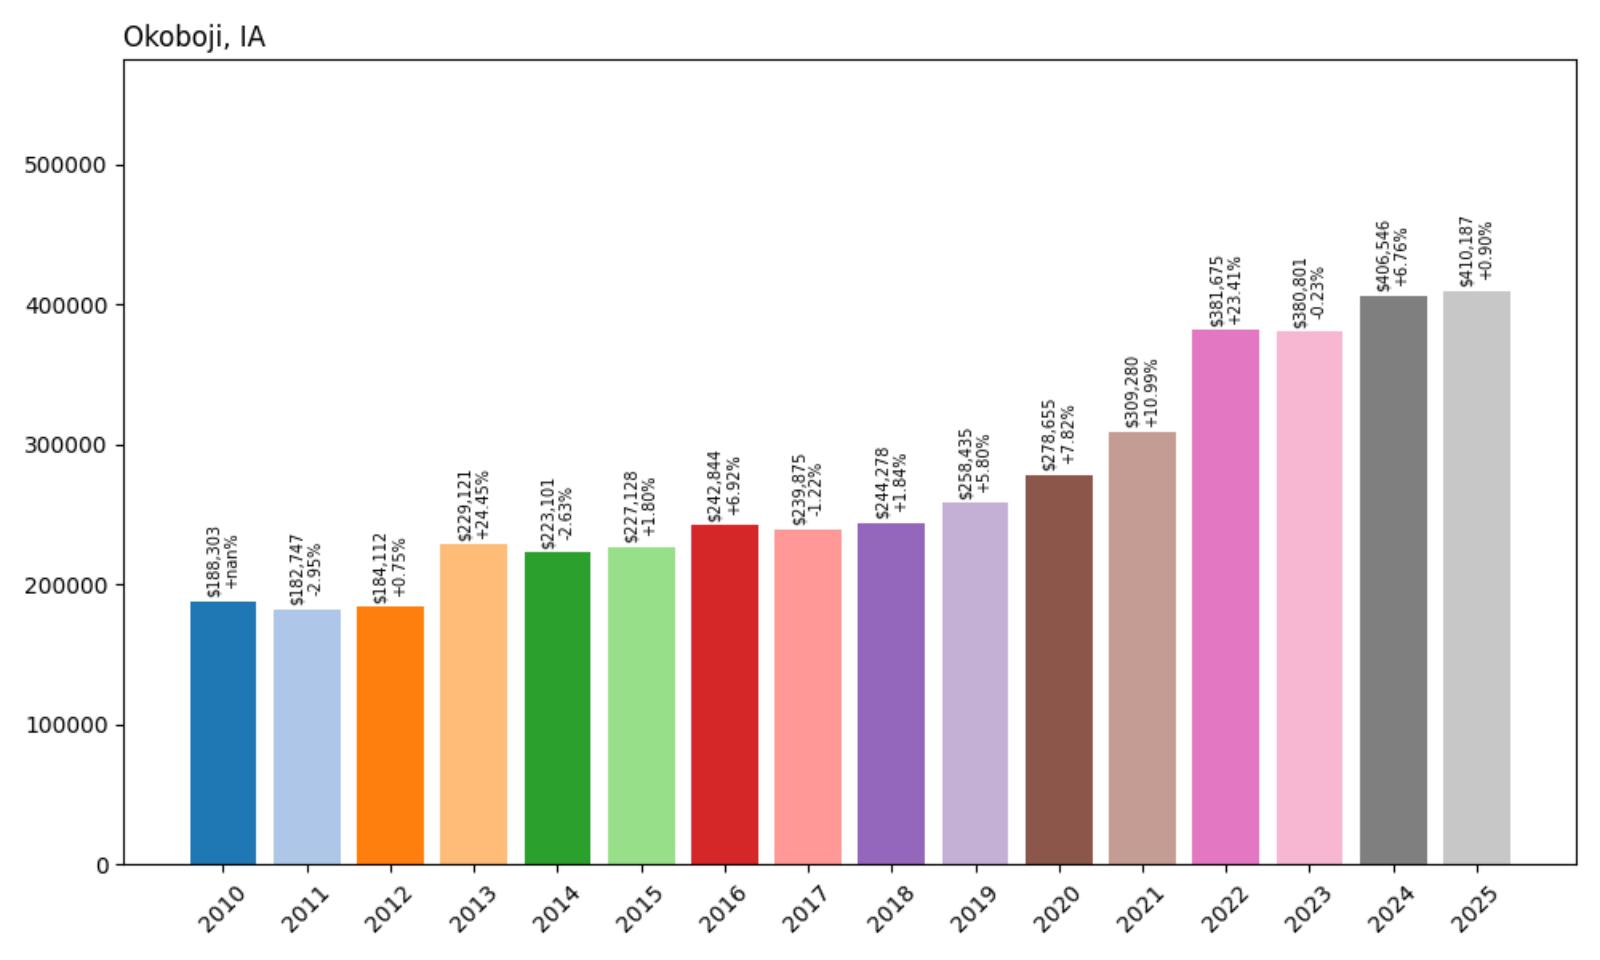
18. Okoboji – 118% Home Price Increase Since 2010
🔥 Would you like to save this?
- 2010: $188,303
- 2011: $182,747 (−$5,556, −2.95% from previous year)
- 2012: $184,112 (+$1,365, +0.75% from previous year)
- 2013: $229,121 (+$45,009, +24.45% from previous year)
- 2014: $223,101 (−$6,020, −2.63% from previous year)
- 2015: $227,128 (+$4,027, +1.80% from previous year)
- 2016: $242,844 (+$15,716, +6.92% from previous year)
- 2017: $239,875 (−$2,968, −1.22% from previous year)
- 2018: $244,278 (+$4,403, +1.84% from previous year)
- 2019: $258,435 (+$14,157, +5.80% from previous year)
- 2020: $278,655 (+$20,220, +7.82% from previous year)
- 2021: $309,280 (+$30,625, +10.99% from previous year)
- 2022: $381,675 (+$72,395, +23.41% from previous year)
- 2023: $380,801 (−$874, −0.23% from previous year)
- 2024: $406,546 (+$25,745, +6.76% from previous year)
- 2025: $410,187 (+$3,642, +0.90% from previous year)
Okoboji exhibits volatile growth patterns typical of vacation markets, with dramatic spikes in 2013 and 2022 when values increased by 24.45% and 23.41% respectively. The 118% total appreciation reflects the community’s transformation into a premium lakefront destination, with current median prices of $410,187 demonstrating sustained demand for Iowa Great Lakes properties despite periodic market fluctuations.
Okoboji – Iowa’s Premier Lake Community
Located in northwest Iowa’s lake region, Okoboji represents the state’s premier vacation and recreational real estate market. The community surrounding West Okoboji Lake has evolved from a seasonal destination into a year-round residential market that attracts buyers from across the Midwest. Okoboji’s appeal stems from its unique combination of natural beauty, recreational opportunities, and resort amenities that are rare in Iowa’s predominantly agricultural landscape. The area offers boating, fishing, and water sports during summer months, while winter activities and indoor entertainment maintain appeal year-round.
The 118% price appreciation reflects Okoboji’s successful transition from seasonal cottages to upscale permanent and vacation homes. The volatile growth pattern mirrors typical vacation market dynamics, with demand driven by lifestyle preferences rather than employment factors. Recent years have seen increased interest from buyers seeking second homes or retirement destinations, particularly those attracted to lakefront living and recreational amenities. The sustained high values demonstrate Okoboji’s unique position in Iowa’s real estate market as a luxury destination that commands premium prices for waterfront access and resort-style living.
17. Van Meter – 96% Home Price Increase Since 2010
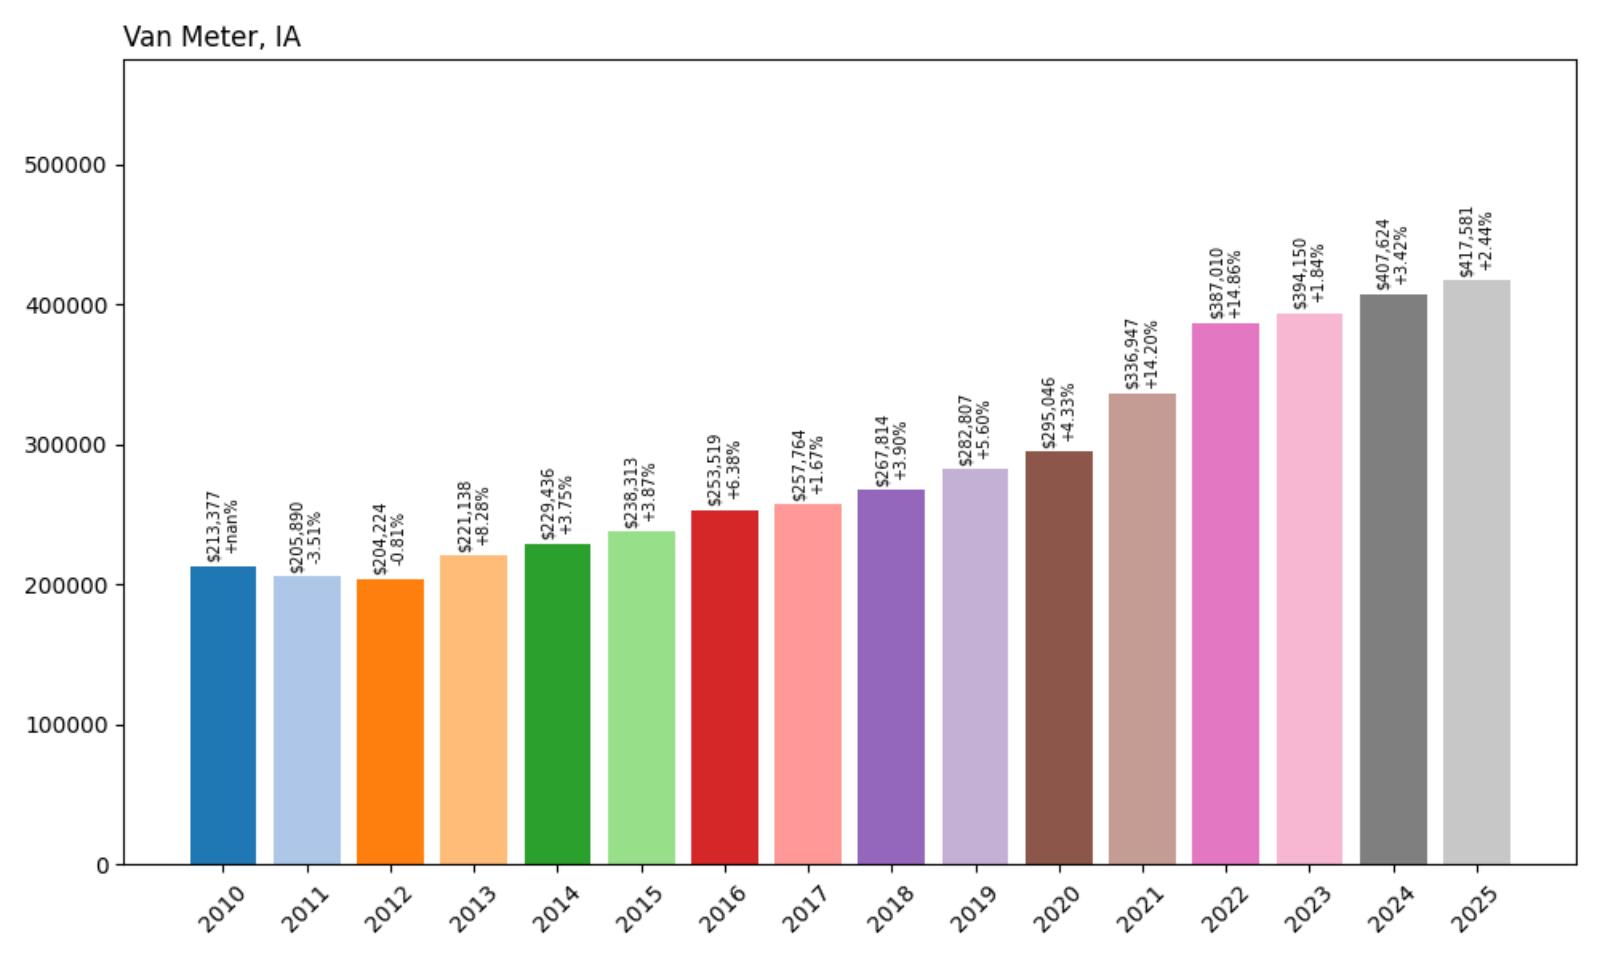
- 2010: $213,377
- 2011: $205,890 (−$7,487, −3.51% from previous year)
- 2012: $204,224 (−$1,667, −0.81% from previous year)
- 2013: $221,138 (+$16,914, +8.28% from previous year)
- 2014: $229,436 (+$8,299, +3.75% from previous year)
- 2015: $238,313 (+$8,877, +3.87% from previous year)
- 2016: $253,519 (+$15,206, +6.38% from previous year)
- 2017: $257,764 (+$4,246, +1.67% from previous year)
- 2018: $267,814 (+$10,049, +3.90% from previous year)
- 2019: $282,807 (+$14,994, +5.60% from previous year)
- 2020: $295,046 (+$12,238, +4.33% from previous year)
- 2021: $336,947 (+$41,902, +14.20% from previous year)
- 2022: $387,010 (+$50,063, +14.86% from previous year)
- 2023: $394,150 (+$7,140, +1.84% from previous year)
- 2024: $407,624 (+$13,474, +3.42% from previous year)
- 2025: $417,581 (+$9,957, +2.44% from previous year)
Van Meter demonstrates consistent appreciation with particularly strong performance during 2021-2022, when values increased by nearly $92,000 over two years. The 96% total growth reflects steady demand for this Dallas County community, with current median prices of $417,581 showing continued momentum. The community’s near-doubling of values demonstrates successful transformation from rural to suburban residential market.
Van Meter – Dallas County’s Family Focus
Located in Dallas County southwest of Des Moines, Van Meter has established itself as a family-oriented community with exceptional schools and recreational amenities. The city of approximately 1,200 residents offers small-town character while providing easy access to Des Moines employment and cultural opportunities. Van Meter’s appeal has grown significantly among families prioritizing education quality, with the school district’s athletic and academic achievements drawing buyers from across the metro area seeking proven excellence in youth development.
The 96% price appreciation reflects Van Meter’s reputation as a premier destination for families with school-age children. The community’s investment in educational and recreational facilities has created a compelling value proposition for buyers willing to commute for superior local amenities. Van Meter’s success in maintaining small-town character while accommodating growth has preserved the qualities that originally attracted residents. The sustained price growth demonstrates continued confidence in the area’s ability to deliver quality of life and educational excellence that justifies premium housing costs.
16. Toddville – 67% Home Price Increase Since 2015
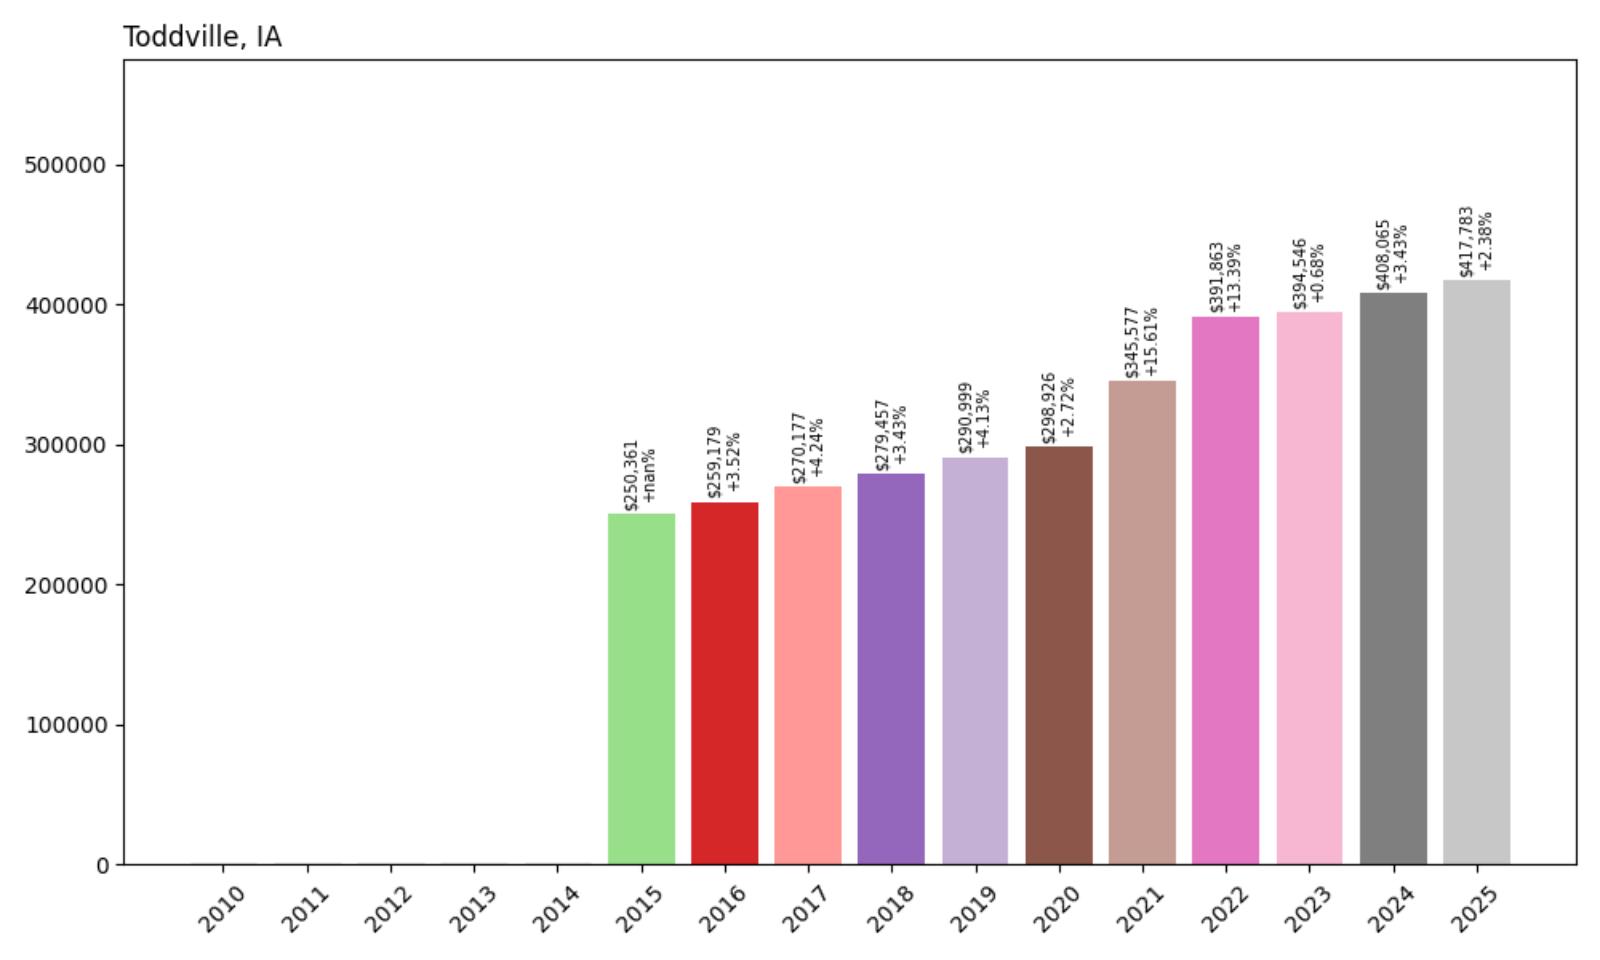
- 2015: $250,361
- 2016: $259,179 (+$8,818, +3.52% from previous year)
- 2017: $270,177 (+$10,998, +4.24% from previous year)
- 2018: $279,457 (+$9,280, +3.43% from previous year)
- 2019: $290,999 (+$11,542, +4.13% from previous year)
- 2020: $298,926 (+$7,927, +2.72% from previous year)
- 2021: $345,577 (+$46,651, +15.61% from previous year)
- 2022: $391,863 (+$46,286, +13.39% from previous year)
- 2023: $394,546 (+$2,683, +0.68% from previous year)
- 2024: $408,065 (+$13,519, +3.43% from previous year)
- 2025: $417,783 (+$9,718, +2.38% from previous year)
Toddville’s data begins in 2015, showing steady early growth followed by explosive gains during 2021-2022 when values increased by nearly $93,000. The 67% appreciation in just ten years reflects strong demand for this Linn County community, with current median prices of $417,783 demonstrating continued buyer interest. The dramatic pandemic-era growth mirrors broader suburban migration trends.
Toddville – Linn County’s Hidden Value
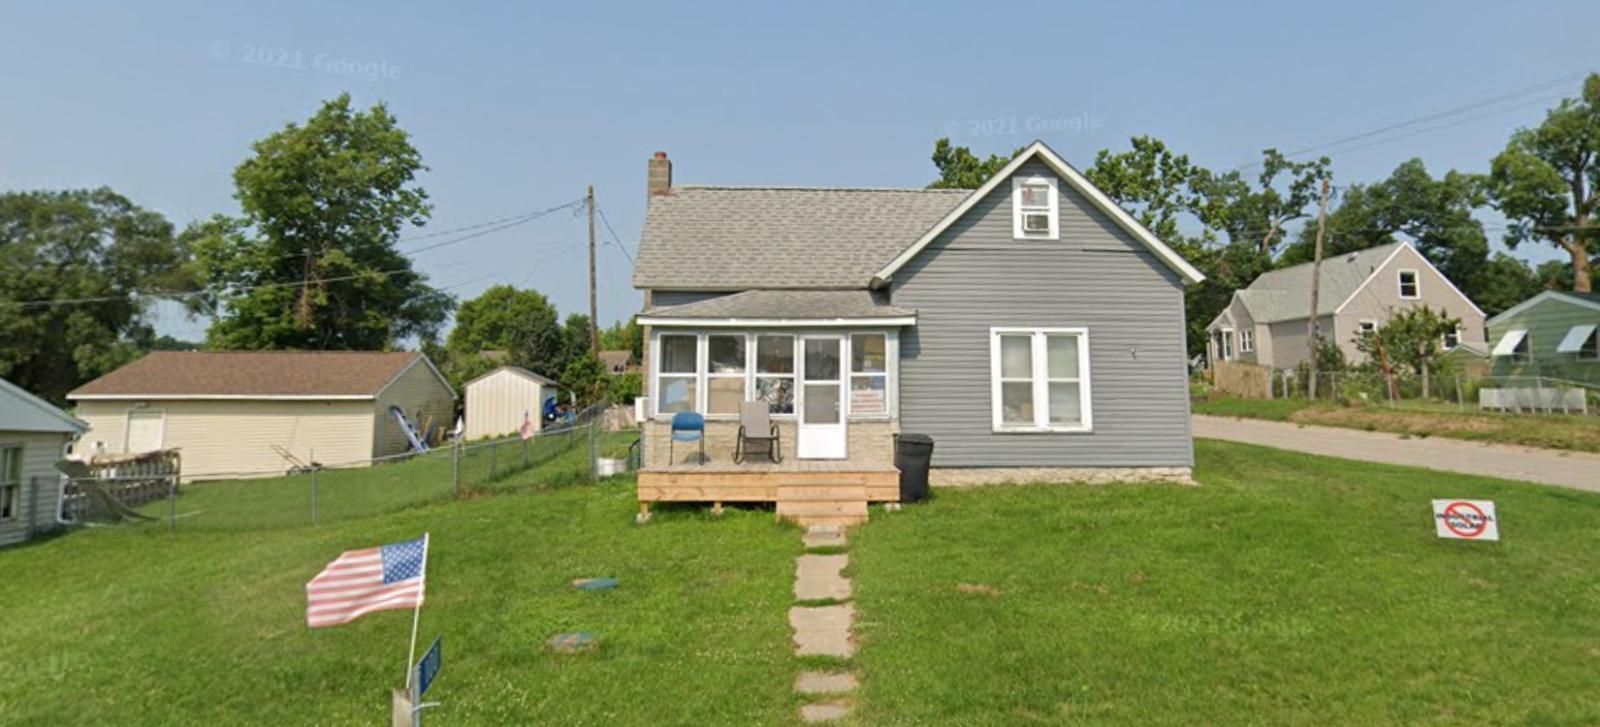
Located in rural Linn County north of Cedar Rapids, Toddville offers country living with metropolitan access for buyers seeking space and privacy. This small community provides an alternative to urban and suburban density while maintaining reasonable commuting distance to Cedar Rapids employment centers. Toddville’s appeal has grown among buyers seeking larger properties and rural amenities, particularly those who can work remotely or prefer longer commutes in exchange for rural lifestyle benefits.
The 67% appreciation since 2015 reflects growing recognition of Toddville’s value proposition in the greater Cedar Rapids market. The dramatic growth during 2021-2022 mirrors broader trends toward rural and suburban migration that accelerated during the pandemic. Toddville benefits from its location in Linn County, which provides strong economic fundamentals while offering rural lifestyle advantages. The continued price growth suggests sustained demand among buyers prioritizing space, privacy, and natural settings over urban conveniences.
15. Peosta – 85% Home Price Increase Since 2010
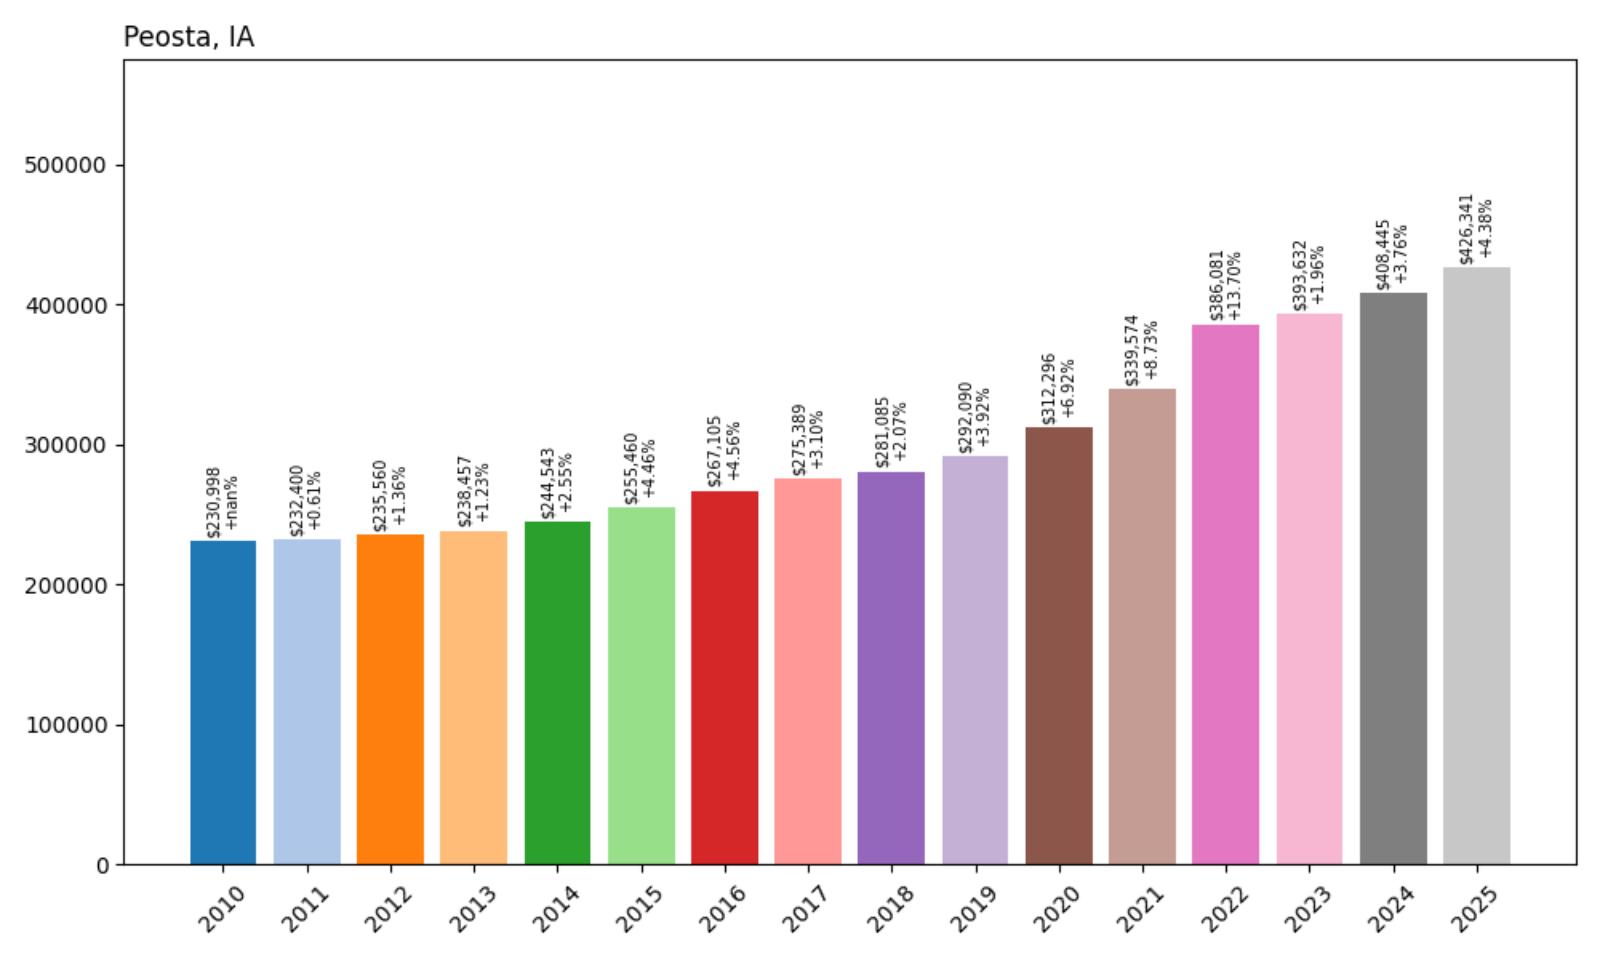
- 2010: $230,998
- 2011: $232,400 (+$1,402, +0.61% from previous year)
- 2012: $235,560 (+$3,160, +1.36% from previous year)
- 2013: $238,457 (+$2,897, +1.23% from previous year)
- 2014: $244,543 (+$6,086, +2.55% from previous year)
- 2015: $255,460 (+$10,916, +4.46% from previous year)
- 2016: $267,105 (+$11,645, +4.56% from previous year)
- 2017: $275,389 (+$8,284, +3.10% from previous year)
- 2018: $281,085 (+$5,696, +2.07% from previous year)
- 2019: $292,090 (+$11,005, +3.92% from previous year)
- 2020: $312,296 (+$20,206, +6.92% from previous year)
- 2021: $339,574 (+$27,278, +8.73% from previous year)
- 2022: $386,081 (+$46,507, +13.70% from previous year)
- 2023: $393,632 (+$7,551, +1.96% from previous year)
- 2024: $408,445 (+$14,813, +3.76% from previous year)
- 2025: $426,341 (+$17,896, +4.38% from previous year)
Peosta shows remarkable consistency in appreciation, with steady growth throughout the study period that accelerated significantly during 2020-2022. The 85% total appreciation reflects sustained demand for this Dubuque County community, with current median prices of $426,341 demonstrating continued upward momentum. The community’s reliable growth pattern suggests stable market fundamentals and consistent buyer appeal.
Peosta – Dubuque County’s Balanced Growth
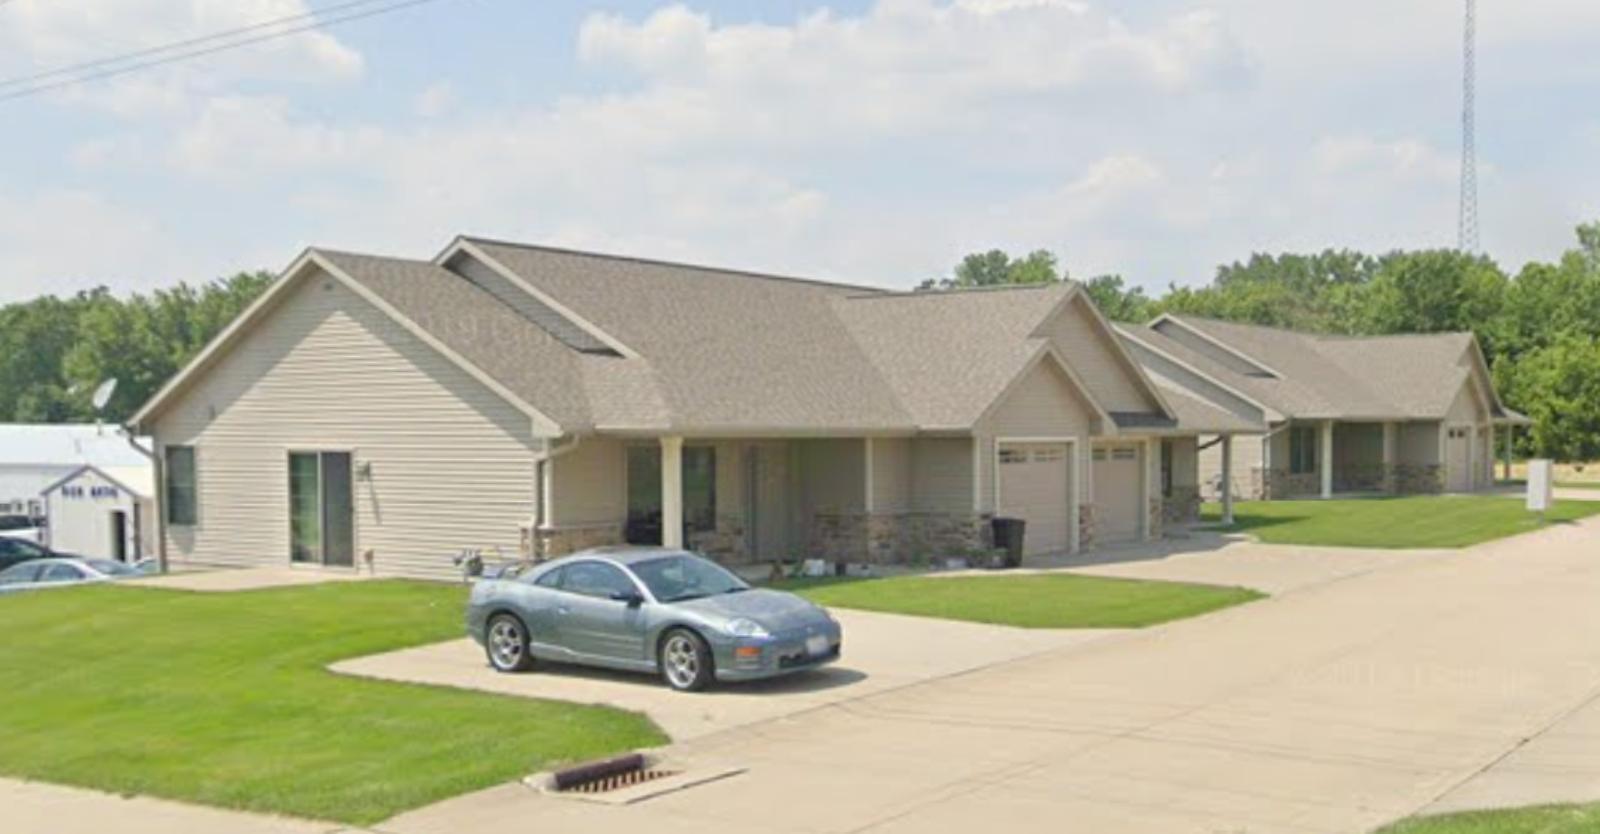
Located in Dubuque County near the Mississippi River, Peosta has evolved into a thriving community that balances small-town character with modern amenities. The city of approximately 1,800 residents offers excellent schools, recreational facilities, and planned residential developments that attract families seeking alternatives to urban living. Peosta’s strategic location provides access to Dubuque employment while offering newer housing options and community amenities that appeal to buyers prioritizing contemporary lifestyle features.
The steady 85% appreciation reflects Peosta’s successful growth management and community development approach. The area’s appeal stems from its combination of rural setting and suburban conveniences, including quality schools and recreational programs that serve active families. Peosta’s commitment to planned growth has preserved community character while accommodating new residents seeking modern amenities and lifestyle options. The consistent price growth demonstrates confidence in the area’s long-term potential and continued desirability among buyers seeking balanced community living.
14. Polk City – 103% Home Price Increase Since 2010
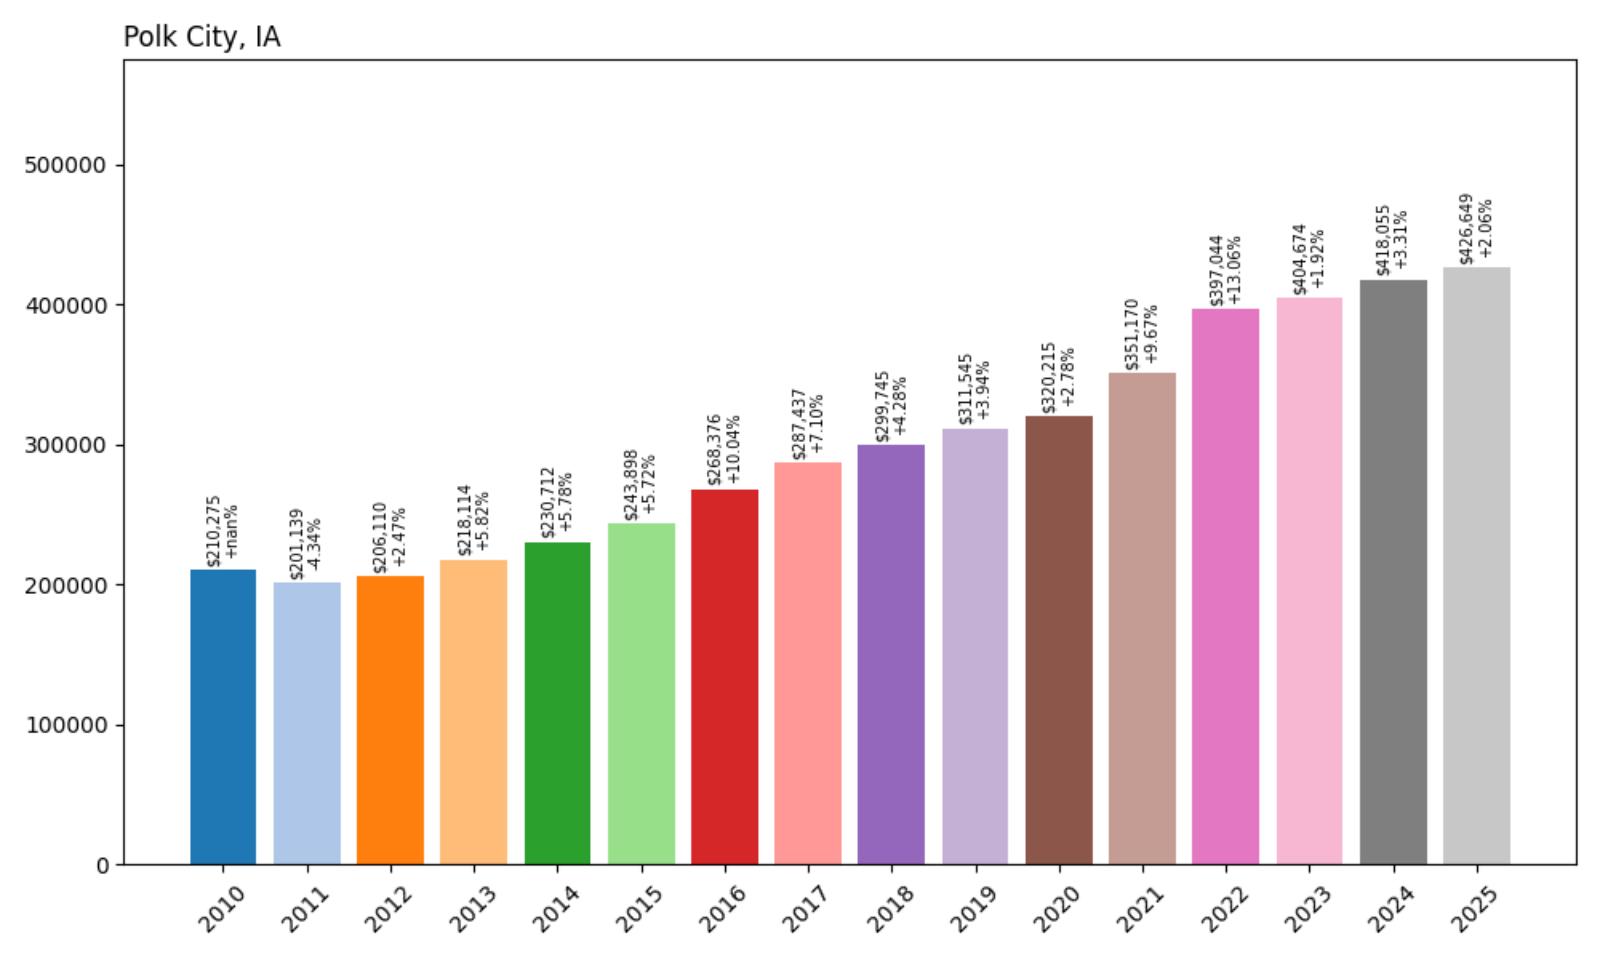
- 2010: $210,275
- 2011: $201,139 (−$9,136, −4.34% from previous year)
- 2012: $206,110 (+$4,971, +2.47% from previous year)
- 2013: $218,114 (+$12,004, +5.82% from previous year)
- 2014: $230,712 (+$12,598, +5.78% from previous year)
- 2015: $243,898 (+$13,186, +5.72% from previous year)
- 2016: $268,376 (+$24,478, +10.04% from previous year)
- 2017: $287,437 (+$19,061, +7.10% from previous year)
- 2018: $299,745 (+$12,308, +4.28% from previous year)
- 2019: $311,545 (+$11,800, +3.94% from previous year)
- 2020: $320,215 (+$8,670, +2.78% from previous year)
- 2021: $351,170 (+$30,955, +9.67% from previous year)
- 2022: $397,044 (+$45,873, +13.06% from previous year)
- 2023: $404,674 (+$7,631, +1.92% from previous year)
- 2024: $418,055 (+$13,381, +3.31% from previous year)
- 2025: $426,649 (+$8,593, +2.06% from previous year)
Polk City demonstrates impressive 103% appreciation with particularly strong performance between 2016-2017 and during 2021-2022. The community more than doubled its home values since 2010, with current median prices of $426,649 reflecting sustained demand for this Polk County location. The consistent growth pattern shows successful transformation from an affordable community to a premium residential destination.
Polk City – Central Iowa’s Recreation Hub

🔥 Would you like to save this?
Located in Polk County northwest of Des Moines, Polk City has emerged as a premier destination for families seeking recreational amenities and small-town character. The community of approximately 5,000 residents benefits from its proximity to Big Creek Lake and extensive trail systems that attract outdoor enthusiasts from across the metro area. Polk City’s location provides easy access to Des Moines employment while offering recreational opportunities and community events that create strong neighborhood connections and quality of life advantages.
The remarkable 103% price appreciation reflects Polk City’s successful development as a recreation-focused community with broad appeal. The area’s investment in parks, trails, and recreational facilities has created a unique value proposition that attracts active families and outdoor enthusiasts. Polk City’s combination of natural amenities and planned residential growth has preserved the community’s character while accommodating new residents seeking lifestyle-oriented living. The sustained price growth demonstrates continued confidence in the area’s recreational assets and community development approach.
13. Runnells – 111% Home Price Increase Since 2010
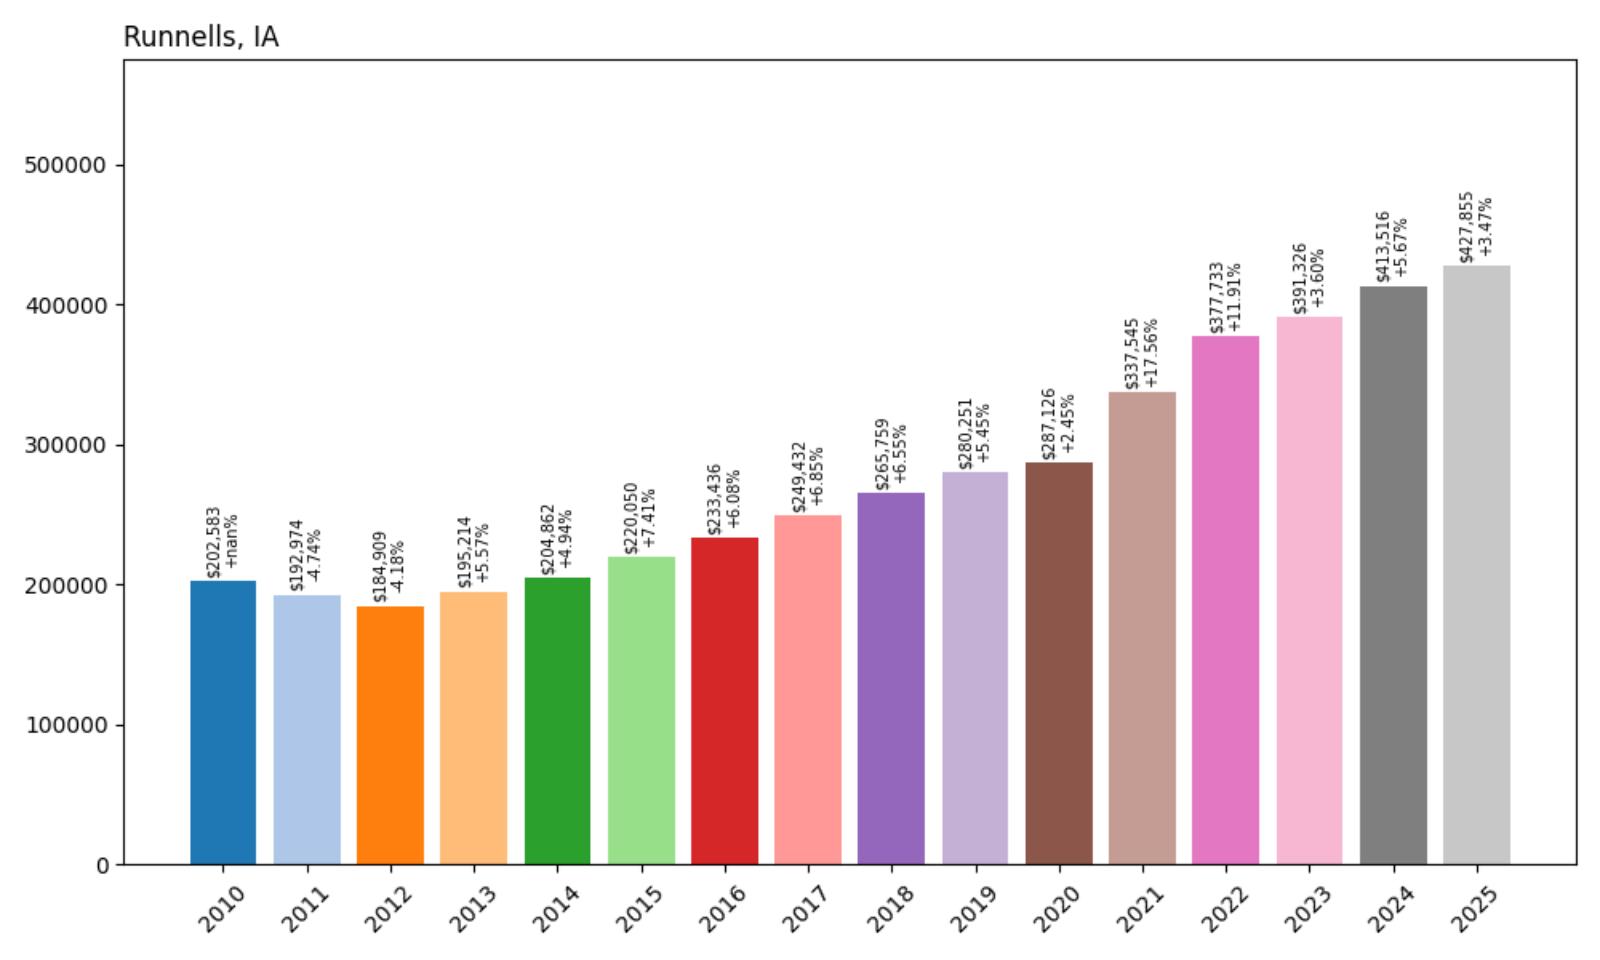
- 2010: $202,583
- 2011: $192,974 (−$9,609, −4.74% from previous year)
- 2012: $184,909 (−$8,065, −4.18% from previous year)
- 2013: $195,214 (+$10,305, +5.57% from previous year)
- 2014: $204,862 (+$9,648, +4.94% from previous year)
- 2015: $220,050 (+$15,188, +7.41% from previous year)
- 2016: $233,436 (+$13,385, +6.08% from previous year)
- 2017: $249,432 (+$15,996, +6.85% from previous year)
- 2018: $265,759 (+$16,327, +6.55% from previous year)
- 2019: $280,251 (+$14,492, +5.45% from previous year)
- 2020: $287,126 (+$6,875, +2.45% from previous year)
- 2021: $337,545 (+$50,419, +17.56% from previous year)
- 2022: $377,733 (+$40,188, +11.91% from previous year)
- 2023: $391,326 (+$13,593, +3.60% from previous year)
- 2024: $413,516 (+$22,190, +5.67% from previous year)
- 2025: $427,855 (+$14,339, +3.47% from previous year)
Runnells overcame early struggles to achieve exceptional 111% growth, with recovery beginning in 2013 and accelerating through consistent gains. The community experienced its strongest performance in 2021 with a remarkable 17.56% single-year increase, followed by continued strong growth. Current median prices of $427,855 represent more than doubling of values, demonstrating remarkable transformation and sustained buyer demand.
Runnells – Polk County’s Surprising Success
Located in rural Polk County southeast of Des Moines, Runnells has transformed from a small agricultural community into a sought-after residential destination. The city of approximately 500 residents offers country living with metropolitan access, attracting buyers seeking privacy and space without completely sacrificing urban conveniences. Runnells’ appeal has grown significantly among families and professionals who prioritize larger properties and rural lifestyle while maintaining reasonable commuting access to Des Moines employment centers.
The remarkable 111% appreciation reflects Runnells’ successful evolution from an overlooked rural community to a recognized residential destination. The dramatic growth acceleration during 2021 mirrors broader trends toward rural and suburban migration that were amplified by remote work opportunities. Runnells benefits from its Polk County location, which provides strong economic fundamentals and access to quality services while offering rural lifestyle advantages. The sustained price growth suggests continued recognition of the area’s value proposition among buyers seeking alternatives to urban and suburban density.
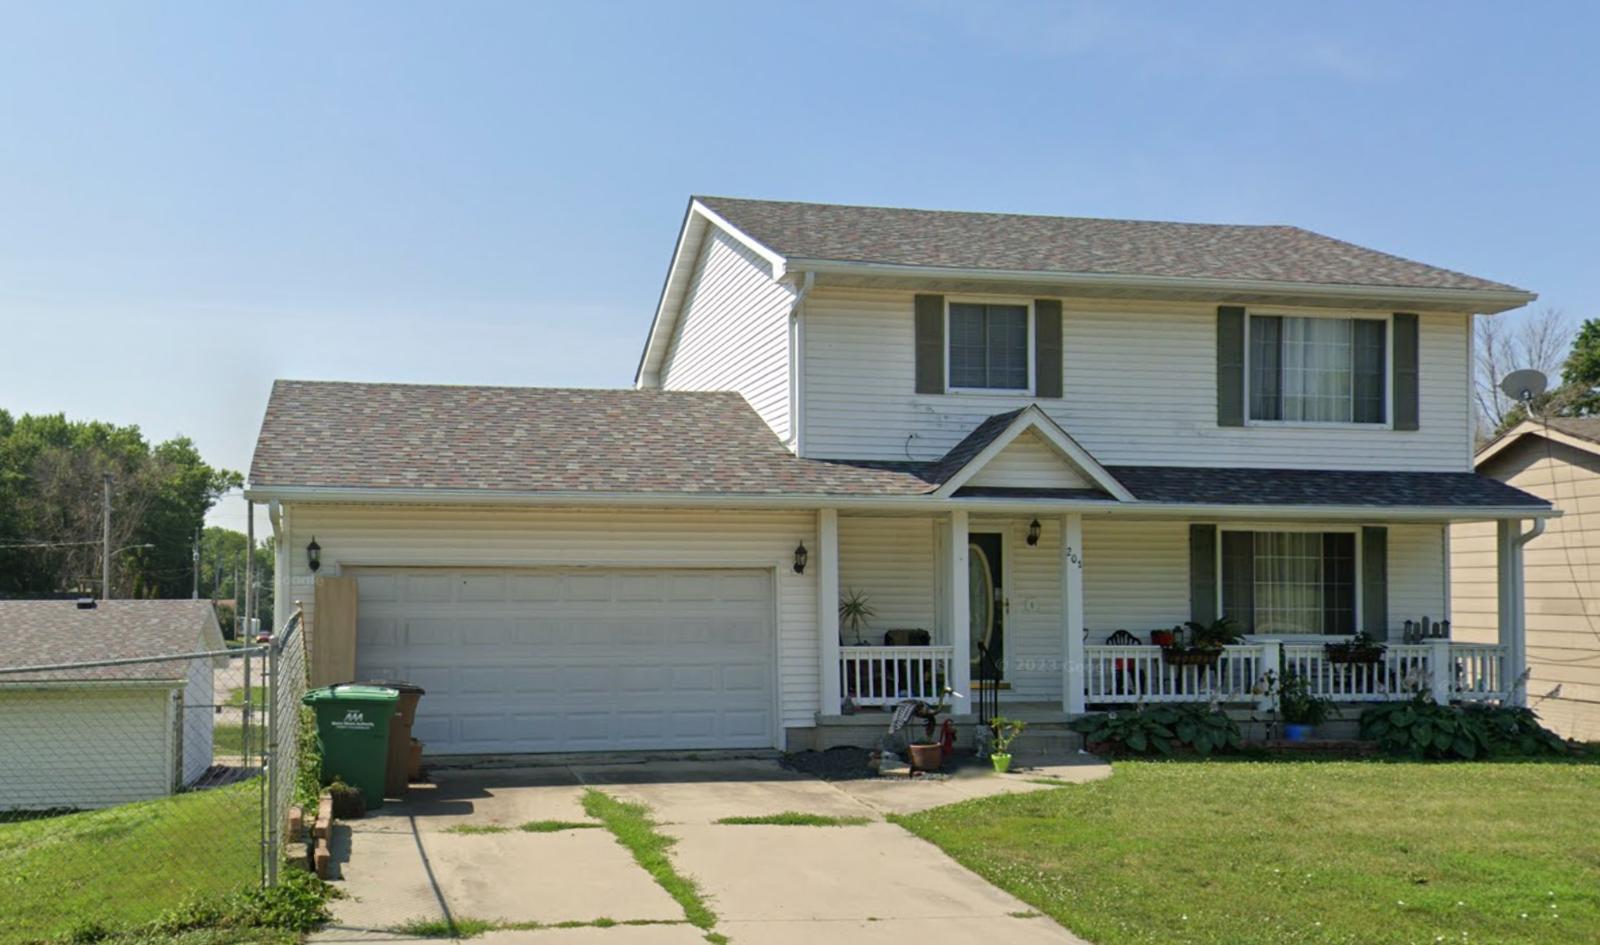
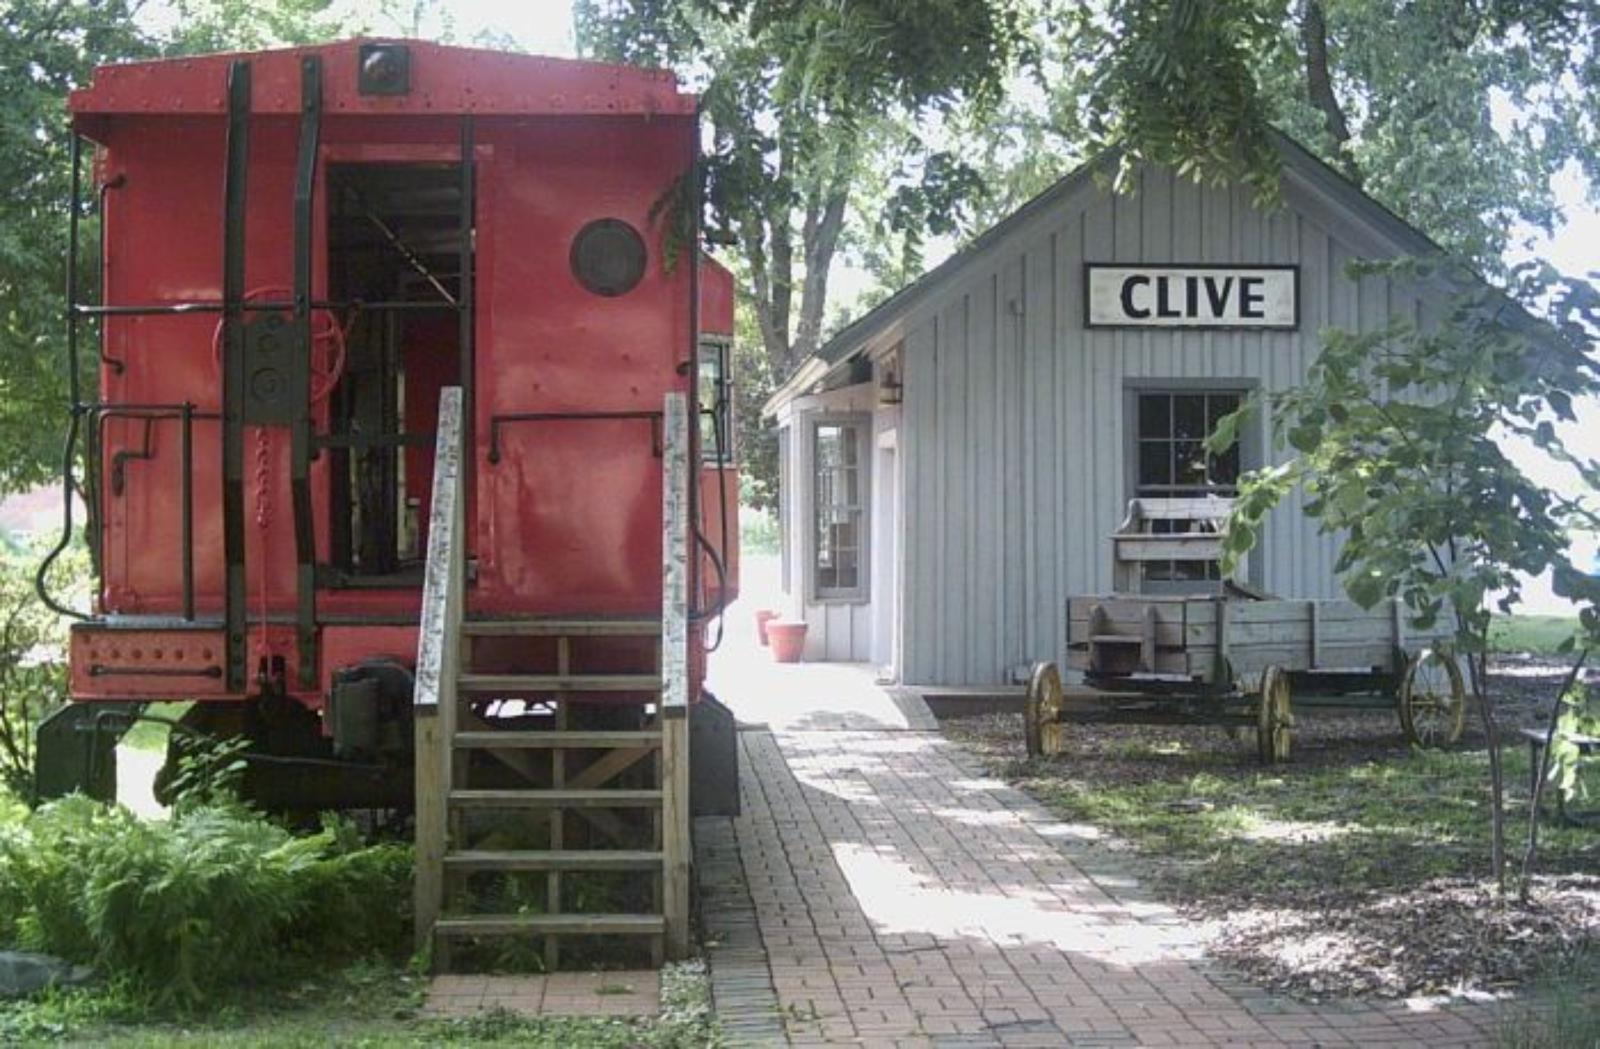
12. Clive – 73% Home Price Increase Since 2010
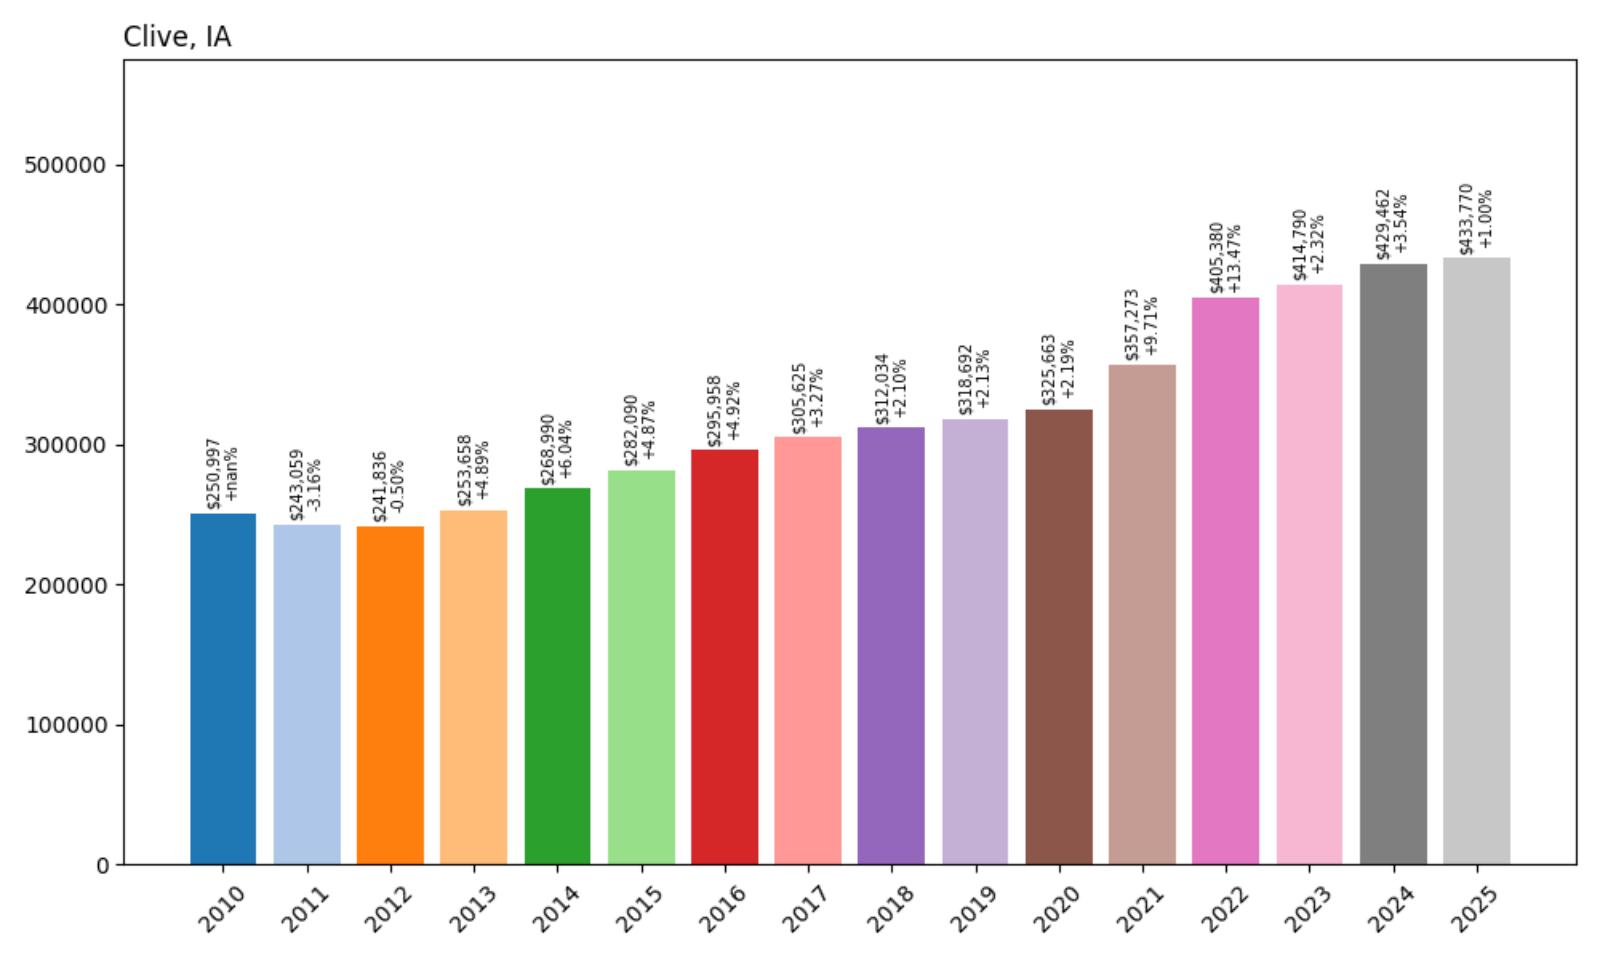
- 2010: $250,997
- 2011: $243,059 (−$7,938, −3.16% from previous year)
- 2012: $241,836 (−$1,223, −0.50% from previous year)
- 2013: $253,658 (+$11,822, +4.89% from previous year)
- 2014: $268,990 (+$15,332, +6.04% from previous year)
- 2015: $282,090 (+$13,099, +4.87% from previous year)
- 2016: $295,958 (+$13,868, +4.92% from previous year)
- 2017: $305,625 (+$9,667, +3.27% from previous year)
- 2018: $312,034 (+$6,409, +2.10% from previous year)
- 2019: $318,692 (+$6,658, +2.13% from previous year)
- 2020: $325,663 (+$6,971, +2.19% from previous year)
- 2021: $357,273 (+$31,610, +9.71% from previous year)
- 2022: $405,380 (+$48,107, +13.47% from previous year)
- 2023: $414,790 (+$9,410, +2.32% from previous year)
- 2024: $429,462 (+$14,672, +3.54% from previous year)
- 2025: $433,770 (+$4,308, +1.00% from previous year)
Clive demonstrates steady, measured growth throughout the study period, starting from a higher baseline reflecting its established status as a premium Des Moines suburb. The 73% appreciation shows consistent demand for this Polk County community, with significant acceleration during 2021-2022 when values increased by nearly $80,000. Current median prices of $433,770 reflect Clive’s position as an established upscale suburban destination with sustained market appeal.
Clive – Des Moines’ Established Luxury Suburb
Located in western Polk County, Clive has long been recognized as one of the Des Moines metropolitan area’s most prestigious suburban communities. The city of approximately 18,000 residents offers upscale neighborhoods, excellent schools, and extensive recreational amenities that attract professionals and executives seeking premium suburban living. Clive’s appeal stems from its combination of luxury housing options, corporate headquarters presence, and comprehensive community amenities that create an exclusive yet accessible residential environment.
The steady 73% appreciation reflects Clive’s established position in the Des Moines luxury market and continued appeal among high-income buyers. The community’s investment in amenities including the Clive Aquatic Center, extensive trail systems, and well-maintained parks has preserved its competitive advantage in attracting affluent residents. Clive’s corporate presence, including major employers and business developments, adds economic stability and employment opportunities that support sustained housing demand. The reliable price growth demonstrates continued confidence in Clive’s ability to maintain its premium market position.
11. Ackworth – 51% Home Price Increase Since 2019
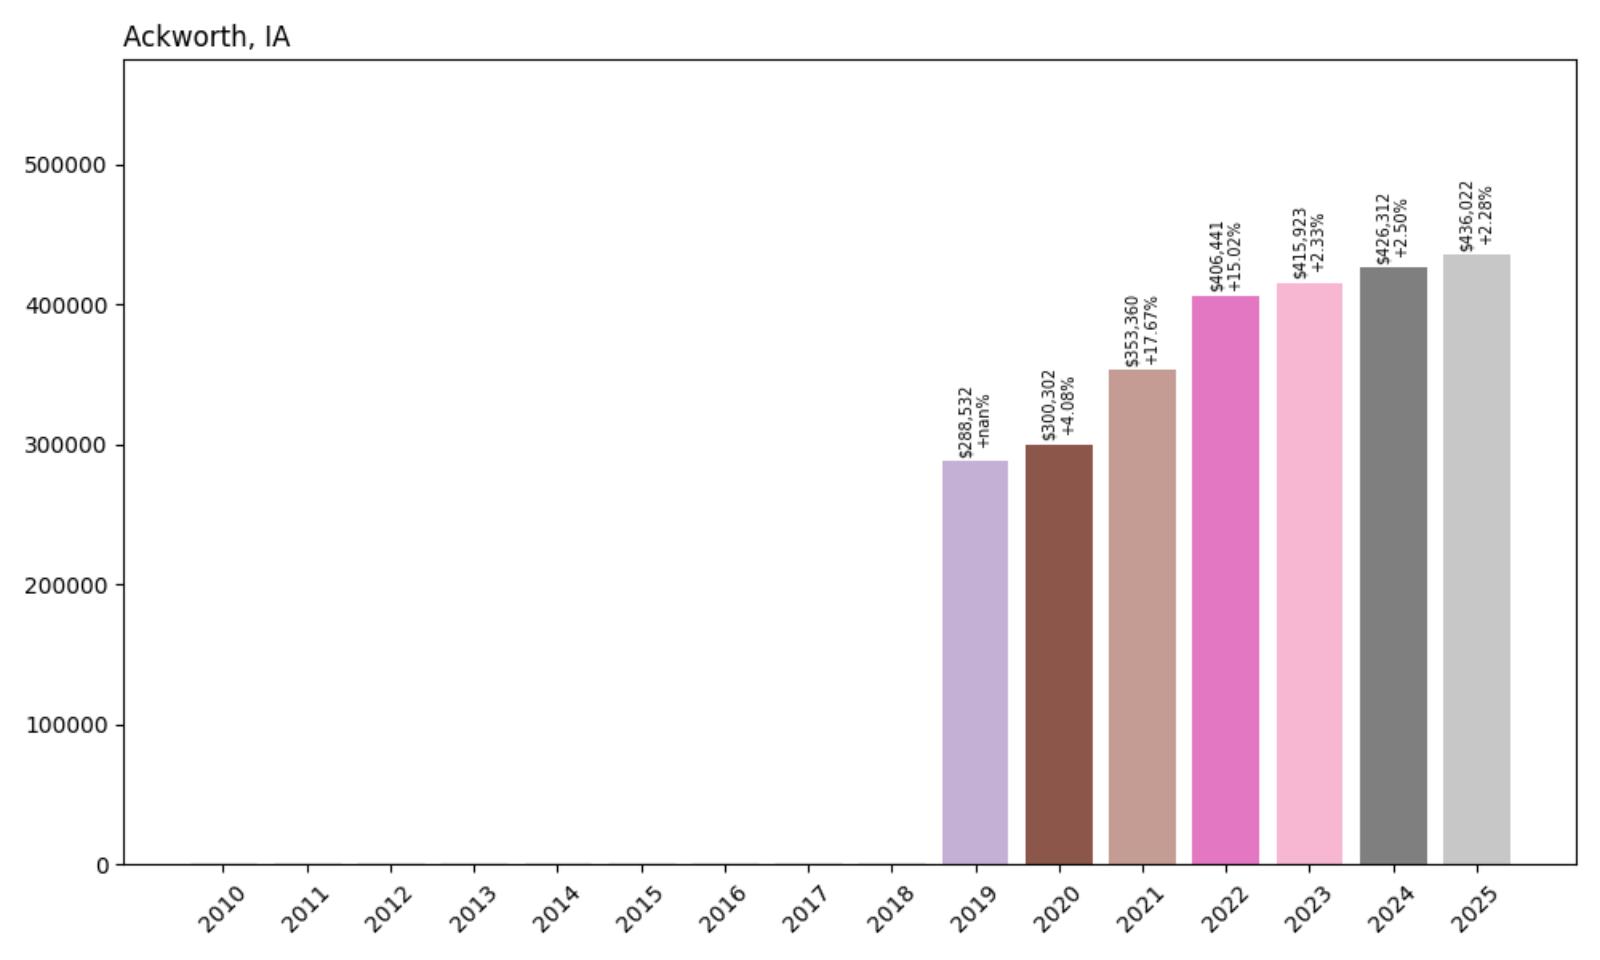
- 2019: $288,532
- 2020: $300,302 (+$11,771, +4.08% from previous year)
- 2021: $353,360 (+$53,058, +17.67% from previous year)
- 2022: $406,441 (+$53,081, +15.02% from previous year)
- 2023: $415,923 (+$9,482, +2.33% from previous year)
- 2024: $426,312 (+$10,389, +2.50% from previous year)
- 2025: $436,022 (+$9,710, +2.28% from previous year)
Ackworth’s data begins in 2019, showing explosive growth during 2021-2022 when values increased by over $106,000 in just two years. The 51% appreciation in only six years reflects dramatic market transformation, with current median prices of $436,022 demonstrating sustained demand for this Warren County community. The rapid price escalation mirrors broader pandemic-era trends toward suburban and rural living.
Ackworth – Warren County’s Rising Star
Located in Warren County south of Des Moines, Ackworth has emerged as an attractive residential destination for families seeking rural character with metropolitan access. This small community offers country living advantages while maintaining reasonable commuting distance to Des Moines employment centers. Ackworth’s appeal has grown significantly among buyers seeking larger properties, privacy, and small-town atmosphere without completely sacrificing urban conveniences and career opportunities.
The remarkable 51% appreciation since 2019 reflects growing recognition of Ackworth’s value proposition in the greater Des Moines market. The dramatic growth during 2021-2022 mirrors broader migration trends toward rural and suburban communities that accelerated during the pandemic. Ackworth benefits from Warren County’s strong economic foundation while offering rural lifestyle advantages that have become increasingly valuable to buyers. The sustained high values suggest continued demand among buyers prioritizing space, community character, and natural settings over immediate urban access.
10. Swisher – 60% Home Price Increase Since 2010
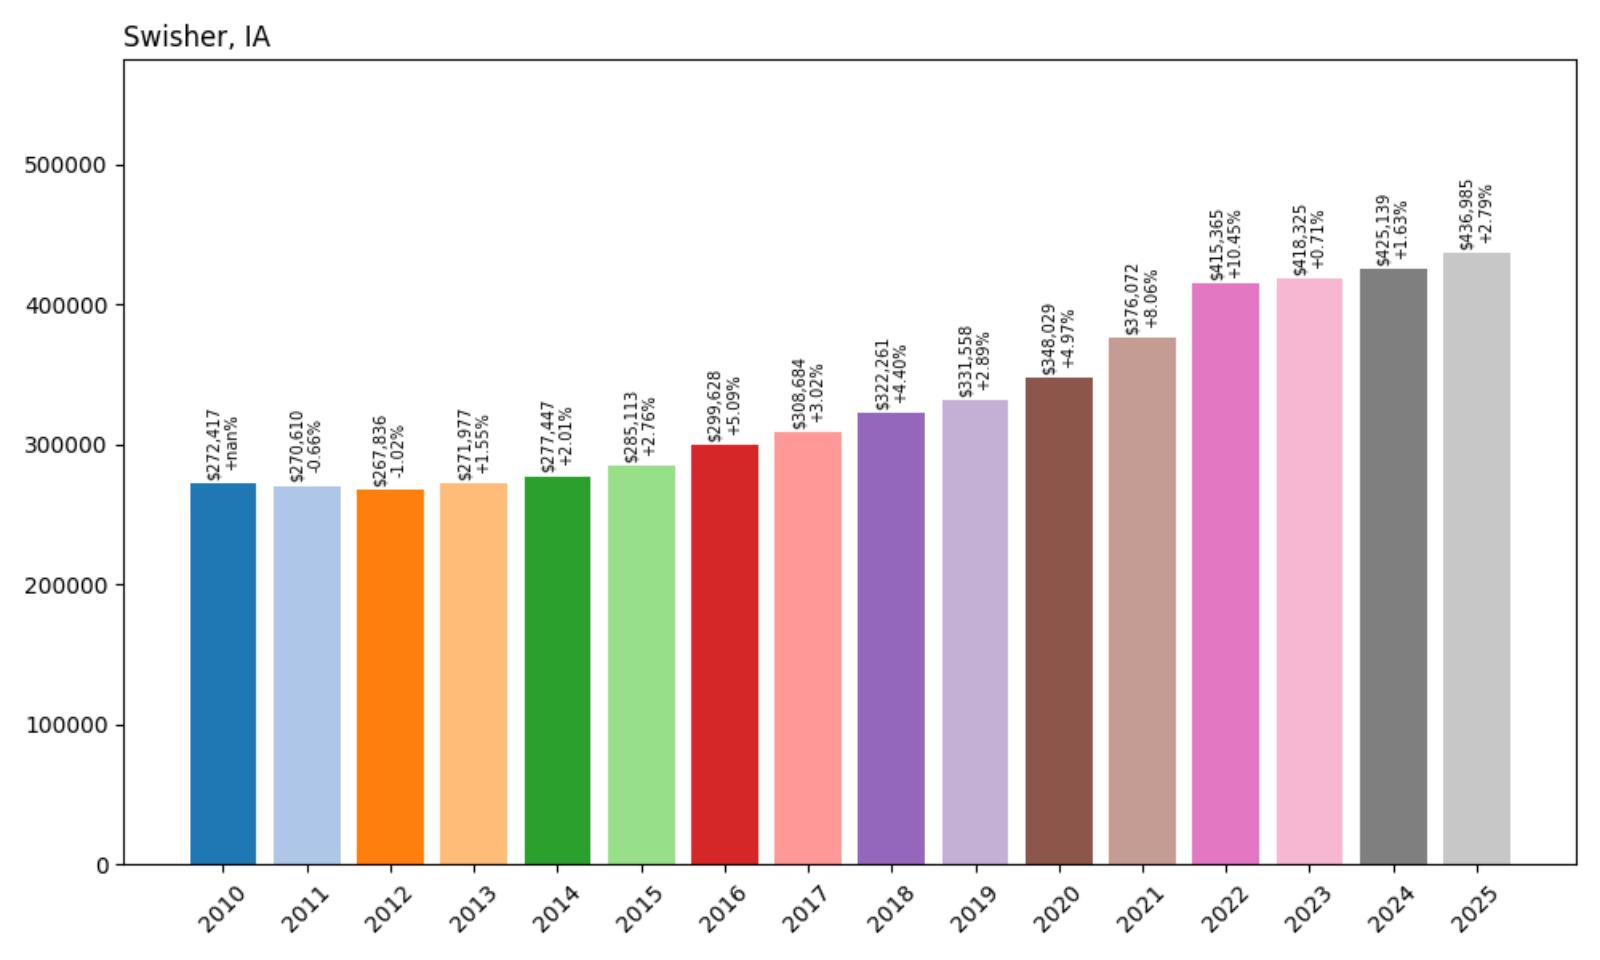
- 2010: $272,417
- 2011: $270,610 (−$1,807, −0.66% from previous year)
- 2012: $267,836 (−$2,773, −1.02% from previous year)
- 2013: $271,977 (+$4,140, +1.55% from previous year)
- 2014: $277,447 (+$5,471, +2.01% from previous year)
- 2015: $285,113 (+$7,665, +2.76% from previous year)
- 2016: $299,628 (+$14,515, +5.09% from previous year)
- 2017: $308,684 (+$9,056, +3.02% from previous year)
- 2018: $322,261 (+$13,577, +4.40% from previous year)
- 2019: $331,558 (+$9,297, +2.89% from previous year)
- 2020: $348,029 (+$16,471, +4.97% from previous year)
- 2021: $376,072 (+$28,042, +8.06% from previous year)
- 2022: $415,365 (+$39,293, +10.45% from previous year)
- 2023: $418,325 (+$2,960, +0.71% from previous year)
- 2024: $425,139 (+$6,813, +1.63% from previous year)
- 2025: $436,985 (+$11,846, +2.79% from previous year)
Swisher shows gradual but consistent appreciation throughout the study period, starting from a higher baseline that reflects its established market position. The 60% total growth demonstrates steady demand for this Johnson County community, with notable acceleration during 2021-2022. Current median prices of $436,985 reflect Swisher’s continued appeal as a suburban alternative to Iowa City, with recent moderate growth suggesting market maturity.
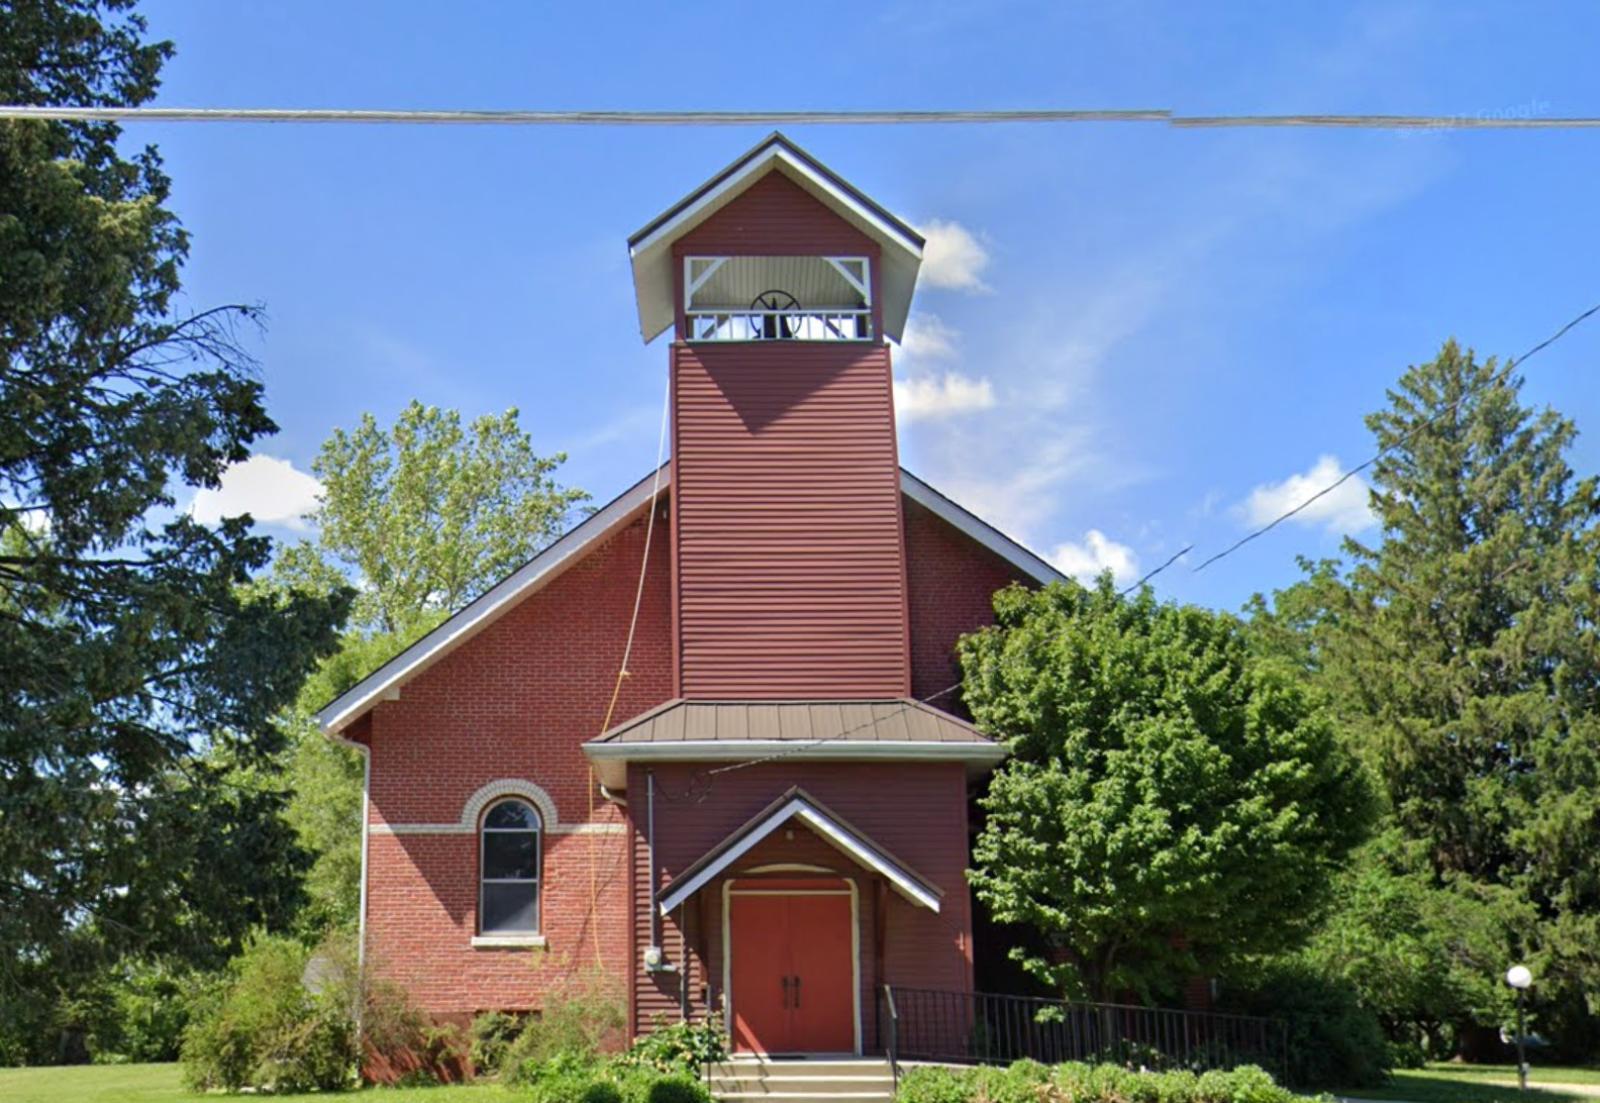
Swisher – Johnson County’s Family Haven
Located in Johnson County near Iowa City, Swisher has established itself as a premier family-oriented community that combines small-town character with access to university town amenities. The city of approximately 900 residents offers excellent schools and recreational facilities while providing easy access to Iowa City employment and cultural opportunities. Swisher’s appeal has grown among families seeking alternatives to urban living while maintaining access to the University of Iowa and associated employment opportunities.
The steady 60% appreciation reflects Swisher’s reputation as a stable and desirable residential destination that attracts families prioritizing education and community involvement. The area’s proximity to Iowa City provides unique advantages including cultural events, educational opportunities, and diverse employment options not typically available in smaller Iowa communities. Swisher’s success in maintaining small-town character while accommodating growth has preserved the qualities that originally attracted residents seeking community-oriented living with urban access.
9. Arnolds Park – 136% Home Price Increase Since 2010
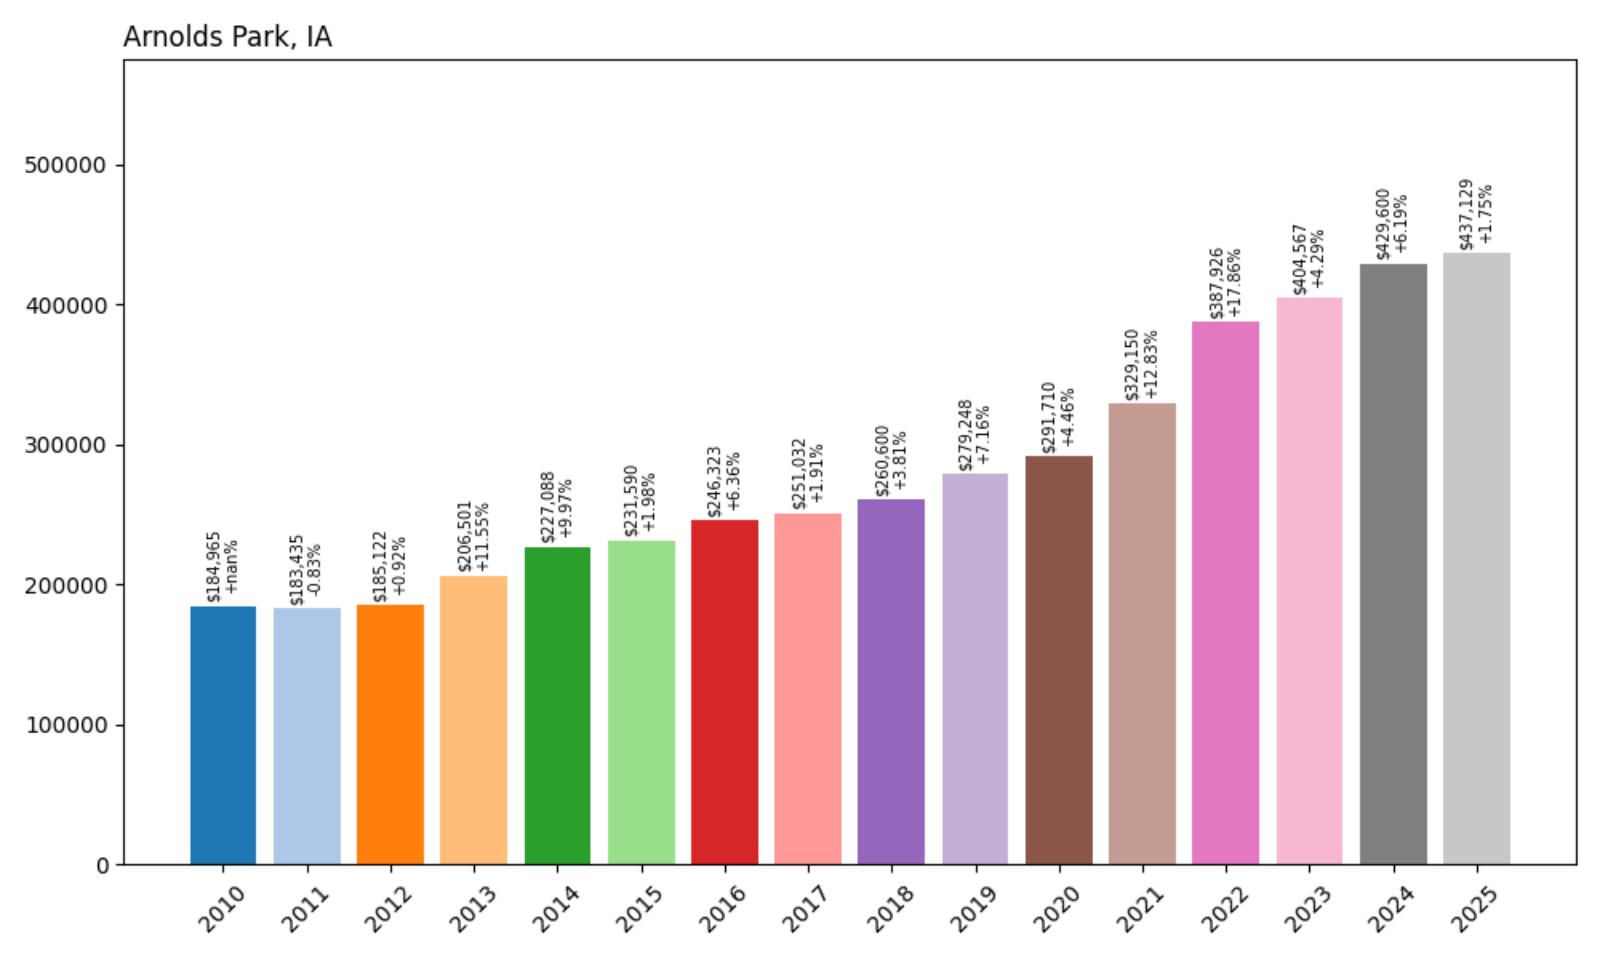
- 2010: $184,965
- 2011: $183,435 (−$1,530, −0.83% from previous year)
- 2012: $185,122 (+$1,686, +0.92% from previous year)
- 2013: $206,501 (+$21,379, +11.55% from previous year)
- 2014: $227,088 (+$20,587, +9.97% from previous year)
- 2015: $231,590 (+$4,502, +1.98% from previous year)
- 2016: $246,323 (+$14,733, +6.36% from previous year)
- 2017: $251,032 (+$4,709, +1.91% from previous year)
- 2018: $260,600 (+$9,568, +3.81% from previous year)
- 2019: $279,248 (+$18,648, +7.16% from previous year)
- 2020: $291,710 (+$12,462, +4.46% from previous year)
- 2021: $329,150 (+$37,440, +12.83% from previous year)
- 2022: $387,926 (+$58,775, +17.86% from previous year)
- 2023: $404,567 (+$16,641, +4.29% from previous year)
- 2024: $429,600 (+$25,033, +6.19% from previous year)
- 2025: $437,129 (+$7,529, +1.75% from previous year)
Arnolds Park demonstrates exceptional 136% appreciation with particularly volatile growth patterns typical of vacation markets. The community experienced strong early gains in 2013-2014, followed by explosive growth during 2021-2022 when values increased by nearly $96,000. Current median prices of $437,129 reflect the area’s transformation into a premium lakefront destination, with sustained demand for Iowa Great Lakes recreational properties.
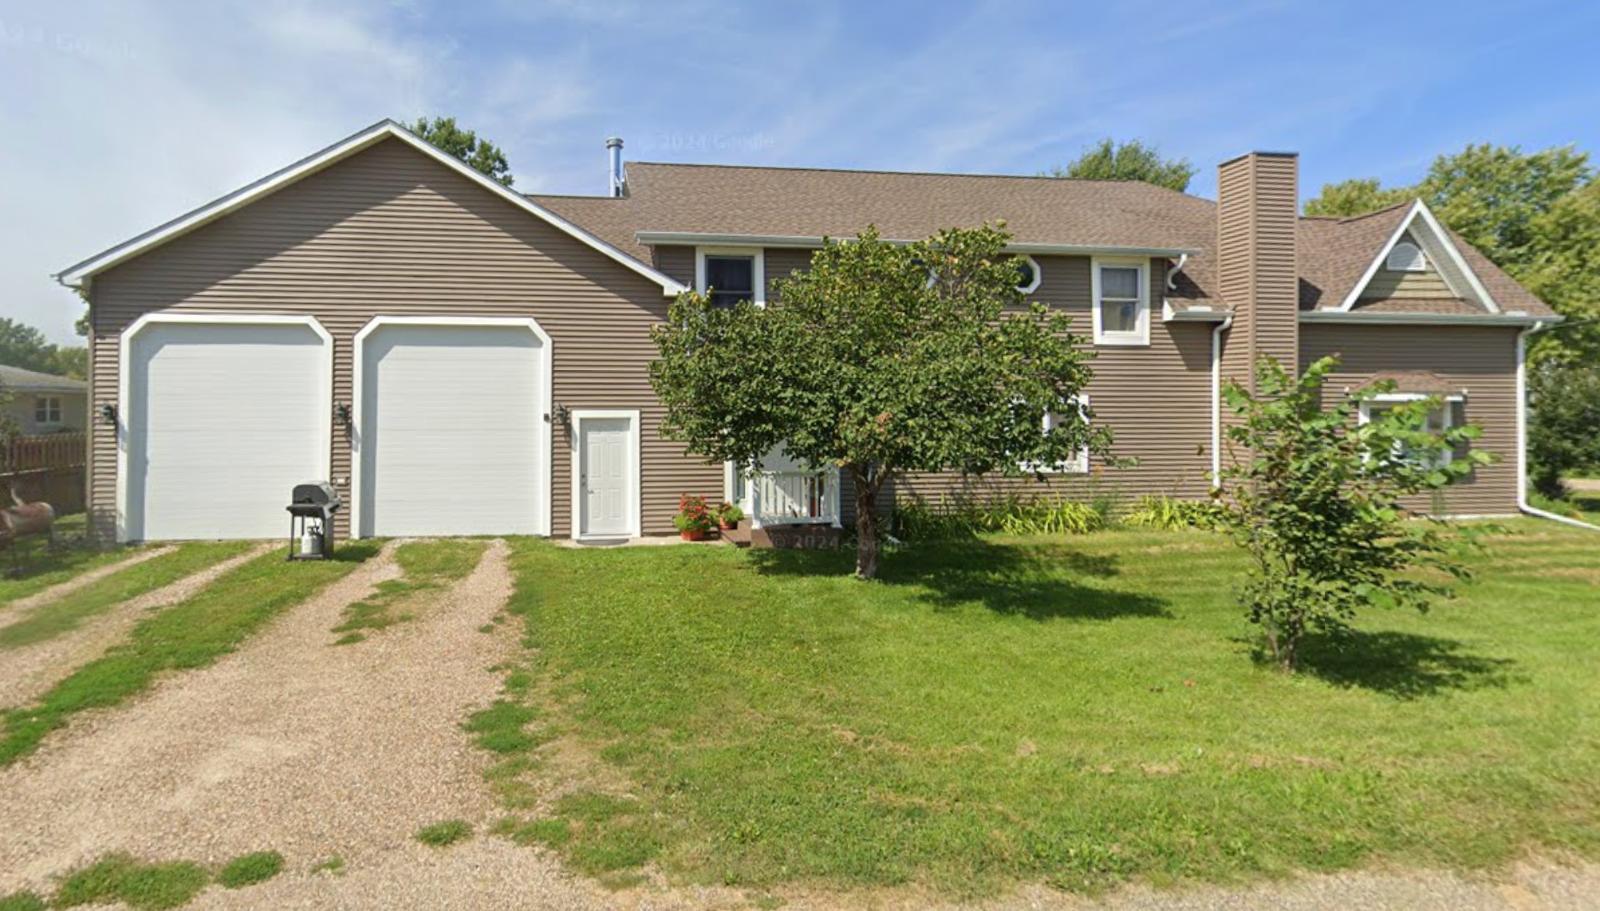
Arnolds Park – Iowa’s Vacation Capital
Located on the shores of West Okoboji Lake, Arnolds Park represents Iowa’s premier vacation and entertainment destination. The community combines natural beauty with recreational amenities including amusement parks, water activities, and seasonal attractions that draw visitors from across the Midwest. Arnolds Park’s unique position as both a residential community and tourist destination creates a dynamic real estate market driven by vacation home buyers, retirees, and permanent residents seeking lakefront lifestyle advantages.
The remarkable 136% appreciation reflects Arnolds Park’s evolution from seasonal cottages to year-round luxury residences and vacation homes. The volatile growth pattern mirrors typical vacation market dynamics, with demand influenced by lifestyle preferences, recreational opportunities, and investment potential rather than traditional employment factors. The area’s continued appeal stems from its unique combination of natural beauty, recreational amenities, and entertainment options that are rare in Iowa’s predominantly rural landscape. Recent sustained high values demonstrate Arnolds Park’s established position as a premium destination commanding luxury prices.
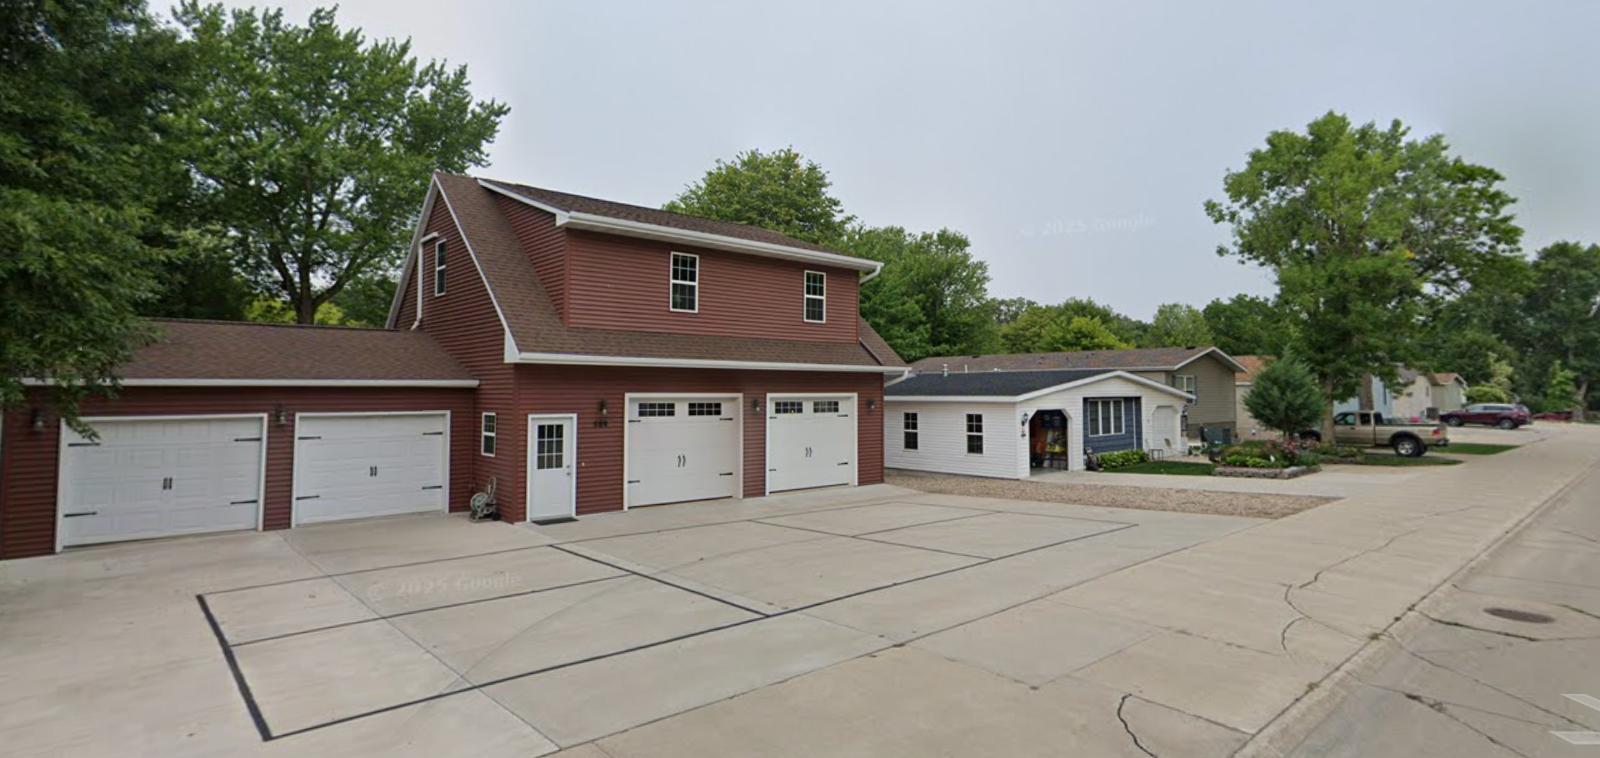
8. Solon – 89% Home Price Increase Since 2010
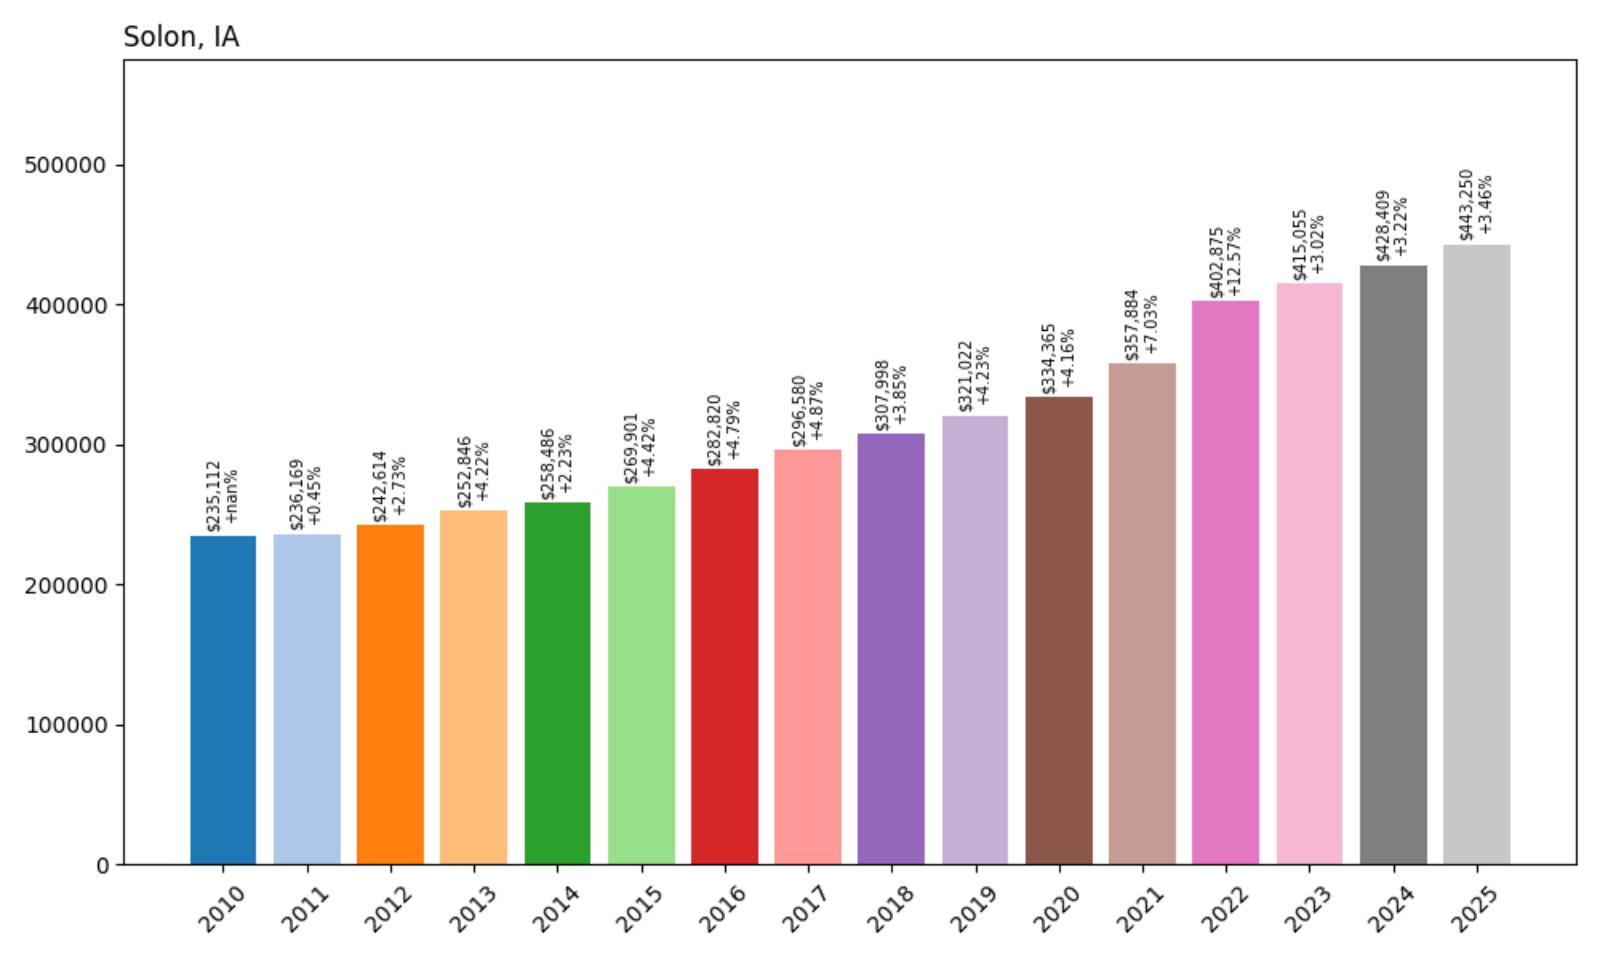
- 2010: $235,112
- 2011: $236,169 (+$1,057, +0.45% from previous year)
- 2012: $242,614 (+$6,445, +2.73% from previous year)
- 2013: $252,846 (+$10,232, +4.22% from previous year)
- 2014: $258,486 (+$5,641, +2.23% from previous year)
- 2015: $269,901 (+$11,415, +4.42% from previous year)
- 2016: $282,820 (+$12,919, +4.79% from previous year)
- 2017: $296,580 (+$13,760, +4.87% from previous year)
- 2018: $307,998 (+$11,418, +3.85% from previous year)
- 2019: $321,022 (+$13,024, +4.23% from previous year)
- 2020: $334,365 (+$13,343, +4.16% from previous year)
- 2021: $357,884 (+$23,520, +7.03% from previous year)
- 2022: $402,875 (+$44,991, +12.57% from previous year)
- 2023: $415,055 (+$12,180, +3.02% from previous year)
- 2024: $428,409 (+$13,354, +3.22% from previous year)
- 2025: $443,250 (+$14,841, +3.46% from previous year)
Solon exhibits remarkably consistent appreciation throughout the study period, with steady growth averaging 4% annually before accelerating during 2021-2022. The 89% total appreciation reflects sustained demand for this Johnson County community, with current median prices of $443,250 demonstrating continued momentum. The consistency of growth suggests stable market fundamentals and enduring appeal among buyers seeking Iowa City area living.
Solon – Johnson County’s Educational Excellence
Located in Johnson County southeast of Iowa City, Solon has established itself as a premier educational community with exceptional schools and family-oriented amenities. The city of approximately 3,000 residents offers small-town character while providing access to University of Iowa resources and Iowa City employment opportunities. Solon’s reputation for educational excellence has attracted families from across eastern Iowa seeking proven academic achievement and comprehensive extracurricular programs for their children.
The steady 89% appreciation reflects Solon’s established reputation as a destination for families prioritizing education quality and community involvement. The community’s investment in schools and recreational facilities has created a compelling value proposition that attracts buyers willing to pay premium prices for educational excellence. Solon’s success in maintaining high academic standards while preserving small-town character has created sustained demand among families seeking both educational opportunities and community connections. The reliable price growth demonstrates continued confidence in Solon’s ability to deliver quality of life that justifies premium housing costs.
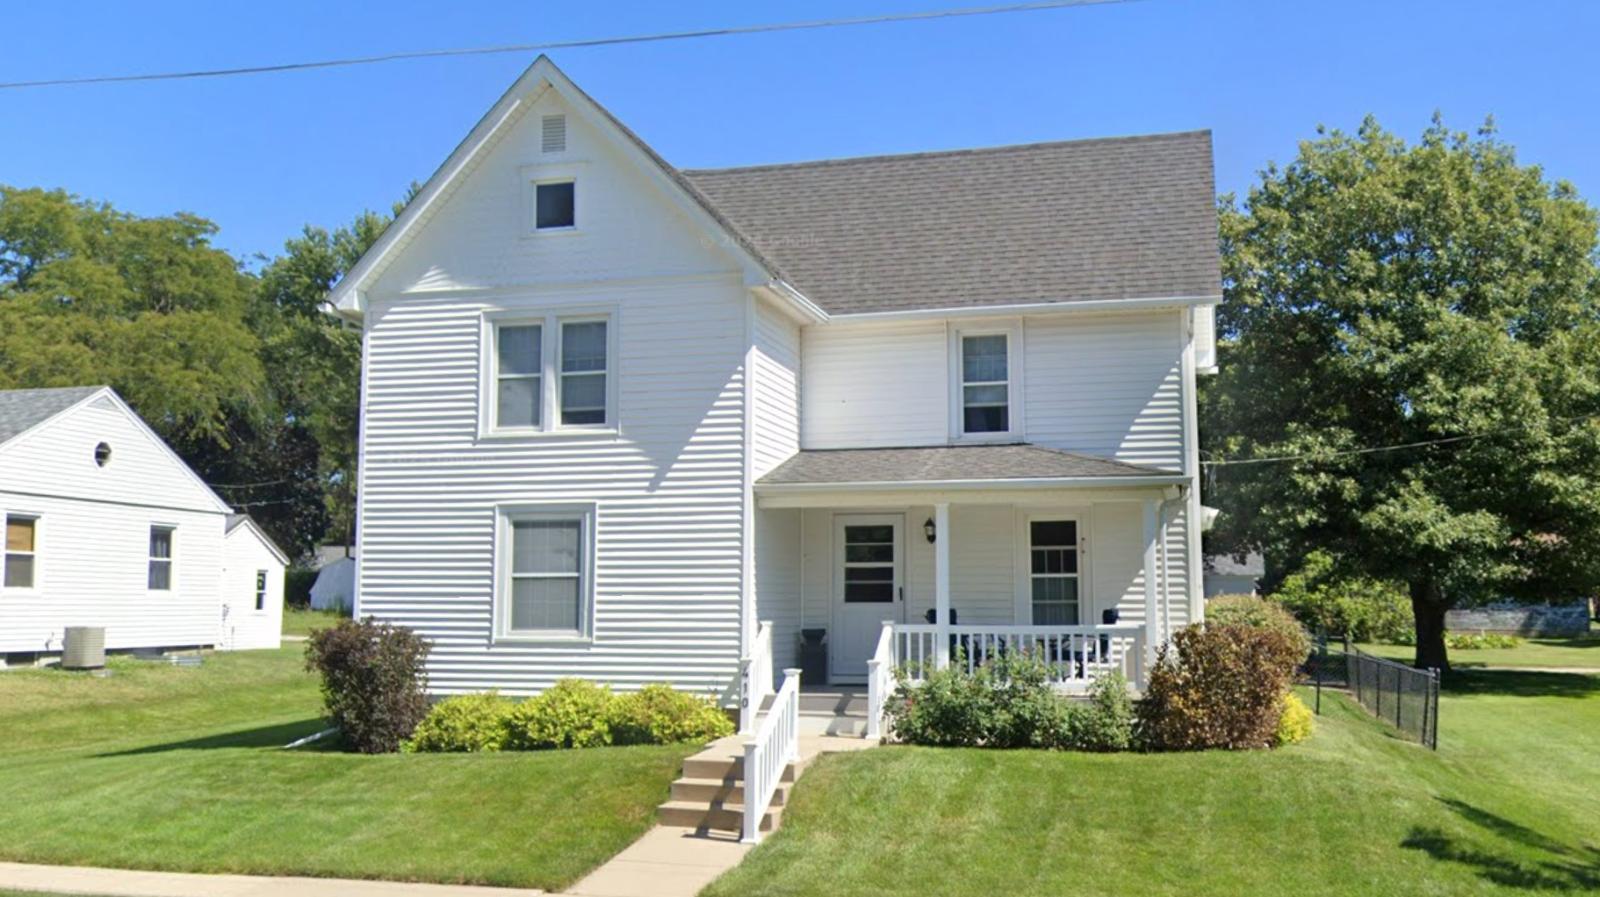
7. Honey Creek – 130% Home Price Increase Since 2012
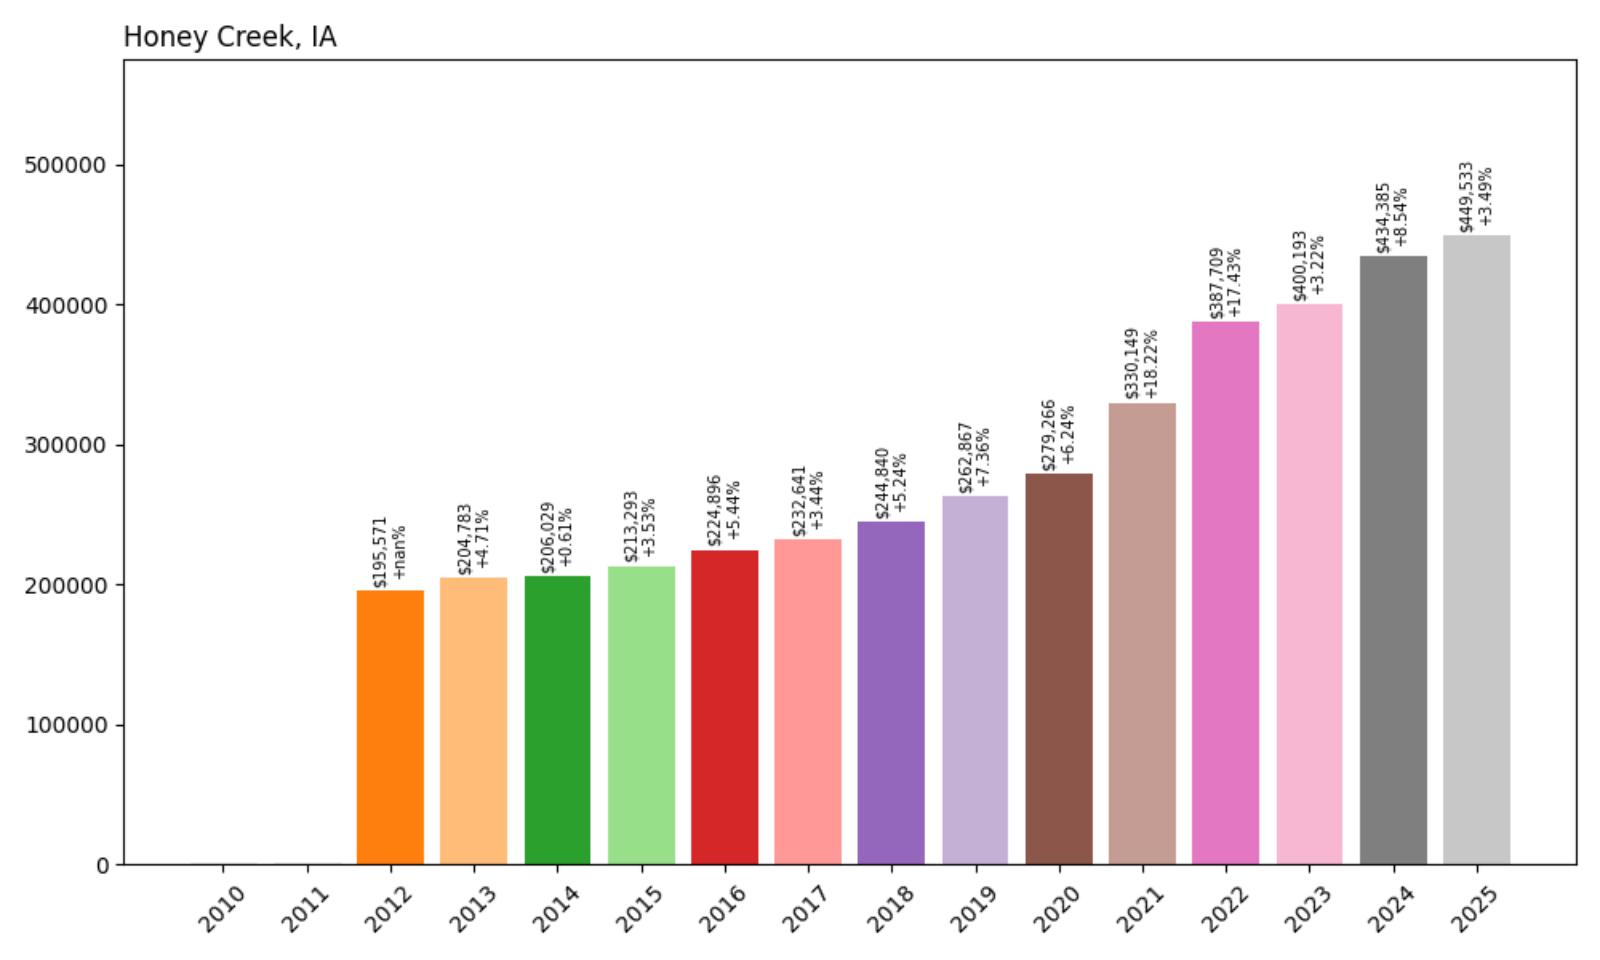
- 2012: $195,571
- 2013: $204,783 (+$9,212, +4.71% from previous year)
- 2014: $206,029 (+$1,246, +0.61% from previous year)
- 2015: $213,293 (+$7,264, +3.53% from previous year)
- 2016: $224,896 (+$11,603, +5.44% from previous year)
- 2017: $232,641 (+$7,746, +3.44% from previous year)
- 2018: $244,840 (+$12,199, +5.24% from previous year)
- 2019: $262,867 (+$18,027, +7.36% from previous year)
- 2020: $279,266 (+$16,399, +6.24% from previous year)
- 2021: $330,149 (+$50,883, +18.22% from previous year)
- 2022: $387,709 (+$57,559, +17.43% from previous year)
- 2023: $400,193 (+$12,484, +3.22% from previous year)
- 2024: $434,385 (+$34,191, +8.54% from previous year)
- 2025: $449,533 (+$15,148, +3.49% from previous year)
Honey Creek’s data begins in 2012, showing steady early growth followed by explosive appreciation during 2021-2022 when values increased by over $108,000. The 130% growth in thirteen years reflects remarkable market transformation, with current median prices of $449,533 demonstrating sustained demand for this Pottawattamie County community. The dramatic pandemic-era acceleration mirrors broader suburban migration trends.
Honey Creek – Pottawattamie County’s Suburban Gem
Located in Pottawattamie County near the Nebraska border, Honey Creek offers suburban living with easy access to the Omaha metropolitan area. This growing community provides an attractive alternative for families seeking newer housing developments and modern amenities while maintaining Iowa residency and tax advantages. Honey Creek’s appeal has grown significantly among Omaha commuters who prioritize housing value, community atmosphere, and quality of life over proximity to urban centers.
The remarkable 130% appreciation since 2012 reflects Honey Creek’s successful development as a commuter community serving the greater Omaha market. The explosive growth during 2021-2022 mirrors broader trends toward suburban and rural migration that were amplified by remote work opportunities and lifestyle preferences. Honey Creek benefits from its strategic location between rural Iowa and metropolitan Nebraska, providing residents with employment opportunities while offering suburban lifestyle advantages. The sustained price growth suggests continued recognition of the area’s value proposition among buyers seeking alternatives to urban density.
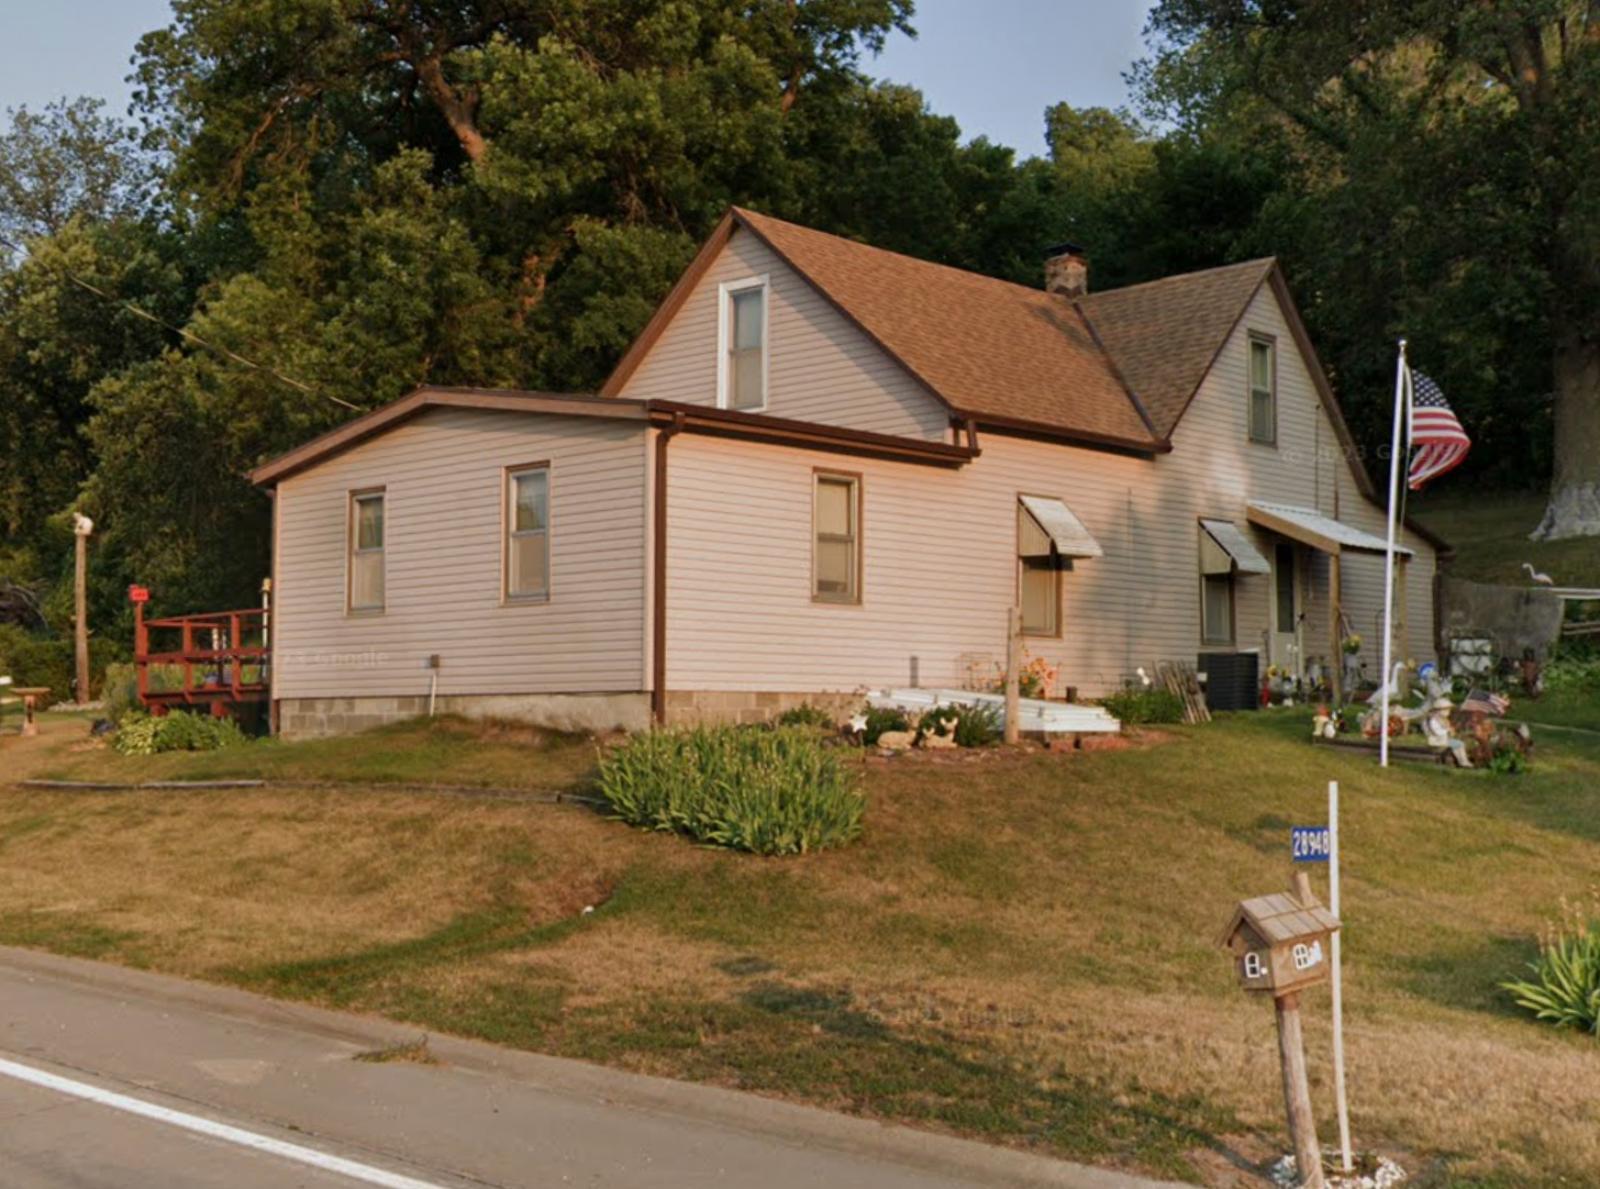
6. Panora – 149% Home Price Increase Since 2010
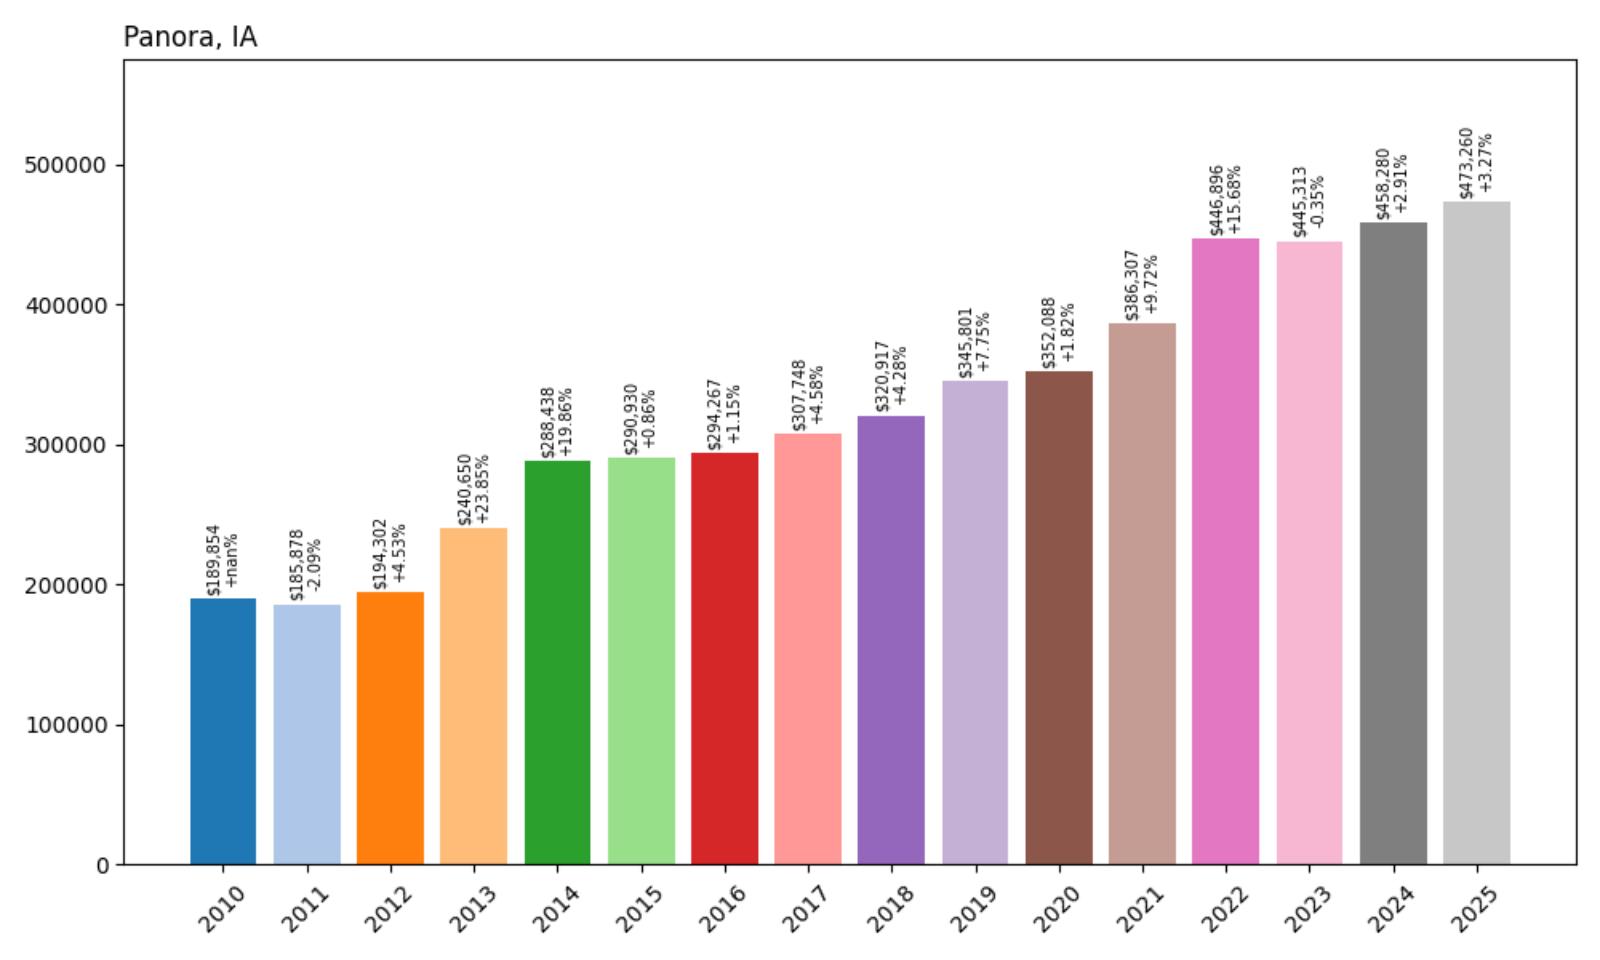
- 2010: $189,854
- 2011: $185,878 (−$3,976, −2.09% from previous year)
- 2012: $194,302 (+$8,425, +4.53% from previous year)
- 2013: $240,650 (+$46,348, +23.85% from previous year)
- 2014: $288,438 (+$47,788, +19.86% from previous year)
- 2015: $290,930 (+$2,492, +0.86% from previous year)
- 2016: $294,267 (+$3,337, +1.15% from previous year)
- 2017: $307,748 (+$13,482, +4.58% from previous year)
- 2018: $320,917 (+$13,168, +4.28% from previous year)
- 2019: $345,801 (+$24,884, +7.75% from previous year)
- 2020: $352,088 (+$6,287, +1.82% from previous year)
- 2021: $386,307 (+$34,219, +9.72% from previous year)
- 2022: $446,896 (+$60,589, +15.68% from previous year)
- 2023: $445,313 (−$1,583, −0.35% from previous year)
- 2024: $458,280 (+$12,967, +2.91% from previous year)
- 2025: $473,260 (+$14,980, +3.27% from previous year)
Panora demonstrates exceptional 149% appreciation with dramatic early spikes in 2013-2014 when values nearly doubled, followed by continued strong growth. The community shows typical vacation market volatility with sustained upward momentum, reaching current median prices of $473,260. The remarkable transformation reflects Panora’s evolution from an affordable lake community to a premium recreational destination.
Panora – Lake Panorama’s Recreational Paradise
Located in Guthrie County around Lake Panorama, Panora has transformed into one of Iowa’s premier recreational real estate markets. The community combines natural beauty with resort-style amenities including golf courses, marinas, and recreational facilities that attract buyers from across the Midwest. Panora’s unique position as both a vacation destination and residential community creates diverse housing demand from retirees, vacation home buyers, and families seeking lakefront lifestyle advantages.
The extraordinary 149% appreciation reflects Panora’s successful development as a luxury recreational destination with broad market appeal. The dramatic early growth in 2013-2014 marked the community’s transition from affordable lake living to premium resort-style properties. Panora’s continued appeal stems from its comprehensive recreational amenities, scenic setting, and resort-style living options that are uncommon in Iowa’s real estate market. The sustained high values demonstrate the community’s established position as a luxury destination that commands premium prices for lakefront access and recreational lifestyle.
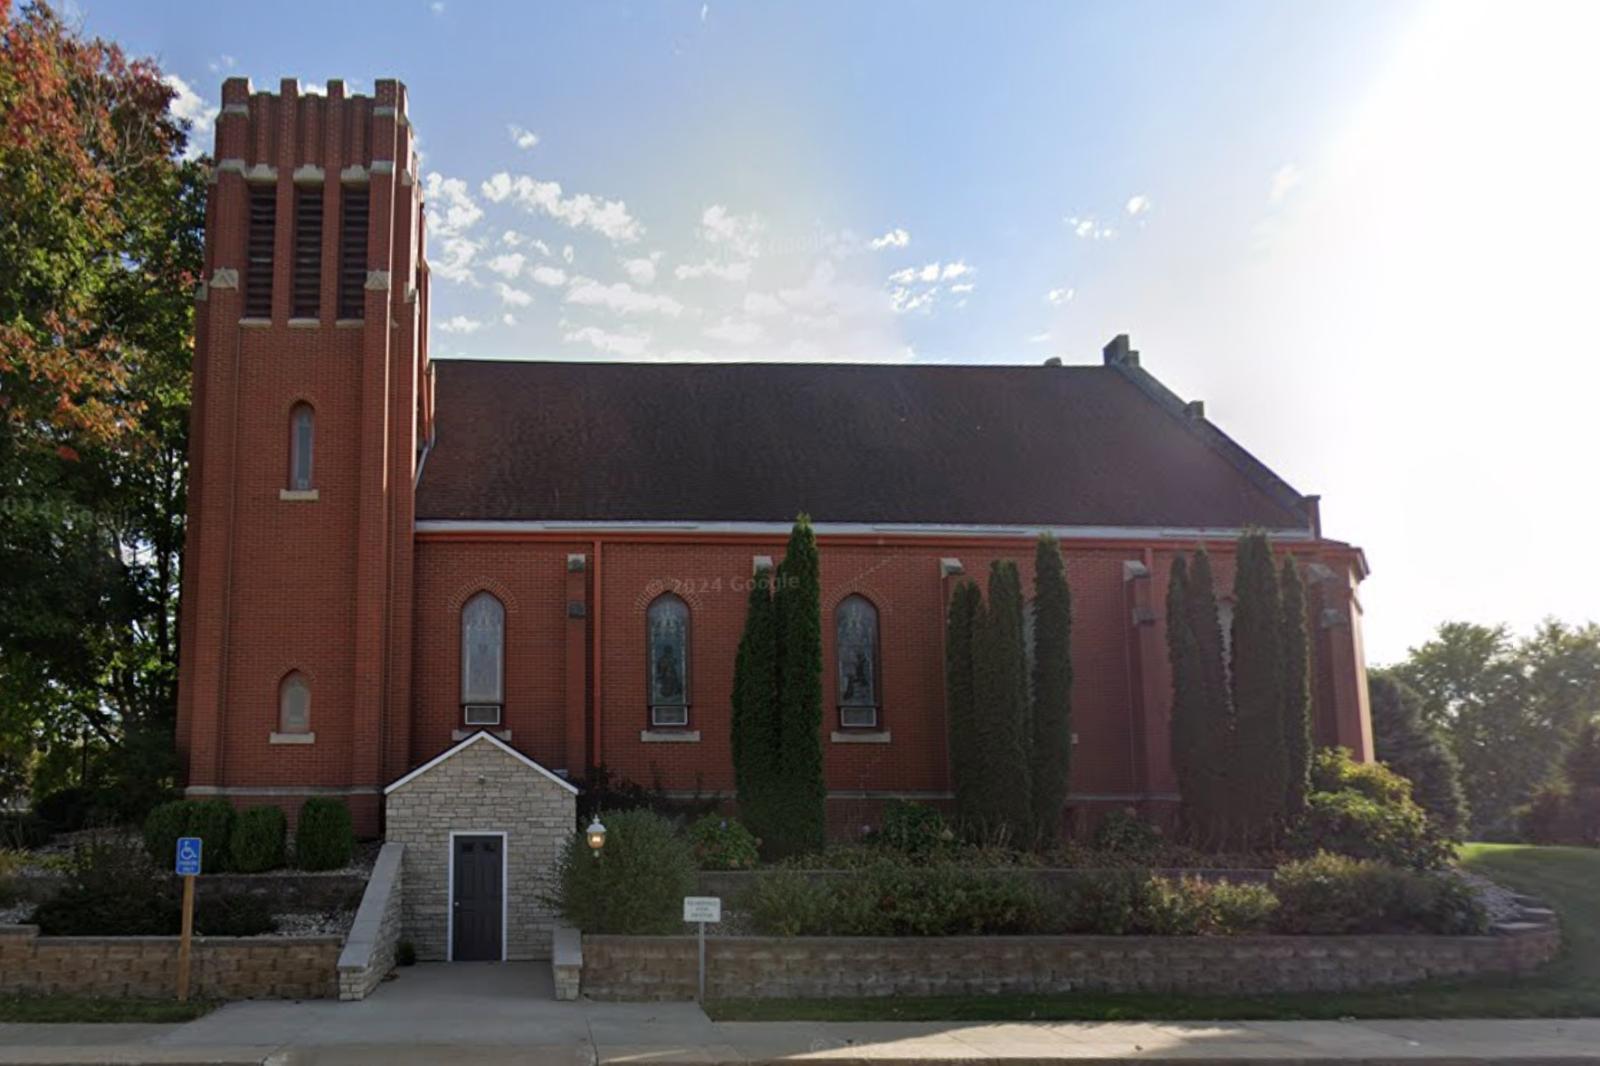
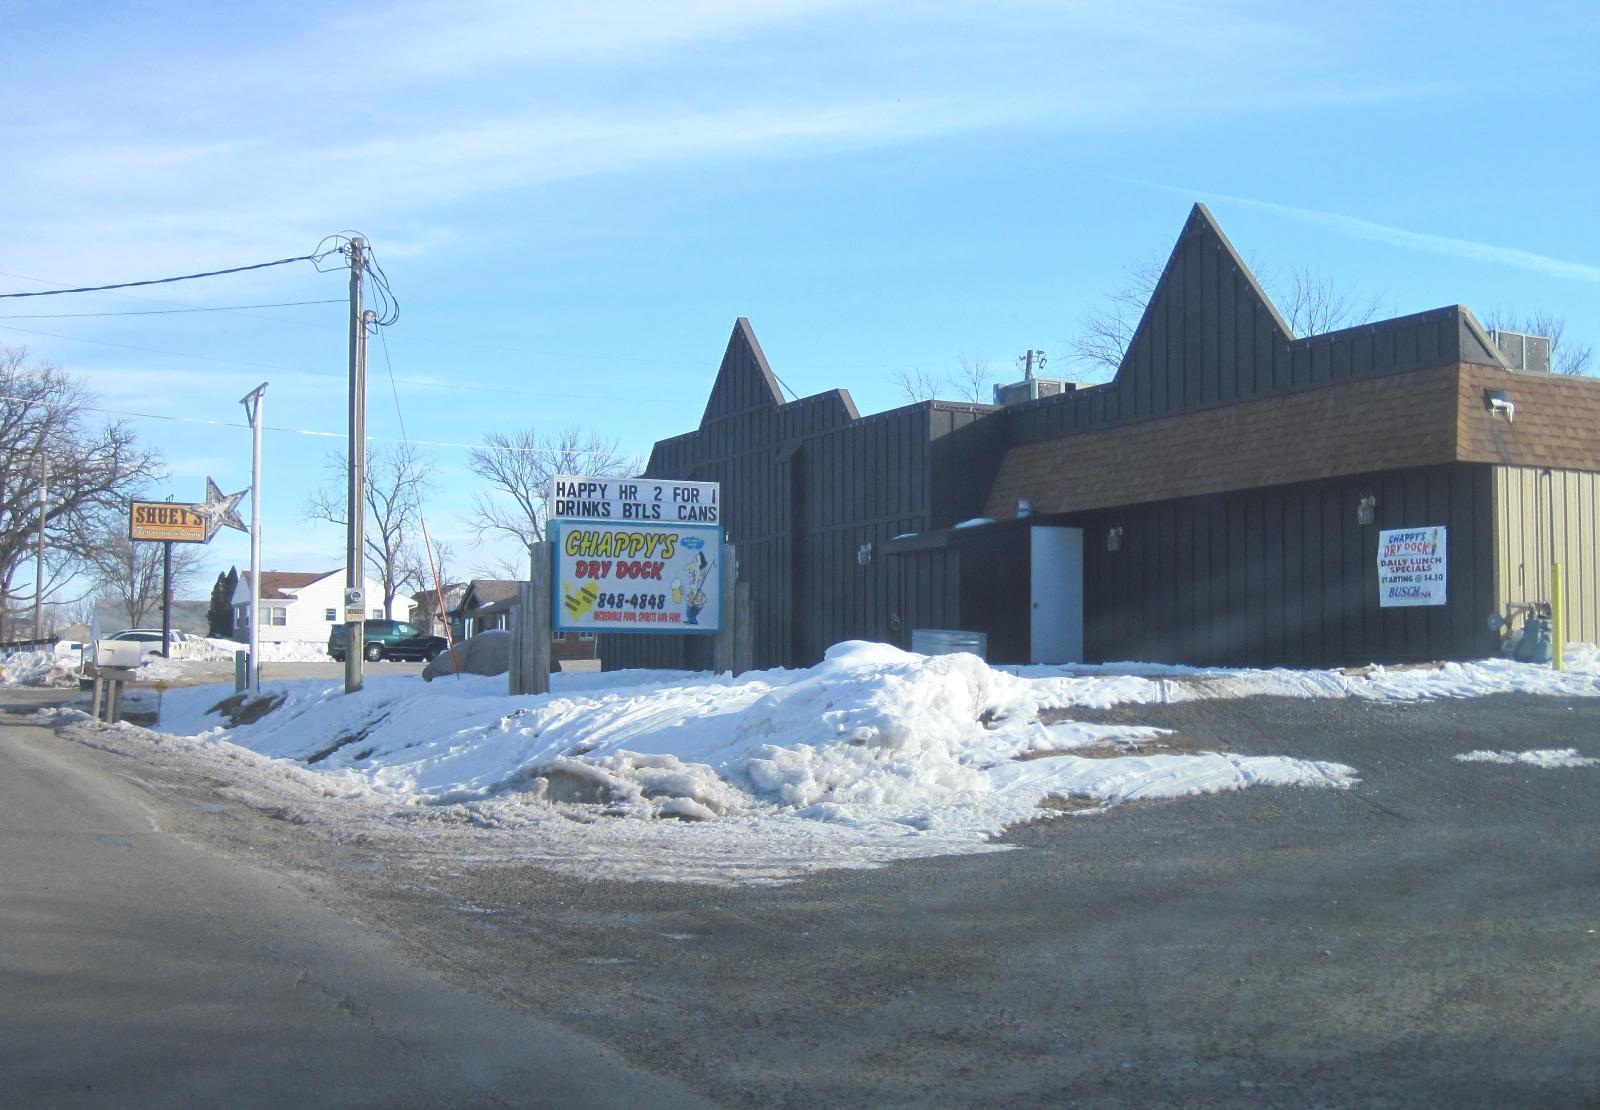
5. Shueyville – 67% Home Price Increase Since 2010
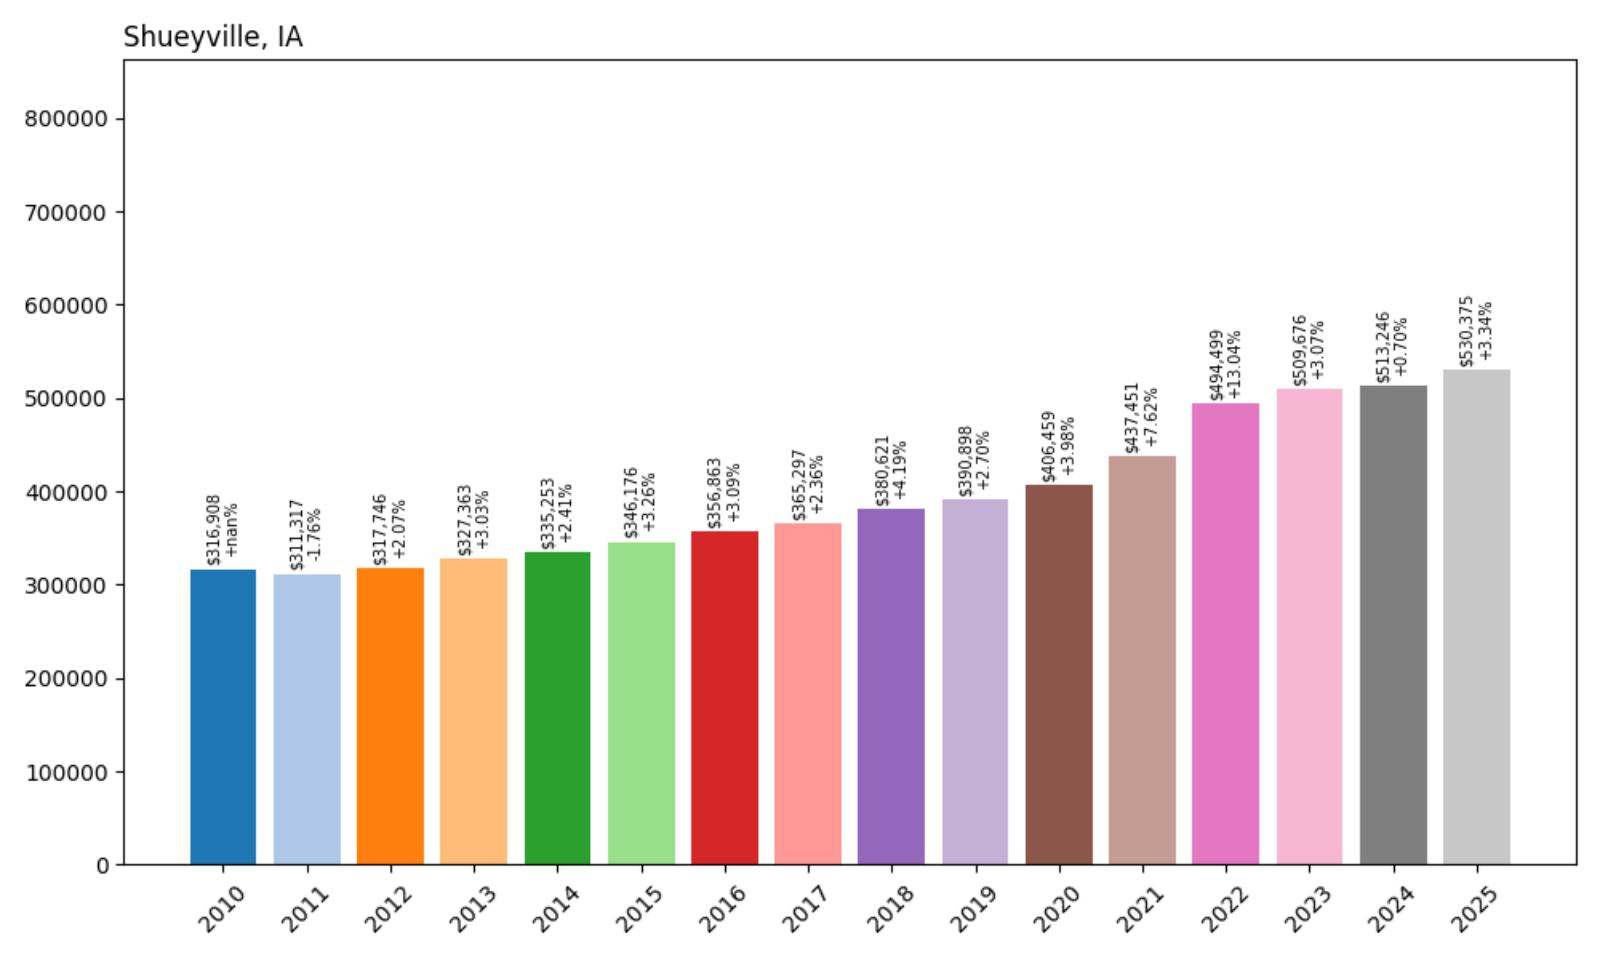
- 2010: $316,908
- 2011: $311,317 (−$5,591, −1.76% from previous year)
- 2012: $317,746 (+$6,429, +2.07% from previous year)
- 2013: $327,363 (+$9,616, +3.03% from previous year)
- 2014: $335,253 (+$7,890, +2.41% from previous year)
- 2015: $346,176 (+$10,923, +3.26% from previous year)
- 2016: $356,863 (+$10,687, +3.09% from previous year)
- 2017: $365,297 (+$8,434, +2.36% from previous year)
- 2018: $380,621 (+$15,324, +4.19% from previous year)
- 2019: $390,898 (+$10,277, +2.70% from previous year)
- 2020: $406,459 (+$15,561, +3.98% from previous year)
- 2021: $437,451 (+$30,992, +7.62% from previous year)
- 2022: $494,499 (+$57,048, +13.04% from previous year)
- 2023: $509,676 (+$15,177, +3.07% from previous year)
- 2024: $513,246 (+$3,570, +0.70% from previous year)
- 2025: $530,375 (+$17,129, +3.34% from previous year)
Shueyville started from the highest baseline in the study, reflecting its established premium market position. The 67% appreciation demonstrates consistent demand for this Johnson County community, with notable acceleration during 2021-2022. Current median prices of $530,375 maintain Shueyville’s position among Iowa’s most expensive residential markets, with steady growth suggesting continued appeal among high-income buyers.
Shueyville – Johnson County’s Luxury Enclave
Located in Johnson County near Iowa City, Shueyville has established itself as an exclusive residential enclave that attracts affluent professionals and executives. The small community offers luxury housing options and rural privacy while maintaining easy access to University of Iowa facilities and Iowa City employment opportunities. Shueyville’s appeal stems from its combination of upscale properties, scenic settings, and proximity to educational and cultural resources that create a unique lifestyle proposition.
The steady 67% appreciation reflects Shueyville’s established position in Iowa’s luxury housing market and continued appeal among high-income buyers seeking exclusivity and privacy. The community’s limited housing stock and rural character have preserved its exclusive atmosphere while providing access to university town amenities and employment opportunities. Shueyville’s success in maintaining its premium market position demonstrates sustained demand for luxury rural properties with urban access. The reliable price growth suggests continued confidence in the area’s ability to attract affluent buyers seeking distinctive lifestyle options.
4. Cumming – 122% Home Price Increase Since 2010
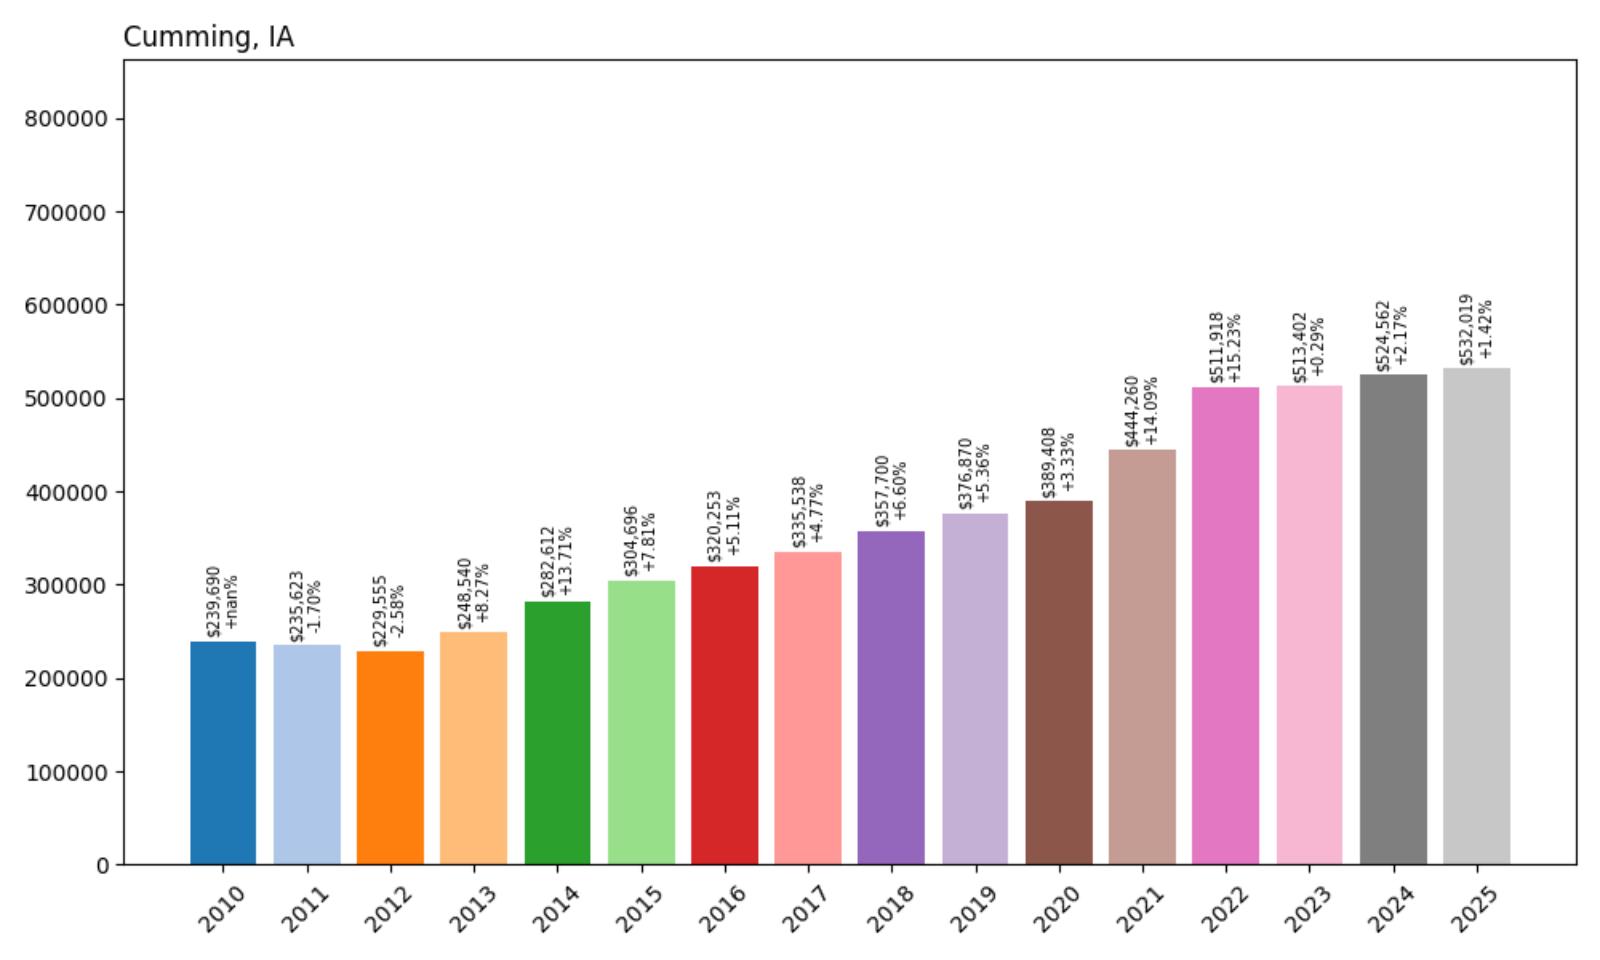
- 2010: $239,690
- 2011: $235,623 (−$4,067, −1.70% from previous year)
- 2012: $229,555 (−$6,067, −2.58% from previous year)
- 2013: $248,540 (+$18,984, +8.27% from previous year)
- 2014: $282,612 (+$34,072, +13.71% from previous year)
- 2015: $304,696 (+$22,085, +7.81% from previous year)
- 2016: $320,253 (+$15,557, +5.11% from previous year)
- 2017: $335,538 (+$15,285, +4.77% from previous year)
- 2018: $357,700 (+$22,162, +6.60% from previous year)
- 2019: $376,870 (+$19,171, +5.36% from previous year)
- 2020: $389,408 (+$12,538, +3.33% from previous year)
- 2021: $444,260 (+$54,852, +14.09% from previous year)
- 2022: $511,918 (+$67,658, +15.23% from previous year)
- 2023: $513,402 (+$1,484, +0.29% from previous year)
- 2024: $524,562 (+$11,159, +2.17% from previous year)
- 2025: $532,019 (+$7,458, +1.42% from previous year)
Cumming overcame early struggles to achieve remarkable 122% growth, with recovery beginning in 2013 and accelerating through consistent gains. The community experienced exceptional performance during 2021-2022 when values increased by over $122,000, reaching current median prices of $532,019. The dramatic transformation demonstrates Cumming’s evolution from an affordable community to a premium residential destination.
Cumming – Warren County’s Premium Destination
Located in Warren County south of Des Moines, Cumming has emerged as one of central Iowa’s most sought-after residential communities. The city combines excellent schools with recreational amenities and planned residential developments that attract affluent families seeking upscale suburban living. Cumming’s strategic location provides easy access to Des Moines employment while offering newer housing stock, quality amenities, and strong community programs that appeal to discerning buyers.
The remarkable 122% appreciation reflects Cumming’s successful transformation into a premier suburban destination with broad appeal among high-income families. The community’s investment in schools, recreational facilities, and infrastructure has created a comprehensive lifestyle package that justifies premium housing costs. Cumming’s appeal stems from its combination of educational excellence, recreational opportunities, and planned community development that attracts families seeking both quality of life and long-term investment value. The sustained price growth demonstrates continued confidence in the area’s ability to deliver premium suburban living.
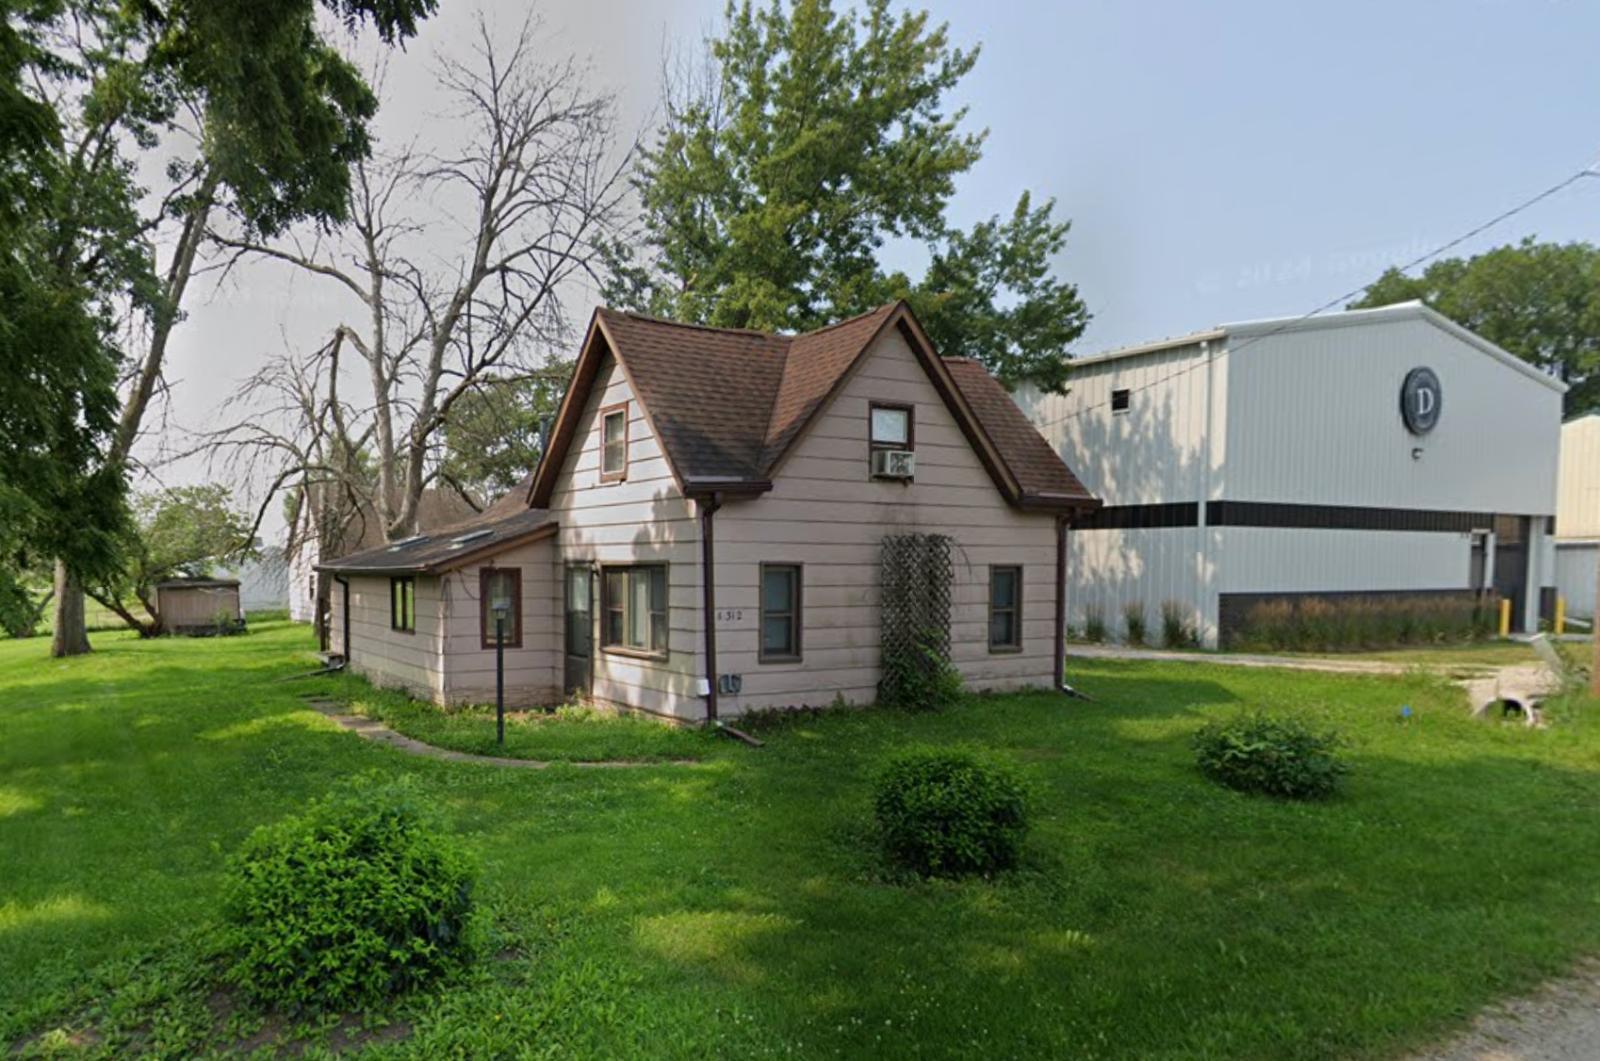
3. Wahpeton – 77% Home Price Increase Since 2017
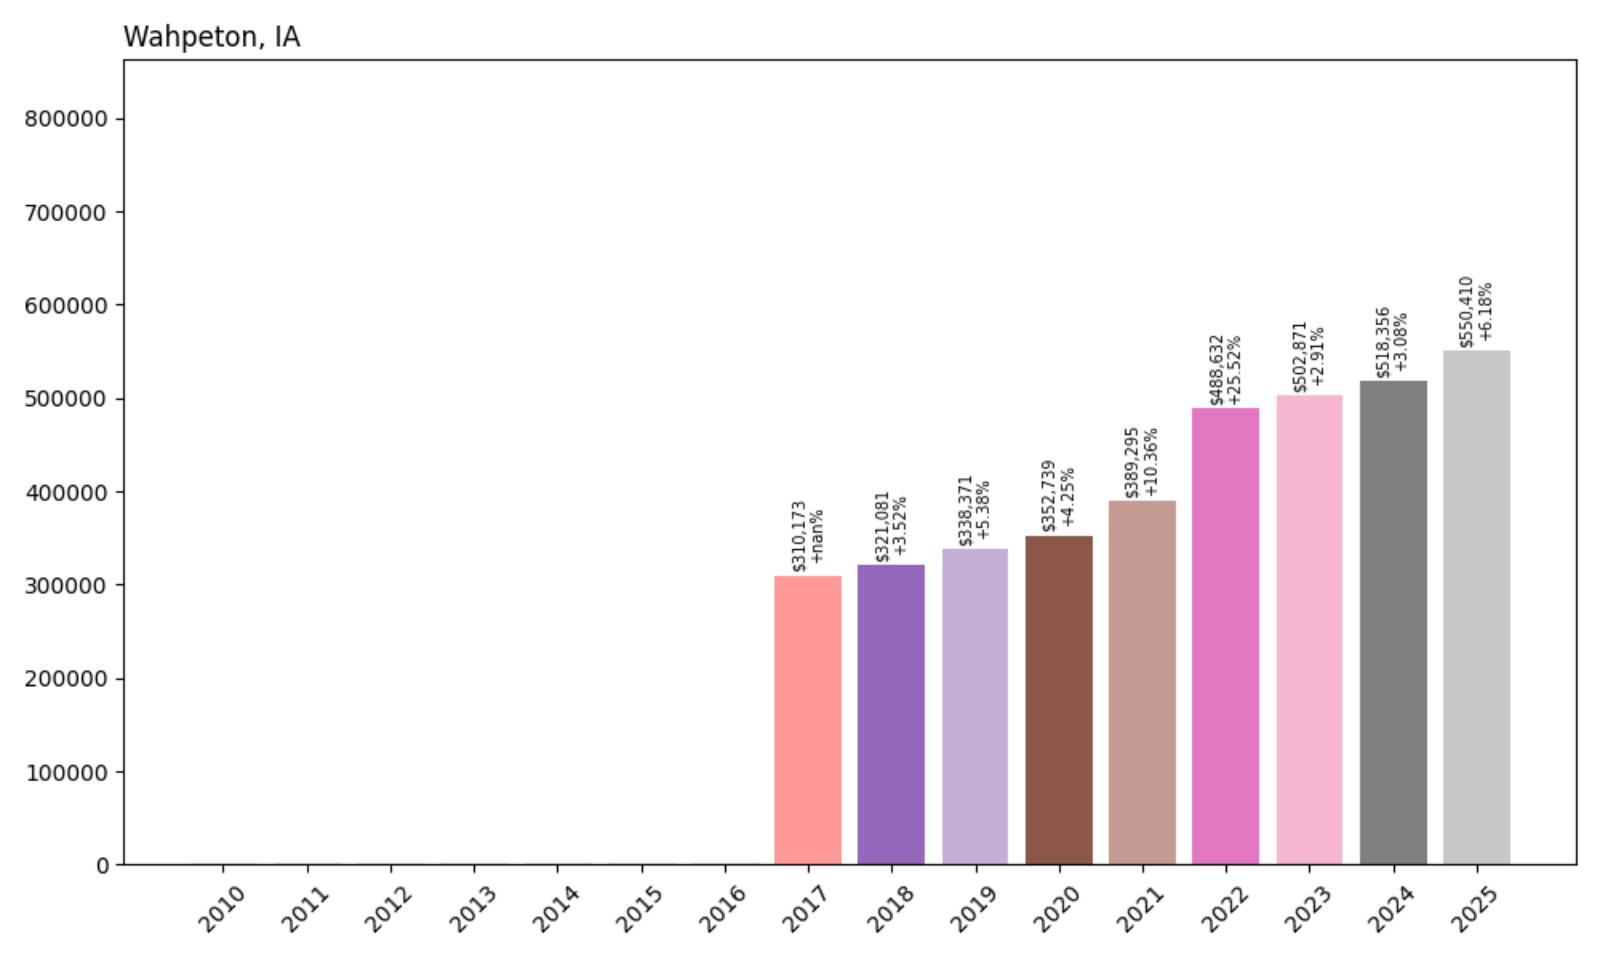
- 2017: $310,173
- 2018: $321,081 (+$10,909, +3.52% from previous year)
- 2019: $338,371 (+$17,290, +5.38% from previous year)
- 2020: $352,739 (+$14,368, +4.25% from previous year)
- 2021: $389,295 (+$36,556, +10.36% from previous year)
- 2022: $488,632 (+$99,337, +25.52% from previous year)
- 2023: $502,871 (+$14,239, +2.91% from previous year)
- 2024: $518,356 (+$15,485, +3.08% from previous year)
- 2025: $550,410 (+$32,054, +6.18% from previous year)
Wahpeton’s data begins in 2017, showing steady early growth followed by explosive appreciation in 2022 when values increased by an extraordinary 25.52%. The 77% growth in just eight years reflects dramatic market transformation, with current median prices of $550,410 demonstrating sustained premium demand. The remarkable single-year gain in 2022 represents one of the strongest performances in the entire dataset.
Wahpeton – Dickinson County’s Elite Retreat
Located in Dickinson County near the Iowa Great Lakes region, Wahpeton represents an exclusive residential enclave that attracts affluent buyers seeking luxury lakefront and recreational properties. This small community offers privacy and natural beauty while providing access to the recreational amenities and entertainment options of the broader lakes area. Wahpeton’s appeal stems from its combination of scenic settings, upscale properties, and proximity to Iowa’s premier vacation and recreational destinations.
The remarkable 77% appreciation since 2017 reflects Wahpeton’s emergence as a premium destination for luxury residential and vacation properties. The explosive growth in 2022 demonstrates the community’s appeal during peak demand for recreational real estate, when buyers sought exclusive properties with natural settings and recreational access. Wahpeton’s continued high values suggest sustained demand among affluent buyers seeking distinctive properties in Iowa’s most scenic and recreational region. The area’s limited housing stock and exclusive character have preserved its premium market position.
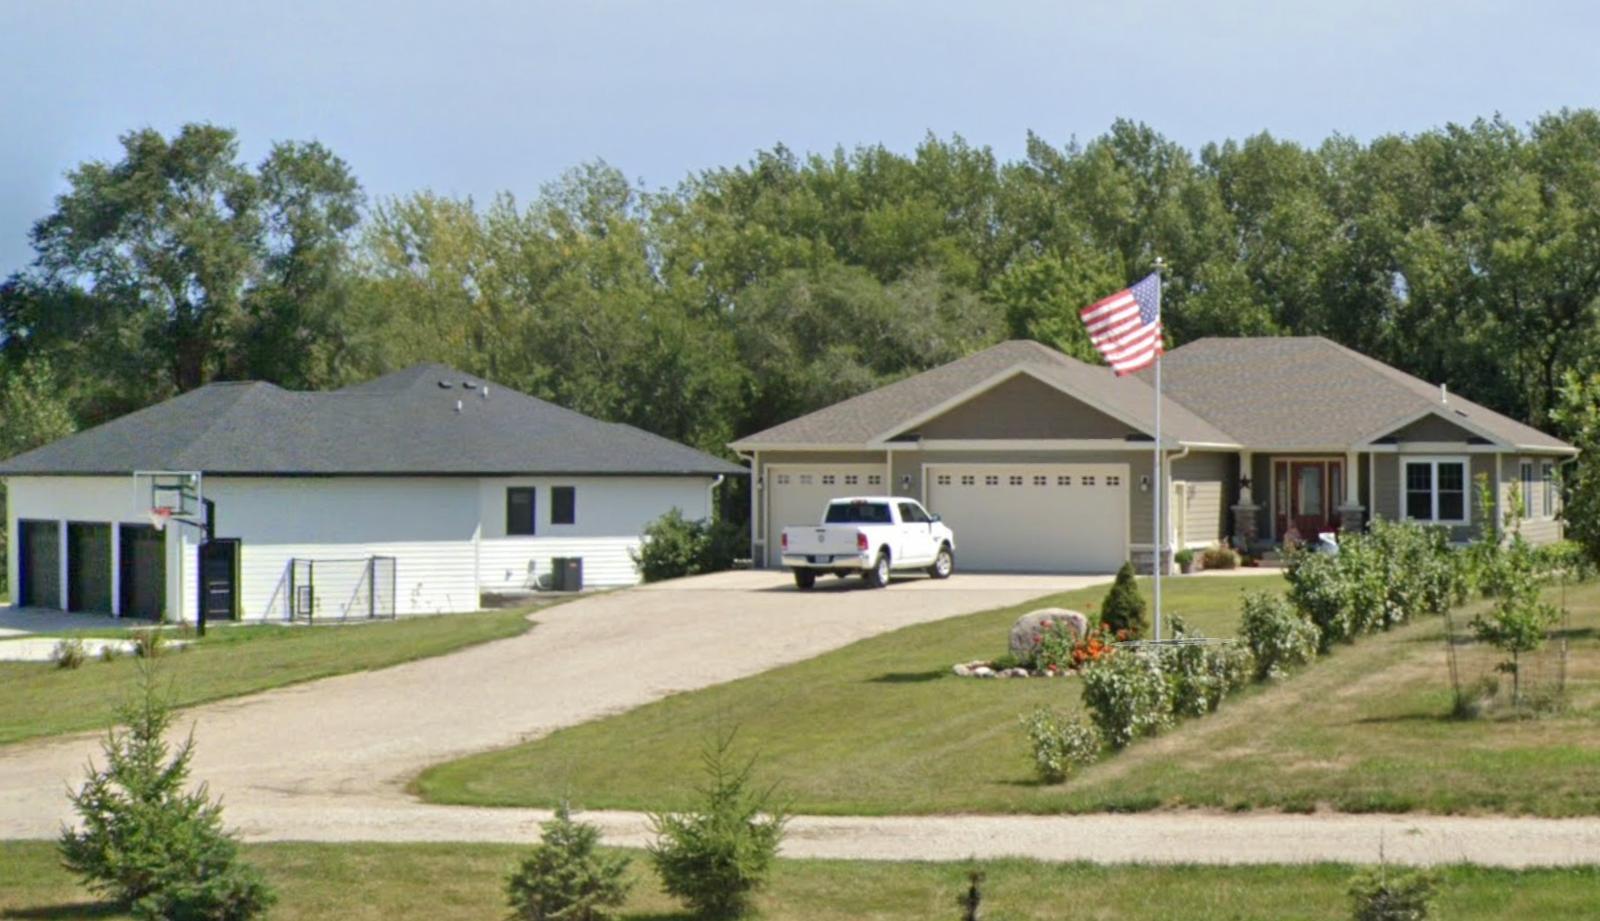
2. Orleans – 246% Home Price Increase Since 2010
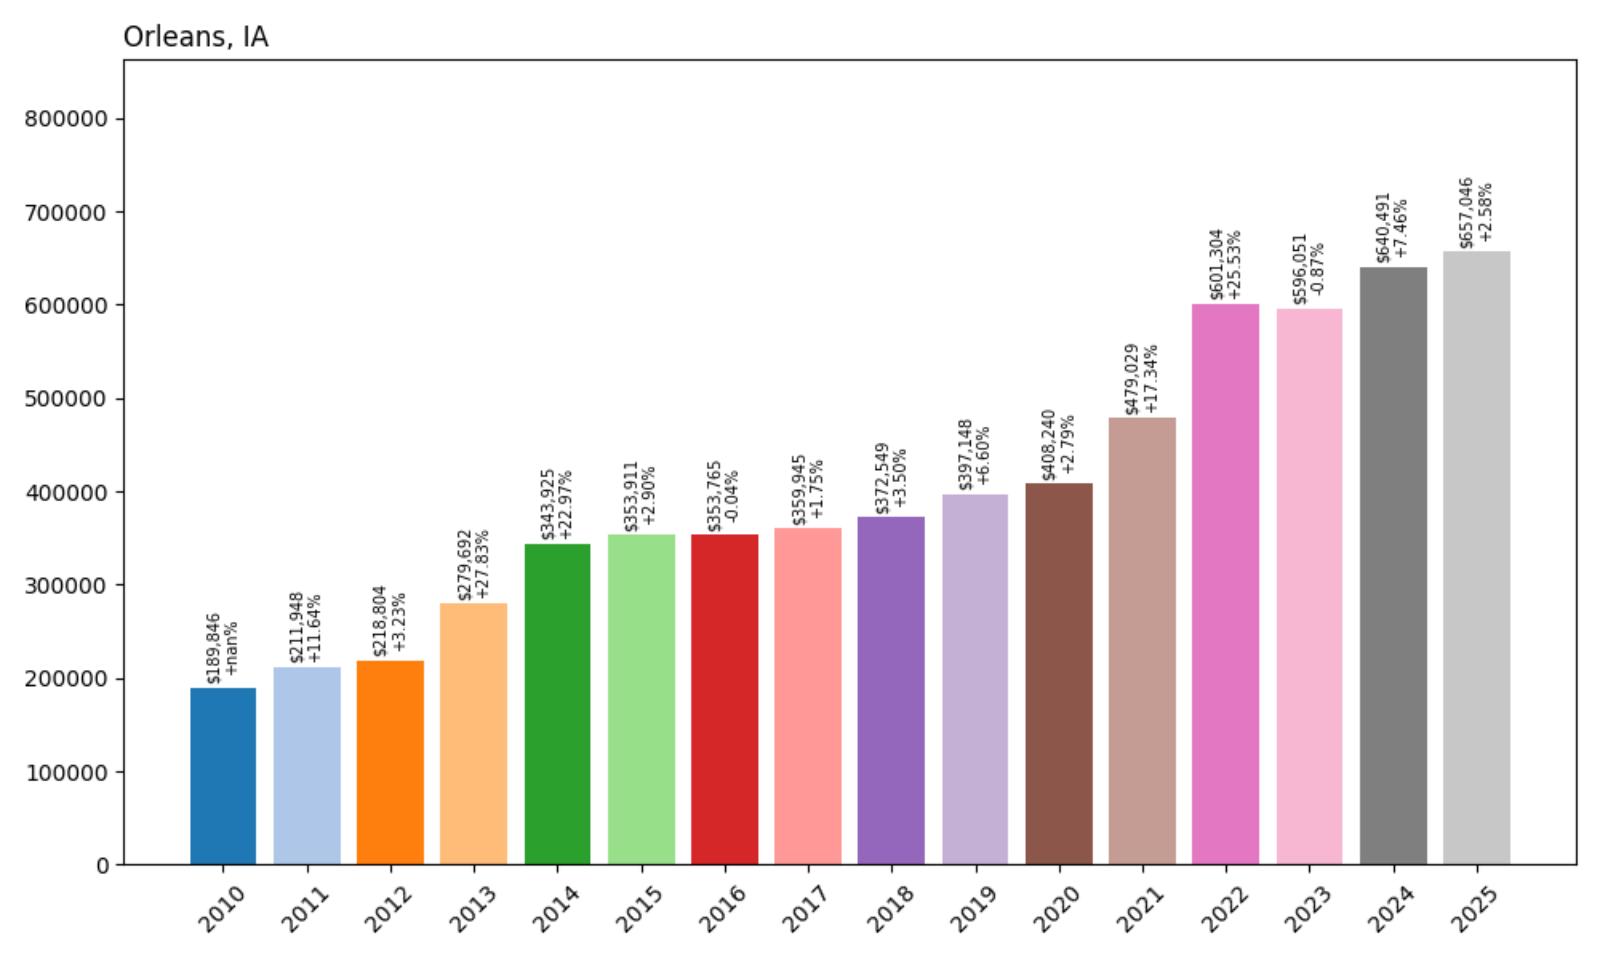
- 2010: $189,846
- 2011: $211,948 (+$22,101, +11.64% from previous year)
- 2012: $218,804 (+$6,856, +3.23% from previous year)
- 2013: $279,692 (+$60,888, +27.83% from previous year)
- 2014: $343,925 (+$64,233, +22.97% from previous year)
- 2015: $353,911 (+$9,986, +2.90% from previous year)
- 2016: $353,765 (−$147, −0.04% from previous year)
- 2017: $359,945 (+$6,180, +1.75% from previous year)
- 2018: $372,549 (+$12,604, +3.50% from previous year)
- 2019: $397,148 (+$24,599, +6.60% from previous year)
- 2020: $408,240 (+$11,091, +2.79% from previous year)
- 2021: $479,029 (+$70,789, +17.34% from previous year)
- 2022: $601,304 (+$122,275, +25.53% from previous year)
- 2023: $596,051 (−$5,253, −0.87% from previous year)
- 2024: $640,491 (+$44,440, +7.46% from previous year)
- 2025: $657,046 (+$16,555, +2.58% from previous year)
Orleans demonstrates the most dramatic appreciation in the study with an extraordinary 246% increase since 2010. The community experienced explosive early growth in 2013-2014 when values nearly doubled, followed by another surge during 2021-2022. Current median prices of $657,046 represent more than tripling of values, reflecting Orleans’ transformation from an affordable rural community to Iowa’s second-most expensive housing market.
Orleans – Dickinson County’s Luxury Lakefront
Located in Dickinson County within the Iowa Great Lakes region, Orleans has evolved into one of the state’s most exclusive residential destinations. This small lakefront community offers luxury properties with direct water access and premium recreational amenities that attract affluent buyers from across the Midwest. Orleans’ appeal stems from its unique combination of natural beauty, waterfront access, and upscale development that creates a resort-style living environment rare in Iowa’s real estate market.
The extraordinary 246% appreciation reflects Orleans’ successful transformation into a luxury lakefront destination that commands premium prices for exclusive properties. The dramatic growth periods in 2013-2014 and 2021-2022 demonstrate the community’s appeal during peak demand for recreational and luxury real estate. Orleans benefits from its position within Iowa’s premier lakes region, offering direct water access and recreational amenities that create exceptional lifestyle value. The sustained ultra-high values demonstrate the community’s established position as a luxury destination that attracts discerning buyers seeking exclusive lakefront properties.
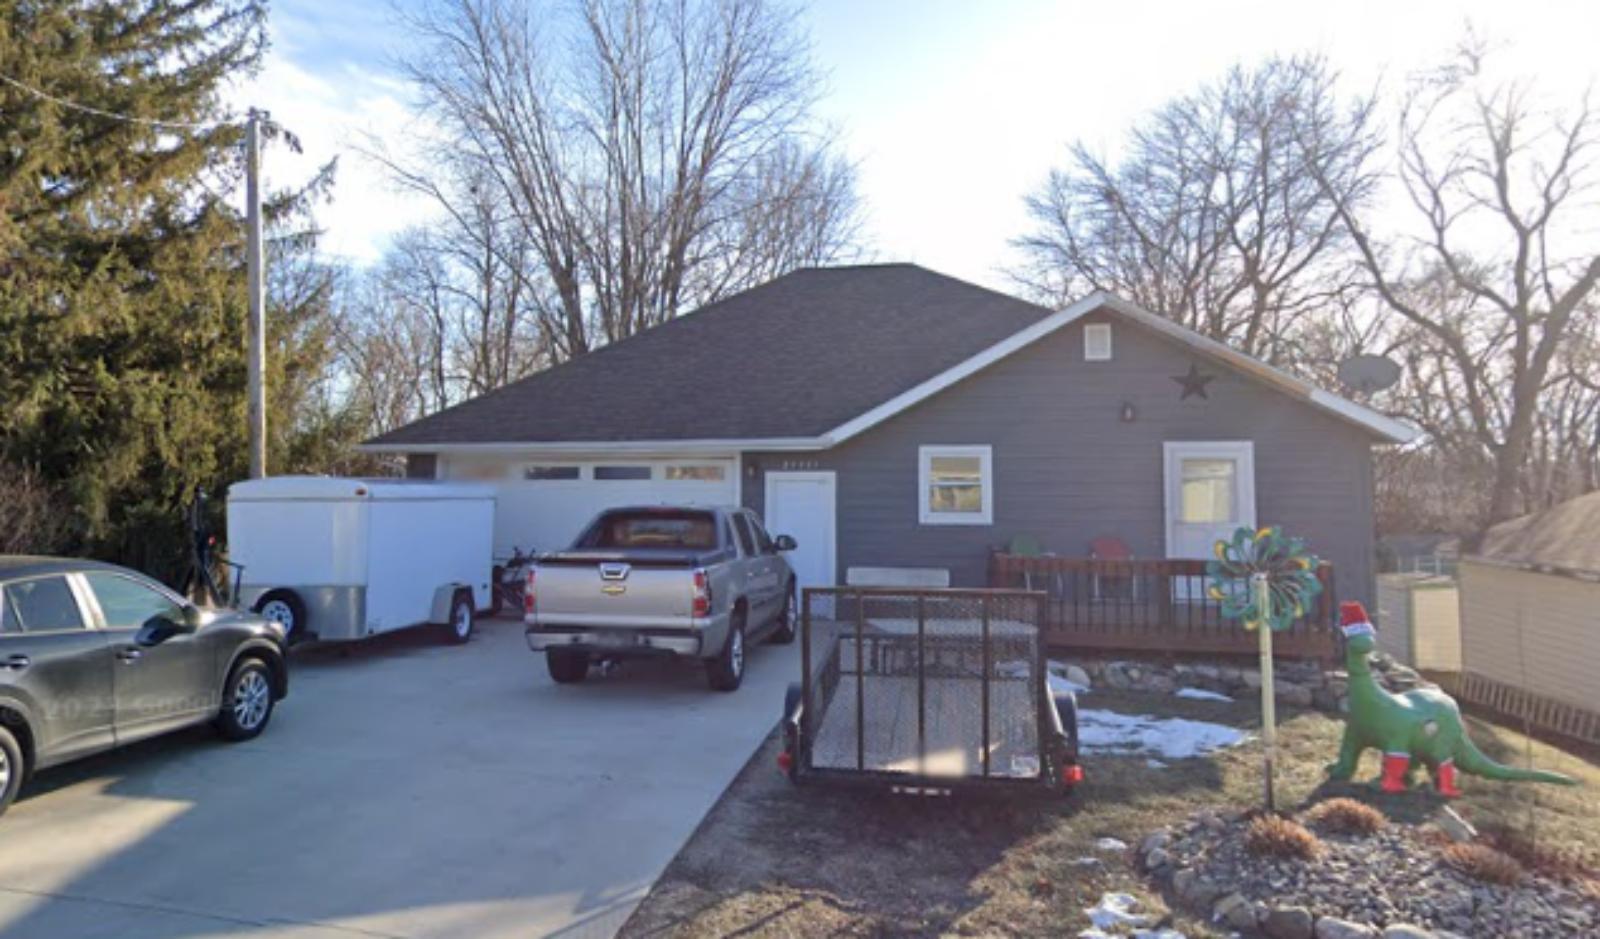
1. West Okoboji – 94% Home Price Increase Since 2017
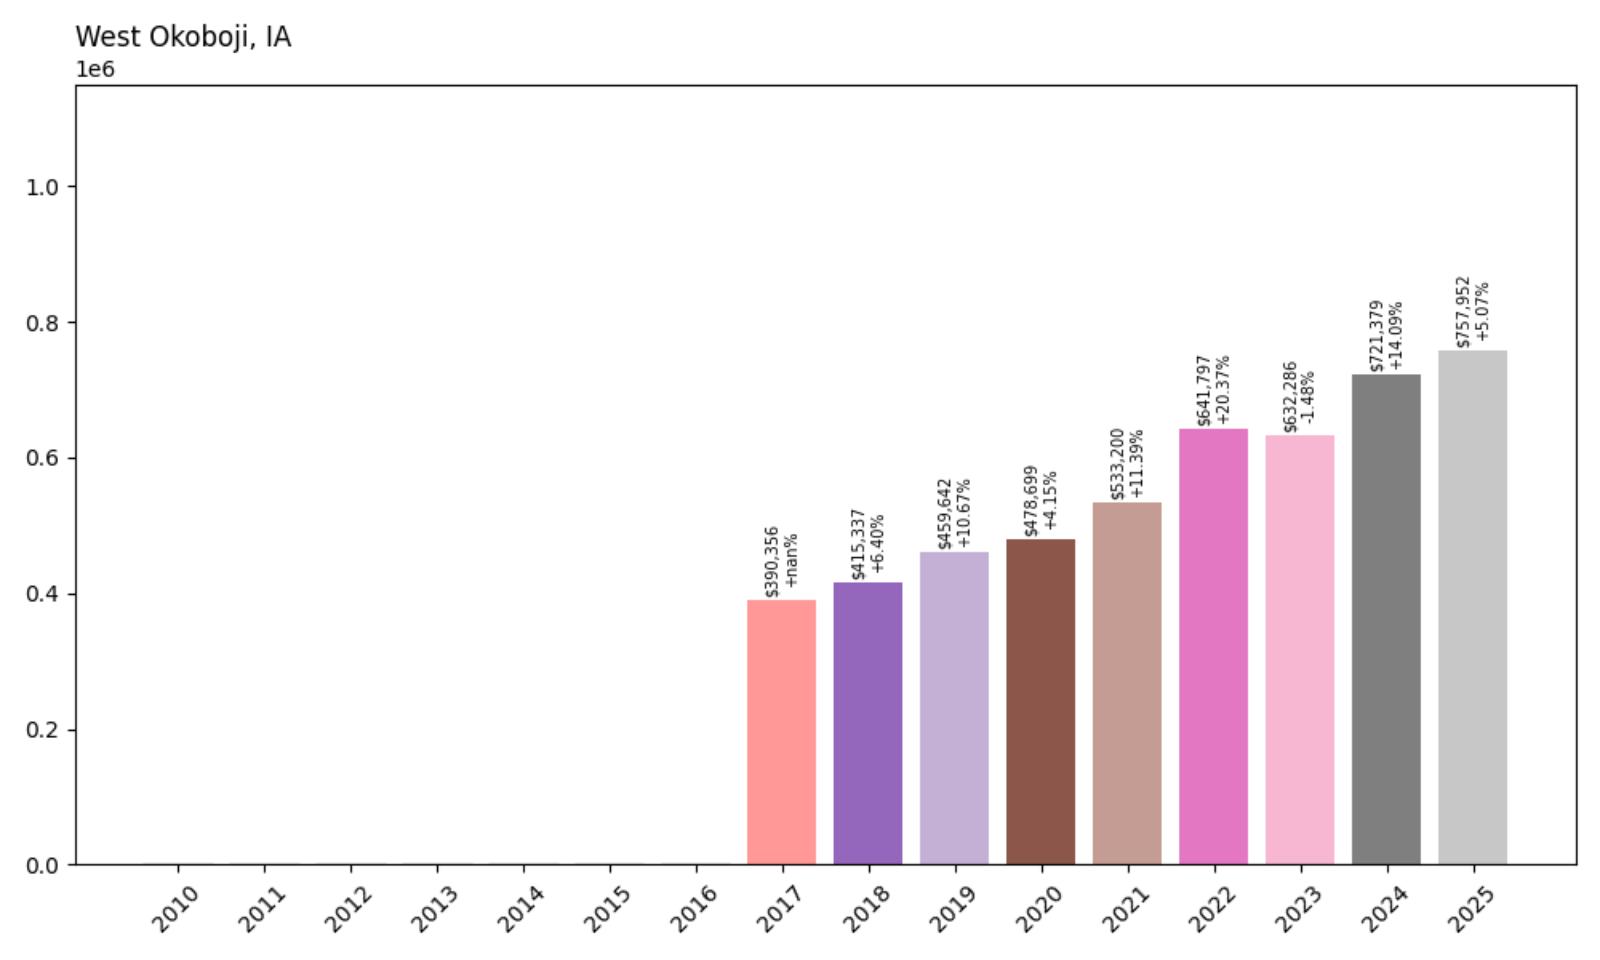
- 2017: $390,356
- 2018: $415,337 (+$24,981, +6.40% from previous year)
- 2019: $459,642 (+$44,305, +10.67% from previous year)
- 2020: $478,699 (+$19,057, +4.15% from previous year)
- 2021: $533,200 (+$54,501, +11.39% from previous year)
- 2022: $641,797 (+$108,597, +20.37% from previous year)
- 2023: $632,286 (−$9,511, −1.48% from previous year)
- 2024: $721,379 (+$89,093, +14.09% from previous year)
- 2025: $757,952 (+$36,573, +5.07% from previous year)
West Okoboji leads Iowa’s housing market with median prices of $757,952, representing 94% appreciation since data collection began in 2017. The community shows consistent strong growth with notable acceleration in 2022 and 2024, when values increased by over $197,000 across those two years. The remarkable performance reflects West Okoboji’s position as Iowa’s most exclusive and expensive residential destination.
West Okoboji – Iowa’s Ultimate Luxury Destination
Located on the shores of West Okoboji Lake in Dickinson County, West Okoboji represents the absolute pinnacle of Iowa’s luxury real estate market. This exclusive lakefront community offers the state’s most prestigious properties, with direct water access, upscale amenities, and resort-style living that attracts the most affluent buyers from across the region. West Okoboji’s unique position as Iowa’s premier luxury destination creates exceptional demand for limited inventory of waterfront properties that command the highest prices in the state.
The remarkable price levels and 94% appreciation since 2017 demonstrate West Okoboji’s established dominance in Iowa’s luxury market. The community’s appeal transcends typical real estate factors, offering lifestyle and recreational opportunities that justify extraordinary price premiums. West Okoboji benefits from its position as the crown jewel of Iowa’s Great Lakes region, providing exclusive access to premium recreational amenities and natural beauty that create unmatched value propositions. The sustained ultra-premium pricing reflects the community’s unique ability to attract buyers seeking the finest luxury properties and recreational lifestyle available in Iowa.


