🔥 Would you like to save this?
If carpet is hoping for a bedroom comeback, our readers haven’t received the memo.
We have carpet in our bedroom, which is probably why this one stung
I was digging through Home Stratosphere’s bedroom preference data when this comparison jumped out at me.
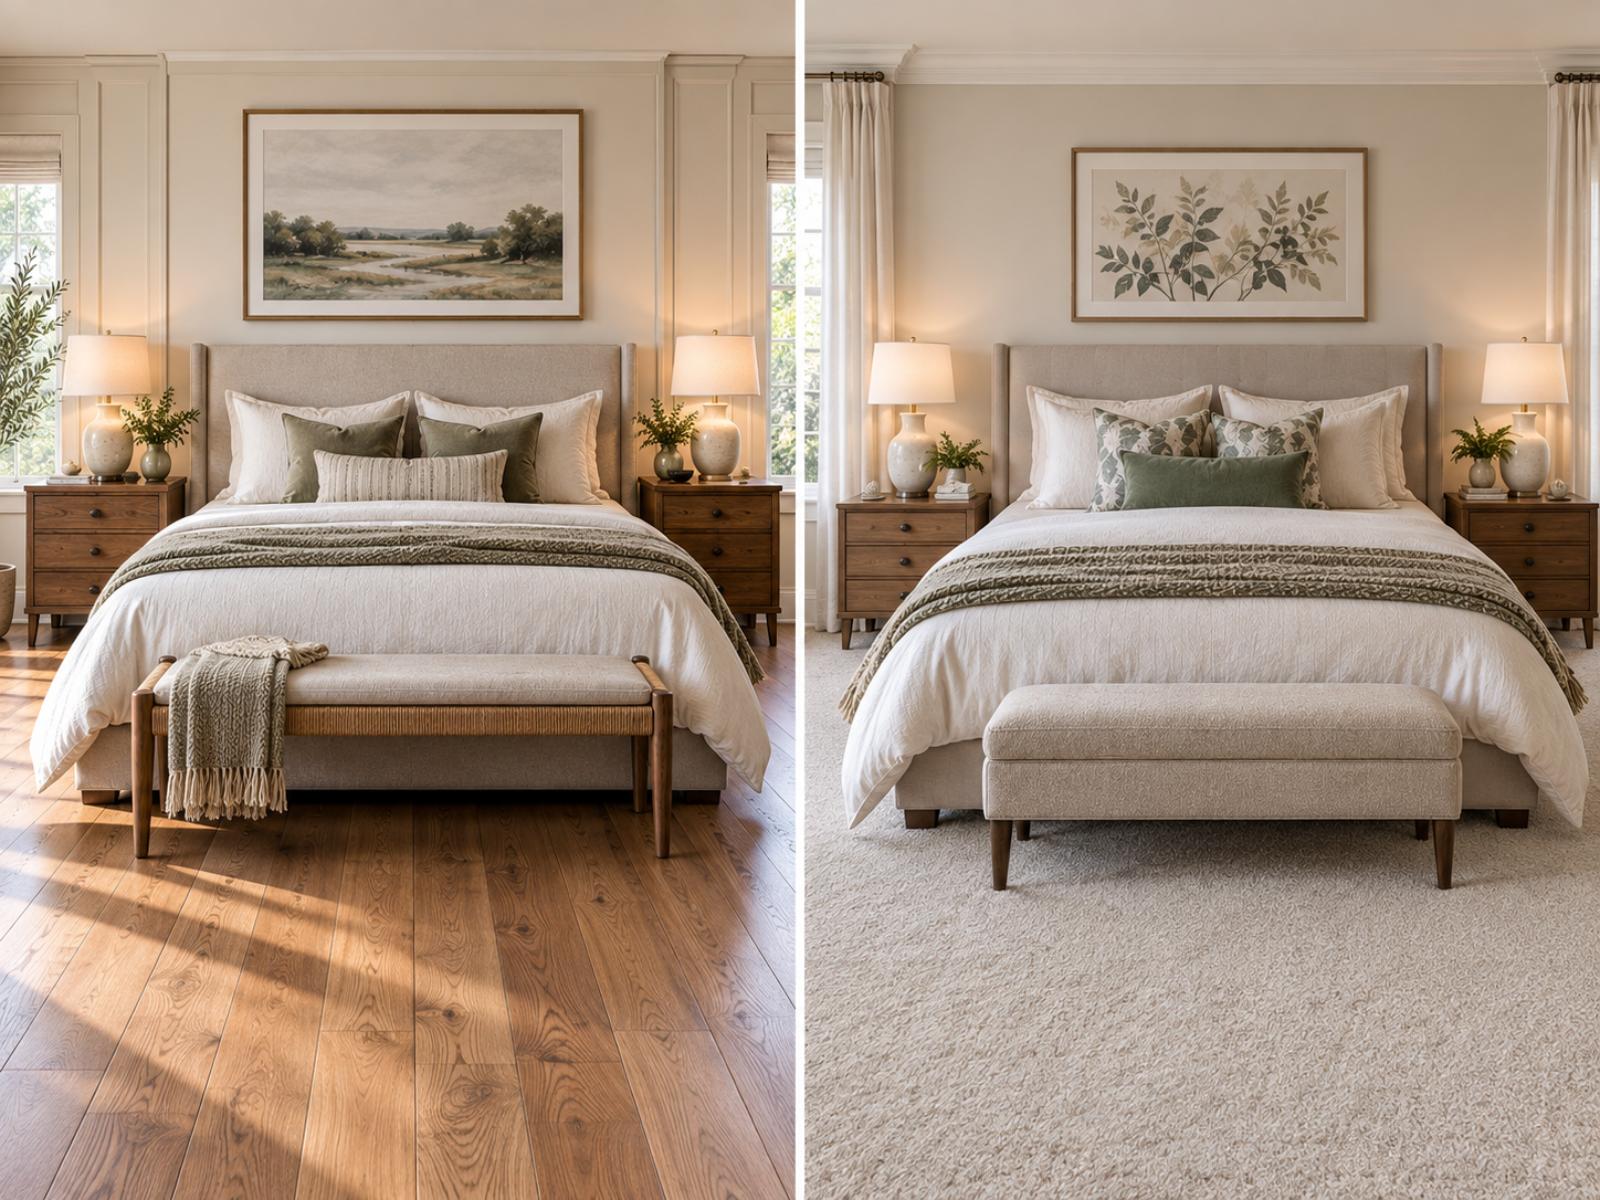
Hardwood flooring scored a Preference Index of 145. Carpet scored 29.
That’s not a close race.
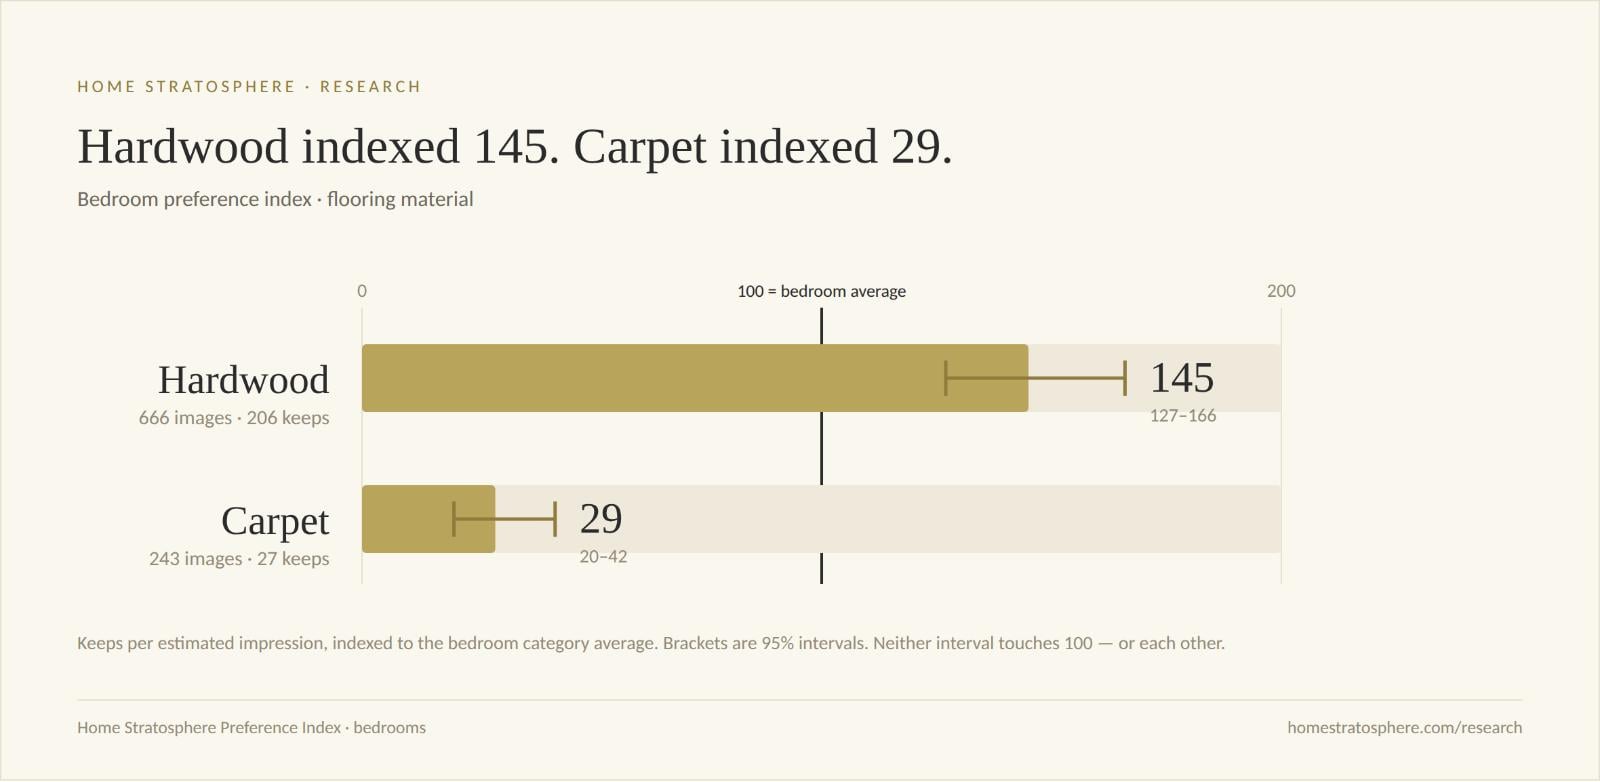

Hardwood vs. Carpet: The Numbers
Our Preference Index measures reader keeps—love and save actions relative to estimated image exposure—against the average for the bedroom category. 100 is average.
| Bedroom flooring | Preference Index | 95% CI | Images | Keeps | Est. impressions |
|---|---|---|---|---|---|
| Hardwood | 145 | 127–166 | 666 | 206 | 14,540 |
| Carpet | 29 | 20–42 | 243 | 27 | 9,520 |
The confidence intervals make this particularly interesting.
Hardwood’s entire interval—127 to 166—sits above the category average.
Carpet’s entire interval—20 to 42—sits far below it.
So while I wouldn’t normally make much of a small difference in an observational dataset, this isn’t a small difference.
Hardwood’s Preference Index was five times carpet’s.
The Gap Is Hard to Miss
Hardwood didn’t merely beat carpet. It performed above the bedroom average while carpet landed dramatically below it.
| Hardwood | Carpet | |
|---|---|---|
| Preference Index | 145 | 29 |
| vs. category average | +45% | −71% |
| Keeps | 206 | 27 |
| Images measured | 666 | 243 |
The sample isn’t tiny, either. We’re looking at 666 hardwood bedroom images and 243 carpeted bedroom images.
One note on how I’m treating this. Bedroom content runs at lower volume than living rooms, so this category uses a lower reporting threshold than the one I apply to living-room findings. Both values clear it, and both intervals sit clear of the category average and of each other.
That’s enough for me to pay attention.
Why Might Carpet Be Struggling?
There are a few obvious possibilities.
Hardwood photographs well. It introduces natural variation, texture and warmth. It can also provide contrast against rugs, furniture and bedding instead of turning the entire floor into one continuous surface.
Carpet has practical advantages that don’t necessarily show up in an inspirational photograph. It’s soft, warm, quiet and comfortable underfoot—all pretty useful characteristics in a bedroom.
But nobody can feel softness through an image.
And that’s an important distinction.
We’re measuring visual response, not product satisfaction.
A homeowner might happily choose carpet for a bedroom after considering comfort, price and acoustics while still finding a hardwood bedroom more visually appealing.
There’s a Useful Flooring-Industry Signal Here
I wouldn’t interpret this as evidence that consumers are about to stop buying bedroom carpet.
Our data doesn’t measure purchases.
But manufacturers and retailers sell flooring visually long before anyone walks on it. Flooring appears in product photography, room scenes, social campaigns, catalogs, Pinterest posts and retailer websites.
And in that environment, hardwood is producing dramatically stronger engagement in our bedroom imagery.
That raises an interesting marketing question for carpet brands:
Is carpet’s problem the product—or how the product looks when presented in a room?
Maybe there’s an opportunity around richer textures, better colors, more distinctive patterns or simply better room styling.
Because based on what we’re seeing, conventional carpet has a pretty steep visual hill to climb.
What I’d Test Next
The next step is to break carpet down further. Light versus dark. Low pile versus plush. Patterned versus solid. Warm versus cool tones. And how carpet performs across traditional, transitional and contemporary bedrooms.
The same goes for hardwood. “Hardwood” covers an enormous range of colors, plank widths, patterns and wood tones.
That’s where this data becomes more commercially useful.
For now, though, the broad result is remarkably clear:
Hardwood: 145. Carpet: 29.
Carpet isn’t merely trailing hardwood in our bedroom imagery.
It’s getting absolutely destroyed.
About the Data
Home Stratosphere measures reader interactions with individual images across our published design content. The Preference Index compares keeps—love and save actions relative to estimated image exposure—for an attribute value against the average for its category. 100 represents the category average.
This is observational image-preference data, not purchase-intent or sales data. Impressions are sampled and scaled estimates and are most useful for comparisons within the dataset.