🔥 Would you like to save this?
Michigan’s most coveted housing markets are surging to new heights. According to the Zillow Home Value Index, the state’s median home prices climbed 6.6% year-over-year in June 2025, outpacing the national average. From the sparkling shores of Lake Michigan to the upscale suburbs surrounding Detroit, these communities are where high-end real estate thrives. Waterfront properties have seen values more than double since 2010, and established suburban neighborhoods continue to draw affluent buyers with top-tier schools, commuter access, and manicured streetscapes. For Michigan’s luxury market, the momentum shows no signs of slowing.
30. Frankfort – 116% Home Price Increase Since 2010
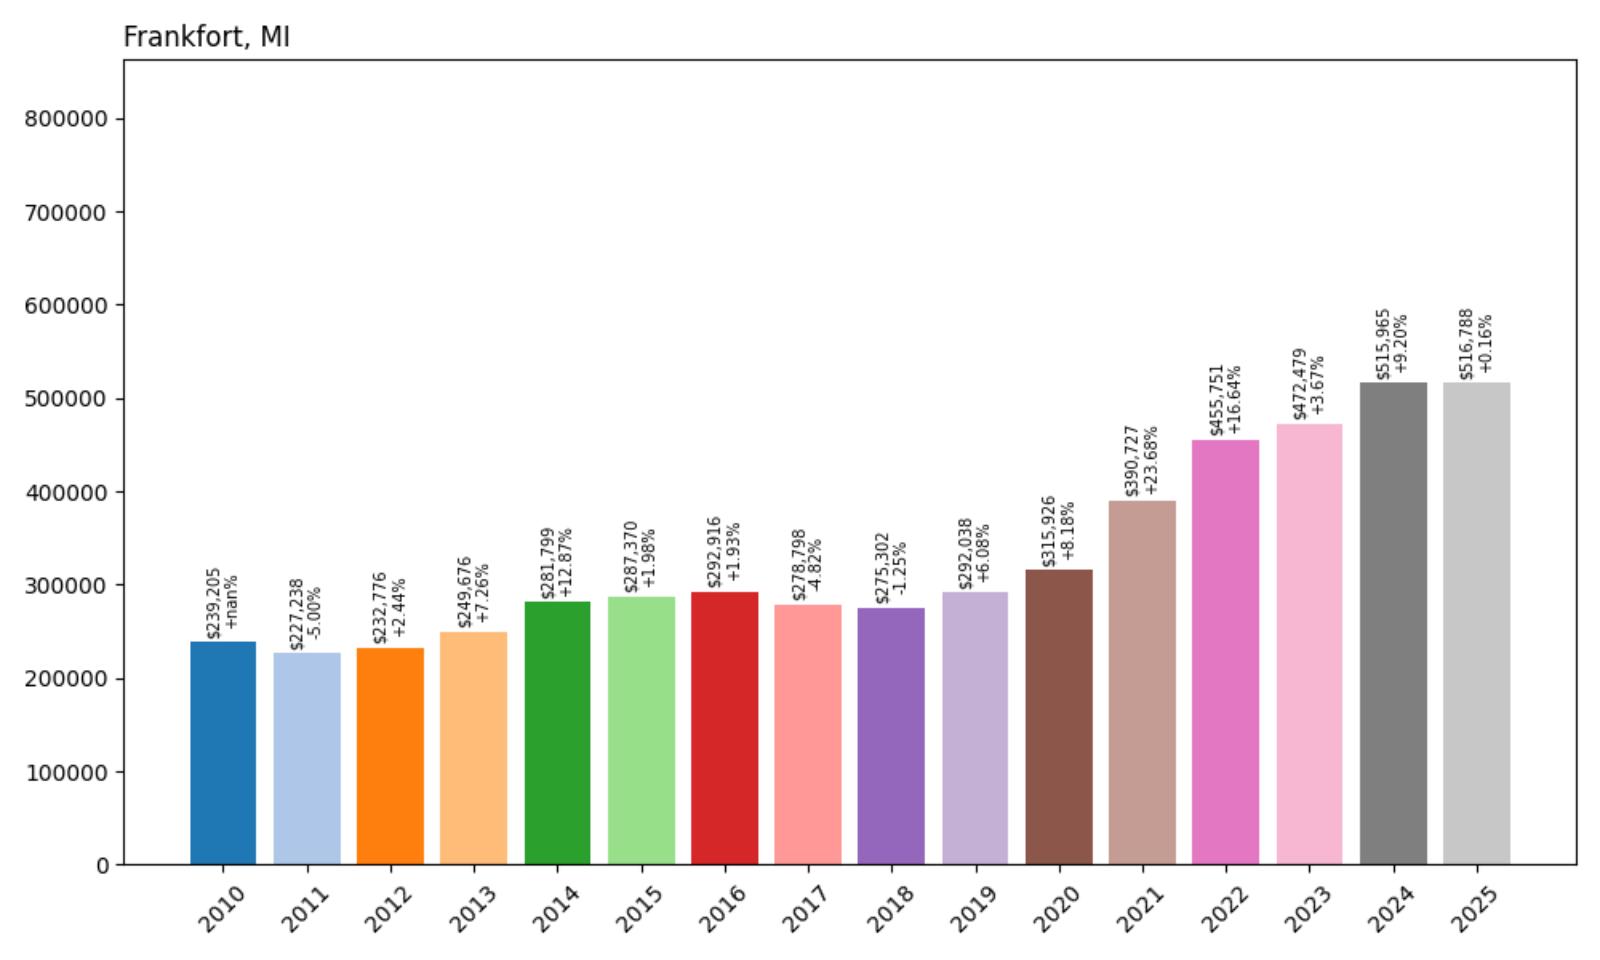
- 2010: $239,205
- 2011: $227,238 (−$11,966, −5.00% from previous year)
- 2012: $232,776 (+$5,538, +2.44% from previous year)
- 2013: $249,676 (+$16,900, +7.26% from previous year)
- 2014: $281,799 (+$32,122, +12.87% from previous year)
- 2015: $287,370 (+$5,572, +1.98% from previous year)
- 2016: $292,916 (+$5,546, +1.93% from previous year)
- 2017: $278,798 (−$14,118, −4.82% from previous year)
- 2018: $275,302 (−$3,496, −1.25% from previous year)
- 2019: $292,038 (+$16,736, +6.08% from previous year)
- 2020: $315,926 (+$23,889, +8.18% from previous year)
- 2021: $390,727 (+$74,801, +23.68% from previous year)
- 2022: $455,751 (+$65,024, +16.64% from previous year)
- 2023: $472,479 (+$16,728, +3.67% from previous year)
- 2024: $515,965 (+$43,485, +9.20% from previous year)
- 2025: $516,788 (+$824, +0.16% from previous year)
Frankfort’s real estate journey reflects the broader trends impacting lakefront Michigan communities. The town weathered a slight dip in 2017-2018 before experiencing remarkable growth, with the current median price of $516,788 representing more than double its 2010 value. The most dramatic surge occurred during 2021, when values jumped nearly 24% in a single year, followed by another strong 16.6% increase in 2022. After this rapid appreciation, the market has shown signs of stabilization, with 2025 showing minimal growth of just 0.16%.
In order to come up with the very specific design ideas, we create most designs with the assistance of state-of-the-art AI interior design software. Also, assume links that take you off the site are affiliate links such as links to Amazon. this means we may earn a commission if you buy something.
Frankfort – Benzie County’s Crown Jewel
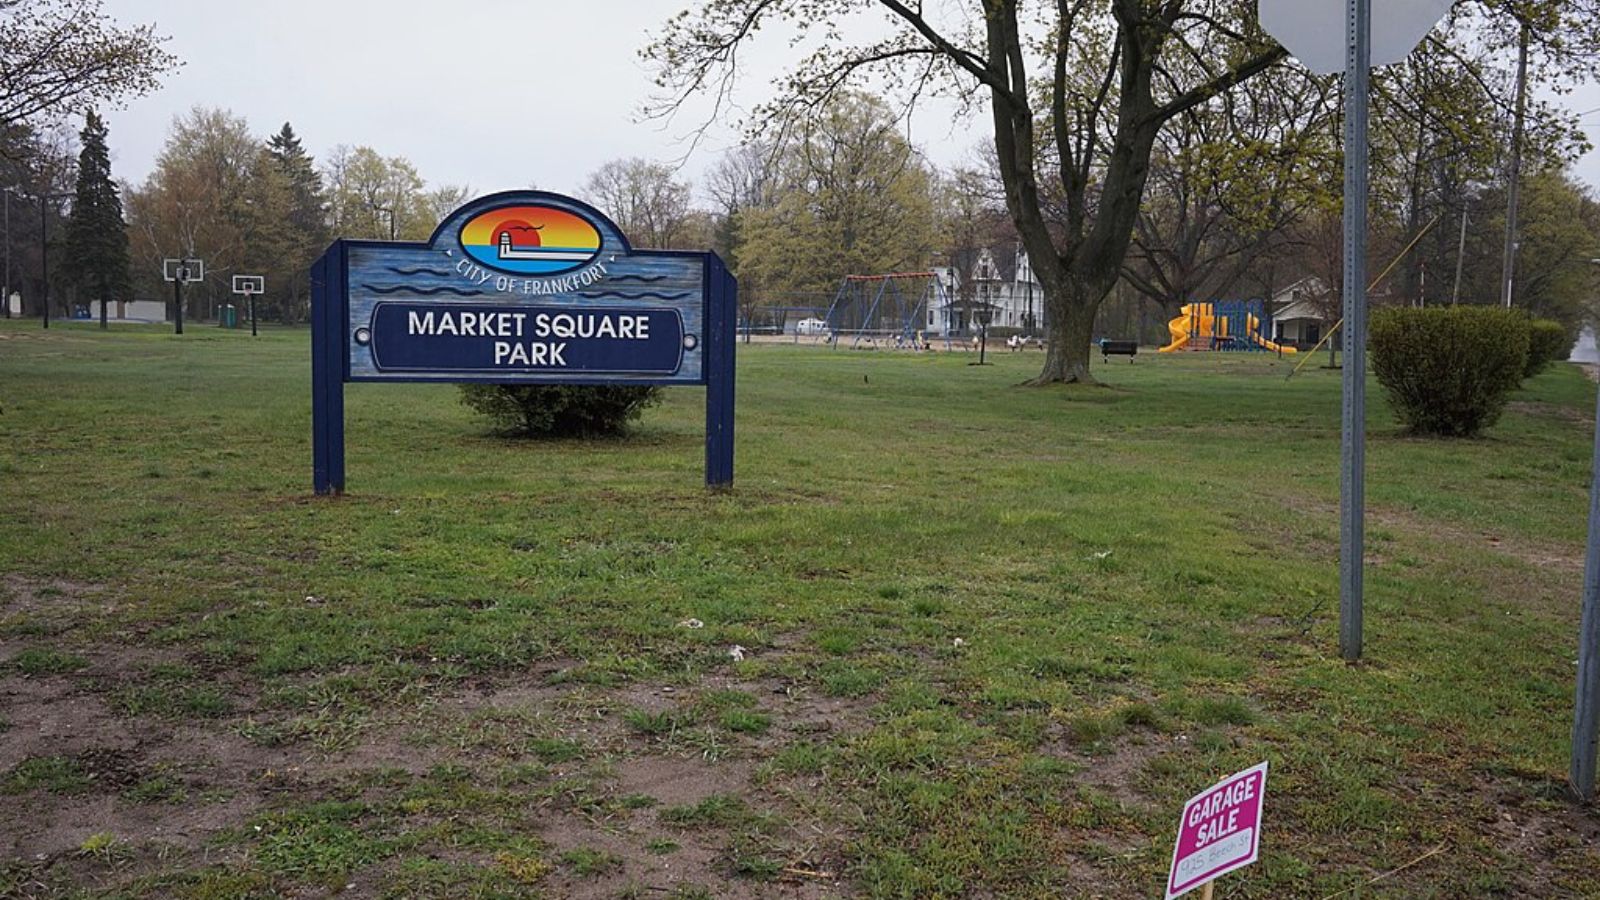
Situated along the pristine shores of Lake Michigan in Benzie County, Frankfort serves as both a year-round community and a coveted summer destination. The town’s economy centers around tourism, recreation, and its historic downtown district, which features charming shops and restaurants that attract visitors from across the Midwest. The presence of Crystal Lake, one of Michigan’s most beautiful inland lakes, adds another layer of appeal for luxury homebuyers seeking waterfront properties.
The recent price stabilization in Frankfort may reflect broader market adjustments following the pandemic-era surge. However, the town’s limited housing inventory and continued appeal to affluent buyers seeking Lake Michigan frontage suggest that significant price declines are unlikely. Properties with direct lake access or panoramic water views command the highest premiums, often exceeding the median by substantial margins.
29. Huntington Woods – 118% Home Price Increase Since 2010
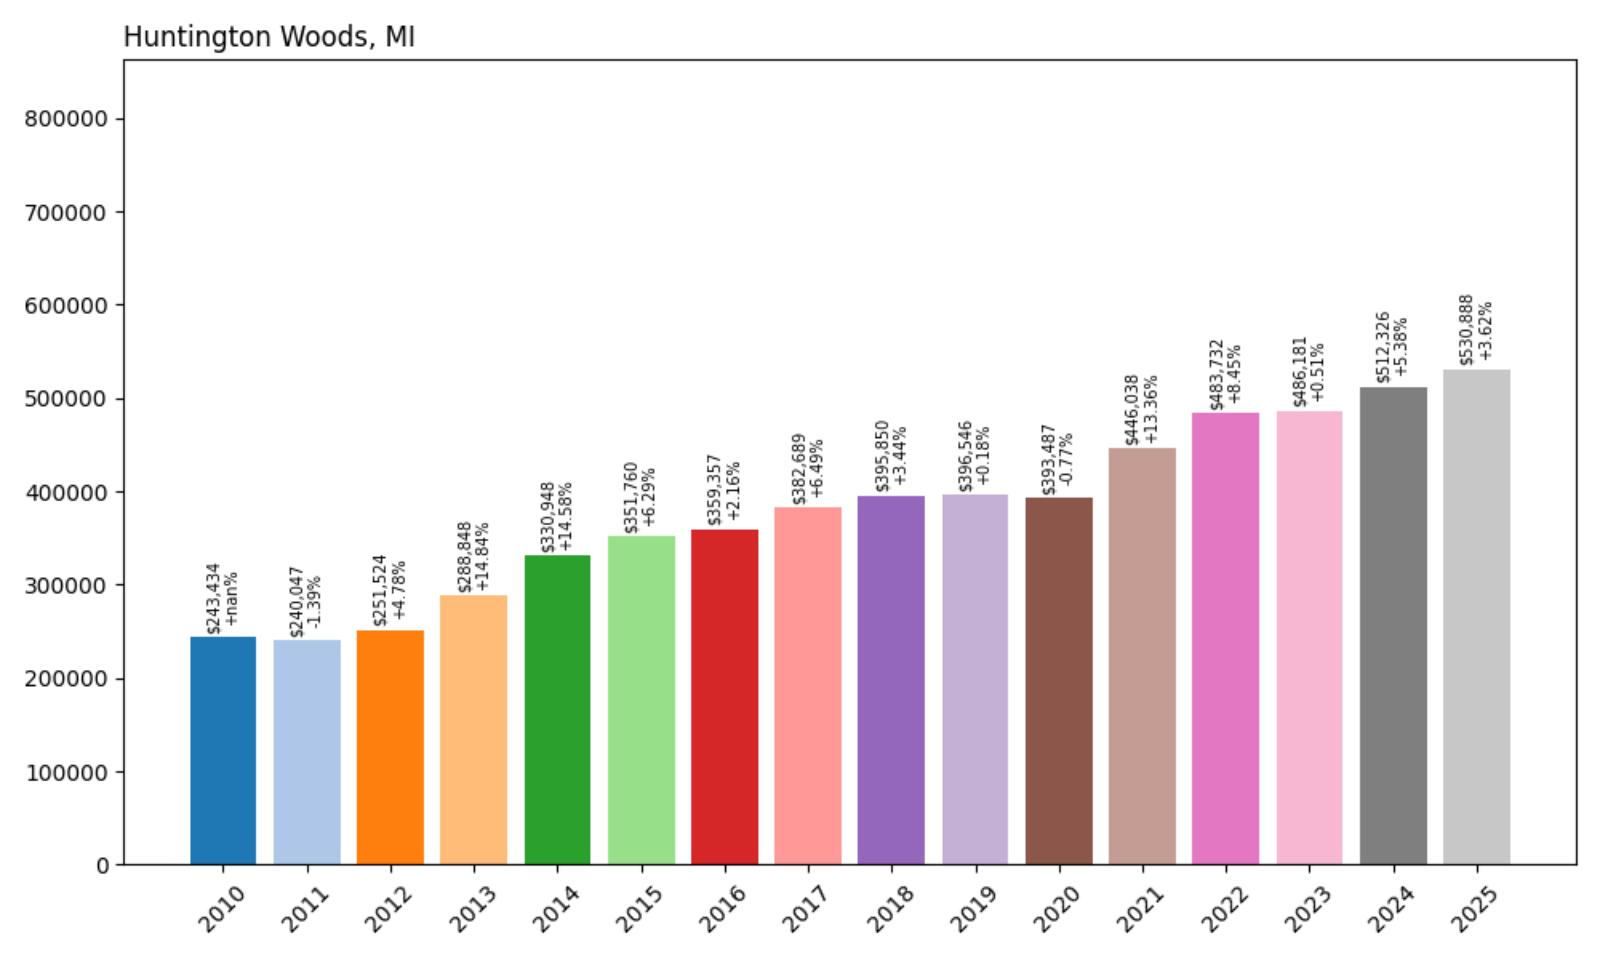
- 2010: $243,434
- 2011: $240,047 (−$3,387, −1.39% from previous year)
- 2012: $251,524 (+$11,477, +4.78% from previous year)
- 2013: $288,848 (+$37,324, +14.84% from previous year)
- 2014: $330,948 (+$42,100, +14.58% from previous year)
- 2015: $351,760 (+$20,813, +6.29% from previous year)
- 2016: $359,357 (+$7,597, +2.16% from previous year)
- 2017: $382,689 (+$23,331, +6.49% from previous year)
- 2018: $395,850 (+$13,161, +3.44% from previous year)
- 2019: $396,546 (+$696, +0.18% from previous year)
- 2020: $393,487 (−$3,059, −0.77% from previous year)
- 2021: $446,038 (+$52,551, +13.36% from previous year)
- 2022: $483,732 (+$37,693, +8.45% from previous year)
- 2023: $486,181 (+$2,449, +0.51% from previous year)
- 2024: $512,326 (+$26,145, +5.38% from previous year)
- 2025: $530,888 (+$18,562, +3.62% from previous year)
Huntington Woods has demonstrated remarkable consistency in its upward price trajectory, with the current median of $530,888 representing a 118% increase from 2010 levels. The community experienced particularly strong growth during 2013-2014, with consecutive double-digit increases that established its position as a premium suburban market. Even during the slight market softening of 2019-2020, values remained relatively stable, and the post-pandemic recovery has been steady and sustained.
Huntington Woods – An Enclave of Suburban Excellence
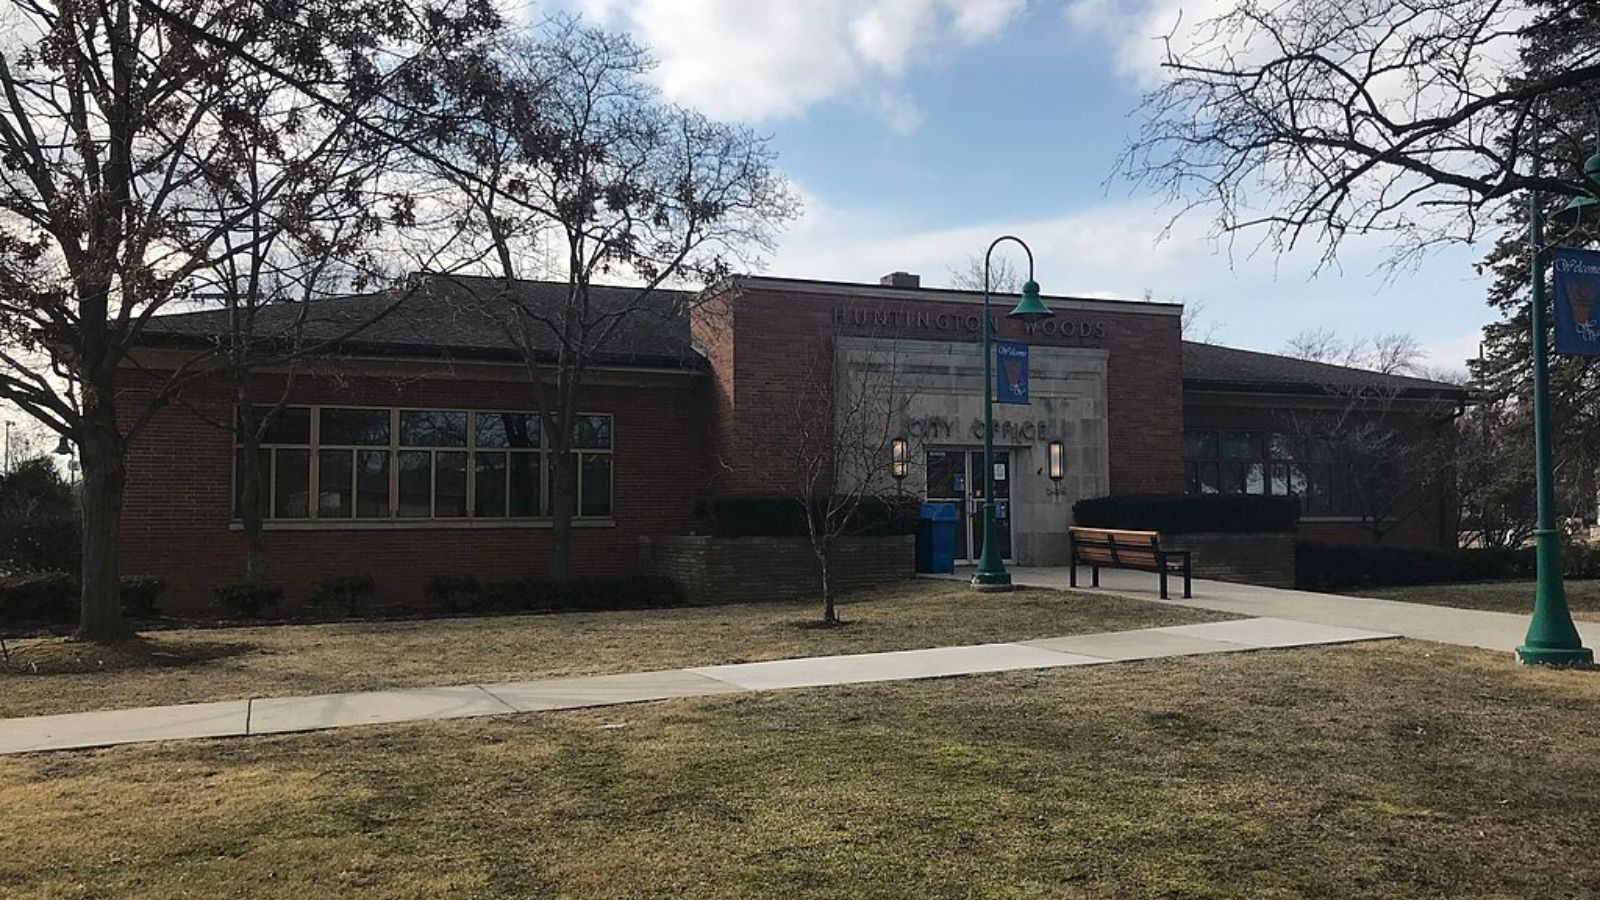
Located in Oakland County just 12 miles north of downtown Detroit, Huntington Woods represents one of Michigan’s most desirable suburban communities. This small city of approximately 6,200 residents is renowned for its tree-lined streets, well-maintained properties, and strong sense of community. The city’s compact size of just 1.5 square miles creates an intimate neighborhood feel while maintaining easy access to metropolitan amenities.
The community’s appeal stems from its exceptional public services, including highly rated schools that consistently rank among the state’s best. Huntington Woods Elementary and the broader Berkley School District attract families willing to pay premium prices for quality education. The city also maintains excellent municipal services, including regular tree maintenance, snow removal, and well-maintained public facilities that contribute to high property values.
28. Ann Arbor – 130% Home Price Increase Since 2010
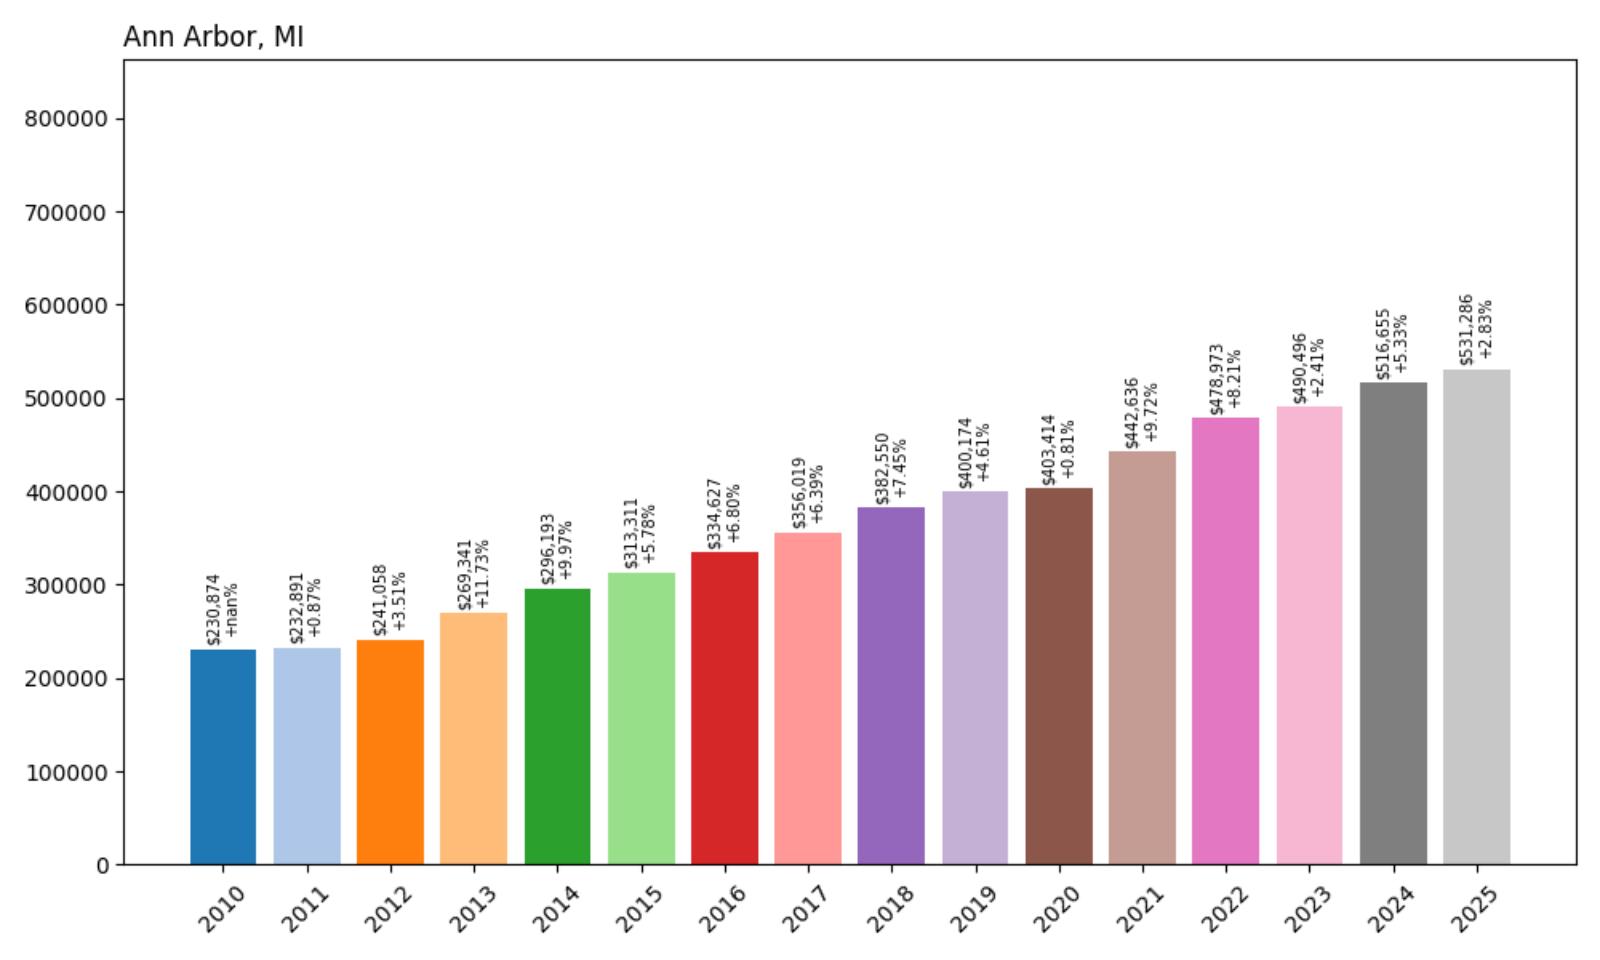
- 2010: $230,874
- 2011: $232,891 (+$2,017, +0.87% from previous year)
- 2012: $241,058 (+$8,167, +3.51% from previous year)
- 2013: $269,341 (+$28,283, +11.73% from previous year)
- 2014: $296,193 (+$26,852, +9.97% from previous year)
- 2015: $313,311 (+$17,118, +5.78% from previous year)
- 2016: $334,627 (+$21,316, +6.80% from previous year)
- 2017: $356,019 (+$21,391, +6.39% from previous year)
- 2018: $382,550 (+$26,531, +7.45% from previous year)
- 2019: $400,174 (+$17,624, +4.61% from previous year)
- 2020: $403,414 (+$3,240, +0.81% from previous year)
- 2021: $442,636 (+$39,222, +9.72% from previous year)
- 2022: $478,973 (+$36,337, +8.21% from previous year)
- 2023: $490,496 (+$11,523, +2.41% from previous year)
- 2024: $516,655 (+$26,159, +5.33% from previous year)
- 2025: $531,286 (+$14,631, +2.83% from previous year)
Ann Arbor’s housing market reflects the steady, sustainable growth characteristic of major university towns. With a current median price of $531,286, the community has achieved a 130% increase since 2010 through consistent year-over-year appreciation averaging around 6-7% annually. The most significant growth periods occurred during 2013-2014 and 2017-2018, when the market posted consecutive years of robust gains. Even during the pandemic, Ann Arbor maintained moderate growth rates, demonstrating the stability provided by its diverse economic base.
Ann Arbor – Where Academia Meets Affluence
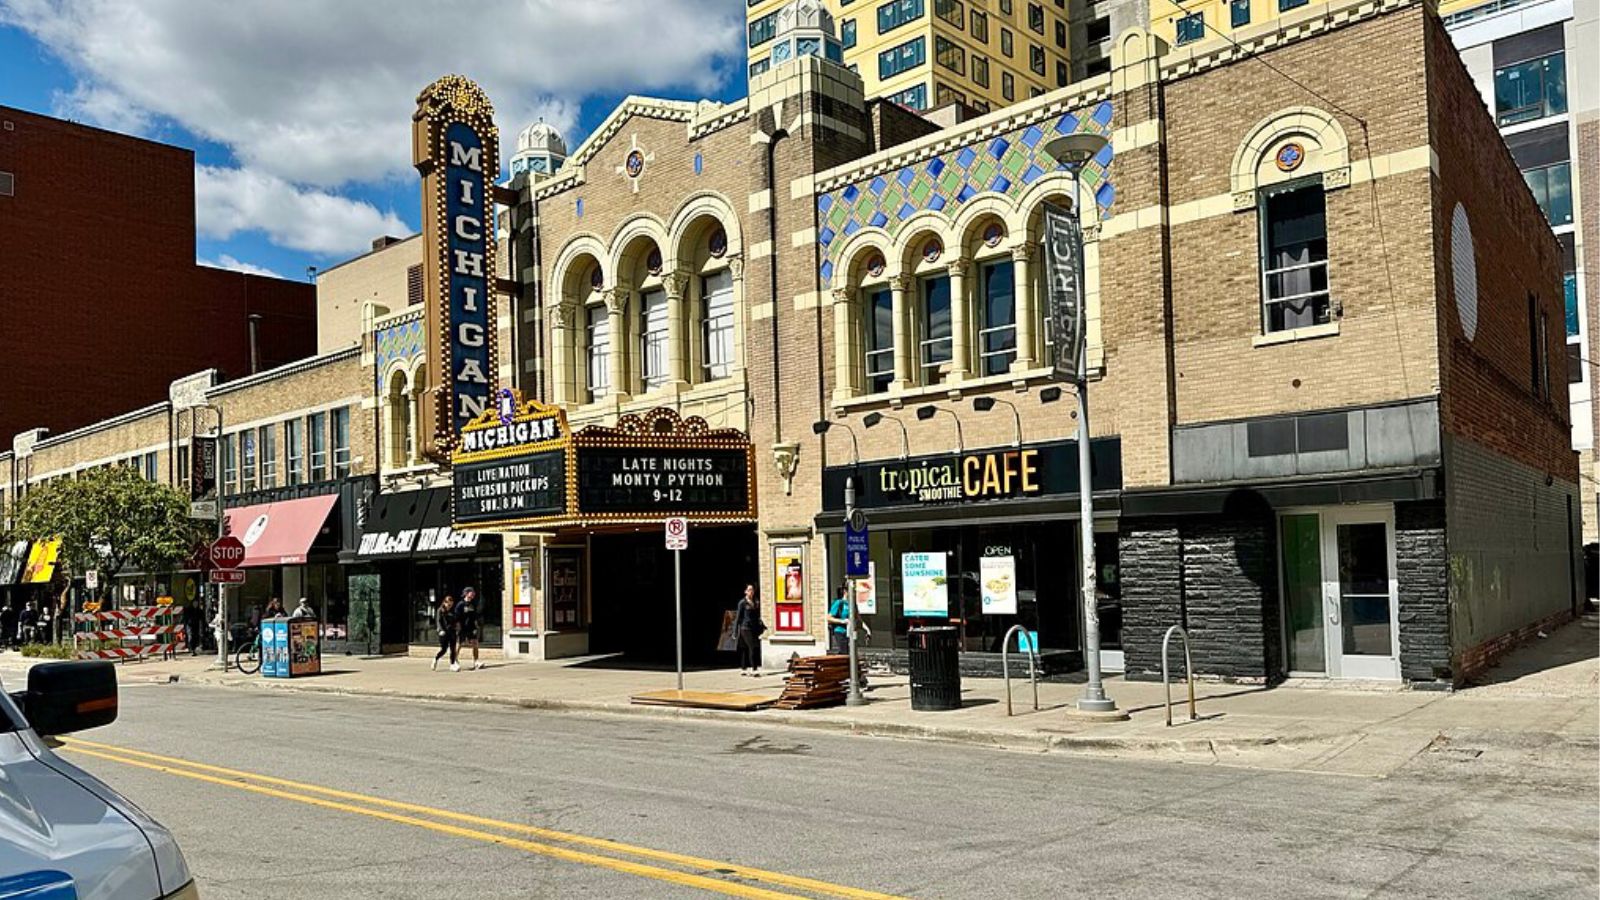
Home to the University of Michigan, Ann Arbor combines the intellectual vitality of a major research university with the sophisticated amenities demanded by affluent residents. The city’s economy extends far beyond education, encompassing thriving healthcare, technology, and professional services sectors that provide high-paying employment opportunities. This economic diversity creates sustained demand for housing from both university-affiliated buyers and professionals in other industries.
Ann Arbor’s real estate market benefits from remarkable stability, with property values supported by the university’s ongoing presence and the city’s reputation as one of the Midwest’s most desirable communities. The area attracts retirees and empty nesters who appreciate the intellectual atmosphere, young professionals drawn to career opportunities, and families seeking excellent schools. This diverse buyer pool helps maintain steady demand even during broader economic uncertainties.
27. Harbor Springs – 114% Home Price Increase Since 2010
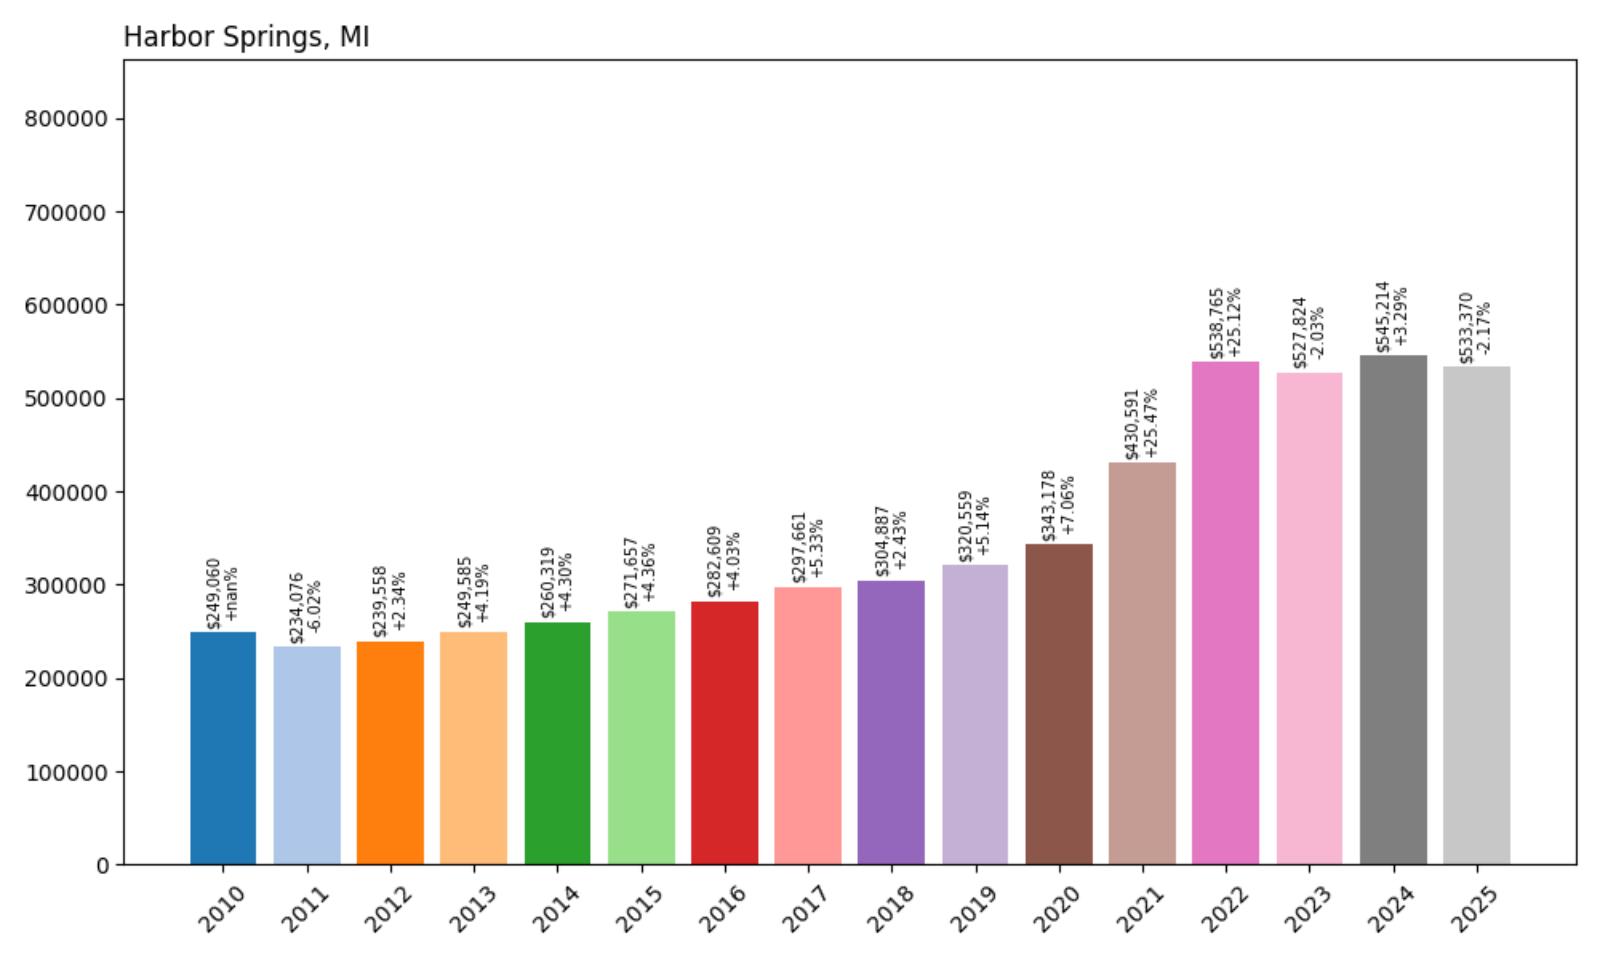
- 2010: $249,060
- 2011: $234,076 (−$14,984, −6.02% from previous year)
- 2012: $239,558 (+$5,482, +2.34% from previous year)
- 2013: $249,585 (+$10,027, +4.19% from previous year)
- 2014: $260,319 (+$10,734, +4.30% from previous year)
- 2015: $271,657 (+$11,338, +4.36% from previous year)
- 2016: $282,609 (+$10,952, +4.03% from previous year)
- 2017: $297,661 (+$15,051, +5.33% from previous year)
- 2018: $304,887 (+$7,227, +2.43% from previous year)
- 2019: $320,559 (+$15,671, +5.14% from previous year)
- 2020: $343,178 (+$22,619, +7.06% from previous year)
- 2021: $430,591 (+$87,414, +25.47% from previous year)
- 2022: $538,765 (+$108,174, +25.12% from previous year)
- 2023: $527,824 (−$10,941, −2.03% from previous year)
- 2024: $545,214 (+$17,390, +3.29% from previous year)
- 2025: $533,370 (−$11,844, −2.17% from previous year)
Harbor Springs experienced one of the most dramatic growth spurts among Michigan’s luxury markets, with consecutive years of 25% growth in 2021-2022 that more than doubled median home values. The current price of $533,370 represents a 114% increase from 2010, though recent years have shown some market correction with modest declines in 2023 and 2025. This pattern suggests the market may be finding a new equilibrium after the pandemic-driven surge that brought buyers fleeing urban areas to northern Michigan’s resort communities.
Harbor Springs – Northern Michigan’s Premier Resort Destination
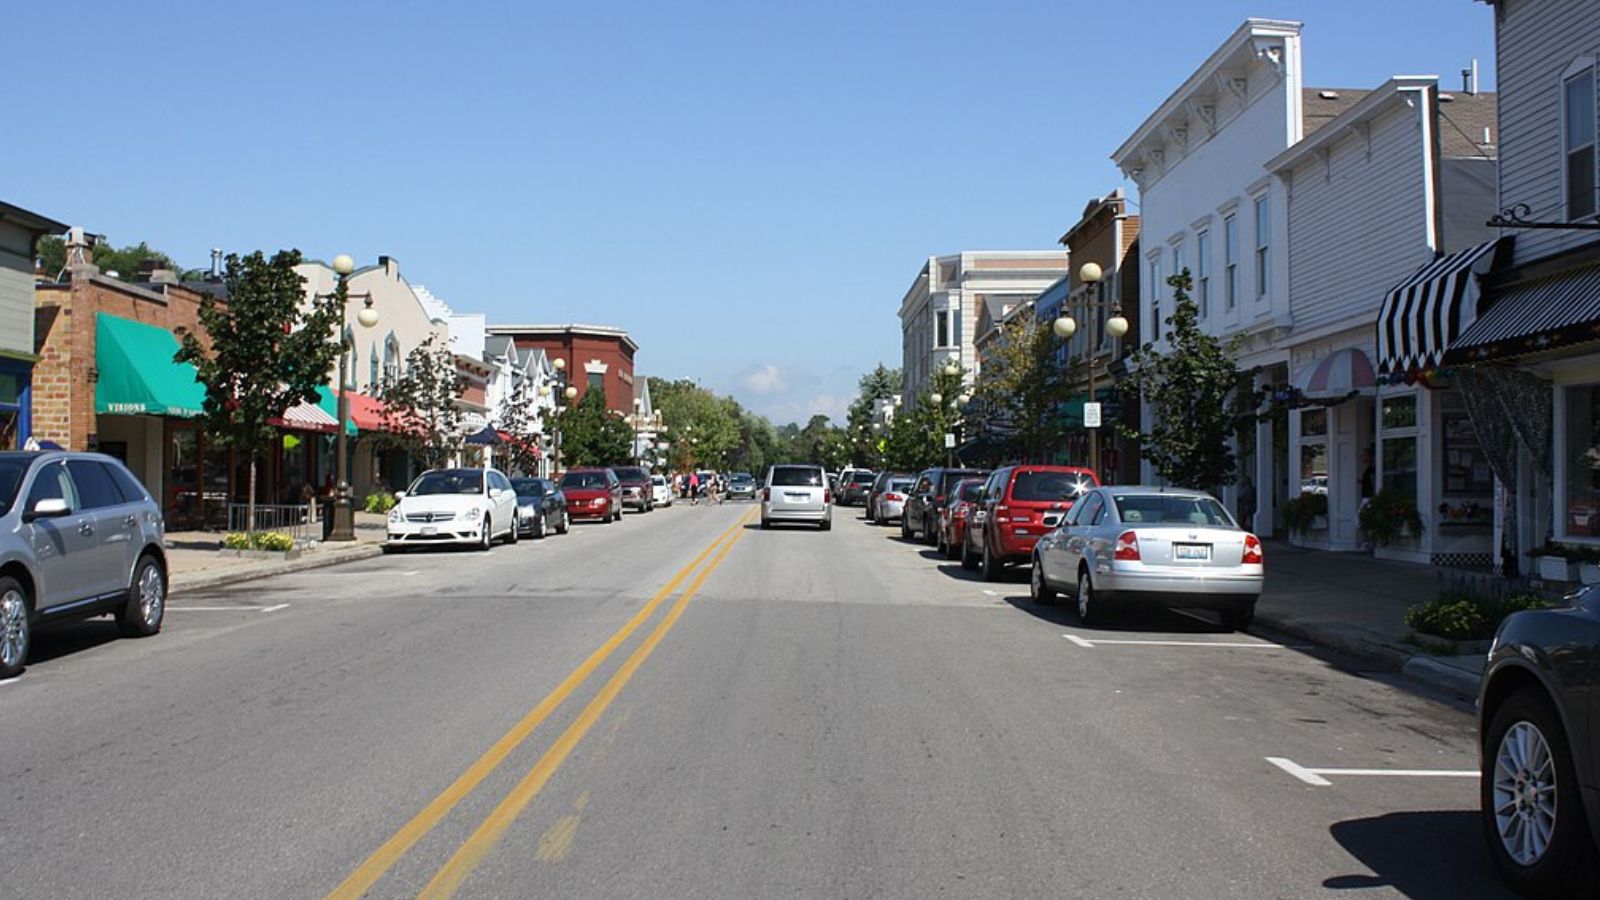
Nestled along the shores of Little Traverse Bay in Emmet County, Harbor Springs has long been recognized as one of northern Michigan’s most exclusive resort communities. The town’s Victorian-era charm, combined with world-class amenities including the renowned Harbor Springs Golf Club and Boyne Highlands Resort, attracts affluent buyers from across the Midwest. The community serves as both a summer retreat and increasingly as a year-round residence for those seeking a quieter lifestyle.
Harbor Springs’ appeal extends beyond its natural beauty to include a thriving downtown district filled with upscale boutiques, galleries, and restaurants. The town’s location provides easy access to some of Michigan’s best skiing at nearby Boyne Mountain and Nub’s Nob, making it attractive to winter sports enthusiasts. The area’s numerous lakes and proximity to Petoskey and Charlevoix create a network of desirable communities that support a robust luxury real estate market.
26. Beverly Hills – 150% Home Price Increase Since 2010
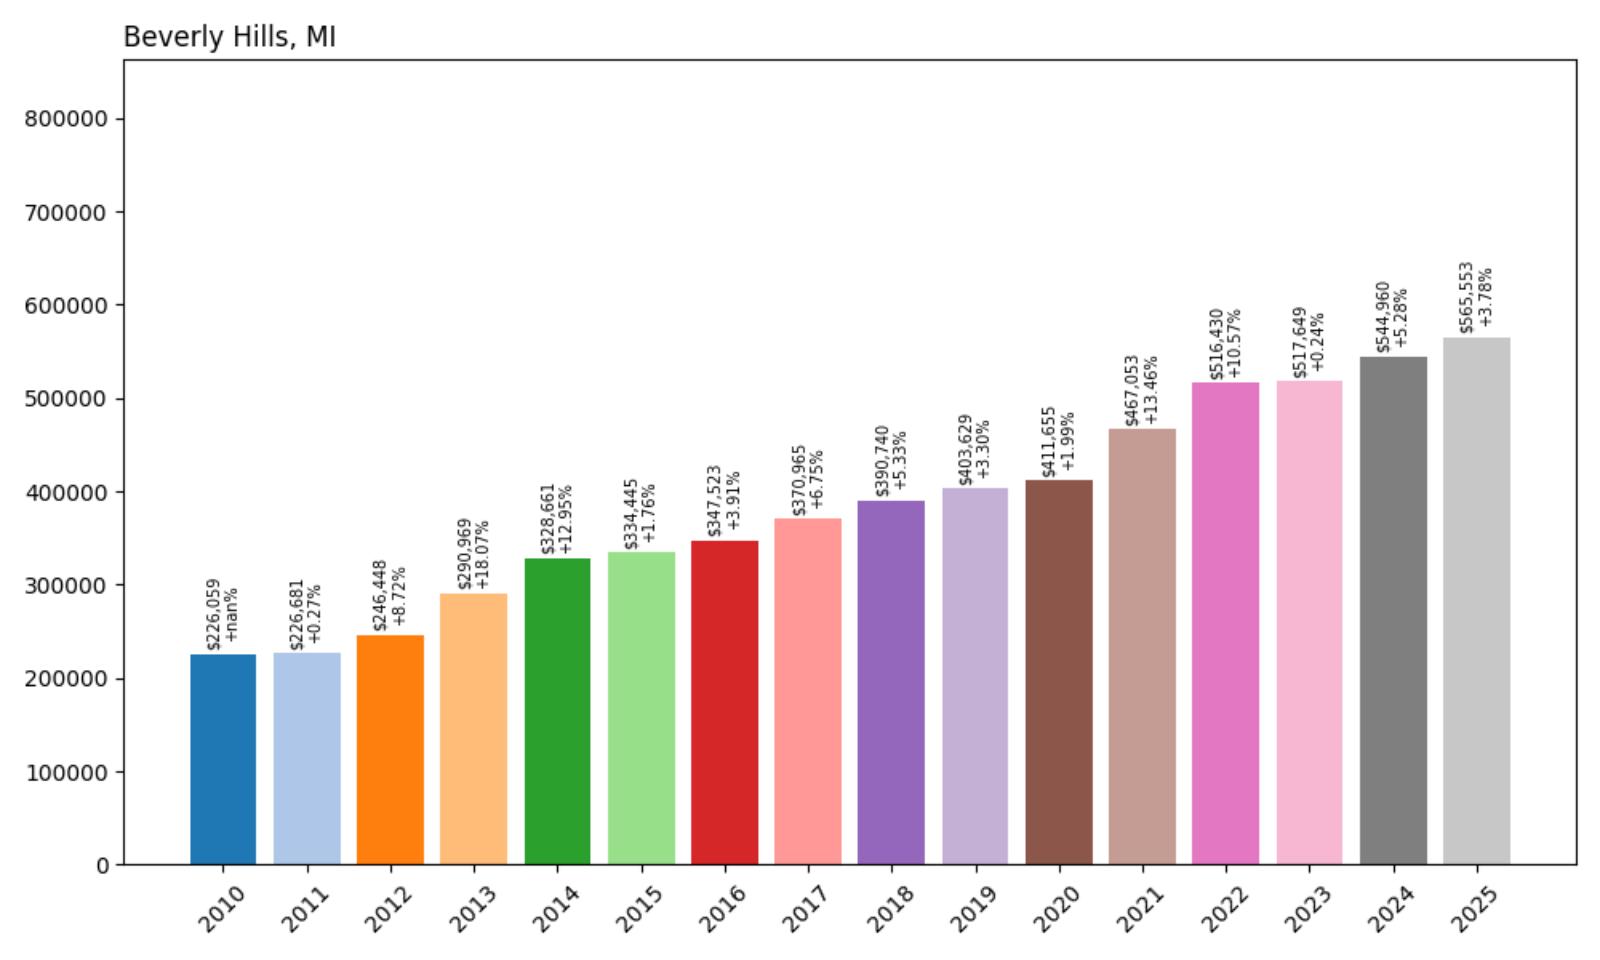
- 2010: $226,059
- 2011: $226,681 (+$621, +0.27% from previous year)
- 2012: $246,448 (+$19,767, +8.72% from previous year)
- 2013: $290,969 (+$44,521, +18.07% from previous year)
- 2014: $328,661 (+$37,692, +12.95% from previous year)
- 2015: $334,445 (+$5,784, +1.76% from previous year)
- 2016: $347,523 (+$13,078, +3.91% from previous year)
- 2017: $370,965 (+$23,442, +6.75% from previous year)
- 2018: $390,740 (+$19,775, +5.33% from previous year)
- 2019: $403,629 (+$12,889, +3.30% from previous year)
- 2020: $411,655 (+$8,026, +1.99% from previous year)
- 2021: $467,053 (+$55,397, +13.46% from previous year)
- 2022: $516,430 (+$49,377, +10.57% from previous year)
- 2023: $517,649 (+$1,219, +0.24% from previous year)
- 2024: $544,960 (+$27,312, +5.28% from previous year)
- 2025: $565,553 (+$20,593, +3.78% from previous year)
Beverly Hills has achieved impressive growth of 150% since 2010, with the current median price of $565,553 reflecting consistent appreciation over the past 15 years. The community experienced its most rapid growth during 2013-2014, when values surged by over 30% in consecutive years. Following a period of more moderate growth, the pandemic years brought renewed acceleration, with strong gains in 2021-2022. The market has continued its upward trajectory through 2025, maintaining healthy appreciation rates of 3-5% annually.
Beverly Hills – Prestigious Oakland County Address
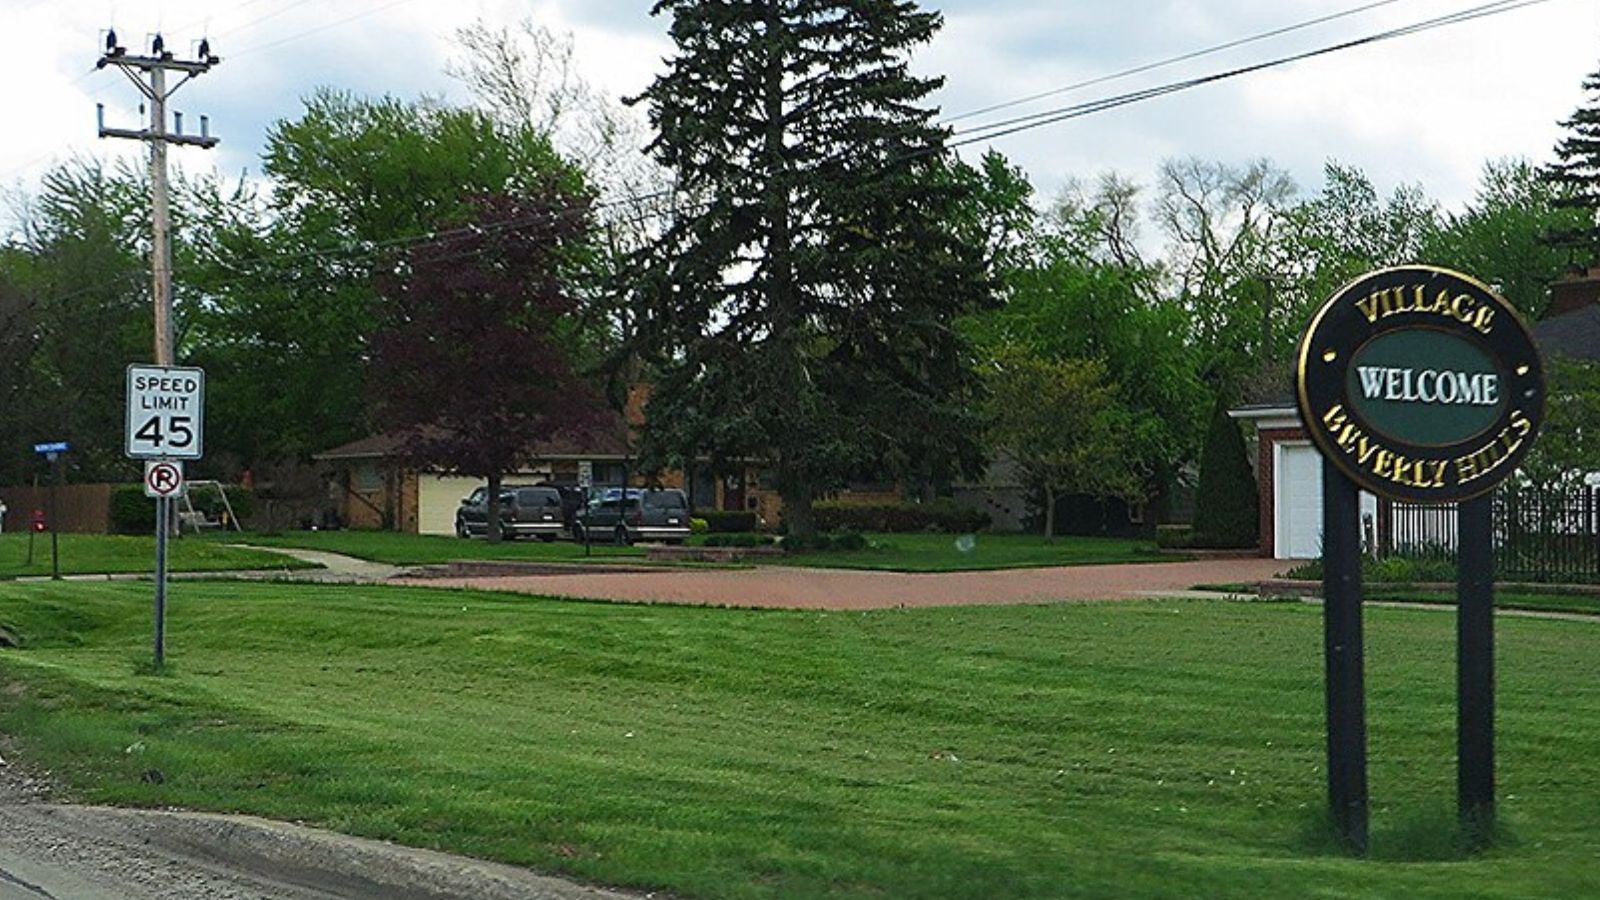
Located in the heart of Oakland County, Beverly Hills represents one of Michigan’s most prestigious residential addresses. This exclusive community of approximately 10,500 residents is situated just 18 miles northwest of downtown Detroit, offering convenient access to the region’s employment centers while maintaining a distinctly suburban character. The village is renowned for its tree-lined streets, well-maintained properties, and strong municipal services that justify premium home prices
The village’s real estate market is characterized by a mix of architectural styles, from Tudor and Colonial revivals to contemporary designs, many situated on generous lots that provide privacy and space. Properties in Beverly Hills tend to appreciate steadily due to the community’s established reputation, limited inventory, and ongoing demand from affluent buyers. The area’s proximity to major employers in automotive, healthcare, and professional services ensures a steady stream of qualified buyers.
25. Northville – 121% Home Price Increase Since 2010
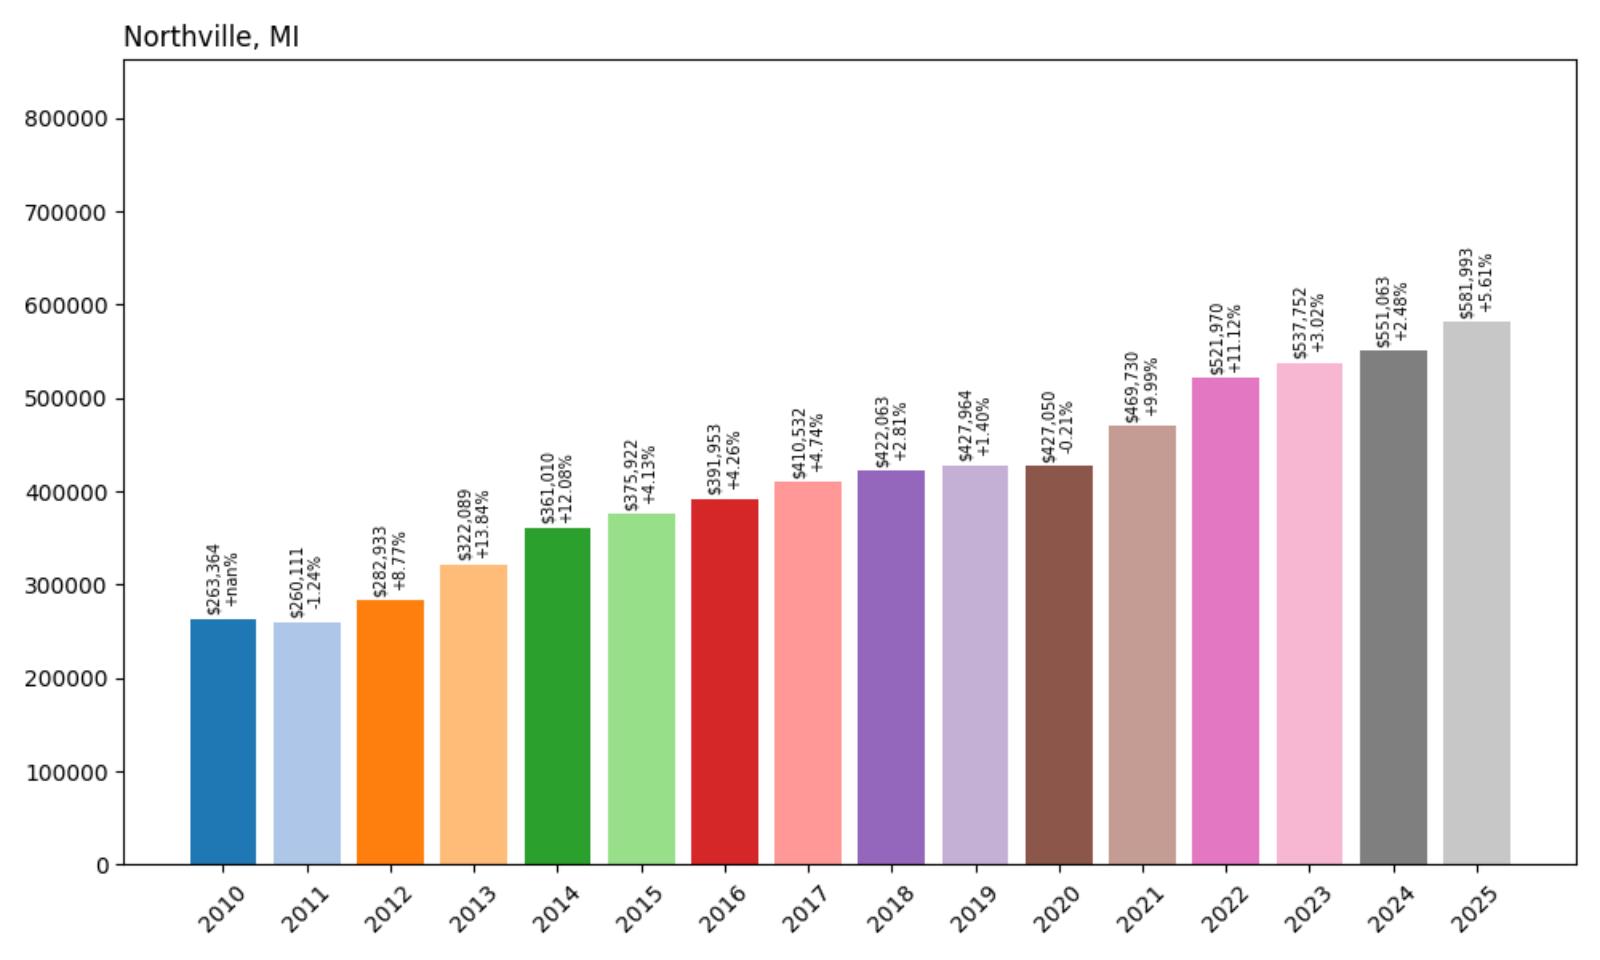
- 2010: $263,364
- 2011: $260,111 (−$3,253, −1.24% from previous year)
- 2012: $282,933 (+$22,823, +8.77% from previous year)
- 2013: $322,089 (+$39,156, +13.84% from previous year)
- 2014: $361,010 (+$38,921, +12.08% from previous year)
- 2015: $375,922 (+$14,912, +4.13% from previous year)
- 2016: $391,953 (+$16,032, +4.26% from previous year)
- 2017: $410,532 (+$18,579, +4.74% from previous year)
- 2018: $422,063 (+$11,531, +2.81% from previous year)
- 2019: $427,964 (+$5,901, +1.40% from previous year)
- 2020: $427,050 (−$914, −0.21% from previous year)
- 2021: $469,730 (+$42,680, +9.99% from previous year)
- 2022: $521,970 (+$52,240, +11.12% from previous year)
- 2023: $537,752 (+$15,782, +3.02% from previous year)
- 2024: $551,063 (+$13,311, +2.48% from previous year)
- 2025: $581,993 (+$30,930, +5.61% from previous year)
Northville has demonstrated exceptional growth stability, with the current median price of $581,993 representing a 121% increase since 2010. The community experienced significant appreciation during 2012-2014, followed by steady moderate growth through the late 2010s. The pandemic years brought renewed momentum with solid double-digit gains in 2021-2022, and 2025 has seen a particularly strong 5.61% increase, suggesting continued market strength and buyer confidence in this established community.
Northville – Historic Charm Meets Modern Convenience
Straddling the border between Wayne and Oakland counties, Northville combines small-town charm with metropolitan convenience. The community is celebrated for its historic downtown district, which features Victorian-era architecture, unique shops, and popular restaurants that draw visitors from throughout southeastern Michigan. Northville’s location provides residents with easy access to major employment centers in Detroit, Ann Arbor, and the broader region while maintaining a distinct community identity.
The city’s appeal extends beyond its picturesque downtown to include excellent schools, well-maintained neighborhoods, and abundant recreational opportunities. Northville is home to several parks and nature preserves, including the popular Maybury State Park, which offers hiking, horseback riding, and other outdoor activities. The community’s strong municipal services and active civic organizations contribute to its reputation as one of the region’s most desirable places to live.
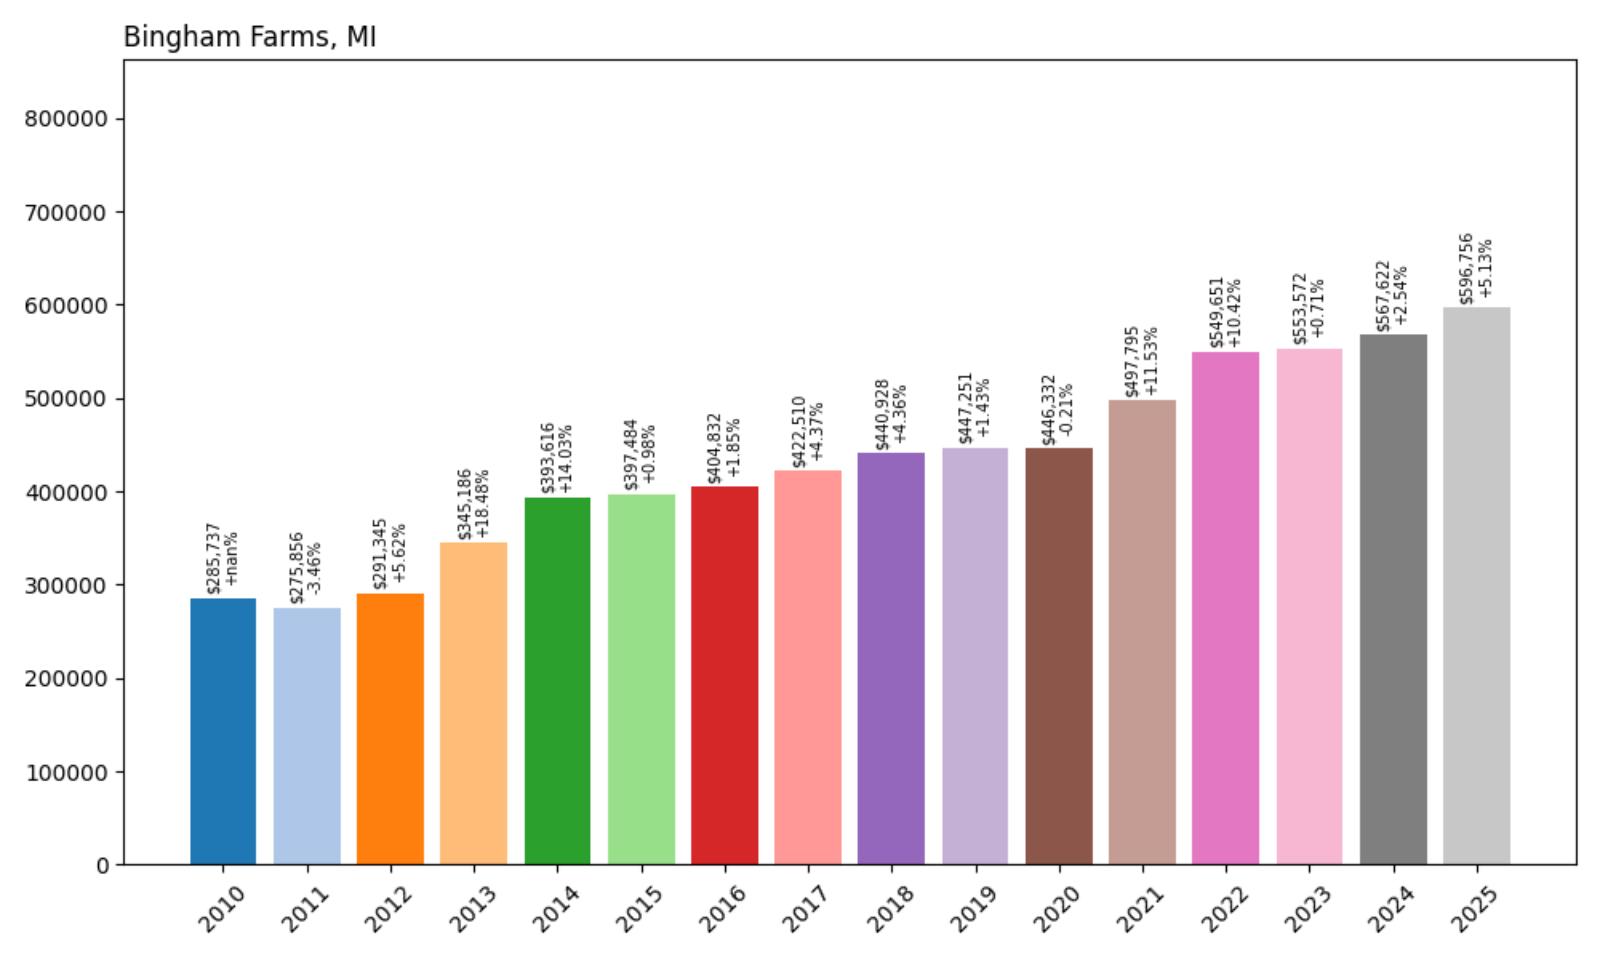
24. Bingham Farms – 109% Home Price Increase Since 2010
🔥 Would you like to save this?
- 2010: $285,737
- 2011: $275,856 (−$9,882, −3.46% from previous year)
- 2012: $291,345 (+$15,489, +5.62% from previous year)
- 2013: $345,186 (+$53,841, +18.48% from previous year)
- 2014: $393,616 (+$48,430, +14.03% from previous year)
- 2015: $397,484 (+$3,868, +0.98% from previous year)
- 2016: $404,832 (+$7,347, +1.85% from previous year)
- 2017: $422,510 (+$17,679, +4.37% from previous year)
- 2018: $440,928 (+$18,417, +4.36% from previous year)
- 2019: $447,251 (+$6,324, +1.43% from previous year)
- 2020: $446,332 (−$919, −0.21% from previous year)
- 2021: $497,795 (+$51,463, +11.53% from previous year)
- 2022: $549,651 (+$51,856, +10.42% from previous year)
- 2023: $553,572 (+$3,921, +0.71% from previous year)
- 2024: $567,622 (+$14,050, +2.54% from previous year)
- 2025: $596,756 (+$29,134, +5.13% from previous year)
Bingham Farms has achieved solid long-term growth with a current median price of $596,756, representing a 109% increase since 2010. The community experienced explosive growth during 2013-2014, with consecutive years of double-digit appreciation that established its position among Oakland County’s premium markets. After a period of steady but moderate growth through the late 2010s, the pandemic years brought renewed momentum with strong gains continuing through 2025’s robust 5.13% increase.
Bingham Farms – Exclusive Oakland County Enclave
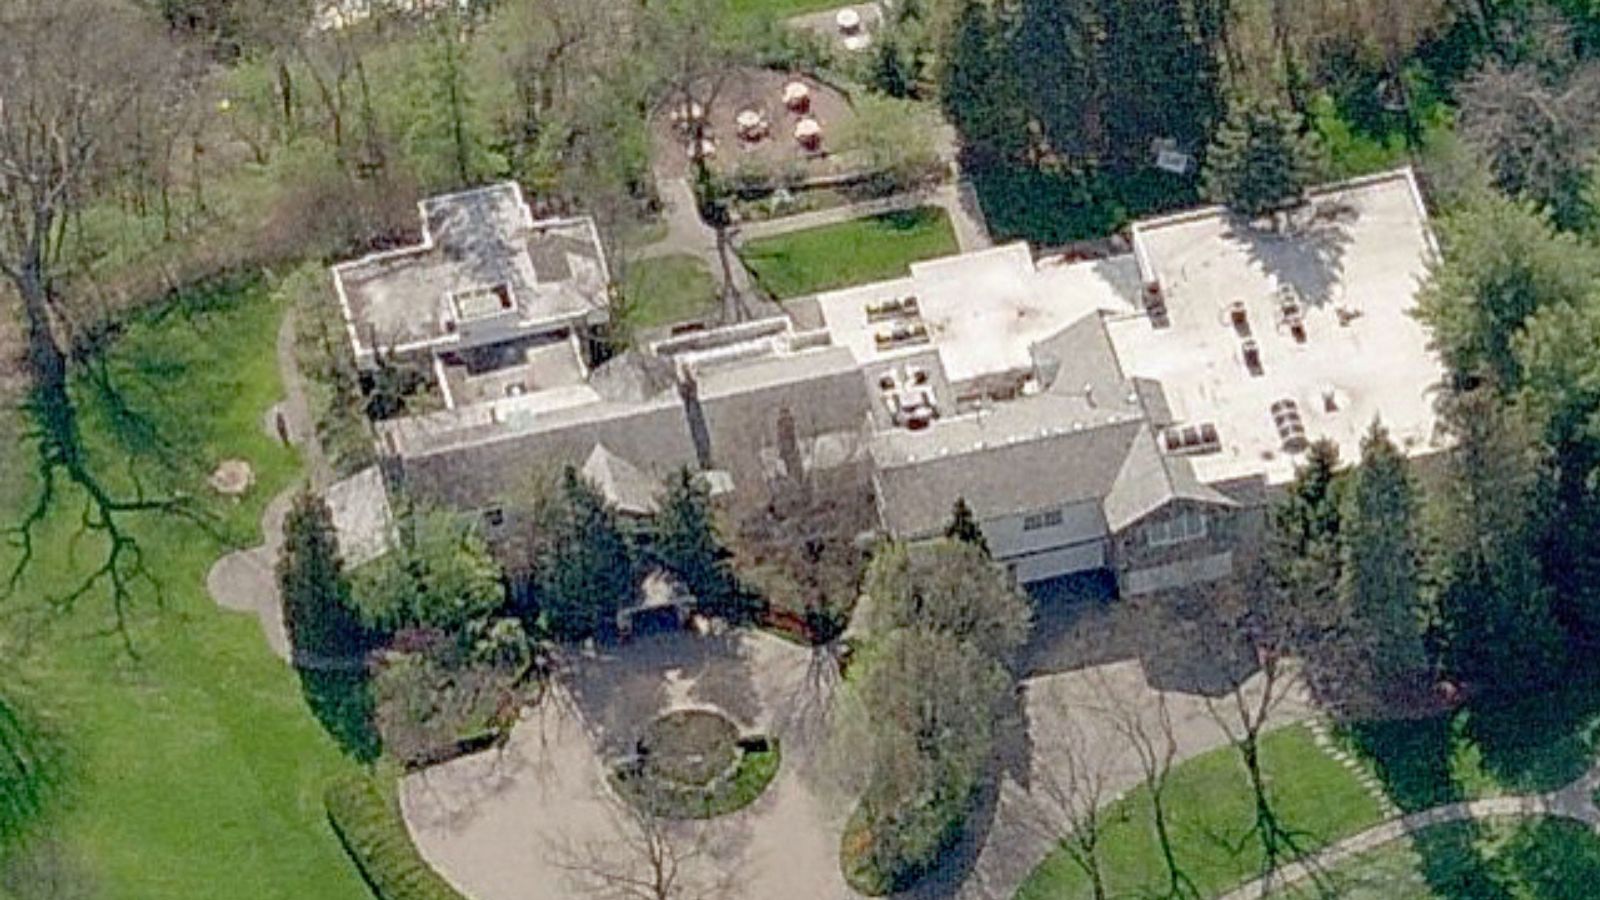
This small but exclusive community in Oakland County represents one of the region’s most prestigious addresses, with just over 1,100 residents enjoying a quiet, residential atmosphere. Bingham Farms is strategically located between Birmingham and Bloomfield Hills, providing residents with easy access to upscale shopping, dining, and cultural amenities while maintaining a distinctly residential character. The village’s location offers convenient access to major highways and employment centers throughout southeastern Michigan.
The area’s real estate market benefits from its proximity to Birmingham’s shopping and dining district, Bloomfield Hills’ estates, and major employers throughout Oakland County. Properties in Bingham Farms typically feature quality construction, mature landscaping, and privacy that justify premium prices. The community’s location within highly rated school districts and its reputation for excellent municipal services continue to attract families and professionals willing to pay for quality.
23. Glen Arbor – 79% Home Price Increase Since 2010
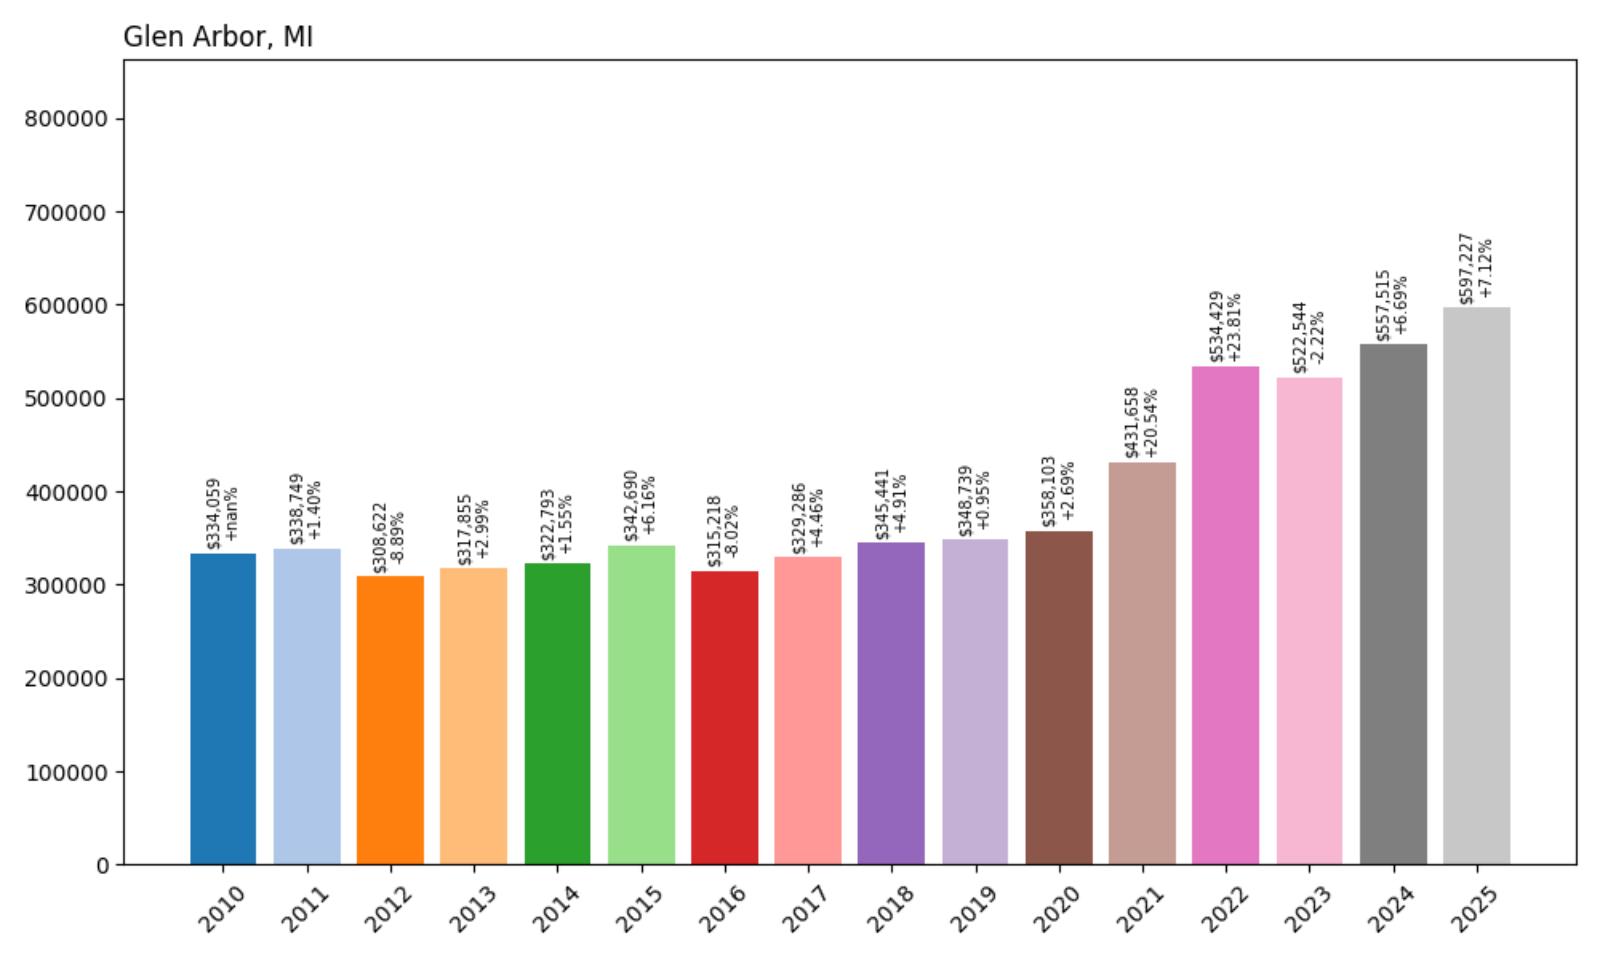
- 2010: $334,059
- 2011: $338,749 (+$4,690, +1.40% from previous year)
- 2012: $308,622 (−$30,128, −8.89% from previous year)
- 2013: $317,855 (+$9,233, +2.99% from previous year)
- 2014: $322,793 (+$4,938, +1.55% from previous year)
- 2015: $342,690 (+$19,898, +6.16% from previous year)
- 2016: $315,218 (−$27,472, −8.02% from previous year)
- 2017: $329,286 (+$14,068, +4.46% from previous year)
- 2018: $345,441 (+$16,155, +4.91% from previous year)
- 2019: $348,739 (+$3,299, +0.95% from previous year)
- 2020: $358,103 (+$9,364, +2.69% from previous year)
- 2021: $431,658 (+$73,554, +20.54% from previous year)
- 2022: $534,429 (+$102,771, +23.81% from previous year)
- 2023: $522,544 (−$11,885, −2.22% from previous year)
- 2024: $557,515 (+$34,970, +6.69% from previous year)
- 2025: $597,227 (+$39,712, +7.12% from previous year)
Glen Arbor’s market journey illustrates the volatility common in resort communities, with the current median price of $597,227 representing a 79% increase since 2010 despite significant fluctuations along the way. The community experienced notable declines in 2012 and 2016 before finding stability, then experienced explosive pandemic-era growth with consecutive years of 20%+ appreciation in 2021-2022. Following a brief correction in 2023, the market has resumed strong growth with solid gains in 2024-2025.
Glen Arbor – Gateway to Sleeping Bear Dunes
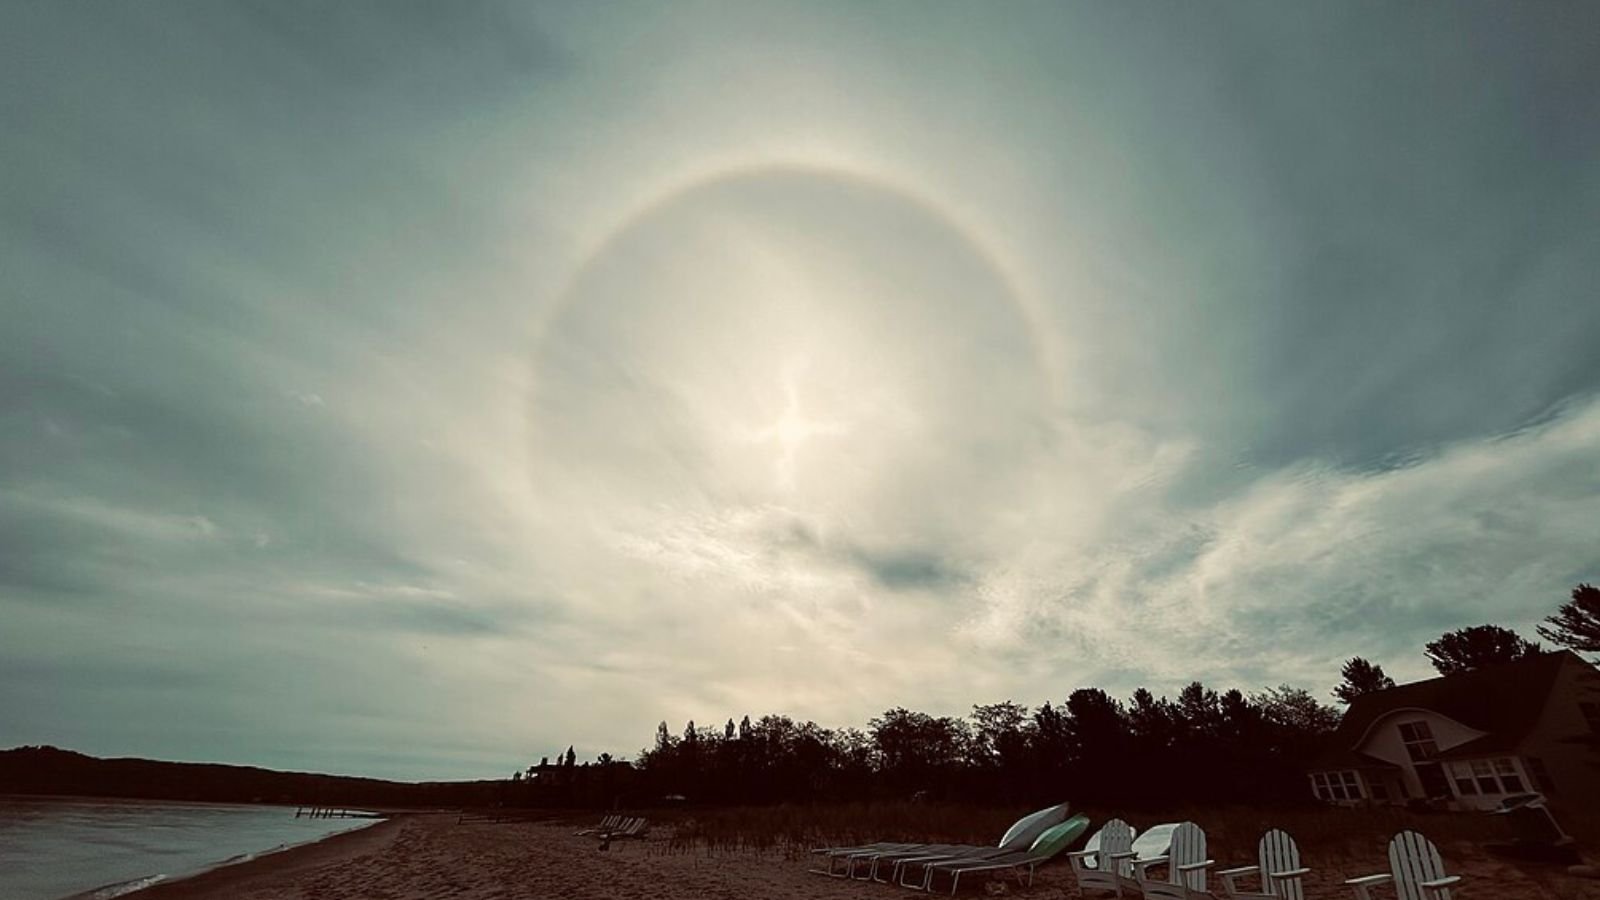
Situated in the heart of the Sleeping Bear Dunes National Lakeshore in Leelanau County, Glen Arbor represents one of northern Michigan’s most scenic and desirable resort communities. The village’s location along Lake Michigan’s shoreline, combined with its proximity to the iconic sand dunes and numerous inland lakes, creates an unparalleled natural setting that attracts affluent buyers from across the Midwest. The community serves as both a summer retreat and increasingly as a year-round residence for those seeking a connection to nature.
Glen Arbor’s economy centers around tourism and recreation, with the village serving as a gateway to outdoor activities including hiking, boating, fishing, and winter sports. The community features a charming downtown district with art galleries, boutiques, and restaurants that cater to both visitors and residents. The area’s numerous cherry orchards and wineries add to its appeal, creating a unique blend of natural beauty and agricultural heritage that sets it apart from other resort communities.
22. Saugatuck – 146% Home Price Increase Since 2010
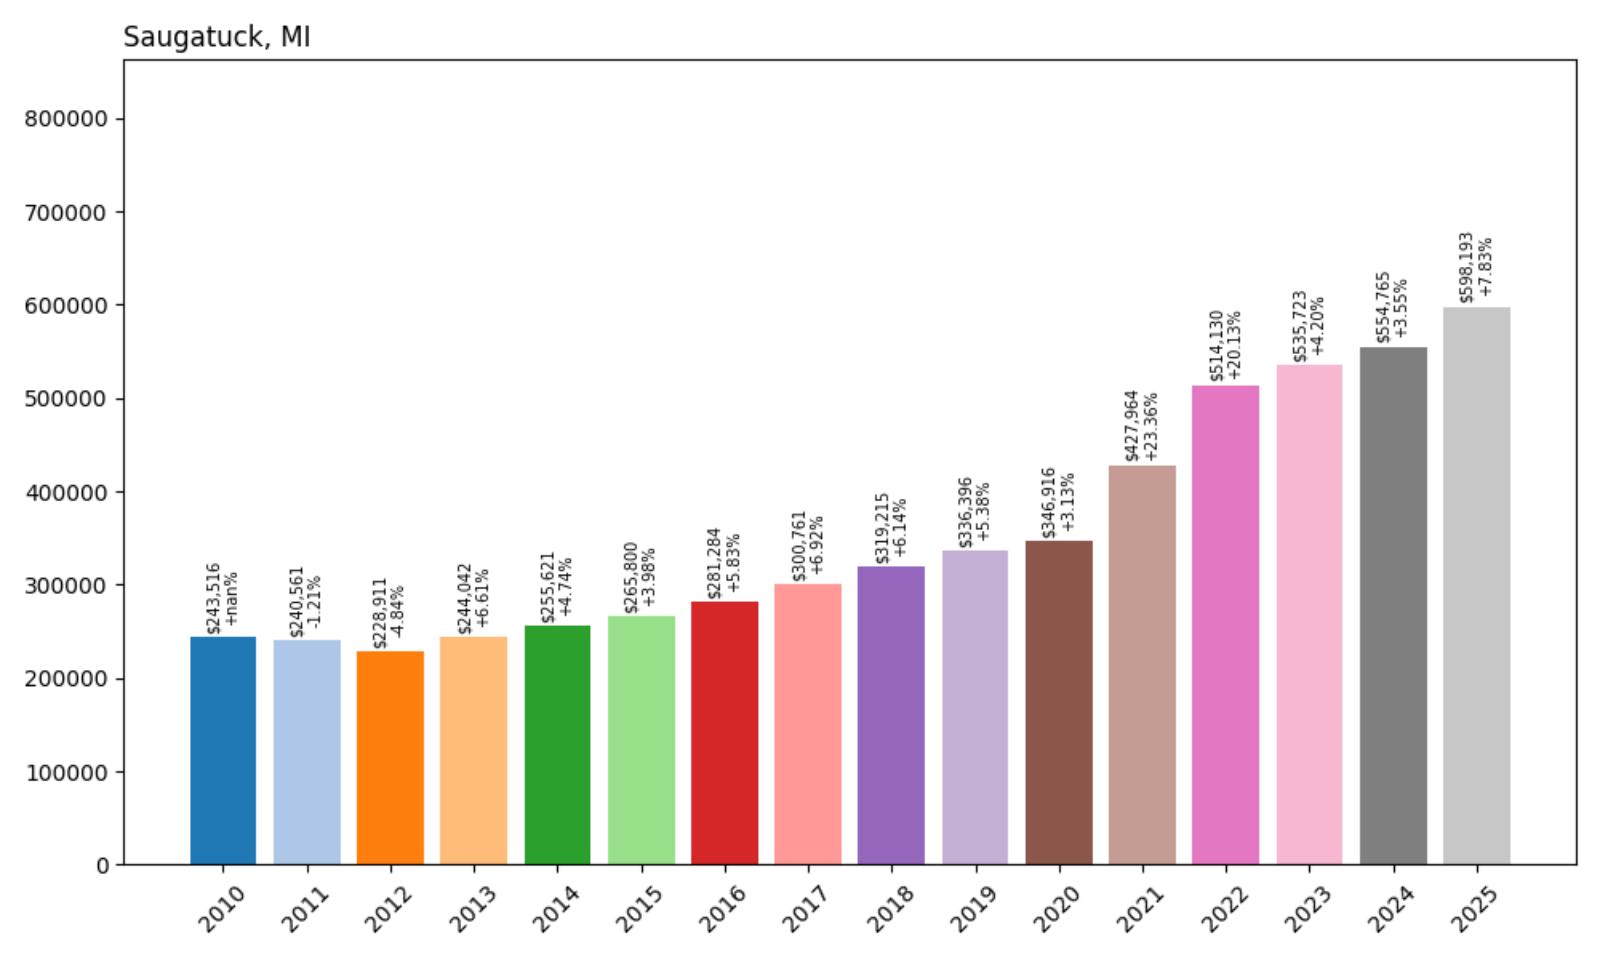
- 2010: $243,516
- 2011: $240,561 (−$2,954, −1.21% from previous year)
- 2012: $228,911 (−$11,650, −4.84% from previous year)
- 2013: $244,042 (+$15,131, +6.61% from previous year)
- 2014: $255,621 (+$11,579, +4.74% from previous year)
- 2015: $265,800 (+$10,179, +3.98% from previous year)
- 2016: $281,284 (+$15,484, +5.83% from previous year)
- 2017: $300,761 (+$19,477, +6.92% from previous year)
- 2018: $319,215 (+$18,454, +6.14% from previous year)
- 2019: $336,396 (+$17,180, +5.38% from previous year)
- 2020: $346,916 (+$10,521, +3.13% from previous year)
- 2021: $427,964 (+$81,048, +23.36% from previous year)
- 2022: $514,130 (+$86,166, +20.13% from previous year)
- 2023: $535,723 (+$21,593, +4.20% from previous year)
- 2024: $554,765 (+$19,041, +3.55% from previous year)
- 2025: $598,193 (+$43,429, +7.83% from previous year)
Saugatuck has achieved remarkable growth of 146% since 2010, with the current median price of $598,193 reflecting a dramatic transformation from its more modest beginnings. After weathering early 2010s declines, the community found its footing around 2013 and maintained steady 4-7% annual growth through 2020. The pandemic years brought explosive growth with back-to-back increases exceeding 20%, and the market has continued strong momentum through 2025 with a robust 7.83% increase.
Saugatuck – Michigan’s Art Coast Jewel
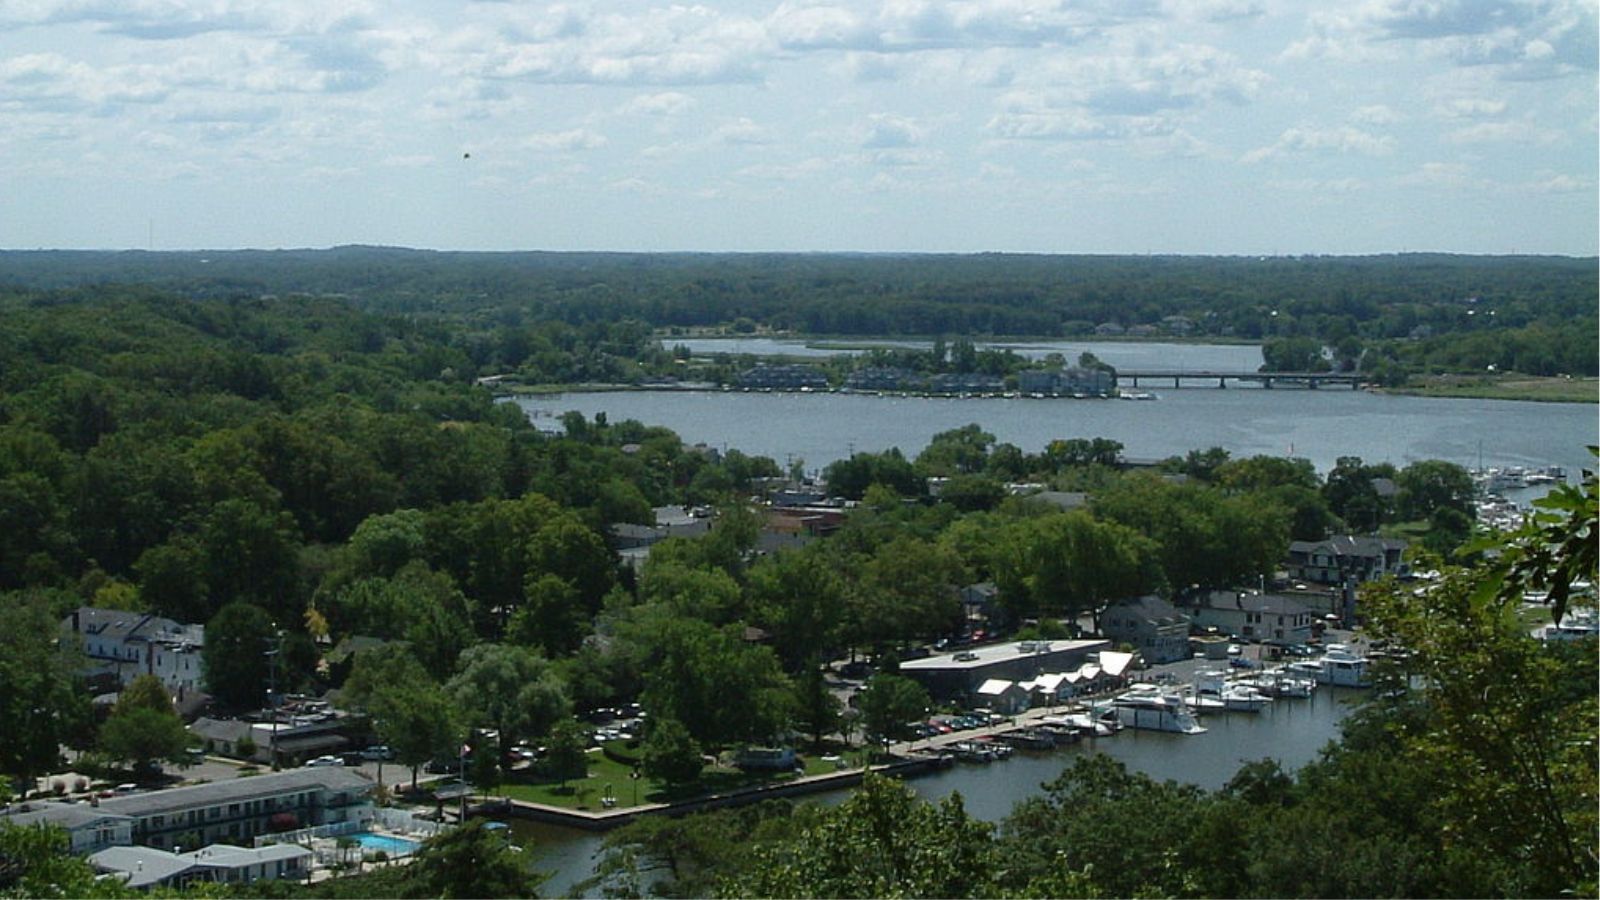
Known as the “Art Coast of Michigan,” Saugatuck combines small-town charm with sophisticated cultural offerings that attract visitors and residents from across the region. Located along Lake Michigan’s eastern shore in Allegan County, this picturesque community of about 900 residents has evolved from a lumber town into one of the state’s premier arts and tourism destinations. The town’s historic downtown district features numerous galleries, boutiques, and acclaimed restaurants that create a vibrant atmosphere year-round.
The real estate market in Saugatuck reflects the community’s evolution into a high-end resort destination, with properties near the lake or downtown district commanding significant premiums. The town’s limited size and geographic constraints create natural scarcity that supports property values, while its growing reputation as a cultural destination continues to attract new buyers. The recent acceleration in price growth reflects increased demand from urban refugees seeking a combination of natural beauty, cultural amenities, and small-town atmosphere.
21. Maple City – 160% Home Price Increase Since 2010
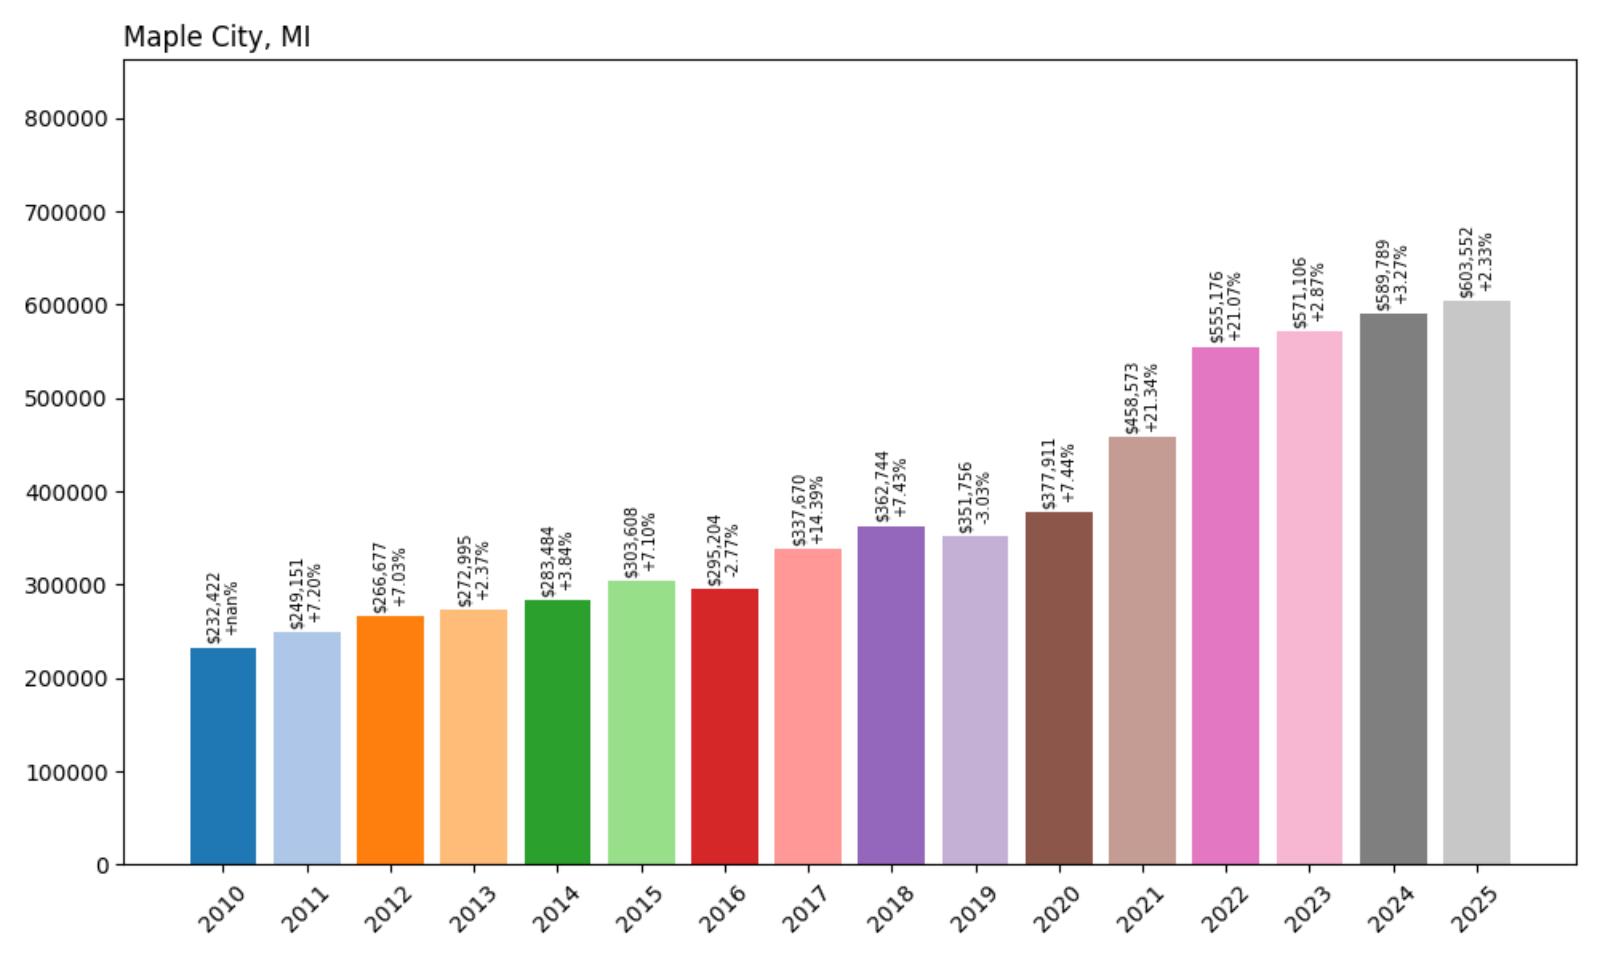
- 2010: $232,422
- 2011: $249,151 (+$16,729, +7.20% from previous year)
- 2012: $266,677 (+$17,526, +7.03% from previous year)
- 2013: $272,995 (+$6,318, +2.37% from previous year)
- 2014: $283,484 (+$10,489, +3.84% from previous year)
- 2015: $303,608 (+$20,123, +7.10% from previous year)
- 2016: $295,204 (−$8,404, −2.77% from previous year)
- 2017: $337,670 (+$42,467, +14.39% from previous year)
- 2018: $362,744 (+$25,074, +7.43% from previous year)
- 2019: $351,756 (−$10,989, −3.03% from previous year)
- 2020: $377,911 (+$26,155, +7.44% from previous year)
- 2021: $458,573 (+$80,662, +21.34% from previous year)
- 2022: $555,176 (+$96,603, +21.07% from previous year)
- 2023: $571,106 (+$15,930, +2.87% from previous year)
- 2024: $589,789 (+$18,684, +3.27% from previous year)
- 2025: $603,552 (+$13,763, +2.33% from previous year)
Maple City has experienced exceptional growth of 160% since 2010, with the current median price of $603,552 reflecting remarkable appreciation over the past 15 years. The community showed strong early growth in 2011-2012, followed by more moderate increases through the mid-2010s. A significant surge in 2017 (+14.39%) preceded the pandemic-era explosion of 2021-2022, when consecutive 21% increases doubled property values. The market has since stabilized with modest but steady growth continuing through 2025.
Maple City – Leelanau County’s Hidden Treasure
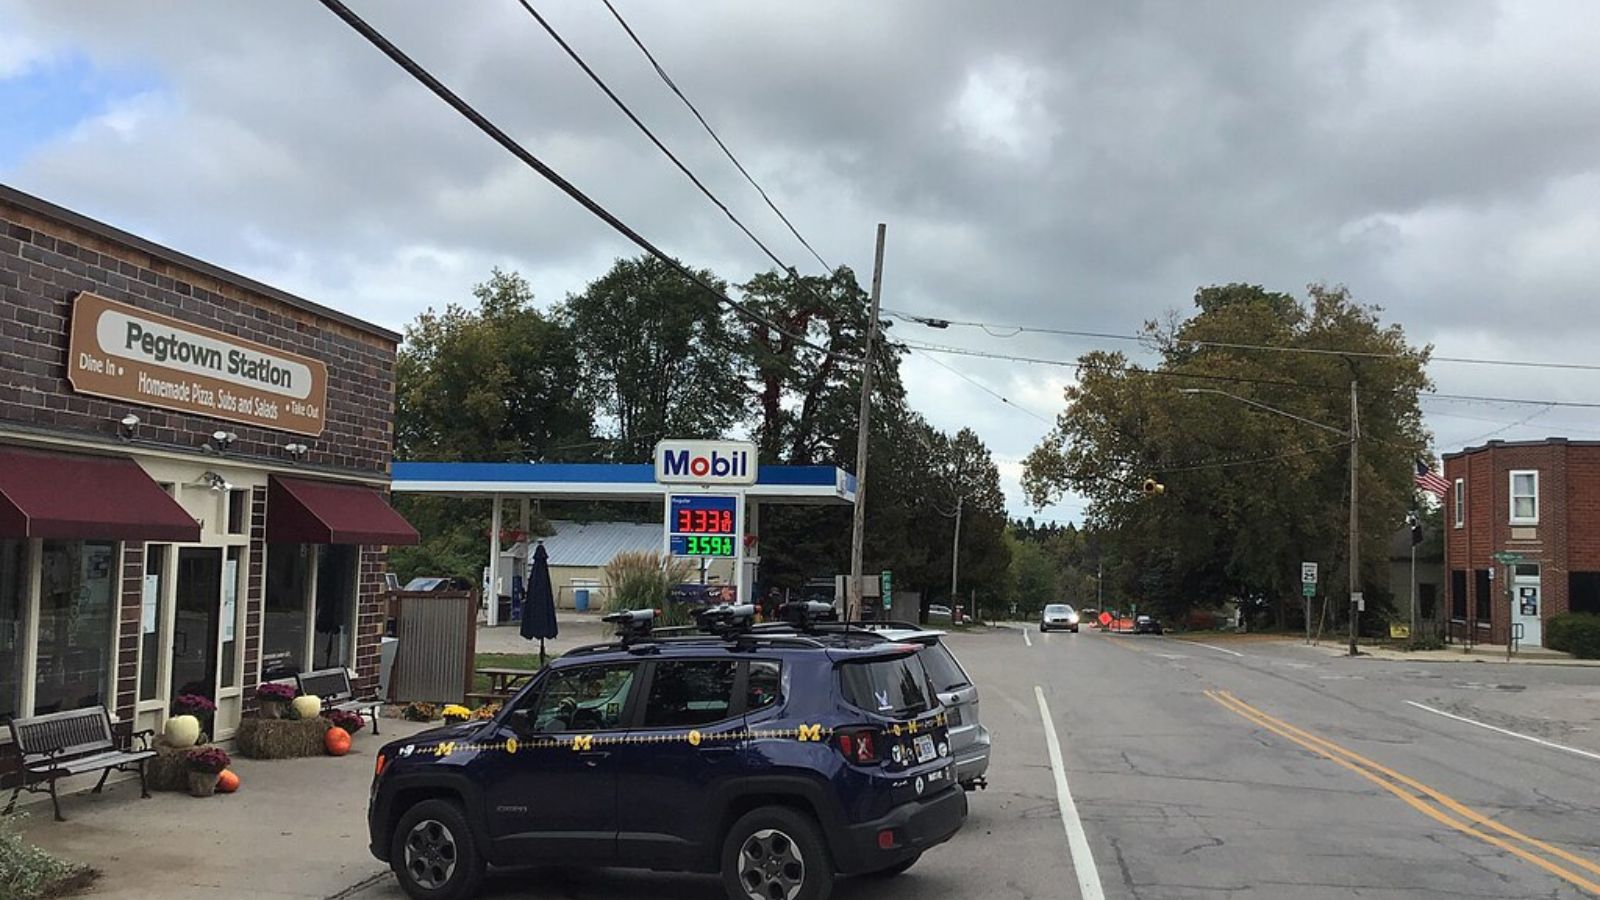
Nestled in the rolling hills of Leelanau County, Maple City represents a quieter alternative to the county’s more famous lakefront communities while still offering proximity to northern Michigan’s premier attractions. This small unincorporated community serves as a gateway to the Sleeping Bear Dunes National Lakeshore and provides easy access to Traverse City, Glen Arbor, and numerous lakes that define the region’s appeal. The area’s rural character attracts buyers seeking privacy and natural beauty without sacrificing access to amenities.
The real estate market in Maple City benefits from limited inventory and growing recognition of Leelanau County as one of Michigan’s most desirable regions. Properties in the area often feature larger acreage than lakefront communities, appealing to buyers seeking privacy and space. The recent price appreciation reflects broader trends affecting northern Michigan, where pandemic-era migration from urban areas has created sustained demand for rural and recreational properties that offer both natural beauty and investment potential.
20. Empire – 102% Home Price Increase Since 2010
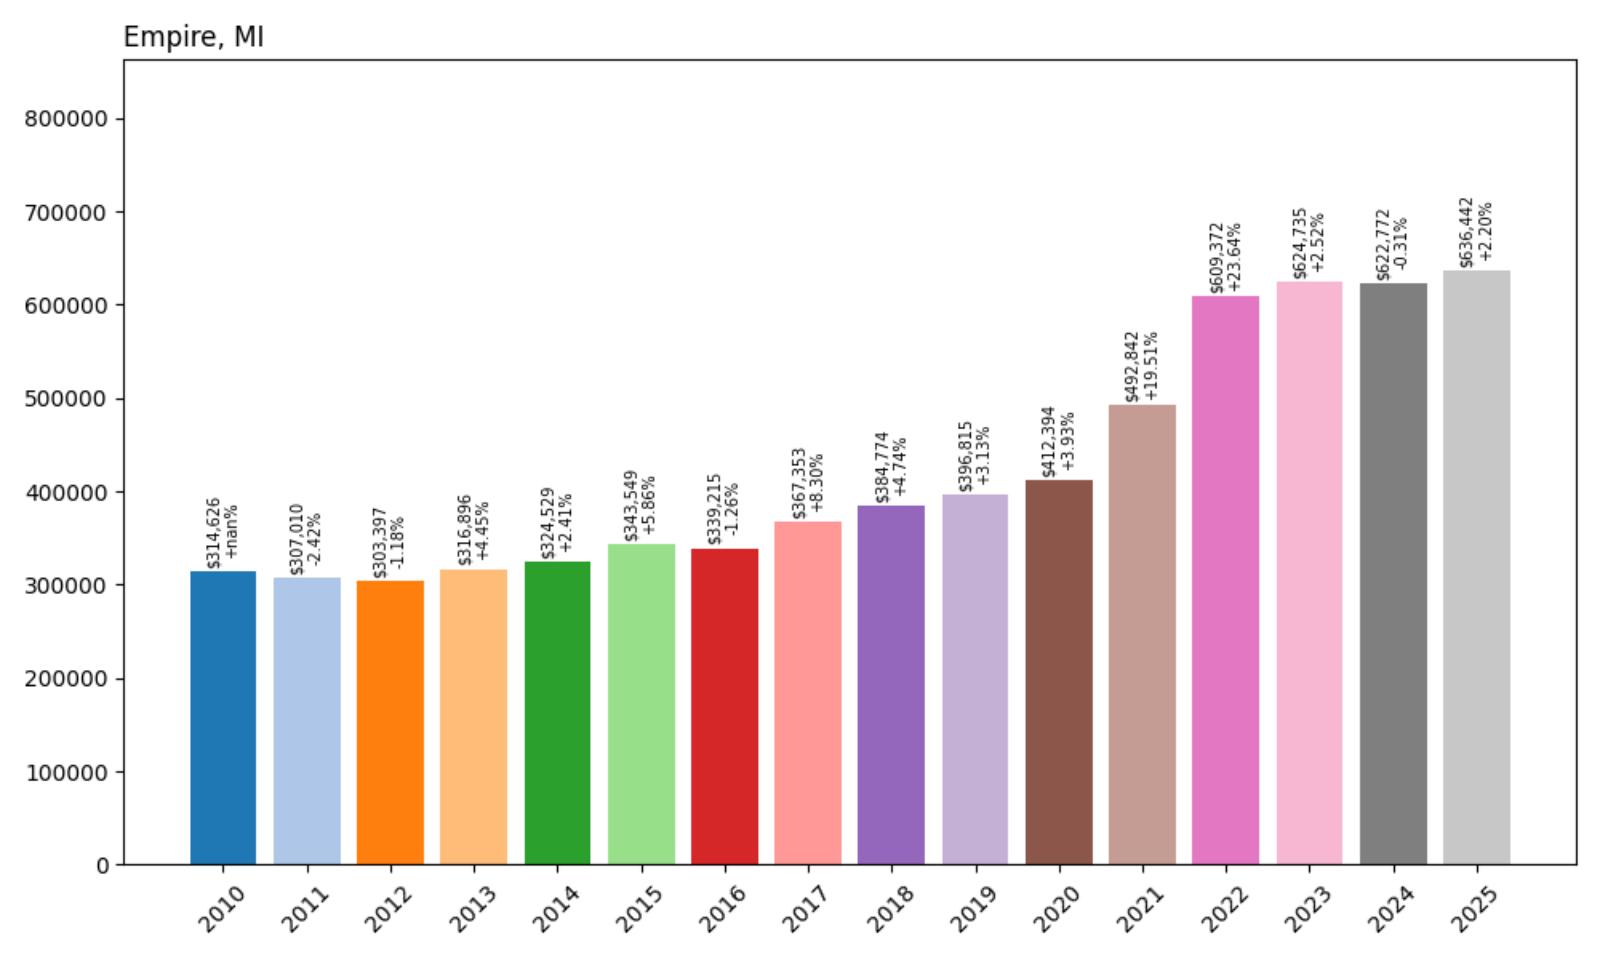
- 2010: $314,626
- 2011: $307,010 (−$7,616, −2.42% from previous year)
- 2012: $303,397 (−$3,612, −1.18% from previous year)
- 2013: $316,896 (+$13,499, +4.45% from previous year)
- 2014: $324,529 (+$7,633, +2.41% from previous year)
- 2015: $343,549 (+$19,020, +5.86% from previous year)
- 2016: $339,215 (−$4,334, −1.26% from previous year)
- 2017: $367,353 (+$28,138, +8.30% from previous year)
- 2018: $384,774 (+$17,421, +4.74% from previous year)
- 2019: $396,815 (+$12,041, +3.13% from previous year)
- 2020: $412,394 (+$15,579, +3.93% from previous year)
- 2021: $492,842 (+$80,449, +19.51% from previous year)
- 2022: $609,372 (+$116,529, +23.64% from previous year)
- 2023: $624,735 (+$15,363, +2.52% from previous year)
- 2024: $622,772 (−$1,962, −0.31% from previous year)
- 2025: $636,442 (+$13,670, +2.20% from previous year)
Empire has achieved solid growth of 102% since 2010, with the current median price of $636,442 reflecting steady long-term appreciation despite some volatility. The community experienced modest declines in the early 2010s before finding stability and consistent growth through 2020. The pandemic years brought dramatic acceleration, with spectacular gains of nearly 20% in 2021 and 24% in 2022. After a brief pause in 2024, the market resumed growth in 2025, suggesting continued underlying strength in this scenic lakefront community.
Empire – Sleeping Bear Dunes Gateway
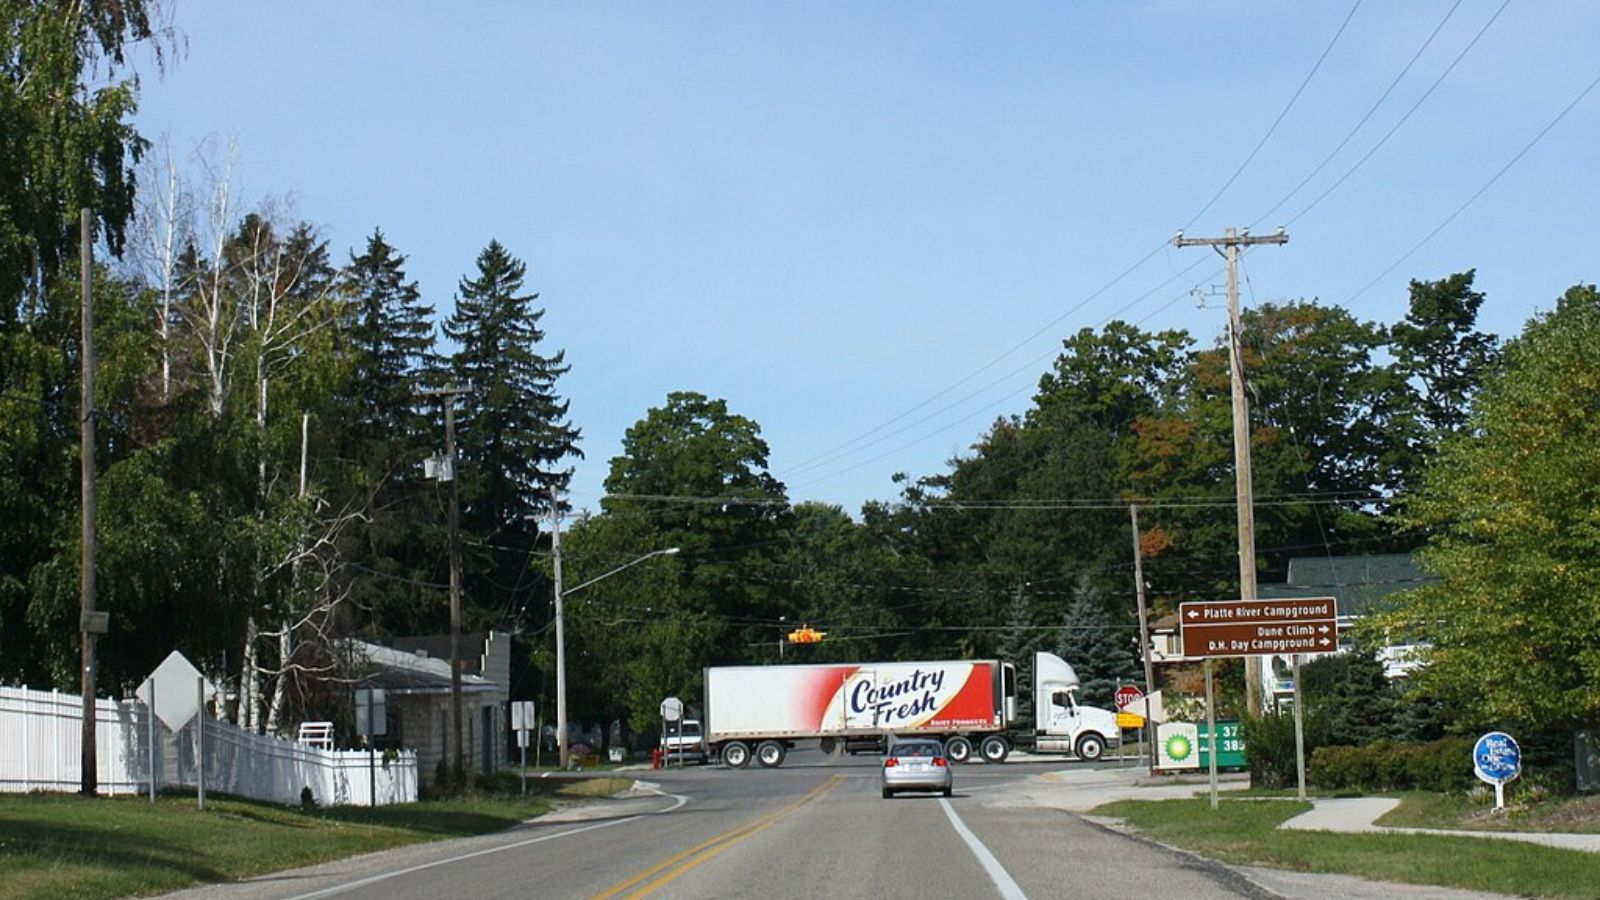
Located at the heart of the Sleeping Bear Dunes National Lakeshore, Empire serves as the primary gateway to one of America’s most beautiful natural areas. This small Lake Michigan community in Leelanau County offers residents and visitors unparalleled access to pristine beaches, towering sand dunes, and crystal-clear inland lakes. The village’s location provides the perfect balance of natural beauty and accessibility, with easy connections to Traverse City and other northern Michigan destinations.
Empire’s economy revolves around tourism and outdoor recreation, with the National Lakeshore drawing millions of visitors annually who contribute to a thriving hospitality and service sector. The community features a charming downtown district with local shops, restaurants, and the Empire Area Museum, which celebrates the region’s maritime heritage. The area’s numerous hiking trails, beaches, and scenic drives create year-round appeal for both residents and visitors seeking outdoor adventure.
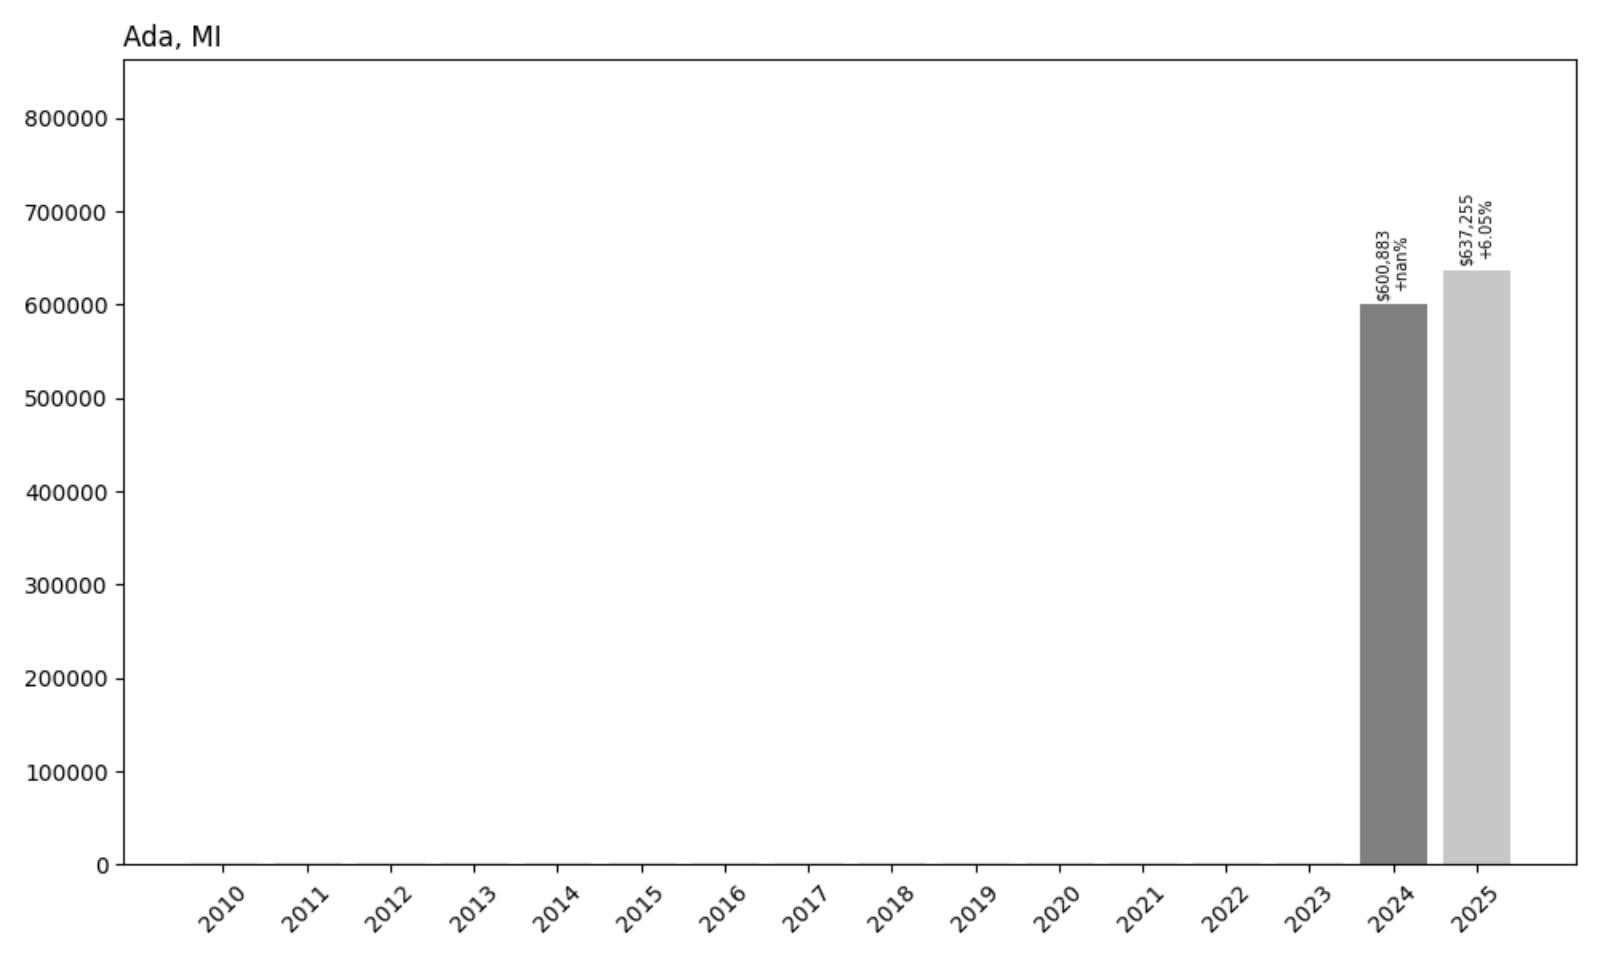
19. Ada – 6% Home Price Increase Since 2024
- 2010: N/A
- 2011: N/A
- 2012: N/A
- 2013: N/A
- 2014: N/A
- 2015: N/A
- 2016: N/A
- 2017: N/A
- 2018: N/A
- 2019: N/A
- 2020: N/A
- 2021: N/A
- 2022: N/A
- 2023: N/A
- 2024: $600,883
- 2025: $637,255 (+$36,372, +6.05% from previous year)
Ada’s limited data shows a strong 6.05% increase from 2024 to 2025, with the current median price of $637,255 placing it among Michigan’s most expensive communities. While historical trend data is unavailable, the current price level suggests Ada has established itself as a premium market within the Grand Rapids metropolitan area. The healthy year-over-year growth indicates strong buyer confidence and continued demand in this exclusive community.
Ada – Grand Rapids’ Premier Suburb
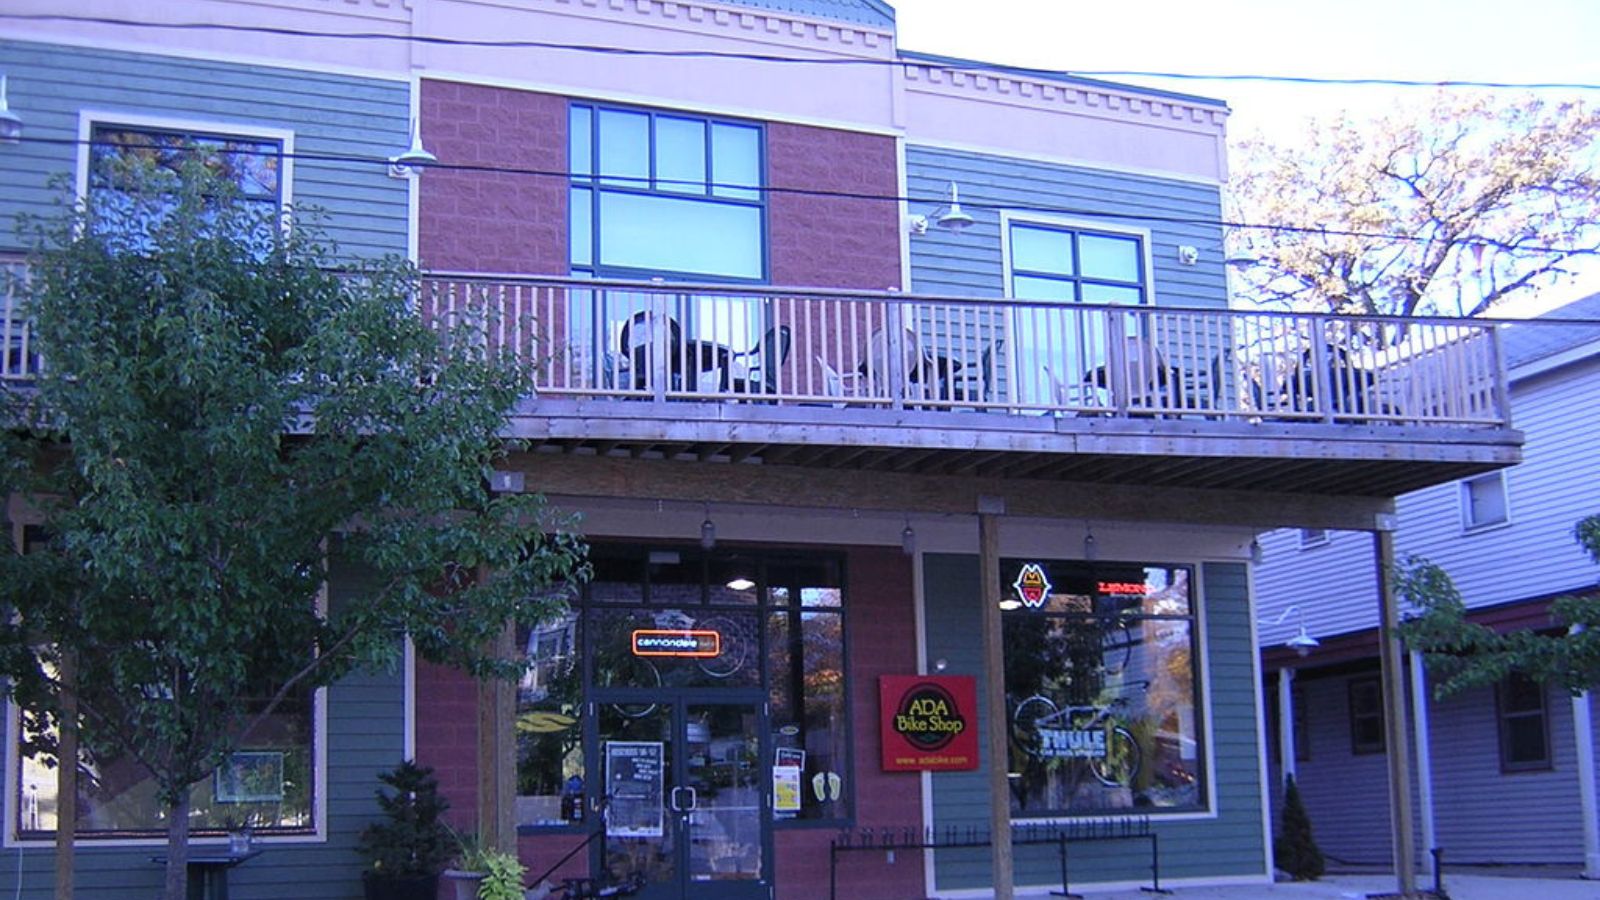
Located in Kent County just southeast of Grand Rapids, Ada represents one of western Michigan’s most prestigious residential communities. This upscale suburb combines natural beauty with convenient access to the Grand Rapids metropolitan area’s employment, cultural, and educational opportunities. Ada is renowned for its excellent schools, well-maintained neighborhoods, and high quality of life that attracts affluent families and professionals throughout the region.
Ada’s real estate market reflects its status as one of the region’s most desirable addresses, with properties typically featuring quality construction, large lots, and proximity to top-rated schools. The community’s strategic location provides easy access to Grand Rapids while maintaining a suburban atmosphere that appeals to families and empty nesters alike. The strong recent price appreciation suggests continued confidence in Ada’s long-term desirability and investment potential.
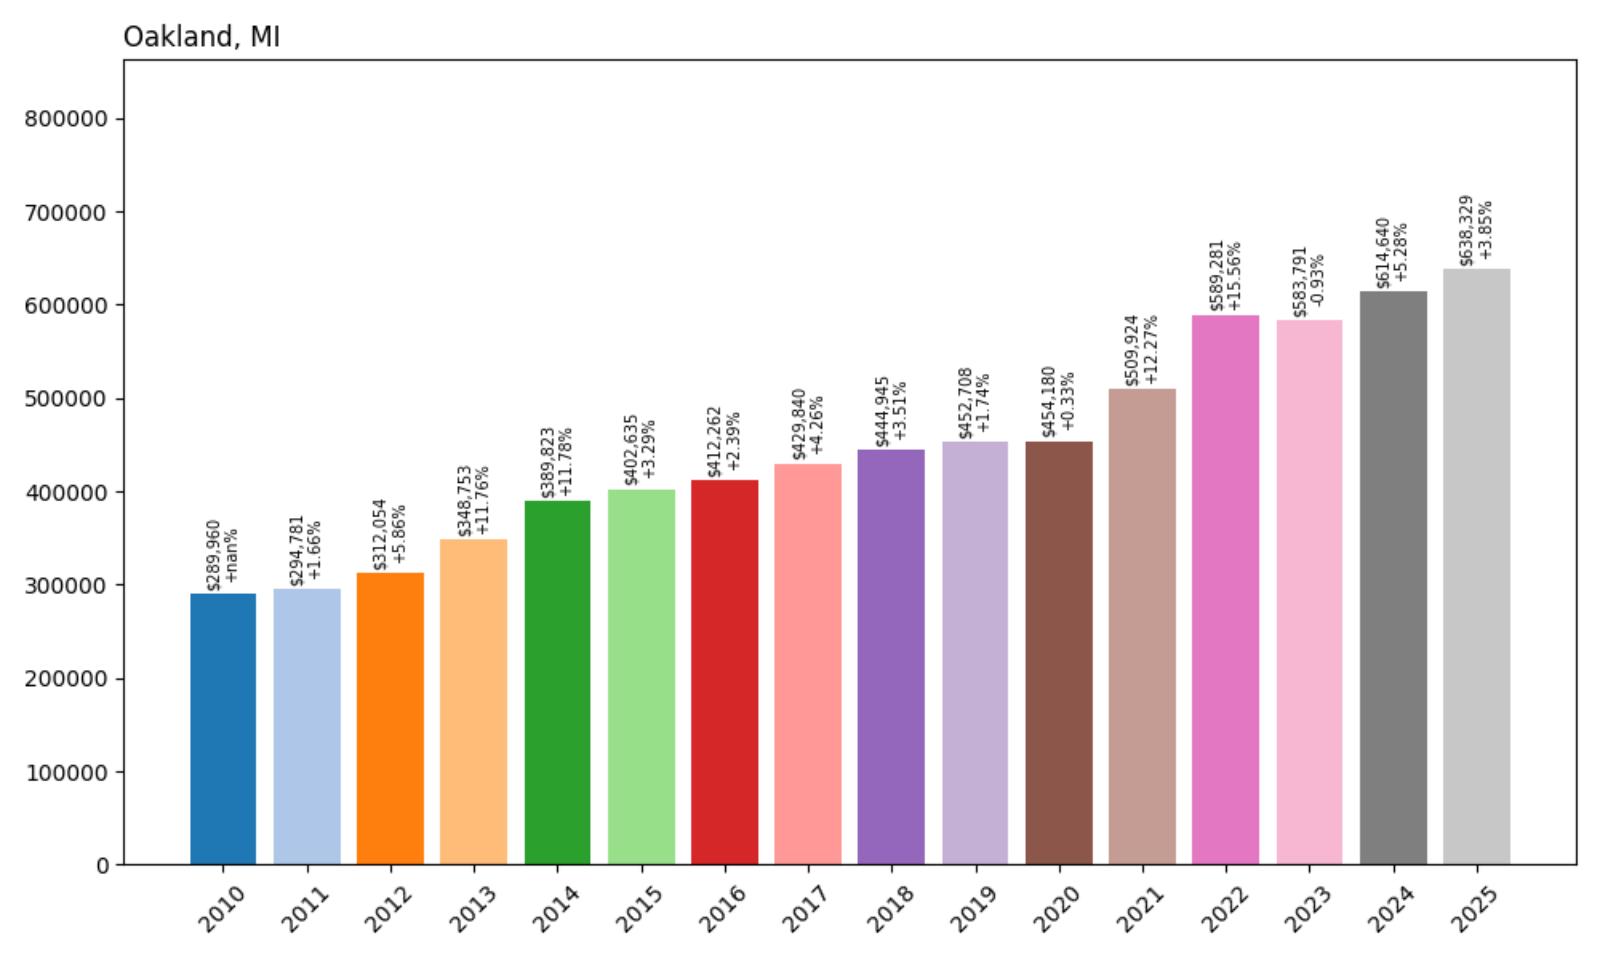
18. Oakland – 120% Home Price Increase Since 2010
🔥 Would you like to save this?
- 2010: $289,960
- 2011: $294,781 (+$4,820, +1.66% from previous year)
- 2012: $312,054 (+$17,273, +5.86% from previous year)
- 2013: $348,753 (+$36,699, +11.76% from previous year)
- 2014: $389,823 (+$41,070, +11.78% from previous year)
- 2015: $402,635 (+$12,812, +3.29% from previous year)
- 2016: $412,262 (+$9,627, +2.39% from previous year)
- 2017: $429,840 (+$17,578, +4.26% from previous year)
- 2018: $444,945 (+$15,105, +3.51% from previous year)
- 2019: $452,708 (+$7,763, +1.74% from previous year)
- 2020: $454,180 (+$1,472, +0.33% from previous year)
- 2021: $509,924 (+$55,744, +12.27% from previous year)
- 2022: $589,281 (+$79,357, +15.56% from previous year)
- 2023: $583,791 (−$5,490, −0.93% from previous year)
- 2024: $614,640 (+$30,849, +5.28% from previous year)
- 2025: $638,329 (+$23,689, +3.85% from previous year)
Oakland has achieved impressive 120% growth since 2010, with the current median price of $638,329 reflecting sustained appreciation over the past 15 years. The community experienced particularly strong growth during 2013-2014, with consecutive double-digit increases that established its premium market position. After steady moderate growth through the late 2010s, the pandemic years brought renewed acceleration, with significant gains in 2021-2022. Despite a brief correction in 2023, the market has resumed healthy growth with solid appreciation continuing through 2025.
Oakland – Oakland County’s Namesake Community
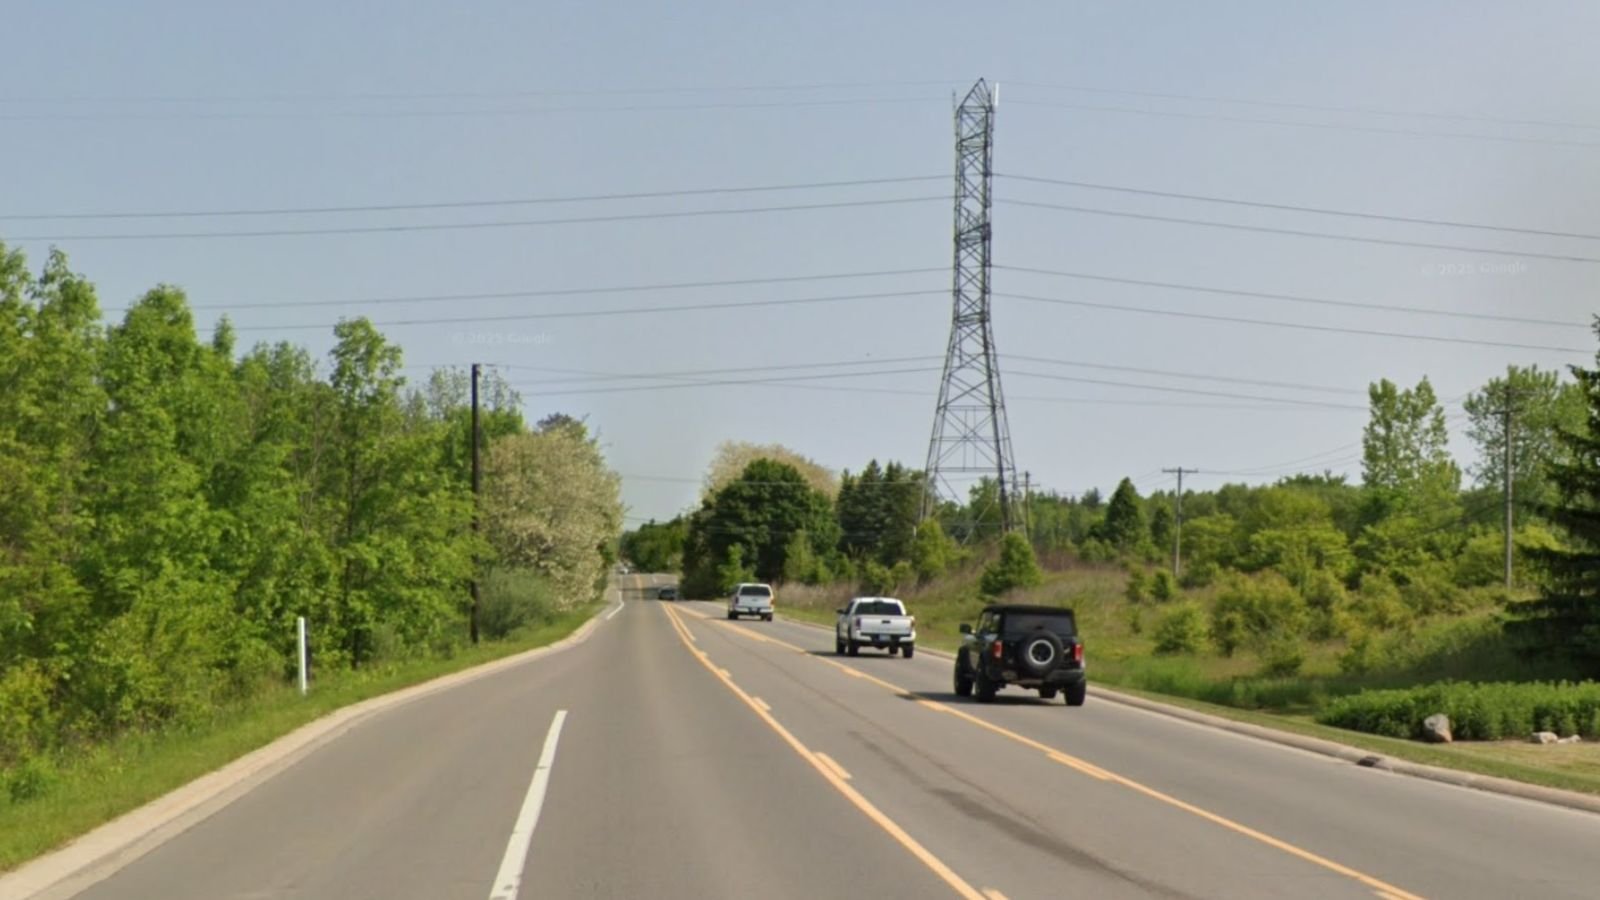
Situated in the heart of Oakland County, this exclusive community represents one of southeastern Michigan’s most prestigious addresses. Oakland benefits from its central location within the county, providing residents with convenient access to Detroit’s employment centers, Birmingham’s upscale shopping, and the recreational opportunities of northern Oakland County. The community’s tree-lined streets and well-maintained properties reflect the high standards expected in one of the region’s most affluent areas.
The real estate market in Oakland is characterized by quality construction, mature landscaping, and properties that reflect the community’s established affluence. Homes in Oakland typically feature generous lots, updated amenities, and architectural details that justify premium prices. The area’s reputation for stability and continued appreciation makes it attractive to buyers seeking long-term value in one of Michigan’s most desirable residential markets.
17. Suttons Bay – 135% Home Price Increase Since 2010
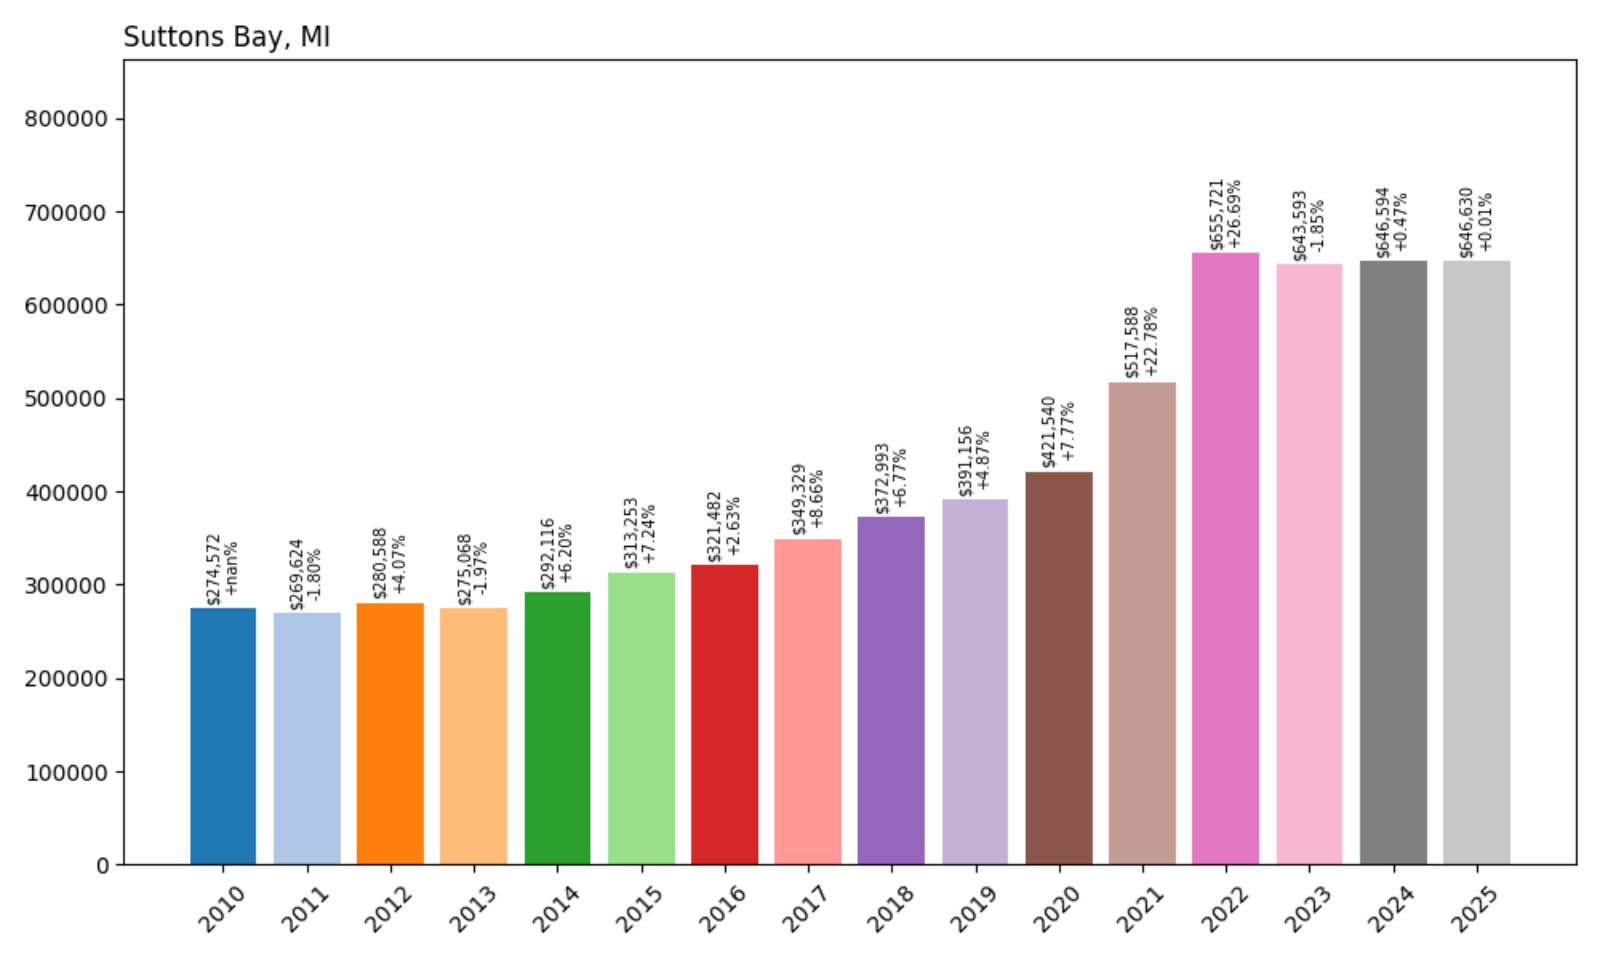
- 2010: $274,572
- 2011: $269,624 (−$4,948, −1.80% from previous year)
- 2012: $280,588 (+$10,964, +4.07% from previous year)
- 2013: $275,068 (−$5,520, −1.97% from previous year)
- 2014: $292,116 (+$17,048, +6.20% from previous year)
- 2015: $313,253 (+$21,137, +7.24% from previous year)
- 2016: $321,482 (+$8,228, +2.63% from previous year)
- 2017: $349,329 (+$27,847, +8.66% from previous year)
- 2018: $372,993 (+$23,664, +6.77% from previous year)
- 2019: $391,156 (+$18,163, +4.87% from previous year)
- 2020: $421,540 (+$30,384, +7.77% from previous year)
- 2021: $517,588 (+$96,048, +22.78% from previous year)
- 2022: $655,721 (+$138,133, +26.69% from previous year)
- 2023: $643,593 (−$12,128, −1.85% from previous year)
- 2024: $646,594 (+$3,001, +0.47% from previous year)
- 2025: $646,630 (+$36, +0.01% from previous year)
Suttons Bay has achieved remarkable 135% growth since 2010, with the current median price of $646,630 reflecting a dramatic transformation in this Leelanau County community. The town showed steady growth through the 2010s, accelerating significantly in 2017 before experiencing explosive pandemic-era increases of 23% in 2021 and 27% in 2022. The market has since stabilized with minimal changes in recent years, suggesting buyers and sellers are finding equilibrium after the dramatic run-up in values.
Suttons Bay – Leelanau Peninsula’s Crown Jewel
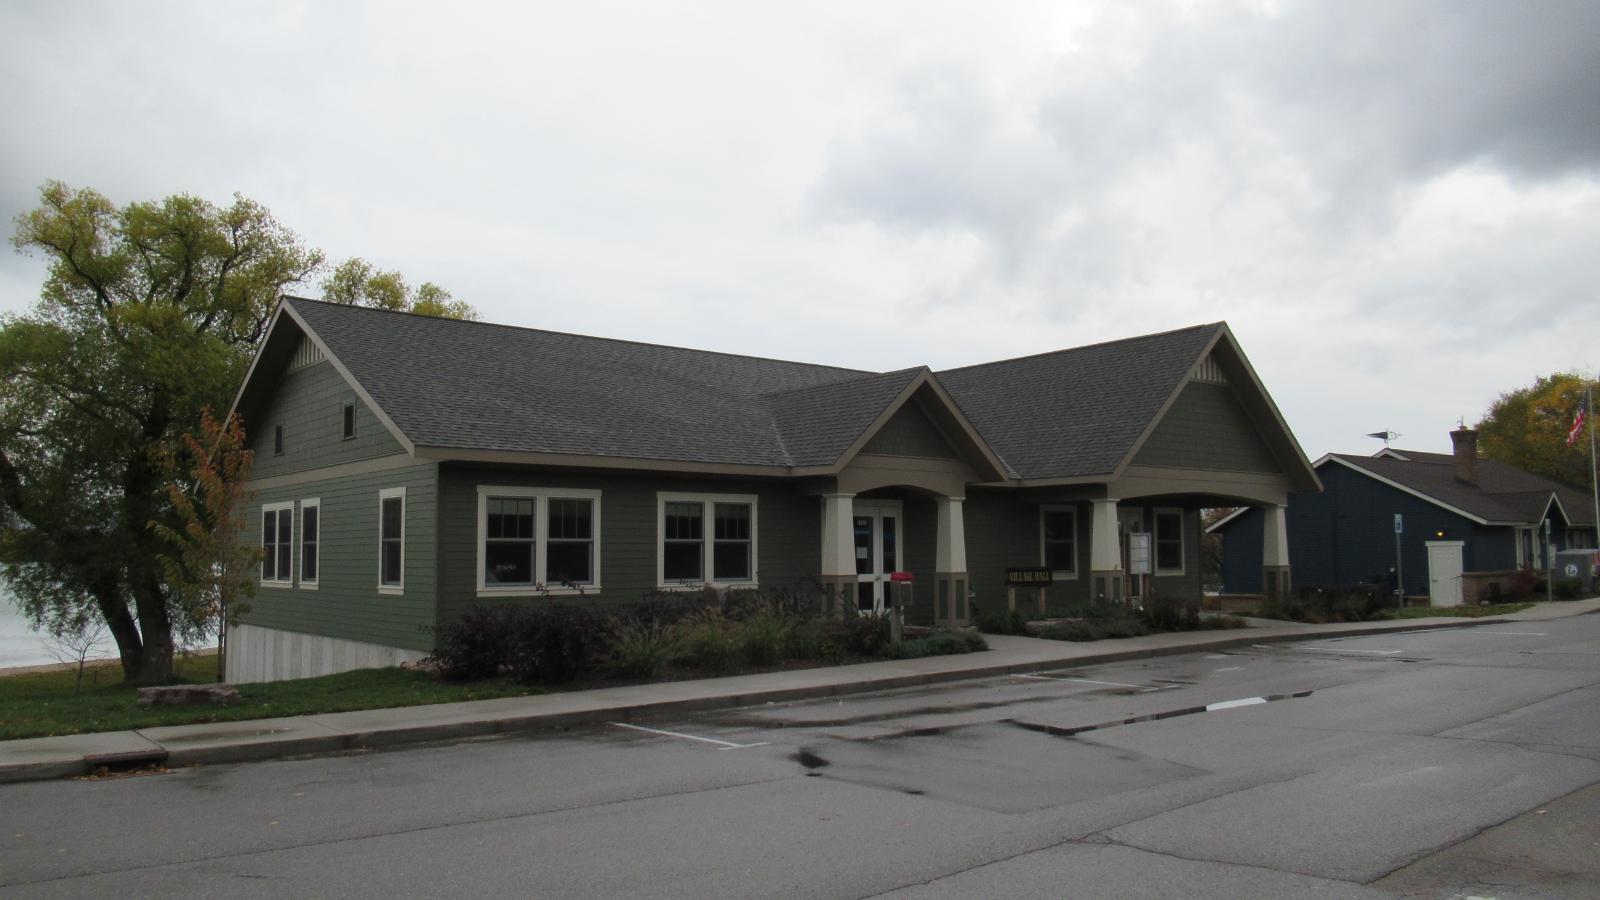
Located on the shores of Grand Traverse Bay in Leelanau County, Suttons Bay combines small-town charm with sophisticated amenities that attract discerning buyers from across the Midwest. This picturesque community of about 600 residents serves as both a year-round home and a premium vacation destination, offering pristine beaches, world-class wineries, and a vibrant downtown district. The town’s location on the Leelanau Peninsula provides easy access to Traverse City while maintaining a distinct identity as one of northern Michigan’s most desirable communities.
The real estate market in Suttons Bay reflects its unique position as a premium resort community with year-round appeal. Properties with water views or proximity to the downtown district command significant premiums, while the area’s limited inventory and geographic constraints create natural scarcity that supports values. The recent market stabilization suggests that rapid pandemic-era appreciation may have reached sustainable levels, though the community’s fundamental appeal ensures continued long-term demand from affluent buyers seeking northern Michigan’s finest residential opportunities.
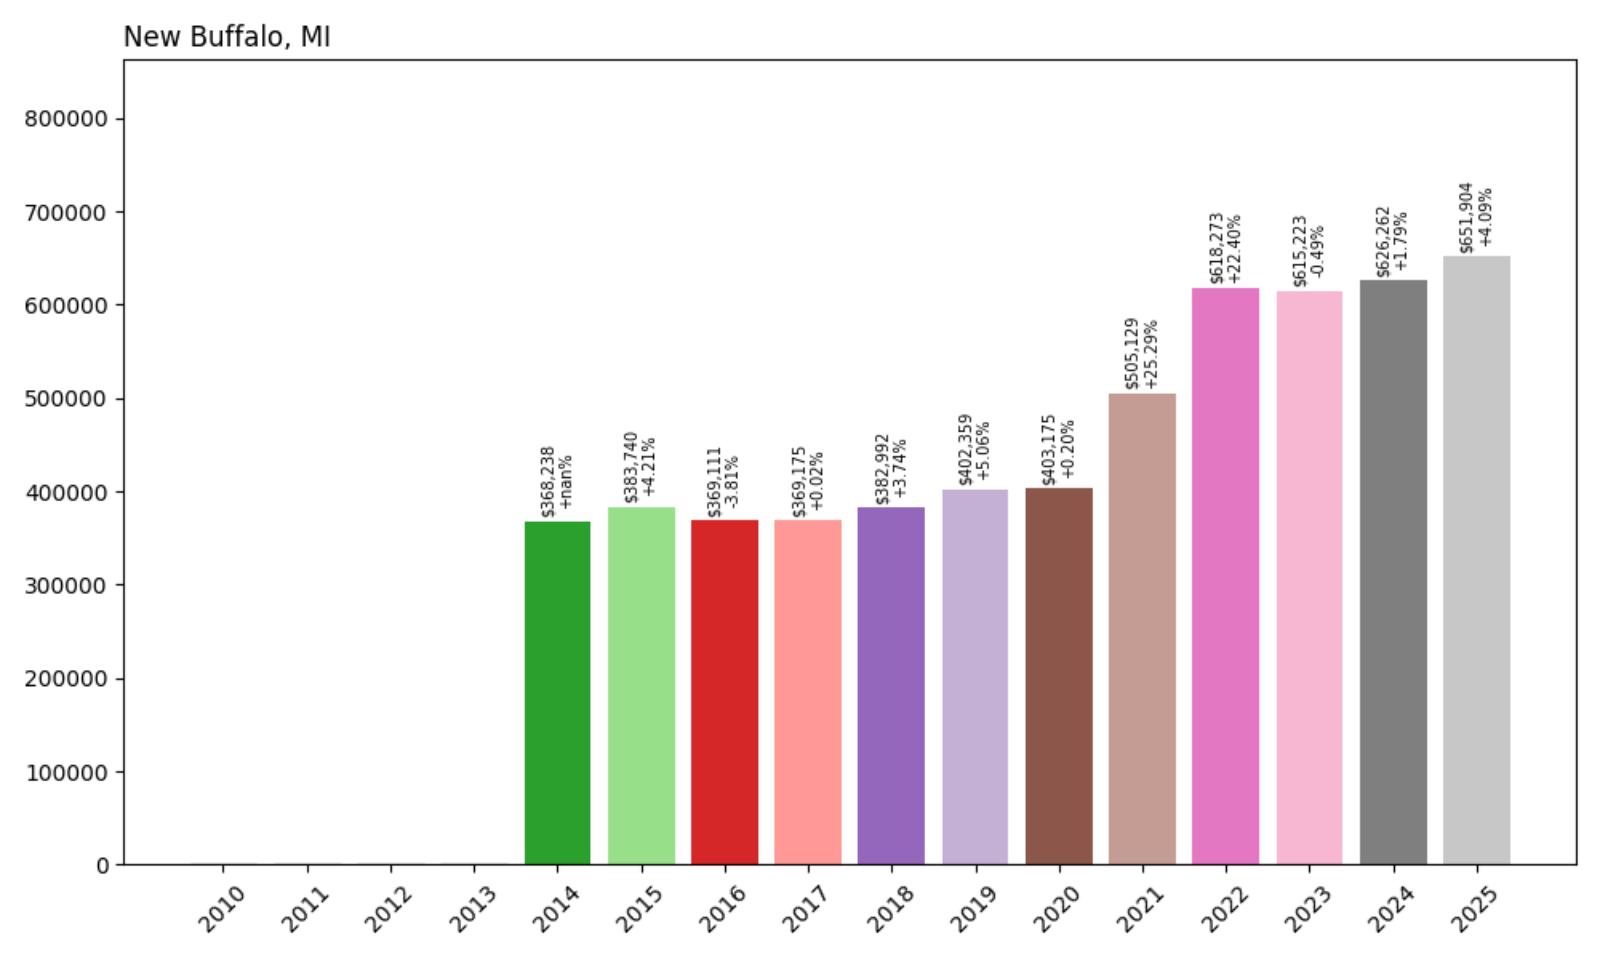
16. New Buffalo – 77% Home Price Increase Since 2014
- 2010: N/A
- 2011: N/A
- 2012: N/A
- 2013: N/A
- 2014: $368,238
- 2015: $383,740 (+$15,501, +4.21% from previous year)
- 2016: $369,111 (−$14,629, −3.81% from previous year)
- 2017: $369,175 (+$64, +0.02% from previous year)
- 2018: $382,992 (+$13,817, +3.74% from previous year)
- 2019: $402,359 (+$19,367, +5.06% from previous year)
- 2020: $403,175 (+$816, +0.20% from previous year)
- 2021: $505,129 (+$101,954, +25.29% from previous year)
- 2022: $618,273 (+$113,144, +22.40% from previous year)
- 2023: $615,223 (−$3,049, −0.49% from previous year)
- 2024: $626,262 (+$11,038, +1.79% from previous year)
- 2025: $651,904 (+$25,642, +4.09% from previous year)
New Buffalo has achieved solid 77% growth since 2014, with the current median price of $651,904 reflecting steady long-term appreciation in this premier Lake Michigan resort community. The town showed modest but consistent growth through the late 2010s before experiencing dramatic pandemic-era acceleration, with spectacular consecutive gains of 25% in 2021 and 22% in 2022. After a brief pause in 2023, the market has resumed healthy growth with solid appreciation continuing through 2025, indicating continued confidence in this established resort destination.
New Buffalo – Harbor Country’s Premier Destination
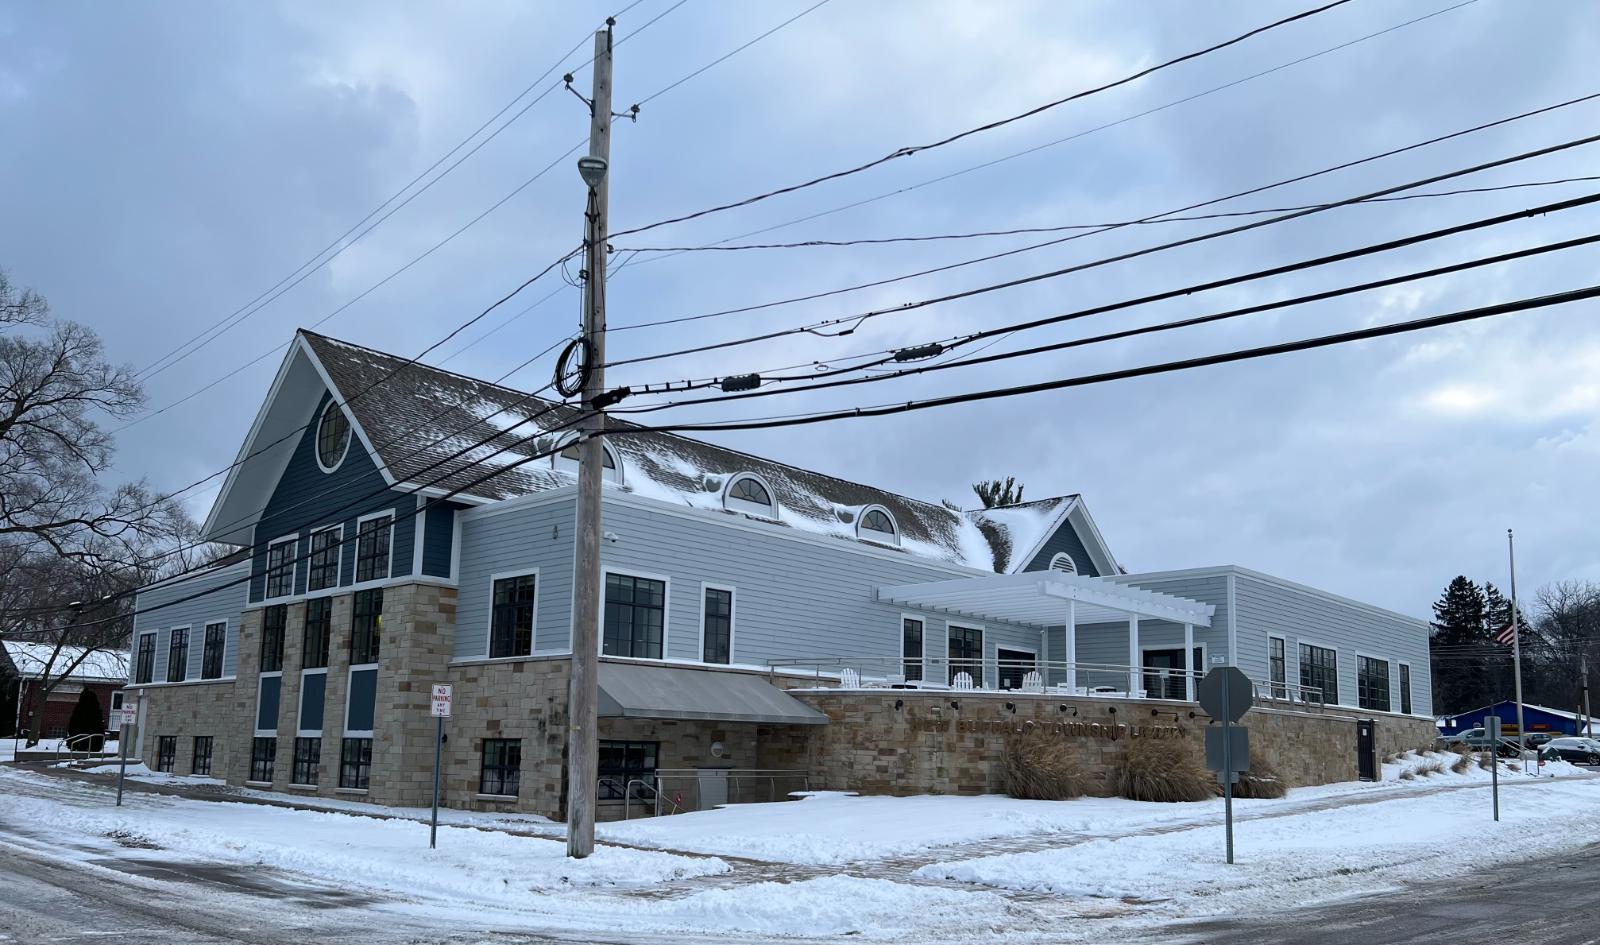
Located along Lake Michigan’s southeastern shore in Berrien County, New Buffalo serves as the crown jewel of Michigan’s “Harbor Country” region. This charming resort community of about 1,900 residents has evolved from a railroad town into one of the Midwest’s premier lakefront destinations, attracting affluent visitors and residents from Chicago, Detroit, and other major metropolitan areas. The town’s pristine beaches, upscale amenities, and convenient location just 90 minutes from Chicago make it particularly popular among urban professionals seeking a lakefront retreat.
New Buffalo’s appeal extends beyond its beautiful beaches to include a revitalized downtown district featuring boutique shops, acclaimed restaurants, and cultural attractions. The community offers world-class amenities including championship golf courses, full-service marinas, and luxury accommodations that cater to sophisticated travelers. The area’s four-season appeal includes summer beach activities, fall color tours, winter sports, and spring recreation that attract visitors and residents year-round.
15. East Grand Rapids – 169% Home Price Increase Since 2010
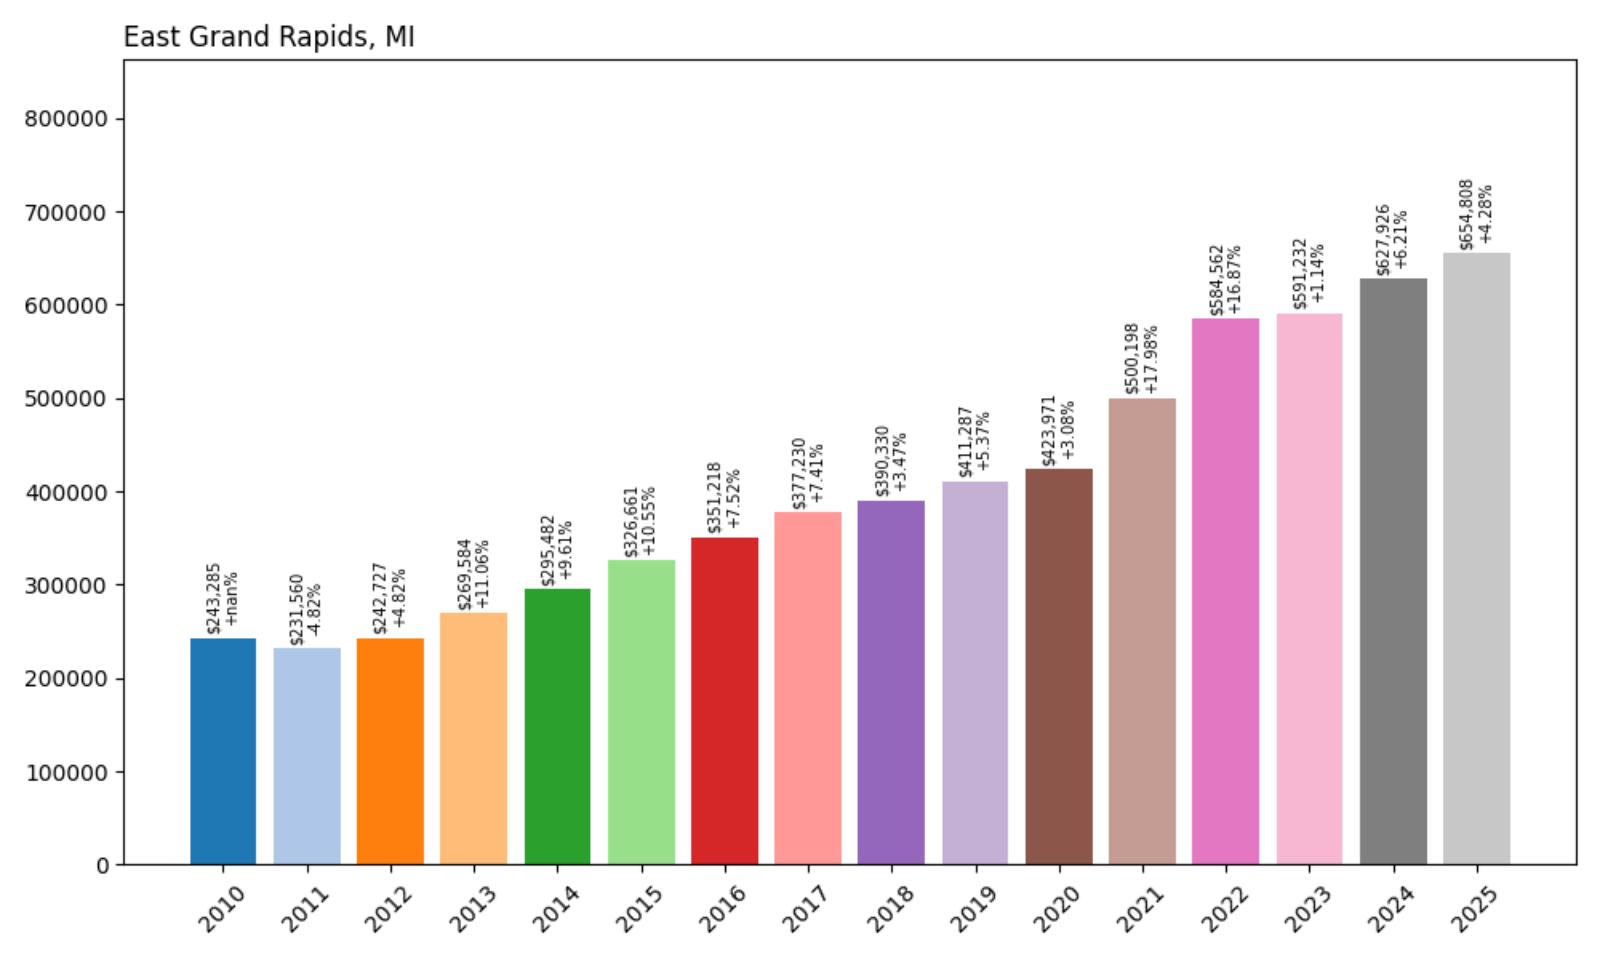
- 2010: $243,285
- 2011: $231,560 (−$11,725, −4.82% from previous year)
- 2012: $242,727 (+$11,167, +4.82% from previous year)
- 2013: $269,584 (+$26,857, +11.06% from previous year)
- 2014: $295,482 (+$25,898, +9.61% from previous year)
- 2015: $326,661 (+$31,179, +10.55% from previous year)
- 2016: $351,218 (+$24,557, +7.52% from previous year)
- 2017: $377,230 (+$26,012, +7.41% from previous year)
- 2018: $390,330 (+$13,100, +3.47% from previous year)
- 2019: $411,287 (+$20,957, +5.37% from previous year)
- 2020: $423,971 (+$12,684, +3.08% from previous year)
- 2021: $500,198 (+$76,227, +17.98% from previous year)
- 2022: $584,562 (+$84,364, +16.87% from previous year)
- 2023: $591,232 (+$6,670, +1.14% from previous year)
- 2024: $627,926 (+$36,693, +6.21% from previous year)
- 2025: $654,808 (+$26,883, +4.28% from previous year)
East Grand Rapids has achieved exceptional 169% growth since 2010, with the current median price of $654,808 reflecting sustained and impressive appreciation over the past 15 years. The community demonstrated remarkable consistency through the 2010s, with particularly strong growth during 2013-2017 when values nearly doubled. The pandemic years brought additional acceleration with solid double-digit gains, and the market has continued healthy growth through 2025 with a robust 4.28% increase, demonstrating continued buyer confidence in this prestigious community.
East Grand Rapids – West Michigan’s Premier Suburb
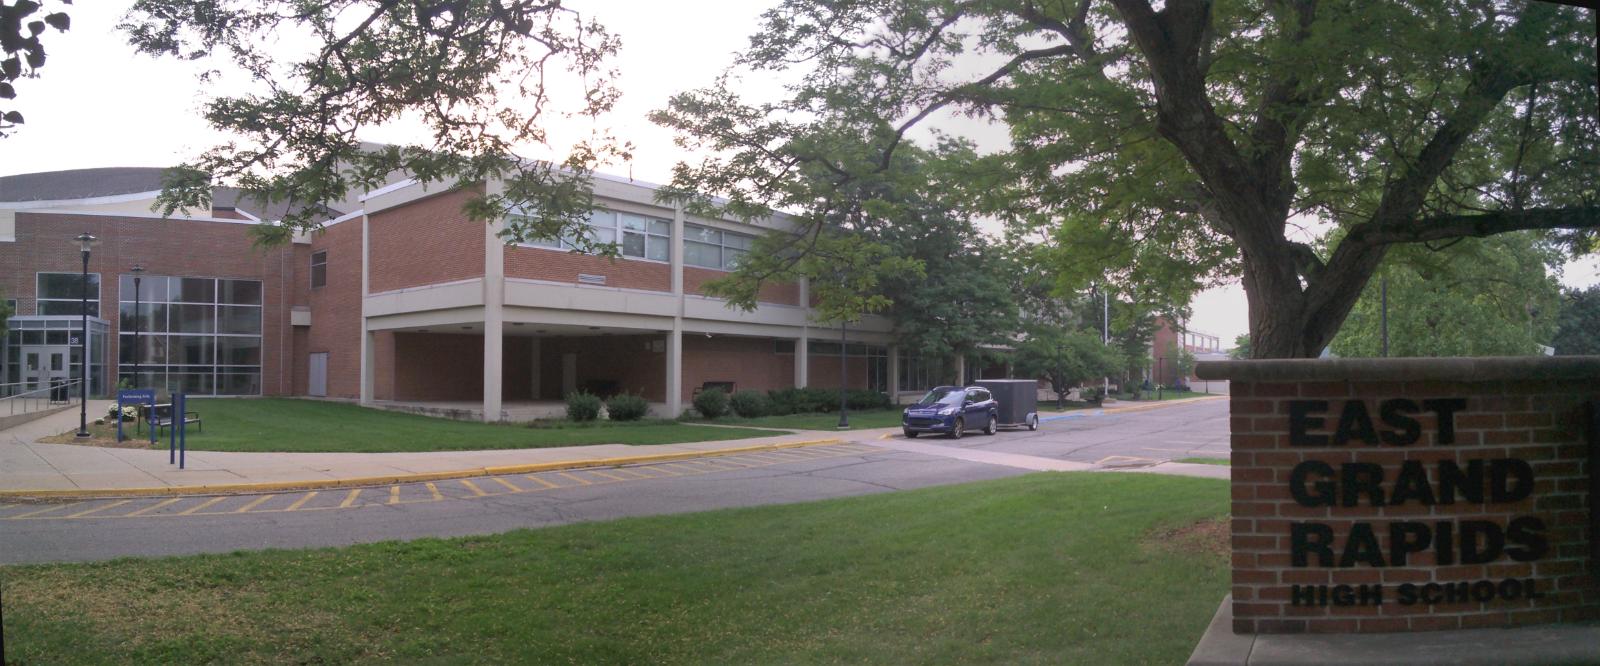
Widely regarded as one of Michigan’s most prestigious suburban communities, East Grand Rapids combines exceptional schools, beautiful neighborhoods, and convenient access to the Grand Rapids metropolitan area. Located in Kent County along Reeds Lake, this exclusive community of about 11,000 residents offers a perfect blend of urban sophistication and suburban tranquility. The city’s tree-lined streets, well-maintained properties, and strong municipal services create an atmosphere that attracts affluent families and professionals throughout western Michigan.
East Grand Rapids is renowned for its outstanding public school system, which consistently ranks among the state’s best and serves as a primary draw for families willing to pay premium prices for quality education. The community’s location provides residents with easy access to Grand Rapids’ thriving downtown district, medical facilities, and employment centers, while maintaining a distinct residential character. The area’s numerous parks, including the popular Reeds Lake area, offer recreation and natural beauty that enhance the community’s appeal.
14. Bloomfield Hills – 121% Home Price Increase Since 2010
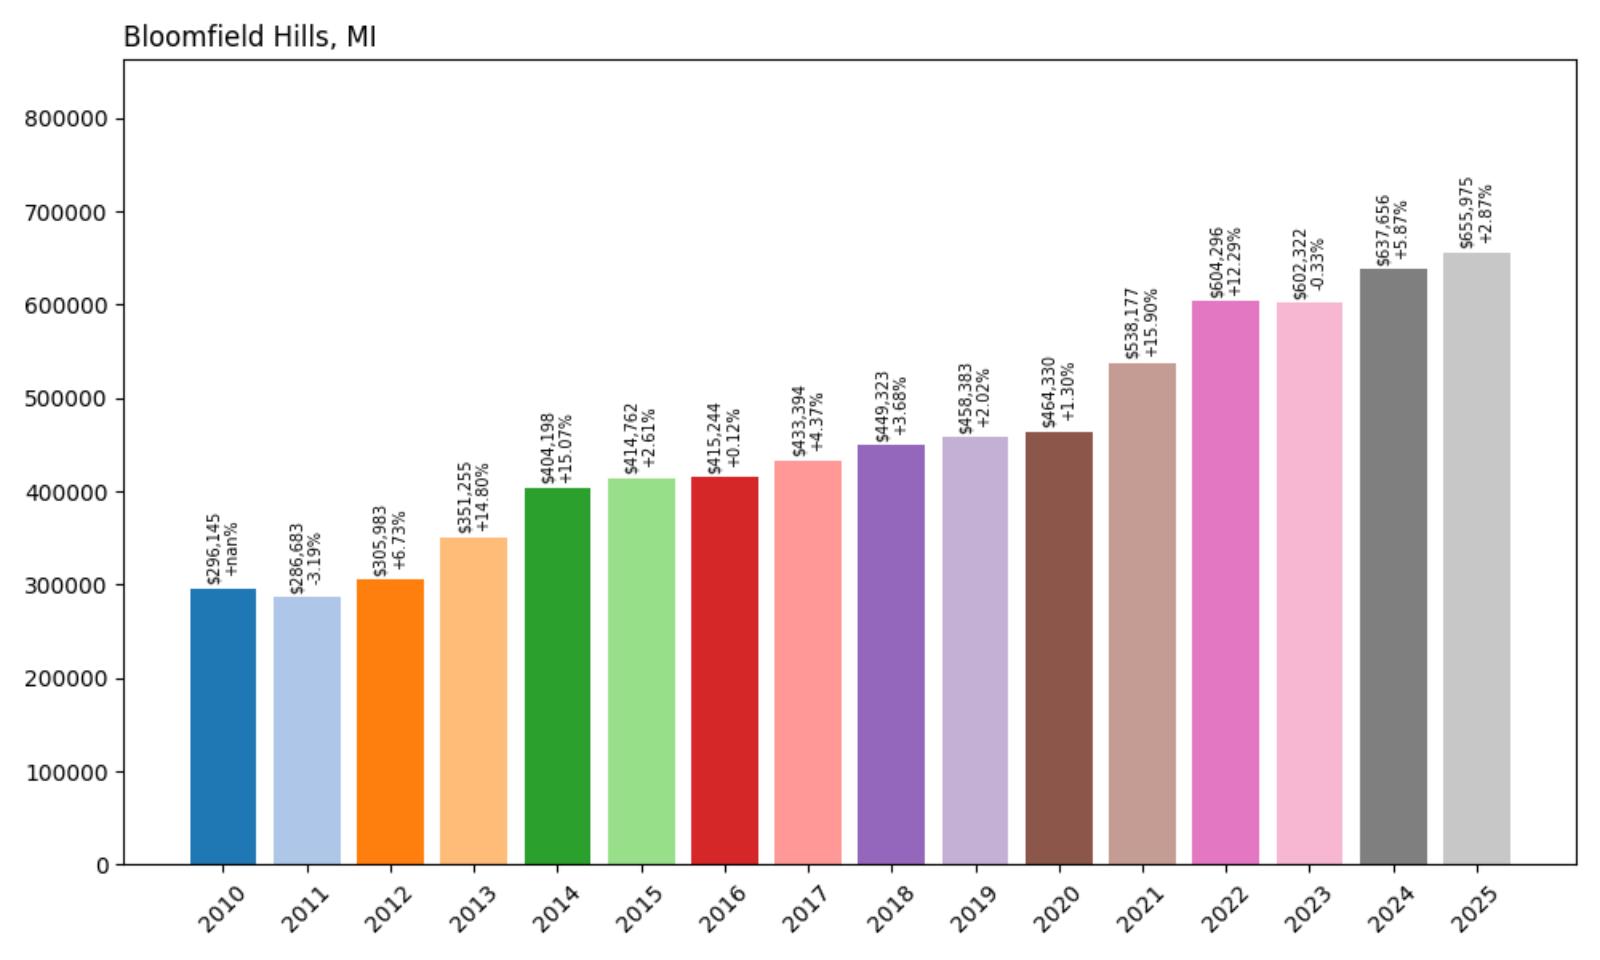
- 2010: $296,145
- 2011: $286,683 (−$9,462, −3.19% from previous year)
- 2012: $305,983 (+$19,299, +6.73% from previous year)
- 2013: $351,255 (+$45,273, +14.80% from previous year)
- 2014: $404,198 (+$52,942, +15.07% from previous year)
- 2015: $414,762 (+$10,564, +2.61% from previous year)
- 2016: $415,244 (+$482, +0.12% from previous year)
- 2017: $433,394 (+$18,150, +4.37% from previous year)
- 2018: $449,323 (+$15,929, +3.68% from previous year)
- 2019: $458,383 (+$9,060, +2.02% from previous year)
- 2020: $464,330 (+$5,948, +1.30% from previous year)
- 2021: $538,177 (+$73,847, +15.90% from previous year)
- 2022: $604,296 (+$66,119, +12.29% from previous year)
- 2023: $602,322 (−$1,974, −0.33% from previous year)
- 2024: $637,656 (+$35,333, +5.87% from previous year)
- 2025: $655,975 (+$18,319, +2.87% from previous year)
Bloomfield Hills has achieved solid 121% growth since 2010, with the current median price of $655,975 reflecting steady long-term appreciation in this internationally recognized luxury community. The city experienced explosive growth during 2013-2014, with consecutive years of 15% appreciation that established its position among Michigan’s premier markets. After a period of moderate growth through the late 2010s, the pandemic years brought renewed momentum with strong gains in 2021-2022, and the market has continued healthy appreciation through 2025.
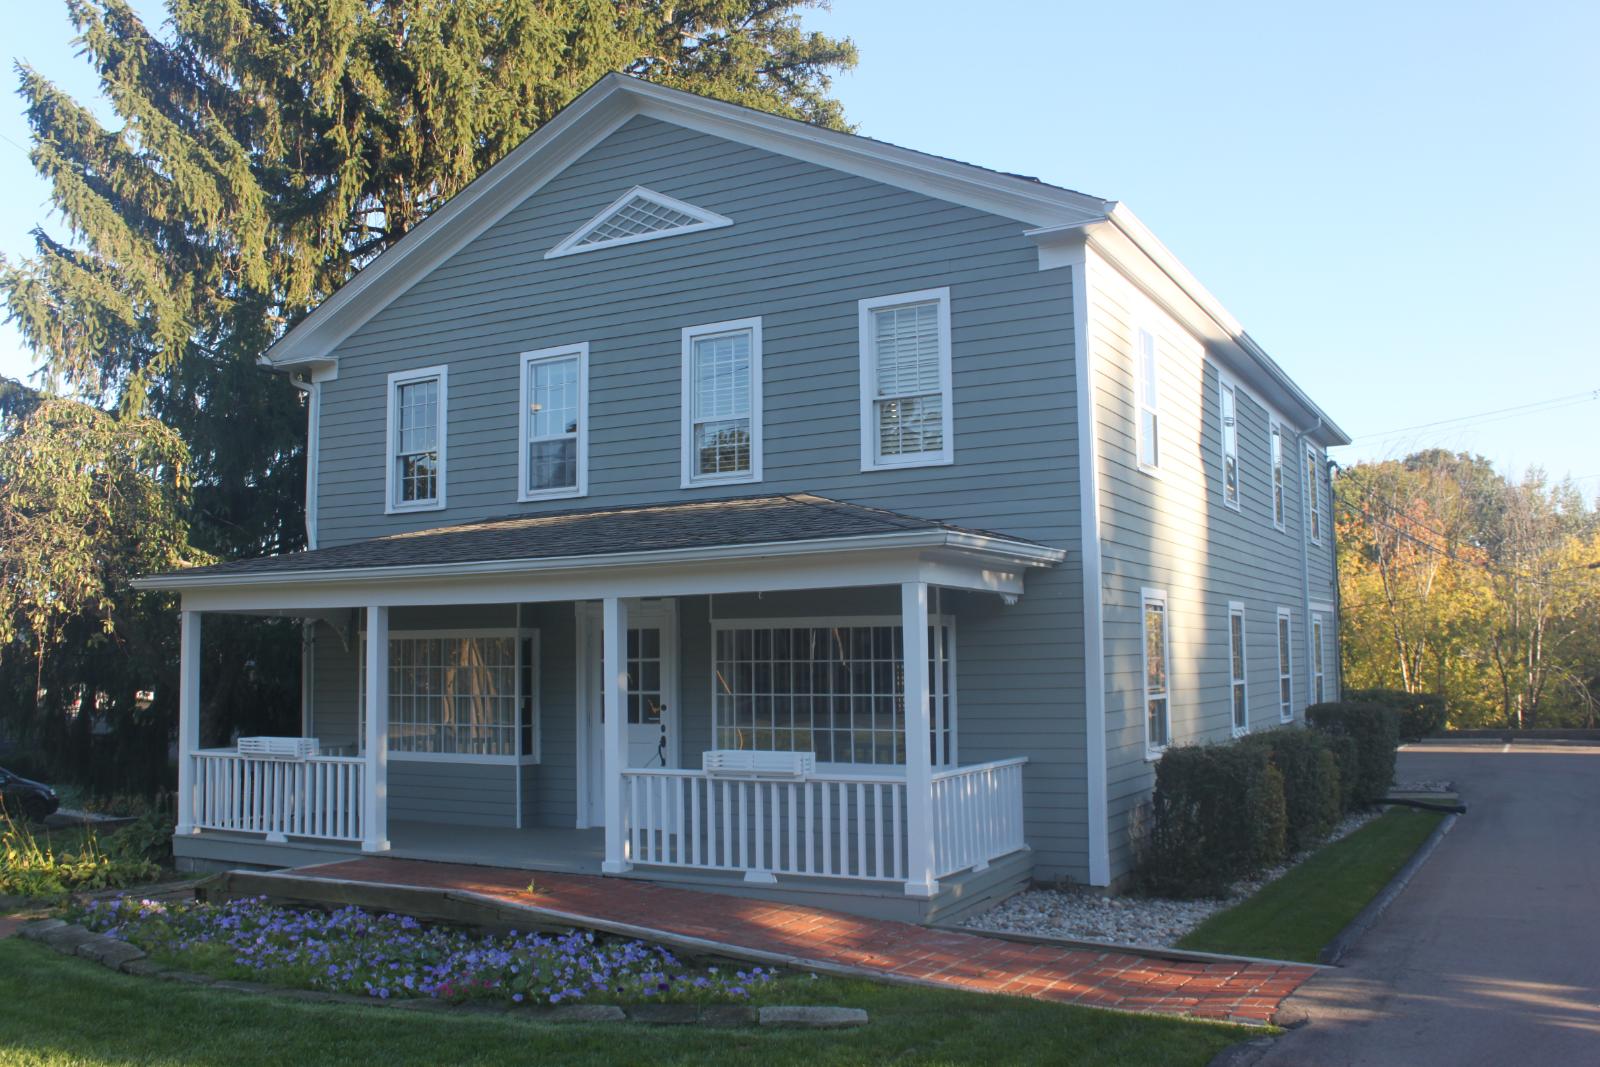
Bloomfield Hills – Michigan’s Beverly Hills
🔥 Would you like to save this?
Often compared to Beverly Hills for its concentration of wealth and luxury, Bloomfield Hills represents the pinnacle of Michigan residential real estate. Located in Oakland County about 20 miles northwest of Detroit, this exclusive community of approximately 3,800 residents is home to some of the state’s most impressive estates and successful business leaders. The city’s rolling hills, mature trees, and meticulously maintained properties create a park-like atmosphere that has attracted affluent residents for generations.
The real estate market in Bloomfield Hills features some of Michigan’s most valuable properties, with many homes situated on multi-acre parcels that provide privacy and exclusivity. The community’s strict zoning regulations and large minimum lot sizes ensure that property values remain stable while preserving the area’s character. Properties in prime locations or with unique architectural significance can command prices well above the median, reflecting the community’s status as Michigan’s most prestigious residential address and its continued appeal to the state’s most successful residents.
13. Douglas – 127% Home Price Increase Since 2010
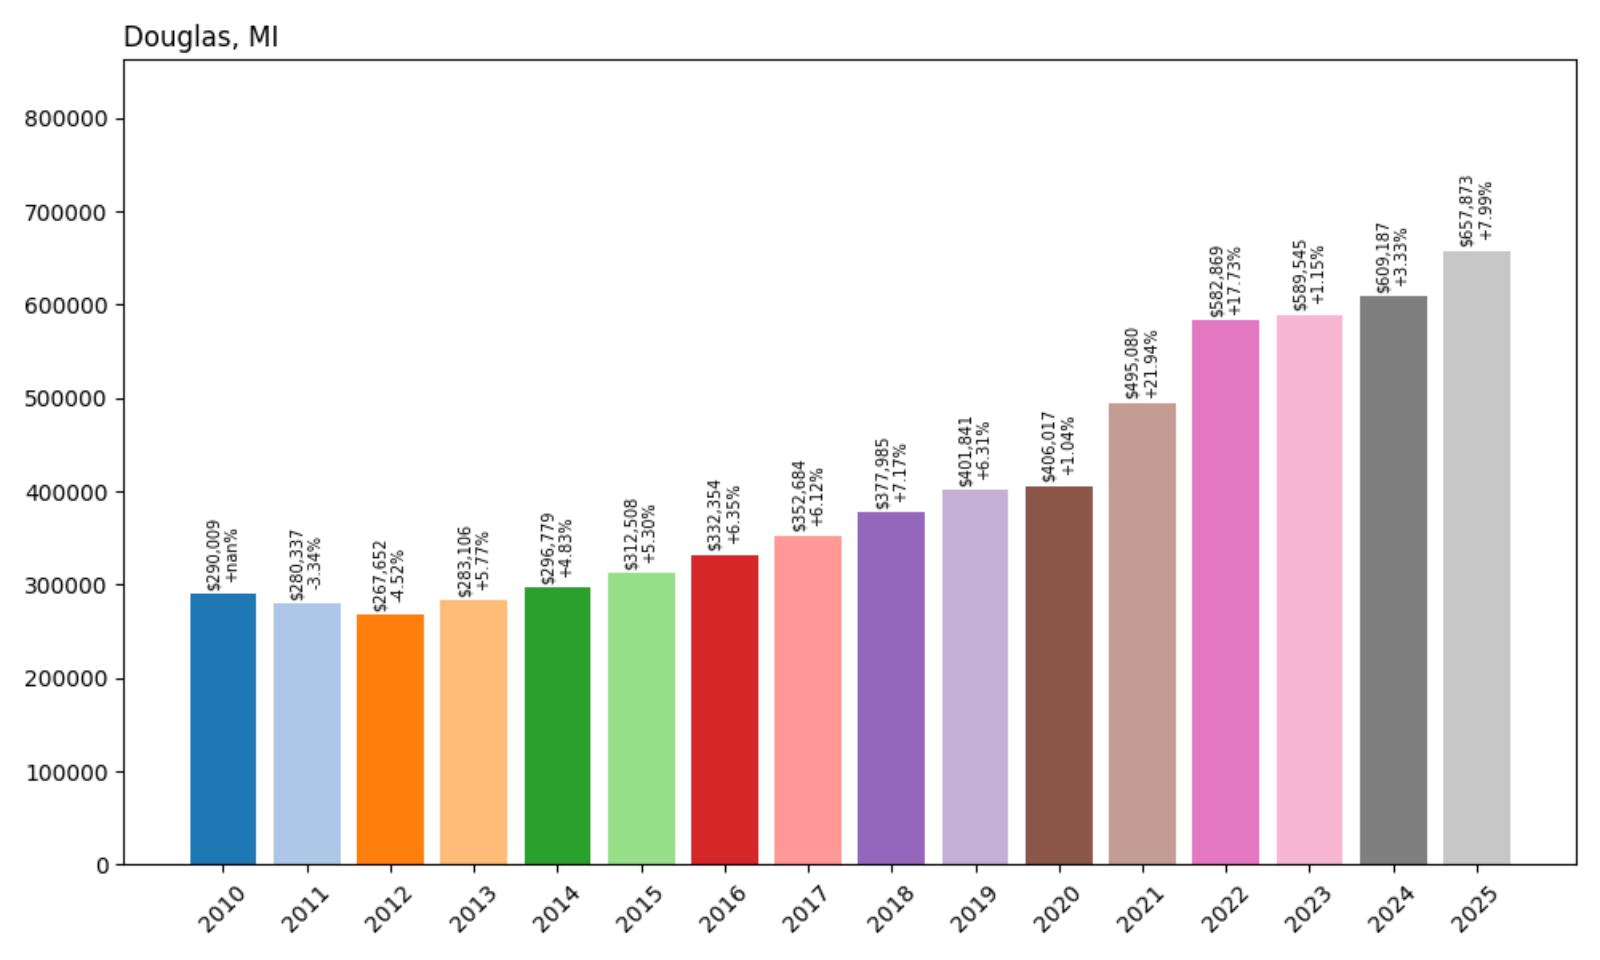
- 2010: $290,009
- 2011: $280,337 (−$9,672, −3.34% from previous year)
- 2012: $267,652 (−$12,684, −4.52% from previous year)
- 2013: $283,106 (+$15,453, +5.77% from previous year)
- 2014: $296,779 (+$13,673, +4.83% from previous year)
- 2015: $312,508 (+$15,730, +5.30% from previous year)
- 2016: $332,354 (+$19,846, +6.35% from previous year)
- 2017: $352,684 (+$20,330, +6.12% from previous year)
- 2018: $377,985 (+$25,301, +7.17% from previous year)
- 2019: $401,841 (+$23,857, +6.31% from previous year)
- 2020: $406,017 (+$4,176, +1.04% from previous year)
- 2021: $495,080 (+$89,063, +21.94% from previous year)
- 2022: $582,869 (+$87,789, +17.73% from previous year)
- 2023: $589,545 (+$6,676, +1.15% from previous year)
- 2024: $609,187 (+$19,642, +3.33% from previous year)
- 2025: $657,873 (+$48,686, +7.99% from previous year)
Douglas has achieved impressive 127% growth since 2010, with the current median price of $657,873 reflecting remarkable resilience and appreciation over the past 15 years. After weathering declines in the early 2010s, the community found solid footing around 2013 and maintained consistent 5-7% annual growth through 2020. The pandemic years brought explosive appreciation with back-to-back increases exceeding 17%, and 2025 has seen particularly strong growth of nearly 8%, indicating continued robust demand for this Lake Michigan resort community.
Douglas – Saugatuck’s Sophisticated Sister City
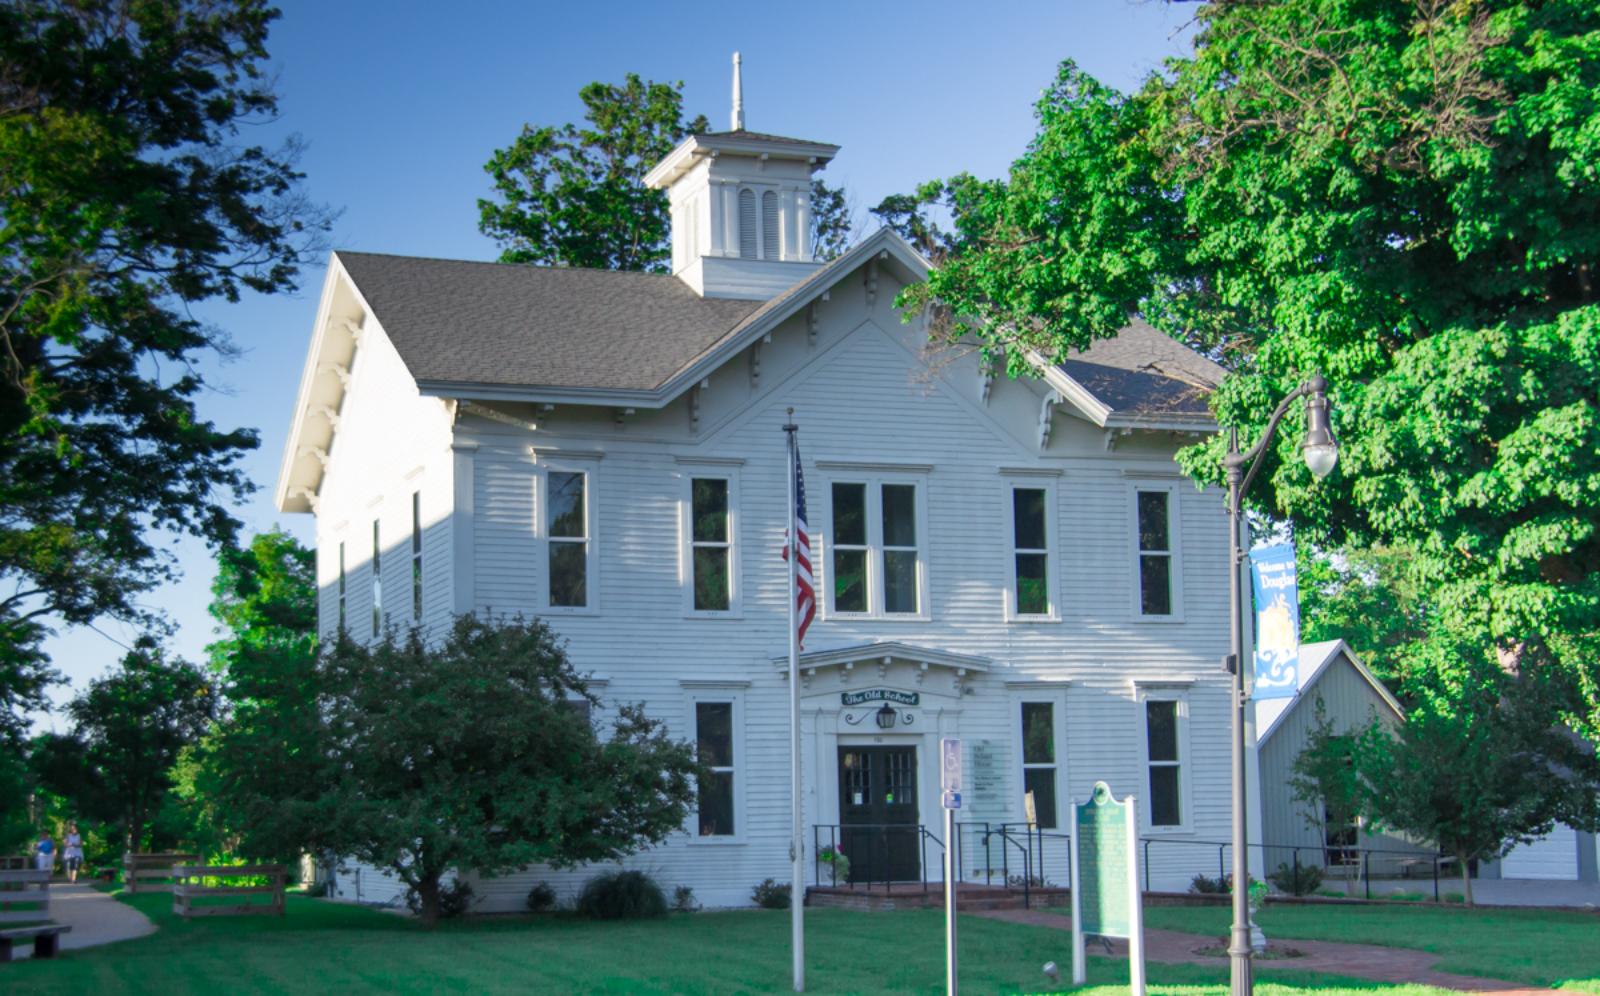
Located directly across the Kalamazoo River from Saugatuck, Douglas forms the other half of one of Michigan’s most celebrated resort destinations. This charming lakefront community in Allegan County offers a more residential atmosphere than its famous neighbor while providing equal access to pristine Lake Michigan beaches, cultural attractions, and recreational opportunities. Douglas attracts discerning buyers who appreciate its quieter character while remaining close to Saugatuck’s vibrant arts scene and tourist amenities.
Douglas’s real estate market reflects its evolution into a premium destination for affluent buyers seeking lakefront luxury in a more residential setting. Properties with water access or views command significant premiums, while the community’s limited development opportunities create natural scarcity that supports appreciation. The strong recent price growth, particularly the 8% increase in 2025, suggests continued confidence in Douglas as both a recreational destination and a sound real estate investment in Michigan’s competitive resort market.
12. Birmingham – 135% Home Price Increase Since 2010
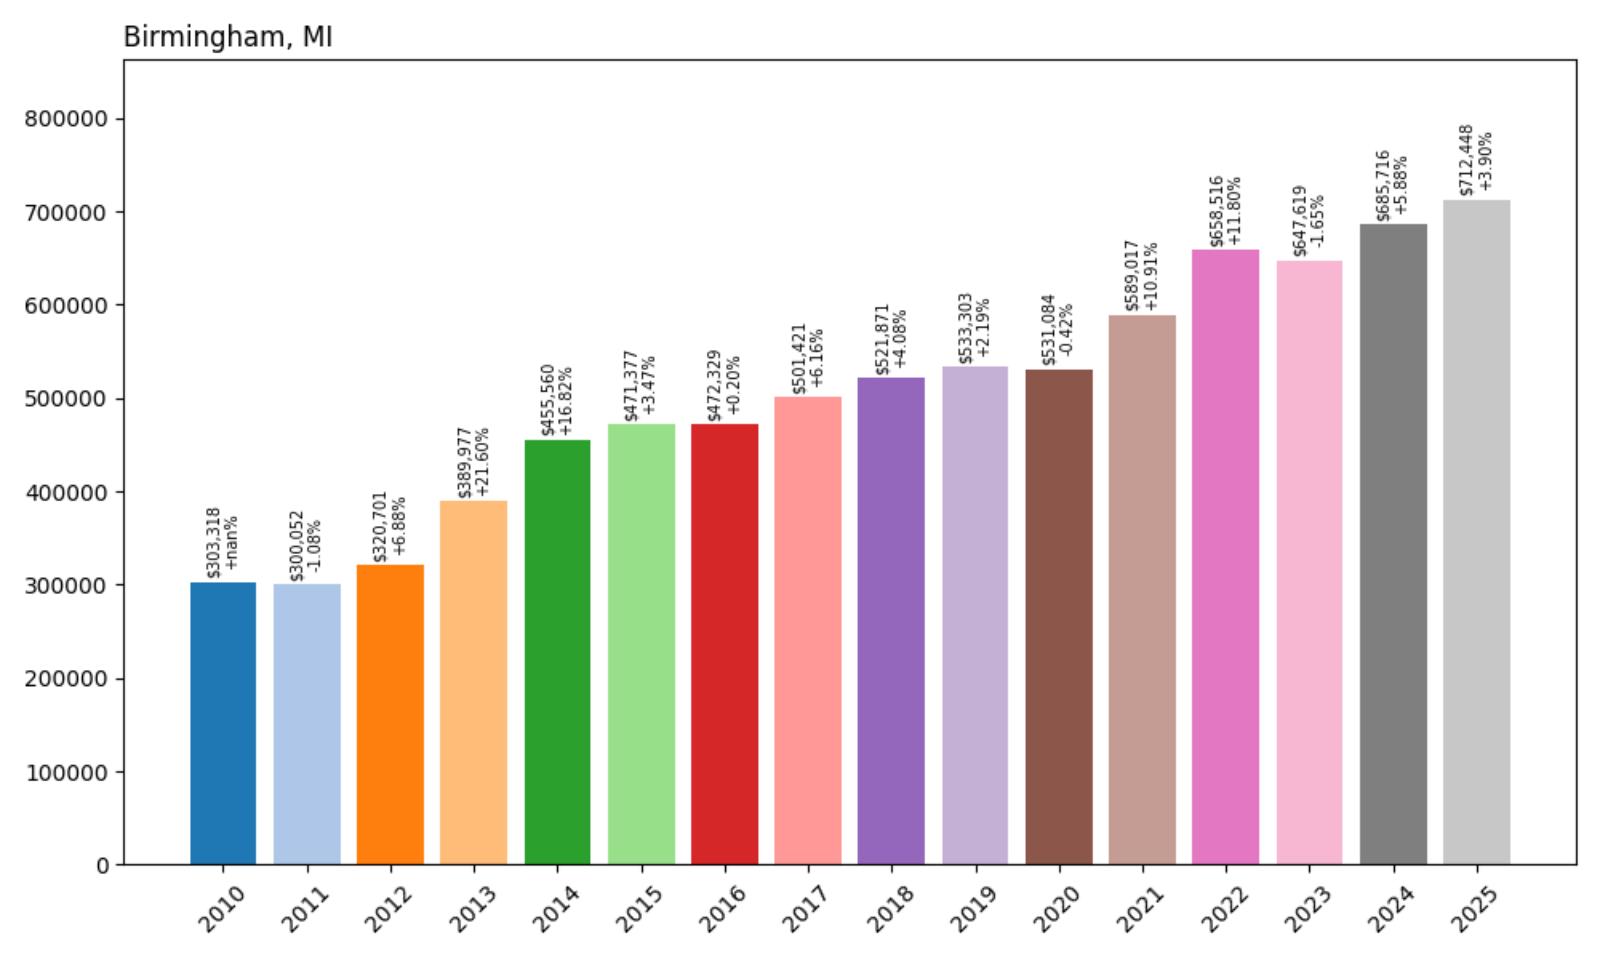
- 2010: $303,318
- 2011: $300,052 (−$3,266, −1.08% from previous year)
- 2012: $320,701 (+$20,648, +6.88% from previous year)
- 2013: $389,977 (+$69,276, +21.60% from previous year)
- 2014: $455,560 (+$65,583, +16.82% from previous year)
- 2015: $471,377 (+$15,817, +3.47% from previous year)
- 2016: $472,329 (+$953, +0.20% from previous year)
- 2017: $501,421 (+$29,092, +6.16% from previous year)
- 2018: $521,871 (+$20,450, +4.08% from previous year)
- 2019: $533,303 (+$11,432, +2.19% from previous year)
- 2020: $531,084 (−$2,220, −0.42% from previous year)
- 2021: $589,017 (+$57,933, +10.91% from previous year)
- 2022: $658,516 (+$69,499, +11.80% from previous year)
- 2023: $647,619 (−$10,897, −1.65% from previous year)
- 2024: $685,716 (+$38,098, +5.88% from previous year)
- 2025: $712,448 (+$26,732, +3.90% from previous year)
Birmingham has demonstrated exceptional growth of 135% since 2010, with the current median price of $712,448 reflecting its transformation into one of Michigan’s premier residential markets. The community experienced explosive growth during 2013-2014, with consecutive years of over 20% and 16% appreciation that established its luxury market position. After steady growth through the late 2010s, the pandemic years brought renewed acceleration with solid double-digit gains, and the market has maintained strong momentum through 2025 with healthy 3.90% appreciation.
Birmingham – Oakland County’s Urban Jewel
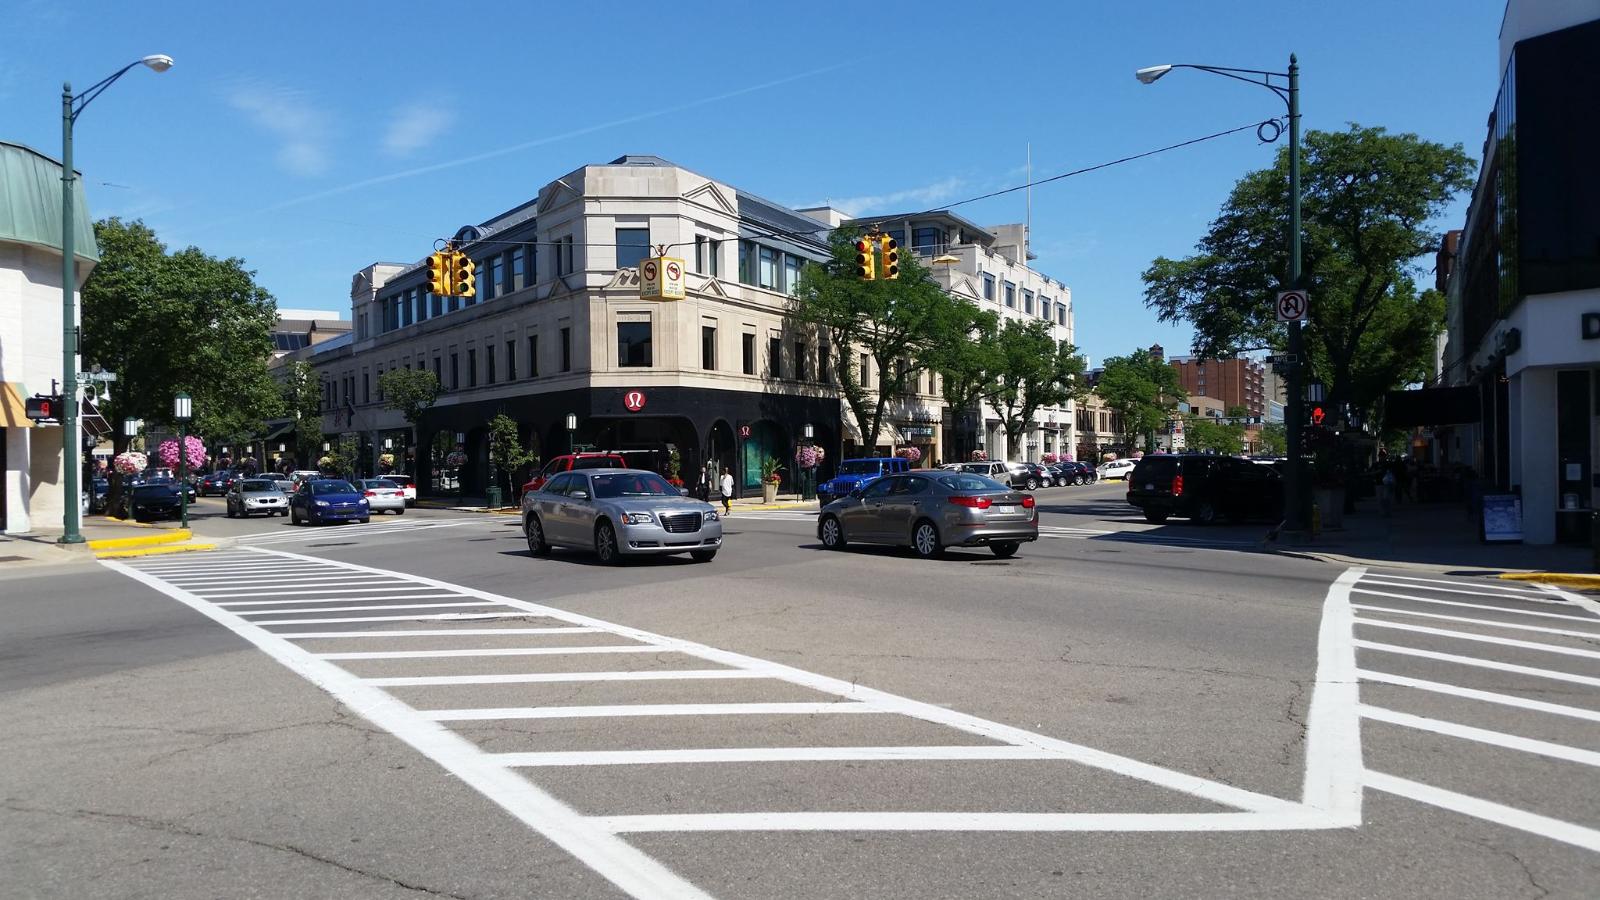
Recognized as one of America’s premier small cities, Birmingham combines sophisticated urban amenities with the charm of a walkable downtown district. Located in Oakland County just 20 miles north of Detroit, this affluent community of about 21,000 residents offers an unparalleled combination of upscale shopping, fine dining, cultural attractions, and residential neighborhoods. Birmingham’s downtown district features over 300 boutiques, galleries, and restaurants, creating a vibrant atmosphere that attracts residents and visitors from throughout the metropolitan area.
The real estate market in Birmingham reflects its status as one of the Midwest’s most desirable small cities, with properties benefiting from the community’s walkable downtown, excellent schools, and prestigious reputation. Homes within walking distance of the downtown district or in the city’s most established neighborhoods command particular premiums, while the area’s limited inventory and continued development of luxury condominiums and townhomes support sustained appreciation. Birmingham’s combination of urban sophistication and suburban comfort continues to attract discerning buyers seeking the finest in metropolitan living.
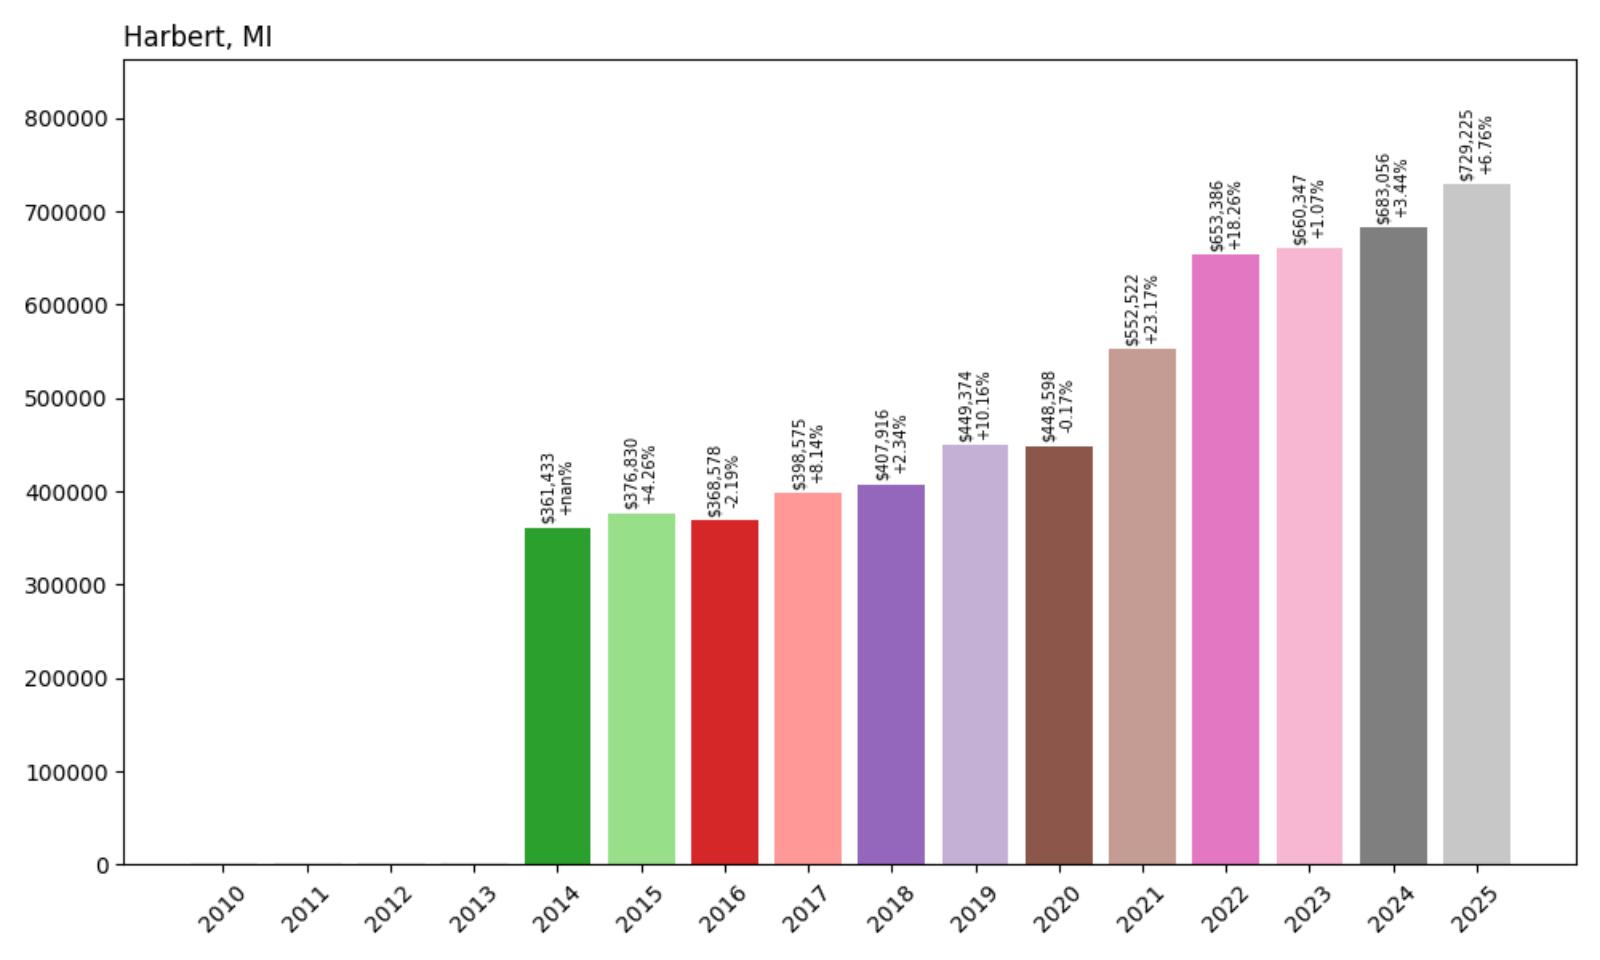
11. Harbert – 102% Home Price Increase Since 2014
- 2010: N/A
- 2011: N/A
- 2012: N/A
- 2013: N/A
- 2014: $361,433
- 2015: $376,830 (+$15,397, +4.26% from previous year)
- 2016: $368,578 (−$8,252, −2.19% from previous year)
- 2017: $398,575 (+$29,998, +8.14% from previous year)
- 2018: $407,916 (+$9,341, +2.34% from previous year)
- 2019: $449,374 (+$41,458, +10.16% from previous year)
- 2020: $448,598 (−$776, −0.17% from previous year)
- 2021: $552,522 (+$103,924, +23.17% from previous year)
- 2022: $653,386 (+$100,864, +18.26% from previous year)
- 2023: $660,347 (+$6,960, +1.07% from previous year)
- 2024: $683,056 (+$22,709, +3.44% from previous year)
- 2025: $729,225 (+$46,169, +6.76% from previous year)
Harbert has achieved solid 102% growth since 2014, with the current median price of $729,225 reflecting steady long-term appreciation in this exclusive Lake Michigan community. The town showed consistent growth through the late 2010s, accelerating significantly in 2019 before experiencing explosive pandemic-era increases of 23% in 2021 and 18% in 2022. The market has maintained strong momentum through 2025 with a robust 6.76% increase, indicating continued confidence in this premium Harbor Country destination.
Harbert – Harbor Country’s Hidden Luxury
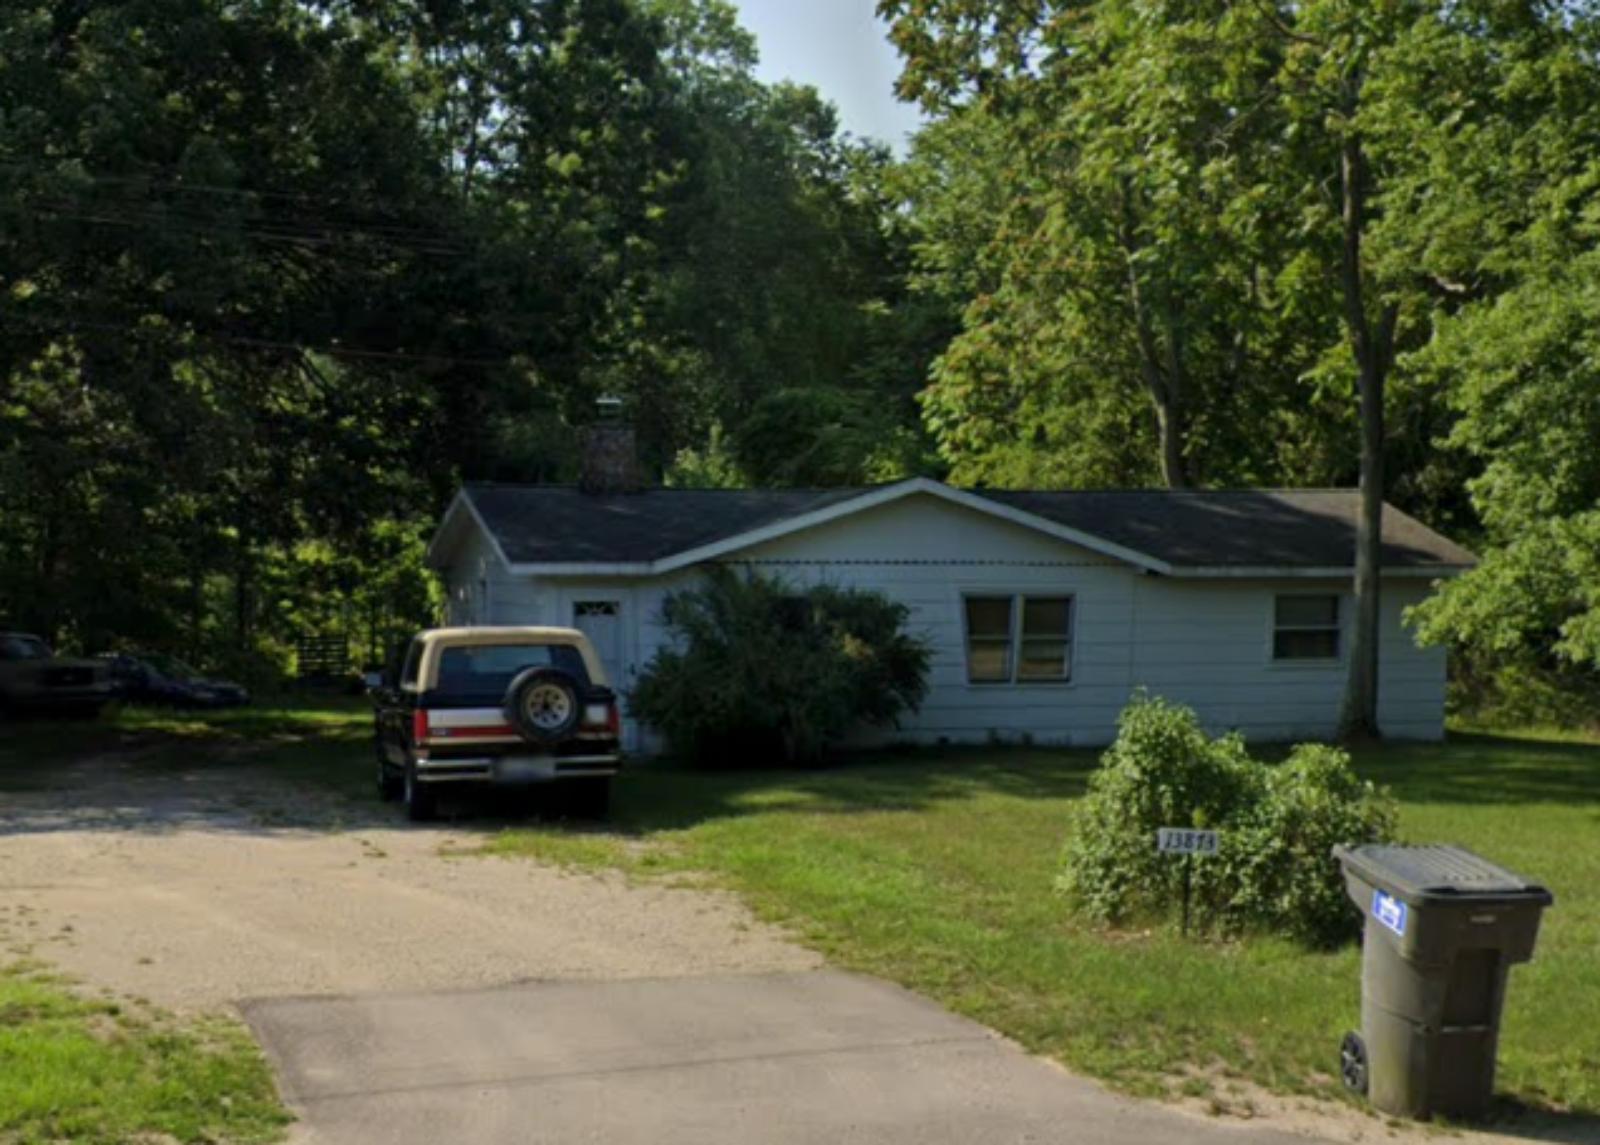
Located in Berrien County along Lake Michigan’s pristine shoreline, Harbert represents one of Harbor Country’s most exclusive and sought-after communities. This small lakefront enclave attracts affluent buyers from Chicago, Detroit, and other major metropolitan areas who seek a more secluded alternative to the region’s busier resort towns. Harbert’s appeal lies in its combination of spectacular natural beauty, privacy, and proximity to the cultural and recreational amenities that define southwestern Michigan’s resort corridor.
The community benefits from its location among the towering sand dunes and pristine beaches that characterize this stretch of Lake Michigan coastline. Harbert offers residents and visitors access to some of the Great Lakes’ most beautiful and unspoiled natural areas, including Warren Dunes State Park and numerous private beach communities. The area’s proximity to New Buffalo, St. Joseph, and other Harbor Country destinations provides convenient access to upscale dining, shopping, and entertainment while maintaining a peaceful residential atmosphere.
10. Grosse Pointe Shores – 157% Home Price Increase Since 2010
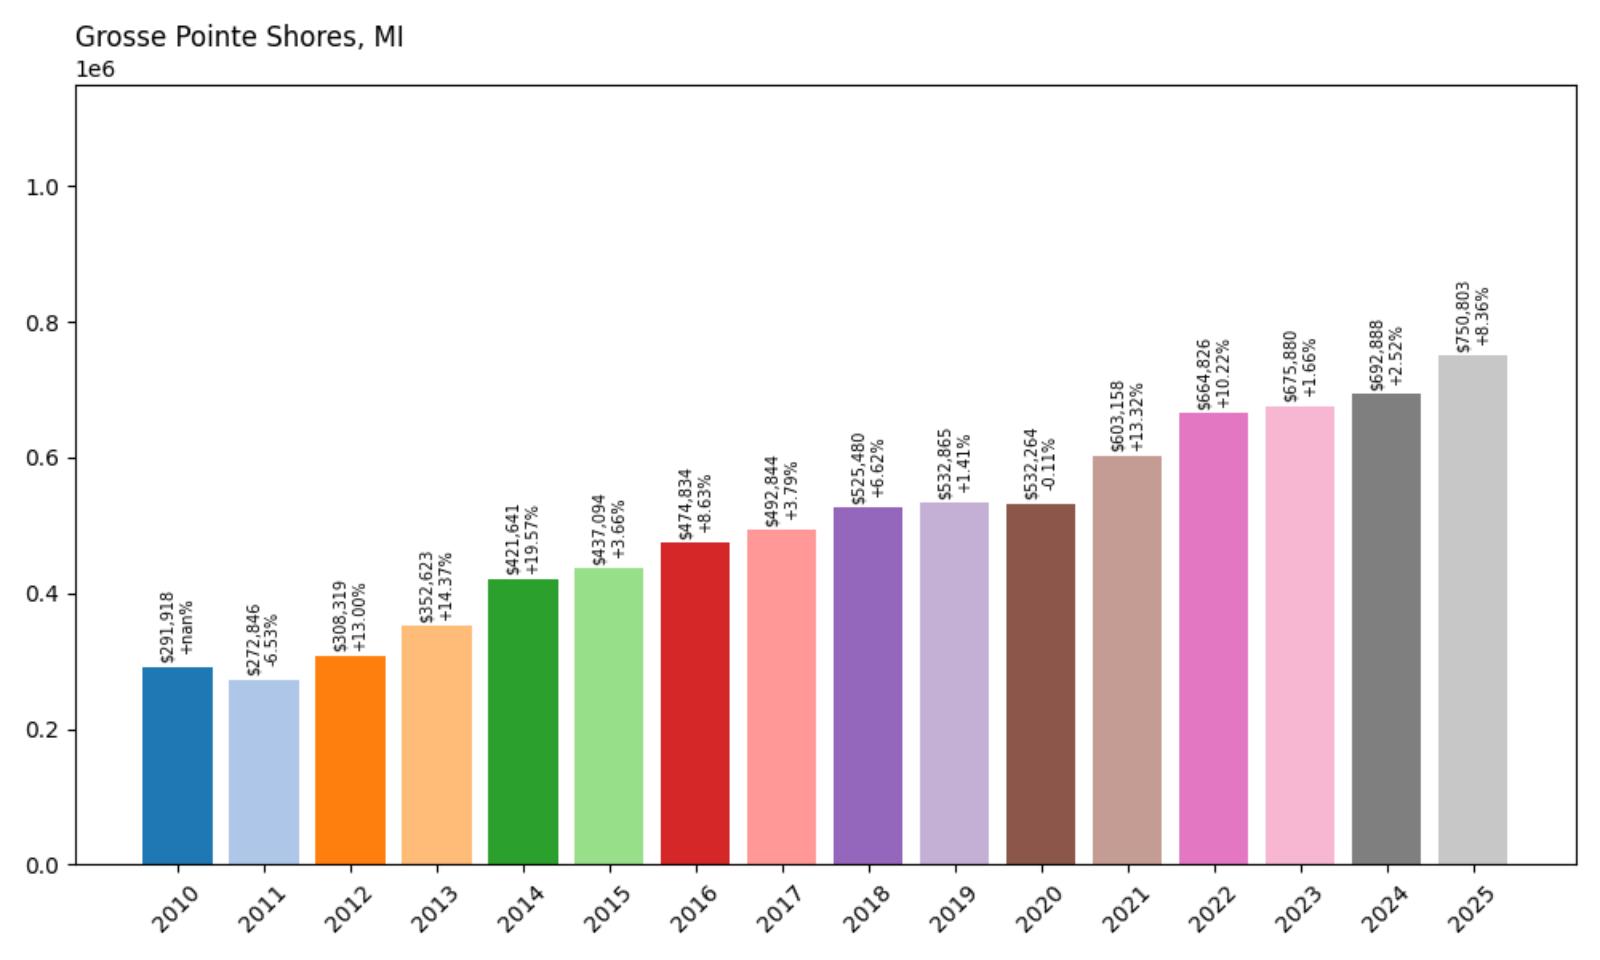
- 2010: $291,918
- 2011: $272,846 (−$19,073, −6.53% from previous year)
- 2012: $308,319 (+$35,474, +13.00% from previous year)
- 2013: $352,623 (+$44,304, +14.37% from previous year)
- 2014: $421,641 (+$69,018, +19.57% from previous year)
- 2015: $437,094 (+$15,453, +3.66% from previous year)
- 2016: $474,834 (+$37,739, +8.63% from previous year)
- 2017: $492,844 (+$18,010, +3.79% from previous year)
- 2018: $525,480 (+$32,636, +6.62% from previous year)
- 2019: $532,865 (+$7,385, +1.41% from previous year)
- 2020: $532,264 (−$601, −0.11% from previous year)
- 2021: $603,158 (+$70,894, +13.32% from previous year)
- 2022: $664,826 (+$61,667, +10.22% from previous year)
- 2023: $675,880 (+$11,054, +1.66% from previous year)
- 2024: $692,888 (+$17,008, +2.52% from previous year)
- 2025: $750,803 (+$57,915, +8.36% from previous year)
Grosse Pointe Shores has achieved remarkable 157% growth since 2010, with the current median price of $750,803 reflecting sustained appreciation in this prestigious lakefront community. The city experienced exceptional growth during the mid-2010s, particularly 2012-2014 when values surged by over 45% in consecutive years. After steady growth through the late 2010s, the pandemic years brought solid double-digit gains, and 2025 has seen particularly strong appreciation of 8.36%, indicating renewed momentum in this exclusive Detroit-area enclave.
Grosse Pointe Shores – Lakefront Luxury at its Finest
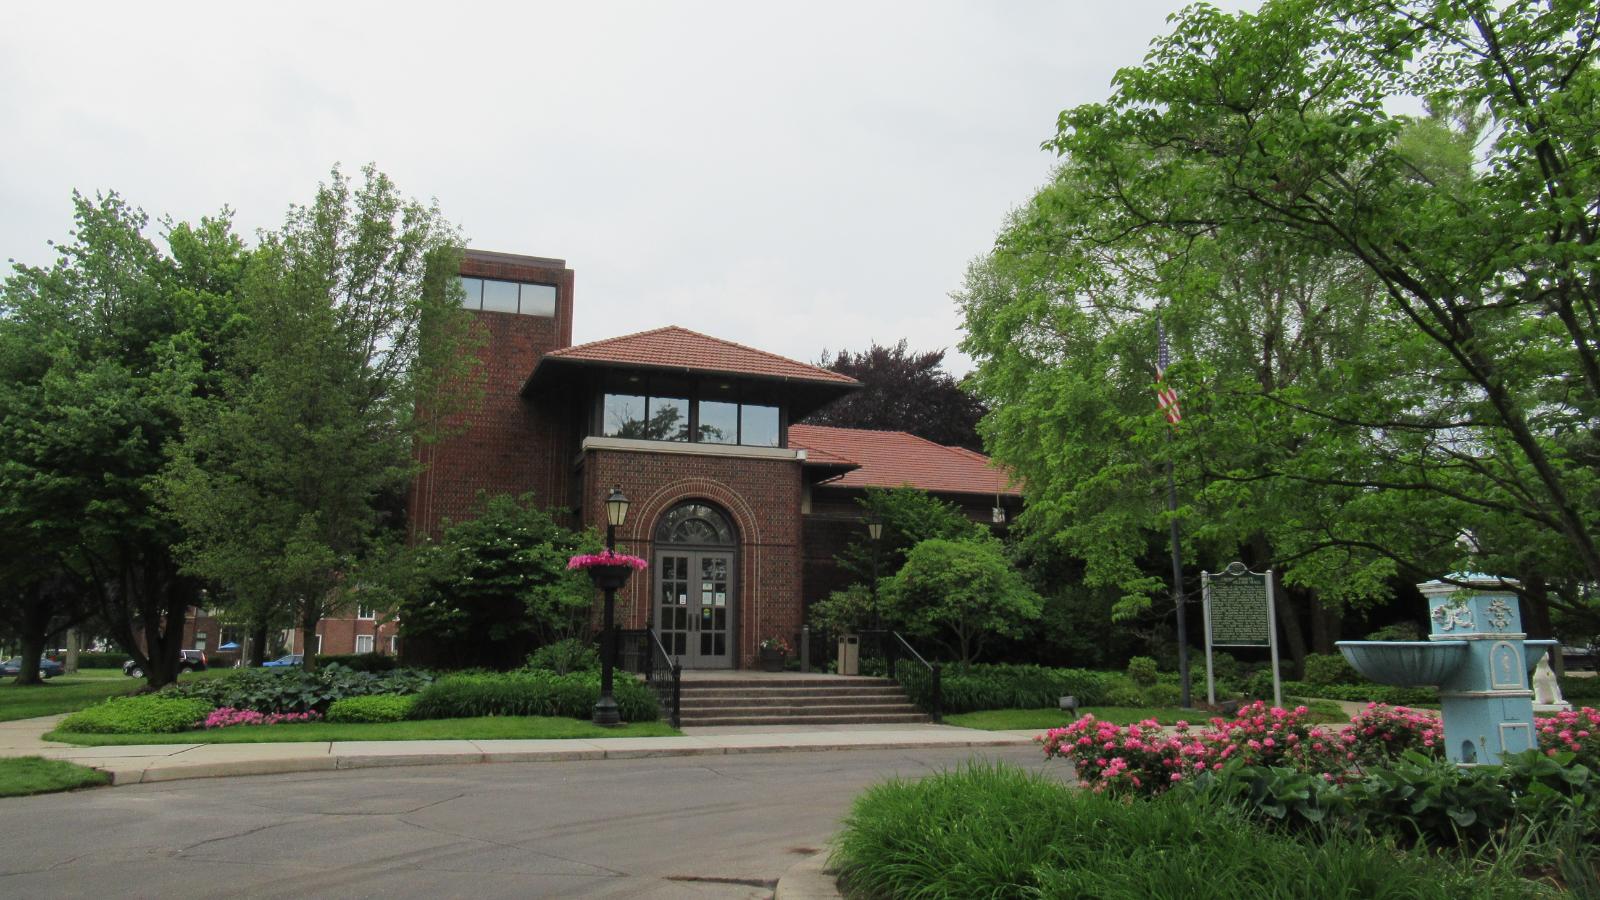
The crown jewel of the prestigious Grosse Pointe communities, Grosse Pointe Shores represents the pinnacle of Detroit-area luxury living. Located along Lake St. Clair in Wayne County, this exclusive municipality of approximately 2,800 residents features some of southeastern Michigan’s most impressive waterfront estates and historic properties. The community’s tree-lined streets and meticulously maintained properties create an atmosphere of understated elegance that has attracted wealthy families for over a century.
The real estate market in Grosse Pointe Shores reflects its status as one of Michigan’s most exclusive addresses, with waterfront properties commanding premium prices that can exceed $2 million. The community’s strict zoning regulations and large minimum lot sizes ensure that property values remain stable while preserving the area’s historic character. The strong recent appreciation, particularly 2025’s 8.36% increase, suggests continued confidence in Grosse Pointe Shores as both a prestigious residential address and a sound long-term investment in Michigan’s luxury real estate market.
9. Northport – 134% Home Price Increase Since 2010
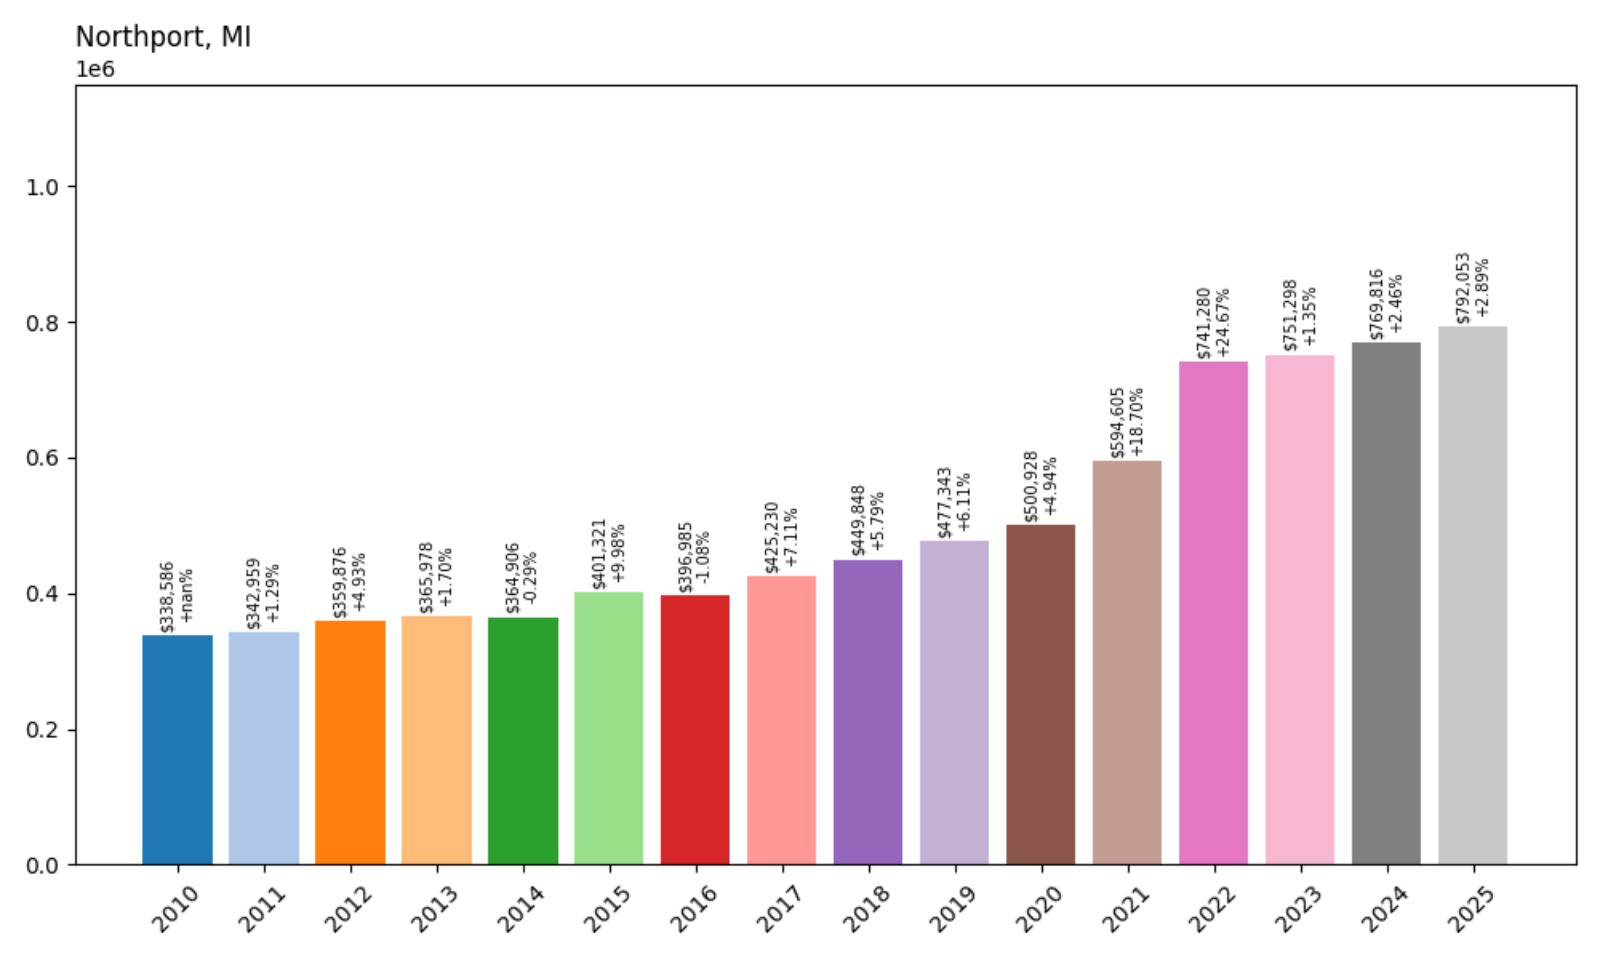
- 2010: $338,586
- 2011: $342,959 (+$4,372, +1.29% from previous year)
- 2012: $359,876 (+$16,917, +4.93% from previous year)
- 2013: $365,978 (+$6,102, +1.70% from previous year)
- 2014: $364,906 (−$1,072, −0.29% from previous year)
- 2015: $401,321 (+$36,416, +9.98% from previous year)
- 2016: $396,985 (−$4,336, −1.08% from previous year)
- 2017: $425,230 (+$28,245, +7.11% from previous year)
- 2018: $449,848 (+$24,618, +5.79% from previous year)
- 2019: $477,343 (+$27,495, +6.11% from previous year)
- 2020: $500,928 (+$23,585, +4.94% from previous year)
- 2021: $594,605 (+$93,677, +18.70% from previous year)
- 2022: $741,280 (+$146,675, +24.67% from previous year)
- 2023: $751,298 (+$10,018, +1.35% from previous year)
- 2024: $769,816 (+$18,517, +2.46% from previous year)
- 2025: $792,053 (+$22,237, +2.89% from previous year)
Northport has achieved impressive 134% growth since 2010, with the current median price of $792,053 reflecting remarkable appreciation in this northern Michigan lakefront community. The town showed steady but moderate growth through most of the 2010s before experiencing explosive pandemic-era increases, particularly a spectacular 25% jump in 2022 that pushed values above $740,000. The market has since stabilized with modest but consistent growth, suggesting buyers and sellers have found equilibrium after the dramatic run-up in values.
Northport – Leelanau Peninsula’s Northern Gem
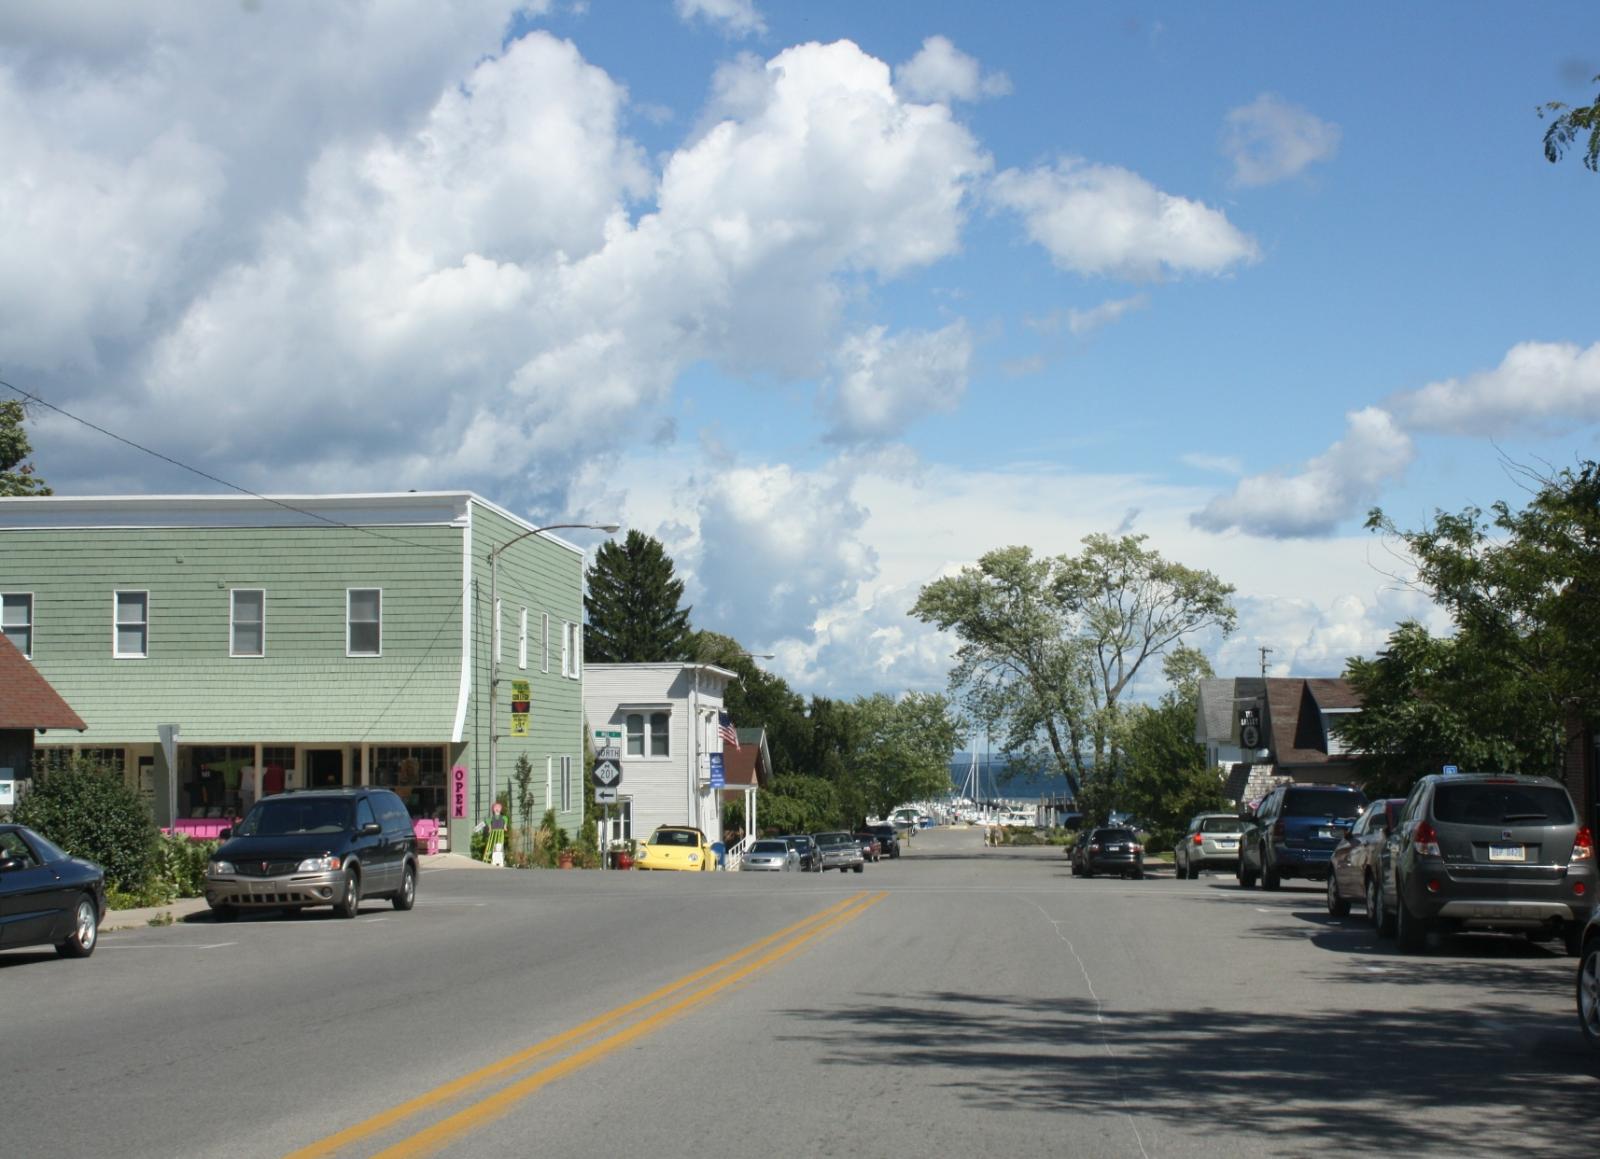
Located at the tip of the scenic Leelanau Peninsula, Northport combines the charm of a historic fishing village with the amenities expected by today’s affluent buyers. This picturesque community on Grand Traverse Bay serves as both a year-round home for about 500 residents and a premier vacation destination for visitors seeking authentic northern Michigan character. Northport’s working harbor, historic lighthouse, and tree-lined streets create an atmosphere that has attracted artists, writers, and sophisticated travelers for generations.
Northport’s real estate market reflects its unique position as both a historic community and a modern luxury destination. Properties with harbor views, historic significance, or proximity to the downtown district command particular premiums, while the area’s limited inventory and geographic constraints create natural scarcity that supports values. The recent market performance demonstrates continued confidence in Northport as one of northern Michigan’s most desirable addresses, where historic charm meets contemporary luxury in an increasingly rare combination.
8. Union Pier – 101% Home Price Increase Since 2010
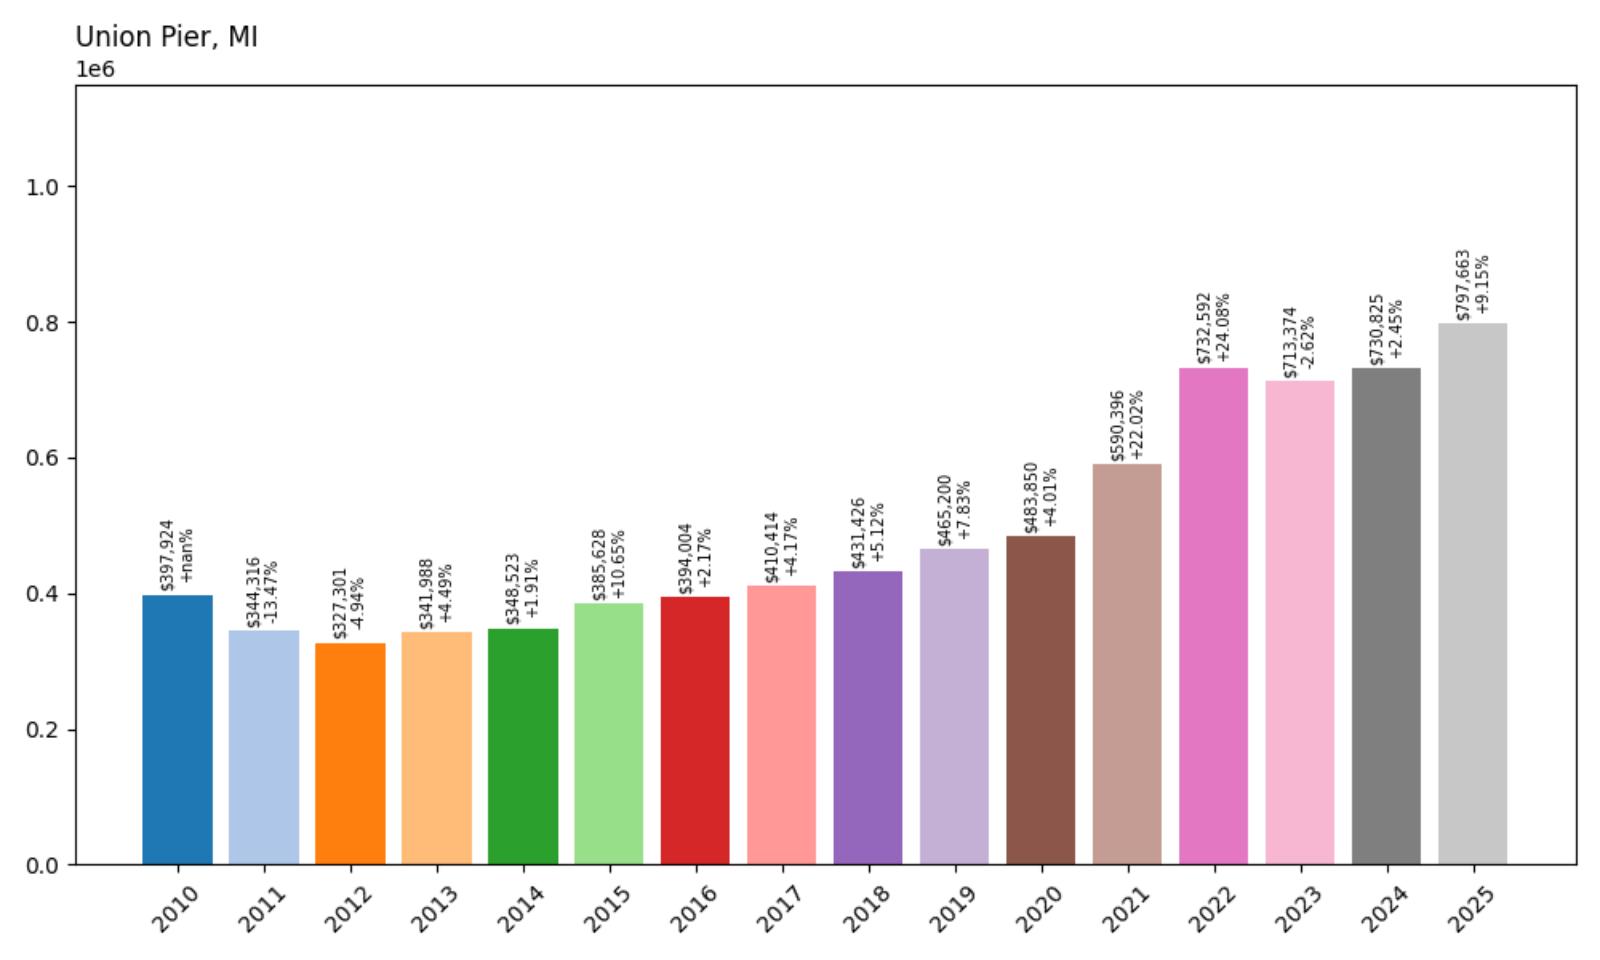
- 2010: $397,924
- 2011: $344,316 (−$53,607, −13.47% from previous year)
- 2012: $327,301 (−$17,016, −4.94% from previous year)
- 2013: $341,988 (+$14,688, +4.49% from previous year)
- 2014: $348,523 (+$6,535, +1.91% from previous year)
- 2015: $385,628 (+$37,105, +10.65% from previous year)
- 2016: $394,004 (+$8,376, +2.17% from previous year)
- 2017: $410,414 (+$16,411, +4.17% from previous year)
- 2018: $431,426 (+$21,012, +5.12% from previous year)
- 2019: $465,200 (+$33,774, +7.83% from previous year)
- 2020: $483,850 (+$18,650, +4.01% from previous year)
- 2021: $590,396 (+$106,545, +22.02% from previous year)
- 2022: $732,592 (+$142,196, +24.08% from previous year)
- 2023: $713,374 (−$19,219, −2.62% from previous year)
- 2024: $730,825 (+$17,452, +2.45% from previous year)
- 2025: $797,663 (+$66,838, +9.15% from previous year)
Union Pier has achieved solid 101% growth since 2010, with the current median price of $797,663 reflecting remarkable resilience after early-decade challenges. The community weathered significant declines in 2011-2012 before finding stability and consistent growth through the late 2010s. The pandemic years brought explosive appreciation with consecutive years exceeding 22%, and after a brief correction in 2023, the market has resumed strong growth with a particularly robust 9.15% increase in 2025, indicating renewed confidence in this Harbor Country destination.
Union Pier – Harbor Country’s Artistic Haven
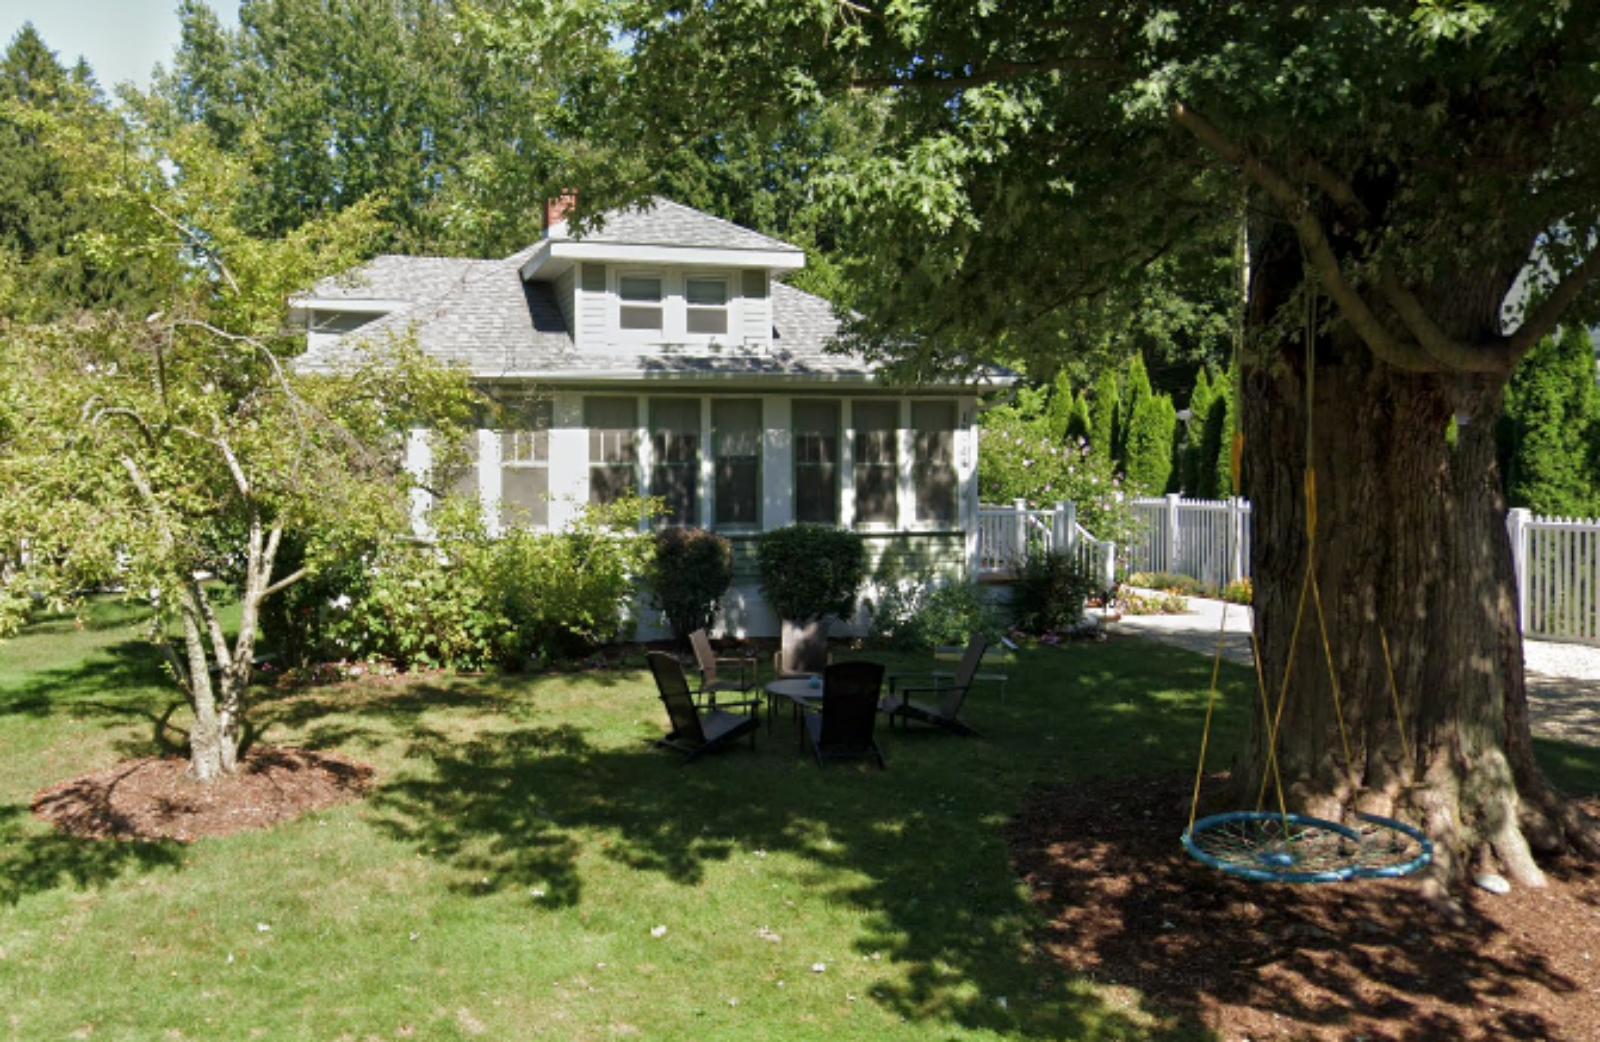
Nestled along Lake Michigan’s pristine shoreline in Berrien County, Union Pier represents one of Harbor Country’s most distinctive communities, combining natural beauty with a thriving arts scene. This small lakefront village attracts a diverse mix of residents and visitors, from Chicago weekenders seeking beach retreats to artists and writers drawn by the area’s creative atmosphere and scenic inspiration. Union Pier’s eclectic character and spectacular sunsets have made it a favorite destination for those seeking an alternative to more commercialized resort areas.
Union Pier’s real estate market reflects its evolution from a quiet beach community into a sought-after destination for affluent buyers seeking artistic inspiration and natural beauty. Properties with lake views, historic character, or unique architectural features command significant premiums, while the area’s limited development opportunities create scarcity that supports appreciation. The strong recent performance, particularly 2025’s 9.15% increase, suggests continued confidence in Union Pier as both a lifestyle destination and a sound investment in Michigan’s competitive lakefront market.
7. Kewadin – 181% Home Price Increase Since 2010
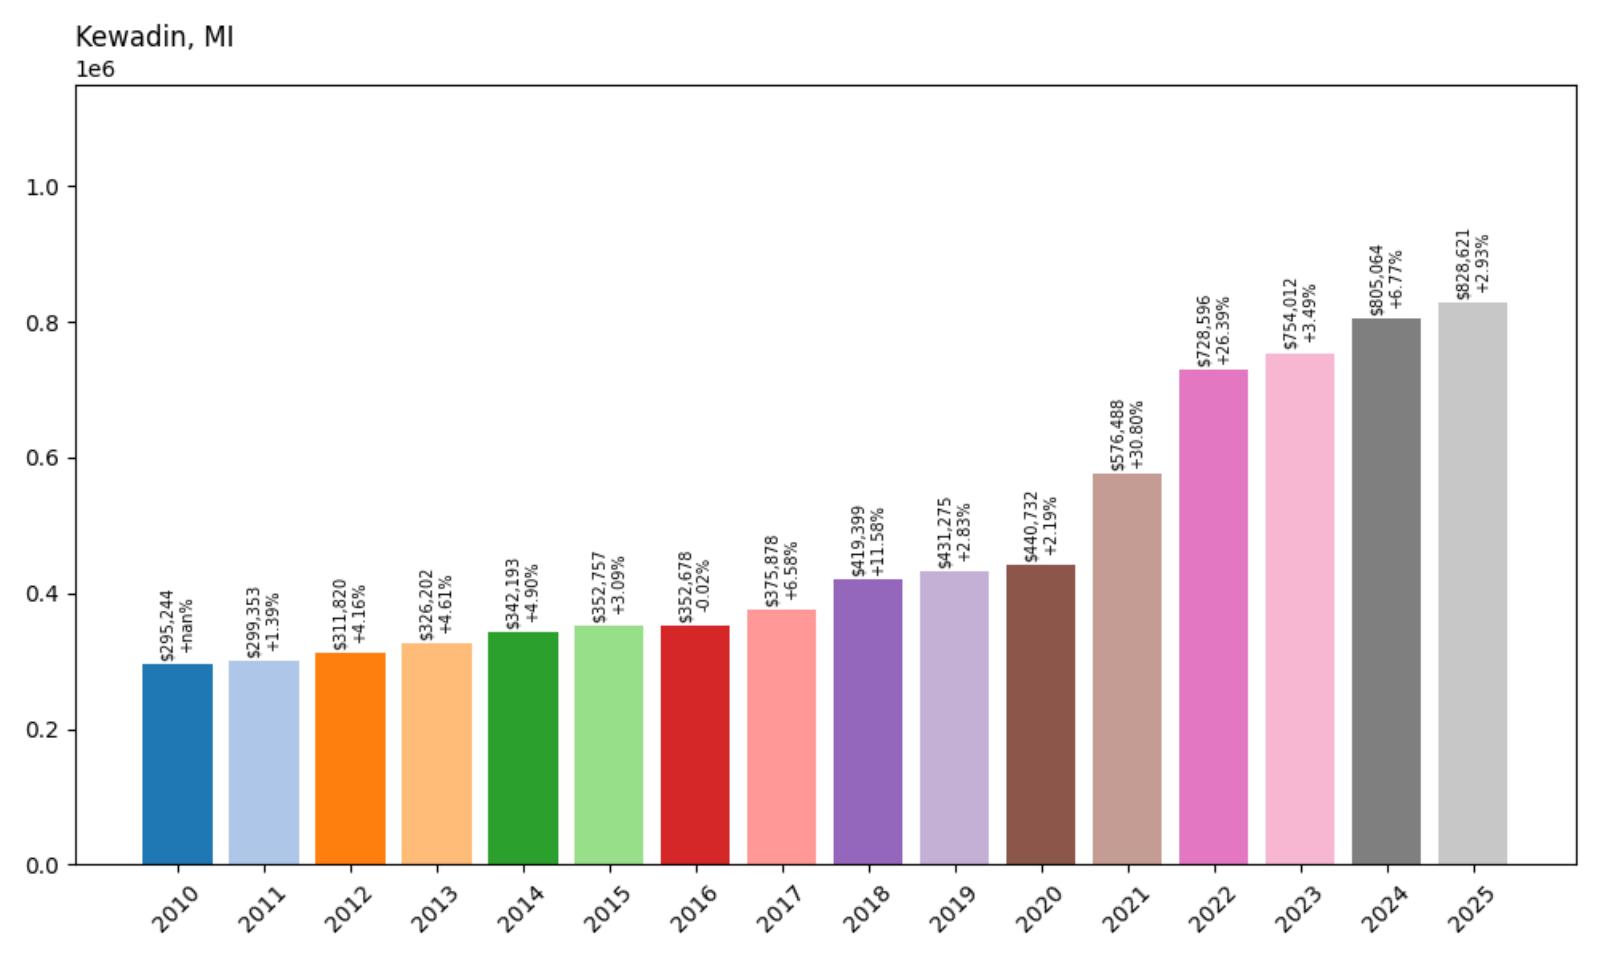
- 2010: $295,244
- 2011: $299,353 (+$4,110, +1.39% from previous year)
- 2012: $311,820 (+$12,467, +4.16% from previous year)
- 2013: $326,202 (+$14,381, +4.61% from previous year)
- 2014: $342,193 (+$15,992, +4.90% from previous year)
- 2015: $352,757 (+$10,564, +3.09% from previous year)
- 2016: $352,678 (−$79, −0.02% from previous year)
- 2017: $375,878 (+$23,200, +6.58% from previous year)
- 2018: $419,399 (+$43,521, +11.58% from previous year)
- 2019: $431,275 (+$11,876, +2.83% from previous year)
- 2020: $440,732 (+$9,457, +2.19% from previous year)
- 2021: $576,488 (+$135,756, +30.80% from previous year)
- 2022: $728,596 (+$152,108, +26.39% from previous year)
- 2023: $754,012 (+$25,416, +3.49% from previous year)
- 2024: $805,064 (+$51,052, +6.77% from previous year)
- 2025: $828,621 (+$23,557, +2.93% from previous year)
Kewadin has achieved exceptional 181% growth since 2010, with the current median price of $828,621 representing nearly a tripling in value over 15 years. The community demonstrated steady, consistent growth through the 2010s, accelerating significantly in 2018 before experiencing explosive pandemic-era increases of over 30% in 2021 and 26% in 2022. The market has continued healthy appreciation through 2025, though at more moderate rates, suggesting sustainable long-term growth in this northern Michigan community.
Kewadin – Torch Lake’s Premium Address
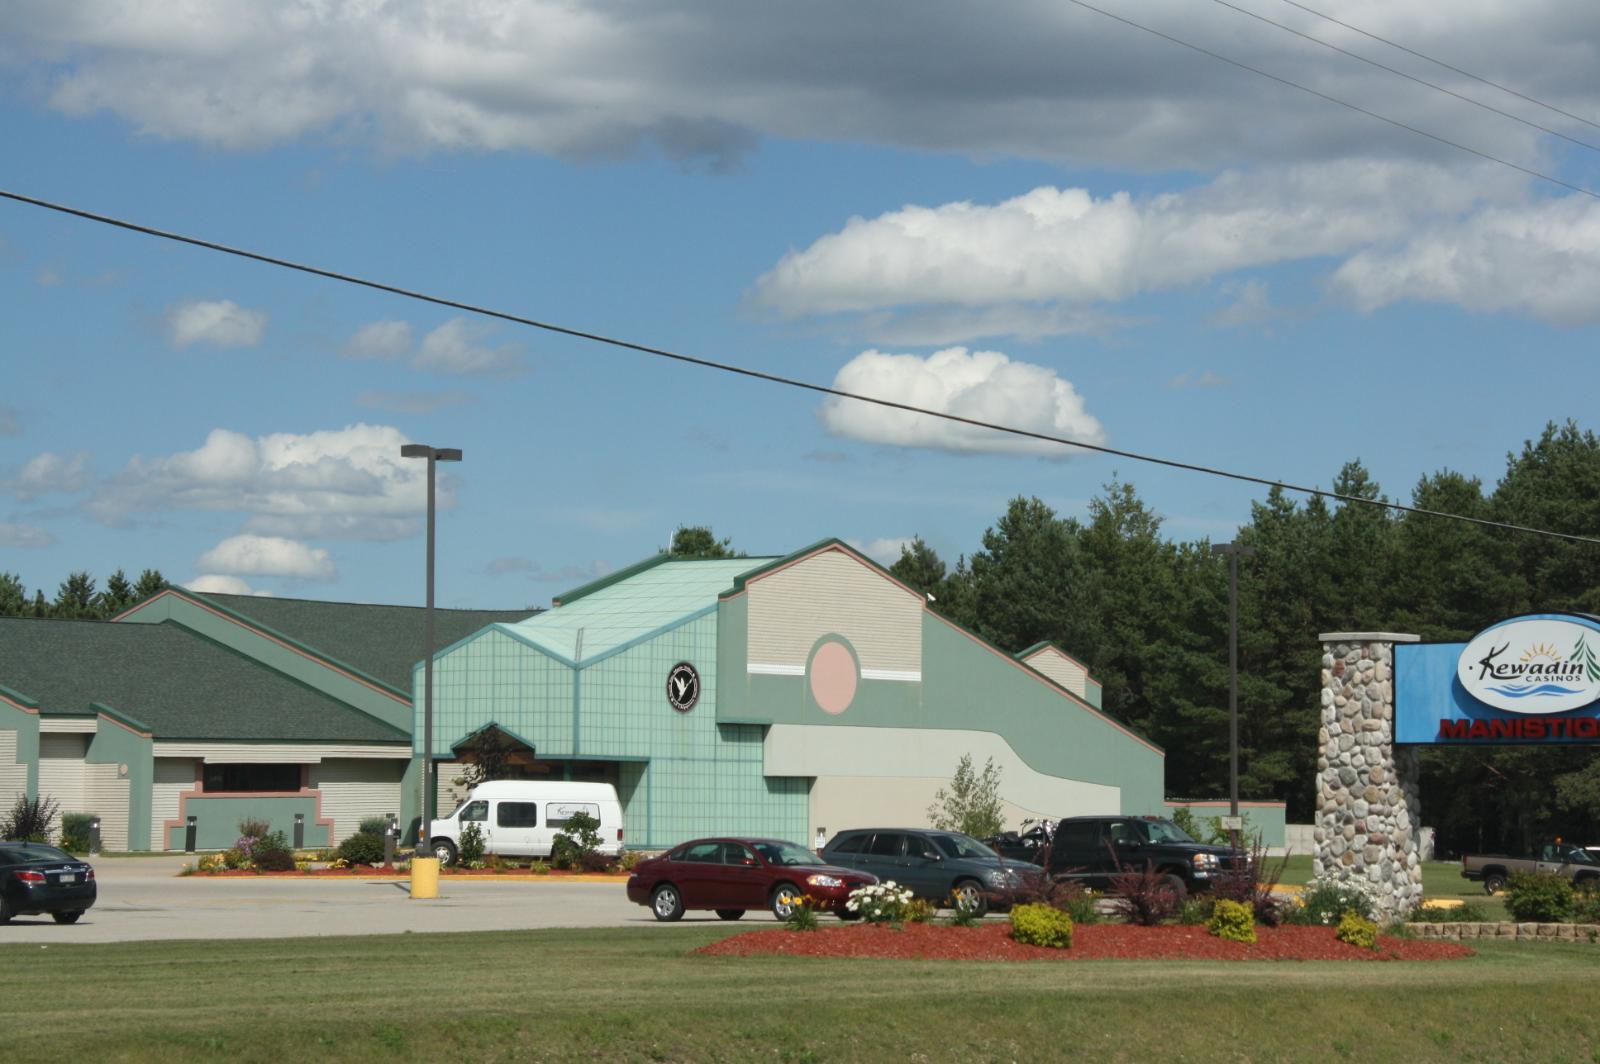
Situated along the crystal-clear waters of Torch Lake in Antrim County, Kewadin has emerged as one of northern Michigan’s most coveted residential destinations. This small community benefits from its location on what many consider Michigan’s most beautiful inland lake, known for its Caribbean-like turquoise waters and pristine sandy beaches. Kewadin attracts affluent buyers from across the Midwest who seek the perfect combination of natural beauty, recreational opportunities, and proximity to northern Michigan’s premier attractions.
The area’s appeal extends beyond Torch Lake’s stunning beauty to include easy access to numerous other lakes, the Jordan River, and some of northern Michigan’s finest golf courses and ski resorts. Kewadin’s location provides convenient access to Traverse City, Petoskey, and other regional destinations while maintaining a peaceful, residential atmosphere. The community’s limited commercial development preserves its natural character while creating scarcity that supports premium property values.
6. Lakeside – 120% Home Price Increase Since 2010
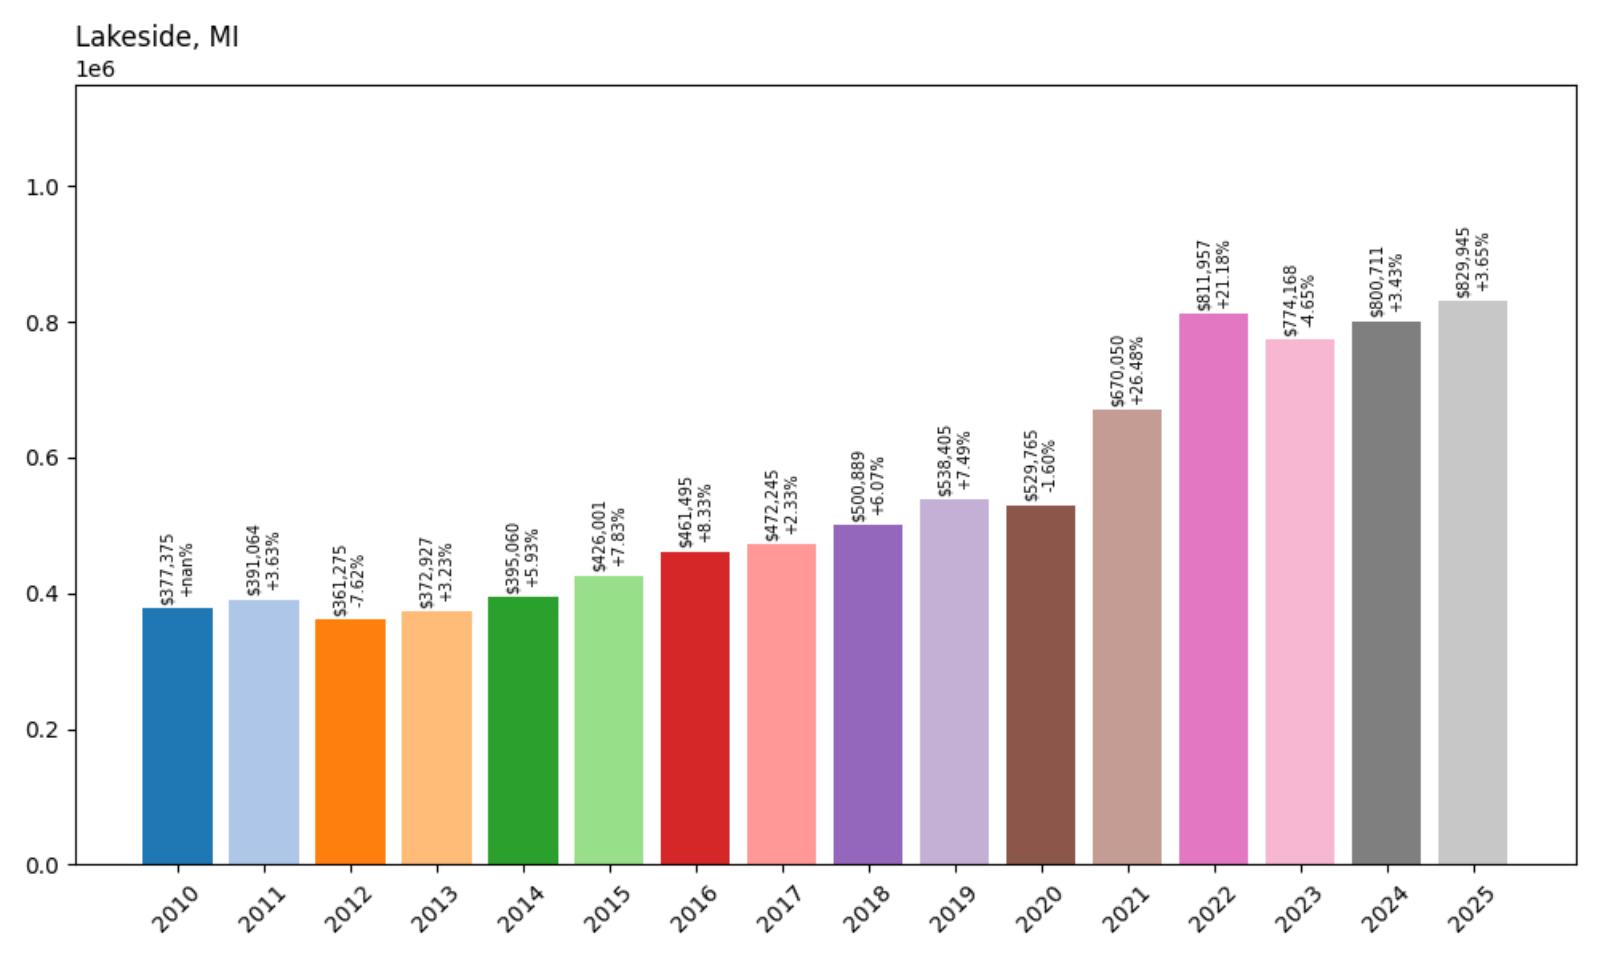
- 2010: $377,375
- 2011: $391,064 (+$13,689, +3.63% from previous year)
- 2012: $361,275 (−$29,789, −7.62% from previous year)
- 2013: $372,927 (+$11,651, +3.23% from previous year)
- 2014: $395,060 (+$22,133, +5.93% from previous year)
- 2015: $426,001 (+$30,941, +7.83% from previous year)
- 2016: $461,495 (+$35,495, +8.33% from previous year)
- 2017: $472,245 (+$10,749, +2.33% from previous year)
- 2018: $500,889 (+$28,644, +6.07% from previous year)
- 2019: $538,405 (+$37,516, +7.49% from previous year)
- 2020: $529,765 (−$8,640, −1.60% from previous year)
- 2021: $670,050 (+$140,285, +26.48% from previous year)
- 2022: $811,957 (+$141,907, +21.18% from previous year)
- 2023: $774,168 (−$37,789, −4.65% from previous year)
- 2024: $800,711 (+$26,543, +3.43% from previous year)
- 2025: $829,945 (+$29,234, +3.65% from previous year)
Lakeside has achieved solid 120% growth since 2010, with the current median price of $829,945 reflecting steady long-term appreciation in this premium Lake Michigan community. After recovering from a 2012 decline, the town showed consistent growth through the late 2010s before experiencing dramatic pandemic-era acceleration with consecutive years exceeding 20%. Following a correction in 2023, the market has resumed healthy growth with solid appreciation continuing through 2025, demonstrating the underlying strength of this exclusive lakefront destination.
Lakeside – Harbor Country’s Exclusive Retreat
Located along Lake Michigan’s pristine shoreline in Berrien County, Lakeside represents one of Harbor Country’s most exclusive and sought-after communities. This upscale lakefront enclave attracts discerning buyers from Chicago, Detroit, and other major metropolitan areas who seek privacy, natural beauty, and sophisticated amenities. Lakeside’s appeal lies in its combination of spectacular beaches, mature sand dunes, and large residential lots that provide the privacy and exclusivity desired by affluent homeowners.
Lakeside’s real estate market features some of southwestern Michigan’s most valuable properties, with many homes situated on large lots with direct lake access or panoramic water views. The community’s strict zoning and limited development opportunities create natural scarcity that supports premium prices, while its growing reputation among affluent buyers ensures continued demand. The recent market performance reflects Lakeside’s position as one of the Great Lakes’ premier residential destinations, where exclusivity and natural beauty combine to create exceptional value for discerning buyers.
5. Lake Leelanau – 136% Home Price Increase Since 2010
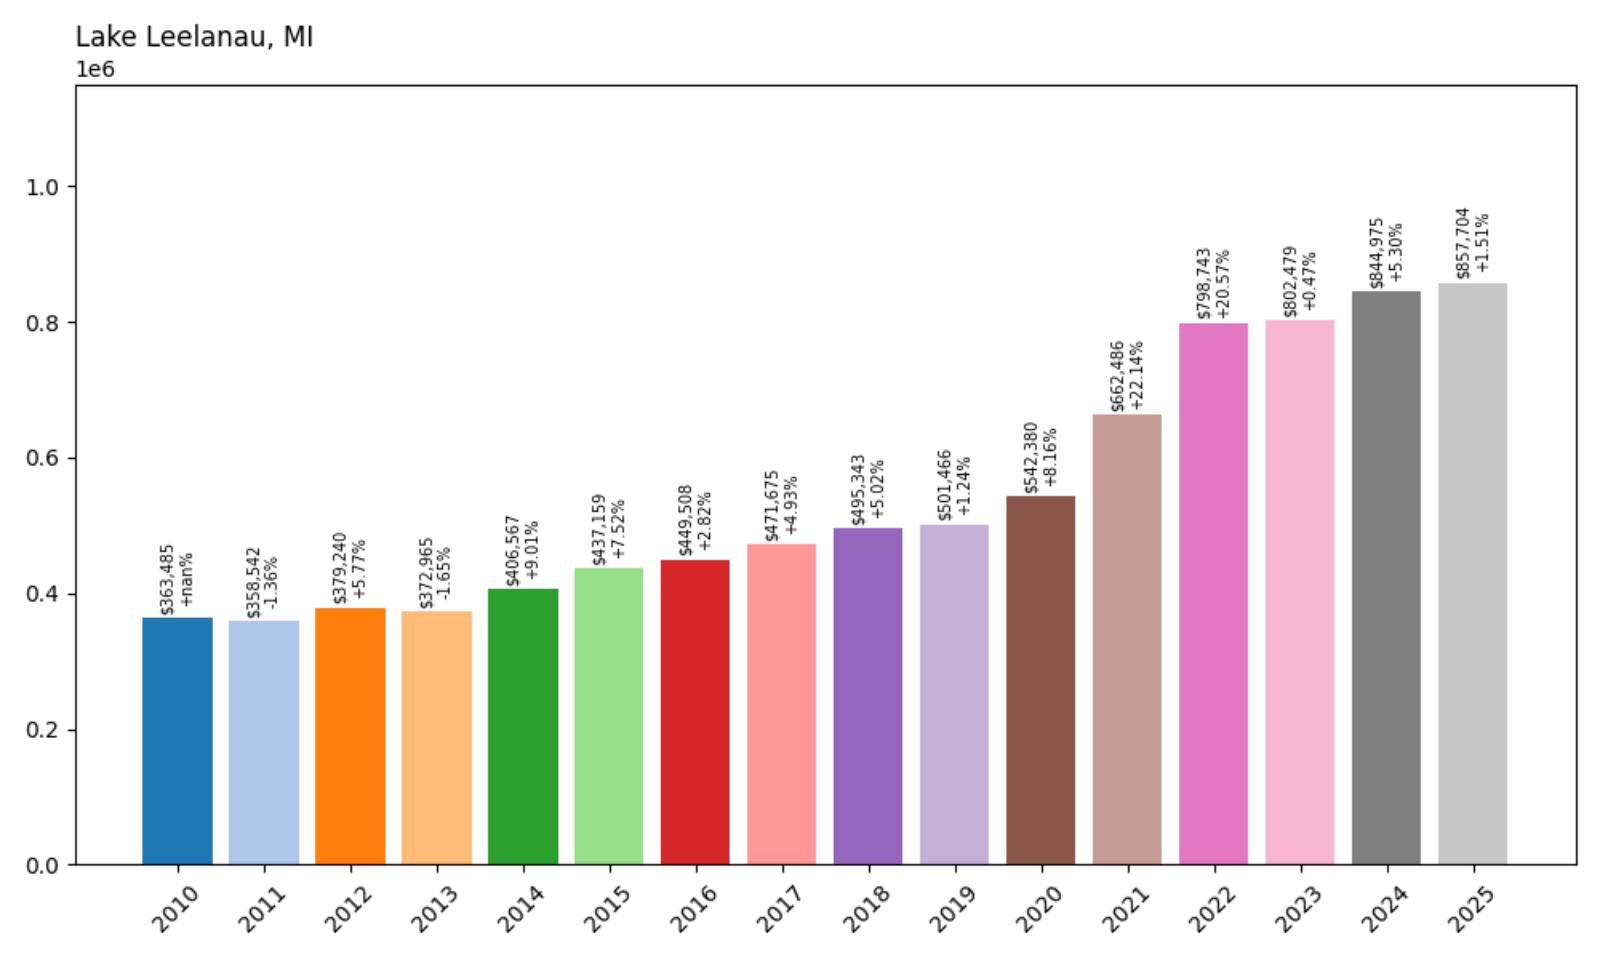
- 2010: $363,485
- 2011: $358,542 (−$4,943, −1.36% from previous year)
- 2012: $379,240 (+$20,698, +5.77% from previous year)
- 2013: $372,965 (−$6,275, −1.65% from previous year)
- 2014: $406,567 (+$33,603, +9.01% from previous year)
- 2015: $437,159 (+$30,591, +7.52% from previous year)
- 2016: $449,508 (+$12,349, +2.82% from previous year)
- 2017: $471,675 (+$22,167, +4.93% from previous year)
- 2018: $495,343 (+$23,668, +5.02% from previous year)
- 2019: $501,466 (+$6,123, +1.24% from previous year)
- 2020: $542,380 (+$40,913, +8.16% from previous year)
- 2021: $662,486 (+$120,106, +22.14% from previous year)
- 2022: $798,743 (+$136,258, +20.57% from previous year)
- 2023: $802,479 (+$3,735, +0.47% from previous year)
- 2024: $844,975 (+$42,496, +5.30% from previous year)
- 2025: $857,704 (+$12,730, +1.51% from previous year)
Lake Leelanau has achieved impressive 136% growth since 2010, with the current median price of $857,704 reflecting sustained appreciation in this prestigious northern Michigan lake community. The town showed steady growth through the 2010s, accelerating in 2020 before experiencing explosive pandemic-era increases of over 20% in both 2021 and 2022. The market has since stabilized with more modest growth, though 2024’s 5.30% increase demonstrates continued underlying strength in this exclusive lakefront destination.
Lake Leelanau – Leelanau County’s Pristine Paradise
Nestled along the shores of beautiful Lake Leelanau in the heart of Leelanau County, this charming community represents one of northern Michigan’s most desirable lakefront destinations. The pristine 21-mile-long lake, surrounded by rolling hills and cherry orchards, creates a picturesque setting that has attracted affluent buyers seeking both recreational opportunities and investment potential. Lake Leelanau’s crystal-clear waters and scenic beauty make it a premier destination for boating, fishing, and water sports enthusiasts.
Lake Leelanau’s real estate market features a mix of historic lake cottages, modern luxury homes, and expansive waterfront estates that cater to diverse buyer preferences. Properties with direct lake access or panoramic water views command significant premiums, while the area’s limited inventory and strict zoning create natural scarcity that supports appreciation. The community’s growing recognition as one of Michigan’s premier lake destinations, combined with its proximity to world-class recreational and cultural amenities, ensures continued demand from affluent buyers seeking the finest in northern Michigan living.
4. Franklin – 119% Home Price Increase Since 2010
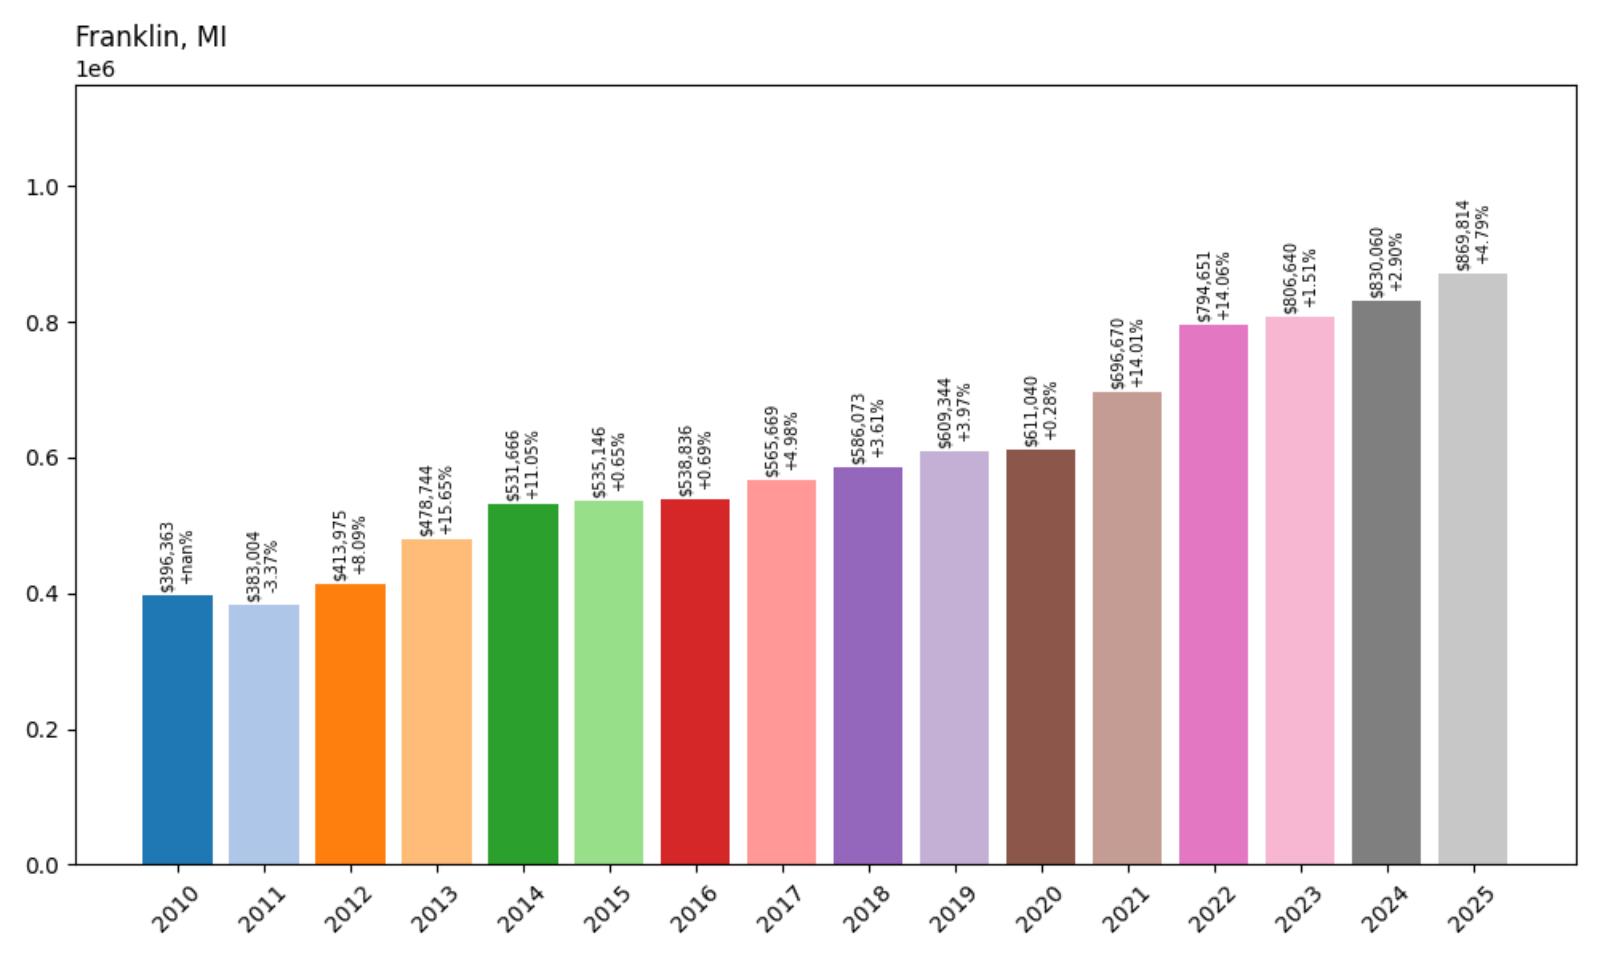
- 2010: $396,363
- 2011: $383,004 (−$13,359, −3.37% from previous year)
- 2012: $413,975 (+$30,971, +8.09% from previous year)
- 2013: $478,744 (+$64,769, +15.65% from previous year)
- 2014: $531,666 (+$52,922, +11.05% from previous year)
- 2015: $535,146 (+$3,481, +0.65% from previous year)
- 2016: $538,836 (+$3,690, +0.69% from previous year)
- 2017: $565,669 (+$26,833, +4.98% from previous year)
- 2018: $586,073 (+$20,404, +3.61% from previous year)
- 2019: $609,344 (+$23,271, +3.97% from previous year)
- 2020: $611,040 (+$1,696, +0.28% from previous year)
- 2021: $696,670 (+$85,630, +14.01% from previous year)
- 2022: $794,651 (+$97,981, +14.06% from previous year)
- 2023: $806,640 (+$11,990, +1.51% from previous year)
- 2024: $830,060 (+$23,419, +2.90% from previous year)
- 2025: $869,814 (+$39,754, +4.79% from previous year)
Franklin has achieved solid 119% growth since 2010, with the current median price of $869,814 reflecting steady long-term appreciation in this prestigious Oakland County community. The city experienced explosive growth during 2012-2014, with particularly strong gains of over 15% in 2013 that established its premium market position. After a period of modest growth through the late 2010s, the pandemic years brought renewed momentum with solid double-digit gains, and 2025 has seen healthy 4.79% appreciation, indicating continued buyer confidence in this exclusive suburb.
Franklin – Oakland County’s Historic Village
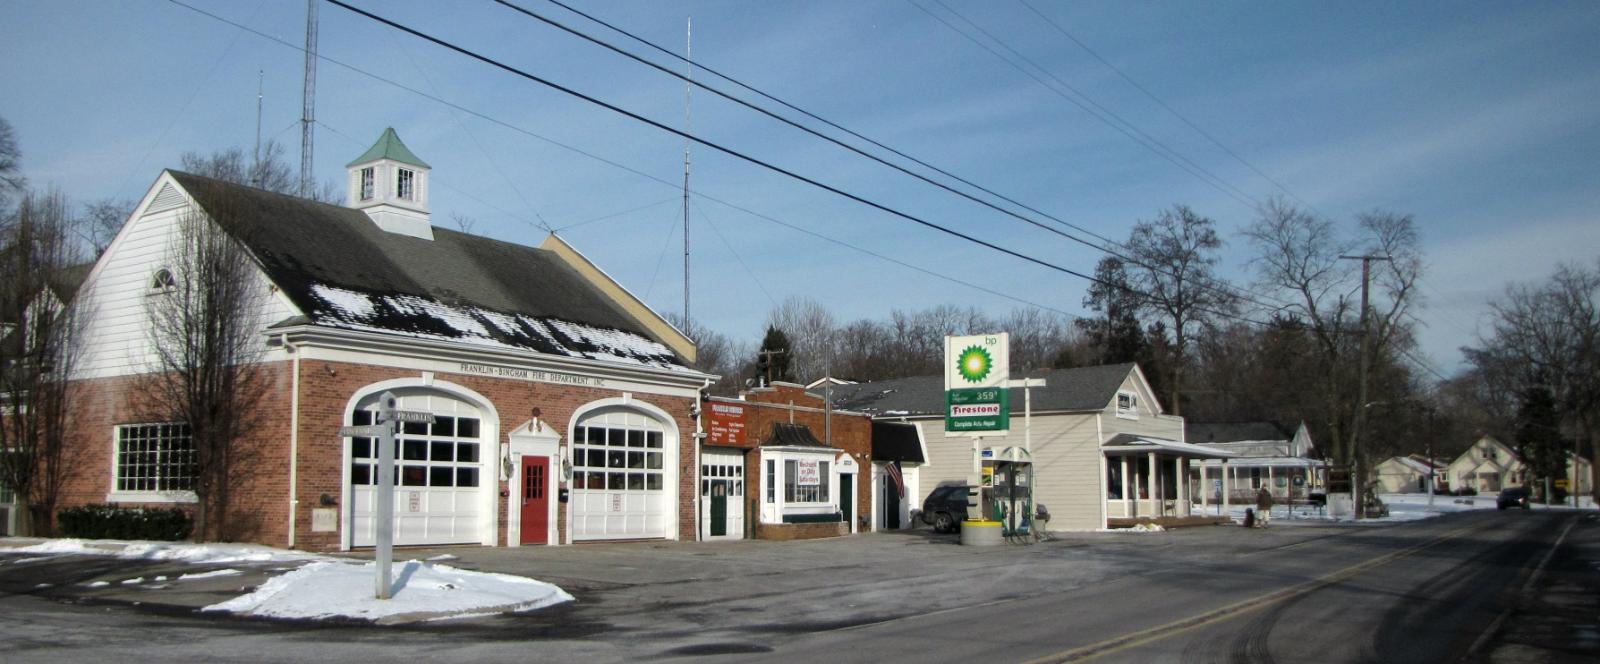
Known as the “Village within a City,” Franklin represents one of southeastern Michigan’s most charming and exclusive residential communities. This historic village in Oakland County maintains a rural character despite its location just 25 miles northwest of downtown Detroit, with tree-lined streets, historic homes, and preserved open spaces creating an atmosphere reminiscent of New England villages. Franklin’s unique character and strict zoning regulations have preserved its small-town charm while property values have soared.
The real estate market in Franklin features a diverse mix of architectural styles, from historic farmhouses and colonial revivals to contemporary designs, many situated on large lots that provide privacy and space. The village’s strict development guidelines and commitment to preserving its character create scarcity that supports premium prices, while its prestigious reputation continues to attract affluent buyers. Franklin’s combination of historic charm, excellent schools, and convenient location makes it one of Michigan’s most desirable addresses for discerning families and professionals.
3. Orchard Lake – 85% Home Price Increase Since 2010
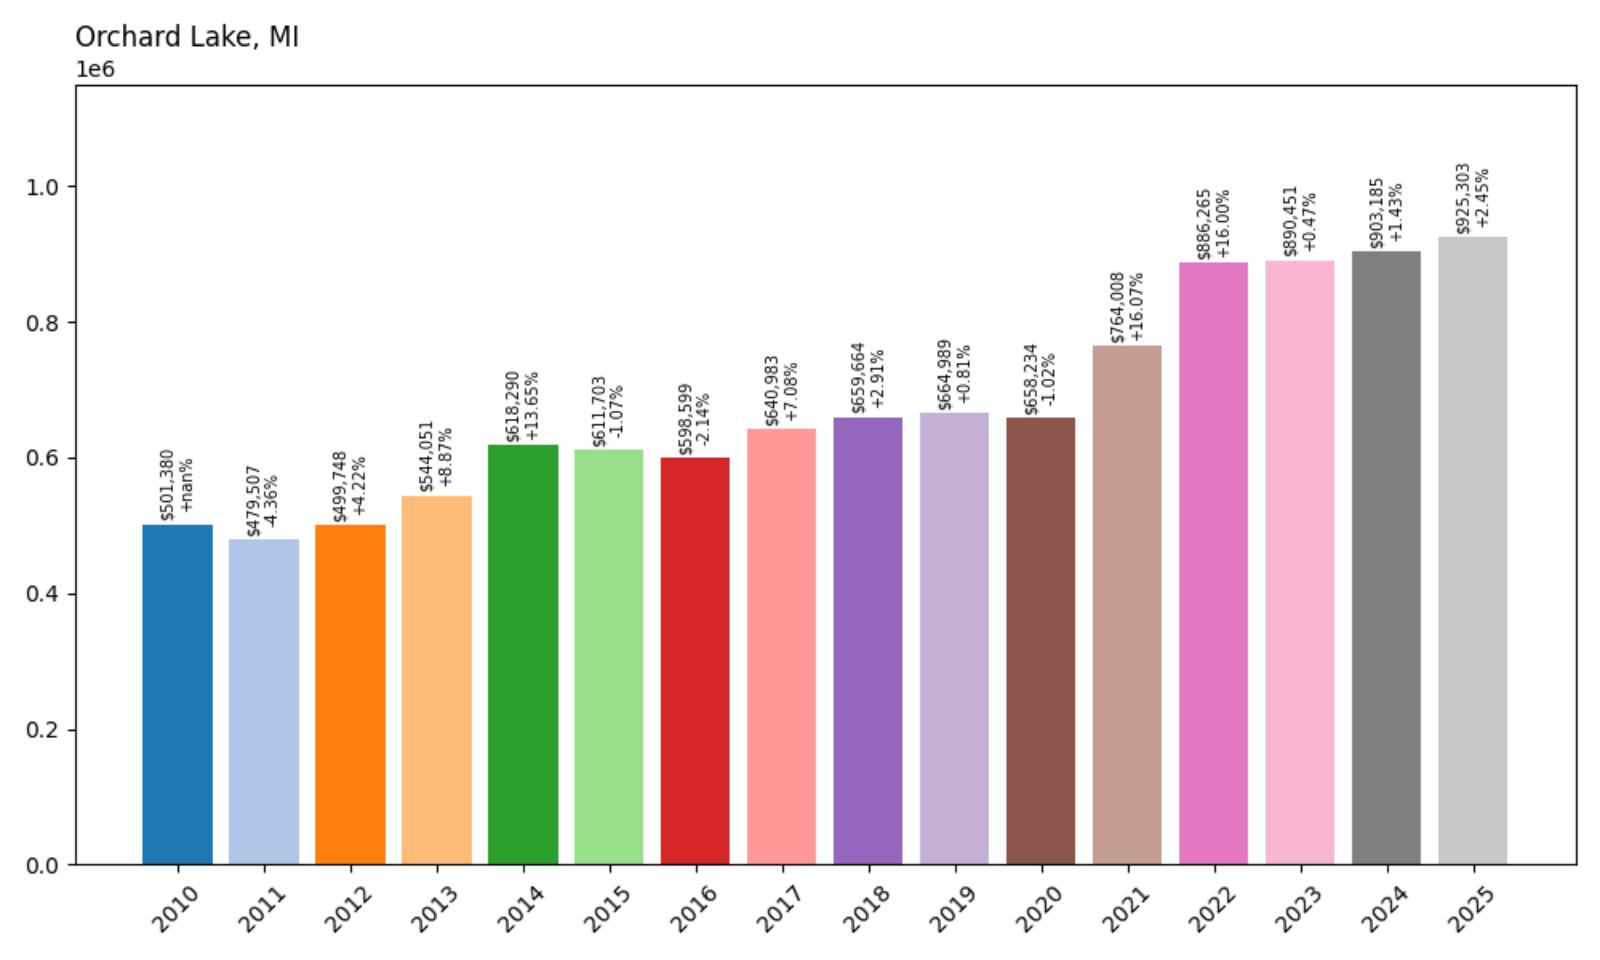
- 2010: $501,380
- 2011: $479,507 (−$21,873, −4.36% from previous year)
- 2012: $499,748 (+$20,241, +4.22% from previous year)
- 2013: $544,051 (+$44,303, +8.87% from previous year)
- 2014: $618,290 (+$74,239, +13.65% from previous year)
- 2015: $611,703 (−$6,587, −1.07% from previous year)
- 2016: $598,599 (−$13,104, −2.14% from previous year)
- 2017: $640,983 (+$42,385, +7.08% from previous year)
- 2018: $659,664 (+$18,680, +2.91% from previous year)
- 2019: $664,989 (+$5,325, +0.81% from previous year)
- 2020: $658,234 (−$6,755, −1.02% from previous year)
- 2021: $764,008 (+$105,774, +16.07% from previous year)
- 2022: $886,265 (+$122,257, +16.00% from previous year)
- 2023: $890,451 (+$4,186, +0.47% from previous year)
- 2024: $903,185 (+$12,734, +1.43% from previous year)
- 2025: $925,303 (+$22,118, +2.45% from previous year)
Orchard Lake has achieved steady 85% growth since 2010, with the current median price of $925,303 reflecting measured appreciation in this elite Oakland County lakefront community. Starting from a higher base than most communities, Orchard Lake showed significant growth during 2013-2014 before experiencing some volatility in the mid-2010s. The pandemic years brought strong acceleration with consecutive 16% increases in 2021-2022, and the market has continued modest but steady growth through 2025, demonstrating the stability expected in Michigan’s most prestigious lakefront addresses.
Orchard Lake – Oakland County’s Lakefront Crown Jewel
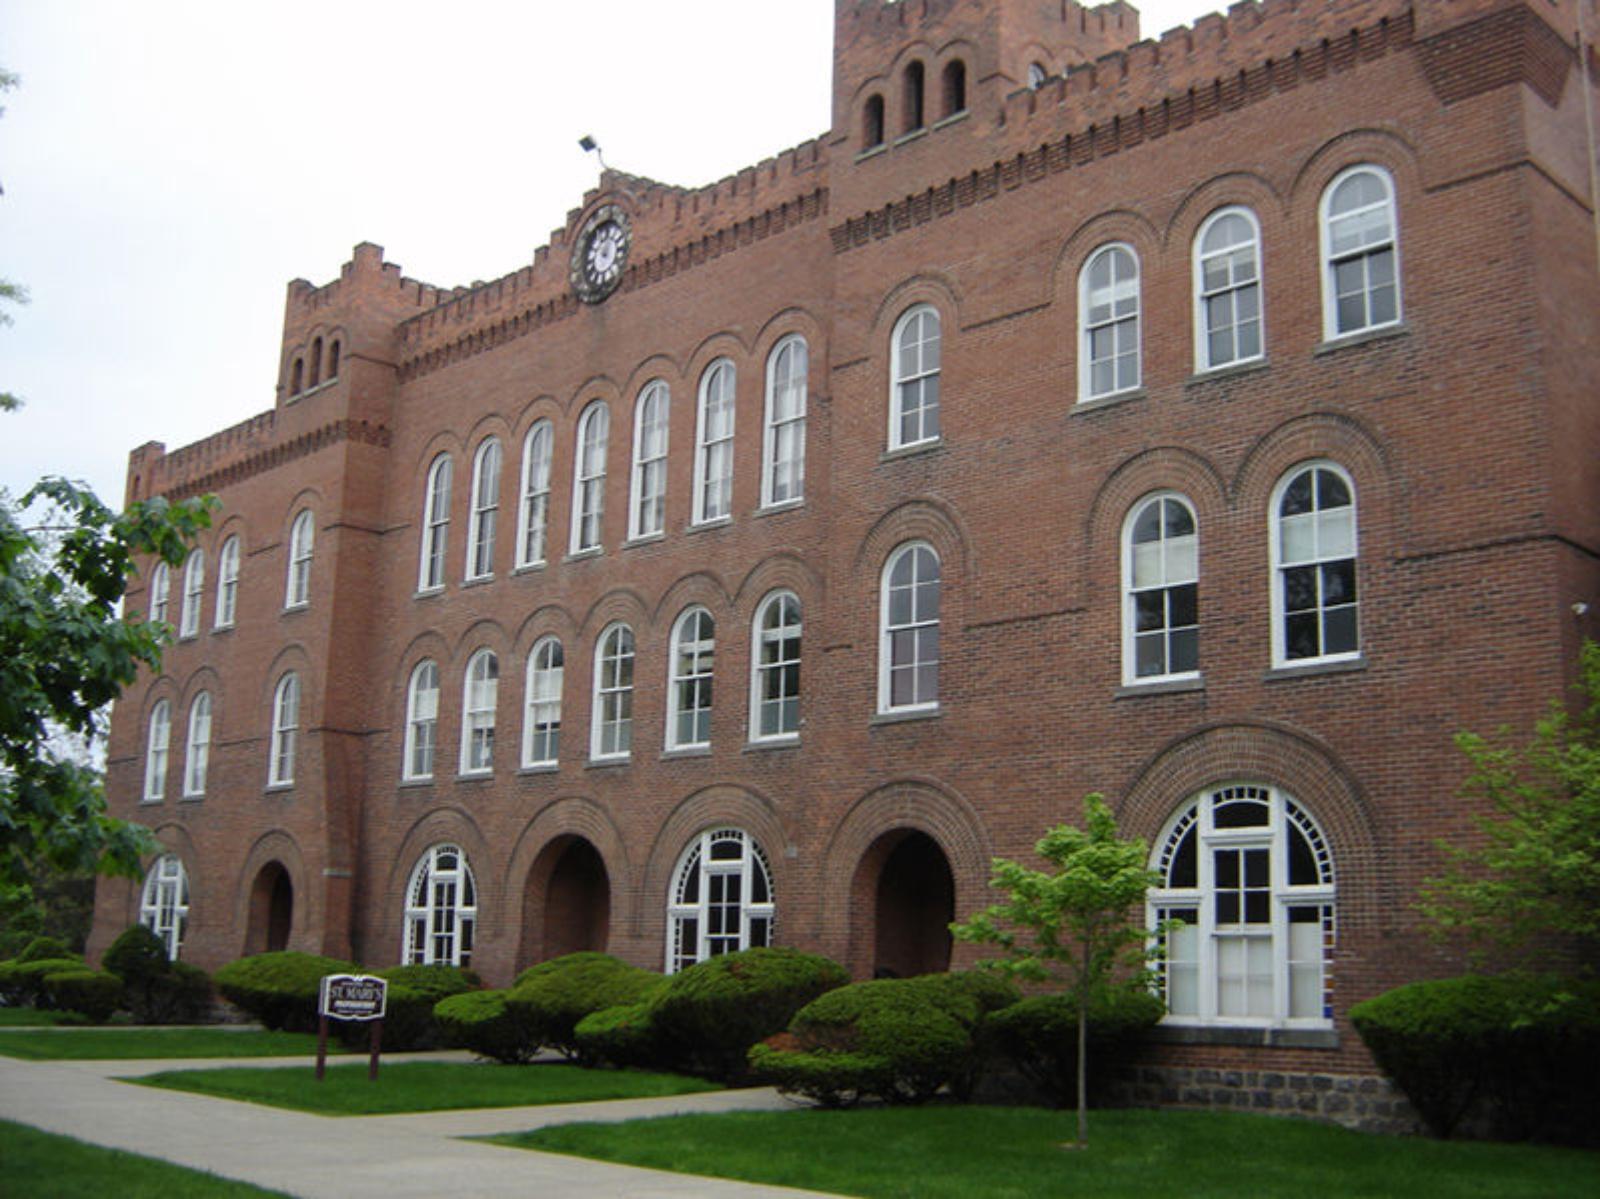
Situated around the pristine waters of Orchard Lake in Oakland County, this exclusive community represents the pinnacle of Michigan lakefront living. The 788-acre all-sports lake, surrounded by some of the state’s most impressive estates and luxury homes, creates an atmosphere of understated elegance that has attracted wealthy families for generations. Orchard Lake’s combination of natural beauty, privacy, and proximity to Detroit’s business centers makes it one of the most coveted addresses in the Great Lakes region.
Orchard Lake’s real estate market features some of Michigan’s most valuable residential properties, with many waterfront estates exceeding $2 million and offering private beaches, boat houses, and expansive grounds. The community’s limited inventory and strict zoning create natural scarcity that supports premium prices, while its established reputation ensures continued demand from the state’s most successful residents. Properties with direct lake access or panoramic water views command the highest premiums, reflecting Orchard Lake’s status as Michigan’s premier lakefront residential destination.
2. Leland – 170% Home Price Increase Since 2011
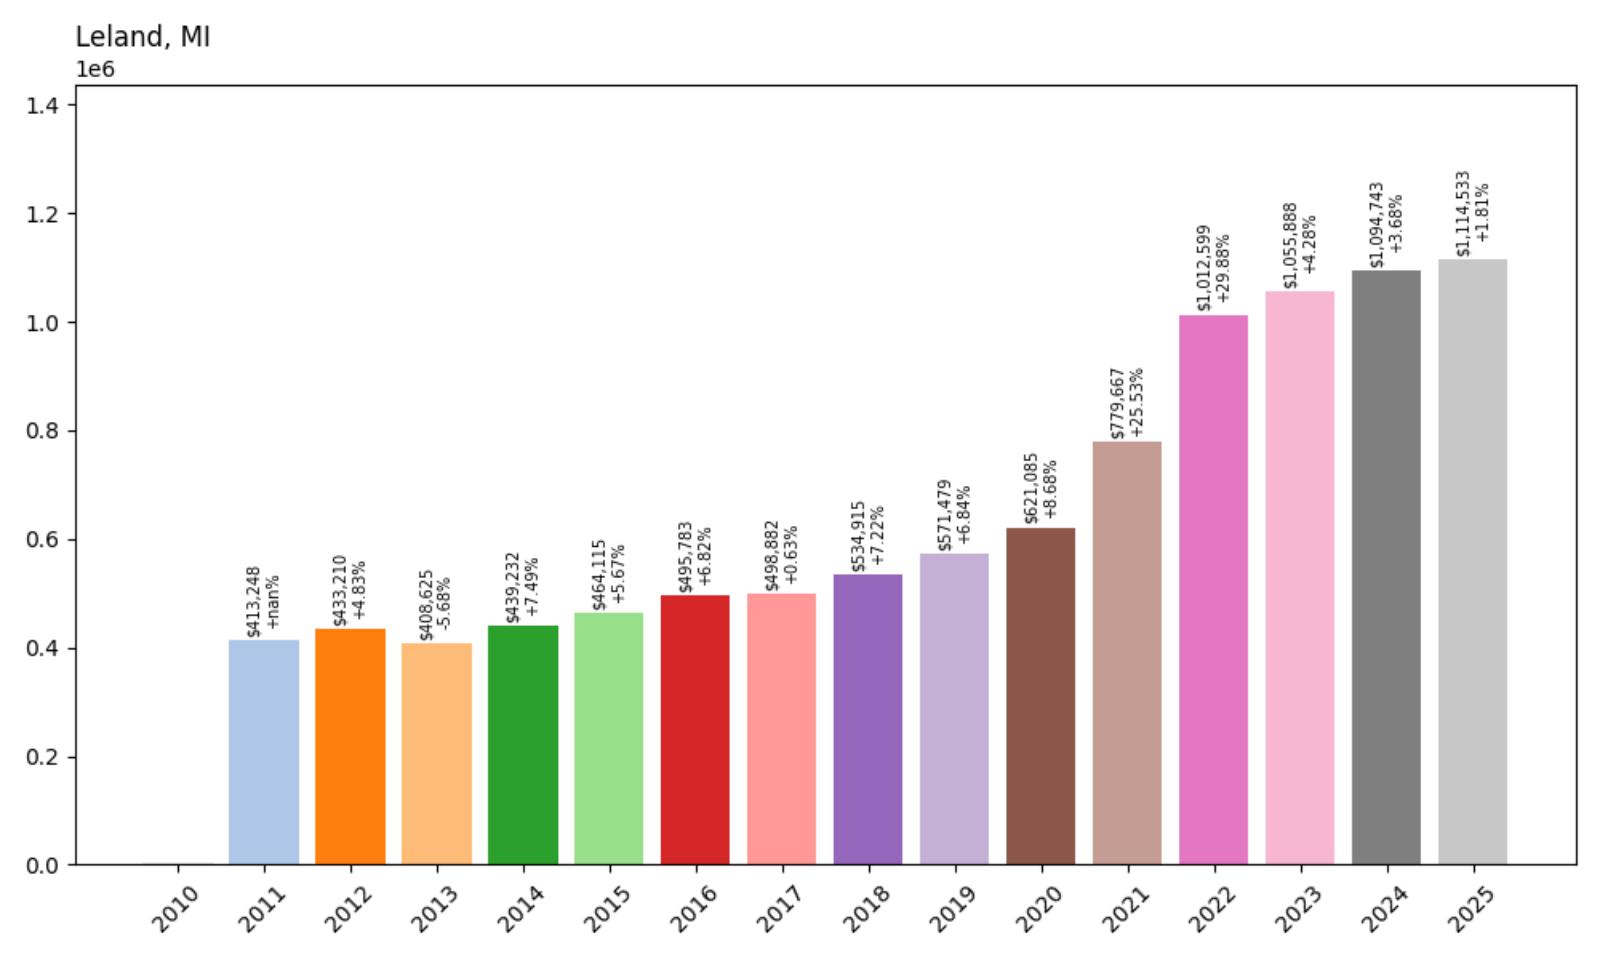
- 2010: N/A
- 2011: $413,248
- 2012: $433,210 (+$19,963, +4.83% from previous year)
- 2013: $408,625 (−$24,586, −5.68% from previous year)
- 2014: $439,232 (+$30,608, +7.49% from previous year)
- 2015: $464,115 (+$24,883, +5.67% from previous year)
- 2016: $495,783 (+$31,668, +6.82% from previous year)
- 2017: $498,882 (+$3,099, +0.63% from previous year)
- 2018: $534,915 (+$36,032, +7.22% from previous year)
- 2019: $571,479 (+$36,565, +6.84% from previous year)
- 2020: $621,085 (+$49,606, +8.68% from previous year)
- 2021: $779,667 (+$158,582, +25.53% from previous year)
- 2022: $1,012,599 (+$232,932, +29.88% from previous year)
- 2023: $1,055,888 (+$43,289, +4.28% from previous year)
- 2024: $1,094,743 (+$38,856, +3.68% from previous year)
- 2025: $1,114,533 (+$19,790, +1.81% from previous year)
Leland has achieved extraordinary 170% growth since 2011, with the current median price of $1,114,533 making it the second-most expensive community in Michigan. The town showed steady growth through most of the 2010s, accelerating significantly in 2020 before experiencing explosive pandemic-era increases of 26% in 2021 and an astounding 30% in 2022 that pushed median values above $1 million. The market has since stabilized with more modest growth, though continued appreciation through 2025 demonstrates sustained confidence in this premier northern Michigan destination.
Leland – The Fishtown Phenomenon
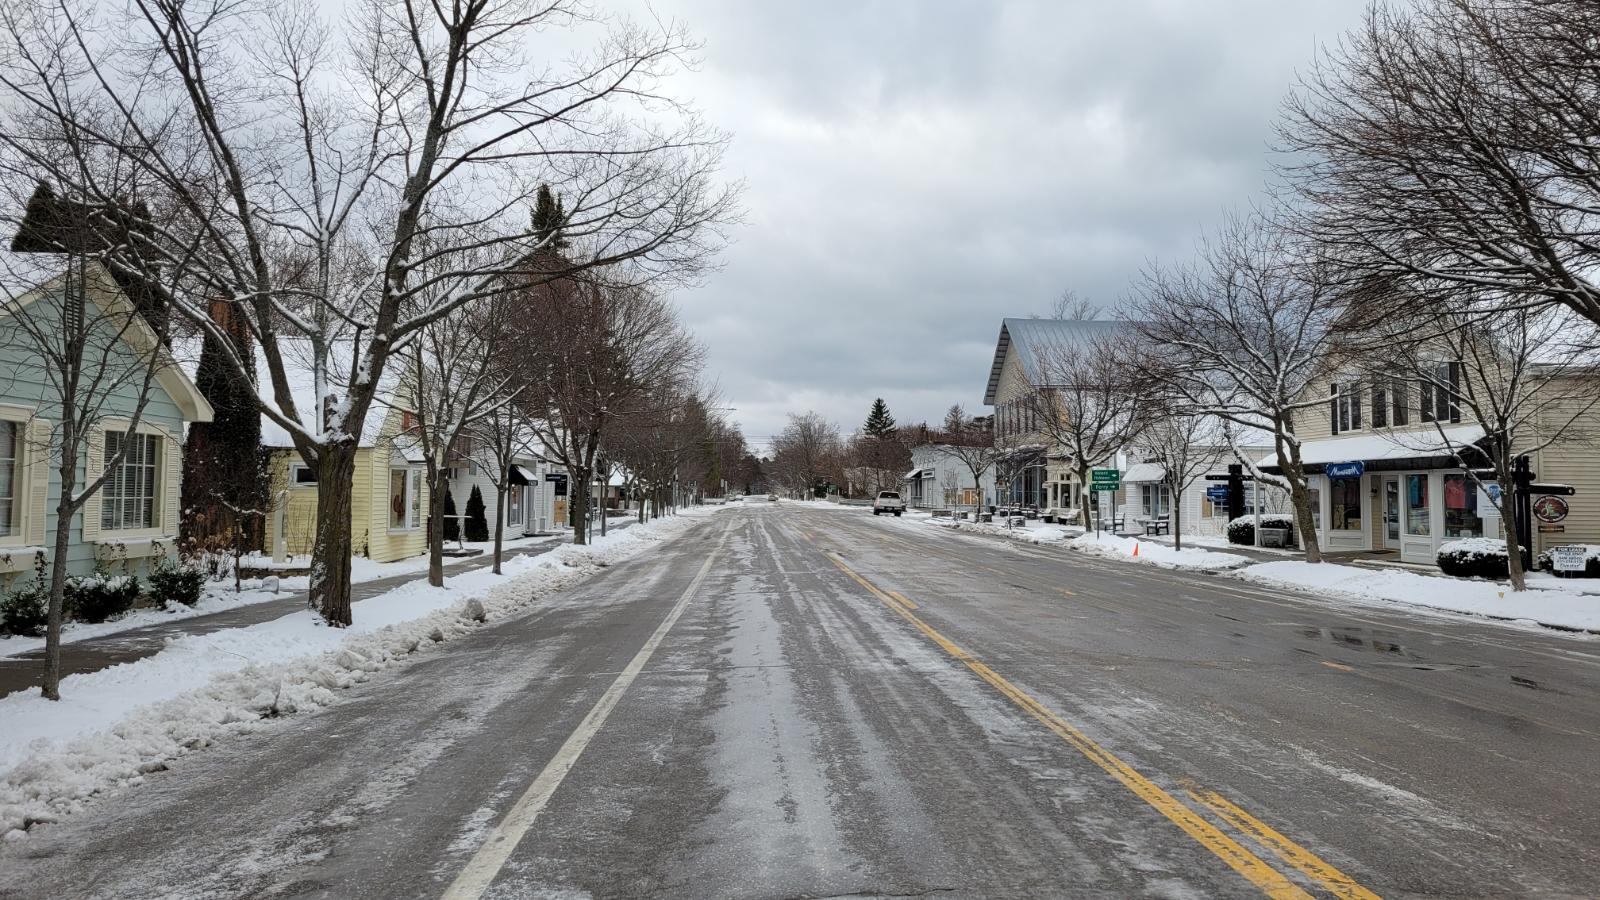
Located on the shores of Lake Michigan at the mouth of the Leland River in Leelanau County, this charming village has evolved from a working fishing community into one of the Midwest’s most exclusive resort destinations. Leland’s historic Fishtown district, with its weathered fishing shanties and working docks, provides authentic character that attracts sophisticated buyers seeking genuine northern Michigan charm. The community’s transformation from fishing village to luxury destination represents one of the most remarkable real estate stories in the Great Lakes region.
The real estate market in Leland reflects its transformation into one of the Great Lakes’ premier destinations, with waterfront properties commanding prices that rival exclusive coastal communities nationwide. The village’s limited size and geographic constraints create extreme scarcity, particularly for properties with lake access or harbor views. Leland’s unique combination of historic character, natural beauty, and modern luxury amenities has created a market where properties regularly exceed $2 million, making it a destination for the most discerning buyers seeking the finest in Great Lakes living.
1. Lake Angelus – 112% Home Price Increase Since 2013
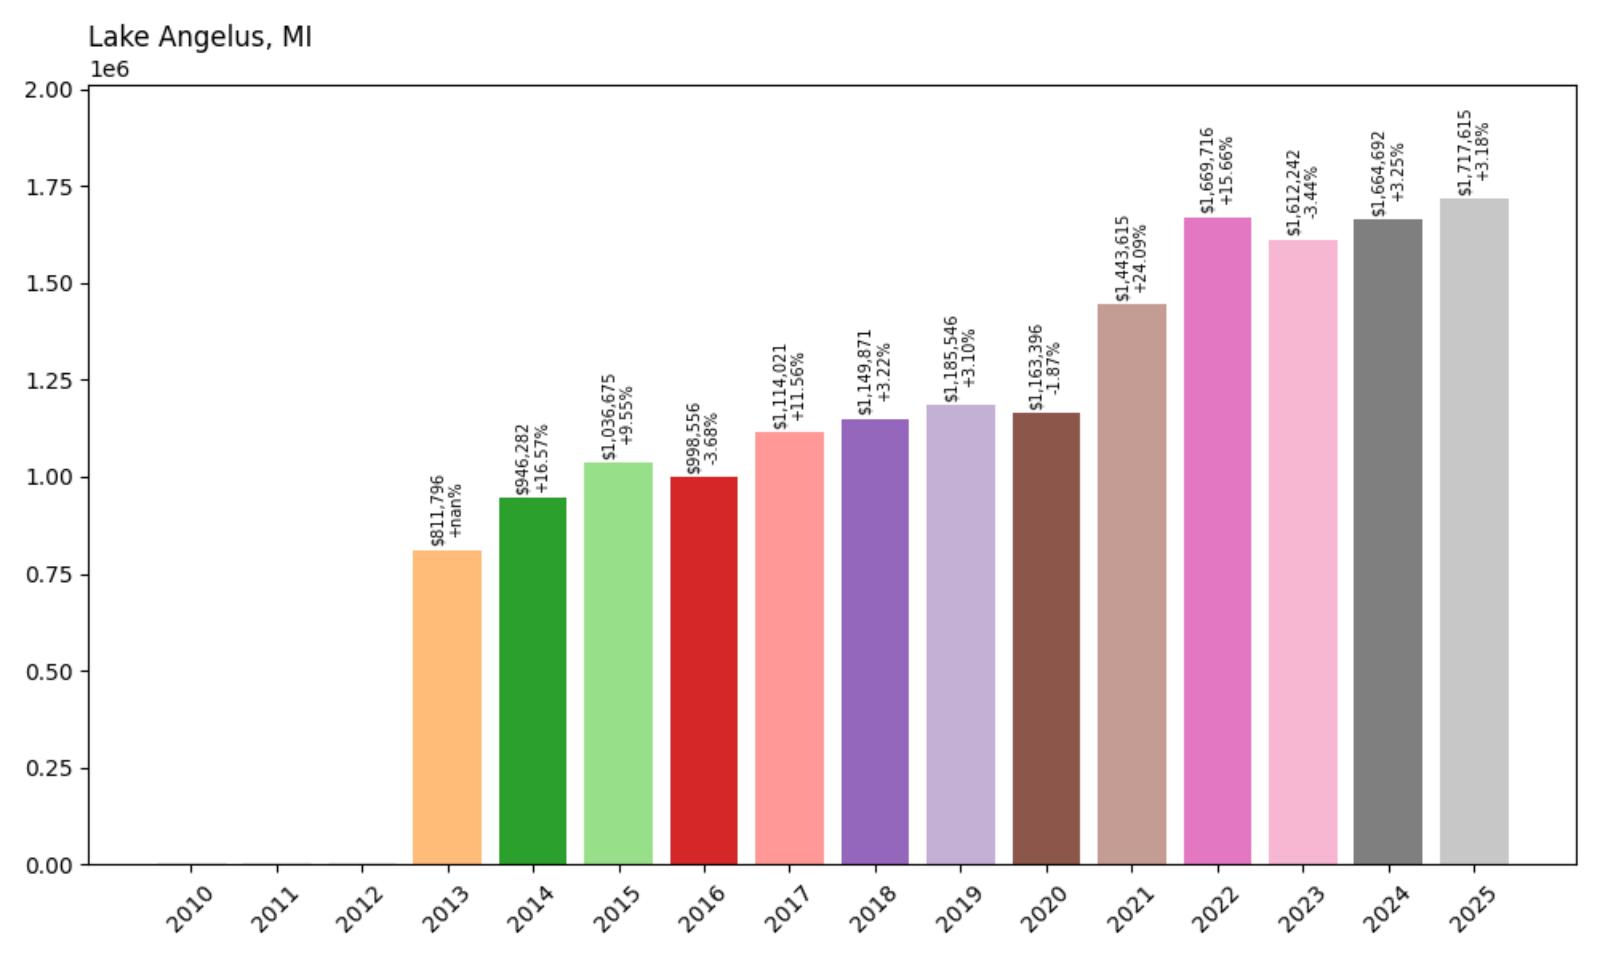
- 2010: N/A
- 2011: N/A
- 2012: N/A
- 2013: $811,796
- 2014: $946,282 (+$134,486, +16.57% from previous year)
- 2015: $1,036,675 (+$90,393, +9.55% from previous year)
- 2016: $998,556 (−$38,119, −3.68% from previous year)
- 2017: $1,114,021 (+$115,465, +11.56% from previous year)
- 2018: $1,149,871 (+$35,850, +3.22% from previous year)
- 2019: $1,185,546 (+$35,675, +3.10% from previous year)
- 2020: $1,163,396 (−$22,149, −1.87% from previous year)
- 2021: $1,443,615 (+$280,218, +24.09% from previous year)
- 2022: $1,669,716 (+$226,101, +15.66% from previous year)
- 2023: $1,612,242 (−$57,474, −3.44% from previous year)
- 2024: $1,664,692 (+$52,450, +3.25% from previous year)
- 2025: $1,717,615 (+$52,923, +3.18% from previous year)
Lake Angelus has achieved impressive 112% growth since 2013, with the current median price of $1,717,615 making it Michigan’s most expensive community. Starting from an already elevated base of over $800,000 in 2013, the city showed strong early growth before experiencing dramatic pandemic-era acceleration, with a spectacular 24% increase in 2021 followed by another solid 16% gain in 2022. After a brief correction in 2023, the market has resumed healthy growth with solid appreciation continuing through 2025, cementing its position as Michigan’s premier residential address.
Lake Angelus – Michigan’s Most Exclusive Address
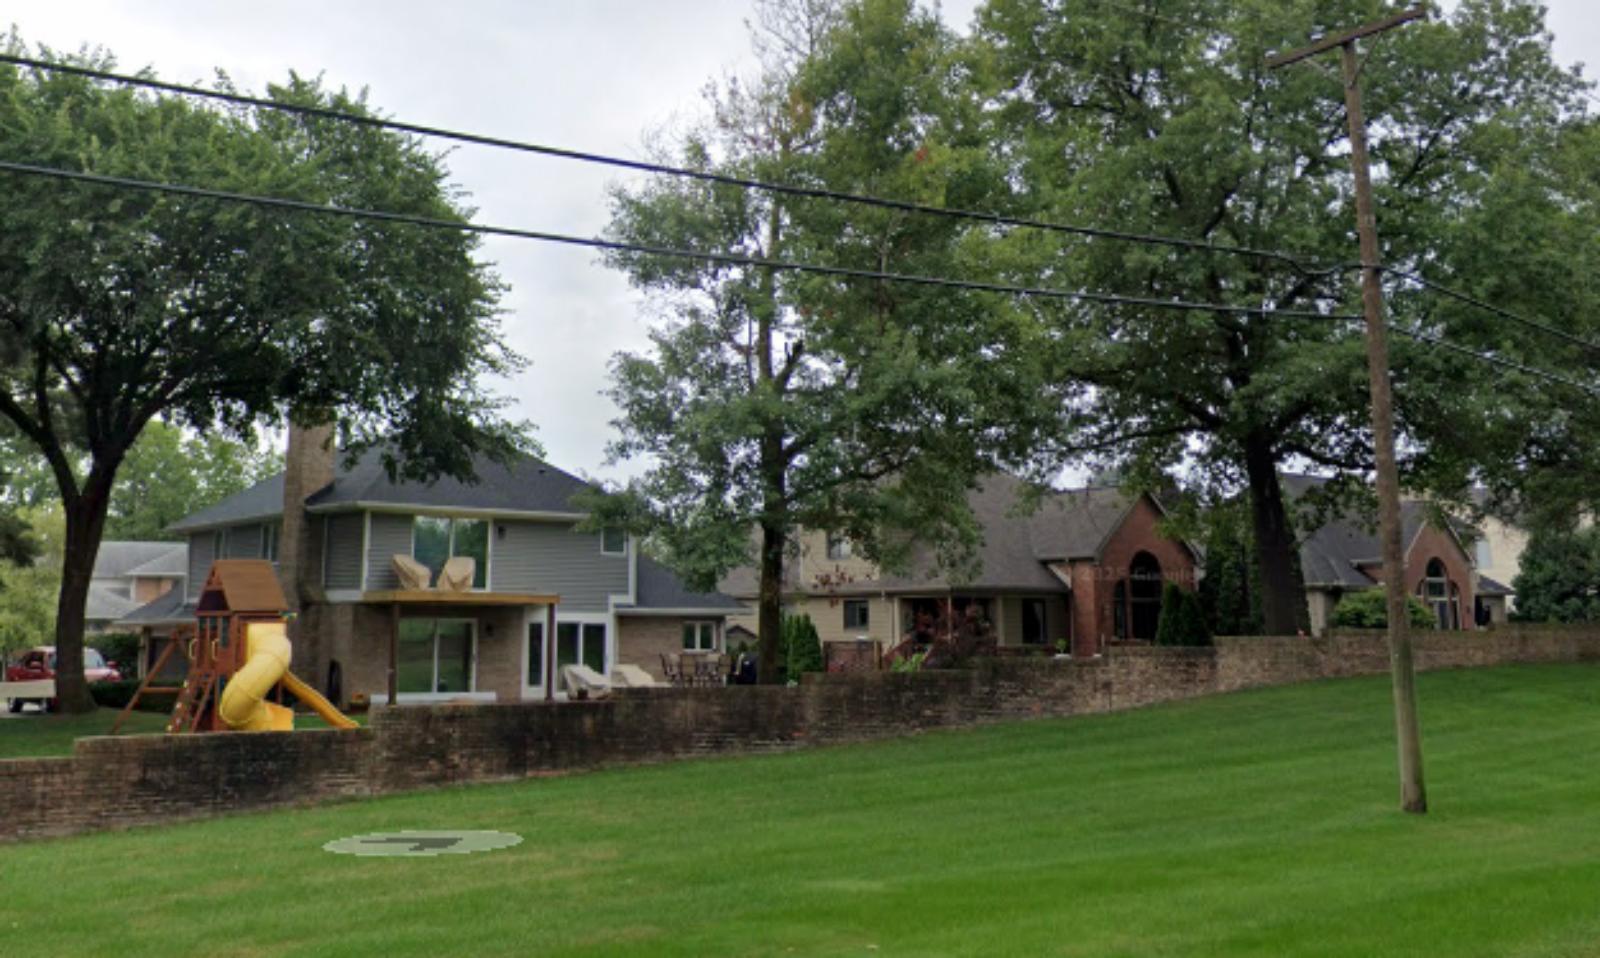
Representing the absolute pinnacle of Michigan luxury living, Lake Angelus stands as the state’s most expensive and exclusive residential community. This tiny municipality in Oakland County, with fewer than 300 residents, surrounds the pristine 108-acre Lake Angelus and features some of the most spectacular estates in the Midwest. The community’s extraordinary privacy, natural beauty, and proximity to Detroit’s business centers create an unparalleled combination that attracts Michigan’s most successful residents and business leaders.
The real estate market in Lake Angelus features Michigan’s most valuable residential properties, with many estates exceeding $3 million and offering private lake frontage, expansive grounds, and architectural significance. The community’s extremely limited inventory creates unparalleled scarcity, with properties rarely coming to market and commanding premium prices when they do. Lake Angelus represents the ultimate achievement in Michigan residential real estate, where natural beauty, absolute privacy, and metropolitan convenience combine to create the state’s most coveted address for those who demand nothing but the finest.