Would you like to save this?
In New York’s priciest towns, the homes are grand—and the price tags are even bigger. The Zillow Home Value Index shows that in 36 elite markets across the Empire State, median home prices now top $1 million. From Hamptons beach estates to stately Westchester Colonials, these communities aren’t just expensive—they’re a full-blown flex. Some have seen prices soar by more than 140% since 2010, while others rode the pandemic surge into the seven-figure club. Whether you’re buying, dreaming, or just nosy, these towns show where New York real estate is anything but modest.
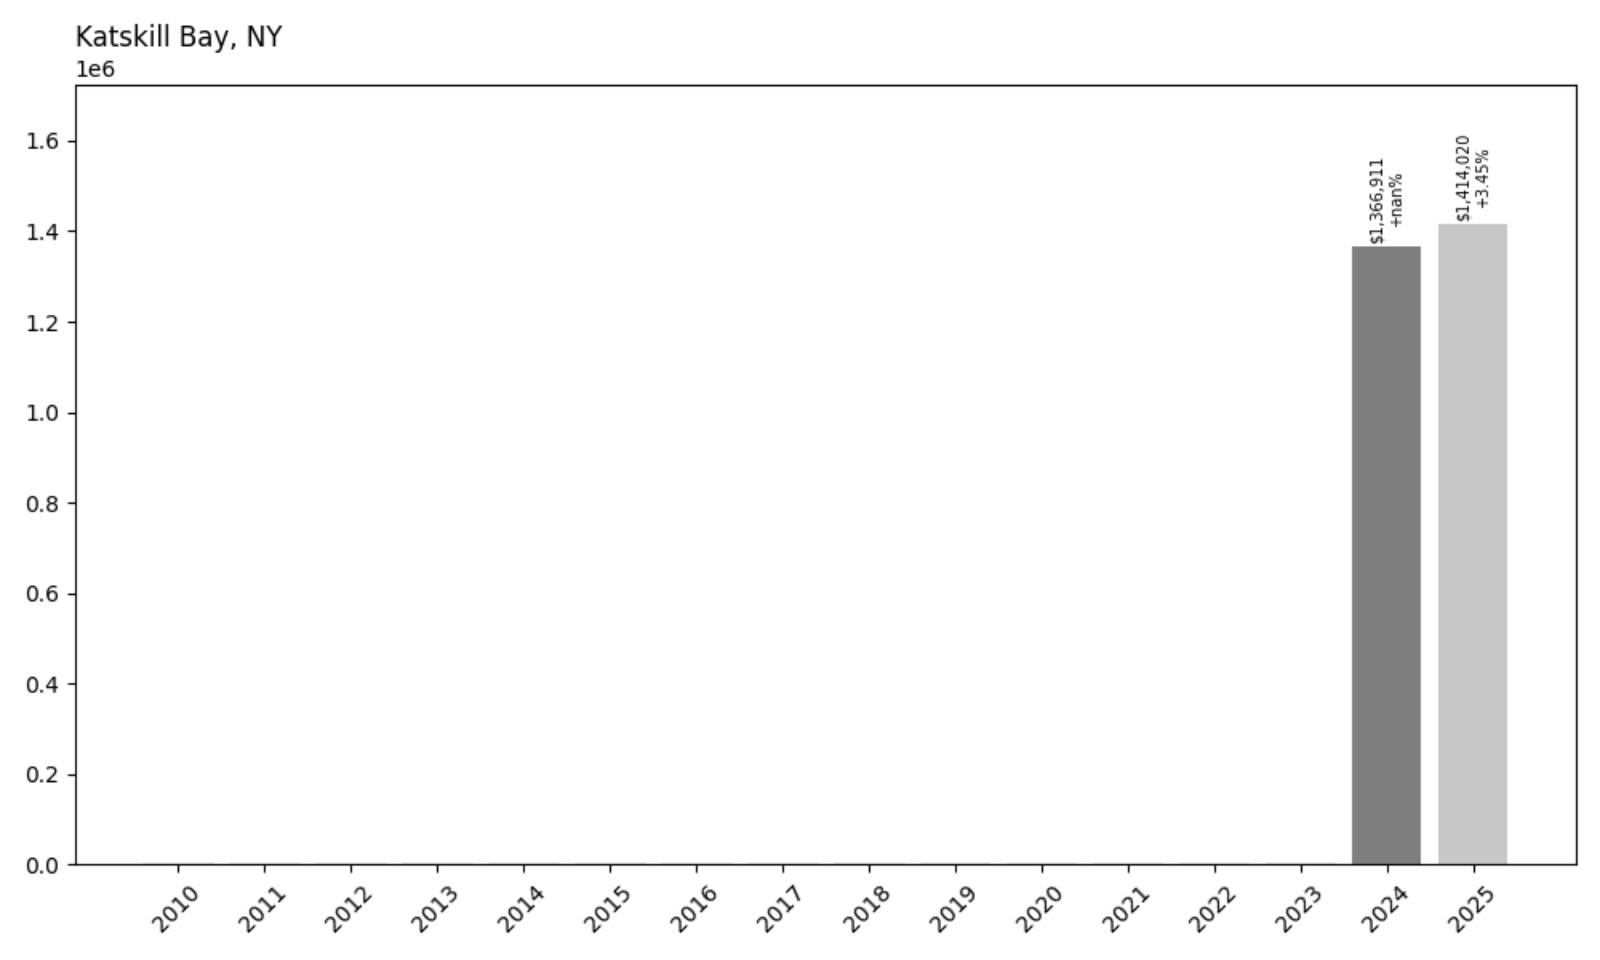
36. Katskill Bay – 3.5% Home Price Increase Since 2024
- 2010: N/A
- 2011: N/A
- 2012: N/A
- 2013: N/A
- 2014: N/A
- 2015: N/A
- 2016: N/A
- 2017: N/A
- 2018: N/A
- 2019: N/A
- 2020: N/A
- 2021: N/A
- 2022: N/A
- 2023: N/A
- 2024: $1,366,911
- 2025: $1,414,020 (+$47,110, +3.45% from previous year)
Katskill Bay represents one of New York’s newer entries into the million-dollar home market, with data only available from 2024. The community has shown steady growth with a 3.5% increase in just one year, bringing median home values to over $1.4 million. This relatively modest but consistent appreciation suggests a stable luxury market that attracts buyers seeking exclusivity without the extreme volatility seen in some other premium locations.
Katskill Bay – Emerging Luxury Market
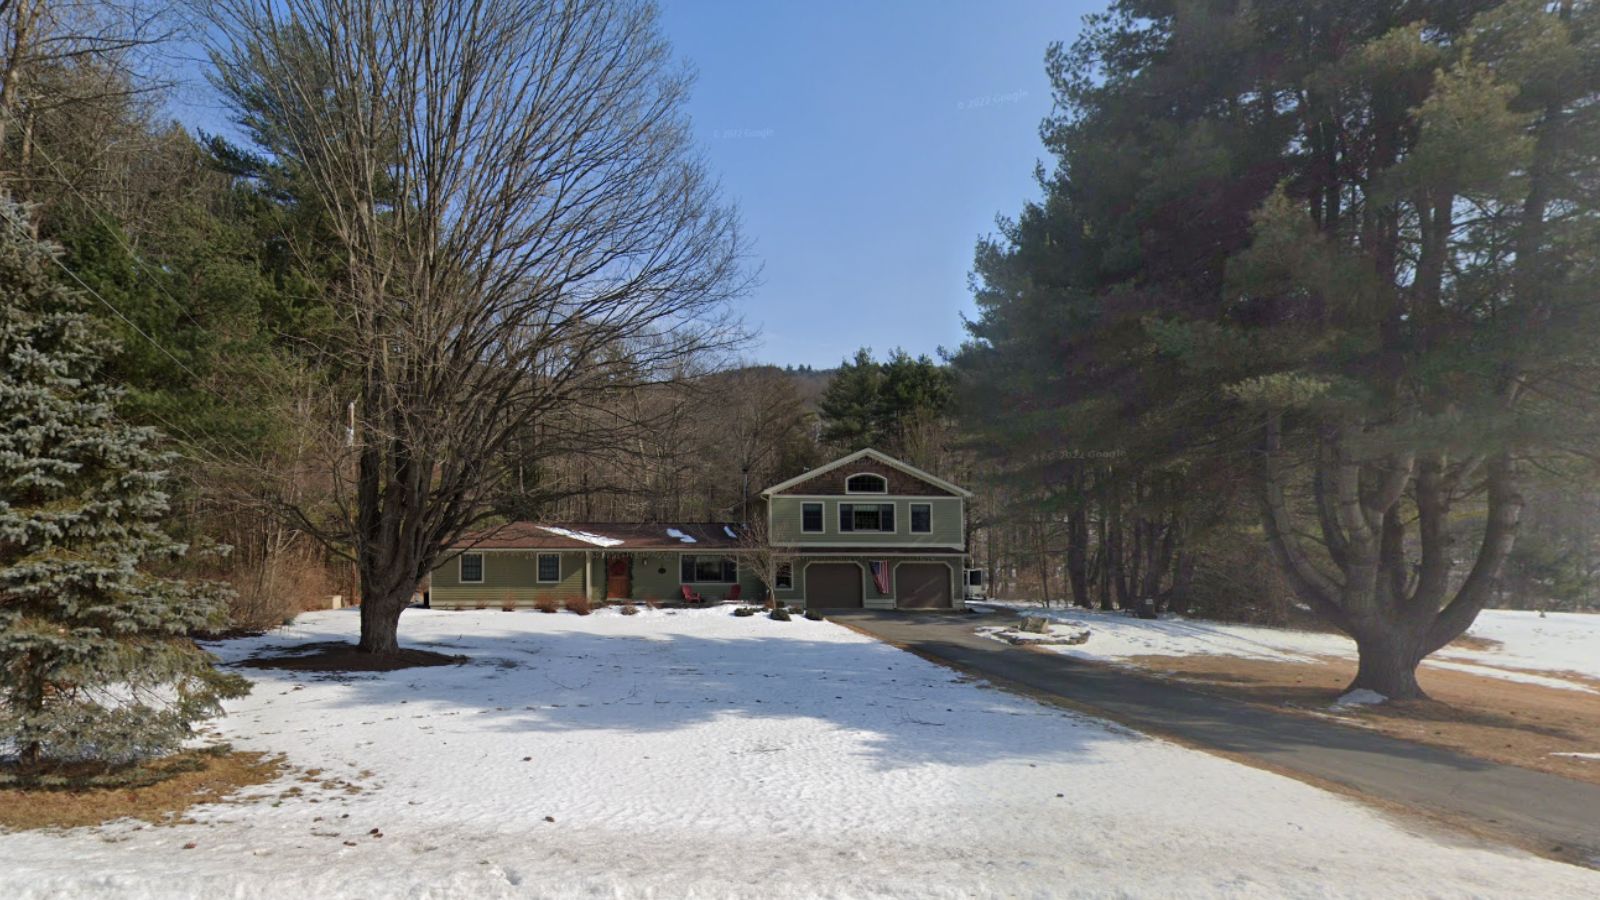
Located in upstate New York, Katskill Bay has quickly established itself as a premium residential destination. The community’s recent emergence in the luxury market reflects growing demand for high-end properties outside traditional metropolitan areas. With current median home prices at $1,414,020, the area appeals to buyers seeking waterfront living and scenic natural surroundings.
The 3.5% year-over-year increase demonstrates healthy market momentum without the speculative bubbles that have affected other luxury markets. This steady appreciation pattern suggests sustainable growth driven by genuine demand rather than investment speculation. The community’s relatively recent data availability indicates it may have crossed the million-dollar threshold only recently, making it an interesting case study in emerging luxury markets.
35. Great Neck – 75.3% Home Price Increase Since 2010
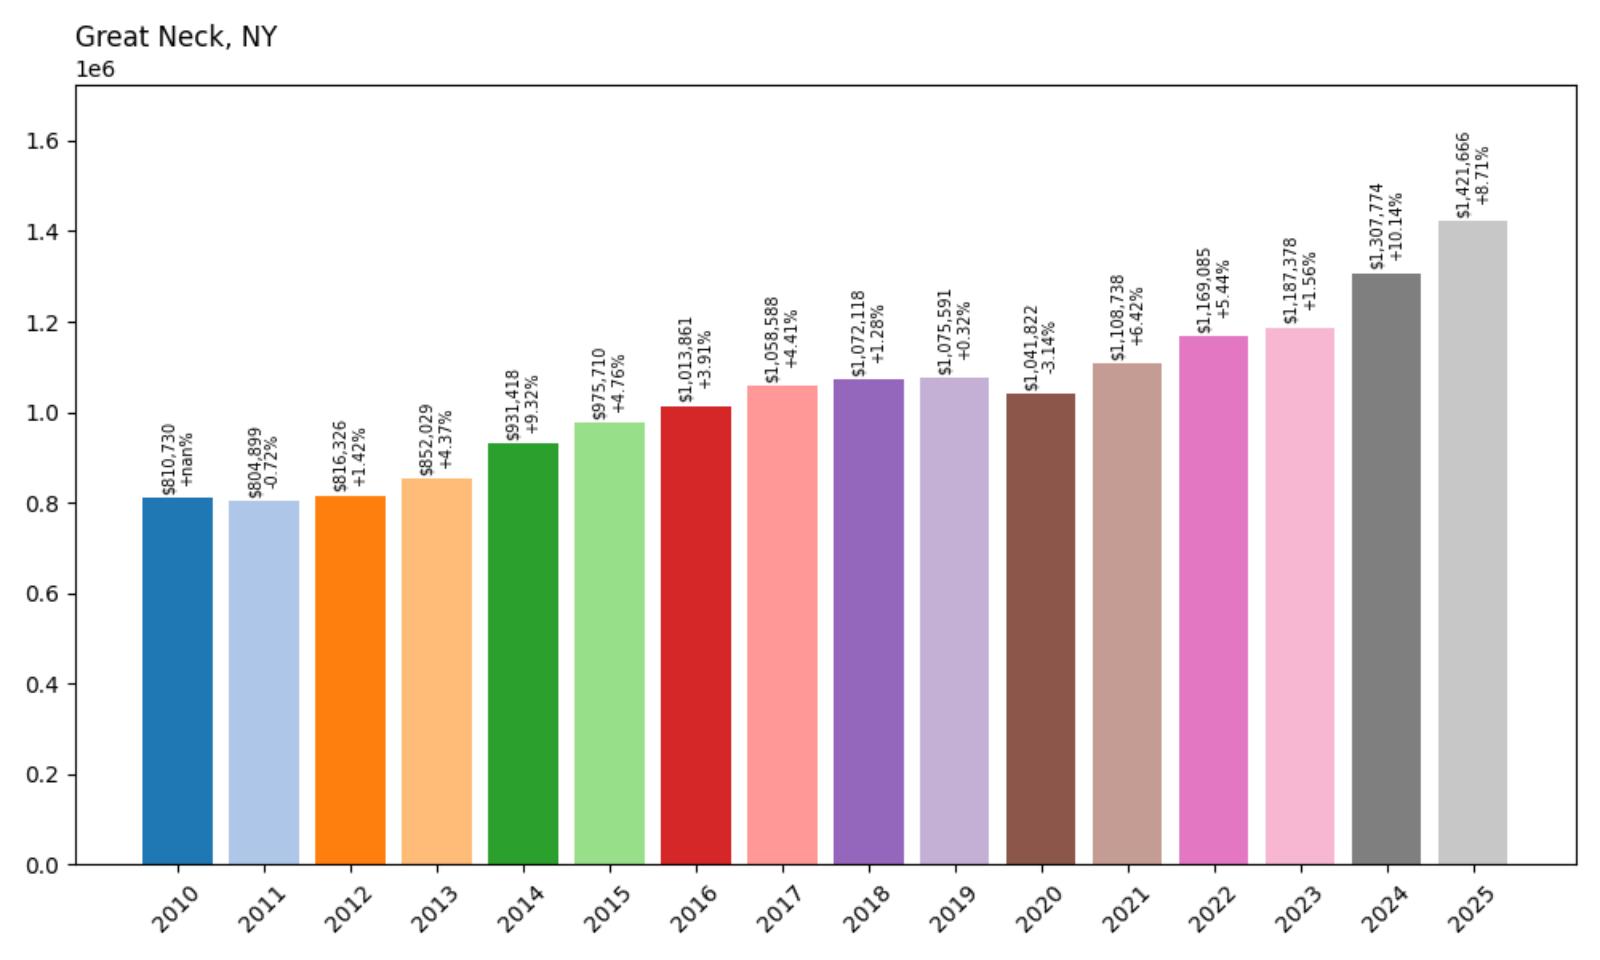
- 2010: $810,730
- 2011: $804,899 (−$5,831, −0.72% from previous year)
- 2012: $816,326 (+$11,427, +1.42% from previous year)
- 2013: $852,029 (+$35,703, +4.37% from previous year)
- 2014: $931,418 (+$79,389, +9.32% from previous year)
- 2015: $975,710 (+$44,292, +4.76% from previous year)
- 2016: $1,013,861 (+$38,151, +3.91% from previous year)
- 2017: $1,058,588 (+$44,727, +4.41% from previous year)
- 2018: $1,072,118 (+$13,530, +1.28% from previous year)
- 2019: $1,075,591 (+$3,473, +0.32% from previous year)
- 2020: $1,041,822 (−$33,769, −3.14% from previous year)
- 2021: $1,108,738 (+$66,916, +6.42% from previous year)
- 2022: $1,169,085 (+$60,347, +5.44% from previous year)
- 2023: $1,187,378 (+$18,293, +1.56% from previous year)
- 2024: $1,307,774 (+$120,396, +10.14% from previous year)
- 2025: $1,421,666 (+$113,892, +8.71% from previous year)
Great Neck has demonstrated impressive long-term growth with a 75.3% increase since 2010, transforming from a sub-million-dollar market to commanding over $1.4 million today. The data reveals particularly strong momentum in recent years, with 2024 showing a notable 10.14% jump followed by 8.71% growth in 2025. The community crossed the million-dollar threshold in 2016 and has maintained steady appreciation since, with only a brief decline during the 2020 market disruption.
Great Neck – Long Island’s Prestigious Peninsula
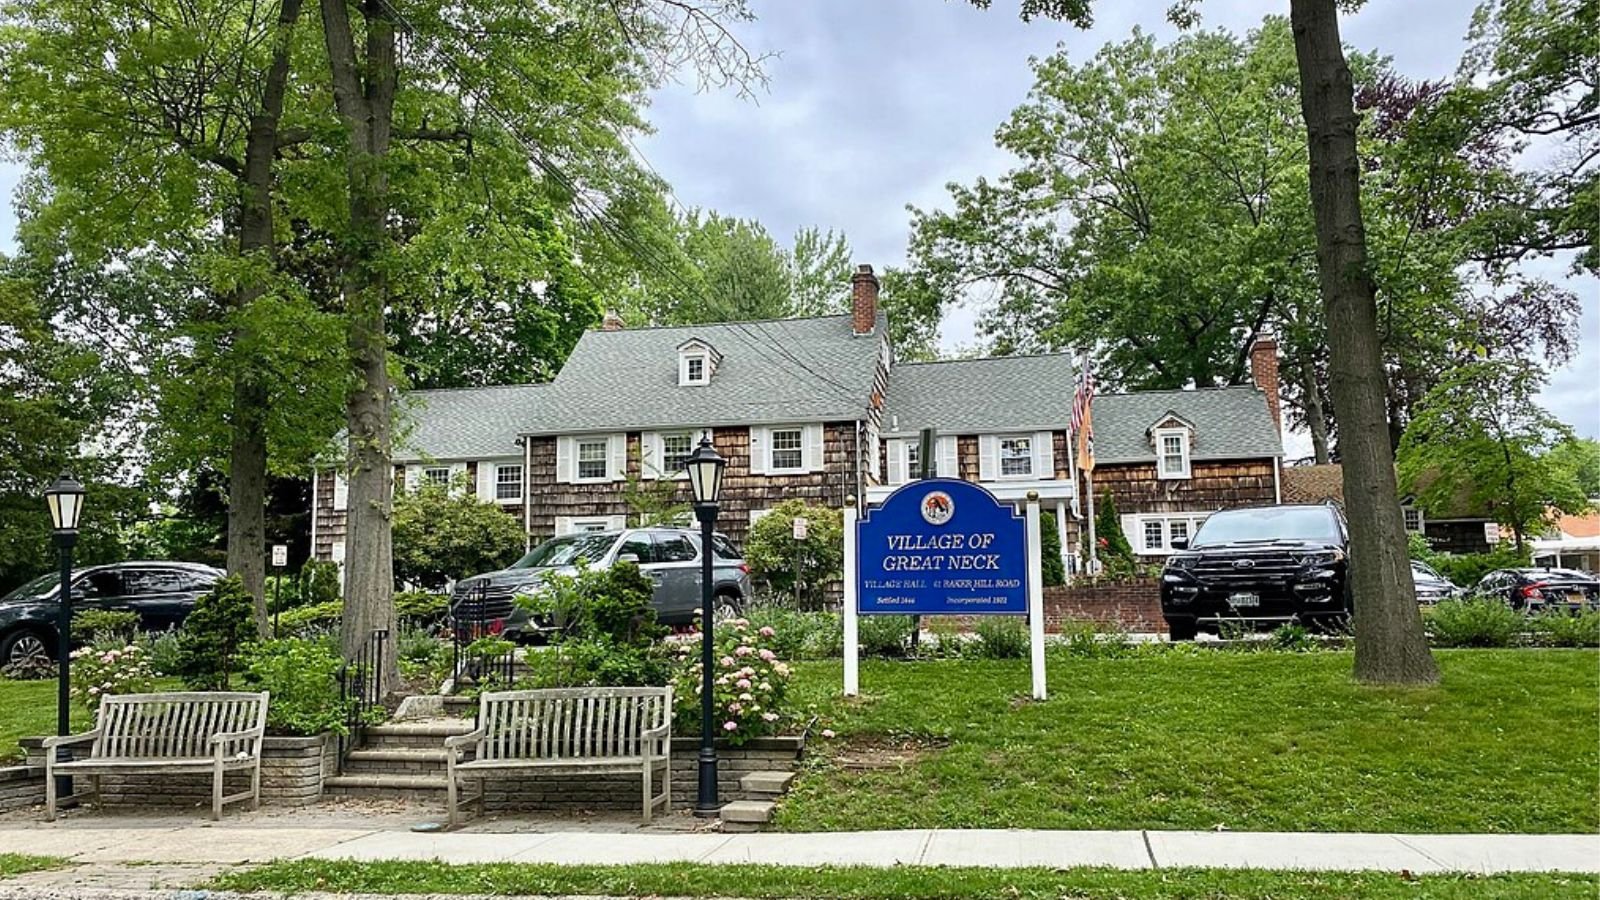
Great Neck, located on Long Island’s North Shore, has long been recognized as one of New York’s most desirable suburban communities. The peninsula town offers easy access to Manhattan via the Long Island Rail Road while maintaining a distinct suburban character with excellent schools and upscale amenities. Its strategic location between Manhasset Bay and Little Neck Bay provides residents with waterfront access and scenic views that contribute significantly to property values.
The community’s steady price appreciation reflects its appeal to affluent professionals seeking proximity to New York City without sacrificing suburban comforts. Great Neck’s reputation for excellent public schools and safe neighborhoods has made it particularly attractive to families, driving consistent demand that supports the 75.3% price growth since 2010. The recent acceleration in price growth, with increases exceeding 8% annually in 2024 and 2025, indicates continued strong market fundamentals.
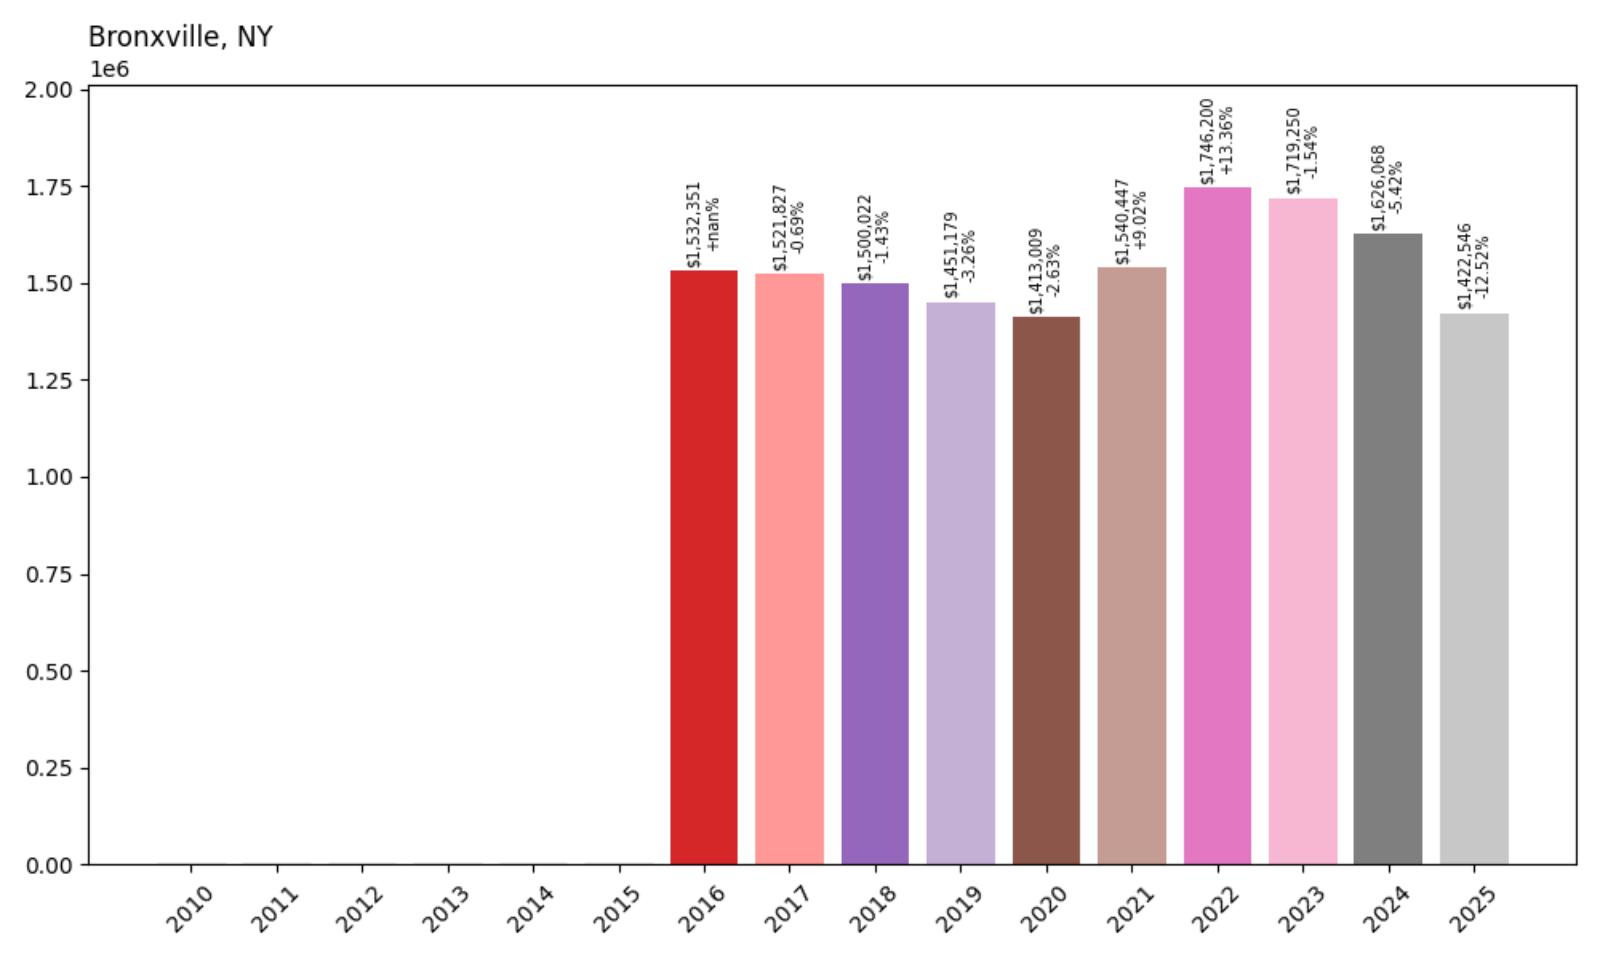
34. Bronxville – 7.2% Home Price Decrease Since 2016
- 2010: N/A
- 2011: N/A
- 2012: N/A
- 2013: N/A
- 2014: N/A
- 2015: N/A
- 2016: $1,532,351
- 2017: $1,521,827 (−$10,524, −0.69% from previous year)
- 2018: $1,500,022 (−$21,805, −1.43% from previous year)
- 2019: $1,451,179 (−$48,842, −3.26% from previous year)
- 2020: $1,413,009 (−$38,171, −2.63% from previous year)
- 2021: $1,540,447 (+$127,438, +9.02% from previous year)
- 2022: $1,746,200 (+$205,753, +13.36% from previous year)
- 2023: $1,719,250 (−$26,950, −1.54% from previous year)
- 2024: $1,626,068 (−$93,182, −5.42% from previous year)
- 2025: $1,422,546 (−$203,521, −12.52% from previous year)
Bronxville presents a unique case among New York’s expensive markets, showing a 7.2% decline since 2016 despite reaching a peak of $1.75 million in 2022. The data reveals significant volatility, with dramatic swings from a 13.36% surge in 2022 to a concerning 12.52% drop in 2025. This pattern suggests market corrections following pandemic-era speculation, with current prices settling back toward more sustainable levels around $1.42 million.
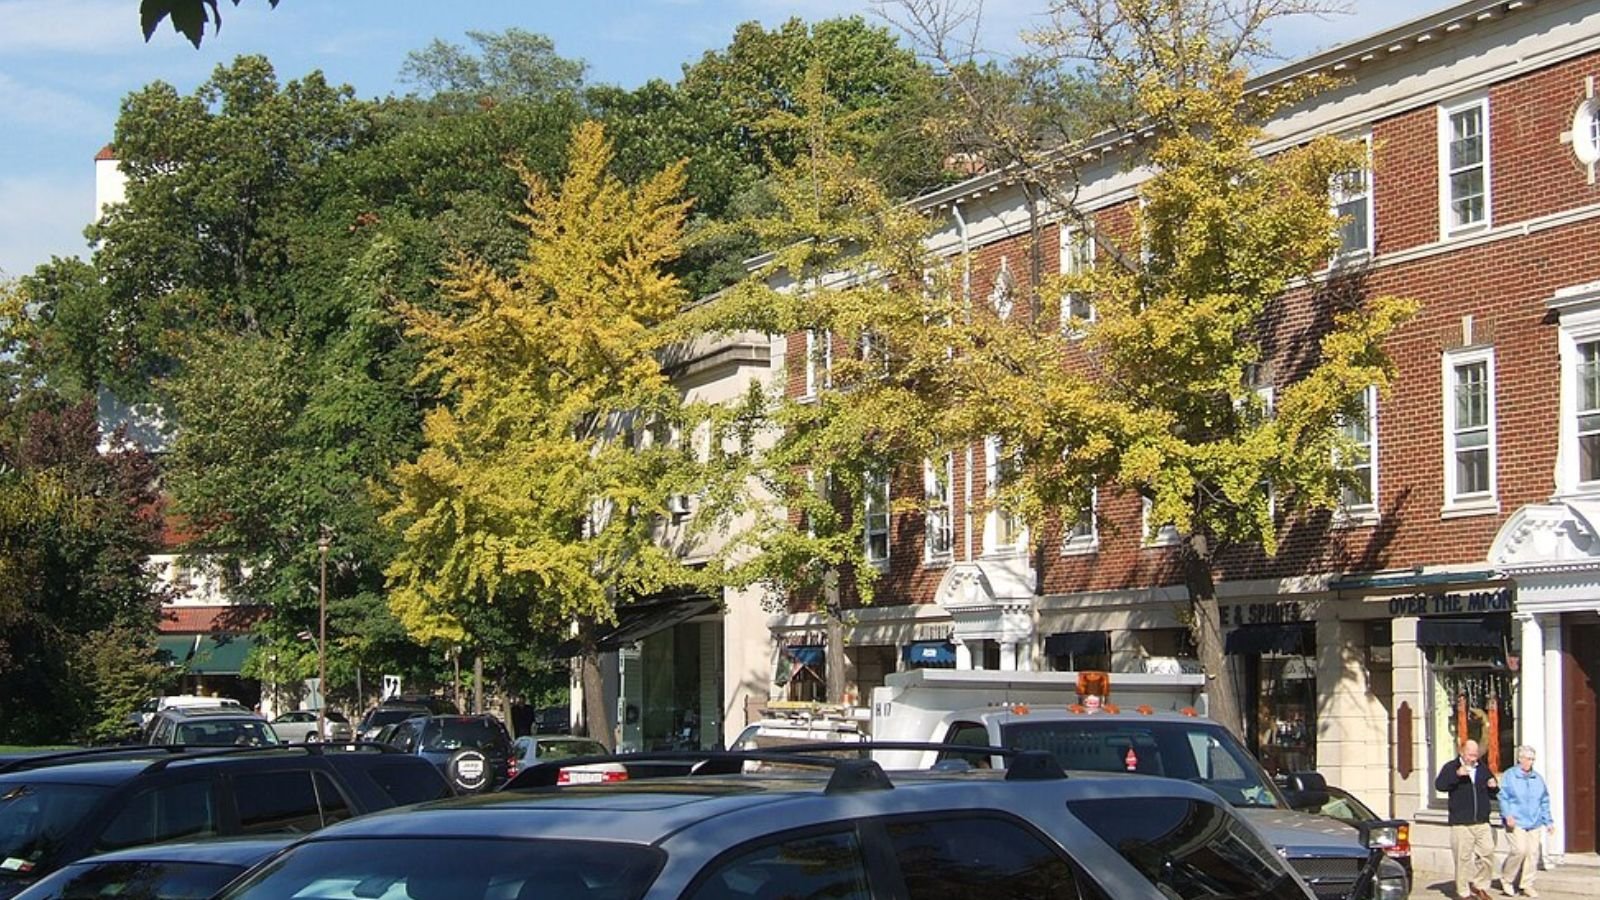
Bronxville – Westchester County’s Historic Village
Would you like to save this?
Bronxville, a small village in Westchester County, has historically been one of New York’s most exclusive residential communities. Known for its picturesque downtown, excellent schools, and easy commuter access to Manhattan, the village has traditionally commanded premium prices. The recent price volatility reflects broader market trends affecting high-end Westchester communities, where pandemic-era speculation drove prices to unsustainable levels.
The dramatic price swings shown in the data, from lows in 2020 to peaks in 2022 and subsequent declines, mirror patterns seen across many luxury markets during and after the pandemic. The current median price of $1.42 million, while down from recent peaks, still represents significant value for one of Westchester’s most prestigious addresses. The market correction appears to be bringing prices back to more fundamental levels based on local income and demand patterns.
33. Woodbury – 66.0% Home Price Increase Since 2010
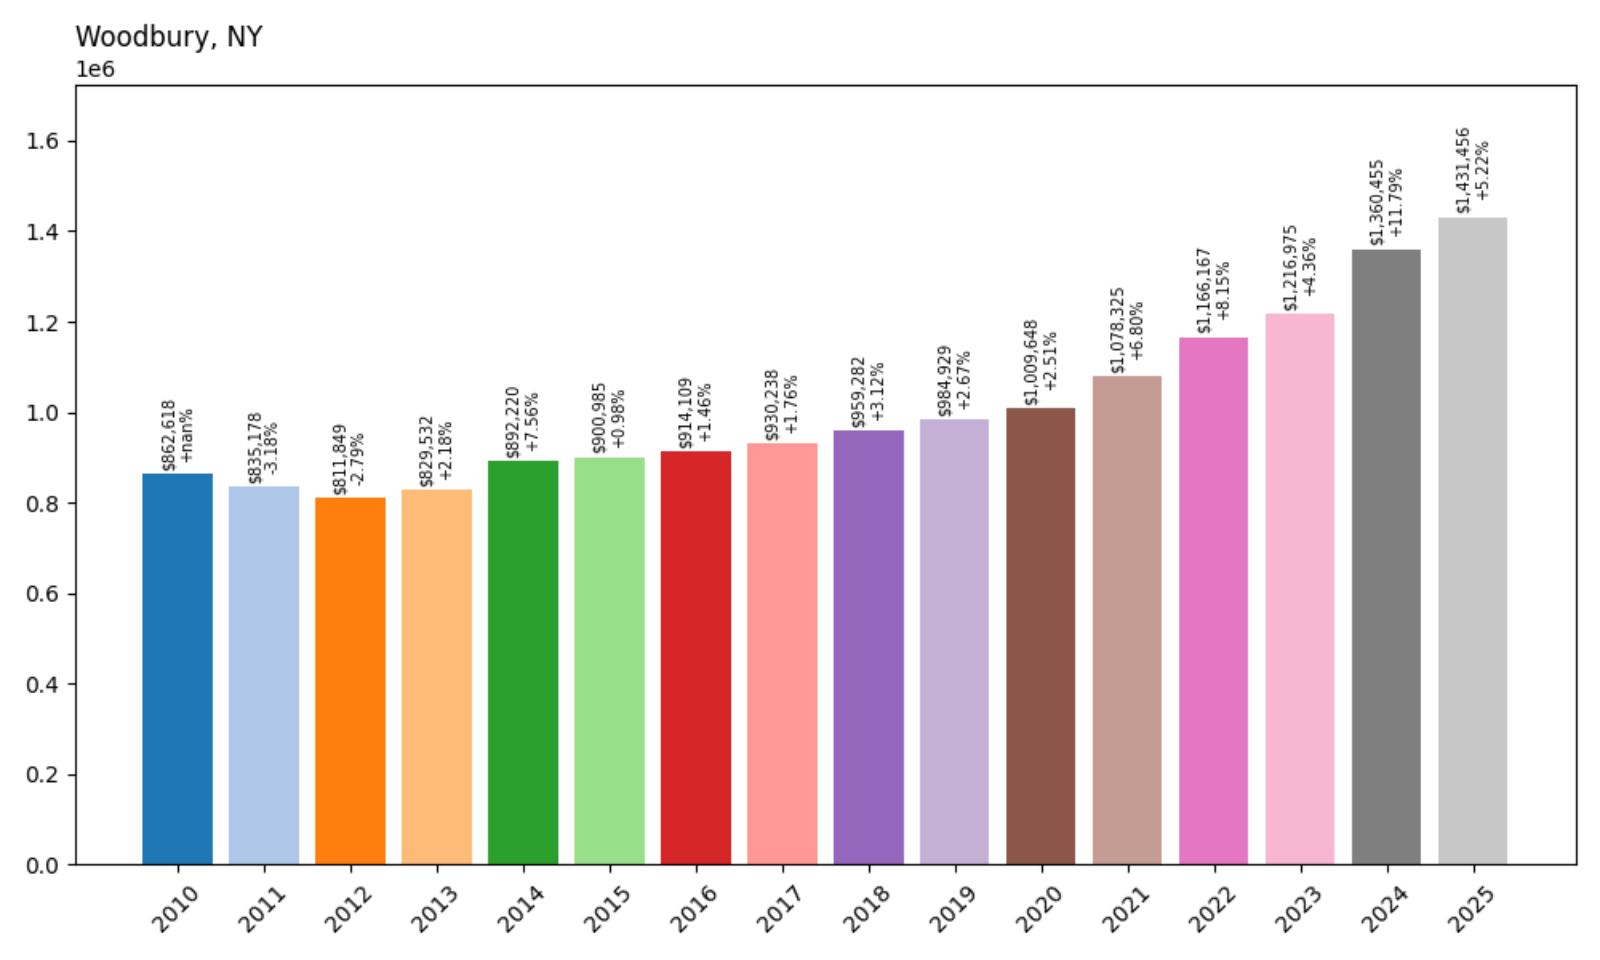
- 2010: $862,618
- 2011: $835,178 (−$27,440, −3.18% from previous year)
- 2012: $811,849 (−$23,329, −2.79% from previous year)
- 2013: $829,532 (+$17,684, +2.18% from previous year)
- 2014: $892,220 (+$62,688, +7.56% from previous year)
- 2015: $900,985 (+$8,765, +0.98% from previous year)
- 2016: $914,109 (+$13,124, +1.46% from previous year)
- 2017: $930,238 (+$16,129, +1.76% from previous year)
- 2018: $959,282 (+$29,044, +3.12% from previous year)
- 2019: $984,929 (+$25,647, +2.67% from previous year)
- 2020: $1,009,648 (+$24,719, +2.51% from previous year)
- 2021: $1,078,325 (+$68,677, +6.80% from previous year)
- 2022: $1,166,167 (+$87,841, +8.15% from previous year)
- 2023: $1,216,975 (+$50,808, +4.36% from previous year)
- 2024: $1,360,455 (+$143,480, +11.79% from previous year)
- 2025: $1,431,456 (+$71,001, +5.22% from previous year)
Woodbury demonstrates remarkable consistency in its upward trajectory, achieving a solid 66% increase since 2010 without the dramatic volatility seen in other markets. The community crossed the million-dollar threshold in 2020 and has maintained steady growth since, with particularly strong performance in 2024 showing an 11.79% increase. This pattern reflects a mature, stable luxury market with sustained demand supporting continued appreciation.
Woodbury – Nassau County’s Steady Performer

Located in Nassau County on Long Island, Woodbury has established itself as a consistently appreciating market that appeals to affluent families seeking suburban tranquility with urban accessibility. The community’s location provides convenient access to both New York City and Long Island’s business centers, making it attractive to professionals across various industries. Woodbury’s excellent school system and family-friendly atmosphere have contributed to sustained demand that supports its steady price growth.
The 66% appreciation since 2010 reflects the community’s fundamental appeal rather than speculative bubbles. Unlike some markets that experienced dramatic swings, Woodbury’s growth pattern shows the kind of sustainable appreciation that builds long-term value for homeowners. The recent acceleration in 2024, with an 11.79% increase, suggests the market remains robust despite broader economic uncertainties affecting other luxury communities.
32. Orient – 112.1% Home Price Increase Since 2010
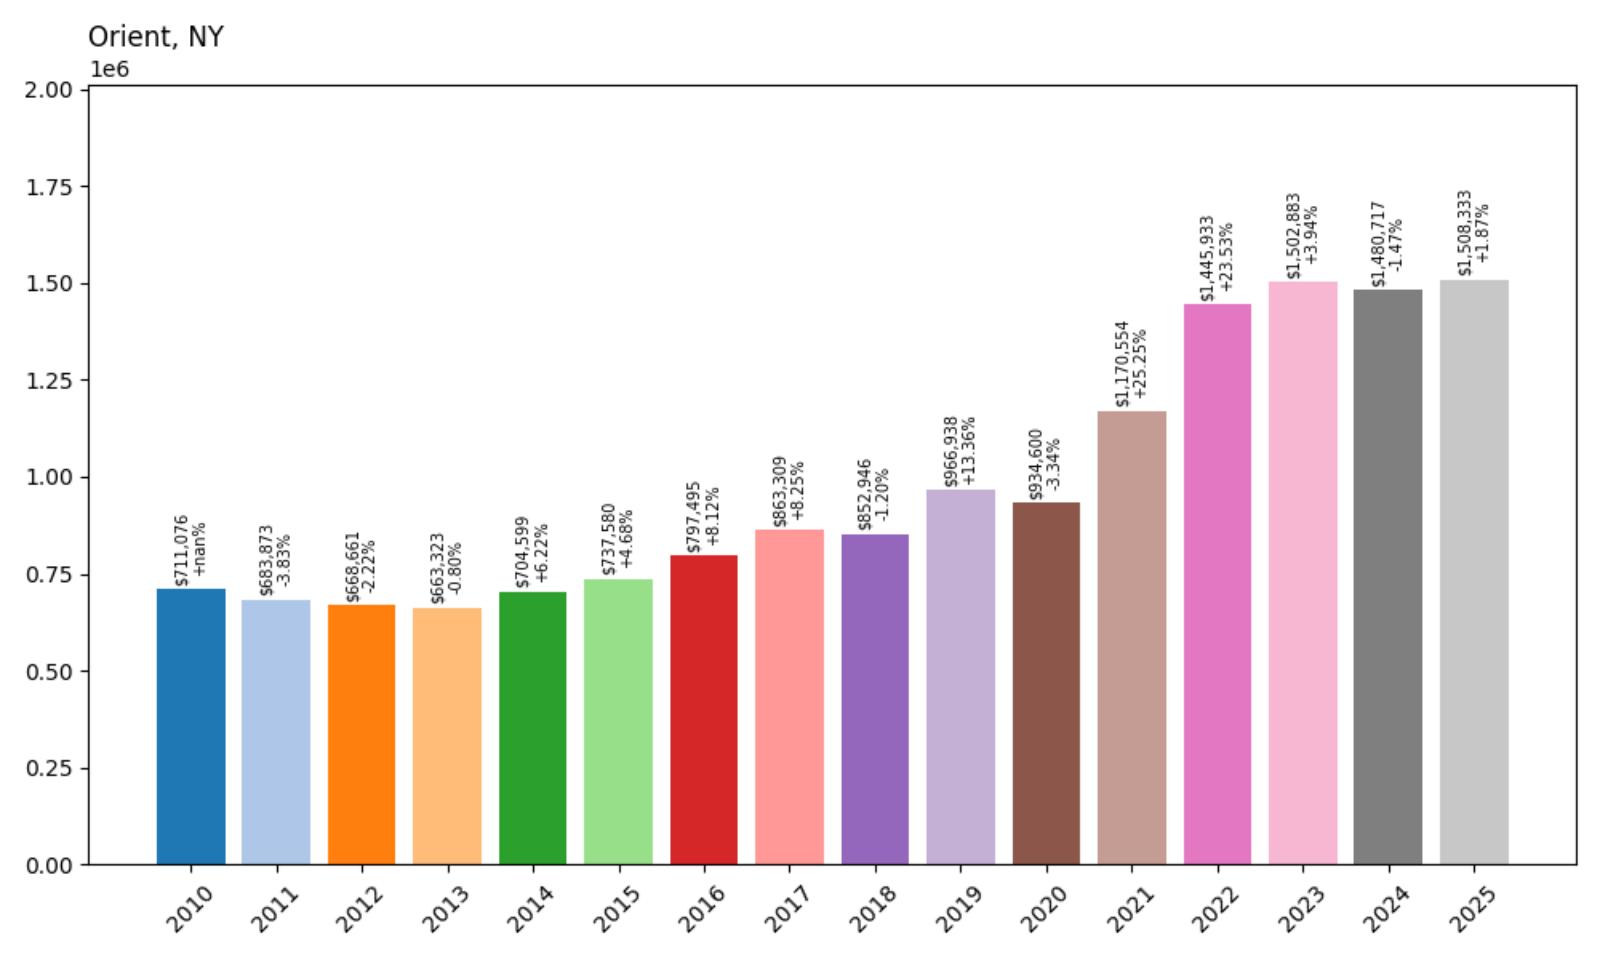
- 2010: $711,076
- 2011: $683,873 (−$27,203, −3.83% from previous year)
- 2012: $668,661 (−$15,212, −2.22% from previous year)
- 2013: $663,323 (−$5,338, −0.80% from previous year)
- 2014: $704,599 (+$41,276, +6.22% from previous year)
- 2015: $737,580 (+$32,981, +4.68% from previous year)
- 2016: $797,495 (+$59,915, +8.12% from previous year)
- 2017: $863,309 (+$65,815, +8.25% from previous year)
- 2018: $852,946 (−$10,364, −1.20% from previous year)
- 2019: $966,938 (+$113,992, +13.36% from previous year)
- 2020: $934,600 (−$32,338, −3.34% from previous year)
- 2021: $1,170,554 (+$235,954, +25.25% from previous year)
- 2022: $1,445,933 (+$275,378, +23.53% from previous year)
- 2023: $1,502,883 (+$56,950, +3.94% from previous year)
- 2024: $1,480,717 (−$22,166, −1.47% from previous year)
- 2025: $1,508,333 (+$27,616, +1.87% from previous year)
Orient showcases one of the most dramatic transformation stories among New York’s expensive towns, with an impressive 112.1% increase since 2010 that elevated the community from around $700,000 to over $1.5 million today. The data reveals explosive growth during the pandemic years, with back-to-back increases of 25.25% in 2021 and 23.53% in 2022. Recent years show market stabilization around the $1.5 million level, suggesting prices have found a new equilibrium after the dramatic run-up.
Orient – Long Island’s Eastern Tip Transformation
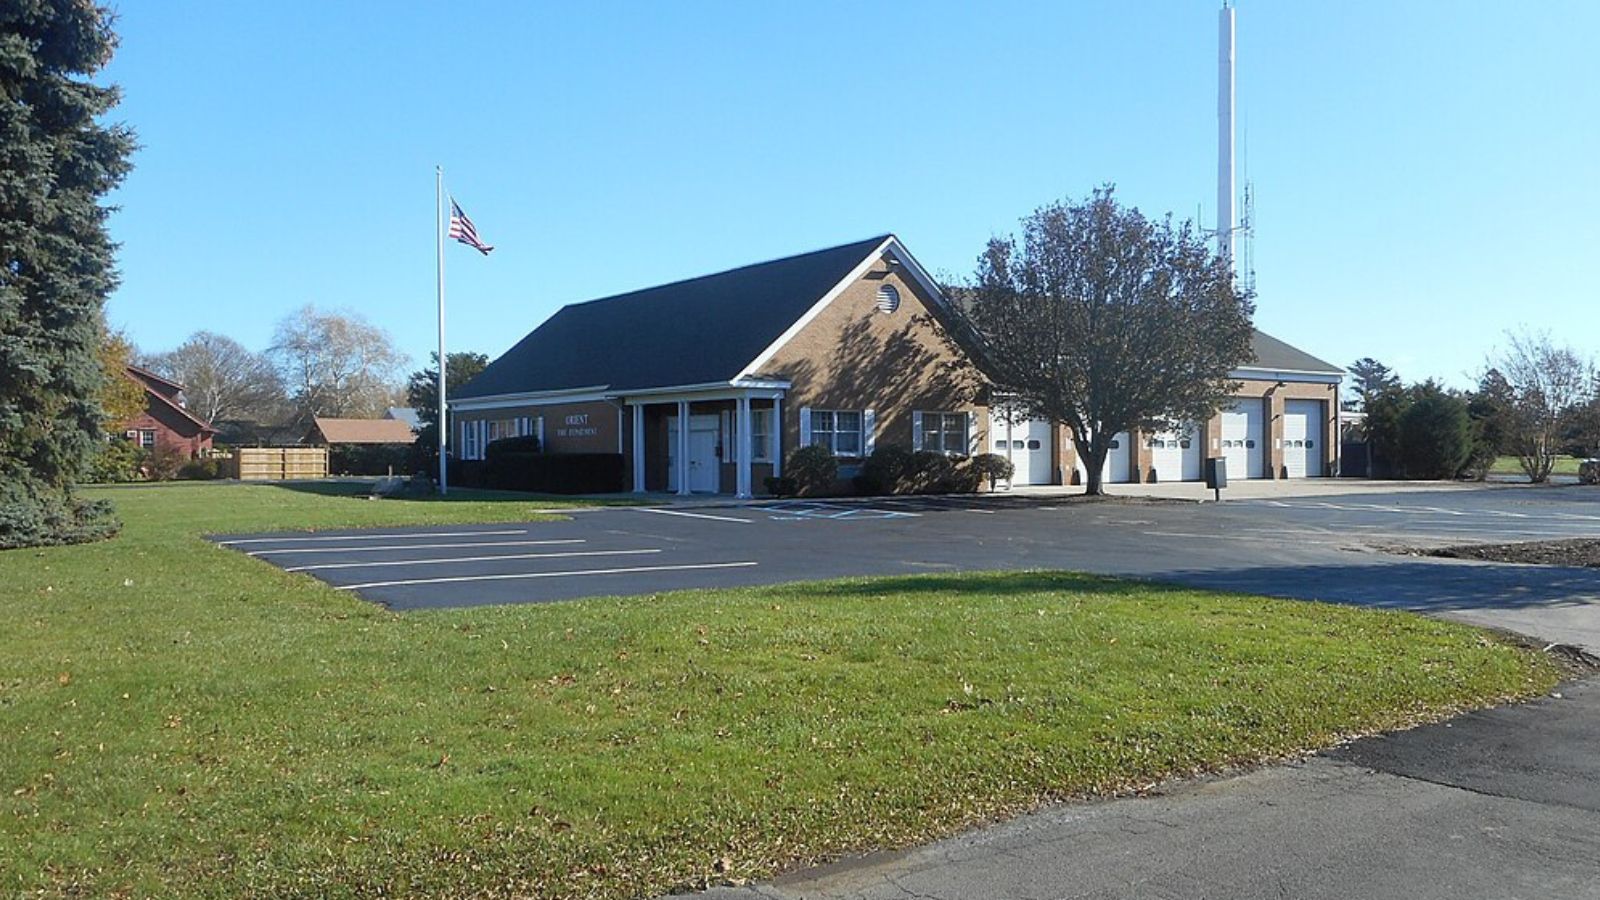
Orient, located at the eastern tip of Long Island’s North Fork, has undergone a remarkable transformation from a relatively affordable coastal community to a luxury destination. The town’s position between Long Island Sound and Peconic Bay provides stunning waterfront access and scenic beauty that has attracted affluent buyers seeking escape from urban centers. Orient’s rural character and agricultural heritage, combined with its proximity to the Hamptons, has made it increasingly attractive to buyers seeking authentic Long Island charm.
The 112.1% price appreciation since 2010 reflects the community’s evolution from a hidden gem to a recognized luxury market. The explosive growth during 2021-2022, when prices jumped from under $1 million to nearly $1.5 million, coincided with pandemic-driven demand for rural properties with water access. While recent price movements show some stabilization, the current median of $1.5 million represents a new baseline for this transformed market that continues to attract buyers seeking Long Island’s most authentic coastal experience.
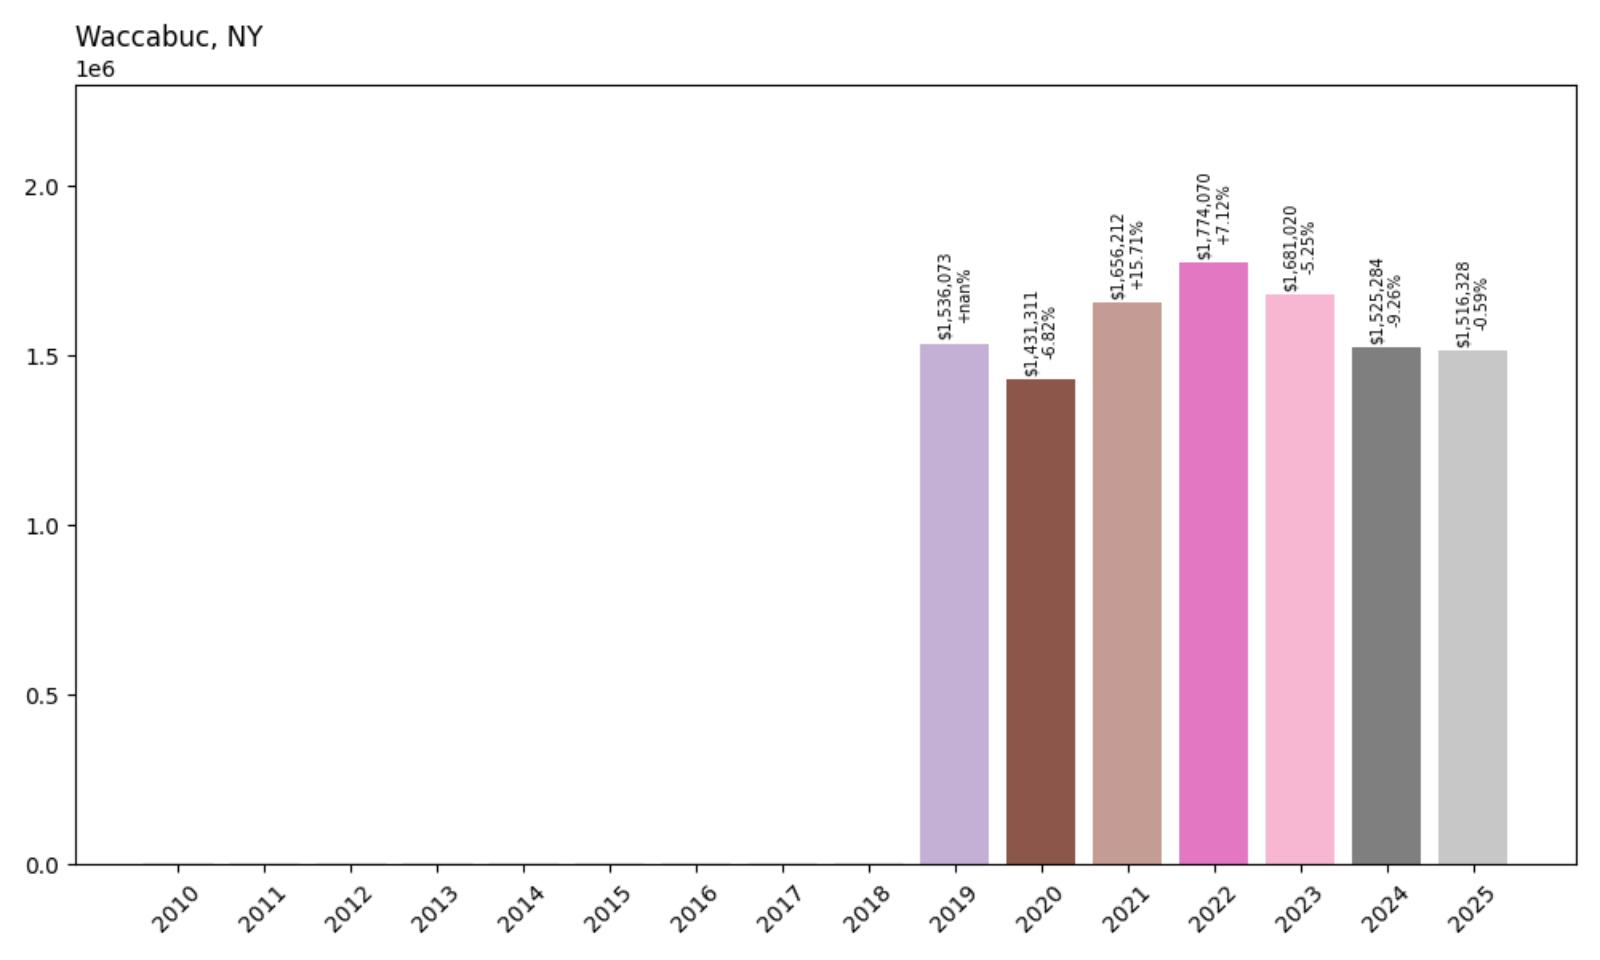
31. Waccabuc – 1.3% Home Price Decrease Since 2019
- 2010: N/A
- 2011: N/A
- 2012: N/A
- 2013: N/A
- 2014: N/A
- 2015: N/A
- 2016: N/A
- 2017: N/A
- 2018: N/A
- 2019: $1,536,073
- 2020: $1,431,311 (−$104,762, −6.82% from previous year)
- 2021: $1,656,212 (+$224,901, +15.71% from previous year)
- 2022: $1,774,070 (+$117,859, +7.12% from previous year)
- 2023: $1,681,020 (−$93,050, −5.25% from previous year)
- 2024: $1,525,284 (−$155,736, −9.26% from previous year)
- 2025: $1,516,328 (−$8,957, −0.59% from previous year)
Waccabuc shows the volatility that has characterized many luxury markets in recent years, with a modest 1.3% decline since 2019 masking significant fluctuations. The community experienced a dramatic pandemic boom, reaching nearly $1.8 million in 2022 before entering a correction phase that has brought prices back to around $1.52 million. Despite recent declines, the current price level still represents a premium market position within New York’s exclusive communities.
Waccabuc – Westchester’s Rural Retreat
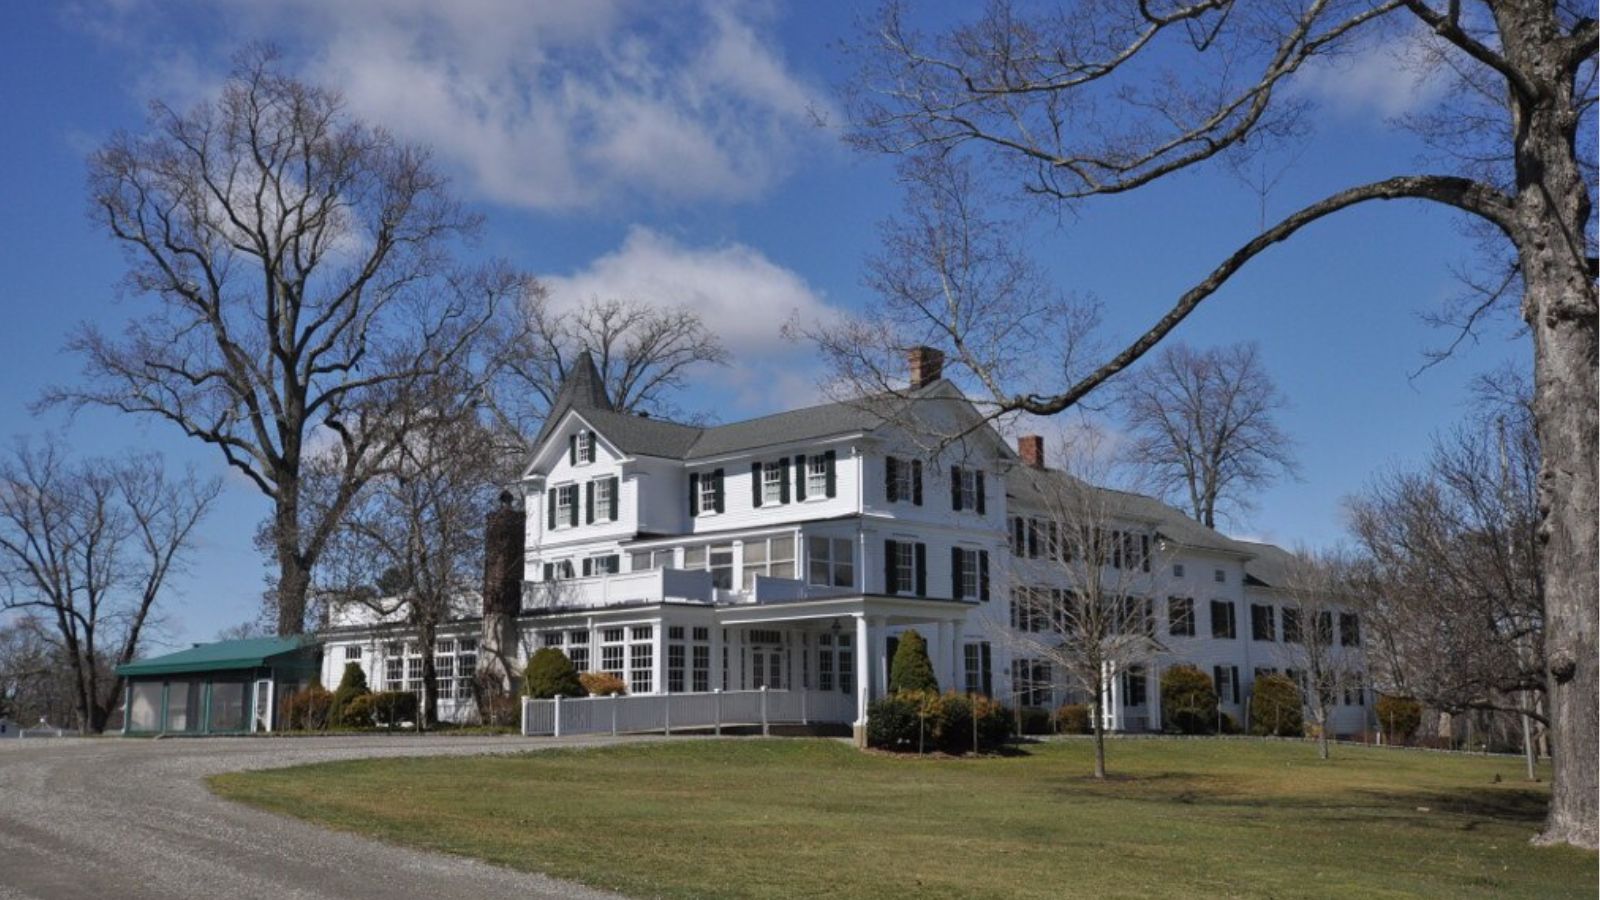
Waccabuc, nestled in northern Westchester County near the Connecticut border, offers a unique combination of rural tranquility and metropolitan accessibility. The community surrounds the pristine Waccabuc Lake, providing residents with private water access and recreational opportunities that justify premium pricing. Its location approximately 45 miles from Manhattan attracts affluent professionals seeking escape from urban density while maintaining reasonable commuting options.
The price volatility shown in the data reflects broader trends affecting luxury suburban markets during and after the pandemic. The peak pricing of $1.77 million in 2022 appears to have been driven by unprecedented demand for rural properties with water access, while subsequent corrections have brought valuations back toward more sustainable levels. The current median of $1.52 million still reflects the community’s fundamental appeal as one of Westchester’s most exclusive lakefront destinations.
30. Westhampton Beach – 108.5% Home Price Increase Since 2010
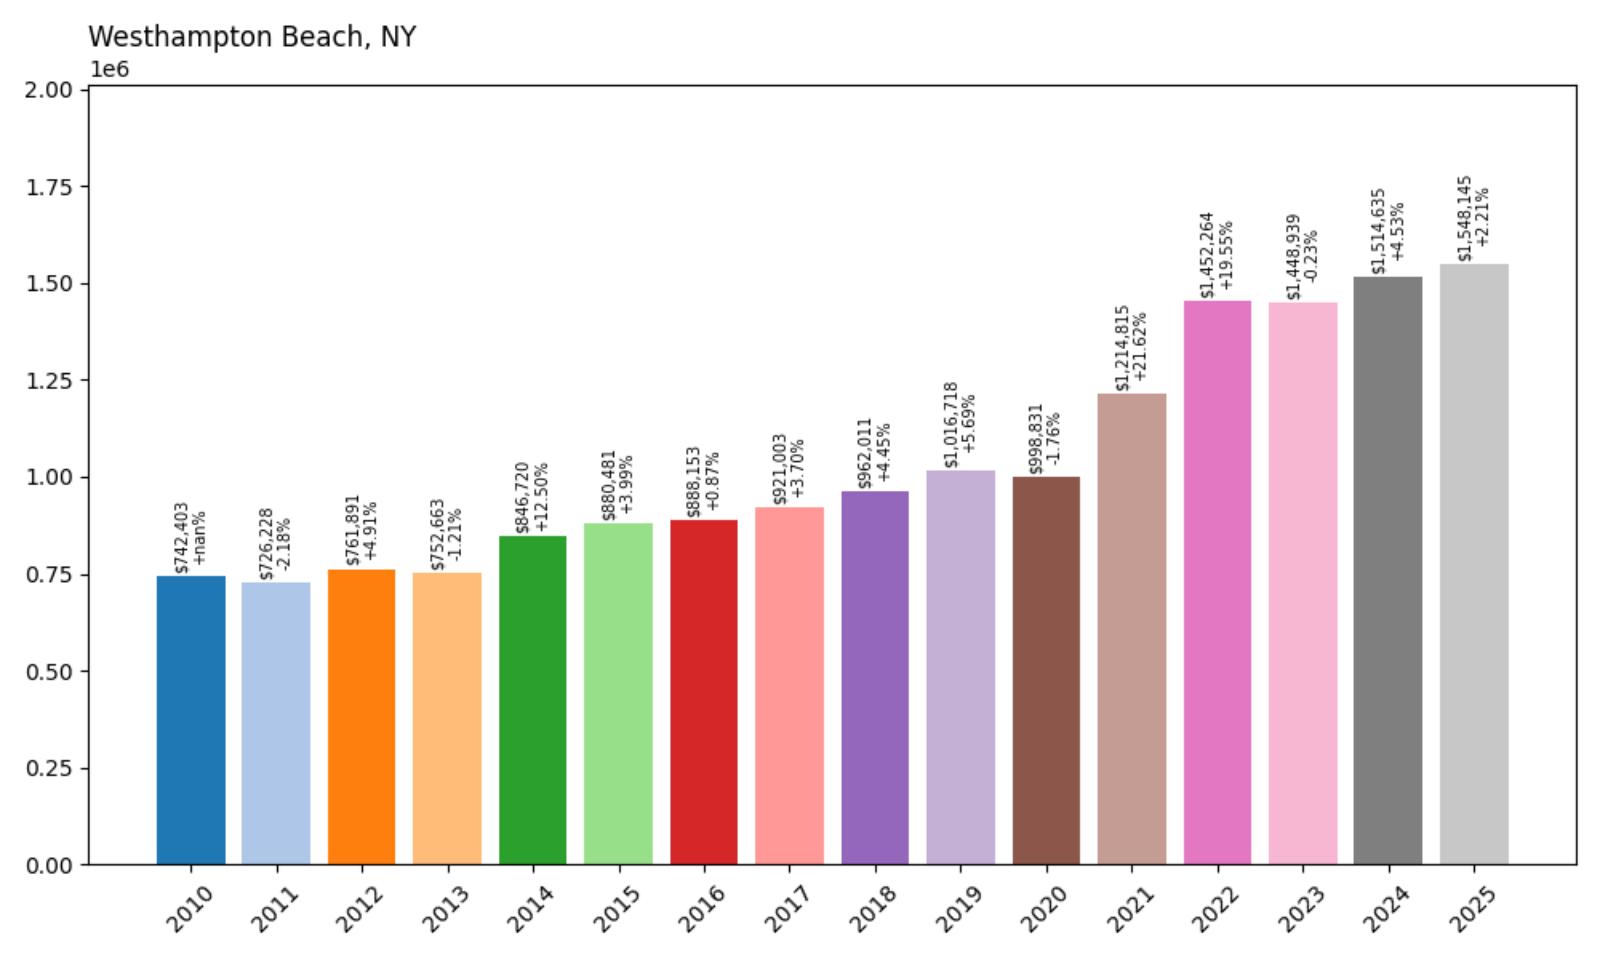
- 2010: $742,403
- 2011: $726,228 (−$16,175, −2.18% from previous year)
- 2012: $761,891 (+$35,663, +4.91% from previous year)
- 2013: $752,663 (−$9,228, −1.21% from previous year)
- 2014: $846,720 (+$94,057, +12.50% from previous year)
- 2015: $880,481 (+$33,761, +3.99% from previous year)
- 2016: $888,153 (+$7,672, +0.87% from previous year)
- 2017: $921,003 (+$32,850, +3.70% from previous year)
- 2018: $962,011 (+$41,008, +4.45% from previous year)
- 2019: $1,016,718 (+$54,707, +5.69% from previous year)
- 2020: $998,831 (−$17,887, −1.76% from previous year)
- 2021: $1,214,815 (+$215,984, +21.62% from previous year)
- 2022: $1,452,264 (+$237,449, +19.55% from previous year)
- 2023: $1,448,939 (−$3,325, −0.23% from previous year)
- 2024: $1,514,635 (+$65,696, +4.53% from previous year)
- 2025: $1,548,145 (+$33,510, +2.21% from previous year)
Westhampton Beach demonstrates exceptional long-term growth with a 108.5% increase since 2010, effectively doubling from around $740,000 to over $1.5 million today. The community experienced particularly dramatic growth during the pandemic years, with consecutive increases of 21.62% and 19.55% in 2021-2022. Recent years show market stabilization with modest but positive growth, suggesting the dramatic price run-up has found a sustainable new level.
Westhampton Beach – Hamptons’ Western Gateway
Westhampton Beach serves as the western entrance to the famous Hamptons region, offering many of the amenities and coastal beauty associated with the prestigious area at relatively more accessible price points. The community features beautiful Atlantic Ocean beaches, charming village centers, and the relaxed coastal lifestyle that has made the Hamptons internationally renowned. Its position allows residents to enjoy Hamptons culture while maintaining somewhat more affordable entry points compared to the ultra-exclusive eastern communities.
The 108.5% appreciation since 2010 reflects the community’s growing recognition as a legitimate Hamptons destination. The explosive growth during 2021-2022, when prices jumped from around $1 million to over $1.4 million, coincided with increased demand for coastal properties during the pandemic. Current pricing around $1.55 million positions Westhampton Beach as an attractive option for buyers seeking Hamptons lifestyle without the extreme premiums commanded by Sagaponack or Bridgehampton.
29. Roslyn – 99.9% Home Price Increase Since 2010
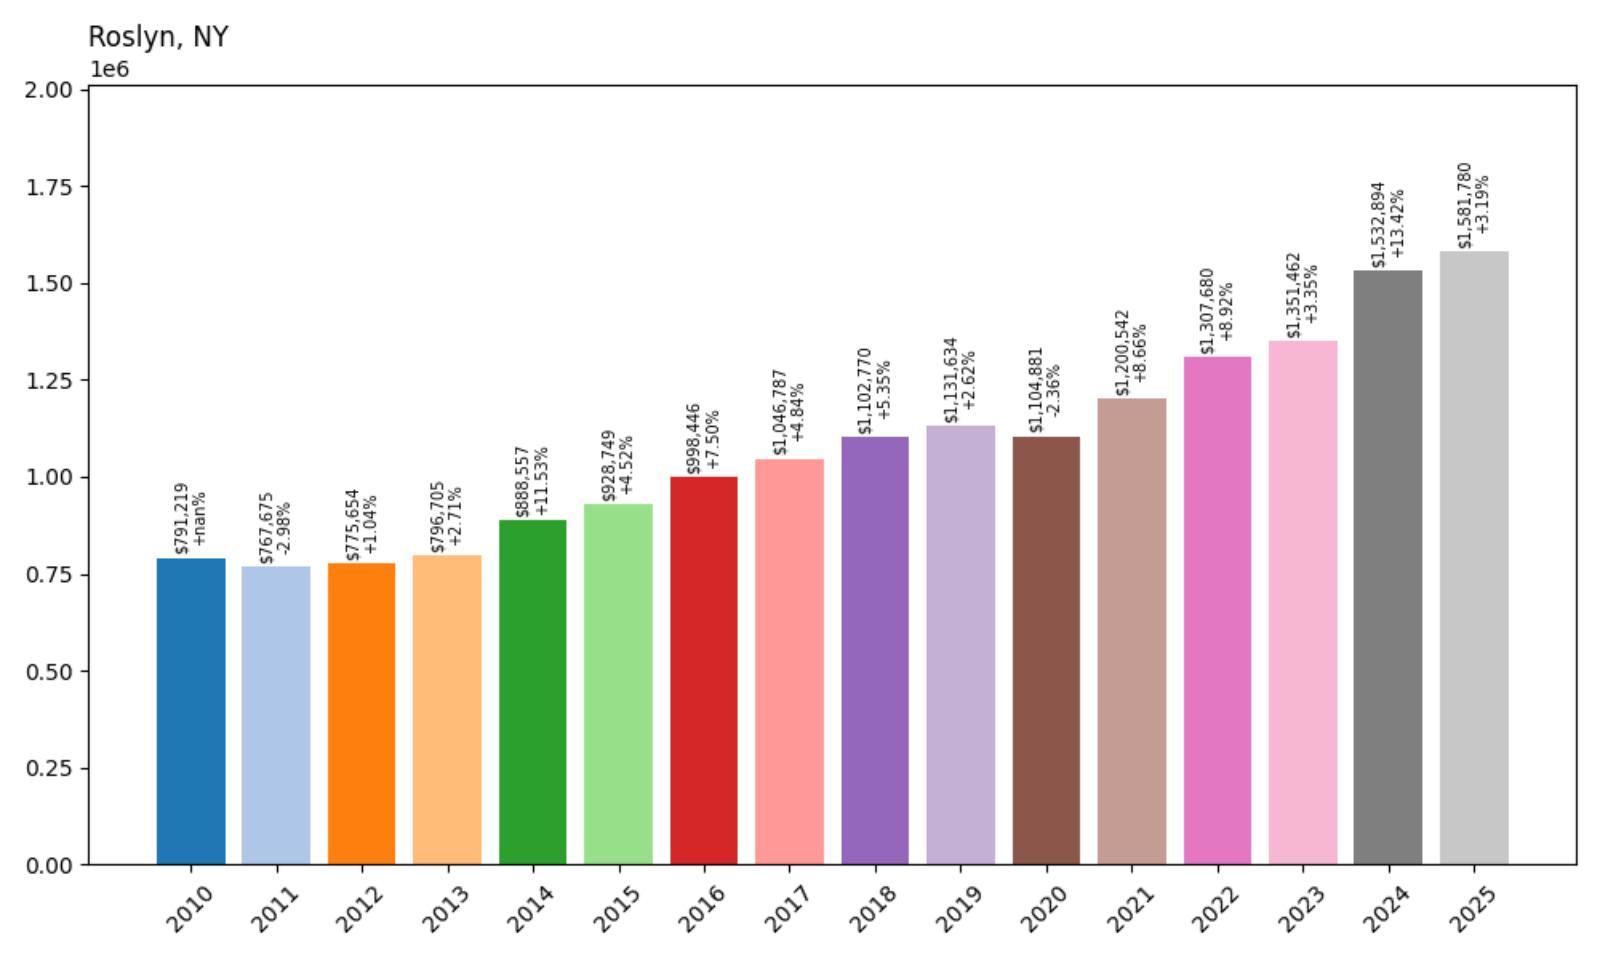
- 2010: $791,219
- 2011: $767,675 (−$23,544, −2.98% from previous year)
- 2012: $775,654 (+$7,979, +1.04% from previous year)
- 2013: $796,705 (+$21,051, +2.71% from previous year)
- 2014: $888,557 (+$91,852, +11.53% from previous year)
- 2015: $928,749 (+$40,192, +4.52% from previous year)
- 2016: $998,446 (+$69,696, +7.50% from previous year)
- 2017: $1,046,787 (+$48,341, +4.84% from previous year)
- 2018: $1,102,770 (+$55,984, +5.35% from previous year)
- 2019: $1,131,634 (+$28,864, +2.62% from previous year)
- 2020: $1,104,881 (−$26,754, −2.36% from previous year)
- 2021: $1,200,542 (+$95,661, +8.66% from previous year)
- 2022: $1,307,680 (+$107,138, +8.92% from previous year)
- 2023: $1,351,462 (+$43,782, +3.35% from previous year)
- 2024: $1,532,894 (+$181,431, +13.42% from previous year)
- 2025: $1,581,780 (+$48,887, +3.19% from previous year)
Roslyn achieves nearly perfect doubling with a 99.9% increase since 2010, transforming from a sub-$800,000 market to commanding nearly $1.6 million today. The community shows consistent upward momentum with particularly strong performance in 2024, when prices jumped 13.42% in a single year. This sustained growth pattern reflects strong fundamental demand and positions Roslyn as one of Long Island’s most successful luxury markets.
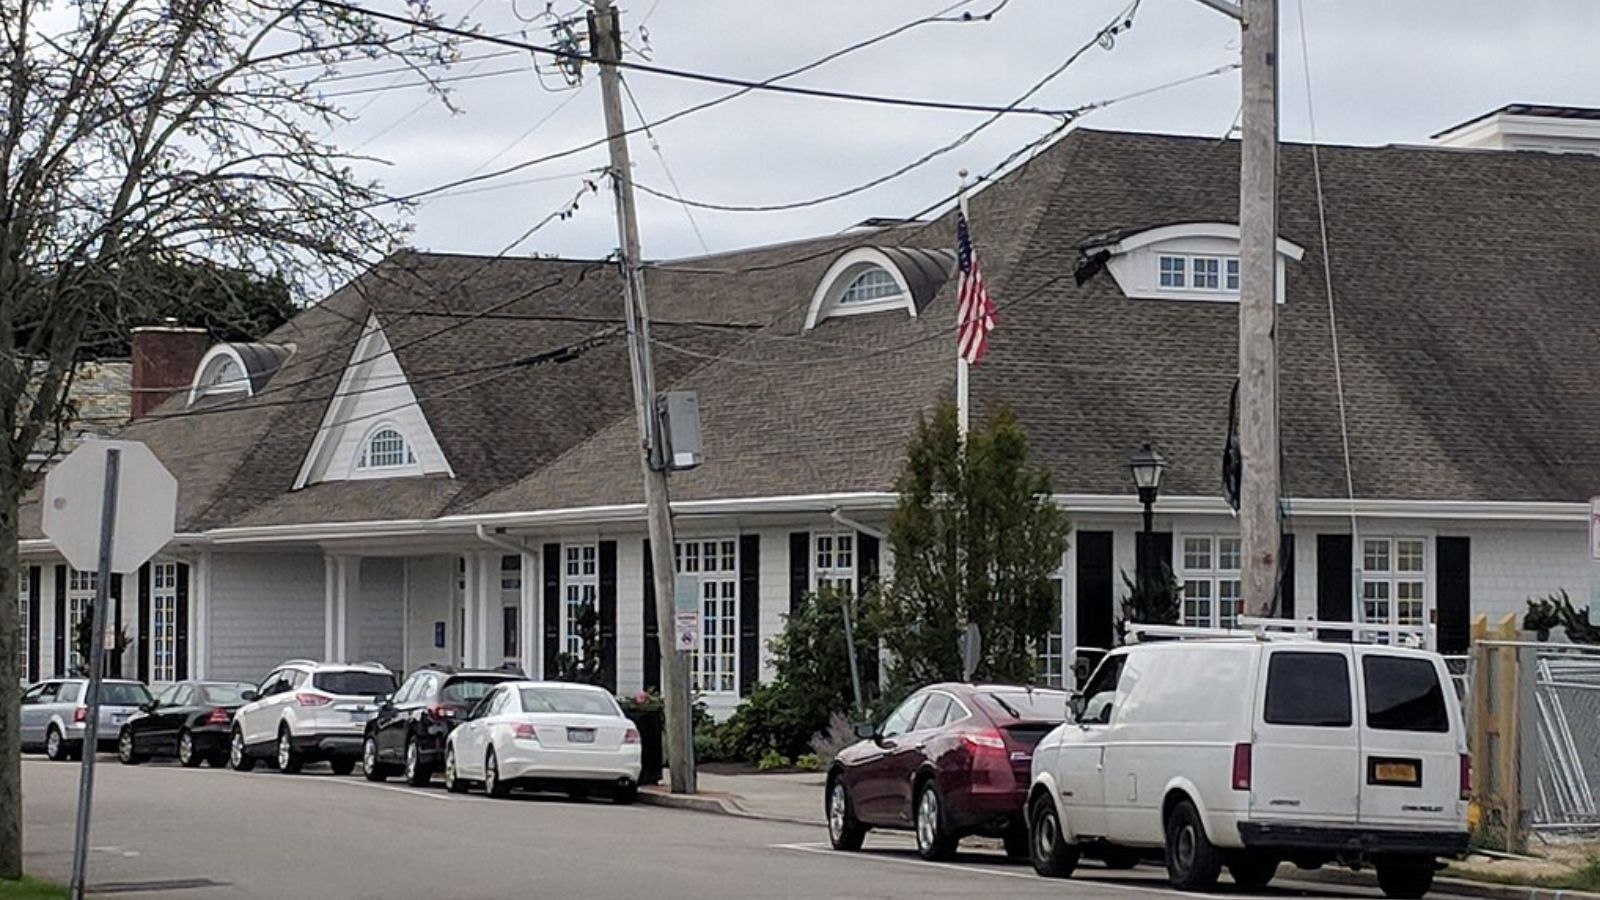
Roslyn – Long Island’s Gold Coast Heritage

AITFFan1, CC BY-SA 4.0, via Wikimedia Commons
Roslyn, located on Long Island’s historic Gold Coast, combines rich historical significance with modern luxury living. The community’s location along the Long Island Sound provides water access and scenic beauty, while its proximity to Manhattan via multiple transportation options makes it attractive to affluent commuters. Roslyn’s well-preserved historic districts and upscale shopping areas contribute to its appeal as a prestigious residential destination.
The near-doubling of prices since 2010 reflects Roslyn’s evolution into a truly premium market. The dramatic 13.42% increase in 2024, bringing median prices above $1.5 million, suggests the community continues to attract strong buyer interest despite broader market uncertainties. Roslyn’s combination of waterfront location, historical character, and excellent schools creates the kind of unique value proposition that supports sustained price appreciation in the luxury market segment.
28. Larchmont – 71.2% Home Price Increase Since 2010
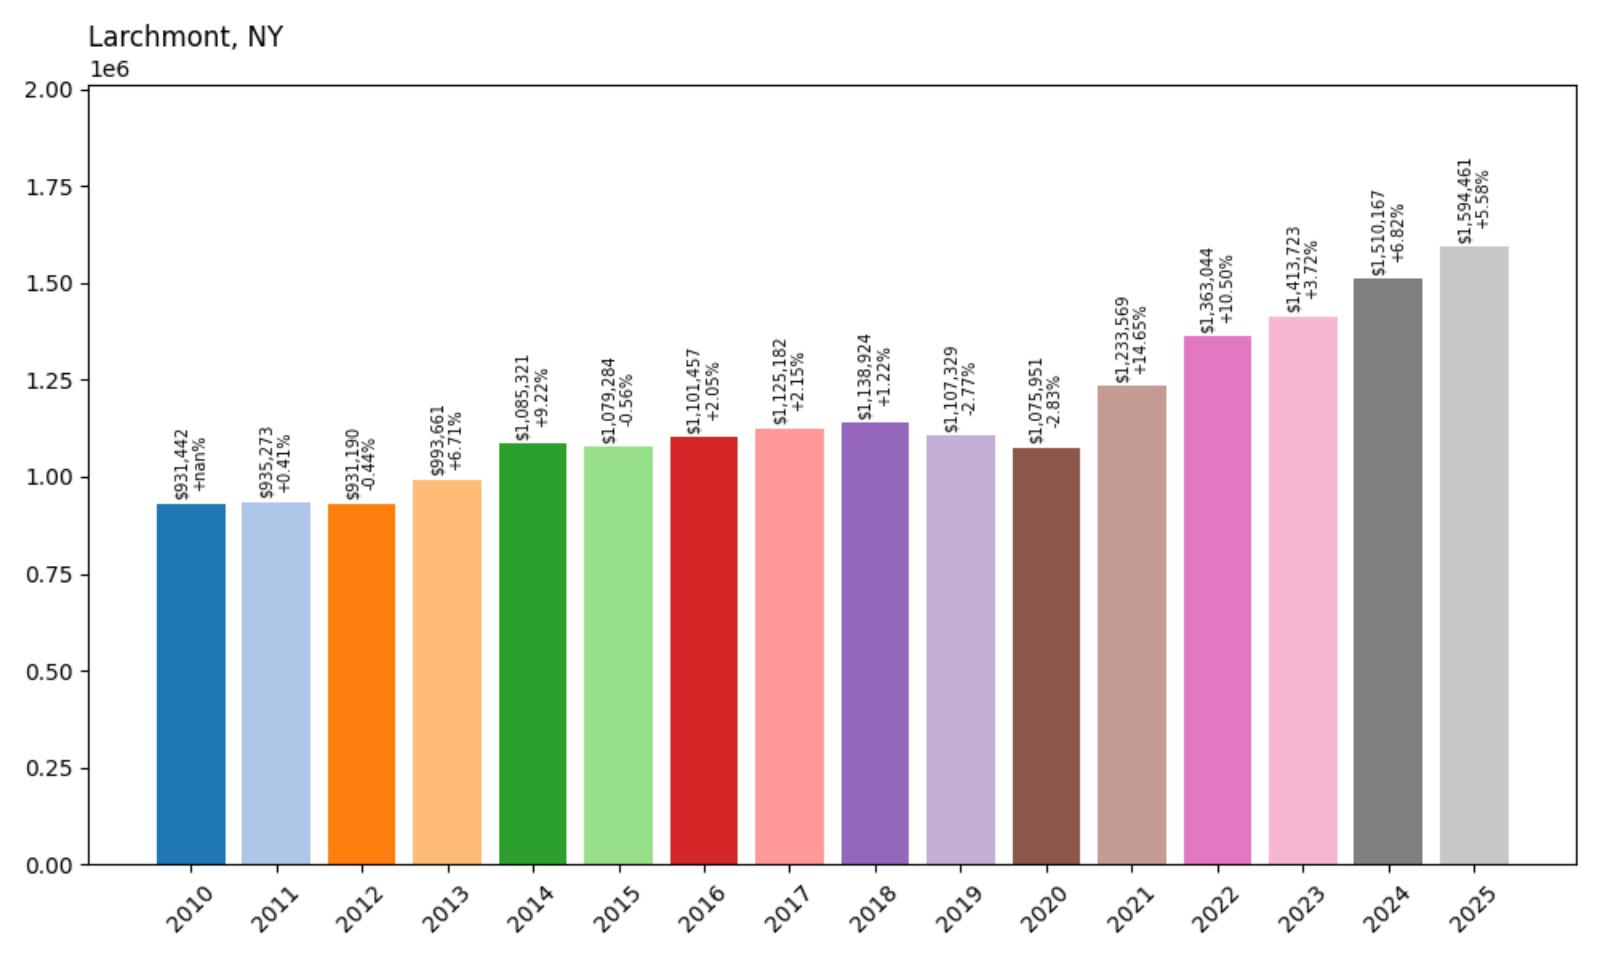
- 2010: $931,442
- 2011: $935,273 (+$3,832, +0.41% from previous year)
- 2012: $931,190 (−$4,083, −0.44% from previous year)
- 2013: $993,661 (+$62,471, +6.71% from previous year)
- 2014: $1,085,321 (+$91,660, +9.22% from previous year)
- 2015: $1,079,284 (−$6,037, −0.56% from previous year)
- 2016: $1,101,457 (+$22,172, +2.05% from previous year)
- 2017: $1,125,182 (+$23,725, +2.15% from previous year)
- 2018: $1,138,924 (+$13,742, +1.22% from previous year)
- 2019: $1,107,329 (−$31,595, −2.77% from previous year)
- 2020: $1,075,951 (−$31,378, −2.83% from previous year)
- 2021: $1,233,569 (+$157,618, +14.65% from previous year)
- 2022: $1,363,044 (+$129,475, +10.50% from previous year)
- 2023: $1,413,723 (+$50,679, +3.72% from previous year)
- 2024: $1,510,167 (+$96,444, +6.82% from previous year)
- 2025: $1,594,461 (+$84,294, +5.58% from previous year)
Larchmont shows solid long-term appreciation with a 71.2% increase since 2010, growing from around $930,000 to nearly $1.6 million today. The community demonstrated resilience during market downturns and strong recovery during favorable periods, with particularly robust growth in 2021-2022. Recent years continue showing healthy appreciation, with consistent gains suggesting a mature luxury market with sustainable demand fundamentals.
Larchmont – Westchester’s Coastal Charm
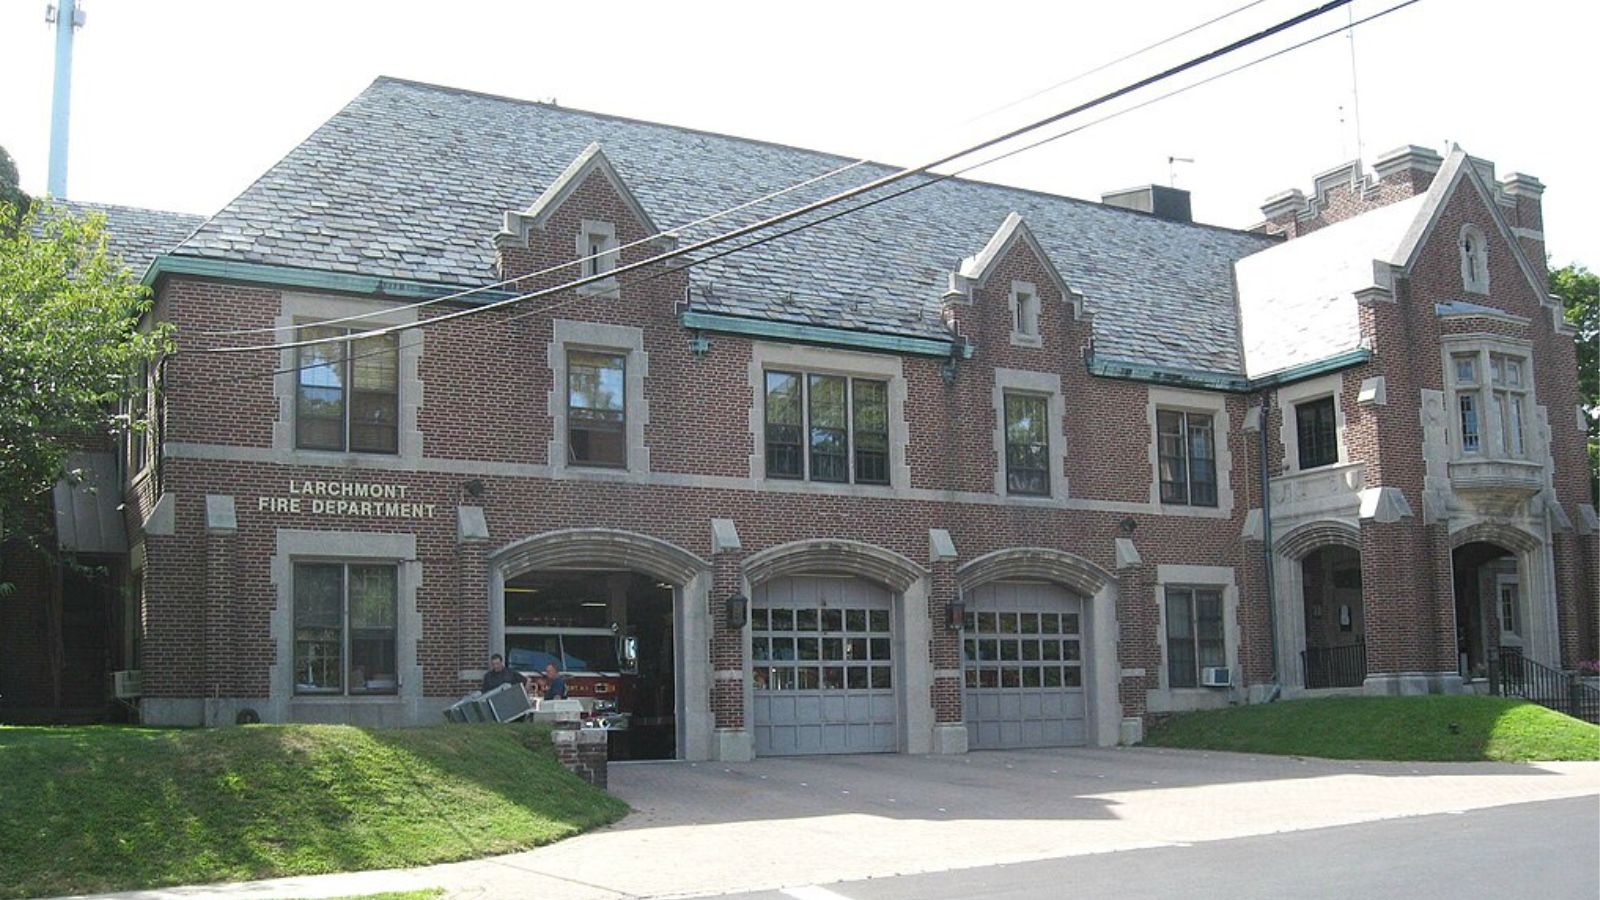
Larchmont, situated on the Long Island Sound in southern Westchester County, offers an attractive combination of waterfront living and convenient Manhattan access. The community features a charming downtown area, beautiful beaches, and a strong sense of community that appeals to affluent families seeking suburban tranquility with urban accessibility. Larchmont’s excellent schools and safe neighborhoods have made it a consistently popular choice for professionals working in New York City.
The 71.2% price appreciation since 2010 reflects steady demand for Westchester waterfront properties. The community’s ability to maintain price growth through various market cycles, including the recent acceleration to nearly $1.6 million, demonstrates strong underlying fundamentals. Larchmont’s position as one of Westchester’s most desirable coastal communities continues to attract buyers willing to pay premium prices for its unique combination of suburban amenities and Sound access.
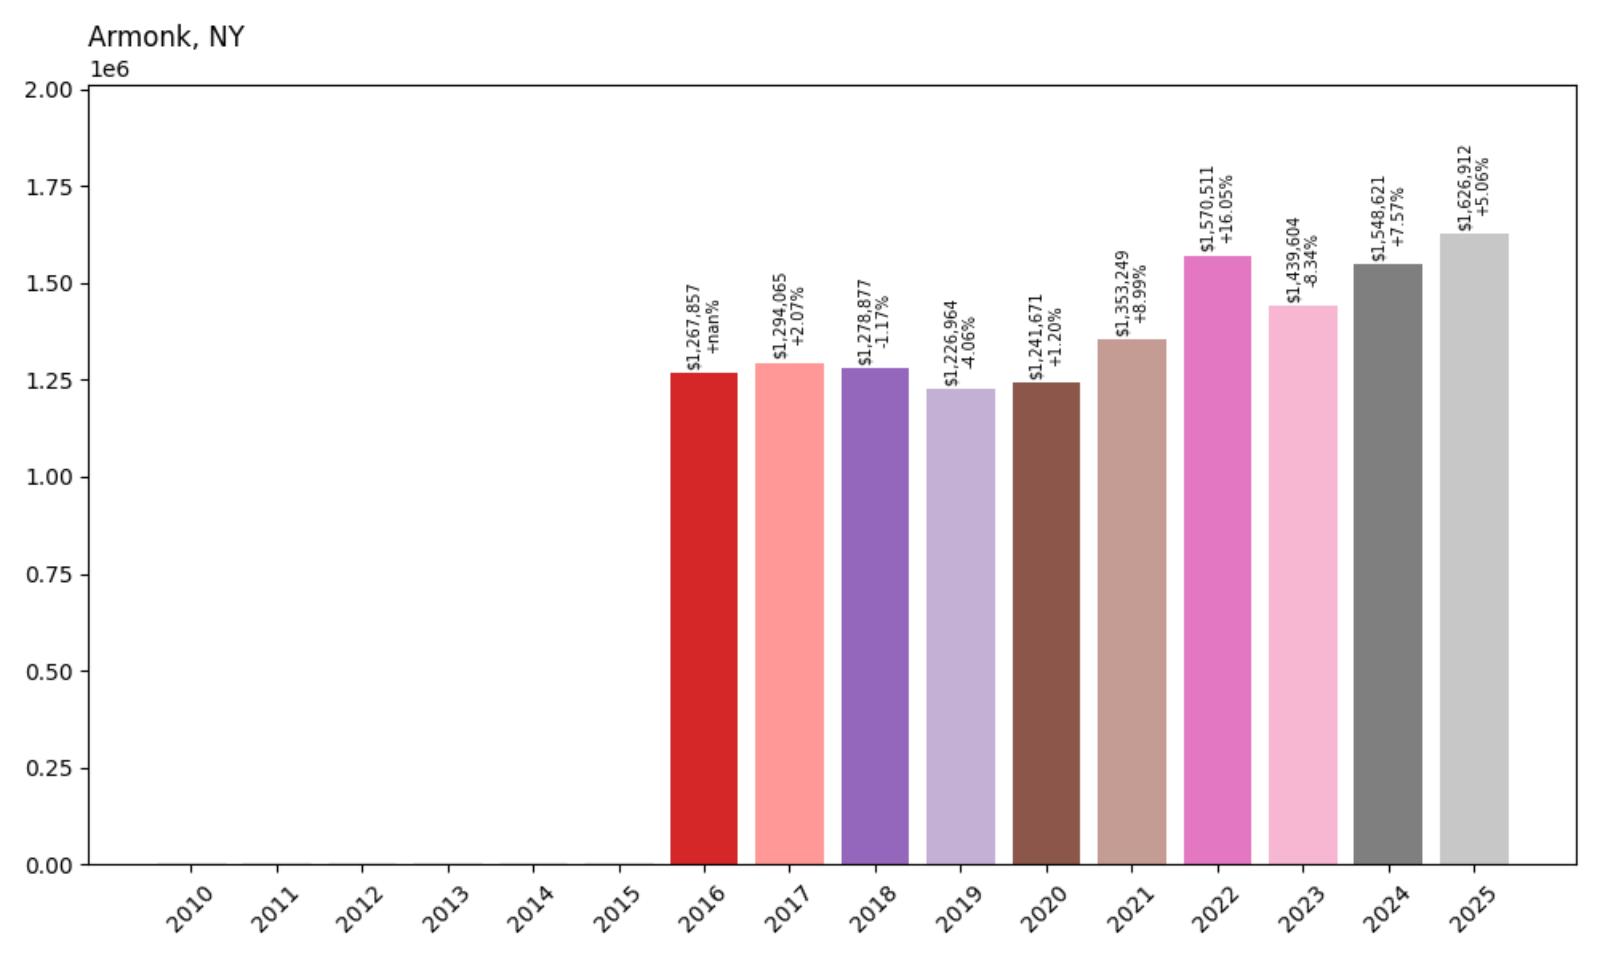
27. Armonk – 28.3% Home Price Increase Since 2016
Would you like to save this?
- 2010: N/A
- 2011: N/A
- 2012: N/A
- 2013: N/A
- 2014: N/A
- 2015: N/A
- 2016: $1,267,857
- 2017: $1,294,065 (+$26,209, +2.07% from previous year)
- 2018: $1,278,877 (−$15,188, −1.17% from previous year)
- 2019: $1,226,964 (−$51,914, −4.06% from previous year)
- 2020: $1,241,671 (+$14,707, +1.20% from previous year)
- 2021: $1,353,249 (+$111,578, +8.99% from previous year)
- 2022: $1,570,511 (+$217,261, +16.05% from previous year)
- 2023: $1,439,604 (−$130,907, −8.34% from previous year)
- 2024: $1,548,621 (+$109,017, +7.57% from previous year)
- 2025: $1,626,912 (+$78,291, +5.06% from previous year)
Armonk displays significant volatility with a 28.3% net increase since 2016, masking dramatic swings that peaked at over $1.57 million in 2022 before correcting. The data shows the community experienced substantial pandemic-driven speculation followed by market corrections, with recent stabilization around $1.63 million. This pattern reflects the challenges facing luxury markets in adjusting to post-pandemic realities while maintaining premium valuations.
Armonk – Northern Westchester’s Corporate Hub
Armonk, located in northern Westchester County, serves as a significant corporate center while maintaining its residential appeal. The community is home to IBM’s headquarters and other major corporations, creating a unique economic base that supports luxury housing demand. Armonk’s rural character, combined with its corporate presence and excellent schools, appeals to executives and professionals seeking upscale suburban living with convenient access to major business centers.
The price volatility shown in the data, from peaks near $1.57 million to subsequent corrections, reflects the community’s sensitivity to broader economic trends affecting corporate America. The recent recovery and stabilization around $1.63 million suggests the market has found a more sustainable level that reflects Armonk’s fundamental strengths. The community’s corporate connections and northern Westchester location continue to support premium pricing despite recent market turbulence.
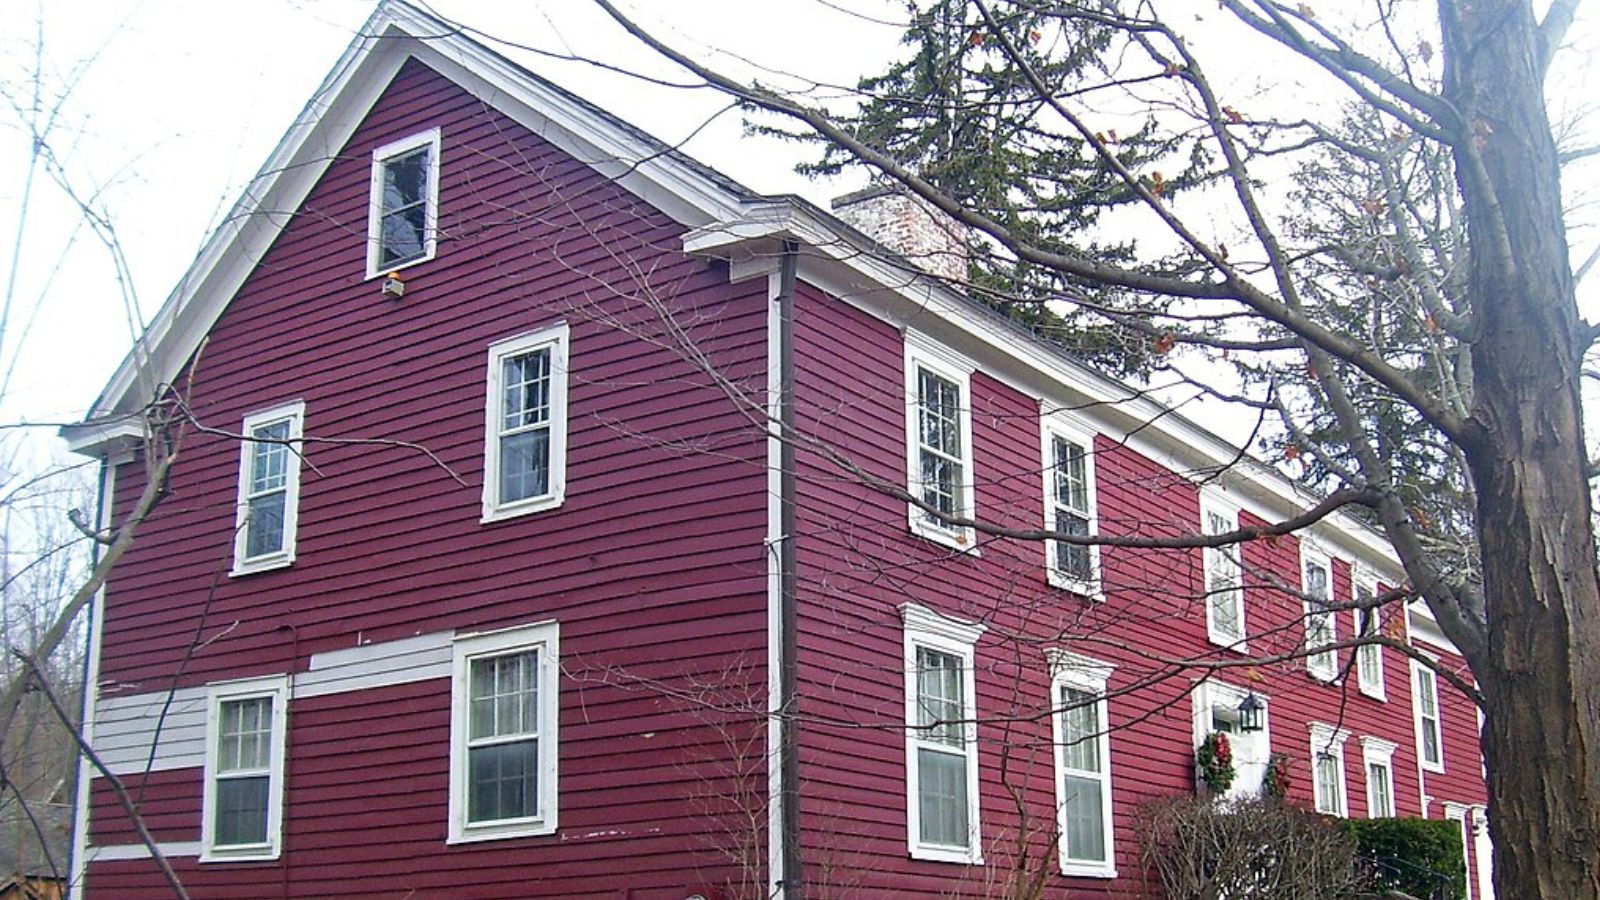
26. Cold Spring Harbor – 47.0% Home Price Increase Since 2010
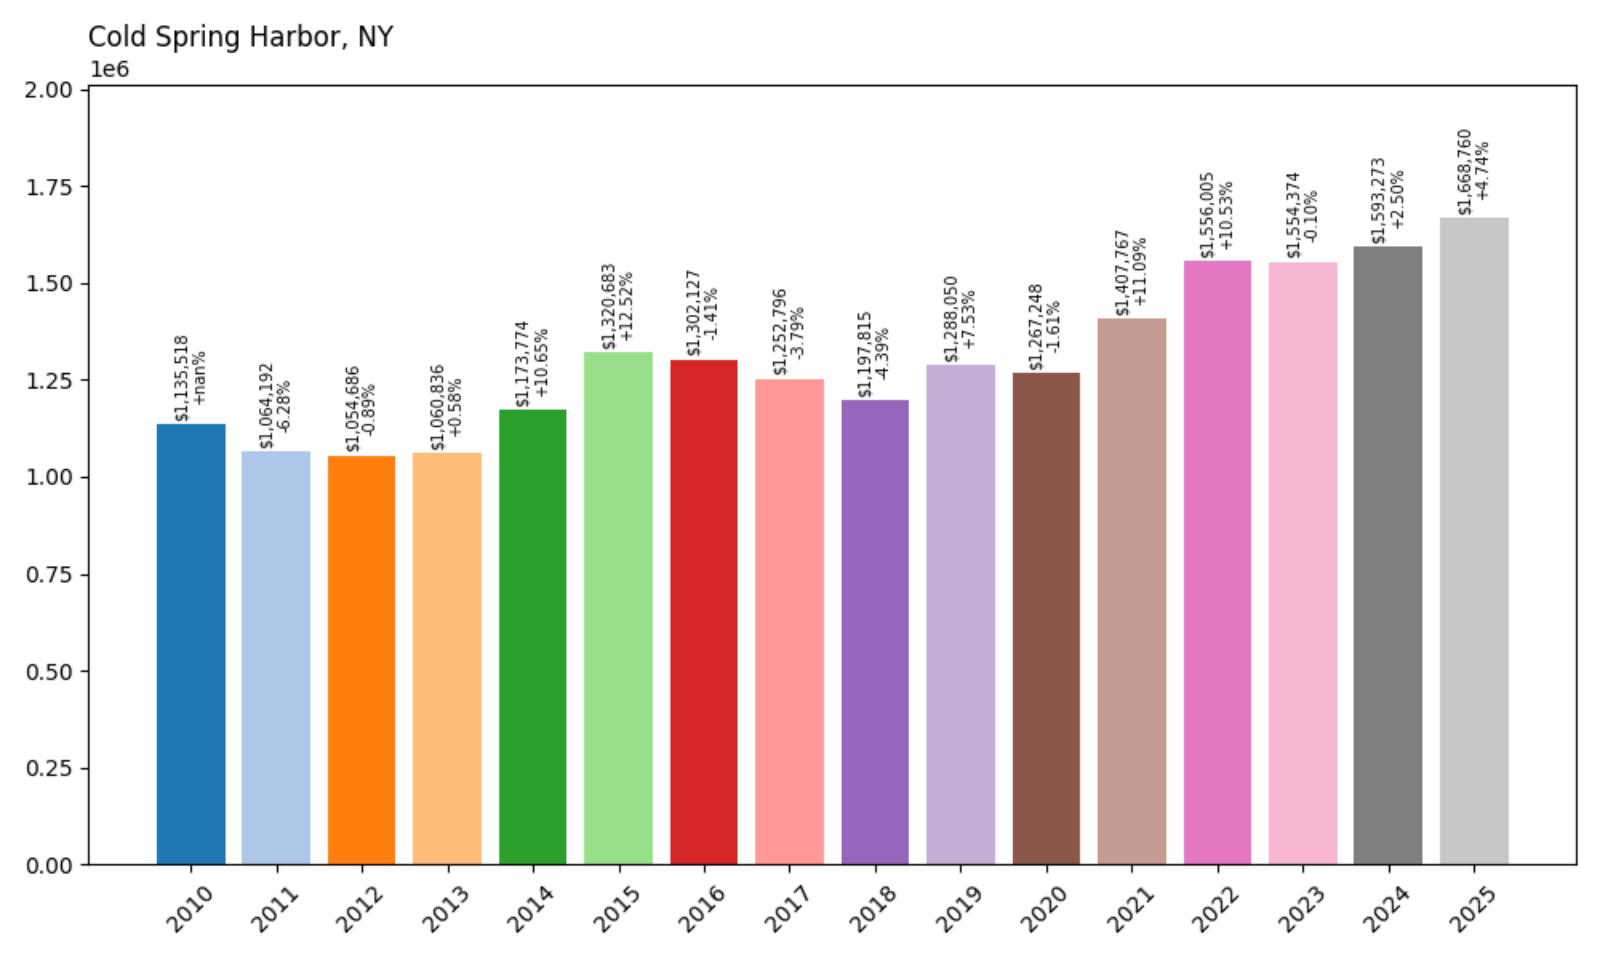
- 2010: $1,135,518
- 2011: $1,064,192 (−$71,325, −6.28% from previous year)
- 2012: $1,054,686 (−$9,506, −0.89% from previous year)
- 2013: $1,060,836 (+$6,150, +0.58% from previous year)
- 2014: $1,173,774 (+$112,938, +10.65% from previous year)
- 2015: $1,320,683 (+$146,909, +12.52% from previous year)
- 2016: $1,302,127 (−$18,556, −1.41% from previous year)
- 2017: $1,252,796 (−$49,330, −3.79% from previous year)
- 2018: $1,197,815 (−$54,981, −4.39% from previous year)
- 2019: $1,288,050 (+$90,235, +7.53% from previous year)
- 2020: $1,267,248 (−$20,802, −1.61% from previous year)
- 2021: $1,407,767 (+$140,519, +11.09% from previous year)
- 2022: $1,556,005 (+$148,238, +10.53% from previous year)
- 2023: $1,554,374 (−$1,630, −0.10% from previous year)
- 2024: $1,593,273 (+$38,898, +2.50% from previous year)
- 2025: $1,668,760 (+$75,487, +4.74% from previous year)
Cold Spring Harbor shows moderate long-term growth with a 47% increase since 2010, though the data reveals significant volatility throughout the period. The community experienced notable declines in the mid-2010s before recovering strongly during the pandemic years. Recent performance shows steady but modest appreciation, with current prices around $1.67 million representing a premium but not explosive market compared to other Long Island luxury communities.
Cold Spring Harbor – Historic Long Island Charm
Cold Spring Harbor, located on Long Island’s North Shore, combines rich maritime history with modern luxury living. The community’s deep natural harbor has been central to its identity since colonial times, and today provides residents with exceptional boating and waterfront access. The area’s proximity to beaches, nature preserves, and cultural attractions makes it attractive to affluent buyers seeking both recreational opportunities and historical character.
The 47% price appreciation since 2010, while significant, reflects a more measured growth pattern compared to some explosive Hamptons markets. Cold Spring Harbor’s appeal lies in its authentic Long Island heritage combined with sophisticated amenities, attracting buyers who value substance over speculation. The current median price of $1.67 million positions the community as a premium but relatively stable choice within the North Shore luxury market.
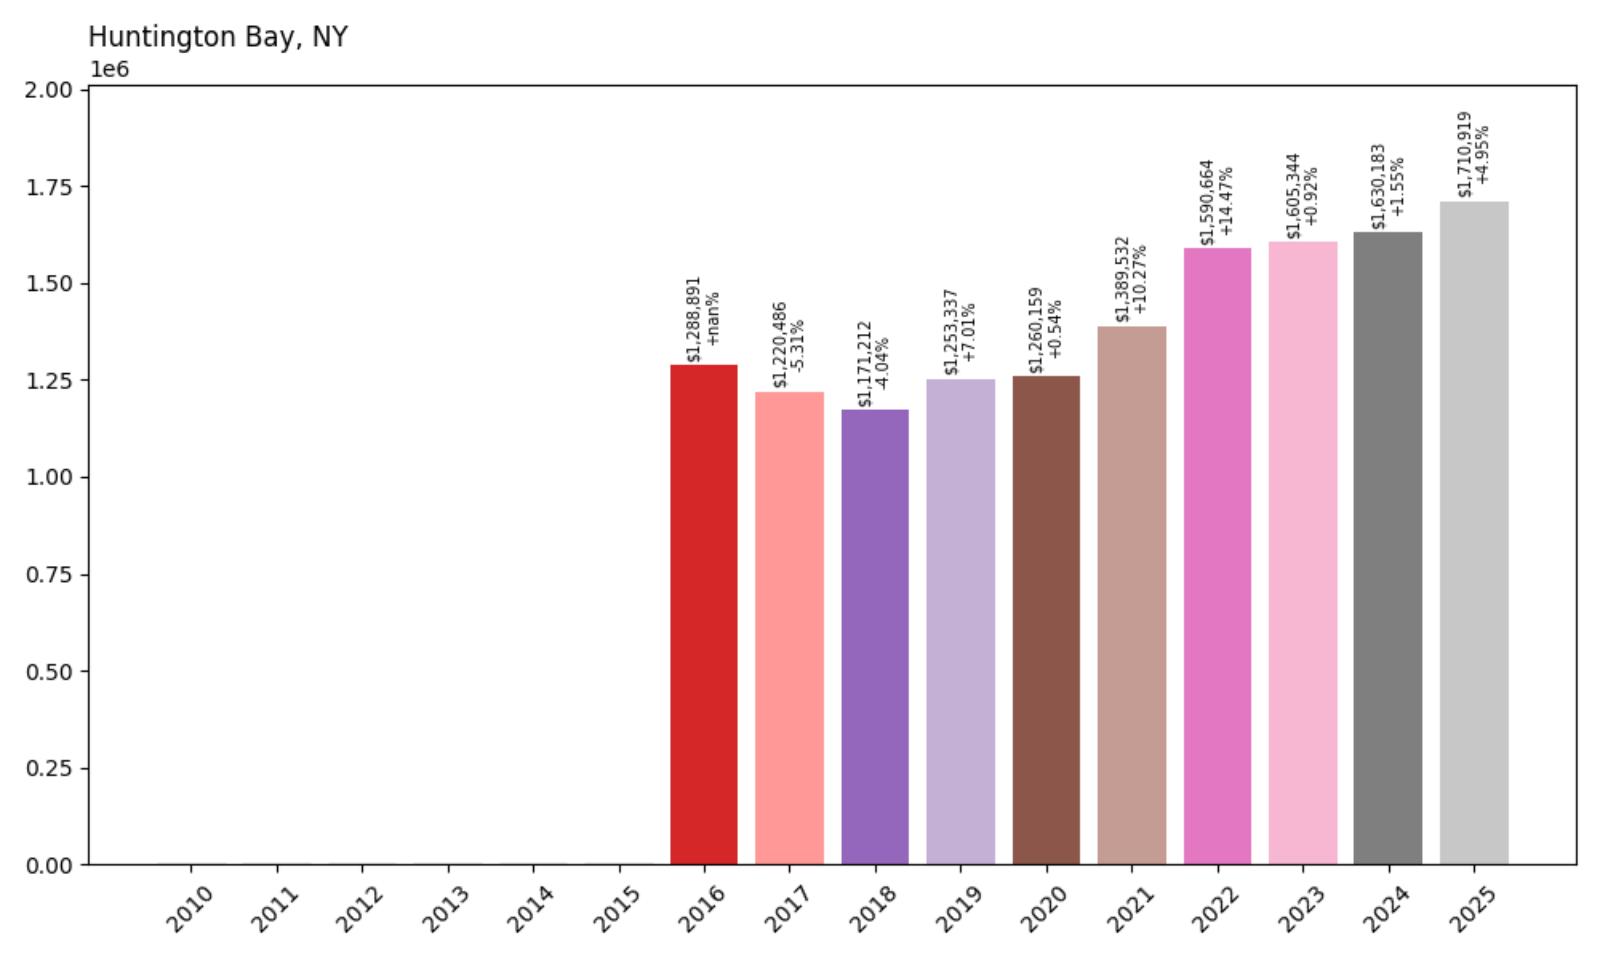
25. Huntington Bay – 32.7% Home Price Increase Since 2016
- 2010: N/A
- 2011: N/A
- 2012: N/A
- 2013: N/A
- 2014: N/A
- 2015: N/A
- 2016: $1,288,891
- 2017: $1,220,486 (−$68,405, −5.31% from previous year)
- 2018: $1,171,212 (−$49,274, −4.04% from previous year)
- 2019: $1,253,337 (+$82,125, +7.01% from previous year)
- 2020: $1,260,159 (+$6,822, +0.54% from previous year)
- 2021: $1,389,532 (+$129,373, +10.27% from previous year)
- 2022: $1,590,664 (+$201,132, +14.47% from previous year)
- 2023: $1,605,344 (+$14,680, +0.92% from previous year)
- 2024: $1,630,183 (+$24,839, +1.55% from previous year)
- 2025: $1,710,919 (+$80,736, +4.95% from previous year)
Huntington Bay demonstrates steady recovery and growth with a 32.7% increase since 2016, overcoming early declines to reach current levels around $1.71 million. The community showed resilience during market downturns and benefited significantly from pandemic-era demand for waterfront properties. Recent years indicate continued momentum with healthy but sustainable appreciation rates that suggest market maturity.
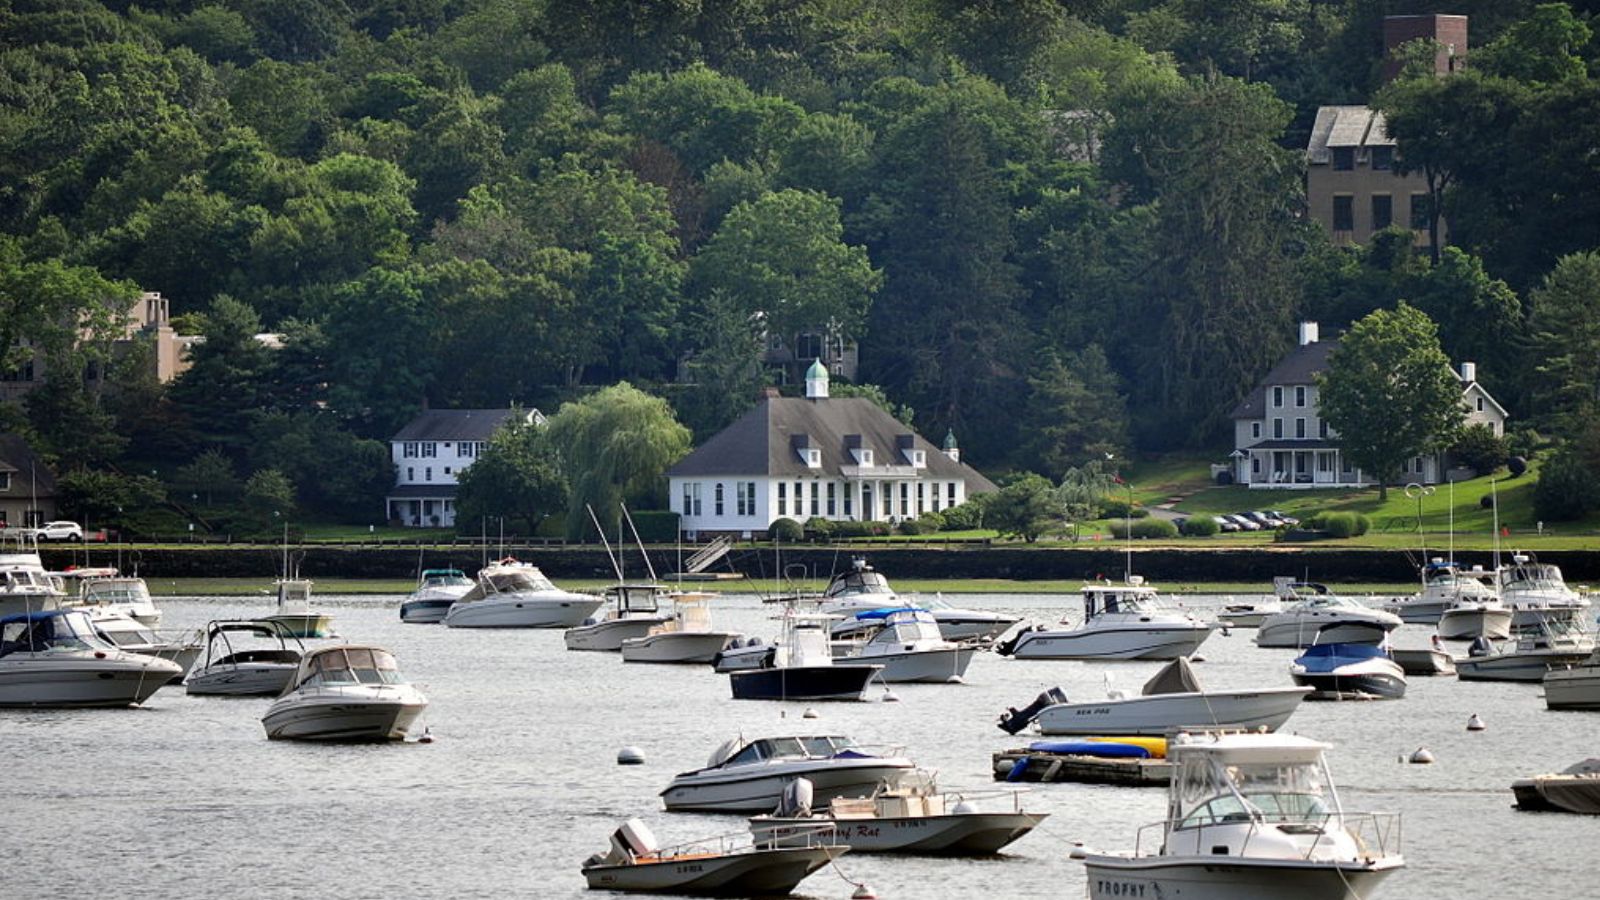
Huntington Bay – Long Island Sound Sanctuary
Huntington Bay offers an exclusive waterfront lifestyle on Long Island’s North Shore, with direct access to Huntington Bay and Long Island Sound. The community’s location provides both recreational boating opportunities and stunning water views while maintaining convenient access to Manhattan via the Long Island Rail Road. The area’s combination of natural beauty and transportation convenience makes it particularly attractive to affluent professionals seeking escape from urban density.
The 32.7% appreciation since 2016 reflects growing recognition of Huntington Bay’s unique value proposition. The strong performance during 2021-2022, when prices jumped from around $1.4 million to over $1.6 million, demonstrates the community’s appeal during periods of increased demand for waterfront properties. Current pricing around $1.71 million positions Huntington Bay as a premium but accessible option within Long Island’s luxury waterfront market.
24. Shelter Island – 7.7% Home Price Increase Since 2024

- 2010: N/A
- 2011: N/A
- 2012: N/A
- 2013: N/A
- 2014: N/A
- 2015: N/A
- 2016: N/A
- 2017: N/A
- 2018: N/A
- 2019: N/A
- 2020: N/A
- 2021: N/A
- 2022: N/A
- 2023: N/A
- 2024: $1,609,283
- 2025: $1,733,393 (+$124,110, +7.71% from previous year)
Shelter Island represents another recent entrant to New York’s million-dollar club, with limited data showing strong momentum and a 7.7% increase from 2024 to 2025. The substantial year-over-year growth of over $124,000 brings current median prices to $1.73 million, suggesting rapid appreciation in this exclusive island community. The limited data points indicate this market may have recently crossed premium thresholds.
Shelter Island – Pristine Island Retreat

Shelter Island, nestled between Long Island’s North and South Forks, offers one of New York’s most exclusive residential experiences. Accessible only by ferry, the island maintains a rural, unspoiled character that appeals to affluent buyers seeking ultimate privacy and natural beauty. The community’s protected status and limited development opportunities create inherent scarcity that supports premium pricing for available properties.
The dramatic 7.7% appreciation shown in the limited data reflects the island’s growing recognition as a luxury destination. Current median prices of $1.73 million represent significant value for buyers seeking island living with proximity to the Hamptons and New York City. Shelter Island’s unique combination of accessibility and isolation continues to attract discerning buyers willing to pay premium prices for this rare residential opportunity.
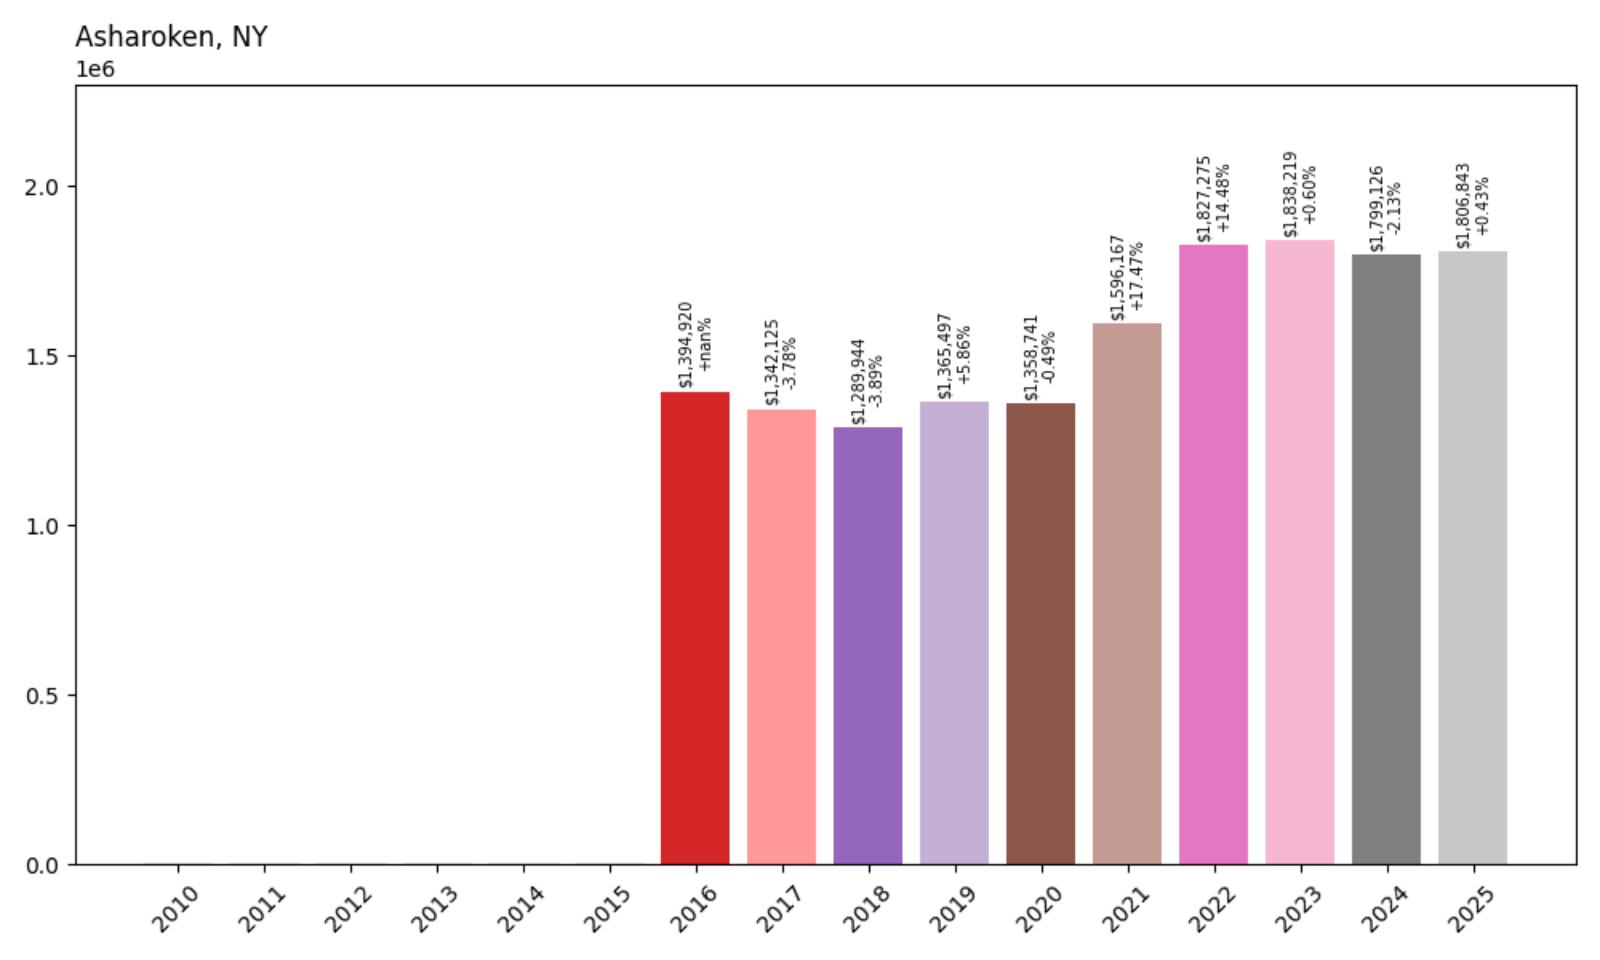
23. Asharoken – 29.5% Home Price Increase Since 2016
- 2010: N/A
- 2011: N/A
- 2012: N/A
- 2013: N/A
- 2014: N/A
- 2015: N/A
- 2016: $1,394,920
- 2017: $1,342,125 (−$52,795, −3.78% from previous year)
- 2018: $1,289,944 (−$52,181, −3.89% from previous year)
- 2019: $1,365,497 (+$75,553, +5.86% from previous year)
- 2020: $1,358,741 (−$6,756, −0.49% from previous year)
- 2021: $1,596,167 (+$237,426, +17.47% from previous year)
- 2022: $1,827,275 (+$231,108, +14.48% from previous year)
- 2023: $1,838,219 (+$10,945, +0.60% from previous year)
- 2024: $1,799,126 (−$39,093, −2.13% from previous year)
- 2025: $1,806,843 (+$7,717, +0.43% from previous year)
Asharoken shows strong overall growth with a 29.5% increase since 2016, despite experiencing some recent volatility around the $1.8 million level. The community benefited significantly from pandemic-era demand, with dramatic increases in 2021-2022 that brought prices from around $1.36 million to over $1.8 million. Recent stabilization suggests the market has found a new equilibrium at these elevated levels.
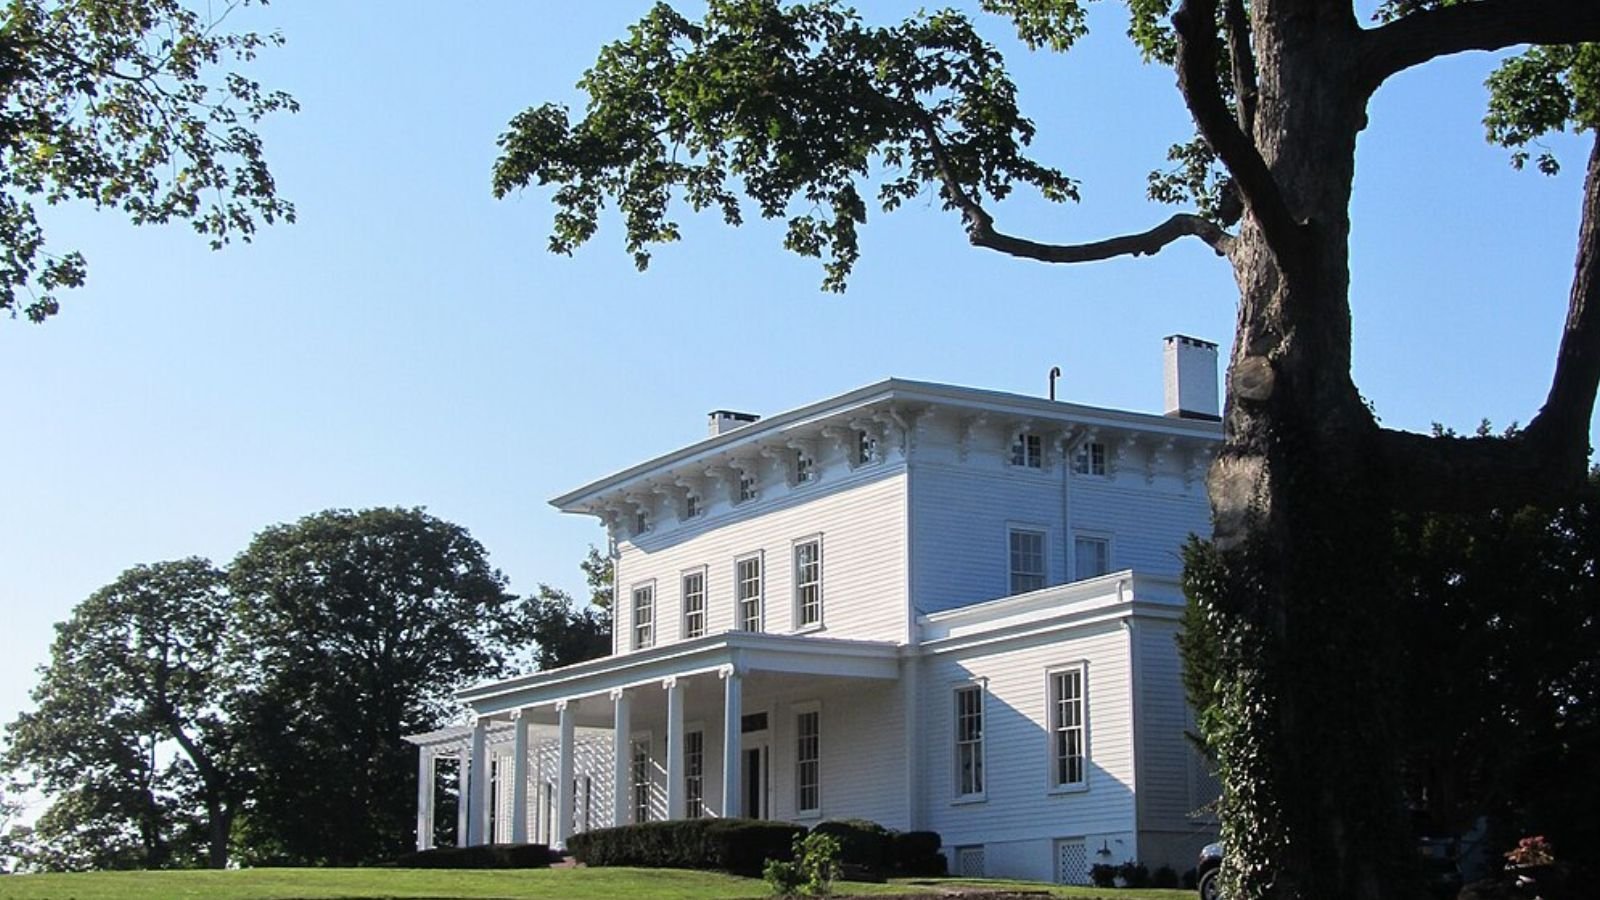
Asharoken – Exclusive Beachfront Peninsula

Asharoken occupies a unique position as a private beachfront community on Long Island’s North Shore, offering residents exclusive access to pristine beaches and Long Island Sound. The community’s peninsula location provides water views from multiple angles while maintaining privacy and exclusivity that appeals to affluent buyers seeking resort-like living. Asharoken’s limited housing stock and geographic constraints create natural scarcity that supports premium pricing.
The 29.5% appreciation since 2016 reflects the community’s evolution into a truly elite destination. The explosive growth during 2021-2022, when prices jumped from around $1.36 million to over $1.8 million, demonstrates Asharoken’s appeal during periods of increased demand for exclusive waterfront properties. Current pricing around $1.81 million positions the community among Long Island’s most exclusive residential enclaves, with its unique beachfront access justifying premium valuations.
22. Remsenburg – 77.5% Home Price Increase Since 2010
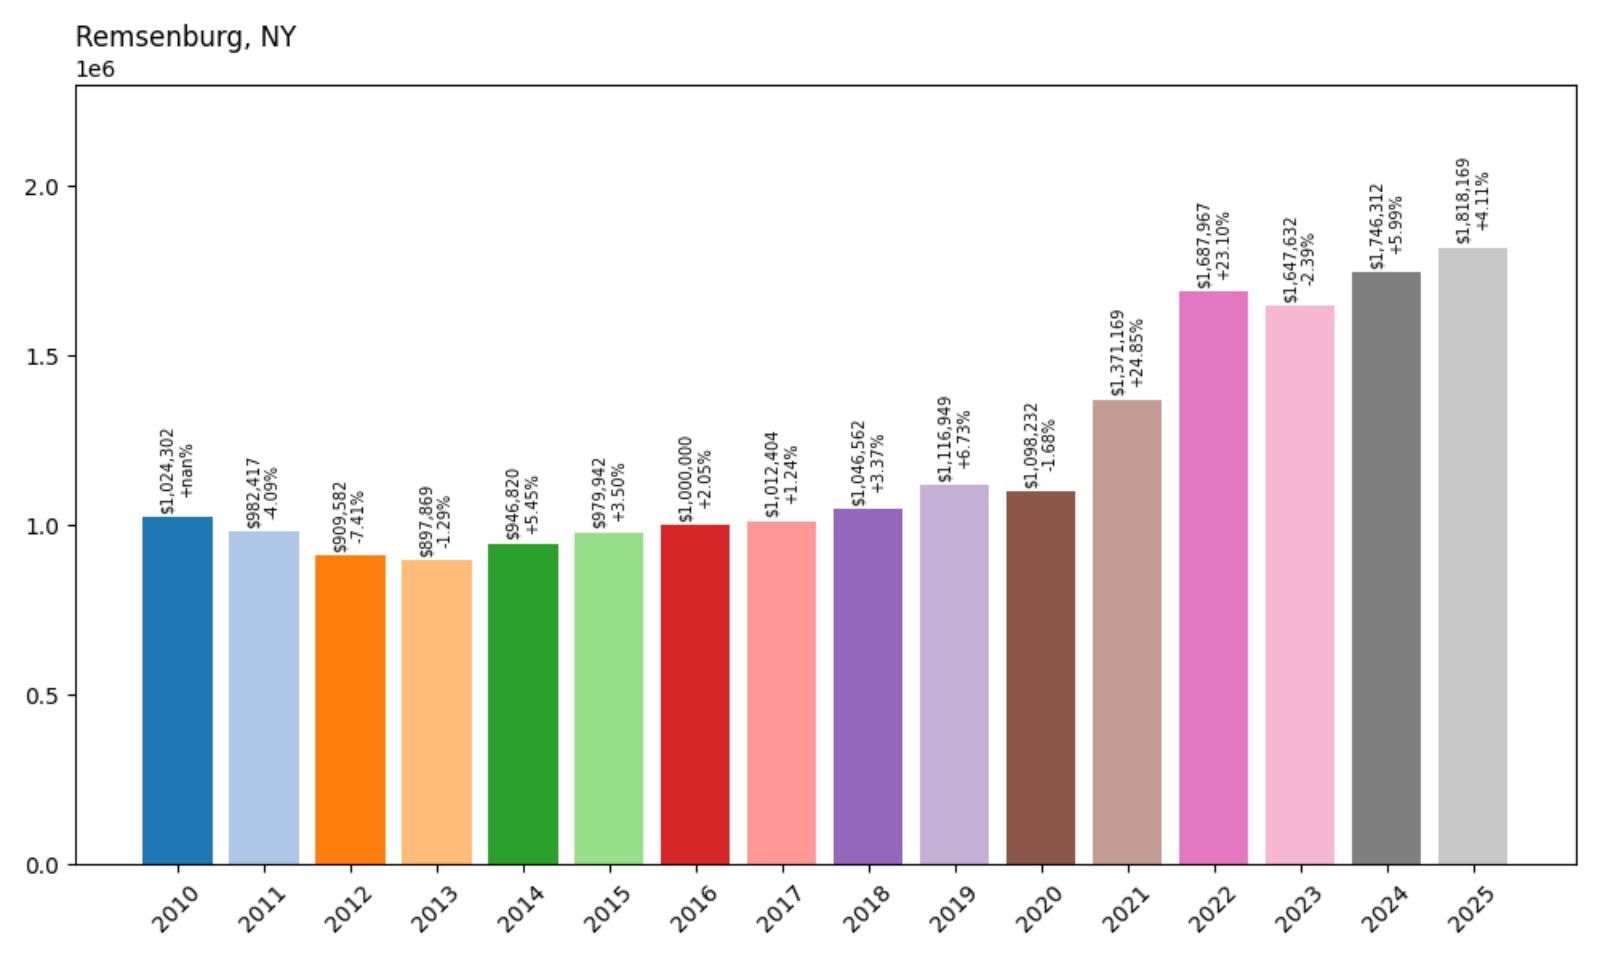
- 2010: $1,024,302
- 2011: $982,417 (−$41,885, −4.09% from previous year)
- 2012: $909,582 (−$72,834, −7.41% from previous year)
- 2013: $897,869 (−$11,713, −1.29% from previous year)
- 2014: $946,820 (+$48,950, +5.45% from previous year)
- 2015: $979,942 (+$33,122, +3.50% from previous year)
- 2016: $1,000,000 (+$20,058, +2.05% from previous year)
- 2017: $1,012,404 (+$12,404, +1.24% from previous year)
- 2018: $1,046,562 (+$34,158, +3.37% from previous year)
- 2019: $1,116,949 (+$70,387, +6.73% from previous year)
- 2020: $1,098,232 (−$18,717, −1.68% from previous year)
- 2021: $1,371,169 (+$272,937, +24.85% from previous year)
- 2022: $1,687,967 (+$316,799, +23.10% from previous year)
- 2023: $1,647,632 (−$40,335, −2.39% from previous year)
- 2024: $1,746,312 (+$98,680, +5.99% from previous year)
- 2025: $1,818,169 (+$71,857, +4.11% from previous year)
Remsenburg demonstrates substantial long-term growth with a 77.5% increase since 2010, recovering from early-decade lows to reach current levels above $1.8 million. The community experienced dramatic acceleration during the pandemic years, with back-to-back increases of nearly 25% in 2021 and 23% in 2022. Recent performance shows continued appreciation at more sustainable rates, suggesting the market has adjusted to new premium levels.
Remsenburg – Hamptons’ Hidden Enclave

Remsenburg, located in the town of Southampton, offers a more secluded alternative to the high-profile Hamptons communities while maintaining access to the region’s amenities and beaches. The community’s quiet residential character appeals to buyers seeking Hamptons prestige without the crowds and publicity associated with more famous destinations. Remsenburg’s location provides easy access to both ocean beaches and bay waters, offering diverse recreational opportunities.
The 77.5% appreciation since 2010 reflects the community’s growing recognition as a legitimate Hamptons destination. The explosive growth during 2021-2022, when prices jumped from around $1.1 million to nearly $1.7 million, coincided with unprecedented demand for Hamptons properties during the pandemic. Current pricing above $1.8 million positions Remsenburg as a premium choice within the broader Hamptons market, offering relative privacy and authenticity compared to more commercialized alternatives.
21. Lawrence – 142.2% Home Price Increase Since 2010
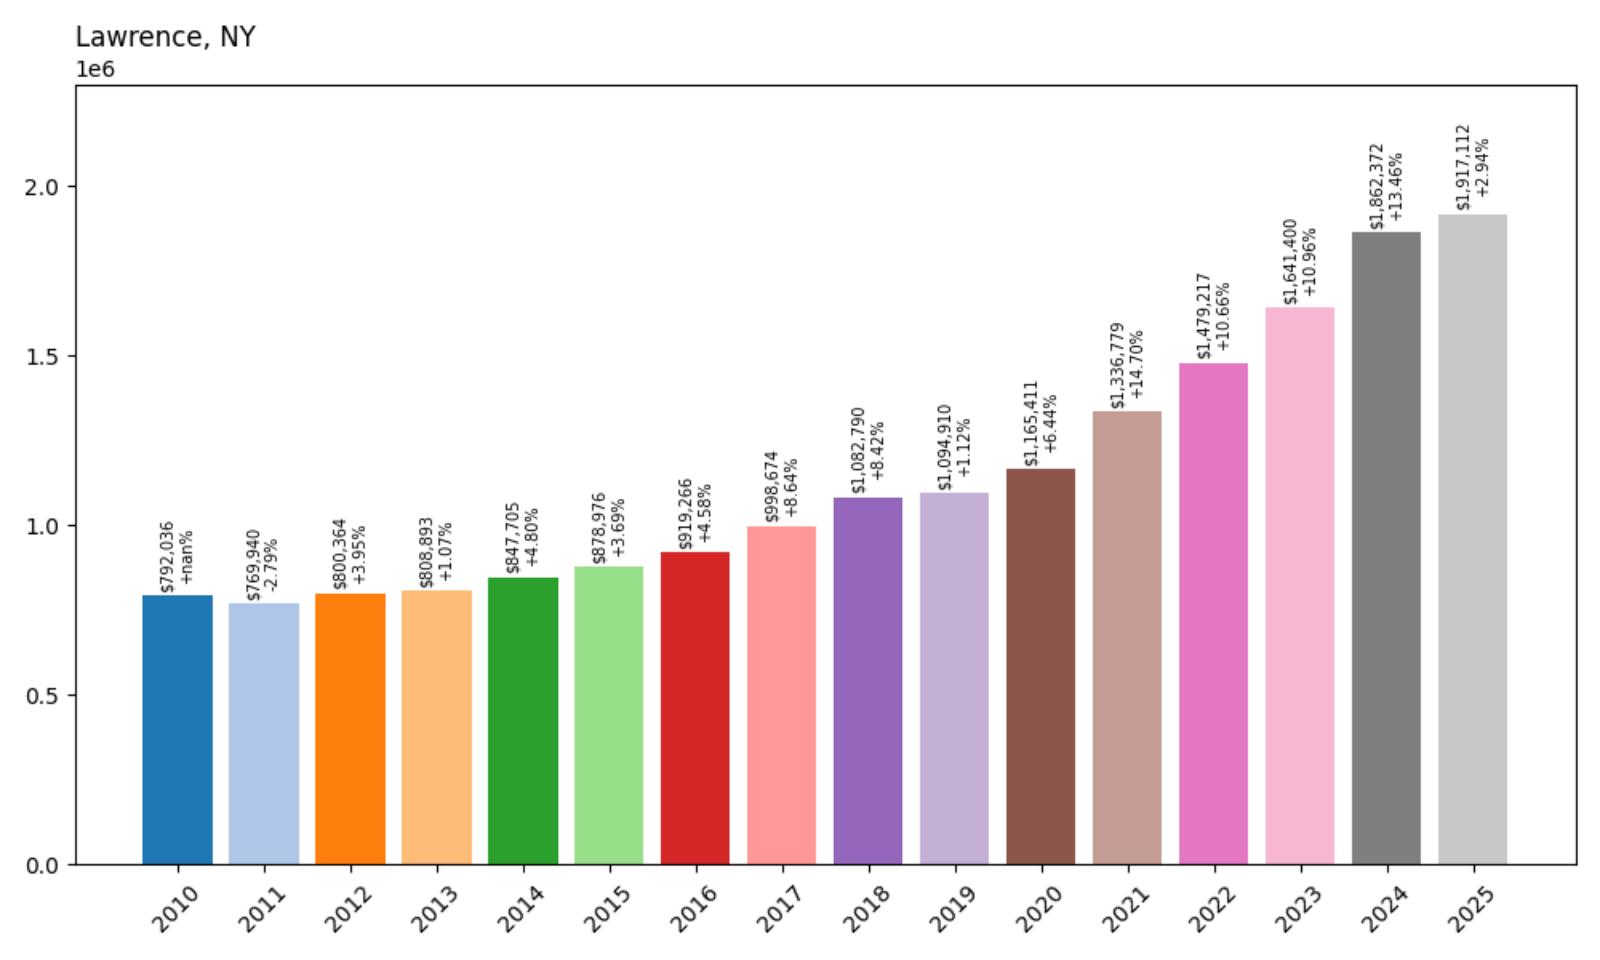
- 2010: $792,036
- 2011: $769,940 (−$22,096, −2.79% from previous year)
- 2012: $800,364 (+$30,424, +3.95% from previous year)
- 2013: $808,893 (+$8,529, +1.07% from previous year)
- 2014: $847,705 (+$38,812, +4.80% from previous year)
- 2015: $878,976 (+$31,271, +3.69% from previous year)
- 2016: $919,266 (+$40,289, +4.58% from previous year)
- 2017: $998,674 (+$79,408, +8.64% from previous year)
- 2018: $1,082,790 (+$84,115, +8.42% from previous year)
- 2019: $1,094,910 (+$12,120, +1.12% from previous year)
- 2020: $1,165,411 (+$70,501, +6.44% from previous year)
- 2021: $1,336,779 (+$171,368, +14.70% from previous year)
- 2022: $1,479,217 (+$142,439, +10.66% from previous year)
- 2023: $1,641,400 (+$162,183, +10.96% from previous year)
- 2024: $1,862,372 (+$220,972, +13.46% from previous year)
- 2025: $1,917,112 (+$54,740, +2.94% from previous year)
Lawrence achieves the most dramatic transformation on this list with an extraordinary 142.2% increase since 2010, more than doubling from around $792,000 to over $1.9 million today. The community shows consistent upward momentum throughout the entire period, with particularly strong acceleration in recent years. The data reveals sustained double-digit growth in multiple years, culminating in a remarkable 13.46% increase in 2024 alone.
Lawrence – Five Towns’ Premium Peninsula

Lawrence, part of the prestigious Five Towns area on Long Island’s South Shore, has undergone a remarkable transformation into one of New York’s most dynamic luxury markets. The community’s peninsula location between Jamaica Bay and the Atlantic Ocean provides water access on multiple sides, creating a unique residential environment that appeals to affluent buyers. Lawrence’s proximity to both Manhattan and Long Island’s beaches, combined with excellent schools and transportation options, has driven unprecedented demand.
The extraordinary 142.2% appreciation since 2010 represents one of the most successful real estate stories in New York. The consistent growth pattern, with multiple years of double-digit increases, reflects sustained demand that has fundamentally transformed the community’s market position. Lawrence’s evolution from a sub-million-dollar market to commanding nearly $2 million demonstrates how strategic location and community development can create exceptional value appreciation over time.
20. Montauk – 139.1% Home Price Increase Since 2010
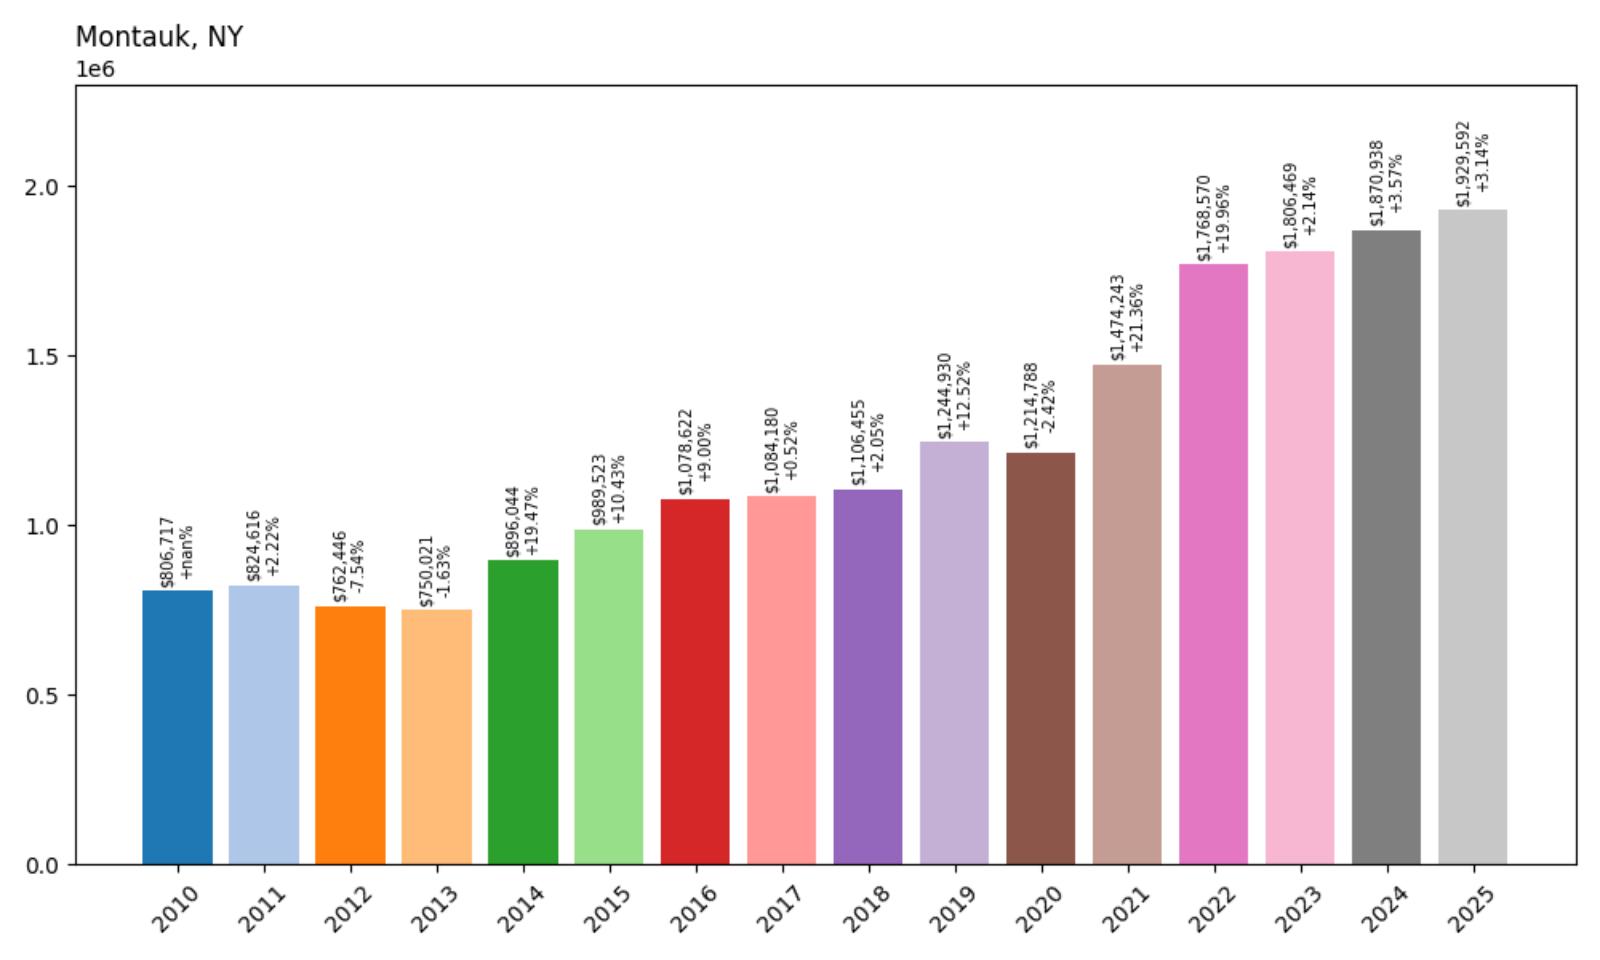
- 2010: $806,717
- 2011: $824,616 (+$17,899, +2.22% from previous year)
- 2012: $762,446 (−$62,170, −7.54% from previous year)
- 2013: $750,021 (−$12,425, −1.63% from previous year)
- 2014: $896,044 (+$146,024, +19.47% from previous year)
- 2015: $989,523 (+$93,479, +10.43% from previous year)
- 2016: $1,078,622 (+$89,099, +9.00% from previous year)
- 2017: $1,084,180 (+$5,558, +0.52% from previous year)
- 2018: $1,106,455 (+$22,274, +2.05% from previous year)
- 2019: $1,244,930 (+$138,475, +12.52% from previous year)
- 2020: $1,214,788 (−$30,142, −2.42% from previous year)
- 2021: $1,474,243 (+$259,455, +21.36% from previous year)
- 2022: $1,768,570 (+$294,327, +19.96% from previous year)
- 2023: $1,806,469 (+$37,899, +2.14% from previous year)
- 2024: $1,870,938 (+$64,469, +3.57% from previous year)
- 2025: $1,929,592 (+$58,654, +3.14% from previous year)
Montauk showcases impressive growth with a 139.1% increase since 2010, transforming from around $807,000 to nearly $2 million today. The community experienced dramatic acceleration during the pandemic years, with back-to-back increases of over 20% in 2021 and 2022. Recent years show continued but more moderate appreciation, suggesting the market has stabilized at these new premium levels while maintaining upward momentum.
Montauk – The End’s Legendary Appeal

Montauk, famously known as “The End” of Long Island, has evolved from a fishing village into one of New York’s most coveted coastal destinations. Located at the easternmost tip of Long Island, the community offers stunning ocean views, pristine beaches, and a relaxed coastal atmosphere that attracts celebrities, executives, and affluent families seeking escape from urban pressures. Montauk’s unique geography, with the Atlantic Ocean on three sides, creates an almost island-like environment that enhances its exclusivity.
The 139.1% appreciation since 2010 reflects Montauk’s transformation from a seasonal destination to a year-round luxury market. The explosive growth during 2021-2022, when prices jumped from around $1.2 million to over $1.7 million, demonstrated the community’s appeal during unprecedented demand for coastal properties. Current pricing approaching $2 million positions Montauk as one of Long Island’s premier destinations, with its authentic maritime character and natural beauty continuing to attract buyers willing to pay premium prices for this unique coastal experience.
19. East Hampton – 2.7% Home Price Decrease Since 2024

- 2010: N/A
- 2011: N/A
- 2012: N/A
- 2013: N/A
- 2014: N/A
- 2015: N/A
- 2016: N/A
- 2017: N/A
- 2018: N/A
- 2019: N/A
- 2020: N/A
- 2021: N/A
- 2022: N/A
- 2023: N/A
- 2024: $2,141,322
- 2025: $2,082,666 (−$58,655, −2.74% from previous year)
East Hampton shows a recent decline with a 2.7% decrease from 2024 to 2025, bringing current median prices to around $2.08 million. The limited data available suggests this iconic Hamptons destination may be experiencing market corrections after reaching peak levels. Despite the recent decline, current pricing still positions East Hampton among New York’s most exclusive residential markets, reflecting the community’s enduring prestige and desirability.
East Hampton – Hamptons’ Crown Jewel

East Hampton stands as perhaps the most famous and prestigious destination in the Hamptons, synonymous with luxury, celebrity culture, and exclusive summer living. The community’s pristine Atlantic beaches, historic village charm, and world-class amenities have made it a playground for the ultra-wealthy for over a century. East Hampton’s Main Beach, luxury shopping, and fine dining establishments create an atmosphere of sophistication that commands premium pricing year-round.
The recent 2.7% decline shown in the data may reflect broader corrections affecting ultra-luxury markets as they adjust from pandemic-era peaks. Despite this adjustment, current median prices above $2 million demonstrate East Hampton’s position at the apex of New York’s luxury real estate market. The community’s international reputation, limited housing supply, and continued appeal to high-net-worth individuals ensure its status as one of America’s most exclusive residential destinations.
18. Manhasset – 90.6% Home Price Increase Since 2010
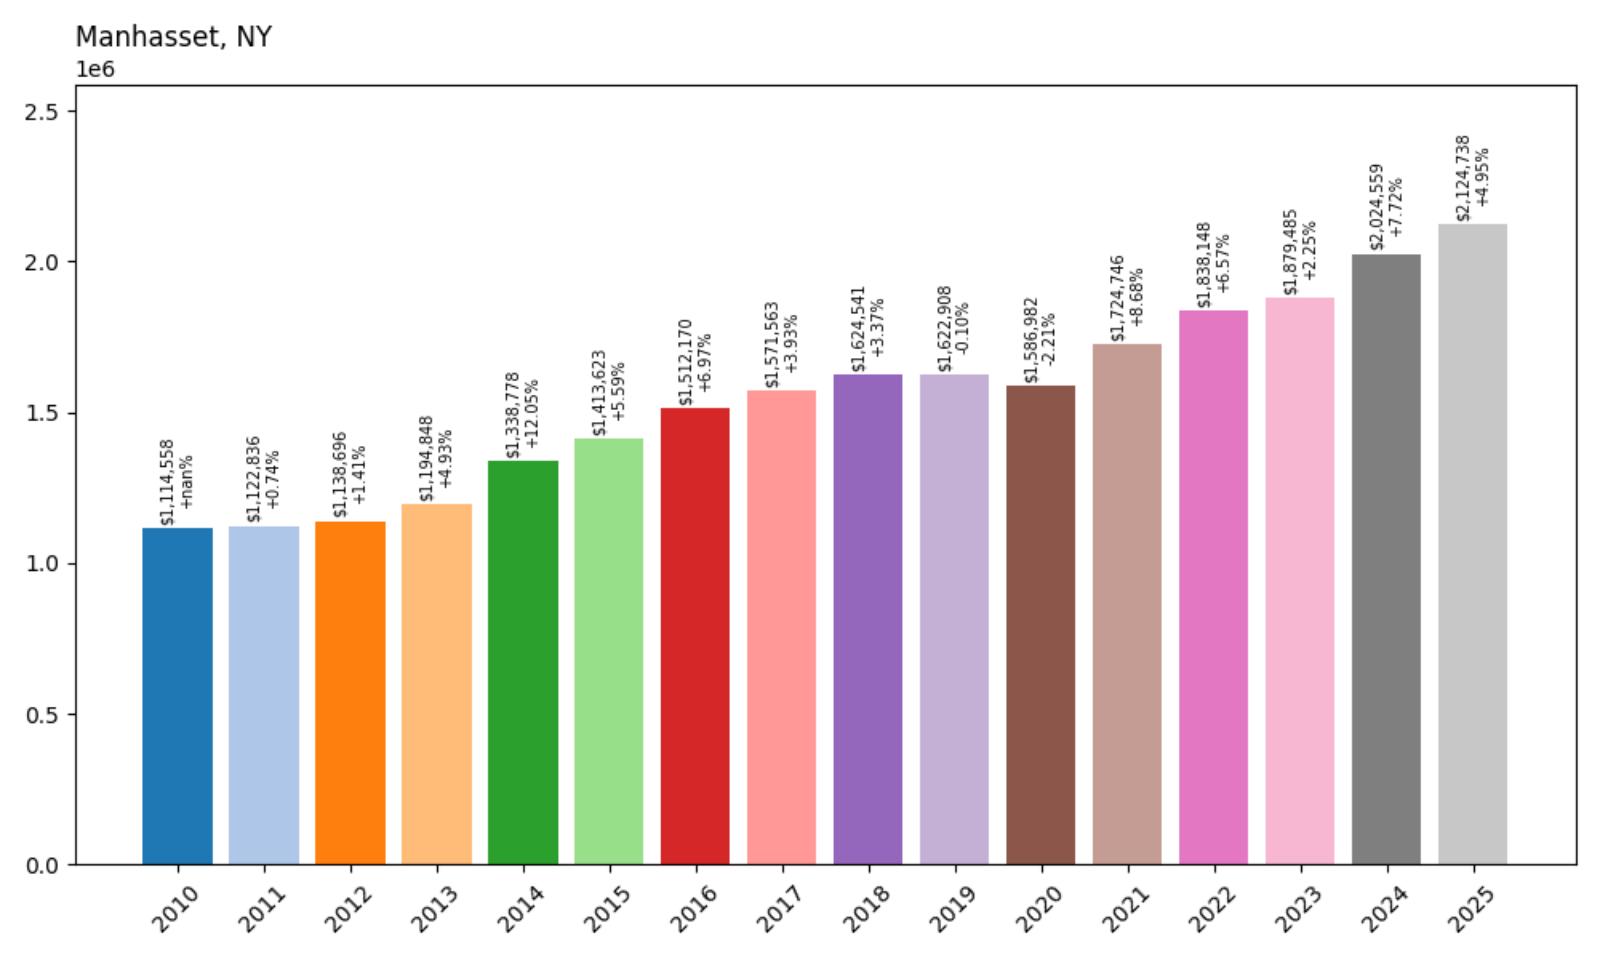
- 2010: $1,114,558
- 2011: $1,122,836 (+$8,278, +0.74% from previous year)
- 2012: $1,138,696 (+$15,860, +1.41% from previous year)
- 2013: $1,194,848 (+$56,152, +4.93% from previous year)
- 2014: $1,338,778 (+$143,930, +12.05% from previous year)
- 2015: $1,413,623 (+$74,845, +5.59% from previous year)
- 2016: $1,512,170 (+$98,547, +6.97% from previous year)
- 2017: $1,571,563 (+$59,393, +3.93% from previous year)
- 2018: $1,624,541 (+$52,978, +3.37% from previous year)
- 2019: $1,622,908 (−$1,634, −0.10% from previous year)
- 2020: $1,586,982 (−$35,926, −2.21% from previous year)
- 2021: $1,724,746 (+$137,765, +8.68% from previous year)
- 2022: $1,838,148 (+$113,402, +6.57% from previous year)
- 2023: $1,879,485 (+$41,337, +2.25% from previous year)
- 2024: $2,024,559 (+$145,073, +7.72% from previous year)
- 2025: $2,124,738 (+$100,180, +4.95% from previous year)
Manhasset demonstrates strong long-term performance with a 90.6% increase since 2010, growing steadily from around $1.1 million to over $2.1 million today. The community shows remarkable consistency in its upward trajectory, with only minor setbacks during market downturns. Recent years display continued momentum, with a notable 7.72% jump in 2024 followed by solid growth in 2025, indicating sustained demand for this premium Long Island location.
Manhasset – Gold Coast Sophistication

Manhasset, located on Long Island’s legendary Gold Coast, combines historical elegance with modern luxury living. The community is renowned for its upscale shopping at the Americana Manhasset, excellent schools, and beautiful residential neighborhoods that have attracted affluent families for generations. Manhasset’s strategic location provides convenient access to Manhattan while maintaining the suburban character that defines the North Shore’s most prestigious communities.
The 90.6% appreciation since 2010 reflects Manhasset’s consistent appeal as one of Long Island’s premier residential destinations. The steady growth pattern, with recent acceleration bringing median prices above $2.1 million, demonstrates the community’s fundamental strength in attracting and retaining affluent residents. Manhasset’s combination of shopping, schools, and transportation access creates a compelling value proposition that continues to support premium pricing in the competitive Long Island luxury market.
17. Purchase – 36.6% Home Price Increase Since 2010
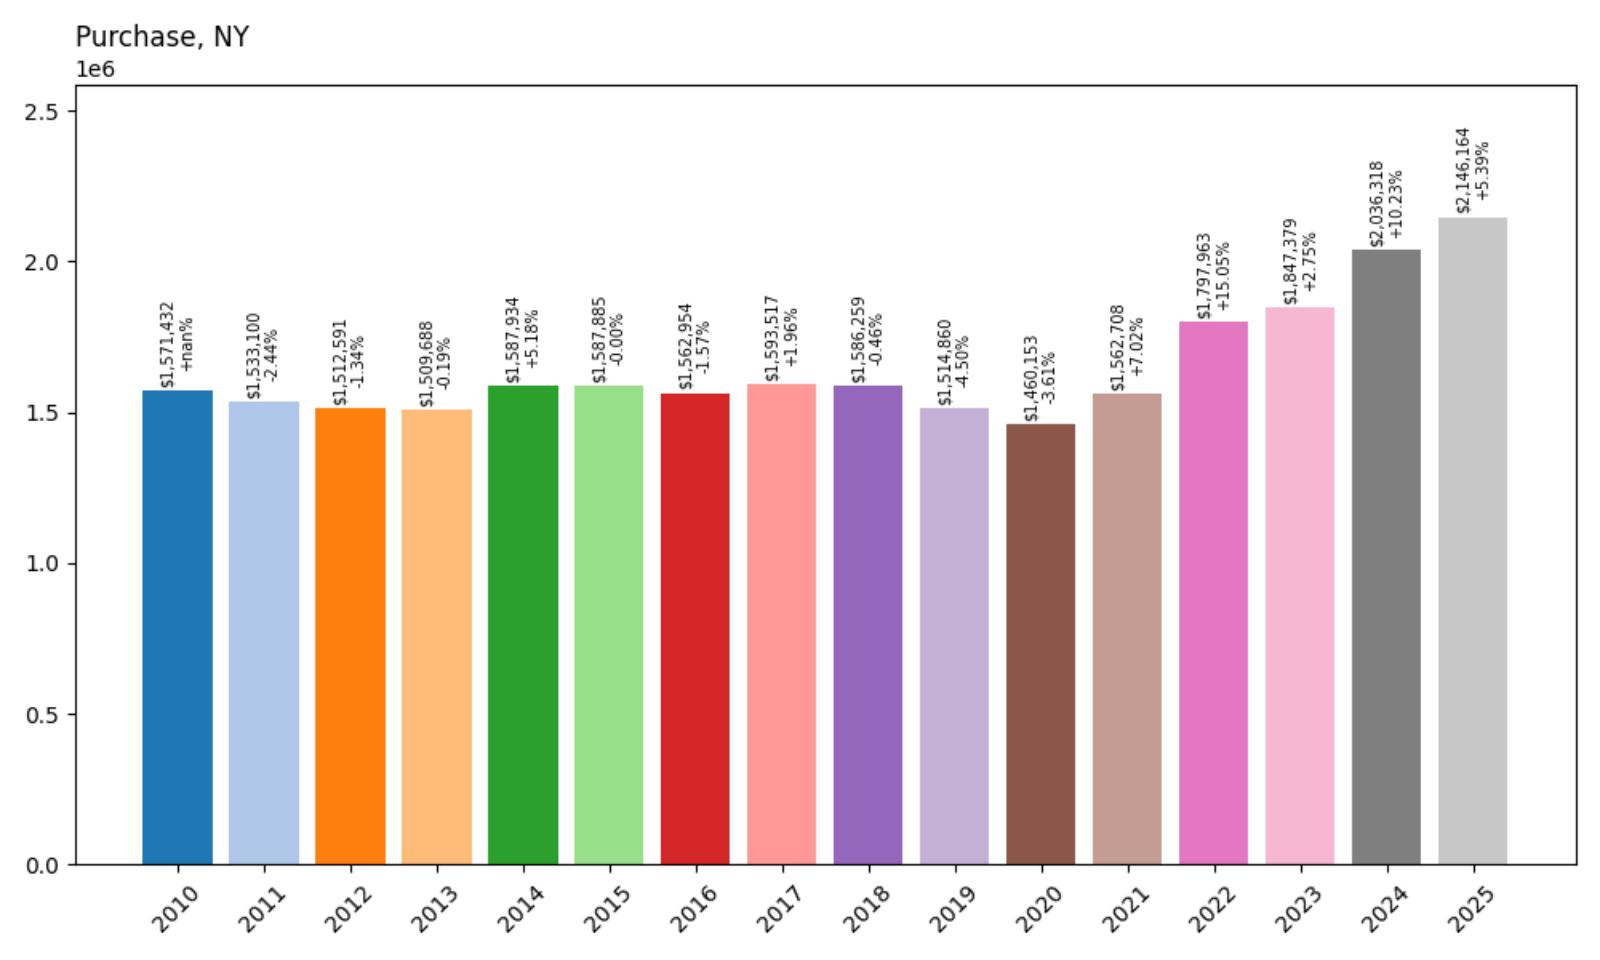
- 2010: $1,571,432
- 2011: $1,533,100 (−$38,332, −2.44% from previous year)
- 2012: $1,512,591 (−$20,509, −1.34% from previous year)
- 2013: $1,509,688 (−$2,903, −0.19% from previous year)
- 2014: $1,587,934 (+$78,246, +5.18% from previous year)
- 2015: $1,587,885 (−$49, −0.00% from previous year)
- 2016: $1,562,954 (−$24,932, −1.57% from previous year)
- 2017: $1,593,517 (+$30,564, +1.96% from previous year)
- 2018: $1,586,259 (−$7,259, −0.46% from previous year)
- 2019: $1,514,860 (−$71,398, −4.50% from previous year)
- 2020: $1,460,153 (−$54,707, −3.61% from previous year)
- 2021: $1,562,708 (+$102,555, +7.02% from previous year)
- 2022: $1,797,963 (+$235,255, +15.05% from previous year)
- 2023: $1,847,379 (+$49,416, +2.75% from previous year)
- 2024: $2,036,318 (+$188,939, +10.23% from previous year)
- 2025: $2,146,164 (+$109,846, +5.39% from previous year)
Purchase shows moderate long-term growth with a 36.6% increase since 2010, though this masks significant volatility throughout the period. The community experienced substantial declines through the late 2010s before staging a dramatic recovery during the pandemic years. Recent performance has been particularly strong, with consecutive double-digit increases bringing current prices to over $2.1 million, suggesting renewed investor confidence in this Westchester location.
Purchase – Corporate Westchester’s Prestige

Purchase, located in the town of Harrison in Westchester County, represents one of the area’s most exclusive residential enclaves. The community is home to major corporate headquarters including PepsiCo and Mastercard, creating a unique economic foundation that supports luxury housing demand. Purchase’s combination of corporate presence, excellent schools, and proximity to Manhattan makes it particularly attractive to executives and affluent professionals seeking prestigious suburban living.
The 36.6% appreciation since 2010, while moderate compared to some markets, reflects Purchase’s recovery from earlier market corrections and recent recognition of its fundamental strengths. The dramatic rebound during 2021-2024, when prices jumped from around $1.5 million to over $2.1 million, demonstrates renewed appreciation for corporate-adjacent luxury living. Current pricing above $2New York’s Most Expensive Towns 2025
16. Laurel Hollow – 49.4% Home Price Increase Since 2010

- 2010: $1,441,802
- 2011: $1,391,380 (−$50,422, −3.50% from previous year)
- 2012: $1,402,230 (+$10,850, +0.78% from previous year)
- 2013: $1,367,143 (−$35,087, −2.50% from previous year)
- 2014: $1,446,293 (+$79,150, +5.79% from previous year)
- 2015: $1,429,746 (−$16,547, −1.14% from previous year)
- 2016: $1,454,761 (+$25,015, +1.75% from previous year)
- 2017: $1,485,040 (+$30,279, +2.08% from previous year)
- 2018: $1,512,038 (+$26,999, +1.82% from previous year)
- 2019: $1,511,304 (−$734, −0.05% from previous year)
- 2020: $1,481,976 (−$29,328, −1.94% from previous year)
- 2021: $1,652,910 (+$170,934, +11.53% from previous year)
- 2022: $1,852,567 (+$199,657, +12.08% from previous year)
- 2023: $1,880,329 (+$27,762, +1.50% from previous year)
- 2024: $2,061,041 (+$180,713, +9.61% from previous year)
- 2025: $2,154,821 (+$93,780, +4.55% from previous year)
Laurel Hollow shows steady long-term growth with a 49.4% increase since 2010, growing from around $1.44 million to over $2.15 million today. The community demonstrated remarkable stability through most of the period before experiencing significant acceleration during the pandemic years. Recent performance continues showing healthy appreciation, with a notable 9.61% jump in 2024, indicating sustained demand for this exclusive Long Island location.
Laurel Hollow – Secluded North Shore Elegance

Laurel Hollow, nestled on Long Island’s prestigious North Shore, offers an exclusive residential experience characterized by large estates, wooded landscapes, and proximity to Long Island Sound. The community’s rural character and strict zoning preserve its exclusivity while providing residents with privacy and natural beauty rarely found so close to Manhattan. Laurel Hollow’s location allows easy access to both New York City and the recreational opportunities of the North Shore.
The 49.4% appreciation since 2010 reflects growing recognition of Laurel Hollow’s unique value proposition among luxury markets. The strong performance during 2021-2022, followed by continued growth bringing median prices above $2.15 million, demonstrates the community’s appeal to affluent buyers seeking privacy and prestige. Laurel Hollow’s combination of exclusivity, natural beauty, and convenient location continues to attract discerning purchasers willing to pay premium prices for this rare residential experience.
15. Southampton – 5.7% Home Price Increase Since 2024

- 2010: N/A
- 2011: N/A
- 2012: N/A
- 2013: N/A
- 2014: N/A
- 2015: N/A
- 2016: N/A
- 2017: N/A
- 2018: N/A
- 2019: N/A
- 2020: N/A
- 2021: N/A
- 2022: N/A
- 2023: N/A
- 2024: $2,047,158
- 2025: $2,163,662 (+$116,504, +5.69% from previous year)
Southampton shows solid momentum with a 5.7% increase from 2024 to 2025, bringing current median prices to over $2.16 million. The limited data available indicates this legendary Hamptons destination maintains steady appreciation despite broader market uncertainties. The substantial year-over-year increase of over $116,000 demonstrates continued strong demand for properties in this iconic summer destination.
Southampton – Hamptons’ Historic Heart

Southampton stands as one of the original and most prestigious Hamptons destinations, with a rich history dating back to the 1640s. The community combines historic village charm with modern luxury amenities, featuring pristine Atlantic beaches, world-class golf courses, and sophisticated cultural attractions. Southampton’s Main Street shopping district and renowned social scene have made it a preferred destination for New York’s social elite for generations.
The steady 5.7% appreciation shown in the limited data reflects Southampton’s enduring appeal as a premier luxury destination. Current median prices above $2.16 million position the community among the Hamptons’ most expensive markets, justified by its combination of historical significance, natural beauty, and social prestige. Southampton’s status as the cultural and commercial center of the Hamptons continues to attract affluent buyers seeking the ultimate in luxury coastal living.
14. Mill Neck – 52.5% Home Price Increase Since 2010
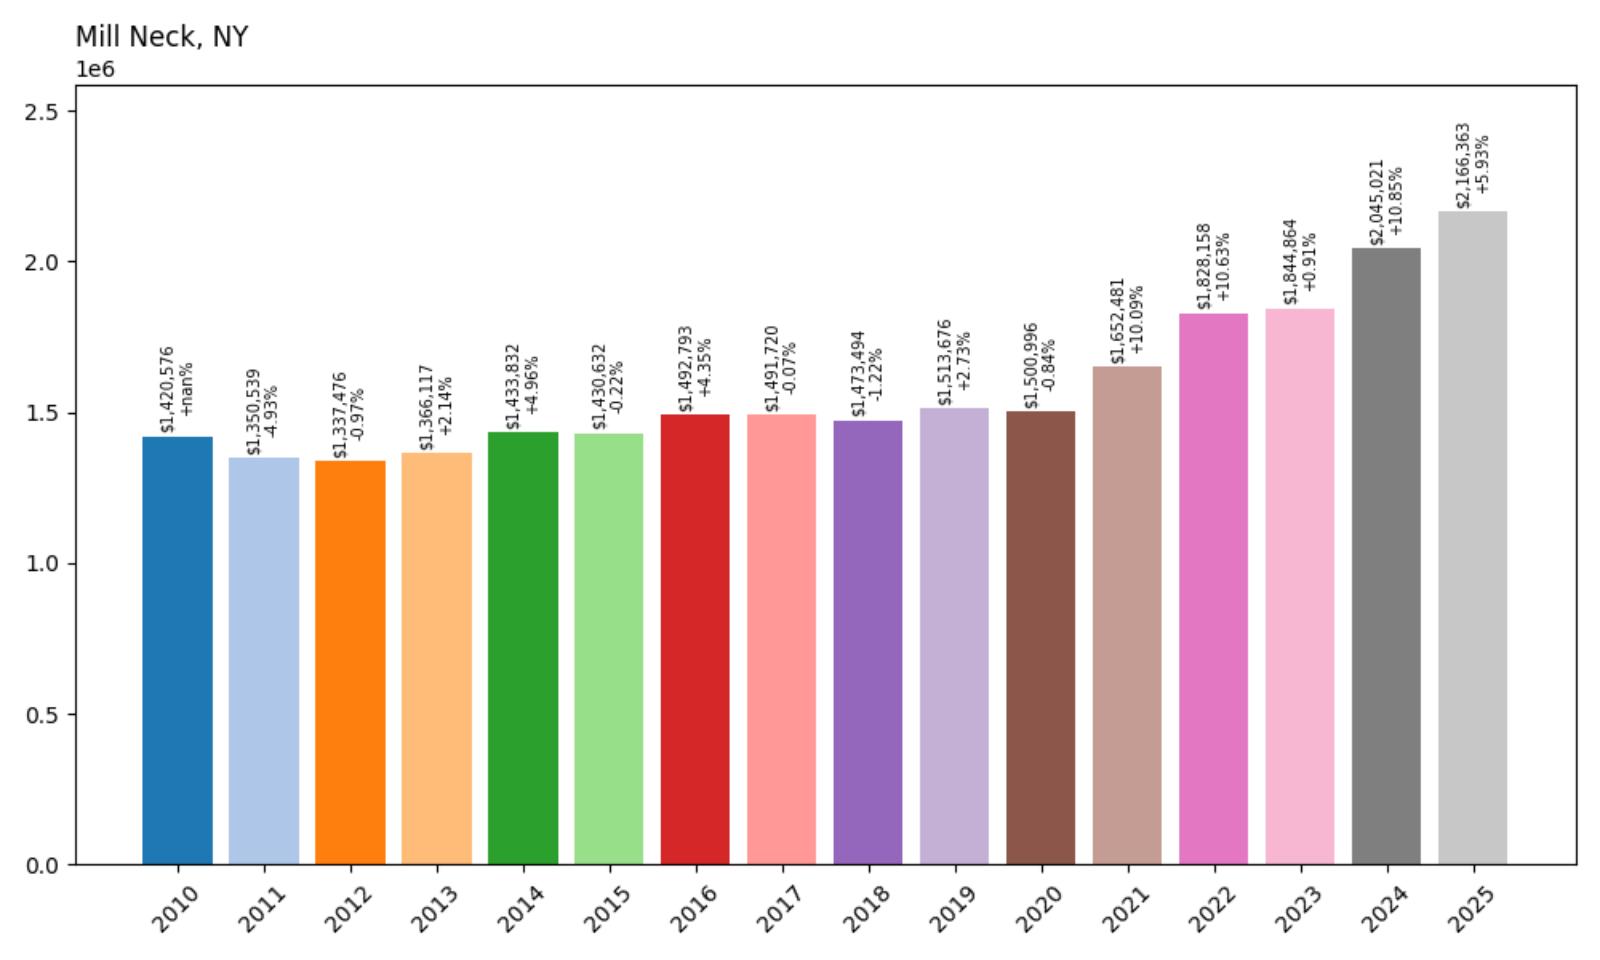
- 2010: $1,420,576
- 2011: $1,350,539 (−$70,038, −4.93% from previous year)
- 2012: $1,337,476 (−$13,063, −0.97% from previous year)
- 2013: $1,366,117 (+$28,642, +2.14% from previous year)
- 2014: $1,433,832 (+$67,714, +4.96% from previous year)
- 2015: $1,430,632 (−$3,200, −0.22% from previous year)
- 2016: $1,492,793 (+$62,161, +4.35% from previous year)
- 2017: $1,491,720 (−$1,073, −0.07% from previous year)
- 2018: $1,473,494 (−$18,226, −1.22% from previous year)
- 2019: $1,513,676 (+$40,182, +2.73% from previous year)
- 2020: $1,500,996 (−$12,680, −0.84% from previous year)
- 2021: $1,652,481 (+$151,486, +10.09% from previous year)
- 2022: $1,828,158 (+$175,677, +10.63% from previous year)
- 2023: $1,844,864 (+$16,705, +0.91% from previous year)
- 2024: $2,045,021 (+$200,157, +10.85% from previous year)
- 2025: $2,166,363 (+$121,342, +5.93% from previous year)
Mill Neck demonstrates solid long-term appreciation with a 52.5% increase since 2010, growing from around $1.42 million to over $2.16 million today. The community showed remarkable stability through the 2010s before experiencing significant acceleration during recent years. The data reveals particularly strong performance in 2024 with a 10.85% increase, followed by continued healthy growth, indicating robust demand for this prestigious Long Island location.
Mill Neck – Gold Coast Tranquility

Mill Neck, located on Long Island’s historic Gold Coast, offers an exclusive residential environment characterized by large estates, mature landscaping, and proximity to Oyster Bay Harbor. The community’s quiet residential character appeals to affluent families seeking privacy and prestige while maintaining convenient access to Manhattan and Long Island’s recreational amenities. Mill Neck’s location provides both water access and the suburban tranquility that defines the North Shore’s most desirable communities.
The 52.5% appreciation since 2010 reflects steady recognition of Mill Neck’s appeal among luxury markets. The strong recent performance, including double-digit growth in 2024, demonstrates continued demand for exclusive North Shore properties. Current pricing above $2.16 million positions Mill Neck among Long Island’s most expensive residential communities, with its combination of privacy, prestige, and proximity to water access justifying premium valuations in the competitive luxury market.
13. Sag Harbor – 117.0% Home Price Increase Since 2010
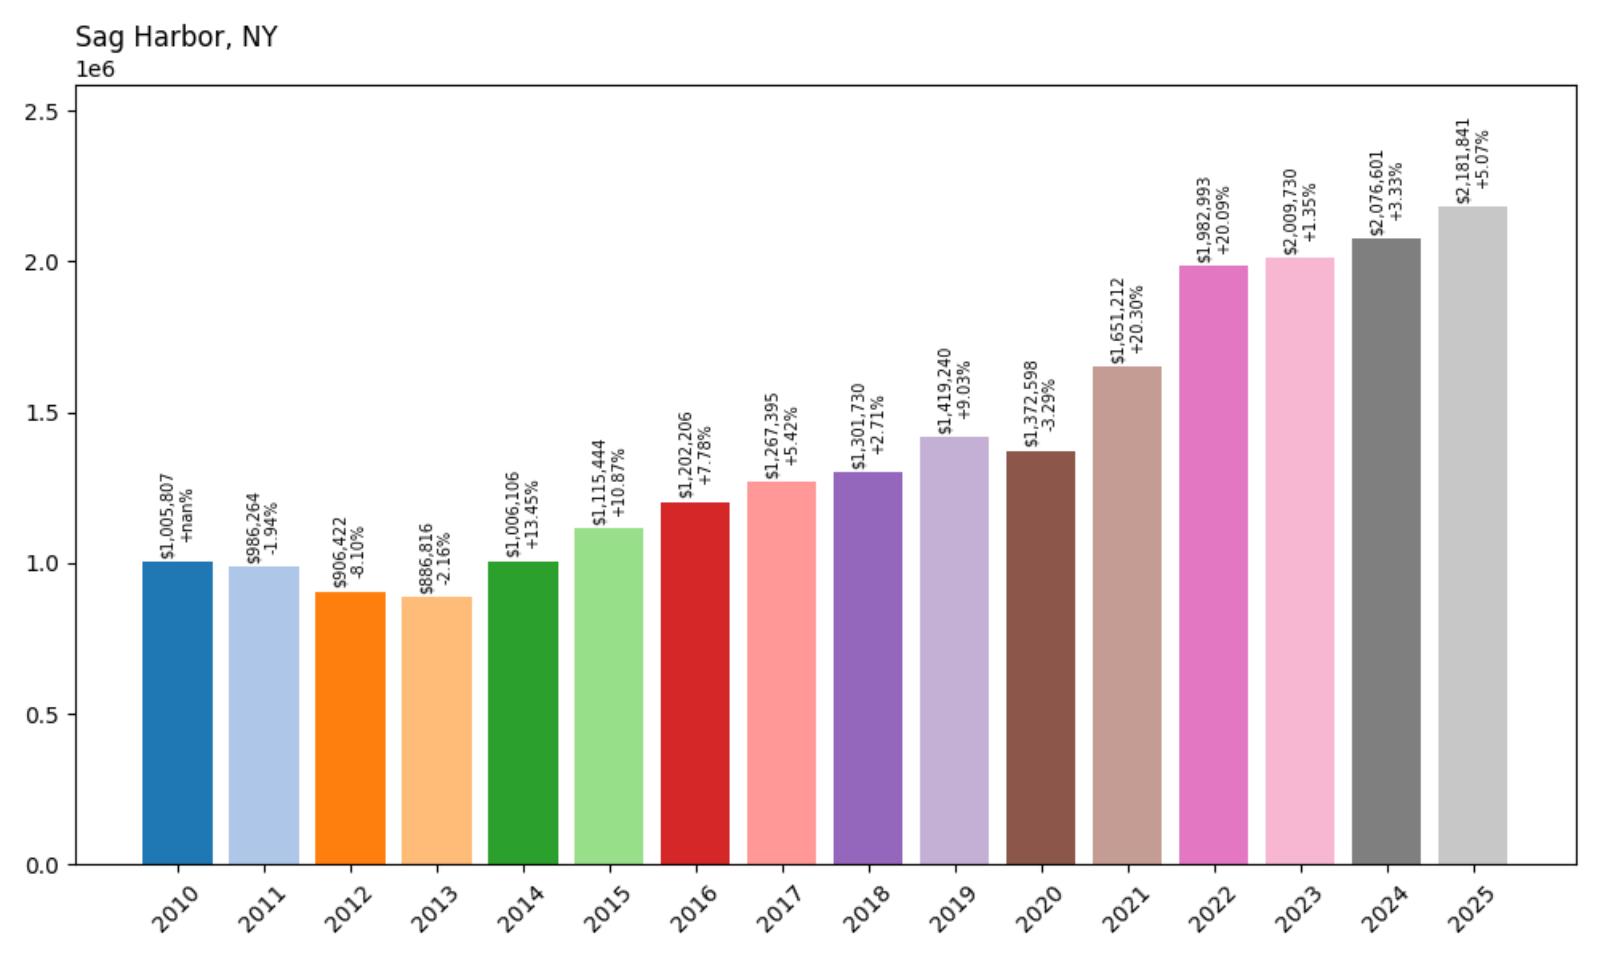
- 2010: $1,005,807
- 2011: $986,264 (−$19,543, −1.94% from previous year)
- 2012: $906,422 (−$79,842, −8.10% from previous year)
- 2013: $886,816 (−$19,606, −2.16% from previous year)
- 2014: $1,006,106 (+$119,291, +13.45% from previous year)
- 2015: $1,115,444 (+$109,338, +10.87% from previous year)
- 2016: $1,202,206 (+$86,761, +7.78% from previous year)
- 2017: $1,267,395 (+$65,189, +5.42% from previous year)
- 2018: $1,301,730 (+$34,336, +2.71% from previous year)
- 2019: $1,419,240 (+$117,510, +9.03% from previous year)
- 2020: $1,372,598 (−$46,642, −3.29% from previous year)
- 2021: $1,651,212 (+$278,615, +20.30% from previous year)
- 2022: $1,982,993 (+$331,780, +20.09% from previous year)
- 2023: $2,009,730 (+$26,738, +1.35% from previous year)
- 2024: $2,076,601 (+$66,871, +3.33% from previous year)
- 2025: $2,181,841 (+$105,240, +5.07% from previous year)
Sag Harbor demonstrates exceptional growth with a 117.0% increase since 2010, more than doubling from around $1 million to over $2.18 million today. The community recovered from early-decade lows to achieve dramatic acceleration during the pandemic years, with back-to-back increases of over 20% in 2021 and 2022. Recent years show continued but more moderate appreciation, suggesting the market has found a new equilibrium at these elevated premium levels.
Sag Harbor – Historic Maritime Charm

Sag Harbor combines authentic maritime history with modern Hamptons luxury, offering a unique alternative to the more commercialized destinations in the region. The community’s well-preserved 19th-century whaling village character, complete with historic architecture and a working harbor, appeals to buyers seeking genuine coastal heritage alongside contemporary amenities. Sag Harbor’s location provides access to both Peconic Bay and the Atlantic Ocean, offering diverse water recreational opportunities.
The remarkable 117.0% appreciation since 2010 reflects Sag Harbor’s evolution from a charming but affordable coastal community to a premier luxury destination. The explosive growth during 2021-2022, when prices jumped from around $1.4 million to nearly $2 million, demonstrated the community’s appeal during unprecedented demand for authentic coastal properties. Current pricing above $2.18 million positions Sag Harbor among the Hamptons’ most expensive markets, with its unique combination of historical character and luxury amenities continuing to attract discerning buyers.
12. Oyster Bay Cove – 53.2% Home Price Increase Since 2010
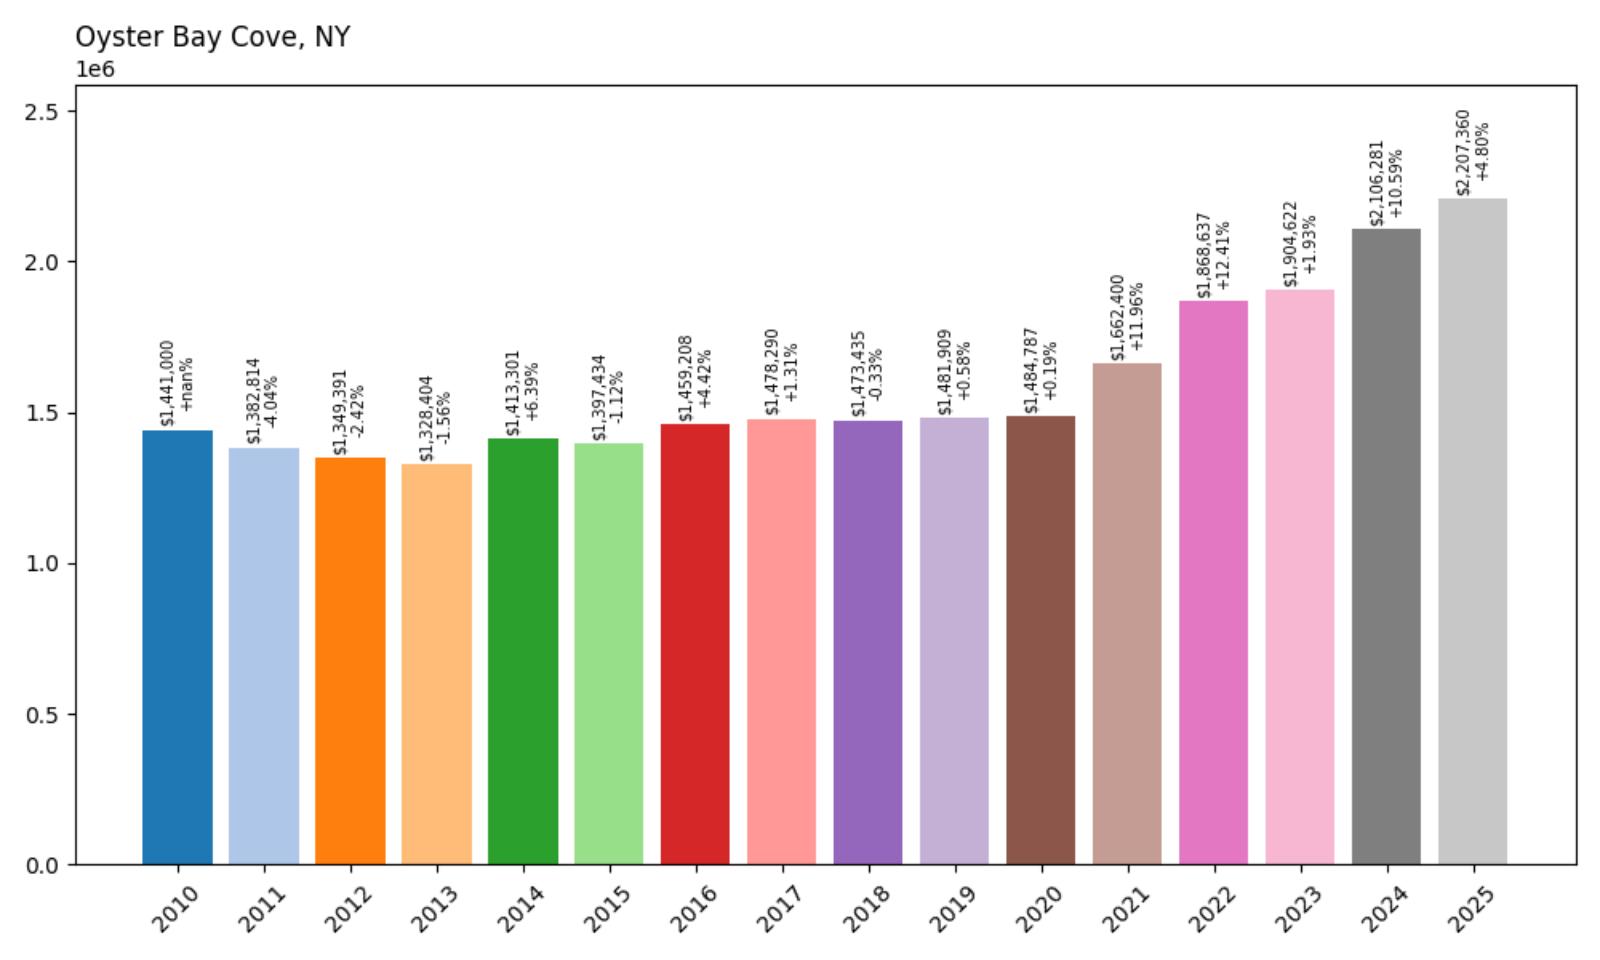
- 2010: $1,441,000
- 2011: $1,382,814 (−$58,187, −4.04% from previous year)
- 2012: $1,349,391 (−$33,423, −2.42% from previous year)
- 2013: $1,328,404 (−$20,987, −1.56% from previous year)
- 2014: $1,413,301 (+$84,897, +6.39% from previous year)
- 2015: $1,397,434 (−$15,867, −1.12% from previous year)
- 2016: $1,459,208 (+$61,774, +4.42% from previous year)
- 2017: $1,478,290 (+$19,082, +1.31% from previous year)
- 2018: $1,473,435 (−$4,855, −0.33% from previous year)
- 2019: $1,481,909 (+$8,474, +0.58% from previous year)
- 2020: $1,484,787 (+$2,878, +0.19% from previous year)
- 2021: $1,662,400 (+$177,613, +11.96% from previous year)
- 2022: $1,868,637 (+$206,237, +12.41% from previous year)
- 2023: $1,904,622 (+$35,986, +1.93% from previous year)
- 2024: $2,106,281 (+$201,659, +10.59% from previous year)
- 2025: $2,207,360 (+$101,078, +4.80% from previous year)
Oyster Bay Cove shows steady long-term growth with a 53.2% increase since 2010, growing from around $1.44 million to over $2.2 million today. The community demonstrated remarkable stability through the 2010s before experiencing significant acceleration during recent years. The data reveals particularly strong performance in 2024 with a 10.59% increase, indicating renewed demand for this exclusive North Shore enclave.
Oyster Bay Cove – Exclusive Harbor Living

Oyster Bay Cove represents one of Long Island’s most exclusive residential communities, featuring large waterfront estates and pristine harbor access. The community’s location on Oyster Bay Harbor provides residents with exceptional boating and water recreational opportunities while maintaining the privacy and prestige associated with the Gold Coast’s most desirable addresses. Oyster Bay Cove’s strict development controls and large lot requirements preserve its exclusive character and natural beauty.
The 53.2% appreciation since 2010 reflects growing recognition of Oyster Bay Cove’s unique position in the luxury market. The strong recent performance, bringing median prices above $2.2 million, demonstrates continued appeal among affluent buyers seeking waterfront exclusivity. The community’s combination of harbor access, privacy, and proximity to Manhattan creates a compelling value proposition that supports premium pricing in the competitive North Shore luxury market.
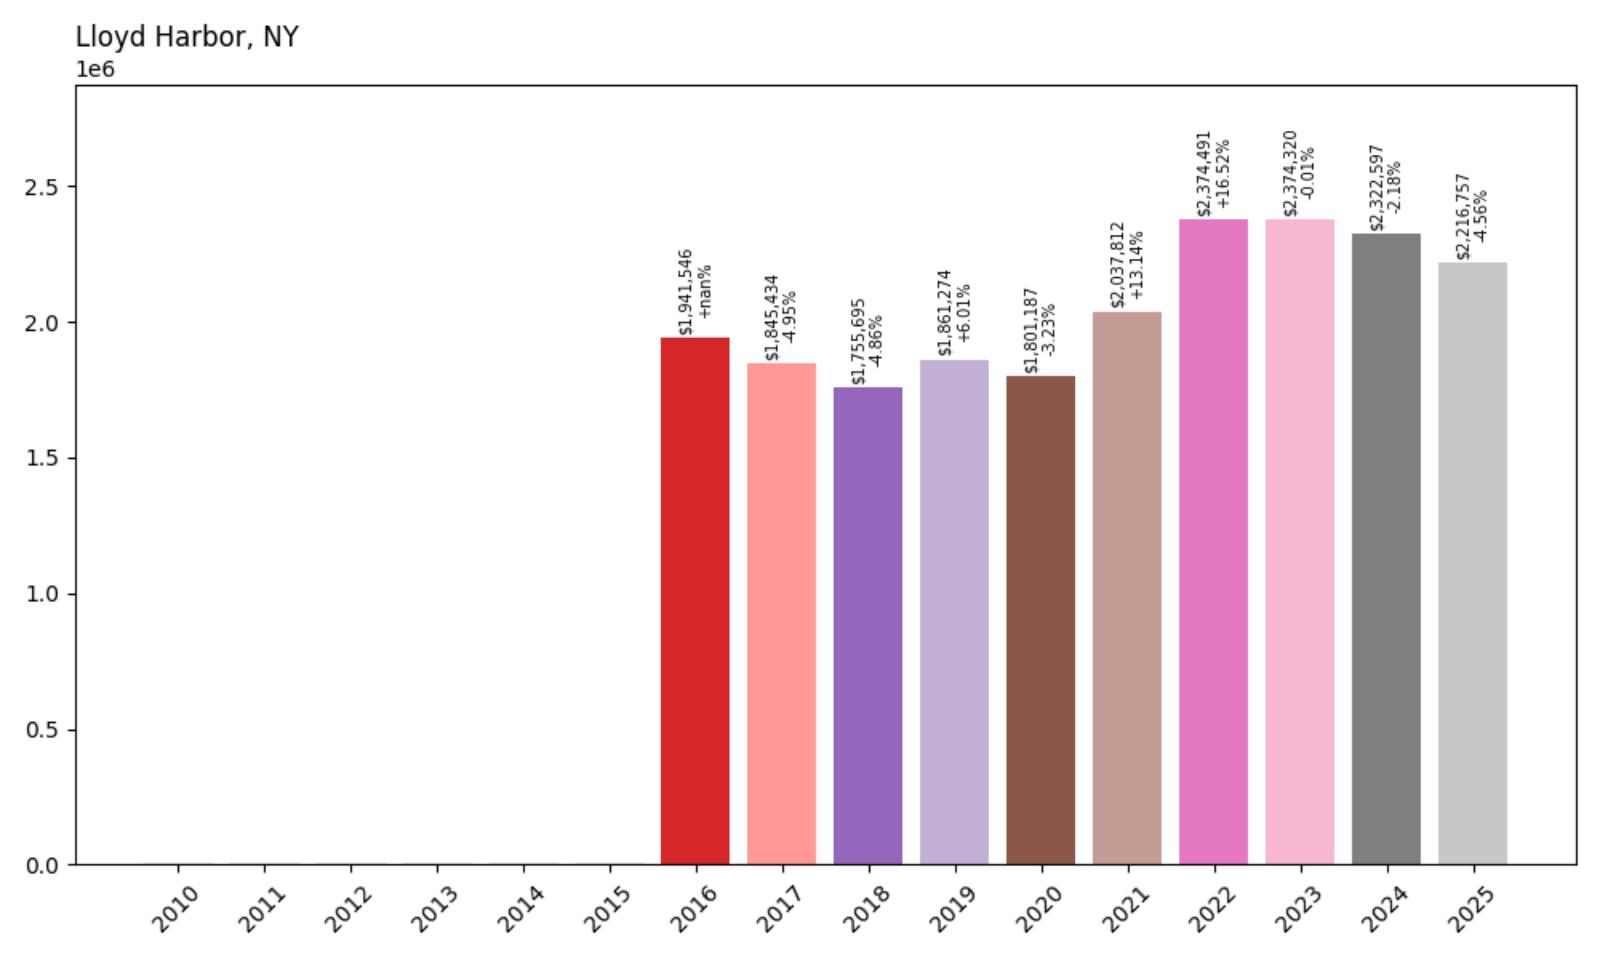
11. Lloyd Harbor – 14.1% Home Price Increase Since 2016
- 2010: N/A
- 2011: N/A
- 2012: N/A
- 2013: N/A
- 2014: N/A
- 2015: N/A
- 2016: $1,941,546
- 2017: $1,845,434 (−$96,112, −4.95% from previous year)
- 2018: $1,755,695 (−$89,739, −4.86% from previous year)
- 2019: $1,861,274 (+$105,579, +6.01% from previous year)
- 2020: $1,801,187 (−$60,086, −3.23% from previous year)
- 2021: $2,037,812 (+$236,625, +13.14% from previous year)
- 2022: $2,374,491 (+$336,679, +16.52% from previous year)
- 2023: $2,374,320 (−$171, −0.01% from previous year)
- 2024: $2,322,597 (−$51,722, −2.18% from previous year)
- 2025: $2,216,757 (−$105,840, −4.56% from previous year)
Lloyd Harbor shows moderate overall growth with a 14.1% increase since 2016, though this masks significant volatility including a dramatic peak in 2022. The community experienced substantial pandemic-driven appreciation, reaching nearly $2.4 million before entering a correction phase. Recent declines have brought current prices to around $2.22 million, suggesting market adjustments after speculative peaks while maintaining premium positioning.
Lloyd Harbor – Gold Coast Prestige

Lloyd Harbor stands among Long Island’s most prestigious residential communities, featuring expansive waterfront estates and some of the most expensive properties on the North Shore. The community’s location on Huntington Bay provides residents with exceptional water access and scenic beauty, while strict zoning preserves the area’s exclusive character. Lloyd Harbor’s large estates and mature landscaping create an environment of unparalleled privacy and luxury.
The recent price volatility, from peaks near $2.4 million to current levels around $2.22 million, reflects broader trends affecting ultra-luxury markets during and after the pandemic. Despite recent corrections, current pricing still positions Lloyd Harbor among New York’s most expensive residential communities. The community’s fundamental appeal—combining waterfront access, privacy, and proximity to Manhattan—continues to attract ultra-high-net-worth individuals seeking the ultimate in luxury living.
10. Muttontown – 46.1% Home Price Increase Since 2010
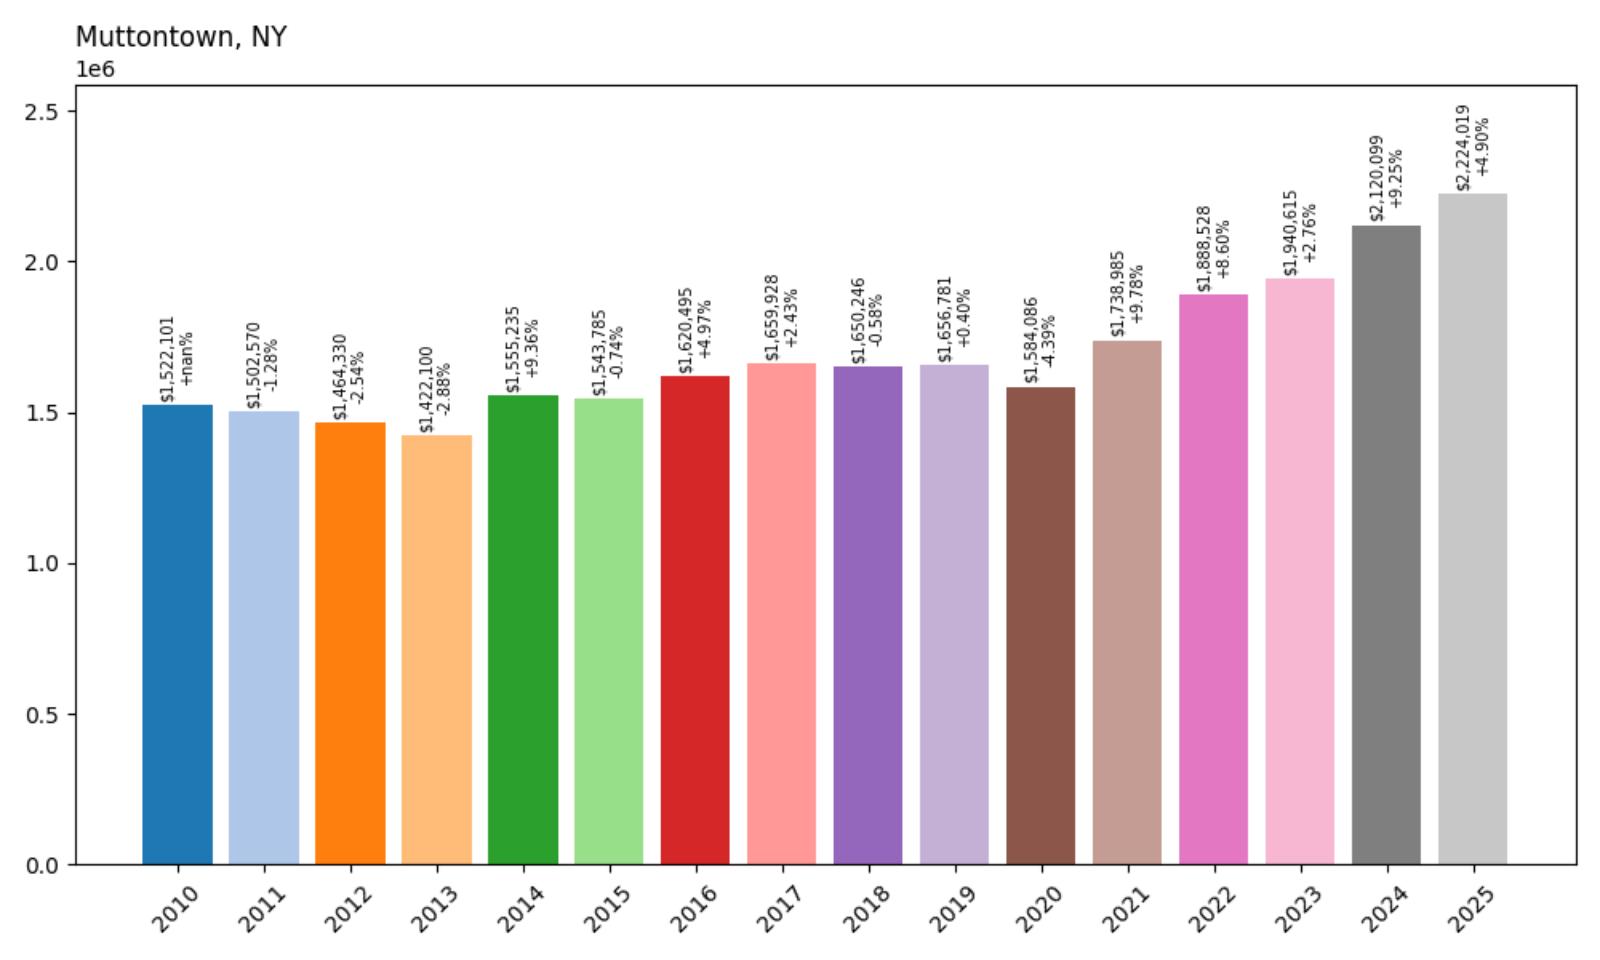
- 2010: $1,522,101
- 2011: $1,502,570 (−$19,531, −1.28% from previous year)
- 2012: $1,464,330 (−$38,240, −2.54% from previous year)
- 2013: $1,422,100 (−$42,230, −2.88% from previous year)
- 2014: $1,555,235 (+$133,136, +9.36% from previous year)
- 2015: $1,543,785 (−$11,450, −0.74% from previous year)
- 2016: $1,620,495 (+$76,710, +4.97% from previous year)
- 2017: $1,659,928 (+$39,433, +2.43% from previous year)
- 2018: $1,650,246 (−$9,682, −0.58% from previous year)
- 2019: $1,656,781 (+$6,535, +0.40% from previous year)
- 2020: $1,584,086 (−$72,696, −4.39% from previous year)
- 2021: $1,738,985 (+$154,899, +9.78% from previous year)
- 2022: $1,888,528 (+$149,544, +8.60% from previous year)
- 2023: $1,940,615 (+$52,086, +2.76% from previous year)
- 2024: $2,120,099 (+$179,484, +9.25% from previous year)
- 2025: $2,224,019 (+$103,920, +4.90% from previous year)
Muttontown demonstrates steady long-term appreciation with a 46.1% increase since 2010, growing from around $1.52 million to over $2.22 million today. The community showed resilience through market downturns and benefited from pandemic-era demand for luxury properties. Recent performance has been particularly strong, with a notable 9.25% increase in 2024, indicating continued demand for this exclusive Nassau County location.
Muttontown – Nassau County’s Rural Elegance

Muttontown offers a unique combination of rural tranquility and suburban convenience within Nassau County, featuring large estates and preserved open spaces that create a countryside atmosphere. The community’s location provides easy access to both Manhattan and Long Island’s recreational amenities while maintaining the privacy and exclusivity that appeals to affluent families. Muttontown’s excellent schools and family-friendly environment make it particularly attractive to high-net-worth families.
The 46.1% appreciation since 2010 reflects steady recognition of Muttontown’s appeal among luxury markets. The strong recent performance, bringing median prices above $2.22 million, demonstrates the community’s continued attraction for buyers seeking suburban luxury with rural character. Muttontown’s combination of privacy, excellent schools, and convenient location creates a compelling value proposition that supports premium pricing in the competitive Long Island luxury market.
9. Upper Brookville – 59.4% Home Price Increase Since 2010
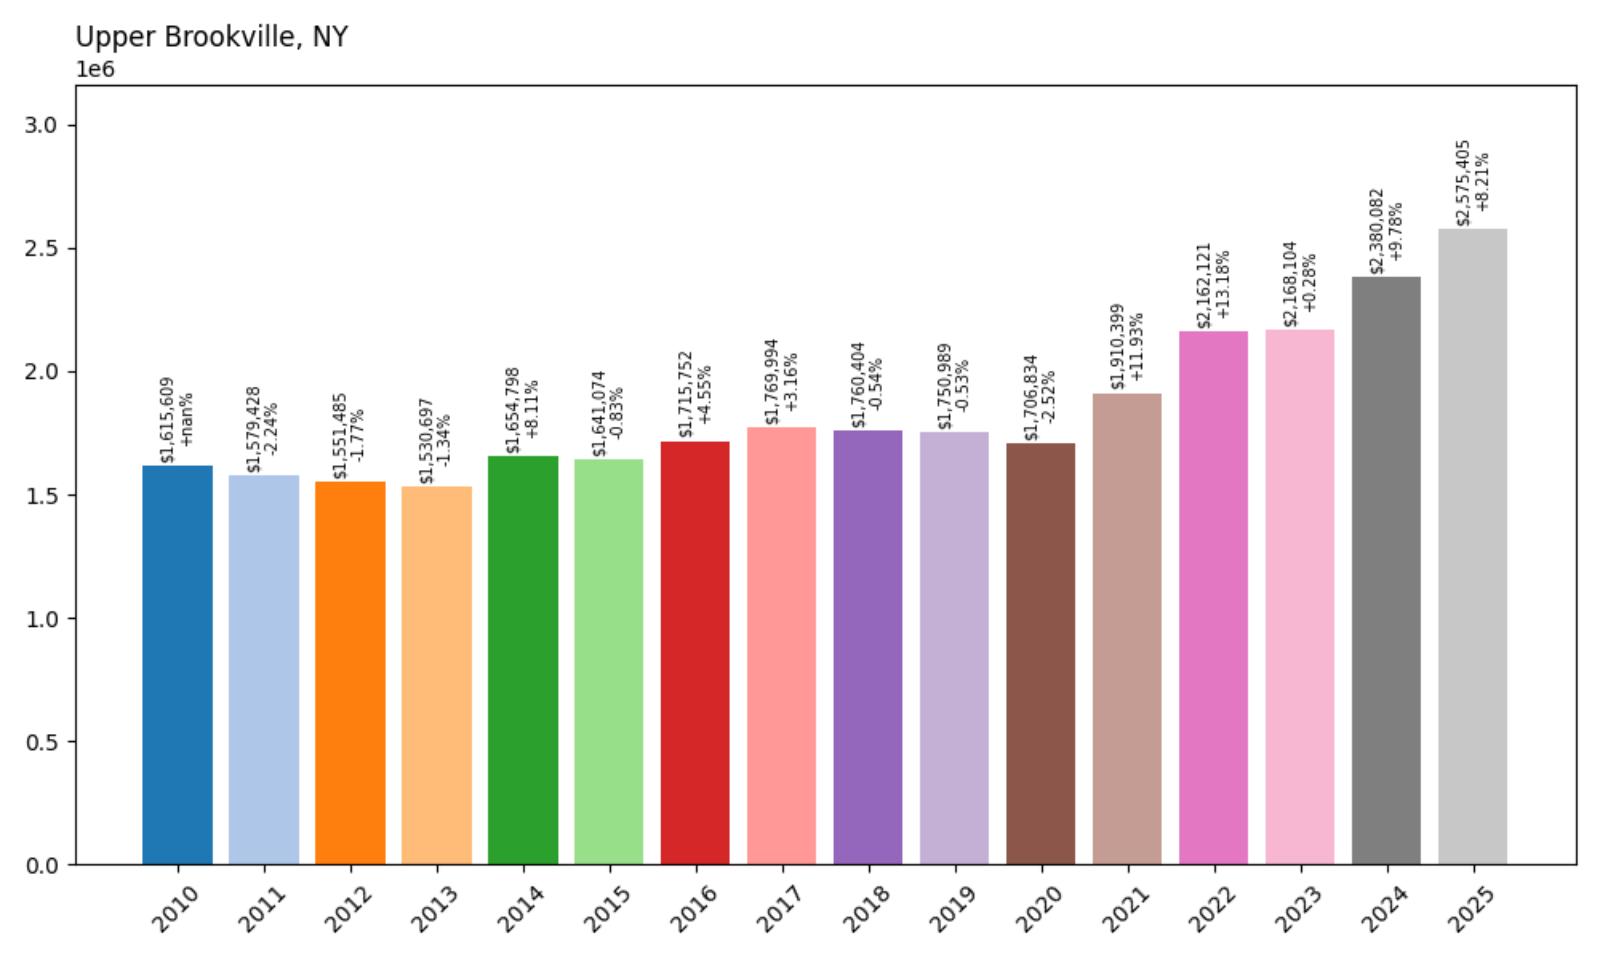
- 2010: $1,615,609
- 2011: $1,579,428 (−$36,181, −2.24% from previous year)
- 2012: $1,551,485 (−$27,943, −1.77% from previous year)
- 2013: $1,530,697 (−$20,788, −1.34% from previous year)
- 2014: $1,654,798 (+$124,101, +8.11% from previous year)
- 2015: $1,641,074 (−$13,724, −0.83% from previous year)
- 2016: $1,715,752 (+$74,678, +4.55% from previous year)
- 2017: $1,769,994 (+$54,242, +3.16% from previous year)
- 2018: $1,760,404 (−$9,590, −0.54% from previous year)
- 2019: $1,750,989 (−$9,415, −0.53% from previous year)
- 2020: $1,706,834 (−$44,155, −2.52% from previous year)
- 2021: $1,910,399 (+$203,565, +11.93% from previous year)
- 2022: $2,162,121 (+$251,722, +13.18% from previous year)
- 2023: $2,168,104 (+$5,983, +0.28% from previous year)
- 2024: $2,380,082 (+$211,979, +9.78% from previous year)
- 2025: $2,575,405 (+$195,323, +8.21% from previous year)
Upper Brookville shows solid long-term growth with a 59.4% increase since 2010, growing from around $1.62 million to over $2.57 million today. The community demonstrated stability through the 2010s before experiencing significant acceleration during recent years. The data reveals particularly strong performance in 2024-2025, with consecutive increases bringing current prices above $2.5 million, indicating robust demand for this prestigious Nassau County location.
Upper Brookville – Gold Coast Grandeur

Upper Brookville represents the epitome of Gold Coast luxury living, featuring some of Long Island’s most magnificent estates and pristine landscapes. The community’s location in the heart of Nassau County’s most prestigious area provides residents with unparalleled privacy and exclusivity while maintaining convenient access to Manhattan and regional amenities. Upper Brookville’s large lots, mature trees, and architectural diversity create an environment that appeals to the most discerning luxury buyers.
The 59.4% appreciation since 2010 reflects growing recognition of Upper Brookville’s position among New York’s premier residential destinations. The strong recent performance, with current prices exceeding $2.57 million, demonstrates continued appeal among ultra-high-net-worth individuals. Upper Brookville’s combination of historical prestige, natural beauty, and modern luxury amenities creates a unique value proposition that supports its position among Long Island’s most expensive communities.
8. Old Westbury – 59.1% Home Price Increase Since 2010
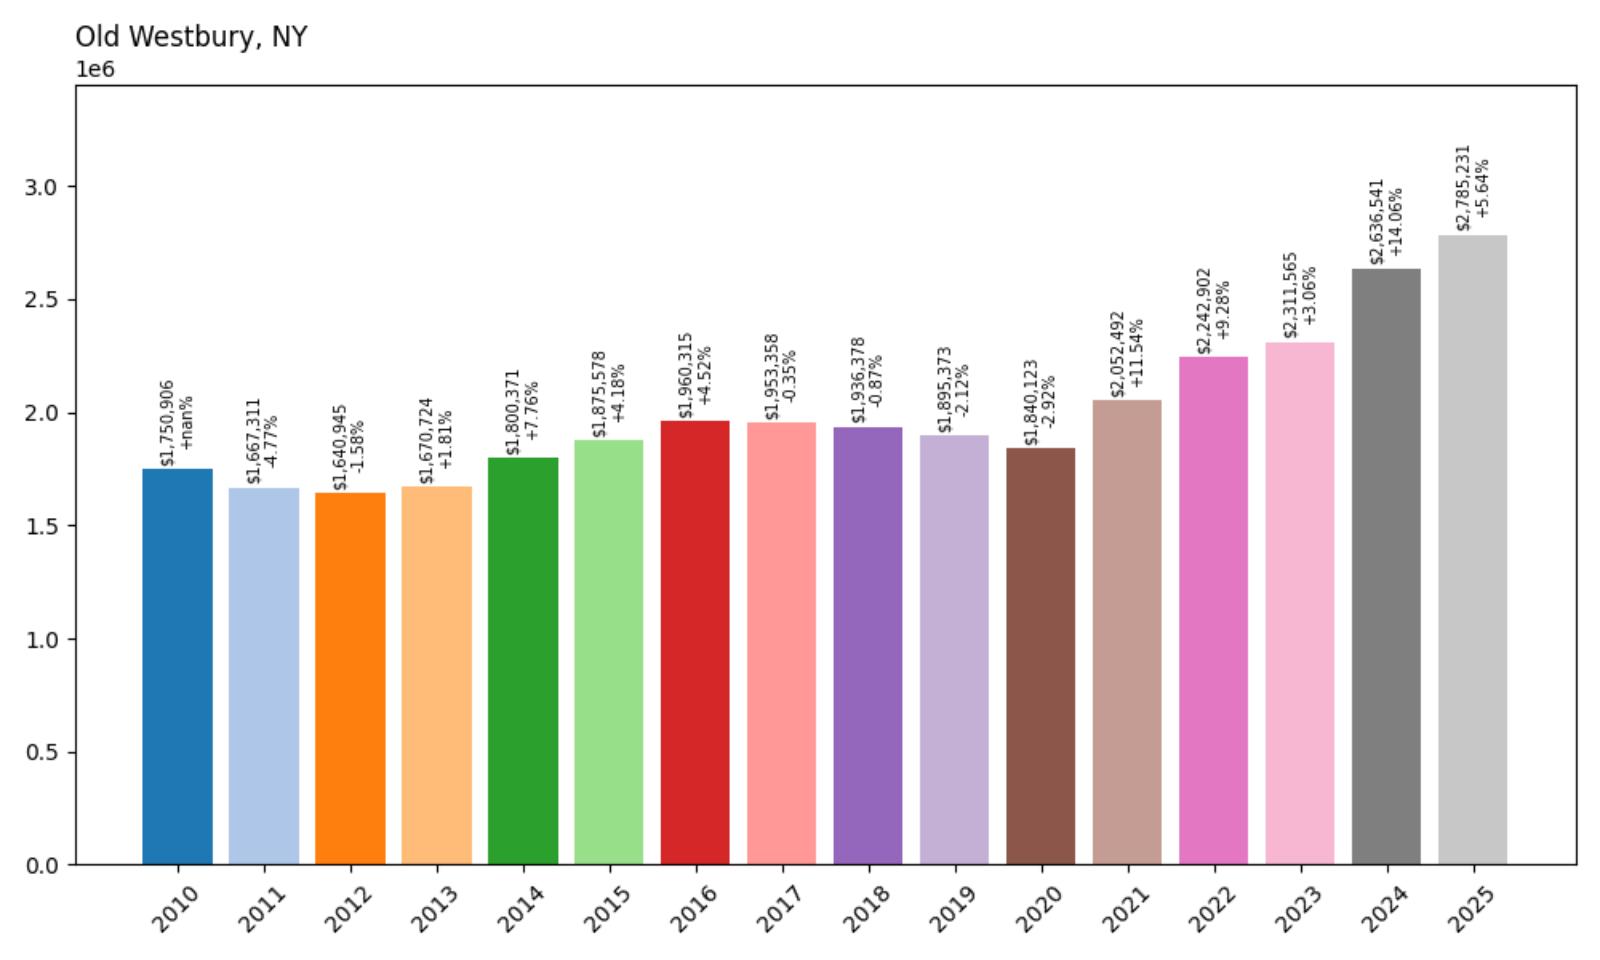
- 2010: $1,750,906
- 2011: $1,667,311 (−$83,595, −4.77% from previous year)
- 2012: $1,640,945 (−$26,366, −1.58% from previous year)
- 2013: $1,670,724 (+$29,779, +1.81% from previous year)
- 2014: $1,800,371 (+$129,647, +7.76% from previous year)
- 2015: $1,875,578 (+$75,206, +4.18% from previous year)
- 2016: $1,960,315 (+$84,737, +4.52% from previous year)
- 2017: $1,953,358 (−$6,957, −0.35% from previous year)
- 2018: $1,936,378 (−$16,980, −0.87% from previous year)
- 2019: $1,895,373 (−$41,004, −2.12% from previous year)
- 2020: $1,840,123 (−$55,251, −2.92% from previous year)
- 2021: $2,052,492 (+$212,370, +11.54% from previous year)
- 2022: $2,242,902 (+$190,410, +9.28% from previous year)
- 2023: $2,311,565 (+$68,662, +3.06% from previous year)
- 2024: $2,636,541 (+$324,976, +14.06% from previous year)
- 2025: $2,785,231 (+$148,690, +5.64% from previous year)
Old Westbury demonstrates strong long-term appreciation with a 59.1% increase since 2010, growing from around $1.75 million to nearly $2.8 million today. The community showed resilience through market downturns and experienced significant acceleration during recent years. The data reveals exceptional performance in 2024 with a remarkable 14.06% increase, followed by continued strong growth, indicating sustained demand for this legendary Gold Coast destination.
Old Westbury – Legendary Estate Living

Old Westbury stands as one of the most prestigious and historically significant communities on Long Island’s Gold Coast, home to some of the region’s most magnificent estates and storied families. The community features expansive properties, world-class equestrian facilities, and the famous Old Westbury Gardens, creating an atmosphere of unparalleled elegance and sophistication. Old Westbury’s legacy as a retreat for America’s wealthiest families continues to influence its character and appeal today.
The 59.1% appreciation since 2010, culminating in current prices approaching $2.8 million, reflects Old Westbury’s enduring position at the apex of Long Island luxury real estate. The exceptional recent performance, including a 14.06% surge in 2024, demonstrates the community’s continued appeal among ultra-high-net-worth buyers seeking the ultimate in estate living. Old Westbury’s combination of historical prestige, natural beauty, and modern amenities ensures its status as one of America’s most exclusive residential destinations.
7. Quogue – 76.1% Home Price Increase Since 2010
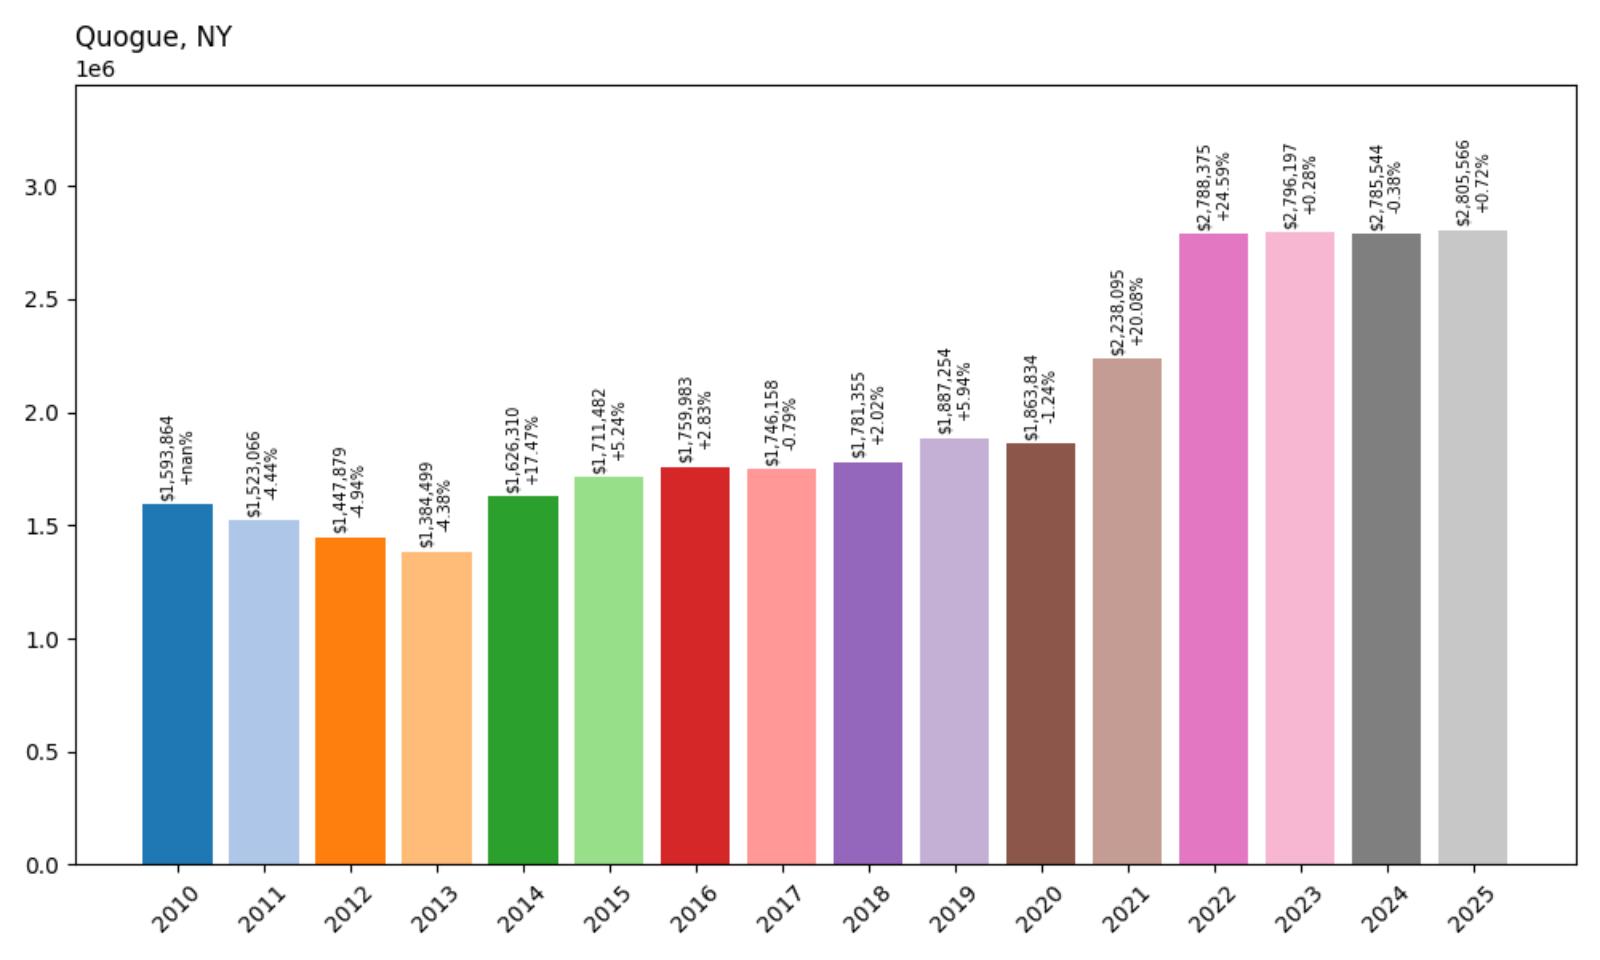
- 2010: $1,593,864
- 2011: $1,523,066 (−$70,798, −4.44% from previous year)
- 2012: $1,447,879 (−$75,187, −4.94% from previous year)
- 2013: $1,384,499 (−$63,380, −4.38% from previous year)
- 2014: $1,626,310 (+$241,811, +17.47% from previous year)
- 2015: $1,711,482 (+$85,172, +5.24% from previous year)
- 2016: $1,759,983 (+$48,501, +2.83% from previous year)
- 2017: $1,746,158 (−$13,825, −0.79% from previous year)
- 2018: $1,781,355 (+$35,196, +2.02% from previous year)
- 2019: $1,887,254 (+$105,899, +5.94% from previous year)
- 2020: $1,863,834 (−$23,420, −1.24% from previous year)
- 2021: $2,238,095 (+$374,260, +20.08% from previous year)
- 2022: $2,788,375 (+$550,281, +24.59% from previous year)
- 2023: $2,796,197 (+$7,822, +0.28% from previous year)
- 2024:$2,785,544 (−$10,653, −0.38% from previous year)
- 2025: $2,805,566 (+$20,021, +0.72% from previous year)
Quogue shows impressive long-term growth with a 76.1% increase since 2010, transforming from around $1.59 million to over $2.8 million today. The community experienced dramatic acceleration during the pandemic years, with explosive increases of 20.08% and 24.59% in 2021-2022 respectively. Recent years show market stabilization around the $2.8 million level, suggesting prices have found a new equilibrium after the dramatic pandemic-era surge.
Quogue – Hamptons’ Exclusive Beach Village

Quogue represents one of the Hamptons’ most exclusive and tightly-knit communities, featuring pristine Atlantic Ocean beaches and a charming village atmosphere that appeals to discerning luxury buyers. The community’s location provides direct beach access while maintaining a more private and residential character compared to some of the more commercialized Hamptons destinations. Quogue’s strict building codes and community oversight preserve its intimate scale and exclusive appeal.
The 76.1% appreciation since 2010, culminating in current prices above $2.8 million, reflects Quogue’s evolution into one of the Hamptons’ premier destinations. The explosive growth during 2021-2022, when prices jumped from under $2 million to nearly $2.8 million, demonstrated the community’s exceptional appeal during unprecedented demand for exclusive coastal properties. Current pricing positions Quogue among the most expensive Hamptons communities, with its combination of beach access, privacy, and village charm justifying ultra-premium valuations.
6. Amagansett – 139.2% Home Price Increase Since 2010
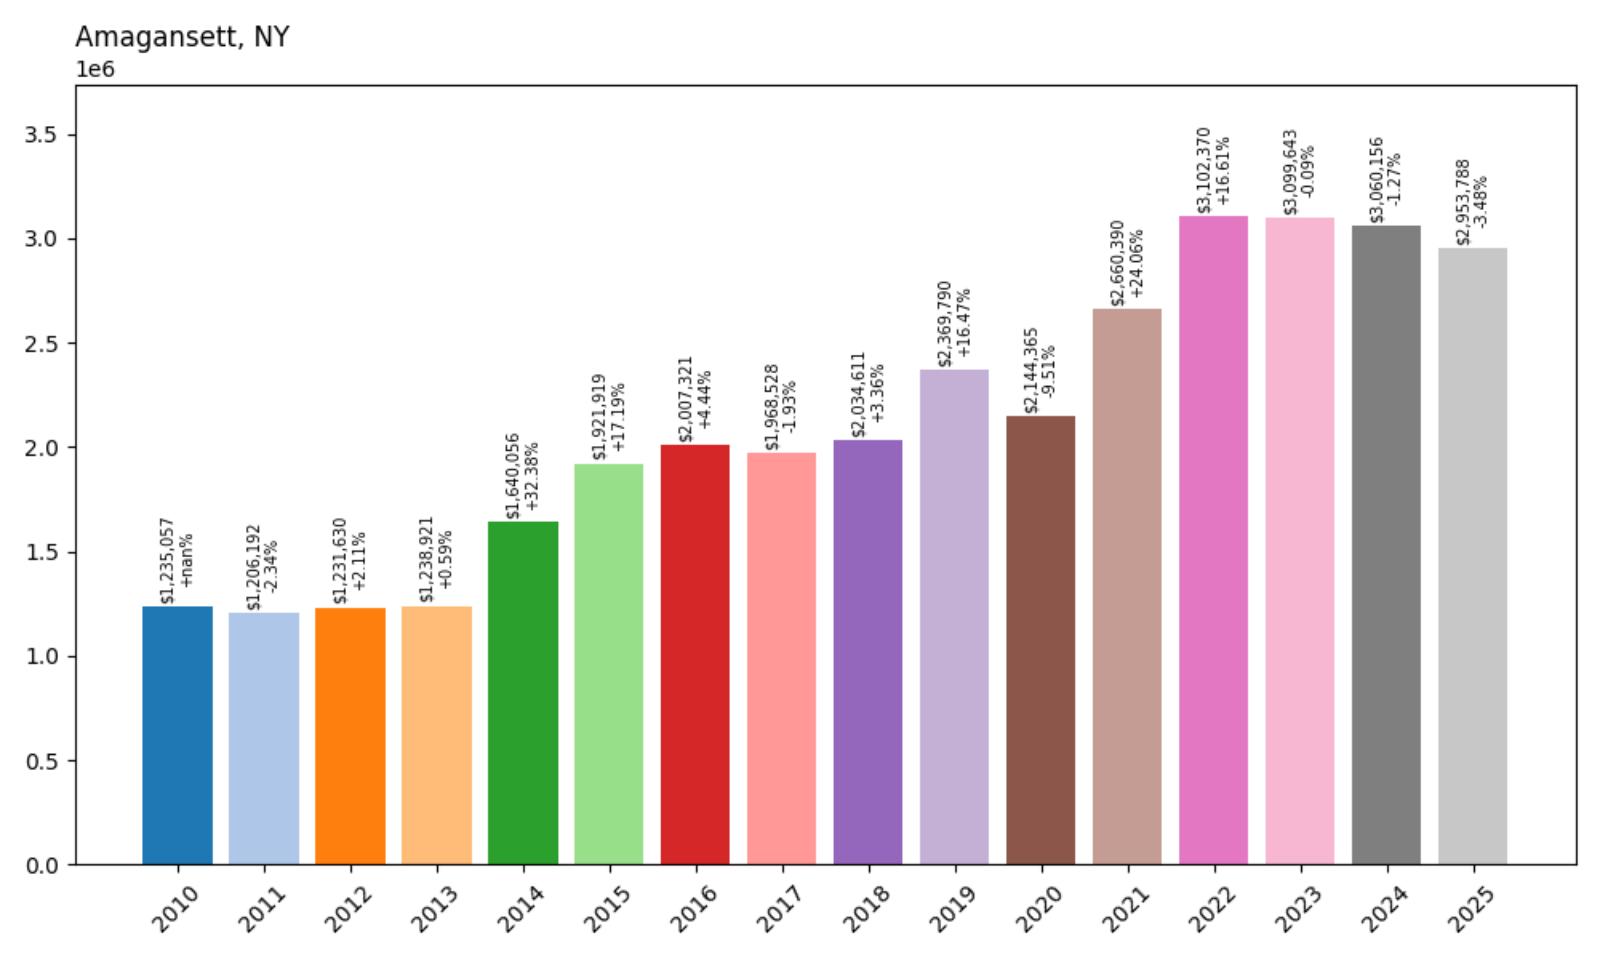
- 2010: $1,235,057
- 2011: $1,206,192 (−$28,865, −2.34% from previous year)
- 2012: $1,231,630 (+$25,438, +2.11% from previous year)
- 2013: $1,238,921 (+$7,291, +0.59% from previous year)
- 2014: $1,640,056 (+$401,134, +32.38% from previous year)
- 2015: $1,921,919 (+$281,863, +17.19% from previous year)
- 2016: $2,007,321 (+$85,402, +4.44% from previous year)
- 2017: $1,968,528 (−$38,792, −1.93% from previous year)
- 2018: $2,034,611 (+$66,083, +3.36% from previous year)
- 2019: $2,369,790 (+$335,179, +16.47% from previous year)
- 2020: $2,144,365 (−$225,425, −9.51% from previous year)
- 2021: $2,660,390 (+$516,024, +24.06% from previous year)
- 2022: $3,102,370 (+$441,980, +16.61% from previous year)
- 2023: $3,099,643 (−$2,727, −0.09% from previous year)
- 2024: $3,060,156 (−$39,488, −1.27% from previous year)
- 2025: $2,953,788 (−$106,367, −3.48% from previous year)
Amagansett demonstrates exceptional growth with a 139.2% increase since 2010, growing from around $1.24 million to nearly $3 million today despite recent corrections. The community experienced dramatic appreciation through the mid-2010s and pandemic years, reaching peaks above $3.1 million before recent market adjustments. Current prices around $2.95 million still represent substantial gains while suggesting market maturation after speculative peaks.
Amagansett – Hamptons’ Authentic Coastal Charm

Amagansett offers one of the most authentic and unspoiled Hamptons experiences, featuring pristine beaches, dunes, and a village atmosphere that has retained much of its original character. The community’s location at the eastern end of the Hamptons provides stunning ocean access and natural beauty while maintaining a more relaxed and less commercialized atmosphere than some neighboring destinations. Amagansett’s appeal lies in its genuine coastal heritage and commitment to preserving its natural environment.
The remarkable 139.2% appreciation since 2010 reflects Amagansett’s transformation from a relatively accessible beach community to one of the Hamptons’ most expensive destinations. The dramatic growth through the 2010s and pandemic years, reaching peaks above $3.1 million, demonstrated exceptional buyer demand for authentic coastal living. Recent price adjustments, bringing current medians to around $2.95 million, suggest market maturation while maintaining Amagansett’s position among New York’s most exclusive coastal communities.
5. Sands Point – 59.0% Home Price Increase Since 2010
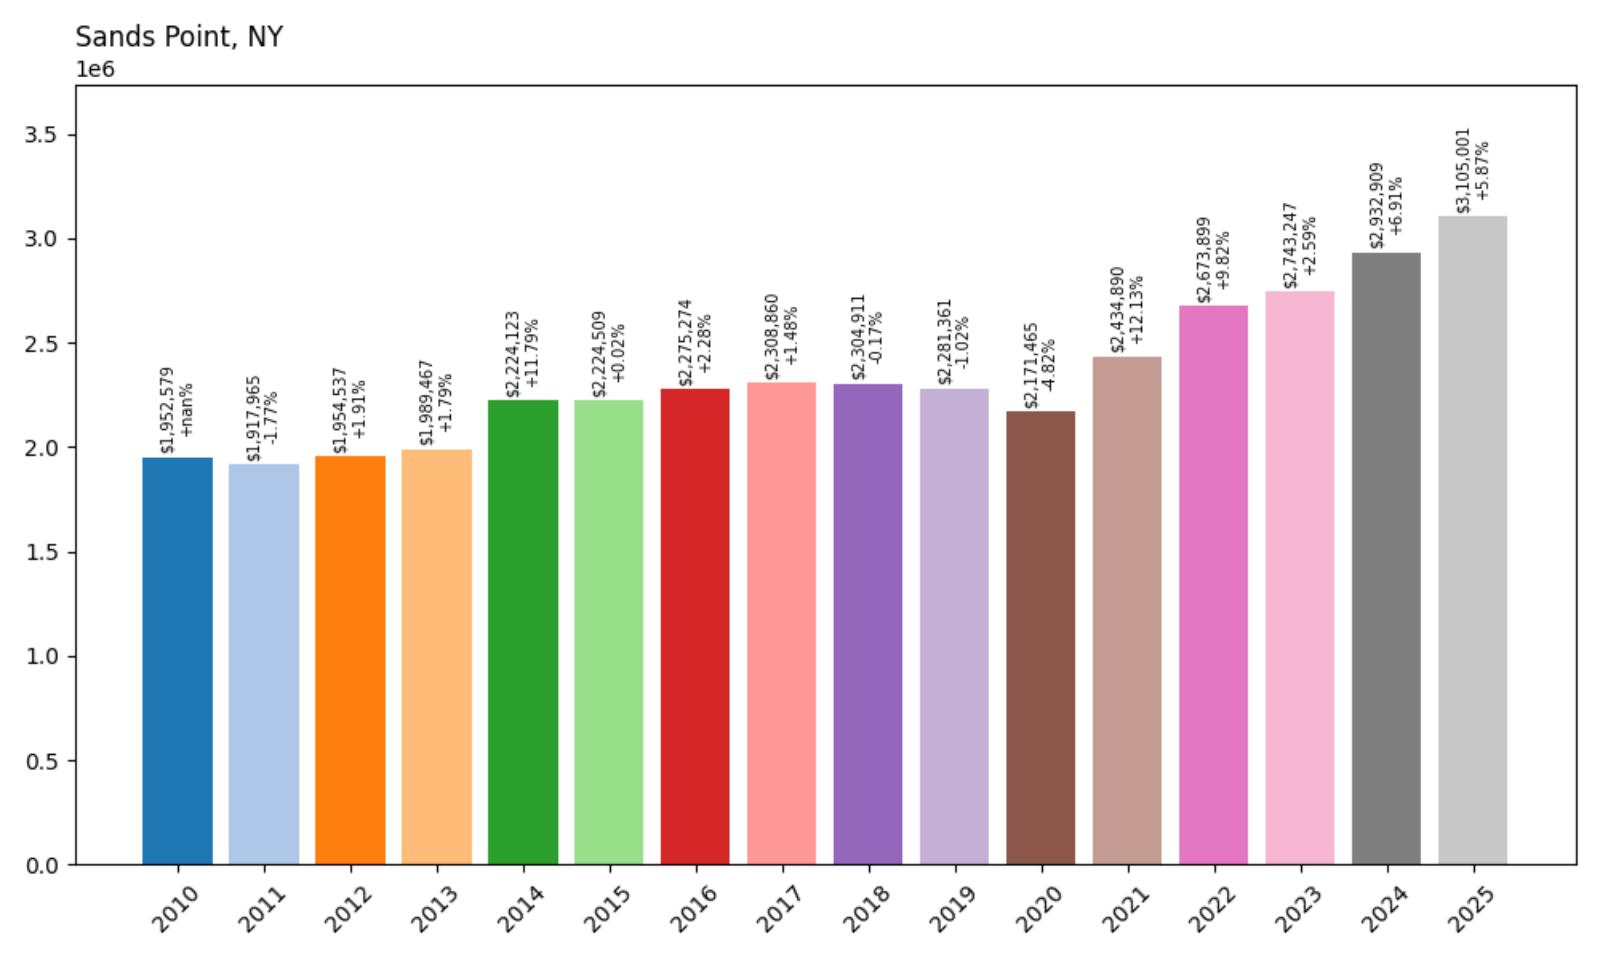
- 2010: $1,952,579
- 2011: $1,917,965 (−$34,613, −1.77% from previous year)
- 2012: $1,954,537 (+$36,572, +1.91% from previous year)
- 2013: $1,989,467 (+$34,930, +1.79% from previous year)
- 2014: $2,224,123 (+$234,656, +11.79% from previous year)
- 2015: $2,224,509 (+$387, +0.02% from previous year)
- 2016: $2,275,274 (+$50,765, +2.28% from previous year)
- 2017: $2,308,860 (+$33,585, +1.48% from previous year)
- 2018: $2,304,911 (−$3,948, −0.17% from previous year)
- 2019: $2,281,361 (−$23,550, −1.02% from previous year)
- 2020: $2,171,465 (−$109,896, −4.82% from previous year)
- 2021: $2,434,890 (+$263,424, +12.13% from previous year)
- 2022: $2,673,899 (+$239,009, +9.82% from previous year)
- 2023: $2,743,247 (+$69,348, +2.59% from previous year)
- 2024: $2,932,909 (+$189,662, +6.91% from previous year)
- 2025: $3,105,001 (+$172,092, +5.87% from previous year)
Sands Point shows solid long-term appreciation with a 59.0% increase since 2010, growing from around $1.95 million to over $3.1 million today. The community demonstrated remarkable stability through most periods, starting from an already-premium base above $1.9 million in 2010. Recent performance has been particularly strong, with consecutive substantial increases bringing current prices above $3 million, indicating sustained demand for this prestigious North Shore location.
Sands Point – Gold Coast’s Waterfront Crown Jewel

Sands Point represents the pinnacle of Gold Coast luxury living, featuring some of Long Island’s most spectacular waterfront estates with panoramic views of Long Island Sound. The community’s peninsula location provides water access on multiple sides while maintaining the privacy and exclusivity that has attracted prominent families for generations. Sands Point’s combination of natural beauty, architectural grandeur, and historical significance creates an unmatched residential environment.
The 59.0% appreciation since 2010, culminating in current prices above $3.1 million, reflects Sands Point’s enduring position among New York’s most elite residential destinations. The recent acceleration, with strong gains in 2024-2025, demonstrates continued appeal among ultra-high-net-worth individuals seeking the ultimate in waterfront estate living. Sands Point’s unique combination of location, prestige, and natural beauty ensures its status as one of America’s most exclusive waterfront communities.
4. Wainscott – 81.4% Home Price Increase Since 2010
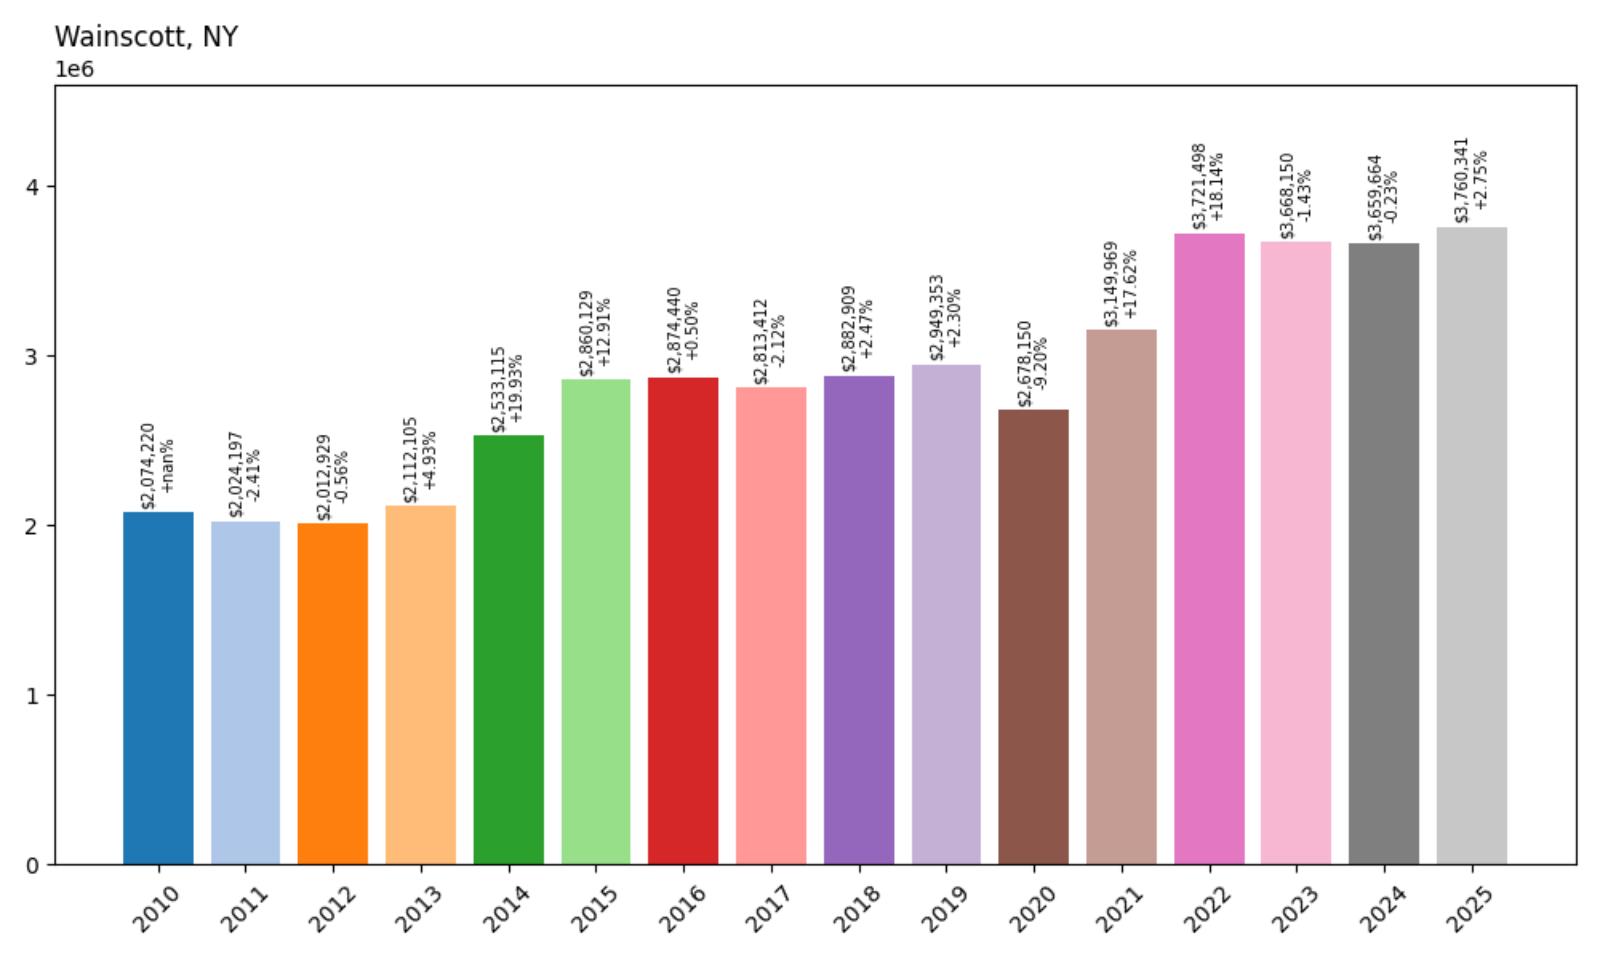
- 2010: $2,074,220
- 2011: $2,024,197 (−$50,023, −2.41% from previous year)
- 2012: $2,012,929 (−$11,268, −0.56% from previous year)
- 2013: $2,112,105 (+$99,176, +4.93% from previous year)
- 2014: $2,533,115 (+$421,010, +19.93% from previous year)
- 2015: $2,860,129 (+$327,014, +12.91% from previous year)
- 2016: $2,874,440 (+$14,311, +0.50% from previous year)
- 2017: $2,813,412 (−$61,028, −2.12% from previous year)
- 2018: $2,882,909 (+$69,497, +2.47% from previous year)
- 2019: $2,949,353 (+$66,443, +2.30% from previous year)
- 2020: $2,678,150 (−$271,203, −9.20% from previous year)
- 2021: $3,149,969 (+$471,819, +17.62% from previous year)
- 2022: $3,721,498 (+$571,529, +18.14% from previous year)
- 2023: $3,668,150 (−$53,348, −1.43% from previous year)
- 2024: $3,659,664 (−$8,486, −0.23% from previous year)
- 2025: $3,760,341 (+$100,677, +2.75% from previous year)
Wainscott demonstrates substantial growth with an 81.4% increase since 2010, growing from around $2.07 million to over $3.76 million today. The community started from an already-premium base and experienced dramatic acceleration during the mid-2010s and pandemic years, reaching peaks above $3.7 million. Recent years show market stabilization with modest adjustments, suggesting prices have found equilibrium at these ultra-premium levels.
Wainscott – Hamptons’ Elite Enclave

Wainscott occupies a unique position in the Hamptons hierarchy, offering exclusive access to some of the region’s most pristine beaches and maintaining a distinctly residential character that appeals to ultra-high-net-worth buyers. The community’s location between East Hampton and Southampton provides convenient access to Hamptons amenities while preserving privacy and exclusivity. Wainscott’s commitment to environmental preservation and restricted development maintains its appeal as one of the most exclusive Hamptons destinations.
The 81.4% appreciation since 2010, reaching current levels above $3.76 million, reflects Wainscott’s position among the Hamptons’ most elite communities. The dramatic growth during the 2010s and pandemic years, when prices nearly doubled from their starting point, demonstrated exceptional demand for this exclusive coastal environment. Current pricing positions Wainscott among New York’s most expensive residential markets, with its combination of beach access, privacy, and Hamptons prestige justifying ultra-premium valuations.
3. Bridgehampton – 126.4% Home Price Increase Since 2010
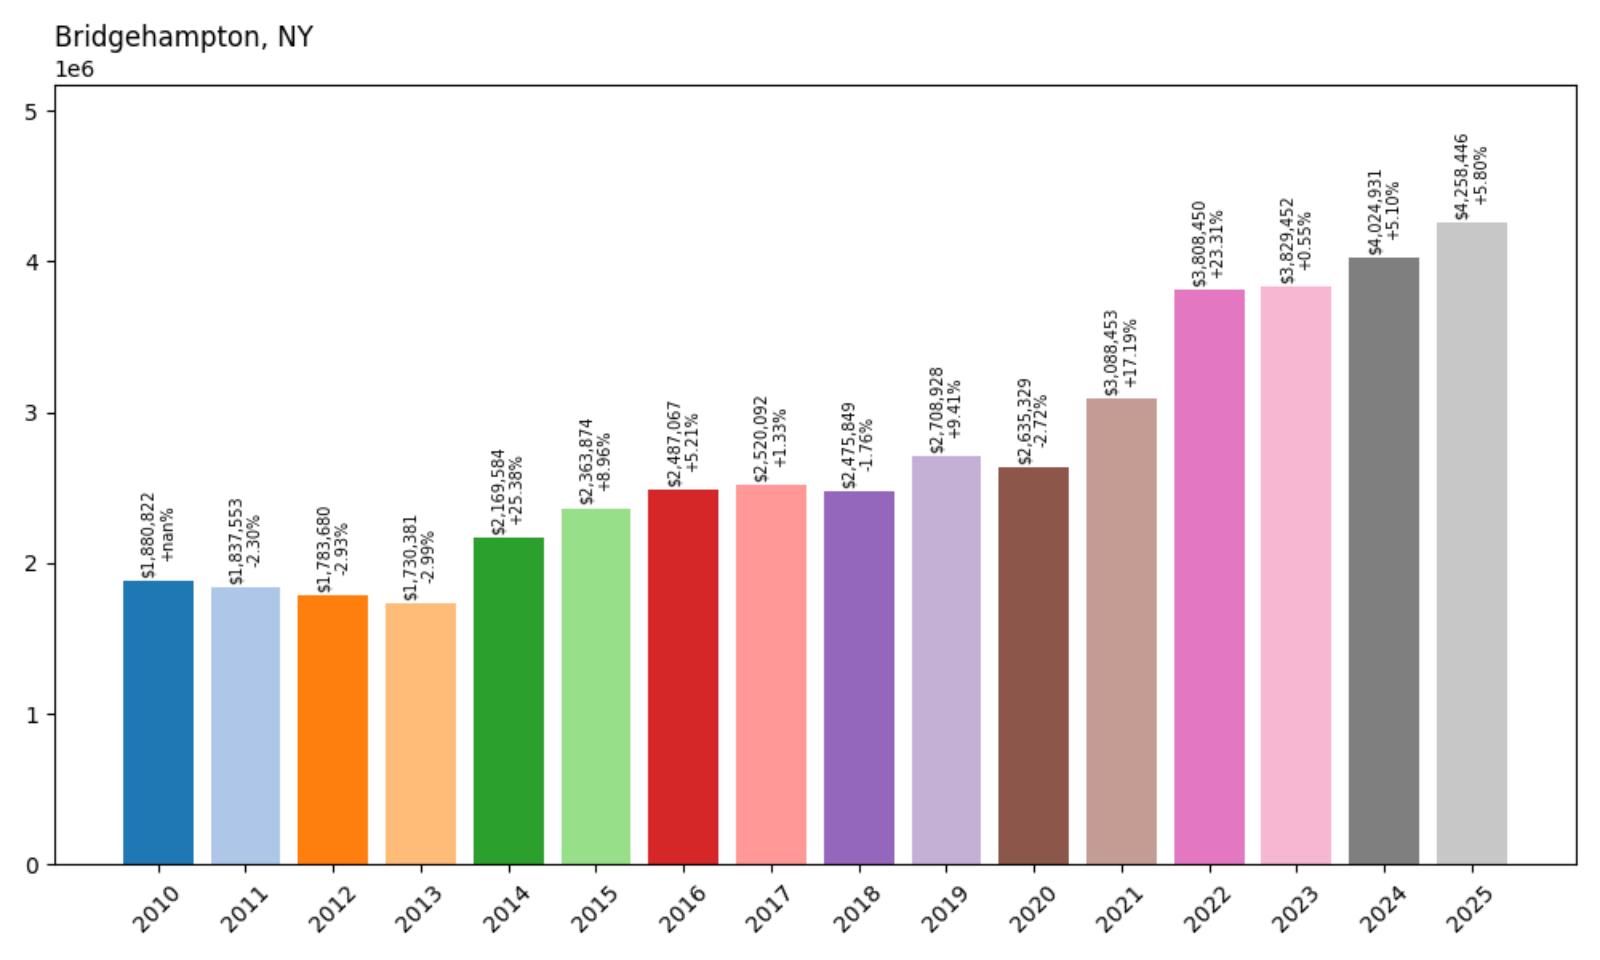
- 2010: $1,880,822
- 2011: $1,837,553 (−$43,269, −2.30% from previous year)
- 2012: $1,783,680 (−$53,873, −2.93% from previous year)
- 2013: $1,730,381 (−$53,299, −2.99% from previous year)
- 2014: $2,169,584 (+$439,204, +25.38% from previous year)
- 2015: $2,363,874 (+$194,289, +8.96% from previous year)
- 2016: $2,487,067 (+$123,193, +5.21% from previous year)
- 2017: $2,520,092 (+$33,025, +1.33% from previous year)
- 2018: $2,475,849 (−$44,244, −1.76% from previous year)
- 2019: $2,708,928 (+$233,079, +9.41% from previous year)
- 2020: $2,635,329 (−$73,599, −2.72% from previous year)
- 2021: $3,088,453 (+$453,124, +17.19% from previous year)
- 2022: $3,808,450 (+$719,998, +23.31% from previous year)
- 2023: $3,829,452 (+$21,001, +0.55% from previous year)
- 2024: $4,024,931 (+$195,479, +5.10% from previous year)
- 2025: $4,258,446 (+$233,515, +5.80% from previous year)
Bridgehampton showcases exceptional growth with a 126.4% increase since 2010, more than doubling from around $1.88 million to over $4.25 million today. The community recovered from early-decade lows to achieve dramatic acceleration during the 2010s and pandemic years. Recent performance continues showing strong appreciation, with current prices above $4.2 million representing one of the highest median values in New York State.
Bridgehampton – Hamptons’ Social and Cultural Center

Bridgehampton serves as the social and cultural heart of the Hamptons, hosting prestigious events, world-class polo matches, and serving as a gathering place for the region’s most influential residents. The community’s central location provides easy access to all Hamptons destinations while maintaining its own distinct character and attractions. Bridgehampton’s combination of social prominence, recreational facilities, and luxury amenities creates an environment that appeals to the most discerning luxury buyers.
The remarkable 126.4% appreciation since 2010 reflects Bridgehampton’s evolution into one of America’s most expensive residential markets. The dramatic growth, particularly during the pandemic years when prices jumped from around $2.6 million to over $3.8 million, demonstrated exceptional demand for this prestigious location. Current pricing above $4.25 million positions Bridgehampton among the nation’s most exclusive communities, with its unique combination of social prestige, cultural amenities, and Hamptons lifestyle commanding ultra-premium valuations.
2. Water Mill – 115.9% Home Price Increase Since 2010
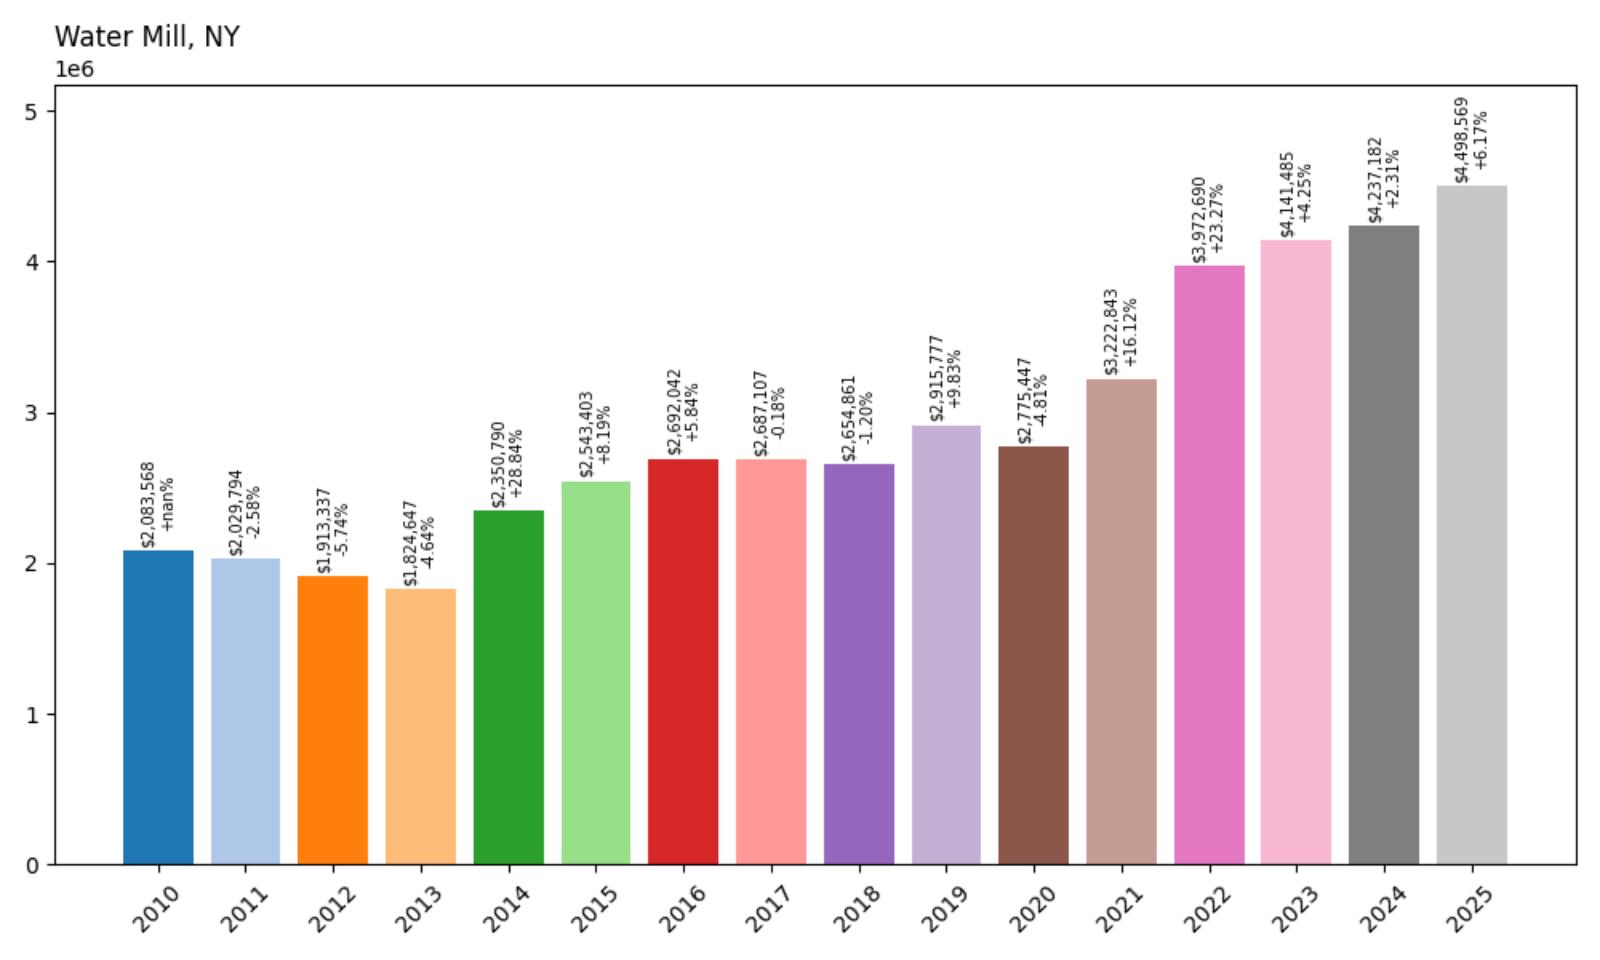
- 2010: $2,083,568
- 2011: $2,029,794 (−$53,774, −2.58% from previous year)
- 2012: $1,913,337 (−$116,457, −5.74% from previous year)
- 2013: $1,824,647 (−$88,690, −4.64% from previous year)
- 2014: $2,350,790 (+$526,143, +28.84% from previous year)
- 2015: $2,543,403 (+$192,613, +8.19% from previous year)
- 2016: $2,692,042 (+$148,639, +5.84% from previous year)
- 2017: $2,687,107 (−$4,935, −0.18% from previous year)
- 2018: $2,654,861 (−$32,246, −1.20% from previous year)
- 2019: $2,915,777 (+$260,916, +9.83% from previous year)
- 2020: $2,775,447 (−$140,330, −4.81% from previous year)
- 2021: $3,222,843 (+$447,396, +16.12% from previous year)
- 2022: $3,972,690 (+$749,847, +23.27% from previous year)
- 2023: $4,141,485 (+$168,795, +4.25% from previous year)
- 2024: $4,237,182 (+$95,698, +2.31% from previous year)
- 2025: $4,498,569 (+$261,387, +6.17% from previous year)
Water Mill demonstrates impressive growth with a 115.9% increase since 2010, more than doubling from around $2.08 million to nearly $4.5 million today. The community recovered from early-decade declines to achieve extraordinary acceleration during the 2010s and pandemic years. Recent performance continues showing strong momentum, with current prices approaching $4.5 million, making it the second-most expensive community in New York State.
Water Mill – Hamptons’ Pastoral Luxury

Water Mill offers a unique Hamptons experience that combines pastoral beauty with sophisticated luxury living, featuring rolling farmland, historic windmills, and some of the region’s most spectacular estates. The community’s inland location provides a different perspective on Hamptons living while maintaining easy access to ocean beaches and village amenities. Water Mill’s agricultural heritage and commitment to land preservation create an environment that appeals to buyers seeking authentic countryside elegance.
The remarkable 115.9% appreciation since 2010, culminating in current prices approaching $4.5 million, reflects Water Mill’s position among America’s most exclusive residential destinations. The explosive growth during the pandemic years, when prices jumped from around $2.8 million to nearly $4 million, demonstrated exceptional demand for this unique Hamptons environment. Current pricing positions Water Mill as New York’s second-most expensive community, with its combination of pastoral beauty, Hamptons prestige, and estate-scale properties justifying ultra-premium valuations.
1. Sagaponack – 141.6% Home Price Increase Since 2010
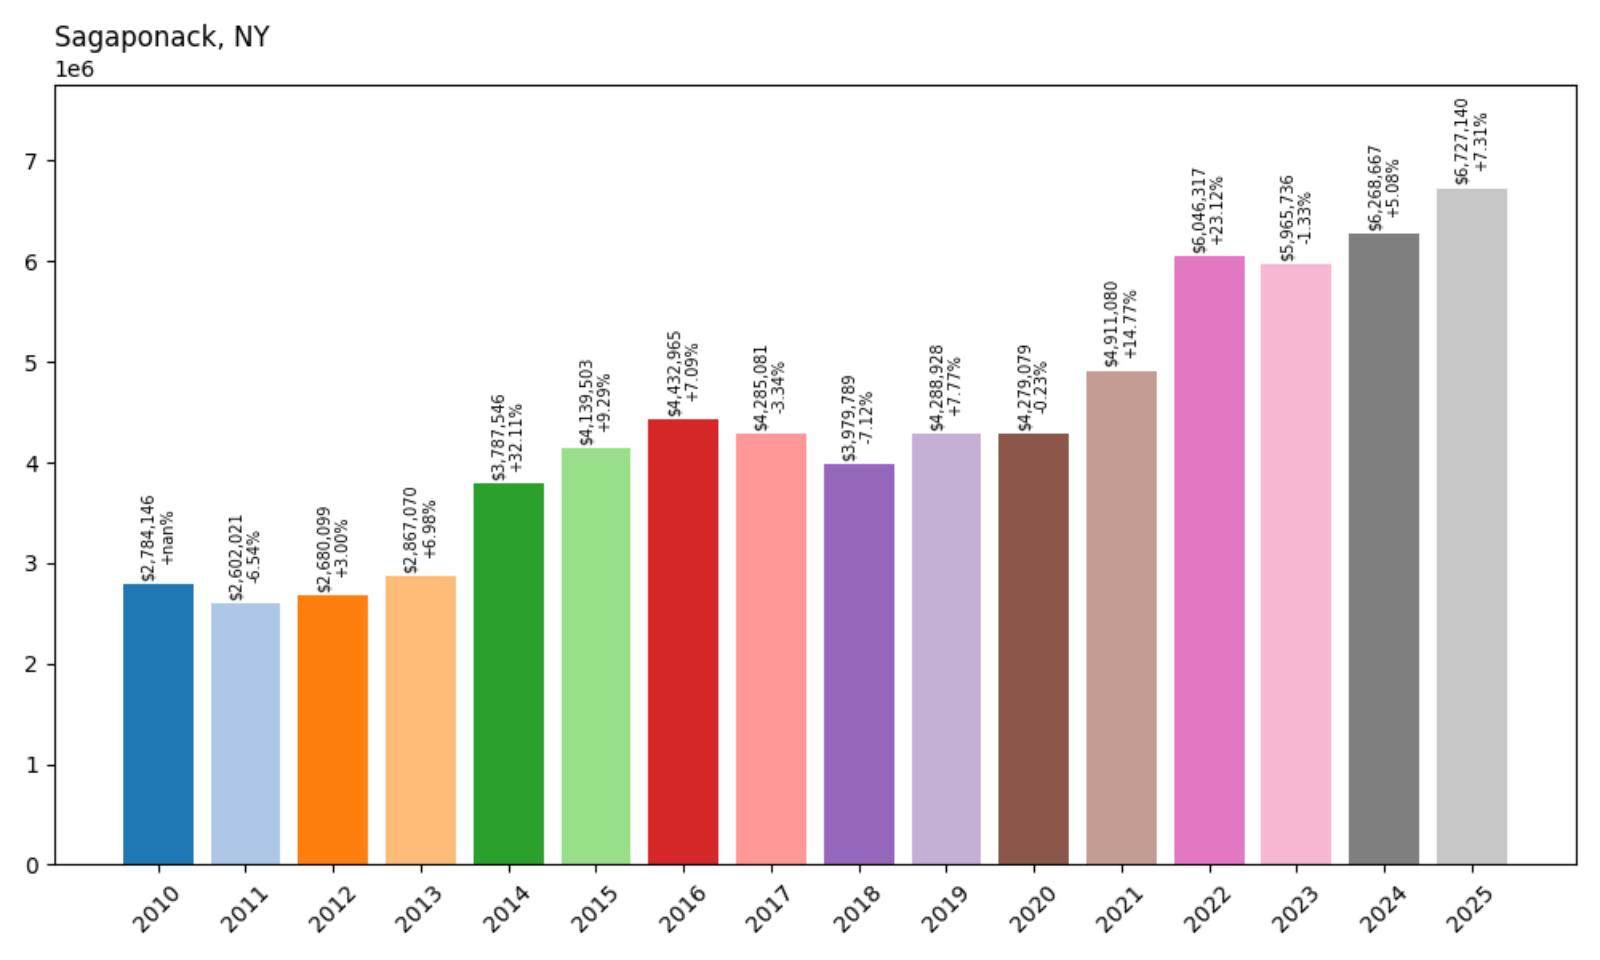
- 2010: $2,784,146
- 2011: $2,602,021 (−$182,126, −6.54% from previous year)
- 2012: $2,680,099 (+$78,079, +3.00% from previous year)
- 2013: $2,867,070 (+$186,971, +6.98% from previous year)
- 2014: $3,787,546 (+$920,476, +32.11% from previous year)
- 2015: $4,139,503 (+$351,957, +9.29% from previous year)
- 2016: $4,432,965 (+$293,462, +7.09% from previous year)
- 2017: $4,285,081 (−$147,884, −3.34% from previous year)
- 2018: $3,979,789 (−$305,292, −7.12% from previous year)
- 2019: $4,288,928 (+$309,139, +7.77% from previous year)
- 2020: $4,279,079 (−$9,849, −0.23% from previous year)
- 2021: $4,911,080 (+$632,001, +14.77% from previous year)
- 2022: $6,046,317 (+$1,135,237, +23.12% from previous year)
- 2023: $5,965,736 (−$80,581, −1.33% from previous year)
- 2024: $6,268,667 (+$302,931, +5.08% from previous year)
- 2025: $6,727,140 (+$458,473, +7.31% from previous year)
Sagaponack claims the top position with an extraordinary 141.6% increase since 2010, growing from around $2.78 million to over $6.7 million today. The community has consistently maintained the highest median home prices in New York State, with particularly dramatic growth during 2014 and the pandemic years. Current prices above $6.7 million represent the pinnacle of American luxury real estate, with recent growth continuing despite already astronomical valuations.
Sagaponack – America’s Most Expensive Zip Code

Sagaponack holds the distinction of being America’s most expensive residential community, featuring oceanfront estates, pristine Atlantic beaches, and an ultra-exclusive atmosphere that attracts the world’s wealthiest individuals. The community’s location in the heart of the Hamptons provides direct ocean access while maintaining the privacy and exclusivity that commands record-breaking real estate prices. Sagaponack’s limited housing stock and geographic constraints create inherent scarcity that supports its position at the apex of luxury real estate.
The exceptional 141.6% appreciation since 2010, reaching current levels above $6.7 million, reflects Sagaponack’s unmatched position in the global luxury market. The dramatic growth, including a historic 32.11% increase in 2014 and explosive pandemic-era gains, demonstrates the community’s appeal among ultra-high-net-worth individuals worldwide. Current median prices exceeding $6.7 million establish Sagaponack not just as New York’s most expensive community, but as one of the most exclusive residential destinations in the world, where prestige, privacy, and oceanfront perfection command the ultimate premium in American real estate.


