🔥 Would you like to save this?
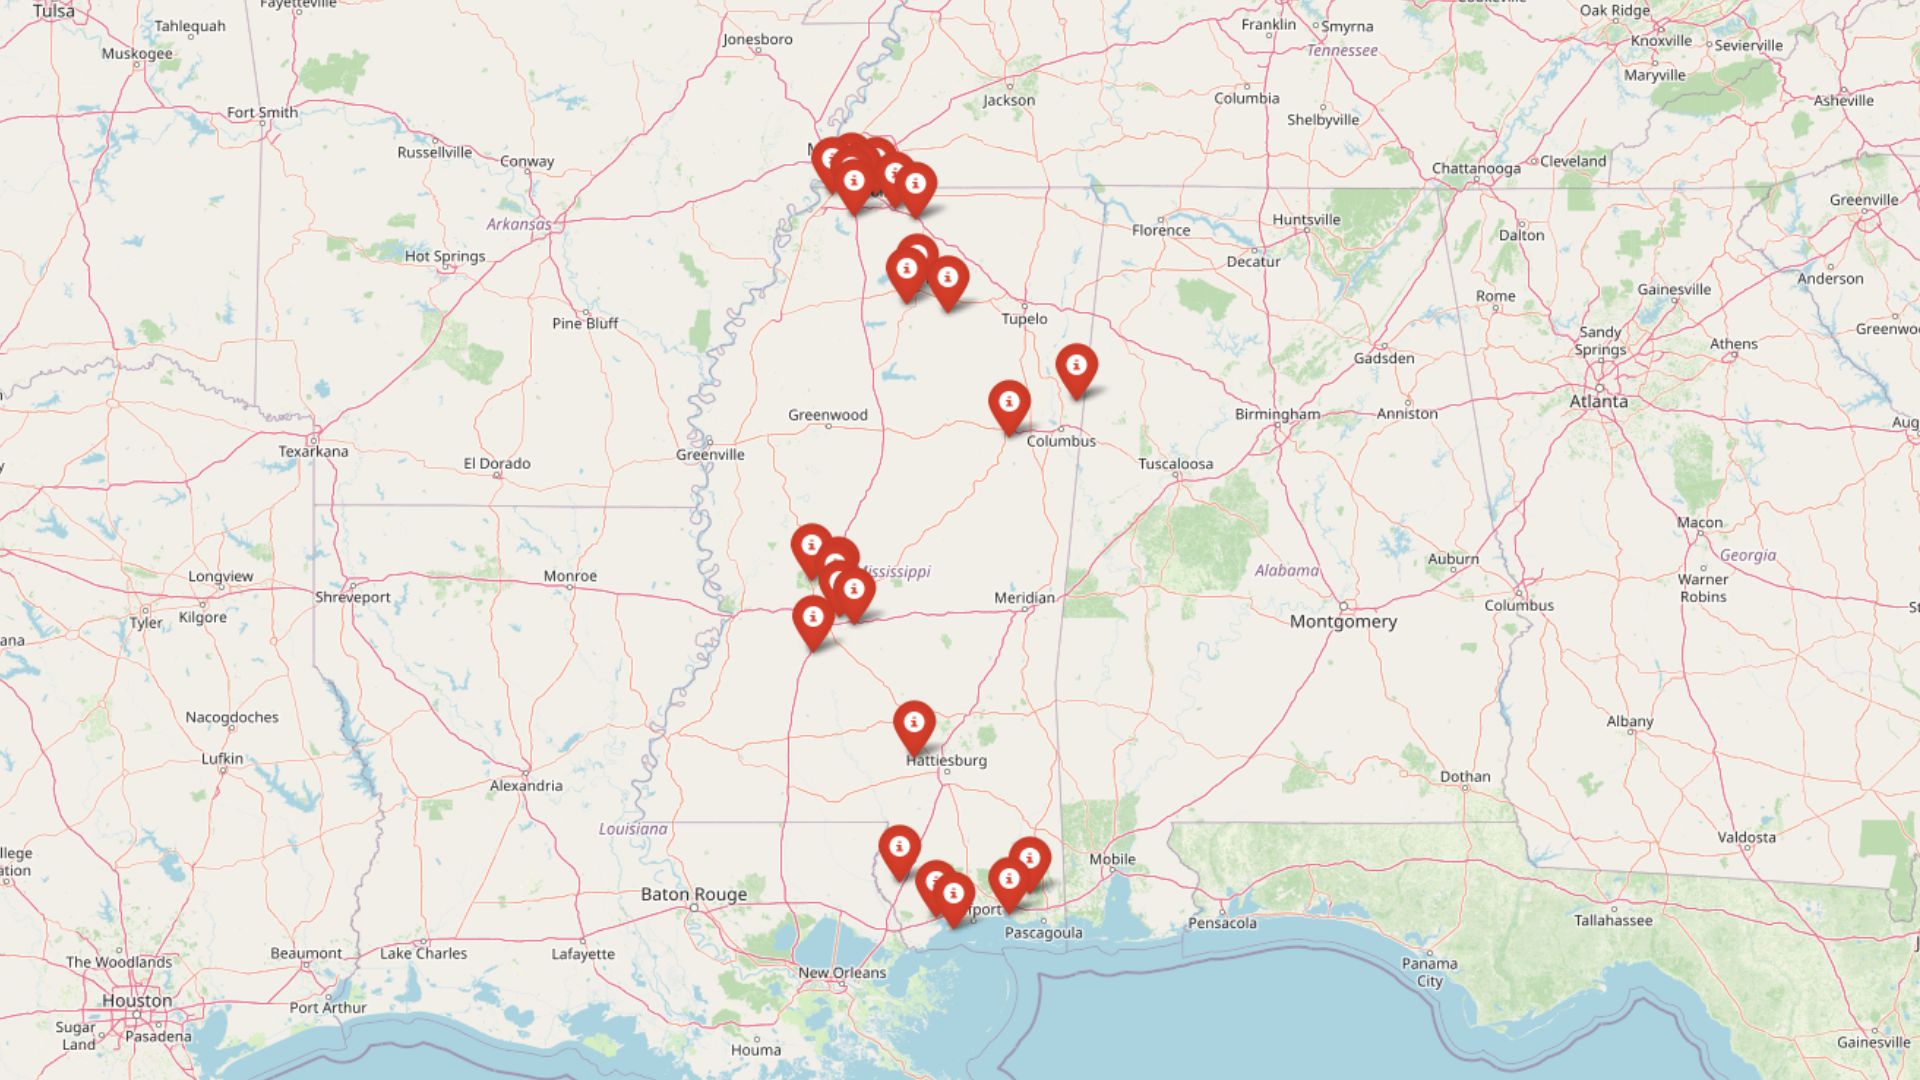
Mississippi’s housing market tells a fascinating story of transformation and growth across the Magnolia State. According to data from the Zillow Home Value Index, several communities have experienced remarkable price appreciation over the past decade and a half, with some towns seeing their median home values more than double since 2010. From the college town atmosphere of Oxford to the suburban appeal of Madison, these 25 communities represent the premium end of Mississippi’s real estate market.
These price trends reflect broader economic shifts across Mississippi, from post-recession recovery to the recent pandemic-era housing boom that peaked in 2021-2022. Understanding which communities command the highest home values provides insight into where residents are choosing to invest in their futures, whether drawn by employment opportunities, educational excellence, or quality of life factors that make these towns stand out in the state’s housing landscape.
In order to come up with the very specific design ideas, we create most designs with the assistance of state-of-the-art AI interior design software.
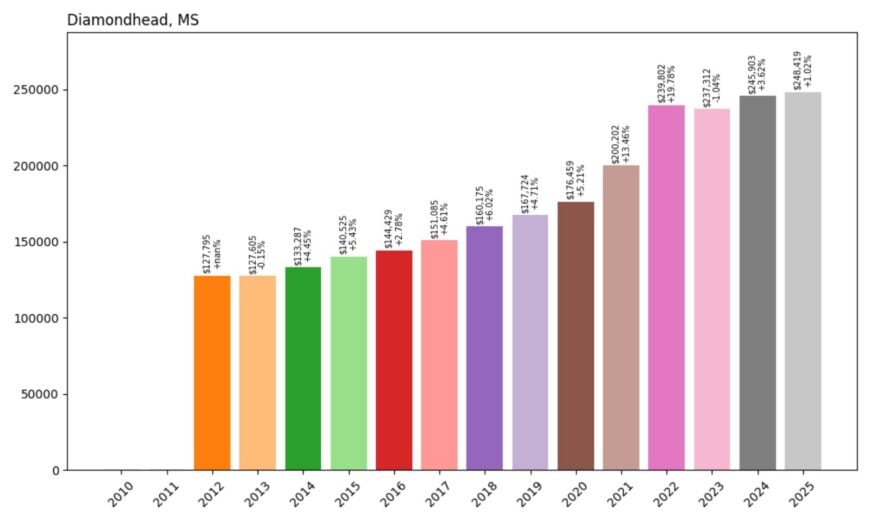
25. Diamondhead – 94% Home Price Increase Since 2012
- 2010: N/A
- 2011: N/A
- 2012: $127,795
- 2013: $127,605 (−$190, −0.15% from previous year)
- 2014: $133,287 (+$5,682, +4.45% from previous year)
- 2015: $140,525 (+$7,238, +5.43% from previous year)
- 2016: $144,429 (+$3,904, +2.78% from previous year)
- 2017: $151,085 (+$6,655, +4.61% from previous year)
- 2018: $160,175 (+$9,090, +6.02% from previous year)
- 2019: $167,724 (+$7,549, +4.71% from previous year)
- 2020: $176,459 (+$8,735, +5.21% from previous year)
- 2021: $200,202 (+$23,743, +13.46% from previous year)
- 2022: $239,802 (+$39,600, +19.78% from previous year)
- 2023: $237,312 (−$2,491, −1.04% from previous year)
- 2024: $245,903 (+$8,591, +3.62% from previous year)
- 2025: $248,419 (+$2,516, +1.02% from previous year)
Diamondhead shows steady appreciation from its 2012 baseline of $127,795 to today’s $248,419, representing consistent growth through most market cycles. The community experienced its most dramatic surge during 2021-2022, when values jumped nearly 20% in a single year before moderating. This growth pattern mirrors many coastal Mississippi communities that benefited from increased demand for waterfront and near-waterfront properties during the pandemic housing boom.
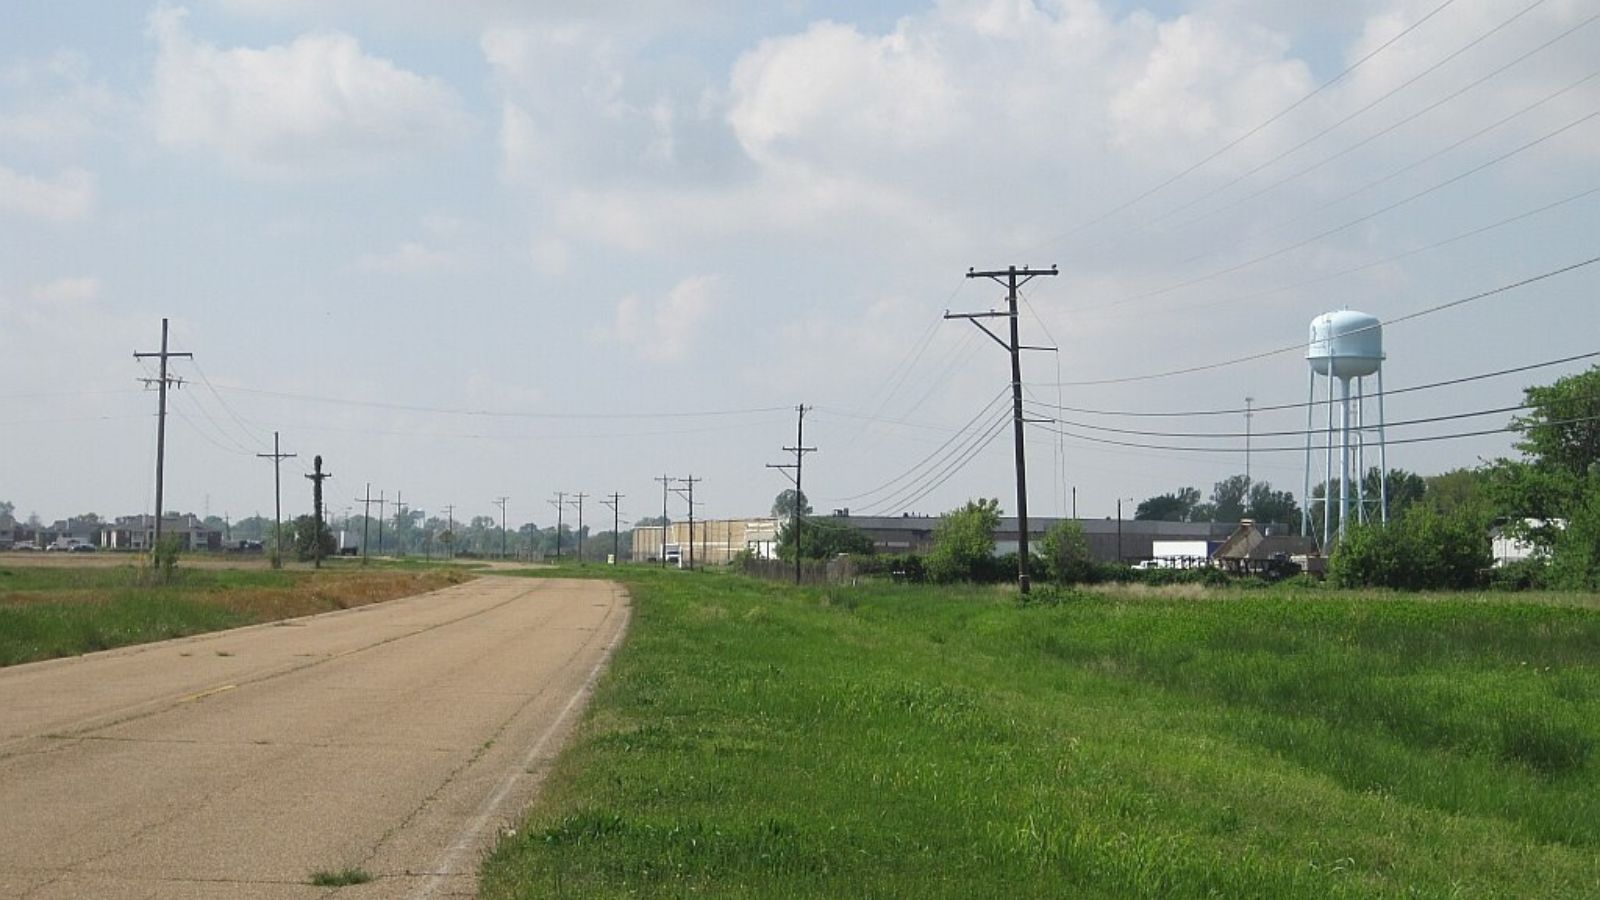
Diamondhead – Golf Community Appeal Drives Consistent Growth

Located in Hancock County along Mississippi’s scenic Gulf Coast, Diamondhead stands out as a master-planned community built around championship golf courses and resort-style amenities. The town was originally developed as a retirement and vacation destination, featuring two 18-hole golf courses designed by Pete Dye and other renowned architects. This recreational infrastructure has helped maintain property values even during economic downturns, as the community attracts both retirees and families seeking an active lifestyle.
Recent growth has been driven by an influx of remote workers and retirees who discovered the community’s blend of affordability and amenities during the pandemic. The 2021-2022 price surge coincided with record-low inventory and increased buyer competition, particularly from out-of-state purchasers drawn to Mississippi’s lower cost of living and Diamondhead’s unique community features.
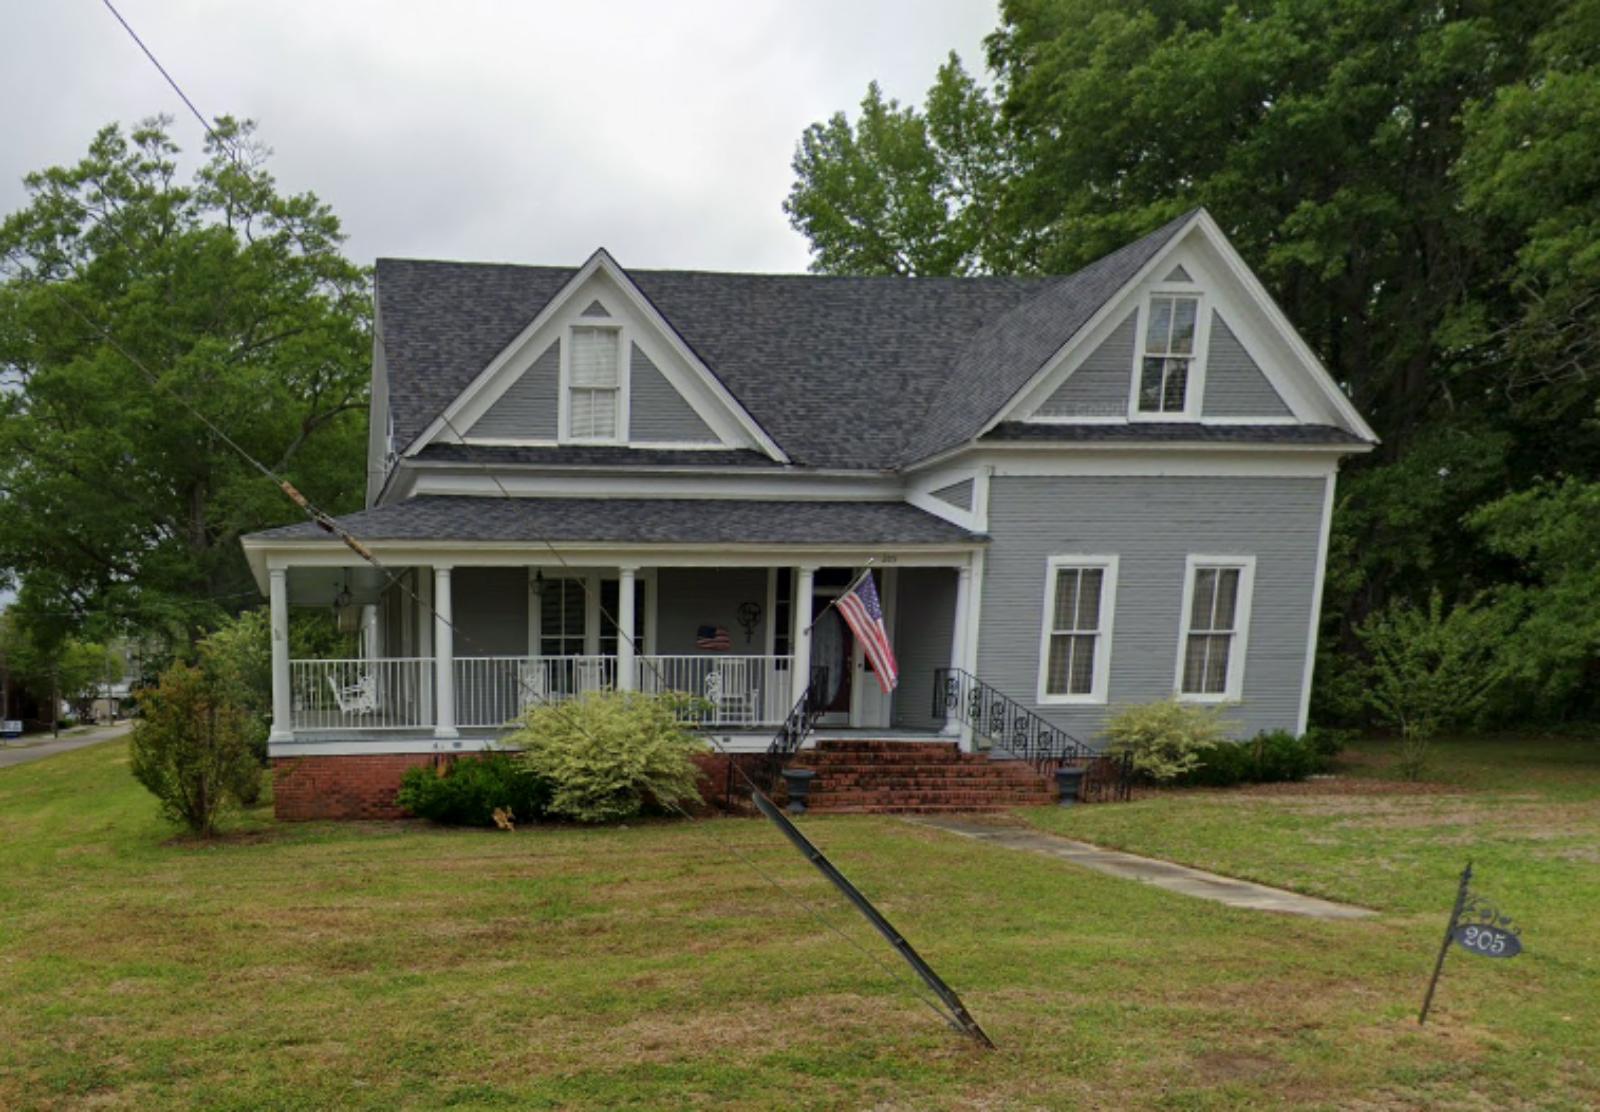
24. Terry – 65% Home Price Increase Since 2010

- 2010: $153,735
- 2011: $144,772 (−$8,963, −5.83% from previous year)
- 2012: $141,549 (−$3,223, −2.23% from previous year)
- 2013: $140,078 (−$1,471, −1.04% from previous year)
- 2014: $140,939 (+$861, +0.61% from previous year)
- 2015: $148,391 (+$7,453, +5.29% from previous year)
- 2016: $154,211 (+$5,819, +3.92% from previous year)
- 2017: $158,818 (+$4,608, +2.99% from previous year)
- 2018: $165,171 (+$6,352, +4.00% from previous year)
- 2019: $178,327 (+$13,156, +7.97% from previous year)
- 2020: $183,219 (+$4,891, +2.74% from previous year)
- 2021: $204,473 (+$21,254, +11.60% from previous year)
- 2022: $226,022 (+$21,550, +10.54% from previous year)
- 2023: $232,454 (+$6,432, +2.85% from previous year)
- 2024: $238,209 (+$5,755, +2.48% from previous year)
- 2025: $253,328 (+$15,119, +6.35% from previous year)
Terry demonstrates a classic post-recession recovery pattern, declining from 2010 through 2013 before beginning sustained growth that accelerated significantly after 2018. The community bottomed out at $140,078 in 2013 and has since climbed to $253,328, with particularly strong gains during 2019 and the pandemic-era boom years. The recent 6.35% jump in 2025 suggests continued momentum in this Jackson metro suburb.
Terry – Jackson Metro Proximity Fuels Suburban Growth

Situated in Hinds County just south of Jackson, Terry benefits from its strategic location along major transportation corridors while maintaining a small-town atmosphere. The community’s proximity to the state capital provides residents with employment opportunities in government, healthcare, and education sectors, while home prices remain more affordable than closer-in Jackson suburbs. This balance has made Terry increasingly attractive to families seeking space and value within commuting distance of the metro area’s job centers.
Recent price acceleration, particularly the 6.35% gain in 2025, indicates Terry may be experiencing spillover demand from more expensive Jackson suburbs. As home prices in communities like Madison and Ridgeland continue rising, Terry represents a value alternative that still provides metro area access. The town’s ongoing development of retail and service businesses further enhances its appeal to families seeking suburban amenities at more modest price points.
23. Lynchburg – 79% Home Price Increase Since 2016

- 2010: N/A
- 2011: N/A
- 2012: N/A
- 2013: N/A
- 2014: N/A
- 2015: N/A
- 2016: $142,778
- 2017: $146,811 (+$4,033, +2.82% from previous year)
- 2018: $158,406 (+$11,596, +7.90% from previous year)
- 2019: $166,812 (+$8,406, +5.31% from previous year)
- 2020: $177,709 (+$10,896, +6.53% from previous year)
- 2021: $203,329 (+$25,620, +14.42% from previous year)
- 2022: $238,796 (+$35,468, +17.44% from previous year)
- 2023: $242,759 (+$3,963, +1.66% from previous year)
- 2024: $252,094 (+$9,335, +3.85% from previous year)
- 2025: $255,238 (+$3,144, +1.25% from previous year)
Starting from $142,778 in 2016, Lynchburg has shown remarkable consistency in home price appreciation, with particularly explosive growth during 2021-2022 when values surged over 30% in just two years. The community maintained steady gains even through 2020, suggesting underlying strength in its housing market that positioned it well for the pandemic-era boom. Current values at $255,238 represent sustained momentum despite recent market cooling.
Lynchburg – Small Town Character Meets Growing Demand

This small community in DeSoto County has benefited tremendously from its location within the Memphis metropolitan statistical area, offering residents small-town living with access to a major regional economy. Lynchburg’s rural character appeals to families seeking space and privacy while maintaining reasonable commutes to Memphis employment centers. The town’s agricultural heritage and open spaces provide a stark contrast to urban density, attracting buyers who value this lifestyle difference.
The dramatic price appreciation since 2016 reflects growing recognition of Lynchburg’s value proposition within the broader Memphis metro housing market. As development pressure increased in closer-in suburbs, buyers began looking further afield for affordable options with land and character. The community’s 17.44% price jump in 2022 coincided with pandemic-era trends toward remote work and suburban relocation, as families discovered they could access big-city amenities while enjoying small-town benefits.
22. Carriere – 59% Home Price Increase Since 2012

- 2010: N/A
- 2011: N/A
- 2012: $162,130
- 2013: $177,118 (+$14,988, +9.24% from previous year)
- 2014: $181,934 (+$4,816, +2.72% from previous year)
- 2015: $202,805 (+$20,872, +11.47% from previous year)
- 2016: $208,892 (+$6,087, +3.00% from previous year)
- 2017: $202,822 (−$6,070, −2.91% from previous year)
- 2018: $208,408 (+$5,586, +2.75% from previous year)
- 2019: $208,920 (+$513, +0.25% from previous year)
- 2020: $205,413 (−$3,507, −1.68% from previous year)
- 2021: $212,812 (+$7,400, +3.60% from previous year)
- 2022: $233,030 (+$20,217, +9.50% from previous year)
- 2023: $232,172 (−$857, −0.37% from previous year)
- 2024: $250,070 (+$17,898, +7.71% from previous year)
- 2025: $257,219 (+$7,149, +2.86% from previous year)
Carriere’s housing market displays significant volatility, with strong early growth through 2015 followed by a plateau period lasting until 2021. The community experienced notable declines in 2017 and 2020, but recent years show renewed strength with 2024 bringing a particularly robust 7.71% gain. This pattern suggests Carriere’s market is sensitive to broader economic conditions while maintaining long-term upward momentum from $162,130 in 2012 to current levels of $257,219.
Carriere – Strategic Location Drives Recovery and Growth

Located in Pearl River County near the Louisiana border, Carriere occupies a strategic position between the New Orleans and Hattiesburg metropolitan areas. This geographic advantage provides residents with employment options in multiple markets while enjoying lower housing costs than urban centers. The community’s location along major transportation corridors has made it increasingly attractive to commuters seeking affordable housing within reach of larger employment markets.
Recent recovery beginning in 2022 suggests renewed confidence in Carriere’s prospects, possibly driven by infrastructure improvements and regional development projects. The 2024 price surge of 7.71% indicates strong buyer demand, likely from families seeking affordable options within commuting distance of employment centers. The community’s rural character, combined with regional accessibility, continues to attract residents prioritizing space and value over urban amenities.
21. Red Banks – 18% Home Price Increase Since 2021

- 2010: N/A
- 2011: N/A
- 2012: N/A
- 2013: N/A
- 2014: N/A
- 2015: N/A
- 2016: N/A
- 2017: N/A
- 2018: N/A
- 2019: N/A
- 2020: N/A
- 2021: $219,590
- 2022: $234,913 (+$15,323, +6.98% from previous year)
- 2023: $234,772 (−$141, −0.06% from previous year)
- 2024: $249,756 (+$14,984, +6.38% from previous year)
- 2025: $259,338 (+$9,581, +3.84% from previous year)
With data beginning in 2021, Red Banks shows a compressed but telling story of recent market dynamics. Starting at $219,590, the community experienced immediate growth before stalling in 2023, then surging 6.38% in 2024 and maintaining solid momentum into 2025. This pattern suggests Red Banks caught the tail end of the pandemic housing boom and is now establishing itself as a growth market in its own right.
Red Banks – Emerging Community Shows Strong Early Growth

As a relatively new entry to Mississippi’s tracked housing markets, Red Banks represents emerging suburban development patterns in the state. The community’s recent establishment as a distinct housing market suggests significant residential growth and development activity that has created enough transaction volume to generate reliable price data. This rapid emergence typically indicates either new construction activity or subdivision development that has attracted buyer attention.
The community’s 6.38% surge in 2024 occurred during a period when many Mississippi markets were cooling, suggesting Red Banks has specific advantages or attractions that continue drawing buyers. The sustained growth through 2025, with a 3.84% increase, indicates Red Banks is moving beyond initial development hype toward established market fundamentals. The community’s ability to maintain appreciation while other markets moderate suggests it has found its niche within Mississippi’s housing landscape, likely appealing to buyers seeking modern amenities and new construction in an accessible location.
20. Caledonia – 78% Home Price Increase Since 2012

- 2010: N/A
- 2011: N/A
- 2012: $146,994
- 2013: $142,816 (−$4,179, −2.84% from previous year)
- 2014: $139,955 (−$2,861, −2.00% from previous year)
- 2015: $157,233 (+$17,278, +12.35% from previous year)
- 2016: $163,410 (+$6,178, +3.93% from previous year)
- 2017: $167,661 (+$4,250, +2.60% from previous year)
- 2018: $180,098 (+$12,437, +7.42% from previous year)
- 2019: $186,012 (+$5,914, +3.28% from previous year)
- 2020: $193,374 (+$7,362, +3.96% from previous year)
- 2021: $216,319 (+$22,945, +11.87% from previous year)
- 2022: $242,346 (+$26,027, +12.03% from previous year)
- 2023: $234,776 (−$7,570, −3.12% from previous year)
- 2024: $247,703 (+$12,927, +5.51% from previous year)
- 2025: $261,322 (+$13,619, +5.50% from previous year)
Caledonia’s market journey reflects economic cycles clearly, declining from 2012 through 2014 before beginning steady recovery. The dramatic turnaround in 2015 with 12.35% growth marked the beginning of sustained appreciation that accelerated during the pandemic years. After a notable 2023 correction, the market has rebounded strongly with consecutive years of solid growth, reaching $261,322 from its 2012 starting point of $146,994.
Caledonia – Educational Excellence Drives Housing Demand

Located in Lowndes County in the Golden Triangle region, Caledonia benefits from its proximity to Mississippi State University and the broader educational and research infrastructure of the area. The community is particularly known for its highly-rated school district, which consistently ranks among Mississippi’s best and draws families seeking quality education for their children. This educational reputation creates sustained housing demand from families willing to pay premium prices for access to top-tier schools.
Recent price momentum, with back-to-back years of 5.5% growth, indicates Caledonia has established itself as a premium market within the Golden Triangle region. The community’s combination of excellent schools, regional economic stability, and small-town character creates a compelling value proposition for families. The 2023 price correction followed by strong recovery suggests the market has found sustainable levels while maintaining its appeal to education-focused buyers.
19. Walls – 83% Home Price Increase Since 2010

🔥 Would you like to save this?
- 2010: $144,041
- 2011: $138,474 (−$5,567, −3.86% from previous year)
- 2012: $138,993 (+$519, +0.38% from previous year)
- 2013: $139,369 (+$375, +0.27% from previous year)
- 2014: $145,364 (+$5,995, +4.30% from previous year)
- 2015: $144,243 (−$1,121, −0.77% from previous year)
- 2016: $148,695 (+$4,452, +3.09% from previous year)
- 2017: $152,462 (+$3,768, +2.53% from previous year)
- 2018: $163,203 (+$10,741, +7.04% from previous year)
- 2019: $173,082 (+$9,880, +6.05% from previous year)
- 2020: $190,793 (+$17,711, +10.23% from previous year)
- 2021: $216,216 (+$25,423, +13.32% from previous year)
- 2022: $250,035 (+$33,819, +15.64% from previous year)
- 2023: $251,613 (+$1,578, +0.63% from previous year)
- 2024: $262,078 (+$10,465, +4.16% from previous year)
- 2025: $263,166 (+$1,088, +0.42% from previous year)
Walls demonstrates a classic slow-growth pattern that accelerated dramatically after 2017, transforming from a stagnant market to one of Mississippi’s most appreciating communities. The town remained relatively flat from 2010-2017, hovering around $140,000-$150,000, before experiencing explosive growth that peaked with a 15.64% surge in 2022. Current values at $263,166 represent remarkable transformation from the $144,041 starting point in 2010.
Walls – Memphis Suburb Benefits From Regional Growth
Situated in DeSoto County just south of Memphis, Walls exemplifies the suburban growth patterns that have transformed North Mississippi’s housing market over the past decade. The community’s proximity to Memphis employment centers, combined with Mississippi’s favorable tax environment and lower cost of living, has made it increasingly attractive to families seeking suburban lifestyle benefits while maintaining urban area access. This positioning has driven the remarkable price appreciation seen since 2018.
Recent market stabilization, with growth moderating to under 1% in 2025, suggests Walls may be finding equilibrium after its remarkable run-up. The community’s ability to nearly double home values in less than a decade demonstrates the power of strategic location and regional economic integration. As development continues and amenities expand, Walls represents the evolution of rural Mississippi communities into suburban markets serving regional metropolitan areas.
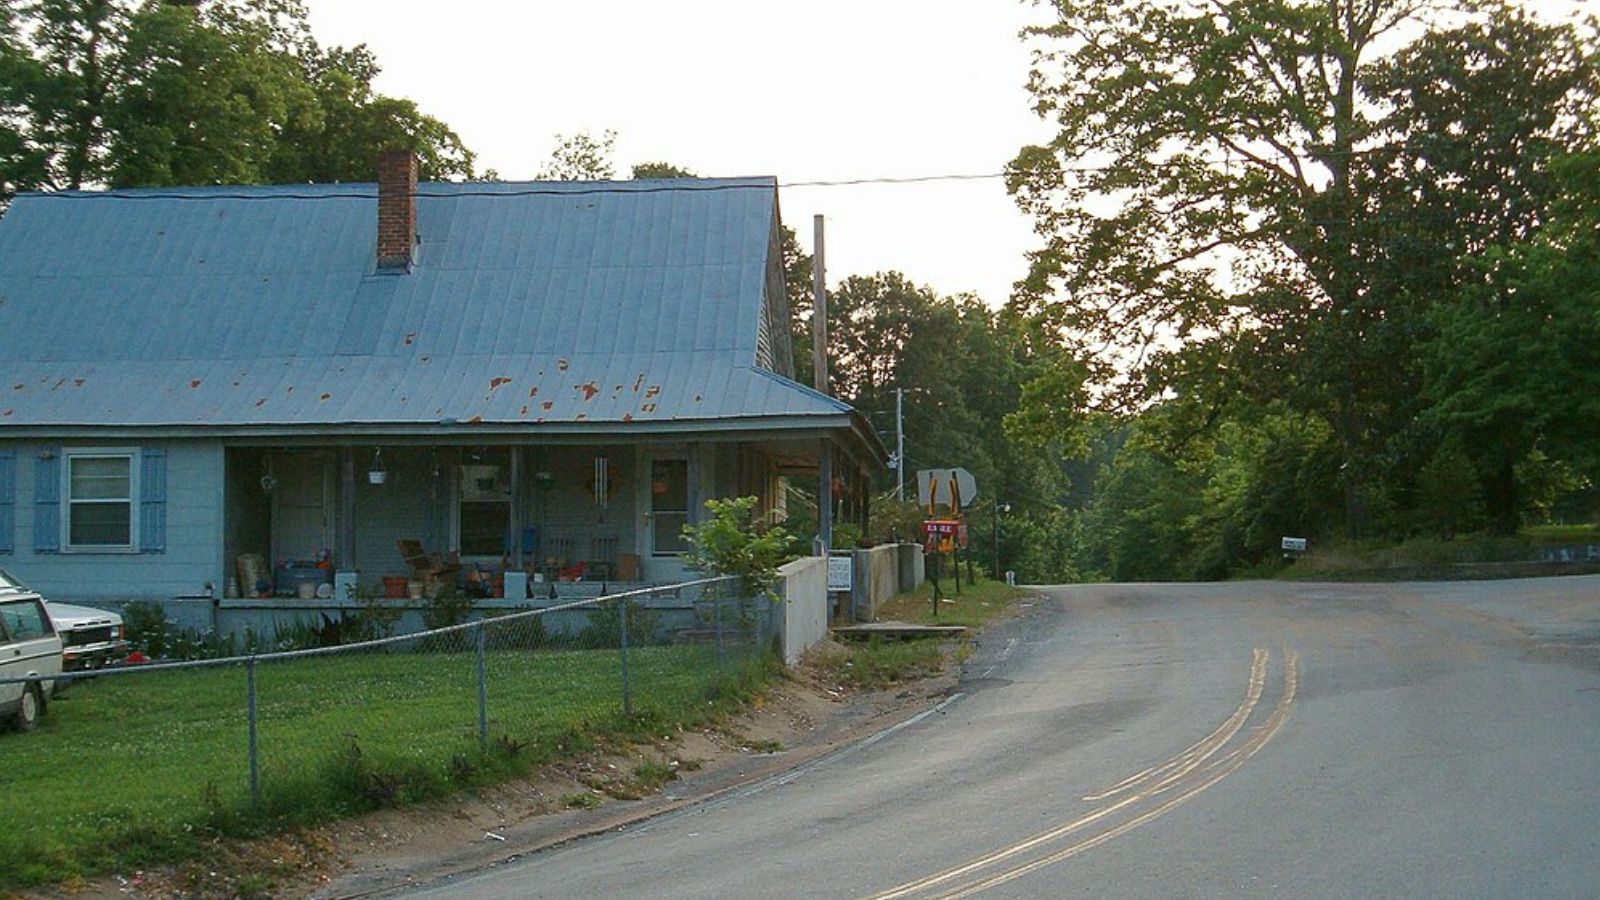
18. Paris – 15% Home Price Increase Since 2021

- 2010: N/A
- 2011: N/A
- 2012: N/A
- 2013: N/A
- 2014: N/A
- 2015: N/A
- 2016: N/A
- 2017: N/A
- 2018: N/A
- 2019: N/A
- 2020: N/A
- 2021: $232,190
- 2022: $244,540 (+$12,350, +5.32% from previous year)
- 2023: $247,948 (+$3,407, +1.39% from previous year)
- 2024: $262,042 (+$14,094, +5.68% from previous year)
- 2025: $266,123 (+$4,081, +1.56% from previous year)
Paris enters the housing data in 2021 at a relatively high starting point of $232,190, suggesting an established premium market before tracking began. The community has shown steady but measured growth, with notable acceleration in 2024’s 5.68% gain before moderating in 2025. This pattern indicates a mature market that benefits from specific local advantages while maintaining stability through broader economic cycles.
Paris – Premium Market Reflects Rural Exclusivity
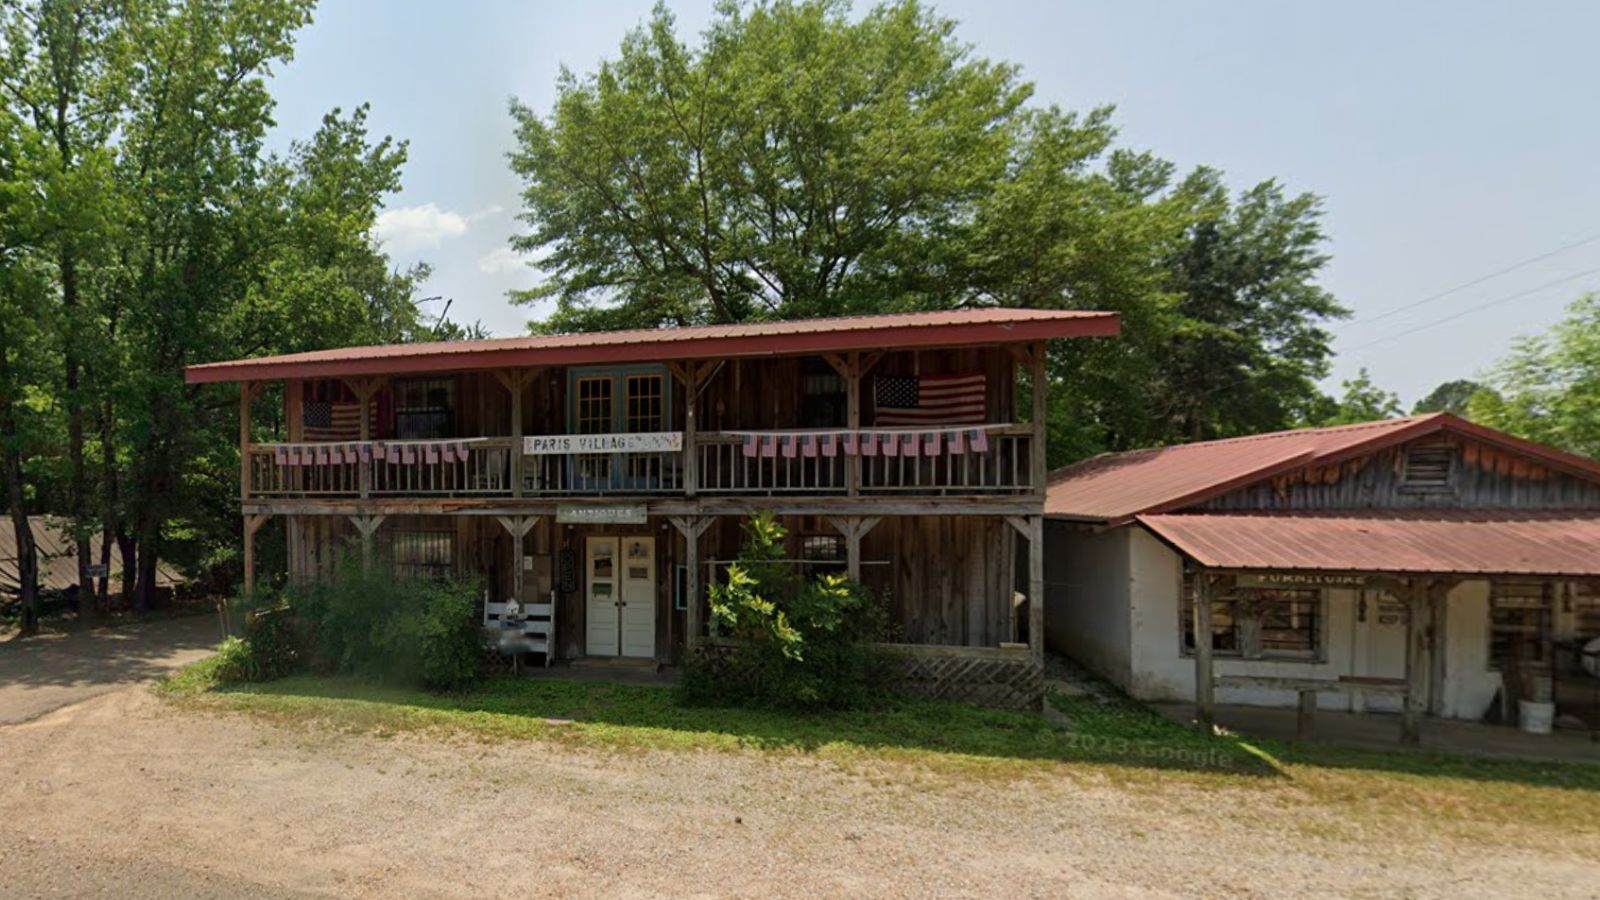
Located in Lafayette County, Paris represents a premium rural market that has attracted buyers seeking exclusivity and land ownership opportunities. The community’s relatively high entry point in 2021 suggests it had already established itself as a desirable location before systematic tracking began, likely due to its scenic rural character and proximity to Oxford and the University of Mississippi. This positioning creates appeal for buyers seeking country estates and recreational properties.
Recent growth acceleration in 2024 may indicate increased interest in rural properties as remote work options have expanded lifestyle choices for many professionals. Paris’s combination of scenic beauty, land availability, and relative proximity to Oxford creates a unique value proposition that continues attracting buyers seeking alternatives to suburban development. The community’s premium pricing reflects both scarcity of available properties and the lifestyle premium buyers assign to rural exclusivity.
17. Sumrall – 65% Home Price Increase Since 2012

- 2010: N/A
- 2011: N/A
- 2012: $162,685
- 2013: $159,583 (−$3,102, −1.91% from previous year)
- 2014: $159,887 (+$303, +0.19% from previous year)
- 2015: $166,677 (+$6,790, +4.25% from previous year)
- 2016: $172,026 (+$5,349, +3.21% from previous year)
- 2017: $170,917 (−$1,109, −0.64% from previous year)
- 2018: $188,770 (+$17,854, +10.45% from previous year)
- 2019: $187,411 (−$1,359, −0.72% from previous year)
- 2020: $197,566 (+$10,155, +5.42% from previous year)
- 2021: $218,735 (+$21,169, +10.71% from previous year)
- 2022: $241,372 (+$22,636, +10.35% from previous year)
- 2023: $243,761 (+$2,389, +0.99% from previous year)
- 2024: $261,149 (+$17,388, +7.13% from previous year)
- 2025: $268,668 (+$7,518, +2.88% from previous year)
Sumrall’s housing market shows periods of consolidation followed by significant growth spurts, particularly notable in 2018 and during the 2021-2022 pandemic boom. After relatively modest gains through 2017, the community experienced dramatic acceleration that has continued with some volatility through 2025. The progression from $162,685 in 2012 to current levels of $268,668 represents substantial appreciation despite periodic slowdowns.
Sumrall – Pine Belt Location Drives Steady Appreciation
Located in Lamar County within Mississippi’s Pine Belt region, Sumrall benefits from its position between Hattiesburg and the Gulf Coast, providing residents access to multiple employment markets and recreational opportunities. The community’s location along major transportation corridors connecting the Pine Belt to coastal areas has made it increasingly attractive to families seeking affordable housing with regional accessibility. This strategic positioning has contributed to the sustained price appreciation seen over the past decade.
Recent price momentum, including the 7.13% surge in 2024, indicates Sumrall continues benefiting from regional growth trends and increased recognition of Pine Belt advantages. The community’s ability to maintain appreciation even during market uncertainties suggests strong fundamentals driven by location, affordability, and quality of life factors. As the Pine Belt region continues developing economically, Sumrall’s position provides both stability and growth potential for homeowners.
16. Byhalia – 103% Home Price Increase Since 2010

- 2010: $132,837
- 2011: $123,955 (−$8,882, −6.69% from previous year)
- 2012: $119,946 (−$4,009, −3.23% from previous year)
- 2013: $112,527 (−$7,419, −6.19% from previous year)
- 2014: $119,558 (+$7,031, +6.25% from previous year)
- 2015: $146,448 (+$26,890, +22.49% from previous year)
- 2016: $147,647 (+$1,199, +0.82% from previous year)
- 2017: $163,589 (+$15,942, +10.80% from previous year)
- 2018: $168,783 (+$5,194, +3.18% from previous year)
- 2019: $181,919 (+$13,136, +7.78% from previous year)
- 2020: $197,898 (+$15,979, +8.78% from previous year)
- 2021: $223,356 (+$25,458, +12.86% from previous year)
- 2022: $249,177 (+$25,821, +11.56% from previous year)
- 2023: $251,479 (+$2,302, +0.92% from previous year)
- 2024: $263,462 (+$11,983, +4.76% from previous year)
- 2025: $269,813 (+$6,352, +2.41% from previous year)
Byhalia presents one of Mississippi’s most dramatic housing market transformations, plummeting to $112,527 in 2013 before beginning an extraordinary recovery that more than doubled values by 2025. The remarkable 22.49% surge in 2015 marked the beginning of sustained appreciation that accelerated through the pandemic years. Current values at $269,813 represent complete recovery and substantial gains beyond the 2010 starting point of $132,837.
Byhalia – Memphis Proximity Creates Suburban Transformation
Situated in Marshall County along the Tennessee border, Byhalia has experienced remarkable transformation from rural community to Memphis suburb over the past decade. The town’s proximity to Memphis, combined with Mississippi’s favorable tax structure and lower cost of living, has attracted increasing numbers of Tennessee residents seeking better value for their housing dollars. This cross-border migration has fundamentally changed Byhalia’s housing market dynamics and price structure.
The community’s dramatic recovery from 2013 lows reflects broader regional development patterns as Memphis metropolitan growth extended into North Mississippi. Byhalia’s rural character, larger lot sizes, and small-town atmosphere provide stark contrast to urban density while maintaining reasonable commute times to Memphis employment centers. The 22.49% surge in 2015 marked the beginning of serious suburban development that has continued transforming the community’s character and housing values.
15. Ocean Springs – 106% Home Price Increase Since 2012

- 2010: N/A
- 2011: N/A
- 2012: $132,051
- 2013: $132,377 (+$326, +0.25% from previous year)
- 2014: $141,102 (+$8,725, +6.59% from previous year)
- 2015: $147,686 (+$6,584, +4.67% from previous year)
- 2016: $157,621 (+$9,934, +6.73% from previous year)
- 2017: $163,700 (+$6,080, +3.86% from previous year)
- 2018: $169,004 (+$5,304, +3.24% from previous year)
- 2019: $178,592 (+$9,588, +5.67% from previous year)
- 2020: $188,113 (+$9,521, +5.33% from previous year)
- 2021: $215,486 (+$27,373, +14.55% from previous year)
- 2022: $252,357 (+$36,870, +17.11% from previous year)
- 2023: $256,170 (+$3,814, +1.51% from previous year)
- 2024: $266,581 (+$10,410, +4.06% from previous year)
- 2025: $272,657 (+$6,076, +2.28% from previous year)
Ocean Springs demonstrates remarkable consistency in appreciation, steadily climbing from $132,051 in 2012 through sustained annual gains that accelerated dramatically during 2021-2022. The community maintained positive growth every single year in the data set, with particularly explosive gains during the pandemic housing boom when values jumped over 30% in two years. Current levels at $272,657 represent more than doubling from the 2012 baseline.
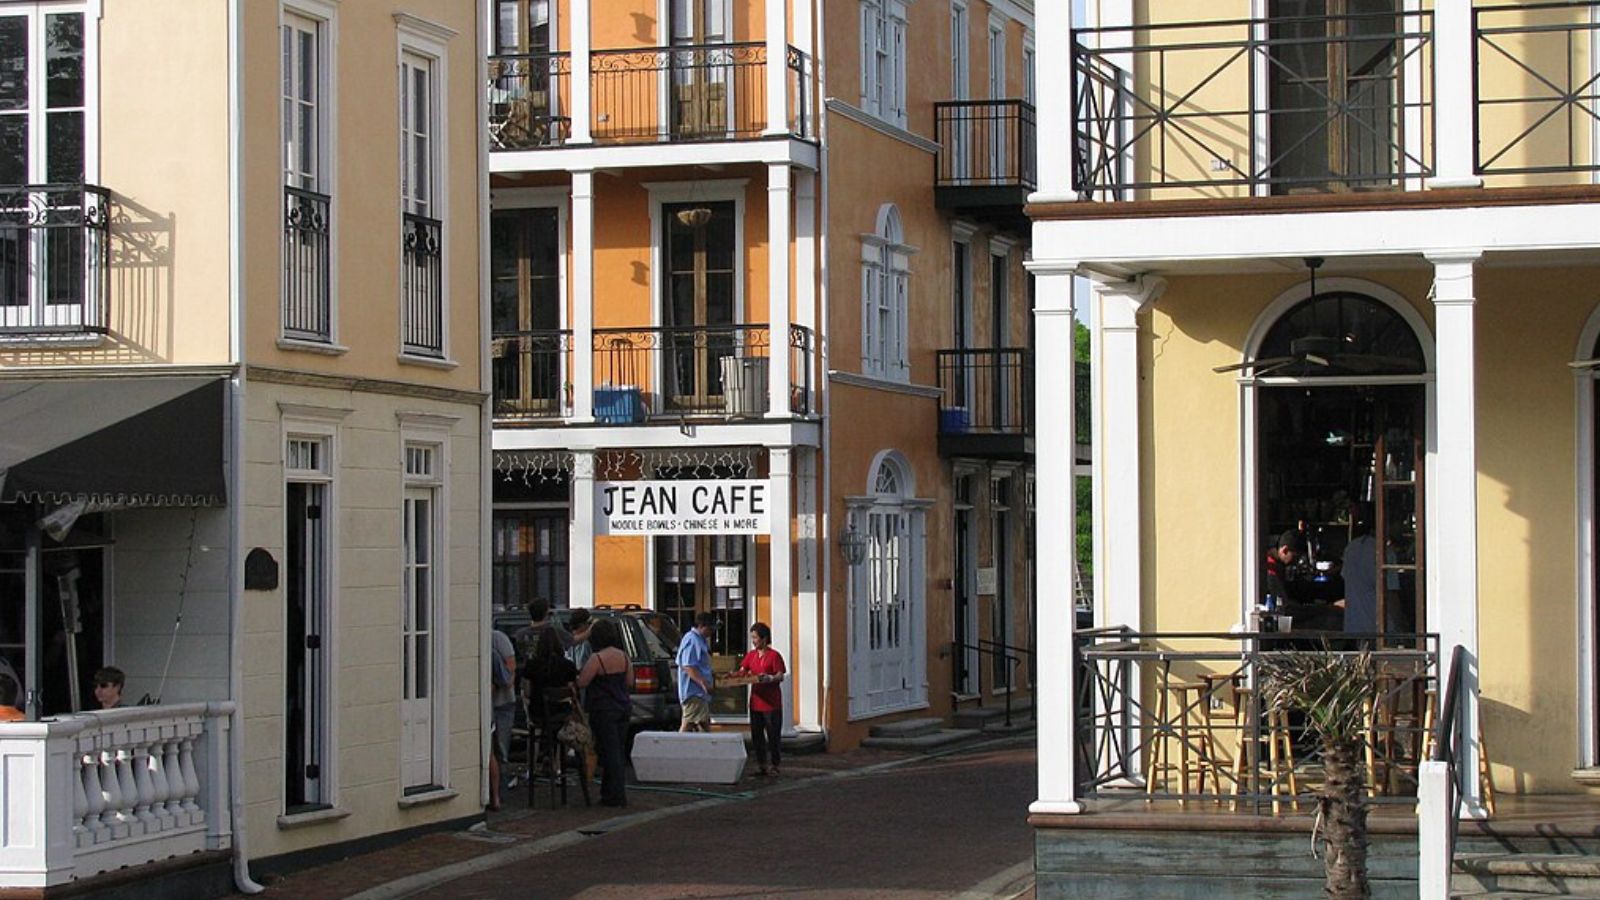
Ocean Springs – Coastal Arts Community Commands Premium Prices
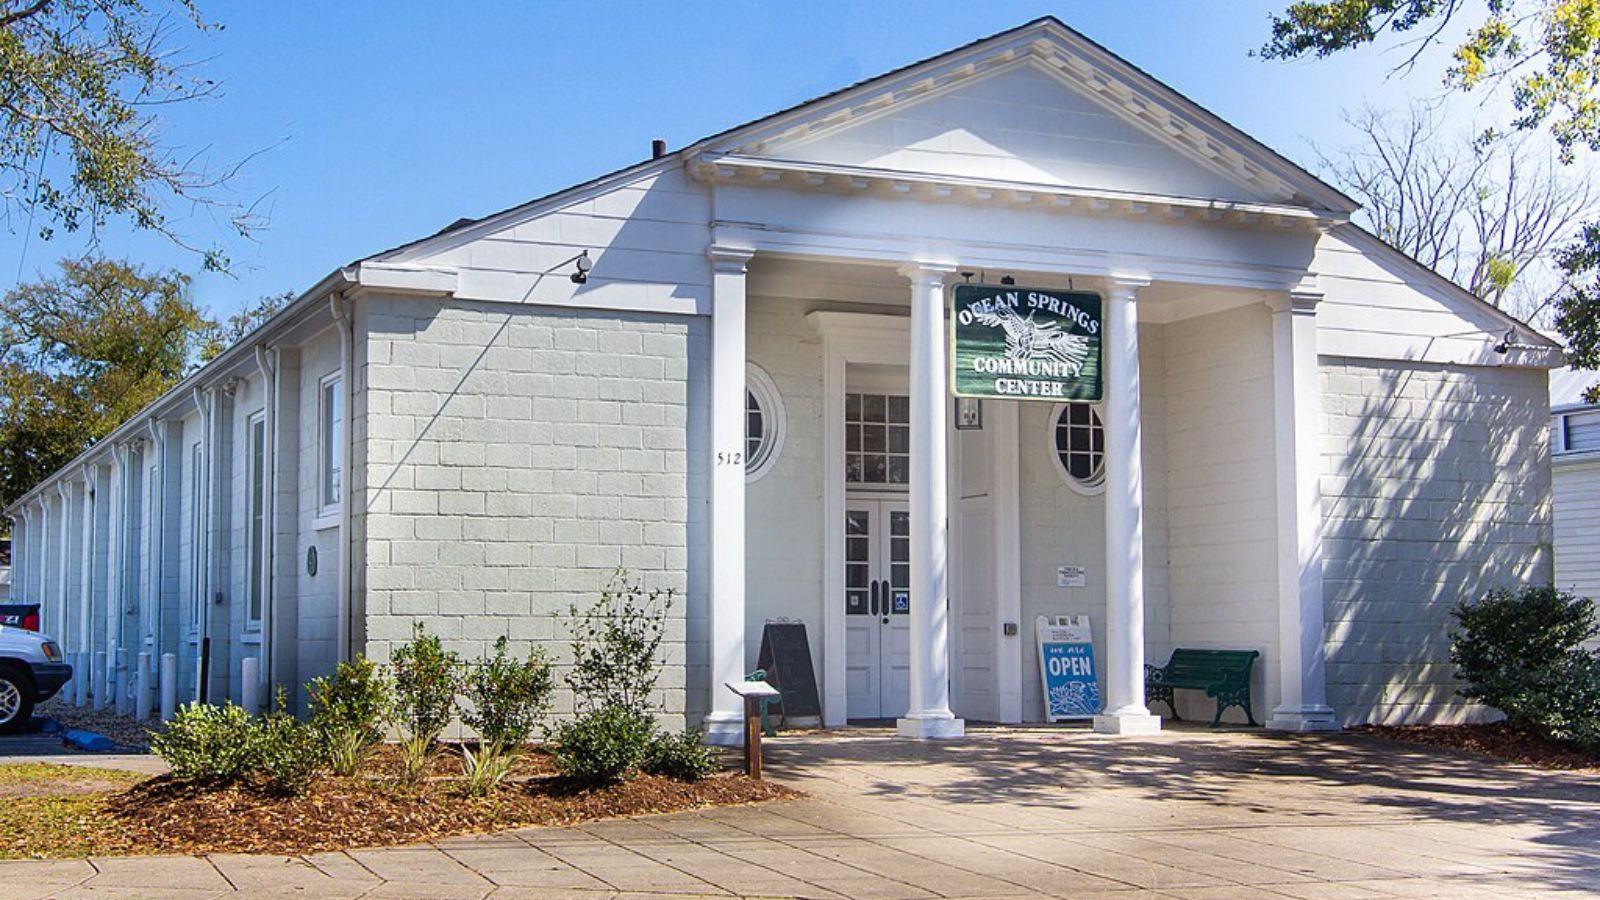
Located on Mississippi’s Gulf Coast in Jackson County, Ocean Springs has established itself as one of the state’s premier coastal communities, known for its vibrant arts scene, historic downtown, and scenic bayou setting. The town’s reputation as an arts and cultural destination, combined with its coastal location and charm, has created sustained demand from both residents and vacation home buyers. This unique positioning has driven the consistent price appreciation seen over the past decade.
Recent growth, including strong gains in 2024, suggests Ocean Springs continues benefiting from coastal migration trends and increased recognition of its lifestyle advantages. The community’s ability to more than double home values while maintaining its character demonstrates successful balance between growth and preservation. As coastal properties become increasingly scarce and expensive nationwide, Ocean Springs represents a compelling combination of affordability, character, and coastal access that continues attracting premium buyers.
14. Vancleave – 83% Home Price Increase Since 2012

- 2010: N/A
- 2011: N/A
- 2012: $151,368
- 2013: $150,725 (−$643, −0.42% from previous year)
- 2014: $160,377 (+$9,653, +6.40% from previous year)
- 2015: $166,649 (+$6,272, +3.91% from previous year)
- 2016: $177,310 (+$10,660, +6.40% from previous year)
- 2017: $180,677 (+$3,367, +1.90% from previous year)
- 2018: $185,277 (+$4,600, +2.55% from previous year)
- 2019: $193,632 (+$8,355, +4.51% from previous year)
- 2020: $201,525 (+$7,892, +4.08% from previous year)
- 2021: $228,666 (+$27,142, +13.47% from previous year)
- 2022: $258,465 (+$29,799, +13.03% from previous year)
- 2023: $255,965 (−$2,500, −0.97% from previous year)
- 2024: $269,876 (+$13,911, +5.43% from previous year)
- 2025: $276,656 (+$6,780, +2.51% from previous year)
Vancleave shows steady, measured growth from 2012 through 2020, followed by explosive appreciation during the pandemic years that added over $50,000 in value in just two years. After a minor correction in 2023, the market has resumed strong growth with consecutive years of solid gains. The progression from $151,368 in 2012 to current levels of $276,656 represents substantial wealth creation for homeowners in this Jackson County community.
Vancleave – Rural Character Meets Gulf Coast Accessibility
Located in Jackson County inland from the immediate coast, Vancleave offers residents rural living with convenient access to Gulf Coast employment and recreational opportunities. The community’s position provides the best of both worlds: country lifestyle with larger lots and privacy, combined with reasonable commute times to coastal jobs in Pascagoula, Ocean Springs, and other Gulf Coast employers. This balance has made Vancleave increasingly attractive to families seeking space and value while maintaining career flexibility.
Recent market strength, with robust growth in 2024 following a brief 2023 pause, suggests Vancleave has established sustainable market fundamentals beyond pandemic-era speculation. The community’s combination of rural lifestyle, affordability relative to coastal areas, and regional accessibility continues attracting buyers seeking authentic country living without sacrificing economic opportunity. This positioning provides ongoing support for property values as Gulf Coast development continues.
13. Southaven – 94% Home Price Increase Since 2010

🔥 Would you like to save this?
- 2010: $142,425
- 2011: $140,427 (−$1,998, −1.40% from previous year)
- 2012: $141,604 (+$1,178, +0.84% from previous year)
- 2013: $141,374 (−$230, −0.16% from previous year)
- 2014: $144,432 (+$3,058, +2.16% from previous year)
- 2015: $148,563 (+$4,131, +2.86% from previous year)
- 2016: $153,664 (+$5,100, +3.43% from previous year)
- 2017: $160,218 (+$6,555, +4.27% from previous year)
- 2018: $170,988 (+$10,770, +6.72% from previous year)
- 2019: $182,531 (+$11,543, +6.75% from previous year)
- 2020: $198,268 (+$15,737, +8.62% from previous year)
- 2021: $226,833 (+$28,565, +14.41% from previous year)
- 2022: $270,089 (+$43,256, +19.07% from previous year)
- 2023: $271,717 (+$1,628, +0.60% from previous year)
- 2024: $278,001 (+$6,284, +2.31% from previous year)
- 2025: $276,771 (−$1,230, −0.44% from previous year)
Southaven exhibits a classic suburban growth pattern, remaining relatively flat through 2016 before beginning accelerating appreciation that culminated in the extraordinary 19.07% surge of 2022. The community has nearly doubled from its 2010 starting point of $142,425, with most gains concentrated in the past seven years. Recent stabilization suggests the market may be finding equilibrium after its remarkable run-up to current levels around $276,771.
Southaven – Major Memphis Suburb Reaches Maturity
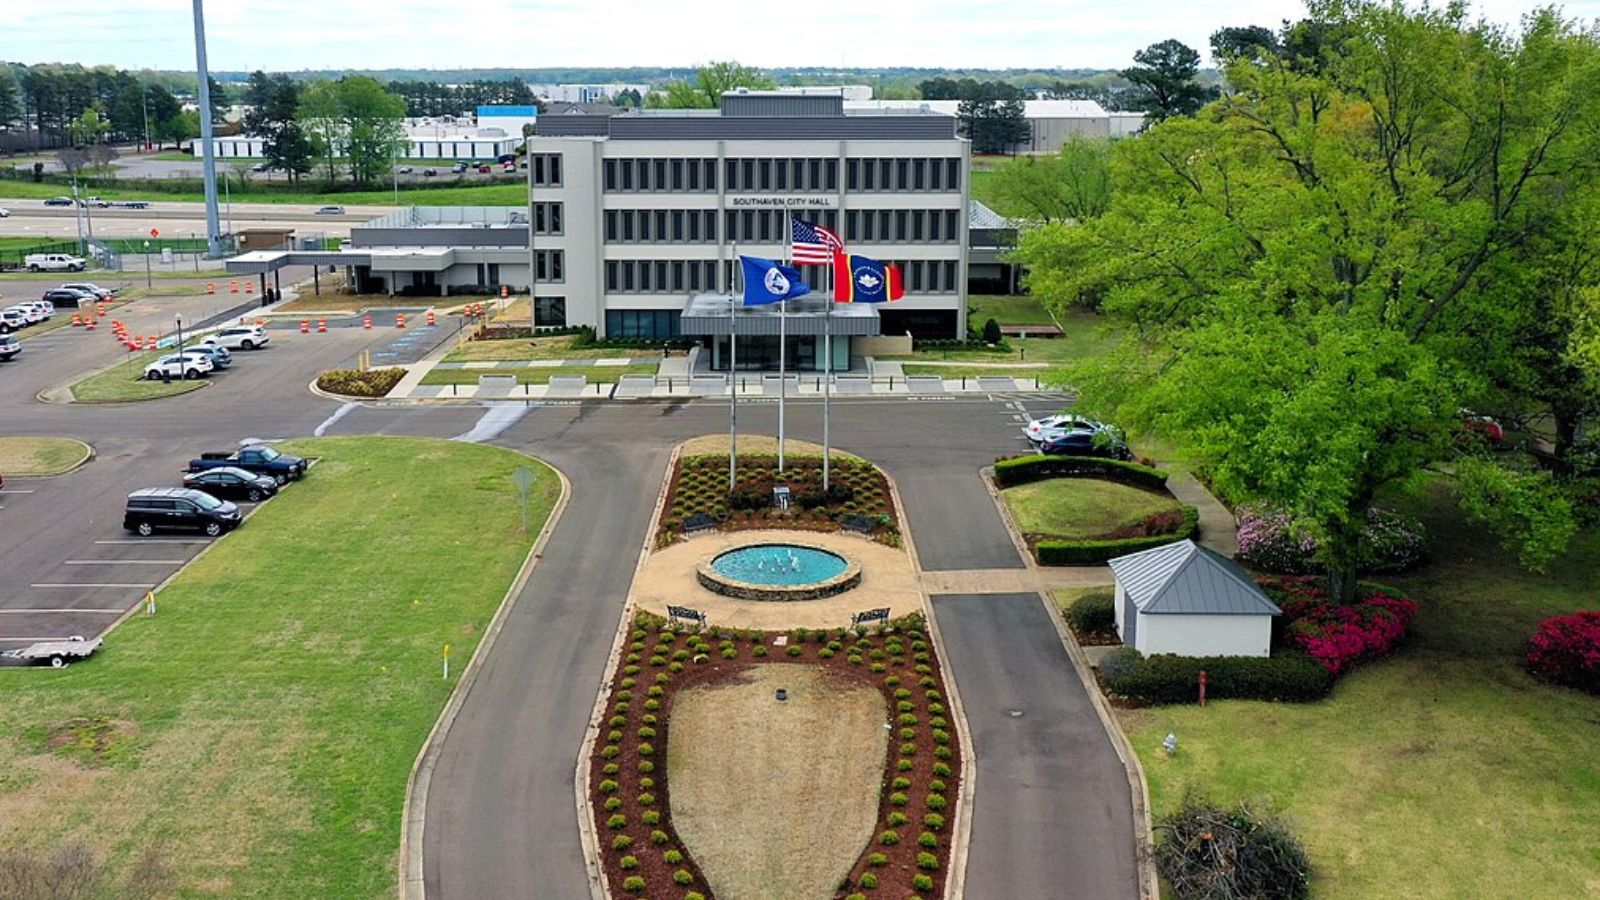
As Mississippi’s third-largest city and a major Memphis suburb, Southaven represents the mature end of cross-border suburban development in North Mississippi. Located in DeSoto County directly south of Memphis, the community has evolved from rural farmland to a major suburban center with extensive retail, dining, and residential development. This transformation has driven remarkable home price appreciation as Southaven established itself as a premier destination for families seeking suburban amenities with Mississippi’s favorable tax and cost advantages.
Recent market stabilization, including the slight decline in 2025, suggests Southaven may be reaching pricing equilibrium as a mature suburban market. The community’s nearly doubling of home values since 2010 represents successful transformation from rural area to major suburb, but current pricing levels may be approaching limits for cross-border buyers. Southaven’s established infrastructure, amenities, and regional importance provide ongoing support for property values even as growth moderates from pandemic-era peaks.
12. Starkville – 50% Home Price Increase Since 2010

- 2010: $184,746
- 2011: $183,411 (−$1,334, −0.72% from previous year)
- 2012: $192,261 (+$8,849, +4.82% from previous year)
- 2013: $202,330 (+$10,070, +5.24% from previous year)
- 2014: $193,853 (−$8,477, −4.19% from previous year)
- 2015: $186,049 (−$7,804, −4.03% from previous year)
- 2016: $186,262 (+$212, +0.11% from previous year)
- 2017: $193,304 (+$7,042, +3.78% from previous year)
- 2018: $195,679 (+$2,375, +1.23% from previous year)
- 2019: $204,701 (+$9,022, +4.61% from previous year)
- 2020: $206,470 (+$1,770, +0.86% from previous year)
- 2021: $222,443 (+$15,973, +7.74% from previous year)
- 2022: $246,094 (+$23,651, +10.63% from previous year)
- 2023: $248,719 (+$2,624, +1.07% from previous year)
- 2024: $264,843 (+$16,124, +6.48% from previous year)
- 2025: $277,637 (+$12,795, +4.83% from previous year)
Starkville demonstrates the stability typical of university markets, with notable volatility during 2014-2015 followed by steady recovery and strong recent growth. The community maintained relatively high starting values in 2010 at $184,746, reflecting its established status as a university town. Recent acceleration, particularly the strong gains in 2024-2025, has pushed values to $277,637, representing solid long-term appreciation despite periodic fluctuations.
Starkville – University Town Stability Drives Long-Term Growth
Home to Mississippi State University, Starkville benefits from the economic stability and consistent demand that comes with being a major university town. The presence of over 22,000 students, thousands of faculty and staff, and ongoing research activities creates a diversified economic base that supports housing demand through various market cycles. The university’s continued growth and research expansion, particularly in engineering and agriculture, provides long-term stability for the local housing market.
Recent strong price growth, with consecutive years of solid gains, indicates Starkville has moved beyond the mid-decade plateau to establish new growth momentum. The community’s combination of university stability, regional economic importance, and quality of life factors continues attracting buyers willing to pay premium prices for access to educational and cultural amenities. As Mississippi State University continues expanding its research profile and enrollment, Starkville’s housing market benefits from this institutional anchor and growth driver.
11. Ridgeland – 48% Home Price Increase Since 2010

- 2010: $188,629
- 2011: $183,998 (−$4,631, −2.46% from previous year)
- 2012: $181,639 (−$2,359, −1.28% from previous year)
- 2013: $179,329 (−$2,309, −1.27% from previous year)
- 2014: $178,869 (−$461, −0.26% from previous year)
- 2015: $183,985 (+$5,116, +2.86% from previous year)
- 2016: $189,353 (+$5,368, +2.92% from previous year)
- 2017: $189,853 (+$500, +0.26% from previous year)
- 2018: $194,599 (+$4,746, +2.50% from previous year)
- 2019: $198,835 (+$4,235, +2.18% from previous year)
- 2020: $204,220 (+$5,385, +2.71% from previous year)
- 2021: $223,421 (+$19,201, +9.40% from previous year)
- 2022: $253,541 (+$30,120, +13.48% from previous year)
- 2023: $264,741 (+$11,200, +4.42% from previous year)
- 2024: $269,967 (+$5,226, +1.97% from previous year)
- 2025: $278,744 (+$8,778, +3.25% from previous year)
Ridgeland experienced a prolonged decline from 2010 through 2014, bottoming out at $178,869 before beginning steady recovery that accelerated dramatically during the pandemic years. The community has shown remarkable resilience, climbing from recession lows to current levels of $278,744. The sustained growth since 2015, including strong recent gains, demonstrates Ridgeland’s successful positioning within the Jackson metropolitan area.
Ridgeland – Jackson Metro Commercial Hub Attracts Premium Buyers
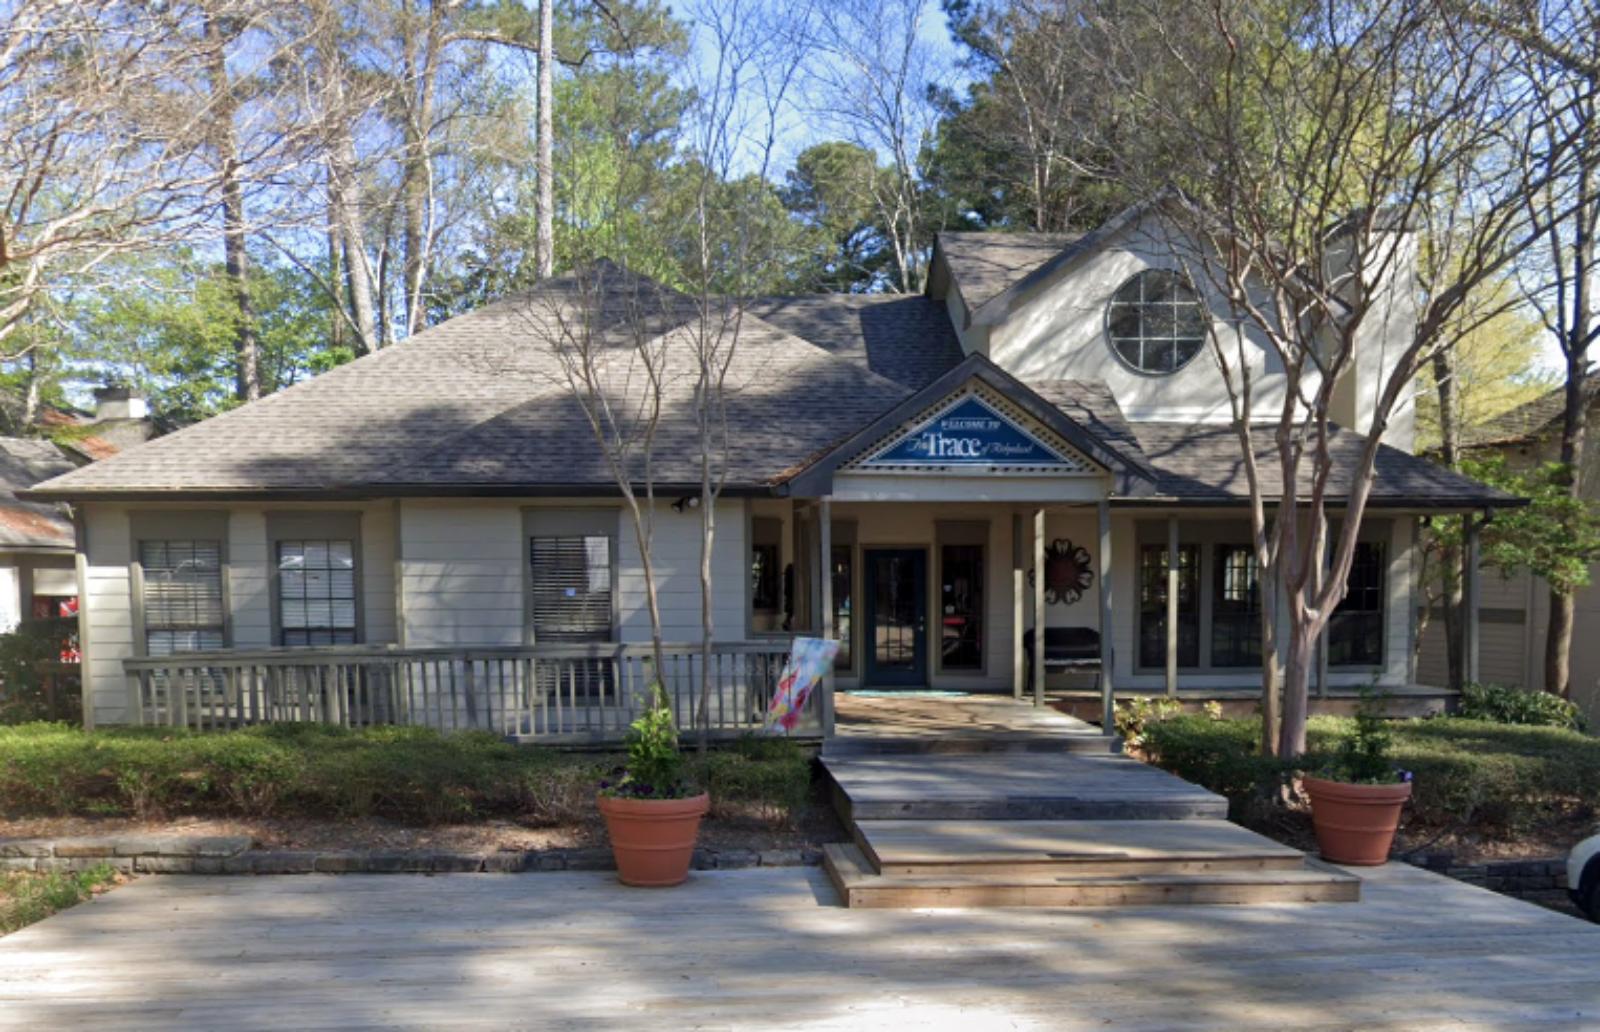
Located in Madison County north of Jackson, Ridgeland has established itself as a major commercial and retail center for the metropolitan area, anchored by the Renaissance at Colony Park shopping district and numerous corporate headquarters. The city’s strategic location along Interstate 55 and Highway 51 provides excellent regional accessibility while maintaining a distinct suburban identity. This combination of commercial importance and residential appeal has driven sustained housing demand from professionals and executives.
The community’s recovery from recession-era lows reflects broader Jackson metro economic stabilization and Ridgeland’s success in attracting major employers and retail developments. The city’s business-friendly environment has drawn corporate relocations and expansions that provide high-paying jobs supporting premium housing demand. Ridgeland’s excellent schools, low crime rates, and abundance of shopping and dining options create appeal for affluent families seeking suburban lifestyle benefits with urban conveniences.
10. Brandon – 66% Home Price Increase Since 2012

- 2010: N/A
- 2011: N/A
- 2012: $171,641
- 2013: $174,375 (+$2,734, +1.59% from previous year)
- 2014: $178,647 (+$4,272, +2.45% from previous year)
- 2015: $184,784 (+$6,137, +3.44% from previous year)
- 2016: $190,838 (+$6,054, +3.28% from previous year)
- 2017: $195,485 (+$4,648, +2.44% from previous year)
- 2018: $199,000 (+$3,515, +1.80% from previous year)
- 2019: $205,482 (+$6,482, +3.26% from previous year)
- 2020: $211,970 (+$6,488, +3.16% from previous year)
- 2021: $236,436 (+$24,466, +11.54% from previous year)
- 2022: $268,870 (+$32,434, +13.72% from previous year)
- 2023: $283,494 (+$14,624, +5.44% from previous year)
- 2024: $281,747 (−$1,747, −0.62% from previous year)
- 2025: $284,093 (+$2,346, +0.83% from previous year)
Brandon shows exceptional consistency in appreciation through 2020, maintaining steady annual gains before experiencing explosive growth during 2021-2022 that added over $50,000 in value in two years. The recent plateauing around $280,000-$285,000 suggests the market may be finding equilibrium after the pandemic-era surge. The progression from $171,641 in 2012 to current levels represents substantial wealth creation for homeowners in this Jackson metro suburb.
Brandon – Family-Friendly Suburb Maintains Premium Appeal
Located in Rankin County east of Jackson, Brandon has established itself as one of the metro area’s most desirable family-oriented suburbs, known for excellent schools, safe neighborhoods, and abundant recreational amenities. The city’s Reservoir area provides scenic waterfront living and recreational opportunities that set it apart from other Jackson suburbs. Brandon’s combination of natural beauty, top-rated schools, and family-friendly atmosphere has created sustained demand from affluent families seeking premium suburban living.
Recent market stabilization around $280,000-$285,000 suggests Brandon may have reached pricing levels that balance demand with affordability constraints for its target market. The community’s established amenities, reputation, and limited inventory continue supporting property values even as growth moderates from pandemic peaks. Brandon’s position as a premier family destination within the Jackson metro provides ongoing fundamental support for its premium housing market.
9. Pass Christian – 78% Home Price Increase Since 2011

- 2010: N/A
- 2011: $167,950
- 2012: $155,873 (−$12,077, −7.19% from previous year)
- 2013: $164,655 (+$8,782, +5.63% from previous year)
- 2014: $168,085 (+$3,430, +2.08% from previous year)
- 2015: $181,071 (+$12,986, +7.73% from previous year)
- 2016: $192,610 (+$11,539, +6.37% from previous year)
- 2017: $200,657 (+$8,047, +4.18% from previous year)
- 2018: $210,109 (+$9,452, +4.71% from previous year)
- 2019: $213,913 (+$3,804, +1.81% from previous year)
- 2020: $222,099 (+$8,186, +3.83% from previous year)
- 2021: $259,398 (+$37,299, +16.79% from previous year)
- 2022: $295,433 (+$36,035, +13.89% from previous year)
- 2023: $287,831 (−$7,602, −2.57% from previous year)
- 2024: $295,387 (+$7,556, +2.63% from previous year)
- 2025: $299,552 (+$4,165, +1.41% from previous year)
Pass Christian demonstrates remarkable resilience, recovering from early decade challenges to achieve sustained growth that accelerated dramatically during 2021-2022. The community experienced notable volatility in its early years but has shown strong momentum since 2015, with current values at $299,552 representing substantial appreciation from the 2011 starting point of $167,950. Recent stabilization suggests a maturing premium coastal market.
Pass Christian – Historic Coastal Charm Commands Premium Prices
🔥 Would you like to save this?
Located on Mississippi’s Gulf Coast in Harrison County, Pass Christian stands out as one of the state’s most charming and historic coastal communities, featuring antebellum homes, scenic beaches, and a walkable downtown district. The city’s rich history, dating back to the 1800s as a summer resort destination for New Orleans elite, continues to attract buyers seeking authentic coastal character and architectural significance. This historical appeal, combined with Gulf proximity, creates unique market dynamics that support premium pricing.
The community’s housing market reflects its dual appeal as both a residential destination and vacation home market. Pass Christian’s combination of year-round livability and resort-like atmosphere attracts diverse buyer groups, from retirees seeking coastal lifestyle to families drawn by small-town character and professionals who can afford premium coastal living. The town’s compact size and limited development opportunities create scarcity that supports higher values compared to larger coastal communities.
8. Flora – 76% Home Price Increase Since 2010

- 2010: $170,526
- 2011: $168,965 (−$1,561, −0.92% from previous year)
- 2012: $163,843 (−$5,122, −3.03% from previous year)
- 2013: $164,265 (+$423, +0.26% from previous year)
- 2014: $165,644 (+$1,379, +0.84% from previous year)
- 2015: $182,501 (+$16,857, +10.18% from previous year)
- 2016: $197,405 (+$14,904, +8.17% from previous year)
- 2017: $202,807 (+$5,402, +2.74% from previous year)
- 2018: $210,011 (+$7,204, +3.55% from previous year)
- 2019: $218,483 (+$8,471, +4.03% from previous year)
- 2020: $223,346 (+$4,864, +2.23% from previous year)
- 2021: $244,471 (+$21,125, +9.46% from previous year)
- 2022: $271,184 (+$26,713, +10.93% from previous year)
- 2023: $276,870 (+$5,686, +2.10% from previous year)
- 2024: $291,140 (+$14,270, +5.15% from previous year)
- 2025: $300,849 (+$9,709, +3.33% from previous year)
Flora exhibits a classic post-recession recovery pattern, declining through 2012 before beginning sustained growth that has continued with remarkable consistency. The dramatic turnaround beginning in 2015 with 10.18% growth marked the start of steady appreciation that has pushed values from recession lows to current levels of $300,849. The progression represents a 76% increase from the 2010 starting point of $170,526, with particularly strong momentum in recent years.
Flora – Rural Charm Meets Jackson Metro Accessibility
Located in Madison County northwest of Jackson, Flora combines small-town rural character with convenient access to the state capital’s employment opportunities. The community’s agricultural heritage and open spaces provide a stark contrast to suburban development while maintaining reasonable commute times to Jackson’s government, healthcare, and education sectors. This unique positioning has attracted families seeking country lifestyle benefits without sacrificing career opportunities in the metro area.
Recent acceleration in price growth, including strong gains in 2024-2025, indicates Flora continues benefiting from spillover demand as Jackson metro buyers seek affordable alternatives to closer-in suburbs. The community’s combination of rural lifestyle, accessibility, and value positioning creates ongoing appeal for families prioritizing space and character over urban amenities. Flora’s successful balance of growth and preservation positions it well for continued appreciation as regional development pressures increase.
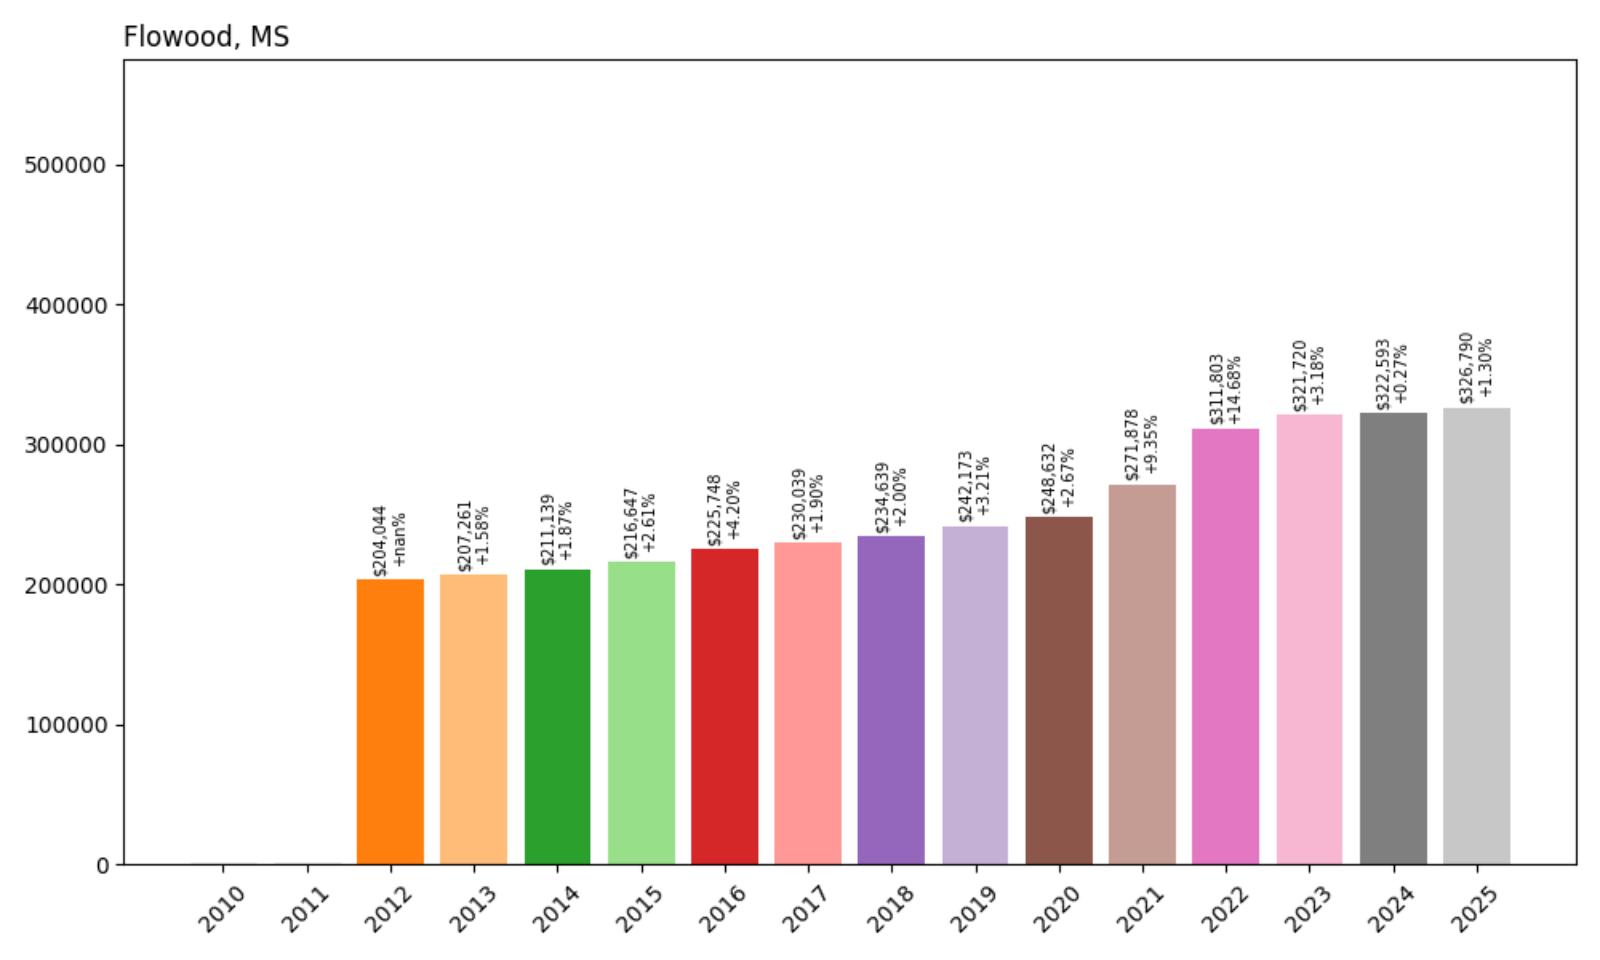
7. Flowood – 60% Home Price Increase Since 2012
- 2010: N/A
- 2011: N/A
- 2012: $204,044
- 2013: $207,261 (+$3,216, +1.58% from previous year)
- 2014: $211,139 (+$3,878, +1.87% from previous year)
- 2015: $216,647 (+$5,509, +2.61% from previous year)
- 2016: $225,748 (+$9,101, +4.20% from previous year)
- 2017: $230,039 (+$4,291, +1.90% from previous year)
- 2018: $234,639 (+$4,600, +2.00% from previous year)
- 2019: $242,173 (+$7,535, +3.21% from previous year)
- 2020: $248,632 (+$6,458, +2.67% from previous year)
- 2021: $271,878 (+$23,247, +9.35% from previous year)
- 2022: $311,803 (+$39,924, +14.68% from previous year)
- 2023: $321,720 (+$9,917, +3.18% from previous year)
- 2024: $322,593 (+$873, +0.27% from previous year)
- 2025: $326,790 (+$4,196, +1.30% from previous year)
Flowood demonstrates exceptional consistency in appreciation, maintaining steady annual gains throughout the data period with acceleration during the pandemic years. The community’s measured growth pattern from $204,044 in 2012 to current levels of $326,790 represents disciplined market development that avoided excessive speculation. Recent stabilization suggests a mature premium market finding equilibrium after the 2022 surge.
Flowood – Upscale Suburb Sets Jackson Metro Standard
Located in Rankin County adjacent to Jackson, Flowood has established itself as one of the metro area’s premier upscale suburban communities, known for excellent schools, high-end retail, and affluent neighborhoods. The city’s strategic location provides immediate access to Jackson employment while maintaining distinct suburban identity through carefully planned development and strict zoning standards. This positioning has attracted executives, professionals, and affluent families seeking premium suburban living with urban convenience.
Recent market stabilization around $325,000 suggests Flowood has reached pricing levels appropriate for its premium market position within the Jackson metro area. The community’s established amenities, reputation, and limited developable land continue supporting property values even as growth moderates from pandemic peaks. Flowood’s position as a premier destination for affluent families provides ongoing fundamental support for its luxury housing market segment.
6. Olive Branch – 84% Home Price Increase Since 2010

- 2010: $183,192
- 2011: $184,977 (+$1,784, +0.97% from previous year)
- 2012: $185,258 (+$281, +0.15% from previous year)
- 2013: $188,472 (+$3,215, +1.74% from previous year)
- 2014: $193,358 (+$4,885, +2.59% from previous year)
- 2015: $197,906 (+$4,548, +2.35% from previous year)
- 2016: $203,553 (+$5,647, +2.85% from previous year)
- 2017: $210,682 (+$7,129, +3.50% from previous year)
- 2018: $225,543 (+$14,861, +7.05% from previous year)
- 2019: $238,018 (+$12,475, +5.53% from previous year)
- 2020: $254,779 (+$16,761, +7.04% from previous year)
- 2021: $286,655 (+$31,876, +12.51% from previous year)
- 2022: $339,081 (+$52,427, +18.29% from previous year)
- 2023: $335,332 (−$3,749, −1.11% from previous year)
- 2024: $340,384 (+$5,052, +1.51% from previous year)
- 2025: $337,479 (−$2,905, −0.85% from previous year)
Olive Branch shows steady, measured growth through 2017 before experiencing dramatic acceleration that peaked with an extraordinary 18.29% gain in 2022. The community has nearly doubled from its 2010 starting point of $183,192, with most appreciation concentrated in the past seven years. Recent volatility, including modest declines in 2023 and 2025, suggests the market may be finding equilibrium after its remarkable run-up.
Olive Branch – Premier Memphis Suburb Reaches Market Peak
Located in DeSoto County as one of the Memphis metropolitan area’s largest and most established suburbs, Olive Branch represents the pinnacle of cross-border suburban development in North Mississippi. The city has evolved from rural community to major suburban center with extensive residential neighborhoods, top-rated schools, and comprehensive amenities that rival any suburb in the region. This transformation has created one of Mississippi’s most successful suburban housing markets, attracting affluent families from across the Memphis metro area.
The community’s explosive growth from 2018 forward reflects its emergence as the premier destination for families seeking the best combination of schools, amenities, and value within the Memphis metropolitan area. Olive Branch’s excellent school district, abundant retail and dining options, and well-planned neighborhoods create a comprehensive suburban experience that justifies premium pricing. The city’s strategic location along major transportation corridors provides excellent access to Memphis employment while offering Mississippi’s tax advantages and newer infrastructure.
5. Hernando – 73% Home Price Increase Since 2010

- 2010: $200,772
- 2011: $196,133 (−$4,639, −2.31% from previous year)
- 2012: $196,291 (+$158, +0.08% from previous year)
- 2013: $200,173 (+$3,882, +1.98% from previous year)
- 2014: $204,364 (+$4,191, +2.09% from previous year)
- 2015: $212,999 (+$8,634, +4.22% from previous year)
- 2016: $216,550 (+$3,551, +1.67% from previous year)
- 2017: $225,361 (+$8,811, +4.07% from previous year)
- 2018: $236,875 (+$11,514, +5.11% from previous year)
- 2019: $246,116 (+$9,241, +3.90% from previous year)
- 2020: $261,815 (+$15,700, +6.38% from previous year)
- 2021: $294,011 (+$32,196, +12.30% from previous year)
- 2022: $339,770 (+$45,759, +15.56% from previous year)
- 2023: $341,251 (+$1,480, +0.44% from previous year)
- 2024: $346,560 (+$5,309, +1.56% from previous year)
- 2025: $346,970 (+$410, +0.12% from previous year)
Hernando exhibits steady, disciplined growth throughout most of the data period, with dramatic acceleration during 2021-2022 that added nearly $80,000 in value in just two years. The community started from a relatively high baseline of $200,772 in 2010, reflecting its established status as a premium Memphis suburb. Recent stabilization around $347,000 suggests the market has reached equilibrium after the pandemic-era surge.
Hernando – Established Memphis Suburb Maintains Premium Status
Located in DeSoto County as one of the Memphis area’s most established and affluent suburbs, Hernando has maintained its position as a premium residential destination for decades. The community’s combination of excellent schools, upscale neighborhoods, and small-town character within a major metropolitan area creates unique appeal for families seeking the best of suburban living. Hernando’s long-established reputation and mature infrastructure have created sustained demand from Memphis-area professionals and executives.
Recent market stabilization around $347,000 indicates Hernando has reached pricing equilibrium appropriate for its premium market position within the Memphis metropolitan area. The community’s established amenities, educational reputation, and limited inventory continue supporting property values even as growth moderates from pandemic peaks. Hernando’s long-term position as a premier Memphis suburb provides fundamental market support and continued appeal to affluent families seeking established suburban excellence.
4. Nesbit – 72% Home Price Increase Since 2010

- 2010: $211,527
- 2011: $208,211 (−$3,316, −1.57% from previous year)
- 2012: $207,009 (−$1,201, −0.58% from previous year)
- 2013: $210,066 (+$3,056, +1.48% from previous year)
- 2014: $212,130 (+$2,064, +0.98% from previous year)
- 2015: $222,130 (+$10,000, +4.71% from previous year)
- 2016: $228,714 (+$6,584, +2.96% from previous year)
- 2017: $238,084 (+$9,370, +4.10% from previous year)
- 2018: $250,462 (+$12,378, +5.20% from previous year)
- 2019: $259,115 (+$8,653, +3.45% from previous year)
- 2020: $275,884 (+$16,769, +6.47% from previous year)
- 2021: $308,040 (+$32,156, +11.66% from previous year)
- 2022: $353,483 (+$45,443, +14.75% from previous year)
- 2023: $355,020 (+$1,537, +0.43% from previous year)
- 2024: $363,734 (+$8,714, +2.45% from previous year)
- 2025: $363,741 (+$7, +0.00% from previous year)
Nesbit demonstrates remarkable consistency in appreciation, maintaining steady annual gains with acceleration during the 2018-2022 period that peaked with a 14.75% surge in 2022. The community started from a high baseline of $211,527 in 2010, reflecting its established premium status, and has reached current levels of $363,741. Recent stabilization suggests the market has found equilibrium after significant pandemic-era gains.
Nesbit – Exclusive Community Reaches Premium Plateau
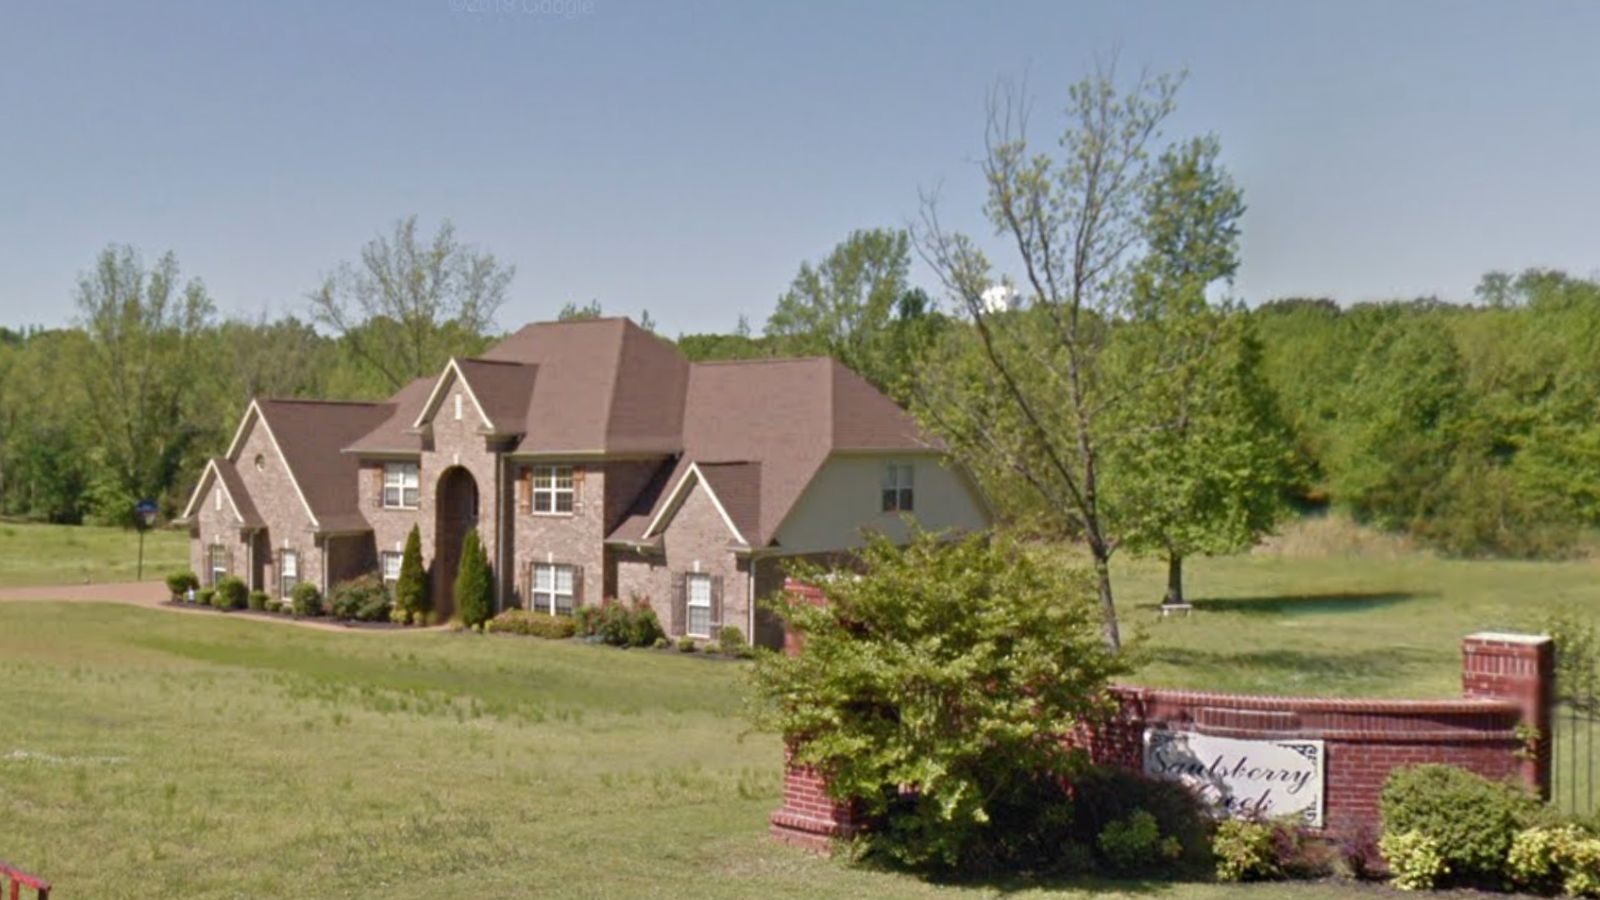
Located in DeSoto County near the Tennessee border, Nesbit represents one of North Mississippi’s most exclusive residential communities, known for large estate-style homes, expansive lots, and rural elegance within Memphis metropolitan accessibility. The community’s low-density development pattern and emphasis on privacy and space create a unique market niche that appeals to affluent buyers seeking country estate living with urban convenience. This exclusivity has supported consistent premium pricing throughout various market cycles.
The town’s housing market reflects its positioning as a luxury residential enclave rather than a typical suburban community. Nesbit’s emphasis on larger lots, custom homes, and natural preservation creates scarcity that supports higher values compared to conventional suburban developments. The community’s proximity to Memphis employment centers, combined with its rural character and privacy, appeals to executives and professionals seeking distinctive residential experiences away from typical suburban density.
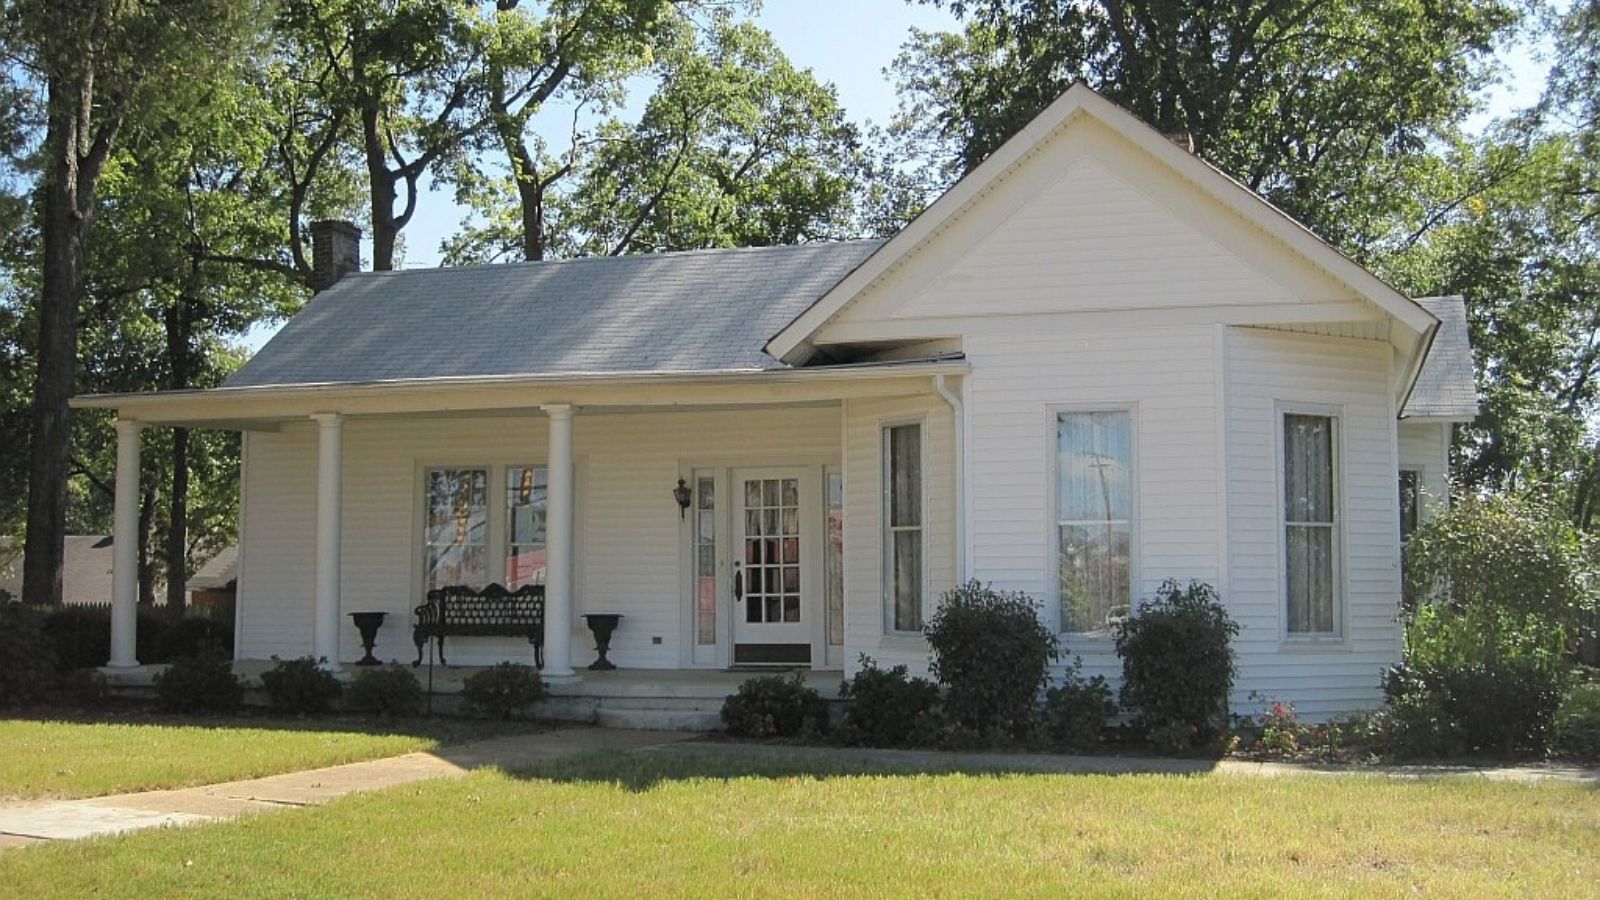
3. Taylor – 68% Home Price Increase Since 2017

- 2010: N/A
- 2011: N/A
- 2012: N/A
- 2013: N/A
- 2014: N/A
- 2015: N/A
- 2016: N/A
- 2017: $226,002
- 2018: $234,132 (+$8,130, +3.60% from previous year)
- 2019: $232,954 (−$1,178, −0.50% from previous year)
- 2020: $247,174 (+$14,220, +6.10% from previous year)
- 2021: $284,754 (+$37,580, +15.20% from previous year)
- 2022: $317,866 (+$33,112, +11.63% from previous year)
- 2023: $328,958 (+$11,092, +3.49% from previous year)
- 2024: $353,838 (+$24,880, +7.56% from previous year)
- 2025: $378,741 (+$24,903, +7.04% from previous year)
Taylor enters the data in 2017 at $226,002 and has shown remarkable growth momentum, particularly accelerating from 2020 forward with consecutive years of strong gains. The community has demonstrated exceptional appreciation, reaching $378,741 by 2025, representing a 68% increase in just eight years. Recent acceleration with back-to-back years of 7%+ growth indicates strong ongoing demand despite broader market cooling.
Taylor – Emerging Premium Market Shows Explosive Growth
Located in Lafayette County near Oxford, Taylor has emerged as one of Mississippi’s fastest-appreciating housing markets, benefiting from proximity to the University of Mississippi and the broader Oxford metropolitan area. The community’s rural character, combined with easy access to Oxford’s employment, cultural, and educational opportunities, has created a unique value proposition that appeals to families seeking country living with university town benefits. This positioning has driven remarkable price appreciation as buyers discover Taylor’s advantages.
Recent acceleration with consecutive 7%+ annual gains indicates Taylor has established strong momentum that continues attracting buyers despite broader market uncertainties. The community’s combination of rural lifestyle, Oxford accessibility, and relative value compared to urban alternatives positions it well for continued growth. As Oxford area development pressures increase, Taylor represents an attractive option for buyers seeking space, character, and university town access at premium but competitive pricing.
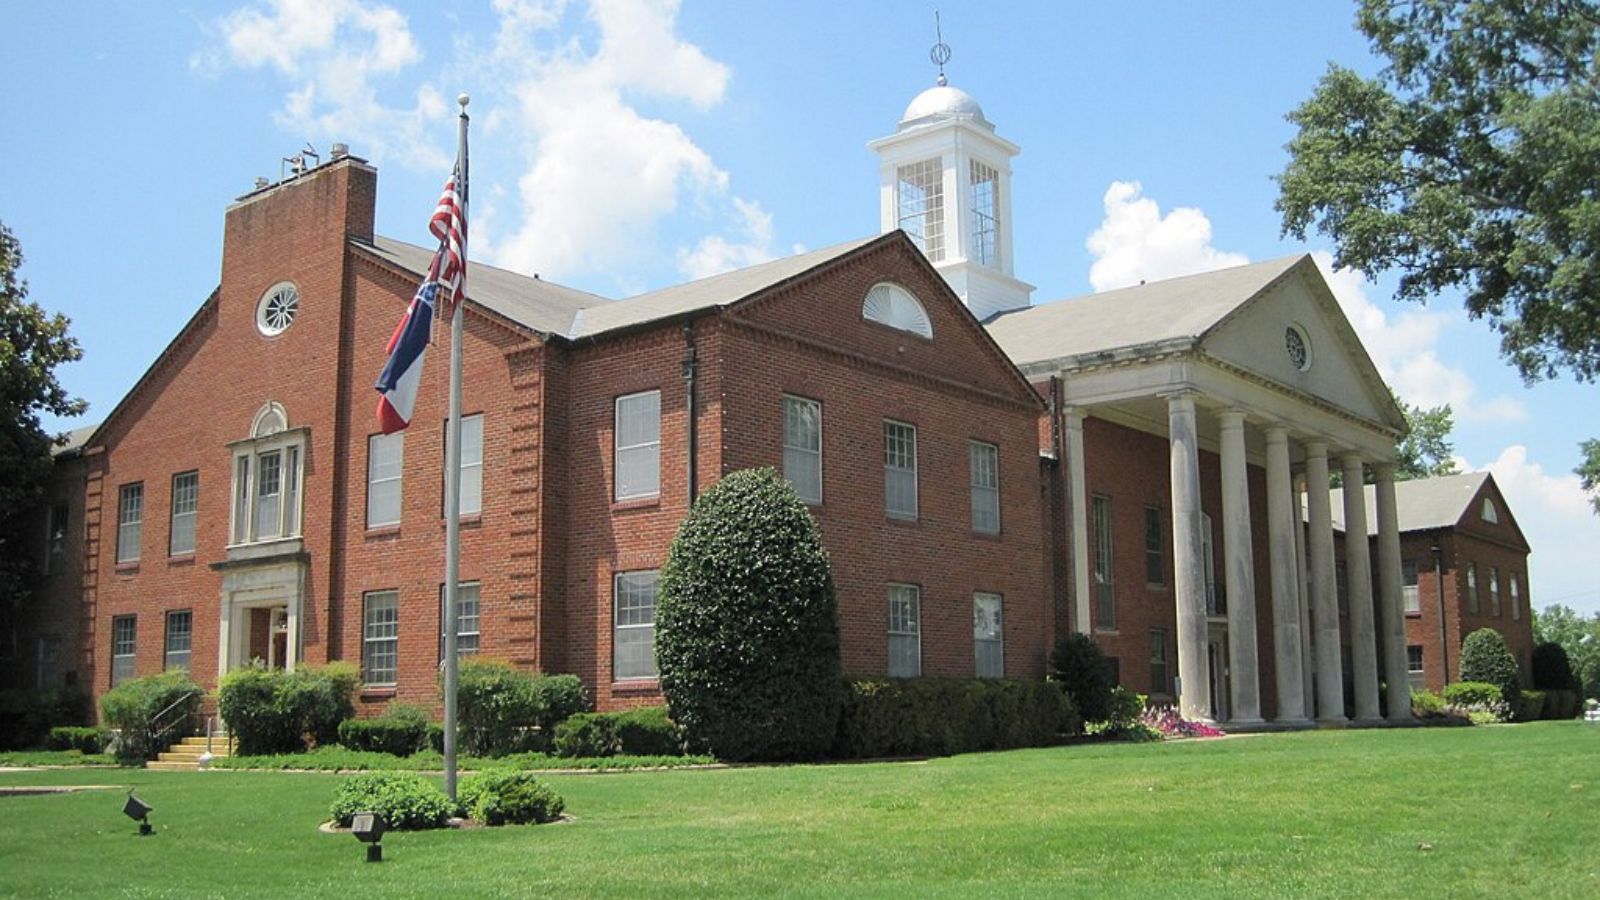
2. Oxford – 107% Home Price Increase Since 2010

- 2010: $193,917
- 2011: $191,003 (−$2,914, −1.50% from previous year)
- 2012: $190,003 (−$1,000, −0.52% from previous year)
- 2013: $196,333 (+$6,330, +3.33% from previous year)
- 2014: $202,800 (+$6,467, +3.29% from previous year)
- 2015: $211,672 (+$8,872, +4.37% from previous year)
- 2016: $227,792 (+$16,119, +7.62% from previous year)
- 2017: $239,727 (+$11,936, +5.24% from previous year)
- 2018: $246,828 (+$7,100, +2.96% from previous year)
- 2019: $247,906 (+$1,078, +0.44% from previous year)
- 2020: $250,625 (+$2,720, +1.10% from previous year)
- 2021: $272,527 (+$21,902, +8.74% from previous year)
- 2022: $303,019 (+$30,492, +11.19% from previous year)
- 2023: $331,797 (+$28,778, +9.50% from previous year)
- 2024: $365,331 (+$33,534, +10.11% from previous year)
- 2025: $401,034 (+$35,703, +9.77% from previous year)
Oxford demonstrates the classic pattern of a university town housing market, with steady growth through 2018 followed by explosive appreciation that has continued unabated through 2025. The community has more than doubled from its 2010 starting point of $193,917, with particularly dramatic gains in recent years including consecutive years of nearly 10% appreciation. Current values at $401,034 represent remarkable transformation of this college town market.
Oxford – University Town Excellence Drives Unprecedented Growth
Home to the University of Mississippi, Oxford has evolved from a traditional college town to one of the South’s most desirable small cities, combining academic excellence with cultural sophistication and economic vitality. The presence of Ole Miss creates a stable economic foundation while the university’s growth, research expansion, and cultural contributions attract residents far beyond the traditional academic community. Oxford’s combination of educational prestige, cultural amenities, and small-city charm has created unprecedented demand that continues driving remarkable price appreciation.
The city’s housing market reflects its unique position as both a university town and a regional cultural and economic center. Oxford’s excellent restaurants, vibrant downtown, literary heritage, and quality of life amenities create appeal that extends well beyond typical college town boundaries. The community attracts retirees, remote workers, and professionals who value the intellectual and cultural environment that the university provides, creating diverse demand that supports continued price growth even at elevated levels.
1. Madison – 49% Home Price Increase Since 2010

- 2010: $276,188
- 2011: $272,869 (−$3,320, −1.20% from previous year)
- 2012: $271,311 (−$1,558, −0.57% from previous year)
- 2013: $276,587 (+$5,276, +1.94% from previous year)
- 2014: $278,345 (+$1,758, +0.64% from previous year)
- 2015: $289,406 (+$11,061, +3.97% from previous year)
- 2016: $291,365 (+$1,959, +0.68% from previous year)
- 2017: $291,984 (+$619, +0.21% from previous year)
- 2018: $298,281 (+$6,297, +2.16% from previous year)
- 2019: $299,061 (+$780, +0.26% from previous year)
- 2020: $303,084 (+$4,023, +1.35% from previous year)
- 2021: $334,086 (+$31,002, +10.23% from previous year)
- 2022: $383,942 (+$49,856, +14.92% from previous year)
- 2023: $402,540 (+$18,598, +4.84% from previous year)
- 2024: $406,598 (+$4,058, +1.01% from previous year)
- 2025: $412,306 (+$5,708, +1.40% from previous year)
Madison represents Mississippi’s most expensive housing market, starting from an already premium baseline of $276,188 in 2010 and reaching current levels of $412,306. The community showed measured growth through 2020 before experiencing dramatic acceleration during 2021-2022 that added nearly $80,000 in value in two years. Recent moderation suggests the market has found equilibrium at these elevated levels while maintaining its position as the state’s premier residential destination.
Madison – Mississippi’s Premier Suburb Sets State Standard
Located in Madison County north of Jackson, Madison has established itself as Mississippi’s most prestigious suburban community, consistently ranking among the state’s best places to live and commanding the highest home values. The city’s combination of excellent schools, upscale amenities, safe neighborhoods, and strategic location has created a comprehensive premium residential experience that sets the standard for suburban excellence in Mississippi. Madison’s reputation for quality extends beyond housing to encompass governance, services, and community character that justify its premium market position.
Recent market stabilization around $410,000 indicates Madison has reached pricing levels that represent equilibrium for its premium market segment while maintaining its position as Mississippi’s most expensive residential market. The community’s established reputation, limited available land, and comprehensive amenities continue supporting the state’s highest property values. Madison’s long-term position as Mississippi’s suburban standard provides fundamental market support and continued appeal to the state’s most affluent families seeking the ultimate in suburban living excellence.


