🔥 Would you like to save this?
Think Kansas still means cheap land and predictable prices? Not in these 30 towns. The Zillow Home Value Index shows just how much the market has shifted, with some home values now pushing past half a million—and staying there. From small suburbs with big price tags to prairie towns-turned-pricey, this list tracks where Kansas real estate has climbed the highest since 2010. Whether you’re planning a move or just wondering why that three-bedroom ranch now costs $600K, these are the towns making homebuyers sweat in 2025.
30. Gardner – 104% Home Price Increase Since 2010
- 2010: $171,373
- 2011: $162,481 (−$8,892, −5.19% from previous year)
- 2012: $160,905 (−$1,576, −0.97% from previous year)
- 2013: $166,500 (+$5,595, +3.48% from previous year)
- 2014: $174,848 (+$8,349, +5.01% from previous year)
- 2015: $185,598 (+$10,749, +6.15% from previous year)
- 2016: $197,481 (+$11,883, +6.40% from previous year)
- 2017: $212,901 (+$15,420, +7.81% from previous year)
- 2018: $229,112 (+$16,211, +7.61% from previous year)
- 2019: $239,002 (+$9,890, +4.32% from previous year)
- 2020: $251,049 (+$12,047, +5.04% from previous year)
- 2021: $288,944 (+$37,895, +15.09% from previous year)
- 2022: $326,603 (+$37,659, +13.03% from previous year)
- 2023: $333,312 (+$6,709, +2.05% from previous year)
- 2024: $342,436 (+$9,124, +2.74% from previous year)
- 2025: $348,895 (+$6,459, +1.89% from previous year)
Gardner has seen home prices more than double since 2010, rising 104% over 15 years. Growth has been fairly steady, with only a couple of minor dips in the early 2010s. Since 2020, the market has cooled somewhat, but it still shows consistent year-over-year gains. The median home value in July 2025 is $348,895, up from $171,373 in 2010.
In order to come up with the very specific design ideas, we create most designs with the assistance of state-of-the-art AI interior design software.
Gardner – Steady Growth and Strong Demand
Located in Johnson County, Gardner has transformed from a small town into a fast-growing suburb of the Kansas City metro. The town’s growth mirrors broader regional trends—access to highways, good schools, and newer housing stock have all played roles. New construction in the 2010s brought modern amenities and expanded the housing supply.
The pandemic years fueled a surge in demand, reflected in the sharp 15% increase in 2021 and 13% in 2022. While more recent years have seen moderate gains, Gardner remains a solid option for buyers looking for a suburban lifestyle without the top-tier price tag. The community continues to attract residents with its parks, retail options, and proximity to major employers.
29. Princeton – 185% Home Price Increase Since 2010
- 2010: $124,800
- 2011: $126,944 (+$2,144, +1.72% from previous year)
- 2012: $126,546 (−$398, −0.31% from previous year)
- 2013: $127,355 (+$809, +0.64% from previous year)
- 2014: $134,407 (+$7,052, +5.54% from previous year)
- 2015: $153,382 (+$18,975, +14.12% from previous year)
- 2016: $172,882 (+$19,500, +12.71% from previous year)
- 2017: $188,461 (+$15,579, +9.01% from previous year)
- 2018: $204,892 (+$16,430, +8.72% from previous year)
- 2019: $217,841 (+$12,949, +6.32% from previous year)
- 2020: $221,748 (+$3,907, +1.79% from previous year)
- 2021: $269,774 (+$48,026, +21.66% from previous year)
- 2022: $317,193 (+$47,419, +17.58% from previous year)
- 2023: $313,595 (−$3,598, −1.13% from previous year)
- 2024: $339,367 (+$25,772, +8.22% from previous year)
- 2025: $355,190 (+$15,823, +4.66% from previous year)
Princeton home values surged nearly 185% from 2010 to 2025, climbing from under $125K to over $355K. The largest spikes occurred between 2015 and 2022, with gains in double digits for multiple years. After a slight dip in 2023, prices rebounded quickly, signaling strong ongoing demand.
Princeton – Big Gains in a Small Package
Princeton, located in Franklin County, is one of Kansas’s smaller towns—but its housing market is no small story. With fewer properties available, even modest demand can push values sharply upward. And that’s exactly what happened starting around 2015 when interest in exurban living began to grow.
Recent years have brought even more attention to Princeton, especially from buyers looking for space and privacy within a reasonable commute of larger job centers. Despite its size, the market here is dynamic and responsive, and the 2025 median of $355,190 is a dramatic shift from its sub-$130K values a decade and a half ago.
28. Baldwin City – 127% Home Price Increase Since 2010
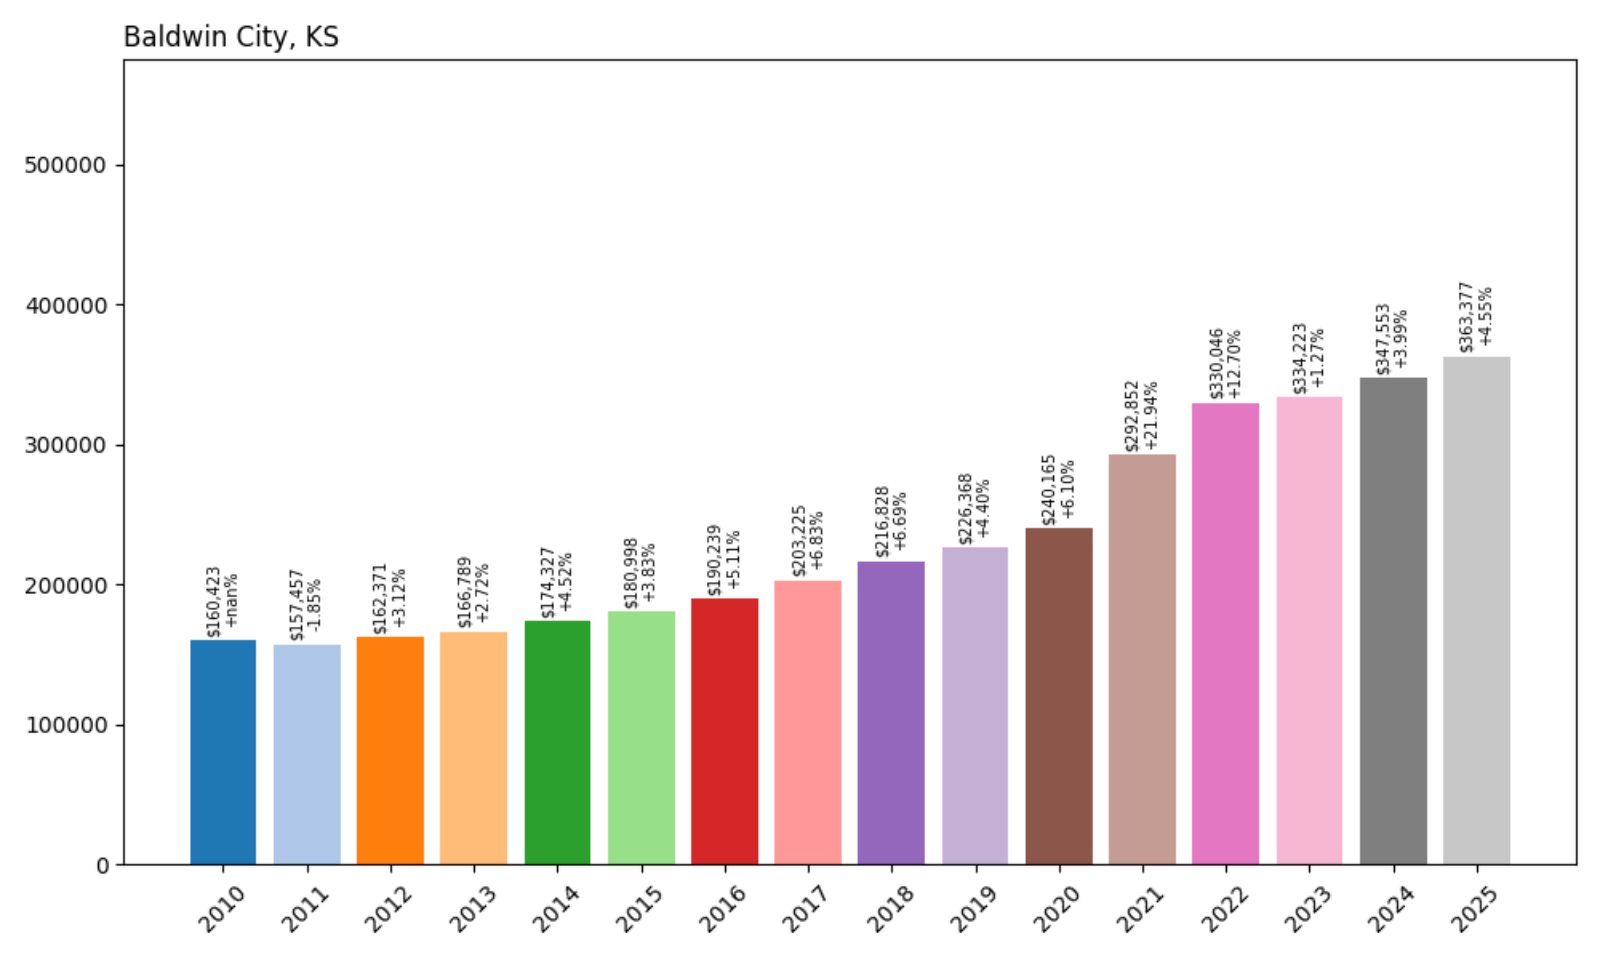
- 2010: $160,423
- 2011: $157,457 (−$2,966, −1.85% from previous year)
- 2012: $162,371 (+$4,914, +3.12% from previous year)
- 2013: $166,789 (+$4,418, +2.72% from previous year)
- 2014: $174,327 (+$7,538, +4.52% from previous year)
- 2015: $180,998 (+$6,671, +3.83% from previous year)
- 2016: $190,239 (+$9,241, +5.11% from previous year)
- 2017: $203,225 (+$12,987, +6.83% from previous year)
- 2018: $216,828 (+$13,603, +6.69% from previous year)
- 2019: $226,368 (+$9,540, +4.40% from previous year)
- 2020: $240,165 (+$13,797, +6.10% from previous year)
- 2021: $292,852 (+$52,687, +21.94% from previous year)
- 2022: $330,046 (+$37,194, +12.70% from previous year)
- 2023: $334,223 (+$4,177, +1.27% from previous year)
- 2024: $347,553 (+$13,330, +3.99% from previous year)
- 2025: $363,377 (+$15,824, +4.55% from previous year)
In Baldwin City, home prices have gone from just over $160K in 2010 to more than $363K in 2025. That’s a 127% increase, with especially strong growth after 2020. A sharp 22% surge in 2021 marked a shift from steady to rapid appreciation, likely driven by buyer demand and tight inventory.
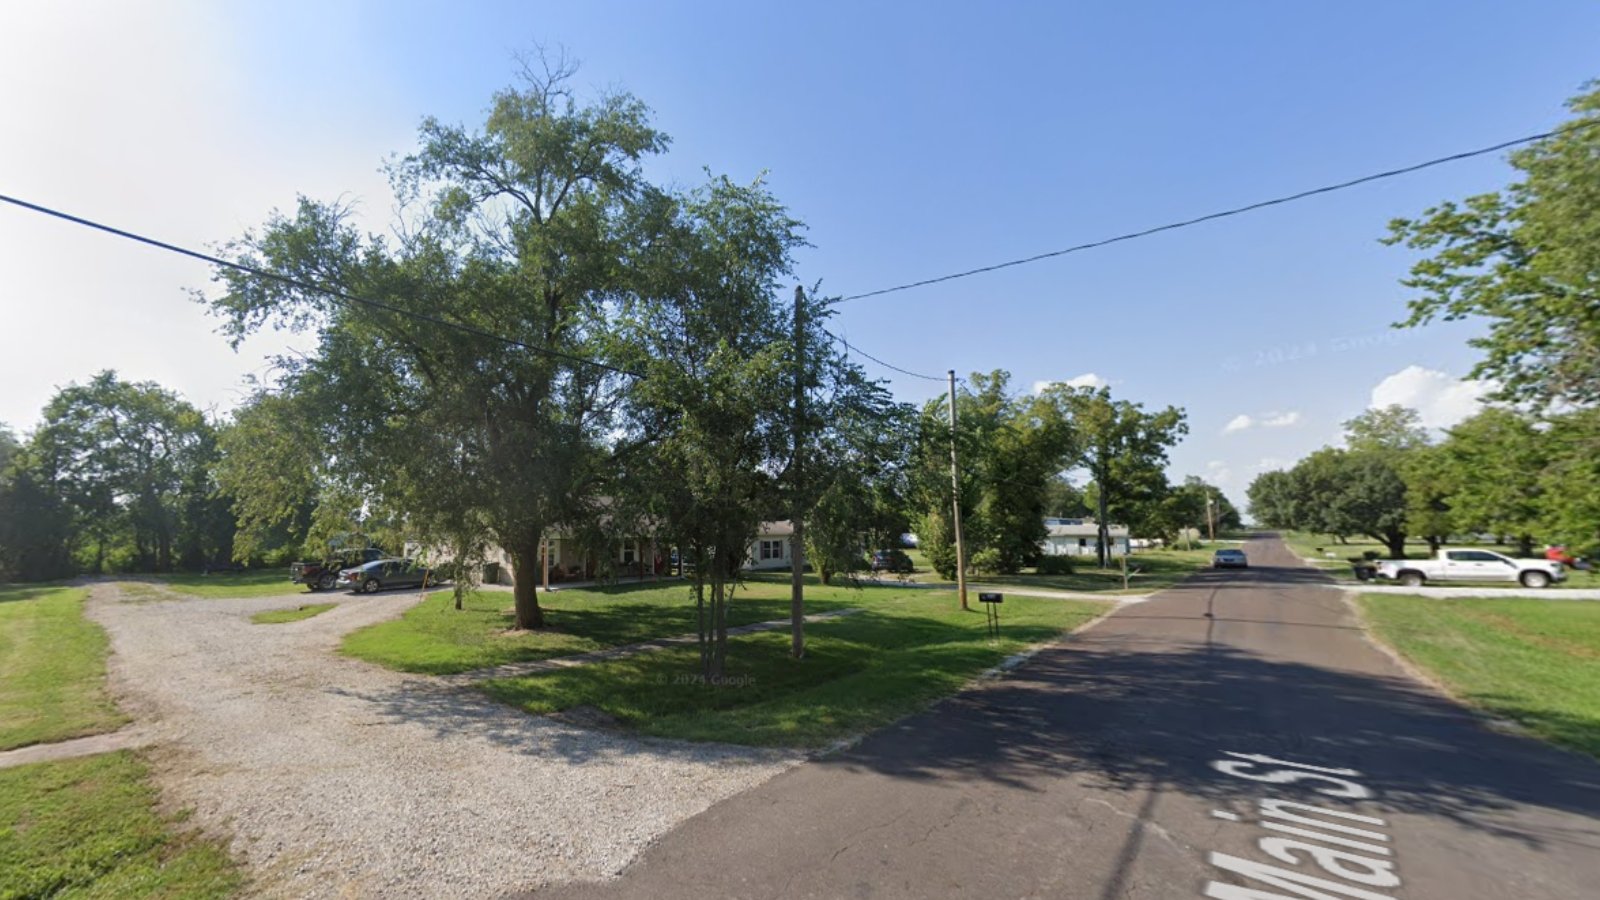
Baldwin City – Historic Charm With Modern Appeal
Baldwin City, nestled in Douglas County, blends small-town living with rich academic and cultural roots. Home to Baker University, the oldest four-year university in Kansas, the town benefits from a strong community identity and a walkable core with local shops and amenities.
The post-2020 housing boom hit Baldwin hard—in a good way. Prices jumped more than $50K in 2021 alone. With newer developments and proximity to Lawrence and the KC metro, demand has stayed strong. Despite its rise in price, Baldwin City still offers relatively good value given its location and character.
27. Andale – 80% Home Price Increase Since 2010
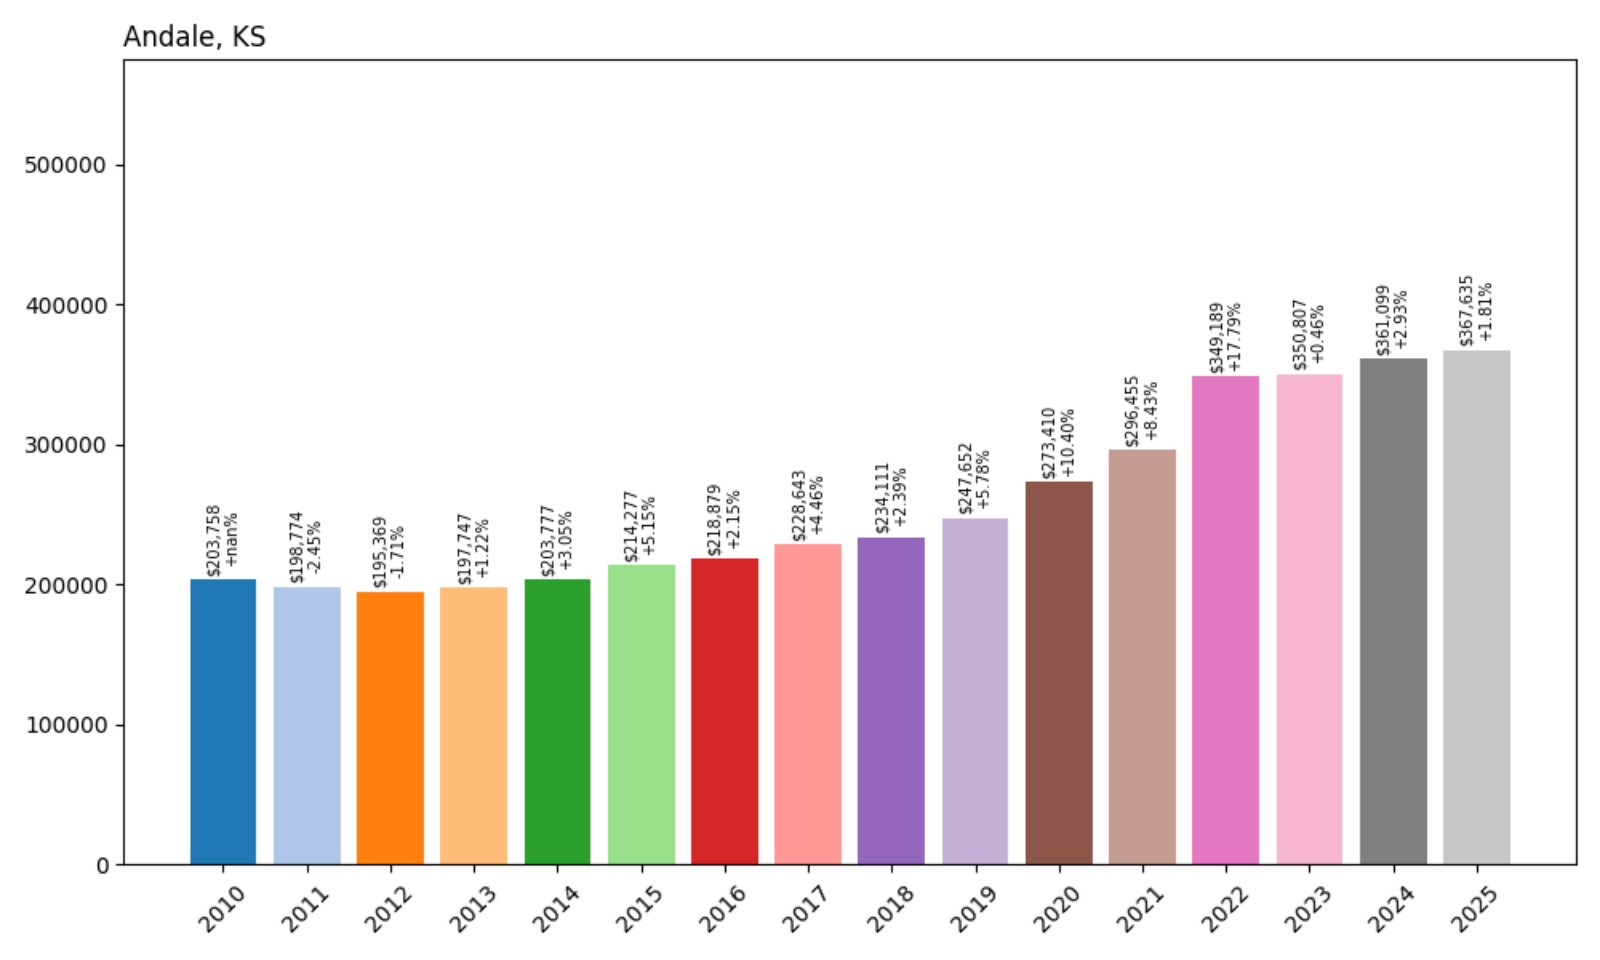
- 2010: $203,758
- 2011: $198,774 (−$4,984, −2.45% from previous year)
- 2012: $195,369 (−$3,405, −1.71% from previous year)
- 2013: $197,747 (+$2,378, +1.22% from previous year)
- 2014: $203,777 (+$6,030, +3.05% from previous year)
- 2015: $214,277 (+$10,501, +5.15% from previous year)
- 2016: $218,879 (+$4,602, +2.15% from previous year)
- 2017: $228,643 (+$9,764, +4.46% from previous year)
- 2018: $234,111 (+$5,467, +2.39% from previous year)
- 2019: $247,652 (+$13,541, +5.78% from previous year)
- 2020: $273,410 (+$25,758, +10.40% from previous year)
- 2021: $296,455 (+$23,045, +8.43% from previous year)
- 2022: $349,189 (+$52,734, +17.79% from previous year)
- 2023: $350,807 (+$1,617, +0.46% from previous year)
- 2024: $361,099 (+$10,292, +2.93% from previous year)
- 2025: $367,635 (+$6,536, +1.81% from previous year)
Andale’s home prices have risen 80% since 2010, ending at $367,635 in July 2025. After two small declines in the early 2010s, prices began a steady climb that accelerated dramatically in 2022. While appreciation has cooled, the market remains strong overall.
Andale – Small-Town Stability Meets Price Momentum
Located in Sedgwick County just west of Wichita, Andale has remained a small but appealing option for buyers seeking affordability and quiet living. The town’s housing market stayed modest for many years, but demand surged after 2020—particularly in 2022 with nearly an 18% jump.
With new homes and a solid school district, Andale is gaining interest from families priced out of the metro core. Though it lacks the flash of larger suburbs, its prices now rival some better-known markets, showing how broad the housing boom has reached across Kansas.
26. Tonganoxie – 151% Home Price Increase Since 2010
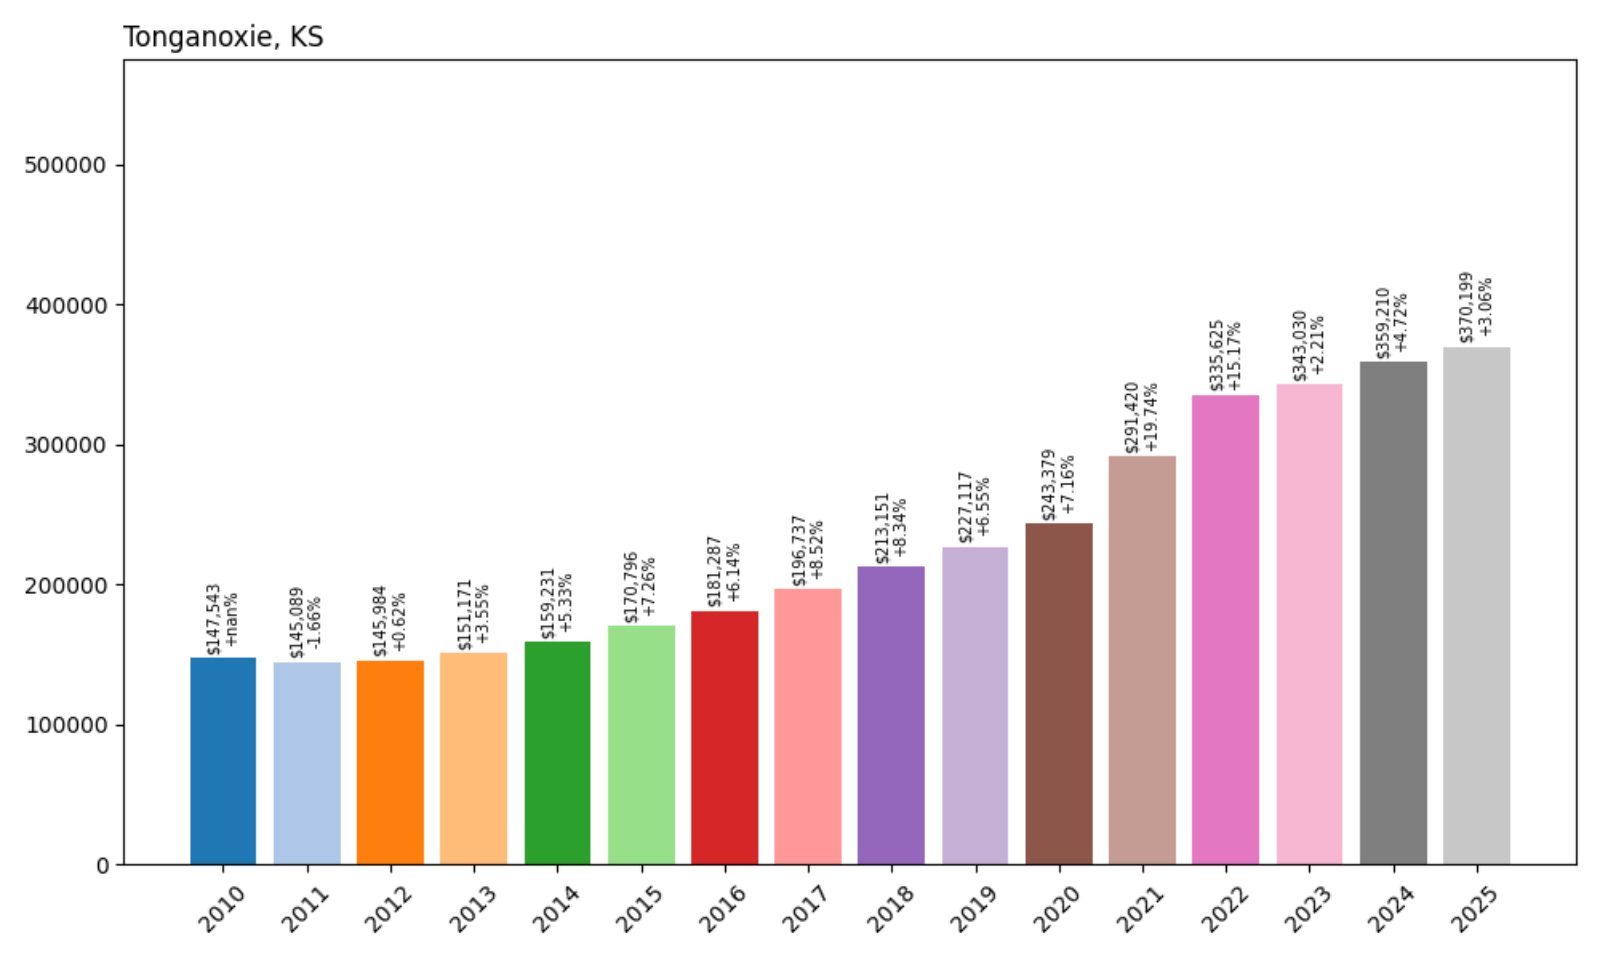
- 2010: $147,543
- 2011: $145,089 (−$2,454, −1.66% from previous year)
- 2012: $145,984 (+$895, +0.62% from previous year)
- 2013: $151,171 (+$5,187, +3.55% from previous year)
- 2014: $159,231 (+$8,060, +5.33% from previous year)
- 2015: $170,796 (+$11,564, +7.26% from previous year)
- 2016: $181,287 (+$10,491, +6.14% from previous year)
- 2017: $196,737 (+$15,450, +8.52% from previous year)
- 2018: $213,151 (+$16,414, +8.34% from previous year)
- 2019: $227,117 (+$13,966, +6.55% from previous year)
- 2020: $243,379 (+$16,262, +7.16% from previous year)
- 2021: $291,420 (+$48,042, +19.74% from previous year)
- 2022: $335,625 (+$44,205, +15.17% from previous year)
- 2023: $343,030 (+$7,405, +2.21% from previous year)
- 2024: $359,210 (+$16,181, +4.72% from previous year)
- 2025: $370,199 (+$10,988, +3.06% from previous year)
Since 2010, Tonganoxie home prices have increased by 151%, from $147,543 to $370,199. The biggest gains happened after 2020, including a near-20% leap in 2021. That momentum has continued, albeit more moderately, in recent years.
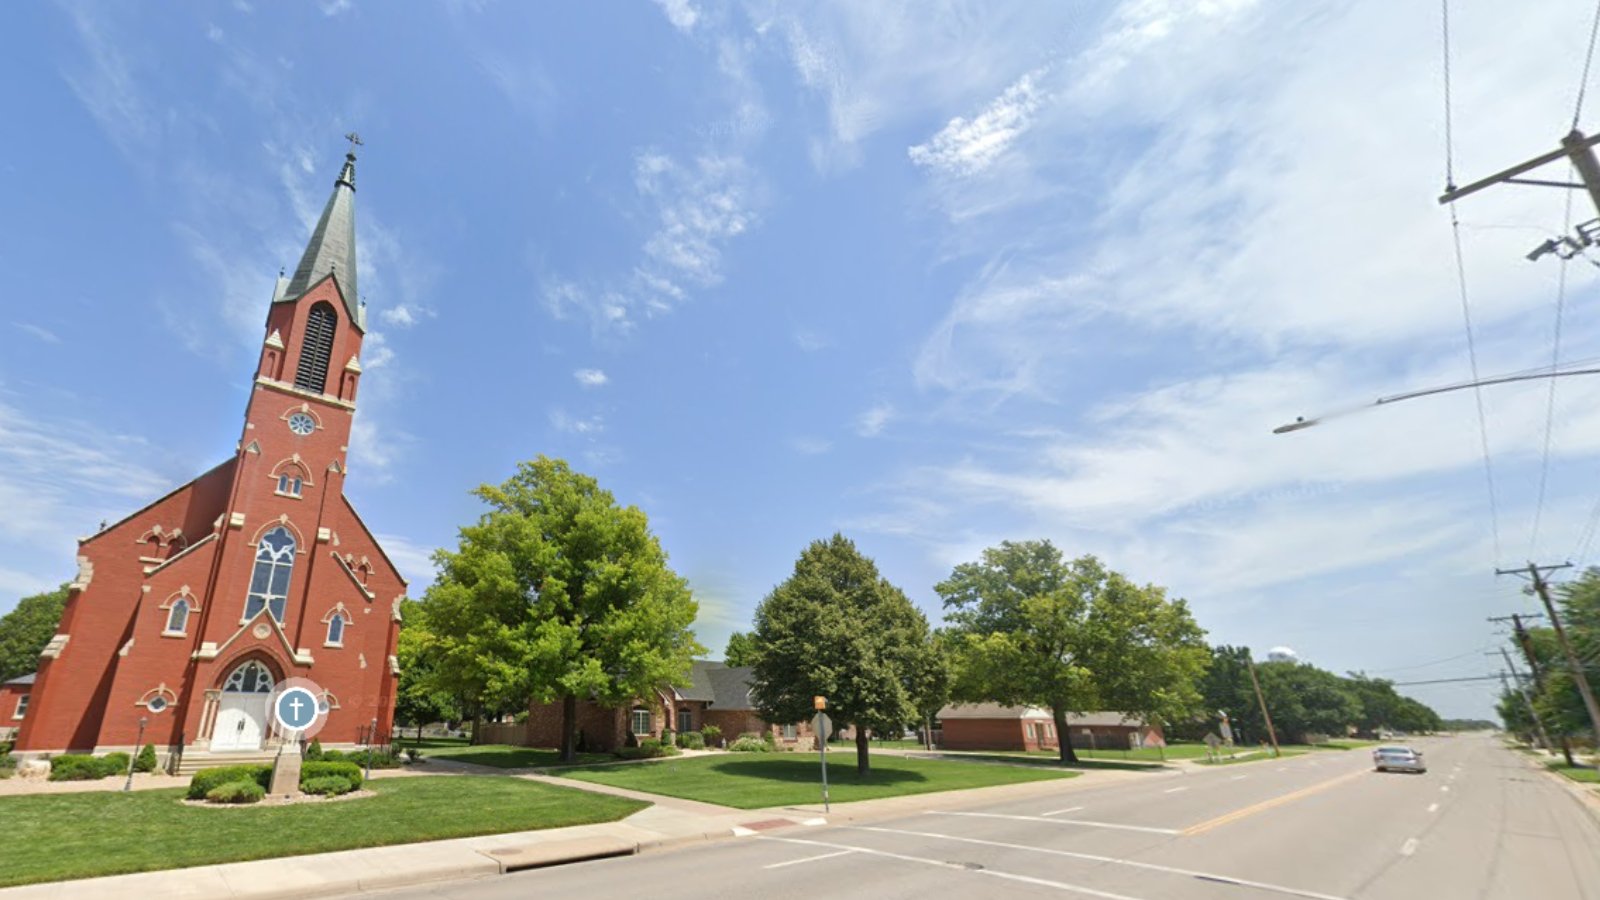
Tonganoxie – Big Jumps, Small-Town Feel
Located in Leavenworth County, Tonganoxie offers a mix of rural charm and easy access to Kansas City. Once overlooked, the town has seen increased demand as buyers look for value outside urban centers. With new developments and infrastructure improvements, its profile has grown.
Housing values here reflect that change. A 20% bump in 2021 points to pandemic-era demand, and recent years show that growth hasn’t stalled. The 2025 median value of $370,199 places it solidly among the state’s priciest towns—yet it retains a friendly, small-town character.
25. Paola – 150% Home Price Increase Since 2010
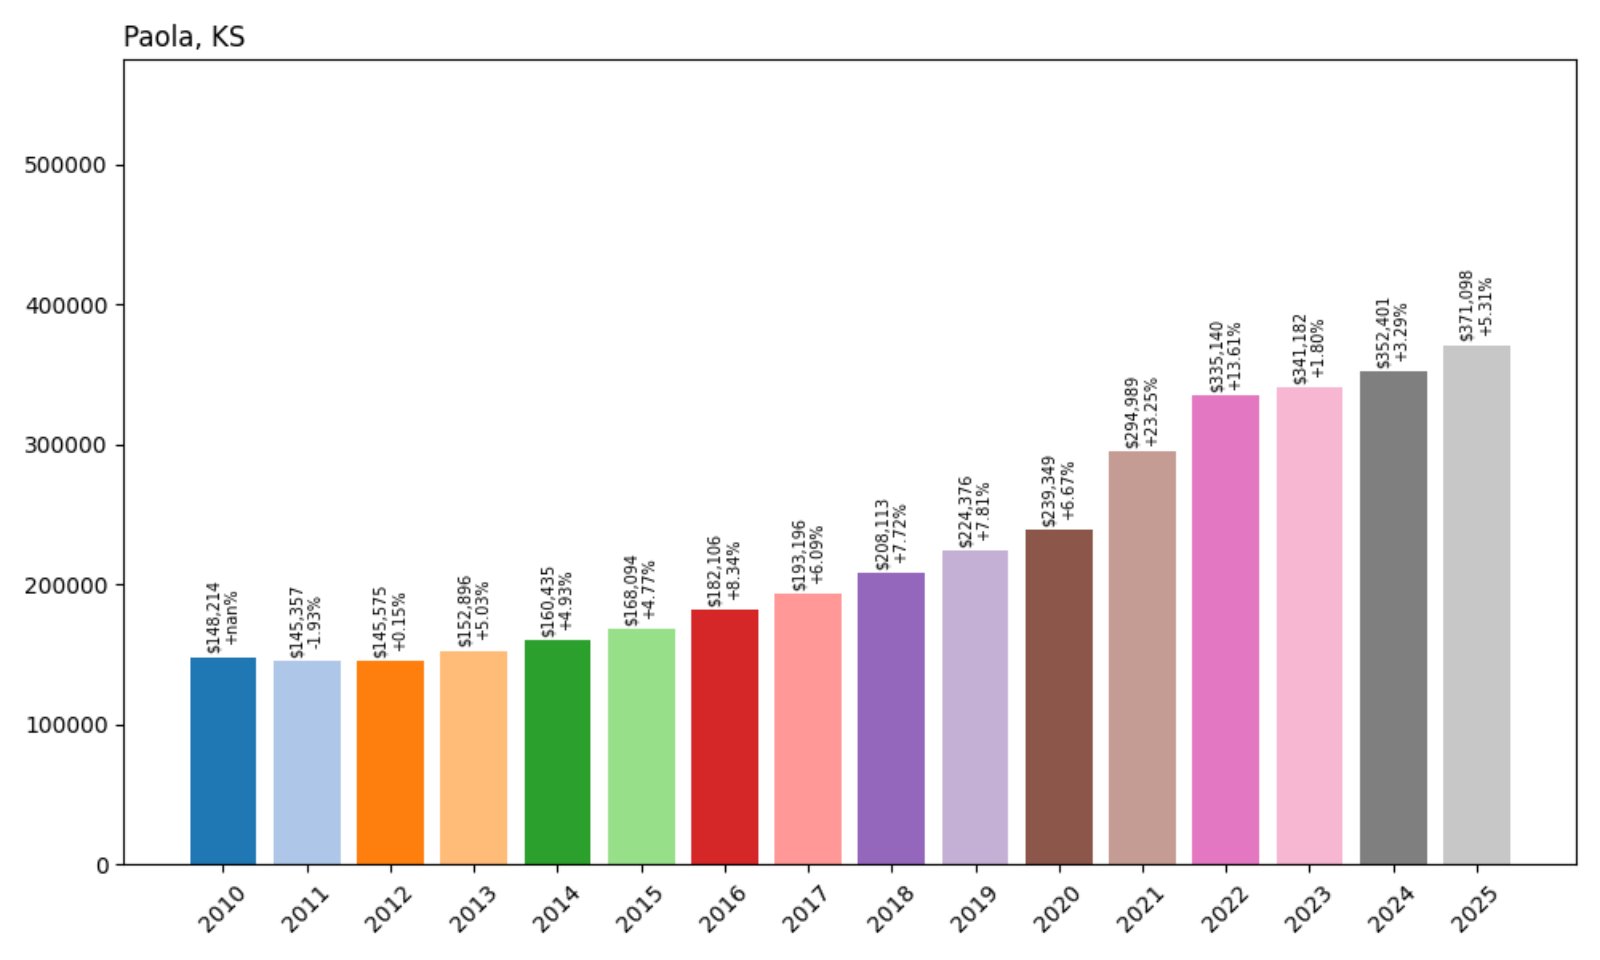
- 2010: $148,214
- 2011: $145,357 (−$2,858, −1.93% from previous year)
- 2012: $145,575 (+$219, +0.15% from previous year)
- 2013: $152,896 (+$7,321, +5.03% from previous year)
- 2014: $160,435 (+$7,539, +4.93% from previous year)
- 2015: $168,094 (+$7,659, +4.77% from previous year)
- 2016: $182,106 (+$14,012, +8.34% from previous year)
- 2017: $193,196 (+$11,090, +6.09% from previous year)
- 2018: $208,113 (+$14,917, +7.72% from previous year)
- 2019: $224,376 (+$16,263, +7.81% from previous year)
- 2020: $239,349 (+$14,973, +6.67% from previous year)
- 2021: $294,989 (+$55,640, +23.25% from previous year)
- 2022: $335,140 (+$40,151, +13.61% from previous year)
- 2023: $341,182 (+$6,042, +1.80% from previous year)
- 2024: $352,401 (+$11,219, +3.29% from previous year)
- 2025: $371,098 (+$18,698, +5.31% from previous year)
Home prices in Paola have grown by 150% since 2010, with the average home increasing from $148K to more than $371K. Most of the appreciation came after 2020, including a 23% surge in 2021 and continued gains even into 2025.
Paola – Fast Growth in a Classic Kansas Town
Paola, located in Miami County about 40 miles south of Kansas City, blends historic charm with modern suburban appeal. Its classic town square and family-friendly feel attract both long-time residents and newcomers looking for space and affordability—at least compared to urban prices.
The biggest home price gains came during the post-pandemic boom, as demand for suburban housing exploded. Strong annual growth continued into 2025, with a healthy 5.31% uptick. Paola’s housing market reflects both its regional appeal and the limited inventory driving up values across the state.
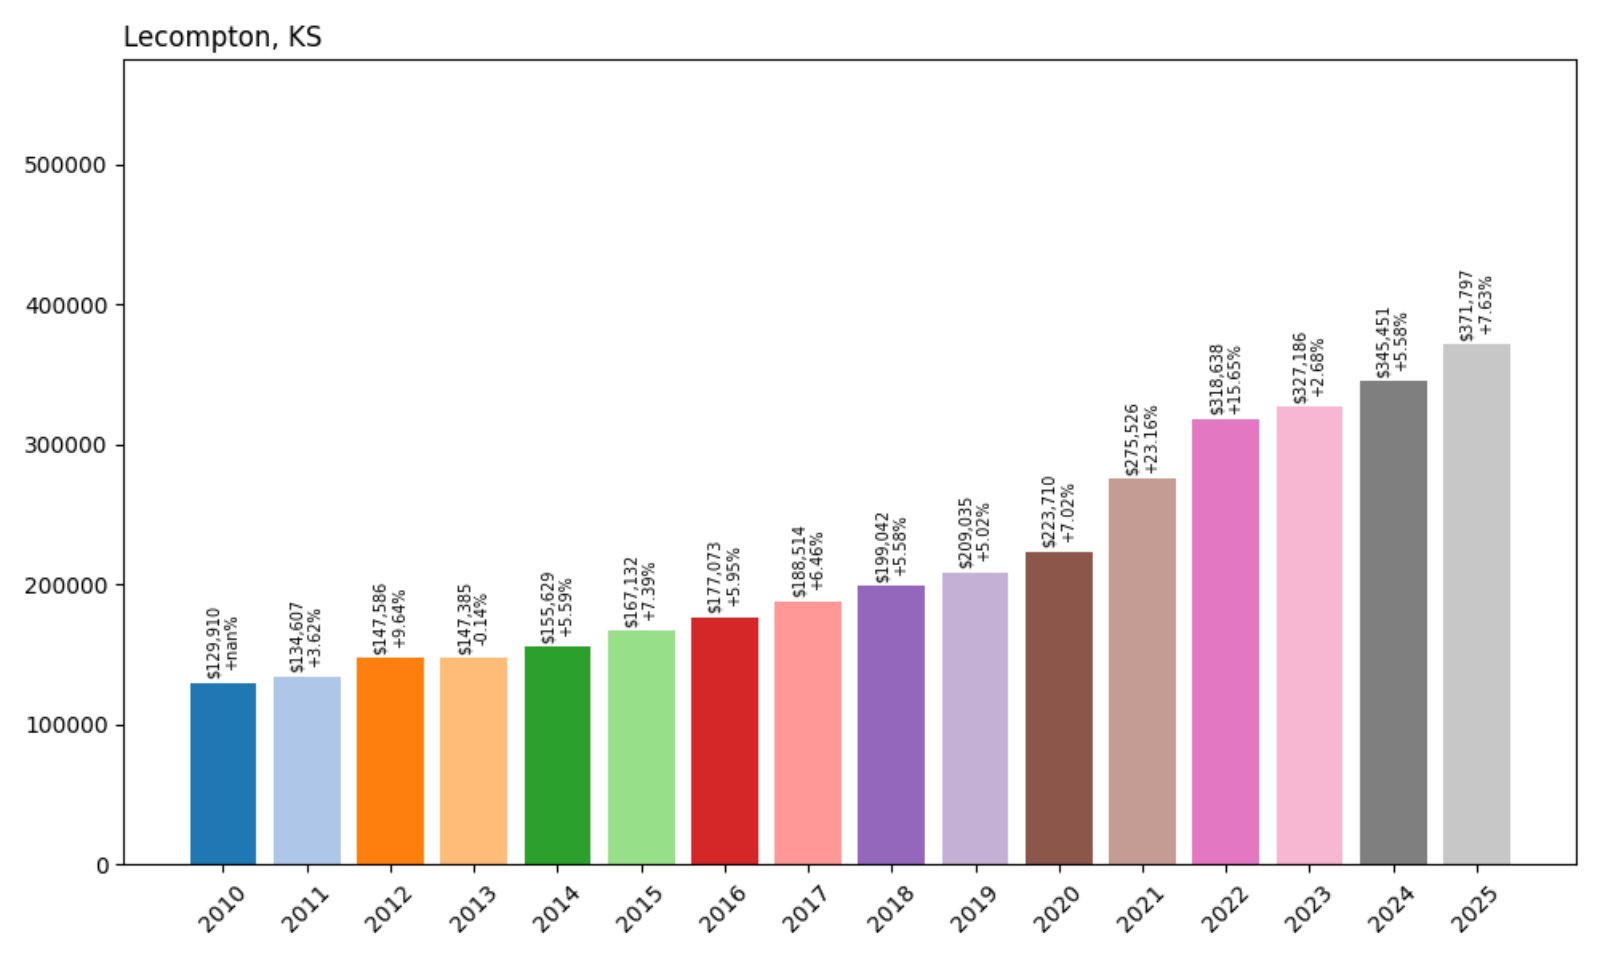
24. Lecompton – 186% Home Price Increase Since 2010
🔥 Would you like to save this?
- 2010: $129,910
- 2011: $134,607 (+$4,698, +3.62% from previous year)
- 2012: $147,586 (+$12,979, +9.64% from previous year)
- 2013: $147,385 (−$201, −0.14% from previous year)
- 2014: $155,629 (+$8,244, +5.59% from previous year)
- 2015: $167,132 (+$11,502, +7.39% from previous year)
- 2016: $177,073 (+$9,941, +5.95% from previous year)
- 2017: $188,514 (+$11,441, +6.46% from previous year)
- 2018: $199,042 (+$10,528, +5.58% from previous year)
- 2019: $209,035 (+$9,993, +5.02% from previous year)
- 2020: $223,710 (+$14,675, +7.02% from previous year)
- 2021: $275,526 (+$51,816, +23.16% from previous year)
- 2022: $318,638 (+$43,112, +15.65% from previous year)
- 2023: $327,186 (+$8,548, +2.68% from previous year)
- 2024: $345,451 (+$18,264, +5.58% from previous year)
- 2025: $371,797 (+$26,347, +7.63% from previous year)
Lecompton’s home values have more than doubled—up 186%—since 2010. Values climbed steadily in the early 2010s, then took off after 2020. The past two years alone added more than $50K to the average home price.
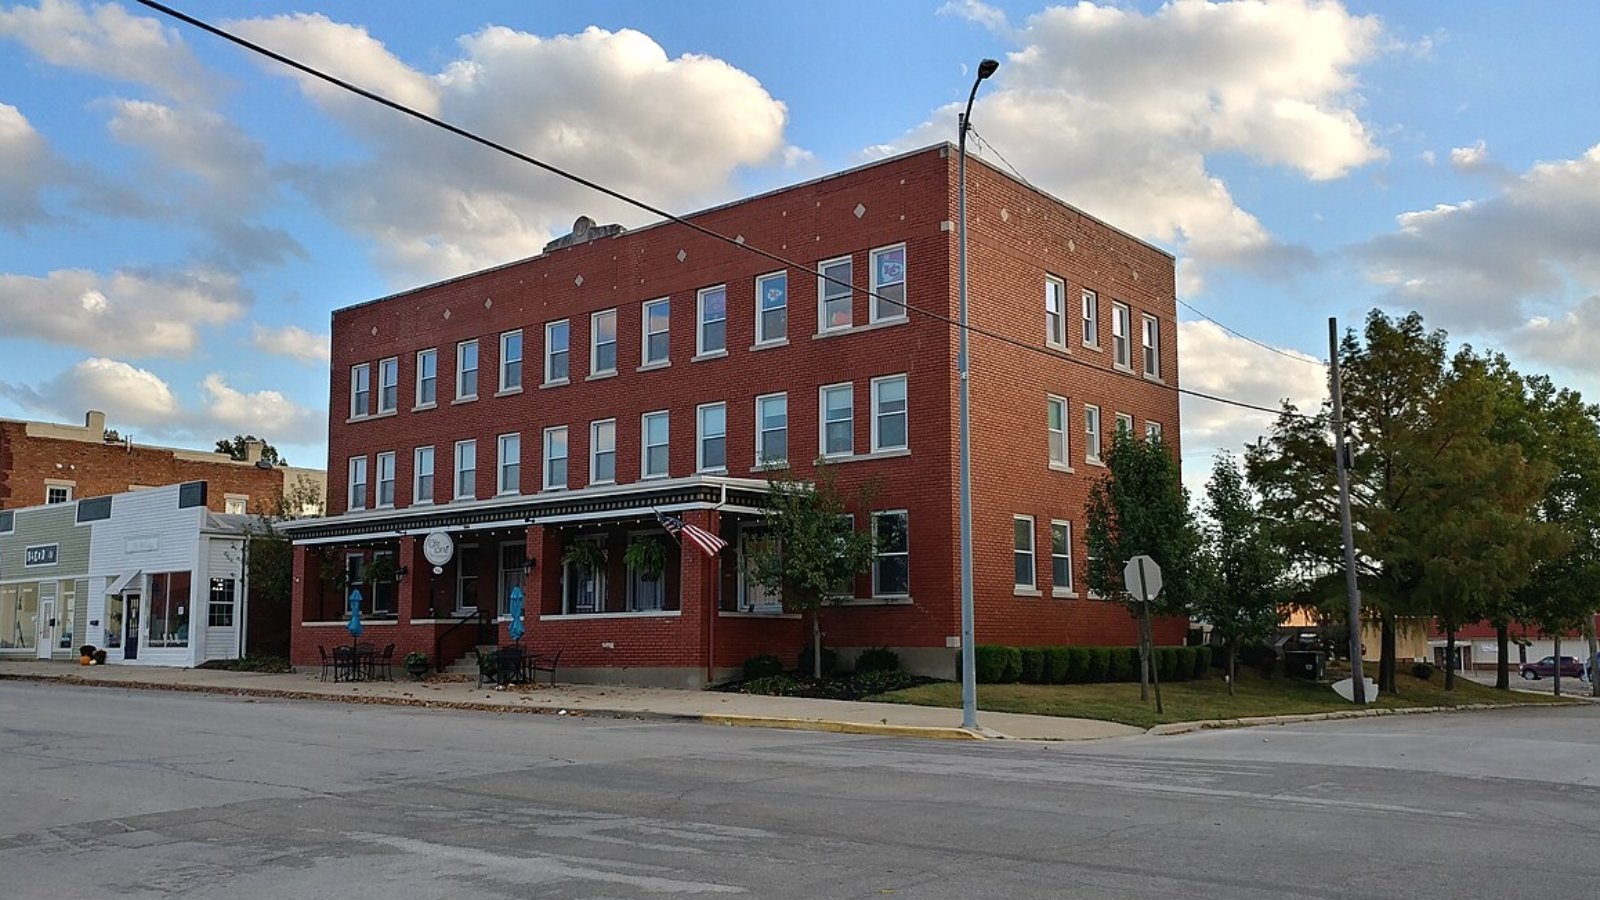
Lecompton – Historic Roots, Rising Prices
Lecompton is a small town on the Kansas River with deep historical significance—it was once in the running to be the state capital. Today, it’s a quiet spot in Douglas County, not far from Lawrence, that has steadily gained popularity for buyers seeking more house for the money.
After years of slow, reliable growth, the 2020s saw Lecompton surge in value. A 23% jump in 2021, followed by sustained double-digit gains, shows the town’s appeal is no longer a secret. Its rural setting, historic buildings, and proximity to job centers help fuel the demand.
23. Berryton – 121% Home Price Increase Since 2010
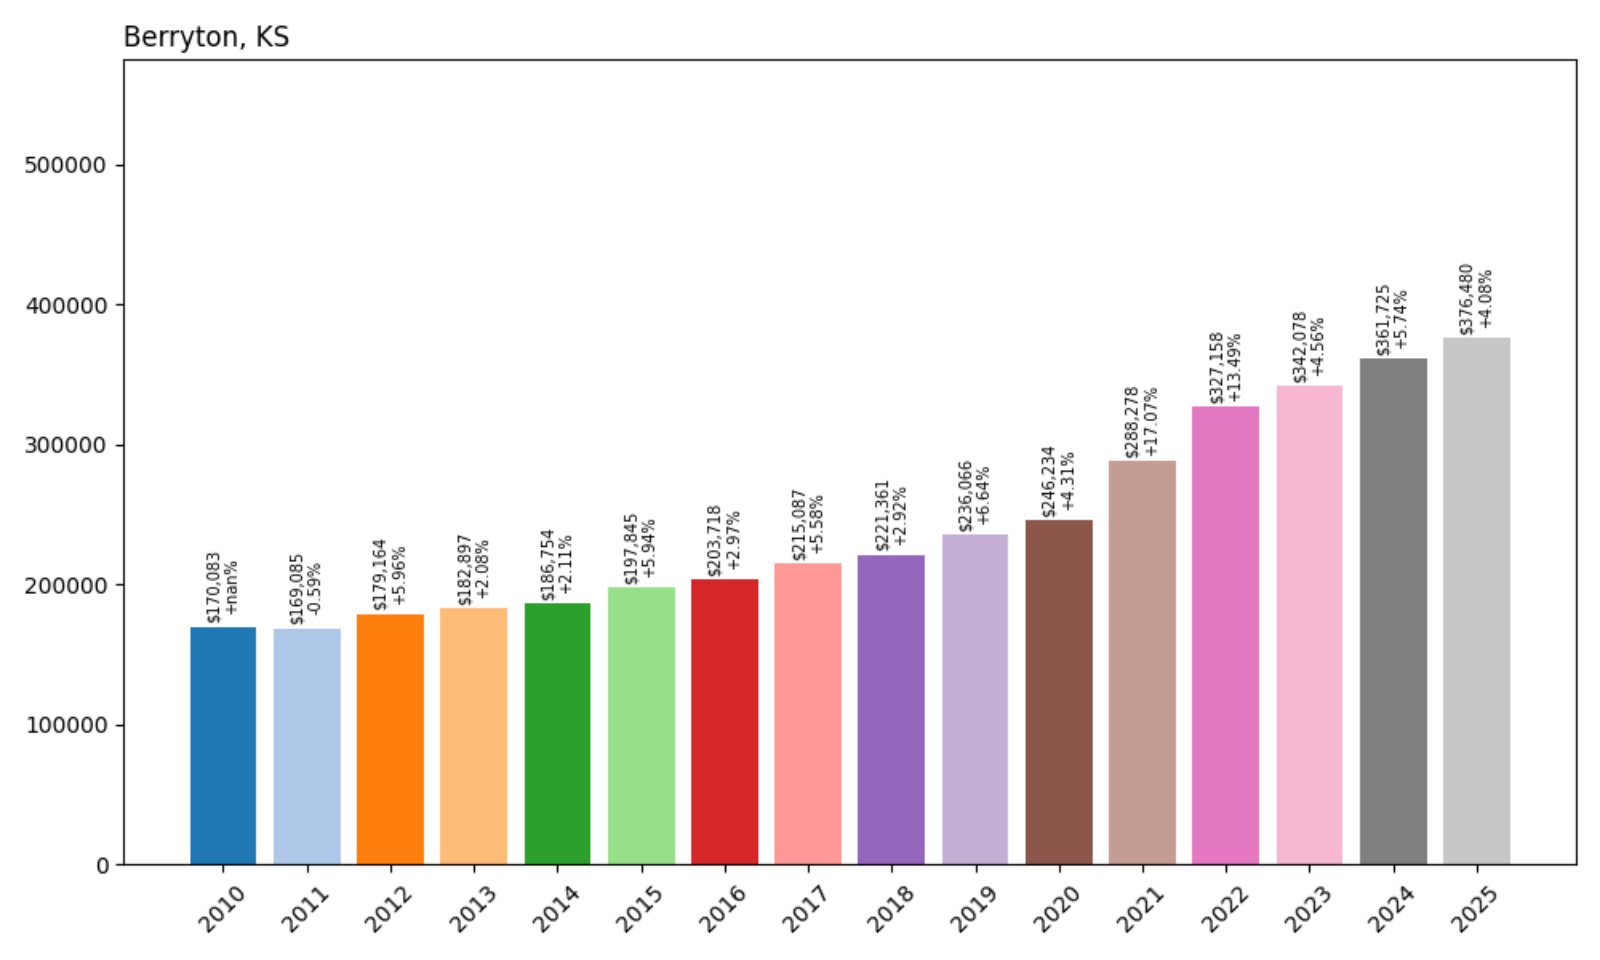
- 2010: $170,083
- 2011: $169,085 (−$999, −0.59% from previous year)
- 2012: $179,164 (+$10,079, +5.96% from previous year)
- 2013: $182,897 (+$3,733, +2.08% from previous year)
- 2014: $186,754 (+$3,857, +2.11% from previous year)
- 2015: $197,845 (+$11,092, +5.94% from previous year)
- 2016: $203,718 (+$5,873, +2.97% from previous year)
- 2017: $215,087 (+$11,369, +5.58% from previous year)
- 2018: $221,361 (+$6,274, +2.92% from previous year)
- 2019: $236,066 (+$14,706, +6.64% from previous year)
- 2020: $246,234 (+$10,167, +4.31% from previous year)
- 2021: $288,278 (+$42,044, +17.07% from previous year)
- 2022: $327,158 (+$38,880, +13.49% from previous year)
- 2023: $342,078 (+$14,921, +4.56% from previous year)
- 2024: $361,725 (+$19,647, +5.74% from previous year)
- 2025: $376,480 (+$14,755, +4.08% from previous year)
Berryton home values increased by 121% from 2010 to 2025. The largest jumps happened in 2021 and 2022, with values rising by nearly $81,000 across those two years. Growth has remained solid through 2025.
Berryton – Quiet Growth in a Rural Community
Berryton is an unincorporated community just southeast of Topeka. Though small, its location has helped drive demand as buyers search for homes in low-density, peaceful settings while staying near employment hubs.
Price appreciation has been especially impressive since 2020, with a 17% gain in 2021 and a 13% jump in 2022. Recent years have seen more moderate growth, but the town’s upward trend continues. With its balance of rural calm and suburban access, Berryton offers a lifestyle that’s increasingly in demand.
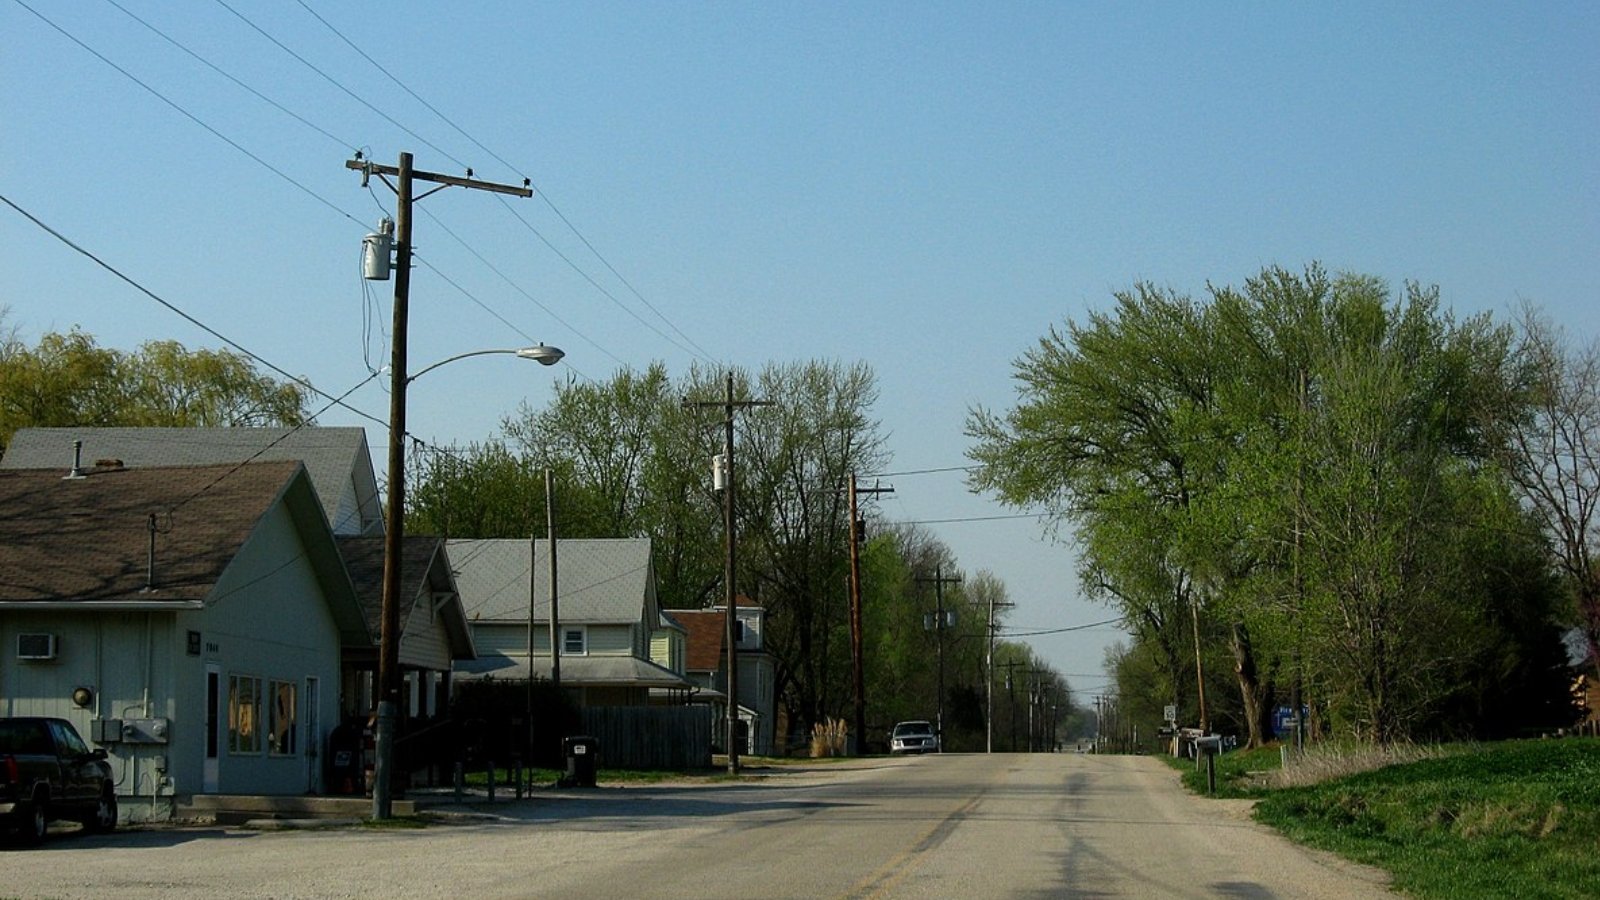
22. Saint George – 84% Home Price Increase Since 2010
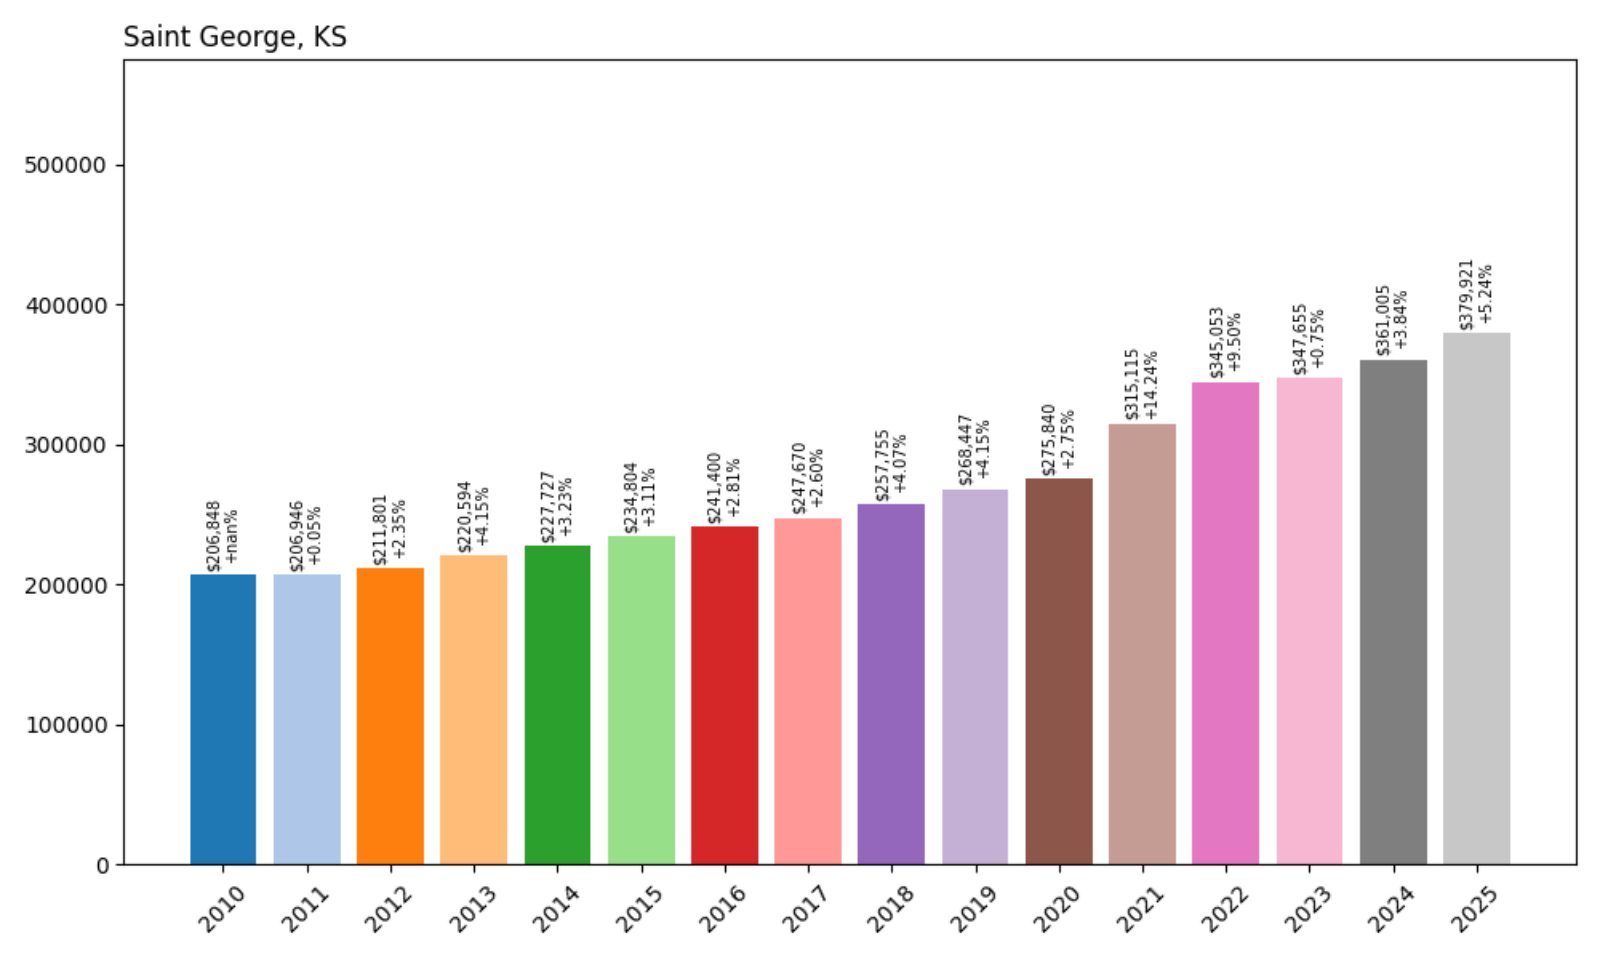
- 2010: $206,848
- 2011: $206,946 (+$98, +0.05% from previous year)
- 2012: $211,801 (+$4,855, +2.35% from previous year)
- 2013: $220,594 (+$8,793, +4.15% from previous year)
- 2014: $227,727 (+$7,133, +3.23% from previous year)
- 2015: $234,804 (+$7,077, +3.11% from previous year)
- 2016: $241,400 (+$6,596, +2.81% from previous year)
- 2017: $247,670 (+$6,271, +2.60% from previous year)
- 2018: $257,755 (+$10,084, +4.07% from previous year)
- 2019: $268,447 (+$10,692, +4.15% from previous year)
- 2020: $275,840 (+$7,393, +2.75% from previous year)
- 2021: $315,115 (+$39,274, +14.24% from previous year)
- 2022: $345,053 (+$29,938, +9.50% from previous year)
- 2023: $347,655 (+$2,602, +0.75% from previous year)
- 2024: $361,005 (+$13,350, +3.84% from previous year)
- 2025: $379,921 (+$18,916, +5.24% from previous year)
Since 2010, Saint George has seen home prices grow by 84%, with values reaching $379,921 in July 2025. Price appreciation was consistent through the 2010s, with a noticeable uptick in the post-2020 period.
Saint George – Strong Demand in a Small Market
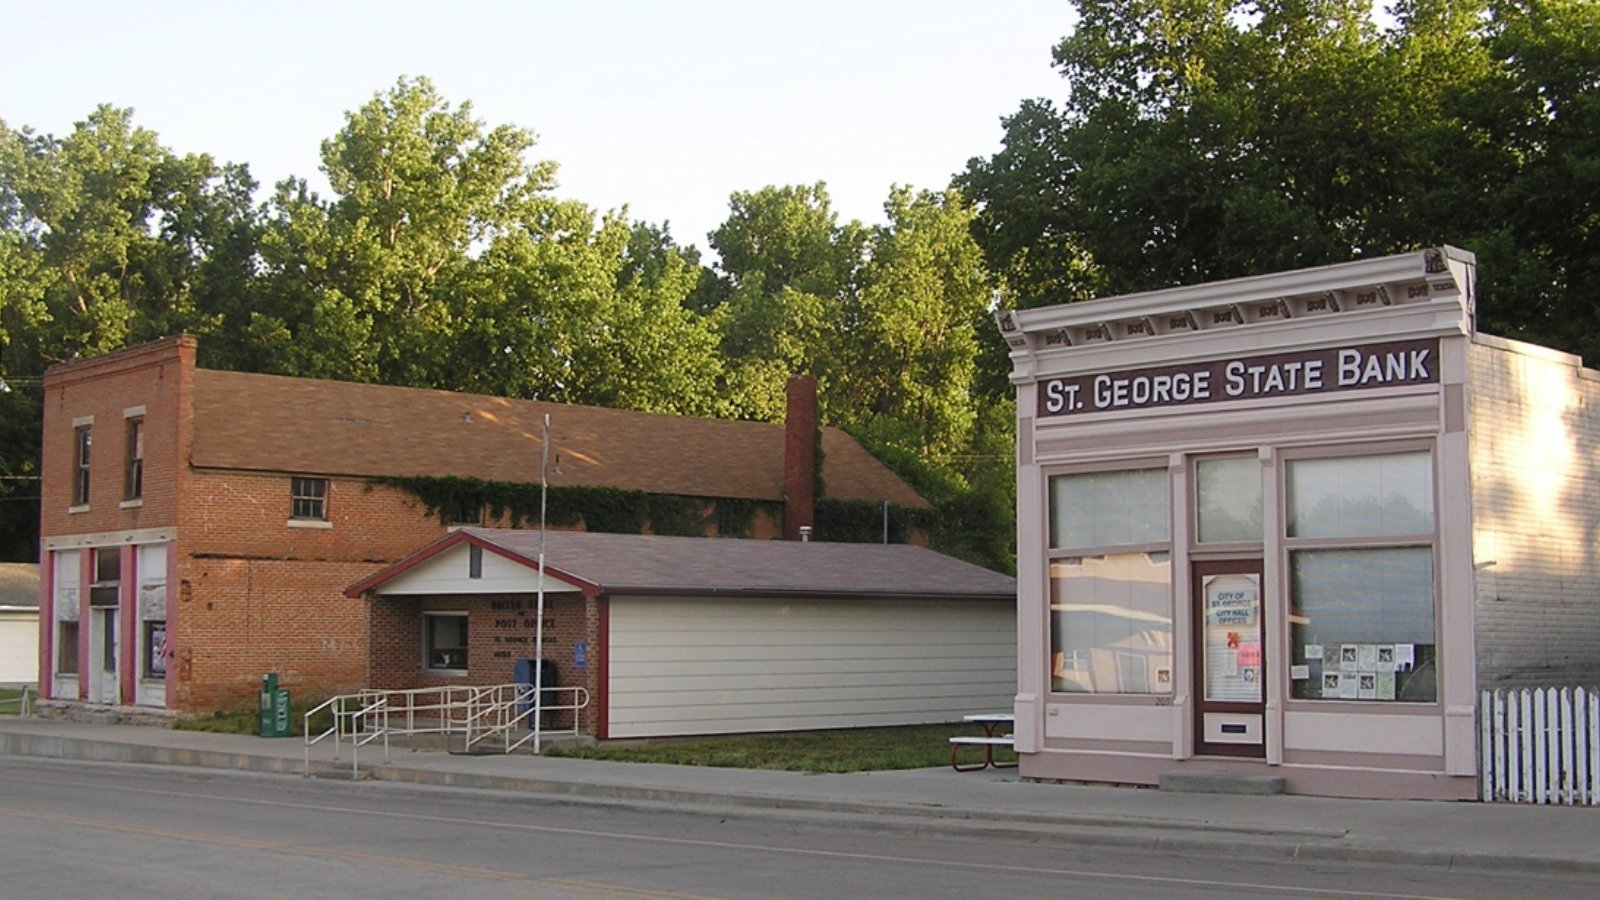
Saint George, located in Pottawatomie County near Manhattan, has seen a steady rise in home values thanks to its appealing location, small-town character, and proximity to Kansas State University. While early years showed gradual growth, 2021 saw a double-digit jump as demand intensified.
The town remains small, but with new residential development and infrastructure improvements, it’s attracting more attention. Saint George offers a combination of affordability, growth potential, and location that makes it a compelling market in Kansas’s real estate landscape.
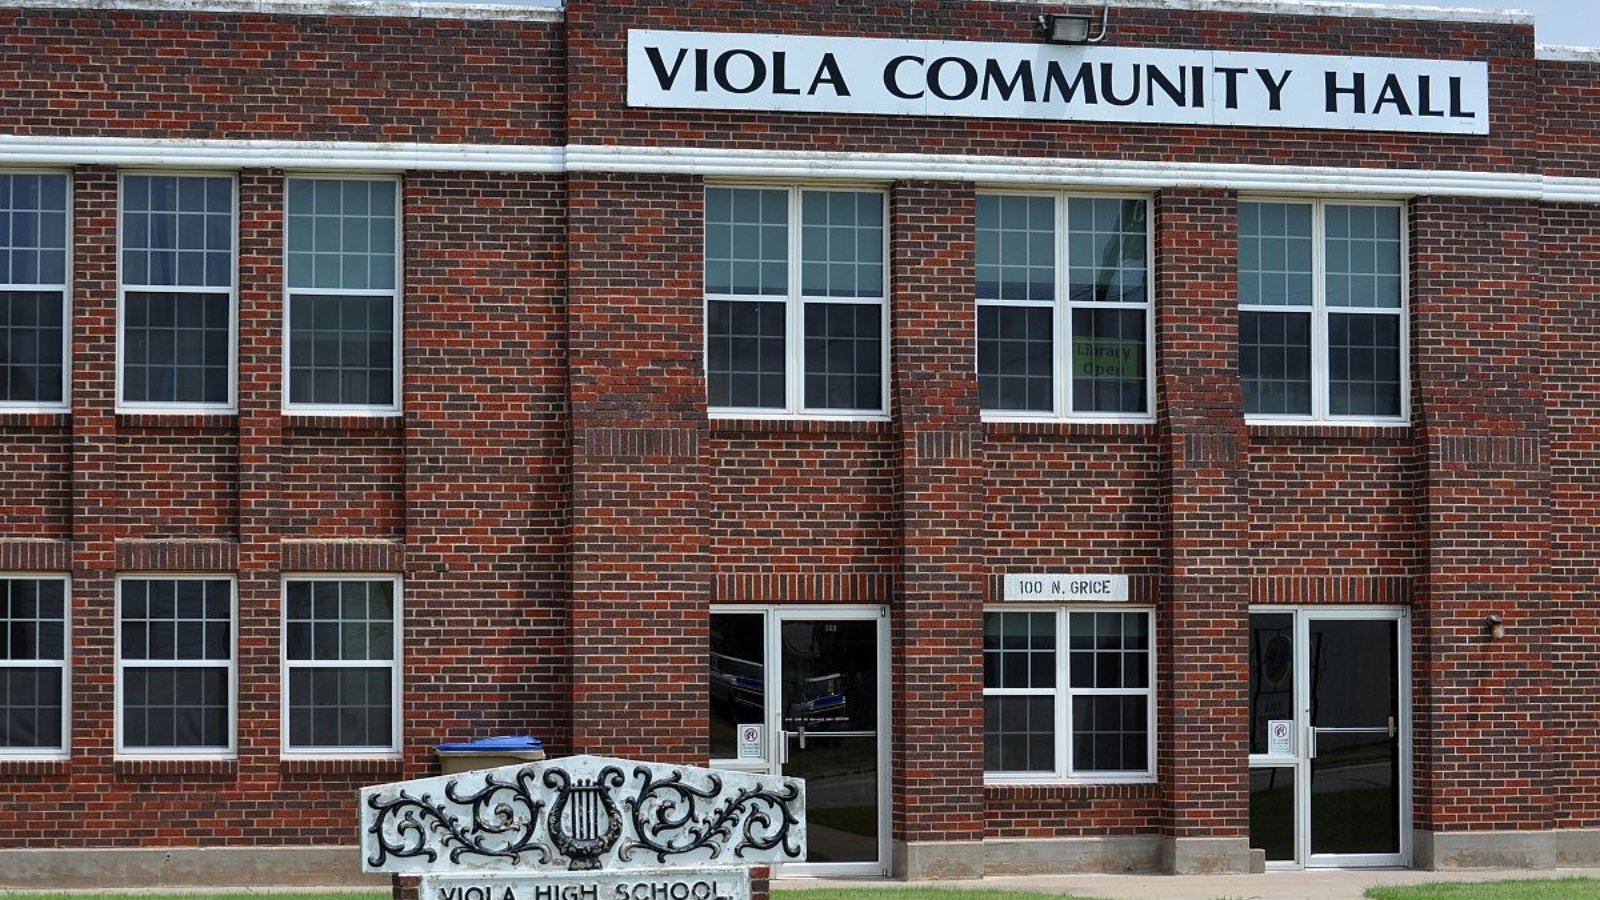
21. Viola – 124% Home Price Increase Since 2010
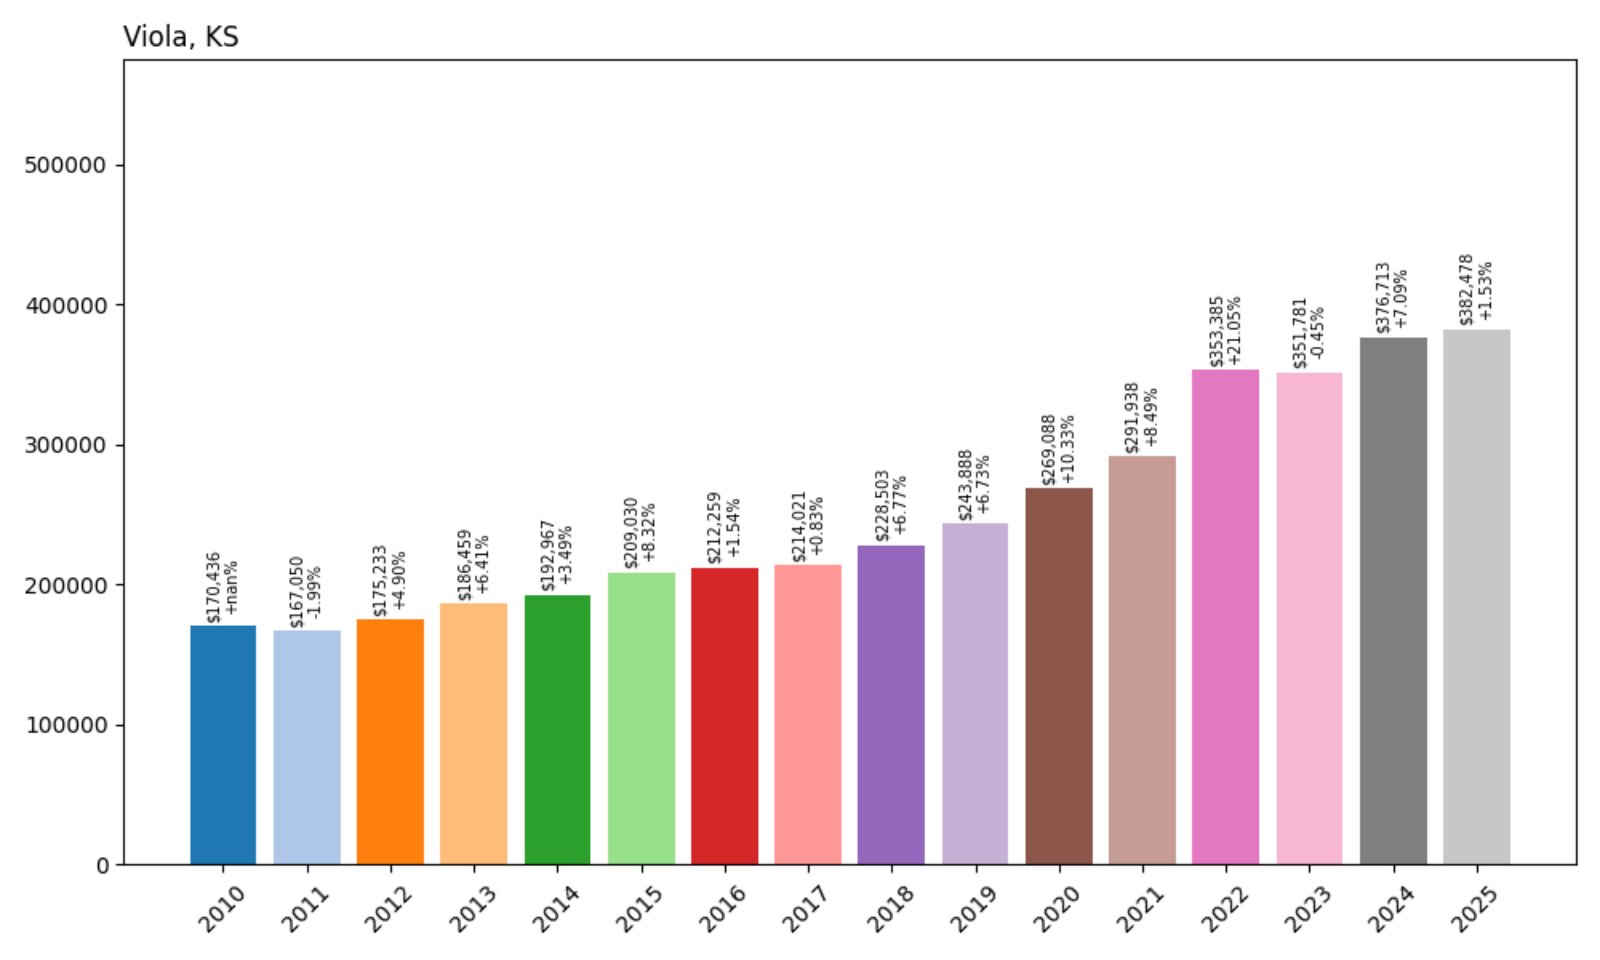
- 2010: $170,436
- 2011: $167,050 (−$3,386, −1.99% from previous year)
- 2012: $175,233 (+$8,184, +4.90% from previous year)
- 2013: $186,459 (+$11,226, +6.41% from previous year)
- 2014: $192,967 (+$6,508, +3.49% from previous year)
- 2015: $209,030 (+$16,063, +8.32% from previous year)
- 2016: $212,259 (+$3,228, +1.54% from previous year)
- 2017: $214,021 (+$1,762, +0.83% from previous year)
- 2018: $228,503 (+$14,482, +6.77% from previous year)
- 2019: $243,888 (+$15,386, +6.73% from previous year)
- 2020: $269,088 (+$25,200, +10.33% from previous year)
- 2021: $291,938 (+$22,851, +8.49% from previous year)
- 2022: $353,385 (+$61,447, +21.05% from previous year)
- 2023: $351,781 (−$1,604, −0.45% from previous year)
- 2024: $376,713 (+$24,932, +7.09% from previous year)
- 2025: $382,478 (+$5,765, +1.53% from previous year)
Viola has seen home prices more than double since 2010, rising from $170,436 to $382,478 in 2025—a 124% increase. Price growth was modest until 2020, after which appreciation accelerated dramatically.
Viola – A Rural Town With Rising Appeal
Viola, a small community in Sedgwick County, has benefitted from broader trends pushing buyers to look beyond city limits. With limited housing supply and increasing interest in rural living, values in Viola jumped 21% in 2022 alone.
Though 2023 showed a slight dip, values rebounded in 2024 and continued rising into 2025. As more Kansans prioritize privacy and land, towns like Viola are no longer flying under the radar. Its real estate market now reflects that shift.
20. Easton – 178% Home Price Increase Since 2010
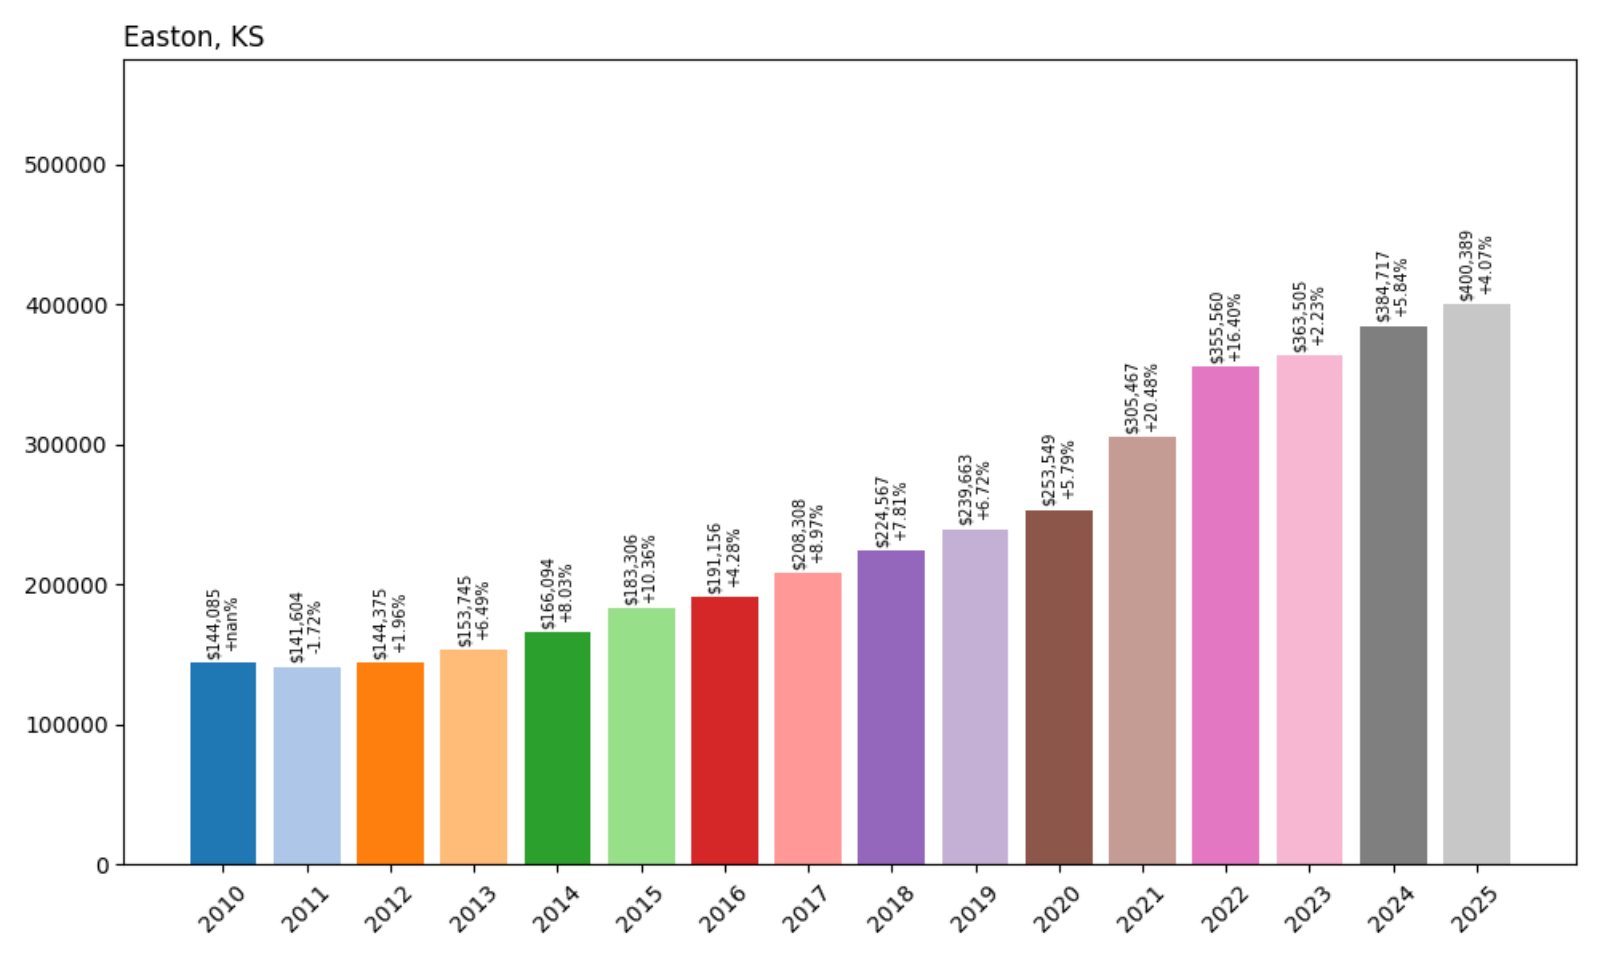
- 2010: $144,085
- 2011: $141,604 (−$2,481, −1.72% from previous year)
- 2012: $144,375 (+$2,771, +1.96% from previous year)
- 2013: $153,745 (+$9,370, +6.49% from previous year)
- 2014: $166,094 (+$12,350, +8.03% from previous year)
- 2015: $183,306 (+$17,211, +10.36% from previous year)
- 2016: $191,156 (+$7,850, +4.28% from previous year)
- 2017: $208,308 (+$17,152, +8.97% from previous year)
- 2018: $224,567 (+$16,259, +7.81% from previous year)
- 2019: $239,663 (+$15,096, +6.72% from previous year)
- 2020: $253,549 (+$13,886, +5.79% from previous year)
- 2021: $305,467 (+$51,918, +20.48% from previous year)
- 2022: $355,560 (+$50,092, +16.40% from previous year)
- 2023: $363,505 (+$7,945, +2.23% from previous year)
- 2024: $384,717 (+$21,212, +5.84% from previous year)
- 2025: $400,389 (+$15,672, +4.07% from previous year)
Home prices in Easton have surged by 178% since 2010, climbing from $144K to just over $400K in 2025. Growth has been especially dramatic since 2020, with prices rising by over $130K in just five years.
Easton – High Growth in a Low-Profile Market
Easton, located in Leavenworth County, offers rural quiet and modest density—an increasingly attractive combination. Its market had been building momentum throughout the 2010s, but the acceleration after 2020 highlights how demand for homes in less crowded areas exploded during the pandemic era.
With home values rising more than 20% in 2021 and continuing strongly through 2025, Easton shows how small communities have become unlikely hot spots. The consistent multi-year gains point to a market still in demand, even without the amenities of larger towns.
19. Louisburg – 135% Home Price Increase Since 2010
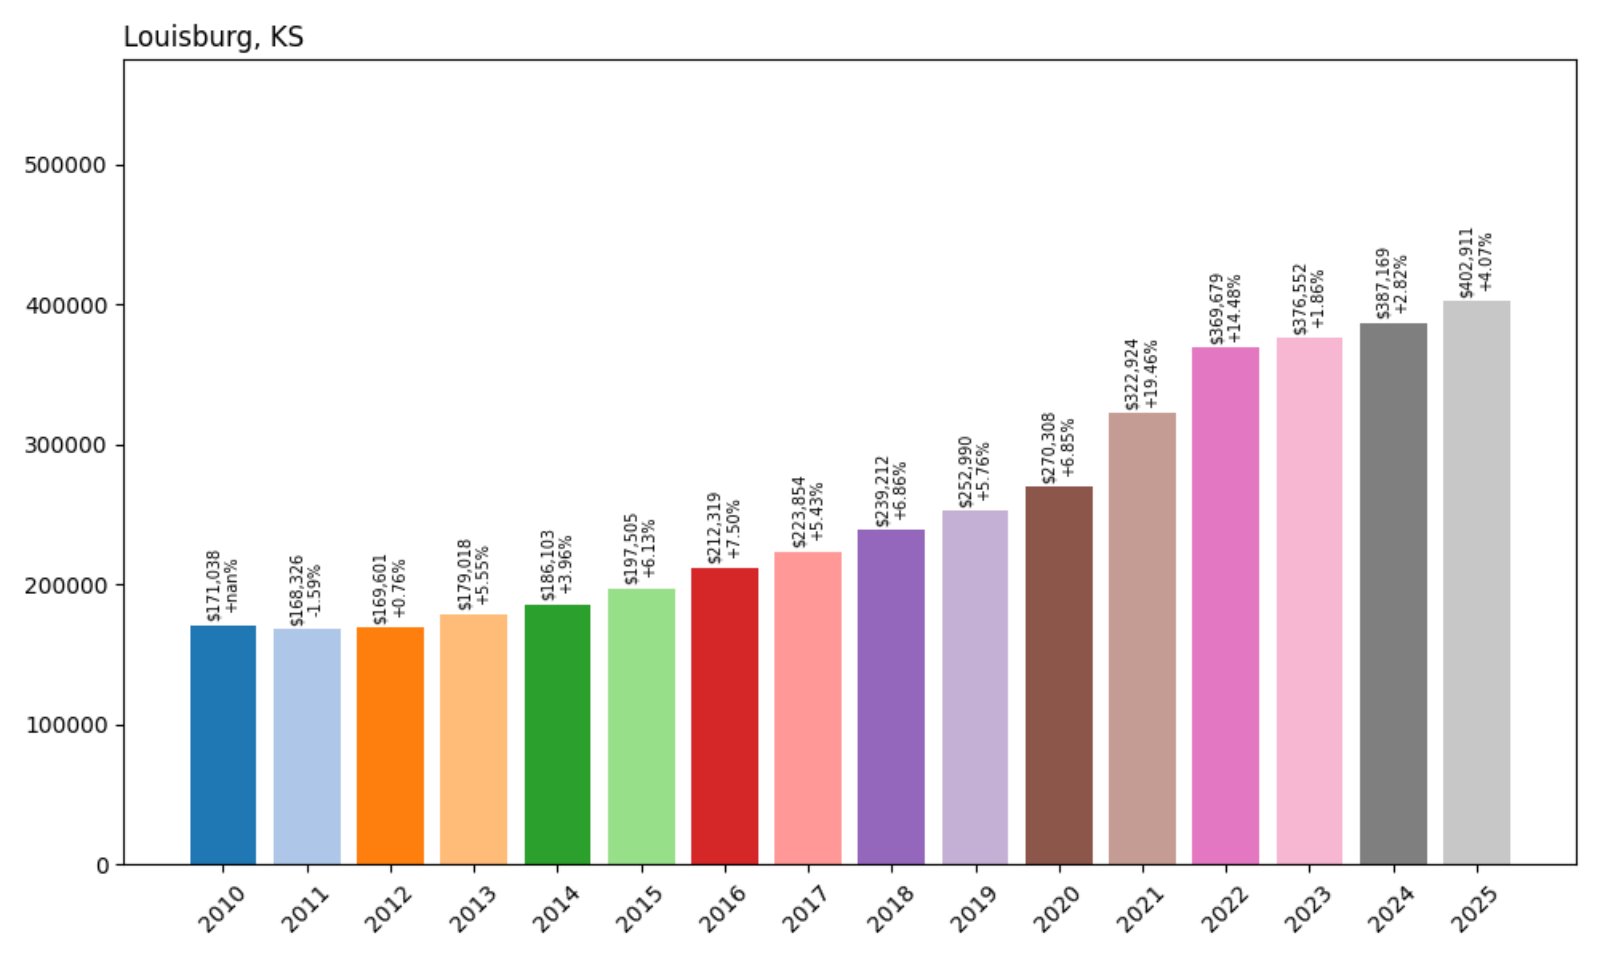
- 2010: $171,038
- 2011: $168,326 (−$2,712, −1.59% from previous year)
- 2012: $169,601 (+$1,274, +0.76% from previous year)
- 2013: $179,018 (+$9,418, +5.55% from previous year)
- 2014: $186,103 (+$7,085, +3.96% from previous year)
- 2015: $197,505 (+$11,402, +6.13% from previous year)
- 2016: $212,319 (+$14,813, +7.50% from previous year)
- 2017: $223,854 (+$11,536, +5.43% from previous year)
- 2018: $239,212 (+$15,358, +6.86% from previous year)
- 2019: $252,990 (+$13,778, +5.76% from previous year)
- 2020: $270,308 (+$17,318, +6.85% from previous year)
- 2021: $322,924 (+$52,615, +19.46% from previous year)
- 2022: $369,679 (+$46,755, +14.48% from previous year)
- 2023: $376,552 (+$6,873, +1.86% from previous year)
- 2024: $387,169 (+$10,616, +2.82% from previous year)
- 2025: $402,911 (+$15,743, +4.07% from previous year)
Louisburg’s average home price has jumped from $171K in 2010 to over $402K in 2025—a 135% increase. While early gains were modest, post-2020 growth was rapid and sustained.
Louisburg – A Top Suburban Choice in Miami County
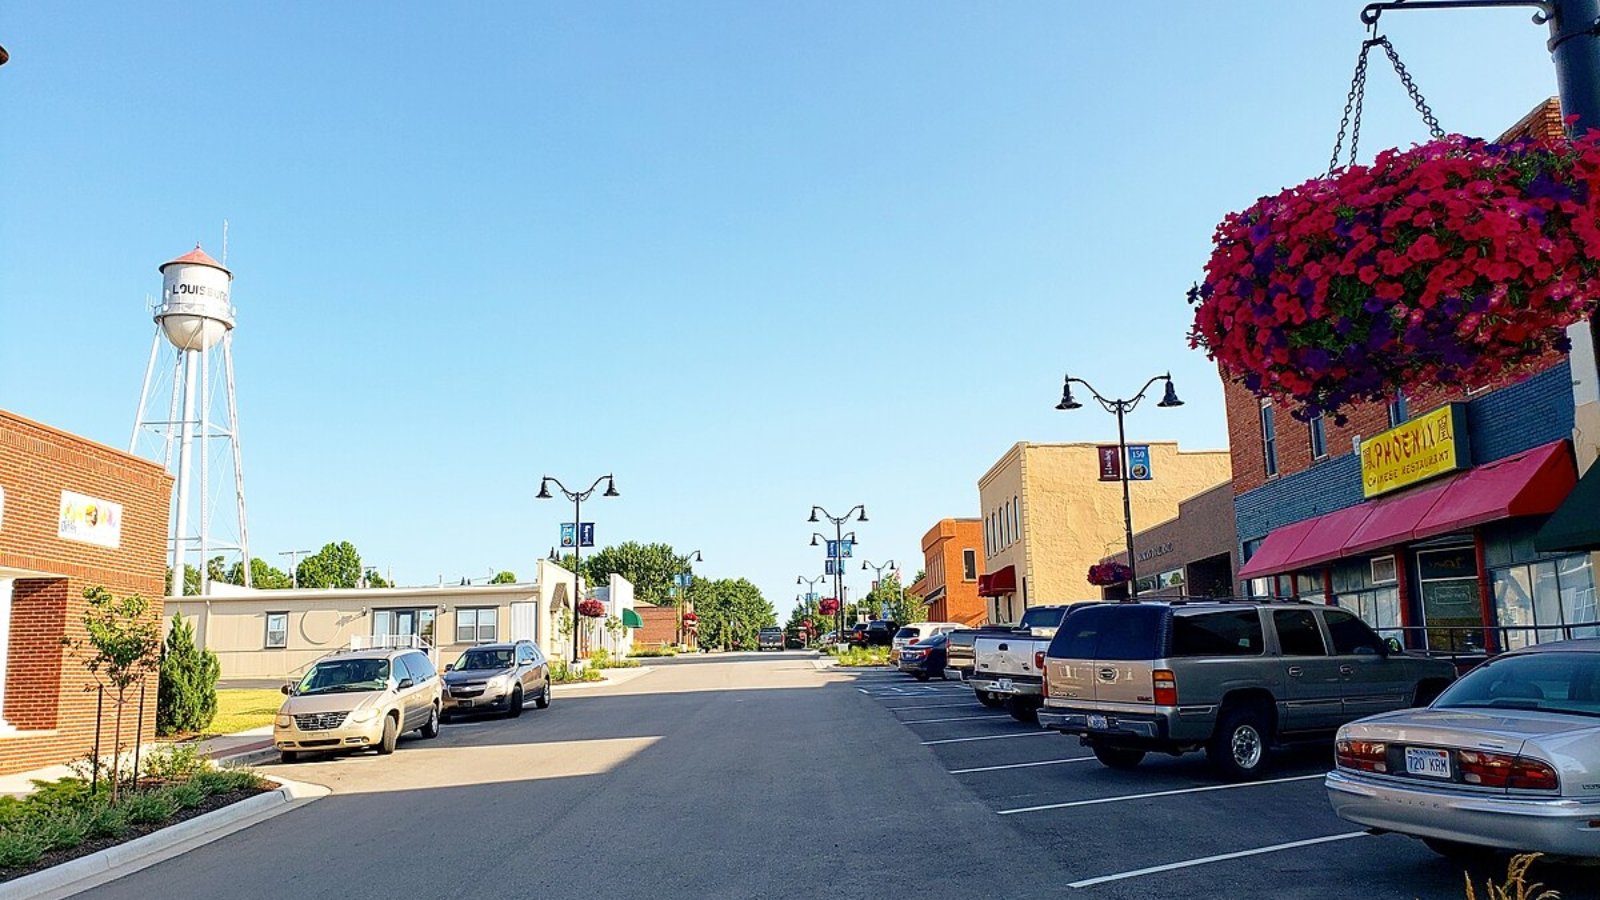
Louisburg lies just 30 minutes south of Kansas City, offering a small-town setting with good highway access. That location has made it a favorite among commuters and families seeking more space for their money without moving too far from the metro area.
After a huge 19% price increase in 2021, Louisburg remained strong through 2025. The local market benefits from a mix of new construction and long-term housing stability. With its combination of scenic surroundings and reasonable commute times, Louisburg continues to attract demand—and the home values reflect it.
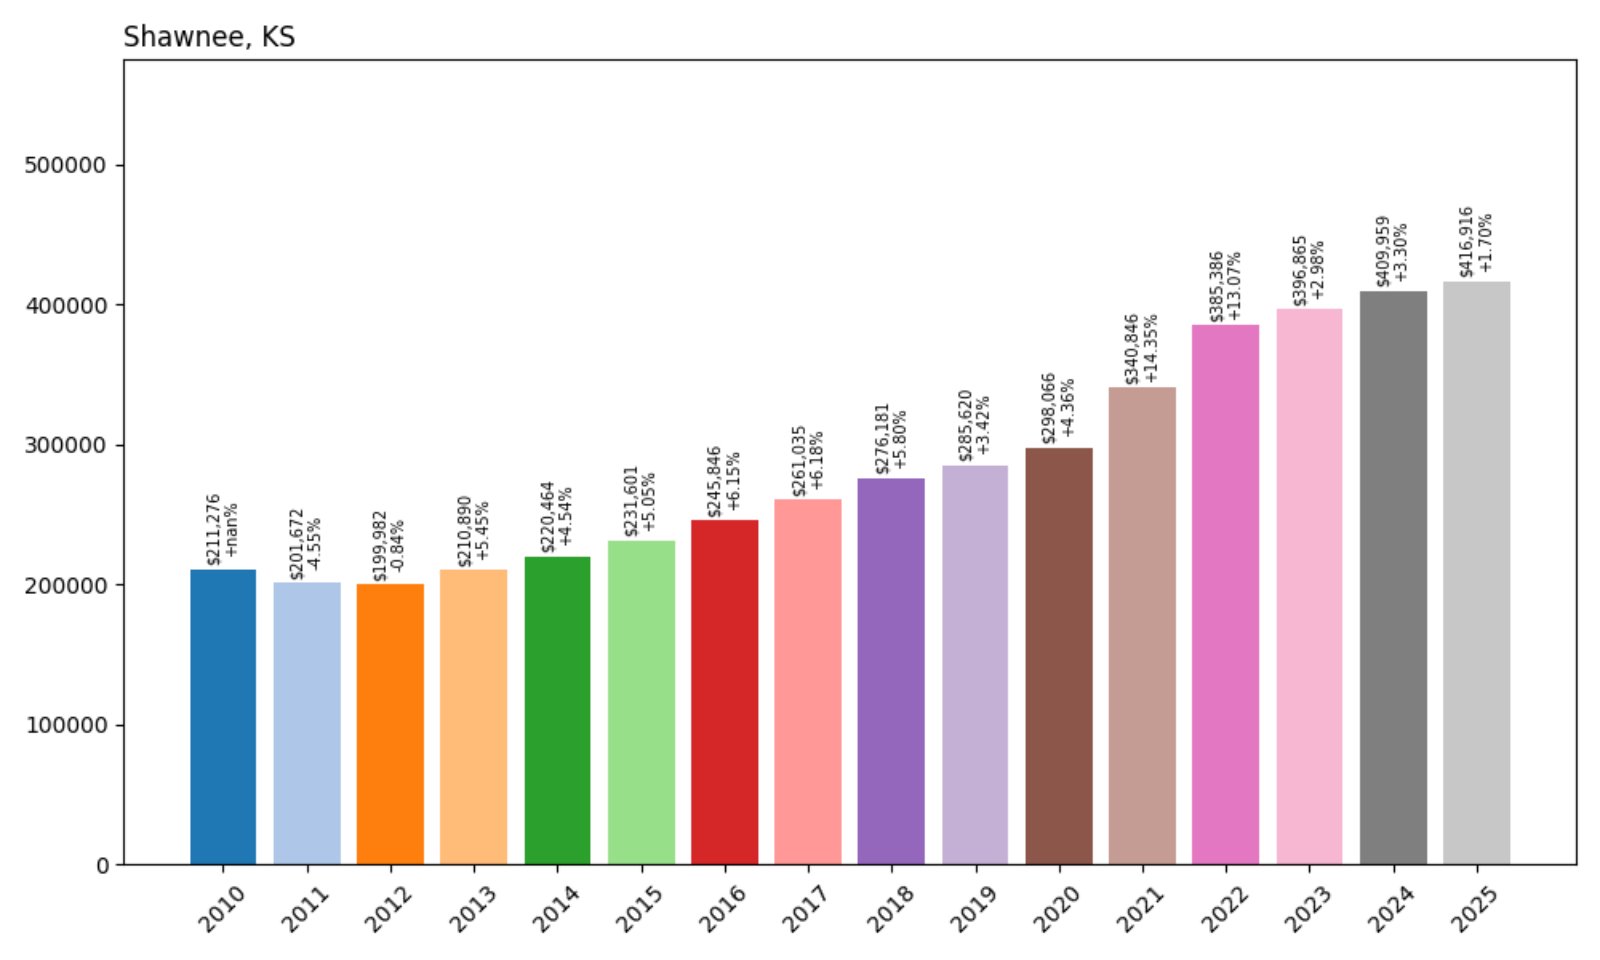
18. Shawnee – 97% Home Price Increase Since 2010
🔥 Would you like to save this?
- 2010: $211,276
- 2011: $201,672 (−$9,604, −4.55% from previous year)
- 2012: $199,982 (−$1,689, −0.84% from previous year)
- 2013: $210,890 (+$10,908, +5.45% from previous year)
- 2014: $220,464 (+$9,574, +4.54% from previous year)
- 2015: $231,601 (+$11,137, +5.05% from previous year)
- 2016: $245,846 (+$14,246, +6.15% from previous year)
- 2017: $261,035 (+$15,189, +6.18% from previous year)
- 2018: $276,181 (+$15,146, +5.80% from previous year)
- 2019: $285,620 (+$9,439, +3.42% from previous year)
- 2020: $298,066 (+$12,446, +4.36% from previous year)
- 2021: $340,846 (+$42,780, +14.35% from previous year)
- 2022: $385,386 (+$44,541, +13.07% from previous year)
- 2023: $396,865 (+$11,478, +2.98% from previous year)
- 2024: $409,959 (+$13,094, +3.30% from previous year)
- 2025: $416,916 (+$6,957, +1.70% from previous year)
Shawnee’s home prices have nearly doubled since 2010, climbing 97% to $416,916. Annual growth has remained strong, particularly in 2021 and 2022 when values surged by over $87K combined.
Shawnee – Solid Suburban Growth Near Kansas City
Part of Johnson County, Shawnee is one of Kansas’s most recognizable suburbs. Its appeal comes from a mix of suburban comfort, parks and trails, and easy access to Kansas City job centers. That reputation helped boost home values steadily over the past decade and a half.
The housing market really took off after 2020, with back-to-back double-digit jumps. While recent gains have been more modest, Shawnee remains one of the most stable and in-demand towns in the region. With excellent schools and well-developed infrastructure, it continues to justify its high home values.
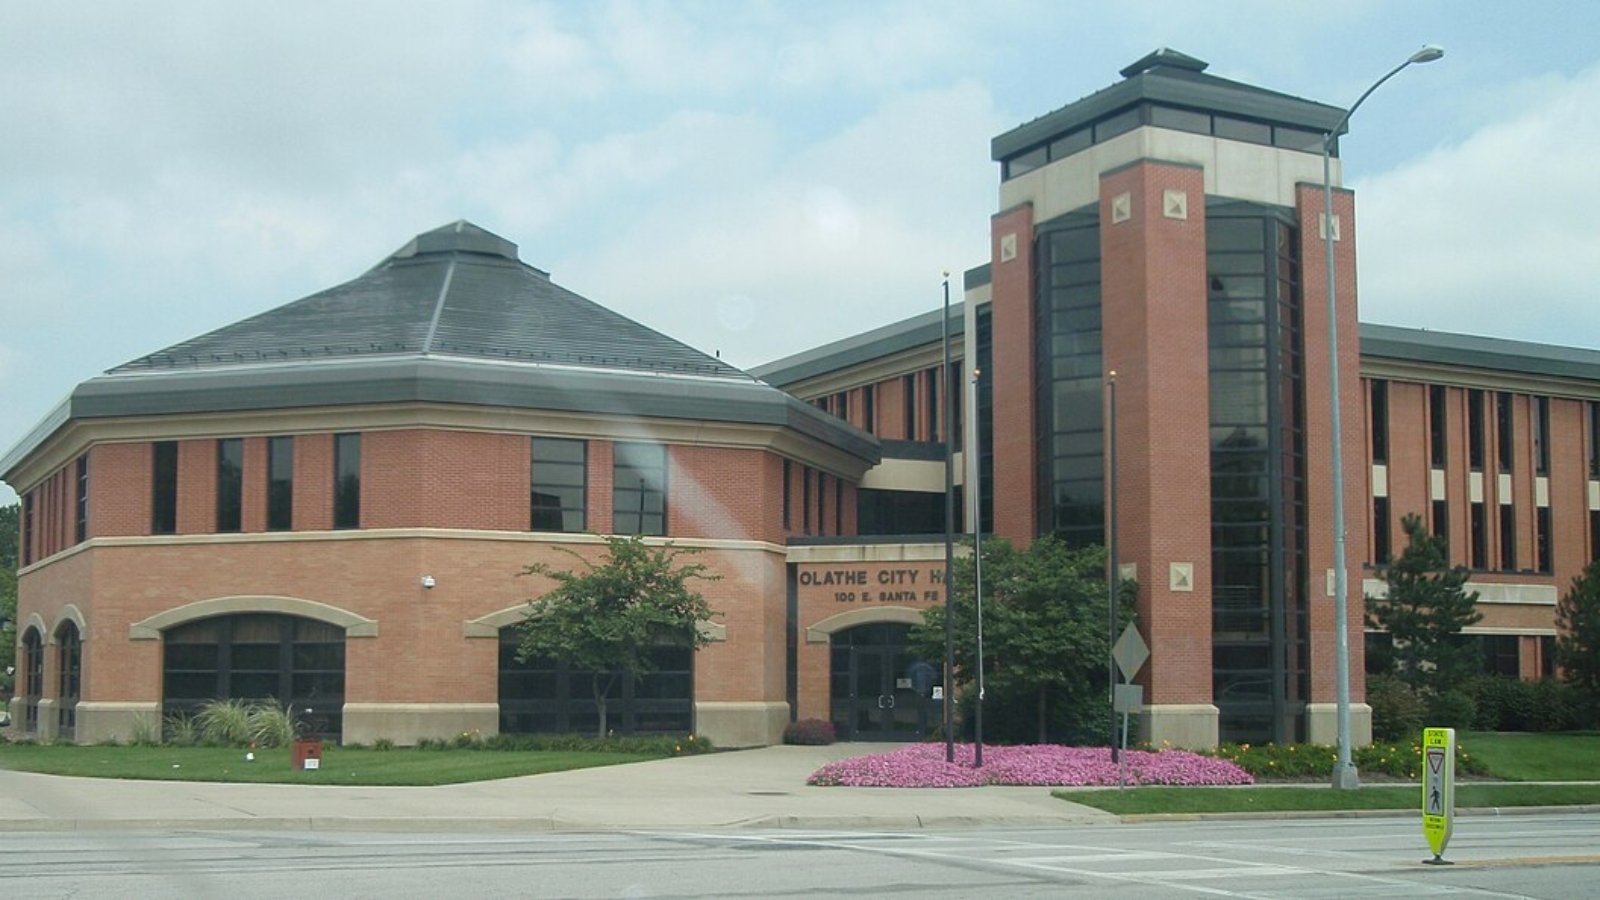
17. Olathe – 101% Home Price Increase Since 2010
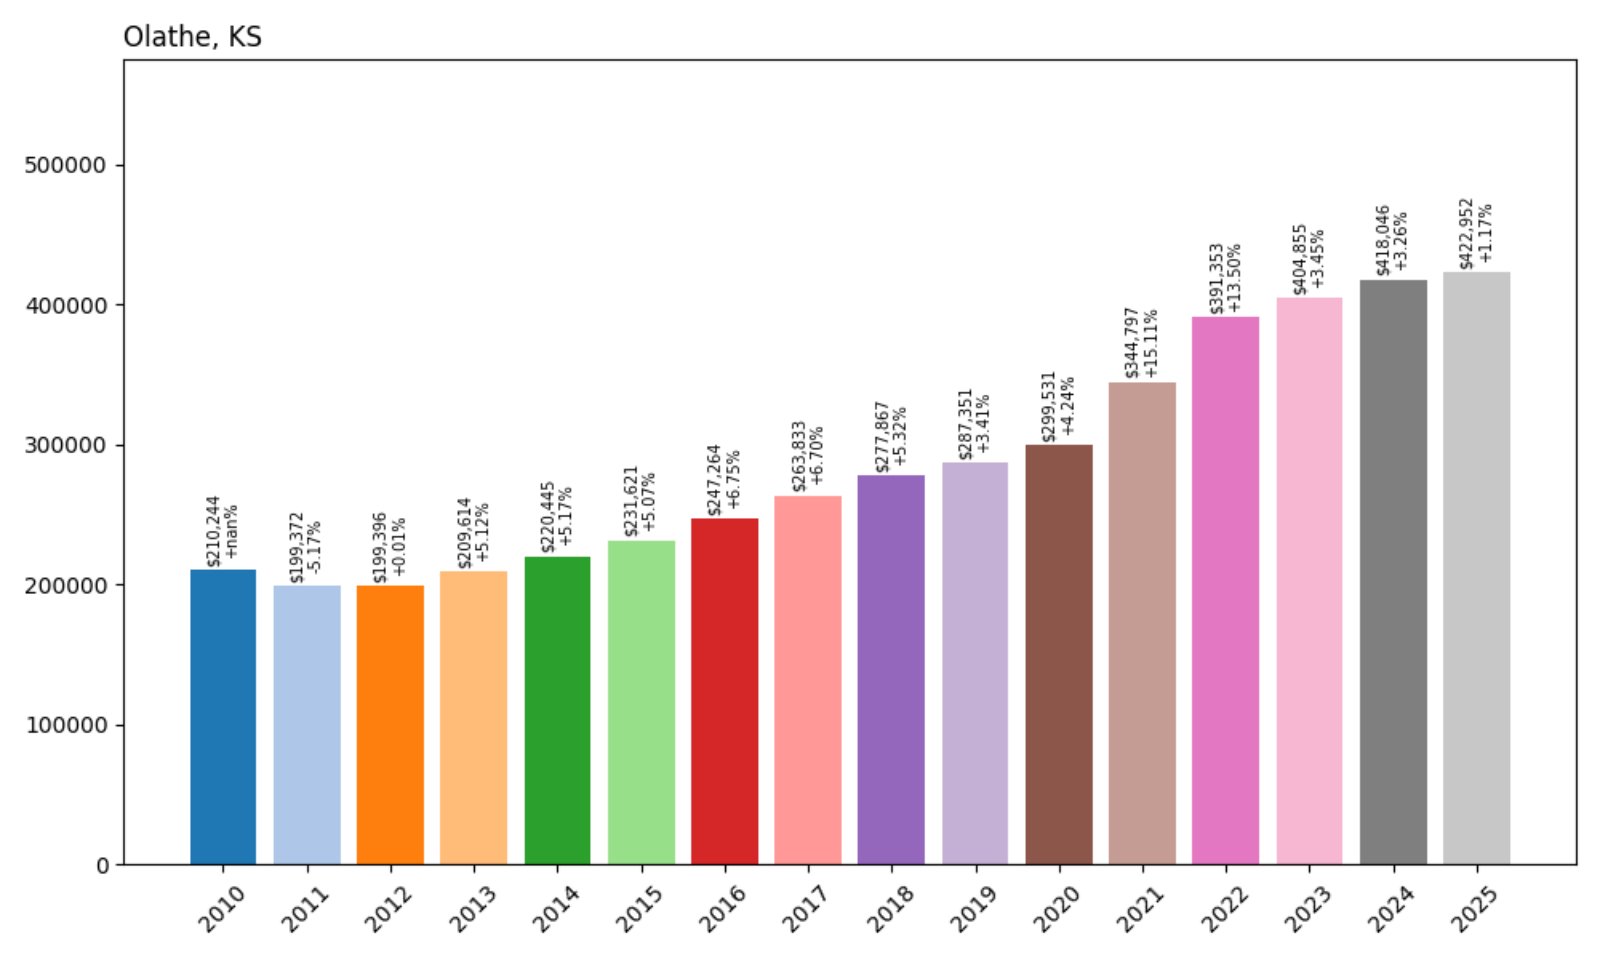
- 2010: $210,244
- 2011: $199,372 (−$10,873, −5.17% from previous year)
- 2012: $199,396 (+$24, +0.01% from previous year)
- 2013: $209,614 (+$10,218, +5.12% from previous year)
- 2014: $220,445 (+$10,830, +5.17% from previous year)
- 2015: $231,621 (+$11,176, +5.07% from previous year)
- 2016: $247,264 (+$15,642, +6.75% from previous year)
- 2017: $263,833 (+$16,569, +6.70% from previous year)
- 2018: $277,867 (+$14,034, +5.32% from previous year)
- 2019: $287,351 (+$9,484, +3.41% from previous year)
- 2020: $299,531 (+$12,180, +4.24% from previous year)
- 2021: $344,797 (+$45,266, +15.11% from previous year)
- 2022: $391,353 (+$46,556, +13.50% from previous year)
- 2023: $404,855 (+$13,502, +3.45% from previous year)
- 2024: $418,046 (+$13,191, +3.26% from previous year)
- 2025: $422,952 (+$4,906, +1.17% from previous year)
Olathe home values have increased 101% since 2010, nearly doubling over 15 years. The biggest gains happened after 2020, driven by demand and limited housing inventory.
Olathe – Growth Fueled by Expansion and Demand
Olathe is one of the largest cities in Kansas and a key part of the Kansas City metro. Known for excellent schools and a growing business base, it has long attracted families and professionals looking for stability and quality of life.
Post-2020, the market boomed. A 15% increase in 2021 followed by another 13% the next year pushed values to new heights. Even as growth slowed, prices continued to rise, reaching $422,952 in 2025. Olathe remains a cornerstone of suburban Kansas real estate.
16. De Soto – 116% Home Price Increase Since 2010
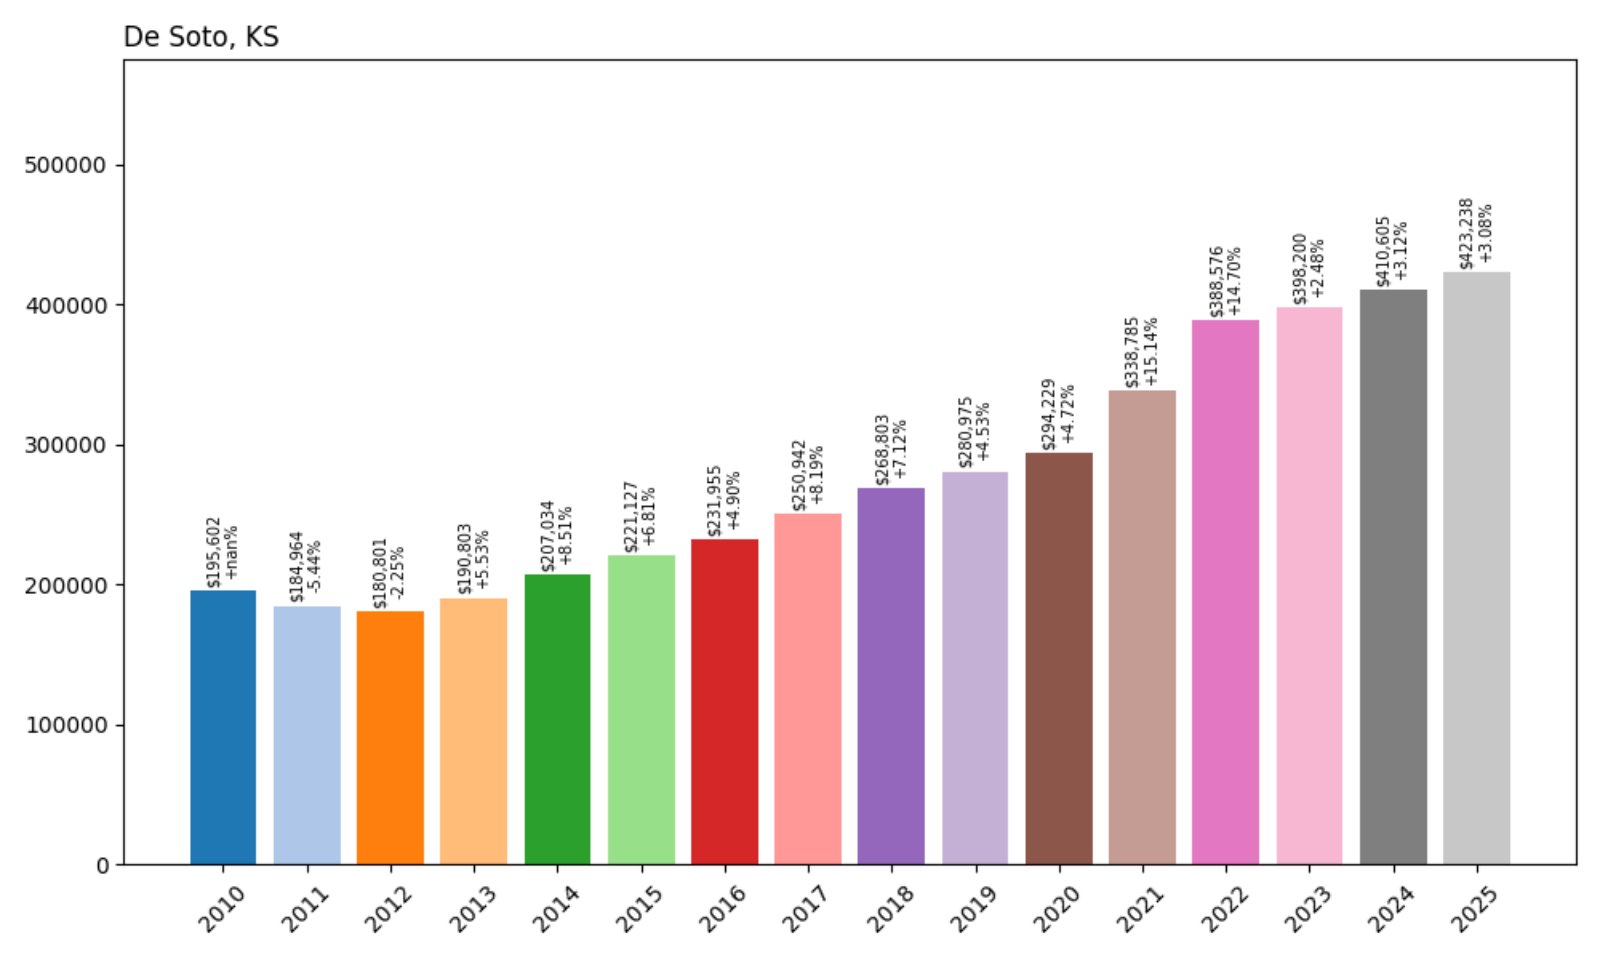
- 2010: $195,602
- 2011: $184,964 (−$10,637, −5.44% from previous year)
- 2012: $180,801 (−$4,163, −2.25% from previous year)
- 2013: $190,803 (+$10,002, +5.53% from previous year)
- 2014: $207,034 (+$16,231, +8.51% from previous year)
- 2015: $221,127 (+$14,093, +6.81% from previous year)
- 2016: $231,955 (+$10,828, +4.90% from previous year)
- 2017: $250,942 (+$18,987, +8.19% from previous year)
- 2018: $268,803 (+$17,861, +7.12% from previous year)
- 2019: $280,975 (+$12,172, +4.53% from previous year)
- 2020: $294,229 (+$13,254, +4.72% from previous year)
- 2021: $338,785 (+$44,555, +15.14% from previous year)
- 2022: $388,576 (+$49,792, +14.70% from previous year)
- 2023: $398,200 (+$9,623, +2.48% from previous year)
- 2024: $410,605 (+$12,406, +3.12% from previous year)
- 2025: $423,238 (+$12,632, +3.08% from previous year)
De Soto home prices have climbed 116% over the past 15 years, with the average value hitting $423,238 in 2025. The steepest increases came after 2020, with back-to-back double-digit jumps.
De Soto – A Booming Town in Johnson County
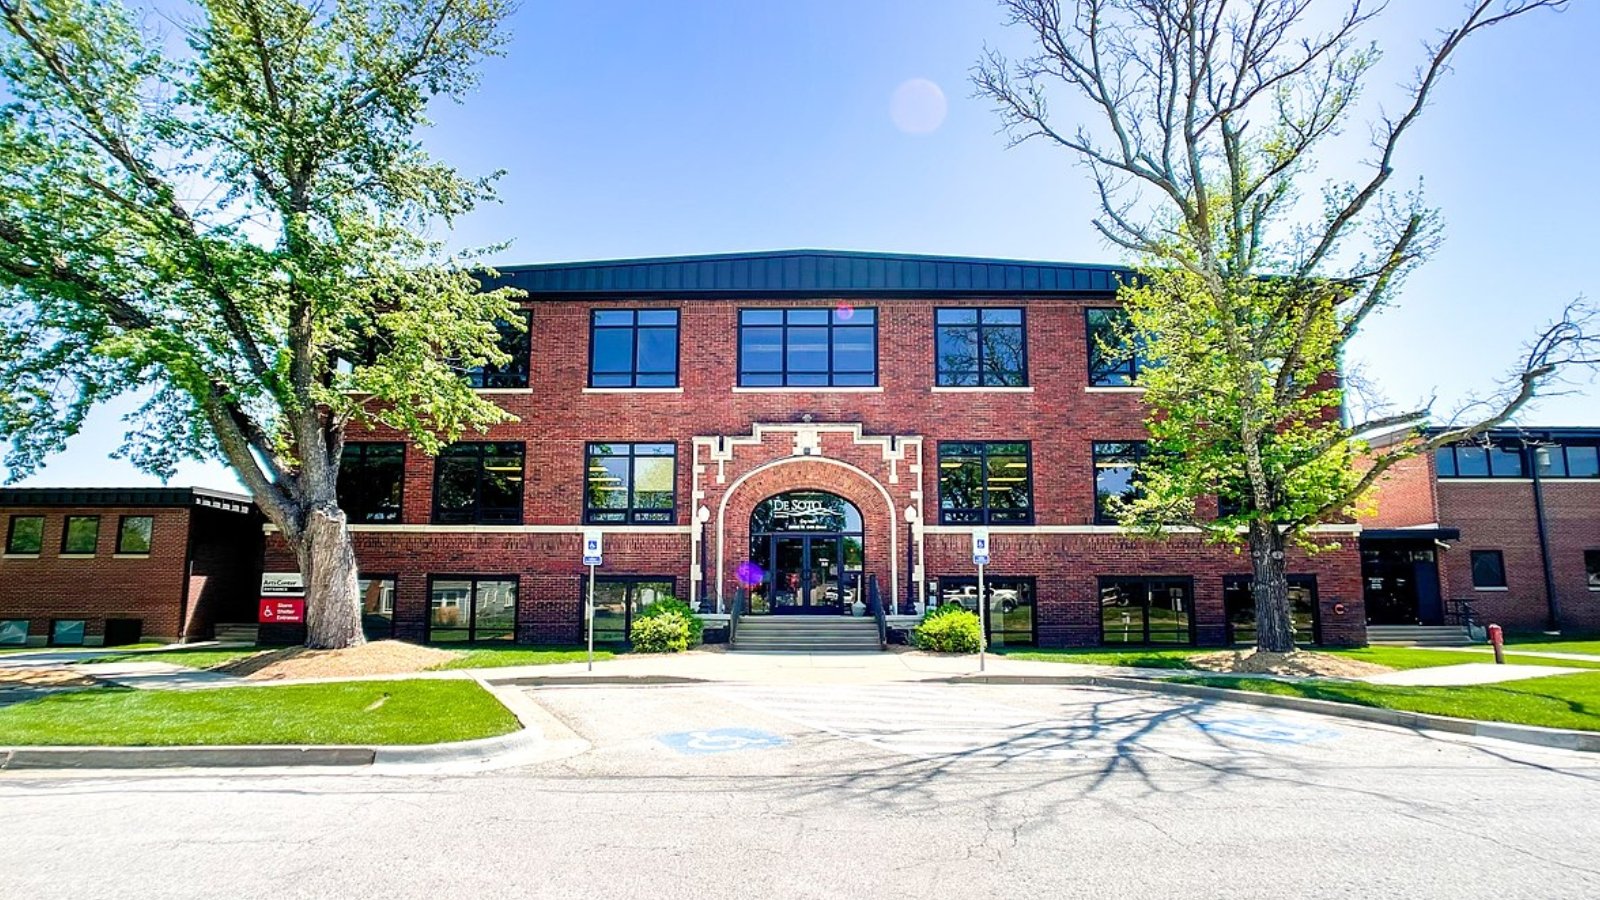
De Soto, once considered a quieter part of Johnson County, has become a focal point of housing growth. With land available for development and easy access to K-10, the town is well-positioned between Lawrence and Kansas City, attracting new residents and investment.
The opening of new commercial facilities in the area has added to its draw. As more people move in, De Soto’s home prices have climbed steadily—and all signs suggest the market is still strong.
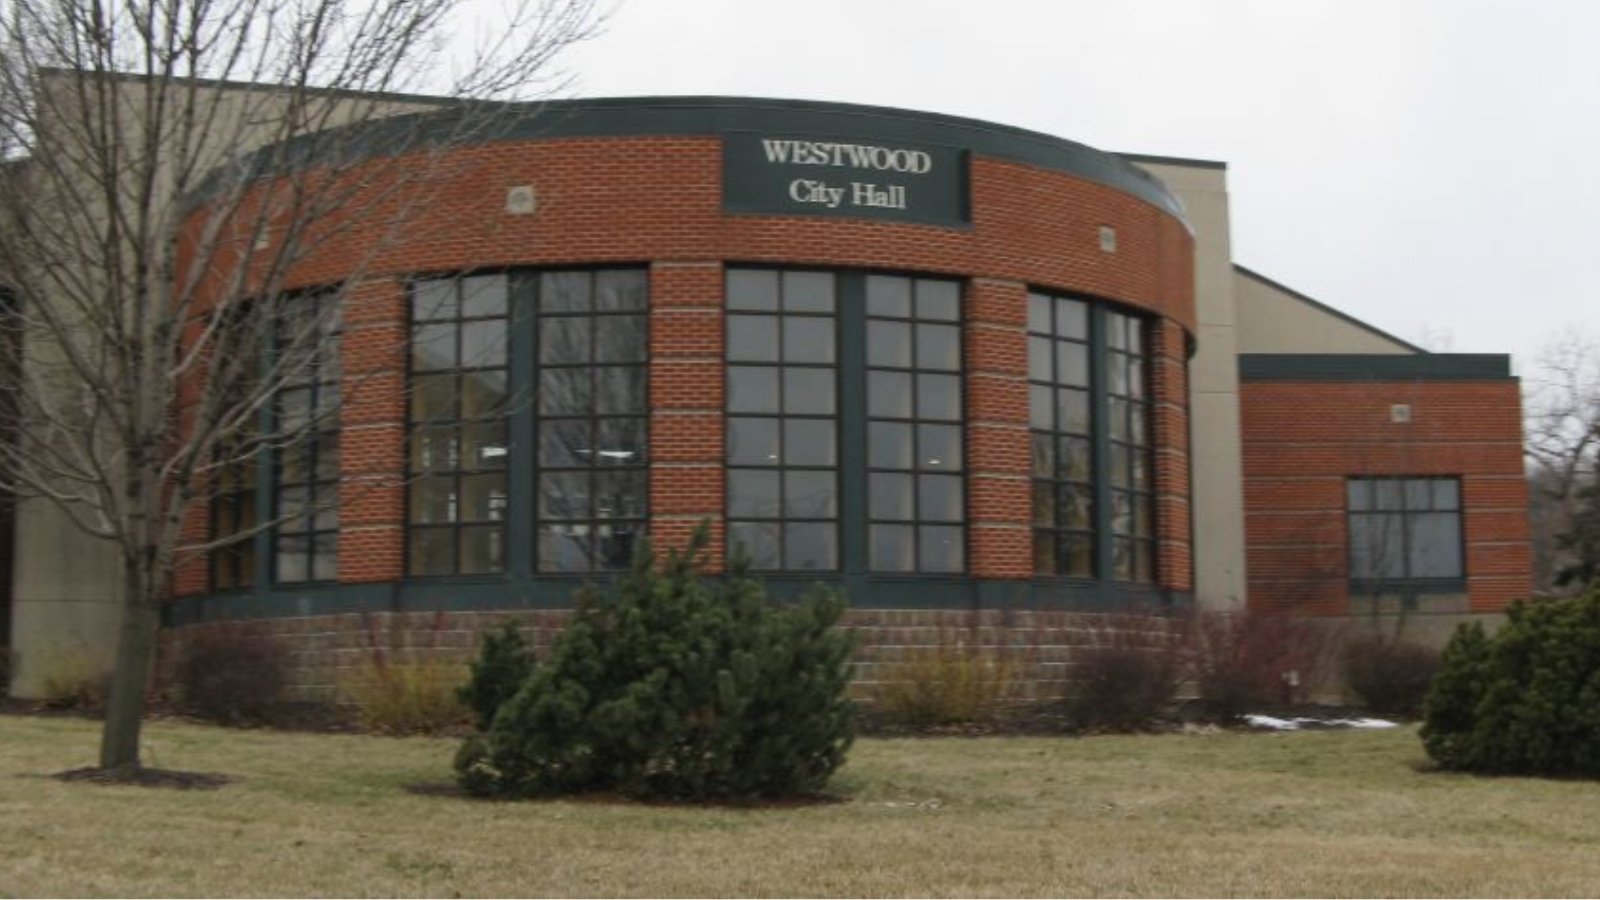
15. Westwood – 119% Home Price Increase Since 2010

- 2010: $194,531
- 2011: $187,125 (−$7,406, −3.81% from previous year)
- 2012: $186,831 (−$293, −0.16% from previous year)
- 2013: $196,965 (+$10,133, +5.42% from previous year)
- 2014: $208,039 (+$11,074, +5.62% from previous year)
- 2015: $217,292 (+$9,253, +4.45% from previous year)
- 2016: $236,210 (+$18,918, +8.71% from previous year)
- 2017: $265,709 (+$29,498, +12.49% from previous year)
- 2018: $284,641 (+$18,932, +7.13% from previous year)
- 2019: $292,578 (+$7,937, +2.79% from previous year)
- 2020: $306,466 (+$13,888, +4.75% from previous year)
- 2021: $352,651 (+$46,185, +15.07% from previous year)
- 2022: $381,898 (+$29,247, +8.29% from previous year)
- 2023: $394,897 (+$12,999, +3.40% from previous year)
- 2024: $413,537 (+$18,640, +4.72% from previous year)
- 2025: $426,353 (+$12,816, +3.10% from previous year)
Westwood has posted a 119% increase in home prices since 2010, with property values rising from $194,531 to $426,353 by mid-2025. Annual growth has remained strong, especially from 2016 onward.
Westwood – A Compact, Coveted Community
Located in northeast Johnson County near the Kansas-Missouri state line, Westwood is known for its proximity to Kansas City while offering a tight-knit residential feel. Despite its small size, it’s a highly desirable address due to location, walkability, and access to amenities.
Home values in Westwood spiked especially during the 2021 boom, gaining over 15% in one year. Demand has remained high, keeping prices on an upward path through 2025. The limited housing inventory in this dense community continues to push prices above neighboring towns.
14. Spring Hill – 121% Home Price Increase Since 2010
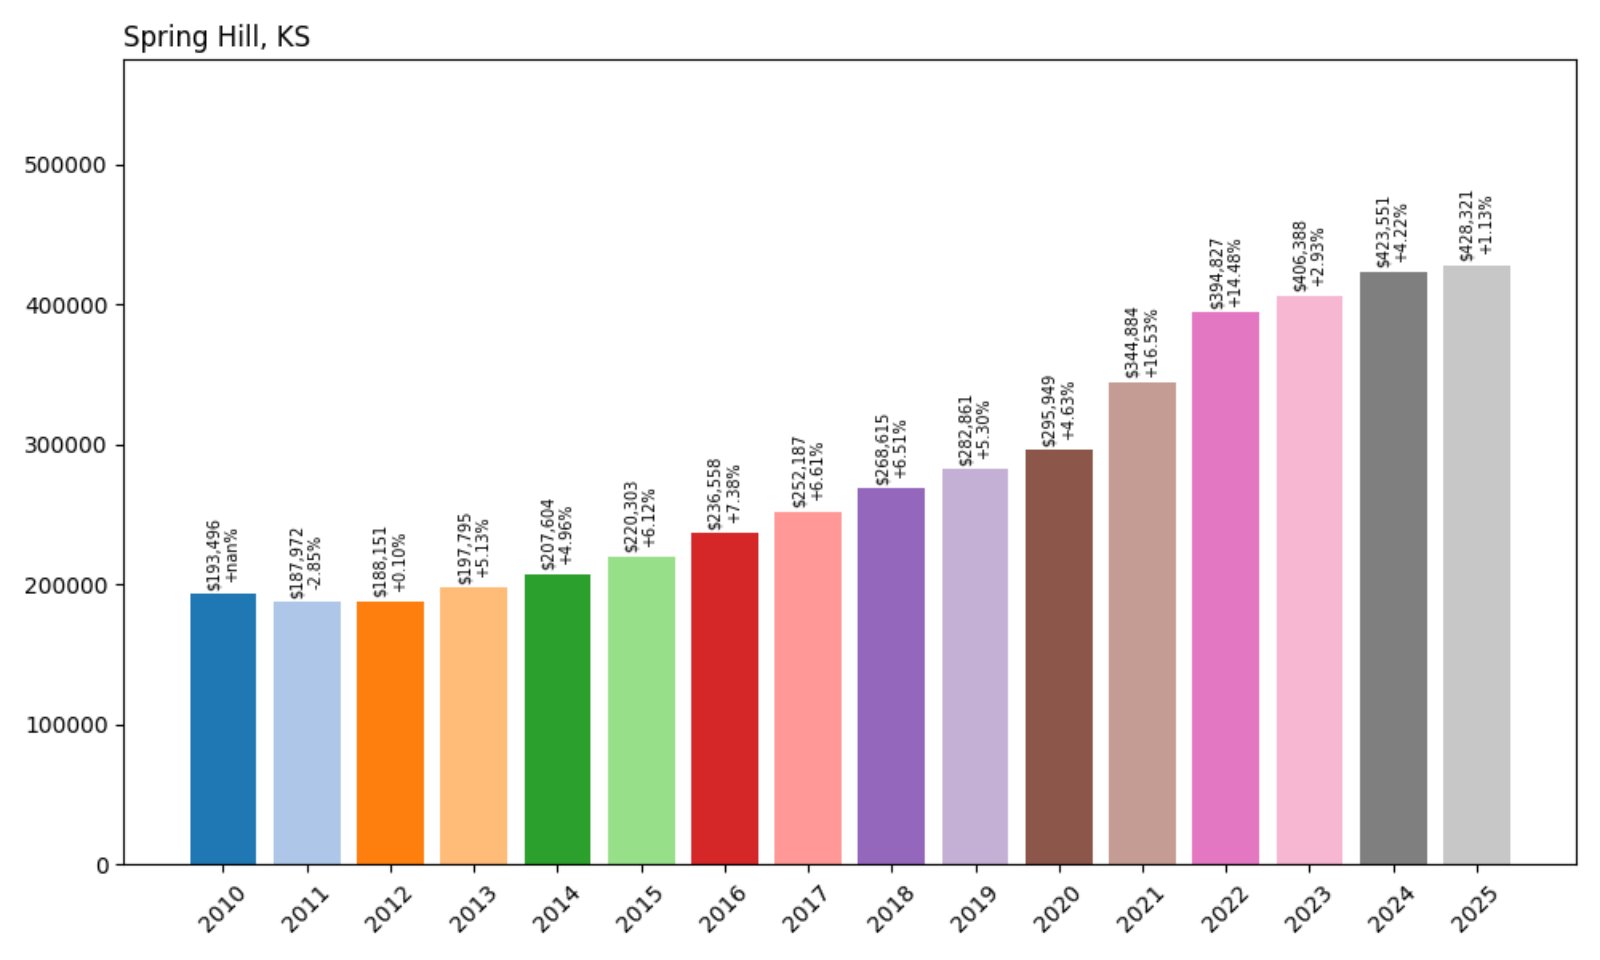
- 2010: $193,496
- 2011: $187,972 (−$5,524, −2.85% from previous year)
- 2012: $188,151 (+$179, +0.10% from previous year)
- 2013: $197,795 (+$9,644, +5.13% from previous year)
- 2014: $207,604 (+$9,809, +4.96% from previous year)
- 2015: $220,303 (+$12,699, +6.12% from previous year)
- 2016: $236,558 (+$16,255, +7.38% from previous year)
- 2017: $252,187 (+$15,630, +6.61% from previous year)
- 2018: $268,615 (+$16,428, +6.51% from previous year)
- 2019: $282,861 (+$14,246, +5.30% from previous year)
- 2020: $295,949 (+$13,088, +4.63% from previous year)
- 2021: $344,884 (+$48,934, +16.53% from previous year)
- 2022: $394,827 (+$49,943, +14.48% from previous year)
- 2023: $406,388 (+$11,562, +2.93% from previous year)
- 2024: $423,551 (+$17,162, +4.22% from previous year)
- 2025: $428,321 (+$4,770, +1.13% from previous year)
Home prices in Spring Hill are up 121% since 2010. After several years of moderate gains, values skyrocketed during the early 2020s and have continued climbing, though more gradually, into 2025.
Spring Hill – On the Rise With Room to Grow
🔥 Would you like to save this?
Situated in both Johnson and Miami counties, Spring Hill has benefited from its semi-rural location and proximity to growth corridors in the Kansas City metro. It’s an area where families are turning to for more space, newer homes, and lower density than in core suburbs.
The market saw two back-to-back surges in 2021 and 2022—over 30% combined—reflecting high pandemic-era demand. More recent growth has slowed but remains positive. Spring Hill continues to develop, with new residential projects and strong interest from buyers priced out of neighboring markets.
13. Basehor – 104% Home Price Increase Since 2010
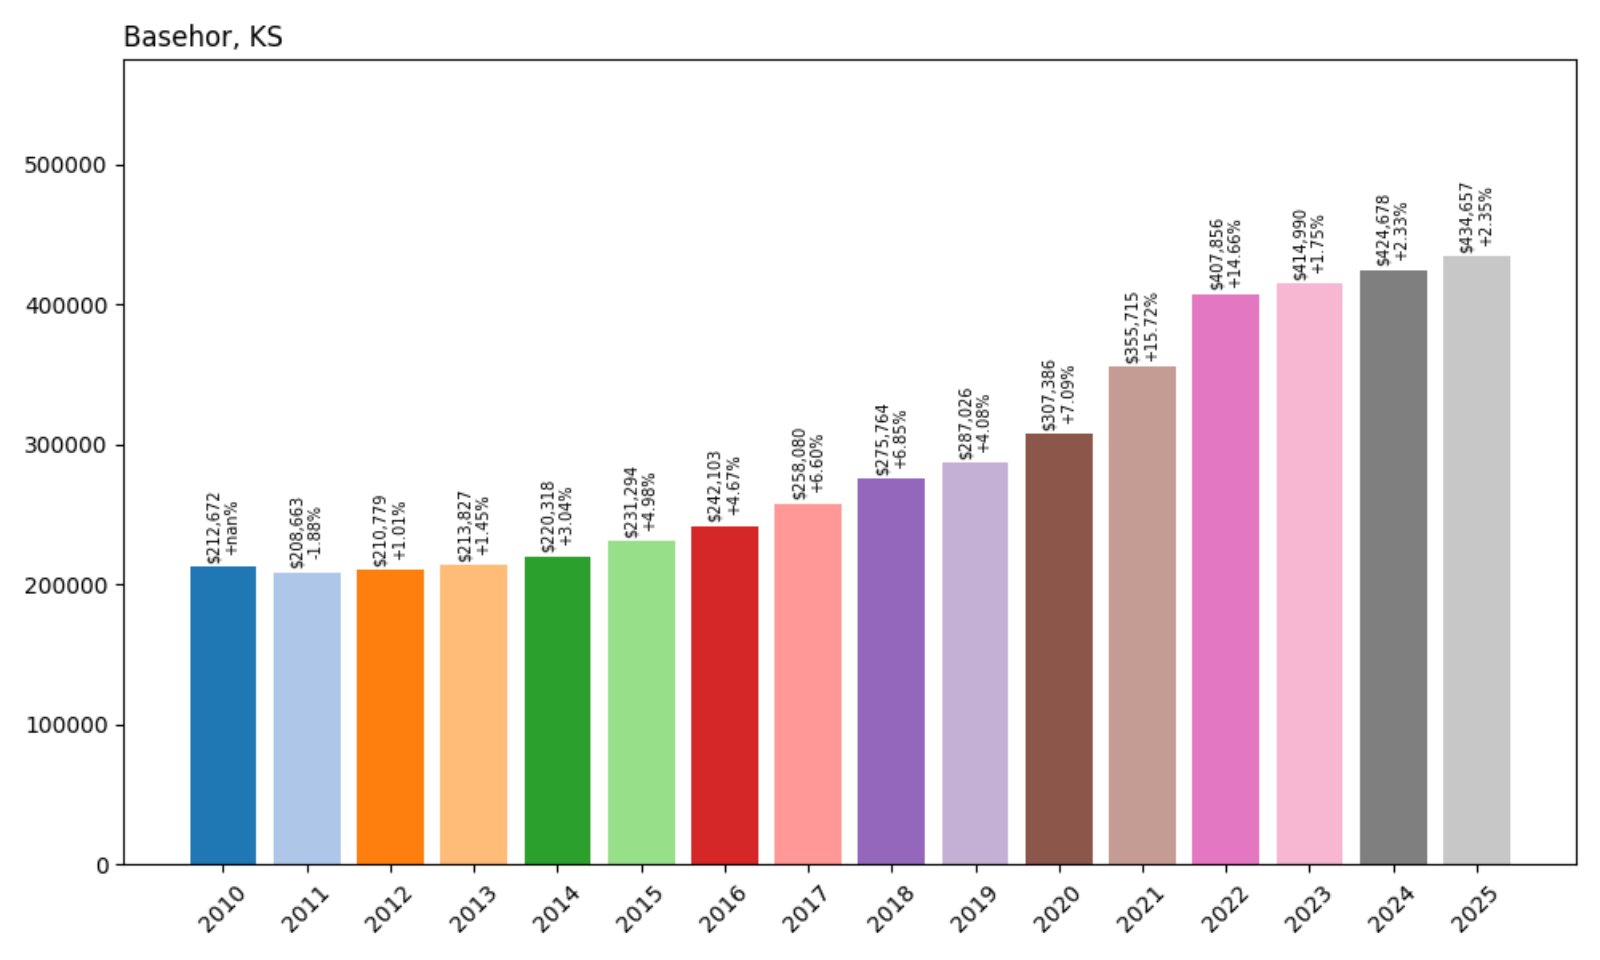
- 2010: $212,672
- 2011: $208,663 (−$4,009, −1.88% from previous year)
- 2012: $210,779 (+$2,116, +1.01% from previous year)
- 2013: $213,827 (+$3,048, +1.45% from previous year)
- 2014: $220,318 (+$6,491, +3.04% from previous year)
- 2015: $231,294 (+$10,976, +4.98% from previous year)
- 2016: $242,103 (+$10,808, +4.67% from previous year)
- 2017: $258,080 (+$15,978, +6.60% from previous year)
- 2018: $275,764 (+$17,684, +6.85% from previous year)
- 2019: $287,026 (+$11,261, +4.08% from previous year)
- 2020: $307,386 (+$20,361, +7.09% from previous year)
- 2021: $355,715 (+$48,329, +15.72% from previous year)
- 2022: $407,856 (+$52,141, +14.66% from previous year)
- 2023: $414,990 (+$7,134, +1.75% from previous year)
- 2024: $424,678 (+$9,688, +2.33% from previous year)
- 2025: $434,657 (+$9,978, +2.35% from previous year)
Basehor’s home prices have climbed 104% since 2010, with particularly strong gains over the past five years. The average home now sells for $434,657, more than double its 2010 value.
Basehor – Expanding Fast, But Still Affordable
Basehor, located in Leavenworth County, has grown into a popular choice for commuters heading into Kansas City or Leavenworth. Known for newer subdivisions and good schools, the town offers many of the perks of a suburb while keeping a quieter, residential feel.
The 2021–2022 boom added over $100,000 in value to the average home, reflecting rapid demand growth. The pace has since settled, but values continue their upward trend. With more development in the pipeline, Basehor’s market remains one to watch.
12. Linwood – 161% Home Price Increase Since 2010
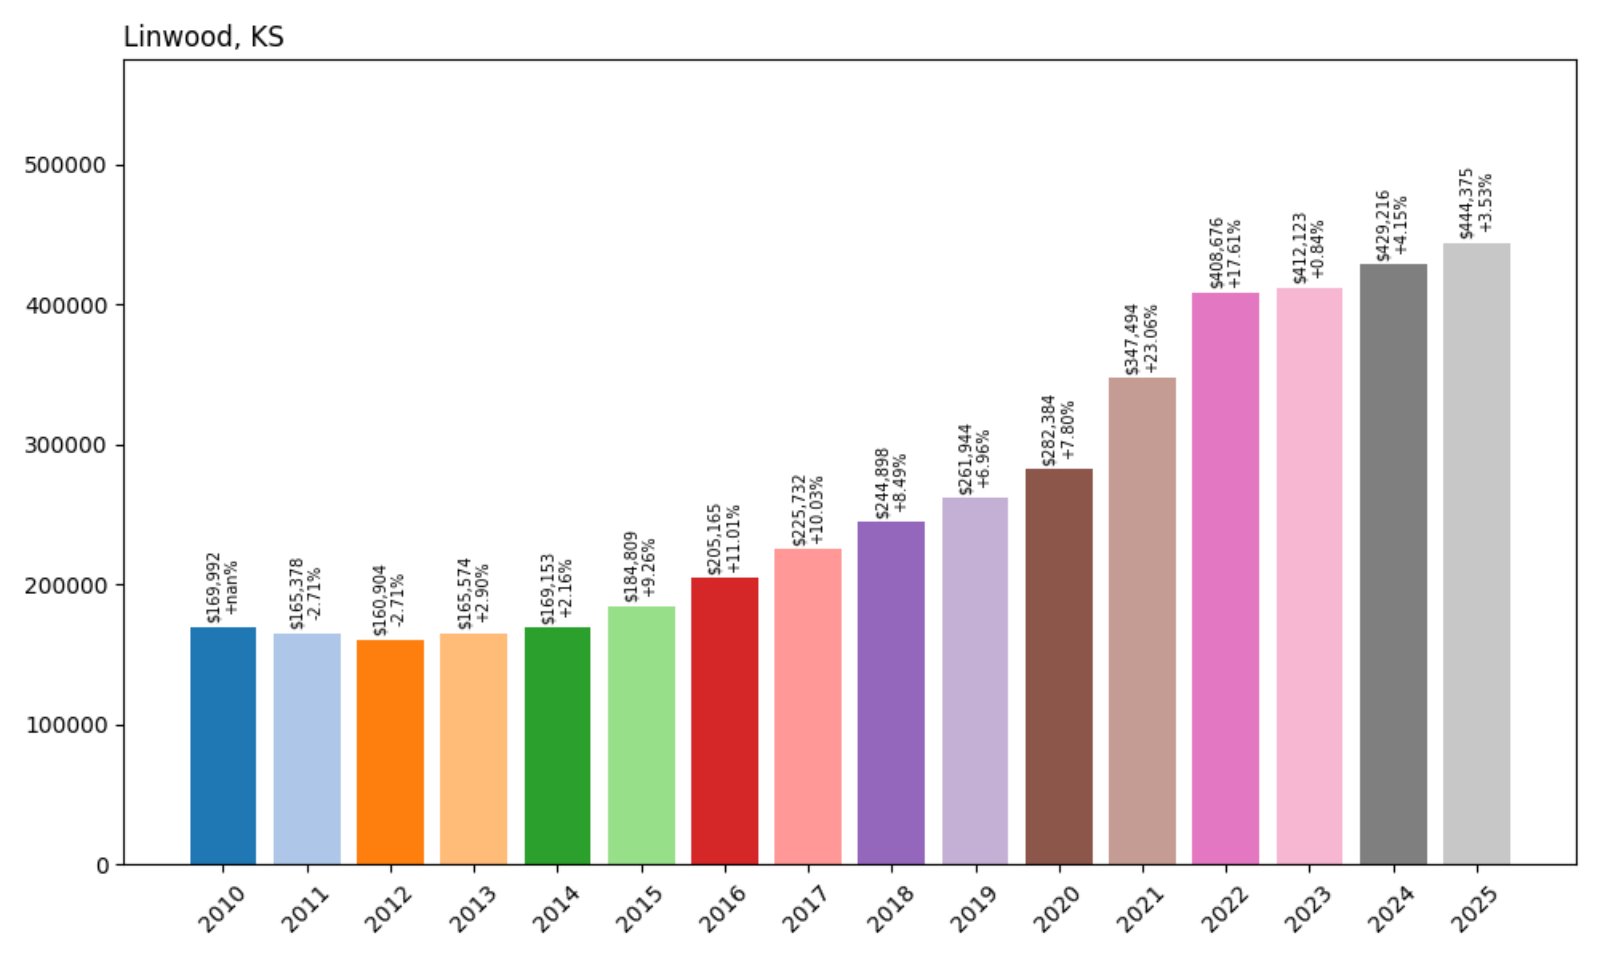
- 2010: $169,992
- 2011: $165,378 (−$4,614, −2.71% from previous year)
- 2012: $160,904 (−$4,474, −2.71% from previous year)
- 2013: $165,574 (+$4,670, +2.90% from previous year)
- 2014: $169,153 (+$3,579, +2.16% from previous year)
- 2015: $184,809 (+$15,656, +9.26% from previous year)
- 2016: $205,165 (+$20,355, +11.01% from previous year)
- 2017: $225,732 (+$20,568, +10.03% from previous year)
- 2018: $244,898 (+$19,165, +8.49% from previous year)
- 2019: $261,944 (+$17,046, +6.96% from previous year)
- 2020: $282,384 (+$20,440, +7.80% from previous year)
- 2021: $347,494 (+$65,110, +23.06% from previous year)
- 2022: $408,676 (+$61,182, +17.61% from previous year)
- 2023: $412,123 (+$3,446, +0.84% from previous year)
- 2024: $429,216 (+$17,093, +4.15% from previous year)
- 2025: $444,375 (+$15,159, +3.53% from previous year)
Linwood home prices have jumped 161% since 2010, driven by double-digit growth during the pandemic housing boom. Prices have held strong in recent years, topping $444K in 2025.
Linwood – A Rural Outlier With Major Gains
Linwood is a small town along the Kansas River in Leavenworth County. Long considered a rural community, it has benefitted from rising interest in low-density living and larger plots of land. As buyers sought more space, Linwood’s market began accelerating.
That demand peaked in 2021 with a massive 23% jump in values, followed by another 17% in 2022. While more recent growth has slowed, prices remain elevated, showing continued interest in outlying communities with room to expand.
11. Lenexa – 98% Home Price Increase Since 2010
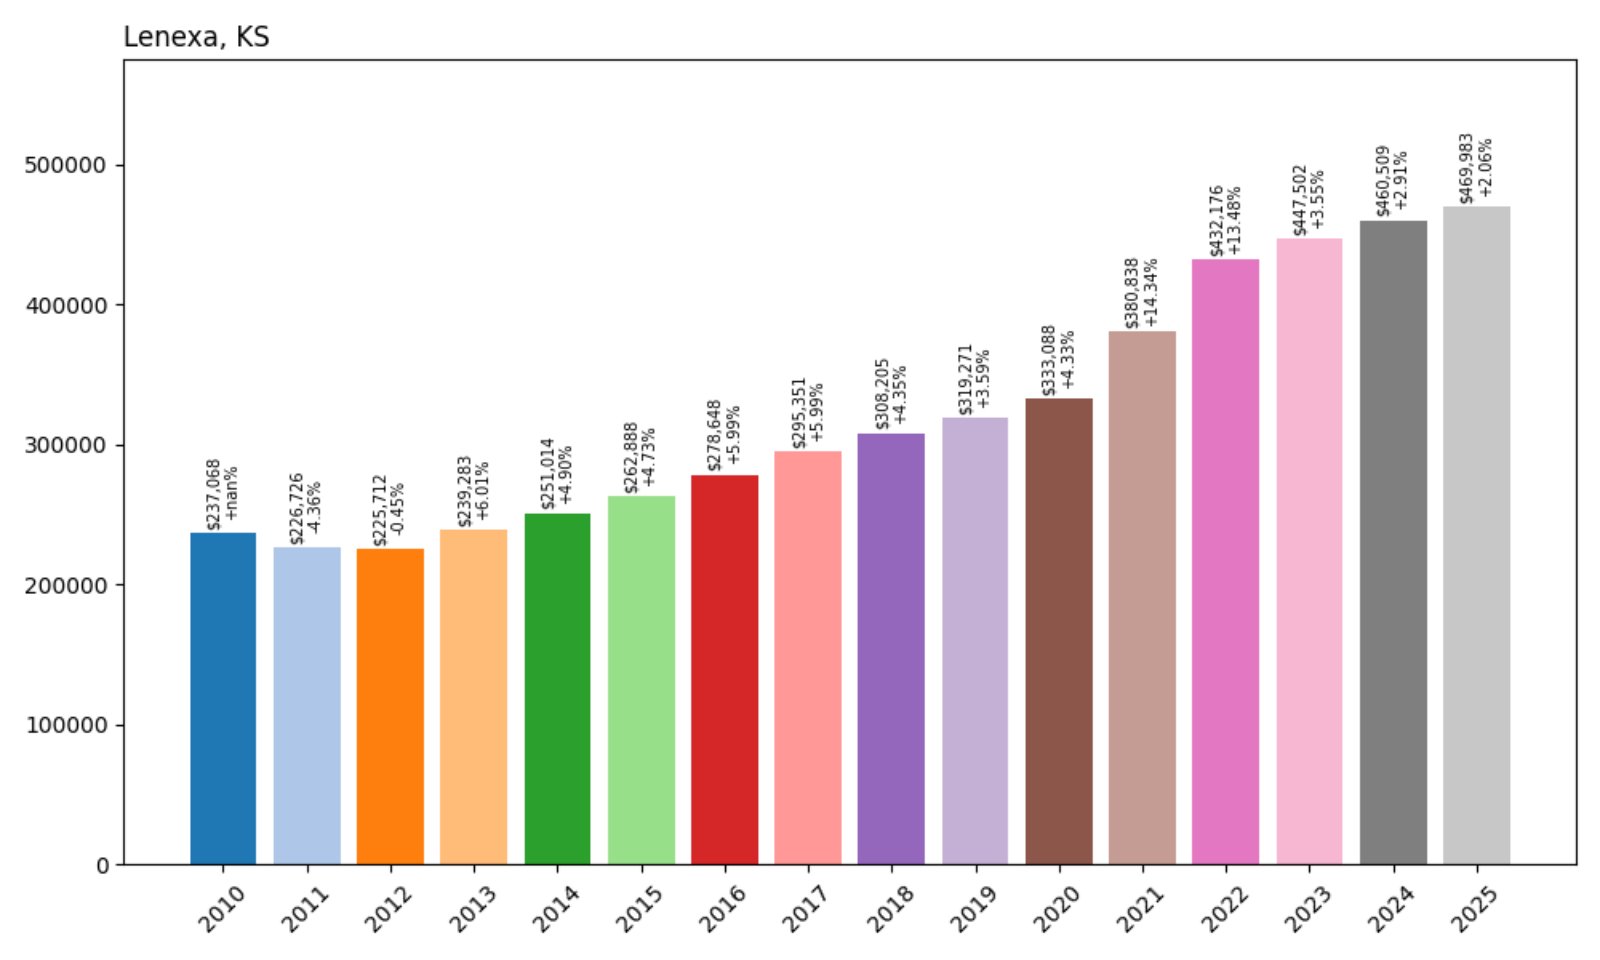
- 2010: $237,068
- 2011: $226,726 (−$10,342, −4.36% from previous year)
- 2012: $225,712 (−$1,014, −0.45% from previous year)
- 2013: $239,283 (+$13,571, +6.01% from previous year)
- 2014: $251,014 (+$11,732, +4.90% from previous year)
- 2015: $262,888 (+$11,874, +4.73% from previous year)
- 2016: $278,648 (+$15,760, +5.99% from previous year)
- 2017: $295,351 (+$16,703, +5.99% from previous year)
- 2018: $308,205 (+$12,854, +4.35% from previous year)
- 2019: $319,271 (+$11,066, +3.59% from previous year)
- 2020: $333,088 (+$13,818, +4.33% from previous year)
- 2021: $380,838 (+$47,750, +14.34% from previous year)
- 2022: $432,176 (+$51,337, +13.48% from previous year)
- 2023: $447,502 (+$15,326, +3.55% from previous year)
- 2024: $460,509 (+$13,007, +2.91% from previous year)
- 2025: $469,983 (+$9,474, +2.06% from previous year)
Lenexa’s average home value has nearly doubled, climbing 98% since 2010. Prices saw a particularly large leap between 2020 and 2022, adding over $99,000 in just two years.
Lenexa – A Polished, Growing Suburb
Lenexa is a polished Johnson County suburb known for its modern amenities, extensive parks system, and tech-driven business corridor. Home to corporate headquarters and newer retail centers, it offers urban conveniences with suburban ease.
High development standards and desirable housing stock have made Lenexa one of the metro’s most sought-after towns. That’s reflected in its prices, which grew steadily through the 2010s and took off after 2020. With strong fundamentals, Lenexa continues to show healthy price momentum into 2025.
10. Prairie Village – 123% Home Price Increase Since 2010
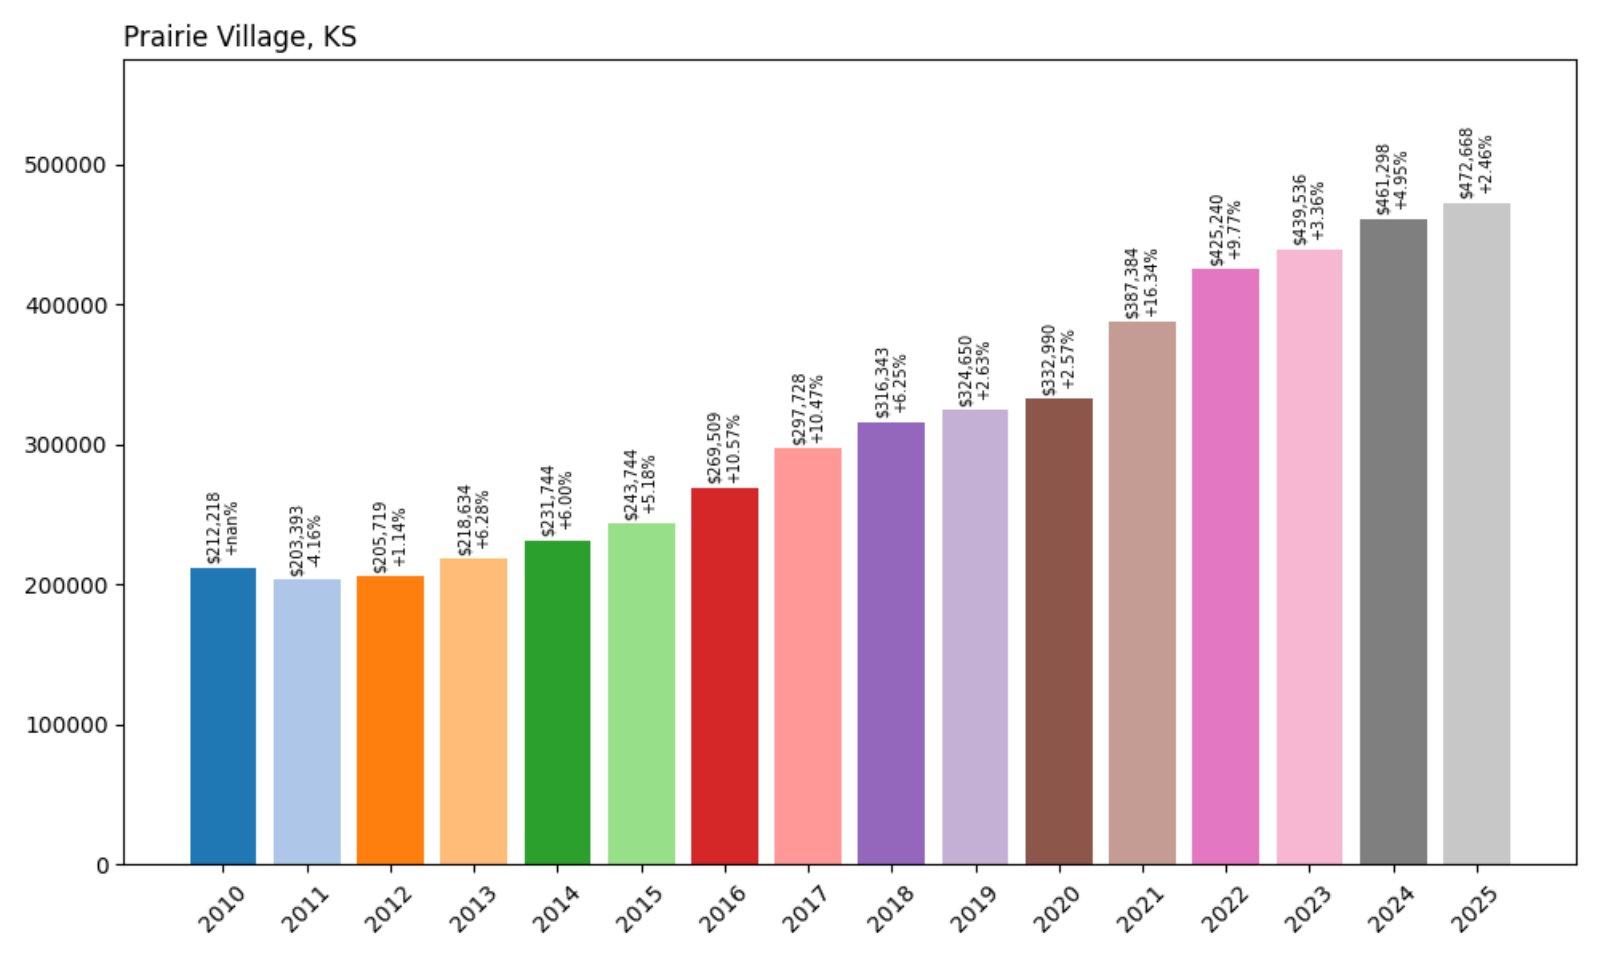
- 2010: $212,218
- 2011: $203,393 (−$8,825, −4.16% from previous year)
- 2012: $205,719 (+$2,325, +1.14% from previous year)
- 2013: $218,634 (+$12,916, +6.28% from previous year)
- 2014: $231,744 (+$13,110, +6.00% from previous year)
- 2015: $243,744 (+$11,999, +5.18% from previous year)
- 2016: $269,509 (+$25,766, +10.57% from previous year)
- 2017: $297,728 (+$28,219, +10.47% from previous year)
- 2018: $316,343 (+$18,615, +6.25% from previous year)
- 2019: $324,650 (+$8,307, +2.63% from previous year)
- 2020: $332,990 (+$8,340, +2.57% from previous year)
- 2021: $387,384 (+$54,394, +16.34% from previous year)
- 2022: $425,240 (+$37,856, +9.77% from previous year)
- 2023: $439,536 (+$14,296, +3.36% from previous year)
- 2024: $461,298 (+$21,762, +4.95% from previous year)
- 2025: $472,668 (+$11,370, +2.46% from previous year)
Prairie Village home prices are up 123% since 2010, with values rising from $212,218 to $472,668. The biggest jumps came during the 2020–2022 stretch, followed by steady growth through 2025.
Prairie Village – Prime Suburb With Price Momentum
Prairie Village is one of Johnson County’s most established and desirable suburbs. Its tree-lined streets, strong public schools, and proximity to Kansas City have long made it a go-to spot for buyers seeking charm and convenience.
Price growth accelerated in the early 2020s, driven by both local demand and national housing trends. Even now, with higher baseline values, home prices continue to tick upward. Its enduring appeal keeps Prairie Village firmly among Kansas’s most expensive towns.
9. Overland Park – 102% Home Price Increase Since 2010
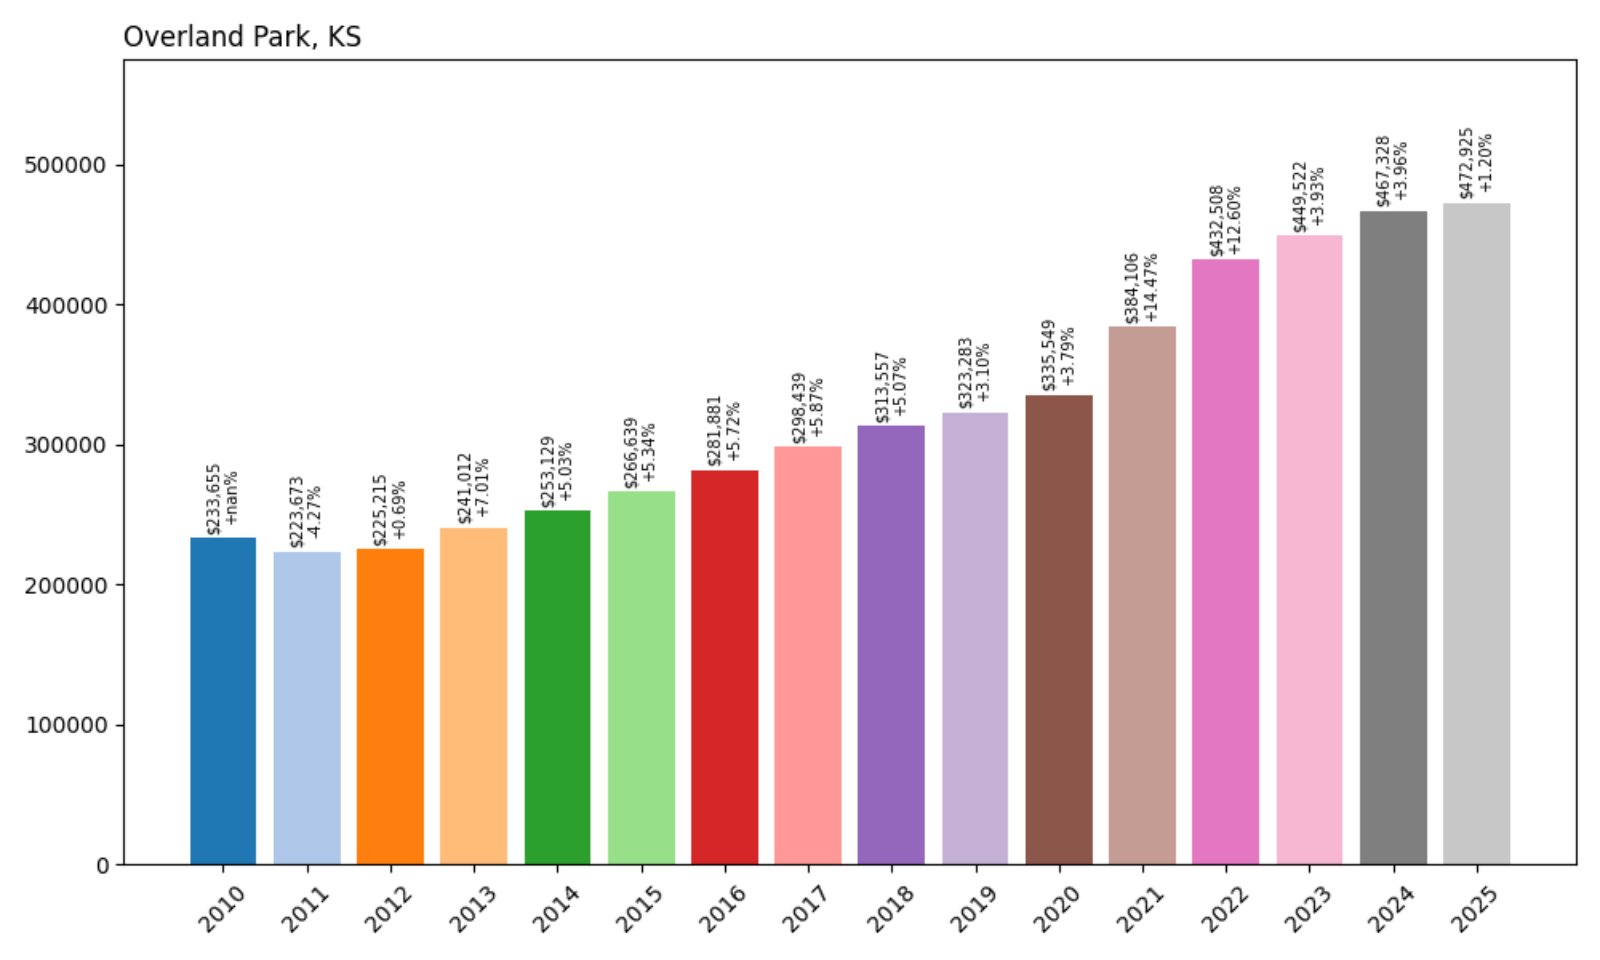
- 2010: $233,655
- 2011: $223,673 (−$9,981, −4.27% from previous year)
- 2012: $225,215 (+$1,541, +0.69% from previous year)
- 2013: $241,012 (+$15,797, +7.01% from previous year)
- 2014: $253,129 (+$12,117, +5.03% from previous year)
- 2015: $266,639 (+$13,510, +5.34% from previous year)
- 2016: $281,881 (+$15,242, +5.72% from previous year)
- 2017: $298,439 (+$16,559, +5.87% from previous year)
- 2018: $313,557 (+$15,118, +5.07% from previous year)
- 2019: $323,283 (+$9,725, +3.10% from previous year)
- 2020: $335,549 (+$12,267, +3.79% from previous year)
- 2021: $384,106 (+$48,557, +14.47% from previous year)
- 2022: $432,508 (+$48,402, +12.60% from previous year)
- 2023: $449,522 (+$17,015, +3.93% from previous year)
- 2024: $467,328 (+$17,805, +3.96% from previous year)
- 2025: $472,925 (+$5,597, +1.20% from previous year)
Overland Park home prices have risen 102% since 2010, with a steady upward trend that sped up during the pandemic. The median home now costs $472,925—more than double the 2010 price.
Overland Park – Business Hub Meets Residential Boom
Overland Park is Kansas’s second-largest city and one of the Midwest’s fastest-growing suburban centers. Anchored by strong public schools, Fortune 500 employers, and retail development, it has drawn consistent demand for years.
Prices surged in 2021 and 2022 with over $96,000 in combined annual gains. That rate has slowed, but appreciation continues. Overland Park remains a strong performer thanks to its amenities, jobs, and deep buyer pool.
8. Eastborough – 83% Home Price Increase Since 2010
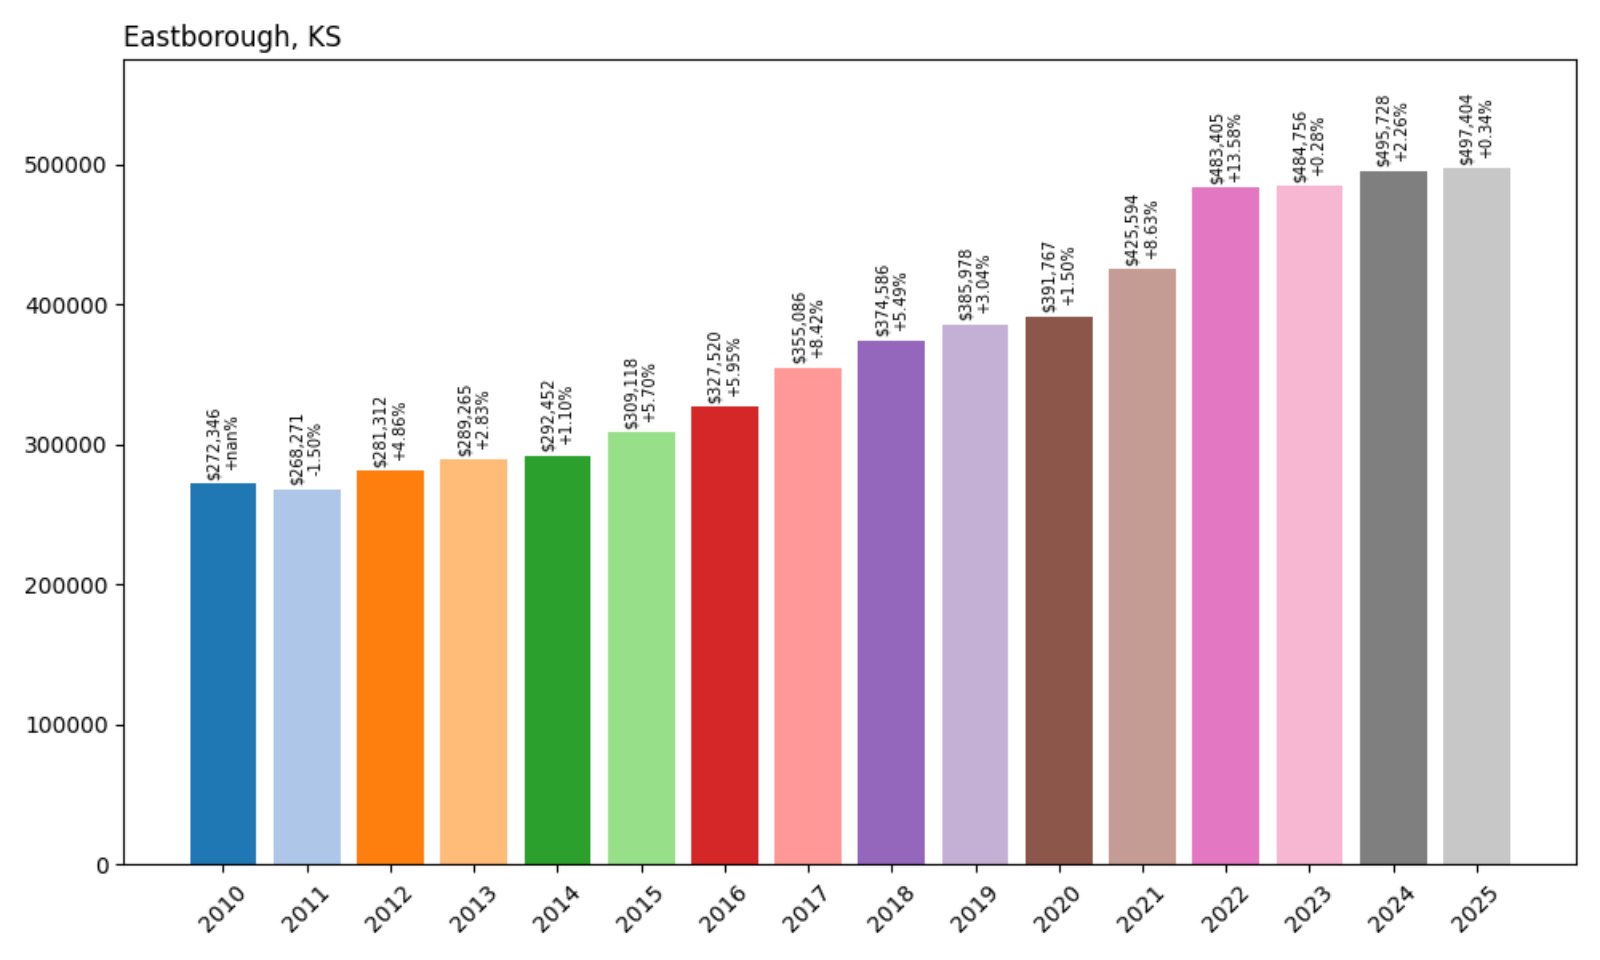
- 2010: $272,346
- 2011: $268,271 (−$4,075, −1.50% from previous year)
- 2012: $281,312 (+$13,042, +4.86% from previous year)
- 2013: $289,265 (+$7,953, +2.83% from previous year)
- 2014: $292,452 (+$3,186, +1.10% from previous year)
- 2015: $309,118 (+$16,666, +5.70% from previous year)
- 2016: $327,520 (+$18,402, +5.95% from previous year)
- 2017: $355,086 (+$27,566, +8.42% from previous year)
- 2018: $374,586 (+$19,500, +5.49% from previous year)
- 2019: $385,978 (+$11,392, +3.04% from previous year)
- 2020: $391,767 (+$5,789, +1.50% from previous year)
- 2021: $425,594 (+$33,827, +8.63% from previous year)
- 2022: $483,405 (+$57,811, +13.58% from previous year)
- 2023: $484,756 (+$1,351, +0.28% from previous year)
- 2024: $495,728 (+$10,972, +2.26% from previous year)
- 2025: $497,404 (+$1,675, +0.34% from previous year)
Eastborough’s home prices have increased 83% since 2010. Though recent growth has slowed, the town saw substantial gains through the 2010s and early 2020s, reaching nearly $500K in 2025.
Eastborough – Classic Homes, Lasting Value
Located within Wichita, Eastborough is a small independent city known for its tree-lined streets and elegant homes. With strict zoning and a long-standing reputation for prestige, Eastborough consistently ranks among Kansas’s priciest places.
The post-2020 boom brought a 13.5% jump in 2022 alone, but values have largely plateaued since then. Even so, Eastborough remains a stable high-value market with unique architecture, quiet streets, and a close-knit feel.
7. Fairway – 102% Home Price Increase Since 2010
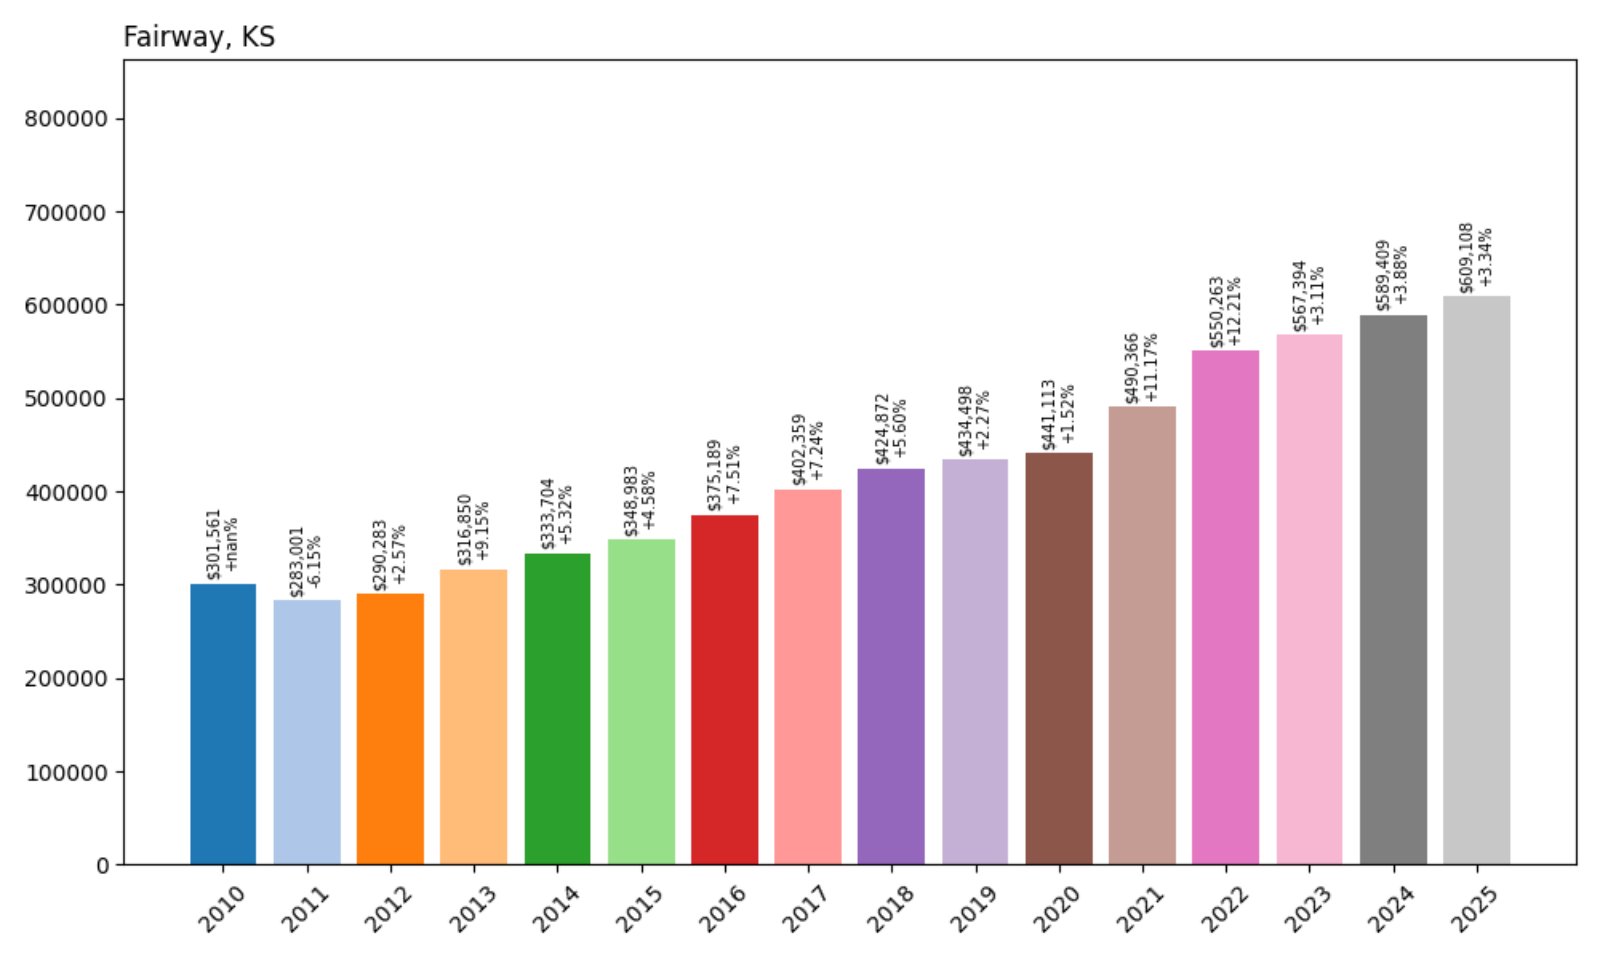
- 2010: $301,561
- 2011: $283,001 (−$18,559, −6.15% from previous year)
- 2012: $290,283 (+$7,282, +2.57% from previous year)
- 2013: $316,850 (+$26,566, +9.15% from previous year)
- 2014: $333,704 (+$16,854, +5.32% from previous year)
- 2015: $348,983 (+$15,280, +4.58% from previous year)
- 2016: $375,189 (+$26,206, +7.51% from previous year)
- 2017: $402,359 (+$27,169, +7.24% from previous year)
- 2018: $424,872 (+$22,513, +5.60% from previous year)
- 2019: $434,498 (+$9,626, +2.27% from previous year)
- 2020: $441,113 (+$6,615, +1.52% from previous year)
- 2021: $490,366 (+$49,253, +11.17% from previous year)
- 2022: $550,263 (+$59,896, +12.21% from previous year)
- 2023: $567,394 (+$17,132, +3.11% from previous year)
- 2024: $589,409 (+$22,014, +3.88% from previous year)
- 2025: $609,108 (+$19,699, +3.34% from previous year)
Fairway home prices have more than doubled since 2010, with a 102% increase and a current median of $609,108. The steepest rise occurred between 2020 and 2022, with prices jumping over $100,000.
Fairway – Charming, Central, and Climbing
Fairway, just north of Mission Hills, is a small but highly desirable Johnson County enclave. With attractive homes, tree cover, and walkability, it appeals to buyers looking for character and location.
The early 2020s brought steep price gains, particularly in 2021 and 2022. While growth has slowed, prices remain high thanks to the town’s limited size and consistent demand from families and professionals.
6. Westwood Hills – 98% Home Price Increase Since 2010
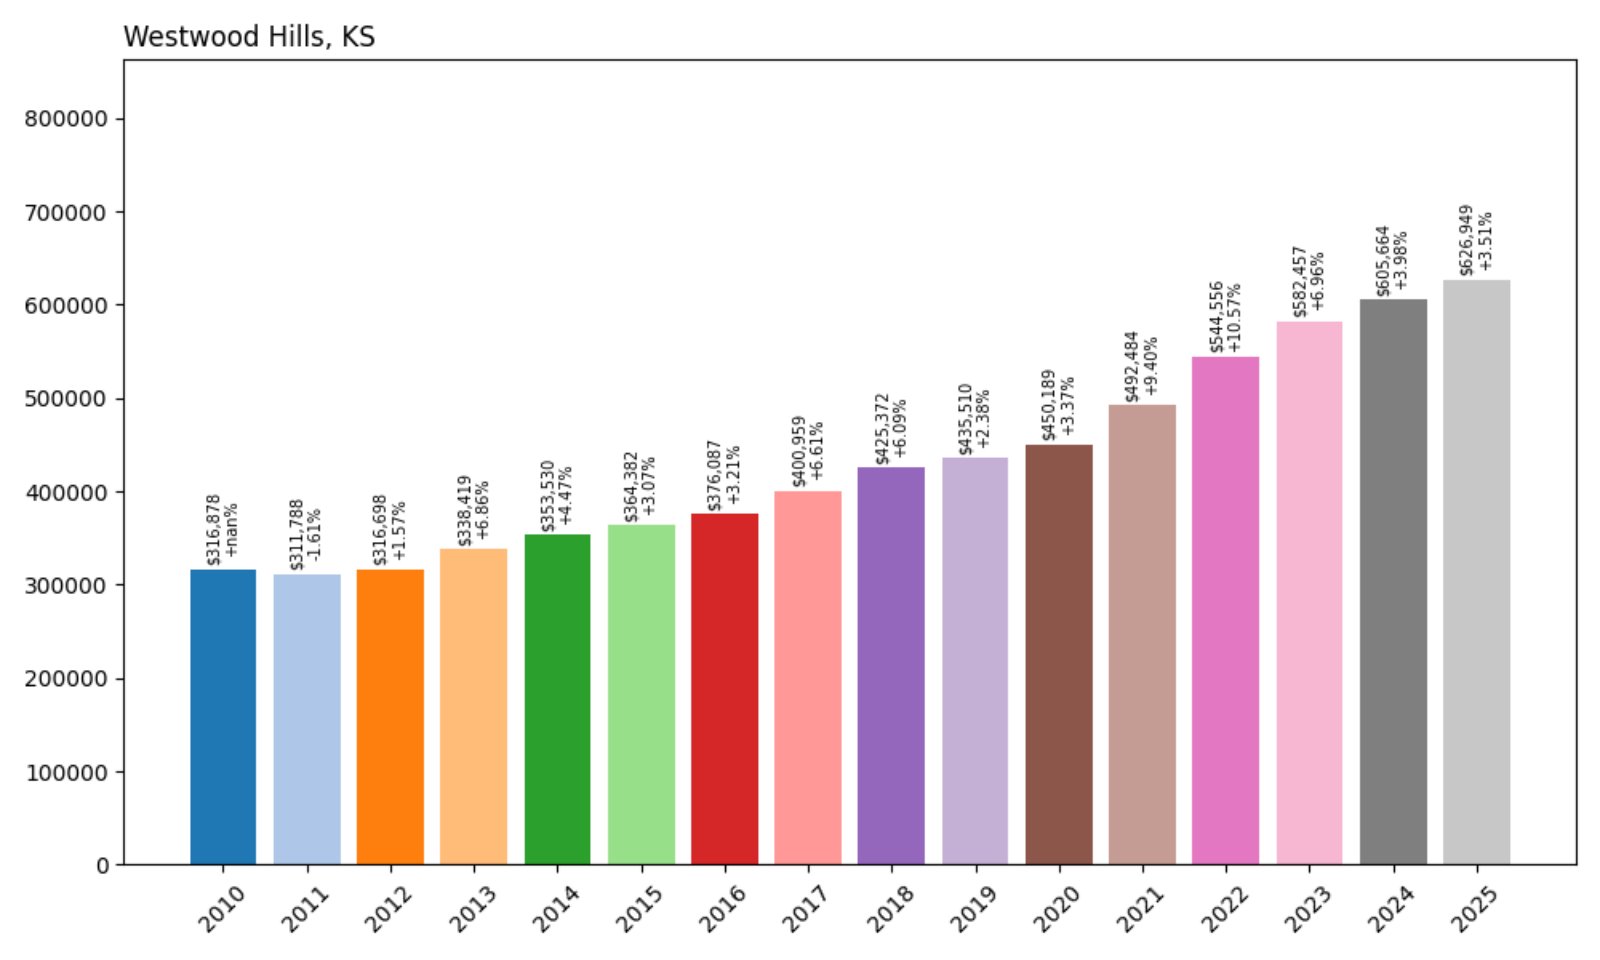
- 2010: $316,878
- 2011: $311,788 (−$5,091, −1.61% from previous year)
- 2012: $316,698 (+$4,910, +1.57% from previous year)
- 2013: $338,419 (+$21,721, +6.86% from previous year)
- 2014: $353,530 (+$15,111, +4.47% from previous year)
- 2015: $364,382 (+$10,852, +3.07% from previous year)
- 2016: $376,087 (+$11,705, +3.21% from previous year)
- 2017: $400,959 (+$24,872, +6.61% from previous year)
- 2018: $425,372 (+$24,413, +6.09% from previous year)
- 2019: $435,510 (+$10,138, +2.38% from previous year)
- 2020: $450,189 (+$14,679, +3.37% from previous year)
- 2021: $492,484 (+$42,295, +9.40% from previous year)
- 2022: $544,556 (+$52,072, +10.57% from previous year)
- 2023: $582,457 (+$37,901, +6.96% from previous year)
- 2024: $605,664 (+$23,208, +3.98% from previous year)
- 2025: $626,949 (+$21,285, +3.51% from previous year)
Westwood Hills has seen home values nearly double since 2010, with a 98% increase bringing the 2025 median price to $626,949. Gains have been steady and sustained over 15 years.
Westwood Hills – Timeless Homes, Strong Market
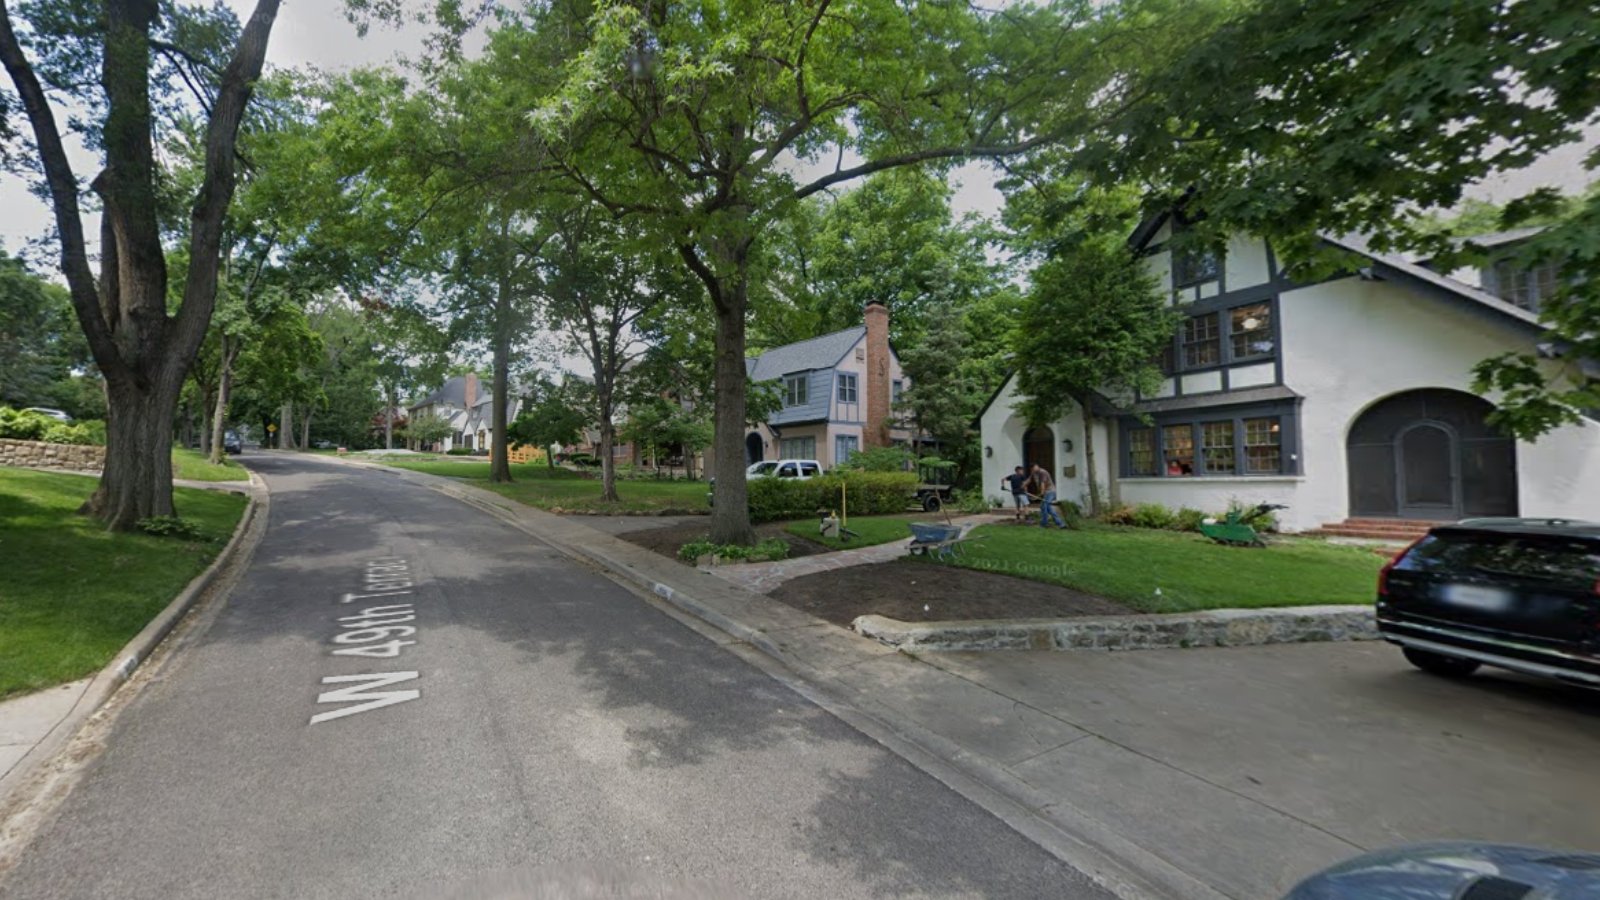
Westwood Hills is one of the smallest municipalities in Johnson County but packs plenty of character into its leafy blocks. Its historic homes and close proximity to Kansas City make it a top-tier choice for high-end buyers.
The town’s market has remained strong through all cycles, with big jumps in 2021 and 2022. With limited inventory and lasting curb appeal, Westwood Hills continues to command premium prices.
5. Bucyrus – 140% Home Price Increase Since June 2010
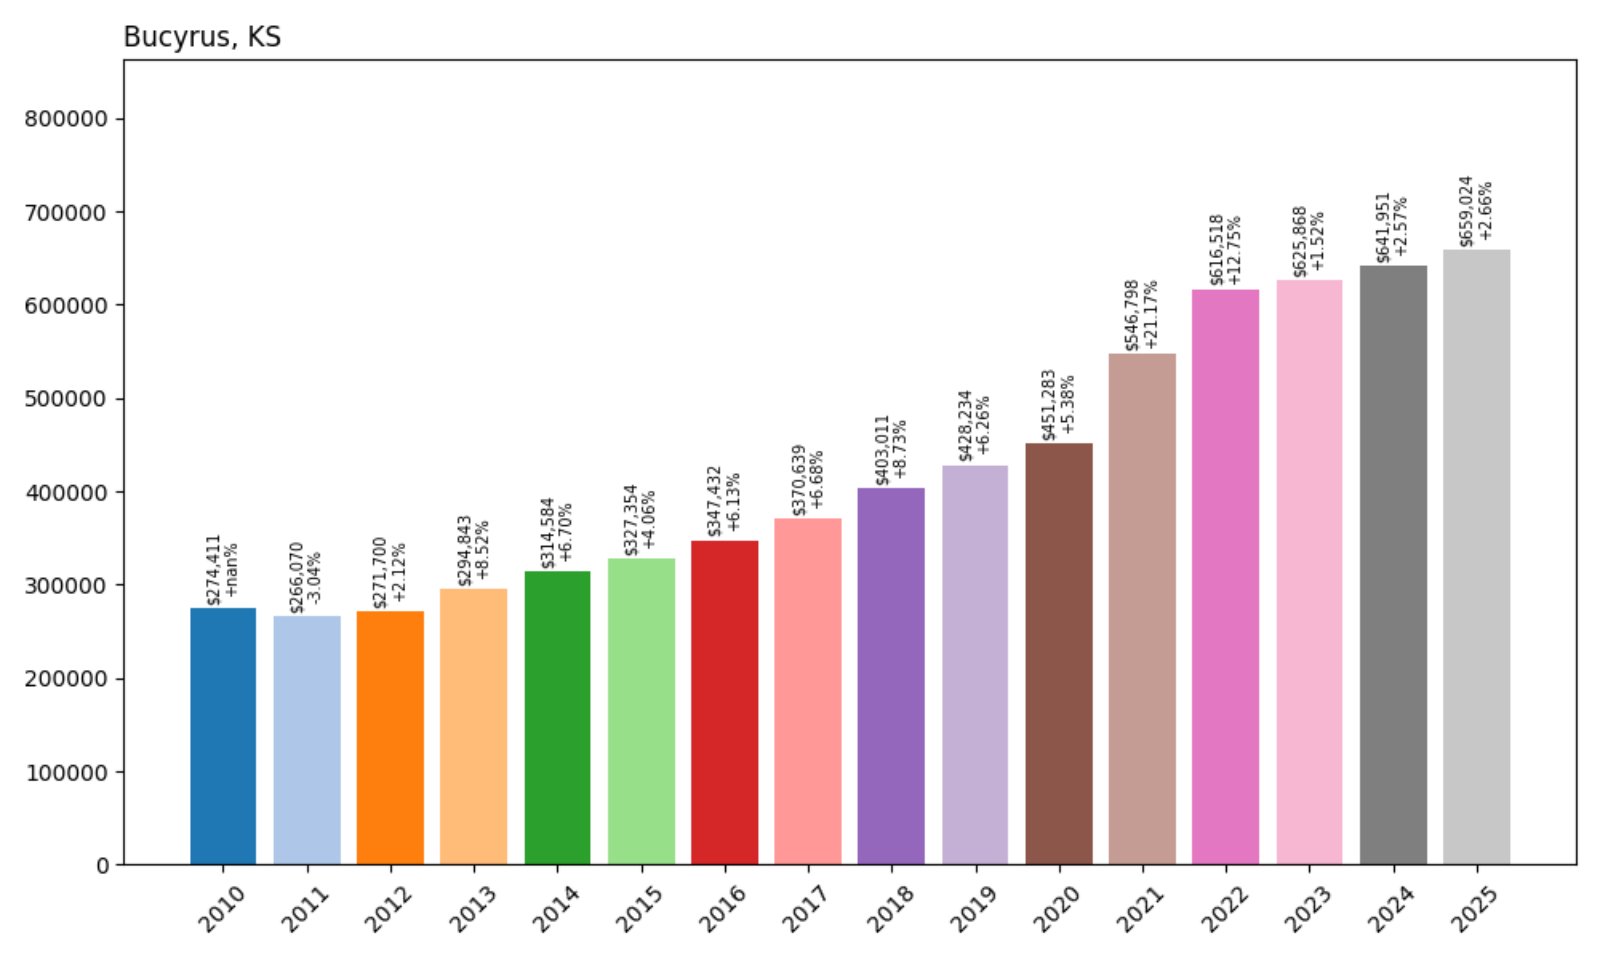
- 2010: $274,411
- 2011: $266,070 (−$8,341, −3.04% from previous year)
- 2012: $271,700 (+$5,630, +2.12% from previous year)
- 2013: $294,843 (+$23,143, +8.52% from previous year)
- 2014: $314,584 (+$19,741, +6.69% from previous year)
- 2015: $327,354 (+$12,770, +4.06% from previous year)
- 2016: $347,432 (+$20,078, +6.13% from previous year)
- 2017: $370,639 (+$23,206, +6.68% from previous year)
- 2018: $403,011 (+$32,372, +8.73% from previous year)
- 2019: $428,234 (+$25,223, +6.26% from previous year)
- 2020: $451,283 (+$23,050, +5.38% from previous year)
- 2021: $546,798 (+$95,515, +21.16% from previous year)
- 2022: $616,518 (+$69,720, +12.75% from previous year)
- 2023: $625,868 (+$9,350, +1.52% from previous year)
- 2024: $641,951 (+$16,083, +2.57% from previous year)
- 2025: $659,024 (+$17,073, +2.66% from previous year)
Bucyrus home values have surged by 140% since 2010, more than doubling from $274K to over $659K in 2025. The sharpest climb came between 2020 and 2022, when prices jumped over $165,000 in just two years.
Bucyrus – A Rural Retreat With Rising Demand
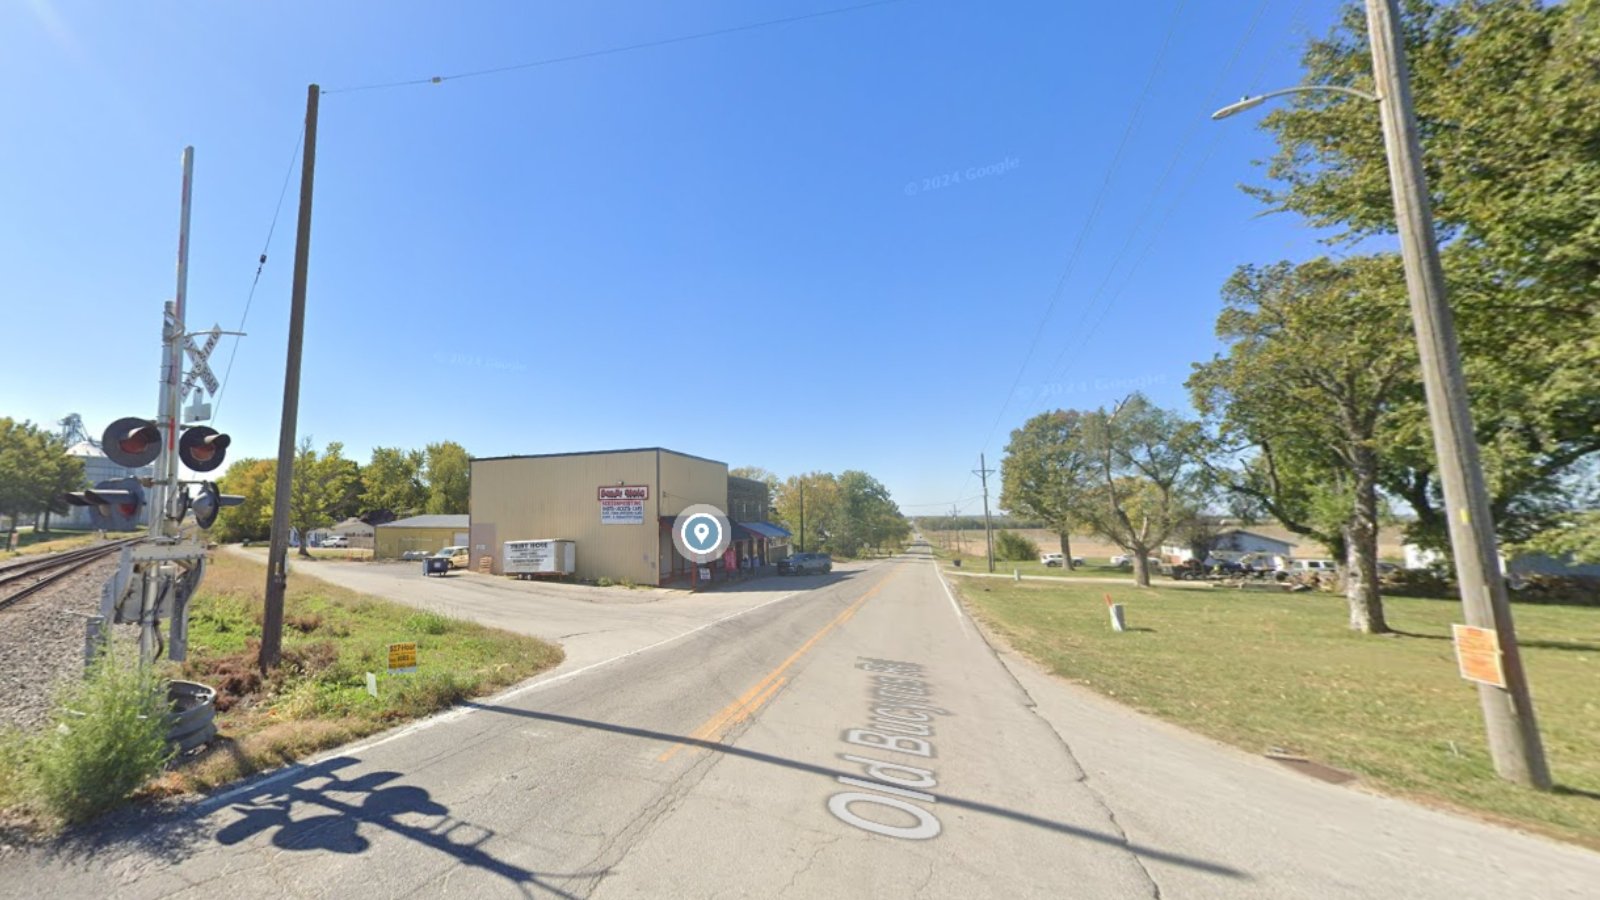
Situated just south of Overland Park, Bucyrus blends rural charm with upscale homes and larger lots. Buyers drawn to space and custom-built homes have pushed values steadily higher over the past decade.
What used to be a quiet country town now attracts affluent households looking for a peaceful escape within commuting distance of the city. That growing appeal has made Bucyrus a serious player in the high-end Kansas market.
4. Leawood – 89% Home Price Increase Since June 2010
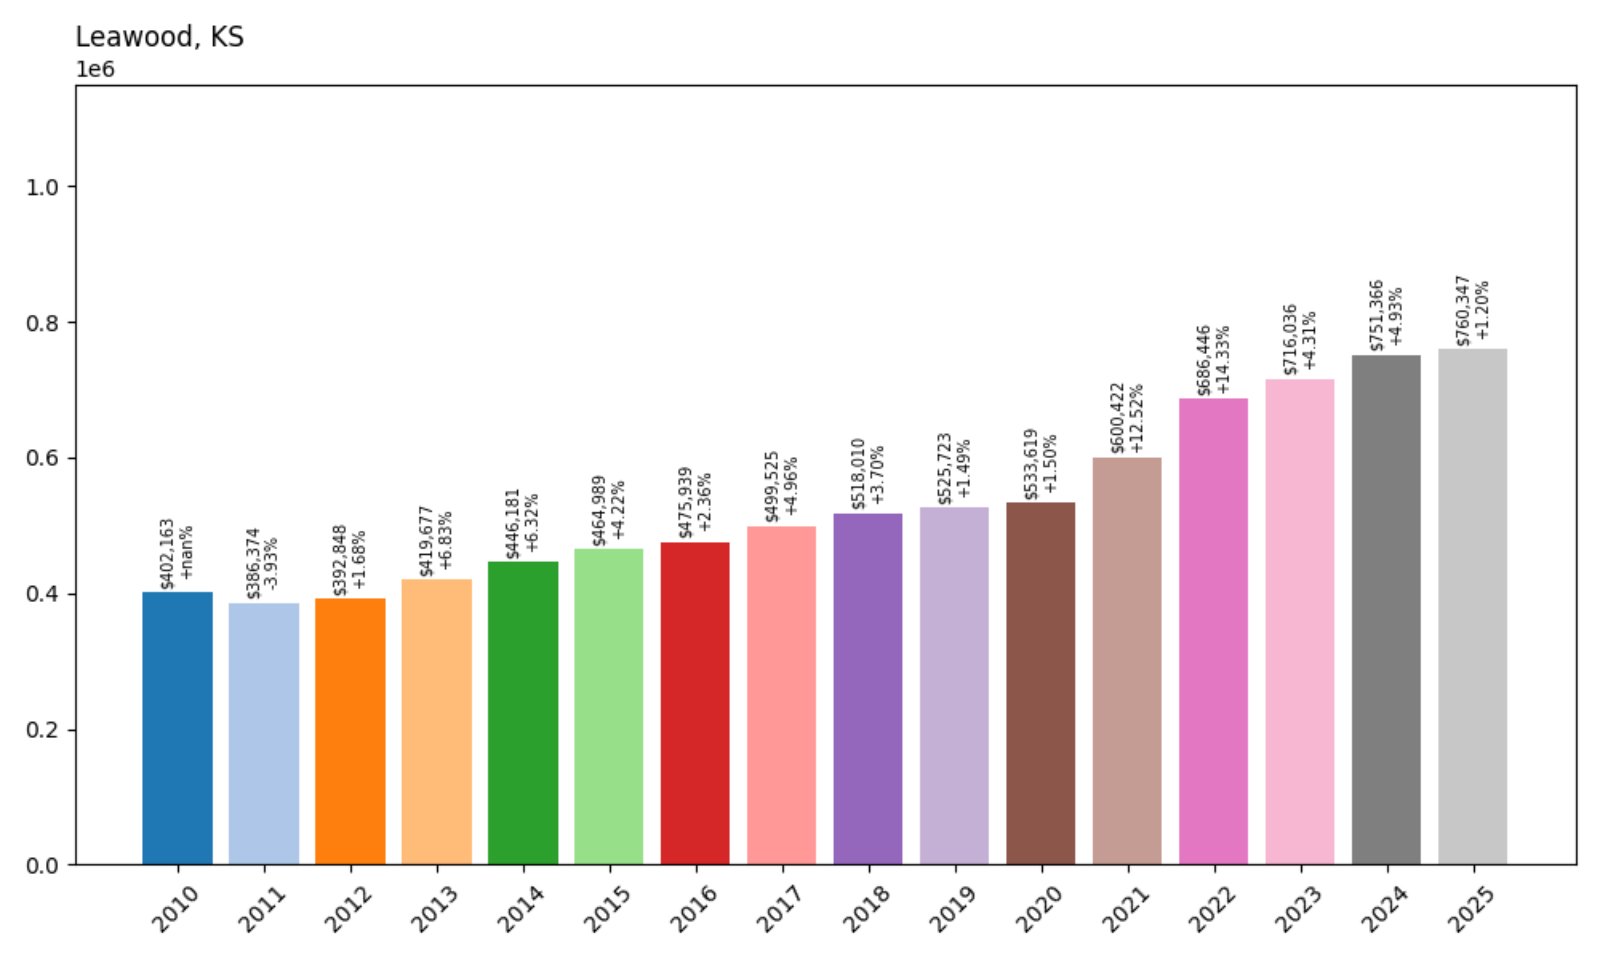
- 2010: $402,163
- 2011: $386,374 (−$15,788, −3.93% from previous year)
- 2012: $392,848 (+$6,474, +1.68% from previous year)
- 2013: $419,677 (+$26,829, +6.83% from previous year)
- 2014: $446,181 (+$26,504, +6.31% from previous year)
- 2015: $464,989 (+$18,808, +4.21% from previous year)
- 2016: $475,939 (+$10,950, +2.35% from previous year)
- 2017: $499,525 (+$23,587, +4.96% from previous year)
- 2018: $518,010 (+$18,485, +3.70% from previous year)
- 2019: $525,723 (+$7,713, +1.49% from previous year)
- 2020: $533,619 (+$7,896, +1.50% from previous year)
- 2021: $600,422 (+$66,803, +12.52% from previous year)
- 2022: $686,446 (+$86,024, +14.33% from previous year)
- 2023: $716,036 (+$29,590, +4.31% from previous year)
- 2024: $751,366 (+$35,330, +4.94% from previous year)
- 2025: $760,347 (+$8,981, +1.19% from previous year)
Home values in Leawood are up nearly 89% since 2010, moving from $402K to just over $760K. The largest gains happened in 2021 and 2022, when values surged by more than $150,000 in two years.
Leawood – Upscale Living in the Heart of Johnson County
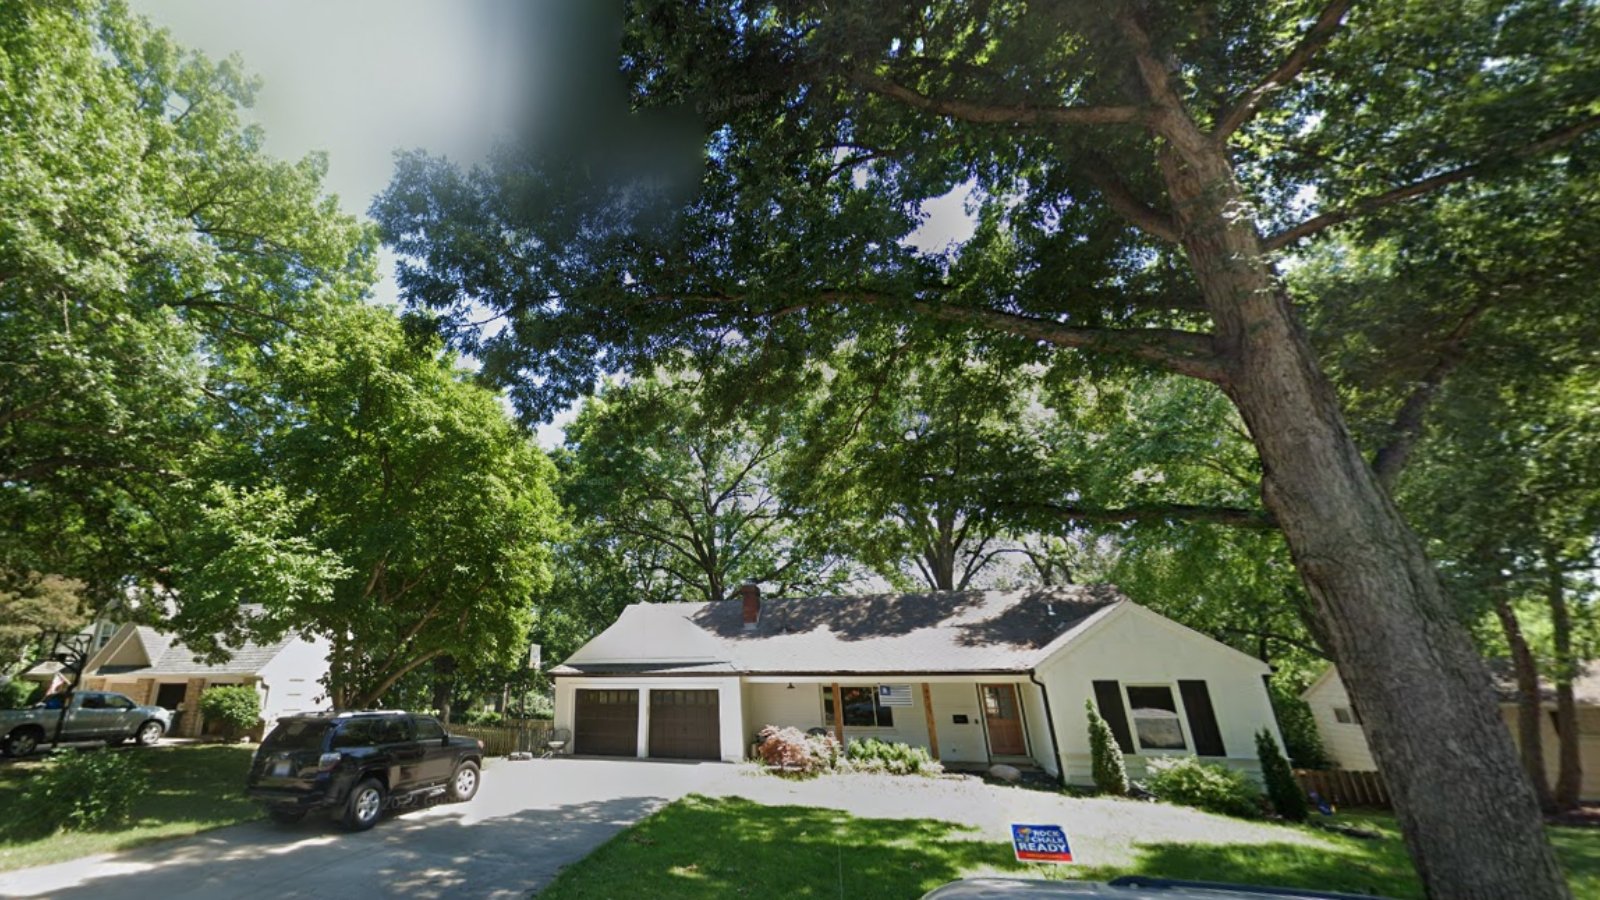
Leawood offers luxury living with well-established neighborhoods, excellent schools, and premium retail. It’s a top destination for Kansas families looking for both comfort and curb appeal.
Price growth has been strong and steady, particularly after 2020. As demand for high-end homes continues, Leawood remains one of the most desirable and stable housing markets in the state.
3. Mission Woods – 82% Home Price Increase Since June 2012
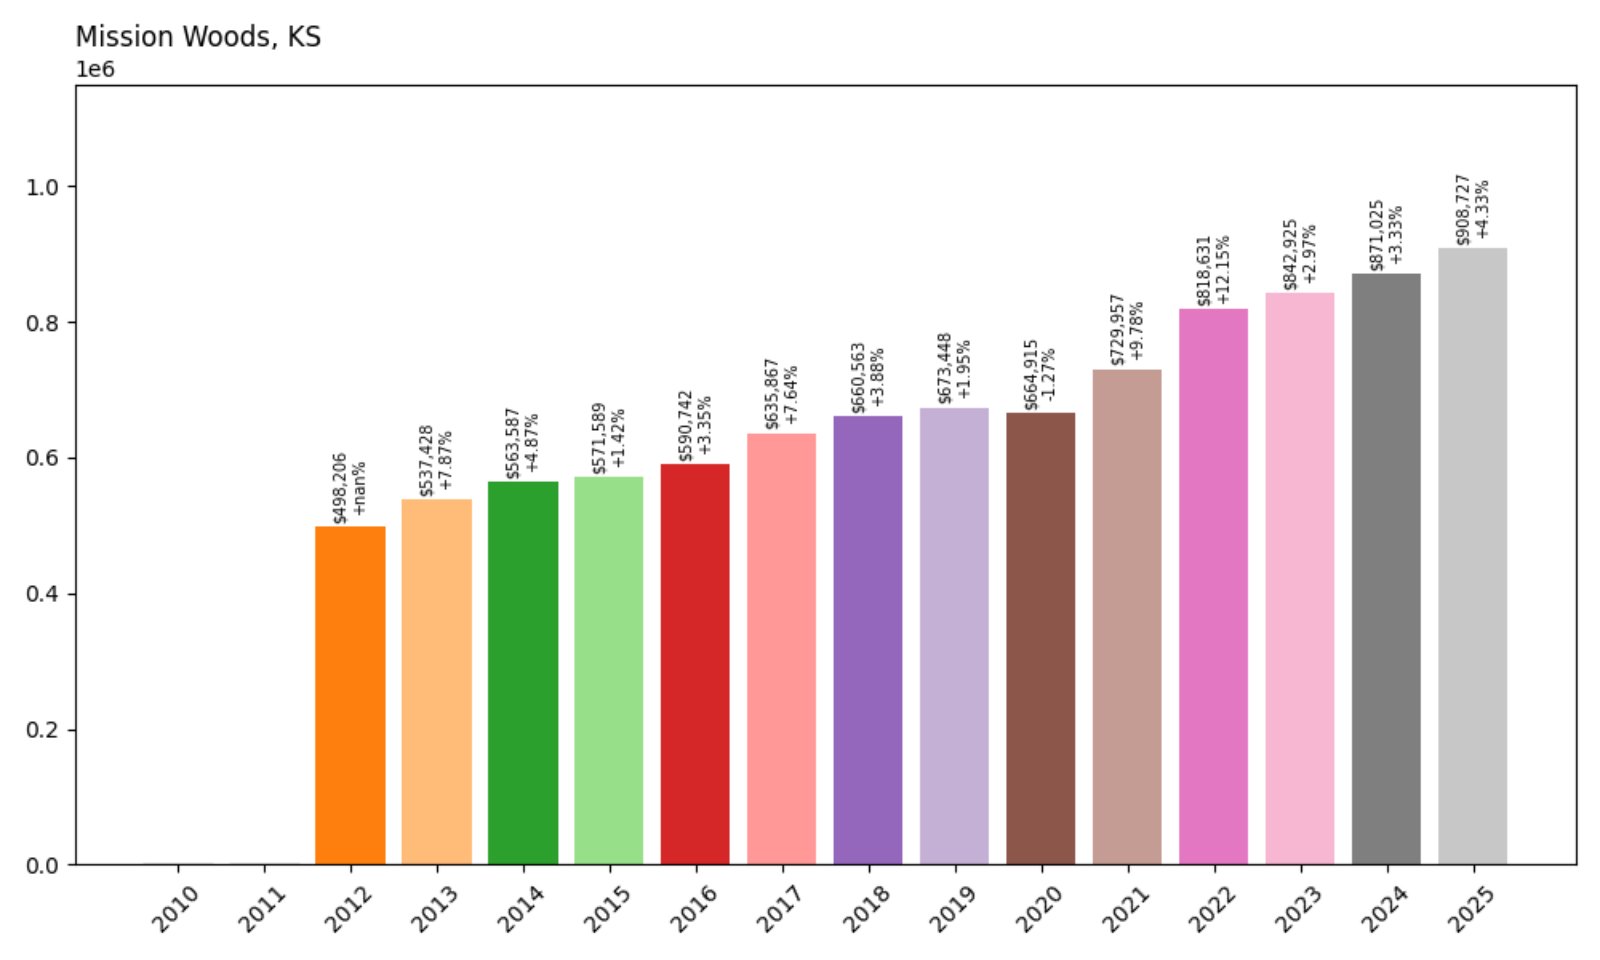
- 2012: $498,206
- 2013: $537,428 (+$39,222, +7.87% from previous year)
- 2014: $563,587 (+$26,159, +4.87% from previous year)
- 2015: $571,589 (+$8,002, +1.42% from previous year)
- 2016: $590,742 (+$19,153, +3.35% from previous year)
- 2017: $635,867 (+$45,126, +7.64% from previous year)
- 2018: $660,563 (+$24,697, +3.88% from previous year)
- 2019: $673,448 (+$12,885, +1.95% from previous year)
- 2020: $664,915 (−$8,533, −1.27% from previous year)
- 2021: $729,957 (+$65,042, +9.78% from previous year)
- 2022: $818,631 (+$88,673, +12.14% from previous year)
- 2023: $842,925 (+$24,294, +2.97% from previous year)
- 2024: $871,025 (+$28,100, +3.33% from previous year)
- 2025: $908,727 (+$37,702, +4.33% from previous year)
Since 2012, Mission Woods home values have grown 82%, reaching $908,727 in 2025. Annual increases have been consistent, particularly strong from 2020 onward.
Mission Woods – Prestige in a Small Package
Mission Woods is tiny but powerful in price. Nestled between Westwood Hills and Mission Hills, it offers historic homes and easy access to Kansas City.
Limited inventory and a peaceful setting contribute to strong appreciation. With under 200 homes, demand often outpaces supply—pushing values higher year after year.
2. Lake Quivira – 71% Home Price Increase Since June 2010
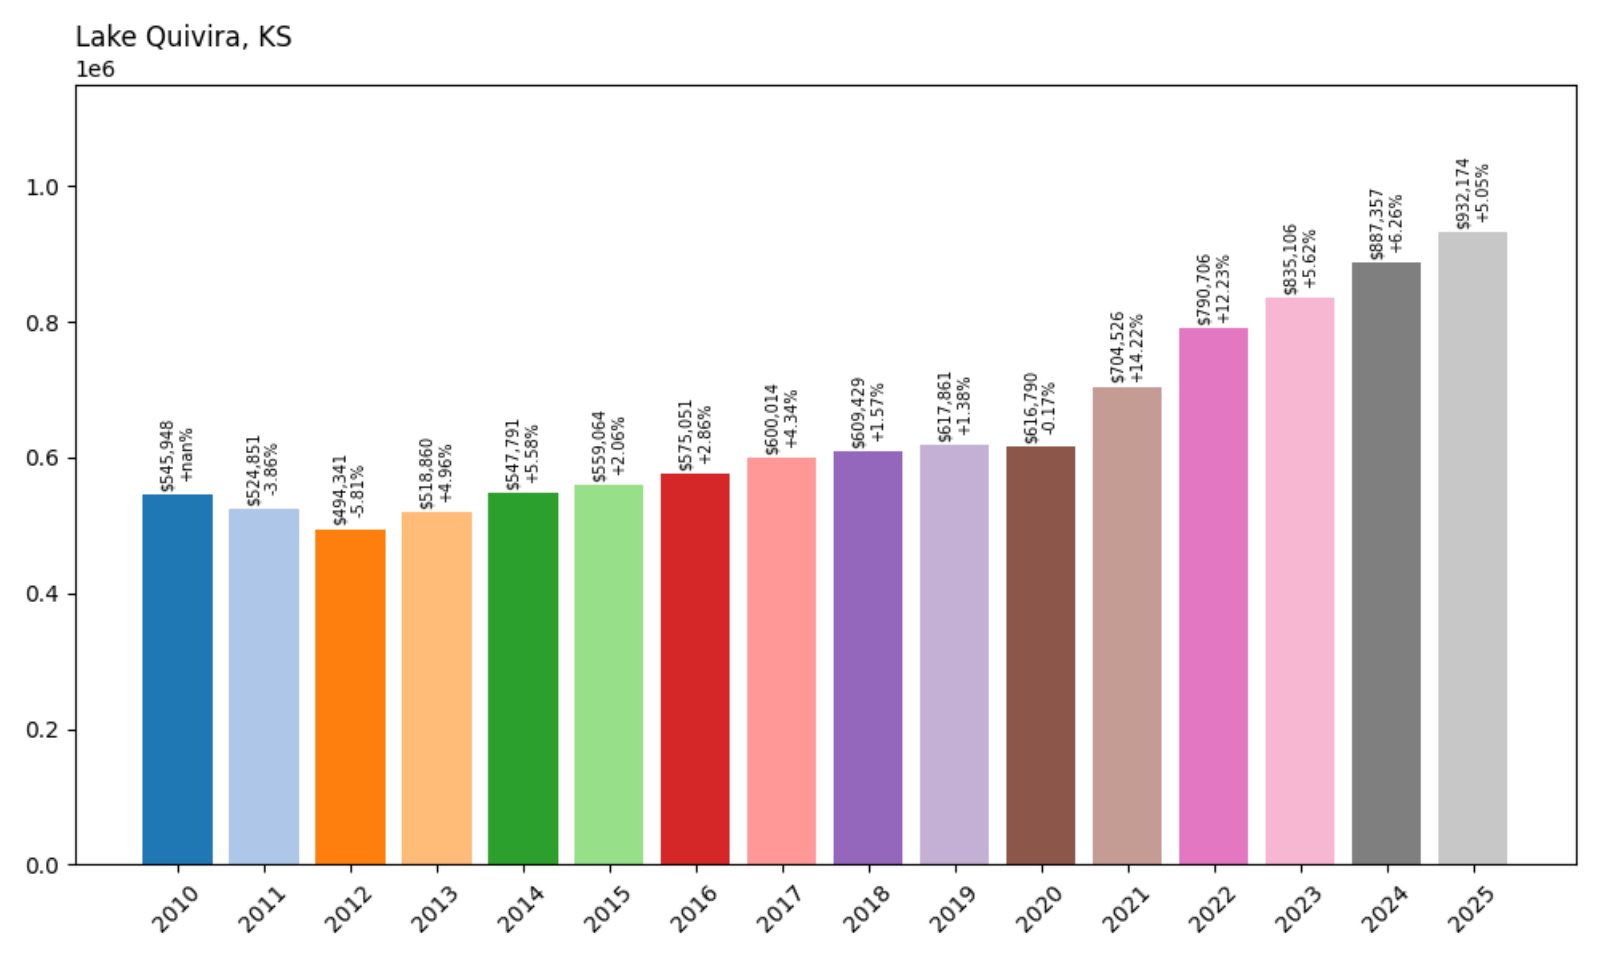
- 2010: $545,948
- 2011: $524,851 (−$21,097, −3.86% from previous year)
- 2012: $494,341 (−$30,510, −5.81% from previous year)
- 2013: $518,860 (+$24,519, +4.96% from previous year)
- 2014: $547,791 (+$28,931, +5.58% from previous year)
- 2015: $559,064 (+$11,273, +2.06% from previous year)
- 2016: $575,051 (+$15,987, +2.86% from previous year)
- 2017: $600,014 (+$24,962, +4.34% from previous year)
- 2018: $609,429 (+$9,415, +1.57% from previous year)
- 2019: $617,861 (+$8,432, +1.38% from previous year)
- 2020: $616,790 (−$1,071, −0.17% from previous year)
- 2021: $704,526 (+$87,736, +14.22% from previous year)
- 2022: $790,706 (+$86,180, +12.23% from previous year)
- 2023: $835,106 (+$44,400, +5.62% from previous year)
- 2024: $887,357 (+$52,251, +6.26% from previous year)
- 2025: $932,174 (+$44,817, +5.05% from previous year)
Lake Quivira homes have appreciated by 71% since 2010. The most dramatic growth came post-2020, with strong double-digit annual gains in 2021 and 2022.
Lake Quivira – Lakeside Luxury With a Private Touch
This gated lakefront community west of Kansas City features waterfront homes, a private golf course, and resort-style amenities. It’s a unique blend of exclusivity and natural beauty.
While values held steady pre-2020, the pandemic spurred renewed interest. Buyers now compete for rare listings, keeping Lake Quivira one of the state’s top luxury markets.
1. Mission Hills – 86% Home Price Increase Since June 2010
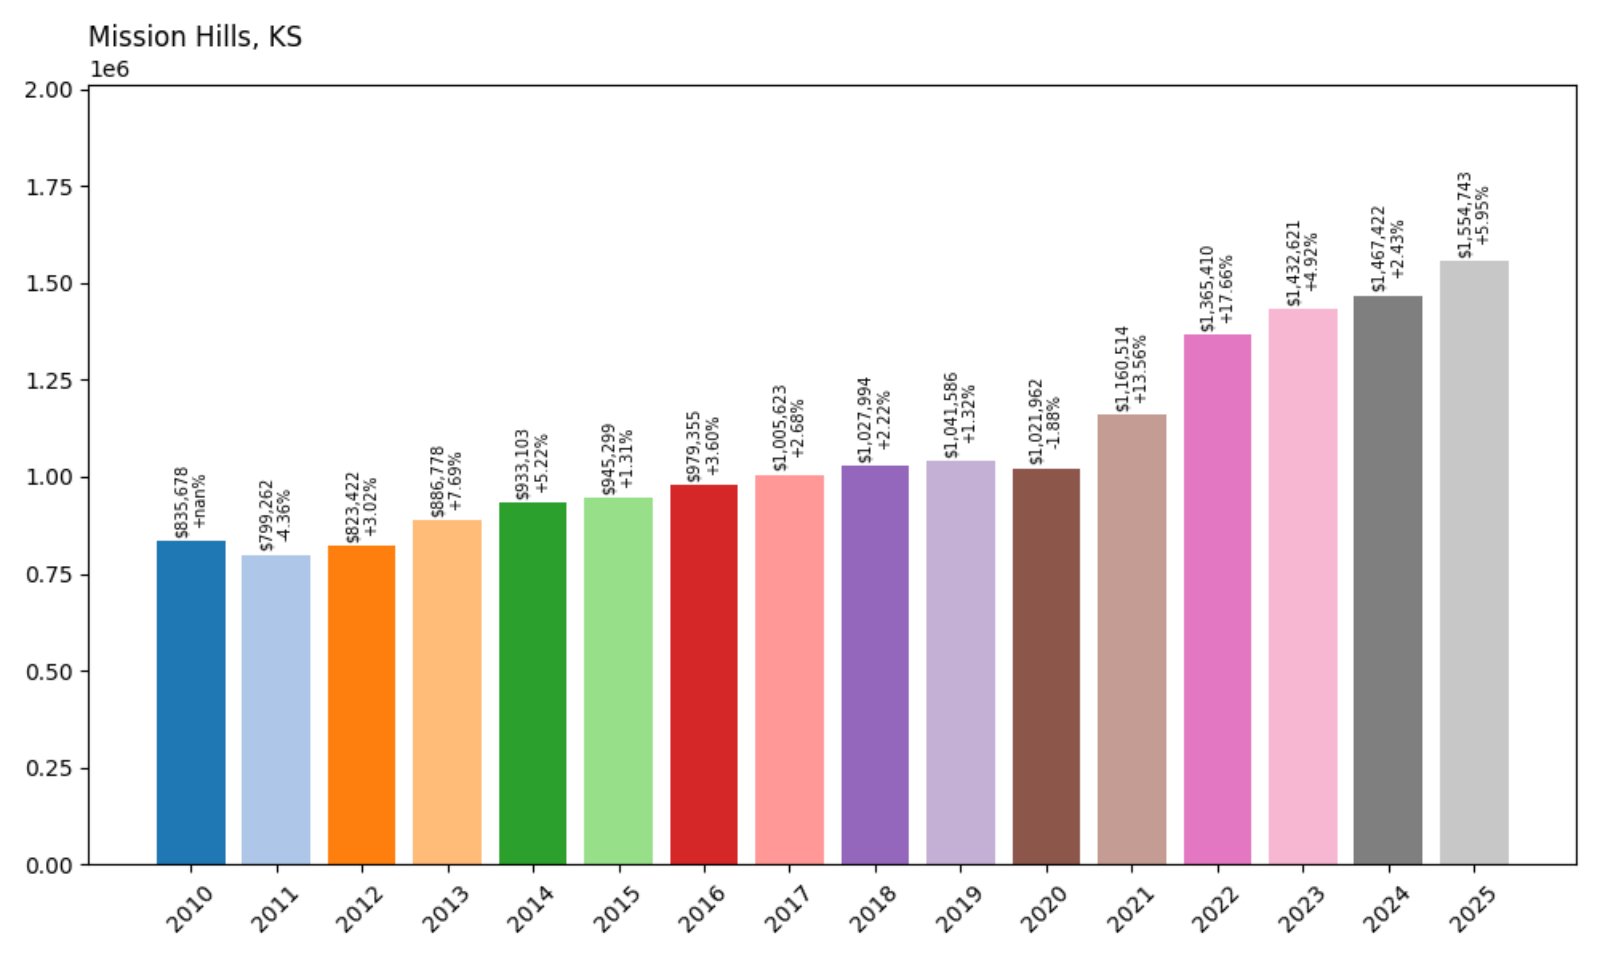
- 2010: $835,678
- 2011: $799,262 (−$36,416, −4.36% from previous year)
- 2012: $823,422 (+$24,160, +3.02% from previous year)
- 2013: $886,778 (+$63,356, +7.70% from previous year)
- 2014: $933,103 (+$46,325, +5.23% from previous year)
- 2015: $945,299 (+$12,196, +1.31% from previous year)
- 2016: $979,355 (+$34,057, +3.60% from previous year)
- 2017: $1,005,623 (+$26,268, +2.68% from previous year)
- 2018: $1,027,994 (+$22,372, +2.22% from previous year)
- 2019: $1,041,586 (+$13,592, +1.32% from previous year)
- 2020: $1,021,962 (−$19,625, −1.88% from previous year)
- 2021: $1,160,514 (+$138,552, +13.56% from previous year)
- 2022: $1,365,410 (+$204,896, +17.66% from previous year)
- 2023: $1,432,621 (+$67,211, +4.92% from previous year)
- 2024: $1,467,422 (+$34,801, +2.43% from previous year)
- 2025: $1,554,743 (+$87,321, +5.95% from previous year)
Mission Hills is Kansas’s most expensive town, with home values climbing from $835,678 to $1.55 million over 15 years—an 86% increase. The luxury market here saw its biggest gains after 2020.
Mission Hills – Kansas’s Pinnacle of Prestige
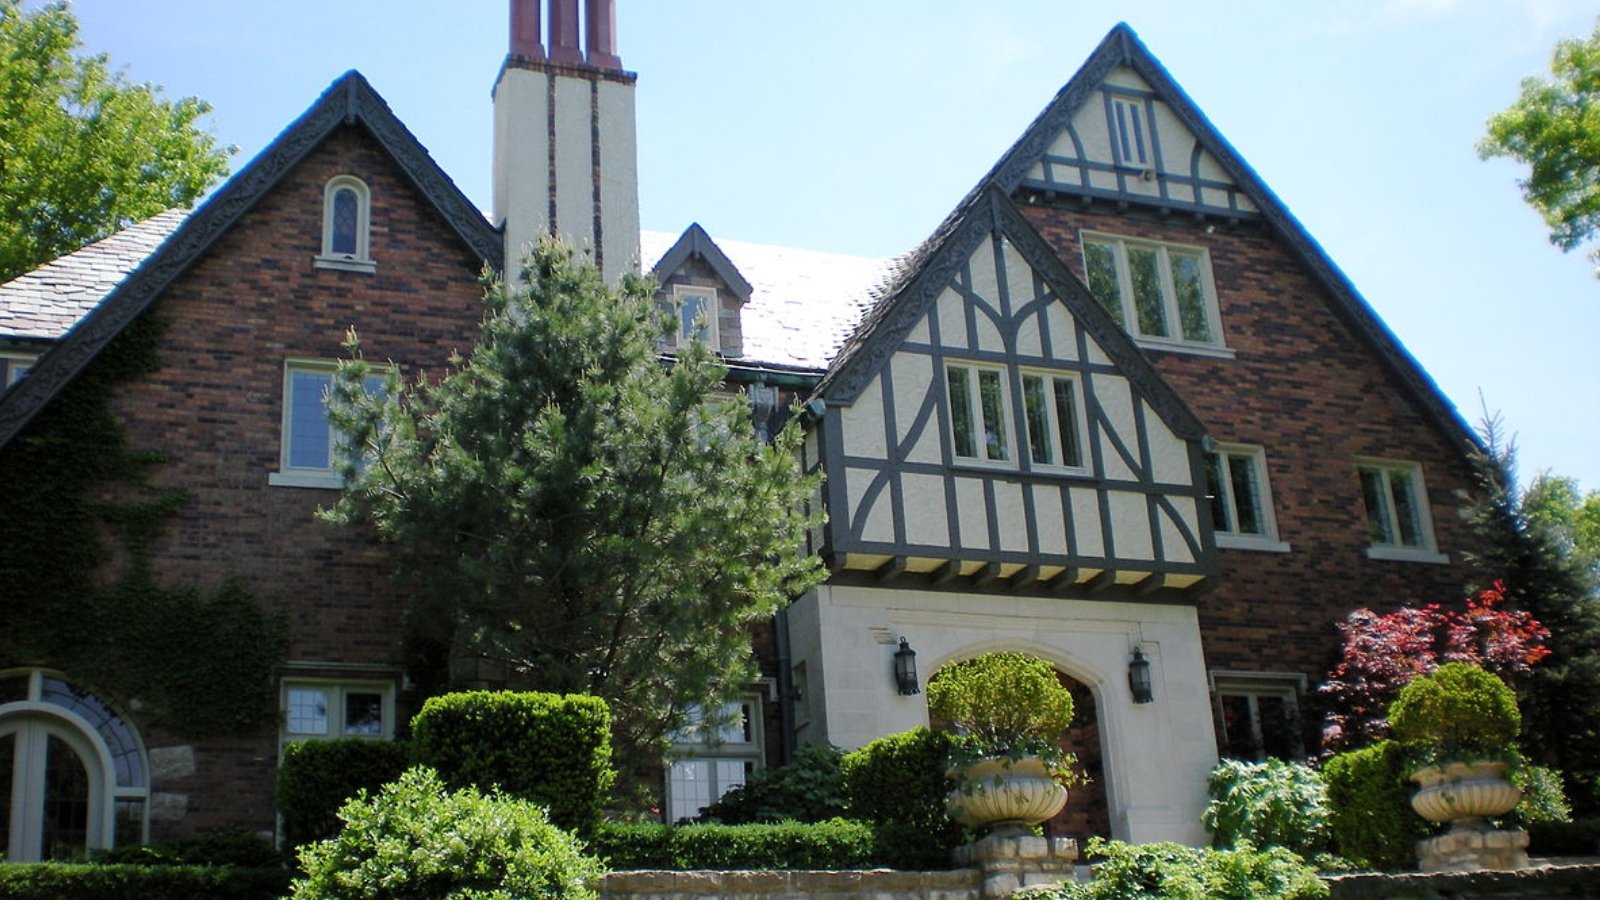
Mission Hills is synonymous with affluence. Its manicured estates, historic homes, and proximity to Kansas City Country Club make it the premier address in the state.
Buyers pay top dollar for exclusivity and architectural beauty. Even with values already high, Mission Hills continues to appreciate—and it shows no sign of slowing down.


