🔥 Would you like to save this?
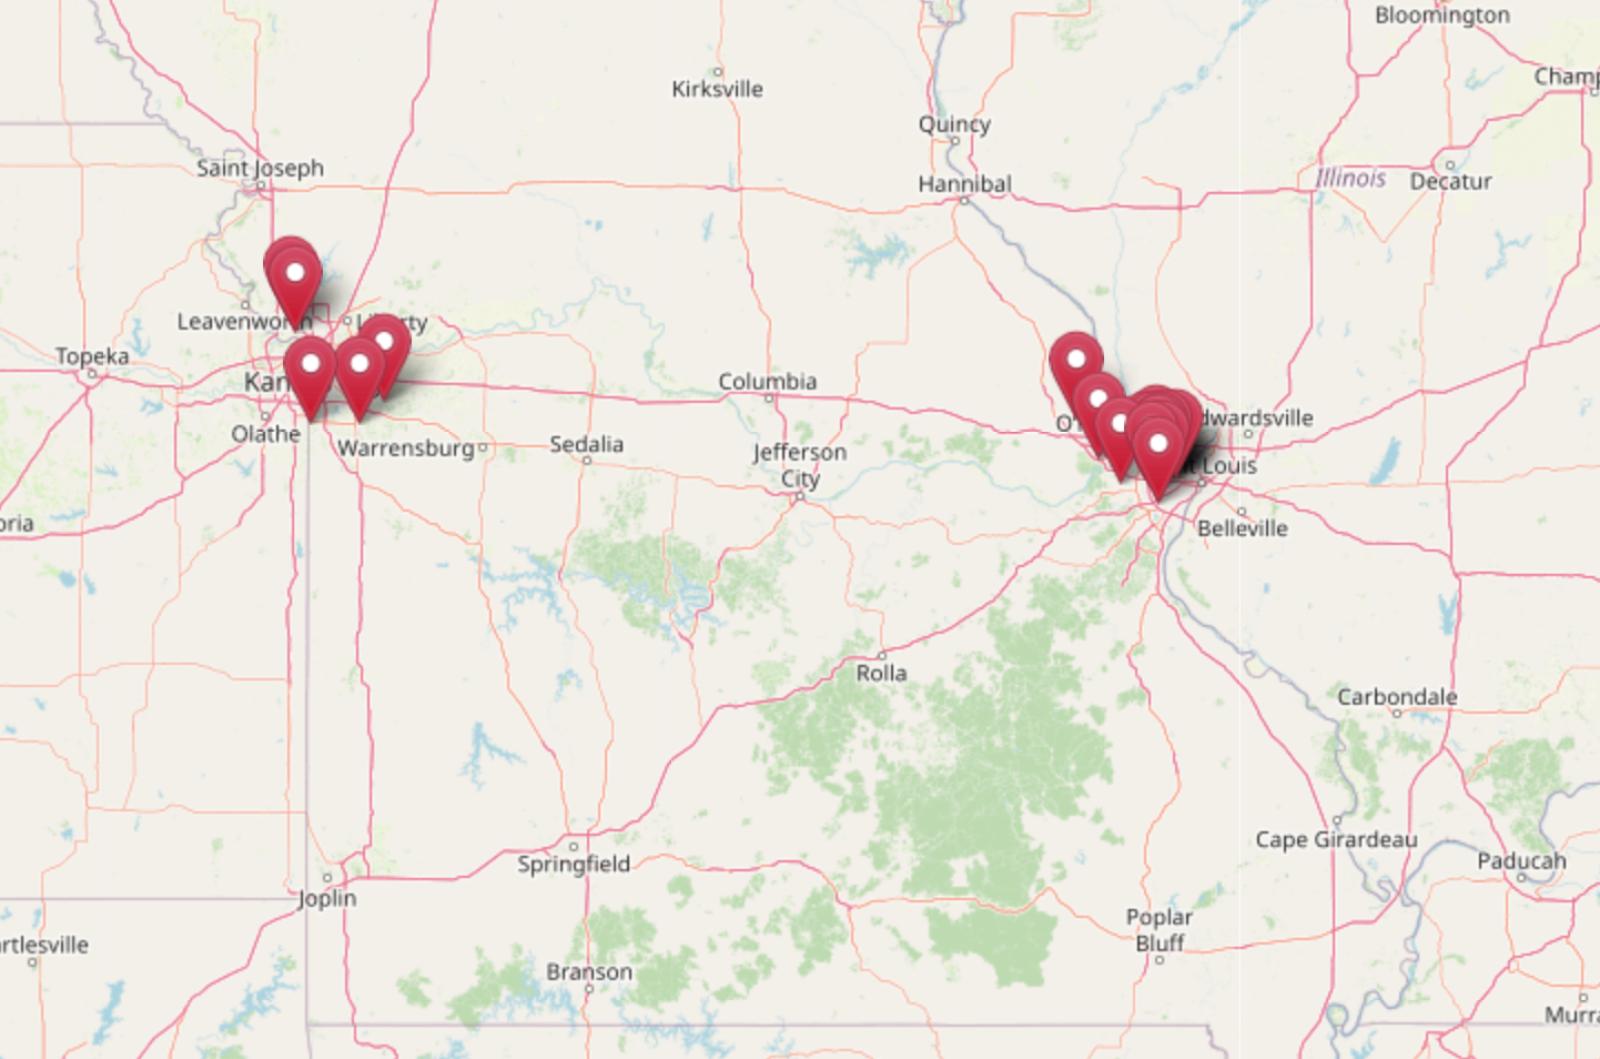
Missouri’s most expensive towns aren’t just clustered near big cities—they’re shaping the state’s entire housing market. Using the Zillow Home Values Index, analysts have pinpointed 19 communities where property prices soar well above the state average. From lakeside resorts to exclusive suburbs around St. Louis and Kansas City, these markets show what consistent demand and limited inventory can do to home values. Some areas have seen prices double in just five years, while others rely on long-standing luxury appeal to maintain sky-high property costs.
19. Flint Hill – 92% Home Price Increase Since 2013

- 2010: N/A
- 2011: N/A
- 2012: N/A
- 2013: $297,236
- 2014: $311,273 (+$14,037, +4.72% from previous year)
- 2015: $324,628 (+$13,355, +4.29% from previous year)
- 2016: $345,151 (+$20,523, +6.32% from previous year)
- 2017: $362,473 (+$17,322, +5.02% from previous year)
- 2018: $374,737 (+$12,264, +3.38% from previous year)
- 2019: $392,565 (+$17,828, +4.76% from previous year)
- 2020: $408,717 (+$16,152, +4.11% from previous year)
- 2021: $460,011 (+$51,294, +12.55% from previous year)
- 2022: $525,579 (+$65,568, +14.25% from previous year)
- 2023: $533,581 (+$8,002, +1.52% from previous year)
- 2024: $549,515 (+$15,934, +2.99% from previous year)
- 2025: $571,483 (+$21,968, +4.00% from previous year)
Flint Hill’s housing market has seen steady growth since 2013, with home values increasing by more than 90% over that period. From a starting point just under $300,000, prices have climbed to nearly $572,000 by May 2025. While annual growth was moderate in earlier years, price acceleration picked up significantly in 2021 and 2022, driven by heightened buyer demand and tightening inventory. Even with slower gains in 2023 and 2024, the upward trend remains consistent. This level of appreciation reflects strong local desirability and increasing competition for homes in the area.
In order to come up with the very specific design ideas, we create most designs with the assistance of state-of-the-art AI interior design software.
Flint Hill – A Small Town With Rising Appeal

Located in St. Charles County, Flint Hill is a small, fast-growing community that benefits from proximity to the St. Louis metro while maintaining a rural, quiet atmosphere. Its appeal lies in large residential lots, newer subdivisions, and easy access to nearby highways. The town has seen a wave of new development over the past decade, with families and professionals seeking homes outside the denser urban core. The rising demand has directly influenced home prices, especially as more buyers have turned to peripheral markets in search of space and modern amenities.
Flint Hill’s charm is in its balance of peaceful living with proximity to major employers and schools in surrounding cities like Wentzville and O’Fallon. With limited housing stock and a desirable reputation, the market remains competitive. The town’s school district quality and development potential continue to attract attention from both buyers and investors. As suburban sprawl pushes outward from St. Louis, Flint Hill is poised to remain one of the region’s higher-value areas—especially for those seeking the suburban experience without sacrificing access or lifestyle.
18. Weatherby Lake – 126% Home Price Increase Since 2010
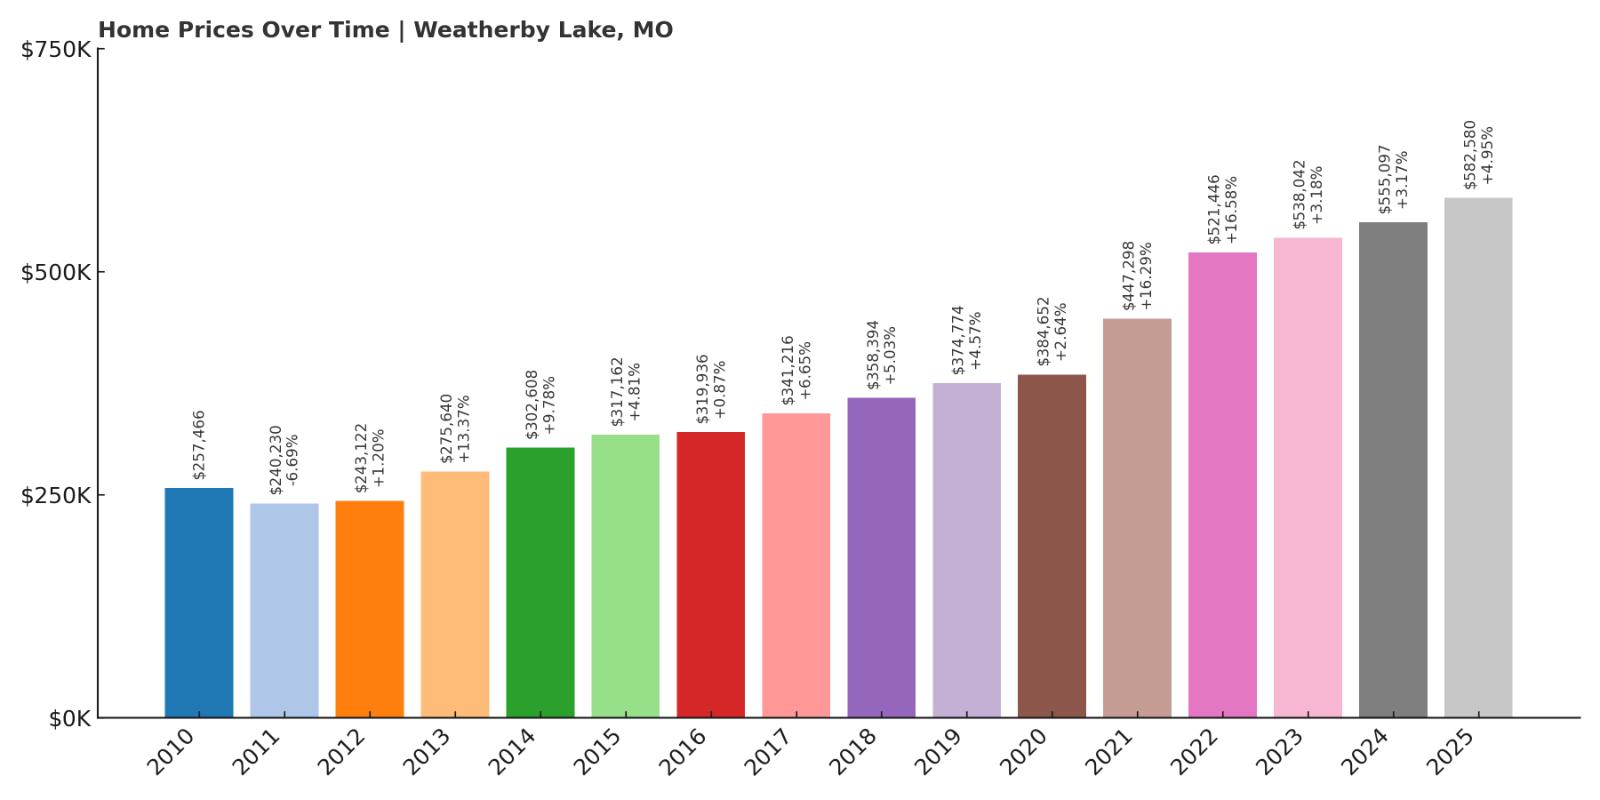
- 2010: $257,466
- 2011: $240,230 (-$17,236, -6.69% from previous year)
- 2012: $243,122 (+$2,892, +1.20% from previous year)
- 2013: $275,640 (+$32,517, +13.37% from previous year)
- 2014: $302,608 (+$26,969, +9.78% from previous year)
- 2015: $317,162 (+$14,553, +4.81% from previous year)
- 2016: $319,936 (+$2,774, +0.87% from previous year)
- 2017: $341,216 (+$21,281, +6.65% from previous year)
- 2018: $358,394 (+$17,178, +5.03% from previous year)
- 2019: $374,774 (+$16,380, +4.57% from previous year)
- 2020: $384,652 (+$9,878, +2.64% from previous year)
- 2021: $447,298 (+$62,646, +16.29% from previous year)
- 2022: $521,446 (+$74,148, +16.58% from previous year)
- 2023: $538,042 (+$16,596, +3.18% from previous year)
- 2024: $555,097 (+$17,054, +3.17% from previous year)
- 2025: $582,580 (+$27,483, +4.95% from previous year)
Weatherby Lake has experienced a remarkable 126% increase in home prices since 2010, thanks to consistent annual gains and standout years in 2021 and 2022. These two years alone contributed more than $136,000 to the town’s average home value, pushing it from under $400,000 to above $580,000 in just four years. The pace has cooled slightly since, but growth remains stable, making Weatherby Lake one of the most steadily appreciating housing markets in Missouri over the past 15 years.
Weatherby Lake – Waterfront Living Near Kansas City

Tucked into the northwest corner of the Kansas City metro, Weatherby Lake is known for its scenic lakefront homes and tight-knit residential community. The town is built around a private lake that attracts boaters, anglers, and those looking for tranquil waterfront living within reach of a major city. Homeowners here enjoy the blend of nature and convenience, with access to downtown Kansas City and the airport just a short drive away. As demand for recreational living near metro areas has grown, so too has Weatherby Lake’s appeal—and its prices.
Weatherby Lake offers a unique lifestyle that’s hard to find elsewhere in Missouri. The neighborhood has a strong homeowners association and community involvement, helping maintain property values and quality of life. The town’s limited housing supply also means high competition when homes hit the market. This exclusivity, combined with a picturesque setting and desirable location, continues to drive steady upward pressure on prices. For buyers seeking peace without isolation, Weatherby Lake stands out as one of the state’s premier suburban enclaves.
17. Parkville – 74% Home Price Increase Since 2010
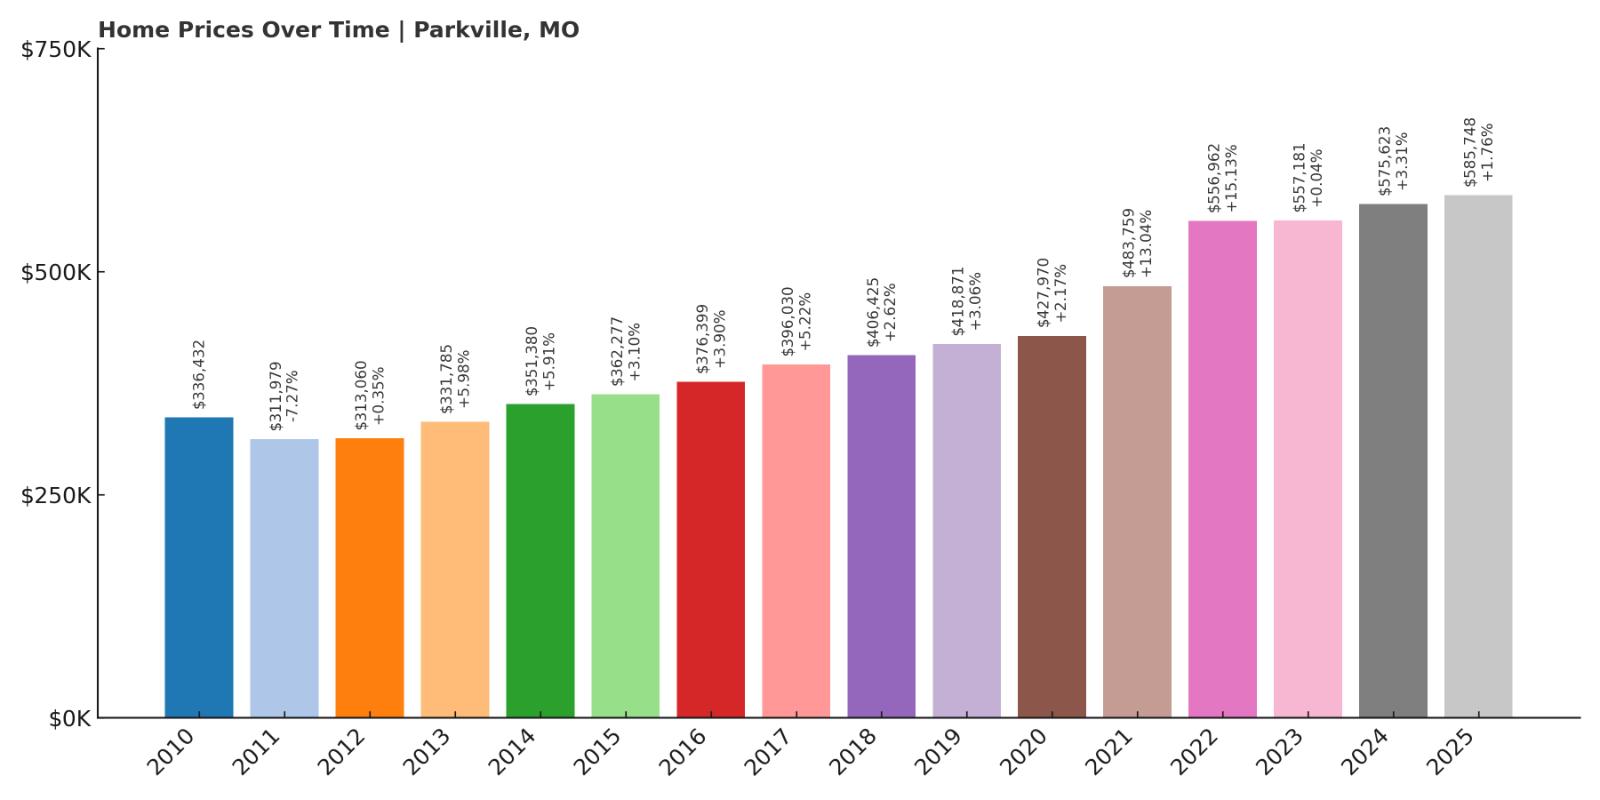
- 2010: $336,432
- 2011: $311,979 (-$24,453, -7.27% from previous year)
- 2012: $313,060 (+$1,081, +0.35% from previous year)
- 2013: $331,785 (+$18,725, +5.98% from previous year)
- 2014: $351,380 (+$19,595, +5.91% from previous year)
- 2015: $362,277 (+$10,897, +3.10% from previous year)
- 2016: $376,399 (+$14,122, +3.90% from previous year)
- 2017: $396,030 (+$19,631, +5.22% from previous year)
- 2018: $406,425 (+$10,395, +2.62% from previous year)
- 2019: $418,871 (+$12,446, +3.06% from previous year)
- 2020: $427,970 (+$9,098, +2.17% from previous year)
- 2021: $483,759 (+$55,790, +13.04% from previous year)
- 2022: $556,962 (+$73,203, +15.13% from previous year)
- 2023: $557,181 (+$219, +0.04% from previous year)
- 2024: $575,623 (+$18,442, +3.31% from previous year)
- 2025: $585,748 (+$10,125, +1.76% from previous year)
Parkville’s real estate market has seen strong, steady gains since 2010, with prices rising nearly 75% over that time. The town weathered the post-recession recovery with moderate growth, followed by a sharp uptick during the COVID-era housing boom. The jump from $428,000 in 2020 to over $585,000 in 2025 marks a period of rapid value appreciation, particularly between 2021 and 2022. Though growth slowed after 2022, the market has retained its elevated position, signaling durable value in this sought-after area.
Parkville – Historic Charm Meets Modern Demand

Situated just minutes from downtown Kansas City, Parkville offers a peaceful setting with easy urban access. Its strong school districts and community amenities appeal to both families and professionals. Home values here are supported by a balance of character, quality, and convenience, helping explain the steady price growth. Even in periods of broader housing slowdowns, Parkville’s demand remains strong, which helps cushion the market and sustain long-term appreciation.
16. Sunset Hills – 74% Home Price Increase Since 2010
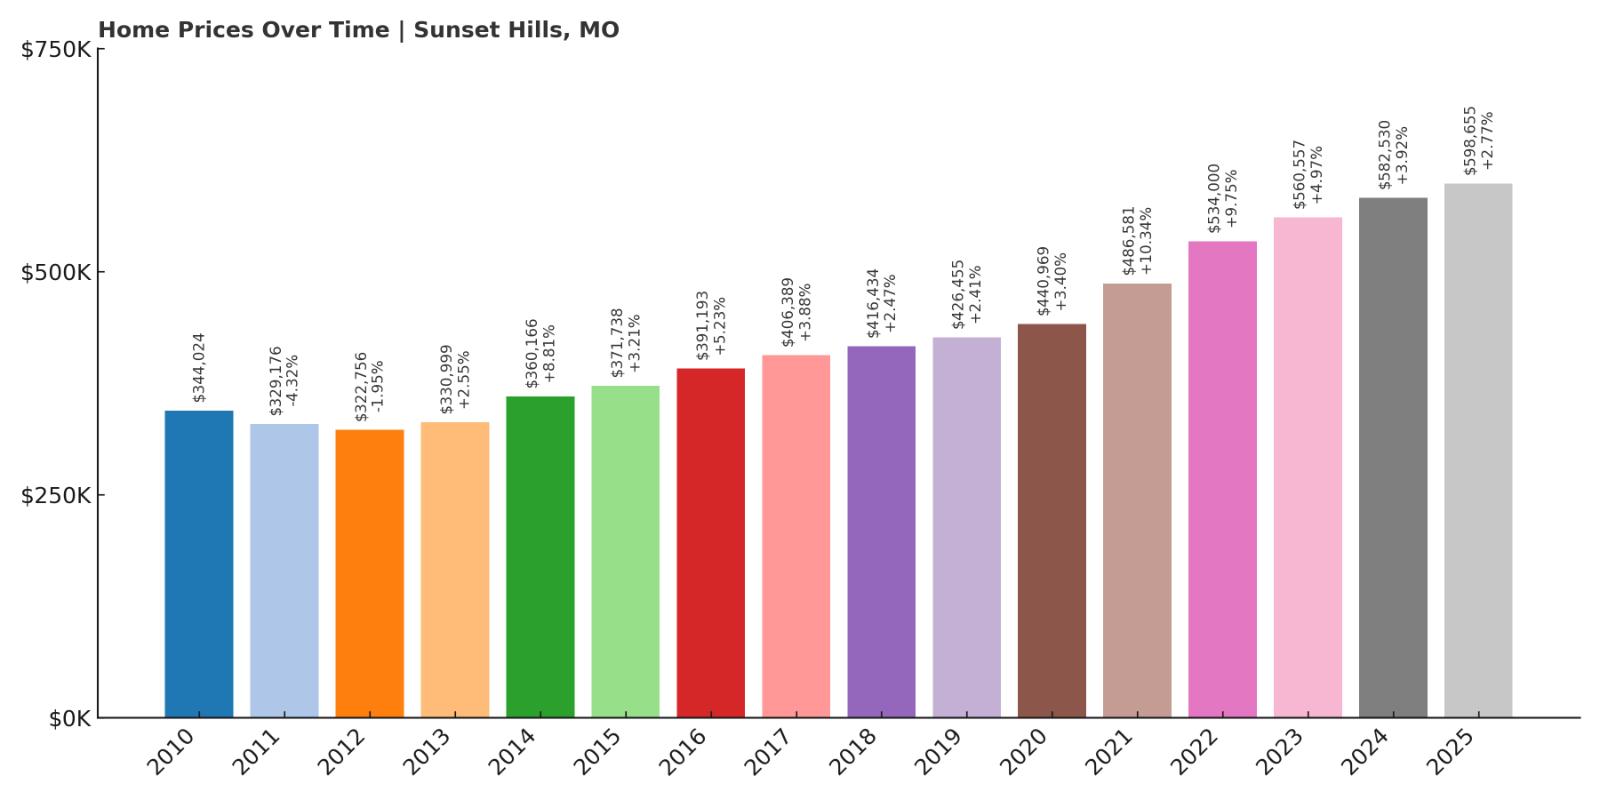
- 2010: $344,024
- 2011: $329,176 (-$14,847, -4.32% from previous year)
- 2012: $322,756 (-$6,420, -1.95% from previous year)
- 2013: $330,999 (+$8,242, +2.55% from previous year)
- 2014: $360,166 (+$29,168, +8.81% from previous year)
- 2015: $371,738 (+$11,571, +3.21% from previous year)
- 2016: $391,193 (+$19,456, +5.23% from previous year)
- 2017: $406,389 (+$15,196, +3.88% from previous year)
- 2018: $416,434 (+$10,045, +2.47% from previous year)
- 2019: $426,455 (+$10,021, +2.41% from previous year)
- 2020: $440,969 (+$14,514, +3.40% from previous year)
- 2021: $486,581 (+$45,611, +10.34% from previous year)
- 2022: $534,000 (+$47,420, +9.75% from previous year)
- 2023: $560,557 (+$26,557, +4.97% from previous year)
- 2024: $582,530 (+$21,973, +3.92% from previous year)
- 2025: $598,655 (+$16,126, +2.77% from previous year)
Sunset Hills has posted consistent price appreciation since 2010, with total home values increasing by about 74% over that time. While early years were marked by slow or negative growth, the market began a strong and steady upward climb starting in 2013. Particularly notable are the double-digit gains in both 2021 and 2022, which propelled the average price from under $450,000 to well over $530,000 in just two years. Even with a softening pace in 2023 and 2024, the town continues to demonstrate reliable year-over-year growth, reaching nearly $600,000 by May 2025.
Sunset Hills – Steady Growth in a Prime Location

Located in southwest St. Louis County, Sunset Hills is one of the region’s most desirable suburban communities. Its blend of spacious homes, high-performing schools, and convenient access to Interstates 270 and 44 makes it a favorite for families and professionals alike. The town is known for its abundant green space, including the popular Laumeier Sculpture Park and Watson Trail Park, offering a tranquil setting just minutes from downtown St. Louis. Sunset Hills has remained stable and attractive even through periods of national housing uncertainty, thanks in part to limited housing inventory and a highly educated population.
Sunset Hills also benefits from a commercial corridor along Watson Road, home to restaurants, shopping centers, and service businesses that support both convenience and employment. Newer subdivisions and custom-built homes have added modern appeal to the area, while older homes on large lots continue to attract buyers looking for long-term value. The town’s combination of suburban calm and strong infrastructure underpins its sustained housing demand. As buyers continue to seek communities that offer both quality of life and solid investment potential, Sunset Hills remains firmly positioned as one of Missouri’s strongest residential markets.
15. Lake Lotawana – 121% Home Price Increase Since 2010
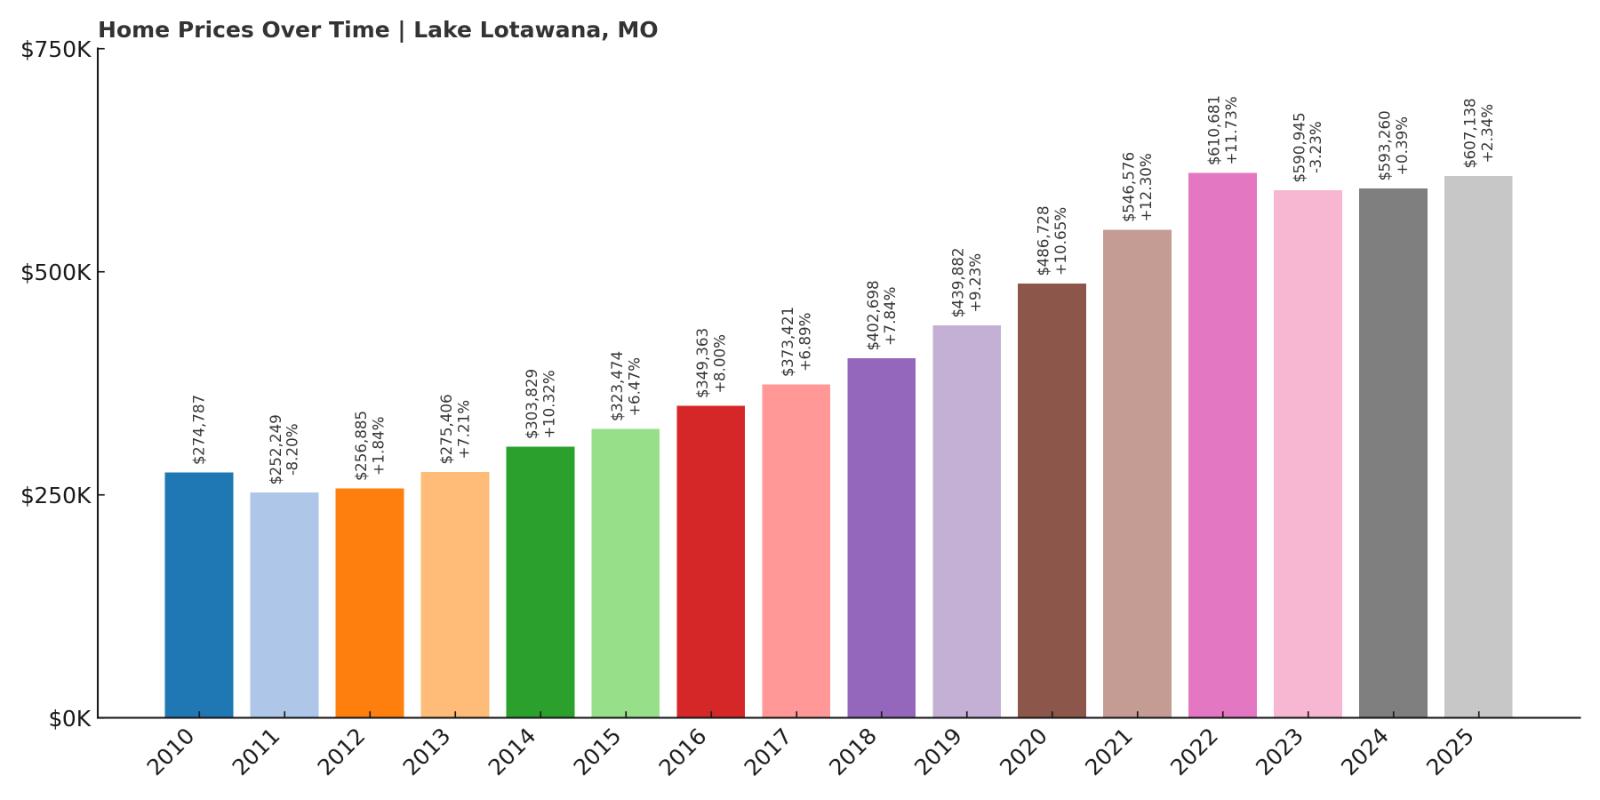
- 2010: $274,787
- 2011: $252,249 (-$22,538, -8.20% from previous year)
- 2012: $256,885 (+$4,636, +1.84% from previous year)
- 2013: $275,406 (+$18,521, +7.21% from previous year)
- 2014: $303,829 (+$28,423, +10.32% from previous year)
- 2015: $323,474 (+$19,645, +6.47% from previous year)
- 2016: $349,363 (+$25,889, +8.00% from previous year)
- 2017: $373,421 (+$24,058, +6.89% from previous year)
- 2018: $402,698 (+$29,277, +7.84% from previous year)
- 2019: $439,882 (+$37,184, +9.23% from previous year)
- 2020: $486,728 (+$46,846, +10.65% from previous year)
- 2021: $546,576 (+$59,848, +12.30% from previous year)
- 2022: $610,681 (+$64,105, +11.73% from previous year)
- 2023: $590,945 (-$19,735, -3.23% from previous year)
- 2024: $593,260 (+$2,314, +0.39% from previous year)
- 2025: $607,138 (+$13,878, +2.34% from previous year)
Lake Lotawana has seen a dramatic surge in home values since 2010, with a 121% overall increase. After modest growth in the early years, the town’s real estate market took off starting in 2013, with strong annual gains and double-digit jumps becoming the norm by 2020. The explosive growth from 2020 to 2022 alone added more than $120,000 to the average home price. While 2023 marked a brief downturn, the market rebounded quickly, closing out at over $600,000 in 2025. These figures reflect both heightened buyer demand and the unique appeal of the area.
Lake Lotawana – Lakeside Luxury With Room to Breathe

Set around one of the largest private lakes in Missouri, Lake Lotawana is a destination for those seeking waterfront living without the congestion of resort towns. Located southeast of Kansas City, the community combines recreational charm with full-time residential appeal. Its lake-centric lifestyle—boating, fishing, and panoramic views—is a major draw for second-home buyers, retirees, and remote workers alike. Over the past decade, as remote work and lifestyle-driven purchases grew more common, Lake Lotawana emerged as a hotspot for affluent buyers seeking privacy and access to nature.
The town’s development has been steady but controlled, with new construction complementing older homes along the shoreline. With limited buildable land, competition for lakefront property has driven prices consistently higher. Lake Lotawana’s inclusion in the Lee’s Summit R-7 School District adds further value for families, and its low crime rate and close-knit community continue to attract long-term residents. Despite brief fluctuations, the underlying demand and exclusivity of the area mean that property values remain strong and resilient. For buyers prioritizing scenery, serenity, and space, few places in Missouri offer the same combination as Lake Lotawana.
14. Weldon Spring – 81% Home Price Increase Since 2010
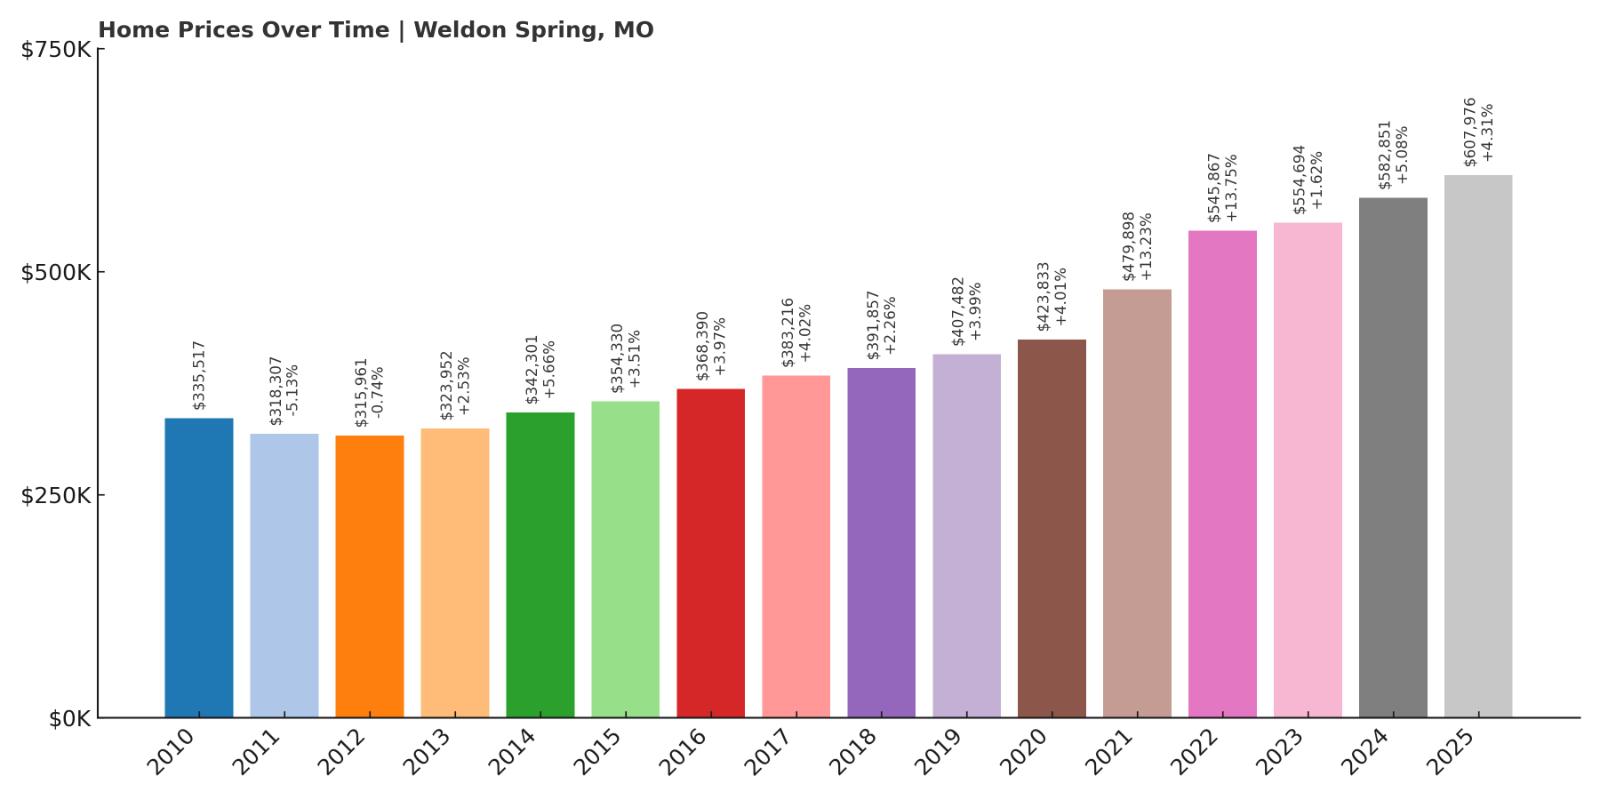
- 2010: $335,517
- 2011: $318,307 (-$17,210, -5.13% from previous year)
- 2012: $315,961 (-$2,346, -0.74% from previous year)
- 2013: $323,952 (+$7,992, +2.53% from previous year)
- 2014: $342,301 (+$18,349, +5.66% from previous year)
- 2015: $354,330 (+$12,029, +3.51% from previous year)
- 2016: $368,390 (+$14,060, +3.97% from previous year)
- 2017: $383,216 (+$14,826, +4.02% from previous year)
- 2018: $391,857 (+$8,642, +2.26% from previous year)
- 2019: $407,482 (+$15,625, +3.99% from previous year)
- 2020: $423,833 (+$16,351, +4.01% from previous year)
- 2021: $479,898 (+$56,065, +13.23% from previous year)
- 2022: $545,867 (+$65,969, +13.75% from previous year)
- 2023: $554,694 (+$8,827, +1.62% from previous year)
- 2024: $582,851 (+$28,157, +5.08% from previous year)
- 2025: $607,976 (+$25,125, +4.31% from previous year)
Weldon Spring has shown robust and consistent price growth since 2010, with average home values climbing more than 80% over the 15-year period. The most dramatic acceleration came after 2020, with 2021 and 2022 together accounting for a massive $122,000 jump in value. Earlier years were marked by steady appreciation in the 3–5% range, which laid a strong foundation for the boom years that followed. Even after the market cooled slightly in 2023, the momentum continued with gains of over 4% annually through 2025, helping solidify Weldon Spring’s position among Missouri’s most expensive towns.
Weldon Spring – An Upscale Enclave in St. Charles County

Weldon Spring sits just west of Chesterfield in St. Charles County, an area long associated with affluence, good schools, and master-planned subdivisions. With easy access to I-64, the town appeals to professionals working in St. Louis who want the benefits of suburban living without sacrificing proximity to city amenities. The community is highly residential, with a mix of custom homes, executive-style housing, and gated neighborhoods that cater to buyers with higher budgets. Scenic views and access to the nearby Missouri River and conservation areas add a premium to the lifestyle Weldon Spring offers.
In recent years, Weldon Spring has benefited from broader regional trends, including the westward shift in high-income homebuying activity and the expansion of employment hubs in St. Charles County. The area also enjoys proximity to top-rated schools, golf courses, and upscale shopping centers like The Meadows and Chesterfield Mall. With limited new development due to zoning and green space protections, housing inventory remains tight, which continues to drive prices upward. For those looking for long-term stability in a highly desirable pocket of suburban Missouri, Weldon Spring offers a mix of prestige, privacy, and practicality.
13. Crystal Lake Park – 78% Home Price Increase Since 2010

🔥 Would you like to save this?
- 2010: $345,255
- 2011: $334,378 (-$10,877, -3.15% from previous year)
- 2012: $327,319 (-$7,058, -2.11% from previous year)
- 2013: $340,627 (+$13,308, +4.07% from previous year)
- 2014: $361,545 (+$20,918, +6.14% from previous year)
- 2015: $371,697 (+$10,152, +2.81% from previous year)
- 2016: $389,740 (+$18,043, +4.85% from previous year)
- 2017: $402,390 (+$12,650, +3.25% from previous year)
- 2018: $426,204 (+$23,814, +5.92% from previous year)
- 2019: $430,825 (+$4,622, +1.08% from previous year)
- 2020: $438,887 (+$8,062, +1.87% from previous year)
- 2021: $476,758 (+$37,870, +8.63% from previous year)
- 2022: $532,300 (+$55,542, +11.65% from previous year)
- 2023: $555,713 (+$23,413, +4.40% from previous year)
- 2024: $583,482 (+$27,770, +5.00% from previous year)
- 2025: $614,134 (+$30,651, +5.25% from previous year)
Crystal Lake Park’s market has nearly doubled in value since 2010, showing a total increase of 78% over the 15-year span. While the early 2010s brought slight declines, that trend reversed dramatically starting in 2013. After that point, the town experienced dependable growth, with especially strong acceleration from 2020 onward. In just five years, home values jumped by over $175,000, reflecting strong buyer demand in this compact, centrally located community. The sustained upward trend shows no sign of reversal as of 2025, with recent yearly gains continuing in the 4–5% range.
Crystal Lake Park – Compact, Quiet, and Consistently Desirable

Nestled in the heart of St. Louis County, Crystal Lake Park is a small but highly sought-after residential pocket. Known for its tree-lined streets, quiet charm, and walkable layout, the town has long attracted families and professionals looking for a peaceful retreat without losing access to the city. It covers just a fraction of a square mile, but what it lacks in size it makes up for in character. Most homes are older, well-kept, and surrounded by mature landscaping, which contributes to a strong sense of neighborhood identity and visual appeal.
The area’s central location puts residents within minutes of major shopping districts, award-winning schools, and several employment hubs. That combination—accessibility, reputation, and limited housing stock—has kept demand consistently high even during market slowdowns. Crystal Lake Park’s zoning and stable homeowner base have also helped maintain property values and reduce volatility. Buyers know that available listings here are rare and often go quickly, which supports long-term appreciation. In an age where location and quality of life are everything, Crystal Lake Park continues to command top-dollar interest from buyers across the region.
12. Creve Coeur – 69% Home Price Increase Since 2010
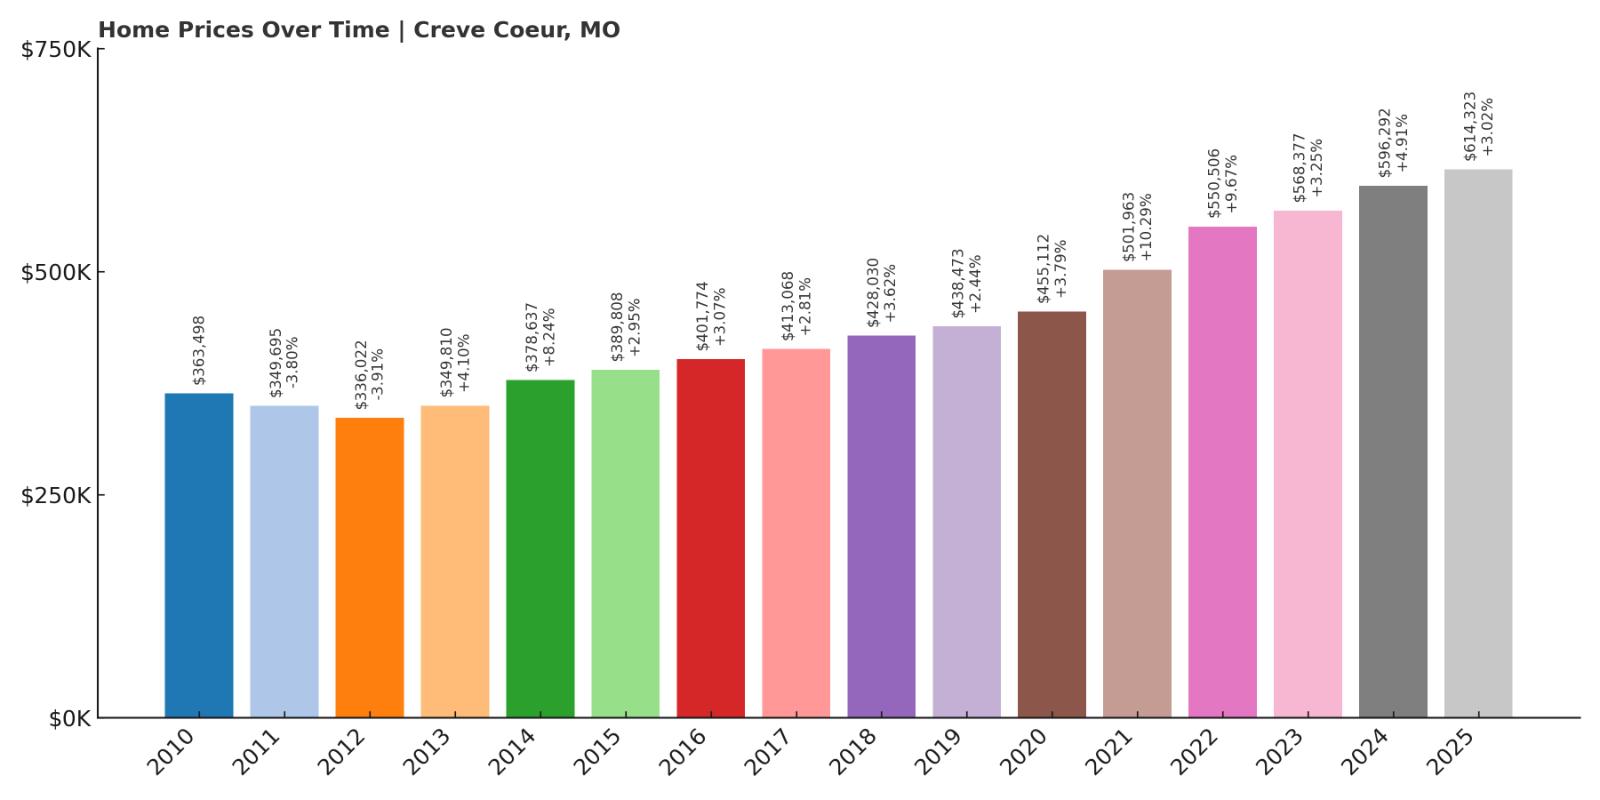
- 2010: $363,498
- 2011: $349,695 (-$13,803, -3.80% from previous year)
- 2012: $336,022 (-$13,673, -3.91% from previous year)
- 2013: $349,810 (+$13,788, +4.10% from previous year)
- 2014: $378,637 (+$28,827, +8.24% from previous year)
- 2015: $389,808 (+$11,170, +2.95% from previous year)
- 2016: $401,774 (+$11,967, +3.07% from previous year)
- 2017: $413,068 (+$11,293, +2.81% from previous year)
- 2018: $428,030 (+$14,962, +3.62% from previous year)
- 2019: $438,473 (+$10,443, +2.44% from previous year)
- 2020: $455,112 (+$16,639, +3.79% from previous year)
- 2021: $501,963 (+$46,851, +10.29% from previous year)
- 2022: $550,506 (+$48,544, +9.67% from previous year)
- 2023: $568,377 (+$17,870, +3.25% from previous year)
- 2024: $596,292 (+$27,915, +4.91% from previous year)
- 2025: $614,323 (+$18,031, +3.02% from previous year)
Creve Coeur’s housing market has seen a nearly 70% increase in home values since 2010, driven by steady year-over-year appreciation and several standout years during the early 2020s. While growth was modest in the earlier part of the decade, the market began picking up momentum around 2014. A significant leap occurred from 2020 to 2022, adding over $95,000 to the average home price. As of May 2025, prices have continued to climb, crossing the $600,000 mark—an important psychological milestone that further cements Creve Coeur’s high-end reputation in the region.
Creve Coeur – A Commercial Hub With Residential Appeal

Creve Coeur is a well-established suburb located along Olive Boulevard in west St. Louis County, known for its mix of corporate offices, medical facilities, and attractive residential neighborhoods. It’s home to many Fortune 500 outposts, regional hospitals, and tech companies, giving the area both economic vitality and job stability. Despite its commercial base, Creve Coeur remains highly livable, offering a variety of housing options from ranch-style homes to gated subdivisions and luxury condos. Residents enjoy access to top-tier public schools, private academies, and numerous parks and recreation areas.
Part of what makes Creve Coeur’s housing market so resilient is its ability to attract high-income earners who value proximity to work, services, and transportation corridors. The area is also seeing new development, including mixed-use projects and upscale apartments, which reflect growing demand from younger buyers and downsizing professionals. The presence of Creve Coeur Lake Memorial Park—the largest park in the county—adds natural beauty to the otherwise urban feel. Overall, Creve Coeur offers a blend of stability, convenience, and long-term growth, which explains why home prices continue to rise steadily year after year.
11. Warson Woods – 70% Home Price Increase Since 2010

- 2010: $391,843
- 2011: $375,112 (-$16,731, -4.27% from previous year)
- 2012: $349,280 (-$25,832, -6.89% from previous year)
- 2013: $362,726 (+$13,447, +3.85% from previous year)
- 2014: $399,074 (+$36,348, +10.02% from previous year)
- 2015: $407,376 (+$8,302, +2.08% from previous year)
- 2016: $435,658 (+$28,282, +6.94% from previous year)
- 2017: $442,776 (+$7,118, +1.63% from previous year)
- 2018: $460,998 (+$18,222, +4.12% from previous year)
- 2019: $465,852 (+$4,854, +1.05% from previous year)
- 2020: $480,210 (+$14,358, +3.08% from previous year)
- 2021: $527,537 (+$47,327, +9.86% from previous year)
- 2022: $581,012 (+$53,476, +10.14% from previous year)
- 2023: $607,347 (+$26,335, +4.53% from previous year)
- 2024: $638,493 (+$31,146, +5.13% from previous year)
- 2025: $665,389 (+$26,896, +4.21% from previous year)
Warson Woods has seen a 70% rise in home values since 2010, with the bulk of that growth occurring in the last five years. While the market was relatively stable in the early 2010s, a clear turning point came in 2020. From there, home prices surged year after year, rising from under $500,000 to over $665,000 in just five years. Double-digit annual growth in both 2021 and 2022 contributed significantly to the town’s current value, while more recent years have seen steady mid-single-digit gains. The data reflect a tight, upward-moving market with consistent long-term demand.
Warson Woods – Tradition, Trees, and Timeless Appeal

Warson Woods is a residential suburb located in central St. Louis County, prized for its mature trees, traditional architecture, and strong neighborhood identity. Originally developed in the mid-20th century, the community has preserved much of its original charm while quietly evolving into one of the area’s most sought-after places to live. Homes here are often brick colonials or cape cods, sitting on well-manicured lots with wide, quiet streets. The town includes its own parks, a community swimming pool, and even a small business district, all of which reinforce the feel of a self-contained, family-focused neighborhood.
Part of Warson Woods’ real estate strength comes from its location within the award-winning Webster Groves School District and its close proximity to Ladue and Kirkwood. The housing stock is limited, turnover is low, and buyers are often willing to pay a premium for the opportunity to move in. With excellent public services, a strong sense of local identity, and a walkable environment that many newer suburbs can’t replicate, Warson Woods continues to grow in popularity—and in price. The town’s stability and charm have made it a reliable choice for long-term homeownership in the St. Louis metro.
10. Des Peres – 77% Home Price Increase Since 2010
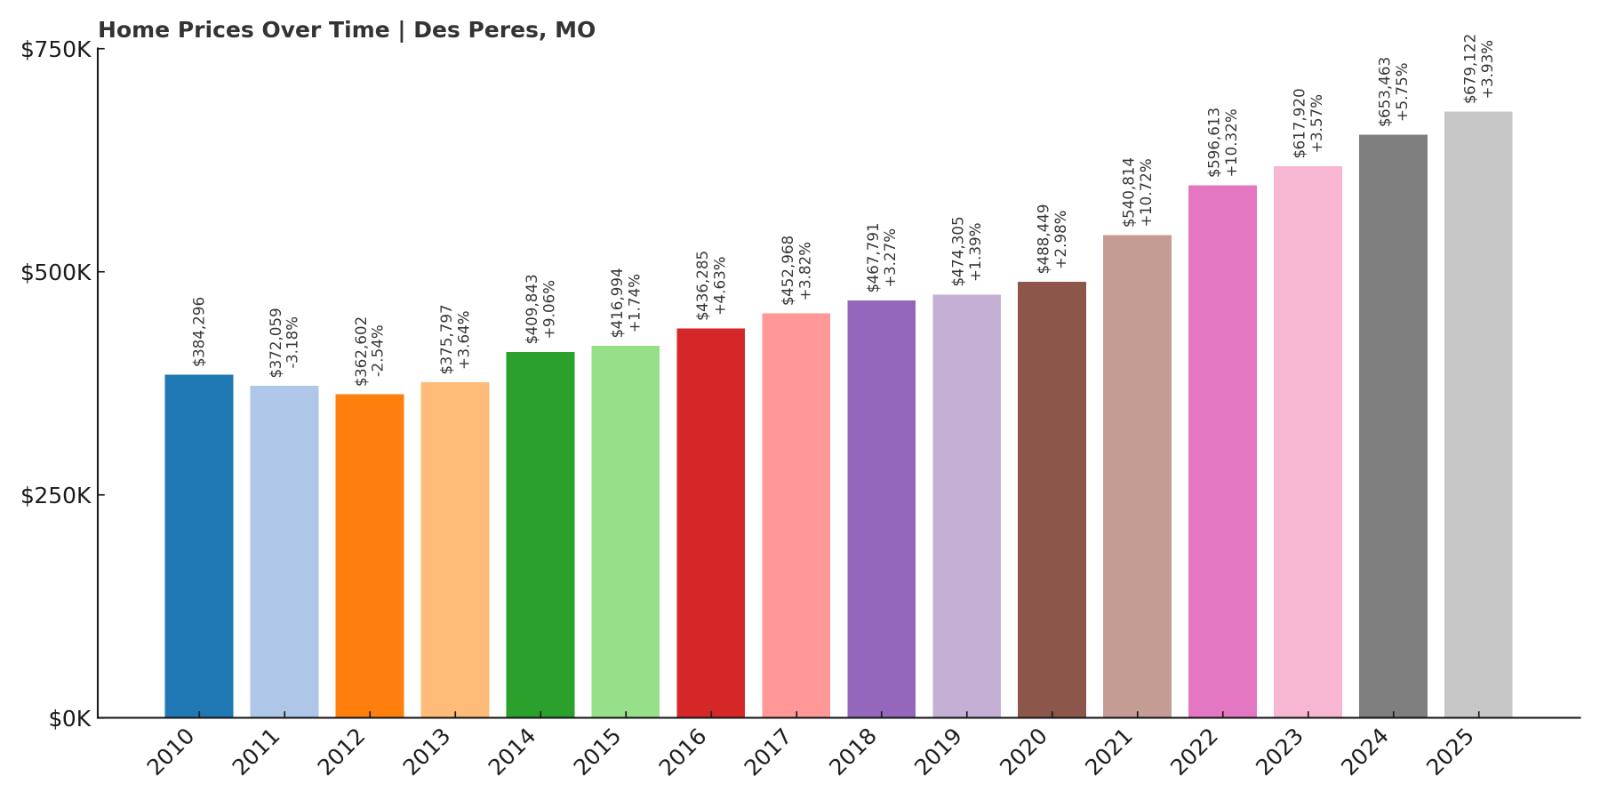
- 2010: $384,296
- 2011: $372,059 (-$12,237, -3.18% from previous year)
- 2012: $362,602 (-$9,457, -2.54% from previous year)
- 2013: $375,797 (+$13,196, +3.64% from previous year)
- 2014: $409,843 (+$34,046, +9.06% from previous year)
- 2015: $416,994 (+$7,150, +1.74% from previous year)
- 2016: $436,285 (+$19,291, +4.63% from previous year)
- 2017: $452,968 (+$16,684, +3.82% from previous year)
- 2018: $467,791 (+$14,823, +3.27% from previous year)
- 2019: $474,305 (+$6,514, +1.39% from previous year)
- 2020: $488,449 (+$14,143, +2.98% from previous year)
- 2021: $540,814 (+$52,365, +10.72% from previous year)
- 2022: $596,613 (+$55,799, +10.32% from previous year)
- 2023: $617,920 (+$21,307, +3.57% from previous year)
- 2024: $653,463 (+$35,543, +5.75% from previous year)
- 2025: $679,122 (+$25,659, +3.93% from previous year)
Des Peres has enjoyed a strong 77% growth in home values since 2010, underpinned by steady gains throughout the decade and a powerful boost in the early 2020s. The double-digit price hikes of 2021 and 2022 alone pushed average values up by over $108,000. Even in the years that followed, prices kept rising at a healthy pace, crossing the $675,000 mark in 2025. Unlike towns that saw sharp dips or volatility, Des Peres’ growth trajectory has been mostly smooth and upward, giving it a reputation as a stable, upper-tier market in the greater St. Louis area.
Des Peres – Classic Suburbia With an Upscale Twist

Located in west St. Louis County, Des Peres is an established suburb known for its excellent schools, strong retail base, and mix of classic and contemporary homes. It’s home to West County Center—one of the region’s premier shopping destinations—as well as several corporate offices and medical facilities. Despite its commercial presence, Des Peres maintains a quiet, family-friendly vibe, with leafy streets, well-kept subdivisions, and a large number of parks and recreational spaces. This blend of amenities and livability has helped support consistently strong housing demand.
Des Peres also benefits from a central location with easy access to I-270 and Manchester Road, placing residents within easy reach of downtown St. Louis, major job centers, and surrounding suburbs. The city offers its own municipal services, including a well-funded parks department and a public safety department that includes fire, EMS, and police under one roof. These factors contribute to strong community trust and a sense of security, which reinforces buyer confidence. As home values continue to rise, Des Peres remains a go-to destination for buyers who want comfort, convenience, and long-term value.
9. Lake Winnebago – 113% Home Price Increase Since 2010
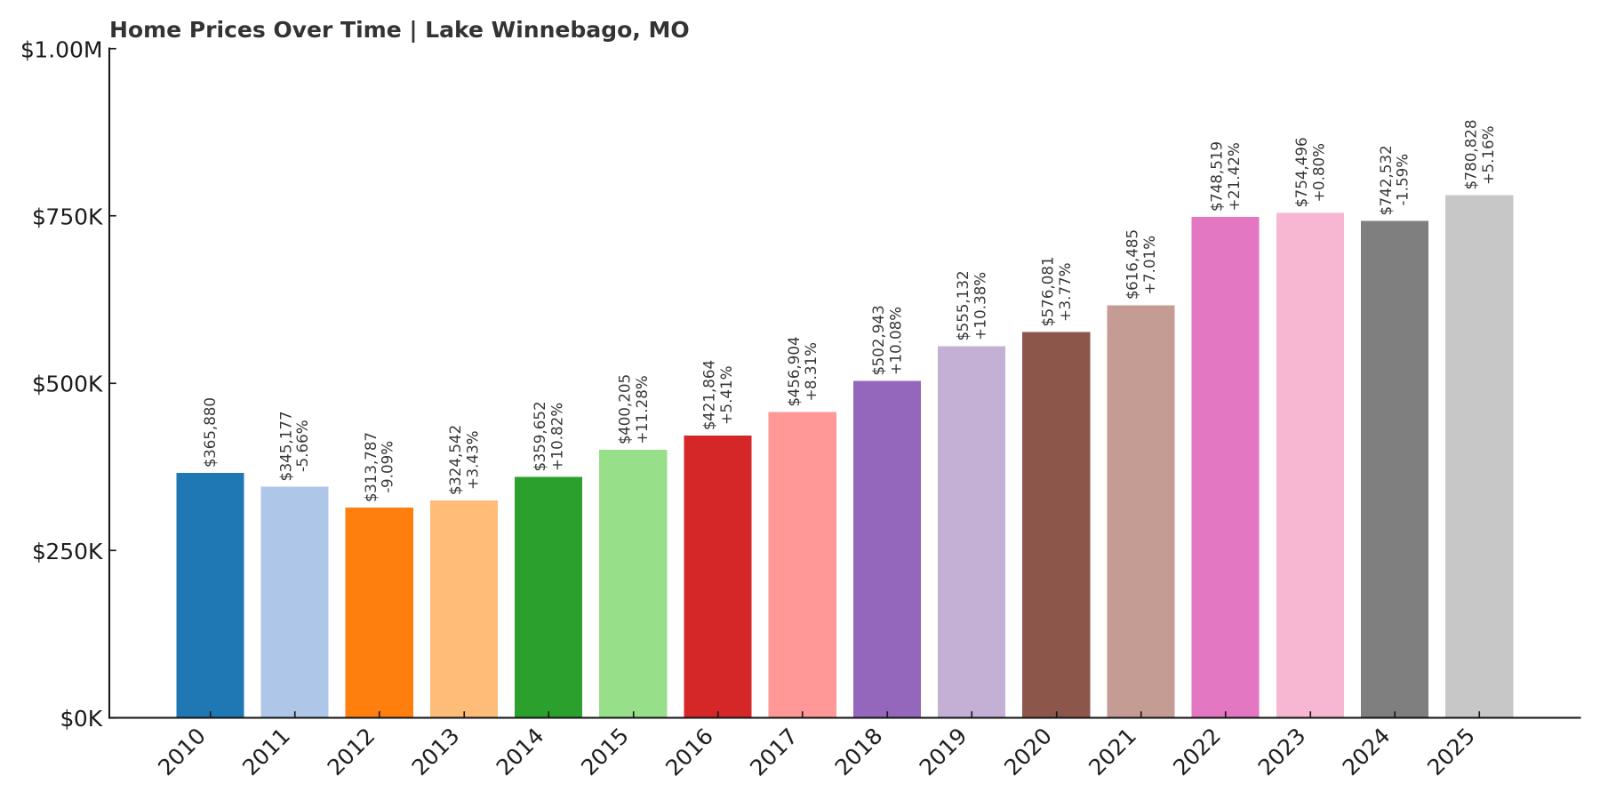
- 2010: $365,880
- 2011: $345,177 (-$20,703, -5.66% from previous year)
- 2012: $313,787 (-$31,390, -9.09% from previous year)
- 2013: $324,542 (+$10,754, +3.43% from previous year)
- 2014: $359,652 (+$35,111, +10.82% from previous year)
- 2015: $400,205 (+$40,553, +11.28% from previous year)
- 2016: $421,864 (+$21,658, +5.41% from previous year)
- 2017: $456,904 (+$35,041, +8.31% from previous year)
- 2018: $502,943 (+$46,039, +10.08% from previous year)
- 2019: $555,132 (+$52,188, +10.38% from previous year)
- 2020: $576,081 (+$20,949, +3.77% from previous year)
- 2021: $616,485 (+$40,404, +7.01% from previous year)
- 2022: $748,519 (+$132,034, +21.42% from previous year)
- 2023: $754,496 (+$5,977, +0.80% from previous year)
- 2024: $742,532 (-$11,964, -1.59% from previous year)
- 2025: $780,828 (+$38,296, +5.16% from previous year)
Lake Winnebago has seen explosive home value appreciation over the last 15 years, climbing by an impressive 113%. After recovering from early declines, the town experienced a decade of sharp growth, with particularly steep gains from 2015 onward. The single largest jump came in 2022, when home prices surged more than $130,000 in just one year. Although the pace slowed in 2023 and dipped slightly in 2024, the rebound in 2025 confirms the town’s ongoing market strength. Lake Winnebago is now firmly established as one of Missouri’s most premium housing destinations.
Lake Winnebago – High-End Lakefront Living South of Kansas City

Lake Winnebago offers a private lake lifestyle in Cass County, just south of Lee’s Summit and Kansas City. With custom homes lining its shoreline and luxury builds on the rise, it has become a magnet for high-net-worth buyers seeking space, privacy, and views. The town revolves around its namesake lake, which spans over 400 acres and offers boating, fishing, and recreation year-round. Many homes come with private docks, and the community includes a marina, clubhouse, and gated entries, giving it the feel of an exclusive lakeside resort town.
Recent development has introduced newer luxury construction, often priced well above $1 million, further boosting the area’s average home values. Access to Lee’s Summit schools, along with proximity to shopping, restaurants, and healthcare facilities, has made it an attractive option for affluent families. The limited availability of lakefront property has created a supply-constrained market where prices remain strong even during broader economic slowdowns. For buyers looking for water access and upscale amenities without leaving Missouri, Lake Winnebago stands out as one of the state’s top-tier housing markets.
8. Clayton – 56% Home Price Increase Since 2010

- 2010: $546,280
- 2011: $526,720 (-$19,560, -3.58% from previous year)
- 2012: $495,417 (-$31,302, -5.94% from previous year)
- 2013: $504,576 (+$9,159, +1.85% from previous year)
- 2014: $550,107 (+$45,531, +9.02% from previous year)
- 2015: $571,431 (+$21,324, +3.88% from previous year)
- 2016: $607,495 (+$36,064, +6.31% from previous year)
- 2017: $620,985 (+$13,490, +2.22% from previous year)
- 2018: $641,902 (+$20,917, +3.37% from previous year)
- 2019: $661,725 (+$19,823, +3.09% from previous year)
- 2020: $686,954 (+$25,228, +3.81% from previous year)
- 2021: $727,816 (+$40,863, +5.95% from previous year)
- 2022: $774,386 (+$46,570, +6.40% from previous year)
- 2023: $776,559 (+$2,173, +0.28% from previous year)
- 2024: $817,173 (+$40,614, +5.23% from previous year)
- 2025: $847,553 (+$30,381, +3.72% from previous year)
Clayton’s housing market has experienced a substantial 56% rise in value since 2010, driven by its enduring appeal as one of Missouri’s most exclusive urban enclaves. Though price growth was slow or even negative in the early 2010s, a turning point came in 2014. Since then, home values have climbed steadily, consistently posting gains in the 3–6% range. Recent years have reinforced Clayton’s stability, with average home prices approaching $850,000 in 2025. That kind of sustained, high-end growth reflects both the affluence and the strategic importance of this central St. Louis suburb.
Clayton – St. Louis’ Economic and Legal Power Center

Clayton is the seat of St. Louis County and home to the region’s top law firms, corporate headquarters, and government institutions. It boasts a walkable downtown filled with high-rise office buildings, luxury apartments, boutique hotels, and some of the area’s best dining. Yet despite its urban density, the residential neighborhoods just outside the business core offer tree-lined streets, architecturally distinct homes, and top-rated public schools. This mix of live-work convenience and neighborhood serenity is a major reason Clayton has held its position as one of Missouri’s most in-demand places to live.
Property values in Clayton are further supported by its school system—Clayton High School is consistently ranked among the best in the state—as well as its public transit access, proximity to Washington University, and cultural institutions like the St. Louis Art Fair and the Center of Clayton. With land in short supply and redevelopment tightly controlled, housing inventory remains low, creating upward pressure on prices. Whether you’re looking at single-family homes, townhouses, or upscale condos, Clayton delivers the kind of urban-suburban balance that commands premium pricing in any market cycle.
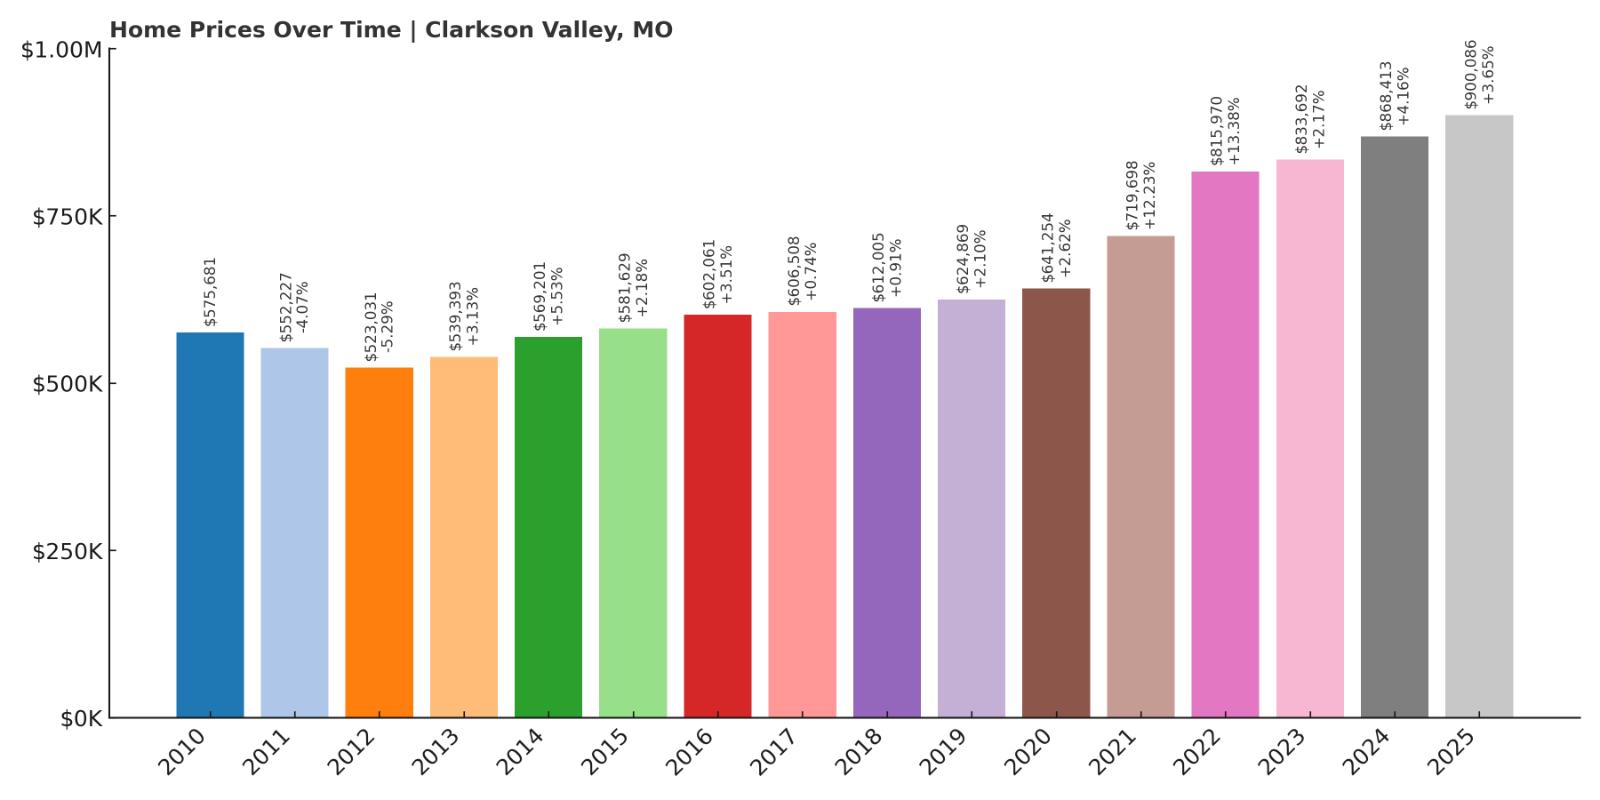
7. Clarkson Valley – 56% Home Price Increase Since 2010
🔥 Would you like to save this?
- 2010: $575,681
- 2011: $552,227 (-$23,455, -4.07% from previous year)
- 2012: $523,031 (-$29,195, -5.29% from previous year)
- 2013: $539,393 (+$16,362, +3.13% from previous year)
- 2014: $569,201 (+$29,807, +5.53% from previous year)
- 2015: $581,629 (+$12,428, +2.18% from previous year)
- 2016: $602,061 (+$20,432, +3.51% from previous year)
- 2017: $606,508 (+$4,447, +0.74% from previous year)
- 2018: $612,005 (+$5,497, +0.91% from previous year)
- 2019: $624,869 (+$12,863, +2.10% from previous year)
- 2020: $641,254 (+$16,386, +2.62% from previous year)
- 2021: $719,698 (+$78,444, +12.23% from previous year)
- 2022: $815,970 (+$96,272, +13.38% from previous year)
- 2023: $833,692 (+$17,722, +2.17% from previous year)
- 2024: $868,413 (+$34,720, +4.16% from previous year)
- 2025: $900,086 (+$31,674, +3.65% from previous year)
Clarkson Valley’s real estate market has increased by 56% since 2010, showing a powerful resurgence especially in the years after 2020. While growth during the 2010s was modest, a wave of pandemic-era demand pushed prices sharply upward. The market jumped more than $170,000 between 2020 and 2022 alone, establishing Clarkson Valley as one of the fastest-moving luxury markets in the state. Even in more recent years, prices have continued to grow steadily, approaching $900,000 in 2025—a milestone few Missouri suburbs have crossed.
Clarkson Valley – Quiet Affluence in West St. Louis County
Clarkson Valley is a small but affluent residential community located in the Chesterfield area. Known for large homes on wooded lots and limited commercial development, it offers a peaceful alternative to busier neighboring towns. The area is zoned exclusively for residential use, helping preserve property values and maintain the character of the community. With top-tier schools like Marquette High School and nearby private institutions, Clarkson Valley appeals to families who want both space and quality education. Many homes are custom-built, with generous square footage, expansive yards, and upscale finishes that signal luxury without excess.
Its location offers quick access to Highway 40/64, Chesterfield Valley shopping, and major employers in West County, while maintaining a secluded, estate-like setting. The city also benefits from strict building codes and a highly involved local government, which help protect the town’s architectural integrity and limit overdevelopment. Because of this, Clarkson Valley’s housing stock remains relatively exclusive, and buyers entering the market tend to stay long-term. As surrounding areas grow more crowded, Clarkson Valley’s combination of low density, natural beauty, and established prestige keeps it in high demand year after year.
6. Town and Country – 63% Home Price Increase Since 2010
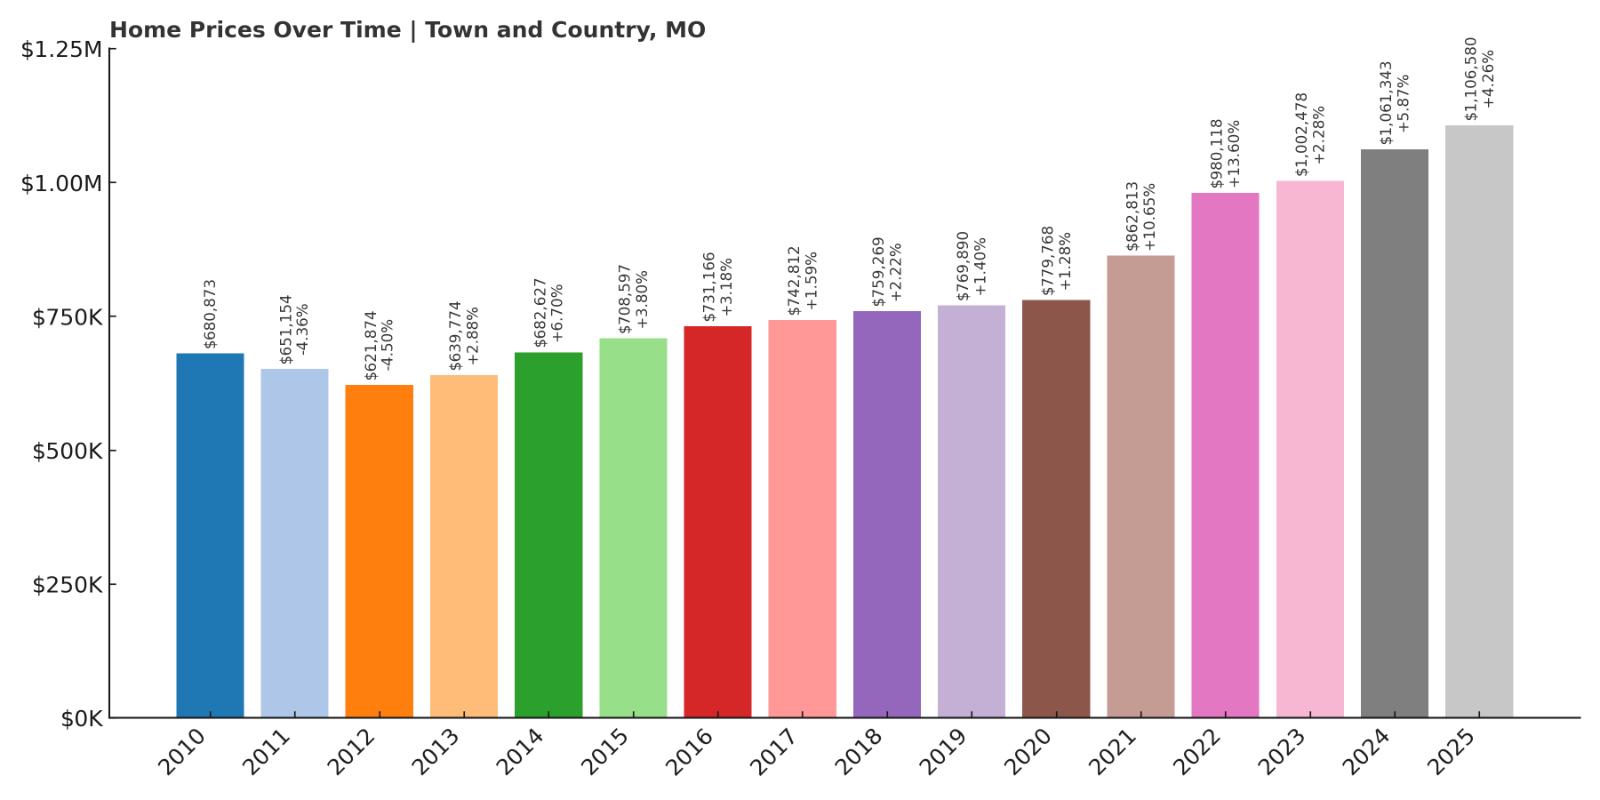
- 2010: $680,873
- 2011: $651,154 (-$29,719, -4.36% from previous year)
- 2012: $621,874 (-$29,279, -4.50% from previous year)
- 2013: $639,774 (+$17,900, +2.88% from previous year)
- 2014: $682,627 (+$42,853, +6.70% from previous year)
- 2015: $708,597 (+$25,970, +3.80% from previous year)
- 2016: $731,166 (+$22,568, +3.18% from previous year)
- 2017: $742,812 (+$11,646, +1.59% from previous year)
- 2018: $759,269 (+$16,456, +2.22% from previous year)
- 2019: $769,890 (+$10,622, +1.40% from previous year)
- 2020: $779,768 (+$9,877, +1.28% from previous year)
- 2021: $862,813 (+$83,045, +10.65% from previous year)
- 2022: $980,118 (+$117,305, +13.60% from previous year)
- 2023: $1,002,478 (+$22,360, +2.28% from previous year)
- 2024: $1,061,343 (+$58,865, +5.87% from previous year)
- 2025: $1,106,580 (+$45,237, +4.26% from previous year)
Town and Country has achieved a 63% increase in average home values since 2010, rising from just under $700,000 to over $1.1 million in 2025. The town’s price trajectory reflects its longstanding role as one of Missouri’s most prestigious places to live. The biggest gains occurred in 2021 and 2022, when the market added over $200,000 in just two years. Since then, growth has remained strong and steady, helping the town cross into the seven-figure average territory—a rare achievement in the Midwest housing market.
Town and Country – Missouri’s Million-Dollar Suburb

Town and Country lives up to its name. This high-income enclave blends estate-style living with proximity to commerce and culture, making it a favored destination for executives, physicians, and old-money families in the St. Louis region. With wide streets, manicured lawns, and large custom homes on multi-acre lots, it has all the hallmarks of upper-tier suburbia. The town also includes parks, country clubs, and top-rated private schools like MICDS and Westminster, which draw affluent families from across the metro area.
Unlike some neighboring towns, Town and Country has limited commercial development, choosing instead to focus on residential preservation and quality of life. Zoning laws keep density low, and new construction is often luxury-tier—adding to the upward pressure on values. Residents also benefit from strong public services and extremely low crime rates, contributing to the area’s elite reputation. As one of the few places in Missouri where seven-figure price tags are the norm rather than the exception, Town and Country continues to set the standard for luxury living in the state.
5. Westwood – 73% Home Price Increase Since 2010
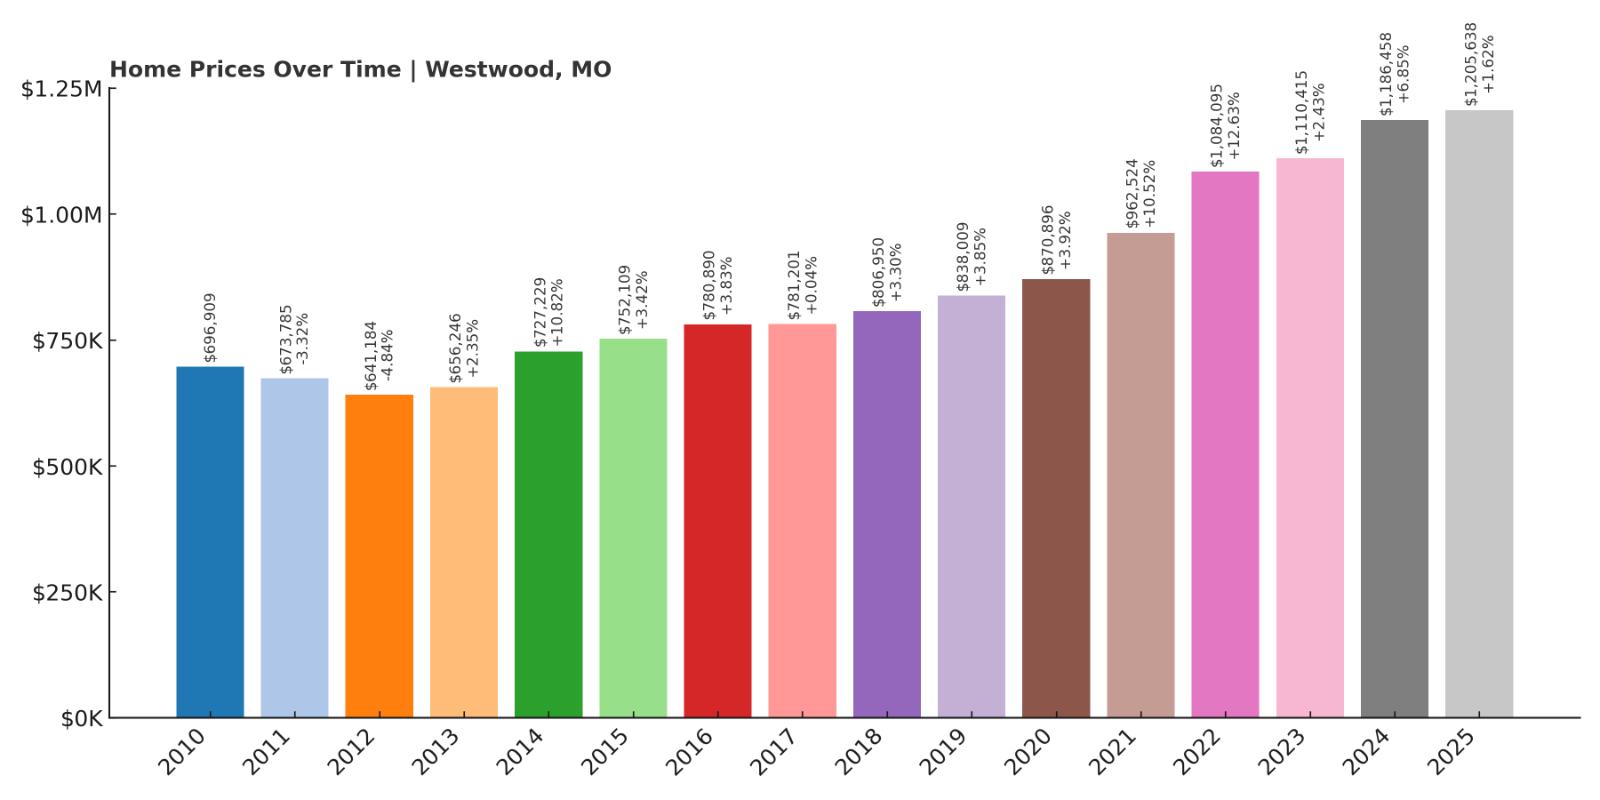
- 2010: $696,909
- 2011: $673,785 (-$23,123, -3.32% from previous year)
- 2012: $641,184 (-$32,601, -4.84% from previous year)
- 2013: $656,246 (+$15,062, +2.35% from previous year)
- 2014: $727,229 (+$70,983, +10.82% from previous year)
- 2015: $752,109 (+$24,879, +3.42% from previous year)
- 2016: $780,890 (+$28,782, +3.83% from previous year)
- 2017: $781,201 (+$310, +0.04% from previous year)
- 2018: $806,950 (+$25,750, +3.30% from previous year)
- 2019: $838,009 (+$31,058, +3.85% from previous year)
- 2020: $870,896 (+$32,887, +3.92% from previous year)
- 2021: $962,524 (+$91,628, +10.52% from previous year)
- 2022: $1,084,095 (+$121,570, +12.63% from previous year)
- 2023: $1,110,415 (+$26,321, +2.43% from previous year)
- 2024: $1,186,458 (+$76,043, +6.85% from previous year)
- 2025: $1,205,638 (+$19,180, +1.62% from previous year)
Westwood has seen its average home value climb by 73% since 2010, a rise driven by consistent year-over-year growth and major jumps in the early 2020s. The years 2021 and 2022 marked the most dramatic gains, with home values leaping by more than $210,000 in that short span. By 2025, prices had crossed the $1.2 million mark, putting Westwood firmly in Missouri’s elite pricing tier. Even as growth moderated after 2023, the long-term trajectory of this exclusive enclave reflects strong market fundamentals and enduring appeal.
Westwood – Quiet Wealth in the Heart of Ladue

Westwood is a tiny but ultra-wealthy town nestled within the Ladue area, known for its exclusivity, lush landscapes, and palatial estates. With a population of fewer than 400 people, it’s one of the most private and prestigious places to live in Missouri. The homes are large, often custom-built, and situated on expansive wooded lots that provide a sense of seclusion. There’s no commercial development within the town’s borders, which means zero traffic congestion and a rare kind of residential calm. That level of quiet luxury has made Westwood a magnet for executives, physicians, and legacy families alike.
While the town itself offers few public amenities, its proximity to everything Ladue and Clayton have to offer means residents enjoy both tranquility and convenience. Top private schools like MICDS and John Burroughs are within minutes, and residents also benefit from easy access to downtown St. Louis, country clubs, and upscale shopping. With virtually no new housing developments, Westwood’s inventory remains extremely limited, which further drives up prices. The result is a hyper-competitive market that rarely sees listings—and when it does, prices reflect that scarcity.
4. Frontenac – 66% Home Price Increase Since 2010
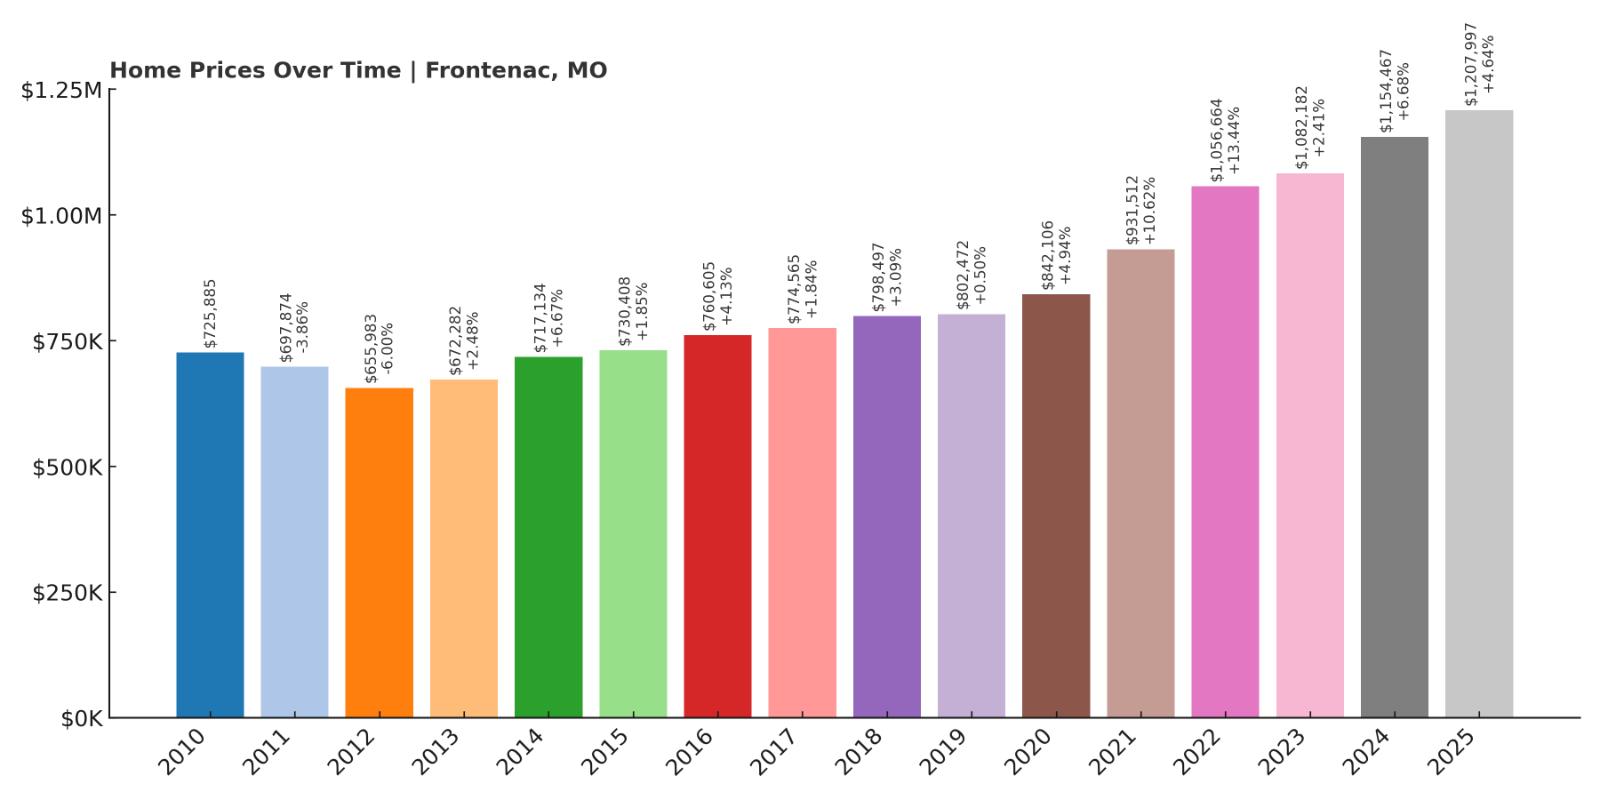
- 2010: $725,885
- 2011: $697,874 (-$28,010, -3.86% from previous year)
- 2012: $655,983 (-$41,892, -6.00% from previous year)
- 2013: $672,282 (+$16,299, +2.48% from previous year)
- 2014: $717,134 (+$44,852, +6.67% from previous year)
- 2015: $730,408 (+$13,274, +1.85% from previous year)
- 2016: $760,605 (+$30,197, +4.13% from previous year)
- 2017: $774,565 (+$13,961, +1.84% from previous year)
- 2018: $798,497 (+$23,931, +3.09% from previous year)
- 2019: $802,472 (+$3,976, +0.50% from previous year)
- 2020: $842,106 (+$39,633, +4.94% from previous year)
- 2021: $931,512 (+$89,407, +10.62% from previous year)
- 2022: $1,056,664 (+$125,151, +13.44% from previous year)
- 2023: $1,082,182 (+$25,518, +2.41% from previous year)
- 2024: $1,154,467 (+$72,285, +6.68% from previous year)
- 2025: $1,207,997 (+$53,530, +4.64% from previous year)
Home prices in Frontenac have increased 66% since 2010, growing from just under $726,000 to over $1.2 million. That growth has been particularly strong in the last five years, when the town’s luxury market soared by more than $375,000. This dramatic rise is a result of both macro trends—like the shift toward larger homes and outdoor space—and local factors, including low inventory and elite school access. Even after those high-growth years, the market has continued upward with consistent mid-single-digit increases, placing Frontenac squarely among the most exclusive communities in Missouri.
Frontenac – Refined Living in St. Louis County

Frontenac offers high-end residential living with a refined, Old World feel. Its mansions and stately brick homes are tucked among wooded streets, while the Plaza Frontenac shopping center brings upscale retailers like Saks Fifth Avenue and Louis Vuitton to the neighborhood’s doorstep. The town is known for its strong zoning laws, which restrict commercial encroachment and preserve its purely residential character. Homes here are typically spacious and architecturally distinguished, often ranging from $1 million to well above $3 million.
The community is also known for its emphasis on education and tradition. Families here send children to prestigious schools such as Chaminade and Villa Duchesne, while generations of residents stay in the area thanks to its enduring charm and safety. With minimal available land and high buyer demand, Frontenac’s housing market is reliably competitive. Despite economic shifts, it has held onto its value—and in many years, outpaced broader metro trends. As a result, it remains a premier destination for buyers seeking both elegance and investment-grade real estate.
3. Village of Loch Lloyd – 103% Home Price Increase Since 2010

- 2010: $598,806
- 2011: $567,813 (-$30,993, -5.18% from previous year)
- 2012: $500,541 (-$67,273, -11.85% from previous year)
- 2013: $514,942 (+$14,401, +2.88% from previous year)
- 2014: $645,537 (+$130,596, +25.36% from previous year)
- 2015: $678,727 (+$33,190, +5.14% from previous year)
- 2016: $734,618 (+$55,891, +8.23% from previous year)
- 2017: $767,194 (+$32,576, +4.43% from previous year)
- 2018: $779,668 (+$12,474, +1.63% from previous year)
- 2019: $850,292 (+$70,624, +9.06% from previous year)
- 2020: $854,847 (+$4,555, +0.54% from previous year)
- 2021: $889,227 (+$34,380, +4.02% from previous year)
- 2022: $1,070,580 (+$181,353, +20.39% from previous year)
- 2023: $1,103,018 (+$32,437, +3.03% from previous year)
- 2024: $1,132,684 (+$29,666, +2.69% from previous year)
- 2025: $1,217,728 (+$85,044, +7.51% from previous year)
Loch Lloyd’s home values have surged over 100% since 2010, rising from $599,000 to over $1.2 million. While some early years saw dips, the long-term growth trajectory has been steep, particularly from 2020 onward. The standout year was 2022, when prices skyrocketed by over $180,000. Since then, prices have continued rising, cementing Loch Lloyd’s status as a premier private community in the Midwest. This kind of appreciation is uncommon even in luxury markets, reflecting the rare combination of exclusivity, amenities, and high-end new construction that Loch Lloyd offers.
Village of Loch Lloyd – Resort-Style Living Just Outside Kansas City

🔥 Would you like to save this?
Loch Lloyd is a gated golf and lake community on the Missouri-Kansas border, often compared to a country club resort. With 24/7 security, manicured grounds, and a championship golf course designed by Tom Watson, the community has become a magnet for athletes, executives, and high-net-worth retirees. Homes in Loch Lloyd are expansive and luxurious, often featuring private pools, wine cellars, and four-car garages. The neighborhood includes walking trails, a wellness center, and planned events that foster a social atmosphere among its residents.
Development in Loch Lloyd continues, with high-end builders adding new inventory that pushes price points even higher. The exclusivity of the community, paired with the quality of its amenities, makes it one of the most desirable places to live in the Kansas City area. It’s also close enough to Overland Park and downtown Kansas City to serve commuters, yet remote enough to feel like a peaceful escape. With a strong brand and reputation for security, lifestyle, and luxury, Loch Lloyd is likely to remain a top-tier market for years to come.
2. Ladue – 59% Home Price Increase Since 2010
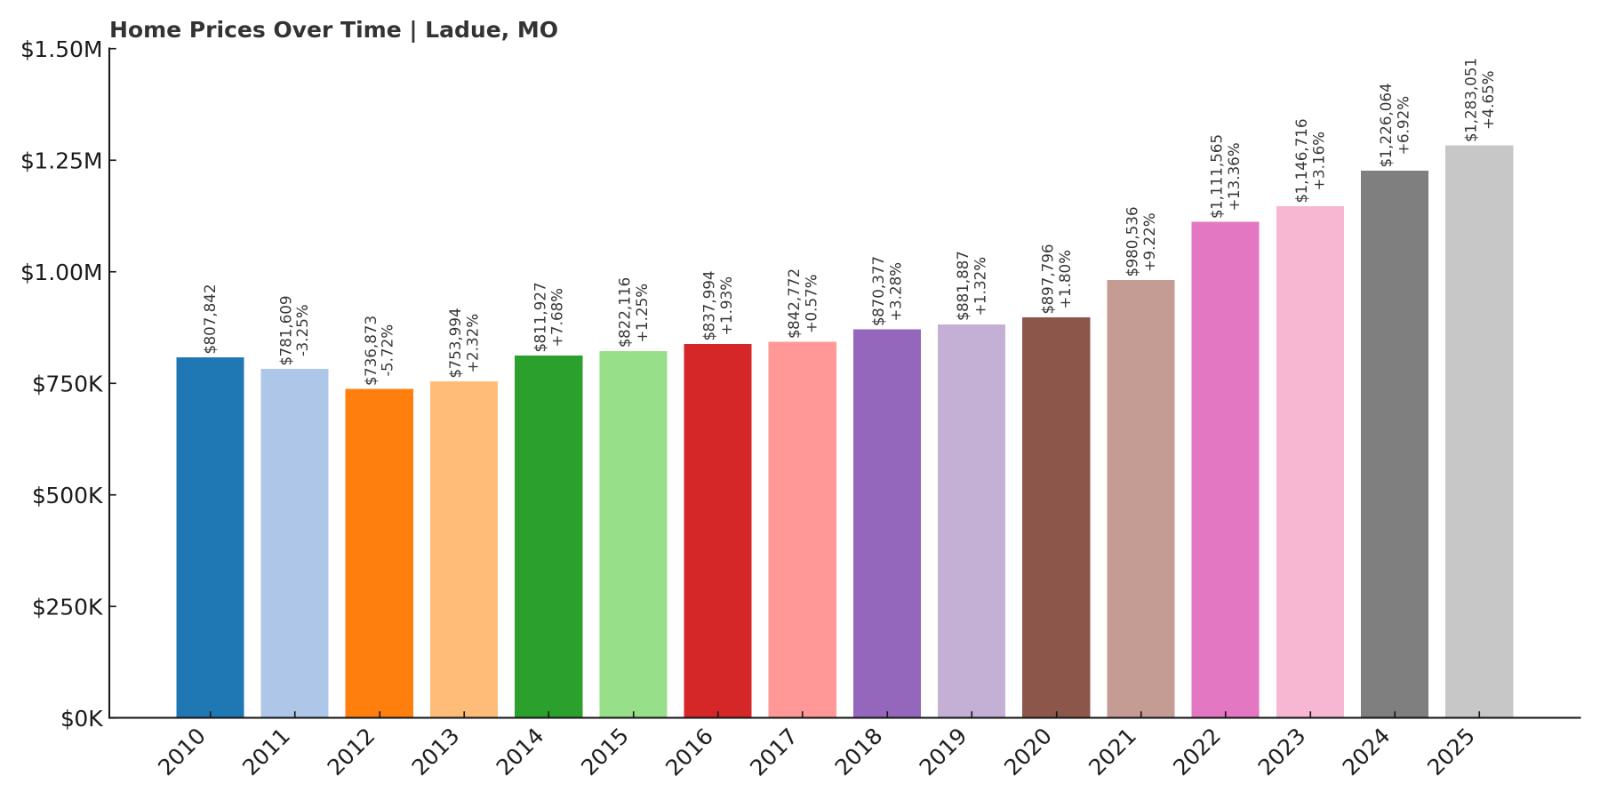
- 2010: $807,842
- 2011: $781,609 (-$26,232, -3.25% from previous year)
- 2012: $736,873 (-$44,736, -5.72% from previous year)
- 2013: $753,994 (+$17,121, +2.32% from previous year)
- 2014: $811,927 (+$57,933, +7.68% from previous year)
- 2015: $822,116 (+$10,188, +1.25% from previous year)
- 2016: $837,994 (+$15,879, +1.93% from previous year)
- 2017: $842,772 (+$4,778, +0.57% from previous year)
- 2018: $870,377 (+$27,605, +3.28% from previous year)
- 2019: $881,887 (+$11,510, +1.32% from previous year)
- 2020: $897,796 (+$15,909, +1.80% from previous year)
- 2021: $980,536 (+$82,740, +9.22% from previous year)
- 2022: $1,111,565 (+$131,030, +13.36% from previous year)
- 2023: $1,146,716 (+$35,151, +3.16% from previous year)
- 2024: $1,226,064 (+$79,347, +6.92% from previous year)
- 2025: $1,283,051 (+$56,988, +4.65% from previous year)
Ladue’s real estate market has appreciated by 59% since 2010, with the most dramatic increases occurring between 2020 and 2022. That period alone added nearly $230,000 to the average home value. Ladue is a benchmark for luxury in Missouri, and prices reflect that. With average values now above $1.28 million, the town continues to attract top-tier buyers looking for status, education, and timeless architecture in a secure, established neighborhood.
Ladue – Old Money, Elite Schools, and Architectural Grandeur

Ladue is Missouri’s most famous luxury suburb, known for its mansions, horse properties, and nationally ranked public and private schools. Residents include top attorneys, business owners, surgeons, and civic leaders. The community features winding roads, brick manors, and a country-club ambiance, with homes often selling quietly off-market. The Ladue School District consistently ranks among the best in the Midwest, and proximity to MICDS, Burroughs, and other private institutions adds to the town’s educational draw.
Strict zoning laws and a resistance to high-density development have helped preserve Ladue’s charm and scarcity. Unlike fast-developing outer suburbs, Ladue offers a timeless experience—and a sense of exclusivity that’s hard to replicate. Whether it’s a traditional estate or a newly renovated mid-century home, properties here come with prestige. It’s no surprise that prices have remained resilient and climbed steadily, year after year.
1. Huntleigh – 51% Home Price Increase Since 2010
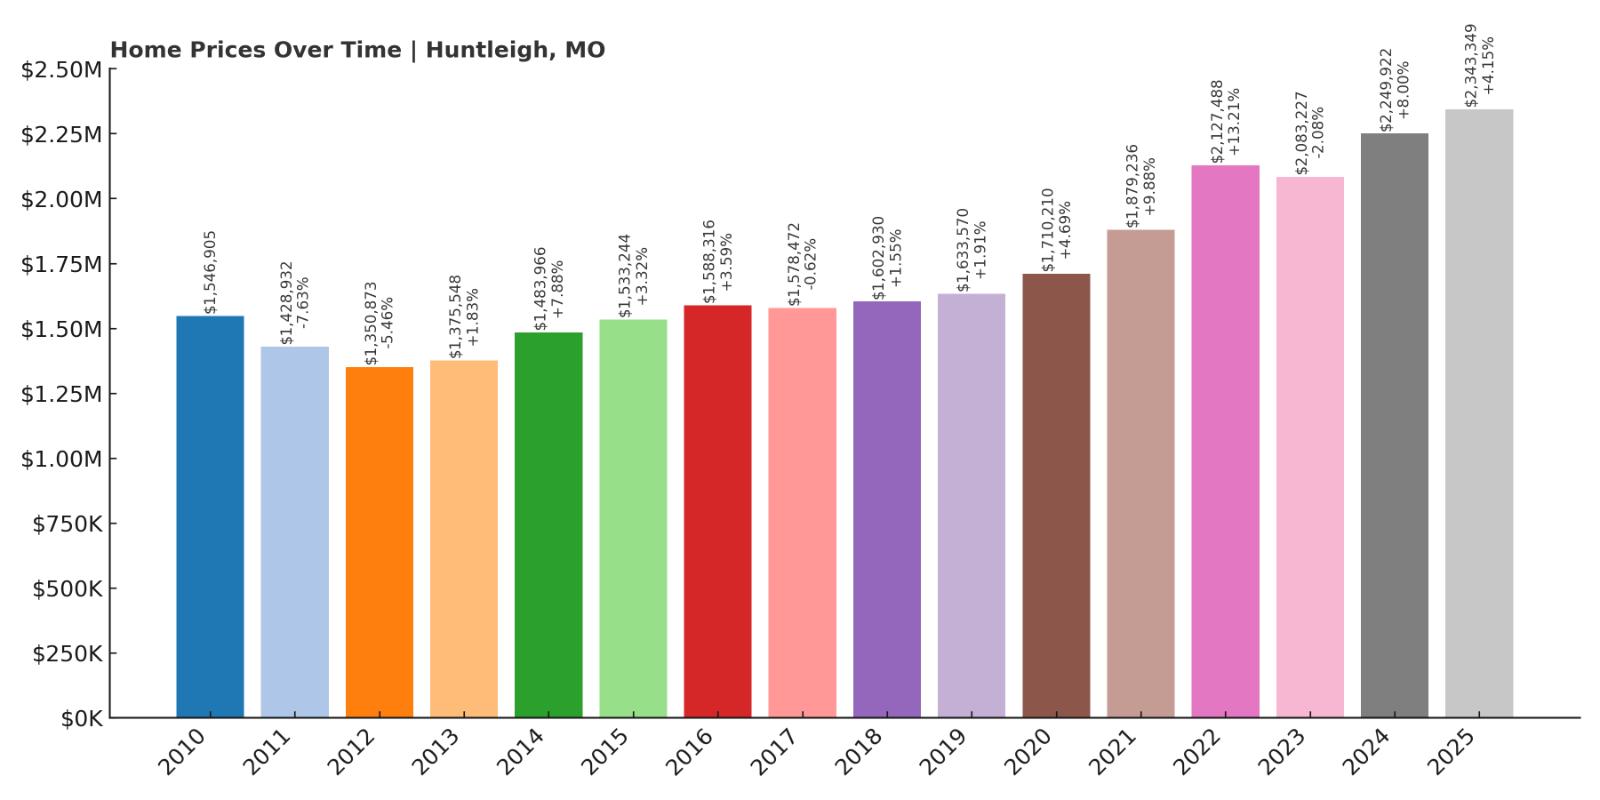
- 2010: $1,546,905
- 2011: $1,428,932 (-$117,973, -7.63% from previous year)
- 2012: $1,350,873 (-$78,059, -5.46% from previous year)
- 2013: $1,375,548 (+$24,675, +1.83% from previous year)
- 2014: $1,483,966 (+$108,418, +7.88% from previous year)
- 2015: $1,533,244 (+$49,278, +3.32% from previous year)
- 2016: $1,588,316 (+$55,072, +3.59% from previous year)
- 2017: $1,578,472 (-$9,844, -0.62% from previous year)
- 2018: $1,602,930 (+$24,457, +1.55% from previous year)
- 2019: $1,633,570 (+$30,640, +1.91% from previous year)
- 2020: $1,710,210 (+$76,640, +4.69% from previous year)
- 2021: $1,879,236 (+$169,026, +9.88% from previous year)
- 2022: $2,127,488 (+$248,252, +13.21% from previous year)
- 2023: $2,083,227 (-$44,261, -2.08% from previous year)
- 2024: $2,249,922 (+$166,695, +8.00% from previous year)
- 2025: $2,343,349 (+$93,427, +4.15% from previous year)
Huntleigh stands at the top of Missouri’s housing market with an average home price of over $2.3 million. While the overall increase since 2010 is 51%, that number underplays just how elite and stable this community is. Massive year-over-year gains in 2021 and 2022 drove prices up by nearly $420,000. Despite a slight dip in 2023, values rebounded strongly in 2024 and 2025. In Missouri, no town matches Huntleigh in terms of consistent ultra-luxury appeal and entry-level prices that start at seven figures.
Huntleigh – Missouri’s Most Exclusive Address

Huntleigh is a tiny, gated community just west of Ladue known for its equestrian estates, private compounds, and quiet prestige. With only a few dozen homes and private streets, the town operates more like a country estate than a typical municipality. Celebrities, business tycoons, and old-money families make up much of the population. Many homes here sit on five or more acres and feature private stables, tennis courts, and guesthouses. This extreme exclusivity, along with proximity to country clubs, top schools, and St. Louis’ business districts, makes Huntleigh unique not only in Missouri, but in the entire Midwest.
Development in Huntleigh is nearly nonexistent—every home is custom, and the town’s regulations protect its character with extraordinary vigilance. Listings are rare, and bidding wars among high-end buyers are common. It’s the kind of place where generational wealth meets architectural grandeur. The result is a market that operates above normal trends, driven more by legacy and prestige than supply-and-demand economics. For those who can afford it, Huntleigh is the pinnacle of Missouri real estate.


