🔥 Would you like to save this?
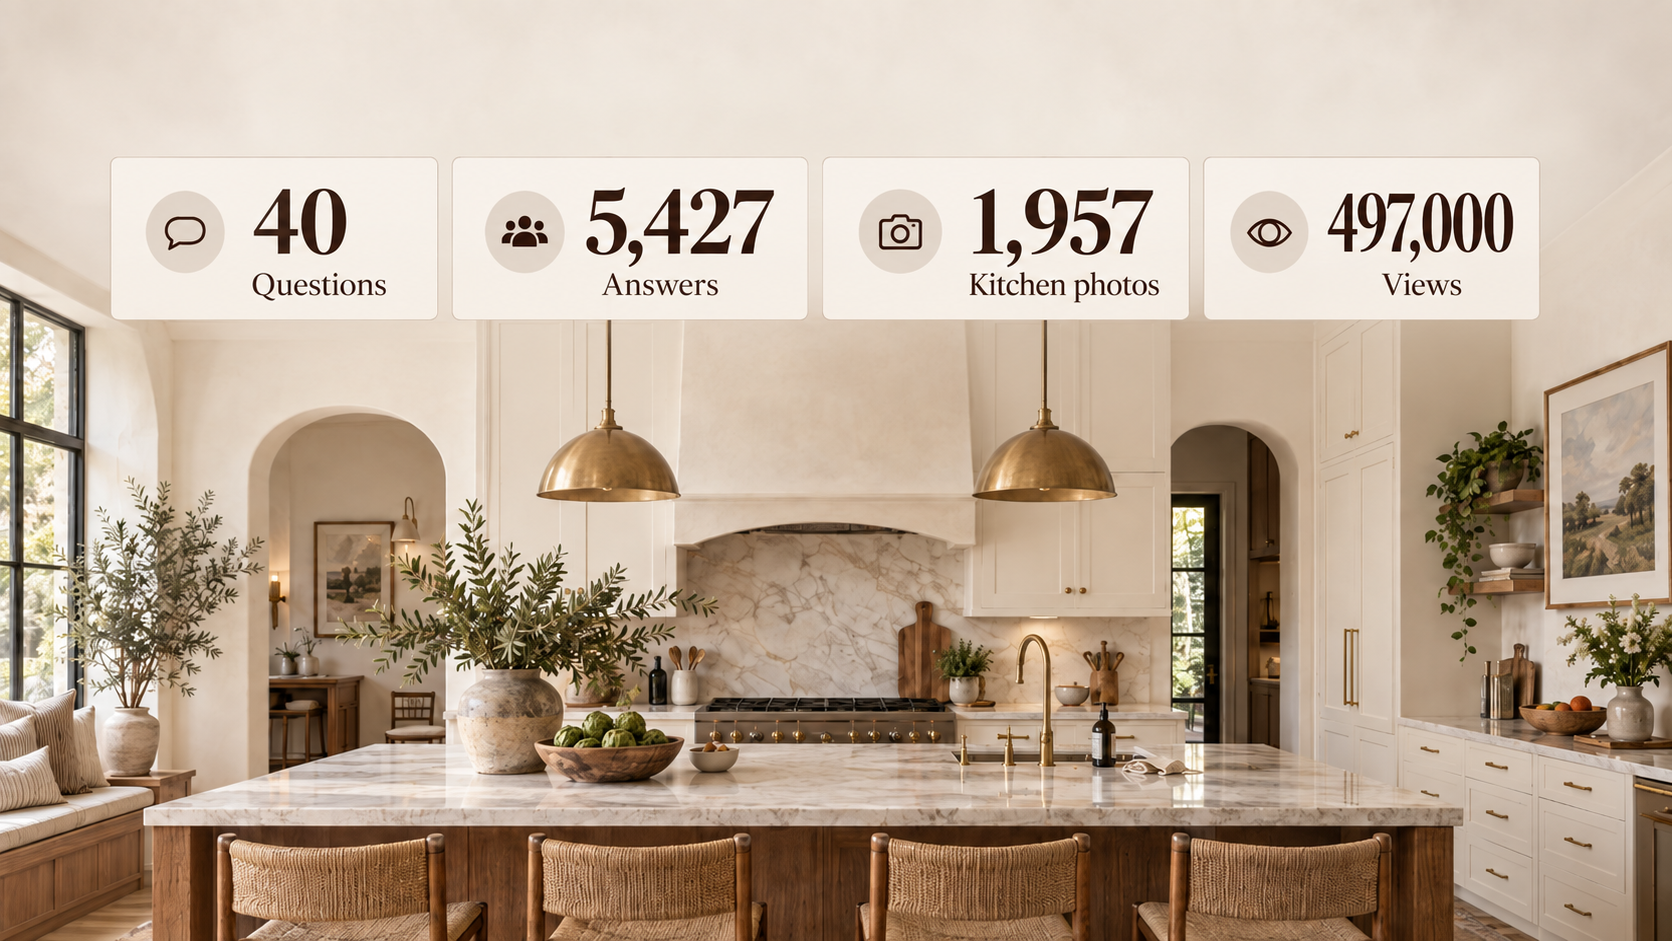
Over the past three weeks, I asked Home Stratosphere readers 40 questions about kitchens. No photos attached. No carefully styled room nudging them one way or another. Just questions about cabinet color, counters, backsplash, flooring, hardware, islands, lighting, range hoods, wood tones, sinks and pretty much everything else that goes into a kitchen.
I got 5,427 answers.
At the same time, readers were looking at 1,957 tagged kitchen photos on Home Stratosphere. Those photos generated about 497,000 views, along with thousands of hearts, saves, thumbs-downs and head-to-head choices.
That gave me something I’ve wanted for a long time: I can compare the kitchen people say they want with the kitchens they actually stop for, save and choose when nobody asks them what they prefer.
Those are not always the same kitchen.
Sometimes they’re not even close.
A quick note before getting into it: views are based on a 1-in-10 session sample that’s scaled up. Poll answers, saves and reactions are events, not unique people, so I’m not going to pretend 5,427 answers equals 5,427 individual readers. This is behavioral data from Home Stratosphere readers, not a representative survey of North America.
With that out of the way, here’s the kitchen they say they’d build.
The Kitchen Readers Would Build
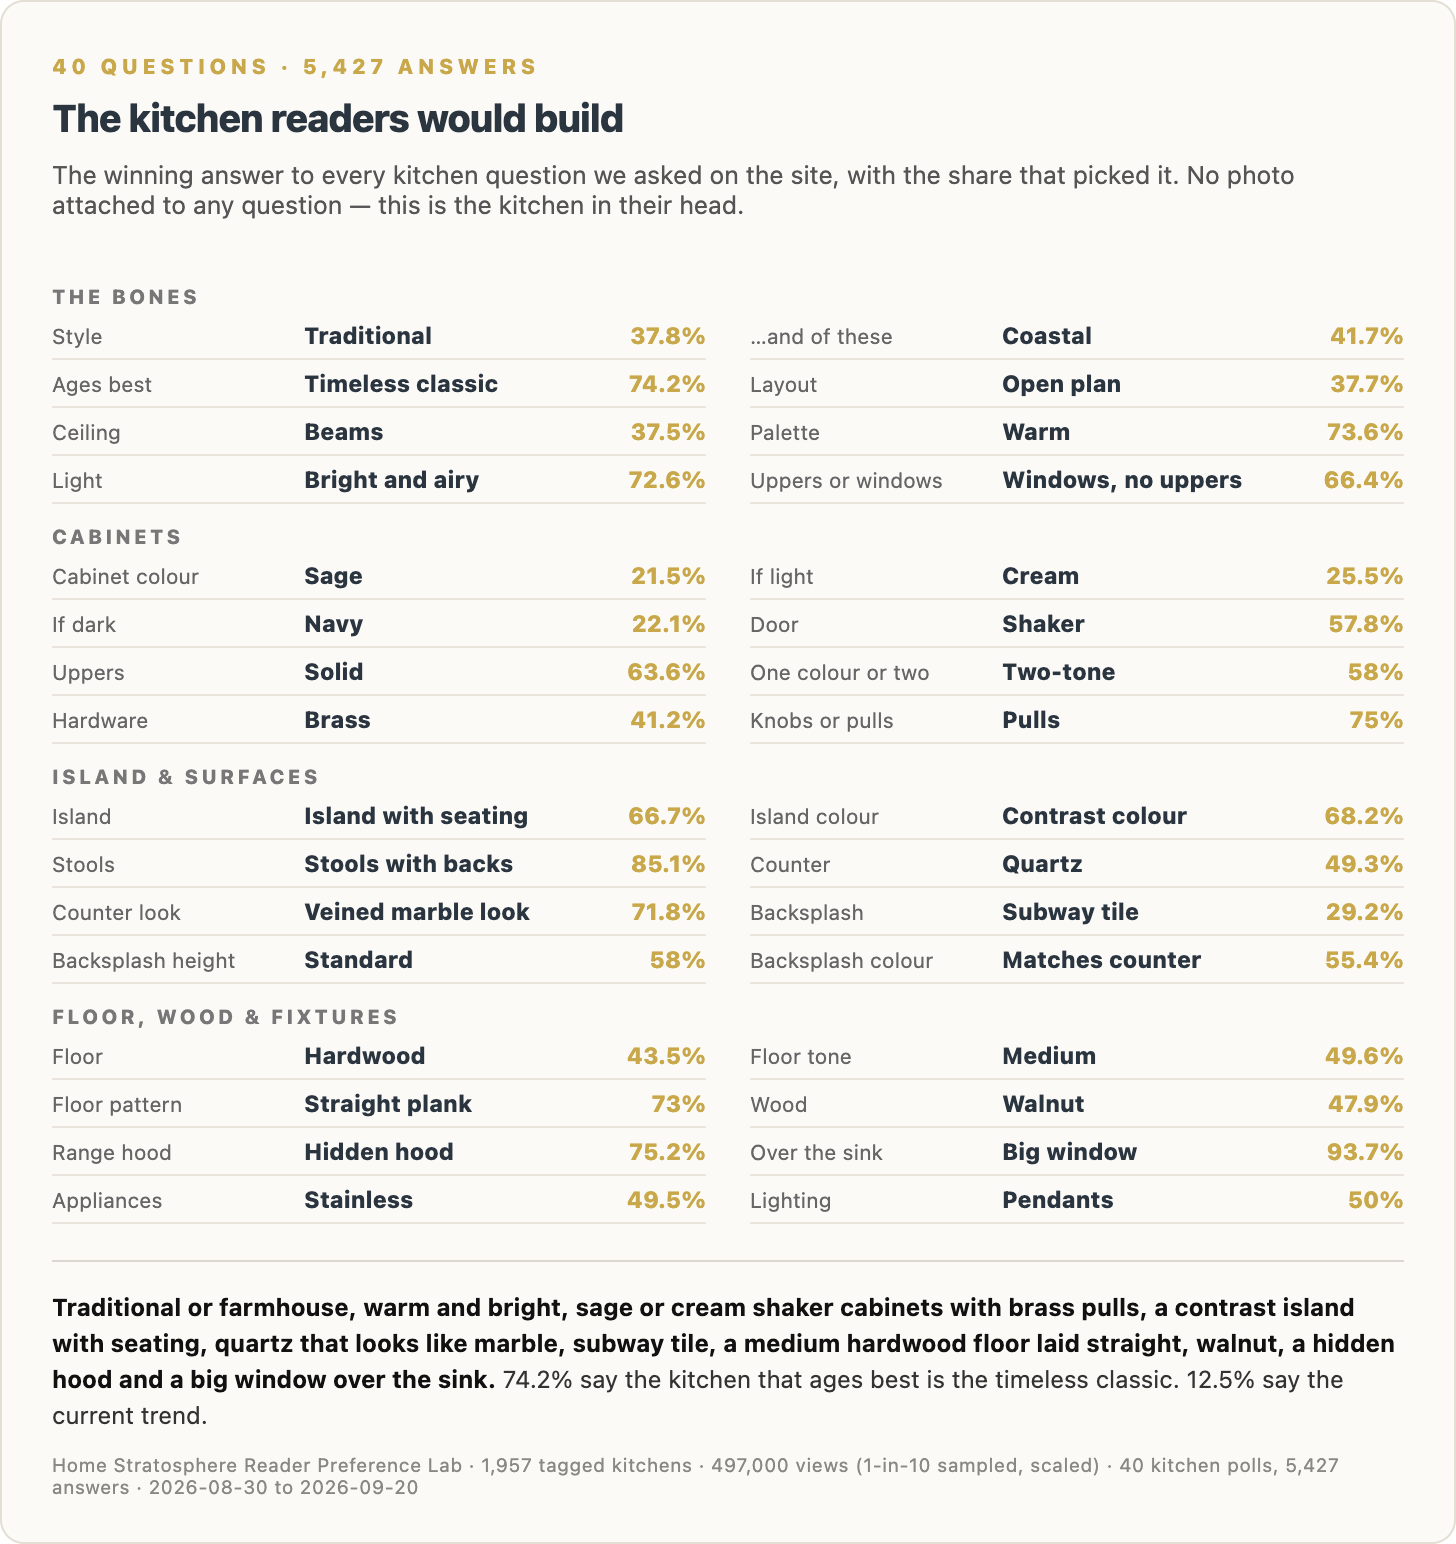
This chart takes the winning answer from all 40 kitchen questions and assembles them into one spec sheet.
And I have to say, it’s a pretty coherent kitchen.
Readers want a traditional kitchen, with farmhouse a reasonably close second. They want it to age as a timeless classic, not look like whatever happens to be current this year. They want a warm palette, bright and airy light, beams overhead and an open layout.
Then there’s the sink wall.
This was one of the biggest blowouts in the entire survey: 93.7% want a big window over the sink. Only 6.3% want that space turned into a backsplash wall.
I get it. If I’m standing there rinsing dishes, I’d rather look outside than admire six more square feet of tile.
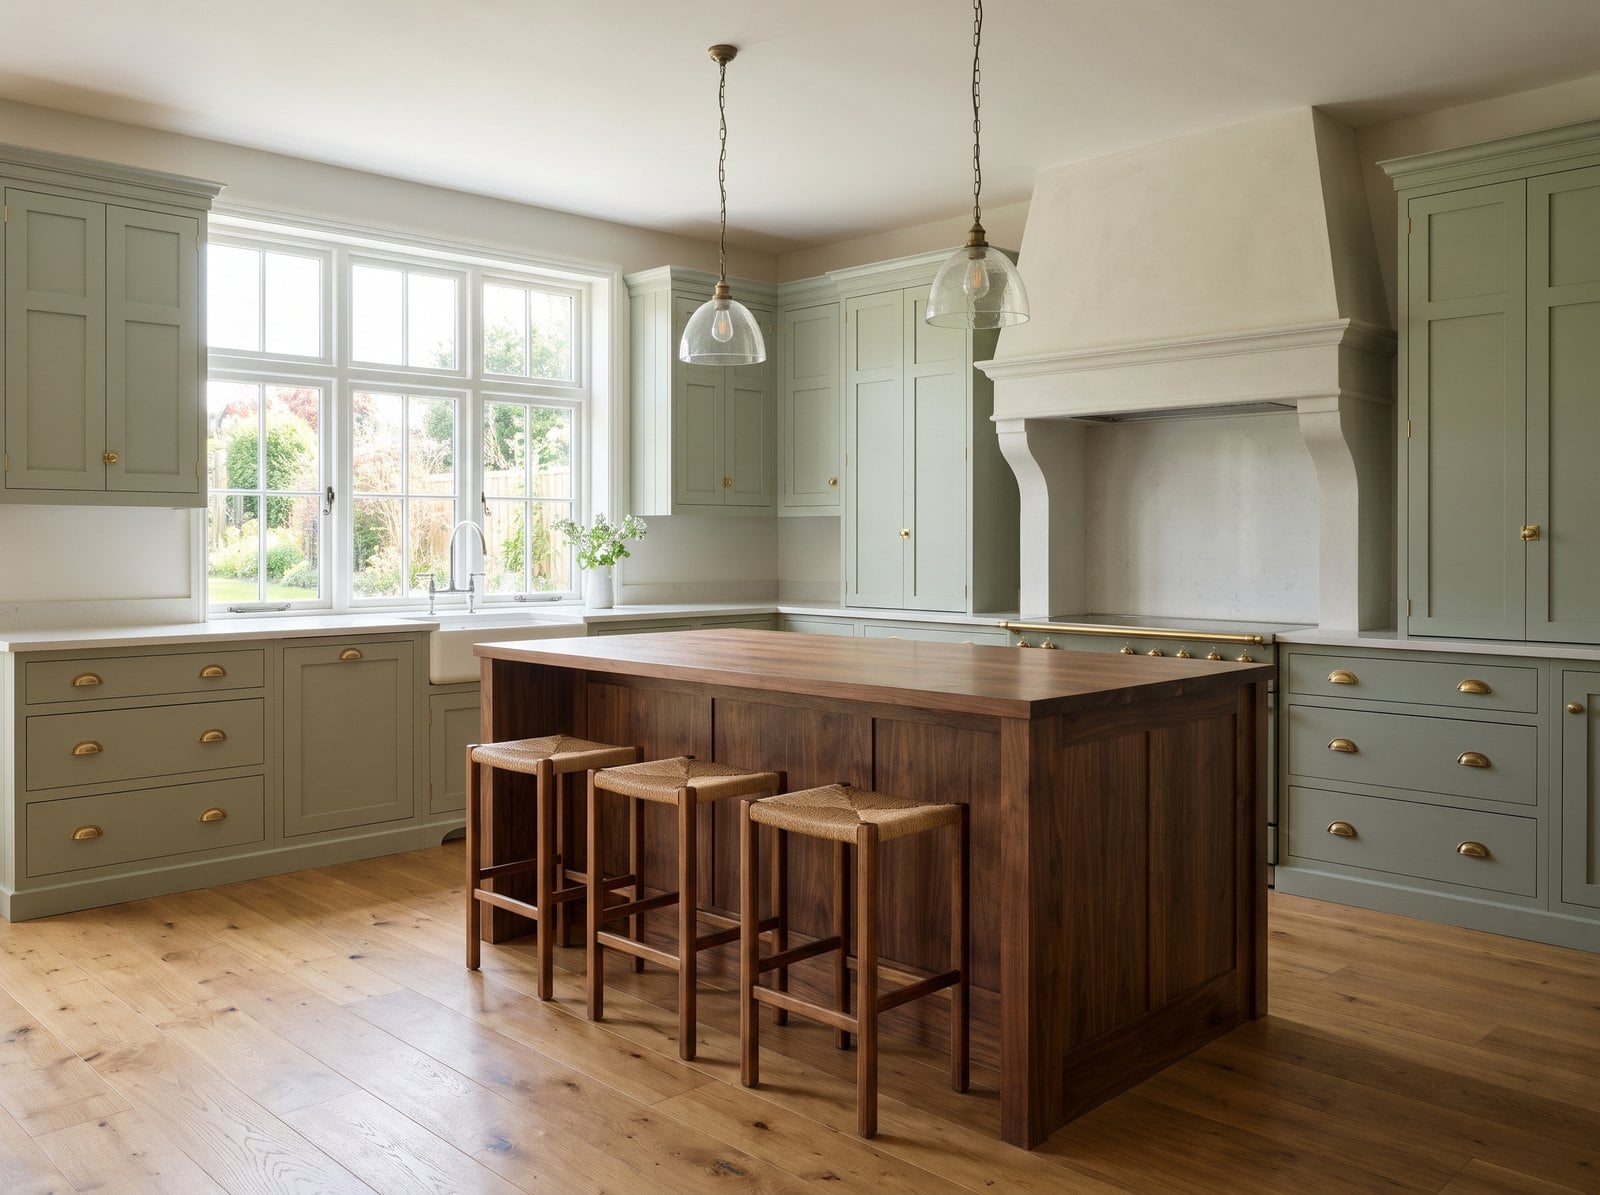
The cabinets are equally telling. Sage wins when readers are simply asked for a cabinet color. Cream wins if the cabinet has to be light. Navy wins if it has to be dark. They want Shaker doors, solid uppers, brass hardware, pulls instead of knobs, and a two-tone kitchen rather than everything being one color.
The island should have seating and contrast with the cabinets. The stools should have backs. Two big pendants go over it.
For surfaces, readers choose quartz, but 71.8% say they want the countertop to look like veined marble. In other words, they want marble without necessarily owning marble, which probably explains half the quartz industry.
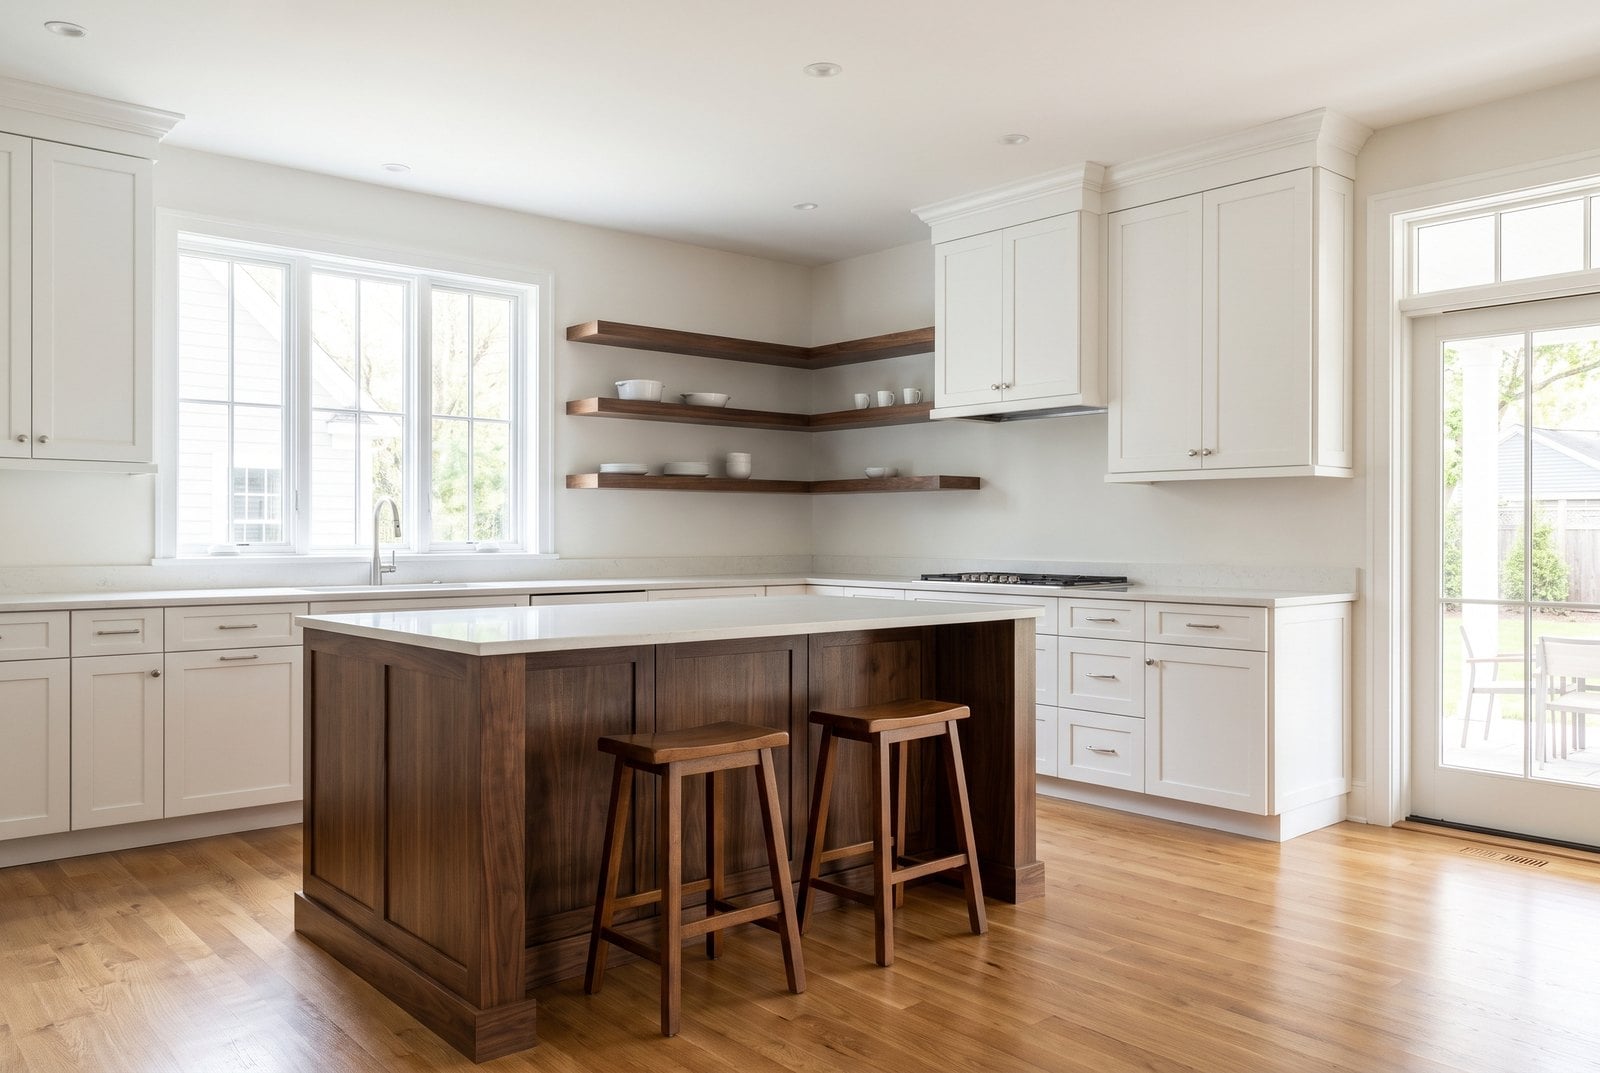
Subway tile wins the backsplash question. Hardwood wins the floor. Medium tone wins the floor color. Straight plank demolishes more decorative floor patterns. Walnut beats pale oak.
The hood should be hidden. Appliances should be stainless. The room should include wood, but not pale oak everywhere. And if readers have to choose between whatever happens to be hot this year and something that will still look good in 10 years, 74.2% choose timeless classic.
That last number might be the most important one on the chart.
Because when you put all of these answers together, the result is not especially trendy.
It’s warm, familiar, fairly traditional and pretty restrained.
Which brings me to the fun part.
A Lot of the Trends We Keep Seeing Are Not What Readers Want
I pulled out twelve kitchen ideas that have been pushed hard in magazines, design blogs, renovation shows and showroom photography.
Then I ranked them by the percentage of readers who actually chose them.
Some got slaughtered.
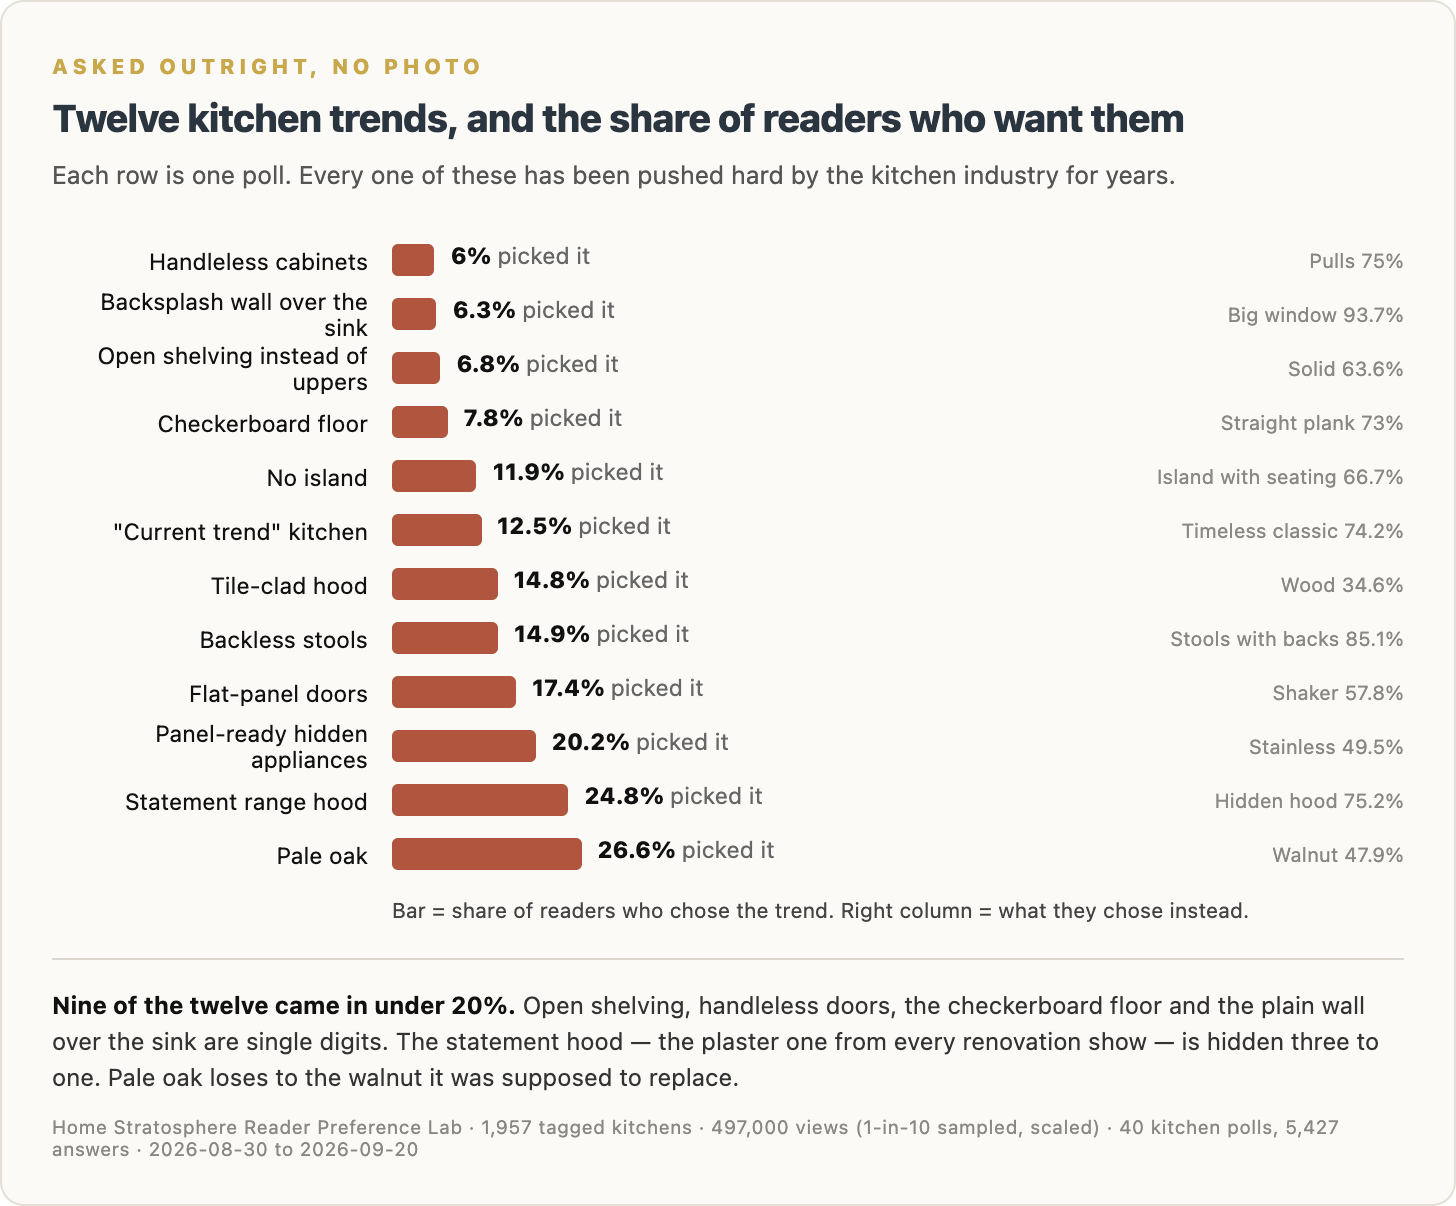
Handleless cabinets: 6%.
Pulls took 75%.
A backsplash wall over the sink instead of a window: 6.3%.
That one barely had a pulse.
Open shelving instead of upper cabinets: 6.8%.
Solid uppers took 63.6%.
Open shelving is especially interesting because I’ve looked at thousands of kitchen photos over the years and you’d think half the country had ripped out its upper cabinets to display three ceramic bowls and a stack of cookbooks.
Apparently not.
Readers overwhelmingly want cabinets.
There’s an important wrinkle, though. In a separate question, we asked whether they wanted upper cabinets or a wall of windows with no uppers at all.
66.4% took the windows.
That tells me the problem isn’t that people desperately want every inch of wall stuffed with cabinetry.
They’re perfectly happy opening the wall up.
They just don’t want open shelves full of dishes.
Checkerboard floors got 7.8%.
No island got 11.9%.
“Current trend” as the kitchen most likely to age well got 12.5%.
Tile-clad hoods came in at 14.8%.
Backless stools: 14.9%.
Flat-panel cabinets: 17.4%.
Panel-ready hidden appliances: 20.2%.
Then we get to the statement range hood.
You know the one.
Plaster hood. Big architectural shape. Often stretching nearly to the ceiling. Appears in approximately every second kitchen renovation on television.
24.8% wanted it.
The hidden hood took 75.2%.
That one surprised me.
So did pale oak.
Pale oak has been absolutely everywhere.
Readers chose it 26.6% of the time.
Walnut took 47.9%.
Apparently the wood pale oak was supposed to replace is still very much alive.
Nine of these twelve trends came in under 20%.
Four were in the single digits.
That’s a pretty big gap between what gets photographed and promoted and what readers actually say they’d install in their own house.
But polls are only half the story.
Because what people say they want is not necessarily what makes them stop scrolling.
Quartz Wins When You Ask. Then Readers Scroll Right Past It.
This is where things start getting much more interesting.
We asked readers directly which countertop material they wanted.
Quartz won easily at 49.3%.
Marble came last at 12.9%.
If I stopped there, the conclusion would be pretty simple:
Readers love quartz.
Except the photo data tells a very different story.
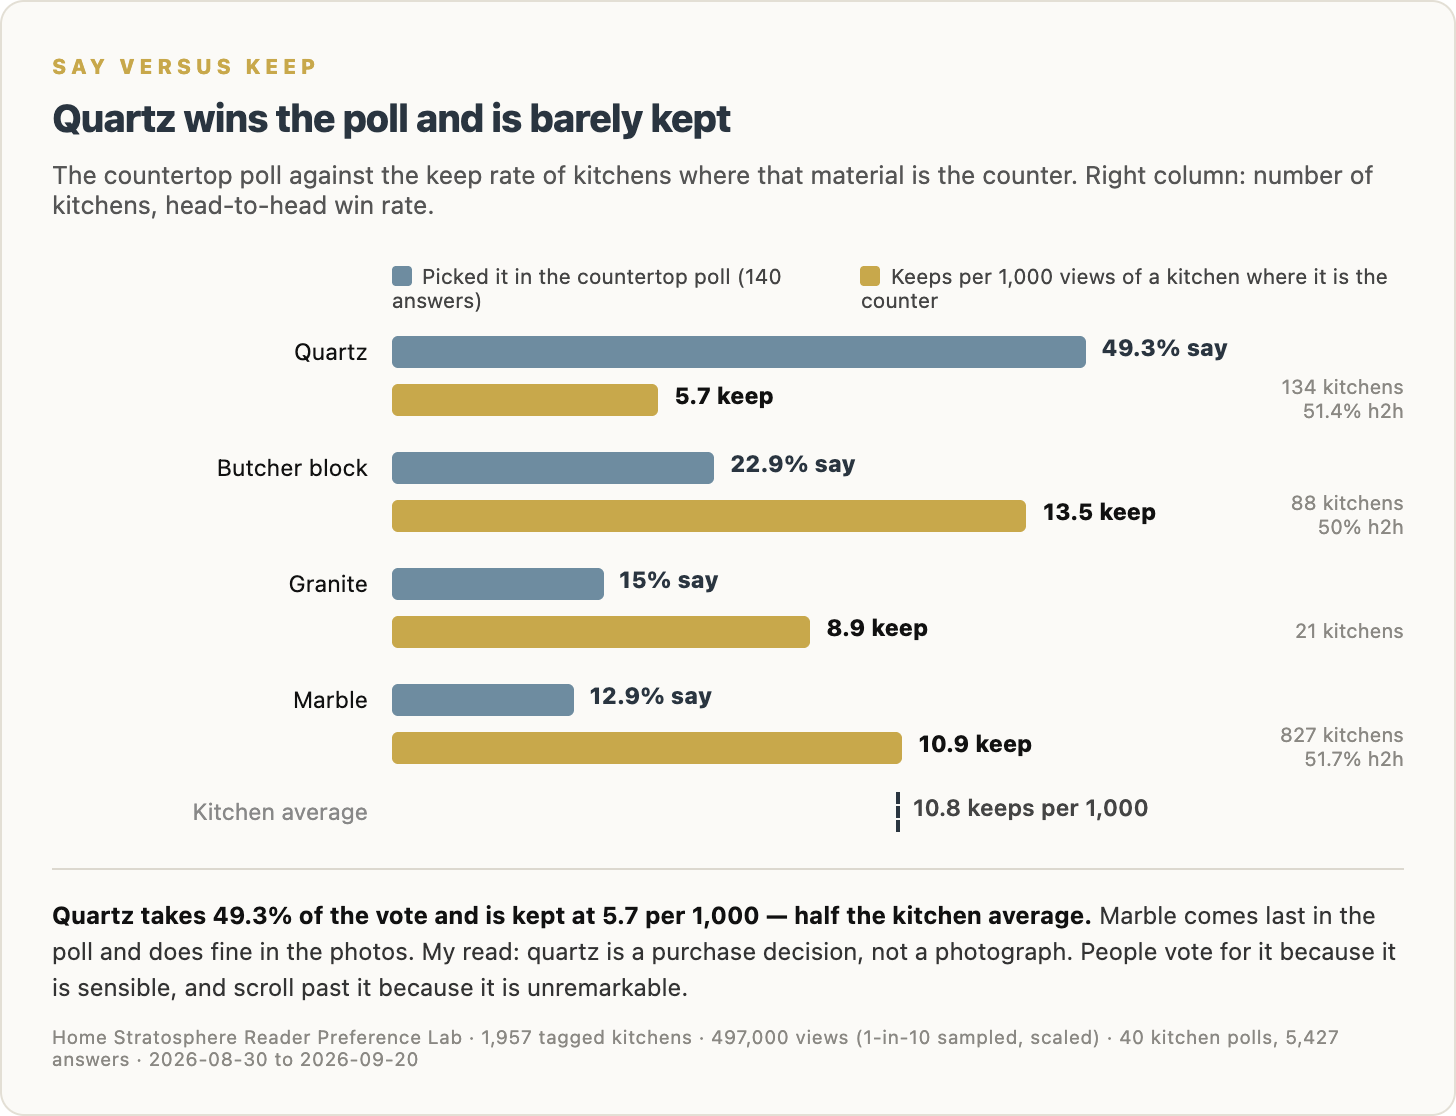
Quartz kitchens are kept at 5.7 per 1,000 views.
The kitchen-wide average is 10.8.
So quartz performs at roughly half the average keep rate.
Butcher block comes in at 13.5.
Marble — the material readers put dead last in the poll — comes in around average at 10.9, across a much larger group of kitchens.
This is one of those cases where both answers can be true.
If you’re actually buying a countertop, quartz makes a ton of sense.
It’s practical.
It’s widely available.
There are endless colors.
You can get the marble look without dealing with marble.
And sure enough, when readers were asked what they wanted their countertop to look like, 71.8% chose veined marble.
So the kitchen in their head is basically:
Give me the marble look without the marble headache.
Totally reasonable.
But a practical buying decision is not necessarily an interesting photograph.
That’s why I think quartz wins the poll but loses the keep.
People choose it because they can imagine living with it.
They scroll past because they’ve already seen it 10,000 times.
Readers Say Bright and Airy. They Keep Moody.
Here’s another contradiction.
Ask readers which kitchen they want and 72.6% choose bright and airy.
Show them kitchens and let them decide what to keep?
Moody kitchens outperform.
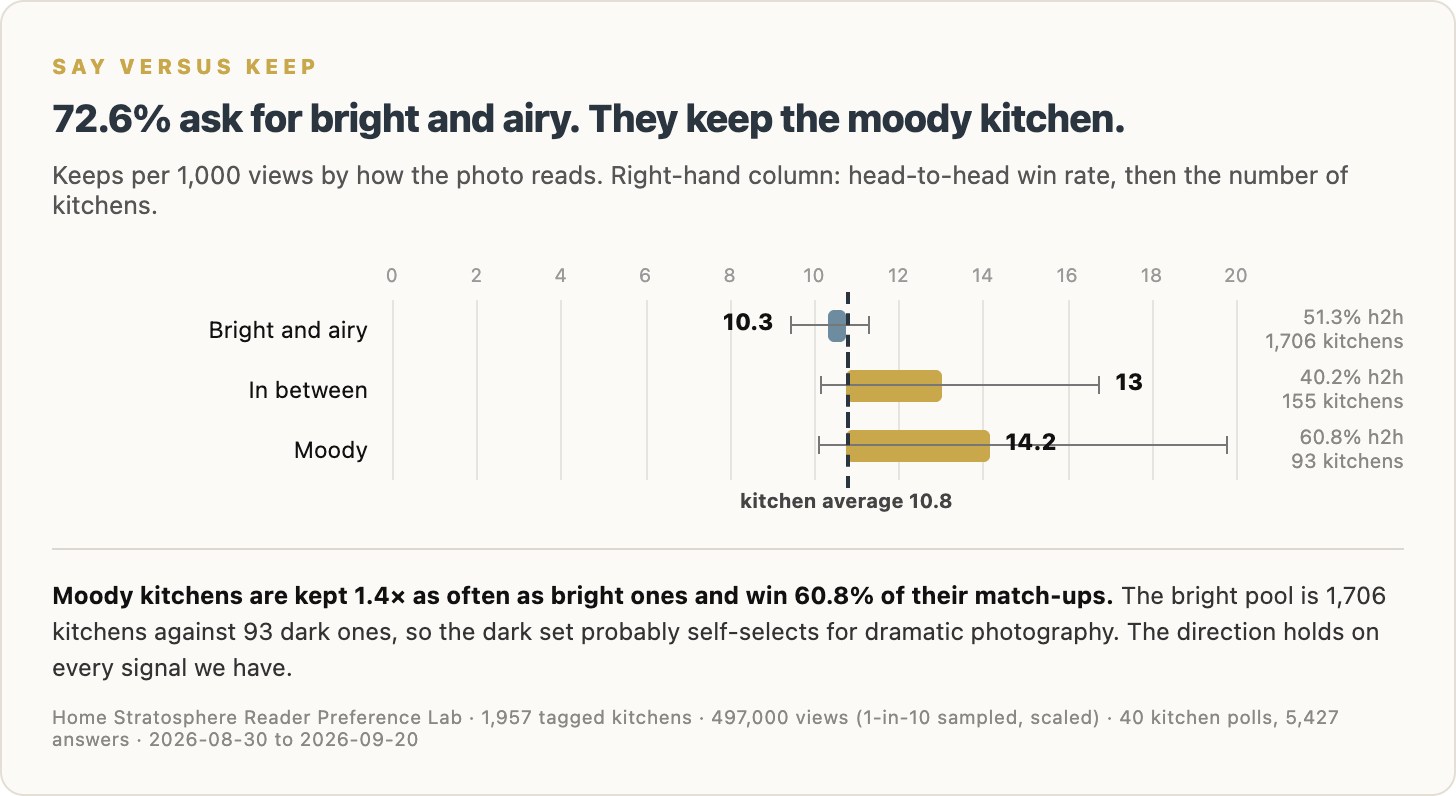
Bright-and-airy kitchens are kept at 10.3 per 1,000 views.
Moody kitchens hit 14.2.
They also win 60.8% of their head-to-head matchups.
That’s a meaningful difference.
There is a caveat here. The bright-and-airy pool is huge: 1,706 kitchens. The moody pool is only 93.
So I wouldn’t take 14.2 as some universal law carved into stone. The moody kitchens probably self-select for stronger, more dramatic photography.
Still, every signal points the same direction.
People say they want bright.
But darker, moodier kitchens are more likely to make them stop.
That doesn’t strike me as inconsistent.
There’s a difference between the kitchen you want to cook breakfast in every morning and the kitchen that makes you pause halfway through a scroll.
One is a house.
The other is a photograph.
No Wood Is the One Thing Readers Seem to Reject Everywhere
This one is different.
There’s no contradiction.
The polls don’t like it.
The keep button doesn’t like it.
The head-to-head choices don’t like it.
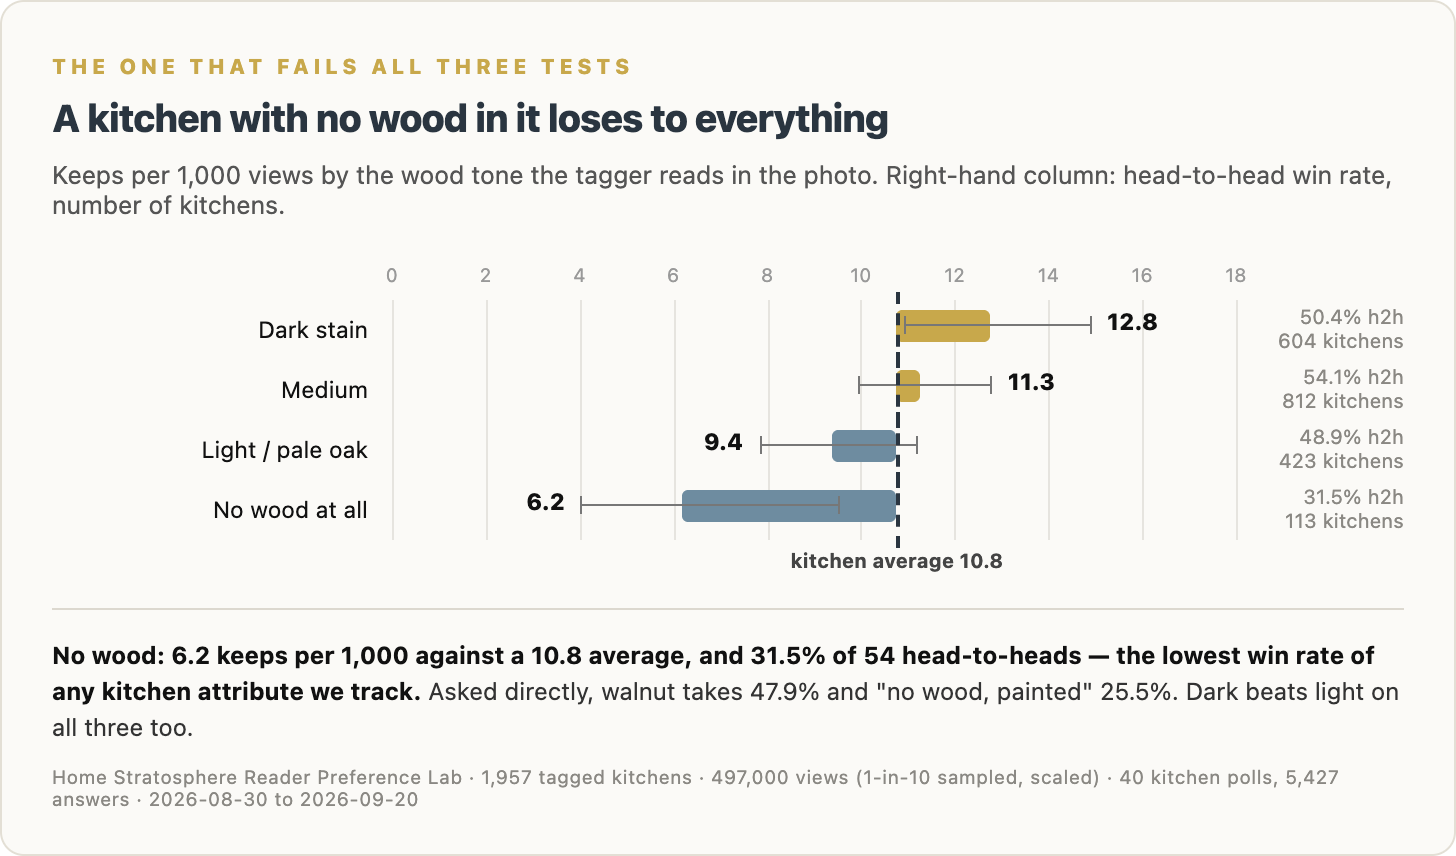
Asked directly about wood, “no wood, painted” finishes last.
Then we look at kitchens where the tagging system reads no visible wood in the photo.
They’re kept at just 6.2 per 1,000 views.
They win only 31.5% of their head-to-head matchups.
That is the lowest win rate of any kitchen attribute we track.
Readers also favor dark wood over pale wood.
Dark stain comes in at 12.8 keeps per 1,000.
Medium wood: 11.3.
Light/pale oak: 9.4.
No wood at all: 6.2.
The direct poll tells the same story.
Walnut beats pale oak.
So if I were building a kitchen today, this is probably the finding I’d be least tempted to argue with:
Put some damn wood in the room.
It doesn’t need to be the cabinets.
It can be the floor, island, hood, ceiling, shelving, stools, trim, furniture or some combination of them.
But a kitchen where every surface is painted, tiled, engineered or polished seems to lose something readers respond to.
Cream Beats White. Beige Gets Obliterated.
This one surprised me.
White kitchens have been declared dead so many times I’ve lost count.
The data says otherwise.
White does fine.
Beige is the disaster.
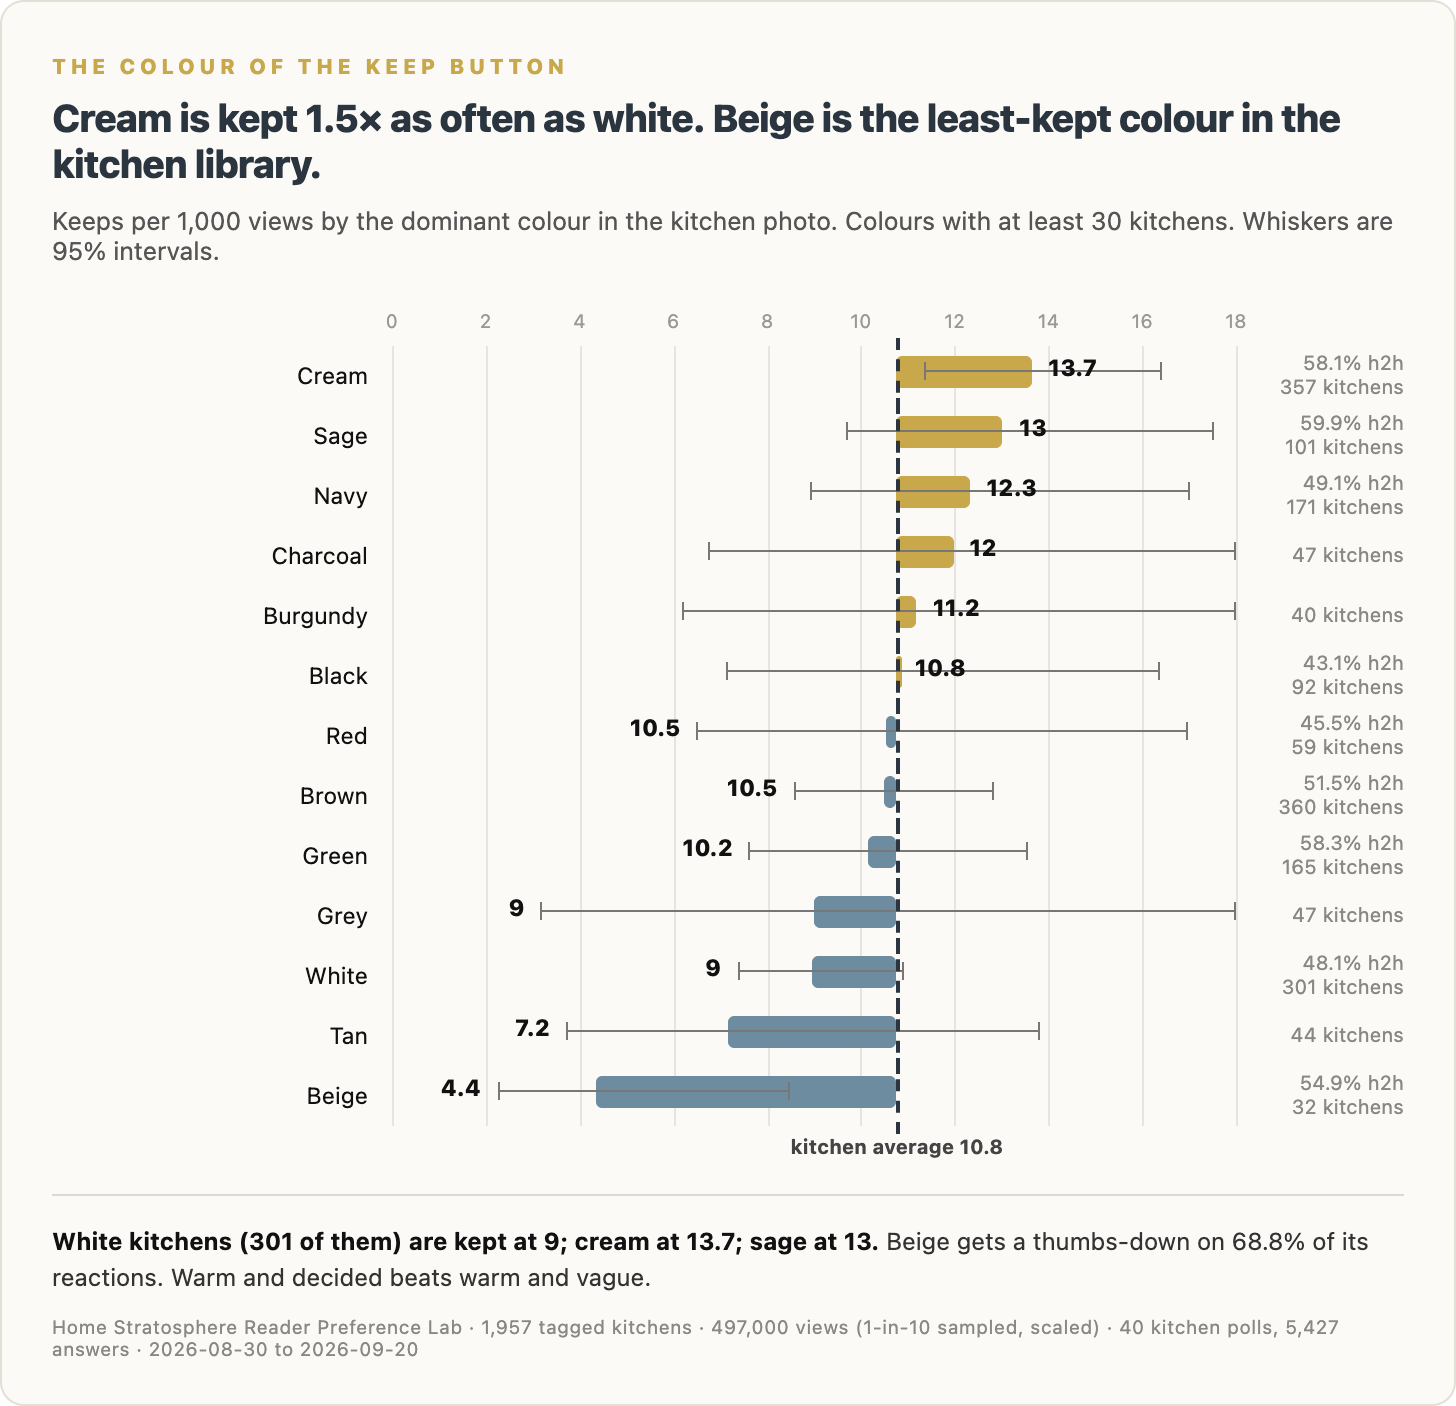
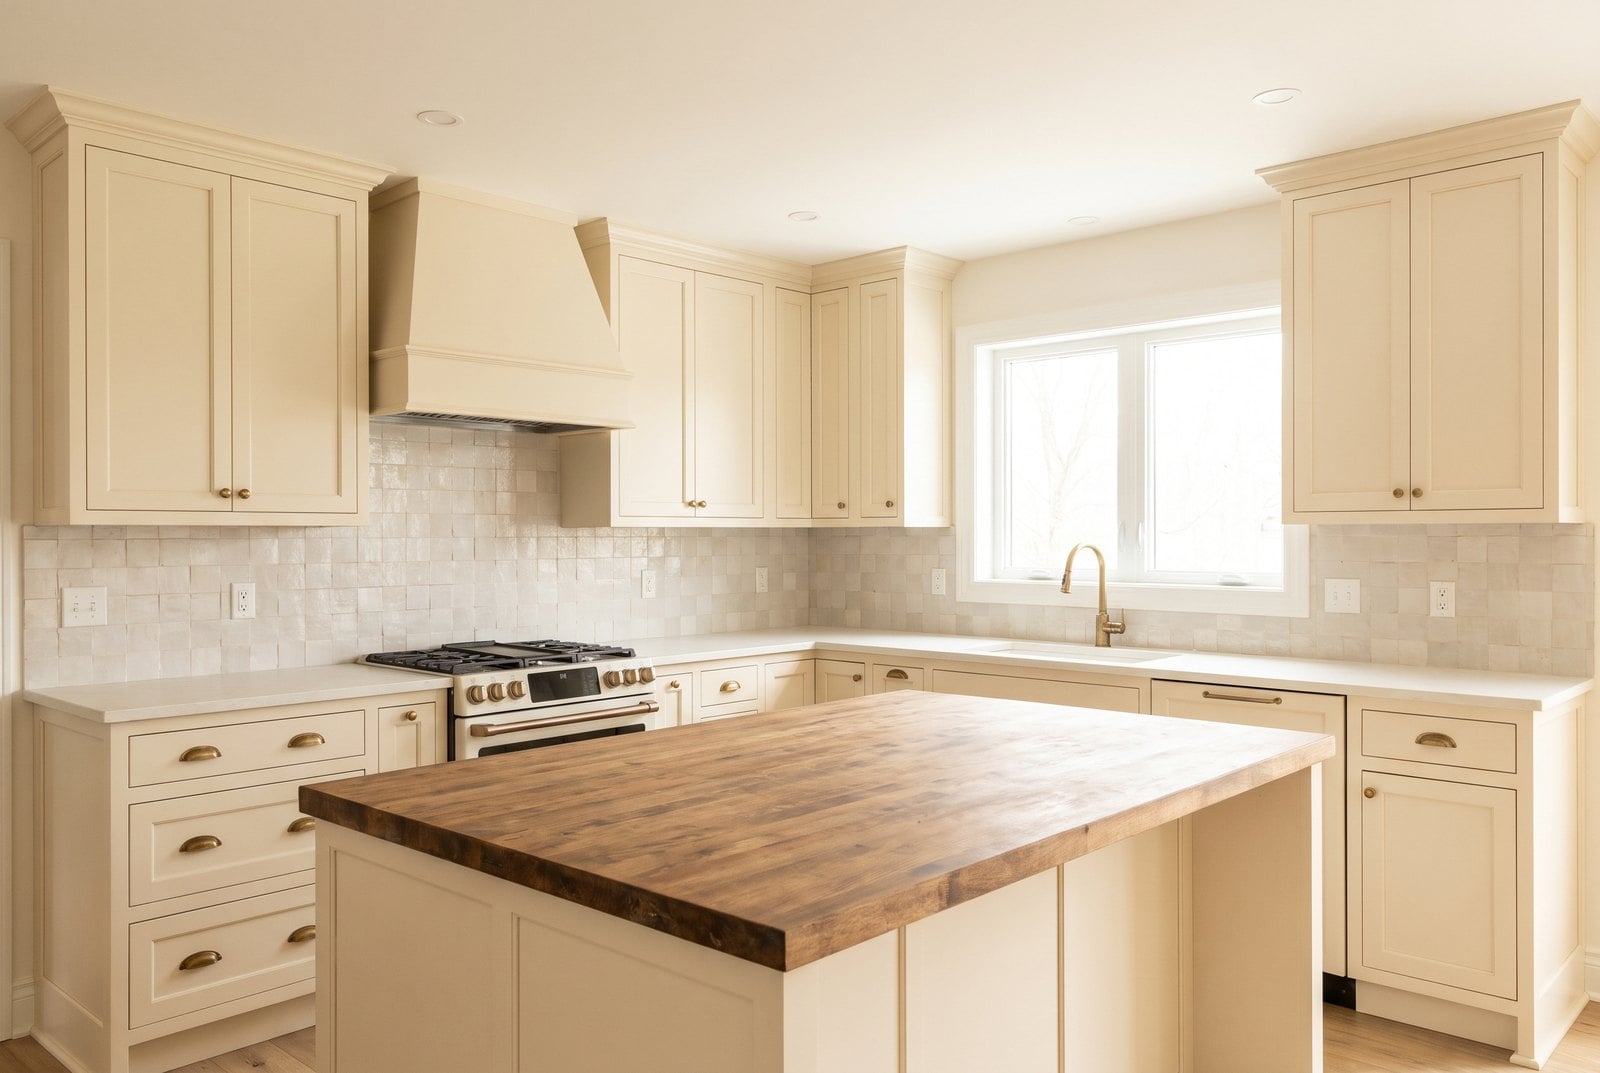
Cream kitchens are kept at 13.7 per 1,000 views.
Sage comes in at 13.0.
Navy at 12.3.
Charcoal at 12.0.
White lands at 9.0.
That’s below average, but hardly catastrophic.
Beige comes in at 4.4.
Dead last.
Tan isn’t much better at 7.2.
Grey also lands at 9.0.
This is one of those charts where the middle is worse than either extreme.
Readers will take cream.
They’ll take sage.
They’ll take navy.
They’ll even take charcoal.
What they don’t seem particularly interested in is a color that looks like somebody started making a decision and stopped halfway through.
That’s my read anyway.
Warm and decided beats warm and vague.
Cream knows what it is.
Beige is still thinking about it.
The Scoreboard Makes the Contradictions Obvious
At this point I wanted one chart that put everything together.
So I took ten trends and lined them up against three different tests:
SAY: what readers pick when asked directly.
VOTE: what wins when two kitchen photos are shown head-to-head.
KEEP: what people actually save or heart after seeing it on the site.
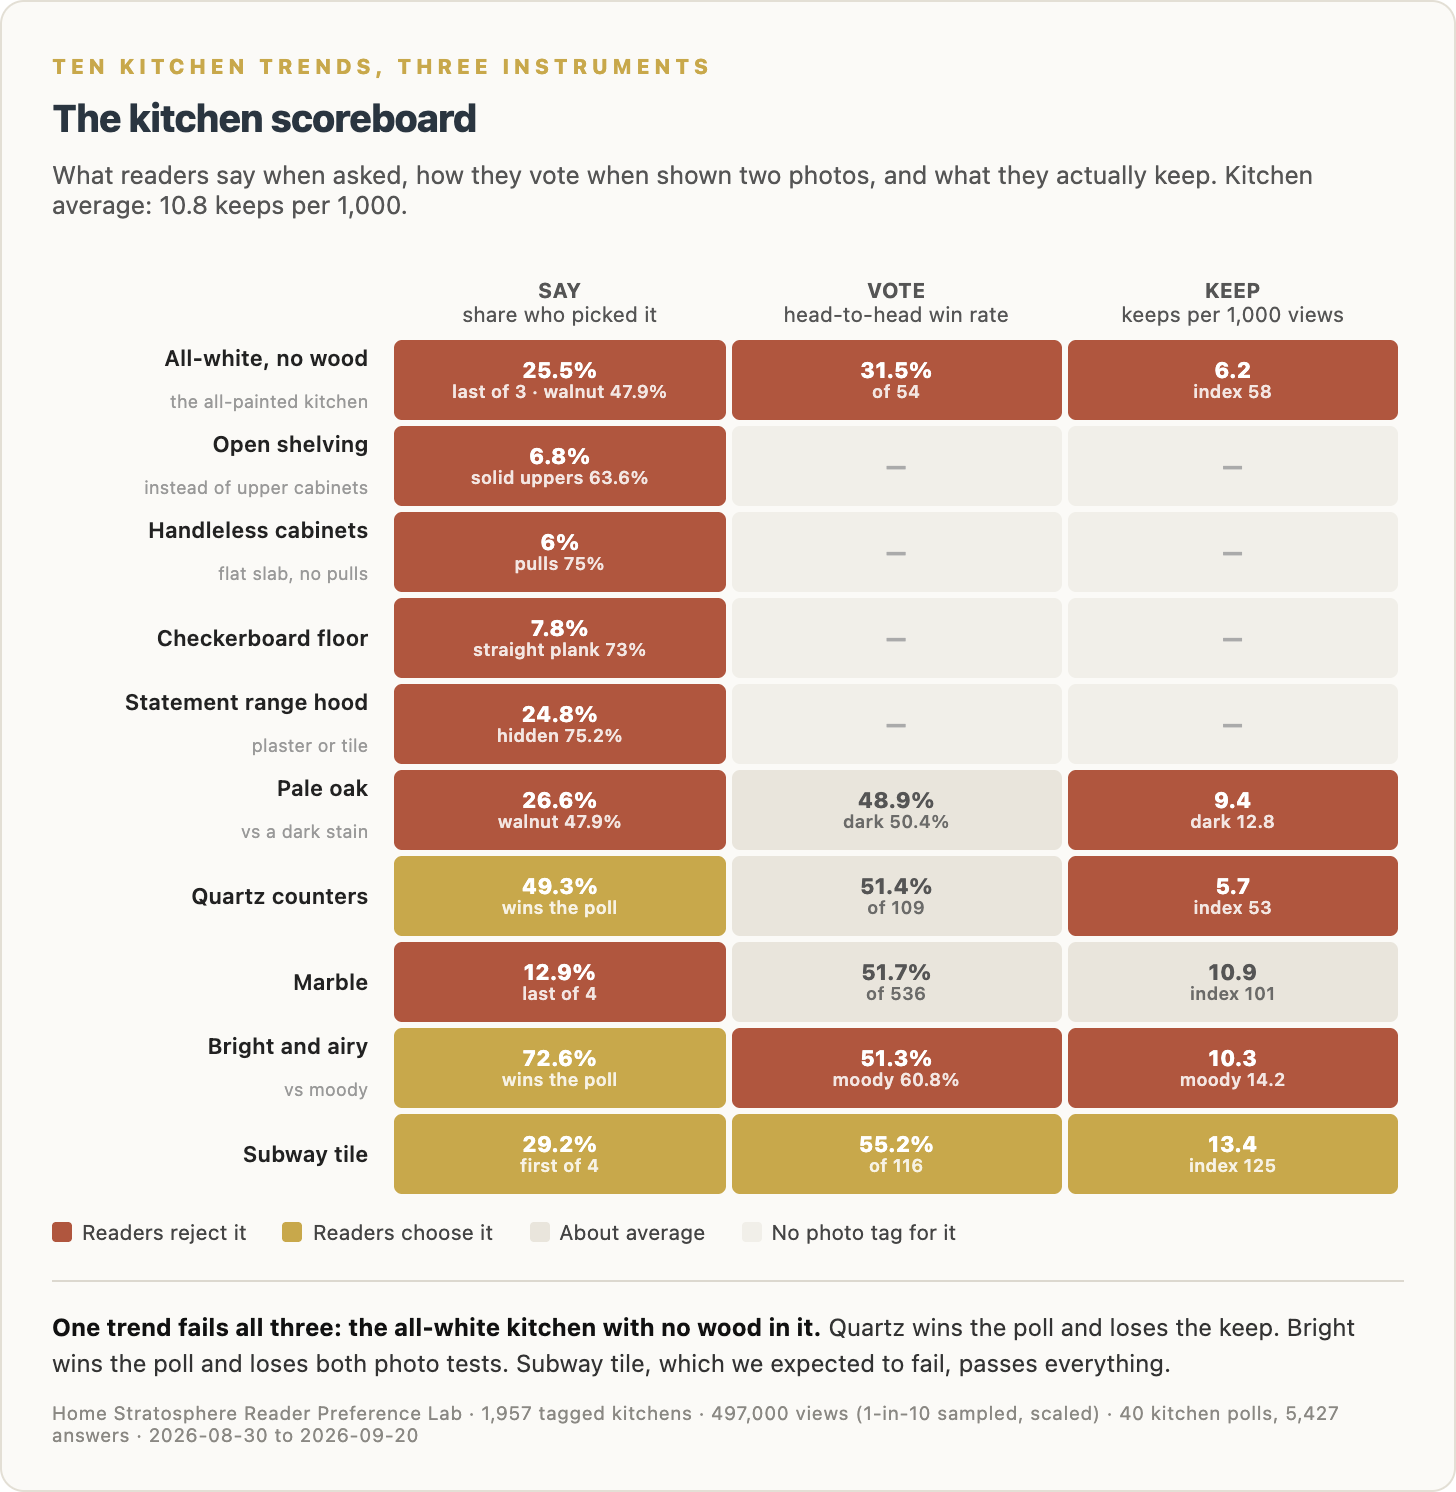
This is probably my favorite chart in the whole project because you can see immediately where stated preference and behavior split apart.
The all-white kitchen with no wood fails all three.
Readers don’t choose it.
They don’t vote for it.
They don’t keep it.
That one is pretty clear.
Quartz is more interesting.
It wins the poll.
It performs roughly average in head-to-heads.
Then it gets crushed on keeps.
Bright and airy does something similar.
Readers strongly say they want it.
Head-to-head performance is okay.
But moody kitchens beat it on keeps.
Marble goes the other way.
Readers don’t choose it when asked.
But it holds up fine when they actually see it.
And then there’s subway tile.
I fully expected subway tile to be toast.
It isn’t.
Readers pick it first in the backsplash poll.
It wins 55.2% of its head-to-head matchups.
Its keep rate is about 25% above average.
Apparently subway tile has been pronounced dead by everyone except the people looking at kitchens.
Kitchens With Character Beat Kitchens Made Entirely From Showroom Parts
The living-room version of this research turned up a pattern I thought might be unique to living rooms.
It isn’t.
The more a room contains features you can’t simply order from a furniture showroom, the better it tends to perform.
So I ran the same idea against kitchens.
I counted four characteristics:
A fireplace.
Built-ins.
A vaulted ceiling.
Stone.
Then I looked at how kitchens performed based on how many of those four were present.
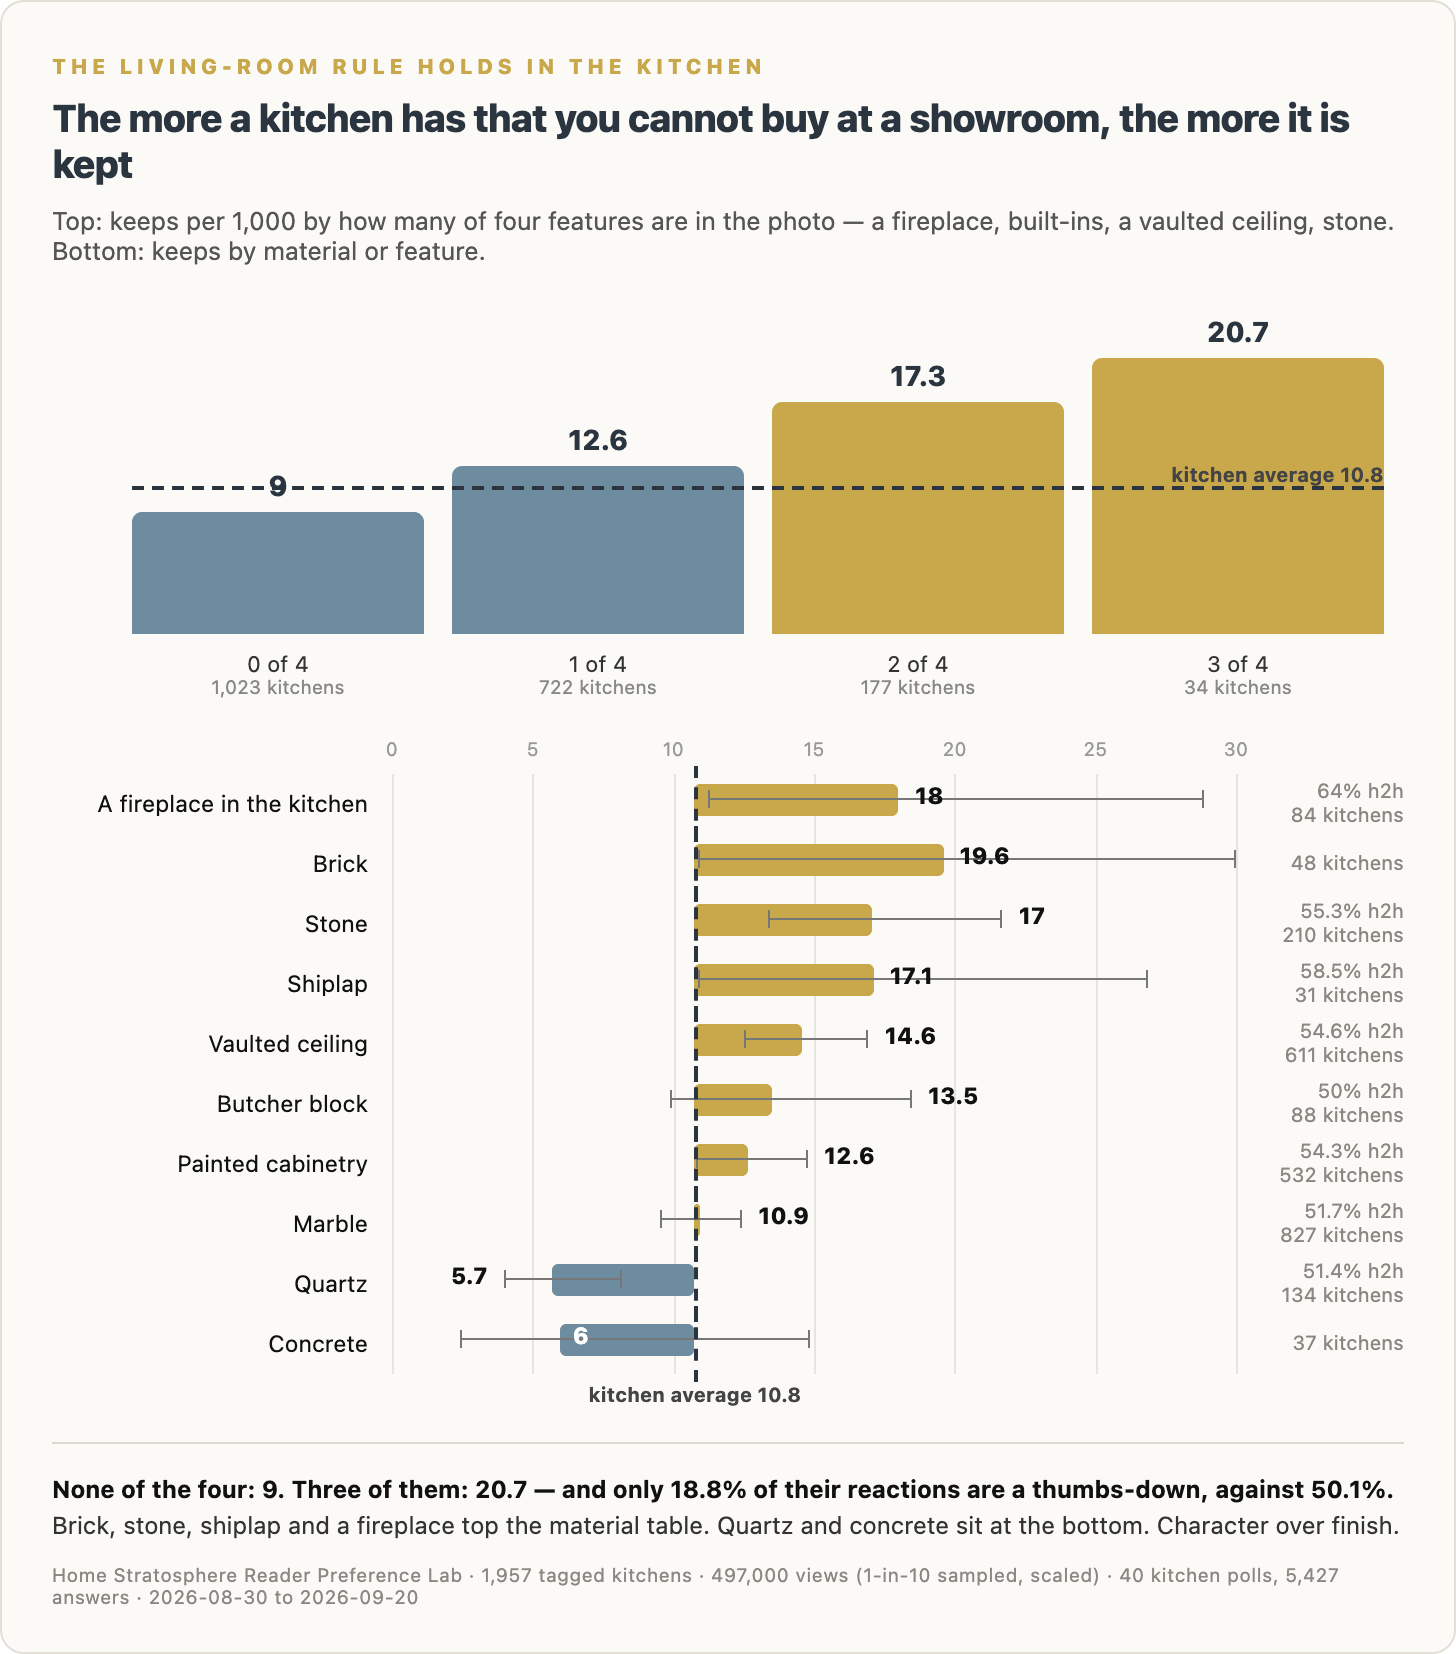
Kitchens with none of the four are kept at 9.0 per 1,000 views.
One feature: 12.6.
Two: 17.3.
Three: 20.7.
That’s a pretty tidy staircase.
And the kitchens with three of these features also get far fewer negative reactions.
The materials underneath tell a similar story.
Brick: 19.6 keeps per 1,000.
A fireplace in the kitchen: 18.0.
Shiplap: 17.1.
Stone: 17.0.
Vaulted ceiling: 14.6.
At the bottom?
Concrete: 6.0.
Quartz: 5.7.
There’s a pattern here that is difficult to miss.
The stuff people keep tends to have character.
Not necessarily more expensive finishes.
Character.
Stone that looks like stone.
Wood with grain.
Brick.
A ceiling that actually does something.
A fireplace.
Something architectural.
Something that wasn’t dropped off by a delivery truck last Thursday.
Minimalist Kitchens Perform Terribly
This is another result I did not expect to be this extreme.
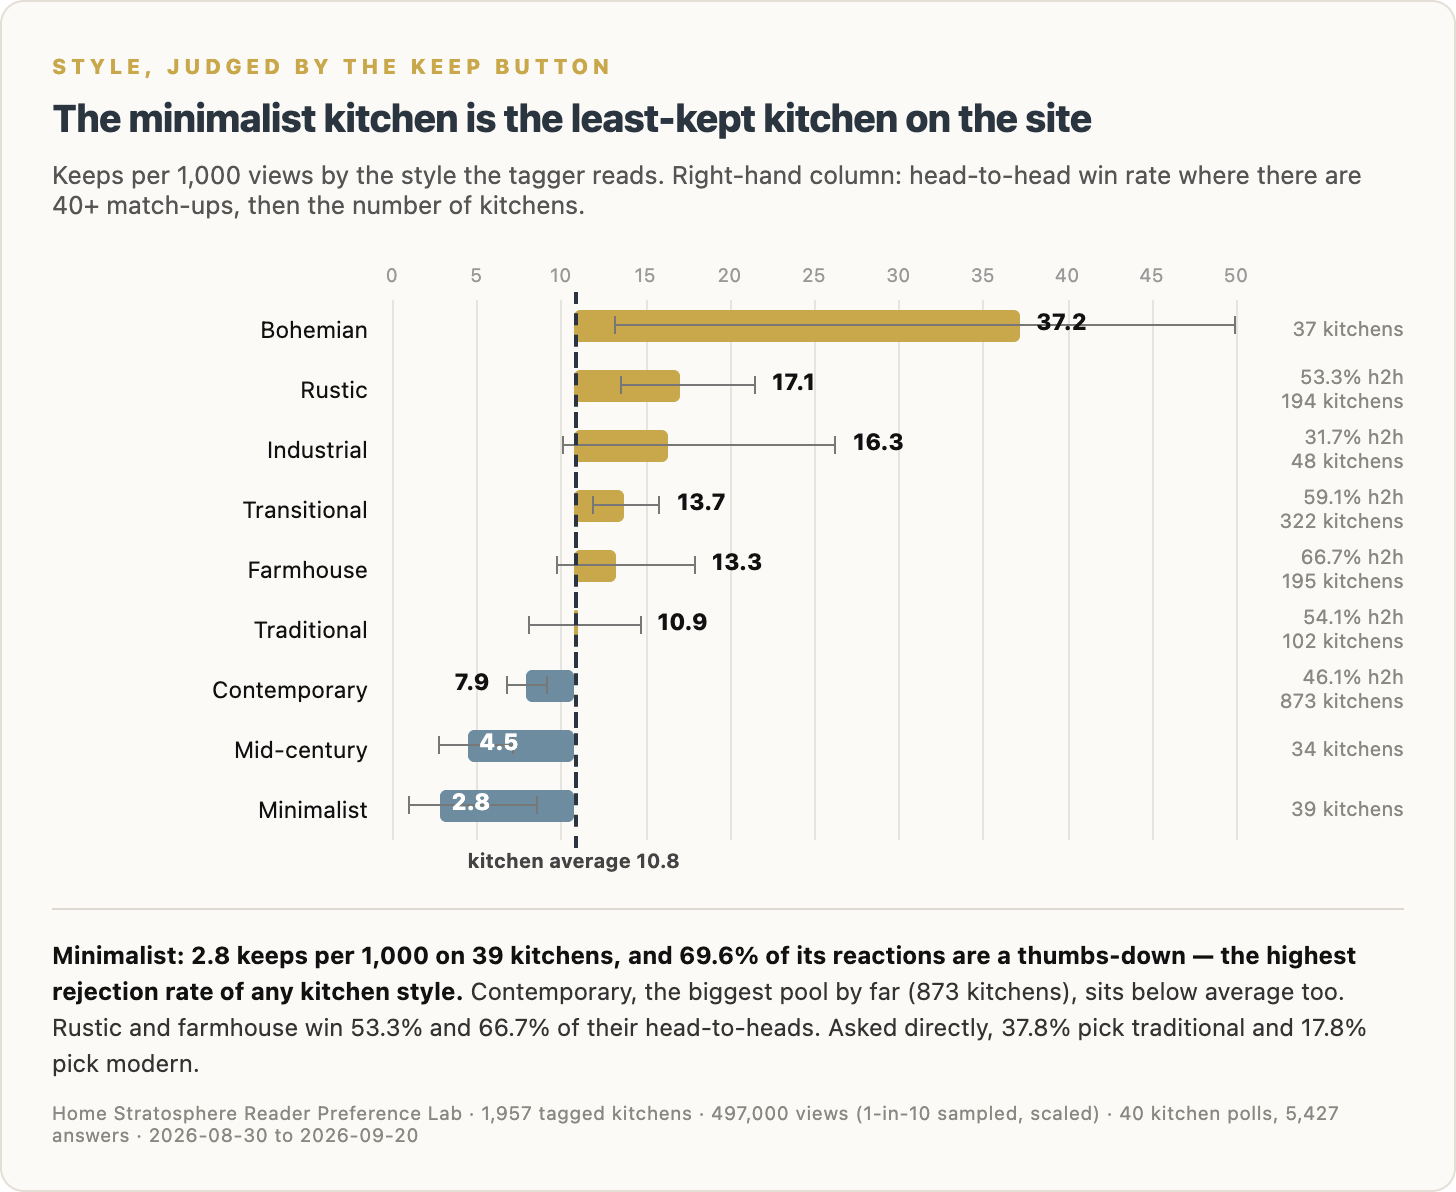
Minimalist kitchens are kept at 2.8 per 1,000 views.
That’s by far the lowest style on the chart.
And 69.6% of their reactions are thumbs-down, which is the highest rejection rate of any kitchen style in the dataset.
Mid-century is also low at 4.5.
Contemporary comes in at 7.9.
And that’s important because contemporary is not some tiny sample. It’s the largest style pool by far, with 873 kitchens.
At the other end:
Bohemian: 37.2, although it’s a small sample and I wouldn’t make too much of the exact number.
Rustic: 17.1.
Industrial: 16.3.
Transitional: 13.7.
Farmhouse: 13.3.
Traditional: 10.9.
Farmhouse also wins 66.7% of its head-to-head matchups.
Asked outright, readers choose traditional far more often than modern.
So on style, what people say and what they do mostly line up.
The stripped-down kitchen isn’t winning either way.
I’m not saying everyone wants a kitchen stuffed with stuff.
But there’s a difference between uncluttered and empty.
Readers seem to notice it.
Here’s What the Kept Kitchens Actually Look Like
Charts are useful.
Eventually I want to see the rooms.
🔥 Would you like to save this?
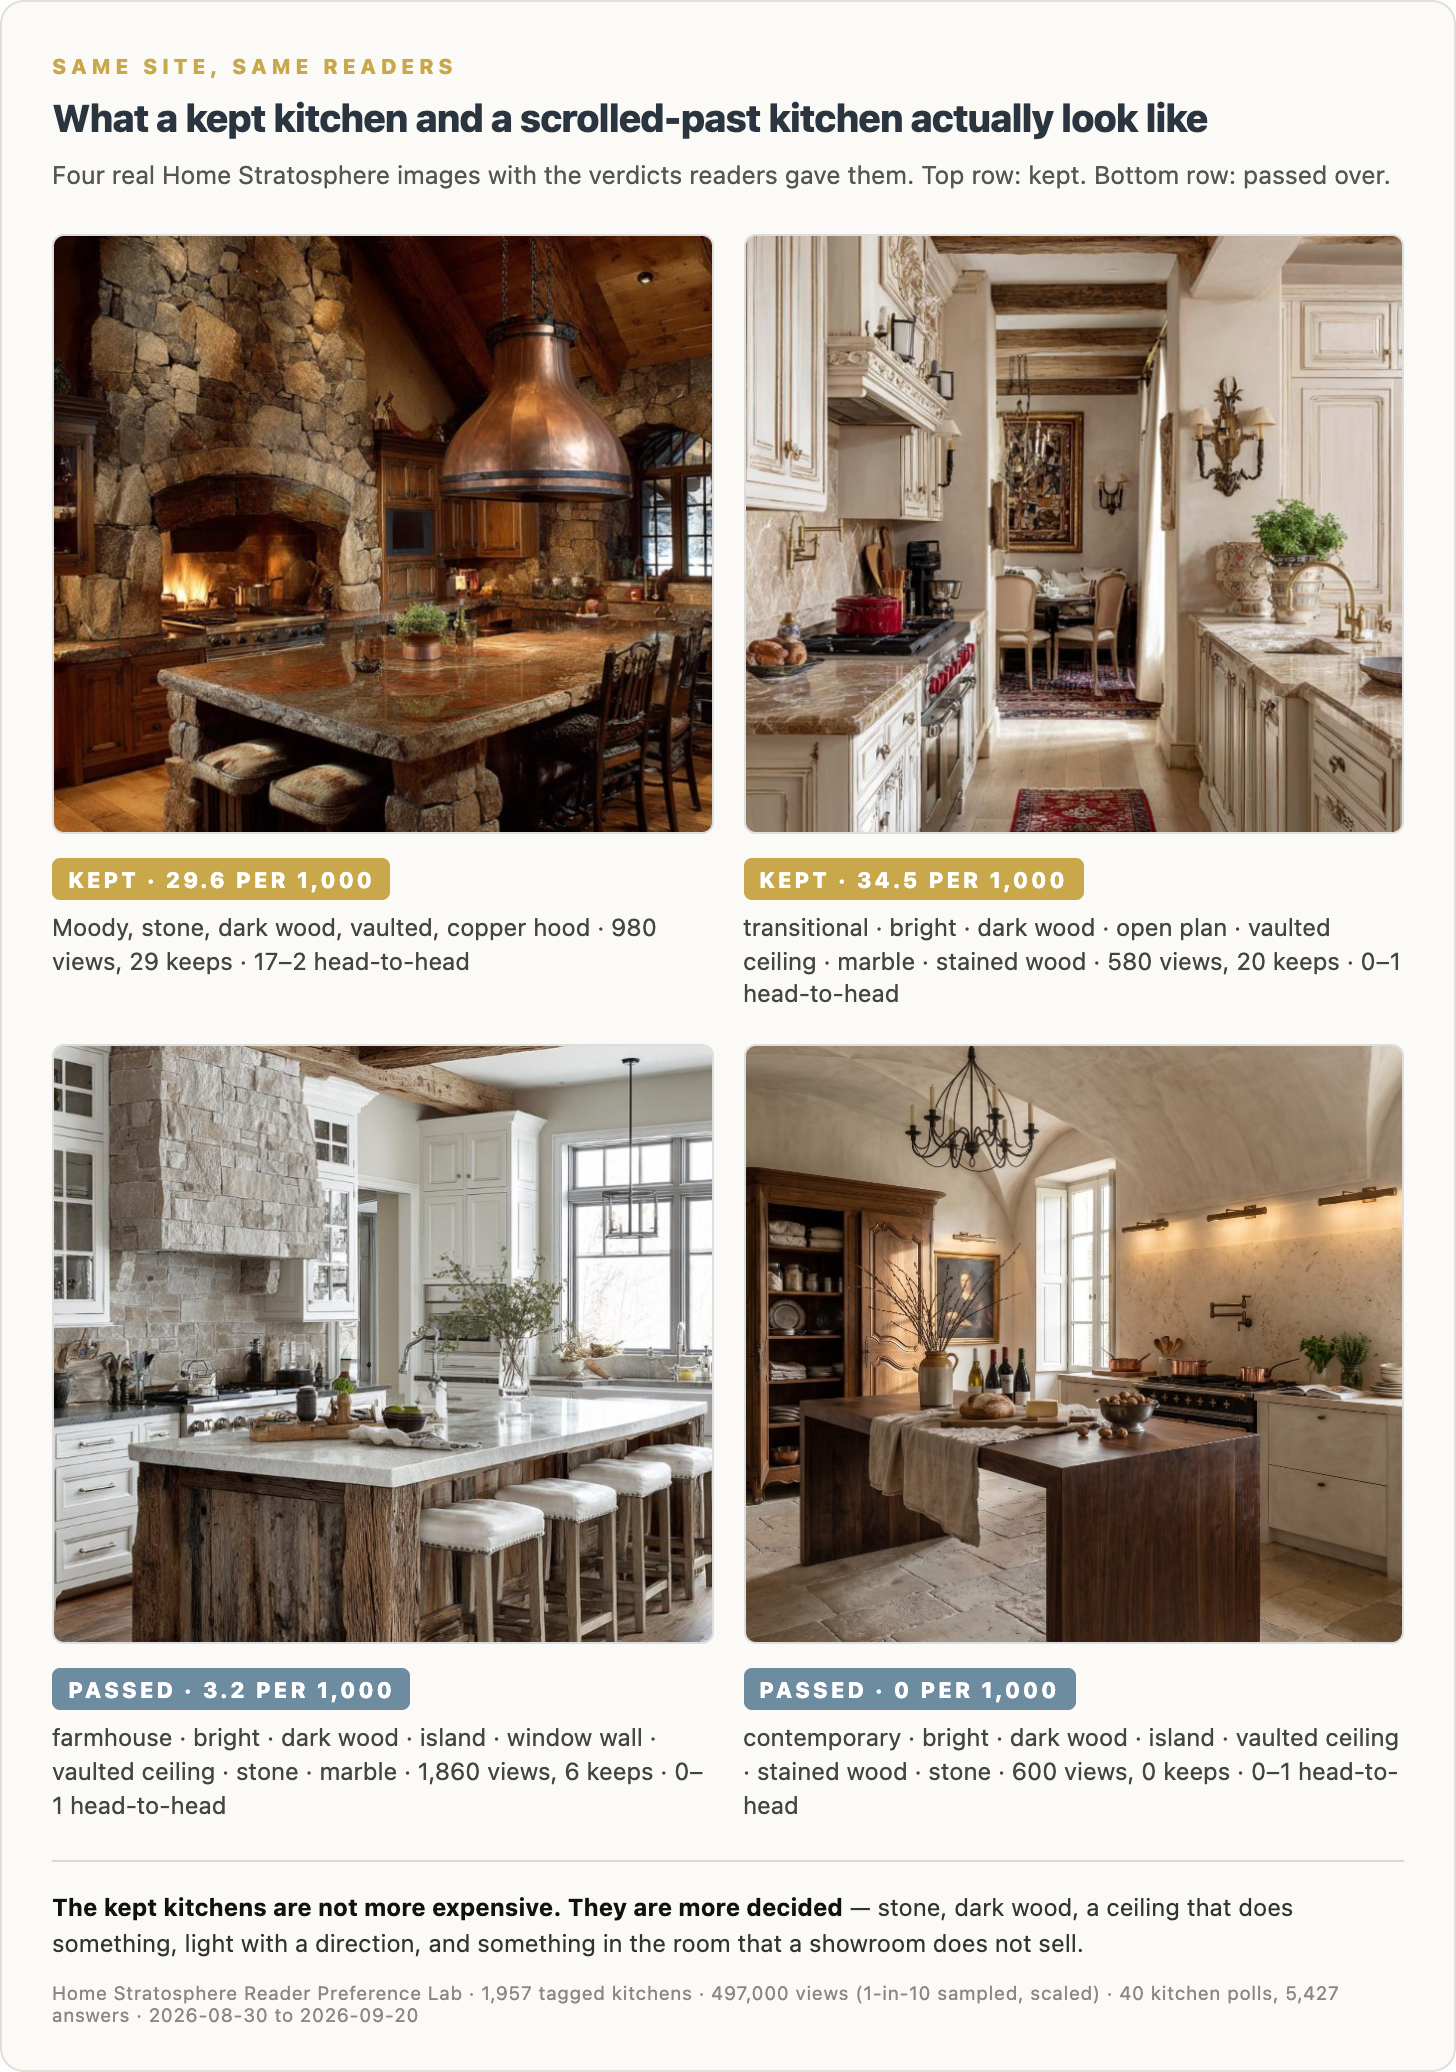
The top two kitchens in this image were kept at 29.6 and 34.5 per 1,000 views.
The bottom two came in at 3.2 and zero.
What jumps out at me is that the winning kitchens are not obviously more expensive.
The top-left kitchen is dramatic as hell, but a lot of that drama comes from what the room already has: stone, wood, vaulted ceiling, fireplace, copper hood.
The top-right kitchen has beams, dark wood, marble, architectural detail and enough going on that your eye has somewhere to land.
Then look at the bottom two.
They’re not ugly.
Far from it.
They’re polished.
Professionally styled.
Expensive-looking.
But they’re also easier to scroll past.
That’s the word I keep coming back to with the winners:
Decided.
The good kitchens make choices.
Dark wood.
Stone.
Cream.
Copper.
Brick.
A proper ceiling.
A fireplace.
A hood that belongs to the room.
They’re not trying to be everything to everyone.
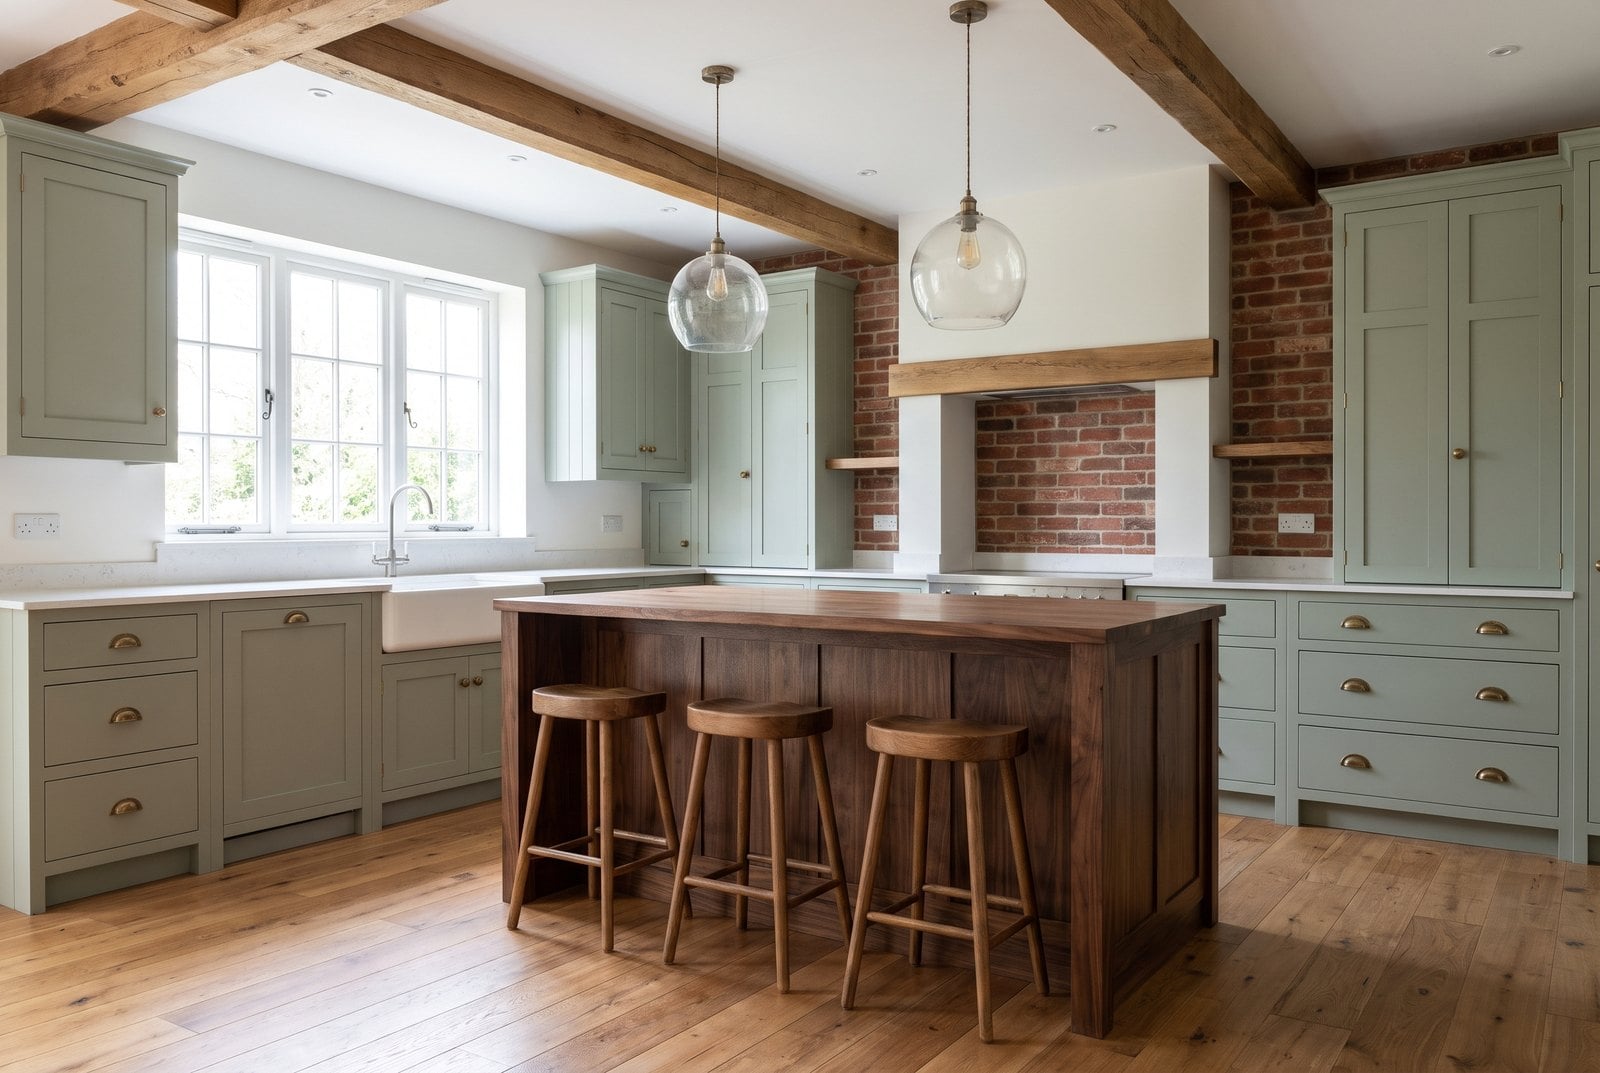
So What Would I Actually Do With This?
If I were planning a kitchen tomorrow, I’d start with the kitchen readers say they want because, frankly, it’s a very sensible spec.
Sage or cream Shaker cabinets.
Brass pulls.
Walnut or another medium-to-dark wood.
Hardwood floors.
A big window over the sink.
Island with seating.
Pendants.
Hidden hood.
Something close to timeless rather than trying to win Kitchen Trend of the Year 2026.
Then I’d use the behavioral data to make it more interesting.
I would not build a kitchen with no visible wood. That’s probably the strongest finding in the entire study because every instrument agrees.
I would lean cream over stark white if both work in the house. I wouldn’t be terrified of white, but I’d stay well away from vague beige-on-beige-on-tan.
I’d think twice about plain quartz. If quartz is the right material — and for many houses it probably is — I’d at least choose something with some movement, veining and personality.
I’d also try very hard to give the room one thing you cannot simply select from a cabinet catalog.
Brick.
Stone.
Beams.
A fireplace.
A great ceiling.
A substantial wood hood.
Something.
Anything that gives the kitchen a reason to exist beyond “these were the finishes available in Package B.”
And I wouldn’t lose much sleep over whether open shelving, handleless cabinetry or checkerboard floors are supposedly hot.
Readers have already voted on those.
The Bigger Takeaway
The most interesting thing here isn’t that one countertop beats another.
It’s that readers seem to make two different kinds of decisions.
When you ask what they’d buy, practicality matters.
Quartz wins.
Bright and airy wins.
Timeless wins.
When you show them photographs and watch what they keep, character matters more.
Moody kitchens do better.
Stone does better.
Brick does better.
Dark wood does better.
Architectural features do better.
Minimalism gets killed.
Those two things are not contradictory.
Most people probably want a kitchen that works extremely well Monday morning at 7:15 when they’re making coffee and somebody can’t find a lunch container.
But they’re inspired by kitchens that give them something to look at.
The sweet spot is probably somewhere in the middle:
Build the practical kitchen. Give it character.
That’s what I’d take from all of this.
Thanks for reading.
Jon
Homestratosphere
This report first appeared in Home Stratosphere on Substack, where Pro members get the full PDF report and the raw data behind it.
Here’s what you get when you upgrade to Pro (which you can do below)
The free post gives you the highlights.
Pro gives you the full 40-page report, the complete evidence behind the findings and the raw data so you can dig into it yourself.
- Every answer from all 40 kitchen polls. Not just the winners. See exactly how readers voted on cabinets, countertops, backsplashes, flooring, lighting, islands, hardware, layouts, colors and more.
- The complete Kitchen Keep Index. See how every kitchen attribute performs based on views, saves, hearts, thumbs-downs, keep rates, confidence intervals and head-to-head results.
- The full most-kept and least-kept rankings. Find out which styles, colors, materials, moods, layouts and wood tones readers actually save — and which ones they consistently pass over.
- The full “say vs. do” analysis. We matched what readers say they want against what they choose head-to-head and what they actually keep. This is where some of the most interesting findings show up.
- The trends readers rejected. See how open shelving, handleless cabinets, checkerboard floors, statement hoods, pale oak and other heavily promoted kitchen trends performed when readers were actually asked to choose.
- The actual kitchens behind the numbers. See examples of kitchens readers kept at unusually high rates, kitchens they mostly ignored and the design attributes attached to each one.
- Four raw datasets. You get the Keep Index, every poll response, the say-vote-keep comparisons and image-level kitchen data. Sort it. Filter it. Build your own charts. Go looking for findings we missed.
The free post tells you what we found. Pro gives you everything behind it.
PLUS: Use the research in your own business
This is not just a report you read and forget about.
Your Pro subscription includes permission to use the research and data in your own marketing and business materials.
That means you can:
- Turn the findings into client presentations
- Use individual statistics in sales and marketing materials
- Create your own branded reports
- Publish data-backed blog posts and newsletters
- Turn the findings into Instagram posts, reels, carousels and videos
- Share the research with prospects to demonstrate expertise
- Use the data in product research and planning
- Build your own charts and analysis from the raw CSV files
If you’re an interior designer, builder, remodeler, realtor, home brand, ecommerce company, agency or publisher, you’re not just buying access to the research.
You’re buying the right to put it to work.
Get the Full Report on Substack →