Would you like to save this?
Nebraska’s real estate landscape is evolving, with certain towns experiencing significant surges in home values. While the state is often associated with its vast plains and small-town charm, recent data from the Zillow Home Value Index reveals that some communities are commanding premium prices.
This list highlights the 25 most expensive towns in Nebraska as of June 2025, showcasing areas where home prices have climbed substantially over the past 15 years. From suburbs near Omaha and Lincoln to unexpected rural locales, these towns represent the pinnacle of Nebraska’s housing market. Whether you’re a prospective buyer, investor, or simply curious about the state’s real estate trends, this compilation offers insight into where property values are at their peak.
25. Elwood – 161% Home Price Increase Since June 2011
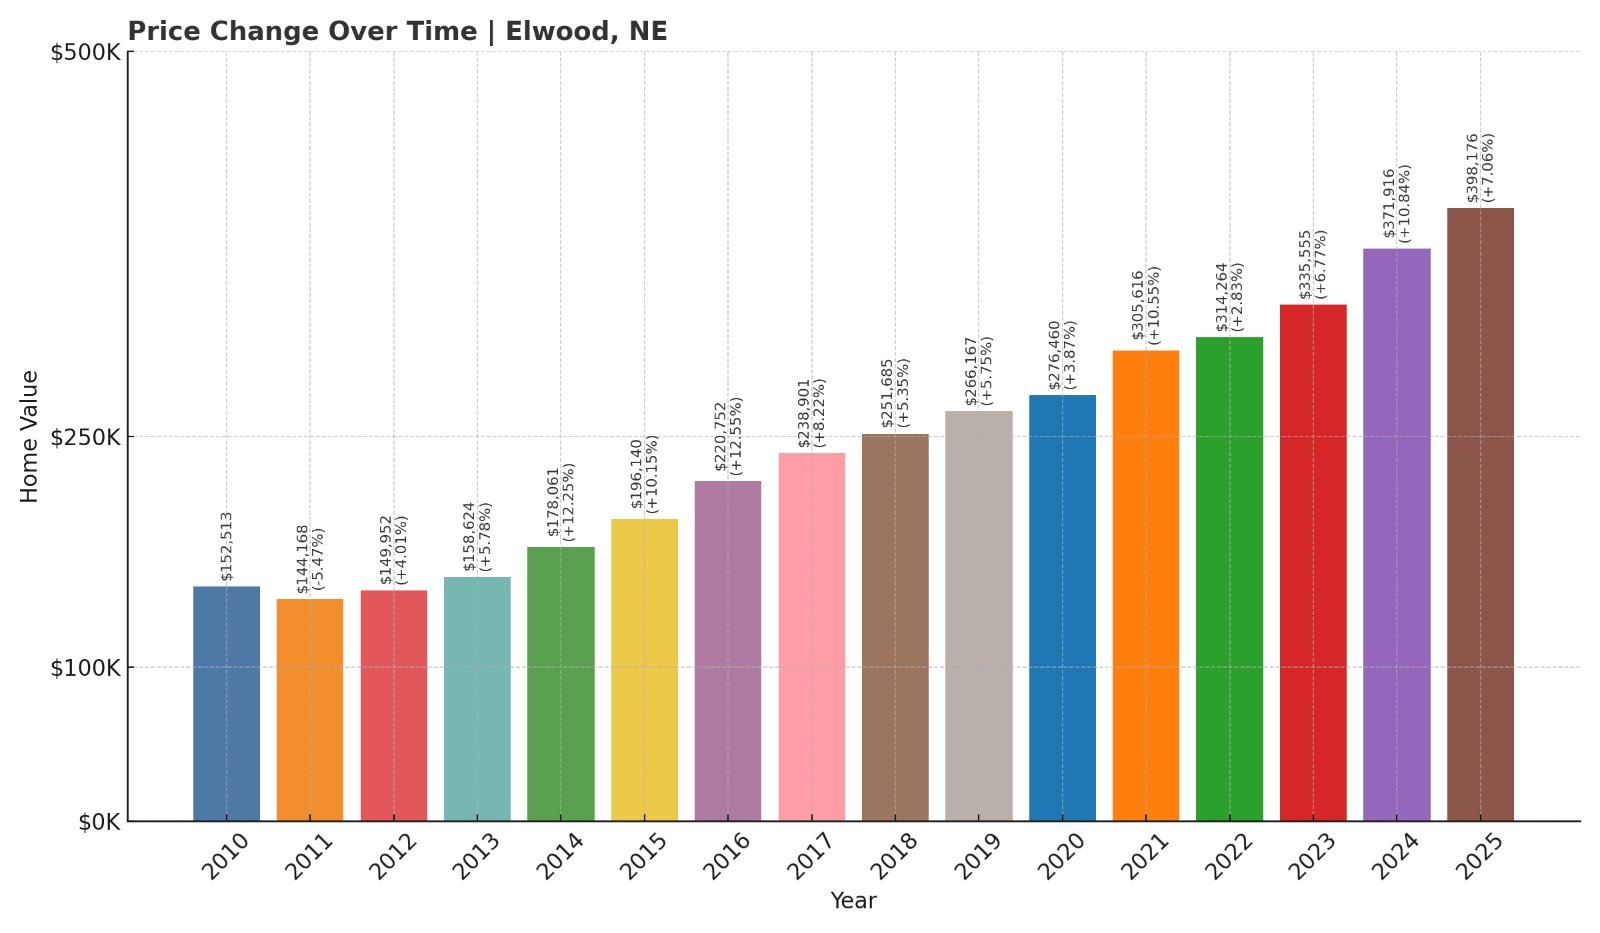
- 2010: $152,513
- 2011: $144,168 ($-8,344, -5.47% from previous year)
- 2012: $149,952 (+$5,784, +4.01% from previous year)
- 2013: $158,624 (+$8,671, +5.78% from previous year)
- 2014: $178,061 (+$19,437, +12.25% from previous year)
- 2015: $196,140 (+$18,079, +10.15% from previous year)
- 2016: $220,752 (+$24,612, +12.55% from previous year)
- 2017: $238,901 (+$18,149, +8.22% from previous year)
- 2018: $251,685 (+$12,785, +5.35% from previous year)
- 2019: $266,167 (+$14,482, +5.75% from previous year)
- 2020: $276,460 (+$10,293, +3.87% from previous year)
- 2021: $305,616 (+$29,156, +10.55% from previous year)
- 2022: $314,264 (+$8,648, +2.83% from previous year)
- 2023: $335,555 (+$21,291, +6.77% from previous year)
- 2024: $371,916 (+$36,361, +10.84% from previous year)
- 2025: $398,176 (+$26,260, +7.06% from previous year)
Elwood’s home prices have risen from $144,168 in 2011 to $398,176 in 2025—an impressive 161% jump over 14 years. The town saw particularly strong growth between 2014 and 2016, with annual increases of over 10%. The past few years have brought additional momentum, especially in 2024 when prices spiked by more than $36,000.
Elwood – Steady Growth in a Rural Setting
Located in Gosper County in south-central Nebraska, Elwood is a small town that has quietly climbed the ranks in housing value. While it lacks the bustle of larger metros, its peaceful setting, low population density, and proximity to Johnson Lake and other recreational spots make it attractive to buyers looking for space and simplicity.
The town’s consistent investment in infrastructure and access to public schools via the Elwood Public Schools district have contributed to its steady home value growth. With more interest in rural living over the past decade, Elwood has seen prices move up without the sharp volatility seen in larger housing markets.
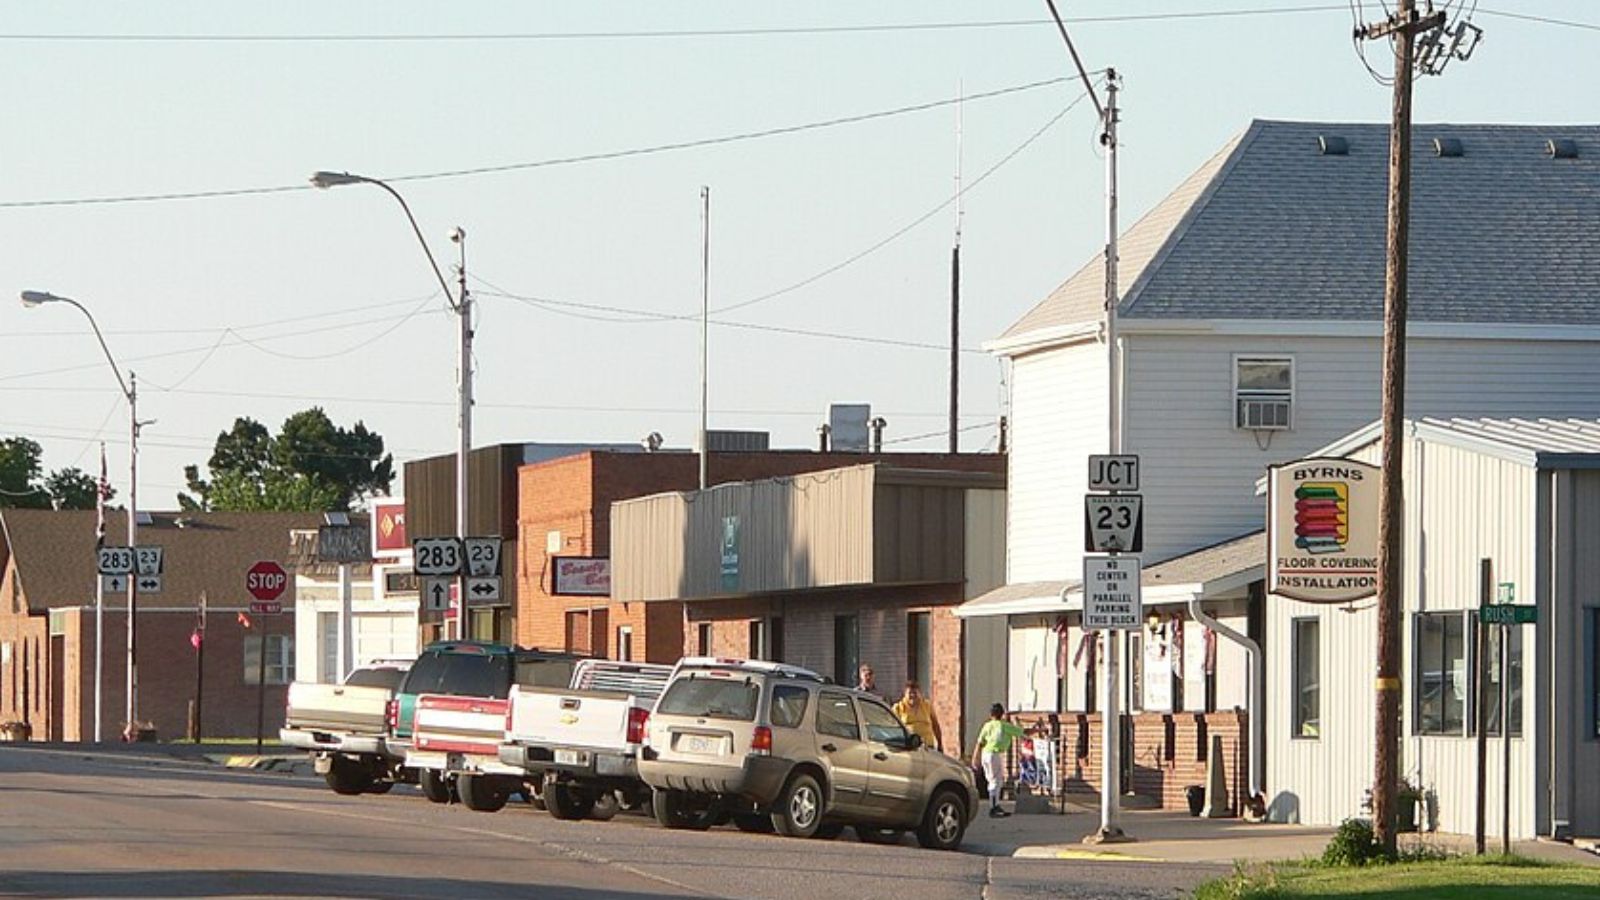
24. Bennet – 109% Home Price Increase Since June 2012
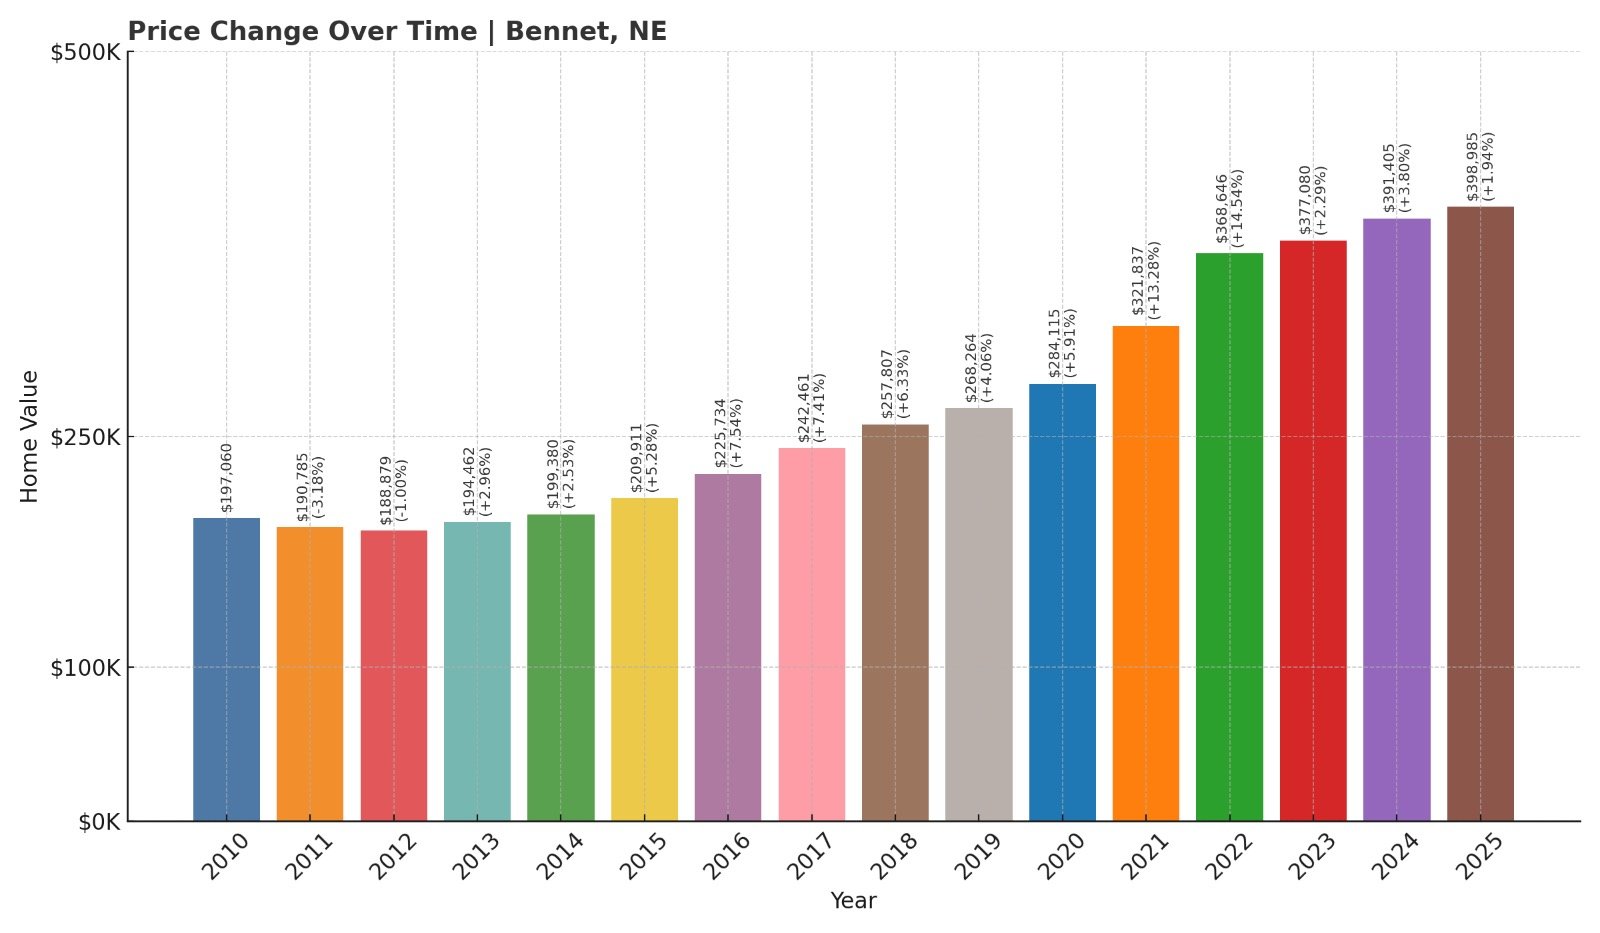
- 2010: $197,060
- 2011: $190,785 ($-6,275, -3.18% from previous year)
- 2012: $188,879 ($-1,907, -1.00% from previous year)
- 2013: $194,462 (+$5,584, +2.96% from previous year)
- 2014: $199,380 (+$4,918, +2.53% from previous year)
- 2015: $209,911 (+$10,530, +5.28% from previous year)
- 2016: $225,734 (+$15,824, +7.54% from previous year)
- 2017: $242,461 (+$16,726, +7.41% from previous year)
- 2018: $257,807 (+$15,346, +6.33% from previous year)
- 2019: $268,264 (+$10,457, +4.06% from previous year)
- 2020: $284,115 (+$15,851, +5.91% from previous year)
- 2021: $321,837 (+$37,722, +13.28% from previous year)
- 2022: $368,646 (+$46,809, +14.54% from previous year)
- 2023: $377,080 (+$8,434, +2.29% from previous year)
- 2024: $391,405 (+$14,325, +3.80% from previous year)
- 2025: $398,985 (+$7,580, +1.94% from previous year)
After dipping slightly in 2012, Bennet’s home prices have more than doubled—rising 109% to reach $398,985 in 2025. The surge was strongest between 2020 and 2022, with prices jumping nearly $85,000 over just two years. While growth has slowed recently, Bennet’s upward trend remains intact.
Bennet – Growth Fueled by Lincoln Suburban Appeal
Bennet is situated southeast of Lincoln, giving it the dual appeal of rural space and metro access. The town benefits from its position along Highway 2, which provides a direct route into the state capital. As Lincoln’s footprint expanded, Bennet emerged as a desirable alternative for commuters looking for more affordable yet upscale housing.
The combination of rising demand, limited housing inventory, and improvements in local services—including Palmyra District OR-1 schools—has helped push home values higher. While Bennet remains small, its proximity to job centers continues to draw buyers willing to pay a premium for its balance of quiet and convenience.
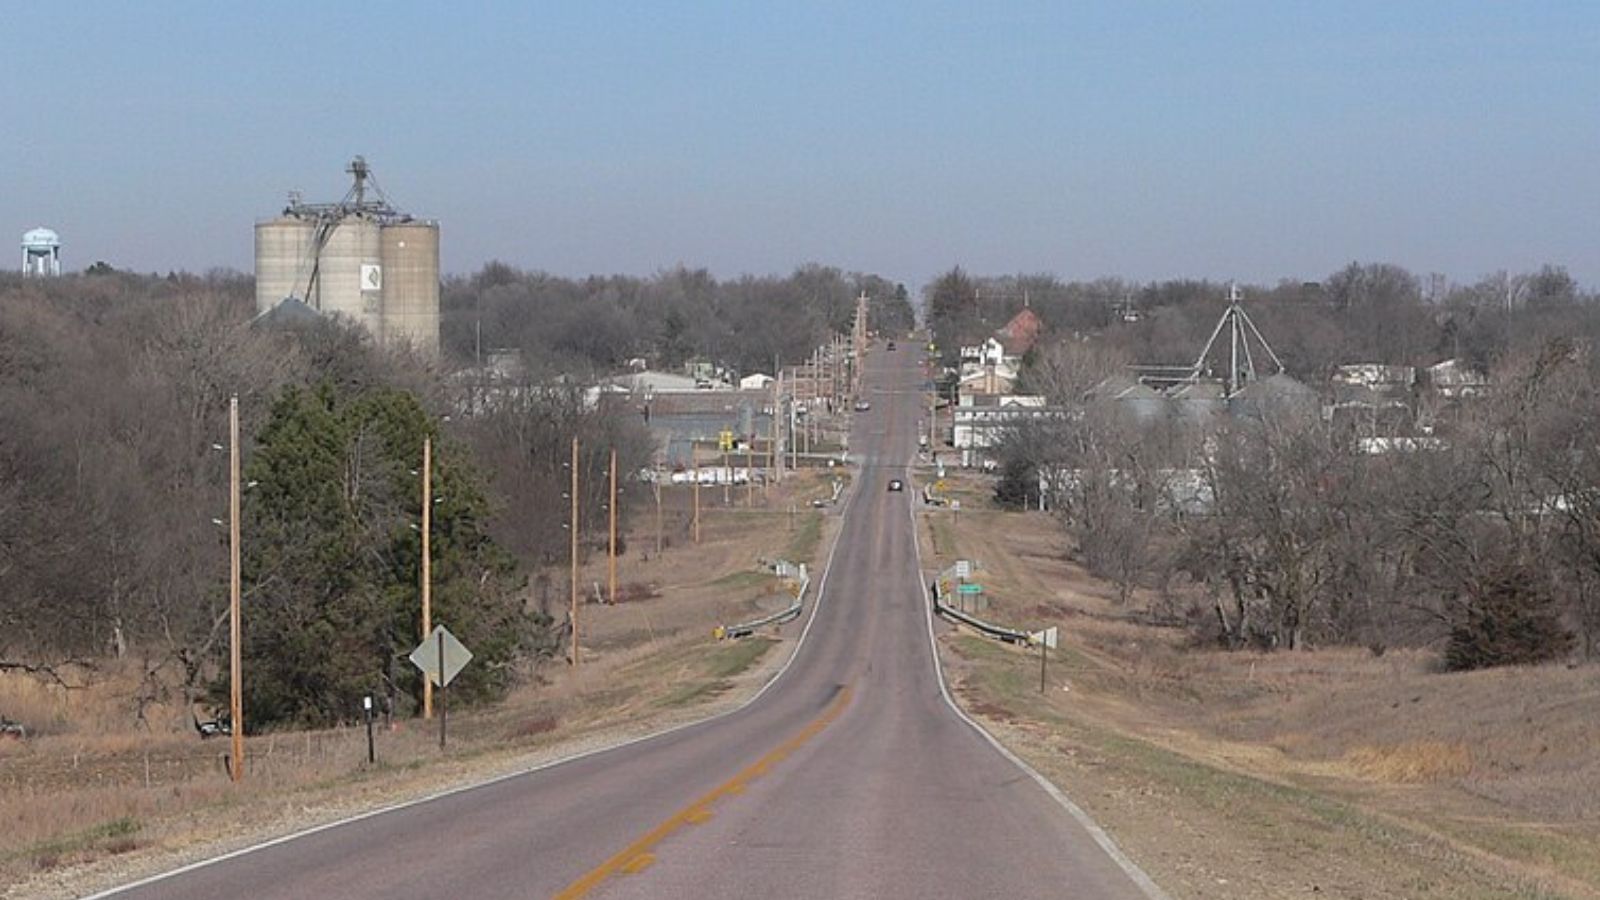
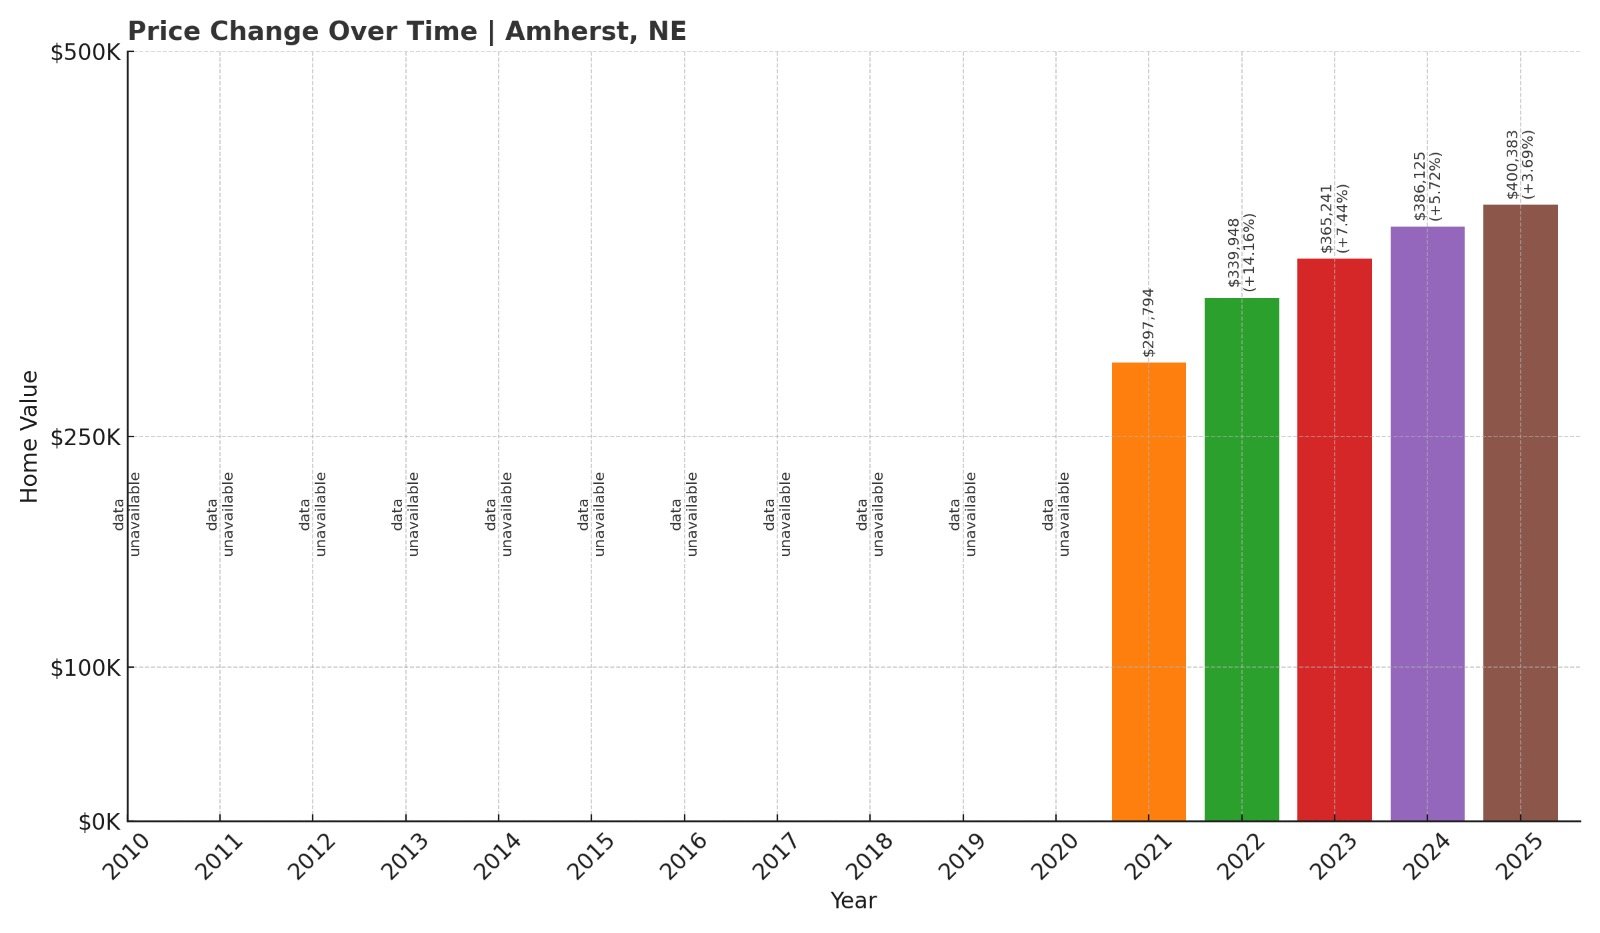
23. Amherst – 34% Home Price Increase Since June 2021
- 2010: N/A
- 2011: N/A
- 2012: N/A
- 2013: N/A
- 2014: N/A
- 2015: N/A
- 2016: N/A
- 2017: N/A
- 2018: N/A
- 2019: N/A
- 2020: N/A
- 2021: $297,794 (N/A from previous year)
- 2022: $339,948 (+$42,154, +14.16% from previous year)
- 2023: $365,241 (+$25,292, +7.44% from previous year)
- 2024: $386,125 (+$20,884, +5.72% from previous year)
- 2025: $400,383 (+$14,258, +3.69% from previous year)
Although data for Amherst only begins in 2021, the town’s prices have grown steadily—up 34% over four years. Each year since 2021 has posted solid gains, with the largest increase coming in 2022 when home values jumped by over $42,000.
Amherst – Small-Town Stability With Steady Price Gains
Would you like to save this?
Amherst, located in Buffalo County, sits about 15 miles northwest of Kearney. This quiet village has gained attention in recent years as buyers look beyond city limits for more land and less congestion. The area’s steady appreciation reflects both new construction and growing demand for rural homes within commuting distance of larger employment hubs.
While Amherst remains one of the smallest towns on this list, its housing market has shown a pattern of reliable growth—making it an increasingly attractive option for families and retirees alike. Local amenities are minimal, but the appeal lies in its wide-open spaces and community-driven lifestyle.
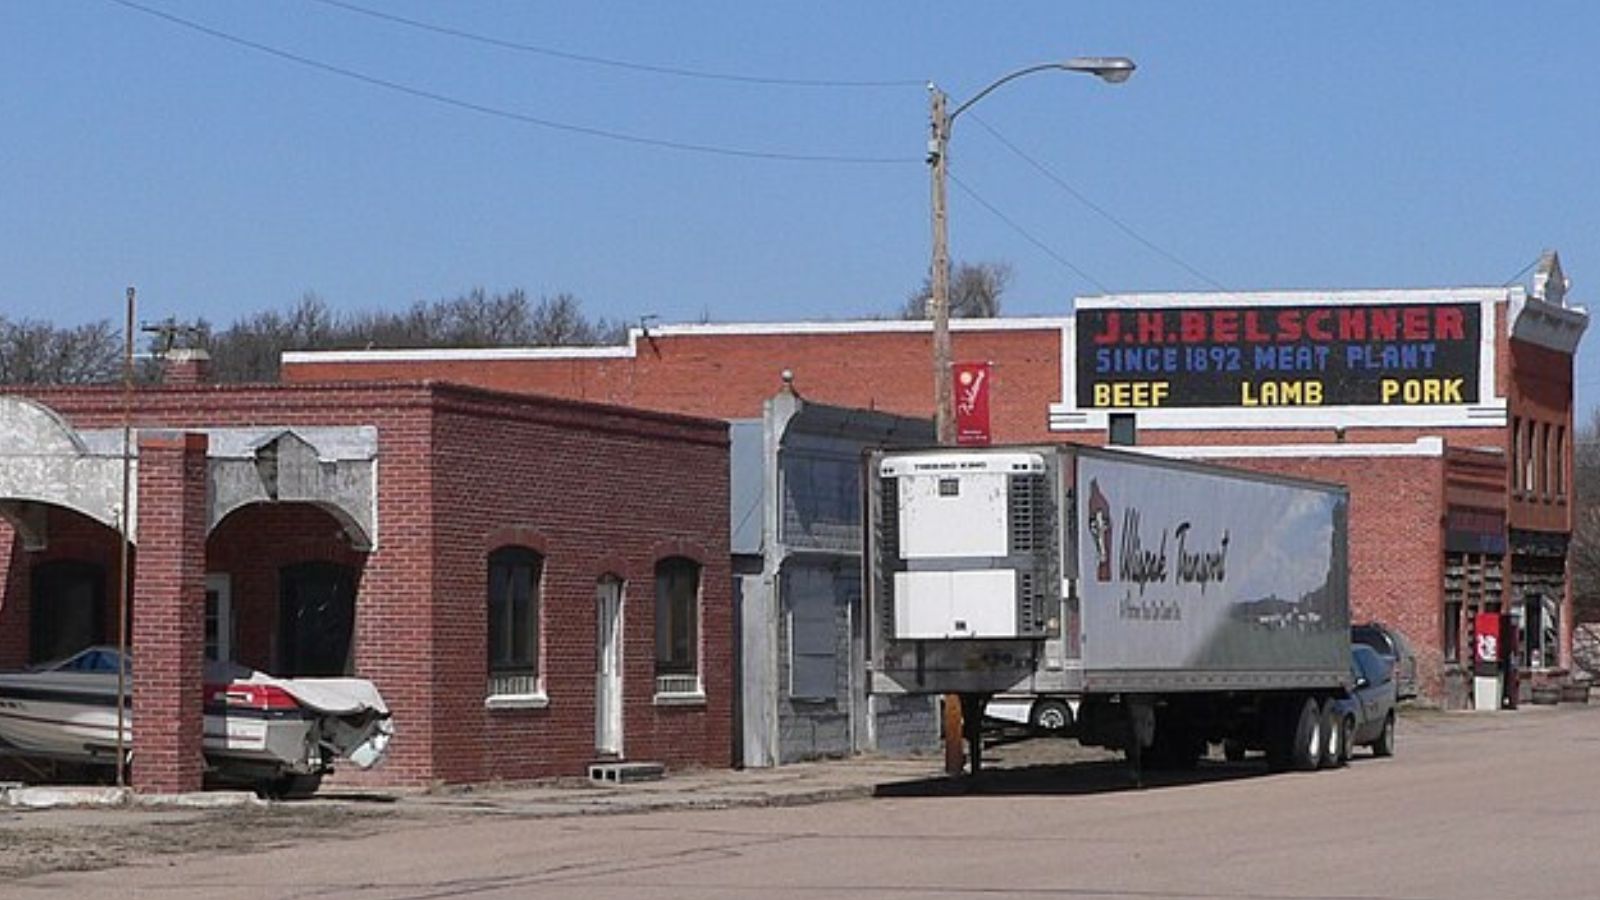
22. Hallam – 107% Home Price Increase Since June 2012
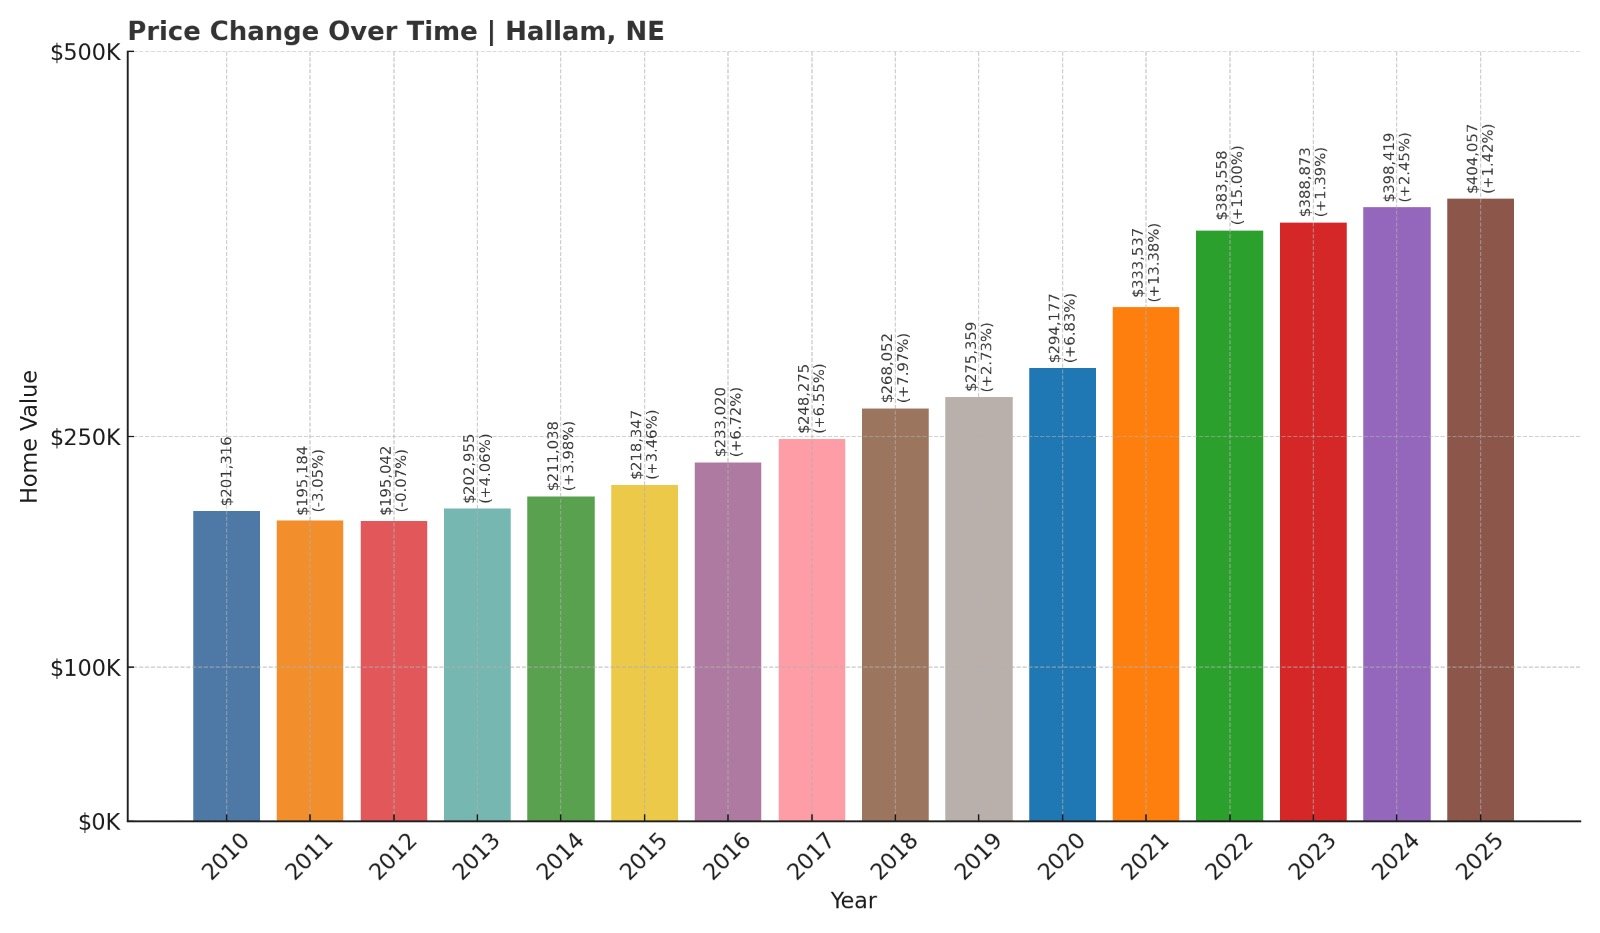
- 2010: $201,316
- 2011: $195,184 ($-6,132, -3.05% from previous year)
- 2012: $195,042 ($-142, -0.07% from previous year)
- 2013: $202,955 (+$7,913, +4.06% from previous year)
- 2014: $211,038 (+$8,083, +3.98% from previous year)
- 2015: $218,347 (+$7,309, +3.46% from previous year)
- 2016: $233,020 (+$14,673, +6.72% from previous year)
- 2017: $248,275 (+$15,255, +6.55% from previous year)
- 2018: $268,052 (+$19,776, +7.97% from previous year)
- 2019: $275,359 (+$7,307, +2.73% from previous year)
- 2020: $294,177 (+$18,818, +6.83% from previous year)
- 2021: $333,537 (+$39,360, +13.38% from previous year)
- 2022: $383,558 (+$50,022, +15.00% from previous year)
- 2023: $388,873 (+$5,315, +1.39% from previous year)
- 2024: $398,419 (+$9,546, +2.45% from previous year)
- 2025: $404,057 (+$5,639, +1.42% from previous year)
Hallam’s home values have grown from $195,042 in 2012 to $404,057 in 2025—an increase of 107%. After steady gains through the 2010s, growth accelerated sharply in 2021 and 2022. While increases have moderated recently, the overall trend remains upward.
Hallam – Bounce Back and Big Gains
Hallam is a small village southwest of Lincoln, historically known for its ties to the local power infrastructure and the 2004 tornado that devastated the area. Since then, Hallam has undergone significant rebuilding and renewal, which helped stabilize and eventually lift the housing market.
Its location near Highway 77 gives residents quick access to Lincoln, making it attractive to commuters. The blend of post-recovery development, relatively affordable prices for the region, and rural character has made Hallam a solid performer on Nebraska’s housing map.
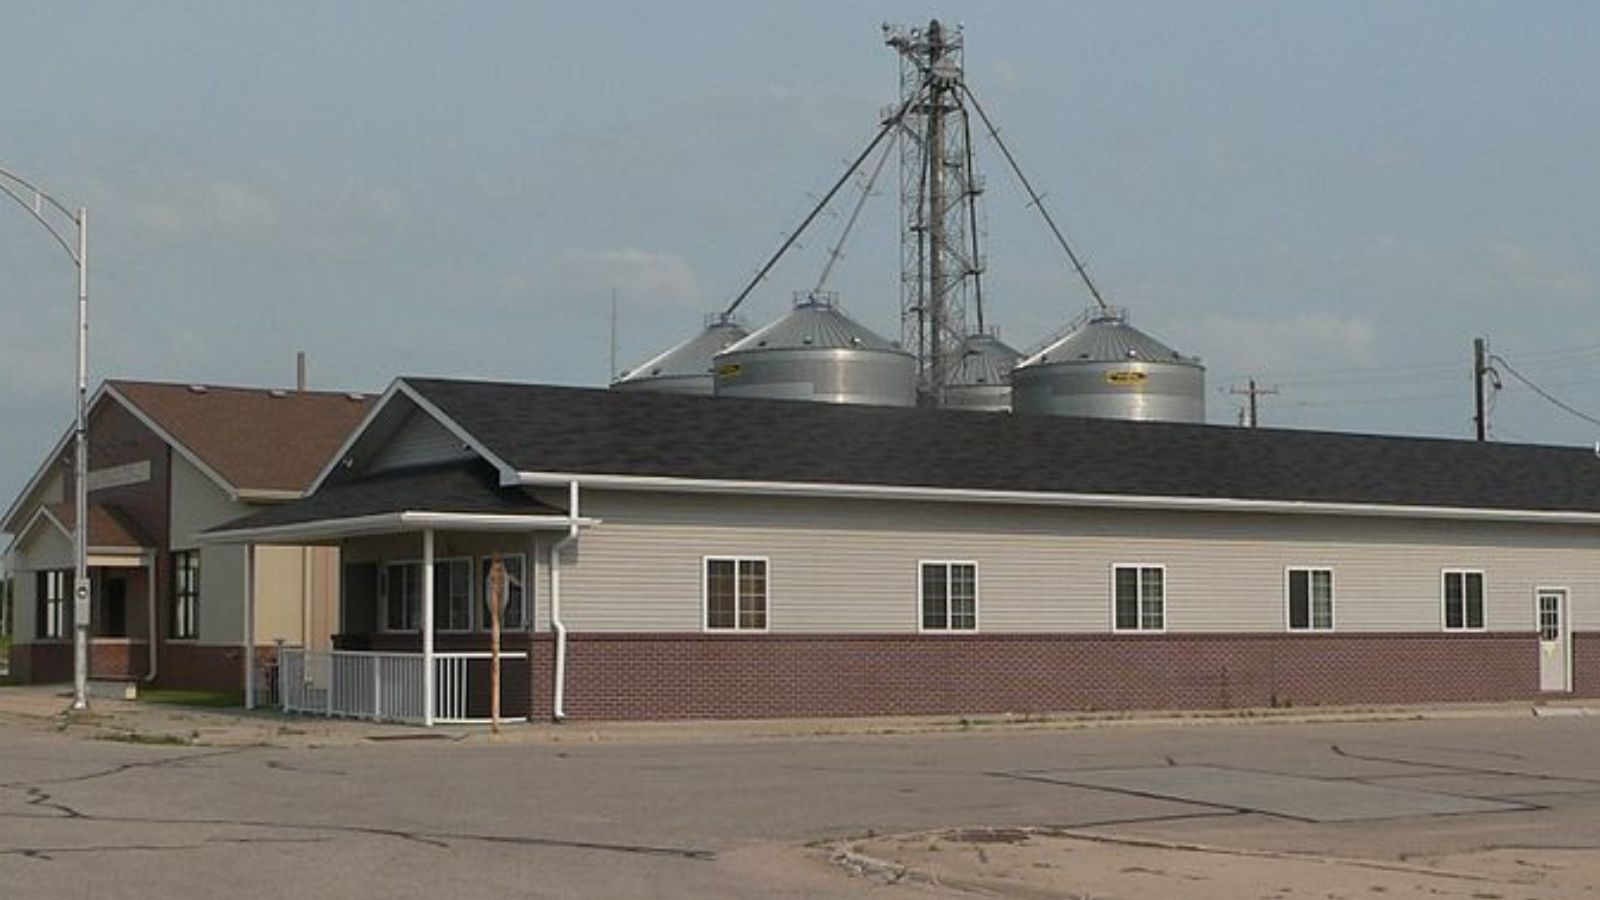
21. Adams – 141% Home Price Increase Since June 2010
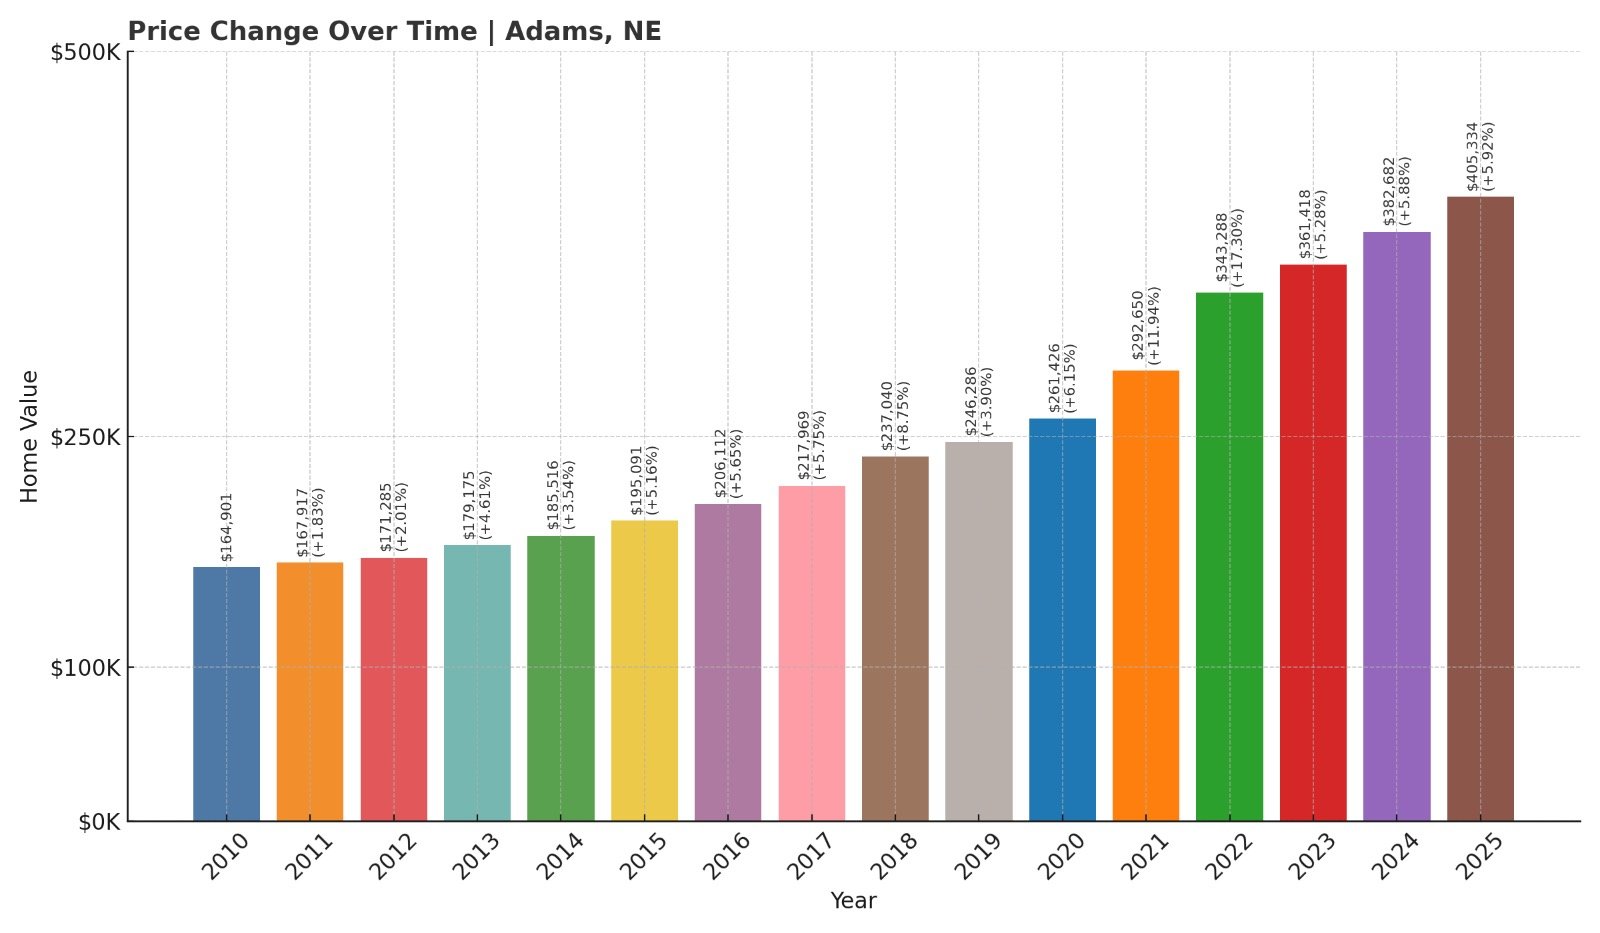
- 2010: $164,901
- 2011: $167,917 (+$3,017, +1.83% from previous year)
- 2012: $171,285 (+$3,368, +2.01% from previous year)
- 2013: $179,175 (+$7,890, +4.61% from previous year)
- 2014: $185,516 (+$6,341, +3.54% from previous year)
- 2015: $195,091 (+$9,575, +5.16% from previous year)
- 2016: $206,112 (+$11,021, +5.65% from previous year)
- 2017: $217,969 (+$11,856, +5.75% from previous year)
- 2018: $237,040 (+$19,072, +8.75% from previous year)
- 2019: $246,286 (+$9,246, +3.90% from previous year)
- 2020: $261,426 (+$15,139, +6.15% from previous year)
- 2021: $292,650 (+$31,224, +11.94% from previous year)
- 2022: $343,288 (+$50,639, +17.30% from previous year)
- 2023: $361,418 (+$18,130, +5.28% from previous year)
- 2024: $382,682 (+$21,264, +5.88% from previous year)
- 2025: $405,334 (+$22,652, +5.92% from previous year)
Since 2010, Adams’ home prices have risen by 141%—going from $164,901 to $405,334 in 2025. Growth was especially strong from 2020 to 2022, when prices jumped nearly $82,000. Annual gains have continued at a healthy pace in recent years.
Adams – Southeast Nebraska’s Quiet Climber
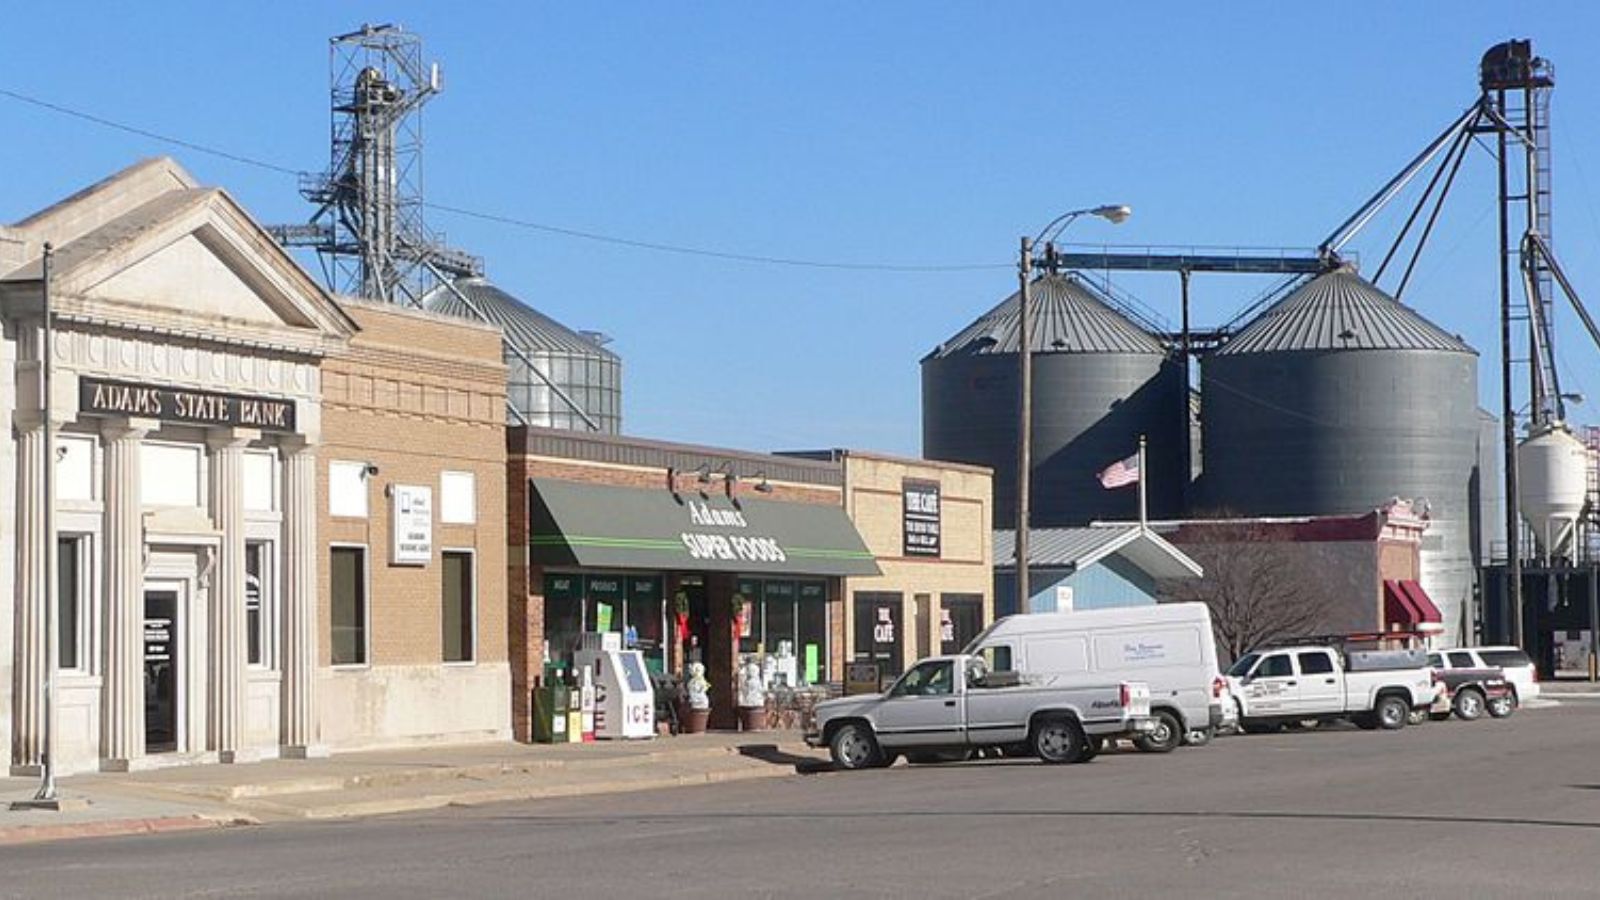
Adams sits about 25 miles southeast of Lincoln in Gage County and has evolved into a popular choice for buyers seeking more space without losing access to city jobs. The village’s charm and community vibe make it especially appealing to families and long-term residents.
Though Adams has no sprawling developments or commercial centers, its strong public schools and quality of life have kept real estate demand steady. Housing growth has mirrored regional trends, with rising costs in Lincoln encouraging more people to explore smaller neighboring towns like Adams.
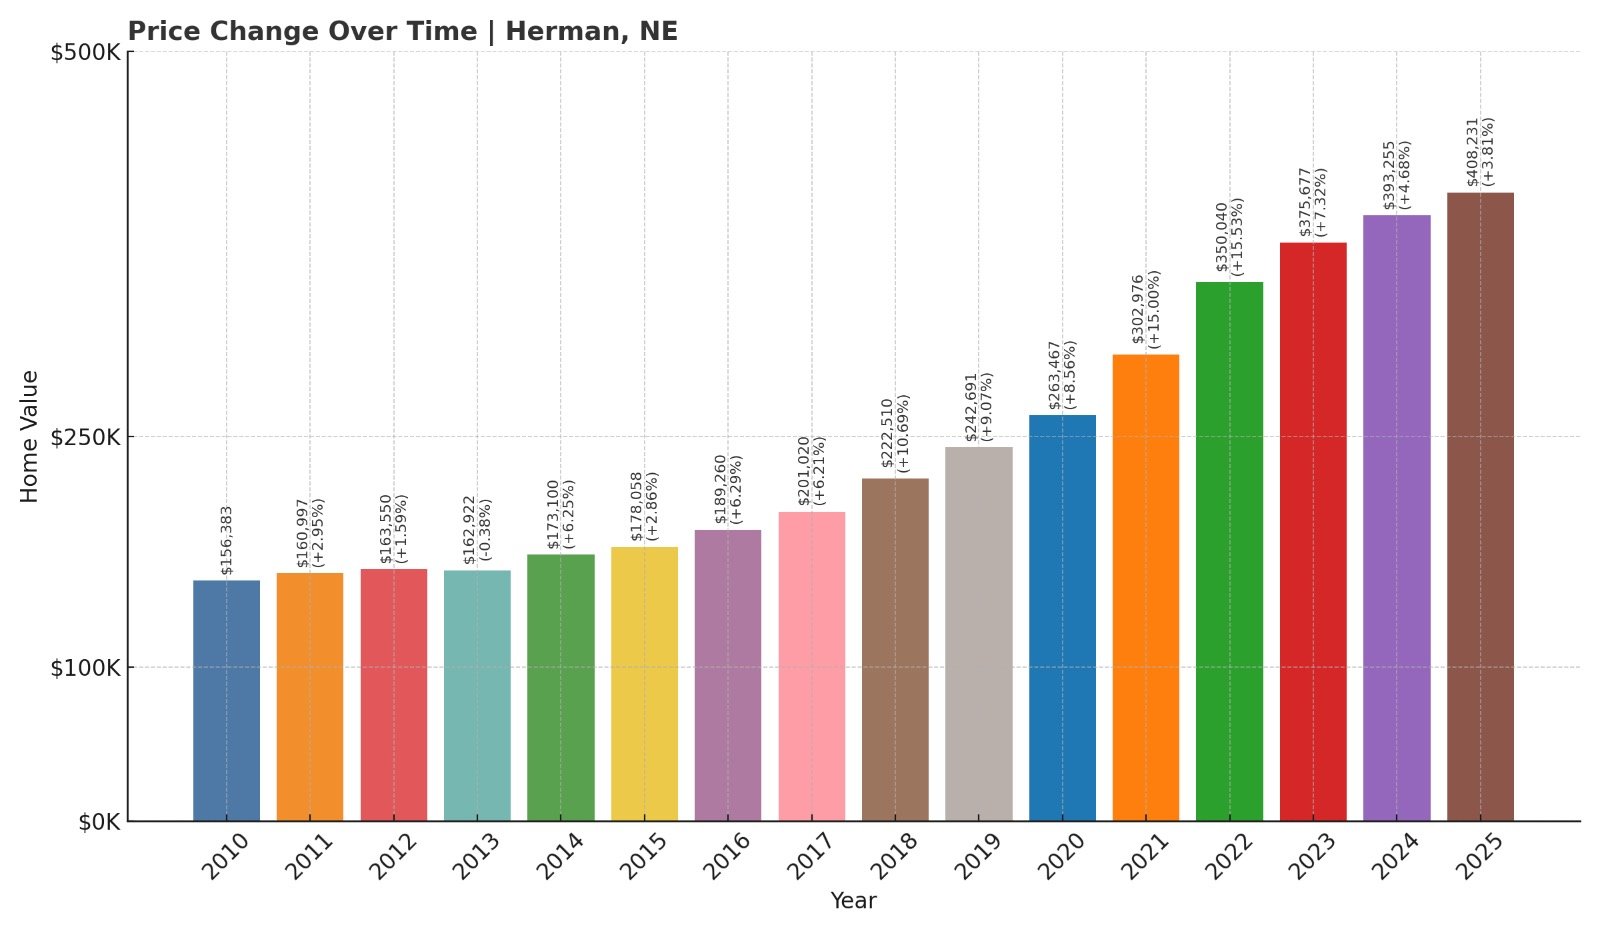
20. Herman – 161% Home Price Increase Since June 2010
- 2010: $156,383
- 2011: $160,997 (+$4,613, +2.95% from previous year)
- 2012: $163,550 (+$2,553, +1.59% from previous year)
- 2013: $162,922 ($-628, -0.38% from previous year)
- 2014: $173,100 (+$10,177, +6.25% from previous year)
- 2015: $178,058 (+$4,958, +2.86% from previous year)
- 2016: $189,260 (+$11,202, +6.29% from previous year)
- 2017: $201,020 (+$11,760, +6.21% from previous year)
- 2018: $222,510 (+$21,490, +10.69% from previous year)
- 2019: $242,691 (+$20,181, +9.07% from previous year)
- 2020: $263,467 (+$20,776, +8.56% from previous year)
- 2021: $302,976 (+$39,509, +15.00% from previous year)
- 2022: $350,040 (+$47,065, +15.53% from previous year)
- 2023: $375,677 (+$25,636, +7.32% from previous year)
- 2024: $393,255 (+$17,578, +4.68% from previous year)
- 2025: $408,231 (+$14,976, +3.81% from previous year)
Herman’s home prices have more than doubled since 2010, rising from $156,383 to $408,231 by 2025. Gains accelerated after 2017, with the steepest increases occurring between 2020 and 2022. Even as the pace slowed slightly in the last two years, prices continued to climb.
Herman – Quiet Location With Fast Appreciation
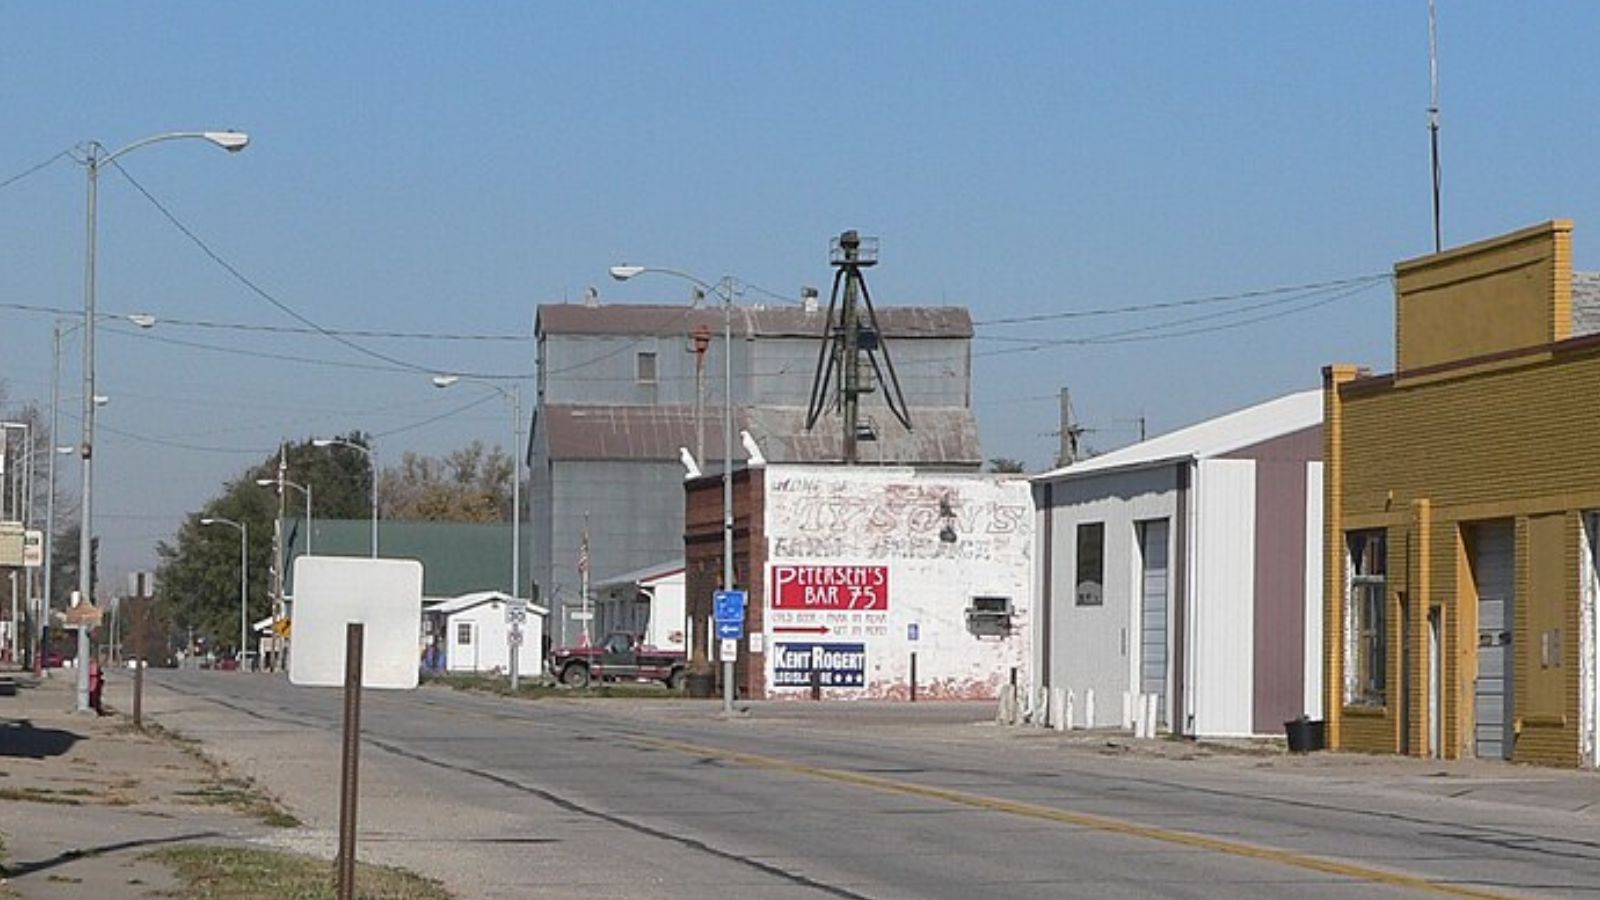
Located in Washington County near the Missouri River, Herman is a small rural town with fewer than 300 residents. Its real estate values have surged despite its size, reflecting broader demand for peaceful living and acreage near Omaha’s metropolitan reach. Though it lacks major amenities, the affordability of land and minimal turnover have made homes increasingly desirable.
Many buyers are drawn to the simplicity of life in Herman, especially as nearby communities experience crowding and higher prices. With limited new construction and high demand, home prices here have risen steadily. The town’s market reflects strong appeal among those willing to trade proximity for privacy.
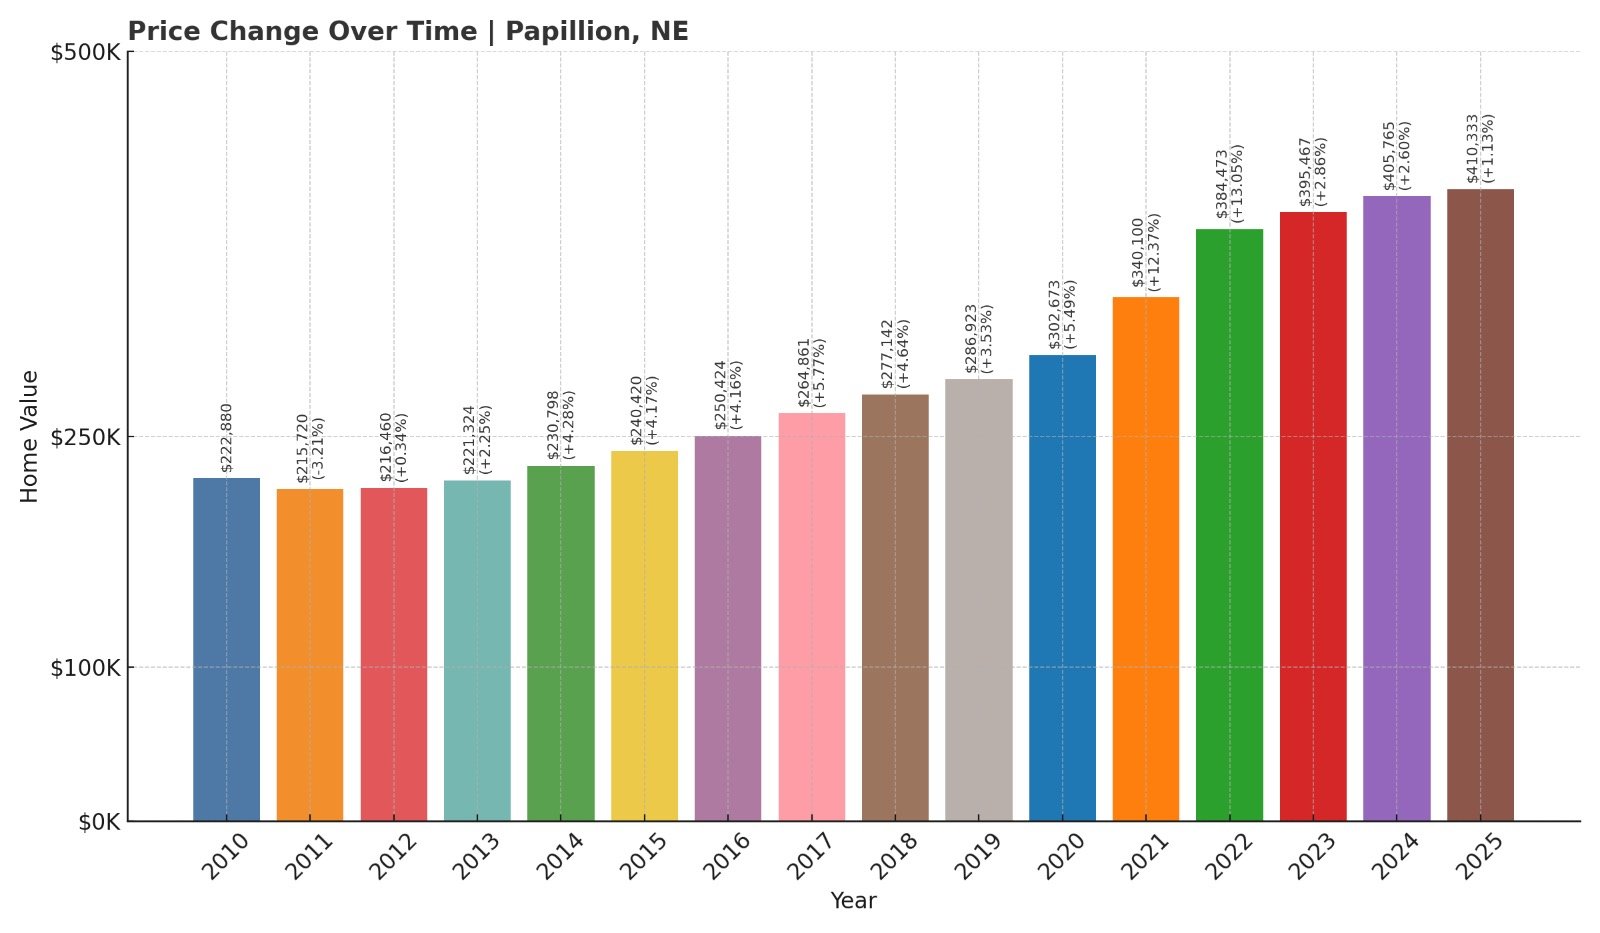
19. Papillion – 84% Home Price Increase Since June 2010
- 2010: $222,880
- 2011: $215,720 ($-7,160, -3.21% from previous year)
- 2012: $216,460 (+$740, +0.34% from previous year)
- 2013: $221,324 (+$4,864, +2.25% from previous year)
- 2014: $230,798 (+$9,474, +4.28% from previous year)
- 2015: $240,420 (+$9,622, +4.17% from previous year)
- 2016: $250,424 (+$10,004, +4.16% from previous year)
- 2017: $264,861 (+$14,437, +5.76% from previous year)
- 2018: $277,142 (+$12,282, +4.64% from previous year)
- 2019: $286,923 (+$9,781, +3.53% from previous year)
- 2020: $302,673 (+$15,750, +5.49% from previous year)
- 2021: $340,100 (+$37,427, +12.37% from previous year)
- 2022: $384,473 (+$44,373, +13.05% from previous year)
- 2023: $395,467 (+$10,994, +2.86% from previous year)
- 2024: $405,765 (+$10,298, +2.60% from previous year)
- 2025: $410,333 (+$4,568, +1.13% from previous year)
Papillion home prices grew from $222,880 in 2010 to $410,333 in 2025—a jump of 84% over 15 years. Much of that growth came between 2020 and 2022, when prices surged nearly $82,000. The market has since cooled, but values continue to rise slowly.
Papillion – One of Omaha’s Most Popular Suburbs
Situated just south of Omaha in Sarpy County, Papillion offers a well-developed suburban lifestyle with parks, schools, and retail. It frequently ranks as one of the best places to live in Nebraska due to its strong infrastructure and job access. This popularity has kept demand high and prices resilient.
New neighborhoods and consistent public investment have made Papillion attractive to families and professionals alike. The housing market remains competitive, even as growth slows slightly in 2024 and 2025. Buyers seeking proximity to Omaha without city congestion continue to fuel long-term appreciation.
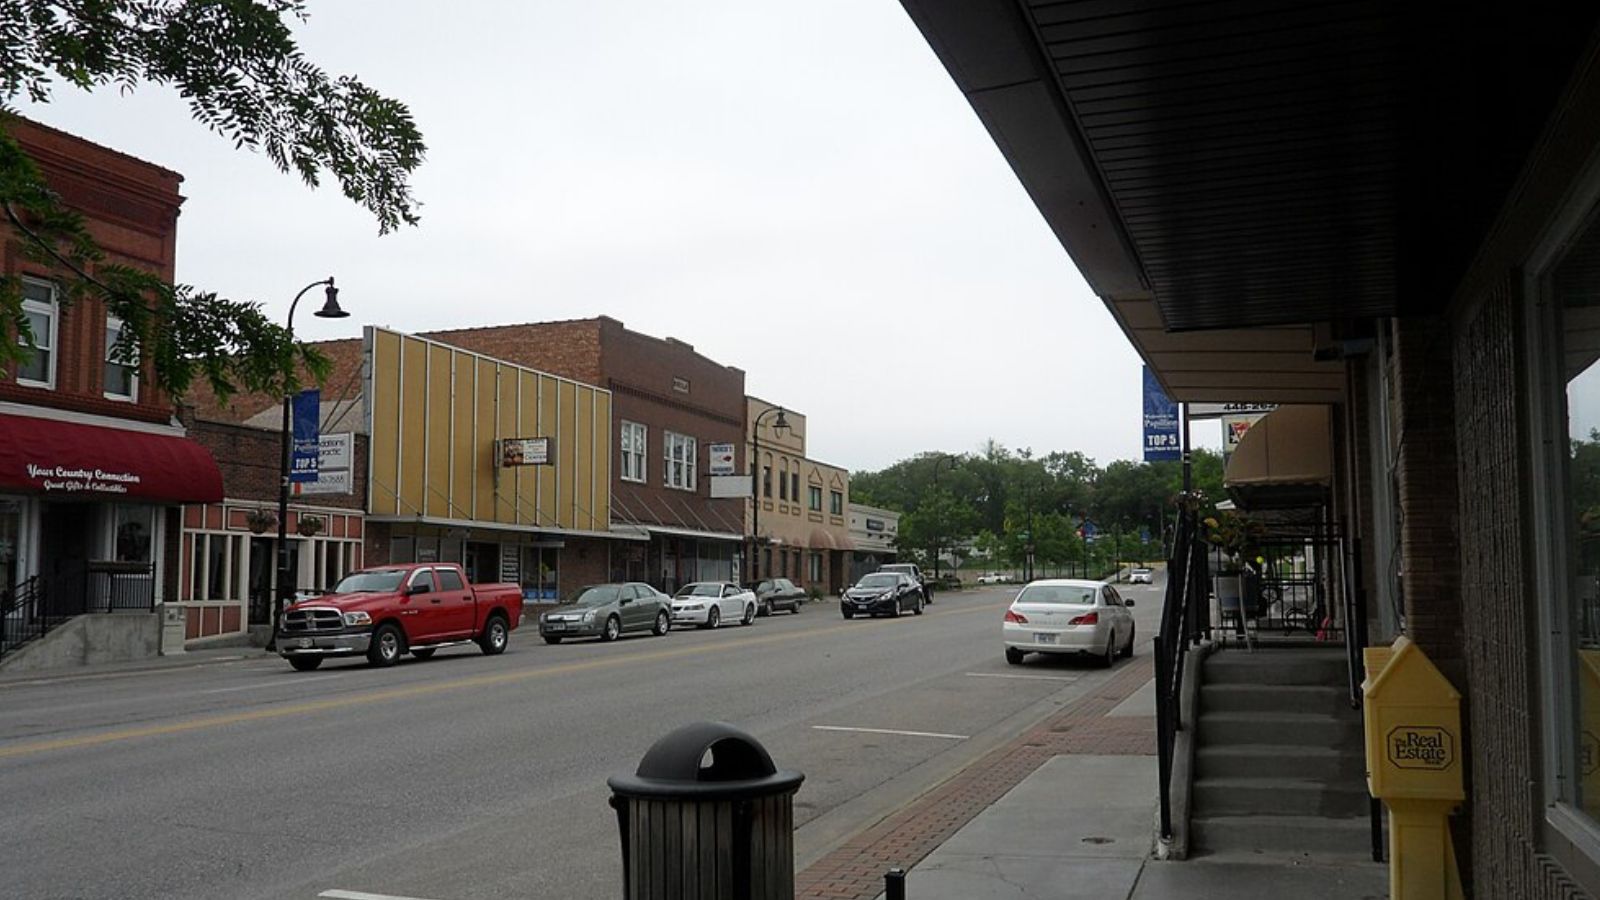
18. Bennington – 77% Home Price Increase Since June 2010
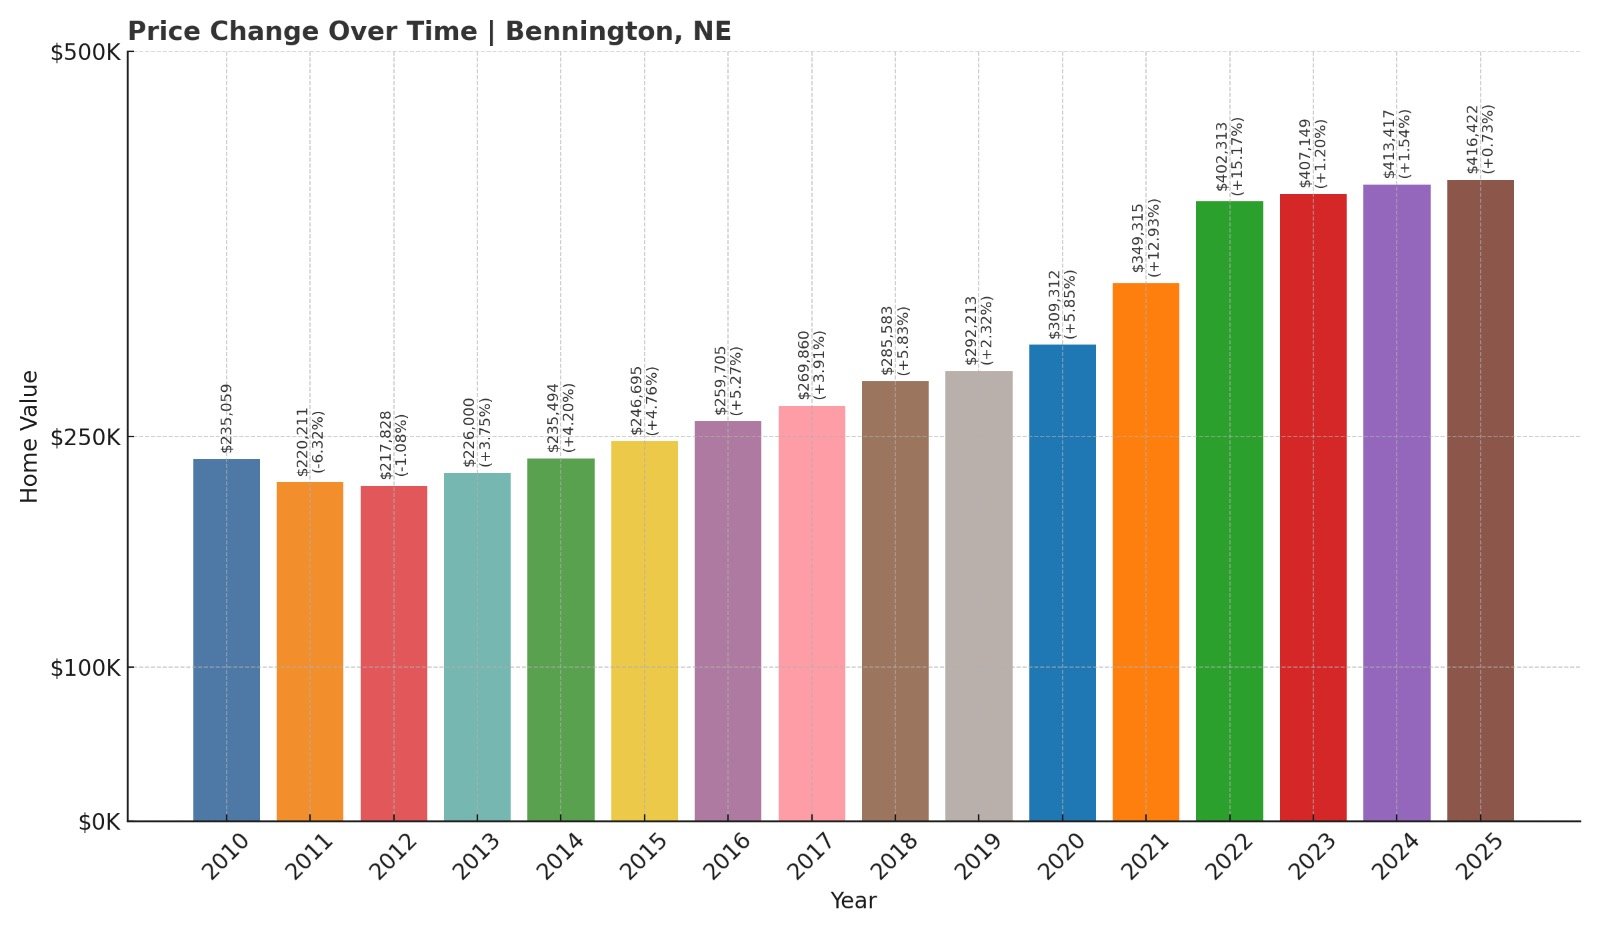

- 2010: $235,059
- 2011: $220,211 ($-14,848, -6.32% from previous year)
- 2012: $217,828 ($-2,383, -1.08% from previous year)
- 2013: $226,000 (+$8,173, +3.75% from previous year)
- 2014: $235,494 (+$9,494, +4.20% from previous year)
- 2015: $246,695 (+$11,201, +4.76% from previous year)
- 2016: $259,705 (+$13,009, +5.27% from previous year)
- 2017: $269,860 (+$10,155, +3.91% from previous year)
- 2018: $285,583 (+$15,723, +5.83% from previous year)
- 2019: $292,213 (+$6,630, +2.32% from previous year)
- 2020: $309,312 (+$17,099, +5.85% from previous year)
- 2021: $349,315 (+$40,003, +12.93% from previous year)
- 2022: $402,313 (+$52,998, +15.17% from previous year)
- 2023: $407,149 (+$4,835, +1.20% from previous year)
- 2024: $413,417 (+$6,269, +1.54% from previous year)
- 2025: $416,422 (+$3,004, +0.73% from previous year)
Bennington home prices have risen from $235,059 in 2010 to $416,422 in 2025—a 77% increase. The town saw its largest spikes in 2021 and 2022, when values jumped more than $93,000 in two years. Growth has cooled recently but remains positive.
Bennington – Fast-Growing Edge of the Metro

Bennington, northwest of Omaha, has become one of the metro area’s fastest-growing residential spots. With access to good schools and new developments, it attracts both families and investors. The appeal is driven by newer housing, large lots, and proximity to job centers.
Rising home values here are fueled by a combination of land availability and steady demand from those priced out of Omaha. Infrastructure improvements and school expansions have further boosted its draw. Despite recent slowdowns, Bennington remains a highly desirable community.
17. Kennard – 125% Home Price Increase Since June 2010
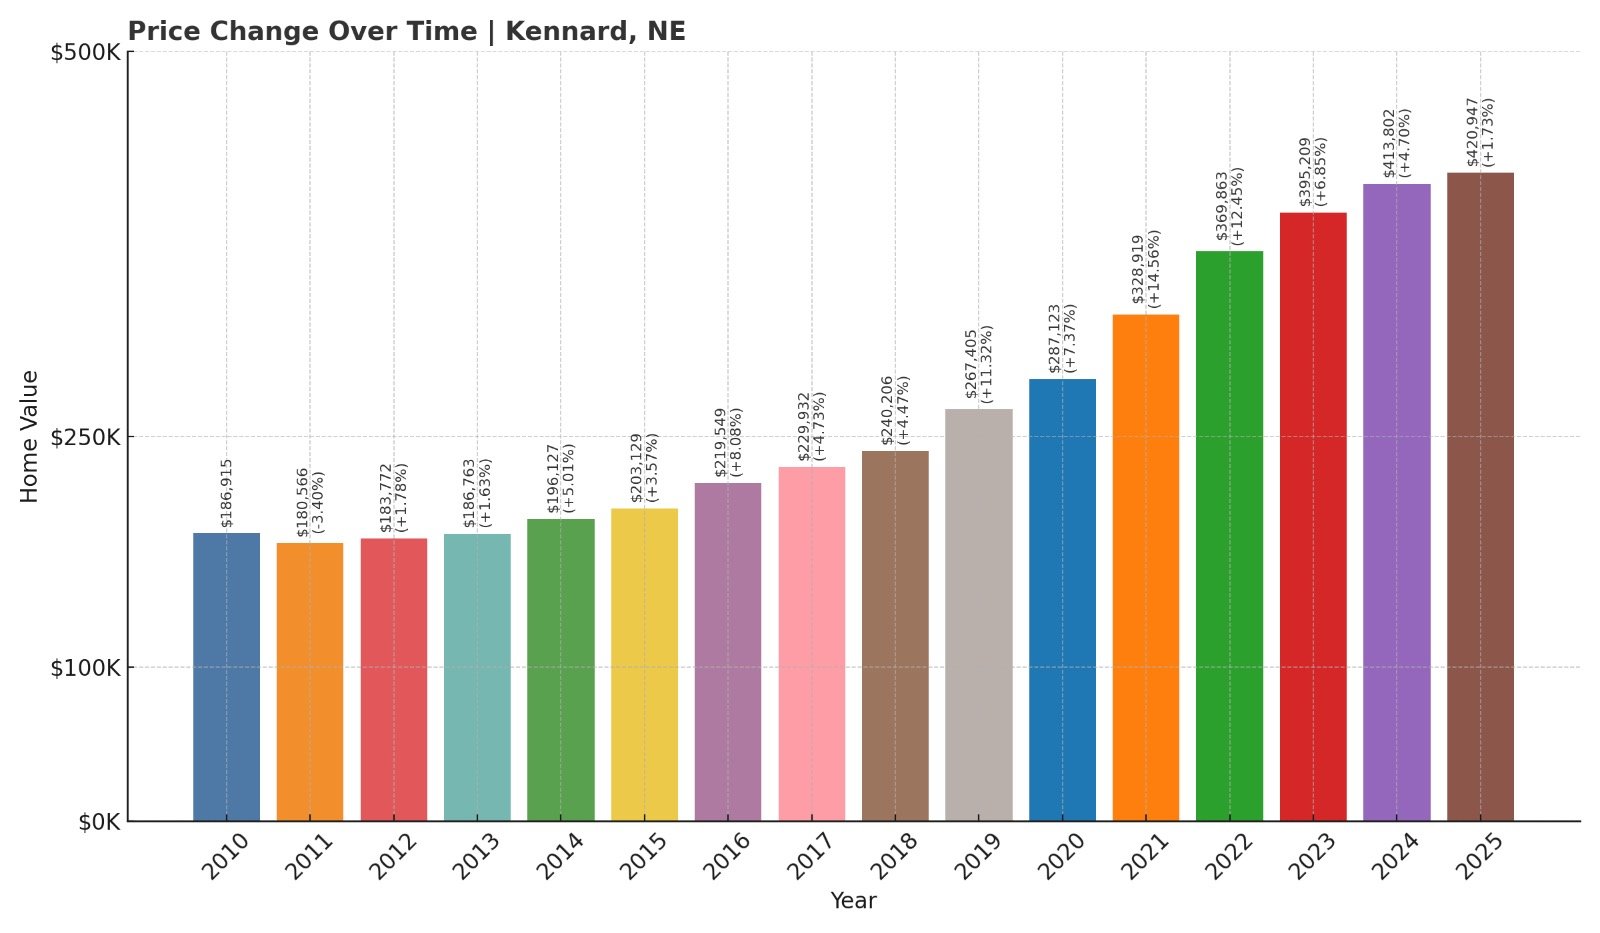
- 2010: $186,915
- 2011: $180,566 ($-6,349, -3.40% from previous year)
- 2012: $183,772 (+$3,207, +1.78% from previous year)
- 2013: $186,763 (+$2,991, +1.63% from previous year)
- 2014: $196,127 (+$9,364, +5.01% from previous year)
- 2015: $203,129 (+$7,002, +3.57% from previous year)
- 2016: $219,549 (+$16,420, +8.08% from previous year)
- 2017: $229,932 (+$10,384, +4.73% from previous year)
- 2018: $240,206 (+$10,274, +4.47% from previous year)
- 2019: $267,405 (+$27,199, +11.32% from previous year)
- 2020: $287,123 (+$19,718, +7.37% from previous year)
- 2021: $328,919 (+$41,797, +14.56% from previous year)
- 2022: $369,863 (+$40,944, +12.45% from previous year)
- 2023: $395,209 (+$25,346, +6.85% from previous year)
- 2024: $413,802 (+$18,593, +4.70% from previous year)
- 2025: $420,947 (+$7,145, +1.73% from previous year)
Kennard’s home values climbed from $186,915 in 2010 to $420,947 in 2025—an increase of 125%. The sharpest gains occurred between 2020 and 2022, when prices rose by over $80,000. Even with smaller recent increases, the overall trend remains strong.
Kennard – A Small Town With Big Gains

Located just north of Bennington in Washington County, Kennard offers a quiet rural setting with easy access to the Omaha metro. It’s become popular among buyers who want space without sacrificing a manageable commute. Housing here is limited, which helps support rising values.
The town has benefited from growth in nearby areas, especially as surrounding communities fill up. Kennard’s appeal lies in its mix of open land, newer homes, and community charm. Despite its small size, the local housing market is competitive and consistently appreciating.
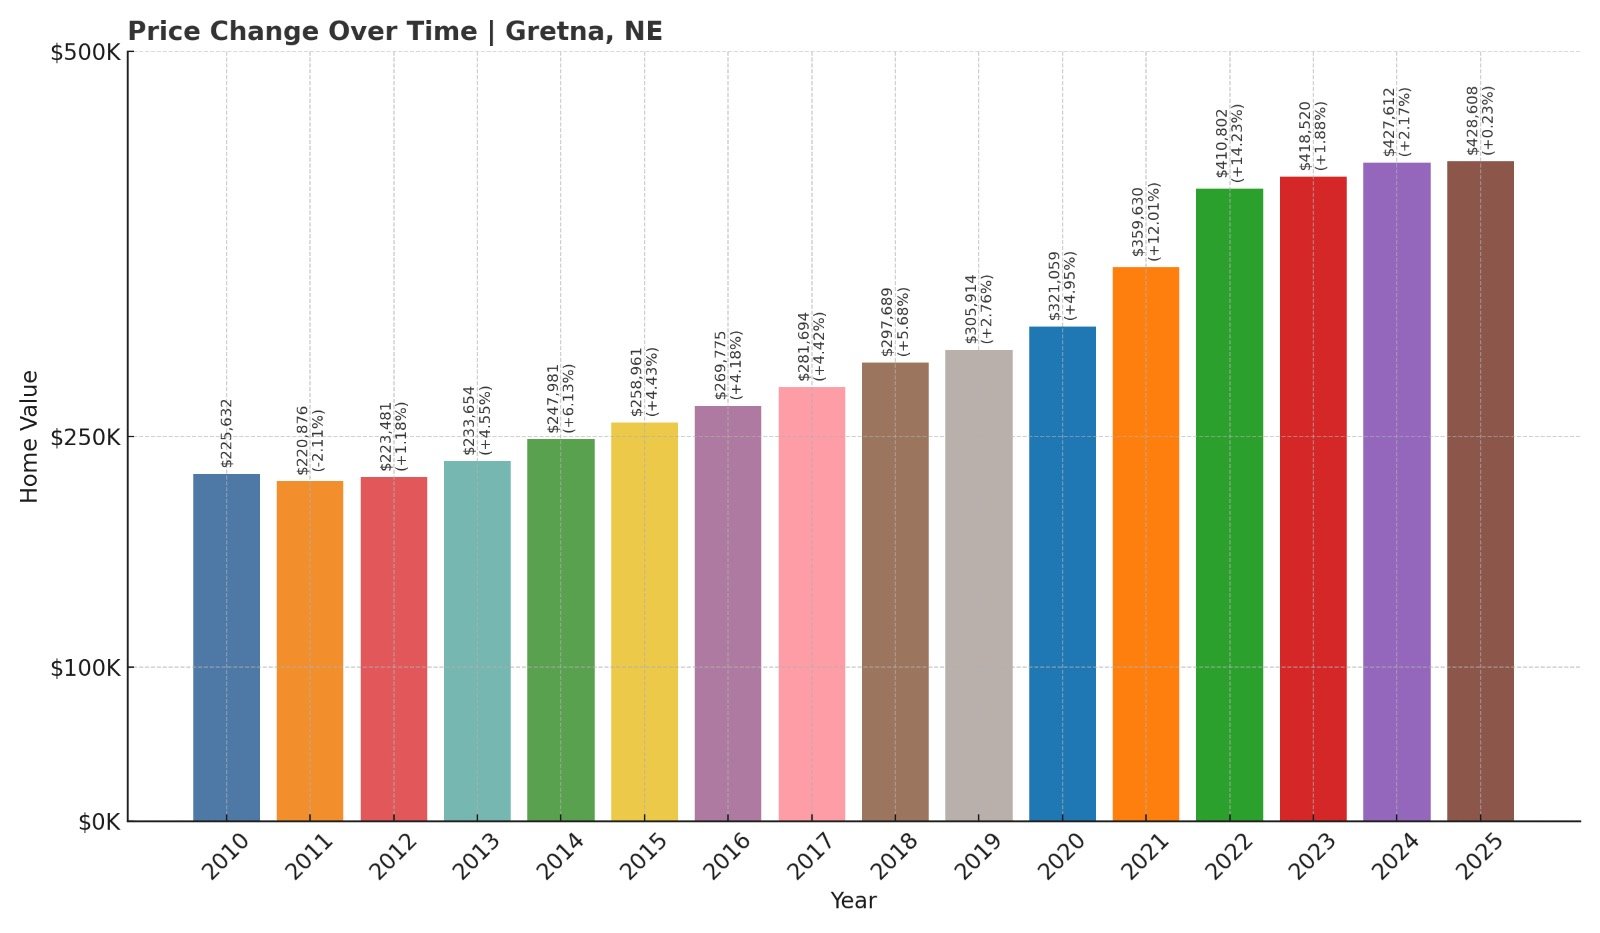
16. Gretna – 90% Home Price Increase Since June 2010
Would you like to save this?
- 2010: $225,632
- 2011: $220,876 ($-4,757, -2.11% from previous year)
- 2012: $223,481 (+$2,605, +1.18% from previous year)
- 2013: $233,654 (+$10,173, +4.55% from previous year)
- 2014: $247,981 (+$14,327, +6.13% from previous year)
- 2015: $258,961 (+$10,980, +4.43% from previous year)
- 2016: $269,775 (+$10,814, +4.18% from previous year)
- 2017: $281,694 (+$11,919, +4.42% from previous year)
- 2018: $297,689 (+$15,995, +5.68% from previous year)
- 2019: $305,914 (+$8,225, +2.76% from previous year)
- 2020: $321,059 (+$15,145, +4.95% from previous year)
- 2021: $359,630 (+$38,571, +12.01% from previous year)
- 2022: $410,802 (+$51,173, +14.23% from previous year)
- 2023: $418,520 (+$7,718, +1.88% from previous year)
- 2024: $427,612 (+$9,092, +2.17% from previous year)
- 2025: $428,608 (+$996, +0.23% from previous year)
Home values in Gretna have grown 90% since 2010, reaching $428,608 in 2025. The town’s biggest price leaps came in 2021 and 2022, with gains topping $89,000 in just two years. Recent increases have tapered, but prices remain at record highs.
Gretna – Rapid Expansion Meets Rising Demand

Gretna sits southwest of Omaha and has transformed from a small town into a booming suburb. New developments, a strong school district, and major retail growth have fueled homebuyer interest. The town’s popularity shows no signs of slowing, even as prices peak.
Its central location between Omaha and Lincoln has made it ideal for commuters. Infrastructure projects like new schools and shopping centers have added to its draw. Though appreciation has slowed in 2025, the long-term growth story remains intact.
15. Waterloo – 112% Home Price Increase Since June 2010

- 2010: $204,977
- 2011: $191,036 ($-13,941, -6.80% from previous year)
- 2012: $192,707 (+$1,671, +0.87% from previous year)
- 2013: $201,437 (+$8,730, +4.53% from previous year)
- 2014: $214,522 (+$13,085, +6.50% from previous year)
- 2015: $226,520 (+$11,998, +5.59% from previous year)
- 2016: $240,929 (+$14,409, +6.36% from previous year)
- 2017: $248,363 (+$7,434, +3.09% from previous year)
- 2018: $269,608 (+$21,245, +8.55% from previous year)
- 2019: $279,195 (+$9,587, +3.56% from previous year)
- 2020: $300,096 (+$20,901, +7.49% from previous year)
- 2021: $358,754 (+$58,658, +19.55% from previous year)
- 2022: $407,406 (+$48,652, +13.56% from previous year)
- 2023: $417,981 (+$10,575, +2.60% from previous year)
- 2024: $433,772 (+$15,791, +3.78% from previous year)
- 2025: $434,072 (+$300, +0.07% from previous year)
Since 2010, Waterloo’s home values have more than doubled, increasing by 112% to reach $434,072 in 2025. The market saw its biggest leap between 2020 and 2021, when values soared nearly $59,000 in a single year. While the most recent data shows stabilization, the long-term growth is substantial.
Waterloo – Strong Appreciation Near Omaha’s Western Edge

Located west of Omaha along the Elkhorn River, Waterloo blends small-town quiet with proximity to city conveniences. The area has seen new residential development as buyers seek more space, river views, and access to recreation without leaving the metro. Its appeal to higher-income commuters has driven strong demand and price appreciation.
Waterloo’s location near Valley and Elkhorn also connects it to regional job centers while preserving its distinct rural character. Limited land supply along the riverfront contributes to steadily rising values. With ongoing interest in suburban living, Waterloo’s housing market remains competitive and highly sought after.
14. Garland – 126% Home Price Increase Since June 2010

- 2010: $197,854
- 2011: $200,792 (+$2,938, +1.48% from previous year)
- 2012: $202,250 (+$1,457, +0.73% from previous year)
- 2013: $203,627 (+$1,378, +0.68% from previous year)
- 2014: $214,563 (+$10,936, +5.37% from previous year)
- 2015: $225,349 (+$10,785, +5.03% from previous year)
- 2016: $237,171 (+$11,822, +5.25% from previous year)
- 2017: $247,128 (+$9,957, +4.20% from previous year)
- 2018: $270,543 (+$23,415, +9.47% from previous year)
- 2019: $287,026 (+$16,483, +6.09% from previous year)
- 2020: $303,173 (+$16,146, +5.63% from previous year)
- 2021: $348,090 (+$44,917, +14.82% from previous year)
- 2022: $397,119 (+$49,029, +14.09% from previous year)
- 2023: $416,351 (+$19,233, +4.84% from previous year)
- 2024: $426,954 (+$10,603, +2.55% from previous year)
- 2025: $447,210 (+$20,255, +4.74% from previous year)
Garland’s home prices climbed from under $198,000 in 2010 to more than $447,000 by 2025, a 126% increase. Growth was relatively modest during the early 2010s, but values took off after 2020, especially in 2021 and 2022. That momentum has continued, with prices steadily rising each year.
Garland – Rural Lifestyle With Urban Proximity

Garland is located in Seward County, just northwest of Lincoln, and offers rural living just a short drive from the city. The area’s scenic countryside and low-density neighborhoods appeal to buyers who want quiet without being far from work or amenities. Its schools and sense of community have helped draw steady demand from growing families.
New builds and lot developments have also contributed to higher prices, though growth has remained controlled compared to more densely populated suburbs. Its close access to highways makes it an attractive option for commuters. Garland continues to command rising values thanks to a strong blend of location, lifestyle, and demand.
13. Malmo – 170% Home Price Increase Since June 2010
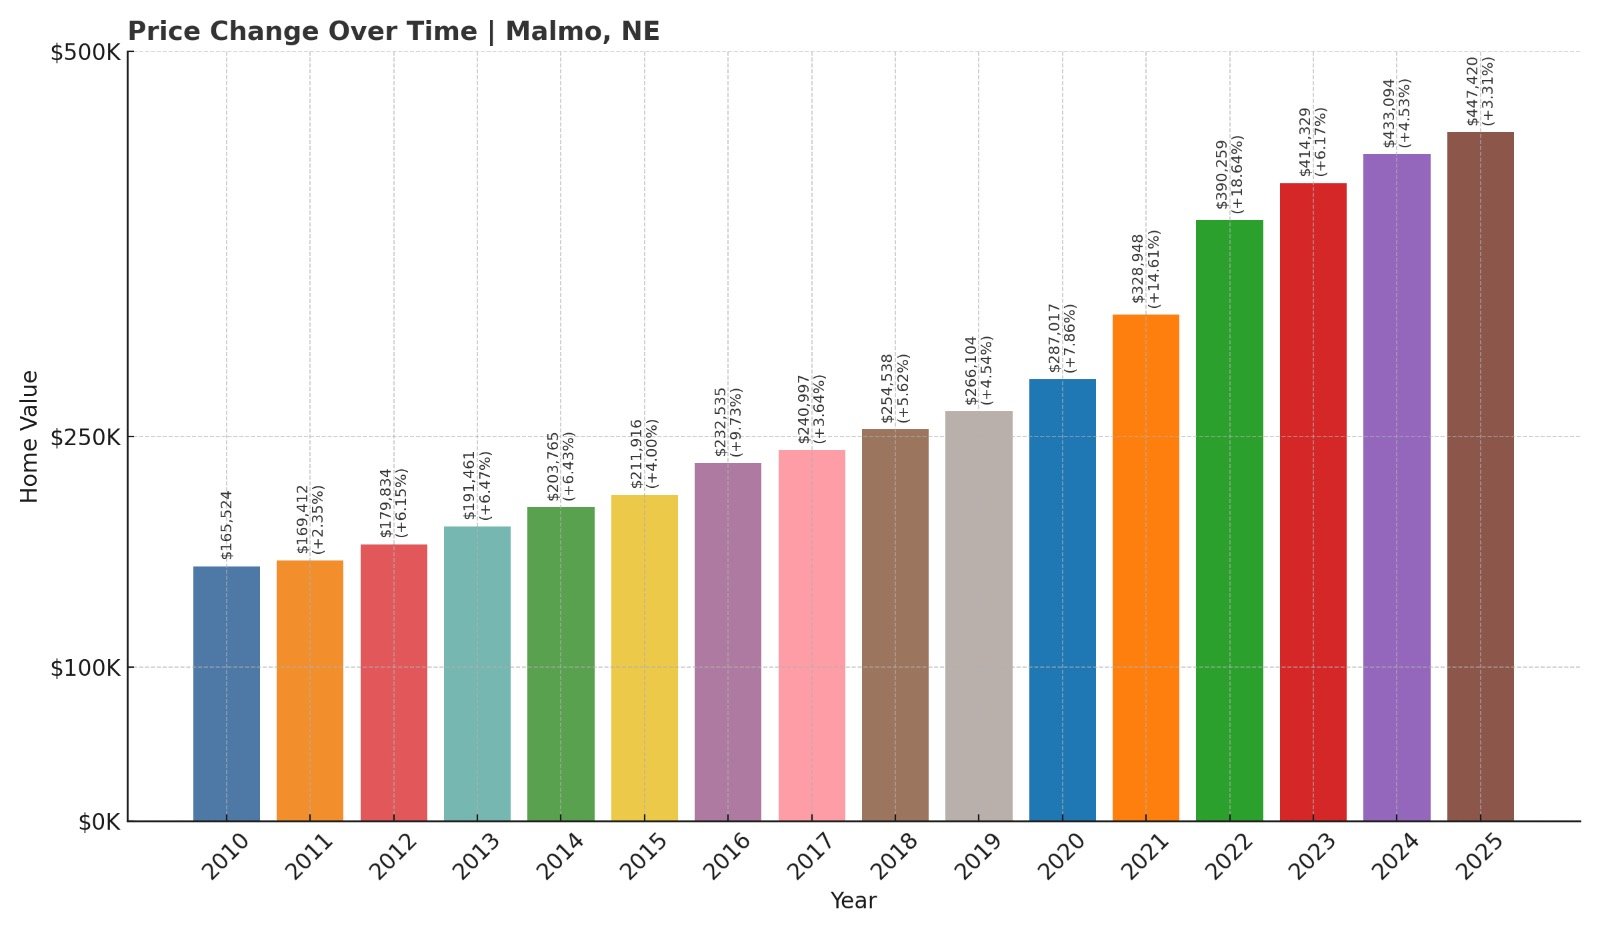
- 2010: $165,524
- 2011: $169,412 (+$3,888, +2.35% from previous year)
- 2012: $179,834 (+$10,422, +6.15% from previous year)
- 2013: $191,461 (+$11,627, +6.47% from previous year)
- 2014: $203,765 (+$12,304, +6.43% from previous year)
- 2015: $211,916 (+$8,151, +4.00% from previous year)
- 2016: $232,535 (+$20,620, +9.73% from previous year)
- 2017: $240,997 (+$8,462, +3.64% from previous year)
- 2018: $254,538 (+$13,541, +5.62% from previous year)
- 2019: $266,104 (+$11,565, +4.54% from previous year)
- 2020: $287,017 (+$20,913, +7.86% from previous year)
- 2021: $328,948 (+$41,931, +14.61% from previous year)
- 2022: $390,259 (+$61,311, +18.64% from previous year)
- 2023: $414,329 (+$24,070, +6.17% from previous year)
- 2024: $433,094 (+$18,765, +4.53% from previous year)
- 2025: $447,420 (+$14,327, +3.31% from previous year)
Home prices in Malmo have skyrocketed 170% since 2010, climbing from $165,524 to $447,420 by 2025. The most dramatic increases occurred in 2021 and 2022, with values surging by more than $100,000 in that short span. Recent years have shown slower but consistent growth.
Malmo – Big Appreciation in a Tiny Village
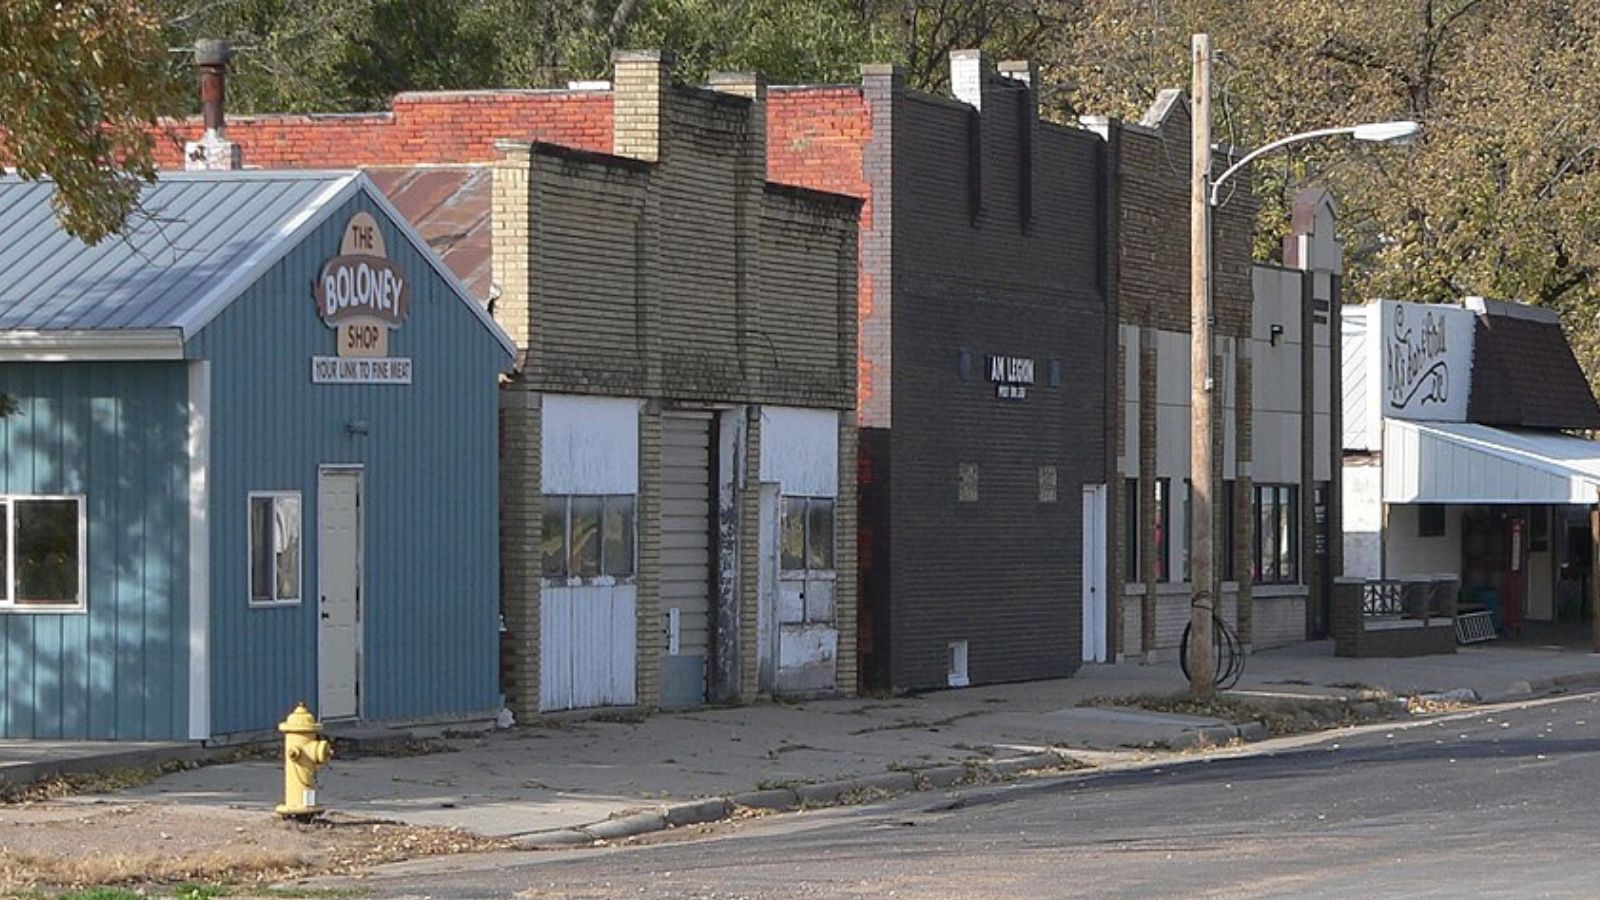
Malmo is a small community in Saunders County with fewer than 150 residents, but its home values have moved like a much larger market. Limited housing inventory and proximity to larger cities like Wahoo and Fremont have helped boost prices. Buyers seeking rural charm with quick access to services have increasingly looked here.
Much of the recent growth is tied to renewed interest in small-town living after 2020. Homes rarely hit the market, and when they do, competition tends to be stiff. Malmo’s property values now rival many larger communities in Nebraska, despite its size.
12. Firth – 129% Home Price Increase Since June 2010
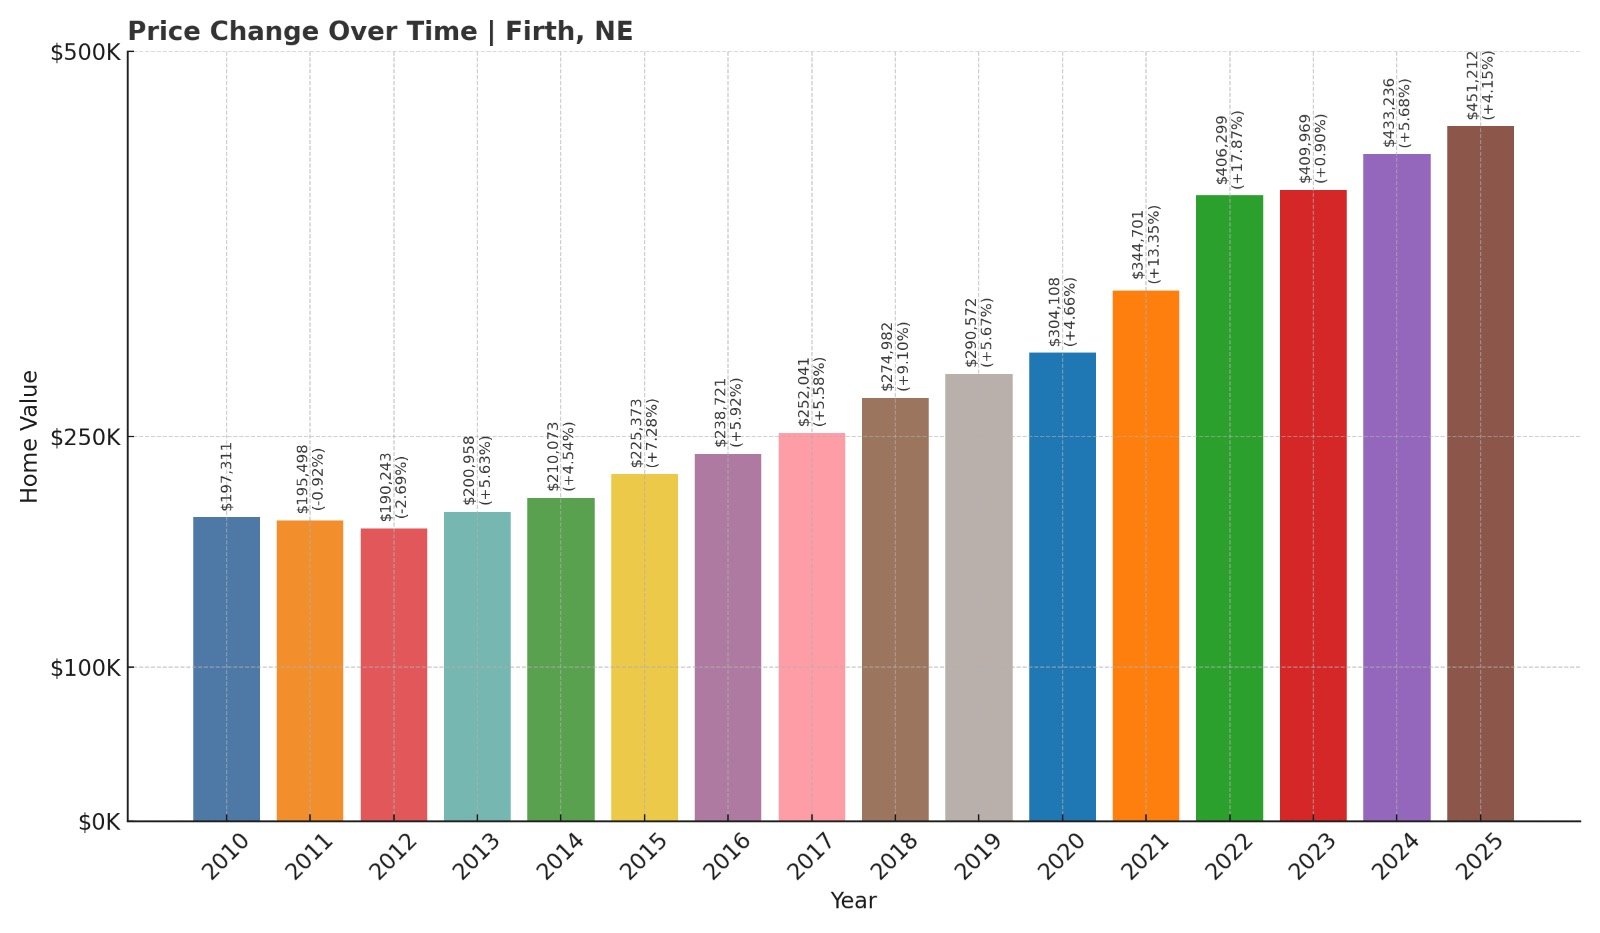
- 2010: $197,311
- 2011: $195,498 ($-1,813, -0.92% from previous year)
- 2012: $190,243 ($-5,255, -2.69% from previous year)
- 2013: $200,958 (+$10,715, +5.63% from previous year)
- 2014: $210,073 (+$9,115, +4.54% from previous year)
- 2015: $225,373 (+$15,300, +7.28% from previous year)
- 2016: $238,721 (+$13,348, +5.92% from previous year)
- 2017: $252,041 (+$13,319, +5.58% from previous year)
- 2018: $274,982 (+$22,941, +9.10% from previous year)
- 2019: $290,572 (+$15,590, +5.67% from previous year)
- 2020: $304,108 (+$13,536, +4.66% from previous year)
- 2021: $344,701 (+$40,592, +13.35% from previous year)
- 2022: $406,299 (+$61,599, +17.87% from previous year)
- 2023: $409,969 (+$3,670, +0.90% from previous year)
- 2024: $433,236 (+$23,266, +5.68% from previous year)
- 2025: $451,212 (+$17,976, +4.15% from previous year)
Firth’s home values rose from $197,311 in 2010 to $451,212 in 2025, an increase of 129%. Prices jumped sharply in 2021 and 2022, climbing by more than $100,000 over those two years. After a brief pause in 2023, the market rebounded again in 2024 and 2025.
Firth – Strong Growth Southeast of Lincoln

Firth is a village in Lancaster County about 20 miles southeast of Lincoln, making it ideal for those who commute but prefer country living. The Norris School District serves the area and has been a major driver of demand among families. Housing inventory is tight, and newer construction has lifted values in recent years.
Much of the town’s growth is tied to Lincoln’s outward expansion and rising prices in the metro. With its balance of rural tranquility and good schools, Firth continues to attract steady buyer interest. That demand is reflected in its fast-rising property values over the past decade.
11. Springfield – 110% Home Price Increase Since June 2010
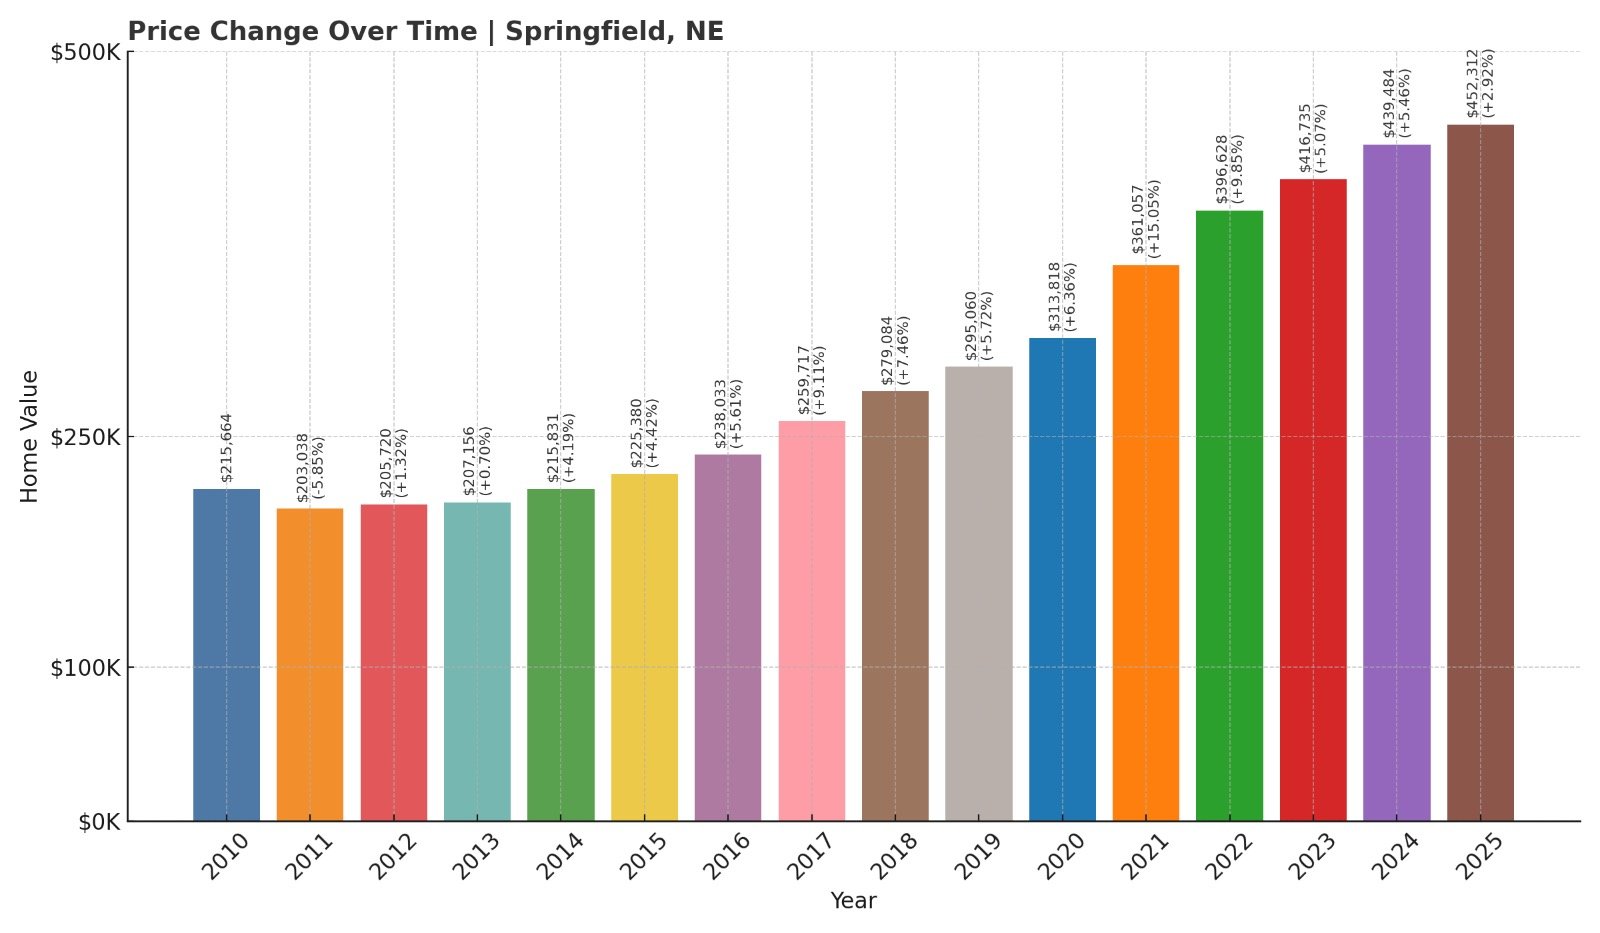
- 2010: $215,664
- 2011: $203,038 ($-12,626, -5.85% from previous year)
- 2012: $205,720 (+$2,681, +1.32% from previous year)
- 2013: $207,156 (+$1,437, +0.70% from previous year)
- 2014: $215,831 (+$8,675, +4.19% from previous year)
- 2015: $225,380 (+$9,549, +4.42% from previous year)
- 2016: $238,033 (+$12,653, +5.61% from previous year)
- 2017: $259,717 (+$21,684, +9.11% from previous year)
- 2018: $279,084 (+$19,368, +7.46% from previous year)
- 2019: $295,060 (+$15,976, +5.72% from previous year)
- 2020: $313,818 (+$18,759, +6.36% from previous year)
- 2021: $361,057 (+$47,238, +15.05% from previous year)
- 2022: $396,628 (+$35,572, +9.85% from previous year)
- 2023: $416,735 (+$20,106, +5.07% from previous year)
- 2024: $439,484 (+$22,750, +5.46% from previous year)
- 2025: $452,312 (+$12,827, +2.92% from previous year)
Springfield’s home prices have jumped 110% since 2010, with values rising from $215,664 to $452,312 in 2025. The biggest acceleration happened between 2020 and 2022, when prices increased by over $80,000. While growth has slowed a bit in the last year, prices are still pushing higher each year.
Springfield – Steady Suburban Appeal Near the Platte River

Located along the Platte River in Sarpy County, Springfield offers a scenic mix of river valley charm and easy access to Omaha. With close proximity to Highway 50 and a short drive to I-80, the town has become a favorite for commuters seeking a quieter pace. Its small-town atmosphere, growing amenities, and proximity to outdoor recreation areas have kept housing demand strong.
New residential development and investments in local infrastructure have helped fuel rising home values. The town’s popularity with families is reflected in strong school district ratings and a consistent influx of new buyers. Even as other markets cool, Springfield continues to deliver solid appreciation year over year.
10. Davey – 110% Home Price Increase Since June 2010
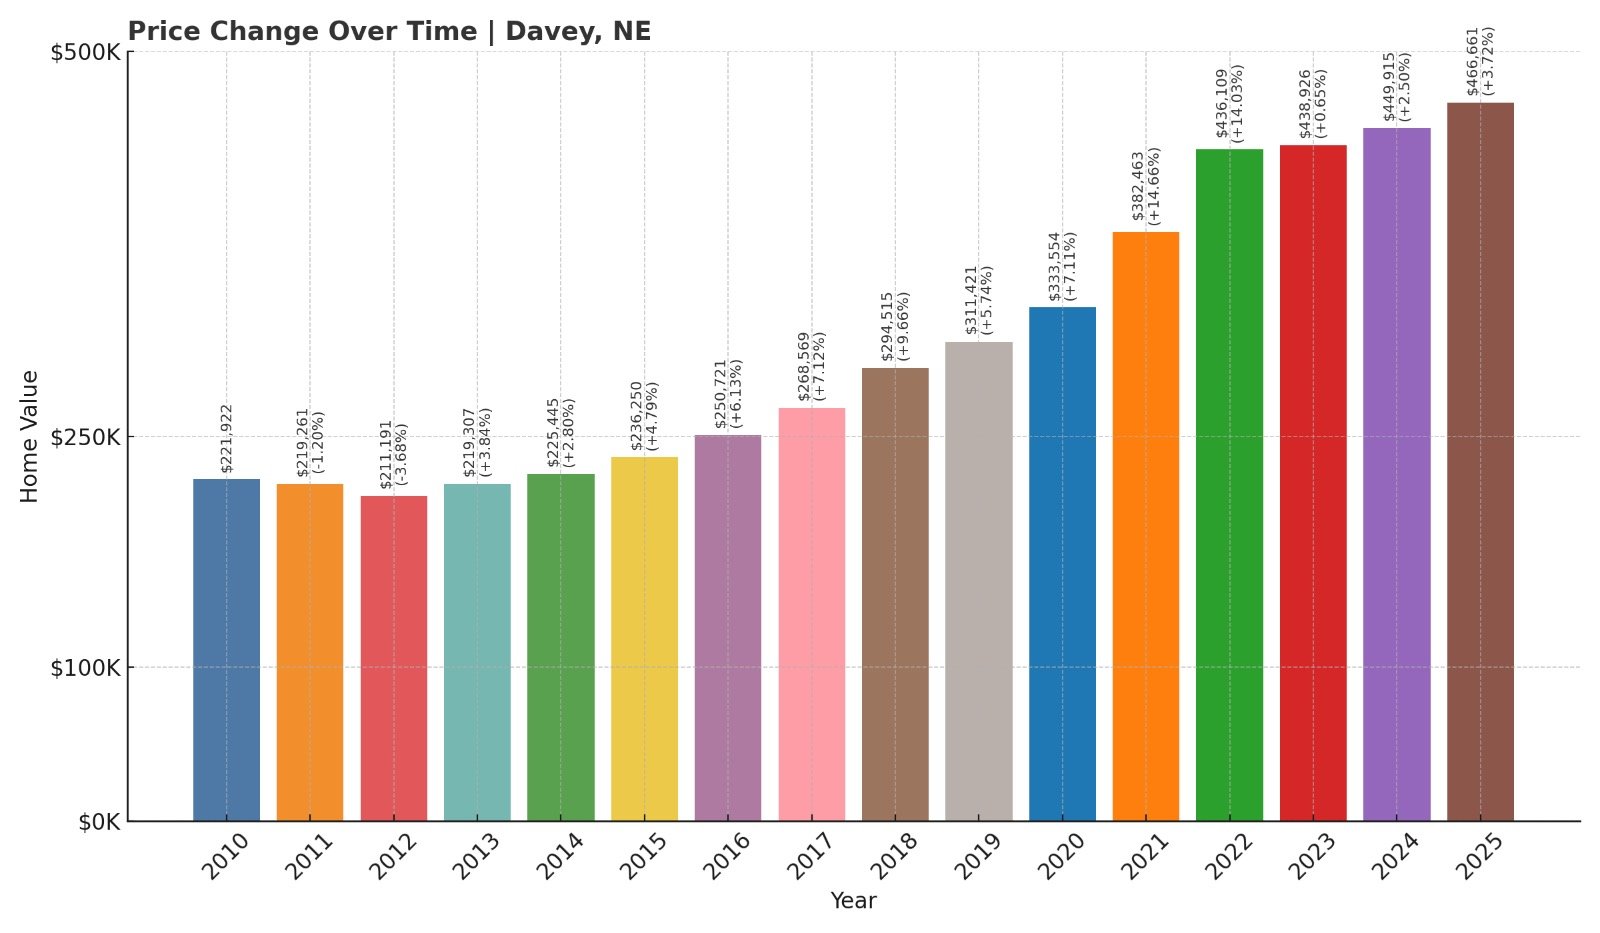
- 2010: $221,922
- 2011: $219,261 ($-2,661, -1.20% from previous year)
- 2012: $211,191 ($-8,069, -3.68% from previous year)
- 2013: $219,307 (+$8,116, +3.84% from previous year)
- 2014: $225,445 (+$6,138, +2.80% from previous year)
- 2015: $236,250 (+$10,805, +4.79% from previous year)
- 2016: $250,721 (+$14,471, +6.13% from previous year)
- 2017: $268,569 (+$17,848, +7.12% from previous year)
- 2018: $294,515 (+$25,946, +9.66% from previous year)
- 2019: $311,421 (+$16,906, +5.74% from previous year)
- 2020: $333,554 (+$22,133, +7.11% from previous year)
- 2021: $382,463 (+$48,909, +14.66% from previous year)
- 2022: $436,109 (+$53,646, +14.03% from previous year)
- 2023: $438,926 (+$2,817, +0.65% from previous year)
- 2024: $449,915 (+$10,988, +2.50% from previous year)
- 2025: $466,661 (+$16,747, +3.72% from previous year)
Davey’s median home value has increased by 110% since 2010, reaching $466,661 by 2025. After years of steady growth, prices soared in 2021 and 2022, adding over $100,000 in just two years. Though appreciation has cooled somewhat, prices remain on an upward path.
Davey – Rural Living Just Outside Lincoln

Davey is a small village in Lancaster County about 15 miles north of Lincoln, appealing to those who want peace and space without sacrificing urban access. The town has become especially attractive to remote workers and families looking for large lots and privacy. Despite its size, it has consistently delivered strong home value gains over the past decade.
Its affordability relative to nearby towns helped attract buyers during Nebraska’s housing boom years. With limited housing stock and very low turnover, each new sale contributes to elevated prices. Davey’s strong performance highlights the strength of demand in outer-Lincoln markets.
9. Pleasant Dale – 134% Home Price Increase Since June 2010
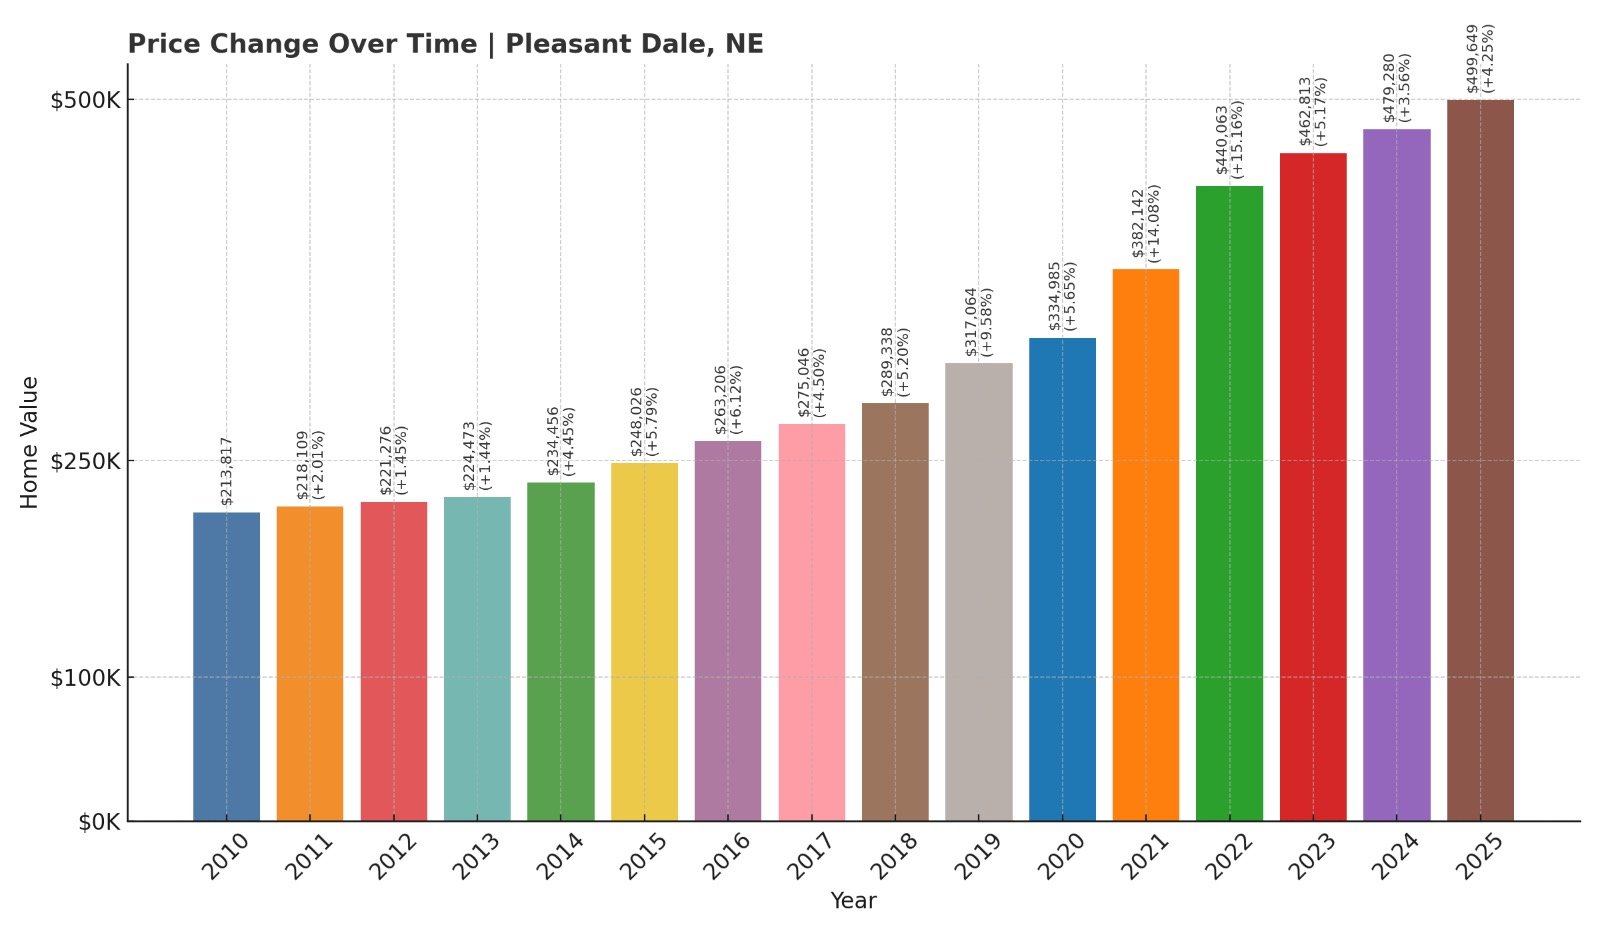
- 2010: $213,817
- 2011: $218,109 (+$4,292, +2.01% from previous year)
- 2012: $221,276 (+$3,167, +1.45% from previous year)
- 2013: $224,473 (+$3,197, +1.44% from previous year)
- 2014: $234,456 (+$9,983, +4.45% from previous year)
- 2015: $248,026 (+$13,570, +5.79% from previous year)
- 2016: $263,206 (+$15,180, +6.12% from previous year)
- 2017: $275,046 (+$11,840, +4.50% from previous year)
- 2018: $289,338 (+$14,291, +5.20% from previous year)
- 2019: $317,064 (+$27,726, +9.58% from previous year)
- 2020: $334,985 (+$17,921, +5.65% from previous year)
- 2021: $382,142 (+$47,157, +14.08% from previous year)
- 2022: $440,063 (+$57,921, +15.16% from previous year)
- 2023: $462,813 (+$22,750, +5.17% from previous year)
- 2024: $479,280 (+$16,467, +3.56% from previous year)
- 2025: $499,649 (+$20,369, +4.25% from previous year)
Pleasant Dale’s home values surged from $213,817 in 2010 to nearly $500,000 in 2025, representing a 134% increase. Values exploded between 2020 and 2022, when homes appreciated by over $100,000 in just two years. The town has continued to post steady increases since then.
Pleasant Dale – Quiet Growth in Seward County

Just off I-80 and a short drive west of Lincoln, Pleasant Dale offers a peaceful rural setting with an easy commute into the city. The area has become especially attractive to those seeking more space, newer homes, and a strong sense of community. High demand and low housing turnover have helped push prices upward year after year.
The town benefits from access to the Milford School District and proximity to recreation like Branched Oak Lake. With demand rising and land in short supply, prices have steadily grown despite the town’s small size. Pleasant Dale has emerged as one of the most in-demand outer suburbs near Lincoln.
8. Malcolm – 145% Home Price Increase Since June 2010
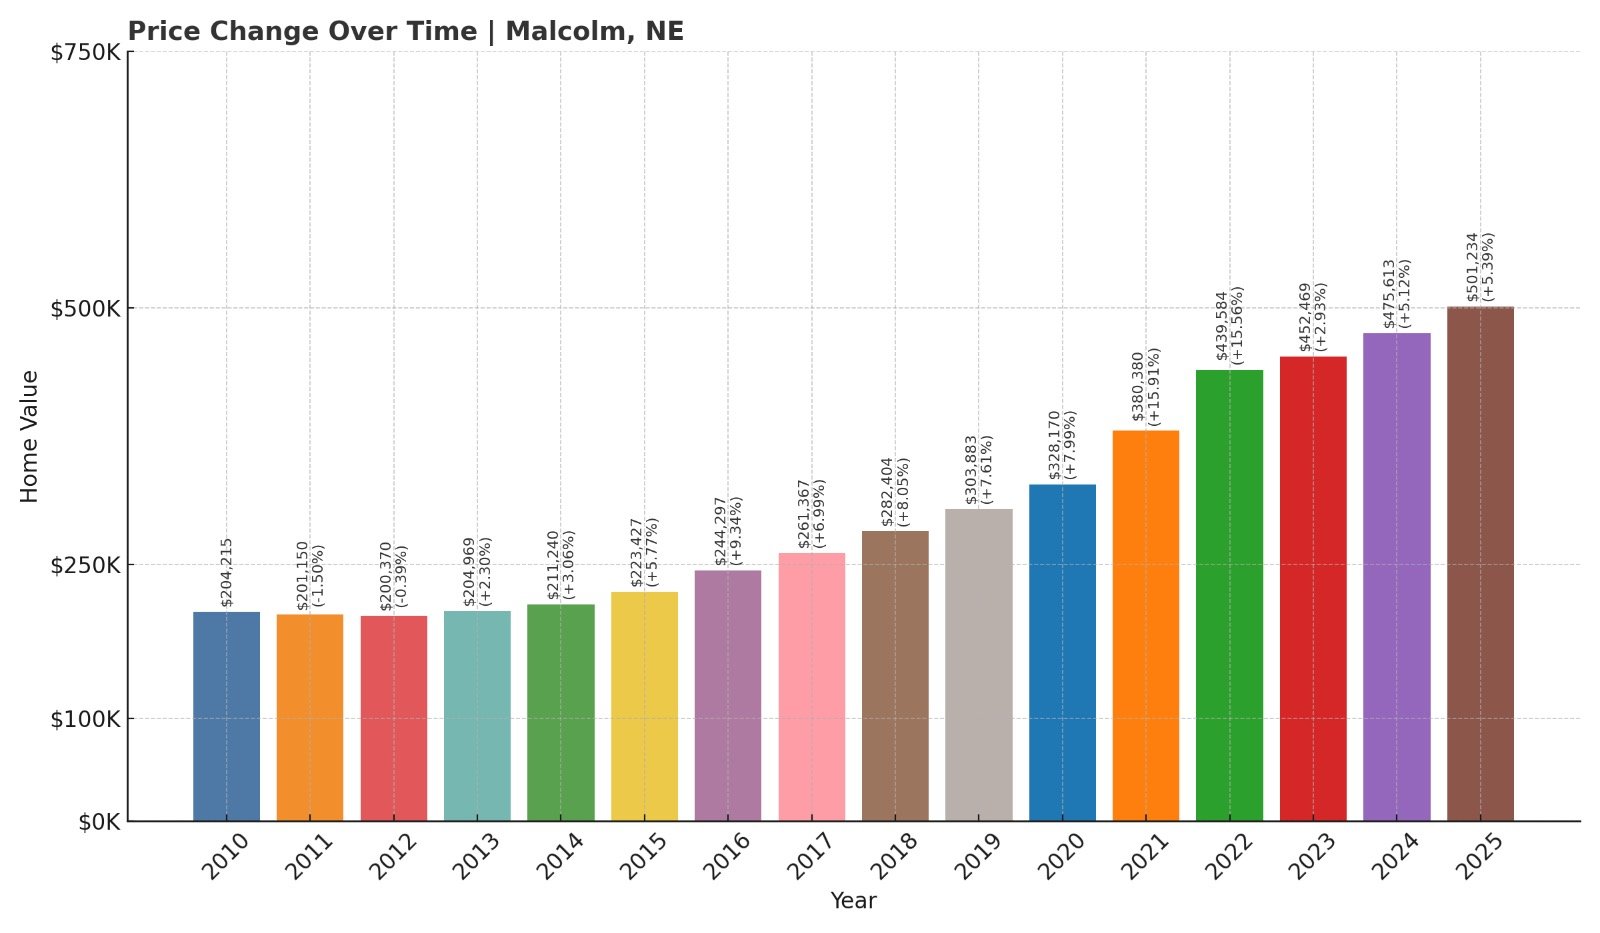
- 2010: $204,215
- 2011: $201,150 ($-3,065, -1.50% from previous year)
- 2012: $200,370 ($-781, -0.39% from previous year)
- 2013: $204,969 (+$4,600, +2.30% from previous year)
- 2014: $211,240 (+$6,271, +3.06% from previous year)
- 2015: $223,427 (+$12,187, +5.77% from previous year)
- 2016: $244,297 (+$20,870, +9.34% from previous year)
- 2017: $261,367 (+$17,070, +6.99% from previous year)
- 2018: $282,404 (+$21,037, +8.05% from previous year)
- 2019: $303,883 (+$21,479, +7.61% from previous year)
- 2020: $328,170 (+$24,287, +7.99% from previous year)
- 2021: $380,380 (+$52,210, +15.91% from previous year)
- 2022: $439,584 (+$59,203, +15.56% from previous year)
- 2023: $452,469 (+$12,885, +2.93% from previous year)
- 2024: $475,613 (+$23,144, +5.12% from previous year)
- 2025: $501,234 (+$25,621, +5.39% from previous year)
Malcolm’s housing market has surged 145% since 2010, with home values rising from $204,215 to $501,234 in 2025. The steepest increases occurred in 2021 and 2022, with gains exceeding $110,000 in those two years alone. Prices have continued to rise steadily, reaching over half a million this year.
Malcolm – High Demand Near Lincoln’s Northwest Edge

Malcolm is a small but growing village northwest of Lincoln, favored for its privacy, schools, and scenic location. The Norris School District and a strong sense of community have drawn families from the city into this quieter, more open setting. That demand has pushed home values higher despite the village’s limited size.
Malcolm’s proximity to Branched Oak Lake and outdoor recreation makes it especially attractive during warmer months. With land values increasing and construction remaining measured, home prices have surged. Buyers continue to view Malcolm as a top-tier option for a rural lifestyle within reach of Lincoln.
7. Valley – 103% Home Price Increase Since June 2010
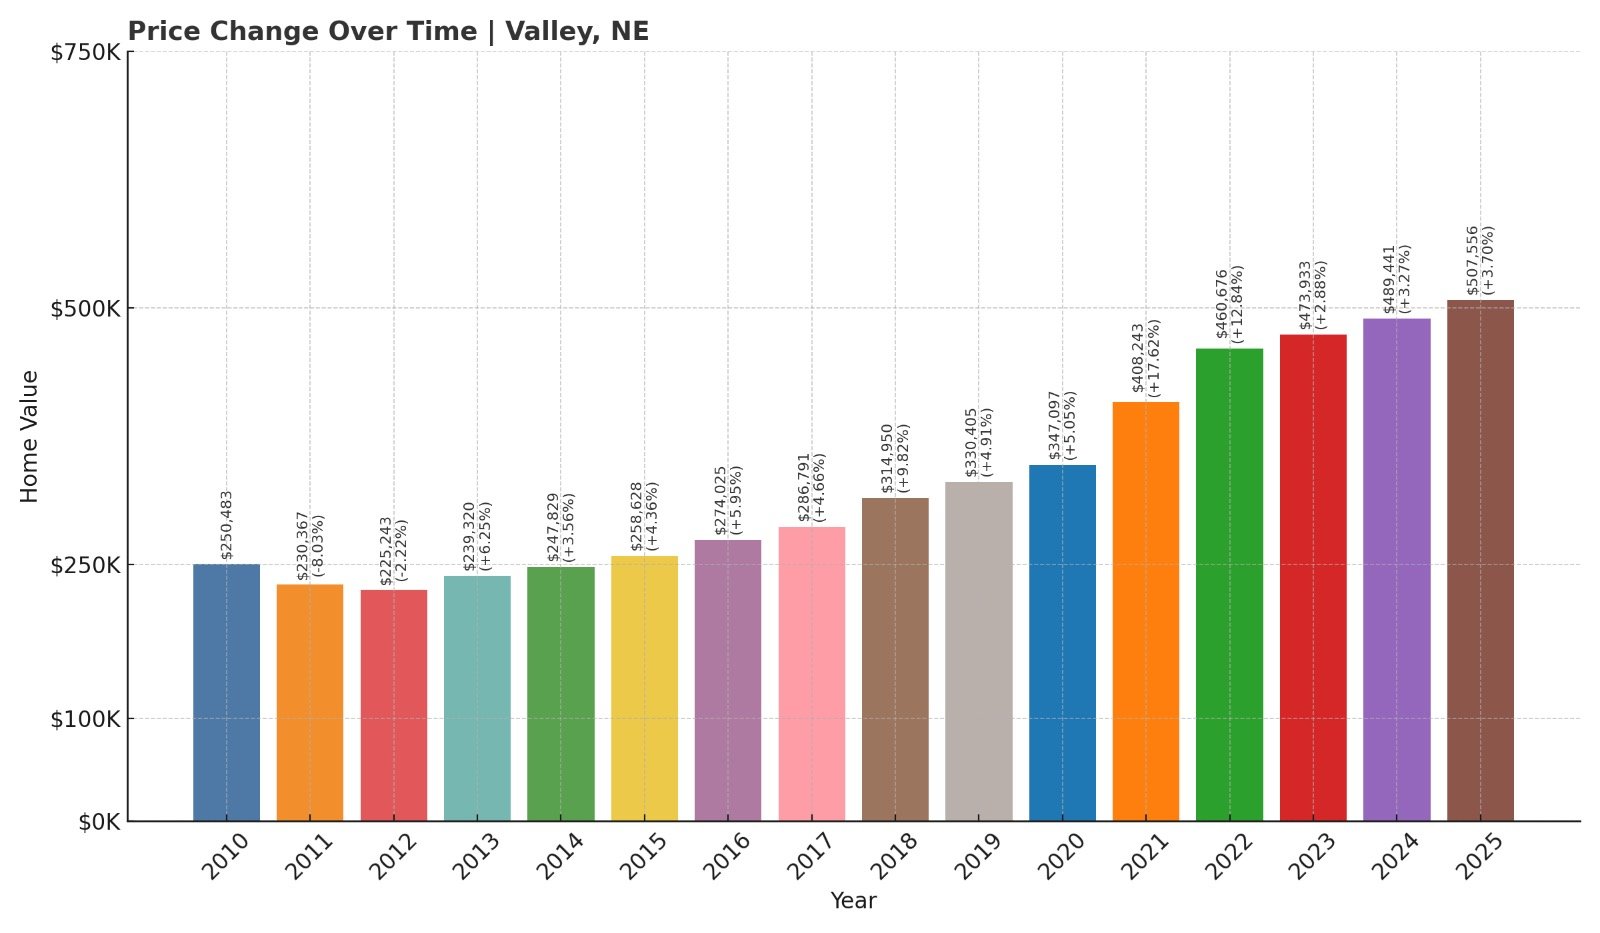
- 2010: $250,483
- 2011: $230,367 ($-20,116, -8.03% from previous year)
- 2012: $225,243 ($-5,124, -2.22% from previous year)
- 2013: $239,320 (+$14,077, +6.25% from previous year)
- 2014: $247,829 (+$8,509, +3.56% from previous year)
- 2015: $258,628 (+$10,799, +4.36% from previous year)
- 2016: $274,025 (+$15,396, +5.95% from previous year)
- 2017: $286,791 (+$12,766, +4.66% from previous year)
- 2018: $314,950 (+$28,159, +9.82% from previous year)
- 2019: $330,405 (+$15,455, +4.91% from previous year)
- 2020: $347,097 (+$16,692, +5.05% from previous year)
- 2021: $408,243 (+$61,146, +17.62% from previous year)
- 2022: $460,676 (+$52,433, +12.84% from previous year)
- 2023: $473,933 (+$13,257, +2.88% from previous year)
- 2024: $489,441 (+$15,508, +3.27% from previous year)
- 2025: $507,556 (+$18,115, +3.70% from previous year)
Valley’s home prices have risen from $250,483 in 2010 to $507,556 in 2025, a 103% gain. The strongest appreciation came after 2020, particularly in 2021 when home values jumped by over $60,000. That momentum has continued, with steady gains through 2025.
Valley – Riverfront Living With Metro Access

Valley is located northwest of Omaha along the Elkhorn River, offering both natural beauty and suburban convenience. Its lakeside communities and newer housing developments have attracted professionals and retirees looking for waterfront property. That demand has kept real estate prices high and rising.
The town also benefits from being near Fremont and Elkhorn, providing a broader job base and easy access to shopping and dining. With limited riverfront inventory and increased buyer interest, prices have surged across the board. Valley is now one of the most desirable—and expensive—places to live in the Omaha area.
6. Martell – 139% Home Price Increase Since June 2010
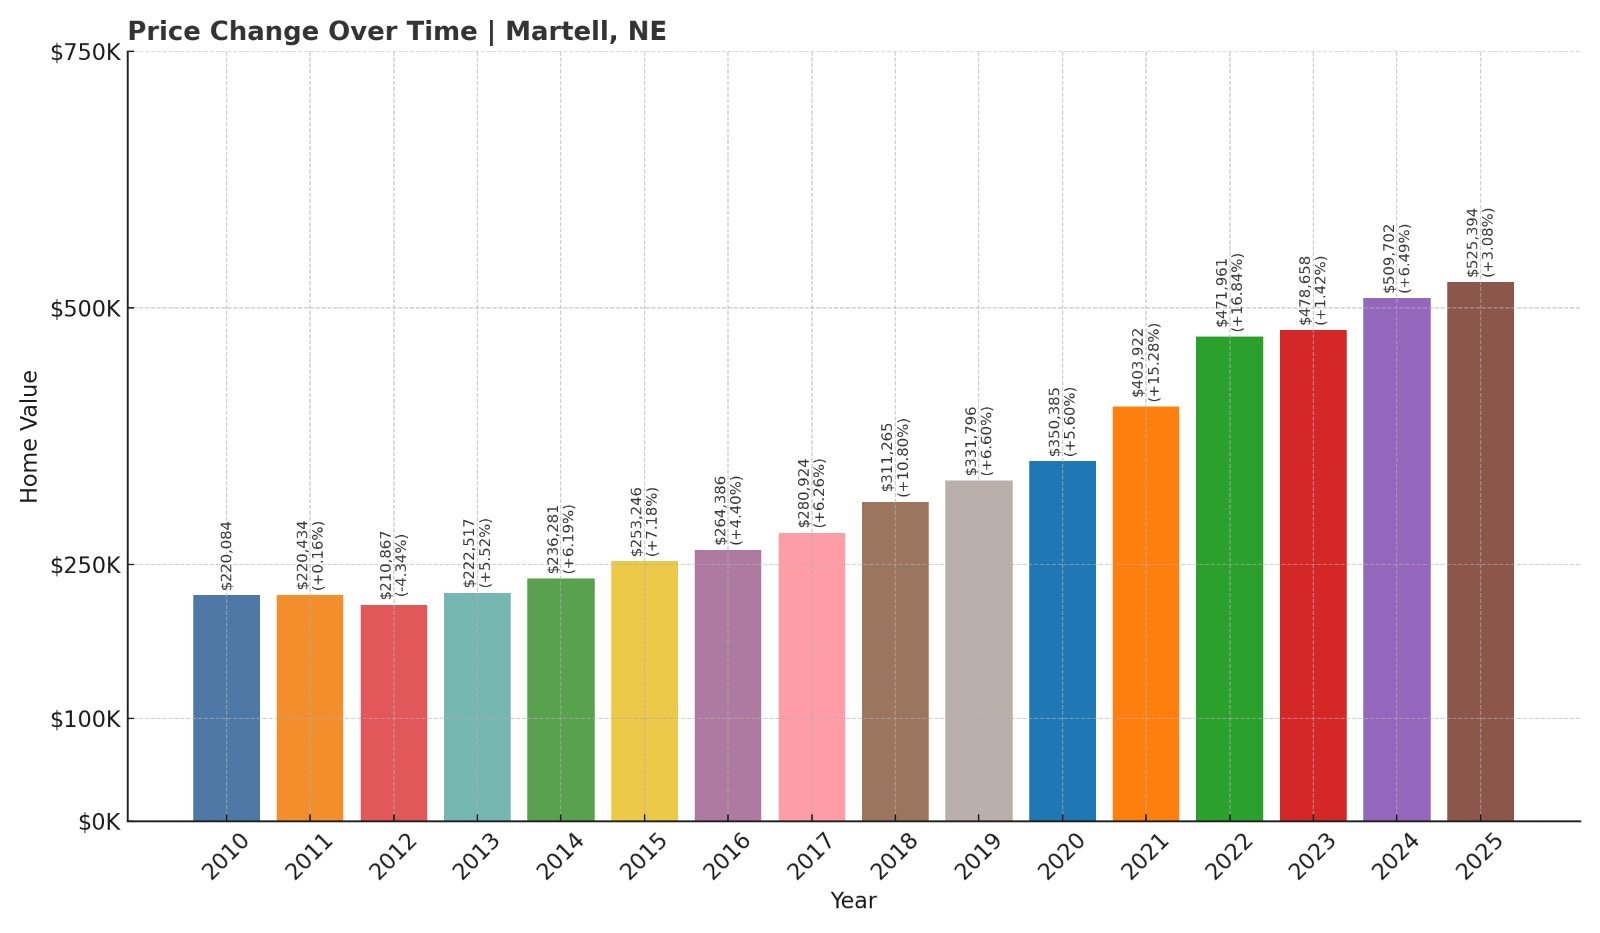
- 2010: $220,084
- 2011: $220,434 (+$350, +0.16% from previous year)
- 2012: $210,867 ($-9,567, -4.34% from previous year)
- 2013: $222,517 (+$11,650, +5.52% from previous year)
- 2014: $236,281 (+$13,764, +6.19% from previous year)
- 2015: $253,246 (+$16,965, +7.18% from previous year)
- 2016: $264,386 (+$11,140, +4.40% from previous year)
- 2017: $280,924 (+$16,538, +6.26% from previous year)
- 2018: $311,265 (+$30,341, +10.80% from previous year)
- 2019: $331,796 (+$20,531, +6.60% from previous year)
- 2020: $350,385 (+$18,589, +5.60% from previous year)
- 2021: $403,922 (+$53,537, +15.28% from previous year)
- 2022: $471,961 (+$68,039, +16.84% from previous year)
- 2023: $478,658 (+$6,698, +1.42% from previous year)
- 2024: $509,702 (+$31,043, +6.49% from previous year)
- 2025: $525,394 (+$15,693, +3.08% from previous year)
Home values in Martell have climbed from $220,084 in 2010 to $525,394 in 2025—a 139% gain. The town experienced sharp increases in the early 2020s, with prices jumping more than $120,000 from 2020 to 2022 alone. Although growth slowed slightly afterward, the market has stayed strong through 2025.
Martell – Quiet Rural Growth With Big Price Gains
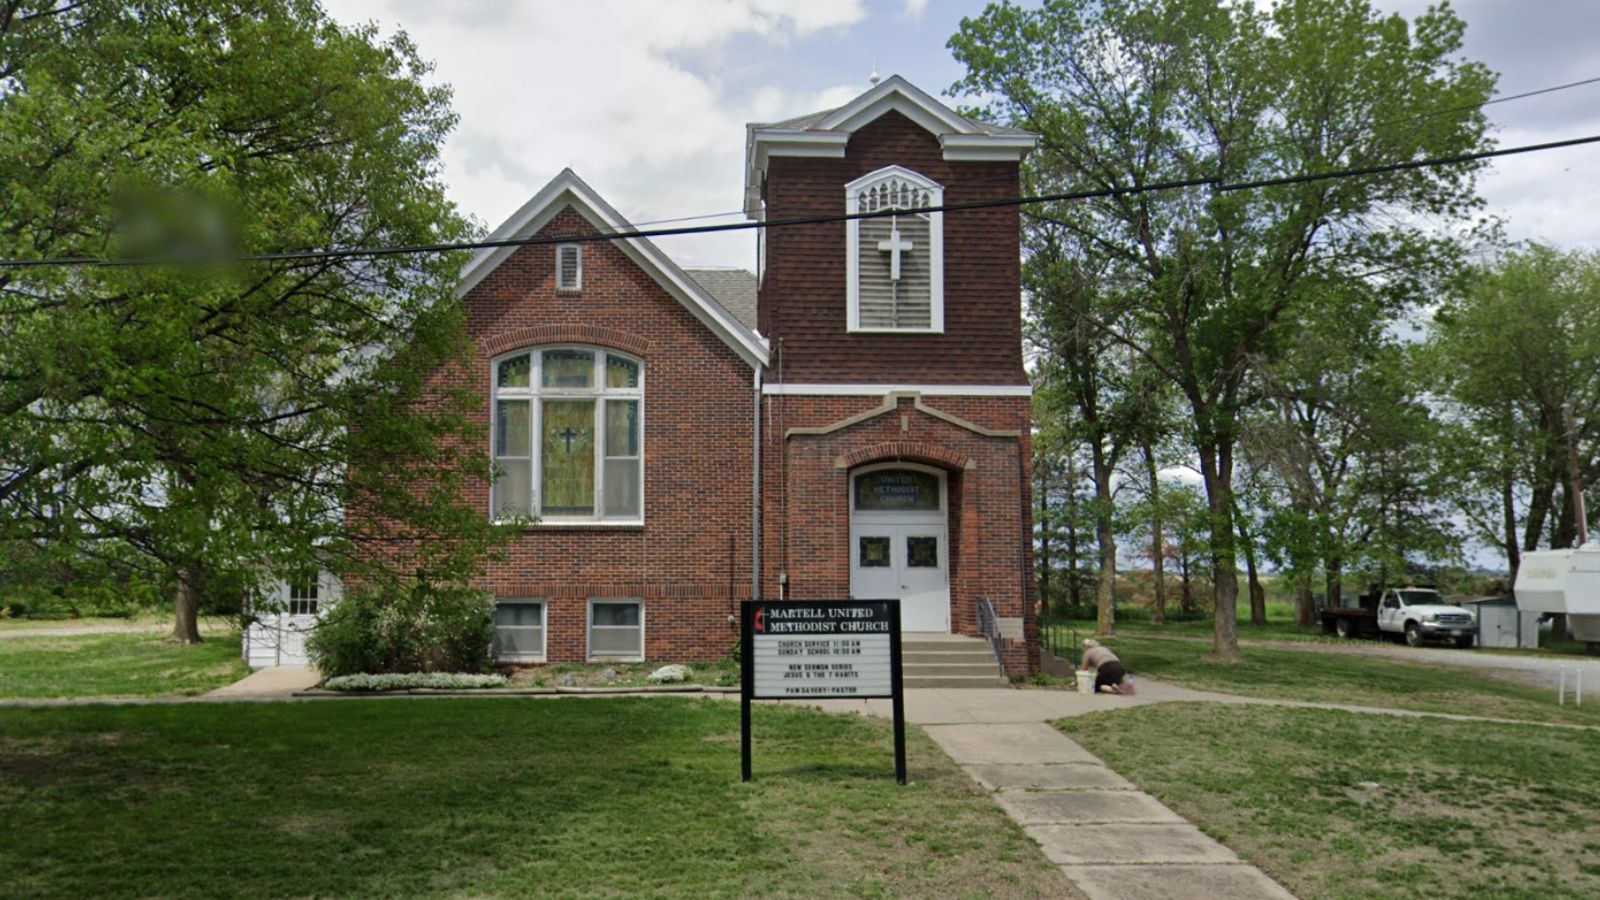
Martell, located southwest of Lincoln in Lancaster County, offers spacious rural living within reasonable commuting distance to the city. This balance of privacy and access has attracted a wave of homeowners looking for affordable acreage and small-town calm. Over the past decade, that demand has steadily translated into major home price growth.
Limited housing supply and desirable proximity to both Lincoln and recreational areas like Bluestem Lake have kept pressure on home values. The spike in values in 2021 and 2022 aligns with rising demand for space during the pandemic era. While Martell may be small, its housing market has clearly outperformed much of the state.
5. Fort Calhoun – 123% Home Price Increase Since June 2010
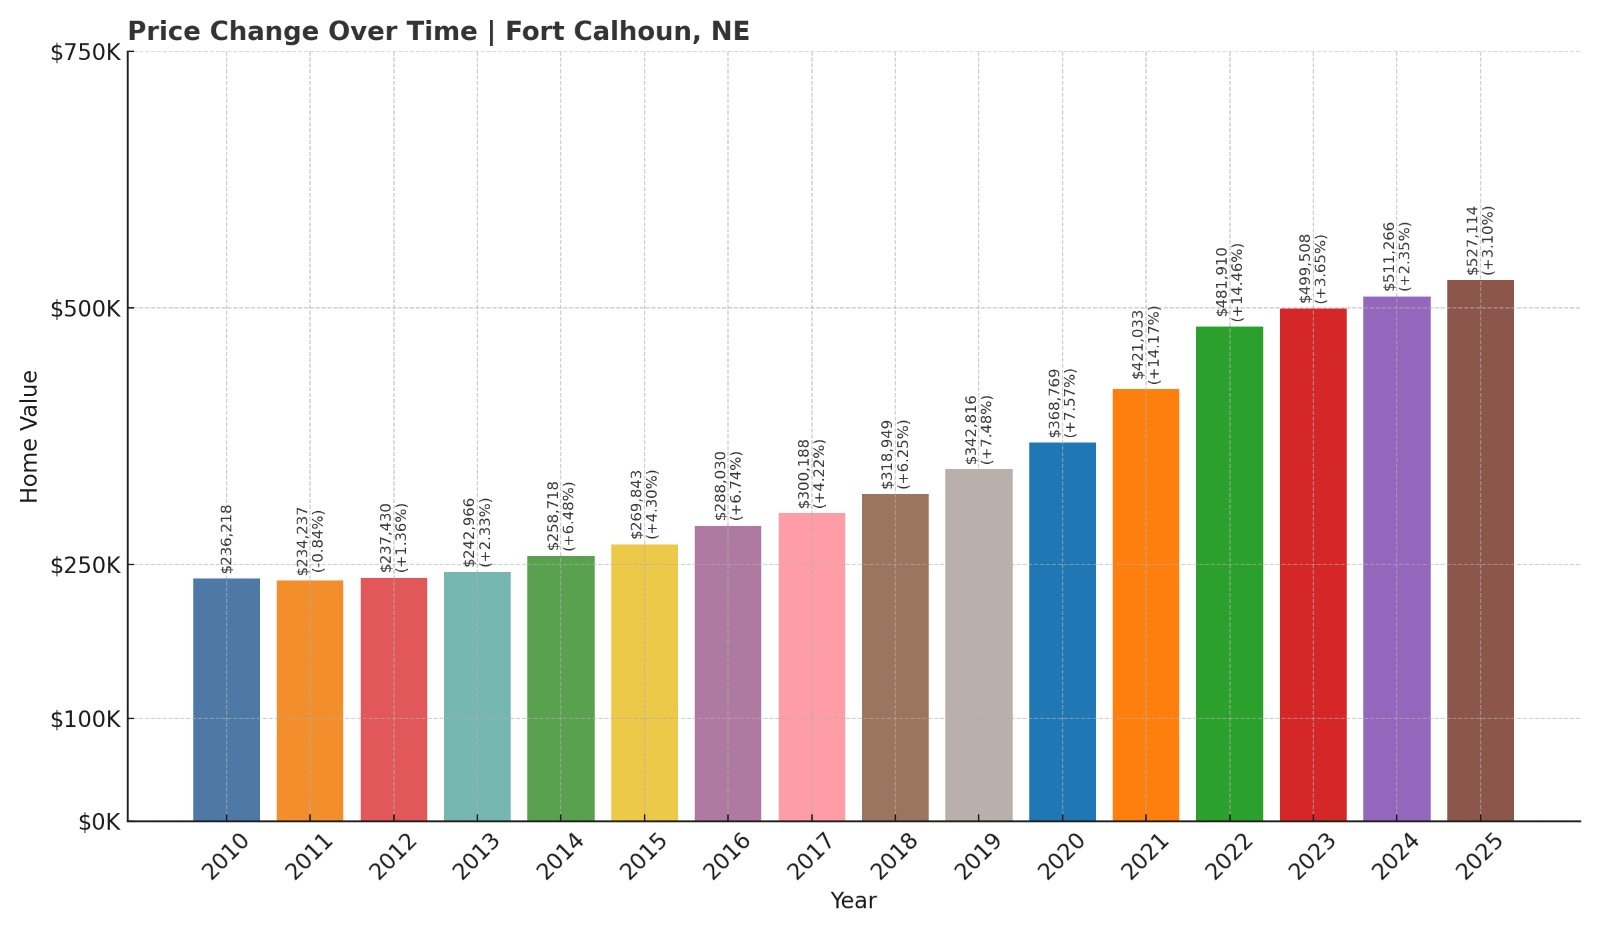
- 2010: $236,218
- 2011: $234,237 ($-1,980, -0.84% from previous year)
- 2012: $237,430 (+$3,193, +1.36% from previous year)
- 2013: $242,966 (+$5,535, +2.33% from previous year)
- 2014: $258,718 (+$15,752, +6.48% from previous year)
- 2015: $269,843 (+$11,125, +4.30% from previous year)
- 2016: $288,030 (+$18,187, +6.74% from previous year)
- 2017: $300,188 (+$12,158, +4.22% from previous year)
- 2018: $318,949 (+$18,760, +6.25% from previous year)
- 2019: $342,816 (+$23,868, +7.48% from previous year)
- 2020: $368,769 (+$25,952, +7.57% from previous year)
- 2021: $421,033 (+$52,265, +14.17% from previous year)
- 2022: $481,910 (+$60,877, +14.46% from previous year)
- 2023: $499,508 (+$17,598, +3.65% from previous year)
- 2024: $511,266 (+$11,759, +2.35% from previous year)
- 2025: $527,114 (+$15,848, +3.10% from previous year)
Fort Calhoun’s home prices have risen 123% over the last 15 years, with median values increasing from $236,218 to $527,114. A major spike occurred between 2020 and 2022, when home values surged by nearly $113,000. The market has remained strong since, with year-over-year increases continuing through 2025.
Fort Calhoun – Historic Roots With Modern Price Appeal

Just north of Omaha along the Missouri River, Fort Calhoun blends historical significance with modern small-town living. Known for being the oldest city in Nebraska, its colonial charm and strategic location have made it an increasingly sought-after place to live. The area’s appeal has only grown as suburban expansion has pushed northward.
Recent years have seen increased construction, new amenities, and infrastructure upgrades that have further supported rising home values. Its school system and access to nature reserves like Boyer Chute have also contributed to buyer interest. Even with modest population size, Fort Calhoun has become one of the pricier housing markets in the state.
4. Raymond – 124% Home Price Increase Since June 2010
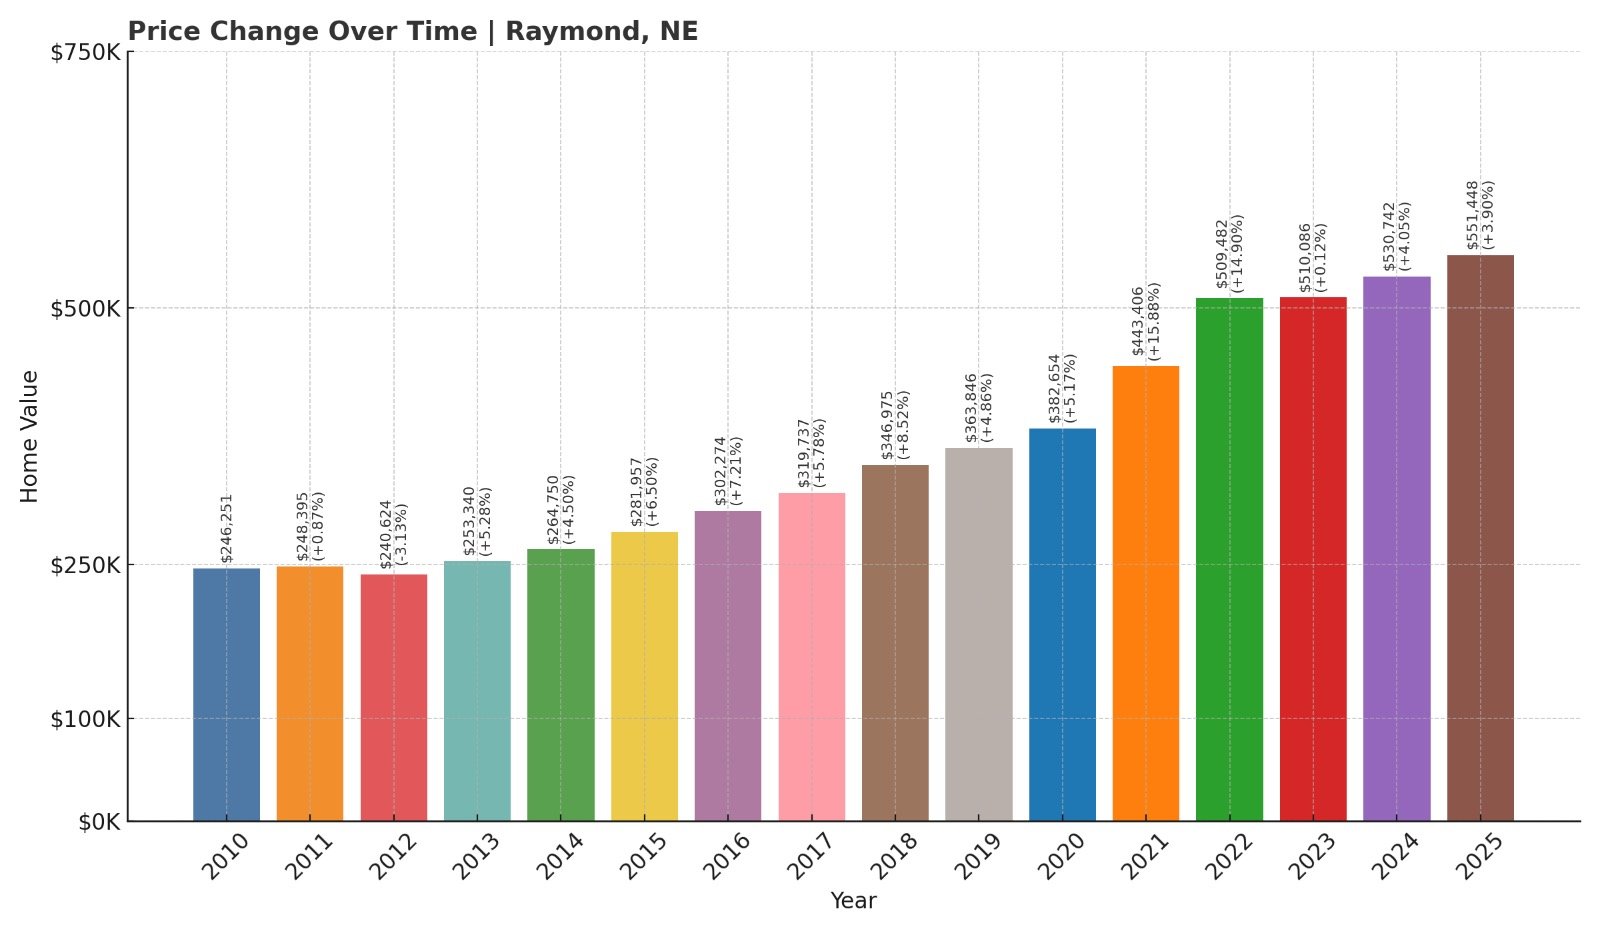
- 2010: $246,251
- 2011: $248,395 (+$2,144, +0.87% from previous year)
- 2012: $240,624 ($-7,771, -3.13% from previous year)
- 2013: $253,340 (+$12,716, +5.28% from previous year)
- 2014: $264,750 (+$11,410, +4.50% from previous year)
- 2015: $281,957 (+$17,207, +6.50% from previous year)
- 2016: $302,274 (+$20,317, +7.21% from previous year)
- 2017: $319,737 (+$17,464, +5.78% from previous year)
- 2018: $346,975 (+$27,238, +8.52% from previous year)
- 2019: $363,846 (+$16,871, +4.86% from previous year)
- 2020: $382,654 (+$18,808, +5.17% from previous year)
- 2021: $443,406 (+$60,752, +15.88% from previous year)
- 2022: $509,482 (+$66,076, +14.90% from previous year)
- 2023: $510,086 (+$603, +0.12% from previous year)
- 2024: $530,742 (+$20,656, +4.05% from previous year)
- 2025: $551,448 (+$20,707, +3.90% from previous year)
Raymond’s housing market has grown 124% since 2010, moving from $246,251 to $551,448 by 2025. The biggest growth years came in 2021 and 2022, when prices jumped by more than $126,000. Even after a slowdown in 2023, the market rebounded with healthy gains.
Raymond – Small Town, Big Value Growth

Located northwest of Lincoln, Raymond is known for its rural character, good schools, and appealing proximity to Branched Oak Lake. It’s a magnet for buyers who want a tranquil lifestyle with access to city conveniences. Its limited housing stock has helped keep prices climbing steadily.
Raymond’s significant appreciation during the early 2020s reflects broader trends favoring rural and semi-rural communities. The town’s setting, amenities, and location within a reasonable drive of Lincoln continue to draw buyers. This combination has made it one of the top-performing housing markets in Nebraska.
3. Roca – 111% Home Price Increase Since June 2010
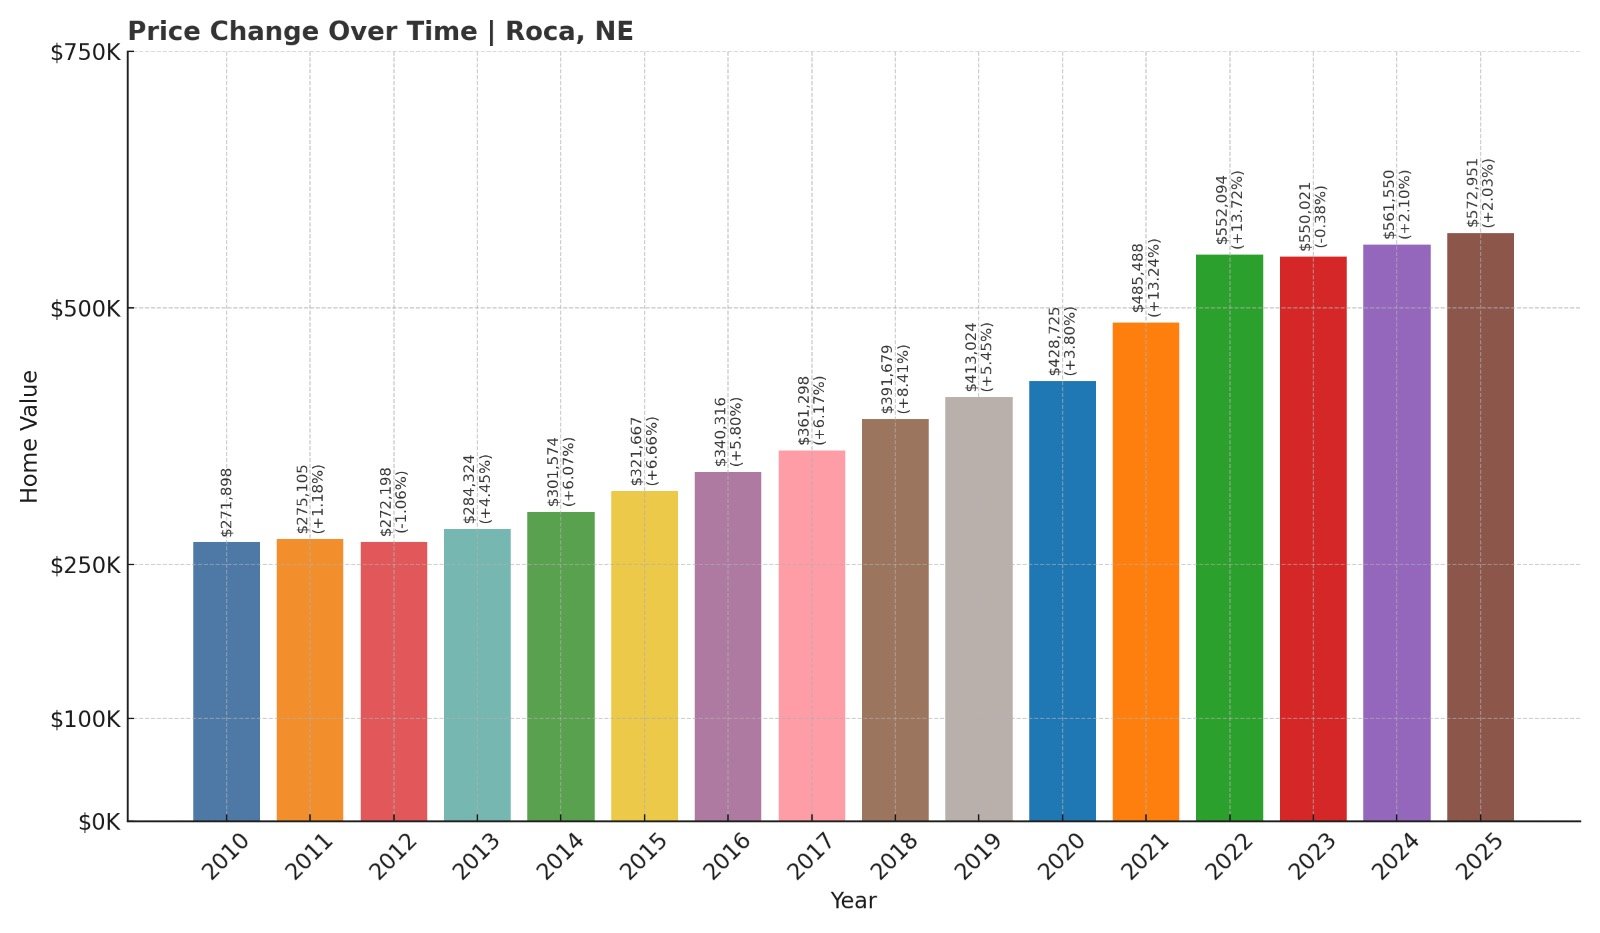
- 2010: $271,898
- 2011: $275,105 (+$3,207, +1.18% from previous year)
- 2012: $272,198 ($-2,907, -1.06% from previous year)
- 2013: $284,324 (+$12,126, +4.45% from previous year)
- 2014: $301,574 (+$17,250, +6.07% from previous year)
- 2015: $321,667 (+$20,093, +6.66% from previous year)
- 2016: $340,316 (+$18,649, +5.80% from previous year)
- 2017: $361,298 (+$20,982, +6.17% from previous year)
- 2018: $391,679 (+$30,381, +8.41% from previous year)
- 2019: $413,024 (+$21,345, +5.45% from previous year)
- 2020: $428,725 (+$15,701, +3.80% from previous year)
- 2021: $485,488 (+$56,763, +13.24% from previous year)
- 2022: $552,094 (+$66,606, +13.72% from previous year)
- 2023: $550,021 ($-2,073, -0.38% from previous year)
- 2024: $561,550 (+$11,529, +2.10% from previous year)
- 2025: $572,951 (+$11,402, +2.03% from previous year)
Home prices in Roca have increased by 111% since 2010, rising from $271,898 to $572,951 by mid-2025. The market peaked during 2021 and 2022 with strong double-digit gains but showed signs of cooling slightly afterward. Still, growth has remained steady in the last two years.
Roca – Upscale Rural Living South of Lincoln

Roca has grown into one of Nebraska’s most upscale rural areas, attracting buyers seeking large lots, new custom homes, and quiet surroundings just minutes south of Lincoln. The town’s rural charm combined with increasing development has steadily pushed prices upward. As a result, Roca has become a magnet for luxury homebuilding and higher-income households.
Strong appreciation from 2020 through 2022 helped elevate Roca into the top three most expensive towns in the state. Though growth slowed slightly in 2023, prices rebounded by 2025. With its reputation for spacious properties and high-end construction, Roca continues to command premium prices in the region.
2. Denton – 139% Home Price Increase Since June 2010
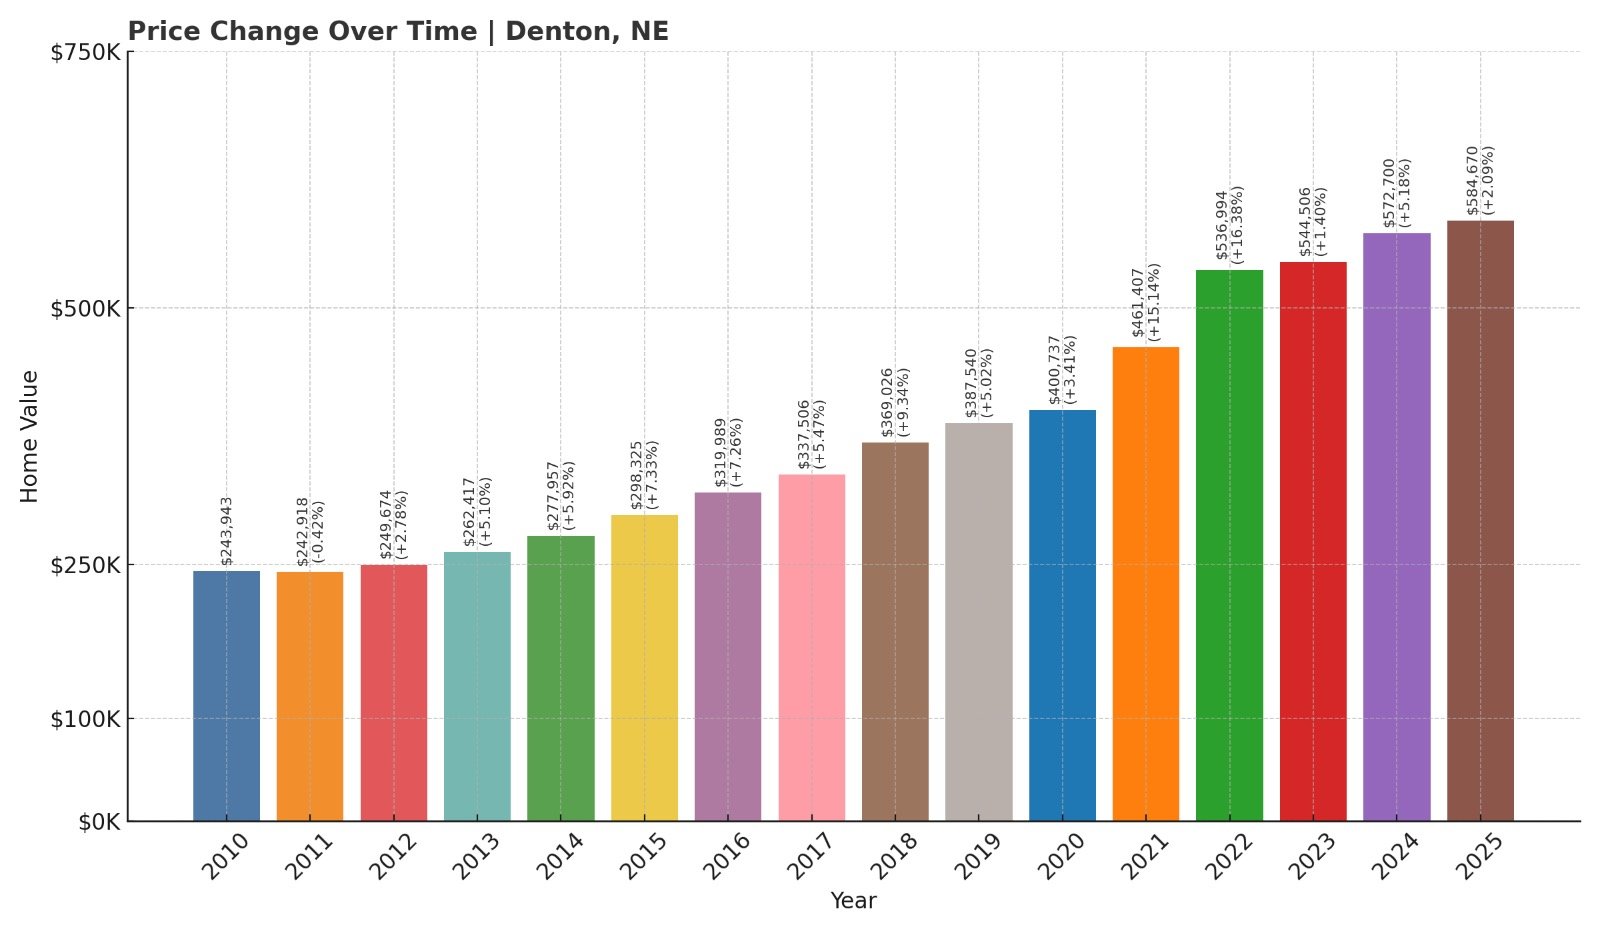
- 2010: $243,943
- 2011: $242,918 ($-1,025, -0.42% from previous year)
- 2012: $249,674 (+$6,755, +2.78% from previous year)
- 2013: $262,417 (+$12,743, +5.10% from previous year)
- 2014: $277,957 (+$15,540, +5.92% from previous year)
- 2015: $298,325 (+$20,368, +7.33% from previous year)
- 2016: $319,989 (+$21,664, +7.26% from previous year)
- 2017: $337,506 (+$17,517, +5.47% from previous year)
- 2018: $369,026 (+$31,520, +9.34% from previous year)
- 2019: $387,540 (+$18,514, +5.02% from previous year)
- 2020: $400,737 (+$13,197, +3.41% from previous year)
- 2021: $461,407 (+$60,670, +15.14% from previous year)
- 2022: $536,994 (+$75,587, +16.38% from previous year)
- 2023: $544,506 (+$7,513, +1.40% from previous year)
- 2024: $572,700 (+$28,194, +5.18% from previous year)
- 2025: $584,670 (+$11,970, +2.09% from previous year)
Denton’s home values have surged by 139% since 2010, increasing from $243,943 to $584,670 by 2025. The most dramatic jump came between 2020 and 2022, when home prices grew by more than $136,000. While recent years show slower growth, the market remains strong and rising.
Denton – Big Price Gains Just Outside Lincoln

Located west of Lincoln, Denton has emerged as a top-tier location for buyers seeking large homes and open land. The town’s steady development and proximity to the city have fueled rapid appreciation. Prices more than doubled in just over a decade, reflecting surging demand for suburban acreage near the capital.
Denton’s explosive growth in 2021 and 2022 came during a period of strong migration and rising interest in low-density neighborhoods. Even as appreciation slowed afterward, the housing market has stayed solid with respectable annual gains. Denton now ranks second statewide for median home prices and total growth.
1. Walton – 82% Home Price Increase Since June 2010
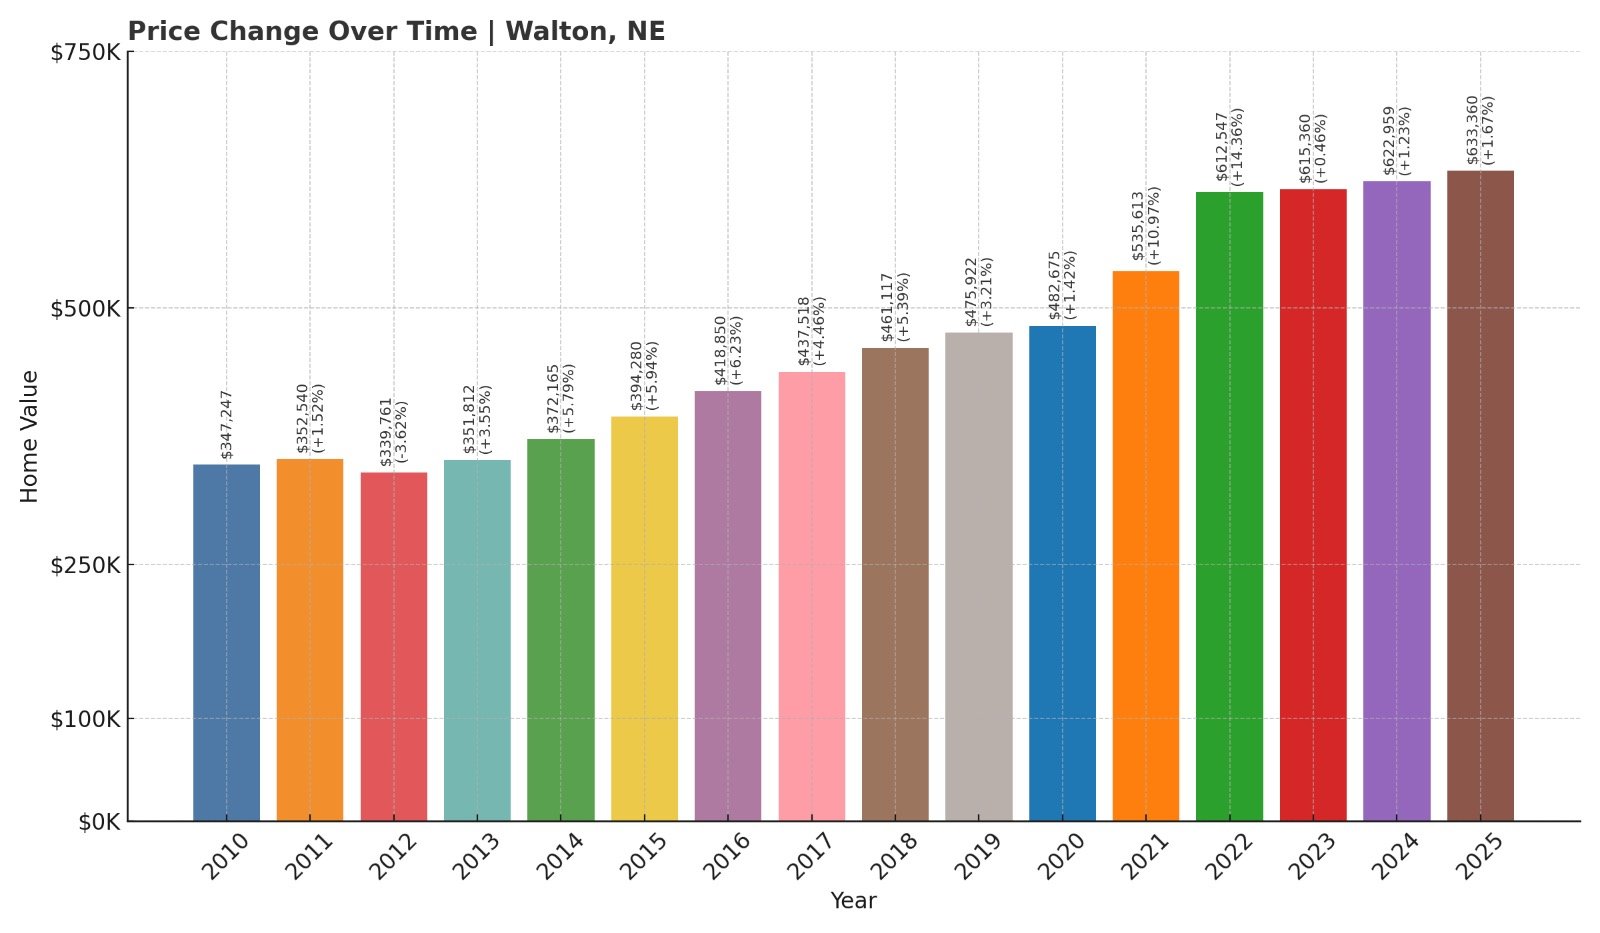
- 2010: $347,247
- 2011: $352,540 (+$5,294, +1.52% from previous year)
- 2012: $339,761 ($-12,779, -3.62% from previous year)
- 2013: $351,812 (+$12,051, +3.55% from previous year)
- 2014: $372,165 (+$20,353, +5.79% from previous year)
- 2015: $394,280 (+$22,115, +5.94% from previous year)
- 2016: $418,850 (+$24,570, +6.23% from previous year)
- 2017: $437,518 (+$18,668, +4.46% from previous year)
- 2018: $461,117 (+$23,599, +5.39% from previous year)
- 2019: $475,922 (+$14,805, +3.21% from previous year)
- 2020: $482,675 (+$6,753, +1.42% from previous year)
- 2021: $535,613 (+$52,938, +10.97% from previous year)
- 2022: $612,547 (+$76,934, +14.36% from previous year)
- 2023: $615,360 (+$2,813, +0.46% from previous year)
- 2024: $622,959 (+$7,600, +1.24% from previous year)
- 2025: $633,360 (+$10,401, +1.67% from previous year)
Walton tops the list for most expensive towns in Nebraska, with a 2025 median home price of $633,360. Although its long-term growth of 82% is lower than some others on this list, its price level remains unmatched. Annual gains have remained modest but consistent since 2022.
Walton – Nebraska’s Most Expensive Market
Walton, located southeast of Lincoln, is known for its exclusivity, large custom homes, and scenic surroundings. With high land values and a small housing inventory, it has consistently ranked at the top of Nebraska’s price charts. Buyers here are typically seeking premium properties with few compromises.
The area saw its biggest jump between 2020 and 2022, mirroring state and national trends of surging demand. While its growth rate has since moderated, Walton’s price level has remained elevated, reflecting its elite status in the Nebraska housing market. It’s the town where luxury and land intersect at the highest price point in the state.