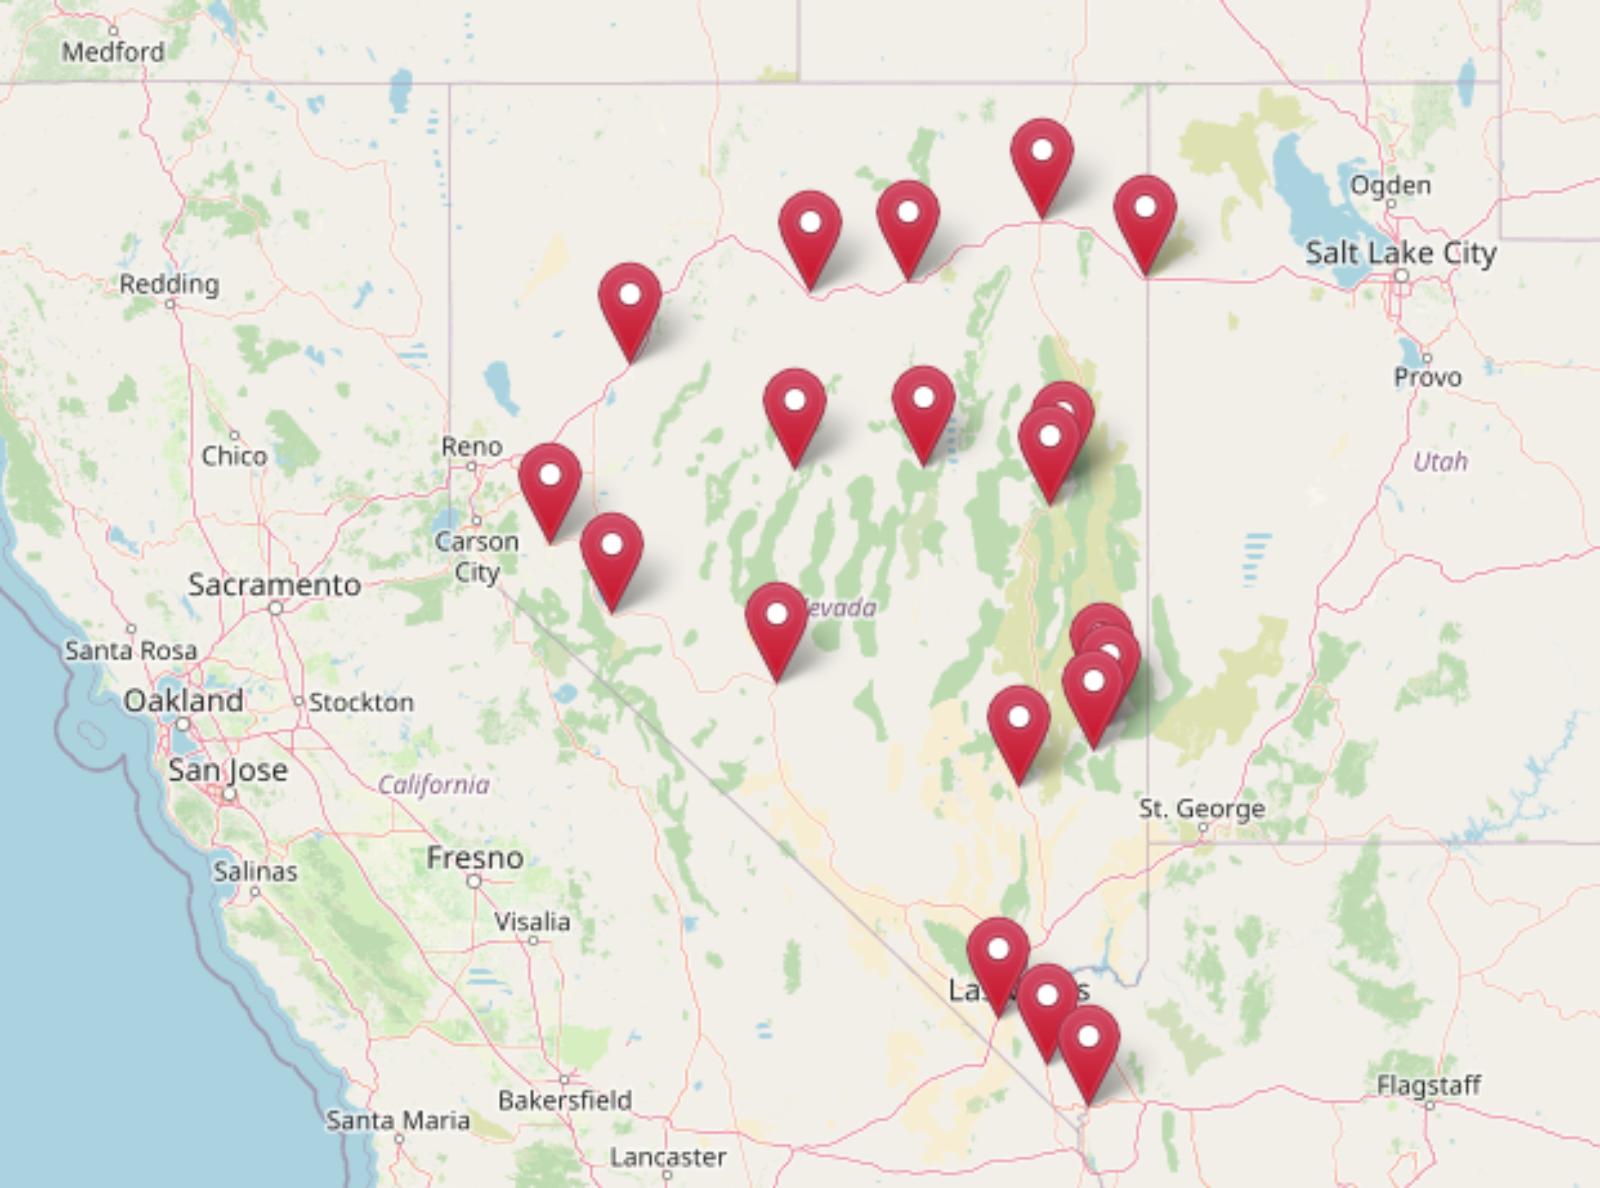
According to the latest Zillow Home Value Index, Nevada still has places where you can buy a home without maxing out your budget. In May 2025, 19 towns across the state stand out for keeping prices low—even as Las Vegas and Reno continue to surge. These spots may not have flashy skylines, but they offer something just as valuable: affordable real estate in a state where that’s getting harder to find. With 15 years of price trends and local insights, this list digs into where your money goes further—and why these towns might be Nevada’s best-kept housing secrets.
19. Yerington – 185.8% Home Price Increase Since 2011
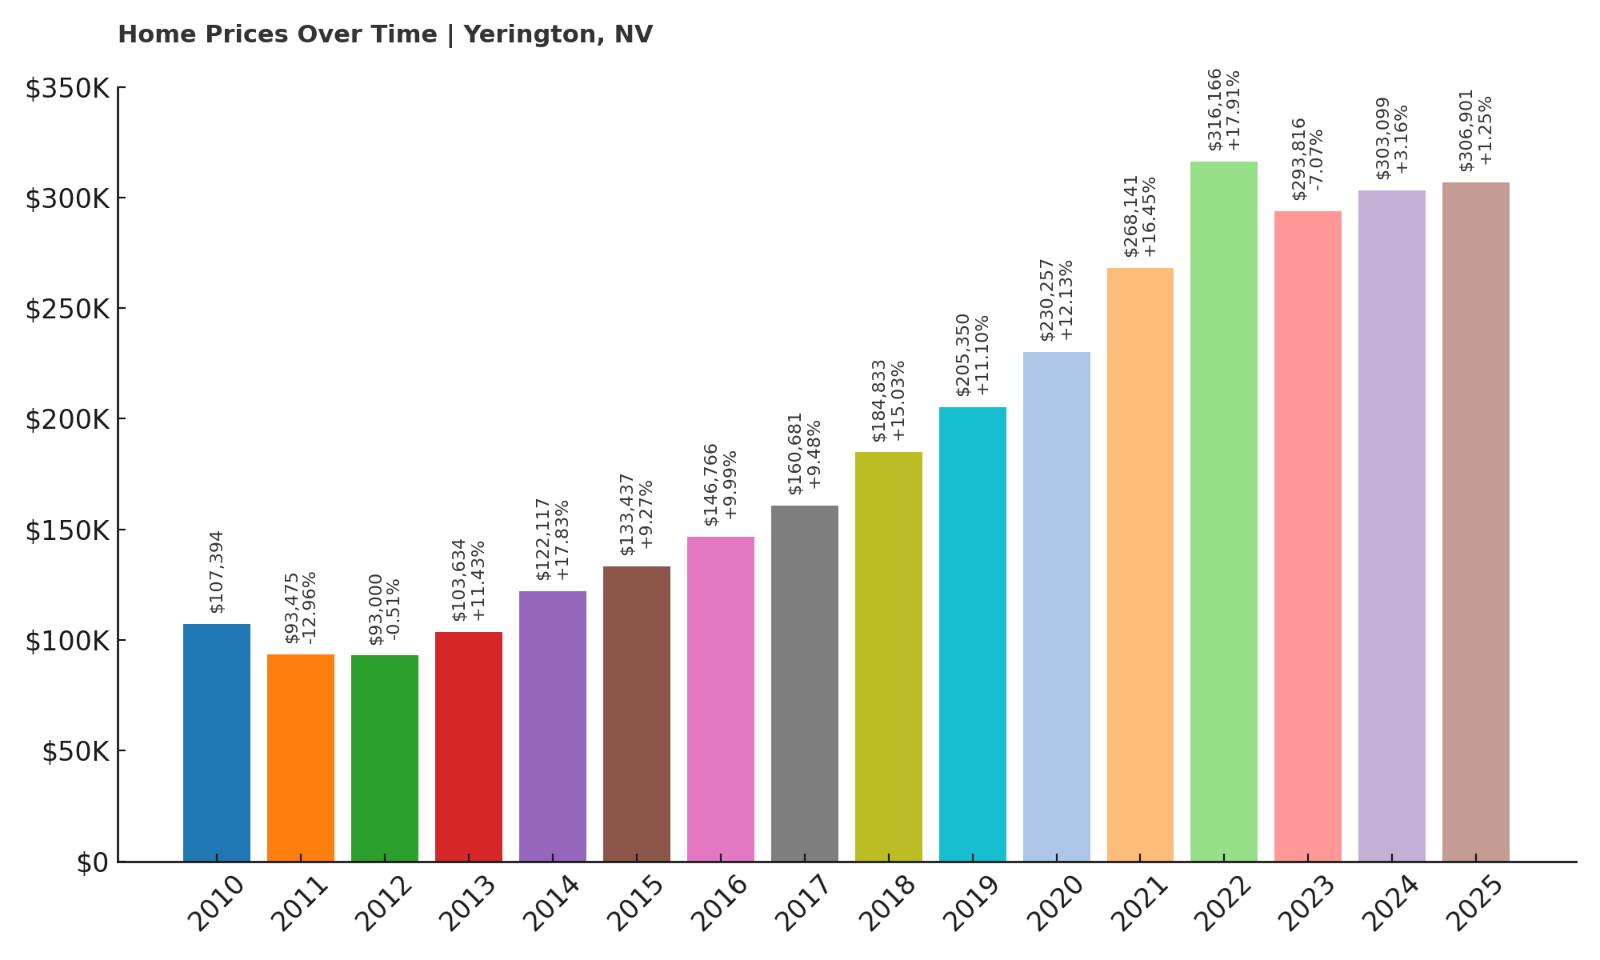
- 2010: $107,394
- 2011: $93,475 (-$13,919, -12.96% from previous year)
- 2012: $93,000 (-$475, -0.51% from previous year)
- 2013: $103,634 (+$10,634, +11.43% from previous year)
- 2014: $122,117 (+$18,483, +17.83% from previous year)
- 2015: $133,437 (+$11,320, +9.27% from previous year)
- 2016: $146,766 (+$13,329, +9.99% from previous year)
- 2017: $160,681 (+$13,915, +9.48% from previous year)
- 2018: $184,833 (+$24,152, +15.03% from previous year)
- 2019: $205,350 (+$20,517, +11.10% from previous year)
- 2020: $230,257 (+$24,907, +12.13% from previous year)
- 2021: $268,141 (+$37,884, +16.45% from previous year)
- 2022: $316,166 (+$48,024, +17.91% from previous year)
- 2023: $293,816 (-$22,350, -7.07% from previous year)
- 2024: $303,099 (+$9,283, +3.16% from previous year)
- 2025: $306,901 (+$3,801, +1.25% from previous year)
Yerington’s home prices have nearly tripled since 2011, with a total increase of over 185%. After a modest decline in 2023, prices bounced back slightly and currently sit at just over $306,000. The consistent annual growth from 2013 through 2022 reflects steady demand and likely an increase in local amenities or employment opportunities driving buyer interest.
In order to come up with the very specific design ideas, we create most designs with the assistance of state-of-the-art AI interior design software. Also, assume links that take you off the site are affiliate links such as links to Amazon. this means we may earn a commission if you buy something.
Yerington – A Quiet Escape With Rising Appeal

Located in Lyon County, Yerington sits in the Mason Valley, surrounded by farmland and open skies. Its rural setting makes it ideal for buyers seeking peace and space without the costs associated with more urbanized areas. As of 2025, the town’s home prices remain relatively low by state standards, even after years of appreciation.
Yerington benefits from proximity to U.S. Route 95A and modest tourism linked to agriculture and local history. With a tight-knit population and essential services like schools and medical centers nearby, it offers both lifestyle and value. The sharp growth in home prices reflects rising interest among out-of-area buyers seeking affordability in quieter communities.
18. Jean – 210% Home Price Increase Since 2012

- 2010: $124,530
- 2011: $96,824 (-$27,706, -22.25% from previous year)
- 2012: $84,471 (-$12,353, -12.76% from previous year)
- 2013: $96,090 (+$11,618, +13.75% from previous year)
- 2014: $119,787 (+$23,697, +24.66% from previous year)
- 2015: $137,833 (+$18,047, +15.07% from previous year)
- 2016: $156,807 (+$18,974, +13.77% from previous year)
- 2017: $170,180 (+$13,374, +8.53% from previous year)
- 2018: $206,166 (+$35,985, +21.15% from previous year)
- 2019: $218,846 (+$12,680, +6.15% from previous year)
- 2020: $217,758 (-$1,088, -0.50% from previous year)
- 2021: $248,484 (+$30,725, +14.11% from previous year)
- 2022: $296,487 (+$48,004, +19.32% from previous year)
- 2023: $267,988 (-$28,499, -9.61% from previous year)
- 2024: $295,031 (+$27,042, +10.09% from previous year)
- 2025: $300,163 (+$5,132, +1.74% from previous year)
Jean has seen dramatic price increases since hitting a low of $84,471 in 2012. Prices have risen more than 210%, reaching $300,163 in 2025. Though the town experienced a dip in 2023, values quickly recovered, reflecting resilient buyer interest and possibly regional development pressure from nearby Las Vegas.
Jean – Gateway to Southern Nevada Growth
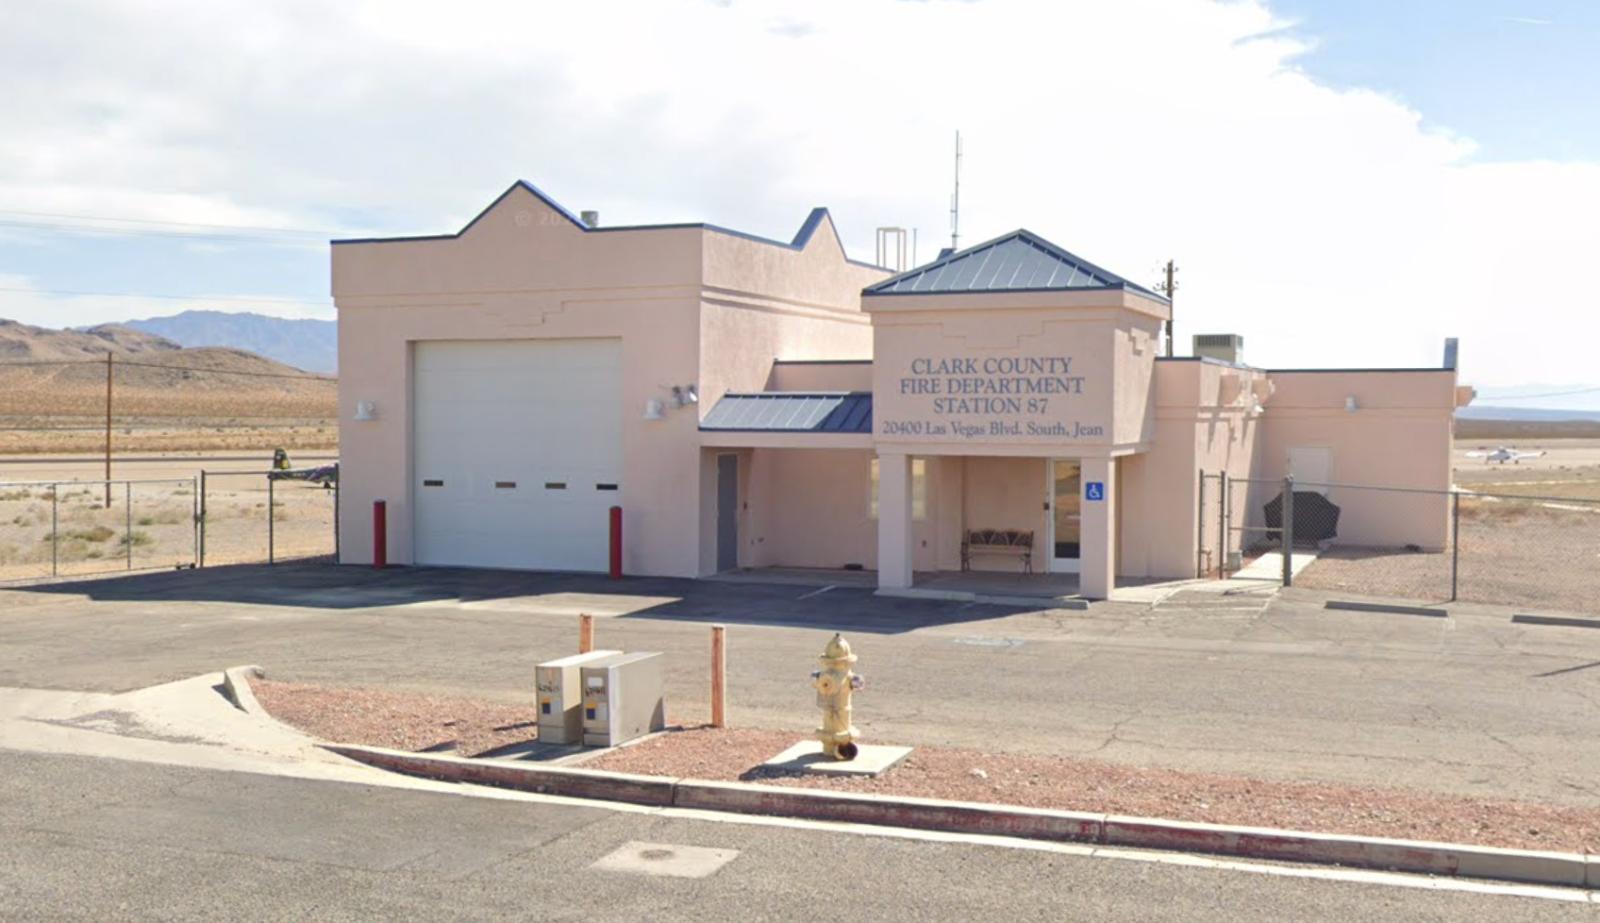
Jean is an unincorporated community in Clark County located about 30 miles south of Las Vegas. It’s best known for its proximity to Interstate 15 and as a frequent stop for travelers heading toward California. Though the town has limited residential infrastructure, its location continues to attract speculative interest.
The area’s affordability relative to Las Vegas and potential future development make it a hotspot for investors and long-term planners. With real estate prices climbing sharply since 2012, Jean represents a micro-market where affordability and proximity to urban centers intersect in interesting ways.
17. West Wendover – 91.9% Home Price Increase Since 2013

- 2010: N/A
- 2011: N/A
- 2012: N/A
- 2013: $151,841
- 2014: $155,034 (+$3,193, +2.10% from previous year)
- 2015: $165,296 (+$10,262, +6.62% from previous year)
- 2016: $176,805 (+$11,509, +6.96% from previous year)
- 2017: $184,790 (+$7,985, +4.52% from previous year)
- 2018: $186,819 (+$2,029, +1.10% from previous year)
- 2019: $191,204 (+$4,385, +2.35% from previous year)
- 2020: $202,551 (+$11,346, +5.93% from previous year)
- 2021: $231,007 (+$28,457, +14.05% from previous year)
- 2022: $262,991 (+$31,984, +13.85% from previous year)
- 2023: $264,012 (+$1,020, +0.39% from previous year)
- 2024: $280,280 (+$16,268, +6.16% from previous year)
- 2025: $291,597 (+$11,317, +4.04% from previous year)
West Wendover’s home values have risen steadily since 2013, increasing nearly 92%. The market’s long-term consistency, punctuated by jumps in 2021 and 2022, shows strength in buyer demand and stable local conditions. The 2025 value stands at just under $292,000.
West Wendover – Remote Yet Resilient

Positioned on the Nevada-Utah border, West Wendover serves as a key stop for travelers along I-80. Known for its casino resorts and proximity to Utah’s Wendover, the town benefits from cross-border traffic and entertainment revenue, which bolsters the local economy.
Though remote, its housing market has proven durable, perhaps due to consistent employment sources and affordability. West Wendover’s growth in home values may also reflect limited inventory and low competition among buyers looking for small-town advantages with steady job access.
16. Battle Mountain – 136.5% Home Price Increase Since 2011

- 2010: $124,936
- 2011: $115,017 (-$9,919, -7.94% from previous year)
- 2012: $121,869 (+$6,852, +5.96% from previous year)
- 2013: $134,477 (+$12,607, +10.35% from previous year)
- 2014: $143,605 (+$9,128, +6.79% from previous year)
- 2015: $154,200 (+$10,595, +7.38% from previous year)
- 2016: $163,148 (+$8,948, +5.80% from previous year)
- 2017: $169,433 (+$6,285, +3.85% from previous year)
- 2018: $183,366 (+$13,932, +8.22% from previous year)
- 2019: $189,703 (+$6,338, +3.46% from previous year)
- 2020: $199,304 (+$9,601, +5.06% from previous year)
- 2021: $222,488 (+$23,185, +11.63% from previous year)
- 2022: $243,953 (+$21,465, +9.65% from previous year)
- 2023: $251,440 (+$7,486, +3.07% from previous year)
- 2024: $260,661 (+$9,221, +3.67% from previous year)
- 2025: $272,003 (+$11,342, +4.35% from previous year)
Battle Mountain’s home values have surged by more than 136% since 2011. Prices in 2025 top $272,000, with modest and consistent gains over the last several years. It’s one of the more stable affordable markets in Nevada with no major downturns in recent memory.
Battle Mountain – Stability in Central Nevada

Battle Mountain lies between Elko and Winnemucca in Lander County, situated along I-80. Historically known as a mining and railroad town, today it serves as a small but active hub with local schools, health services, and a strong connection to Nevada’s resource economy.
Its affordability is balanced by slow but steady appreciation, making it a practical choice for buyers seeking predictability. With access to both outdoor recreation and basic infrastructure, Battle Mountain has gradually earned attention for its value and livability in central Nevada.
15. Laughlin – 119.8% Home Price Increase Since 2012

- 2010: $120,496
- 2011: $110,453 (-$10,043, -8.33% from previous year)
- 2012: $100,125 (-$10,328, -9.35% from previous year)
- 2013: $113,654 (+$13,529, +13.51% from previous year)
- 2014: $123,304 (+$9,651, +8.49% from previous year)
- 2015: $127,109 (+$3,805, +3.09% from previous year)
- 2016: $133,975 (+$6,866, +5.40% from previous year)
- 2017: $143,749 (+$9,774, +7.30% from previous year)
- 2018: $158,654 (+$14,905, +10.37% from previous year)
- 2019: $167,773 (+$9,119, +5.75% from previous year)
- 2020: $179,865 (+$12,092, +7.21% from previous year)
- 2021: $205,138 (+$25,273, +14.05% from previous year)
- 2022: $258,944 (+$53,805, +26.23% from previous year)
- 2023: $254,811 (-$4,133, -1.60% from previous year)
- 2024: $265,400 (+$10,589, +4.16% from previous year)
- 2025: $264,803 (-$597, -0.23% from previous year)
Laughlin’s home prices have jumped nearly 120% since 2012, despite a couple of modest pullbacks. At $264,803 in 2025, it remains one of the most affordable options in southern Nevada, especially considering its location along the Colorado River.
Laughlin – Riverfront Value and Entertainment

Located along the Nevada-Arizona border, Laughlin is known for its casinos, desert climate, and scenic views of the Colorado River. It attracts retirees, vacation homeowners, and locals looking for lower costs near the water. With a tourism-driven economy, it blends resort flair with affordability.
The town’s housing market has benefited from its recreational appeal, seeing strong growth in 2021 and 2022. Even with recent cooling, Laughlin’s real estate remains a solid option for those seeking budget-friendly living near water, gaming, and year-round sunshine.
14. Searchlight – 6.9% Home Price Increase Since 2023

- 2010: N/A
- 2011: N/A
- 2012: N/A
- 2013: N/A
- 2014: N/A
- 2015: N/A
- 2016: N/A
- 2017: N/A
- 2018: N/A
- 2019: N/A
- 2020: N/A
- 2021: N/A
- 2022: N/A
- 2023: $242,328
- 2024: $249,814 (+$7,487, +3.09% from previous year)
- 2025: $259,033 (+$9,218, +3.69% from previous year)
Although data for earlier years is unavailable, Searchlight has posted modest gains since 2023, with a 6.9% increase in home prices over two years. The 2025 median home value stands at $259,033, placing it among the more budget-conscious towns in southern Nevada. This steady growth, though not as steep as in other areas, points to consistent if limited demand in a niche desert community.
Searchlight – A Desert Stop With Modest Momentum

Searchlight is a small, historically mining-driven town in Clark County, situated along U.S. Route 95 between Las Vegas and Laughlin. Though its population hovers around a few hundred residents, Searchlight maintains a notable presence on the map as a quiet pit stop en route to larger destinations. The surrounding desert landscape is vast and largely undeveloped, offering solitude that appeals to a particular subset of homebuyers—especially retirees or remote workers looking to disconnect from city life.
While the town doesn’t boast a dense infrastructure or economy, its affordability and low population density remain attractive to those seeking simplicity. The town’s modest rise in home prices could reflect its growing appeal among people priced out of Las Vegas but still wanting to remain within reach of its amenities. Even a slight increase in buyer interest can have an outsized effect on pricing in a community this small. That dynamic may explain the gradual uptick in values seen since 2023. For buyers seeking entry-level pricing and an off-the-grid atmosphere, Searchlight holds potential.
13. Panaca – 65.4% Home Price Increase Since 2018

🔥 Would you like to save this?
- 2010: N/A
- 2011: N/A
- 2012: N/A
- 2013: N/A
- 2014: N/A
- 2015: N/A
- 2016: N/A
- 2017: N/A
- 2018: $144,419
- 2019: $160,574 (+$16,155, +11.19% from previous year)
- 2020: $173,619 (+$13,045, +8.12% from previous year)
- 2021: $200,670 (+$27,051, +15.58% from previous year)
- 2022: $223,379 (+$22,709, +11.32% from previous year)
- 2023: $219,897 (-$3,482, -1.56% from previous year)
- 2024: $236,008 (+$16,111, +7.33% from previous year)
- 2025: $238,895 (+$2,887, +1.22% from previous year)
Panaca’s home prices have climbed more than 65% since 2018, reflecting healthy long-term appreciation with only one year of slight decline. At $238,895 in 2025, the town remains highly affordable compared to state averages, despite recent gains. The market shows consistent interest, likely driven by small-town appeal and relatively low starting values.
Panaca – Nevada’s Historic Pioneer Town

Founded in the 1860s and located in Lincoln County, Panaca is one of Nevada’s oldest settlements and one of its few towns that prohibits gambling. That alone makes it unique within the state. Nestled near Cathedral Gorge State Park, Panaca offers outdoor recreation, tight-knit community life, and a relatively quiet existence away from major urban sprawl. It serves as a bedroom community and local service hub for eastern Nevada, with modest infrastructure that includes schools, churches, and civic buildings.
Its recent rise in housing values may be due in part to increased interest from buyers looking for affordable alternatives to western Nevada, or those drawn to the town’s rural pace and historical roots. The park nearby draws visitors throughout the year, and that tourism likely contributes modestly to local home demand. Price growth here may not be explosive, but its consistency over the last half-decade suggests that Panaca is on solid footing as a niche affordable option.
12. Alamo – 72.8% Home Price Increase Since 2013

- 2010: N/A
- 2011: N/A
- 2012: N/A
- 2013: $134,914
- 2014: $150,077 (+$15,162, +11.24% from previous year)
- 2015: $158,074 (+$7,998, +5.33% from previous year)
- 2016: $176,736 (+$18,662, +11.81% from previous year)
- 2017: $178,728 (+$1,991, +1.13% from previous year)
- 2018: $172,973 (-$5,755, -3.22% from previous year)
- 2019: $177,486 (+$4,513, +2.61% from previous year)
- 2020: $184,884 (+$7,398, +4.17% from previous year)
- 2021: $238,280 (+$53,396, +28.88% from previous year)
- 2022: $262,985 (+$24,705, +10.37% from previous year)
- 2023: $251,561 (-$11,424, -4.34% from previous year)
- 2024: $256,711 (+$5,150, +2.05% from previous year)
- 2025: $233,118 (-$23,592, -9.19% from previous year)
Alamo has experienced substantial home value appreciation since 2013, with a total gain of nearly 73% despite recent price drops. After peaking above $260,000 in 2022, home values slipped, settling at $233,118 in 2025. This recent softening, however, doesn’t erase years of steady growth and shows that prices here may be adjusting after rapid gains.
Alamo – Small Town Growth With Room to Cool

Located in Lincoln County, Alamo sits along U.S. Route 93 about 90 miles north of Las Vegas. It’s a common stopover for travelers headed to Area 51 or nearby wildlife refuges, but for locals, it’s a peaceful rural town with essential services and family-friendly amenities. The economy revolves largely around agriculture, education, and small businesses, and the town supports a modest population that values open space and close community ties.
Alamo’s home prices soared between 2020 and 2022, perhaps due to pandemic-era urban flight and limited housing inventory. That rapid growth now appears to be leveling out, with 2023–2025 showing modest declines. Still, the long-term outlook remains positive, especially for buyers drawn to small towns with access to outdoor recreation and basic services. For many, Alamo offers a middle ground between isolation and connectivity.
11. Lovelock – 261% Home Price Increase Since 2012

- 2010: N/A
- 2011: N/A
- 2012: $63,071
- 2013: $72,074 (+$9,003, +14.28% from previous year)
- 2014: $79,556 (+$7,482, +10.38% from previous year)
- 2015: $89,493 (+$9,937, +12.49% from previous year)
- 2016: $105,669 (+$16,176, +18.08% from previous year)
- 2017: $105,823 (+$154, +0.15% from previous year)
- 2018: $109,787 (+$3,964, +3.75% from previous year)
- 2019: $117,762 (+$7,975, +7.26% from previous year)
- 2020: $136,487 (+$18,725, +15.90% from previous year)
- 2021: $157,076 (+$20,589, +15.08% from previous year)
- 2022: $194,905 (+$37,829, +24.08% from previous year)
- 2023: $207,346 (+$12,442, +6.38% from previous year)
- 2024: $223,967 (+$16,621, +8.02% from previous year)
- 2025: $227,723 (+$3,756, +1.68% from previous year)
Lovelock’s housing market has seen explosive growth, with prices jumping more than 260% since 2012. What started as a sub-$65,000 market has now climbed to over $227,000. Despite the jump, the town still offers relative affordability and a record of strong year-over-year performance.
Lovelock – A Rural Boom in the Heart of Nevada

Lovelock is the county seat of Pershing County and is situated along I-80 between Reno and Elko. Though small in size and population, Lovelock plays a regional role as a stopover, agricultural hub, and gateway to northern Nevada’s wide-open basins. The area is home to farms, correctional facilities, and some tourism linked to natural hot springs and mining history.
This mix of economic inputs, combined with a low starting base for home prices, has contributed to its dramatic price gains. Housing in Lovelock still remains much cheaper than in larger metro areas, but the appreciation over the last decade points to rising demand. Buyers looking to invest or relocate to a quiet town with room for growth may find Lovelock’s recent market history encouraging. Its central location and price accessibility continue to be strong draws in 2025.
10. Pioche – 89.5% Home Price Increase Since 2013

- 2010: N/A
- 2011: N/A
- 2012: N/A
- 2013: $117,942
- 2014: $126,212 (+$8,270, +7.01% from previous year)
- 2015: $137,686 (+$11,475, +9.09% from previous year)
- 2016: $144,800 (+$7,114, +5.17% from previous year)
- 2017: $146,258 (+$1,458, +1.01% from previous year)
- 2018: $157,485 (+$11,227, +7.68% from previous year)
- 2019: $163,944 (+$6,460, +4.10% from previous year)
- 2020: $177,431 (+$13,486, +8.23% from previous year)
- 2021: $218,431 (+$41,001, +23.11% from previous year)
- 2022: $240,135 (+$21,704, +9.94% from previous year)
- 2023: $231,196 (-$8,939, -3.72% from previous year)
- 2024: $235,292 (+$4,096, +1.77% from previous year)
- 2025: $223,480 (-$11,813, -5.02% from previous year)
Pioche has seen a total home price increase of 89.5% since 2013, with a peak in 2022 followed by moderate price adjustments. The current median price of $223,480 still reflects long-term growth, although the market has cooled over the past two years. This trend is common in smaller Nevada towns that experienced sharp gains during the 2021 boom.
Pioche – Mining Roots With Scenic Solitude

Pioche, perched in the high desert of Lincoln County, is one of Nevada’s most storied former mining towns. Once known for its lawlessness and silver boom in the 19th century, it now stands as a quiet and picturesque settlement with historic charm. The town’s elevation gives it cooler temperatures than many surrounding areas, and its rugged setting offers dramatic views and a sense of isolation that appeals to buyers looking for something off the beaten path. It remains largely residential with modest infrastructure—think local diners, gas stations, and a few small shops.
Its relative affordability and unique character have kept Pioche on the radar for adventurous homebuyers, even as market activity dips from pandemic highs. The town saw its most explosive growth between 2020 and 2022, when values jumped over 60% in just two years. The more recent drop in price doesn’t necessarily suggest a market in trouble—it may instead reflect stabilization after rapid appreciation. For those looking to own property in a place where time feels slower and the views go on for miles, Pioche is a compelling option.
9. Caliente – 118.3% Home Price Increase Since 2013

- 2010: N/A
- 2011: N/A
- 2012: N/A
- 2013: $92,757
- 2014: $102,647 (+$9,890, +10.66% from previous year)
- 2015: $117,124 (+$14,477, +14.10% from previous year)
- 2016: $128,929 (+$11,805, +10.08% from previous year)
- 2017: $131,729 (+$2,800, +2.17% from previous year)
- 2018: $138,847 (+$7,118, +5.40% from previous year)
- 2019: $151,287 (+$12,440, +8.96% from previous year)
- 2020: $157,895 (+$6,607, +4.37% from previous year)
- 2021: $204,378 (+$46,484, +29.44% from previous year)
- 2022: $221,634 (+$17,256, +8.44% from previous year)
- 2023: $201,764 (-$19,870, -8.97% from previous year)
- 2024: $204,366 (+$2,602, +1.29% from previous year)
- 2025: $202,565 (-$1,801, -0.88% from previous year)
Caliente’s housing market has risen by over 118% since 2013, peaking in 2022 and experiencing a modest decline since then. In 2025, the median home value remains just above $202,000, signaling a durable level of affordability even after years of growth. This long-term upward trend suggests lasting interest in the town’s lifestyle and setting.
Caliente – Historic Charm Along the Railroad

Caliente is one of southern Nevada’s most unique small towns, known for its historic mission-style railroad depot and location along the Union Pacific line. It sits in a narrow valley along Meadow Valley Wash, offering greenery and views uncommon in Nevada’s otherwise dry landscape. The town has retained much of its old-world charm, with early 20th-century buildings, tree-lined streets, and active community spaces. Though remote, Caliente offers local amenities like a library, parks, grocery stores, and access to nearby national and state parks.
The sharp price growth in 2021 and 2022 points to a pandemic-driven surge in interest—especially among buyers fleeing urban cores. Even though prices have settled, Caliente still offers an affordable entry point into Nevada homeownership, particularly for those drawn to quiet towns with character. Proximity to Cathedral Gorge and Kershaw-Ryan State Park enhances its appeal for nature lovers, and the town’s reliable infrastructure makes it livable full-time. The modest price correction in 2023–2025 may present a buying opportunity in a town that continues to hold long-term value.
8. Ely – 80.9% Home Price Increase Since 2011

- 2010: $111,815
- 2011: $100,369 (-$11,446, -10.24% from previous year)
- 2012: $101,960 (+$1,591, +1.58% from previous year)
- 2013: $110,382 (+$8,422, +8.26% from previous year)
- 2014: $114,708 (+$4,327, +3.92% from previous year)
- 2015: $125,220 (+$10,511, +9.16% from previous year)
- 2016: $126,503 (+$1,283, +1.02% from previous year)
- 2017: $126,936 (+$433, +0.34% from previous year)
- 2018: $133,708 (+$6,772, +5.34% from previous year)
- 2019: $141,754 (+$8,046, +6.02% from previous year)
- 2020: $159,234 (+$17,480, +12.33% from previous year)
- 2021: $182,963 (+$23,730, +14.90% from previous year)
- 2022: $202,052 (+$19,089, +10.43% from previous year)
- 2023: $204,167 (+$2,114, +1.05% from previous year)
- 2024: $204,685 (+$518, +0.25% from previous year)
- 2025: $202,399 (-$2,286, -1.12% from previous year)
Ely has seen a solid 81% increase in home prices since 2011, climbing steadily to a current value of $202,399. While growth has leveled off in recent years, the long-term trend remains strong. For buyers seeking affordability without compromising too much on services or scenery, Ely remains a standout.
Ely – Eastern Nevada’s Midsize Stronghold

Ely is among the largest towns in eastern Nevada, serving as the White Pine County seat and a hub for the region. It’s nestled between mountain ranges and surrounded by public lands, offering a gateway to Great Basin National Park and the scenic Loneliest Road in America. Historically a mining and railway town, Ely now supports a diversified economy that includes tourism, healthcare, education, and government services. The town features a historic downtown, museums, and even a working steam railroad that attracts heritage tourism.
Ely’s housing market has grown steadily without overheating. Its mix of affordability, infrastructure, and access to natural attractions makes it an appealing choice for long-term residents and newcomers alike. Though it has recently experienced slight price dips, those corrections seem mild in context and may even improve accessibility for future buyers. With its strong services and steady appreciation, Ely strikes a compelling balance between small-town charm and real-world convenience.
7. Wells – 60.4% Home Price Increase Since 2013

🔥 Would you like to save this?
- 2010: N/A
- 2011: N/A
- 2012: N/A
- 2013: $121,925
- 2014: $129,568 (+$7,643, +6.27% from previous year)
- 2015: $151,684 (+$22,116, +17.07% from previous year)
- 2016: $155,170 (+$3,486, +2.30% from previous year)
- 2017: $158,341 (+$3,171, +2.04% from previous year)
- 2018: $173,505 (+$15,164, +9.58% from previous year)
- 2019: $175,400 (+$1,895, +1.09% from previous year)
- 2020: $192,922 (+$17,522, +9.99% from previous year)
- 2021: $197,294 (+$4,373, +2.27% from previous year)
- 2022: $204,014 (+$6,720, +3.41% from previous year)
- 2023: $198,390 (-$5,624, -2.76% from previous year)
- 2024: $190,124 (-$8,266, -4.17% from previous year)
- 2025: $195,560 (+$5,436, +2.86% from previous year)
Wells has added more than 60% to its home values since 2013, peaking in 2022 before retreating slightly. As of 2025, home prices are on the rise again, landing at just over $195,000. The recent recovery may signal renewed interest in this well-located northeastern town.
Wells – Northeastern Access With Affordable Homes

Wells is located at the intersection of I-80 and U.S. Route 93, making it one of the most well-connected small towns in rural Nevada. This junction town has long served travelers and truckers moving between Salt Lake City, Reno, and southern Nevada. Despite its small population, Wells boasts public schools, a hospital, city government, and a few recreation areas that draw locals and visitors alike. It’s surrounded by scenic peaks and alpine wilderness, offering access to camping, fishing, and off-road trails within minutes.
Its home prices grew quickly during the early 2020s, reflecting both demand and inflationary pressures, but have cooled in the past two years. Even with those declines, prices remain well above 2013 levels, and affordability continues to be a draw. Wells may especially appeal to those seeking a low-cost base with easy transportation links. For remote workers or retirees prioritizing scenery and road access, Wells provides one of the more balanced markets in the region.
6. Carlin – 87.0% Home Price Increase Since 2011

- 2010: $104,744
- 2011: $97,517 (-$7,227, -6.90% from previous year)
- 2012: $96,510 (-$1,007, -1.03% from previous year)
- 2013: $114,692 (+$18,182, +18.84% from previous year)
- 2014: $129,464 (+$14,772, +12.88% from previous year)
- 2015: $138,423 (+$8,959, +6.92% from previous year)
- 2016: $143,127 (+$4,704, +3.40% from previous year)
- 2017: $146,037 (+$2,909, +2.03% from previous year)
- 2018: $147,610 (+$1,573, +1.08% from previous year)
- 2019: $150,966 (+$3,356, +2.27% from previous year)
- 2020: $164,687 (+$13,721, +9.09% from previous year)
- 2021: $174,836 (+$10,149, +6.16% from previous year)
- 2022: $187,273 (+$12,436, +7.11% from previous year)
- 2023: $172,526 (-$14,747, -7.87% from previous year)
- 2024: $182,821 (+$10,295, +5.97% from previous year)
- 2025: $195,390 (+$12,569, +6.87% from previous year)
Carlin has seen a nearly 87% home price increase since 2011, with values climbing from under $98,000 to just below $200,000 in 2025. Despite a price dip in 2023, the town’s housing market has rebounded and continues to show moderate year-over-year gains. That recent bounce-back suggests the market remains stable and may be supported by local employment or improved infrastructure.
Carlin – A Mining Town With Quiet Demand

Carlin is located in Elko County and plays an important role in Nevada’s gold mining economy. The town is home to the Carlin Trend, one of the richest gold mining areas in the world. With a population under 3,000, Carlin is a tight-knit place that offers the basics—schools, small shops, and civic services—without the noise or traffic of larger towns. Residents often work for nearby mining operations or commute to Elko, which is just 23 miles away. The town’s identity is shaped by its working-class roots and close proximity to natural resources and public lands.
Carlin’s home prices have grown steadily over the past decade, driven in part by mining-related economic stability and limited housing stock. The sharp jump in 2020 and 2021 could be attributed to both pandemic trends and commodity booms. While 2023 brought a brief dip, 2024 and 2025 showed renewed strength in the market. For homebuyers looking for affordability near high-wage industries, Carlin represents a practical and historically resilient option.
5. Eureka – 47.8% Home Price Increase Since 2013
- 2010: N/A
- 2011: N/A
- 2012: N/A
- 2013: $129,485
- 2014: $126,753 (-$2,732, -2.11% from previous year)
- 2015: $136,634 (+$9,881, +7.80% from previous year)
- 2016: $149,576 (+$12,942, +9.47% from previous year)
- 2017: $155,403 (+$5,827, +3.90% from previous year)
- 2018: $157,248 (+$1,845, +1.19% from previous year)
- 2019: $158,248 (+$1,001, +0.64% from previous year)
- 2020: $170,396 (+$12,147, +7.68% from previous year)
- 2021: $187,360 (+$16,964, +9.96% from previous year)
- 2022: $195,430 (+$8,070, +4.31% from previous year)
- 2023: $206,124 (+$10,695, +5.47% from previous year)
- 2024: $193,918 (-$12,206, -5.92% from previous year)
- 2025: $191,396 (-$2,523, -1.30% from previous year)
Eureka’s housing market has grown nearly 48% since 2013, despite some mild pullbacks in the past two years. Home prices peaked in 2023 before dipping slightly to $191,396 in 2025. Still, the town remains one of the more affordable options in central Nevada with a consistent track record of price growth.
Eureka – History and Affordability in One of Nevada’s Oldest Towns


Tucked in the center of the state, Eureka is a former silver mining town and county seat that dates back to the 1800s. Its population is small, but its historical legacy looms large, with restored buildings, an old opera house, and a charming main street that’s often featured in regional travel guides. Eureka lies along U.S. Route 50, the so-called “Loneliest Road in America,” offering stunning high-desert views and a peaceful pace of life. Its isolation is also part of its appeal—residents enjoy a quiet, close-knit environment far from the sprawl of Nevada’s metro hubs.
Home prices have increased gradually over the years, in part due to modest supply and continued interest from retirees and rural enthusiasts. Though prices dipped in 2024 and 2025, they remain well above pre-2020 levels, showing that Eureka still offers long-term growth potential. Buyers looking for historical atmosphere, public lands access, and community events in a traditional Western town may find Eureka a rare gem at a modest cost.
4. Tonopah – 34.0% Home Price Increase Since 2018

- 2010: N/A
- 2011: N/A
- 2012: N/A
- 2013: N/A
- 2014: N/A
- 2015: N/A
- 2016: N/A
- 2017: N/A
- 2018: $116,847
- 2019: $132,943 (+$16,097, +13.78% from previous year)
- 2020: $163,199 (+$30,256, +22.76% from previous year)
- 2021: $176,883 (+$13,683, +8.38% from previous year)
- 2022: $201,698 (+$24,815, +14.03% from previous year)
- 2023: $189,598 (-$12,099, -6.00% from previous year)
- 2024: $161,952 (-$27,646, -14.58% from previous year)
- 2025: $156,660 (-$5,292, -3.27% from previous year)
Tonopah saw its home values rise 34% since 2018, with significant appreciation between 2019 and 2022. The more recent dip in values—three consecutive years of decline—suggests the market may be correcting after sharp growth. Still, with prices hovering around $156,000 in 2025, affordability remains a key feature of this rural town.
Tonopah – High Desert Living With Historic Roots

Tonopah is one of Nevada’s best-known historic mining towns, located midway between Reno and Las Vegas. It serves as a stopover on U.S. Route 95 and is famous for its clear night skies, old mining remnants, and even a clown-themed motel that attracts curiosity seekers from across the country. For residents, Tonopah offers wide-open spaces, a modest cost of living, and a unique blend of quirk and tradition. There are local schools, a small hospital, and enough commercial infrastructure to support daily life.
The boom in prices from 2019 through 2022 likely reflected growing interest from remote workers and buyers priced out of other Nevada markets. As that trend fades, Tonopah’s recent declines bring prices back in line with historical trends, reinforcing its reputation as one of the state’s most affordable towns. While volatility may continue in the short term, Tonopah’s long-term affordability and unique appeal help it remain relevant for cost-conscious buyers with a taste for small-town character.
3. McGill – 84.0% Home Price Increase Since 2018

- 2010: N/A
- 2011: N/A
- 2012: N/A
- 2013: N/A
- 2014: N/A
- 2015: N/A
- 2016: N/A
- 2017: N/A
- 2018: $77,946
- 2019: $94,478 (+$16,532, +21.21% from previous year)
- 2020: $112,539 (+$18,061, +19.12% from previous year)
- 2021: $125,721 (+$13,182, +11.71% from previous year)
- 2022: $136,019 (+$10,298, +8.19% from previous year)
- 2023: $130,284 (-$5,735, -4.22% from previous year)
- 2024: $146,935 (+$16,651, +12.78% from previous year)
- 2025: $143,448 (-$3,487, -2.37% from previous year)
McGill has experienced substantial growth in home prices since 2018, with values rising by 84% overall. The 2025 price of $143,448 reflects a resilient market that’s held onto most of its gains even after recent adjustments. The strongest increases occurred during the pandemic years, with values nearly doubling in just four years.
McGill – A Company Town Making a Quiet Comeback

🔥 Would you like to save this?
McGill is a small community just outside Ely in White Pine County. Originally built as a company town for workers at the nearby Kennecott Copper smelter, McGill retains its early 20th-century character, with many original homes and a quiet grid of streets backed by mountain views. Though the smelter is long closed, the town endures thanks to its affordable housing, strong sense of community, and proximity to jobs and services in Ely. There’s also a growing interest in restoring older homes and preserving the town’s unique identity.
The sharp rise in prices from 2019 to 2022 likely reflects increased interest from bargain hunters, remote workers, and retirees looking for low-cost living with access to nature. Although the market dipped slightly in 2023 and 2025, it rebounded in 2024—suggesting healthy demand and limited inventory. McGill’s historical appeal, low entry prices, and location near Great Basin National Park give it a combination of value and character that’s rare in today’s market.
2. Hawthorne – 79.9% Home Price Increase Since 2011

- 2010: $77,047
- 2011: $69,086 (-$7,961, -10.33% from previous year)
- 2012: $70,875 (+$1,788, +2.59% from previous year)
- 2013: $76,993 (+$6,118, +8.63% from previous year)
- 2014: $75,111 (-$1,882, -2.44% from previous year)
- 2015: $72,965 (-$2,145, -2.86% from previous year)
- 2016: $74,013 (+$1,048, +1.44% from previous year)
- 2017: $74,435 (+$421, +0.57% from previous year)
- 2018: $89,549 (+$15,114, +20.31% from previous year)
- 2019: $102,135 (+$12,586, +14.05% from previous year)
- 2020: $130,937 (+$28,802, +28.20% from previous year)
- 2021: $133,101 (+$2,165, +1.65% from previous year)
- 2022: $165,708 (+$32,606, +24.50% from previous year)
- 2023: $159,558 (-$6,150, -3.71% from previous year)
- 2024: $130,179 (-$29,378, -18.41% from previous year)
- 2025: $124,298 (-$5,881, -4.52% from previous year)
Hawthorne’s home values grew nearly 80% from their 2011 low, reaching a peak in 2022 before sliding for three consecutive years. In 2025, prices are down to $124,298 but still well above pre-2020 levels. The market shows signs of correction, yet long-term growth remains.
Hawthorne – Lakeside Living With an Industrial Edge

Hawthorne is located in Mineral County, near Walker Lake, and is known for hosting the Hawthorne Army Depot—the largest ammunition storage facility in the world. The town has long been shaped by military and logistics employment, which provides a degree of economic stability uncommon in rural Nevada. Though small, it features a well-organized main street, local schools, a library, and lake access that supports fishing and boating. The surrounding scenery adds recreational appeal, with desert trails and mountain views offering outdoor options just beyond town limits.
Home prices soared during the pandemic housing wave but have since retreated, especially after sharp increases in 2020 and 2022. This reset may present opportunities for new buyers, particularly those looking for affordable homes with access to a steady job base and lakeside amenities. Hawthorne continues to be a strategic location in Nevada’s economic landscape, balancing industrial activity with rural charm.
1. Austin – 33.0% Home Price Decrease Since 2020

- 2010: N/A
- 2011: N/A
- 2012: N/A
- 2013: N/A
- 2014: N/A
- 2015: N/A
- 2016: N/A
- 2017: N/A
- 2018: $117,061
- 2019: $123,733 (+$6,672, +5.70% from previous year)
- 2020: $140,874 (+$17,141, +13.85% from previous year)
- 2021: $142,607 (+$1,733, +1.23% from previous year)
- 2022: $119,016 (-$23,591, -16.54% from previous year)
- 2023: $114,923 (-$4,093, -3.44% from previous year)
- 2024: $112,074 (-$2,849, -2.48% from previous year)
- 2025: $96,917 (-$15,157, -13.52% from previous year)
Austin is the only town on this list to post a multi-year decline in home values, with prices falling 33% from their 2020 peak. The 2025 median price of $96,917 makes it the most affordable housing market in Nevada this year. This sharp decline stands out in a state where many rural towns have seen long-term gains.
Austin – A Mining Relic With Room to Recover

Austin is a tiny, scenic outpost along Highway 50 in Lander County, known for its Old West character and crumbling mining-era architecture. Once a silver boomtown, it now boasts a population of just a few hundred and offers a peaceful, frontier-style lifestyle. Its high elevation and remote location give it unmatched quietude and beautiful vistas. But these same qualities also limit economic growth and job access, making it less attractive to many buyers during economic uncertainty. Still, its affordability and historic feel give it a niche appeal.
The price declines since 2020 may reflect limited demand or a small sample size of transactions. Yet with prices under $100,000 in 2025, Austin offers a rare price point in a state that has grown significantly more expensive. For those interested in preservation, privacy, or simply owning land in one of Nevada’s most distinctive small towns, Austin could be a hidden bargain waiting for reinvestment.