Would you like to save this?
Vermont may be known for its quiet charm, but in some towns, real estate prices have been anything but sleepy. Drawing on Zillow Home Value Index data, we looked back to 2010 to see where values have surged the most—and the results reveal a clear pattern. Lakeside escapes, ski-country favorites, and picture-perfect towns with thriving communities top the list. These are places where demand never let up, and prices followed. Whether it’s the draw of mountain views or walkable main streets, these 21 towns have turned into some of the state’s hottest—and priciest—markets.
21. Jericho – 91% Home Price Increase Since 2010
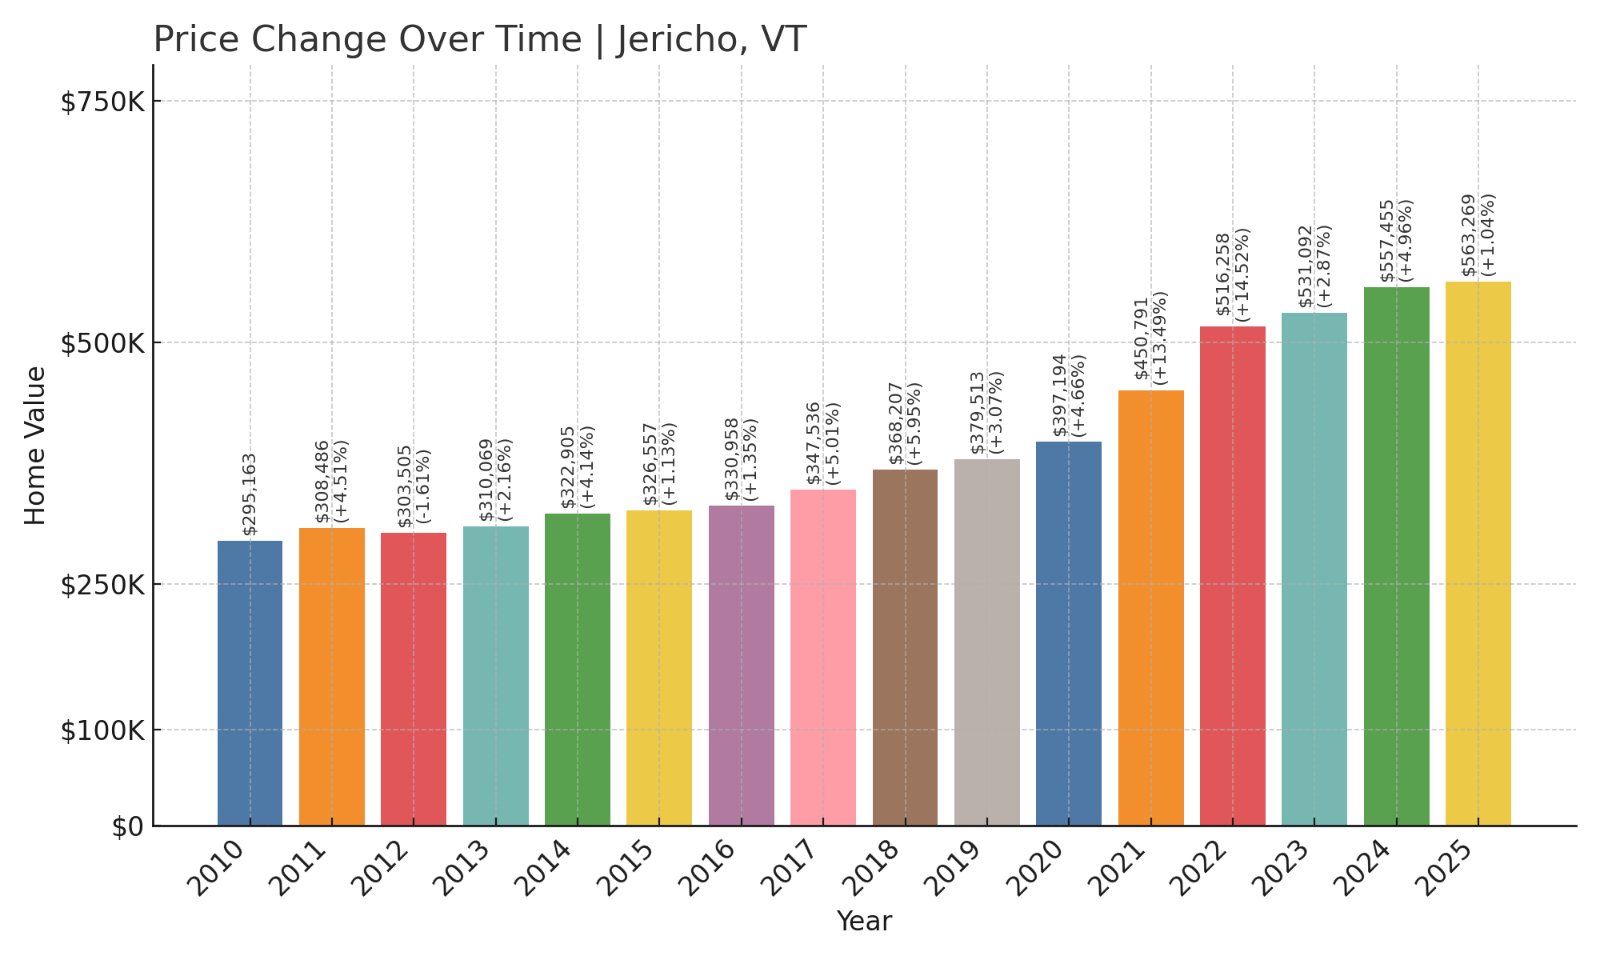
- 2010: $295,163
- 2011: $308,486 (+$13,323, +4.51%)
- 2012: $303,505 (-$4,981, -1.61%)
- 2013: $310,069 (+$6,564, +2.16%)
- 2014: $322,905 (+$12,836, +4.14%)
- 2015: $326,557 (+$3,653, +1.13%)
- 2016: $330,958 (+$4,400, +1.35%)
- 2017: $347,536 (+$16,578, +5.01%)
- 2018: $368,207 (+$20,671, +5.95%)
- 2019: $379,513 (+$11,306, +3.07%)
- 2020: $397,194 (+$17,681, +4.66%)
- 2021: $450,791 (+$53,597, +13.49%)
- 2022: $516,258 (+$65,467, +14.52%)
- 2023: $531,092 (+$14,834, +2.87%)
- 2024: $557,455 (+$26,363, +4.96%)
- 2025: $563,269 (+$5,814, +1.04%)
Jericho’s home prices have grown by an impressive 91% since 2010. The town saw a slow and steady rise in the first half of the 2010s, but things picked up sharply in 2021 and 2022, when annual gains exceeded 13% and 14%, respectively. That pace has moderated recently, but Jericho remains a consistently strong market in Vermont’s housing scene.
Jericho – Stable Demand With a Scenic, Small-Town Appeal
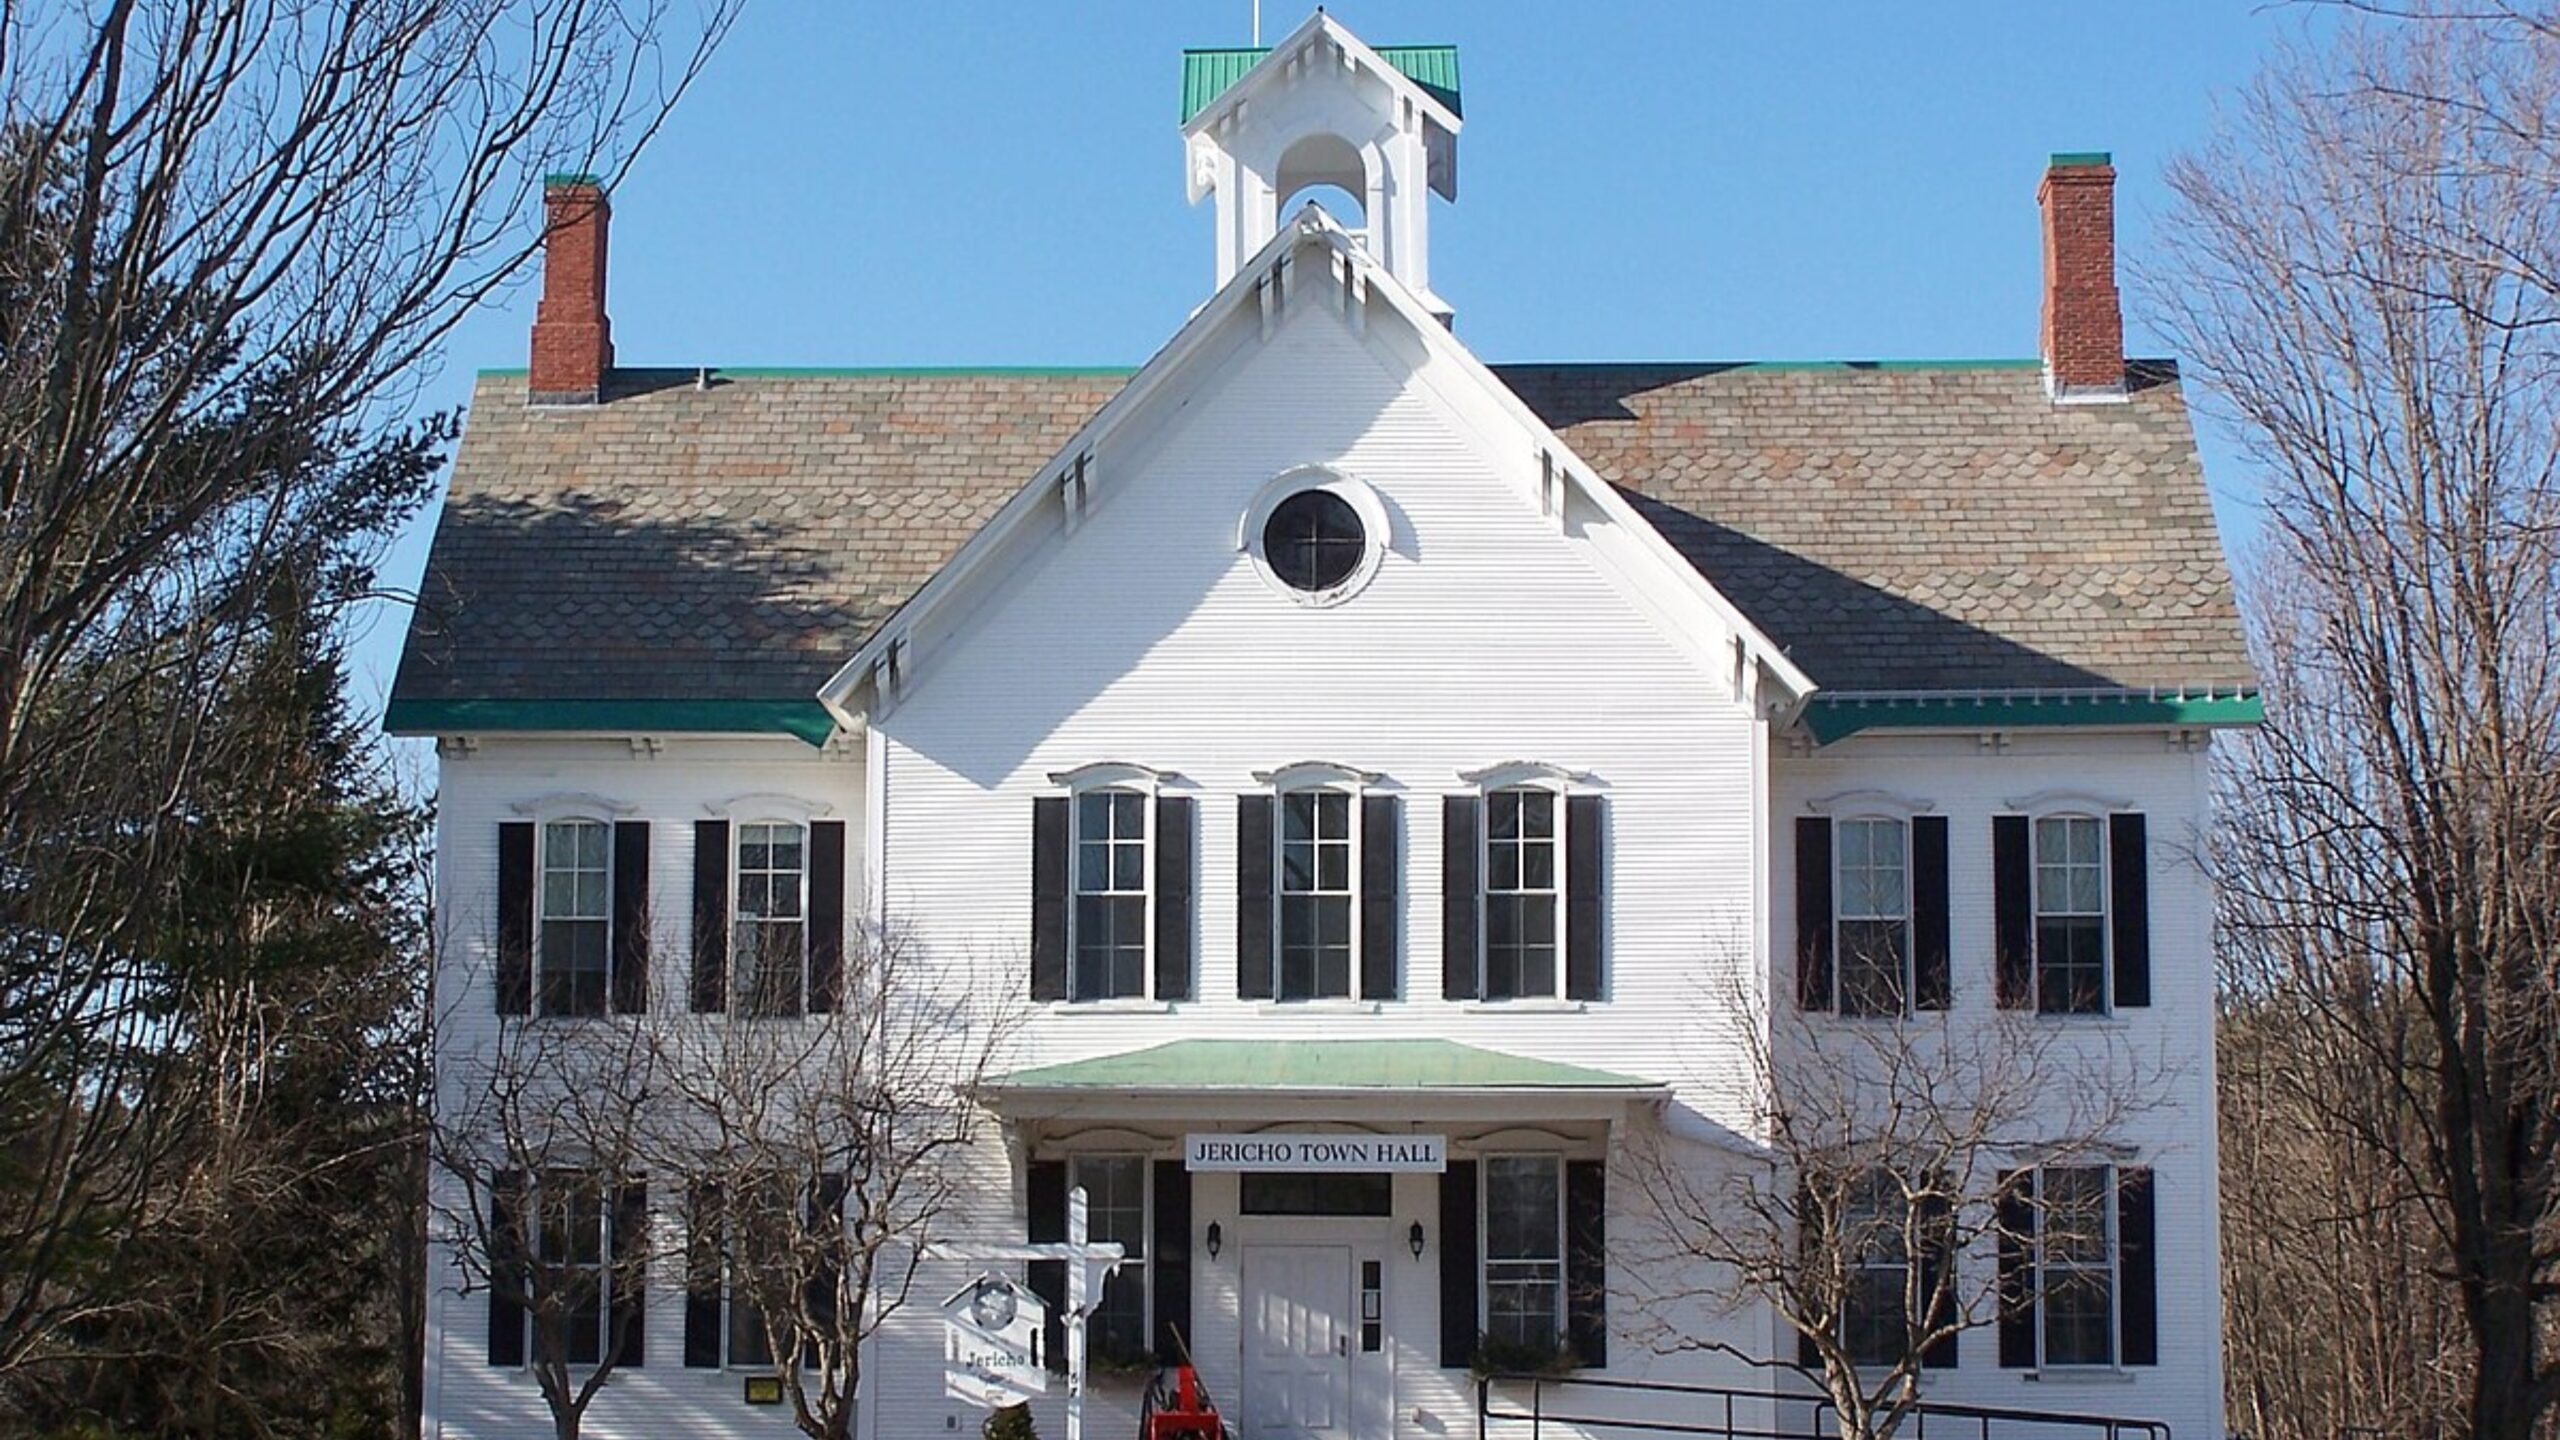
Nestled in Chittenden County, Jericho sits about 15 miles northeast of Burlington, Vermont’s largest city. This location offers a peaceful setting without sacrificing access to job markets, cultural amenities, and schools. Its popularity has likely grown due to remote work trends and buyers prioritizing space and quality of life.
Jericho is known for its quintessential New England charm and natural surroundings, including proximity to Mount Mansfield State Forest. The town’s school system, part of the Mount Mansfield Unified Union School District, is a frequent draw for families. Steady investment in infrastructure and public services also supports long-term appeal, helping drive the near-doubling in home values since 2010.
20. Hinesburg – 89% Home Price Increase Since 2012
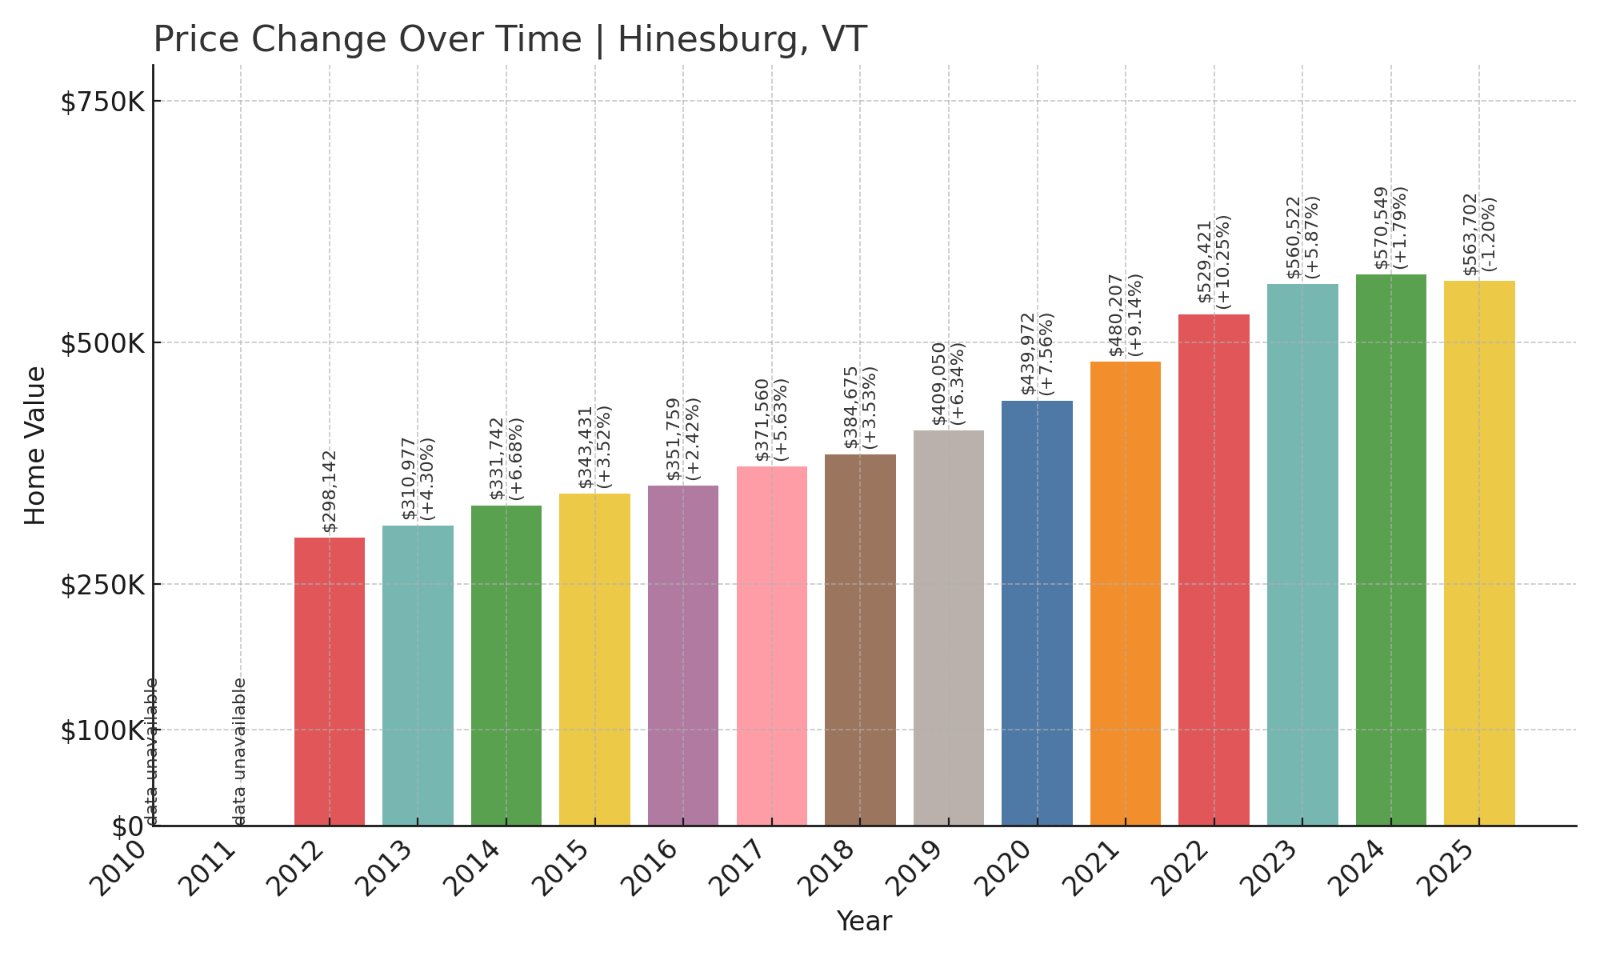
- 2012: $298,142
- 2013: $310,977 (+$12,834, +4.30%)
- 2014: $331,742 (+$20,765, +6.68%)
- 2015: $343,431 (+$11,689, +3.52%)
- 2016: $351,759 (+$8,328, +2.42%)
- 2017: $371,560 (+$19,802, +5.63%)
- 2018: $384,675 (+$13,114, +3.53%)
- 2019: $409,050 (+$24,375, +6.34%)
- 2020: $439,972 (+$30,922, +7.56%)
- 2021: $480,207 (+$40,236, +9.15%)
- 2022: $529,421 (+$49,214, +10.25%)
- 2023: $560,522 (+$31,101, +5.87%)
- 2024: $570,549 (+$10,027, +1.79%)
- 2025: $563,702 (-$6,847, -1.20%)
Hinesburg’s home prices have nearly doubled since 2012, with a particularly sharp rise from 2020 through 2022. Despite a modest dip in 2025, the market remains strong overall. Growth here has been consistent and points to Hinesburg’s increasing appeal in the post-2010 era.
Hinesburg – Growth Fueled by Livability and Location
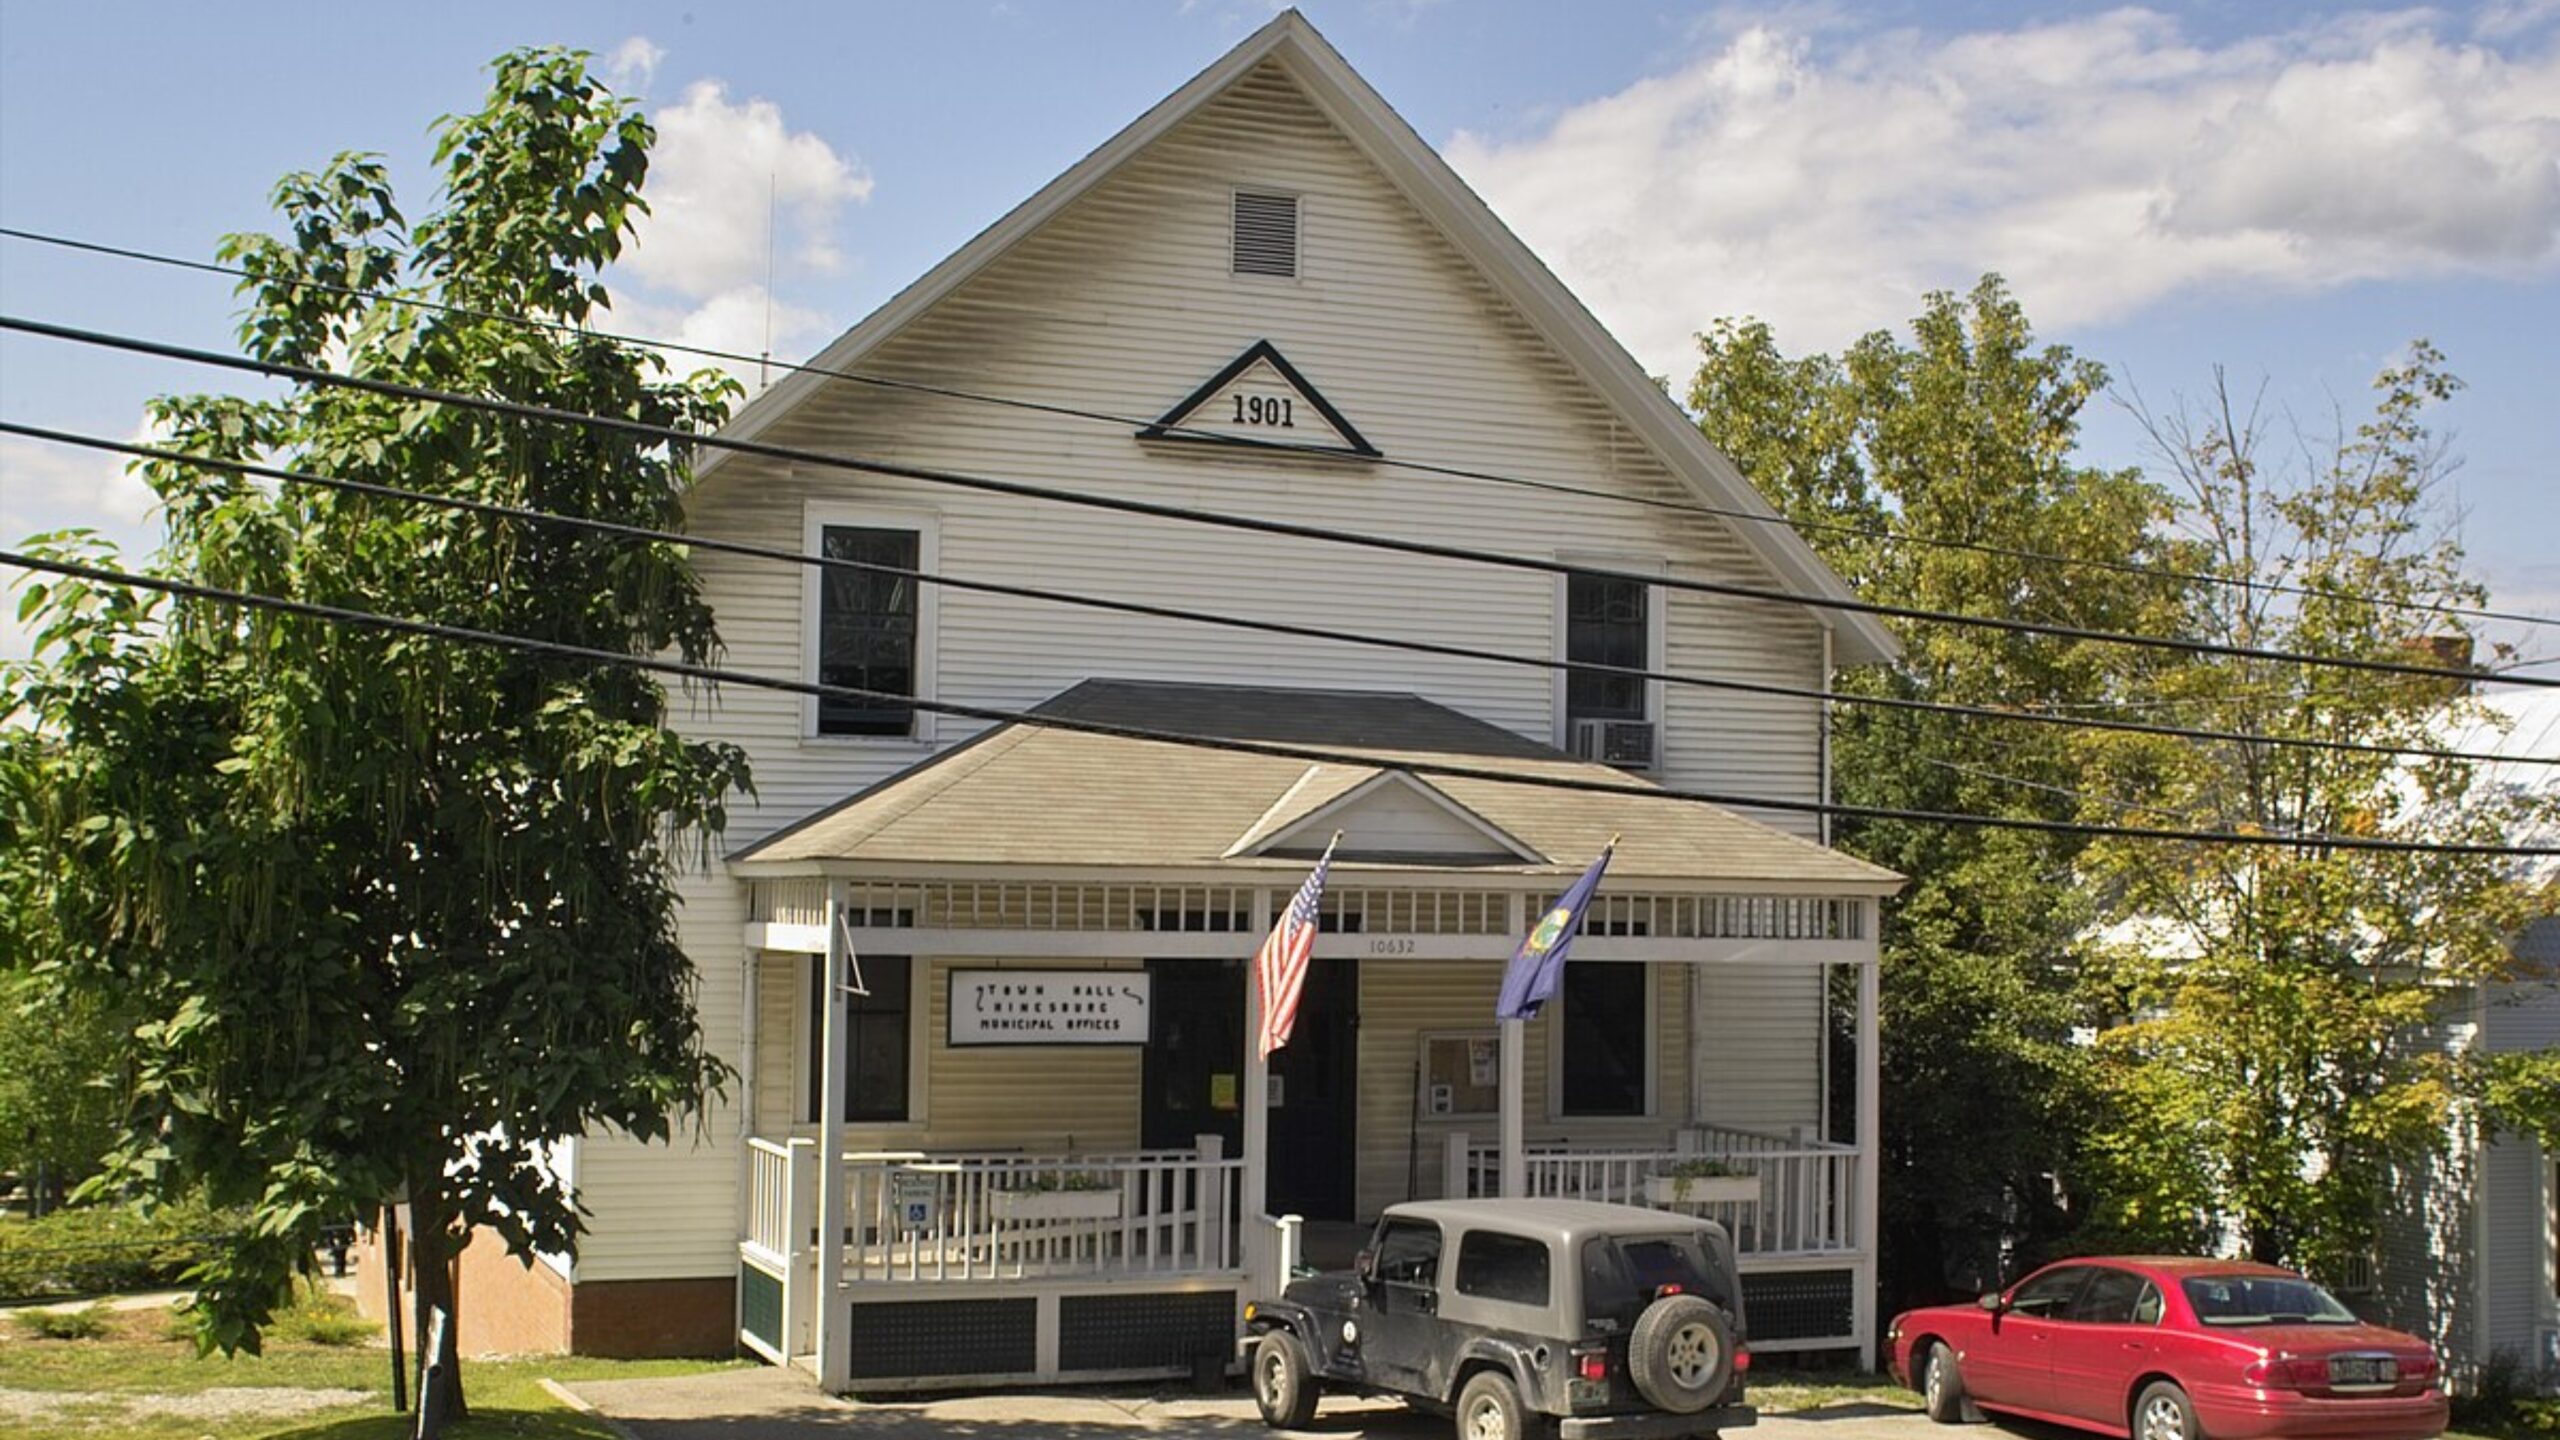
Located just south of Burlington, Hinesburg offers an attractive mix of rural scenery and convenience. The town’s village center has seen thoughtful development in recent years, with new housing, small businesses, and community infrastructure enhancing its livability. The balance of farmland and residential areas has helped the town maintain its rural identity while growing steadily.
Its school system and outdoor recreation opportunities, including Lake Iroquois and the LaPlatte River, are important contributors to Hinesburg’s value. The town’s housing demand has benefited from regional spillover as Burlington homebuyers seek more affordable alternatives with space and charm. These dynamics have propelled the town’s 89% price jump since 2012.
19. Weston – 93% Home Price Increase Since 2012
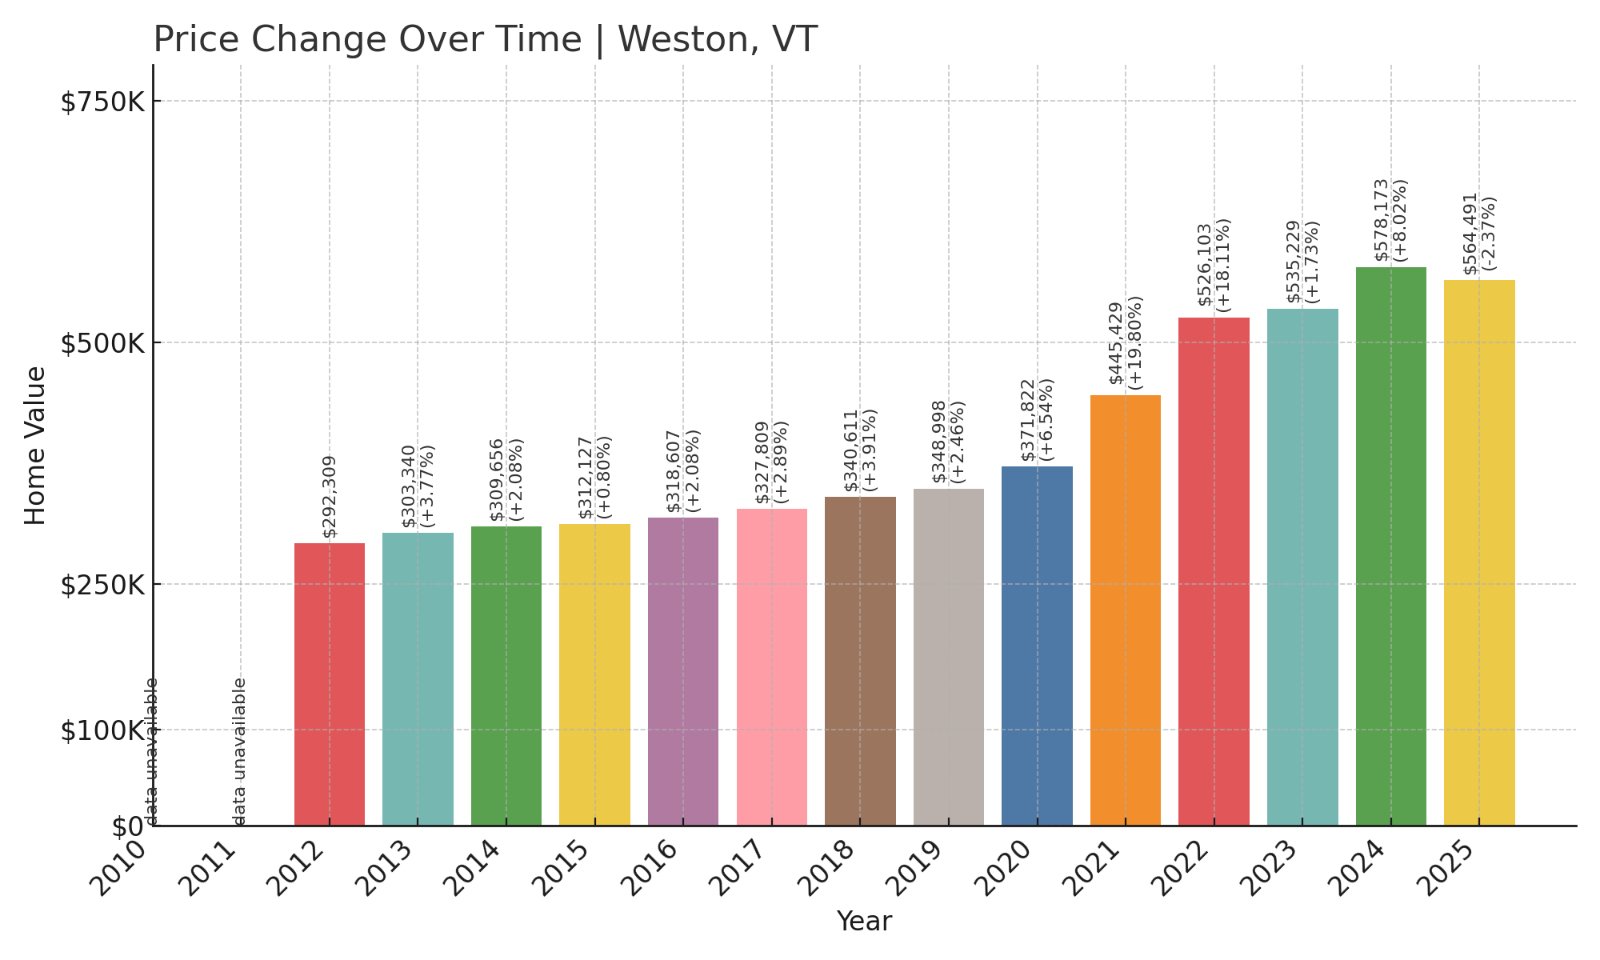
- 2012: $292,309
- 2013: $303,340 (+$11,031, +3.77%)
- 2014: $309,656 (+$6,316, +2.08%)
- 2015: $312,127 (+$2,470, +0.80%)
- 2016: $318,607 (+$6,480, +2.08%)
- 2017: $327,809 (+$9,202, +2.89%)
- 2018: $340,611 (+$12,802, +3.91%)
- 2019: $348,998 (+$8,387, +2.46%)
- 2020: $371,822 (+$22,825, +6.54%)
- 2021: $445,429 (+$73,607, +19.80%)
- 2022: $526,103 (+$80,674, +18.11%)
- 2023: $535,229 (+$9,126, +1.73%)
- 2024: $578,173 (+$42,945, +8.02%)
- 2025: $564,491 (-$13,682, -2.37%)
Weston saw a substantial 93% rise in home prices between 2012 and 2025. After a relatively quiet start, price growth took off in 2021 and 2022 with increases near or above 20%. Though prices dipped slightly in 2025, Weston remains one of Vermont’s most valuable small towns.
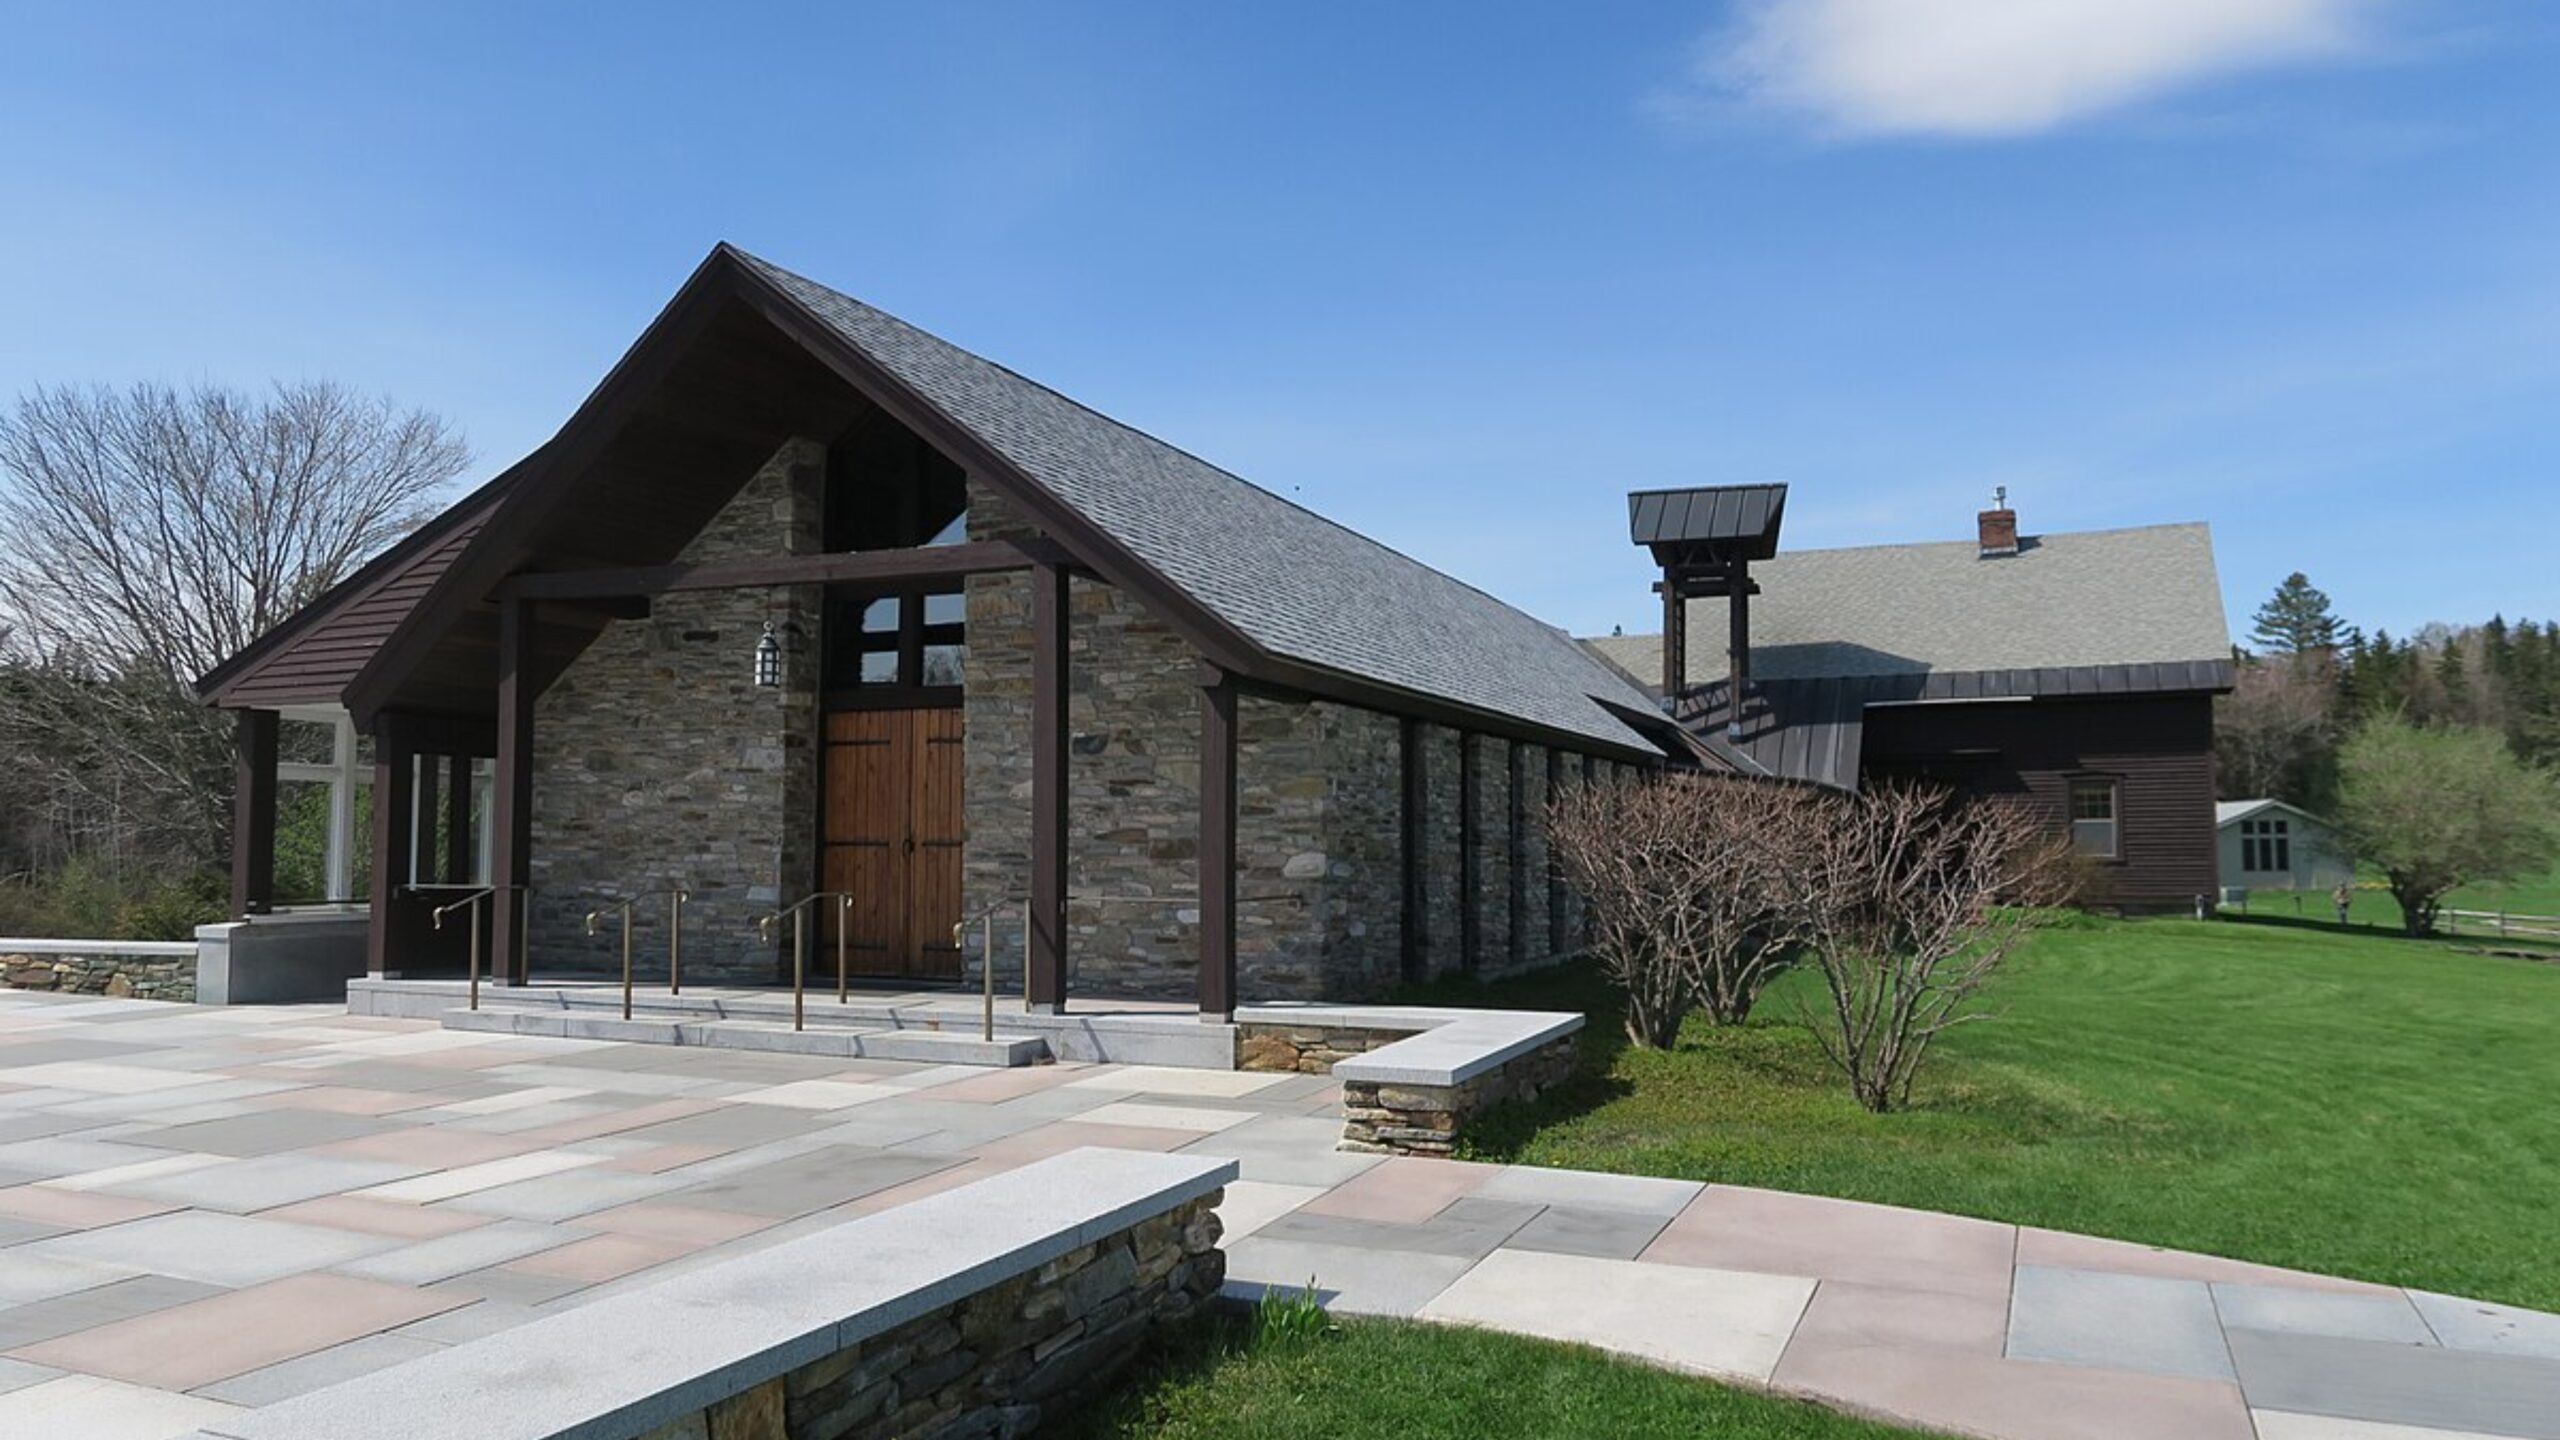
Weston – Scenic Village With Skyrocketing Appeal
Would you like to save this?
Weston is a postcard-worthy village located in southern Vermont’s Windsor County. It’s perhaps best known for the Weston Playhouse, Vermont’s oldest professional theater, and for its historic village green. Its cultural cachet and quaint ambiance make it a favorite for second-home buyers and retirees.
Easy access to ski areas like Okemo and Stratton, as well as a walkable center filled with galleries and shops, enhances Weston’s desirability. With limited housing inventory and strong demand for vacation homes, prices soared after 2020. That demand, combined with Weston’s charm and heritage, makes its housing market one of Vermont’s top performers.
18. Richmond – 76% Home Price Increase Since 2012
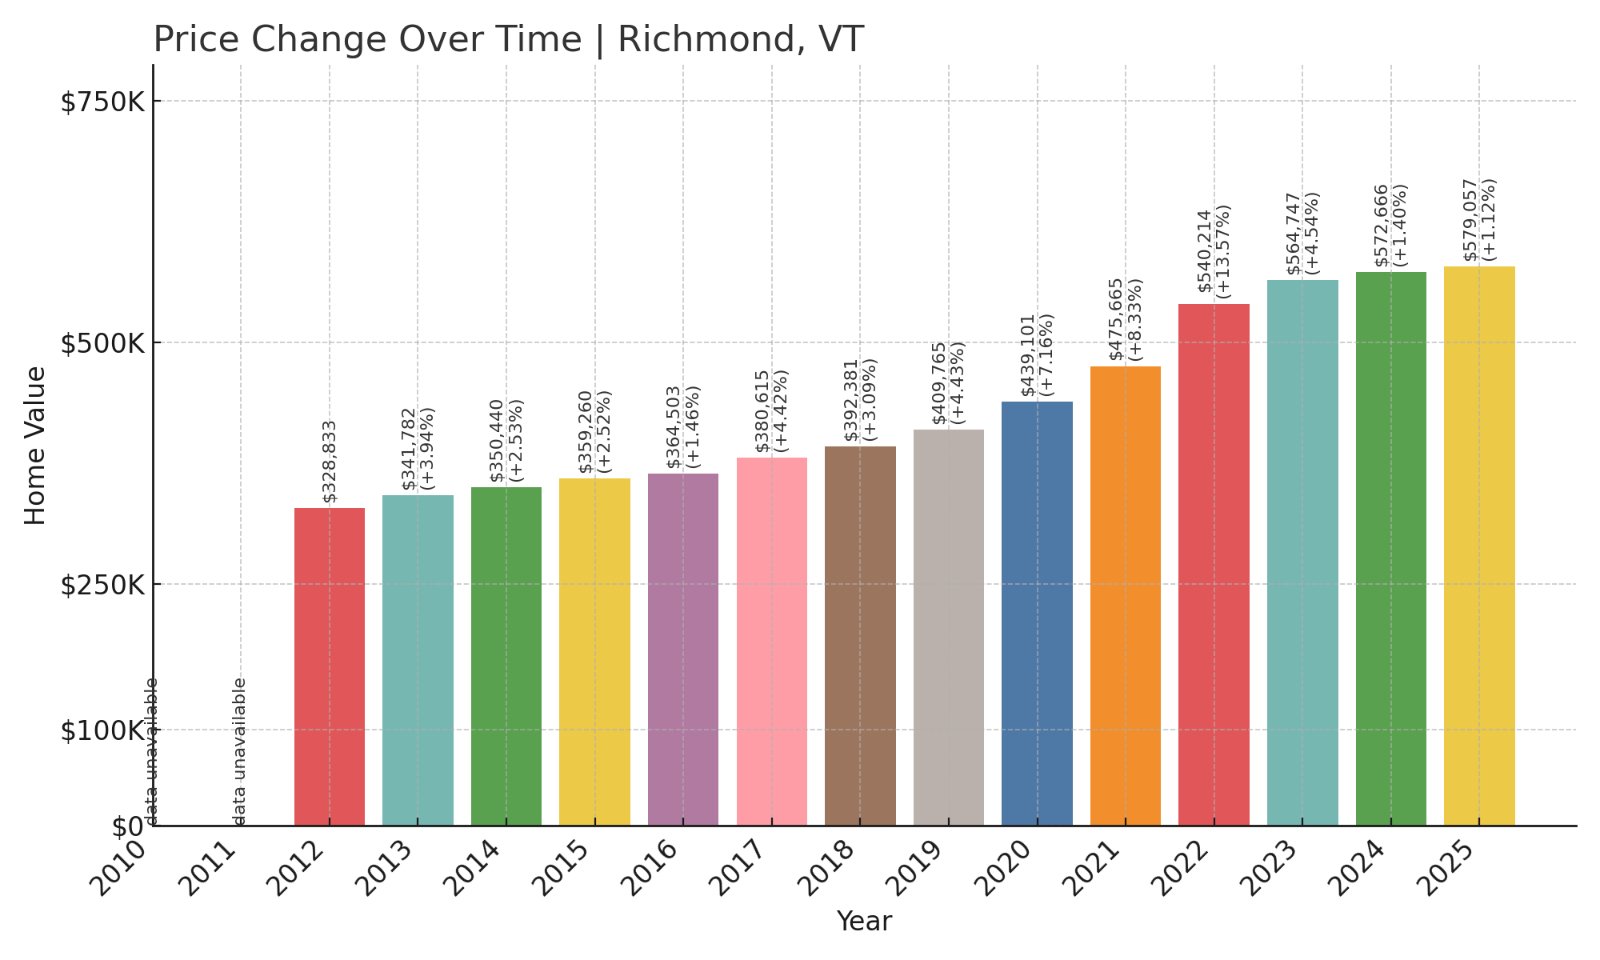
- 2012: $328,833
- 2013: $341,782 (+$12,949, +3.94%)
- 2014: $350,440 (+$8,658, +2.53%)
- 2015: $359,260 (+$8,821, +2.52%)
- 2016: $364,503 (+$5,243, +1.46%)
- 2017: $380,615 (+$16,112, +4.42%)
- 2018: $392,381 (+$11,766, +3.09%)
- 2019: $409,765 (+$17,384, +4.43%)
- 2020: $439,101 (+$29,335, +7.16%)
- 2021: $475,665 (+$36,564, +8.33%)
- 2022: $540,214 (+$64,549, +13.57%)
- 2023: $564,747 (+$24,534, +4.54%)
- 2024: $572,666 (+$7,919, +1.40%)
- 2025: $579,057 (+$6,391, +1.12%)
Richmond’s home values climbed steadily from 2012 onward, accumulating a 76% gain through 2025. Growth here has been consistent year-over-year, with strong spikes post-2020 reflecting broader market trends and increasing buyer interest in suburban and rural locations.
Richmond – Reliable Growth in a Commuter-Friendly Hub
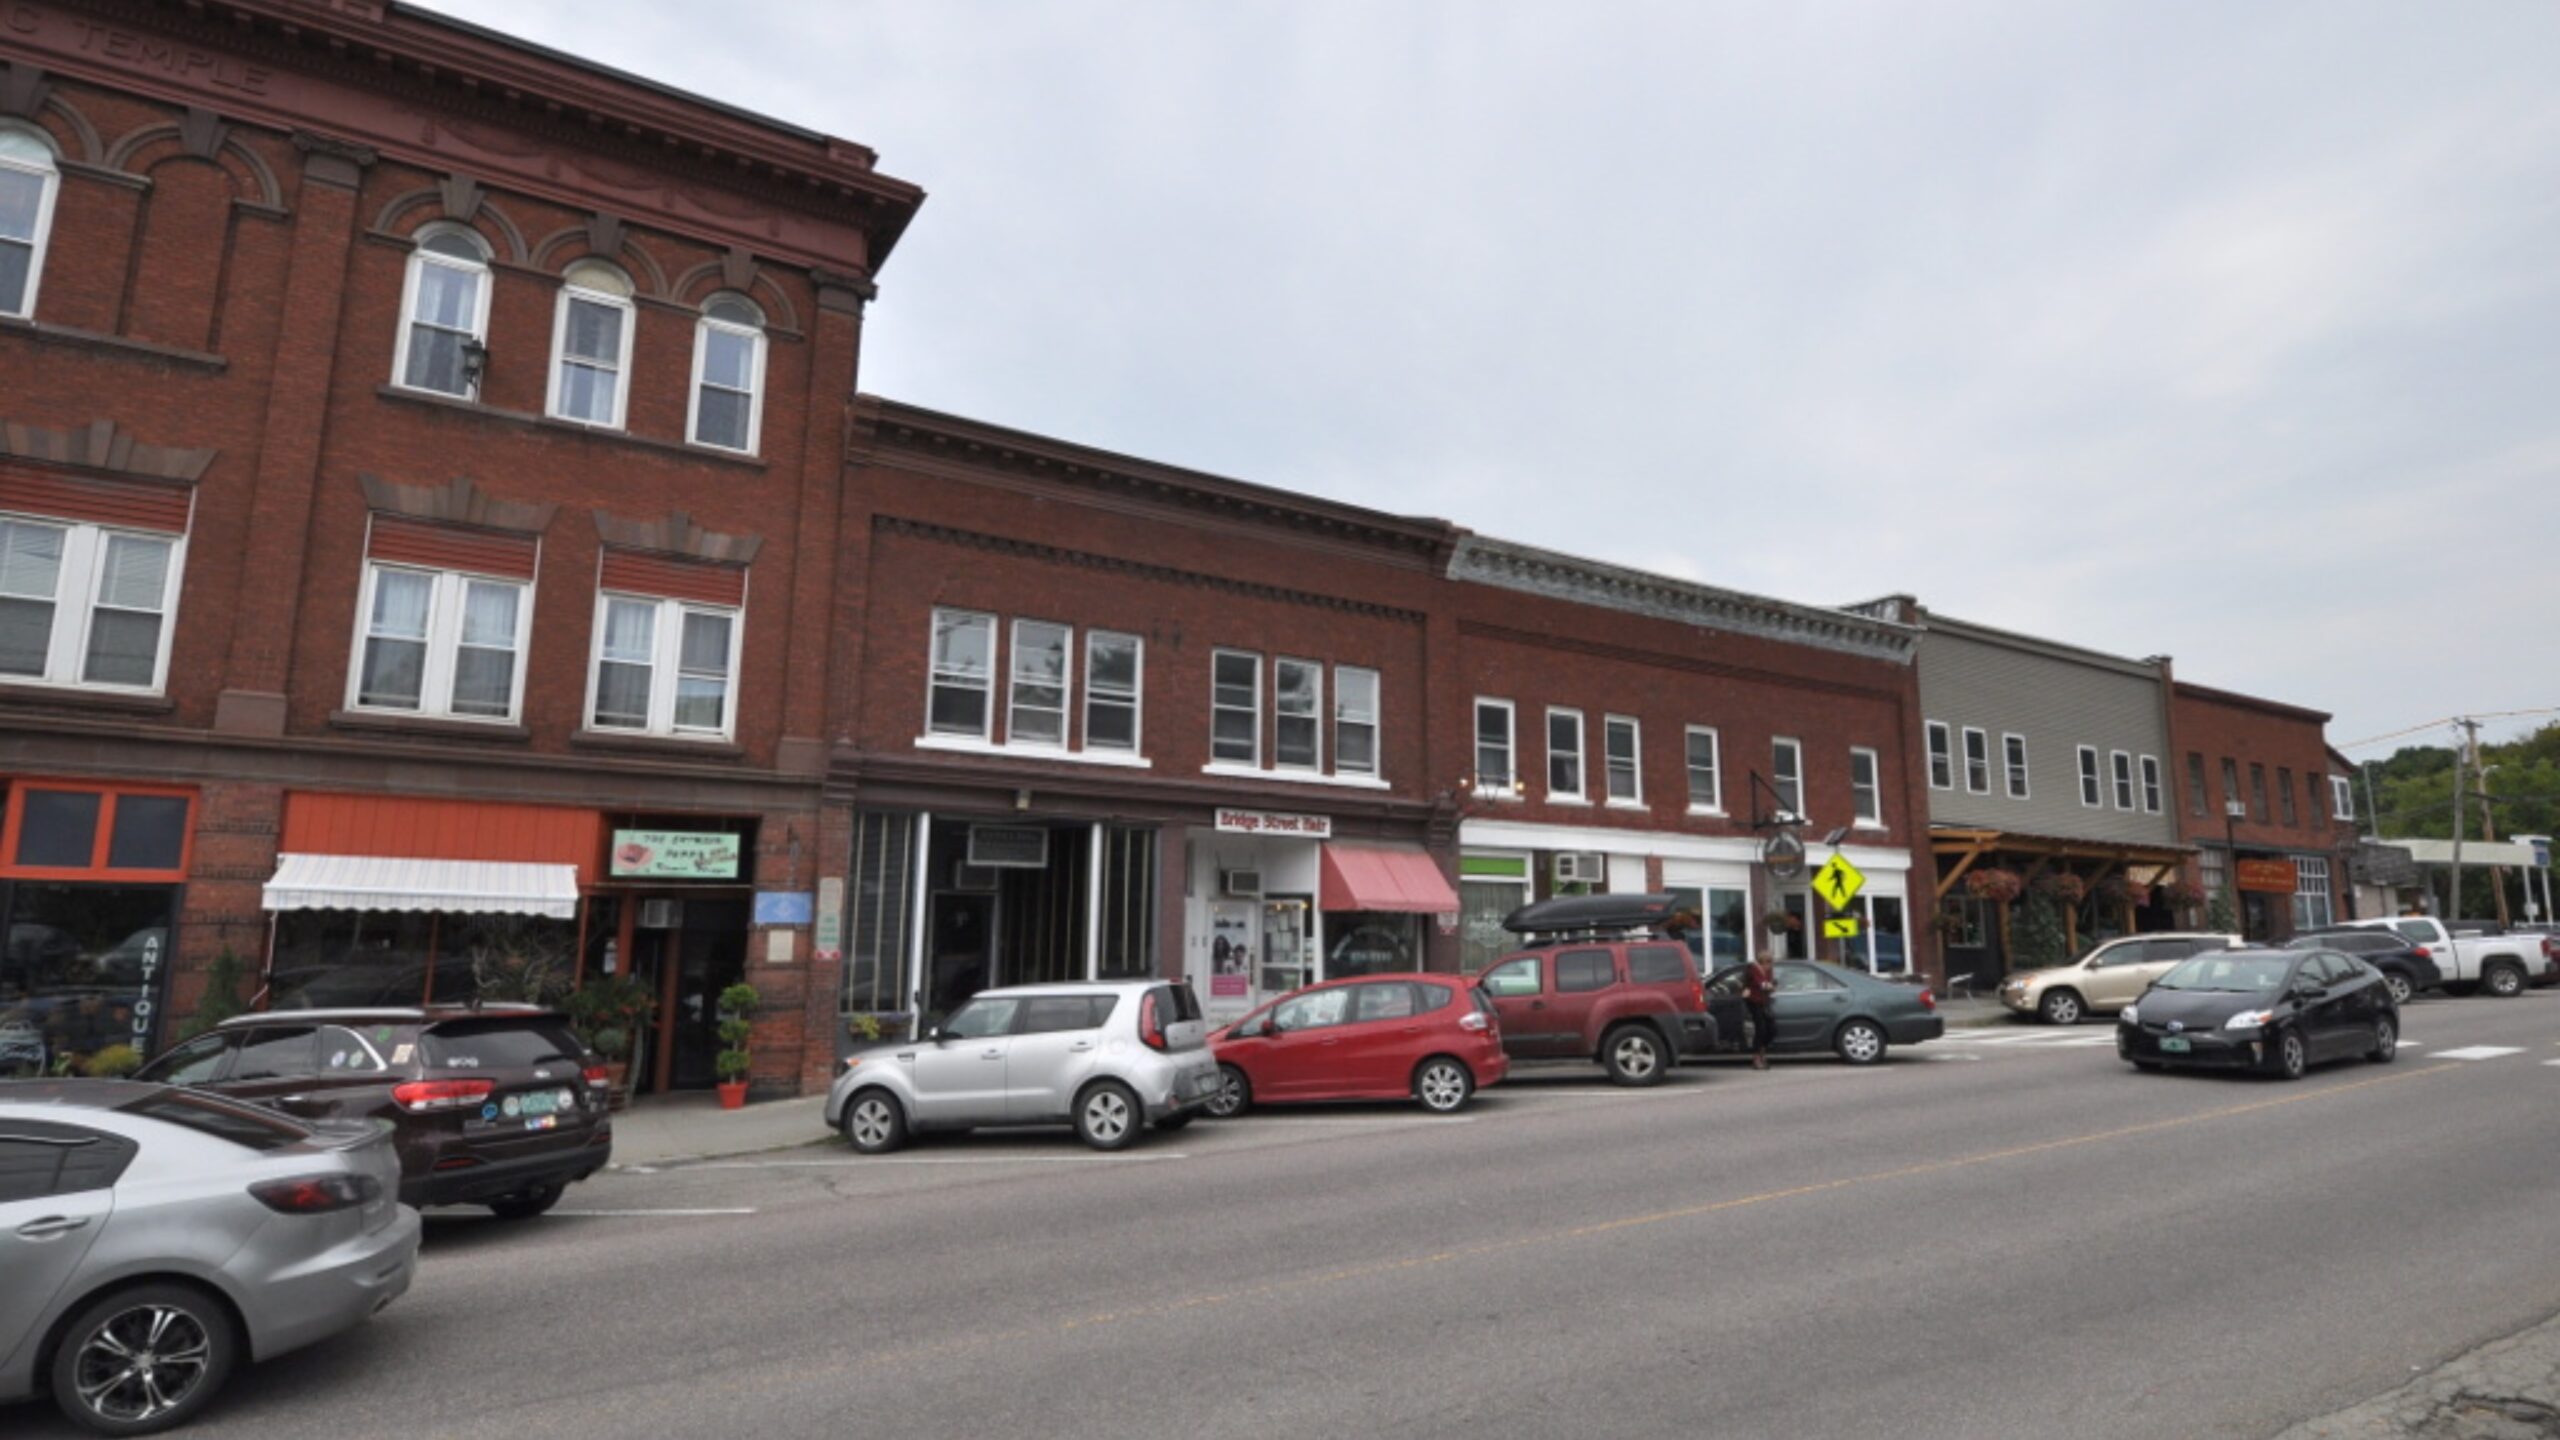
Richmond is conveniently located southeast of Burlington, straddling Interstate 89, making it a desirable location for professionals commuting into Chittenden County’s urban centers. It blends scenic living with accessibility — a major selling point in today’s housing market.
The town’s access to outdoor attractions like the Winooski River and Camel’s Hump, paired with a vibrant local food scene, contributes to its popularity. With good schools and relatively affordable starting values compared to larger towns, Richmond has become a go-to spot for buyers seeking long-term stability and a high quality of life.
17. Underhill – 70% Home Price Increase Since 2012
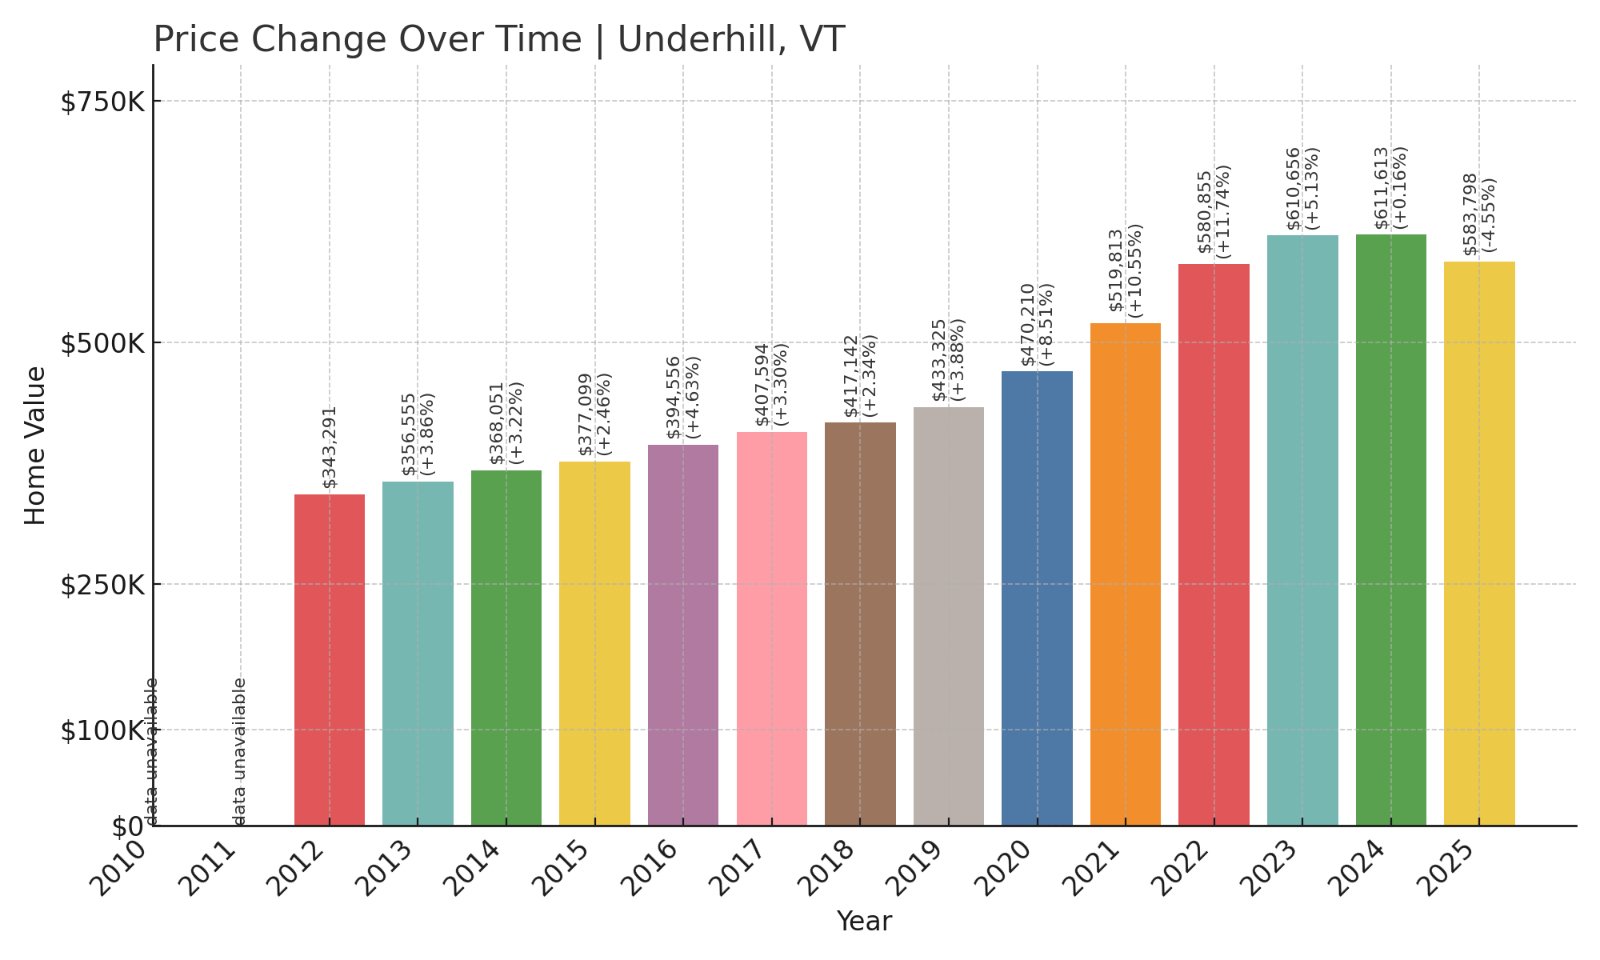
- 2012: $343,291
- 2013: $356,555 (+$13,263, +3.86%)
- 2014: $368,051 (+$11,496, +3.22%)
- 2015: $377,099 (+$9,048, +2.46%)
- 2016: $394,556 (+$17,458, +4.63%)
- 2017: $407,594 (+$13,037, +3.30%)
- 2018: $417,142 (+$9,548, +2.34%)
- 2019: $433,325 (+$16,183, +3.88%)
- 2020: $470,210 (+$36,885, +8.51%)
- 2021: $519,813 (+$49,603, +10.55%)
- 2022: $580,855 (+$61,043, +11.74%)
- 2023: $610,656 (+$29,801, +5.13%)
- 2024: $611,613 (+$957, +0.16%)
- 2025: $583,798 (-$27,816, -4.55%)
Underhill experienced a 70% increase in home values from 2012 through 2025, with a steep climb in the early 2020s. Although 2025 saw a slight retreat, long-term growth has been robust, underlining the town’s transformation into one of Vermont’s high-value destinations.
Underhill – Big Price Gains in a Quiet Setting
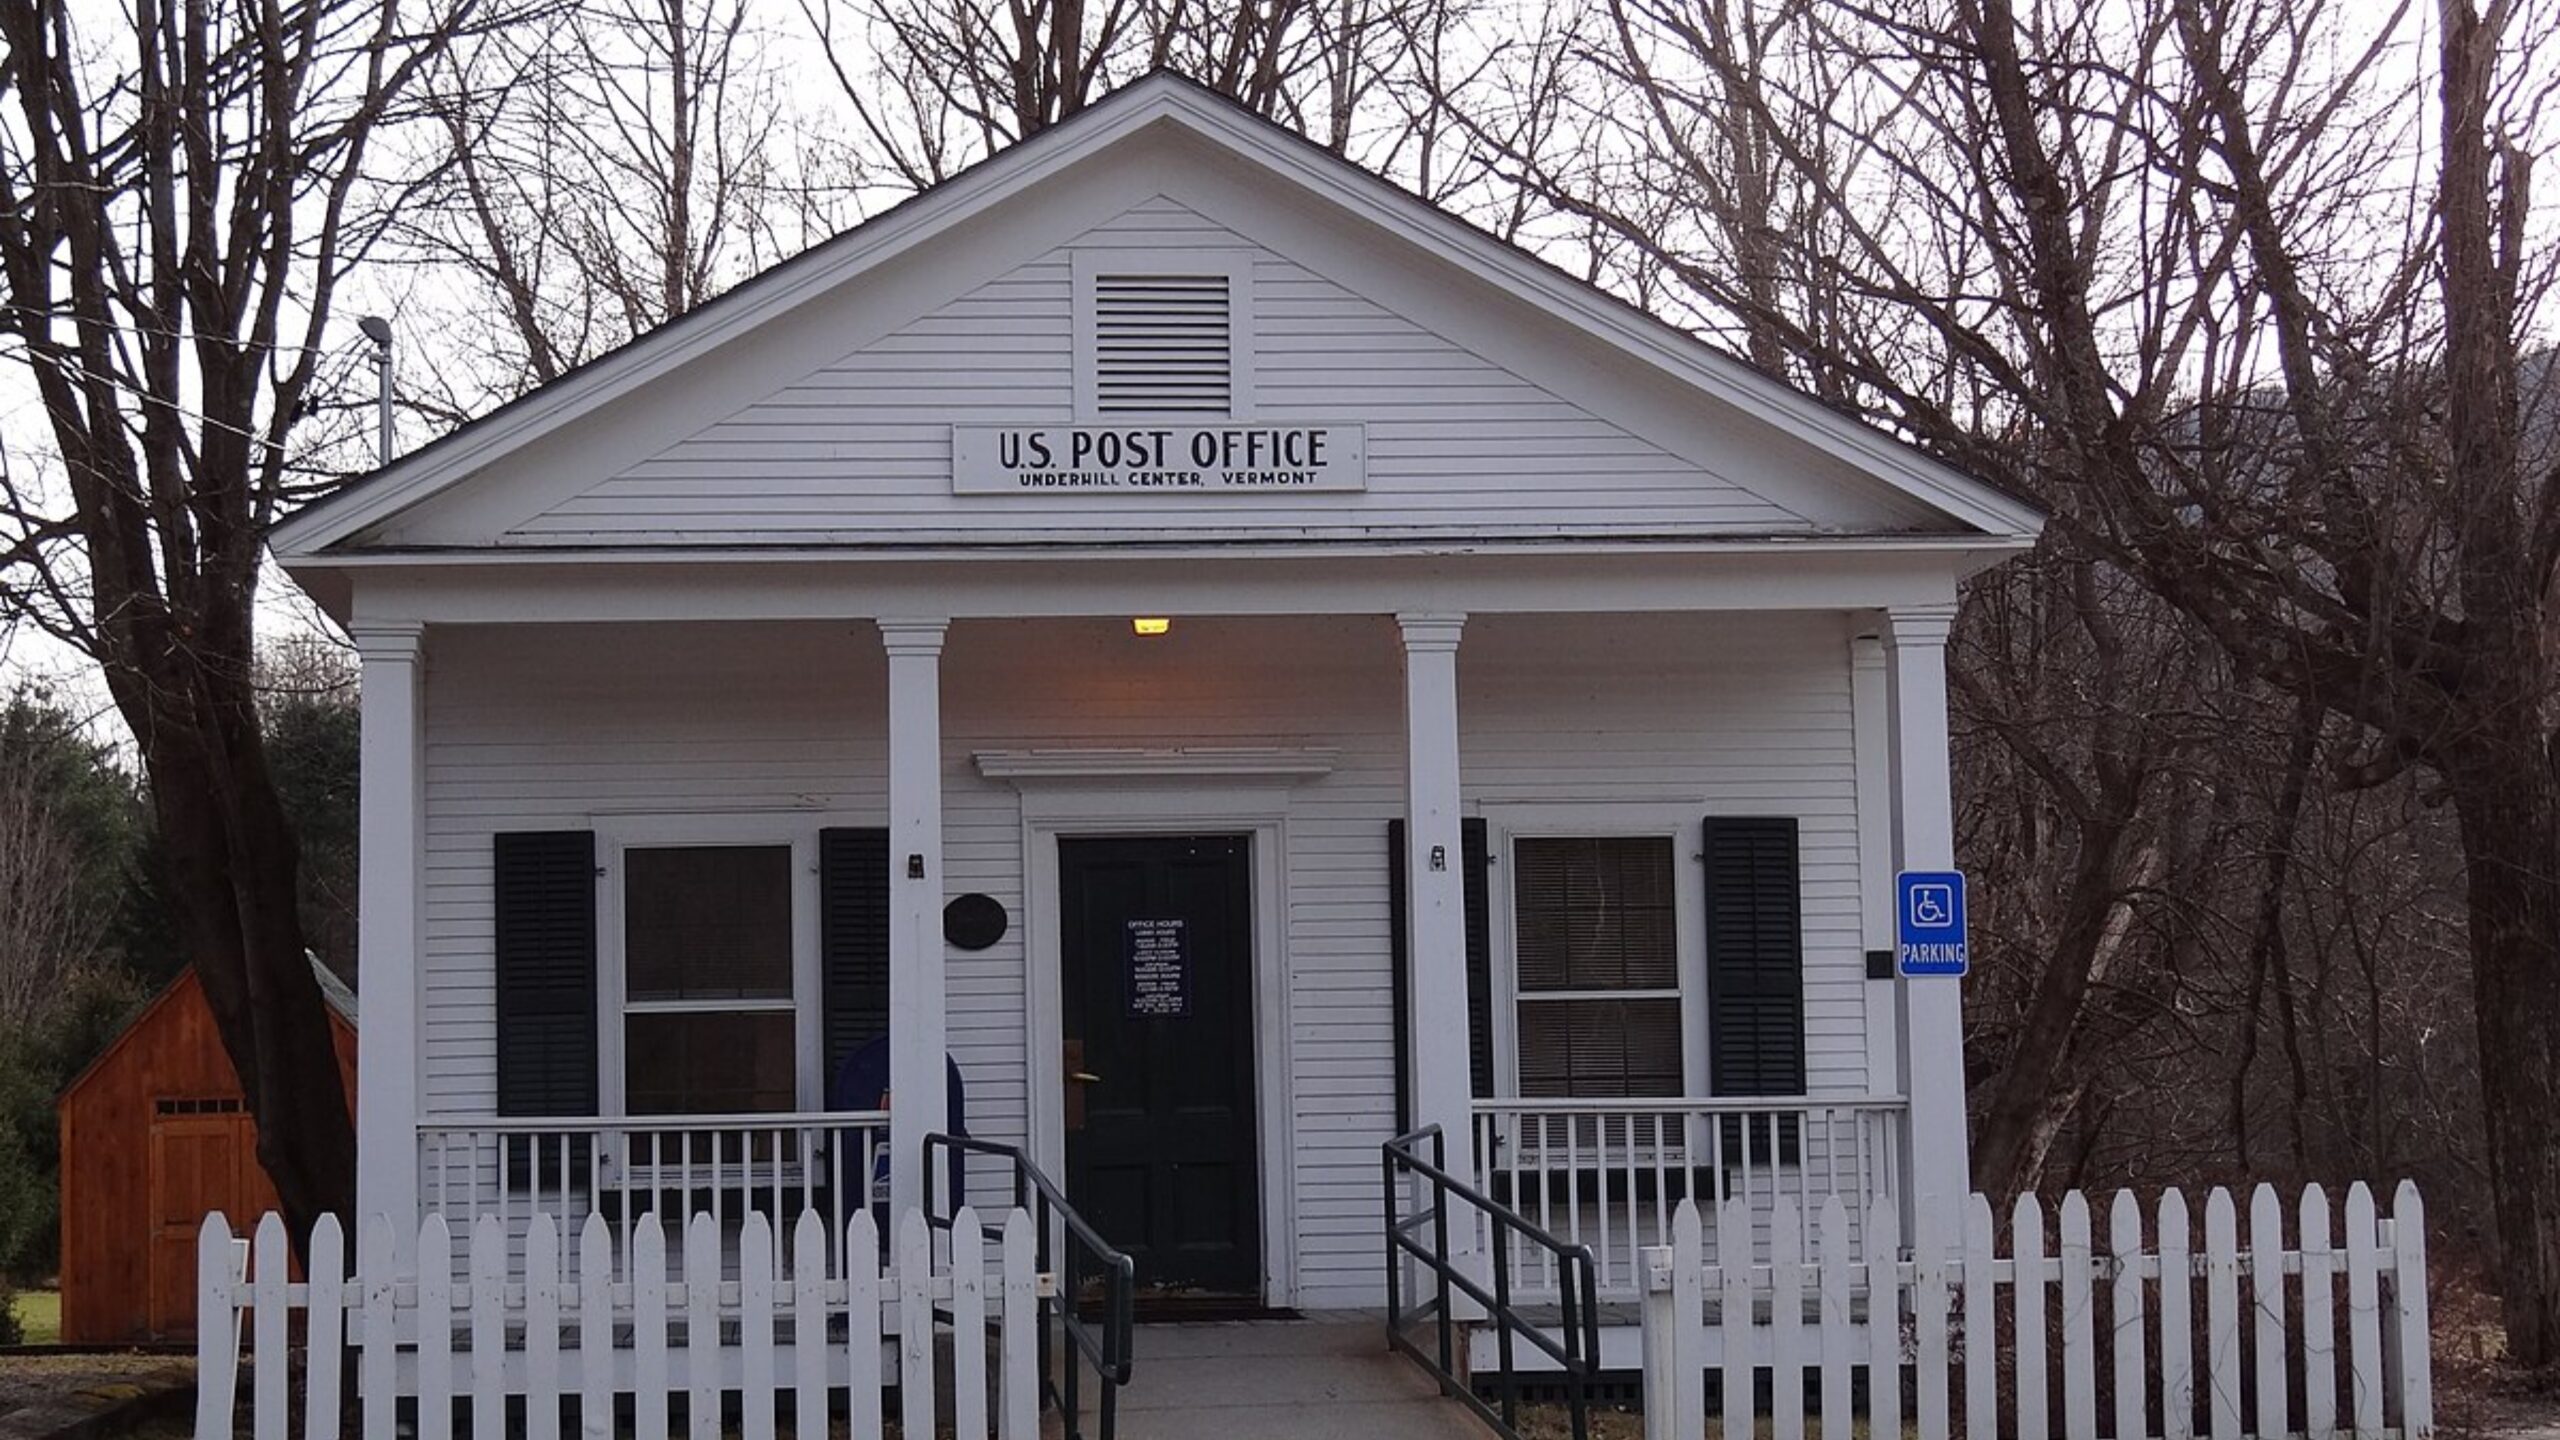
Underhill sits at the base of Mount Mansfield and offers sweeping views and a true Vermont rural experience. Its tranquility and access to hiking and skiing have increasingly attracted buyers looking for second homes or lifestyle properties. It also offers proximity to Essex and Burlington without the denser population.
While inventory remains limited, demand has surged in recent years, especially from buyers relocating from out-of-state. That surge in interest is reflected in the sharp increases between 2020 and 2022. Although the most recent figures show a modest drop, Underhill’s desirability remains intact, sustained by its natural beauty and peaceful pace.
16. Williston – 107% Home Price Increase Since 2010
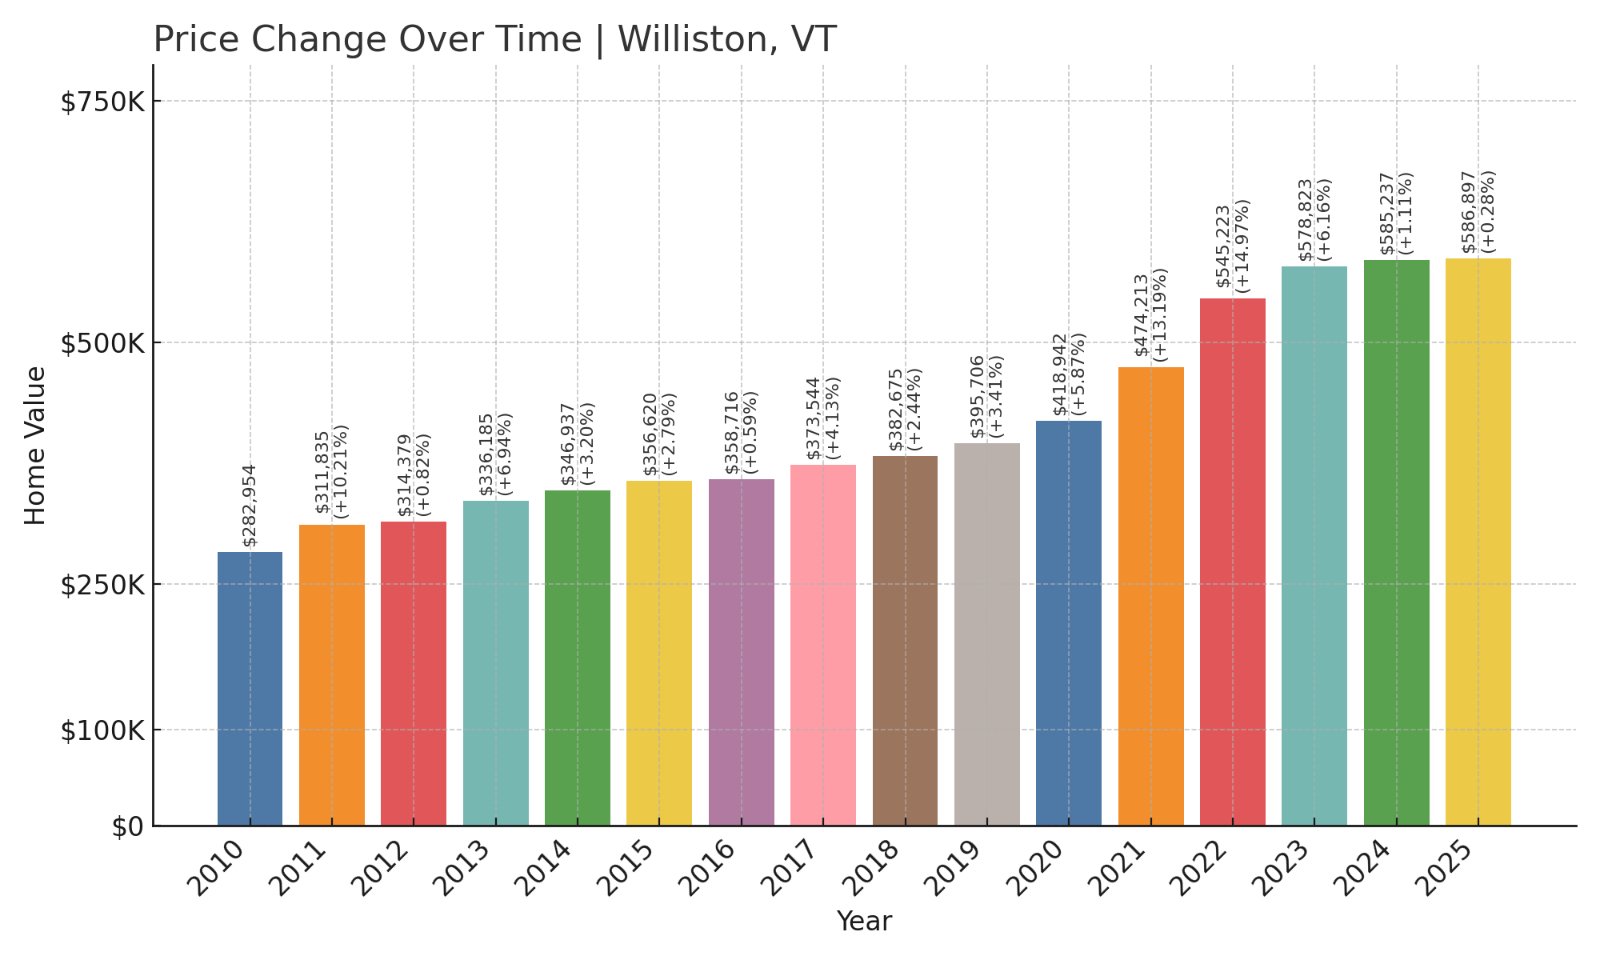
- 2010: $282,954
- 2011: $311,835 (+$28,881, +10.21%)
- 2012: $314,379 (+$2,544, +0.82%)
- 2013: $336,185 (+$21,807, +6.94%)
- 2014: $346,937 (+$10,752, +3.20%)
- 2015: $356,620 (+$9,683, +2.79%)
- 2016: $358,716 (+$2,096, +0.59%)
- 2017: $373,544 (+$14,828, +4.13%)
- 2018: $382,675 (+$9,131, +2.44%)
- 2019: $395,706 (+$13,031, +3.41%)
- 2020: $418,942 (+$23,236, +5.87%)
- 2021: $474,213 (+$55,270, +13.19%)
- 2022: $545,223 (+$71,010, +14.97%)
- 2023: $578,823 (+$33,600, +6.16%)
- 2024: $585,237 (+$6,414, +1.11%)
- 2025: $586,897 (+$1,660, +0.28%)
Home prices in Williston have more than doubled since 2010, climbing 107% over 15 years. The strongest gains occurred between 2020 and 2022, when double-digit annual increases became the norm. Recent years have seen a more tempered pace, but Williston’s long-term growth is undeniable.
Williston – Commerce and Community Fuel Growth
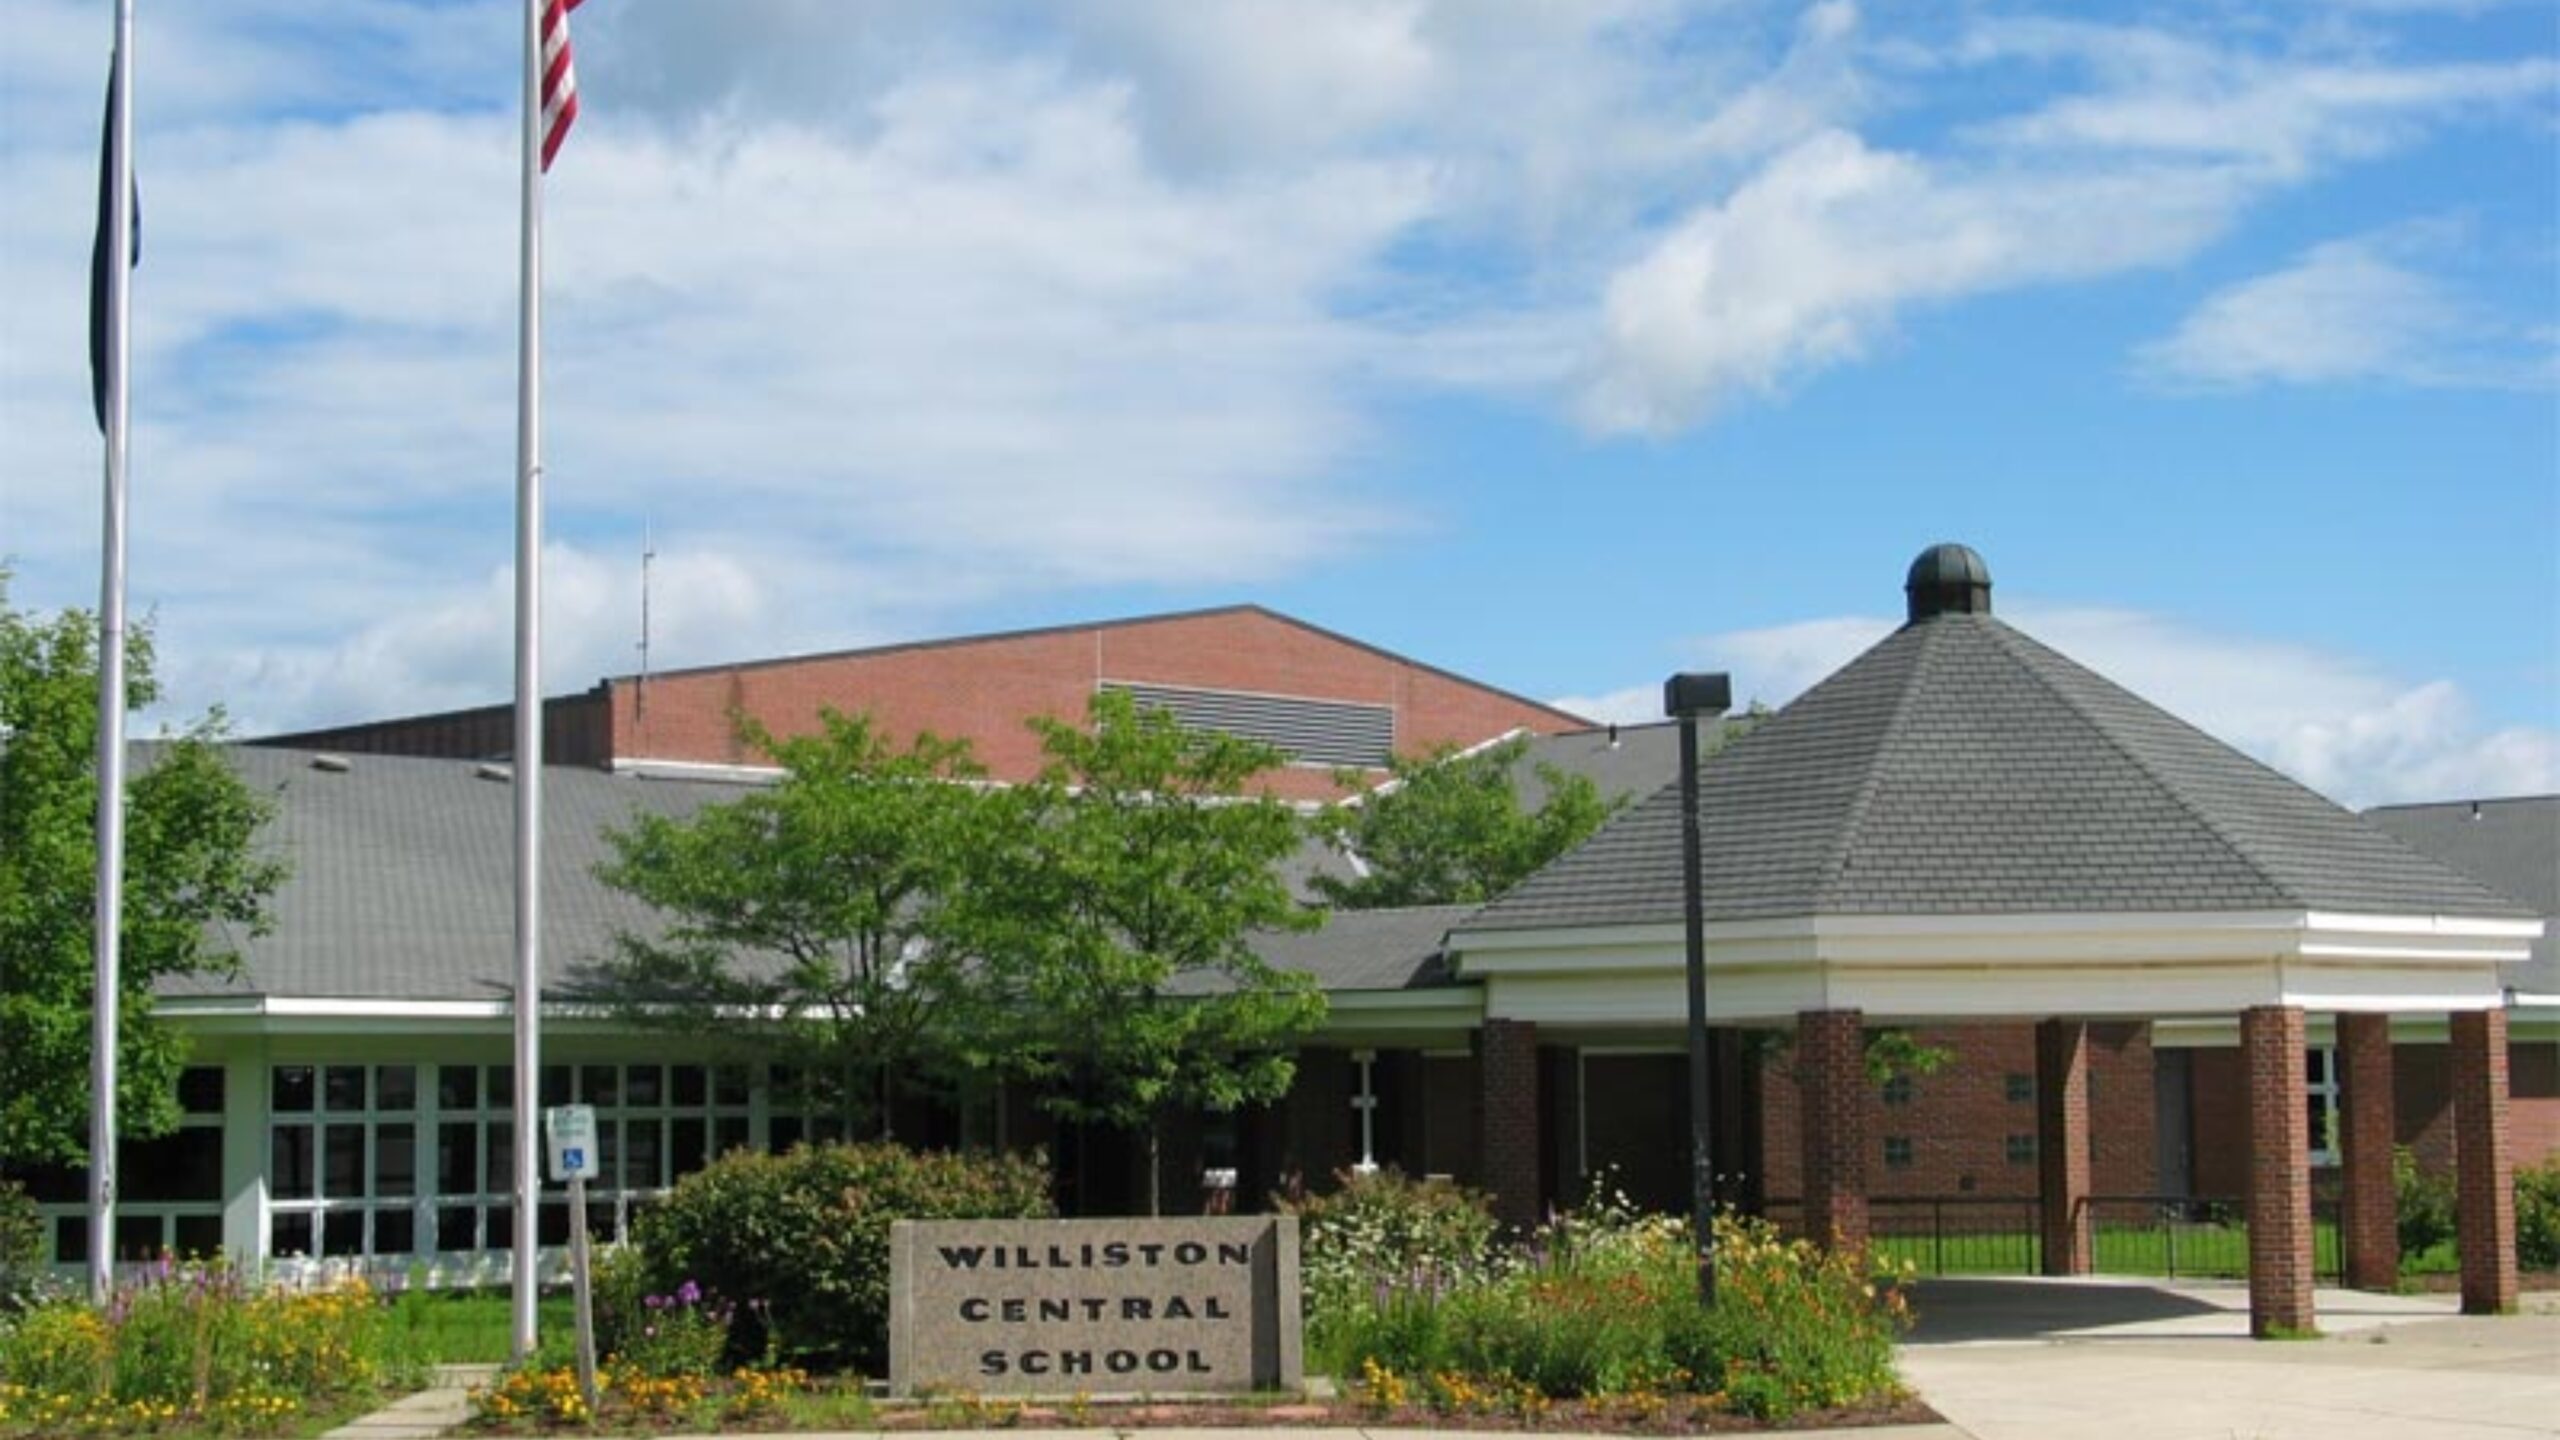
Williston is one of the fastest-growing communities in Chittenden County, thanks in part to its mix of suburban convenience and economic opportunity. Located just east of South Burlington, it hosts a large share of the region’s retail, warehouse, and commercial development — making it a key employment hub and shopping destination.
The town’s strong tax base and infrastructure investment have helped it absorb population growth while maintaining a high quality of life. New housing developments have contributed to supply, yet demand continues to outpace it, especially from professionals and families. Williston’s impressive housing appreciation reflects both market momentum and strong fundamentals.
15. Barnard – 84% Home Price Increase Since 2012
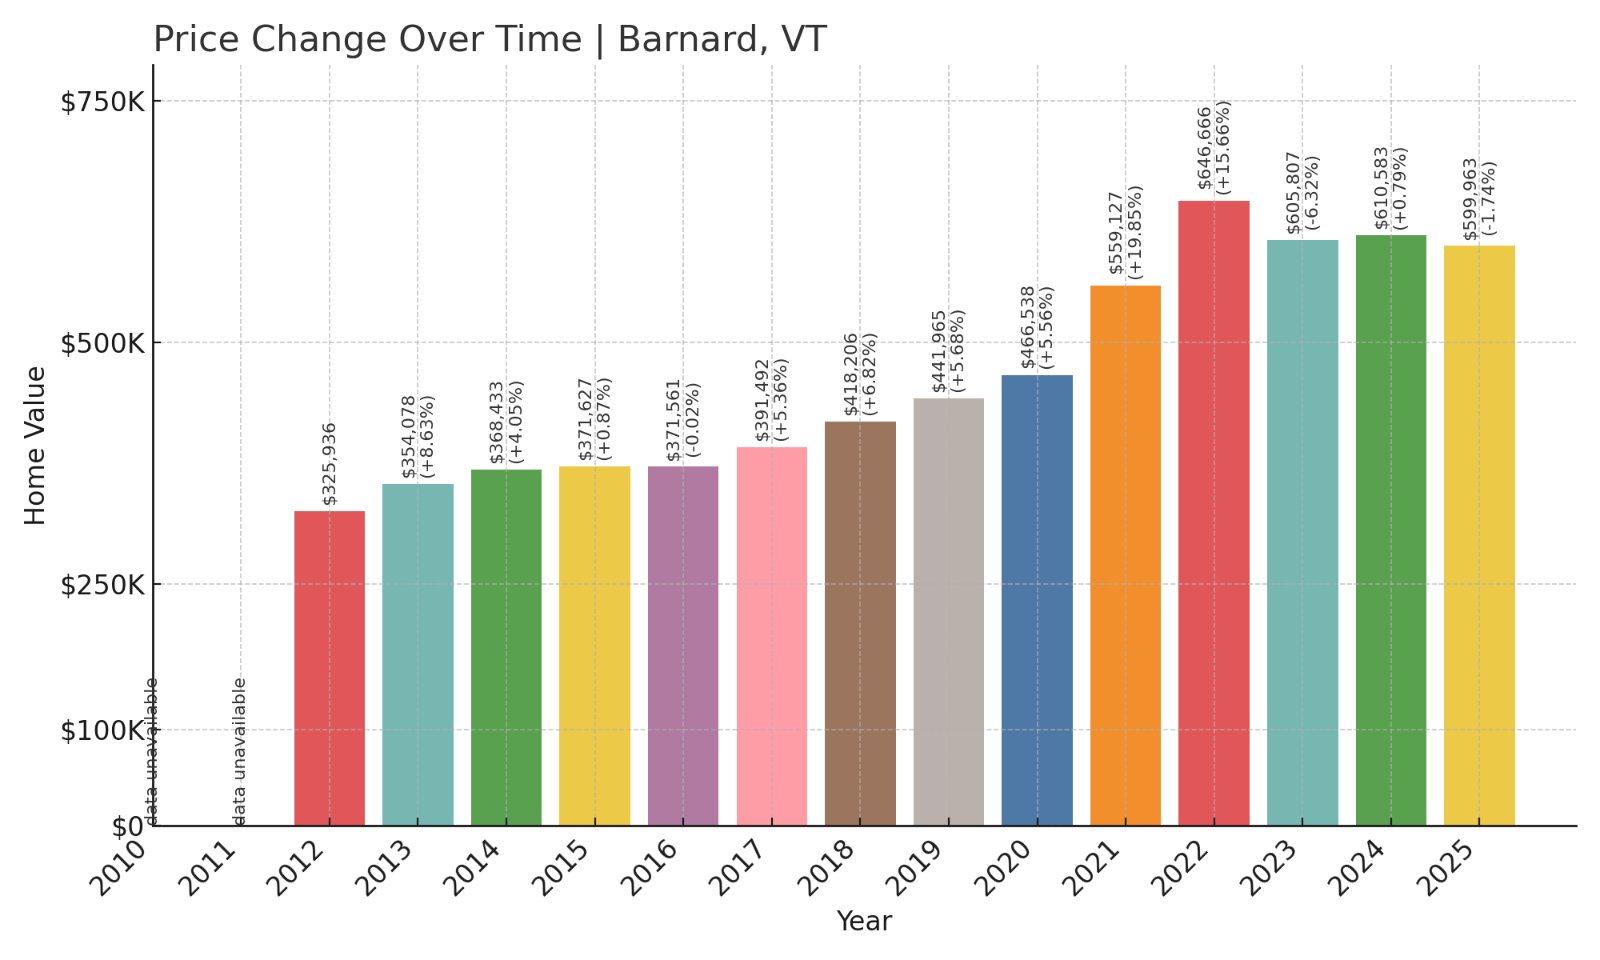
- 2012: $325,936
- 2013: $354,078 (+$28,142, +8.63%)
- 2014: $368,433 (+$14,356, +4.05%)
- 2015: $371,627 (+$3,193, +0.87%)
- 2016: $371,561 (-$66, -0.02%)
- 2017: $391,492 (+$19,931, +5.36%)
- 2018: $418,206 (+$26,714, +6.82%)
- 2019: $441,965 (+$23,759, +5.68%)
- 2020: $466,538 (+$24,572, +5.56%)
- 2021: $559,127 (+$92,589, +19.85%)
- 2022: $646,666 (+$87,539, +15.66%)
- 2023: $605,807 (-$40,859, -6.32%)
- 2024: $610,583 (+$4,776, +0.79%)
- 2025: $599,963 (-$10,620, -1.74%)
Barnard saw an 84% increase in home values from 2012 to 2025. After slow early growth, prices surged in 2021 and 2022 with back-to-back double-digit spikes. Though recent years reflect modest declines, the overall trajectory remains strongly positive.
Barnard – A Quiet Retreat With Rising Prestige
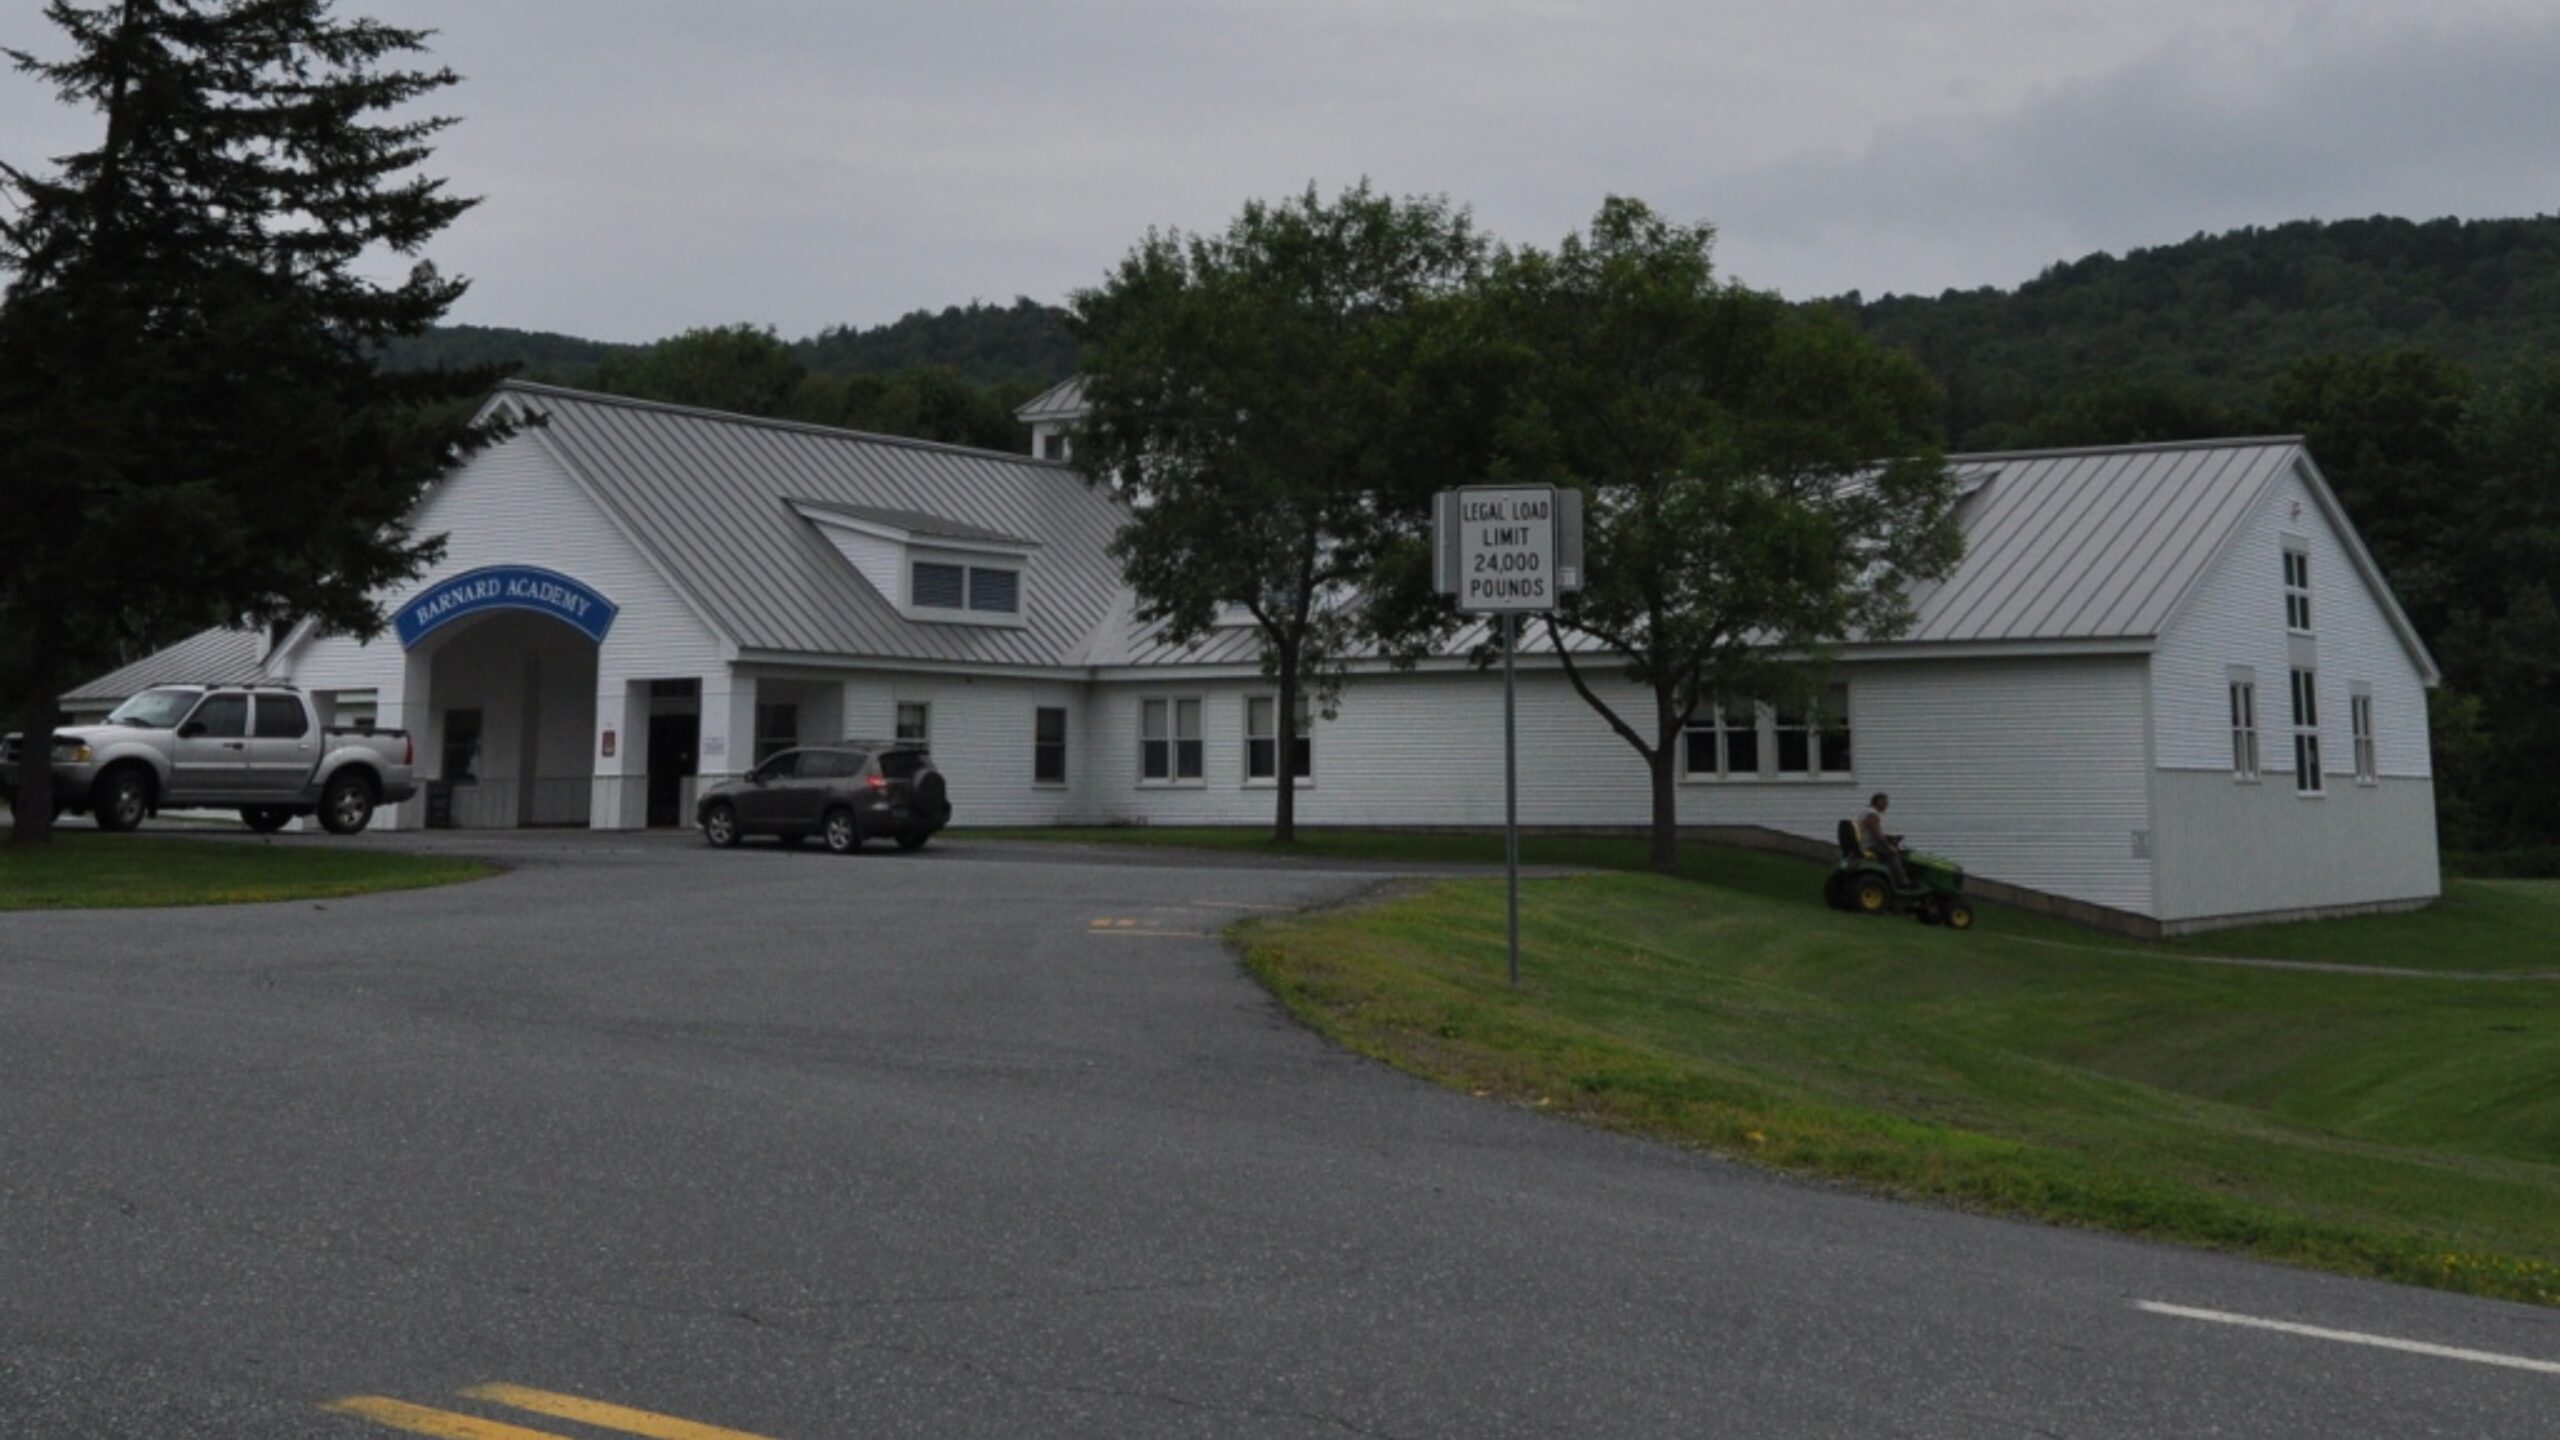
Barnard, tucked in central Vermont, is a town known for serenity and natural beauty. Silver Lake State Park and the surrounding woodlands attract buyers looking for a peaceful second home or remote work base. Its rural charm, paired with limited housing inventory, has helped push prices higher.
The town’s market is driven in part by its exclusivity — it has no big-box stores or dense development. This has created strong appeal among higher-end buyers who value privacy and unspoiled scenery. Barnard’s impressive appreciation speaks to its transformation into one of Vermont’s most desirable rural enclaves.
14. Cornwall – 90% Home Price Increase Since 2010
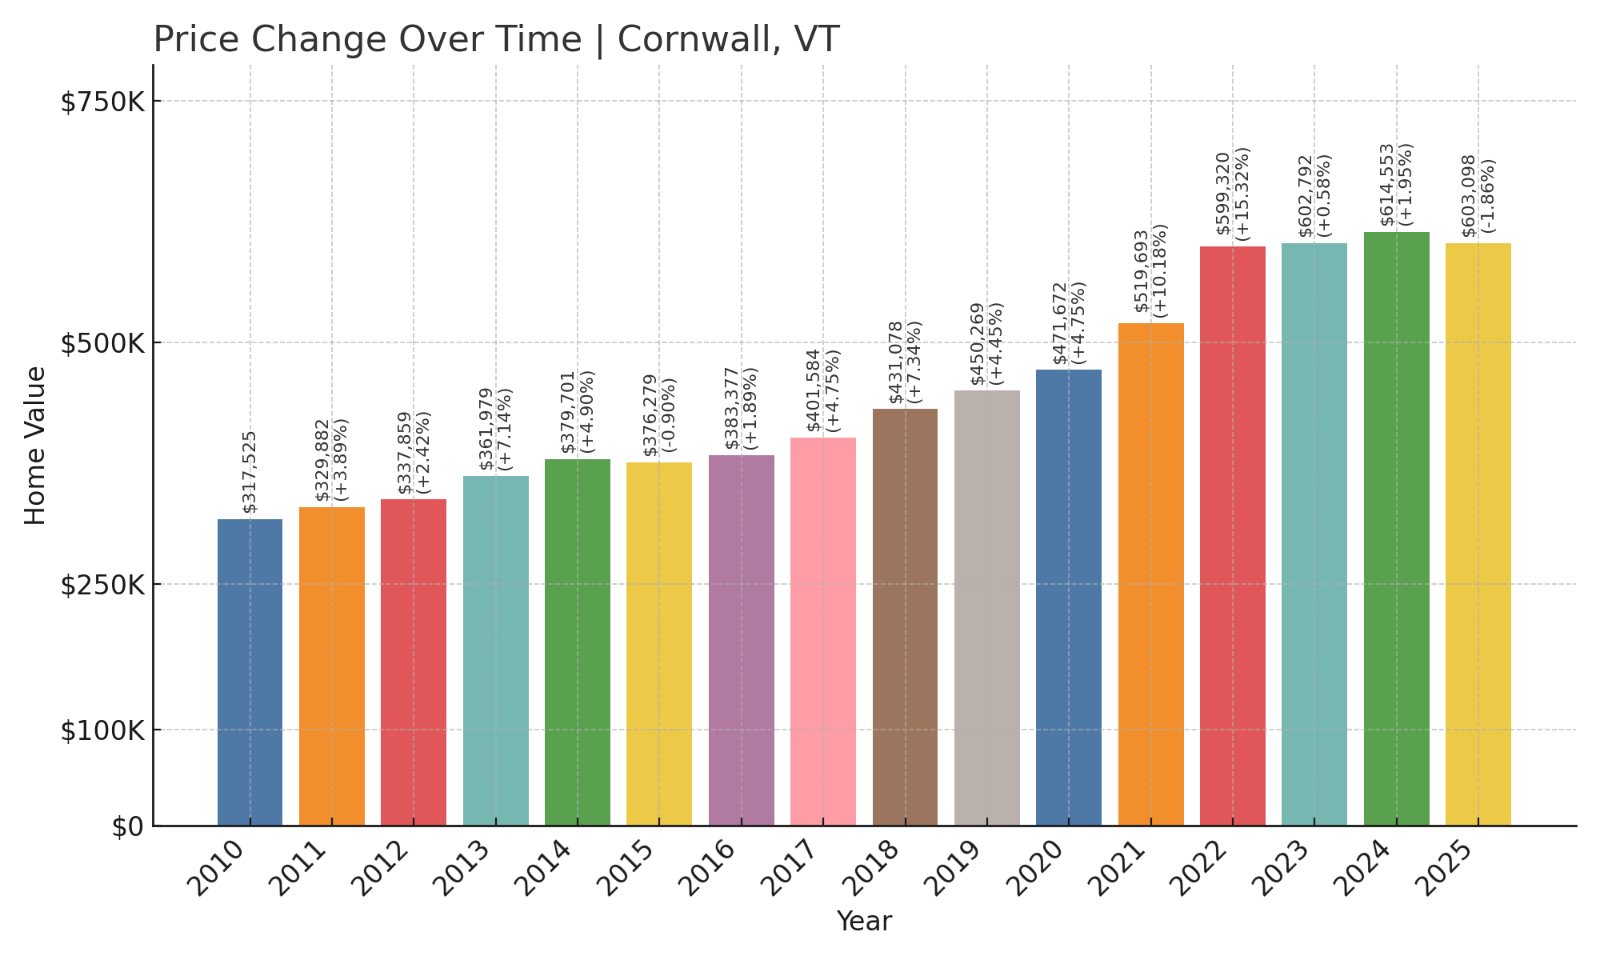
- 2010: $317,525
- 2011: $329,882 (+$12,357, +3.89%)
- 2012: $337,859 (+$7,977, +2.42%)
- 2013: $361,979 (+$24,120, +7.14%)
- 2014: $379,701 (+$17,722, +4.90%)
- 2015: $376,279 (-$3,422, -0.90%)
- 2016: $383,377 (+$7,097, +1.89%)
- 2017: $401,584 (+$18,207, +4.75%)
- 2018: $431,078 (+$29,494, +7.34%)
- 2019: $450,269 (+$19,192, +4.45%)
- 2020: $471,672 (+$21,402, +4.75%)
- 2021: $519,693 (+$48,021, +10.18%)
- 2022: $599,320 (+$79,628, +15.32%)
- 2023: $602,792 (+$3,471, +0.58%)
- 2024: $614,553 (+$11,761, +1.95%)
- 2025: $603,098 (-$11,455, -1.86%)
Cornwall’s home values rose 90% between 2010 and 2025, with steady increases across most years and especially sharp growth between 2020 and 2022. While 2025 shows a slight correction, the broader trend is clearly upward.
Cornwall – Quiet Excellence in Addison County
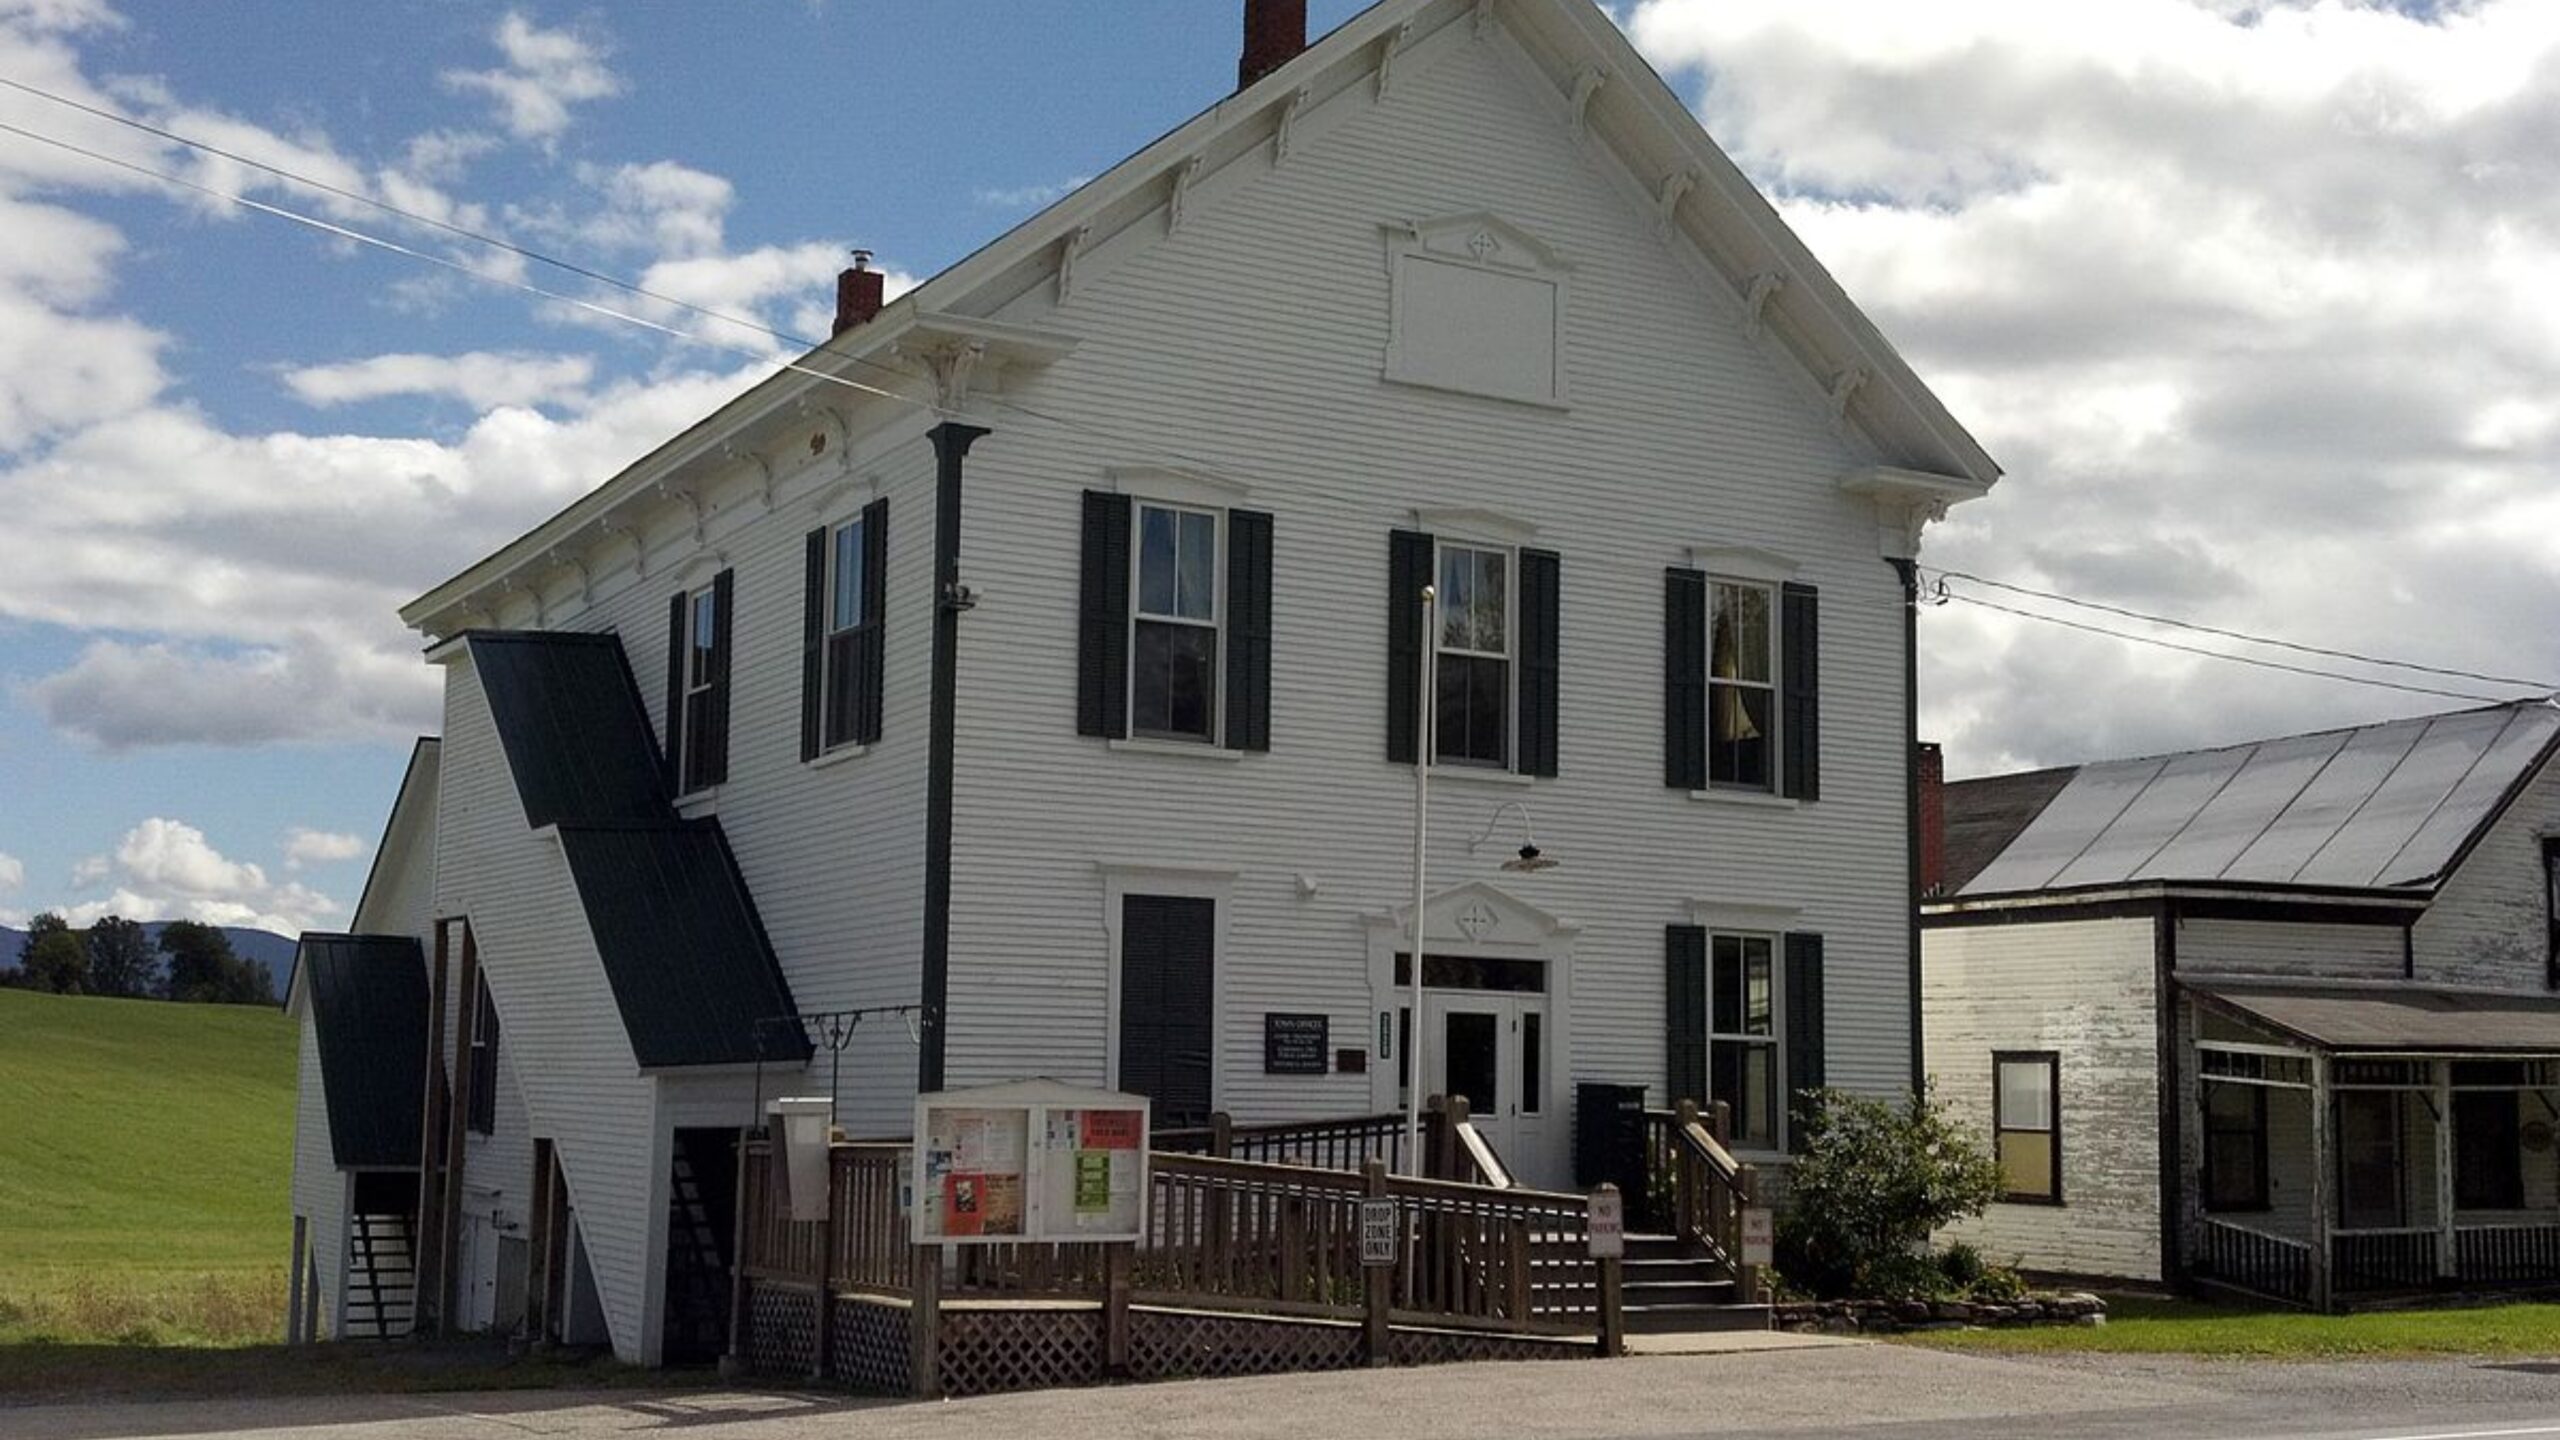
Located just southwest of Middlebury, Cornwall is a small, agriculturally rich town known for its pastoral beauty and panoramic views of the Green Mountains. Its close proximity to Middlebury College and downtown Middlebury adds to its appeal without sacrificing its peaceful setting.
Cornwall has grown in popularity among professionals and retirees seeking an elegant countryside lifestyle. Its housing market has historically been modest in volume, which has made it highly responsive to demand spikes. The recent price surge underscores growing interest in the area’s understated charm.
13. Ludlow – 89% Home Price Increase Since 2010
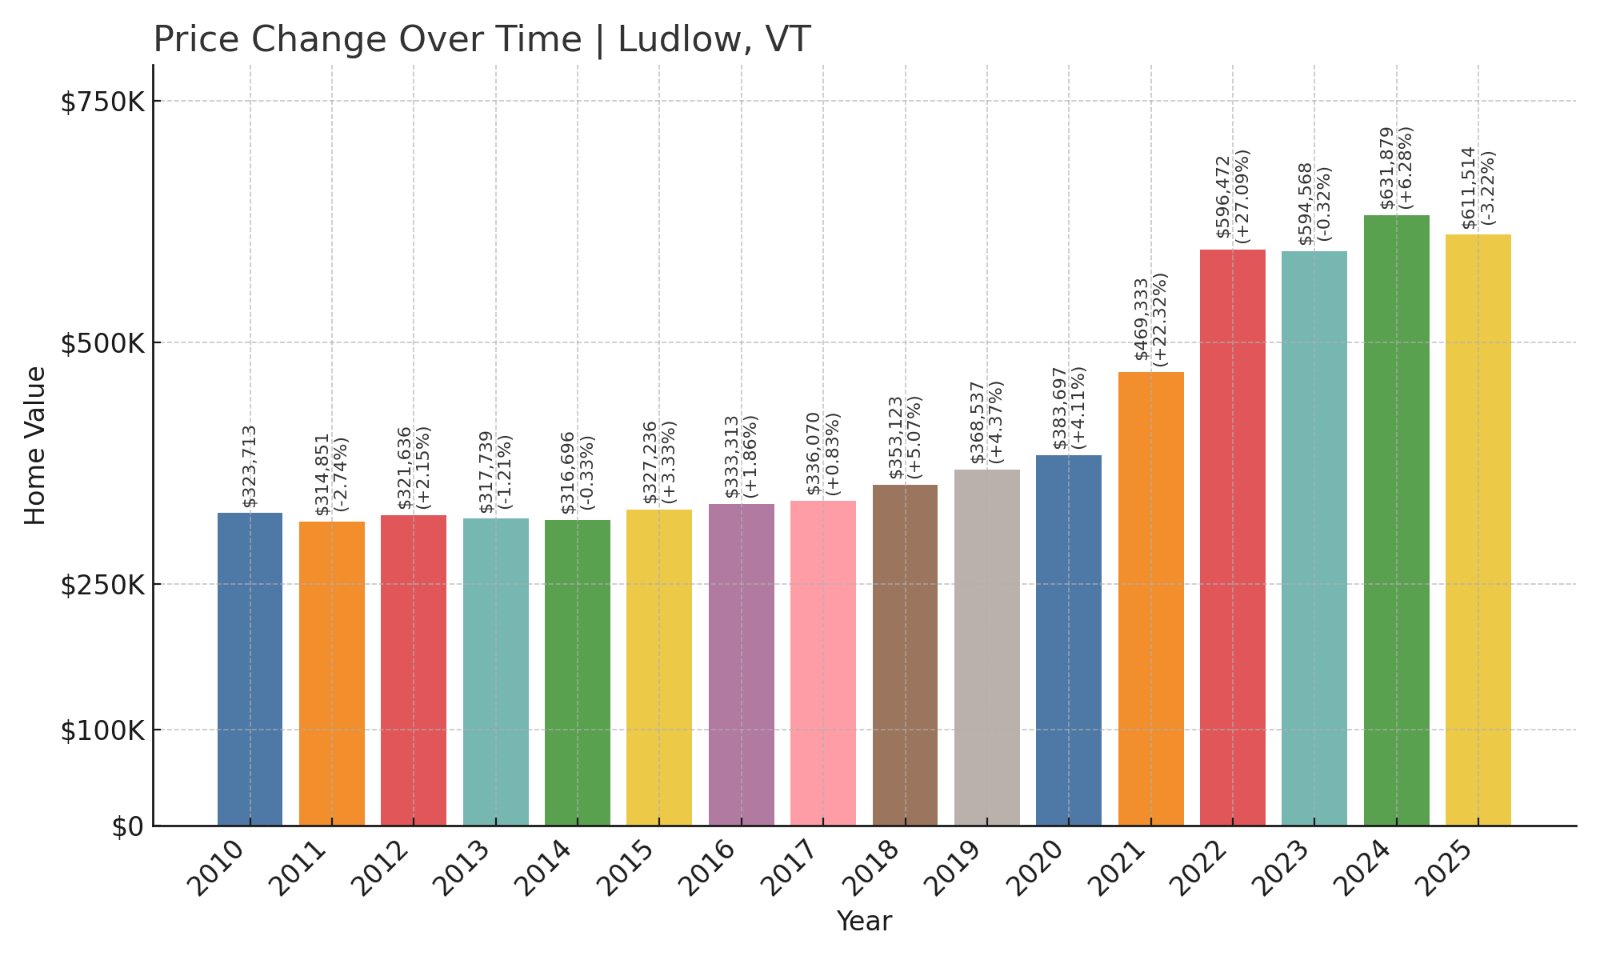
- 2010: $323,713
- 2011: $314,851 (-$8,862, -2.74%)
- 2012: $321,636 (+$6,785, +2.16%)
- 2013: $317,739 (-$3,897, -1.21%)
- 2014: $316,696 (-$1,044, -0.33%)
- 2015: $327,236 (+$10,540, +3.33%)
- 2016: $333,313 (+$6,077, +1.86%)
- 2017: $336,070 (+$2,757, +0.83%)
- 2018: $353,123 (+$17,053, +5.07%)
- 2019: $368,537 (+$15,415, +4.37%)
- 2020: $383,697 (+$15,159, +4.11%)
- 2021: $469,333 (+$85,637, +22.32%)
- 2022: $596,472 (+$127,139, +27.09%)
- 2023: $594,568 (-$1,904, -0.32%)
- 2024: $631,879 (+$37,311, +6.28%)
- 2025: $611,514 (-$20,365, -3.22%)
From 2010 to 2025, Ludlow’s home prices climbed 89%. Most of that growth came after 2020, when prices shot up thanks to lifestyle migration, tourism, and second-home interest. Despite a dip in 2025, the market remains far above pre-pandemic levels.
Ludlow – Resort Living Driving a Real Estate Boom
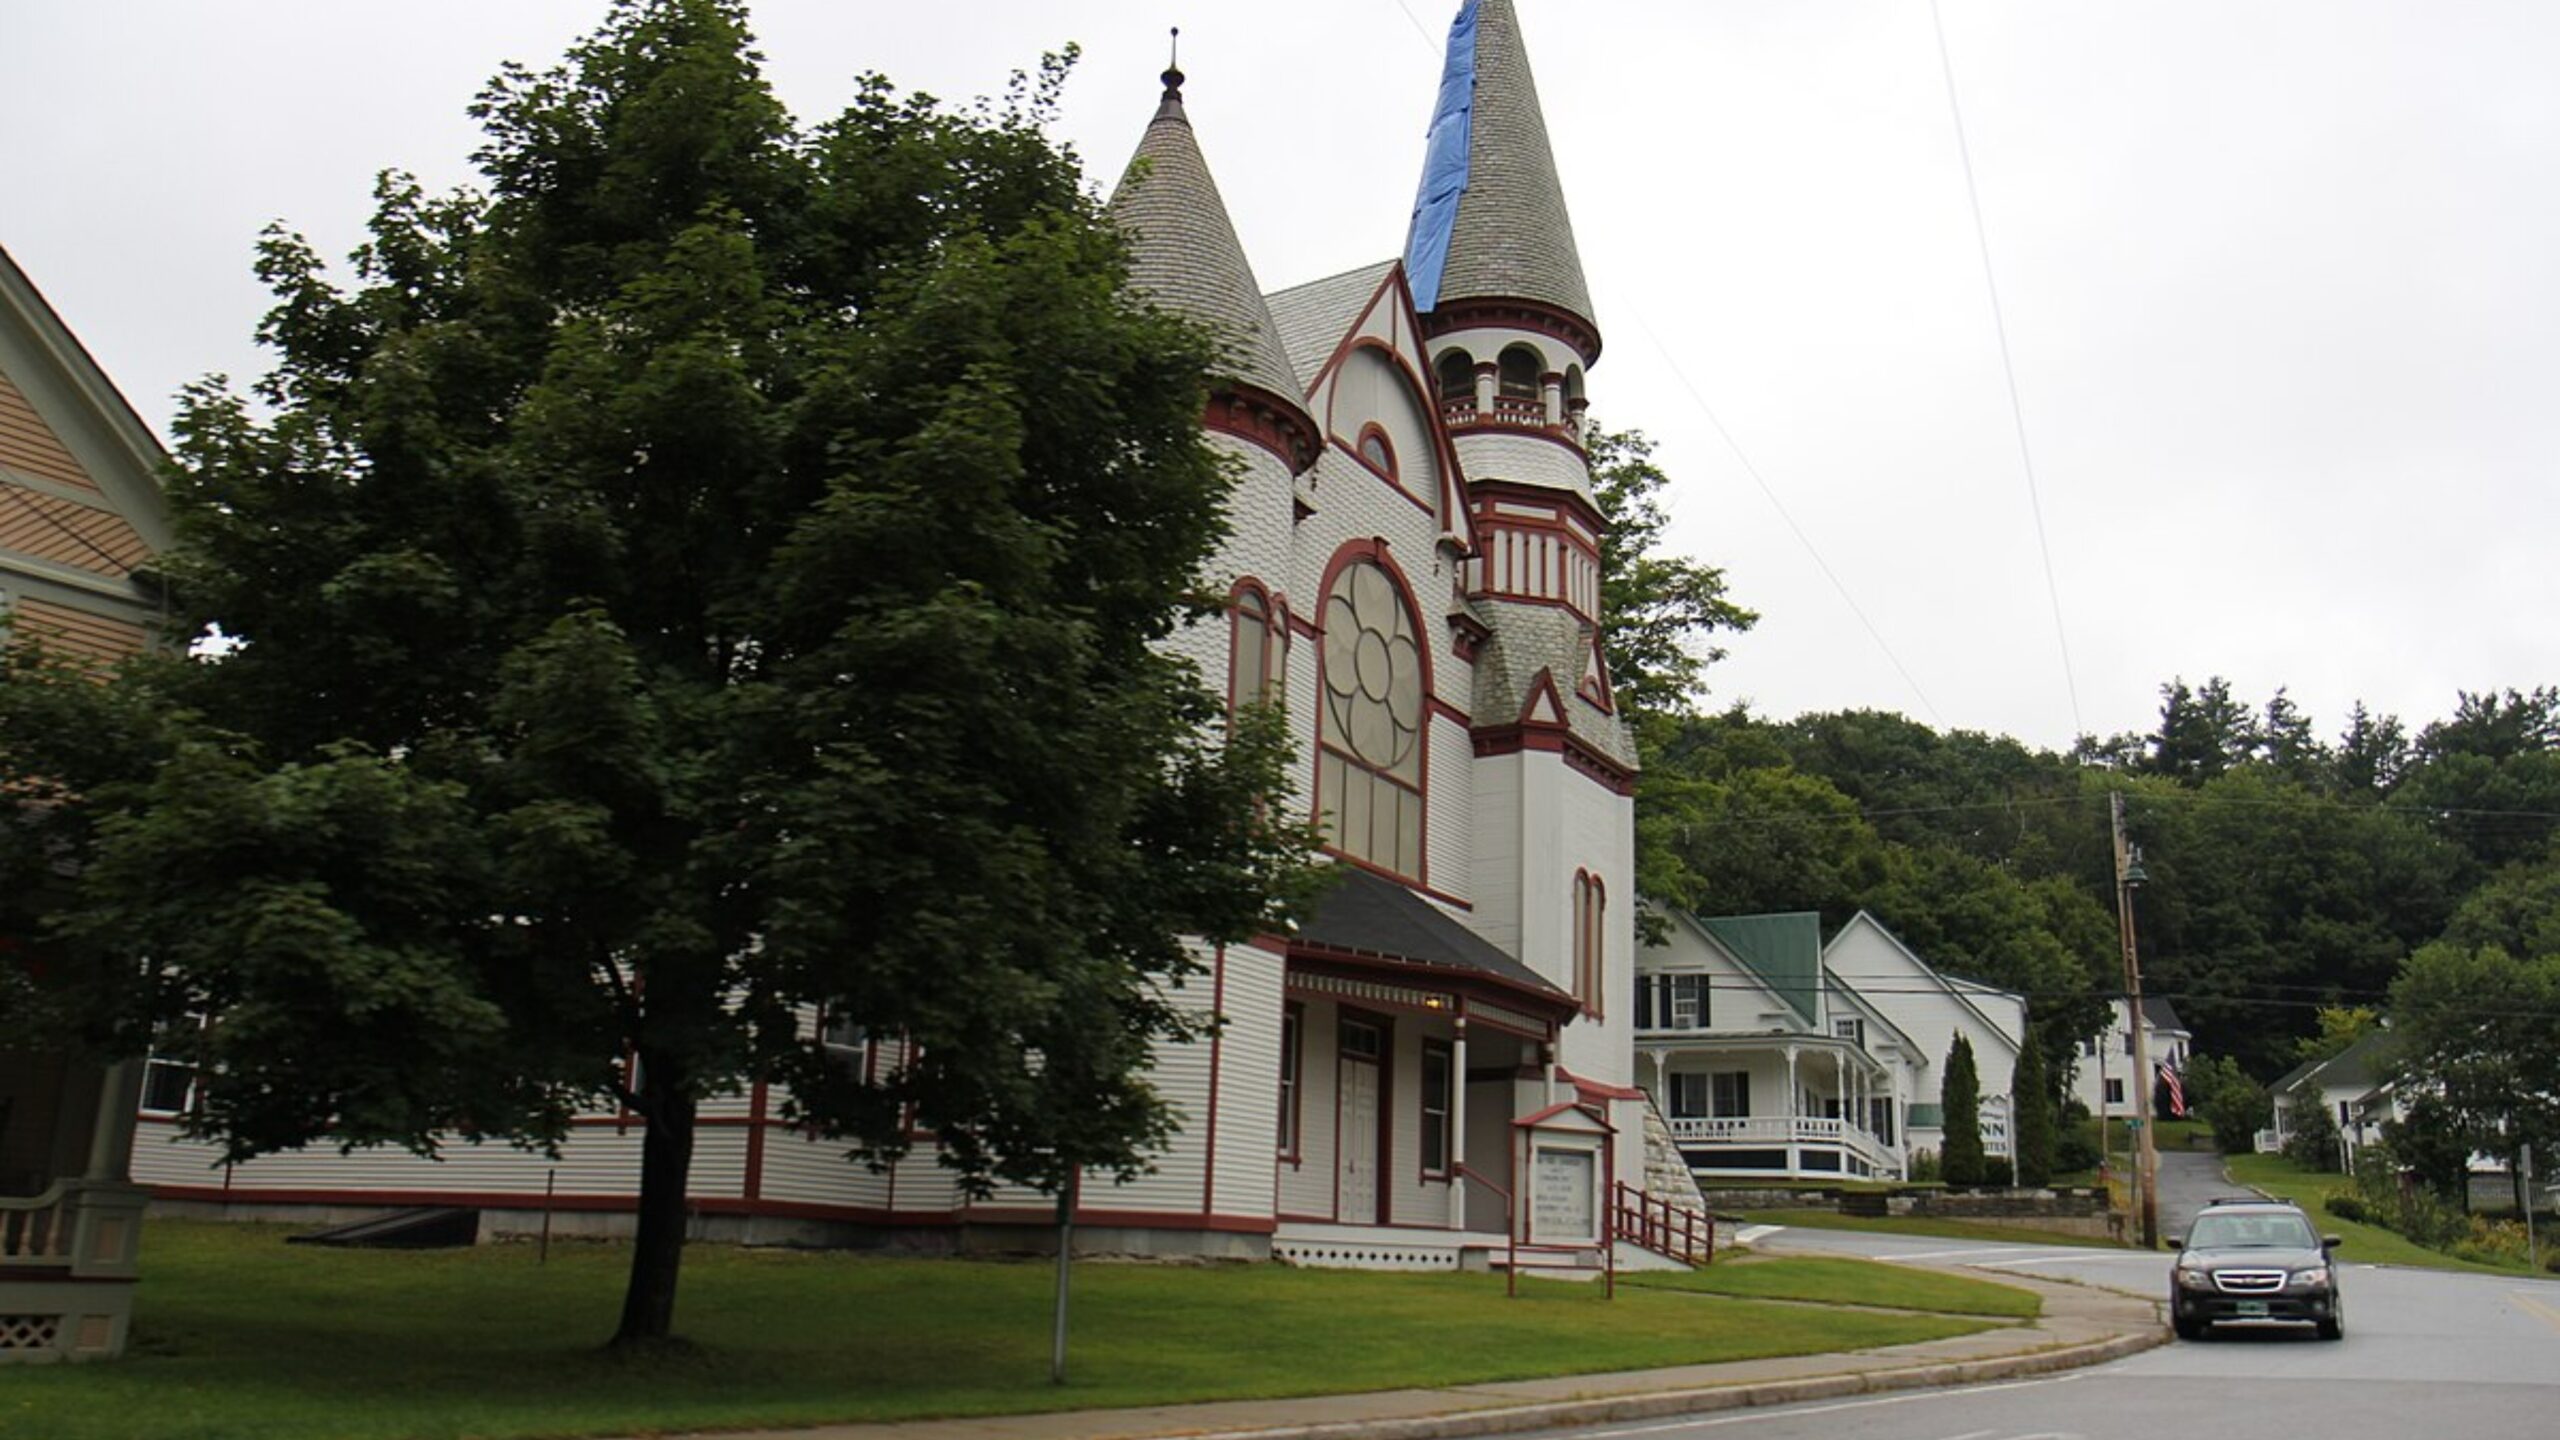
Ludlow is home to Okemo Mountain Resort, a major ski destination in Vermont that draws thousands of visitors each winter. This tourism infrastructure, along with vacation home interest, has been a primary driver of home price increases in recent years.
In addition to ski appeal, Ludlow offers year-round recreational opportunities and a growing number of restaurants, boutiques, and vacation rentals. These assets have attracted out-of-state buyers and seasonal residents alike, reshaping the market into one of the state’s most dynamic in terms of price growth.
12. South Hero – 64% Home Price Increase Since 2010

Would you like to save this?
- 2010: $375,208
- 2011: $378,494 (+$3,286, +0.88%)
- 2012: $387,014 (+$8,520, +2.25%)
- 2013: $404,455 (+$17,441, +4.51%)
- 2014: $408,736 (+$4,281, +1.06%)
- 2015: $406,865 (-$1,871, -0.46%)
- 2016: $400,376 (-$6,489, -1.59%)
- 2017: $420,387 (+$20,011, +5.00%)
- 2018: $443,882 (+$23,495, +5.59%)
- 2019: $458,098 (+$14,215, +3.20%)
- 2020: $479,226 (+$21,128, +4.61%)
- 2021: $566,821 (+$87,595, +18.28%)
- 2022: $651,700 (+$84,880, +14.97%)
- 2023: $657,467 (+$5,766, +0.88%)
- 2024: $663,992 (+$6,525, +0.99%)
- 2025: $616,950 (-$47,042, -7.08%)
South Hero’s home prices have risen 64% since 2010, with a steep acceleration beginning in 2020. While 2025 saw a notable correction, the long-term trend is upward, driven by consistent demand and the town’s waterfront location.
South Hero – Island Living With Serious Appeal
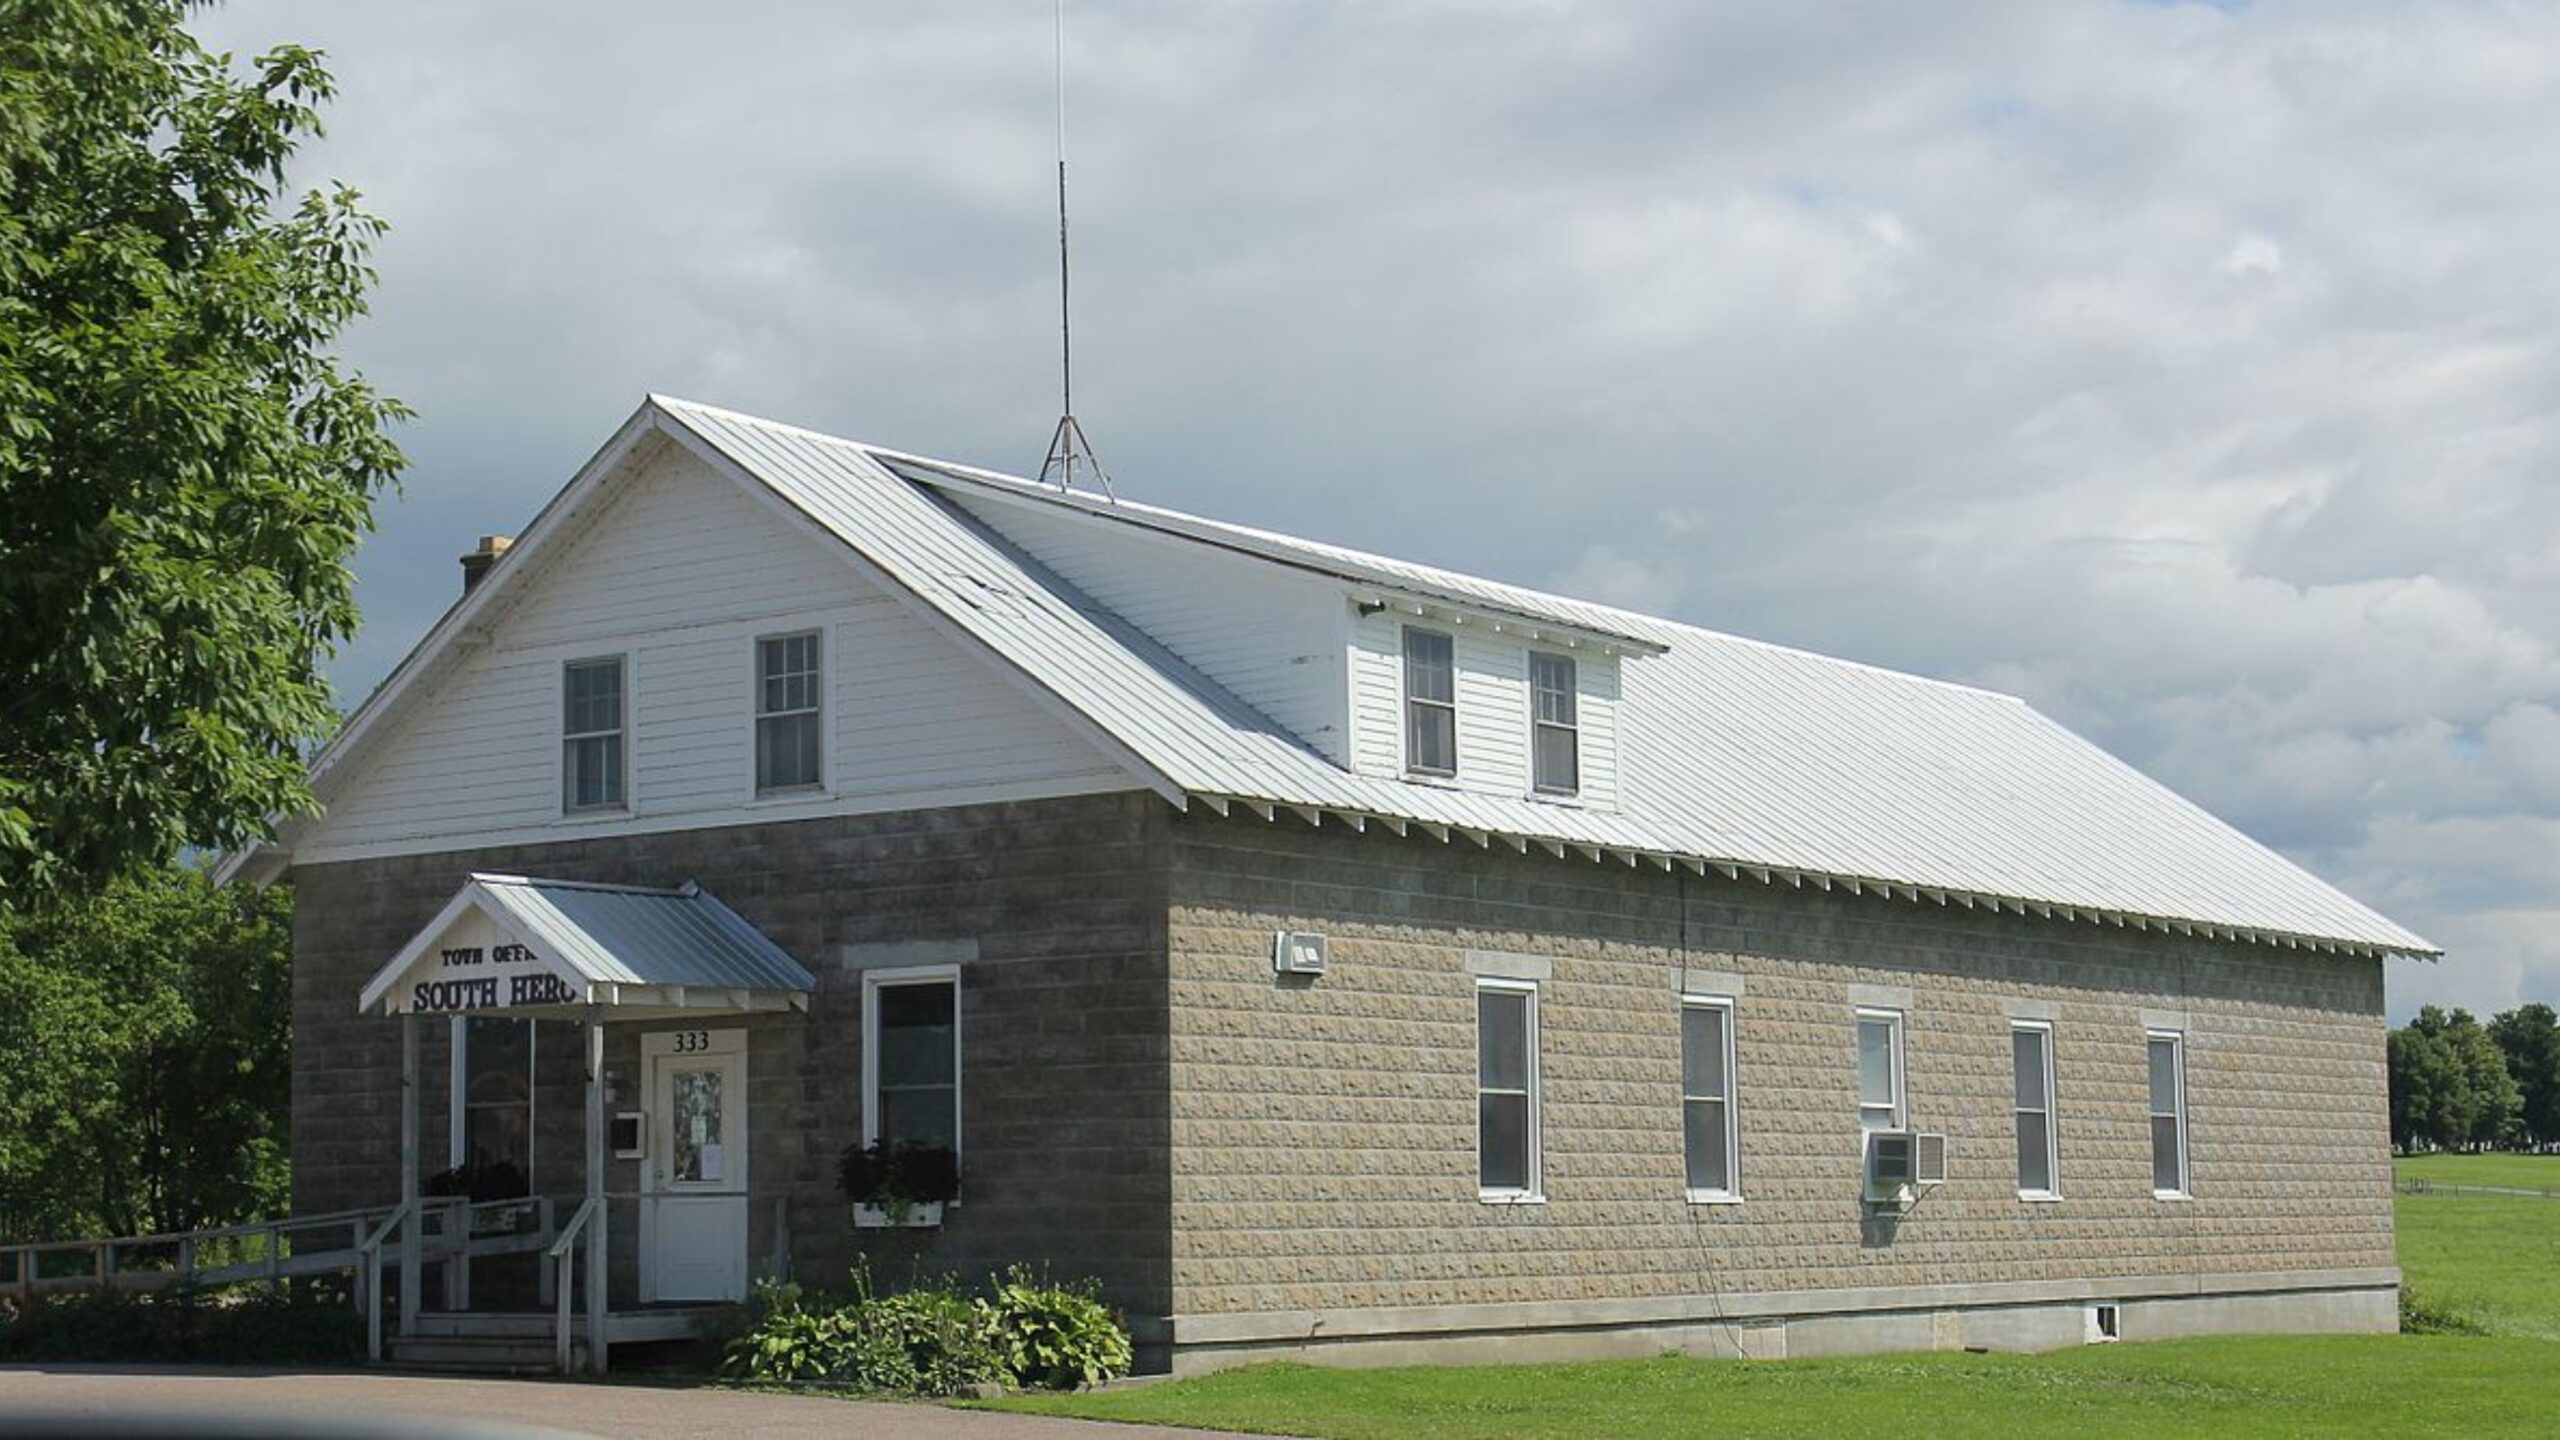
Located on South Hero Island in Lake Champlain, South Hero offers rare lakefront property within a commutable distance of Burlington. This geographic advantage has helped it become a sought-after location for both vacation homeowners and permanent residents seeking scenic views and tranquility.
The town’s popularity surged during the pandemic, when proximity to water, open space, and outdoor recreation became top priorities for many buyers. That demand, paired with a limited housing stock, contributed to dramatic price gains from 2020 through 2022. While prices dipped in 2025, South Hero’s desirability remains strong.
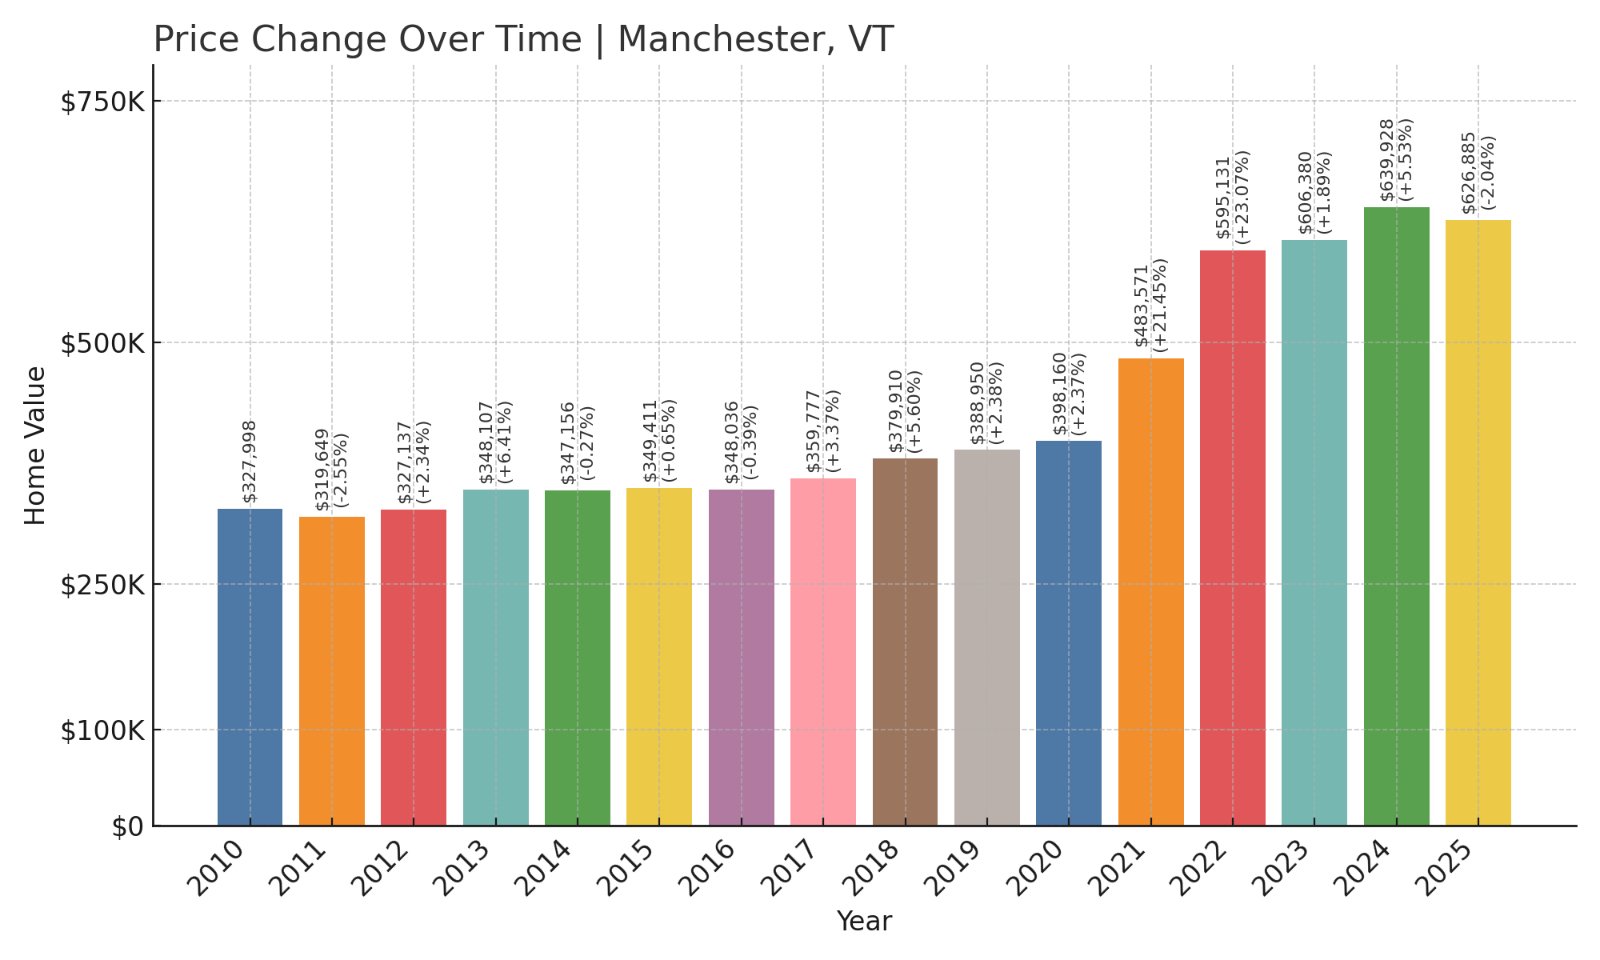
11. Manchester – 91% Home Price Increase Since 2010
- 2010: $327,998
- 2011: $319,649 (-$8,349, -2.55%)
- 2012: $327,137 (+$7,488, +2.34%)
- 2013: $348,107 (+$20,970, +6.41%)
- 2014: $347,156 (-$951, -0.27%)
- 2015: $349,411 (+$2,255, +0.65%)
- 2016: $348,036 (-$1,375, -0.39%)
- 2017: $359,777 (+$11,741, +3.37%)
- 2018: $379,910 (+$20,133, +5.60%)
- 2019: $388,950 (+$9,040, +2.38%)
- 2020: $398,160 (+$9,210, +2.37%)
- 2021: $483,571 (+$85,411, +21.45%)
- 2022: $595,131 (+$111,560, +23.07%)
- 2023: $606,380 (+$11,249, +1.89%)
- 2024: $639,928 (+$33,548, +5.53%)
- 2025: $626,885 (-$13,043, -2.04%)
Manchester has seen its home prices rise by 91% since 2010, with some of the sharpest growth occurring between 2020 and 2022. Although there was a slight decline in 2025, overall prices remain far higher than a decade ago.
Manchester – Southern Vermont’s Upscale Destination
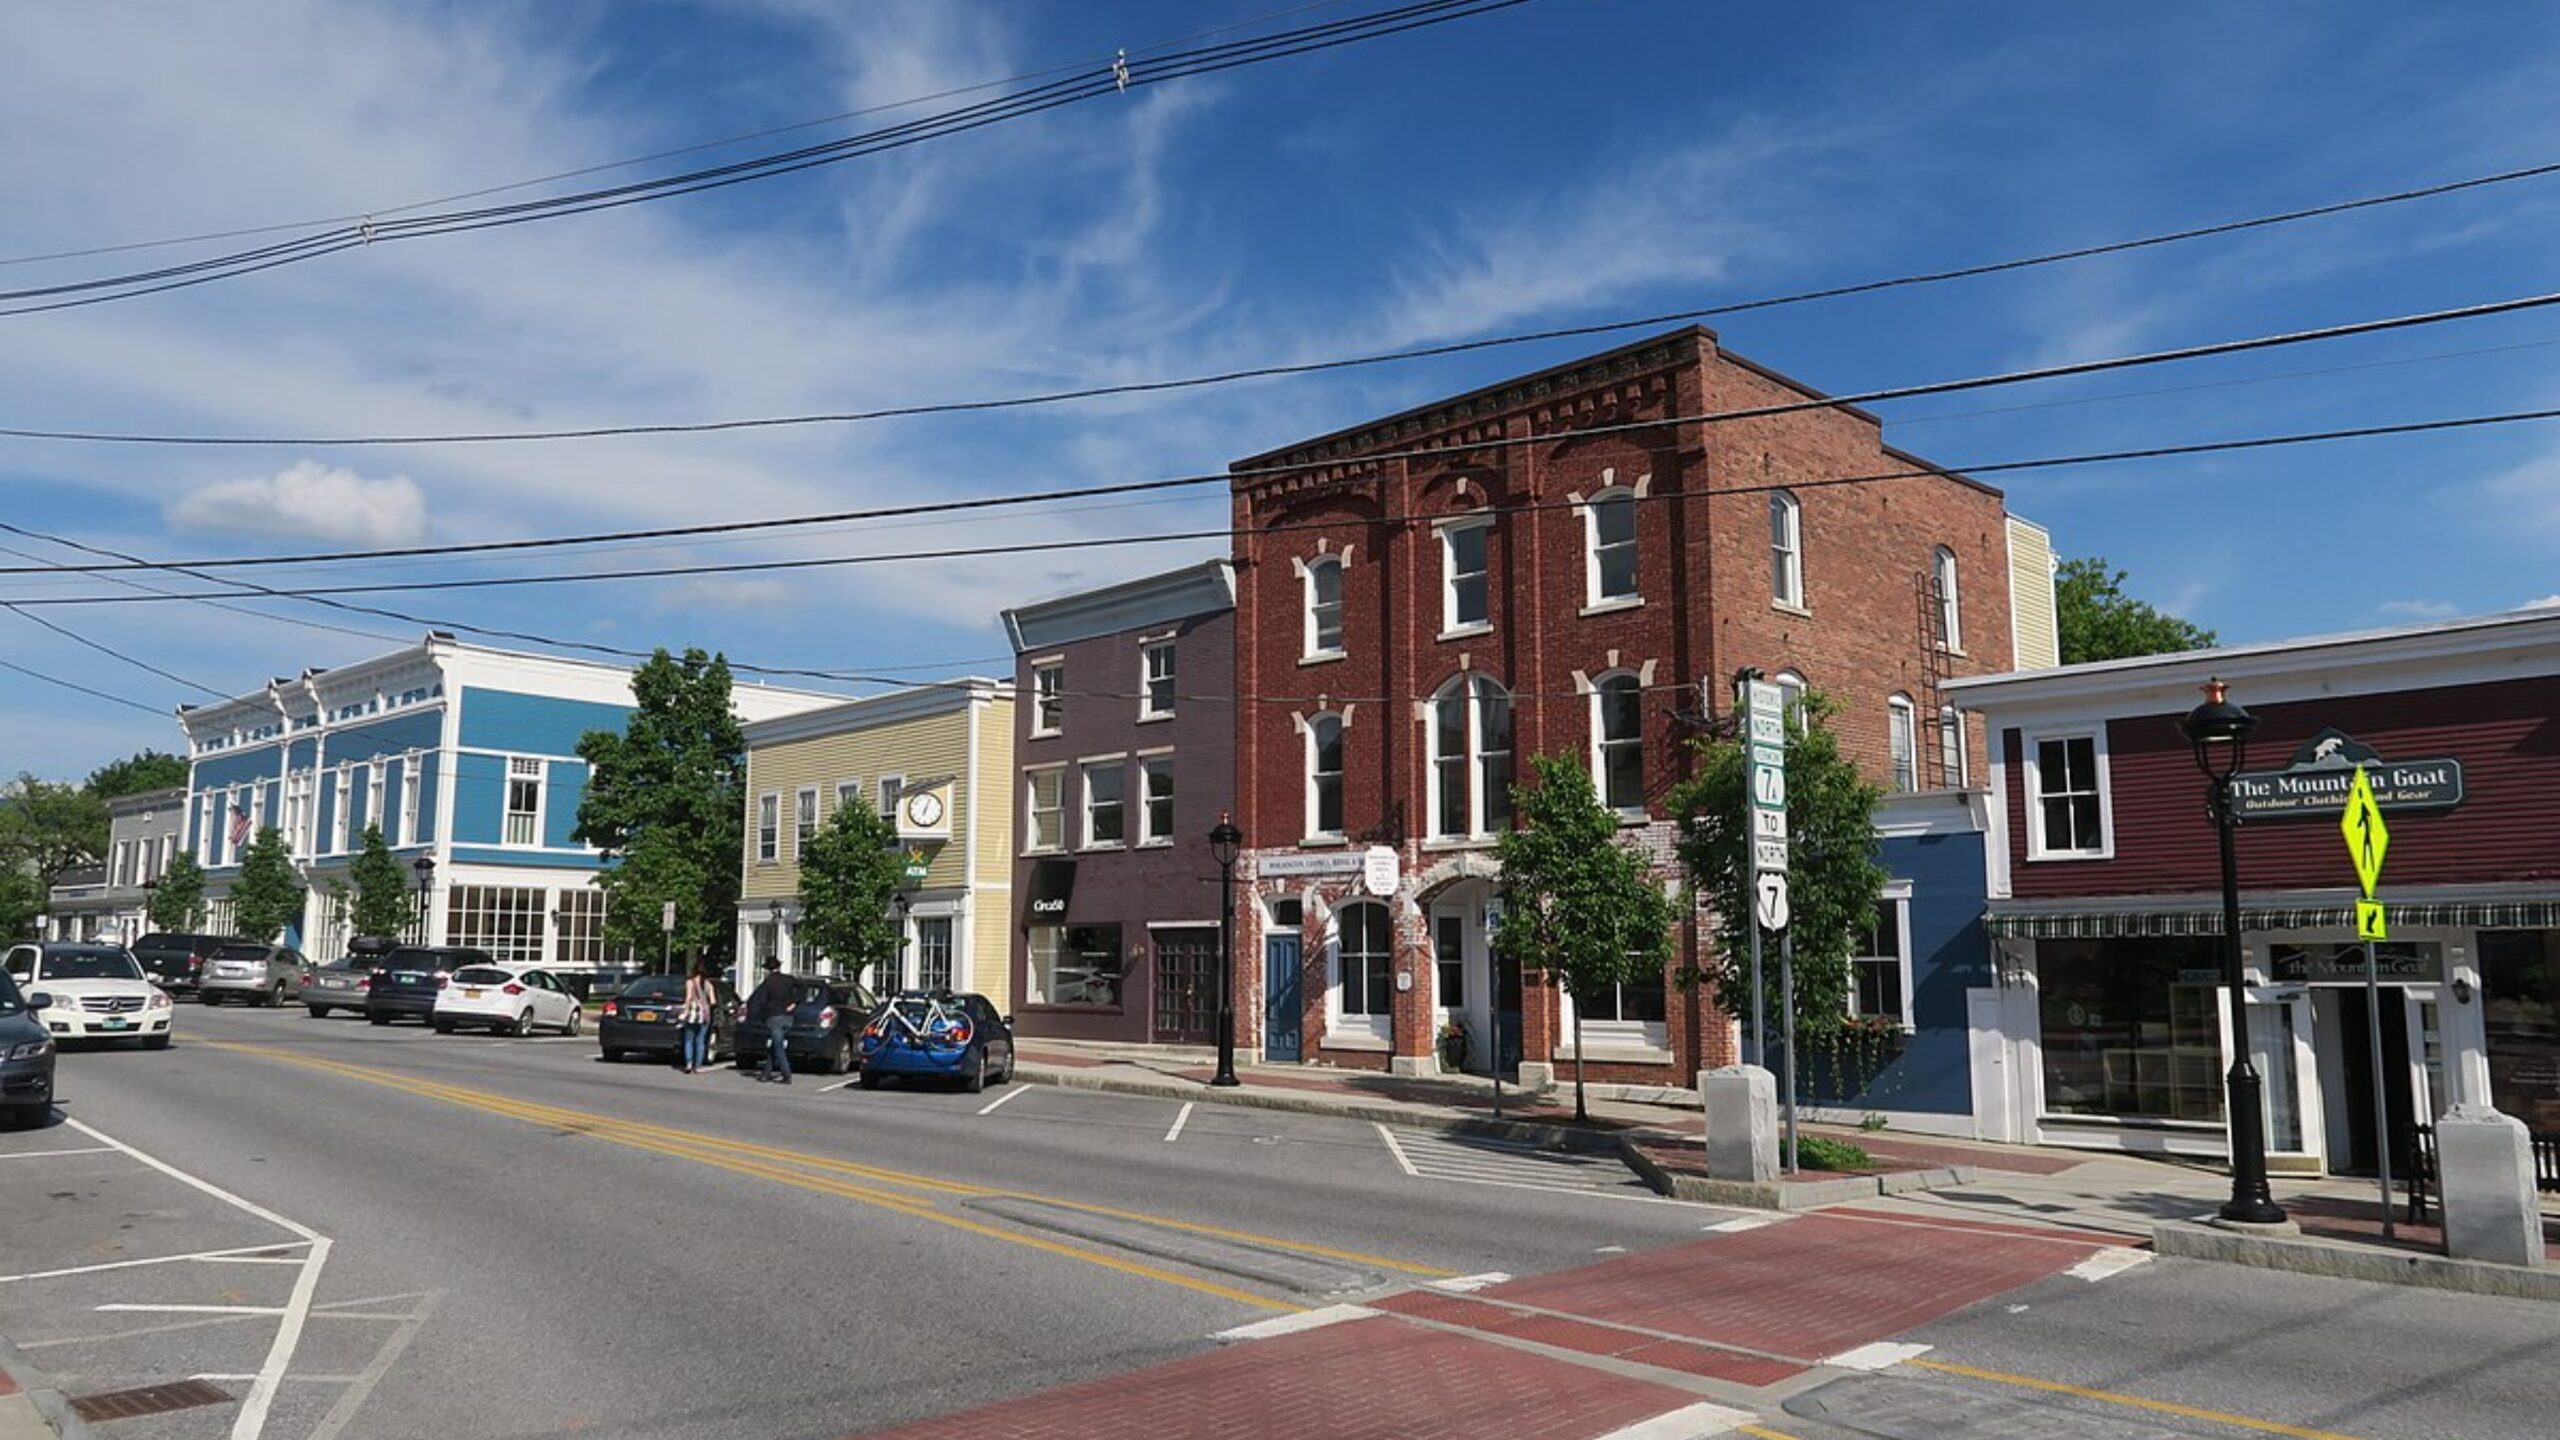
Manchester is a premier destination in southern Vermont, known for its high-end retail outlets, fine dining, and proximity to Bromley and Stratton ski resorts. It blends resort-town charm with practical amenities, making it attractive to both vacationers and full-time residents.
Its housing market reflects that reputation, particularly in the post-2020 era, when buyers from urban areas sought lifestyle changes. A shortage of available inventory and continued demand from affluent buyers helped push Manchester into the top tier of Vermont’s real estate market. The town’s cultural offerings, schools, and recreation make it one of the most desirable places to live in the state.
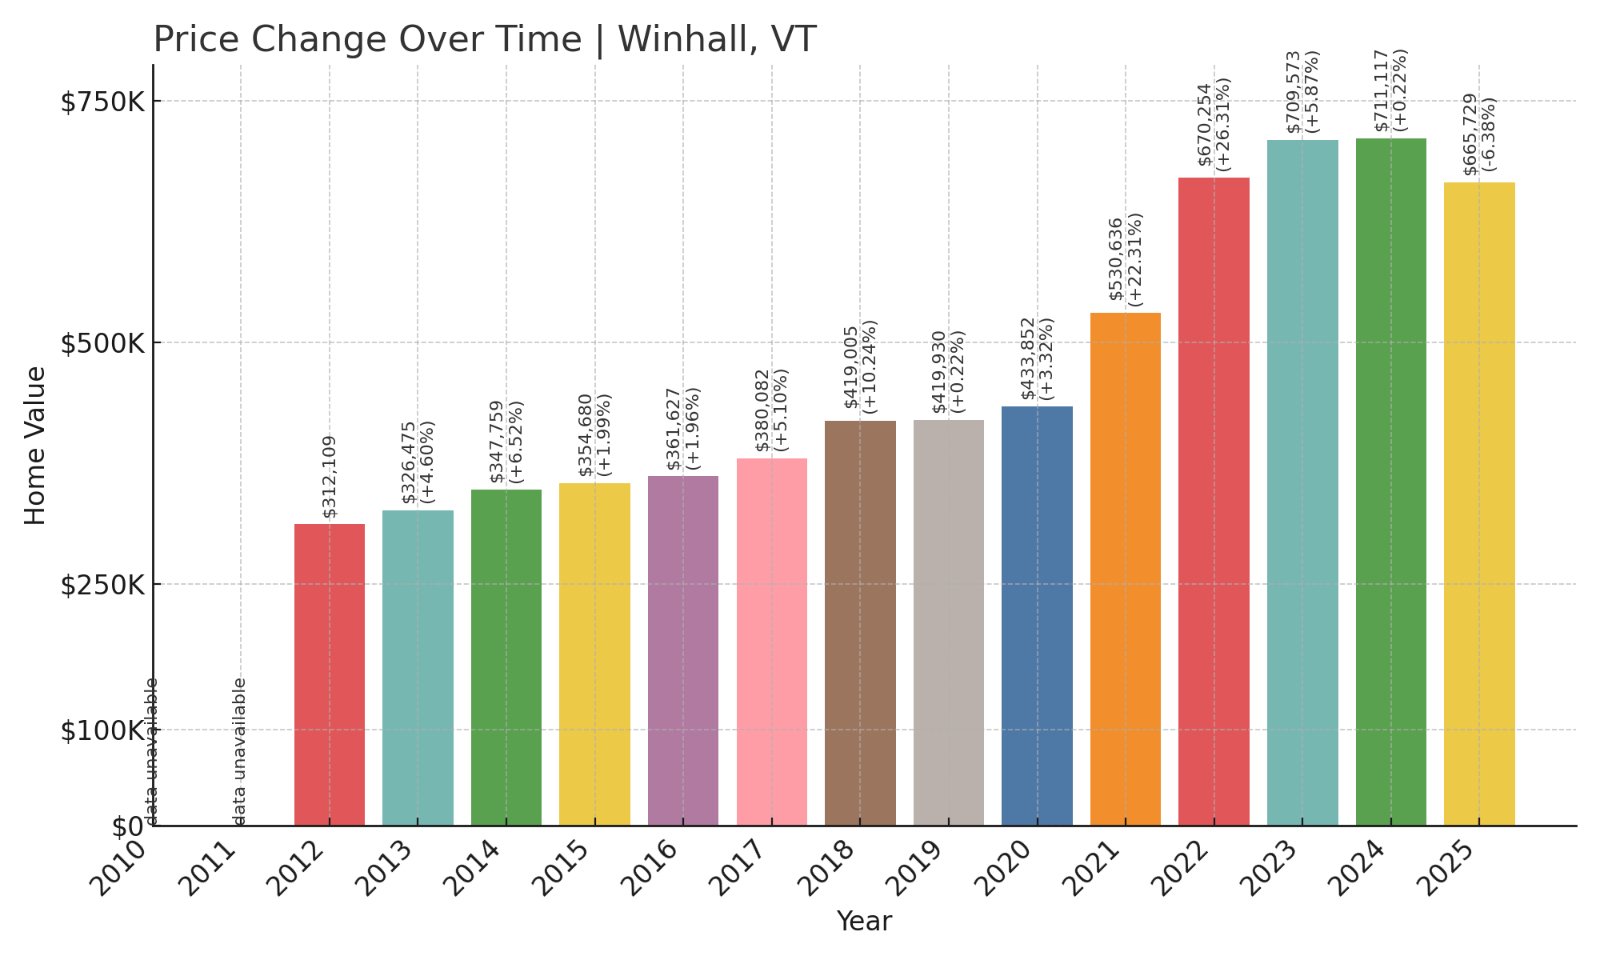
10. Winhall – 113% Home Price Increase Since 2012
- 2012: $312,109
- 2013: $326,475 (+$14,366, +4.60%)
- 2014: $347,759 (+$21,284, +6.52%)
- 2015: $354,680 (+$6,921, +1.99%)
- 2016: $361,627 (+$6,947, +1.96%)
- 2017: $380,082 (+$18,455, +5.10%)
- 2018: $419,005 (+$38,924, +10.24%)
- 2019: $419,930 (+$924, +0.22%)
- 2020: $433,852 (+$13,923, +3.32%)
- 2021: $530,636 (+$96,784, +22.31%)
- 2022: $670,254 (+$139,618, +26.31%)
- 2023: $709,573 (+$39,319, +5.87%)
- 2024: $711,117 (+$1,544, +0.22%)
- 2025: $665,729 (-$45,389, -6.38%)
Winhall’s home prices have soared 113% since 2012, with the sharpest increases happening in the early 2020s. Though prices slid slightly in 2025, they remain among the highest in Vermont due to persistent demand from luxury buyers.
Winhall – Mountain Market on the Rise
Winhall sits at the foot of Stratton Mountain Resort, making it a coveted location for ski-in/ski-out properties and second homes. Its real estate market has surged as high-income buyers seek vacation properties with year-round amenities and high rental potential.
The town has benefitted from rising demand for resort-area homes, limited new construction, and a reputation for premium living. Though there was a dip in 2025, Winhall’s pricing reflects strong long-term growth in Vermont’s luxury segment. Its mix of alpine access and upscale appeal ensures continued interest in the years ahead.
9. Pomfret – 94% Home Price Increase Since 2012
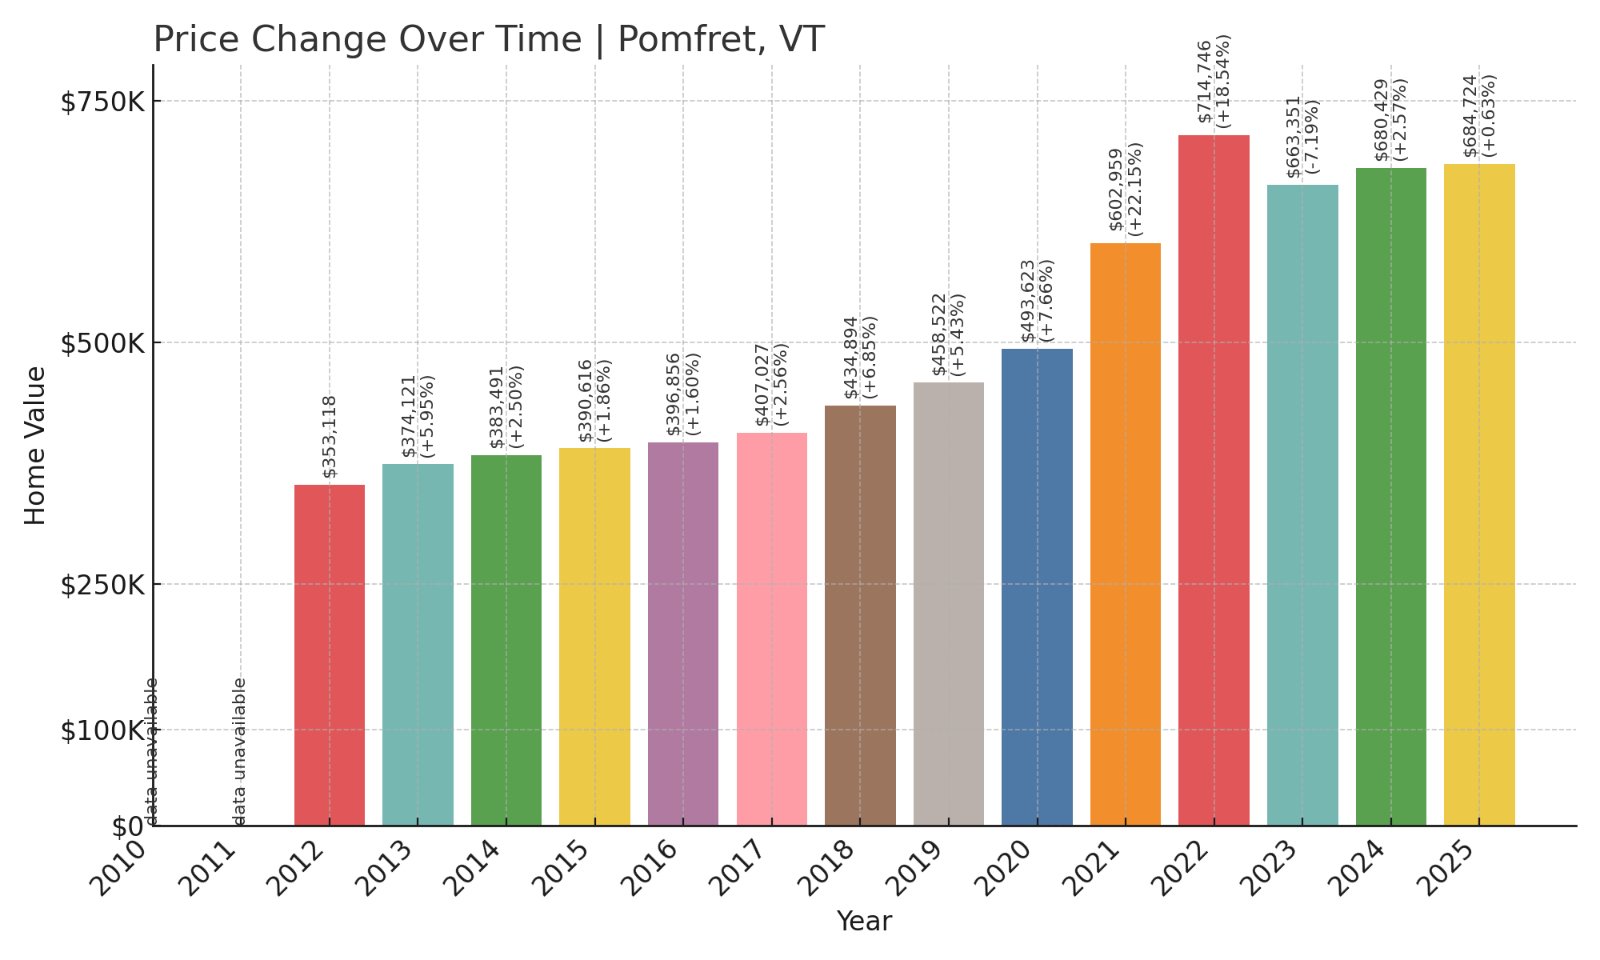
- 2012: $353,118
- 2013: $374,121 (+$21,003, +5.95%)
- 2014: $383,491 (+$9,370, +2.50%)
- 2015: $390,616 (+$7,125, +1.86%)
- 2016: $396,856 (+$6,240, +1.60%)
- 2017: $407,027 (+$10,171, +2.56%)
- 2018: $434,894 (+$27,867, +6.85%)
- 2019: $458,522 (+$23,628, +5.43%)
- 2020: $493,623 (+$35,101, +7.66%)
- 2021: $602,959 (+$109,336, +22.15%)
- 2022: $714,746 (+$111,787, +18.54%)
- 2023: $663,351 (-$51,395, -7.19%)
- 2024: $680,429 (+$17,077, +2.57%)
- 2025: $684,724 (+$4,295, +0.63%)
Home prices in Pomfret jumped 94% between 2012 and 2025, peaking in 2022 after two massive years of double-digit growth. Though prices pulled back slightly in 2023, the long-term trend remains very strong.
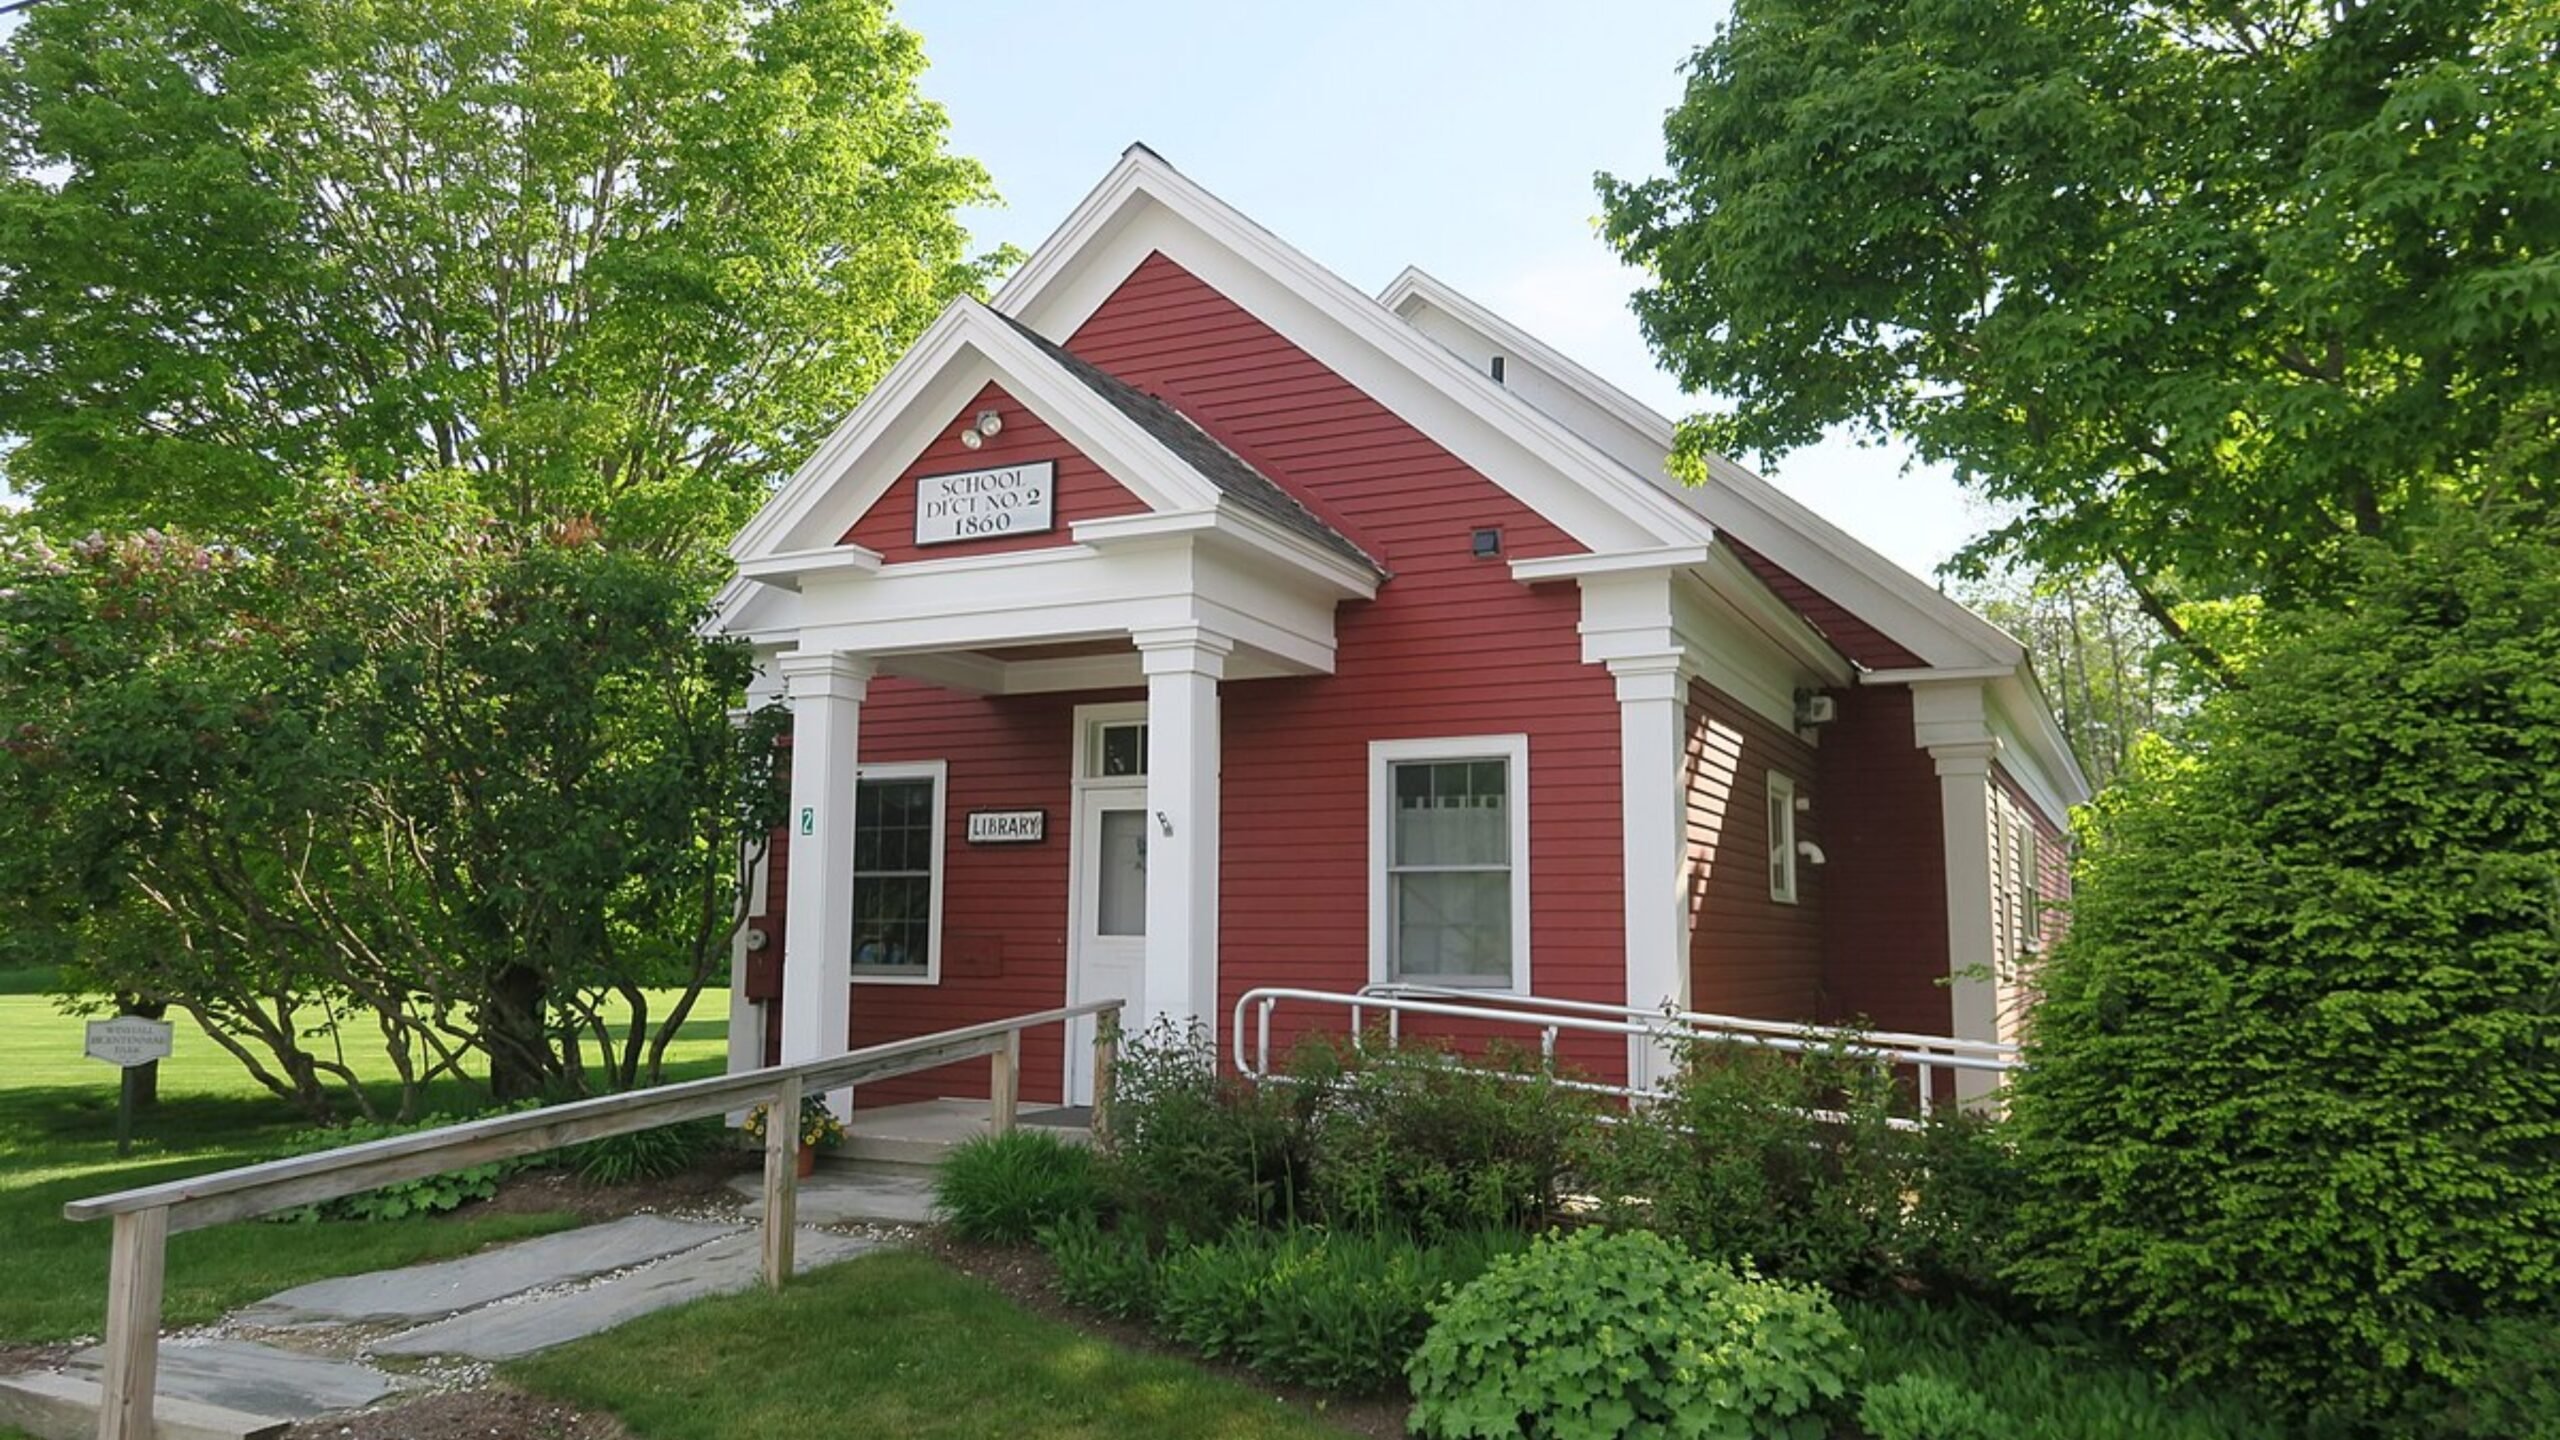
Pomfret – Tucked Away Yet Increasingly Popular
Pomfret is a quiet, rural town near Woodstock that has become increasingly popular among buyers seeking solitude, natural beauty, and proximity to outdoor recreation. With winding roads, forested hills, and a strong local arts community, Pomfret blends rustic charm with cultural richness.
It has traditionally seen lower transaction volume, which makes it sensitive to demand surges. That’s exactly what happened in 2021 and 2022, as buyers with flexible work options snapped up rural properties. The town’s strong showing in this list is a reflection of growing interest in Vermont’s lesser-known, high-quality living environments.
8. Shelburne – 69% Home Price Increase Since 2011
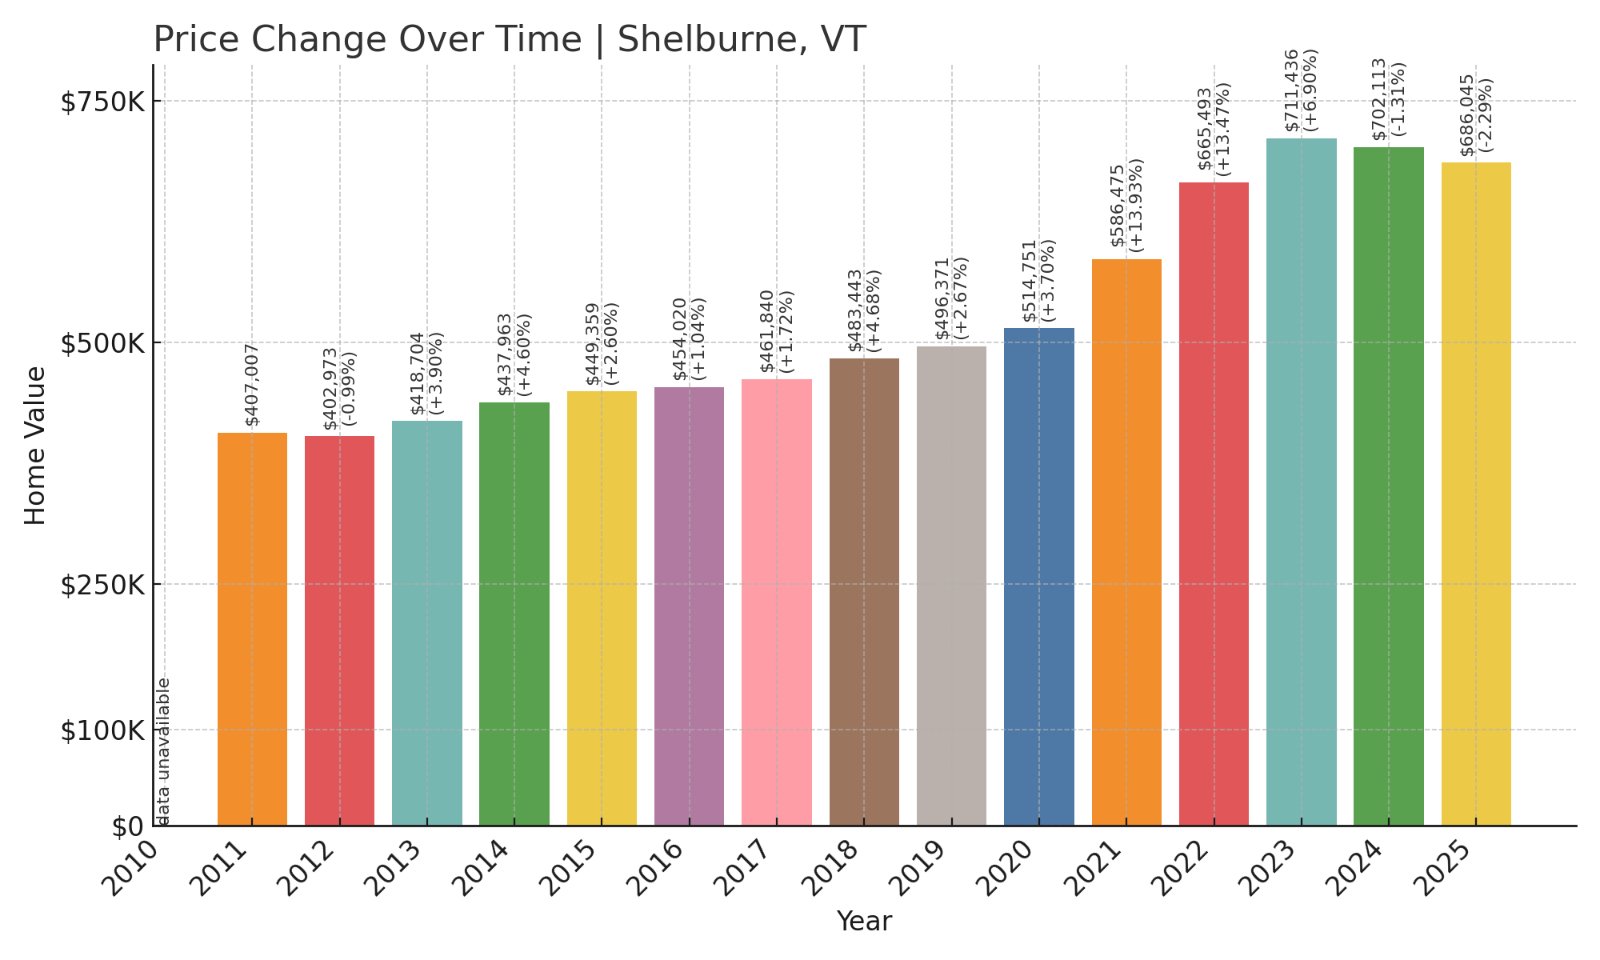
- 2011: $407,007
- 2012: $402,973 (-$4,033, -0.99%)
- 2013: $418,704 (+$15,731, +3.90%)
- 2014: $437,963 (+$19,259, +4.60%)
- 2015: $449,359 (+$11,396, +2.60%)
- 2016: $454,020 (+$4,661, +1.04%)
- 2017: $461,840 (+$7,820, +1.72%)
- 2018: $483,443 (+$21,603, +4.68%)
- 2019: $496,371 (+$12,929, +2.67%)
- 2020: $514,751 (+$18,379, +3.70%)
- 2021: $586,475 (+$71,725, +13.93%)
- 2022: $665,493 (+$79,017, +13.47%)
- 2023: $711,436 (+$45,943, +6.90%)
- 2024: $702,113 (-$9,324, -1.31%)
- 2025: $686,045 (-$16,068, -2.29%)
From 2011 to 2025, Shelburne’s home prices climbed nearly 69%. After a stretch of steady, moderate growth, the market took off in 2021 and 2022 with large annual gains, though there has been some cooling in the last two years.
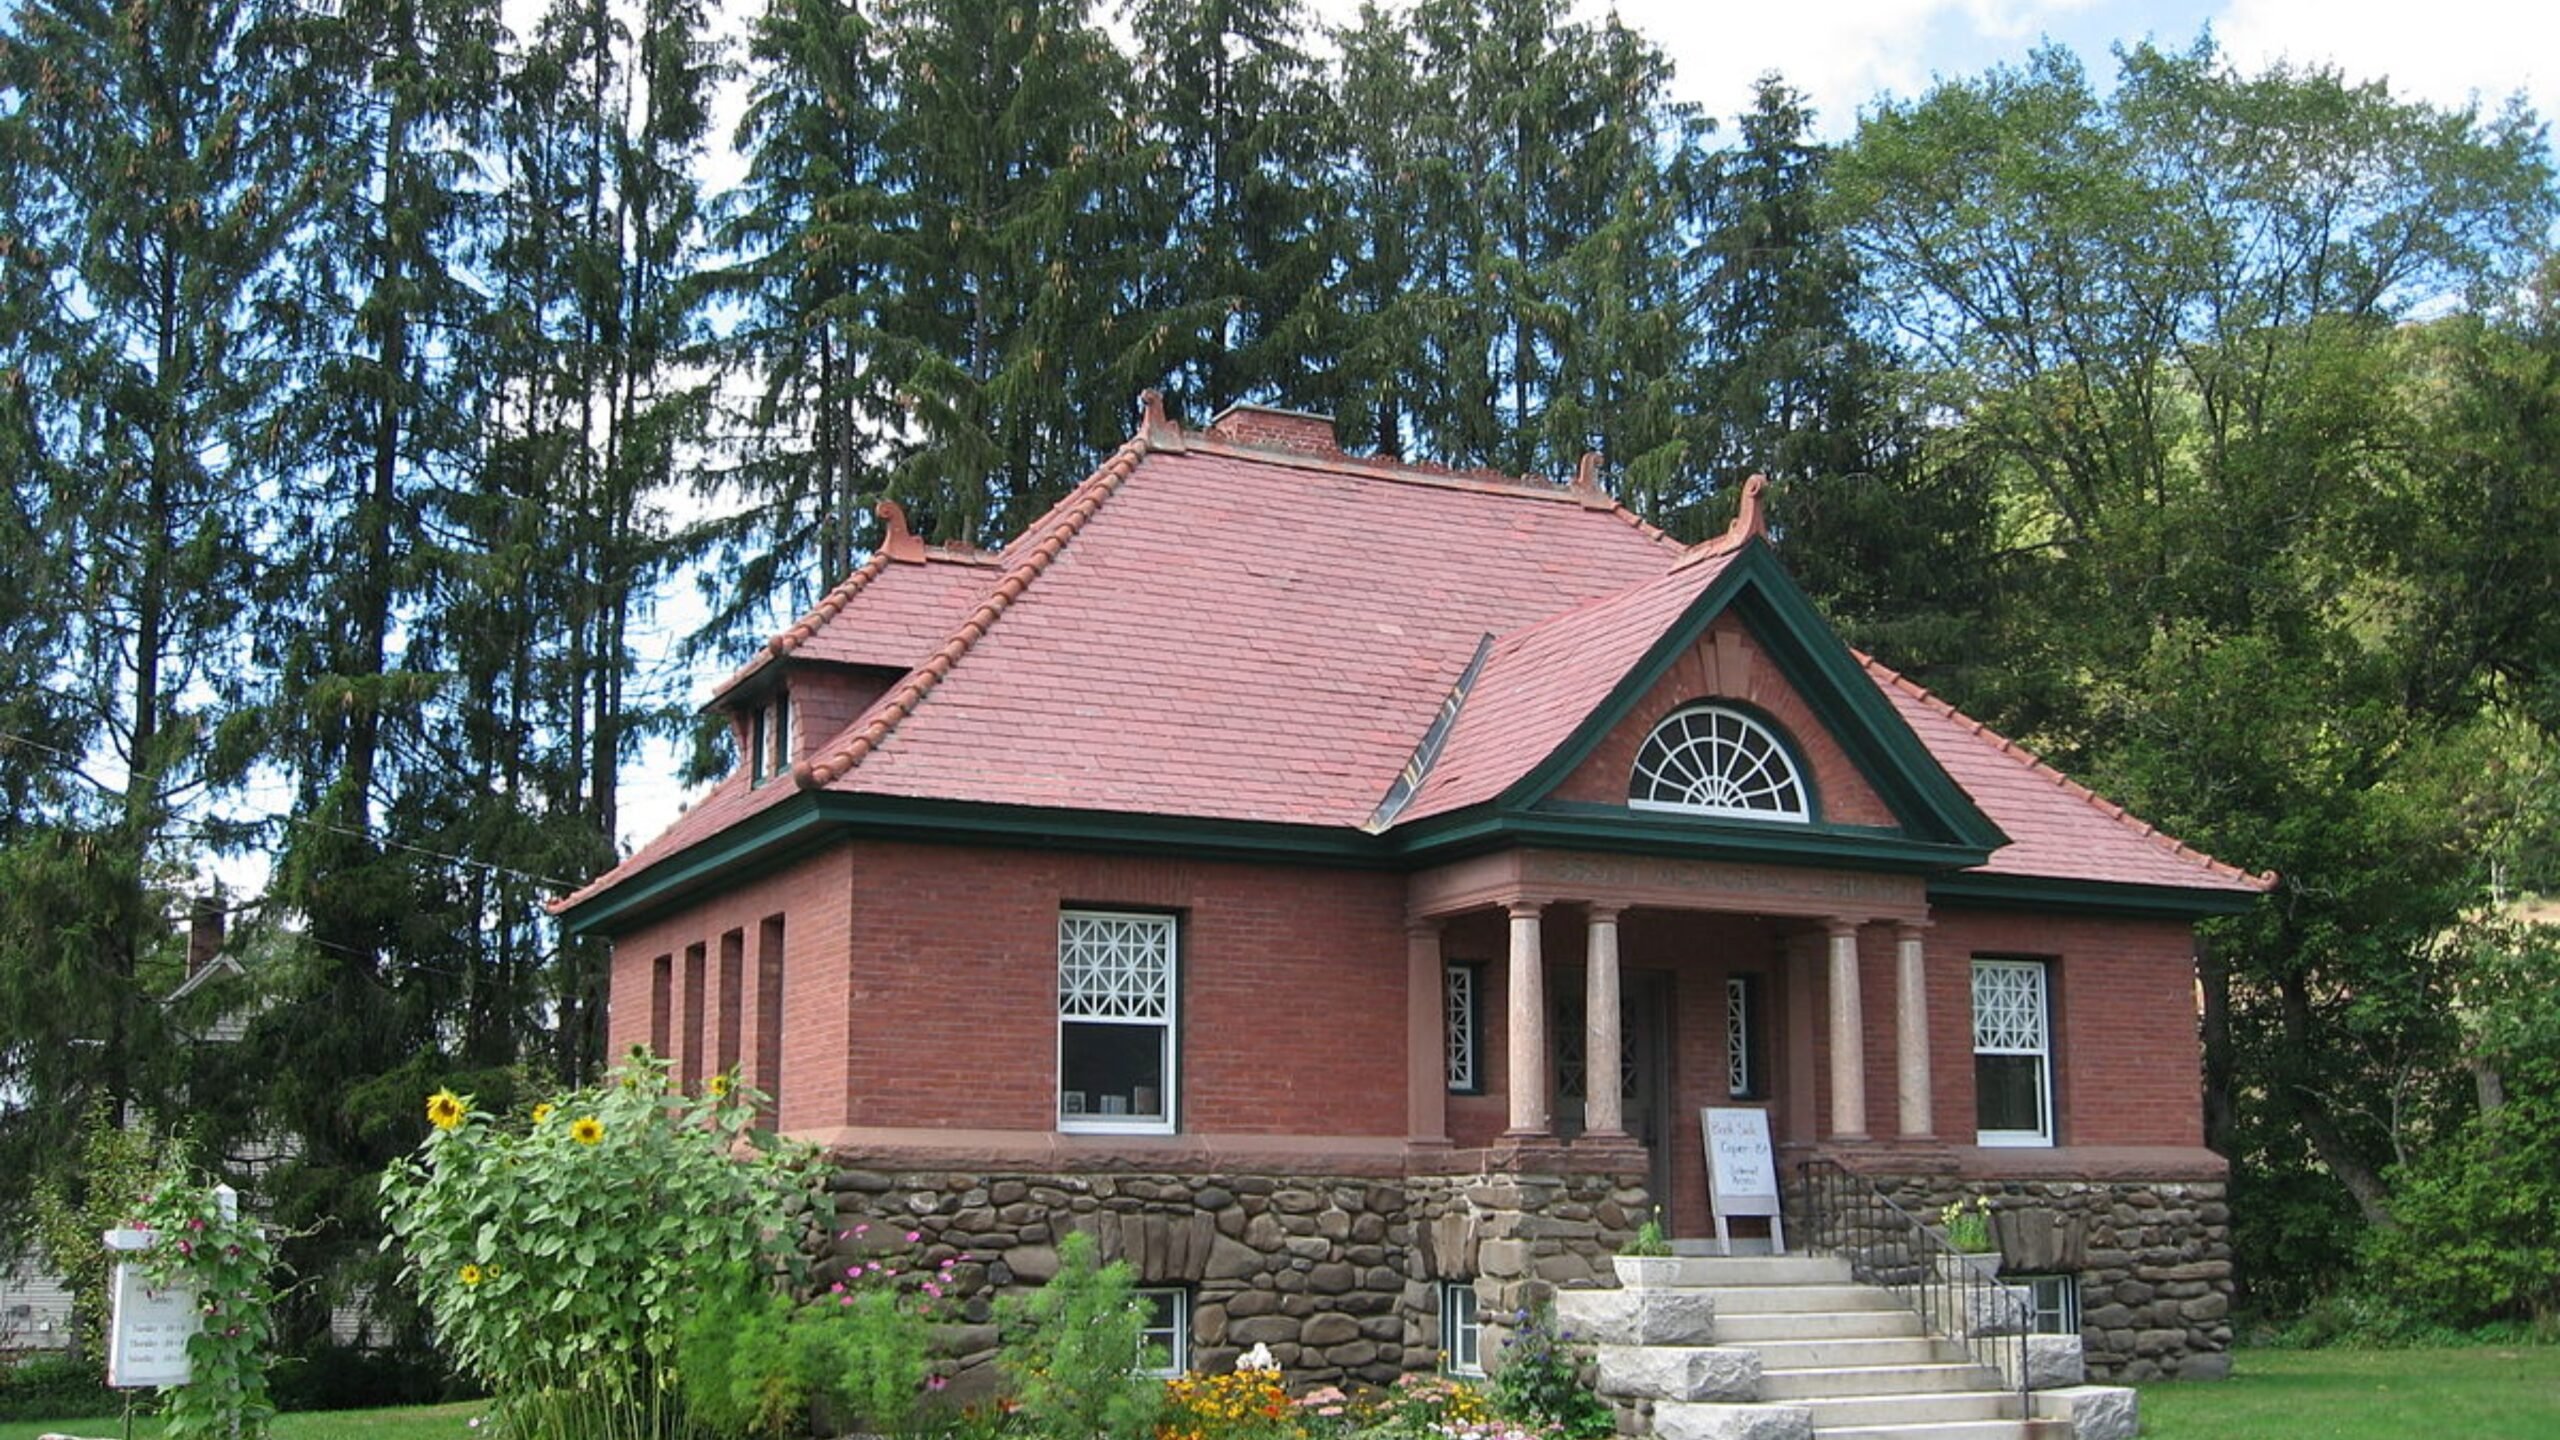
Shelburne – Lakefront Living With Urban Proximity
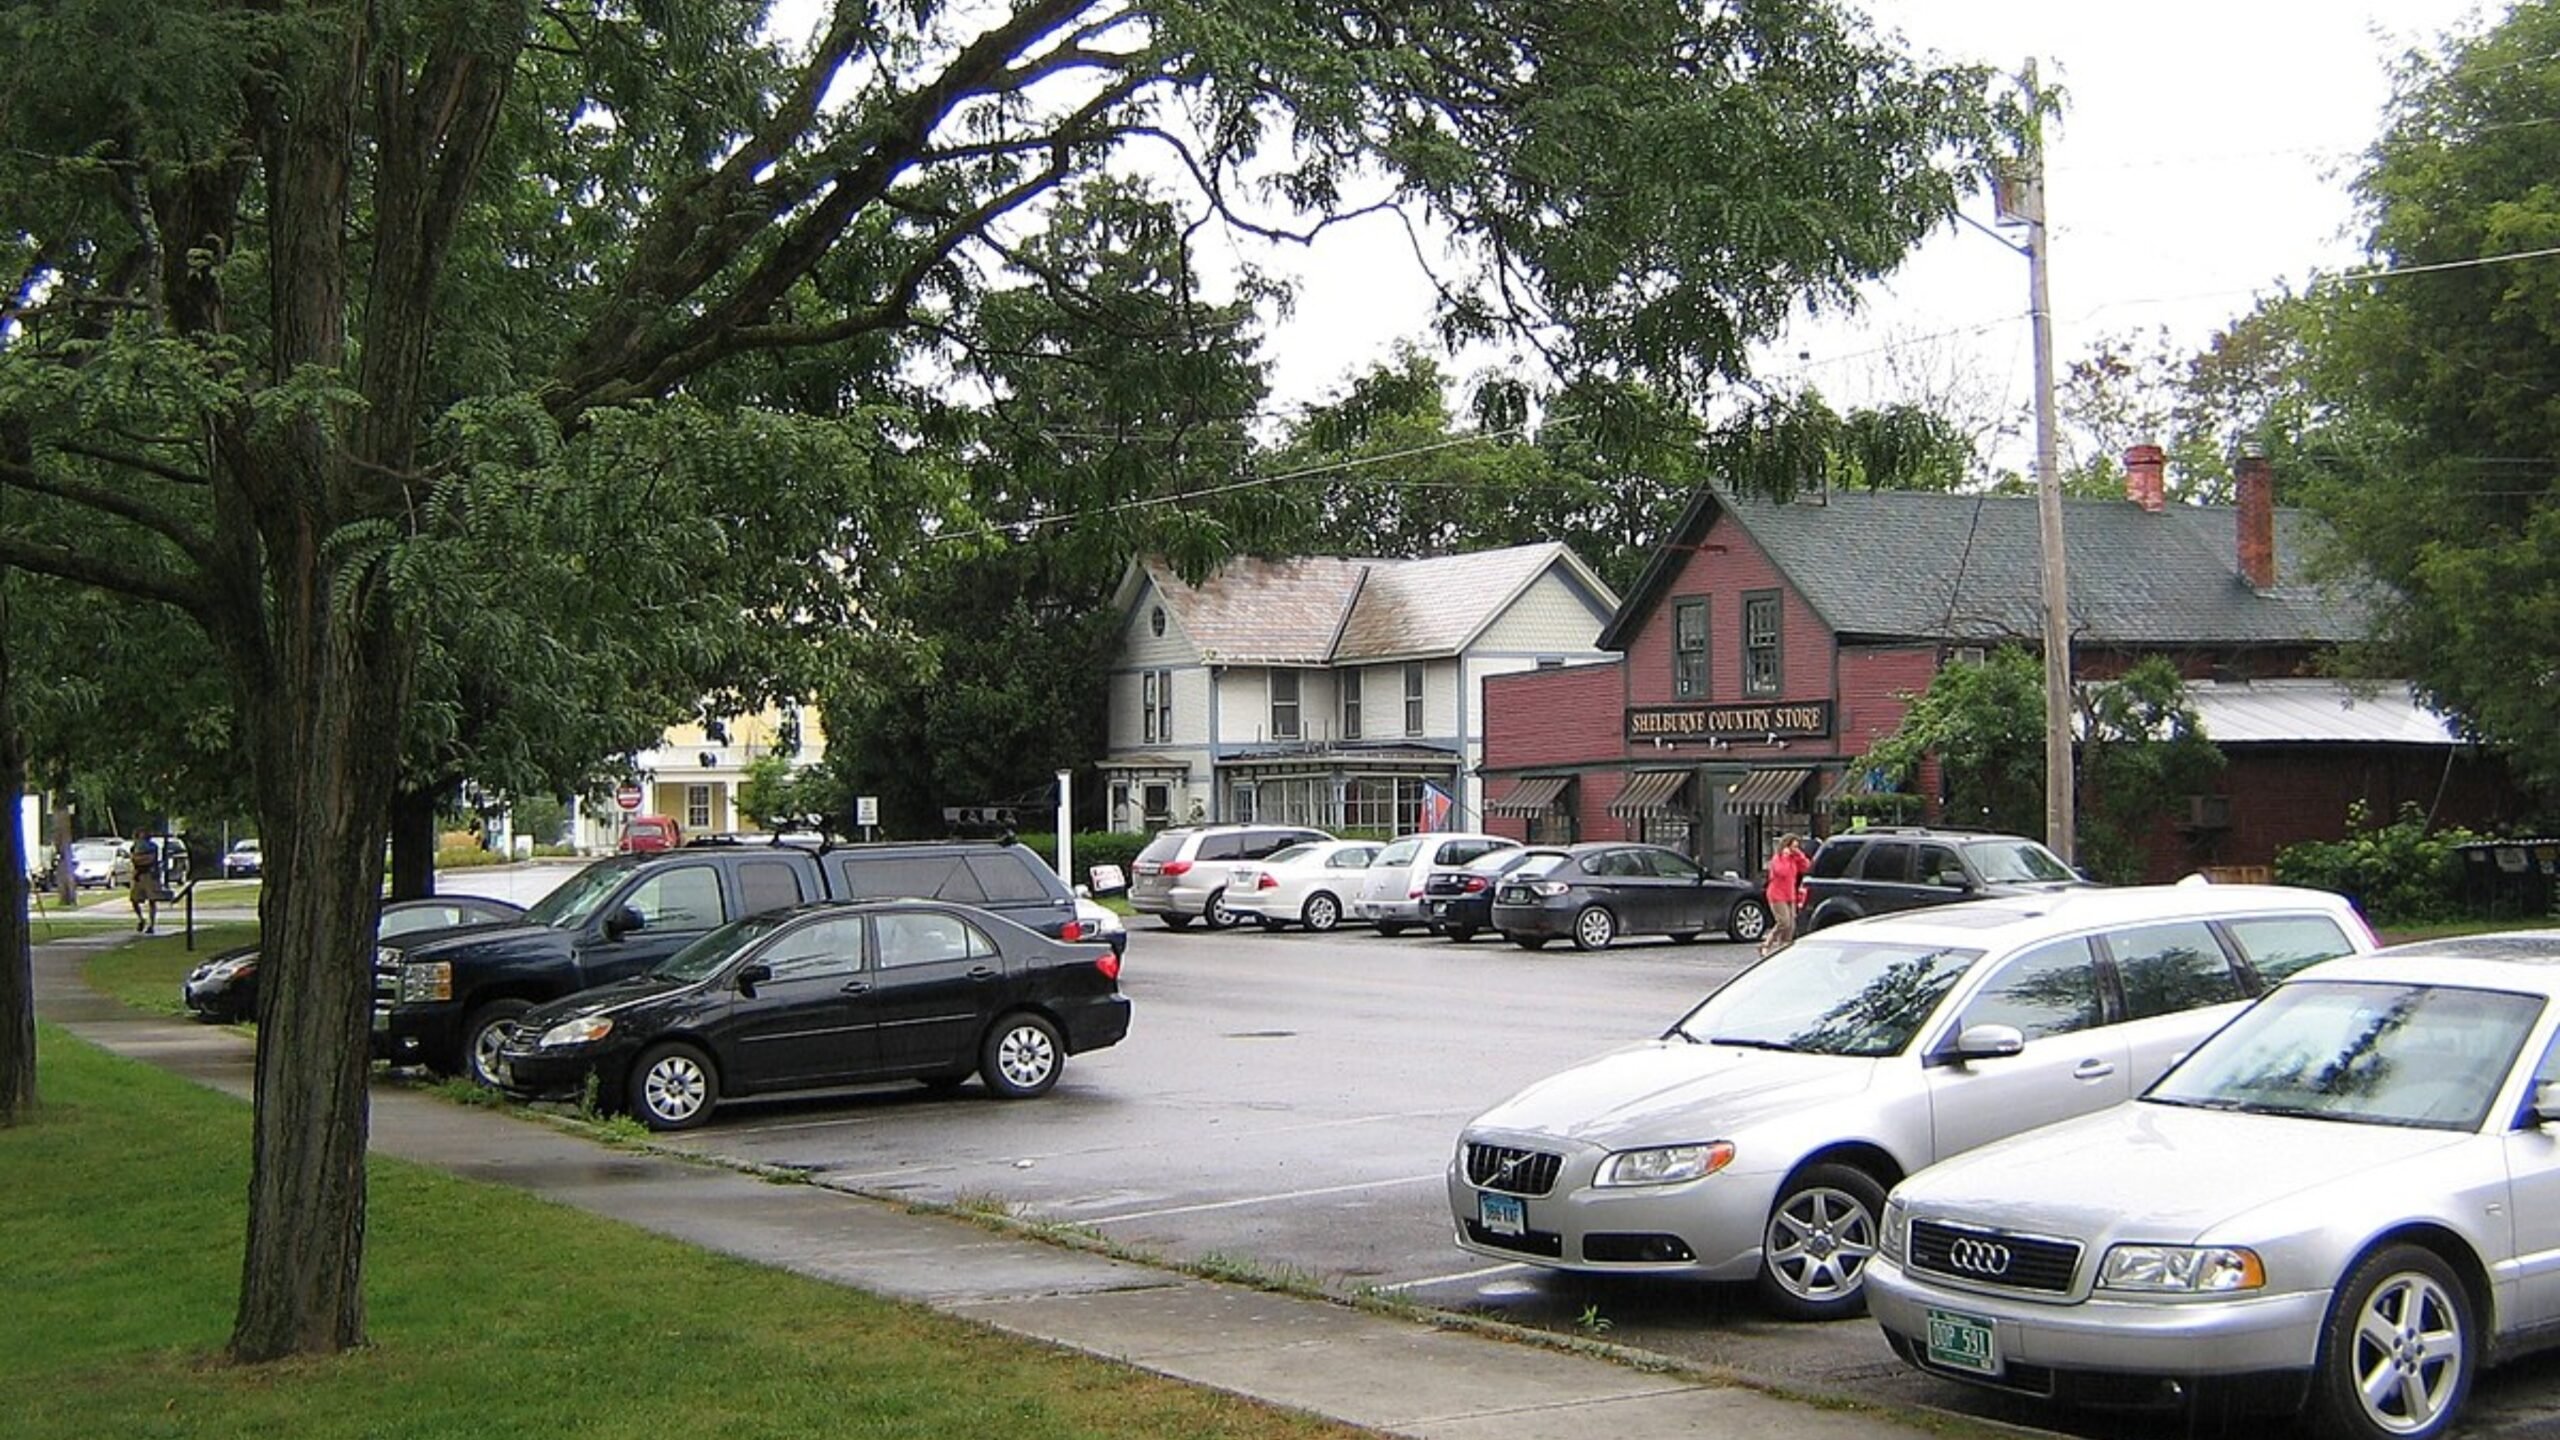
Shelburne is located just south of Burlington and offers a blend of scenic charm, historic character, and accessibility to urban employment centers. Its position along the eastern shore of Lake Champlain enhances its value, particularly for buyers drawn to waterfront views and recreational opportunities.
The town is known for cultural landmarks like Shelburne Museum and Shelburne Farms, along with excellent schools and a vibrant local food scene. These factors have supported steady demand, and prices surged during the height of remote work migration. Even with recent cooling, Shelburne remains one of Chittenden County’s most expensive and desirable towns.
7. Stratton – 121% Home Price Increase Since 2012
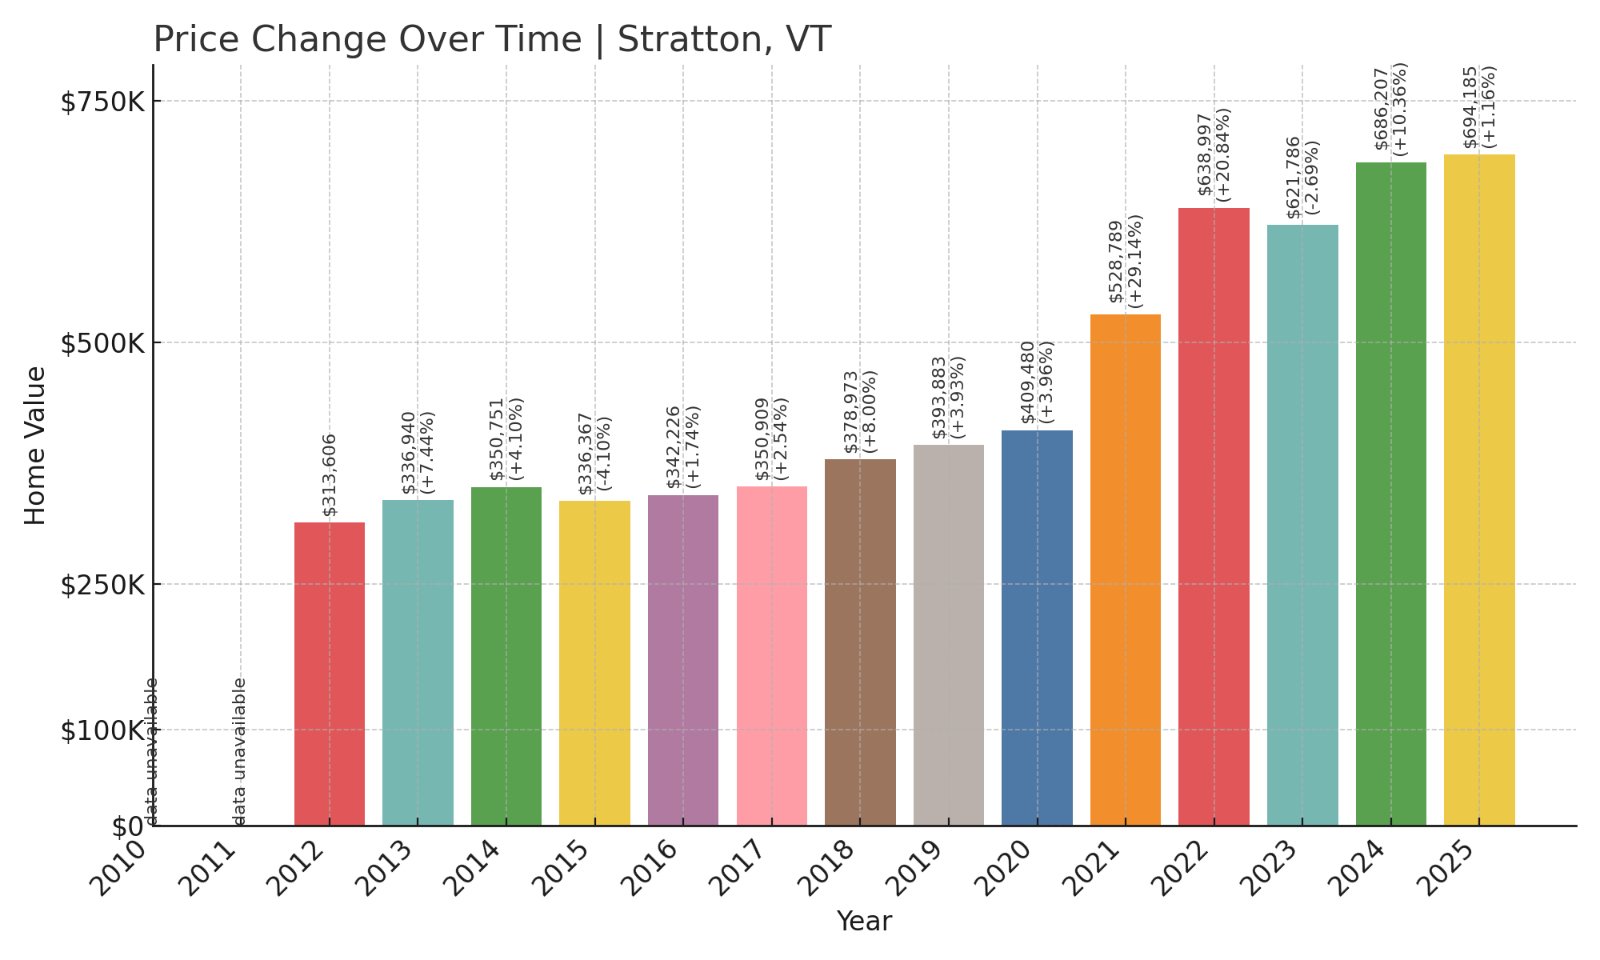
- 2012: $313,606
- 2013: $336,940 (+$23,334, +7.44%)
- 2014: $350,751 (+$13,811, +4.10%)
- 2015: $336,367 (-$14,384, -4.10%)
- 2016: $342,226 (+$5,859, +1.74%)
- 2017: $350,909 (+$8,683, +2.54%)
- 2018: $378,973 (+$28,065, +8.00%)
- 2019: $393,883 (+$14,910, +3.93%)
- 2020: $409,480 (+$15,597, +3.96%)
- 2021: $528,789 (+$119,309, +29.14%)
- 2022: $638,997 (+$110,208, +20.84%)
- 2023: $621,786 (-$17,211, -2.69%)
- 2024: $686,207 (+$64,420, +10.36%)
- 2025: $694,185 (+$7,978, +1.16%)
Stratton’s housing prices more than doubled from 2012 to 2025, reflecting a 121% increase. While there were brief corrections in 2015 and 2023, most years saw strong gains, particularly in the post-2020 period.
Stratton – Resort-Fueled Real Estate Momentum
Stratton is home to one of Vermont’s top ski resorts, and that reputation has made it a magnet for second-home buyers and short-term rental investors. The pandemic-era shift toward outdoor lifestyles only amplified this trend, pushing prices skyward in 2021 and 2022.
The town’s real estate market benefits from a limited housing supply, high demand for slope-side accommodations, and long-standing appeal among affluent northeastern buyers. Even with fluctuations, Stratton’s market remains strong thanks to its winter sports economy and recreational value.
6. Dorset – 87% Home Price Increase Since 2010
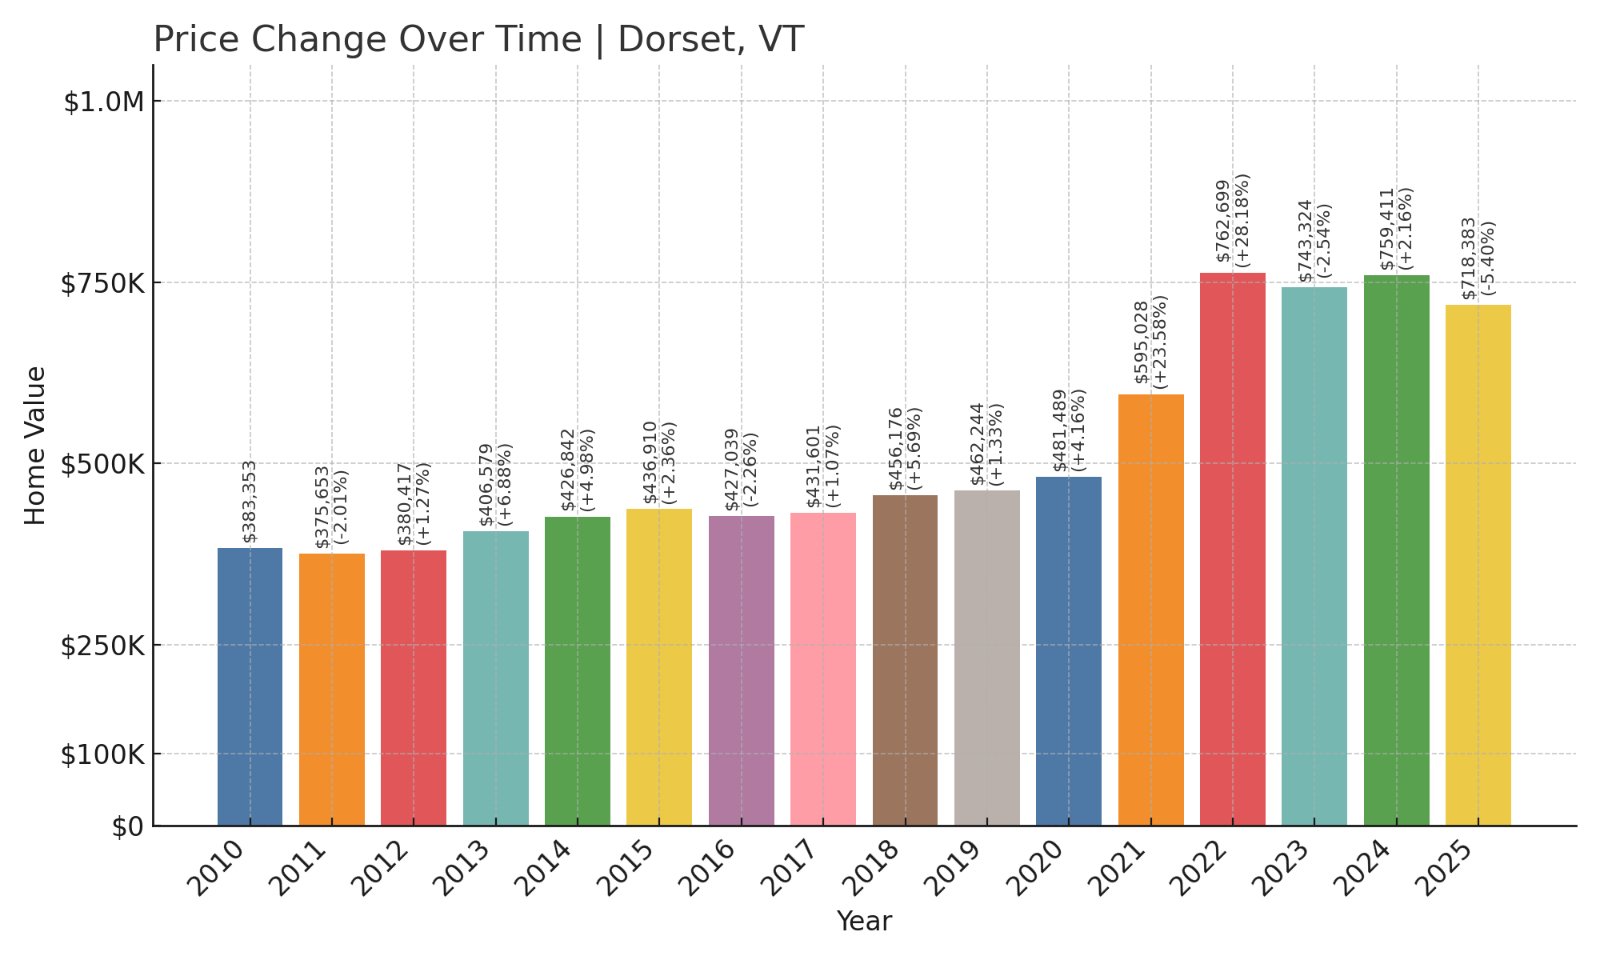
- 2010: $383,353
- 2011: $375,653 (-$7,700, -2.01%)
- 2012: $380,417 (+$4,763, +1.27%)
- 2013: $406,579 (+$26,162, +6.88%)
- 2014: $426,842 (+$20,264, +4.98%)
- 2015: $436,910 (+$10,067, +2.36%)
- 2016: $427,039 (-$9,871, -2.26%)
- 2017: $431,601 (+$4,561, +1.07%)
- 2018: $456,176 (+$24,575, +5.69%)
- 2019: $462,244 (+$6,068, +1.33%)
- 2020: $481,489 (+$19,245, +4.16%)
- 2021: $595,028 (+$113,539, +23.58%)
- 2022: $762,699 (+$167,671, +28.18%)
- 2023: $743,324 (-$19,375, -2.54%)
- 2024: $759,411 (+$16,087, +2.16%)
- 2025: $718,383 (-$41,028, -5.40%)
Dorset saw an 87% increase in home prices from 2010 to 2025. While the market dipped in the most recent year, that followed two of the strongest years in the state, with increases of 24% and 28% in 2021 and 2022.
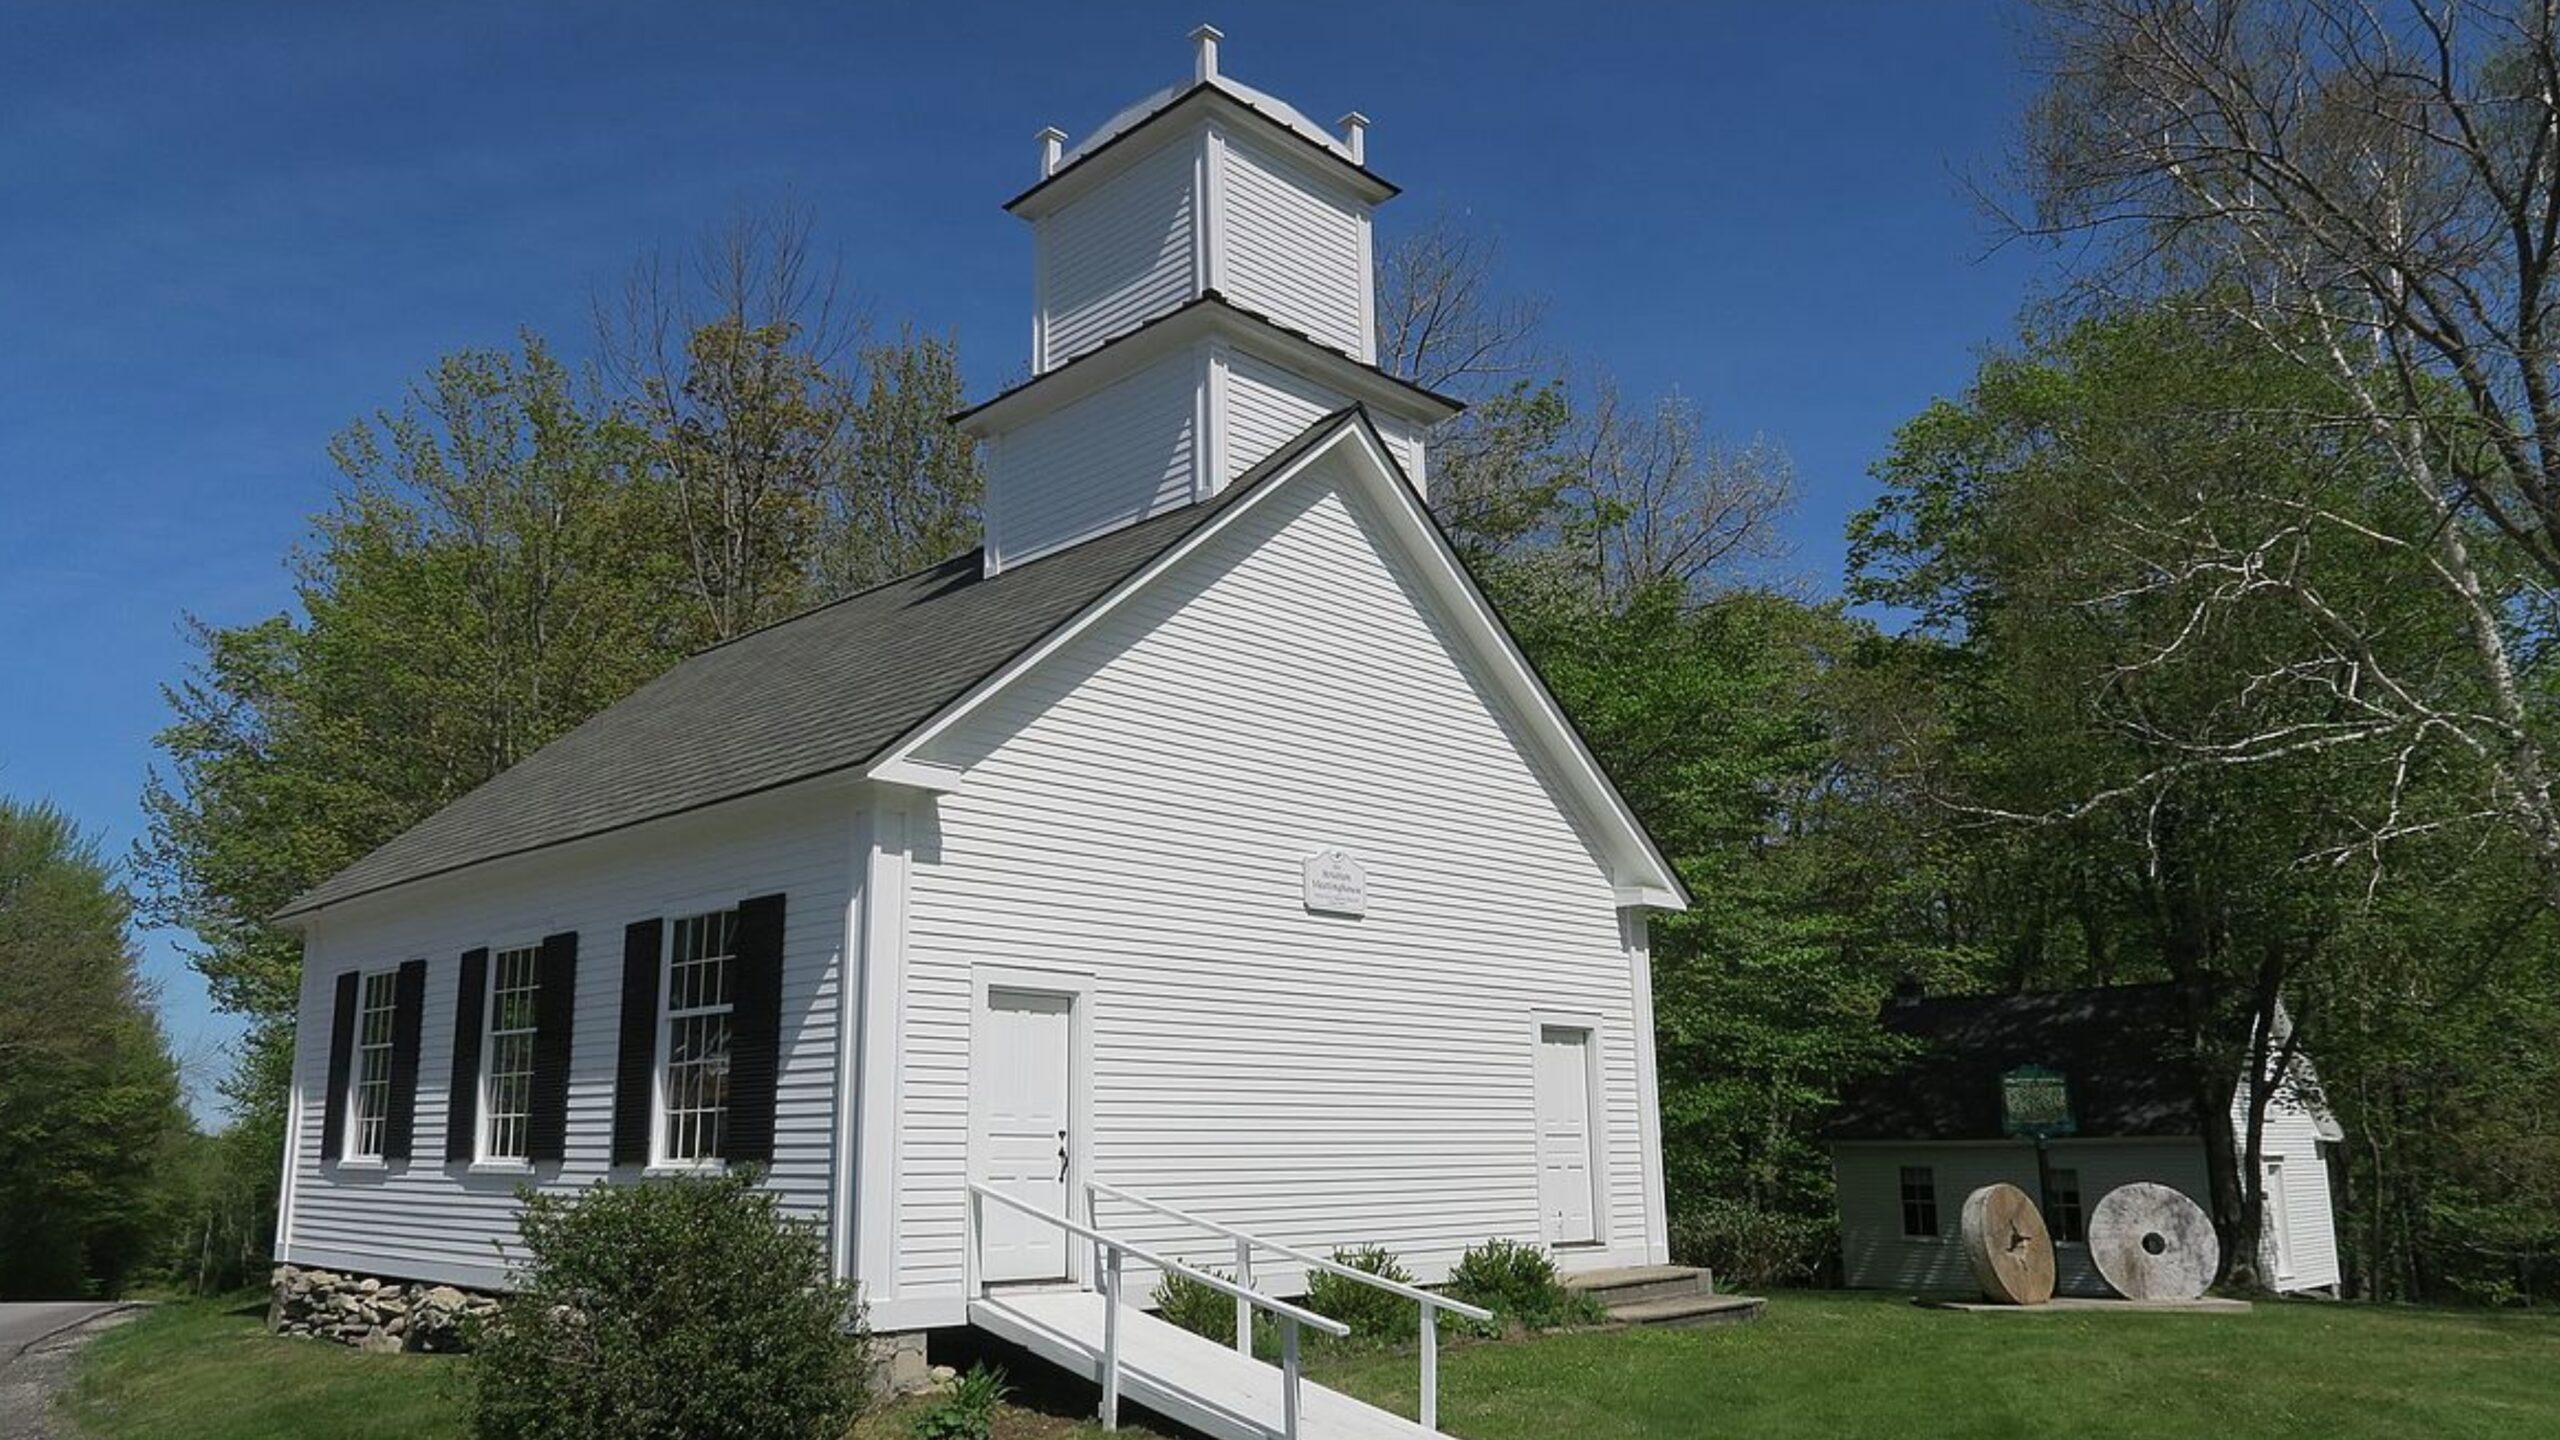
Dorset – Luxury Living in the Green Mountains

Dorset is one of southern Vermont’s most upscale and picturesque communities. Known for its historic village, marble quarries, and boutique atmosphere, it’s been a longtime favorite among well-heeled vacationers and second-home buyers from New York and New England.
The surge in home prices reflects both demand and scarcity: there are few homes available at any given time, and even fewer that match the town’s high-end standards. Dorset offers refined rural living with easy access to Manchester’s amenities, giving it both cachet and convenience.
5. Woodstock – 87% Home Price Increase Since 2010
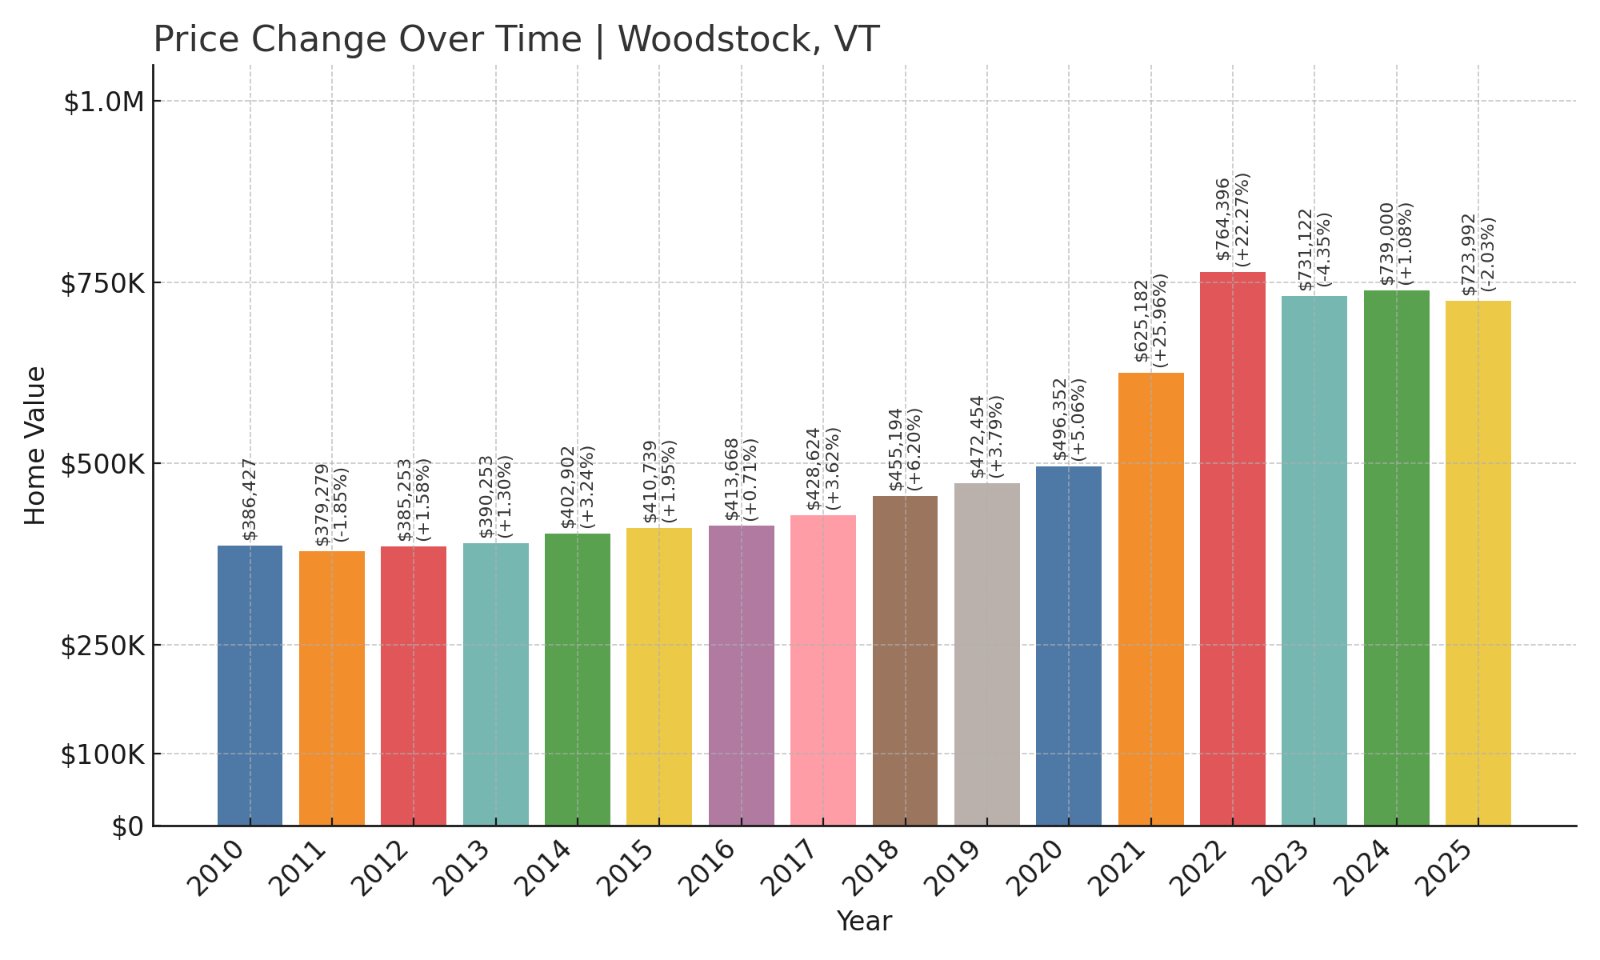
- 2010: $386,427
- 2011: $379,279 (-$7,148, -1.85%)
- 2012: $385,253 (+$5,974, +1.57%)
- 2013: $390,253 (+$5,000, +1.30%)
- 2014: $402,902 (+$12,649, +3.24%)
- 2015: $410,739 (+$7,837, +1.95%)
- 2016: $413,668 (+$2,929, +0.71%)
- 2017: $428,624 (+$14,956, +3.62%)
- 2018: $455,194 (+$26,570, +6.20%)
- 2019: $472,454 (+$17,260, +3.79%)
- 2020: $496,352 (+$23,898, +5.06%)
- 2021: $625,182 (+$128,830, +25.96%)
- 2022: $764,396 (+$139,214, +22.27%)
- 2023: $731,122 (-$33,274, -4.35%)
- 2024: $739,000 (+$7,878, +1.08%)
- 2025: $723,992 (-$15,008, -2.03%)
Woodstock’s home prices have climbed 87% since 2010. Much of that increase came between 2020 and 2022, when values jumped more than 50% in just two years. While the market has cooled since, values remain significantly higher than a decade ago.
Woodstock – Heritage and High Demand
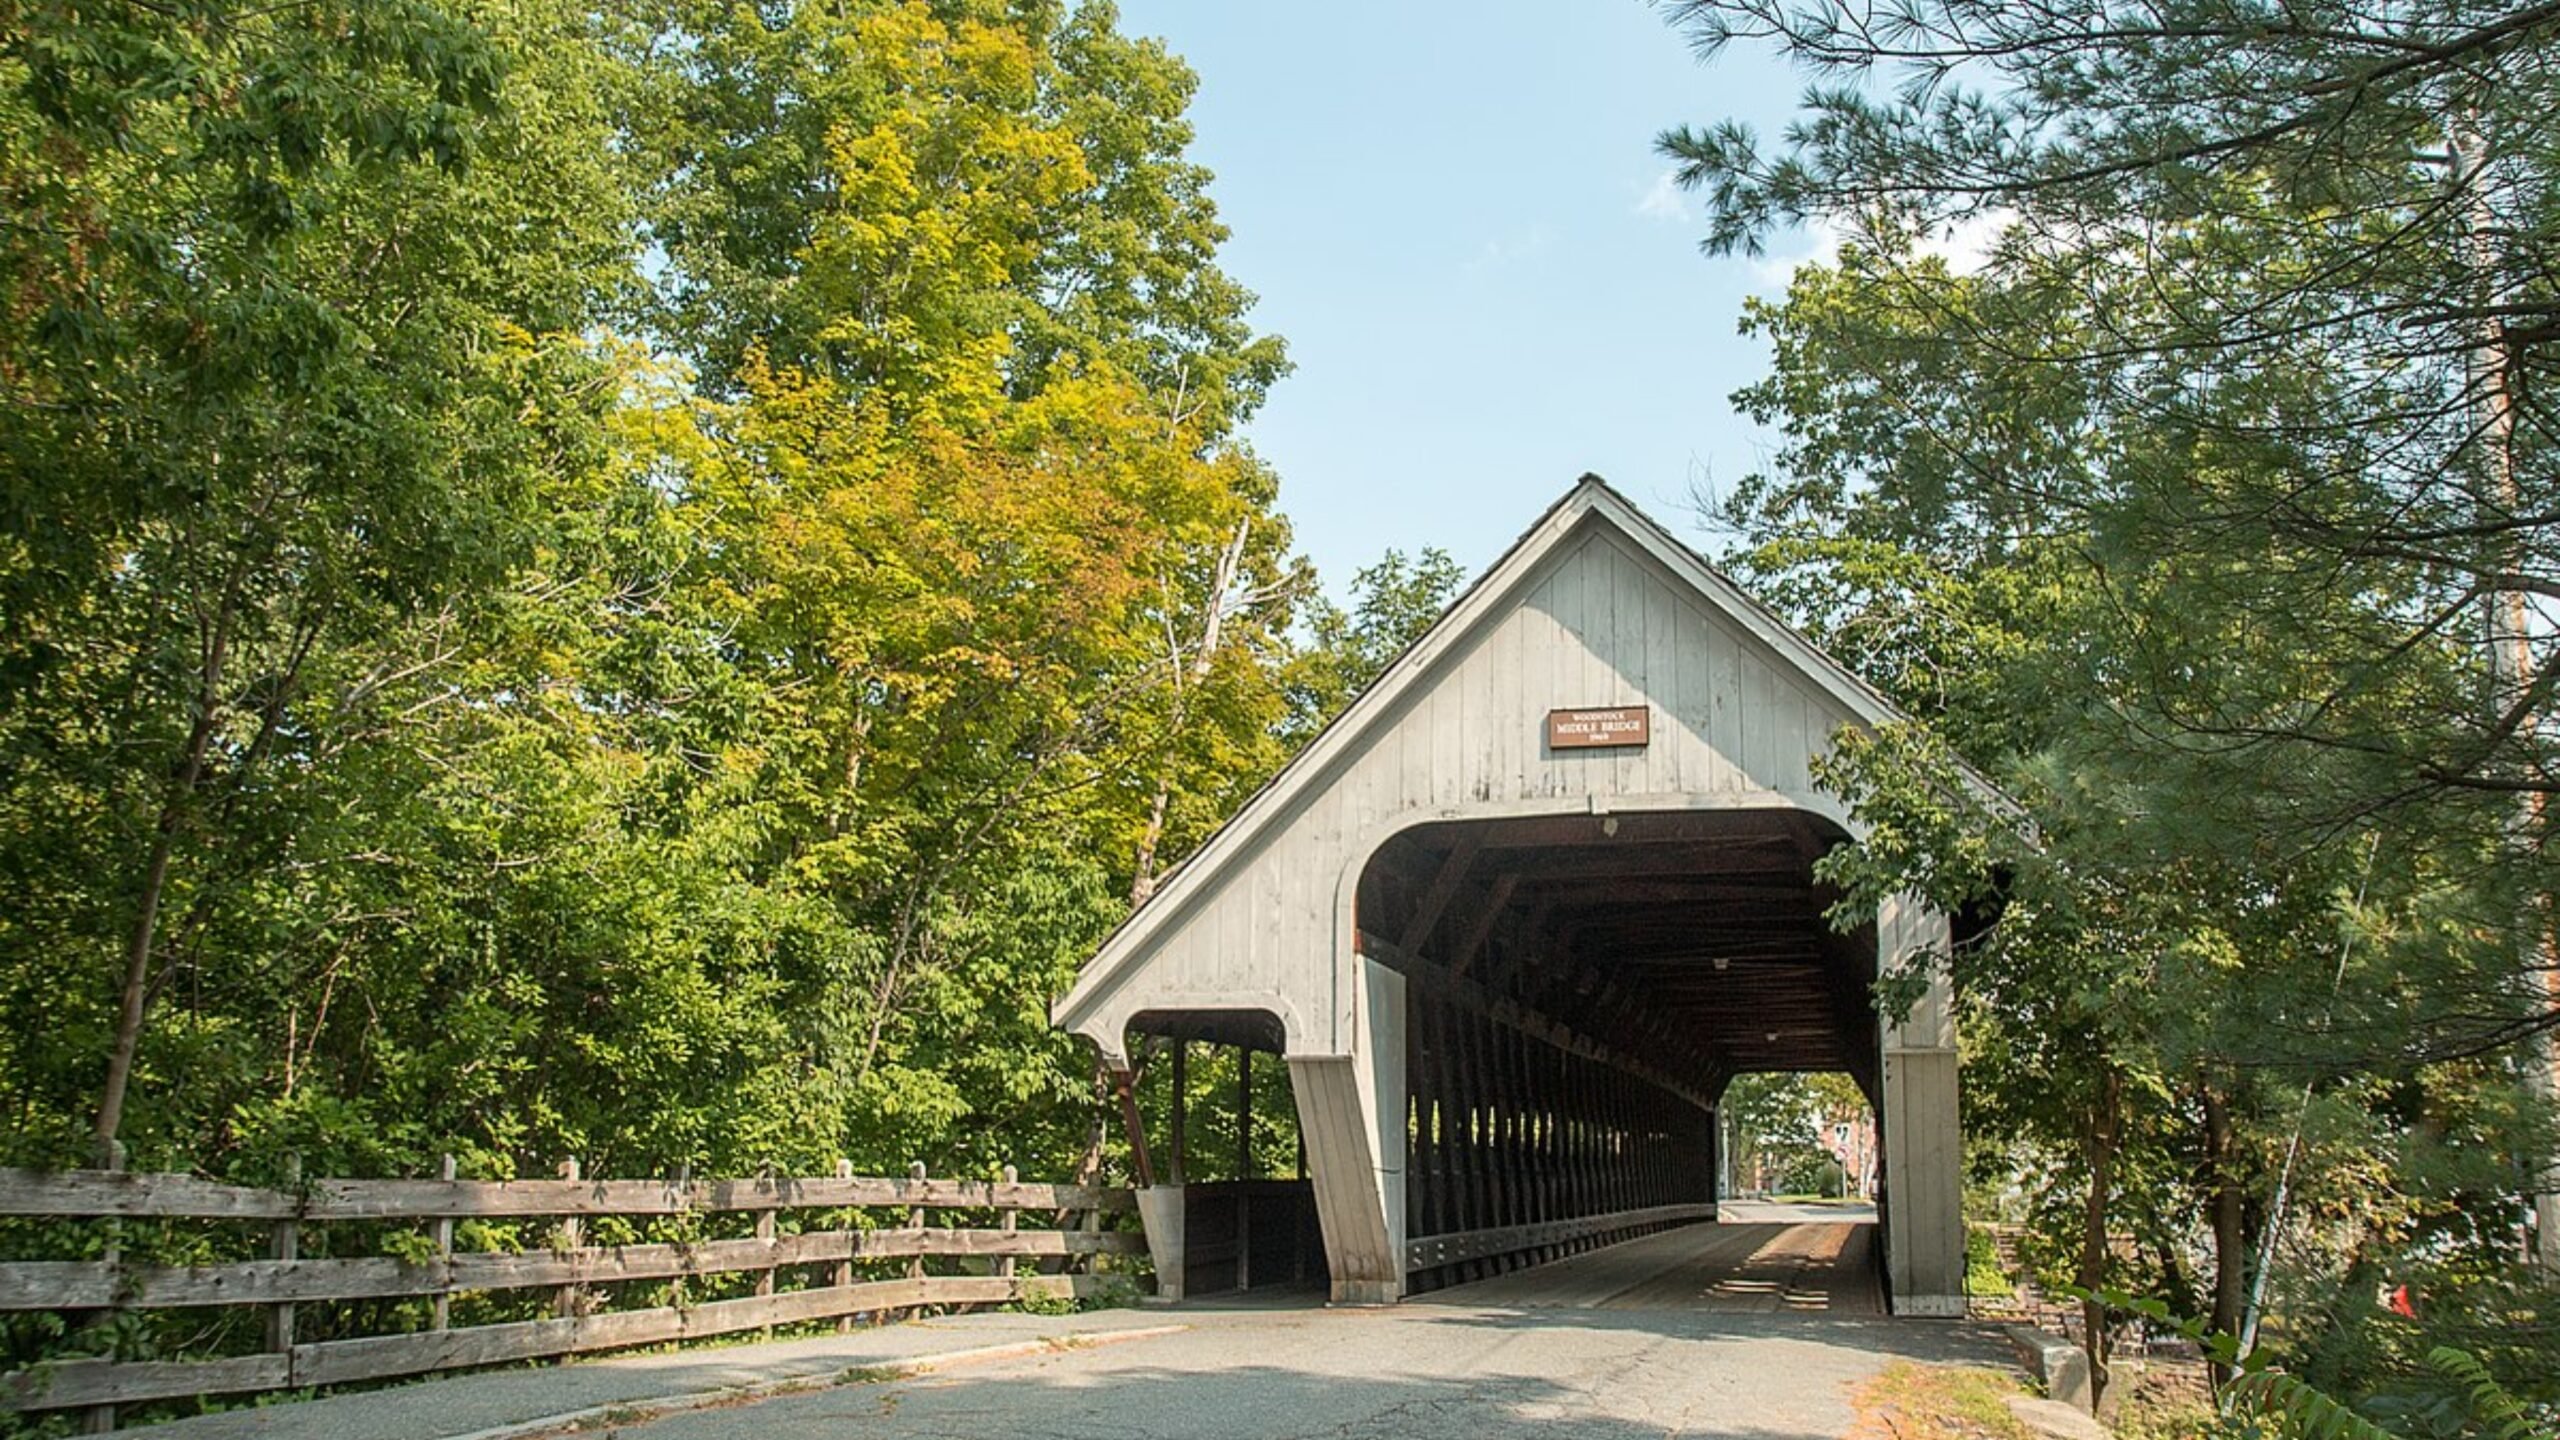
Often called one of the prettiest towns in America, Woodstock has long held a special place in Vermont’s identity. Its covered bridges, historic architecture, and cultural institutions like the Billings Farm and Museum make it a magnet for tourists and residents alike.
The town has a strong second-home market, and its status as a year-round destination has driven demand from wealthy out-of-staters. Limited inventory, walkable charm, and scenic appeal have all contributed to sharp price increases, particularly in the post-pandemic years.
4. Norwich – 98% Home Price Increase Since 2010
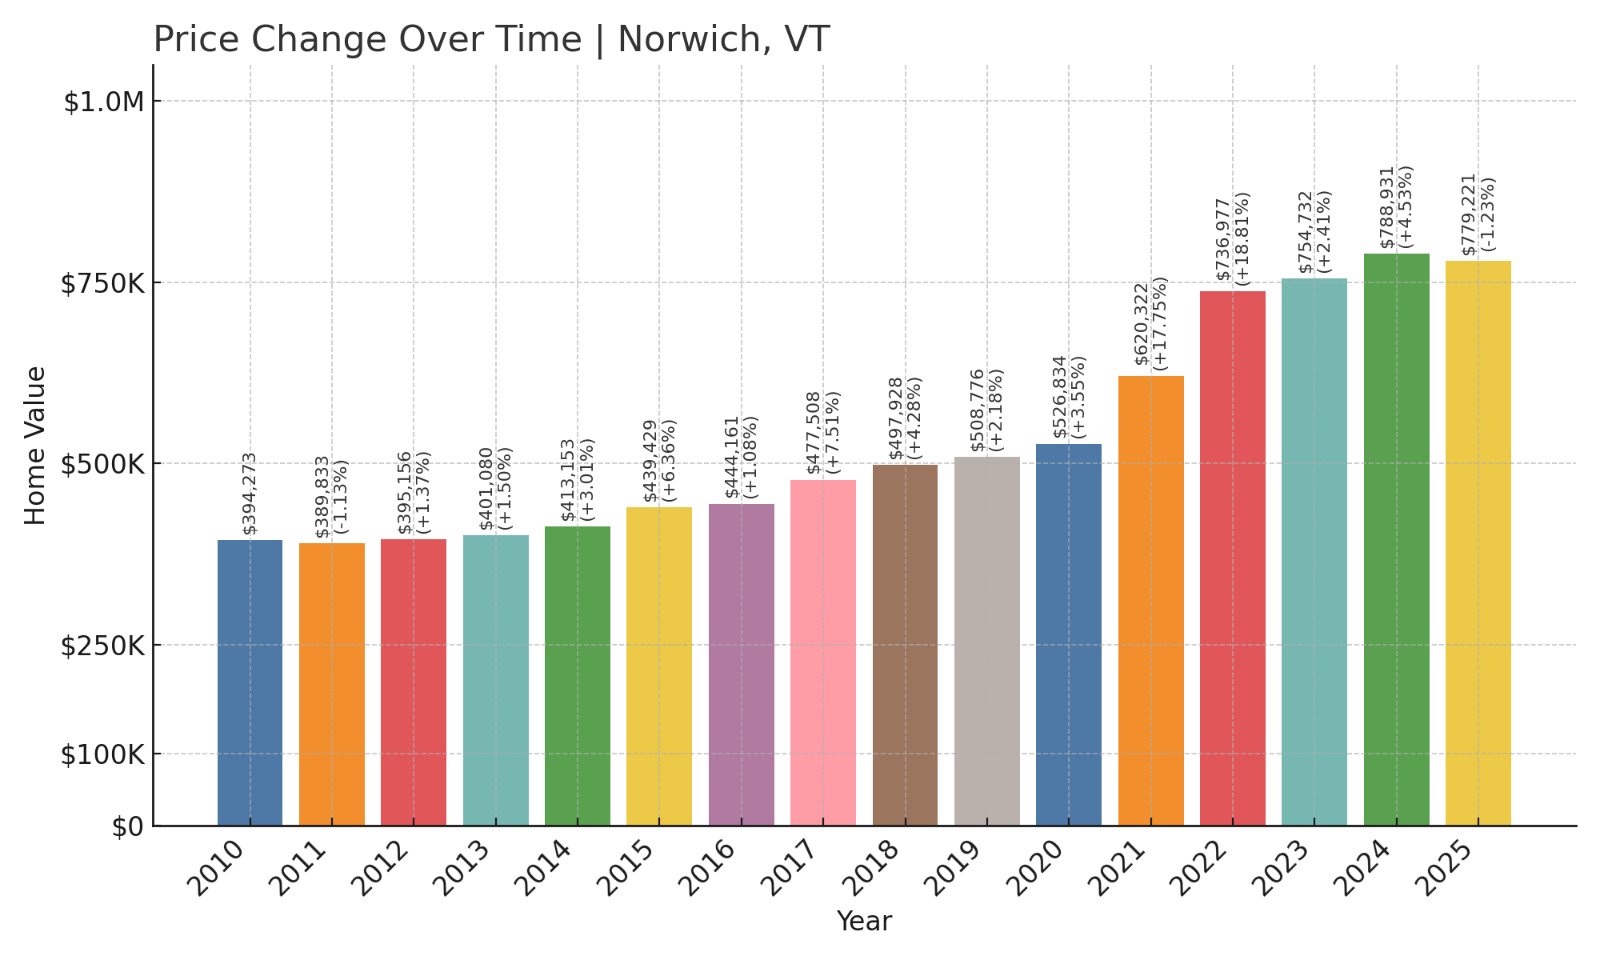
- 2010: $394,273
- 2011: $389,833 (-$4,440, -1.13%)
- 2012: $395,156 (+$5,323, +1.37%)
- 2013: $401,080 (+$5,925, +1.50%)
- 2014: $413,153 (+$12,072, +3.01%)
- 2015: $439,429 (+$26,276, +6.36%)
- 2016: $444,161 (+$4,732, +1.08%)
- 2017: $477,508 (+$33,346, +7.51%)
- 2018: $497,928 (+$20,420, +4.28%)
- 2019: $508,776 (+$10,848, +2.18%)
- 2020: $526,834 (+$18,058, +3.55%)
- 2021: $620,322 (+$93,488, +17.75%)
- 2022: $736,977 (+$116,655, +18.81%)
- 2023: $754,732 (+$17,755, +2.41%)
- 2024: $788,931 (+$34,198, +4.53%)
- 2025: $779,221 (-$9,709, -1.23%)
Norwich home prices nearly doubled from 2010 to 2025, with steady growth in the 2010s followed by major surges in the early 2020s. Even with a slight dip in 2025, Norwich remains one of Vermont’s most valuable housing markets.
Norwich – Ivy League Proximity and Rural Prestige
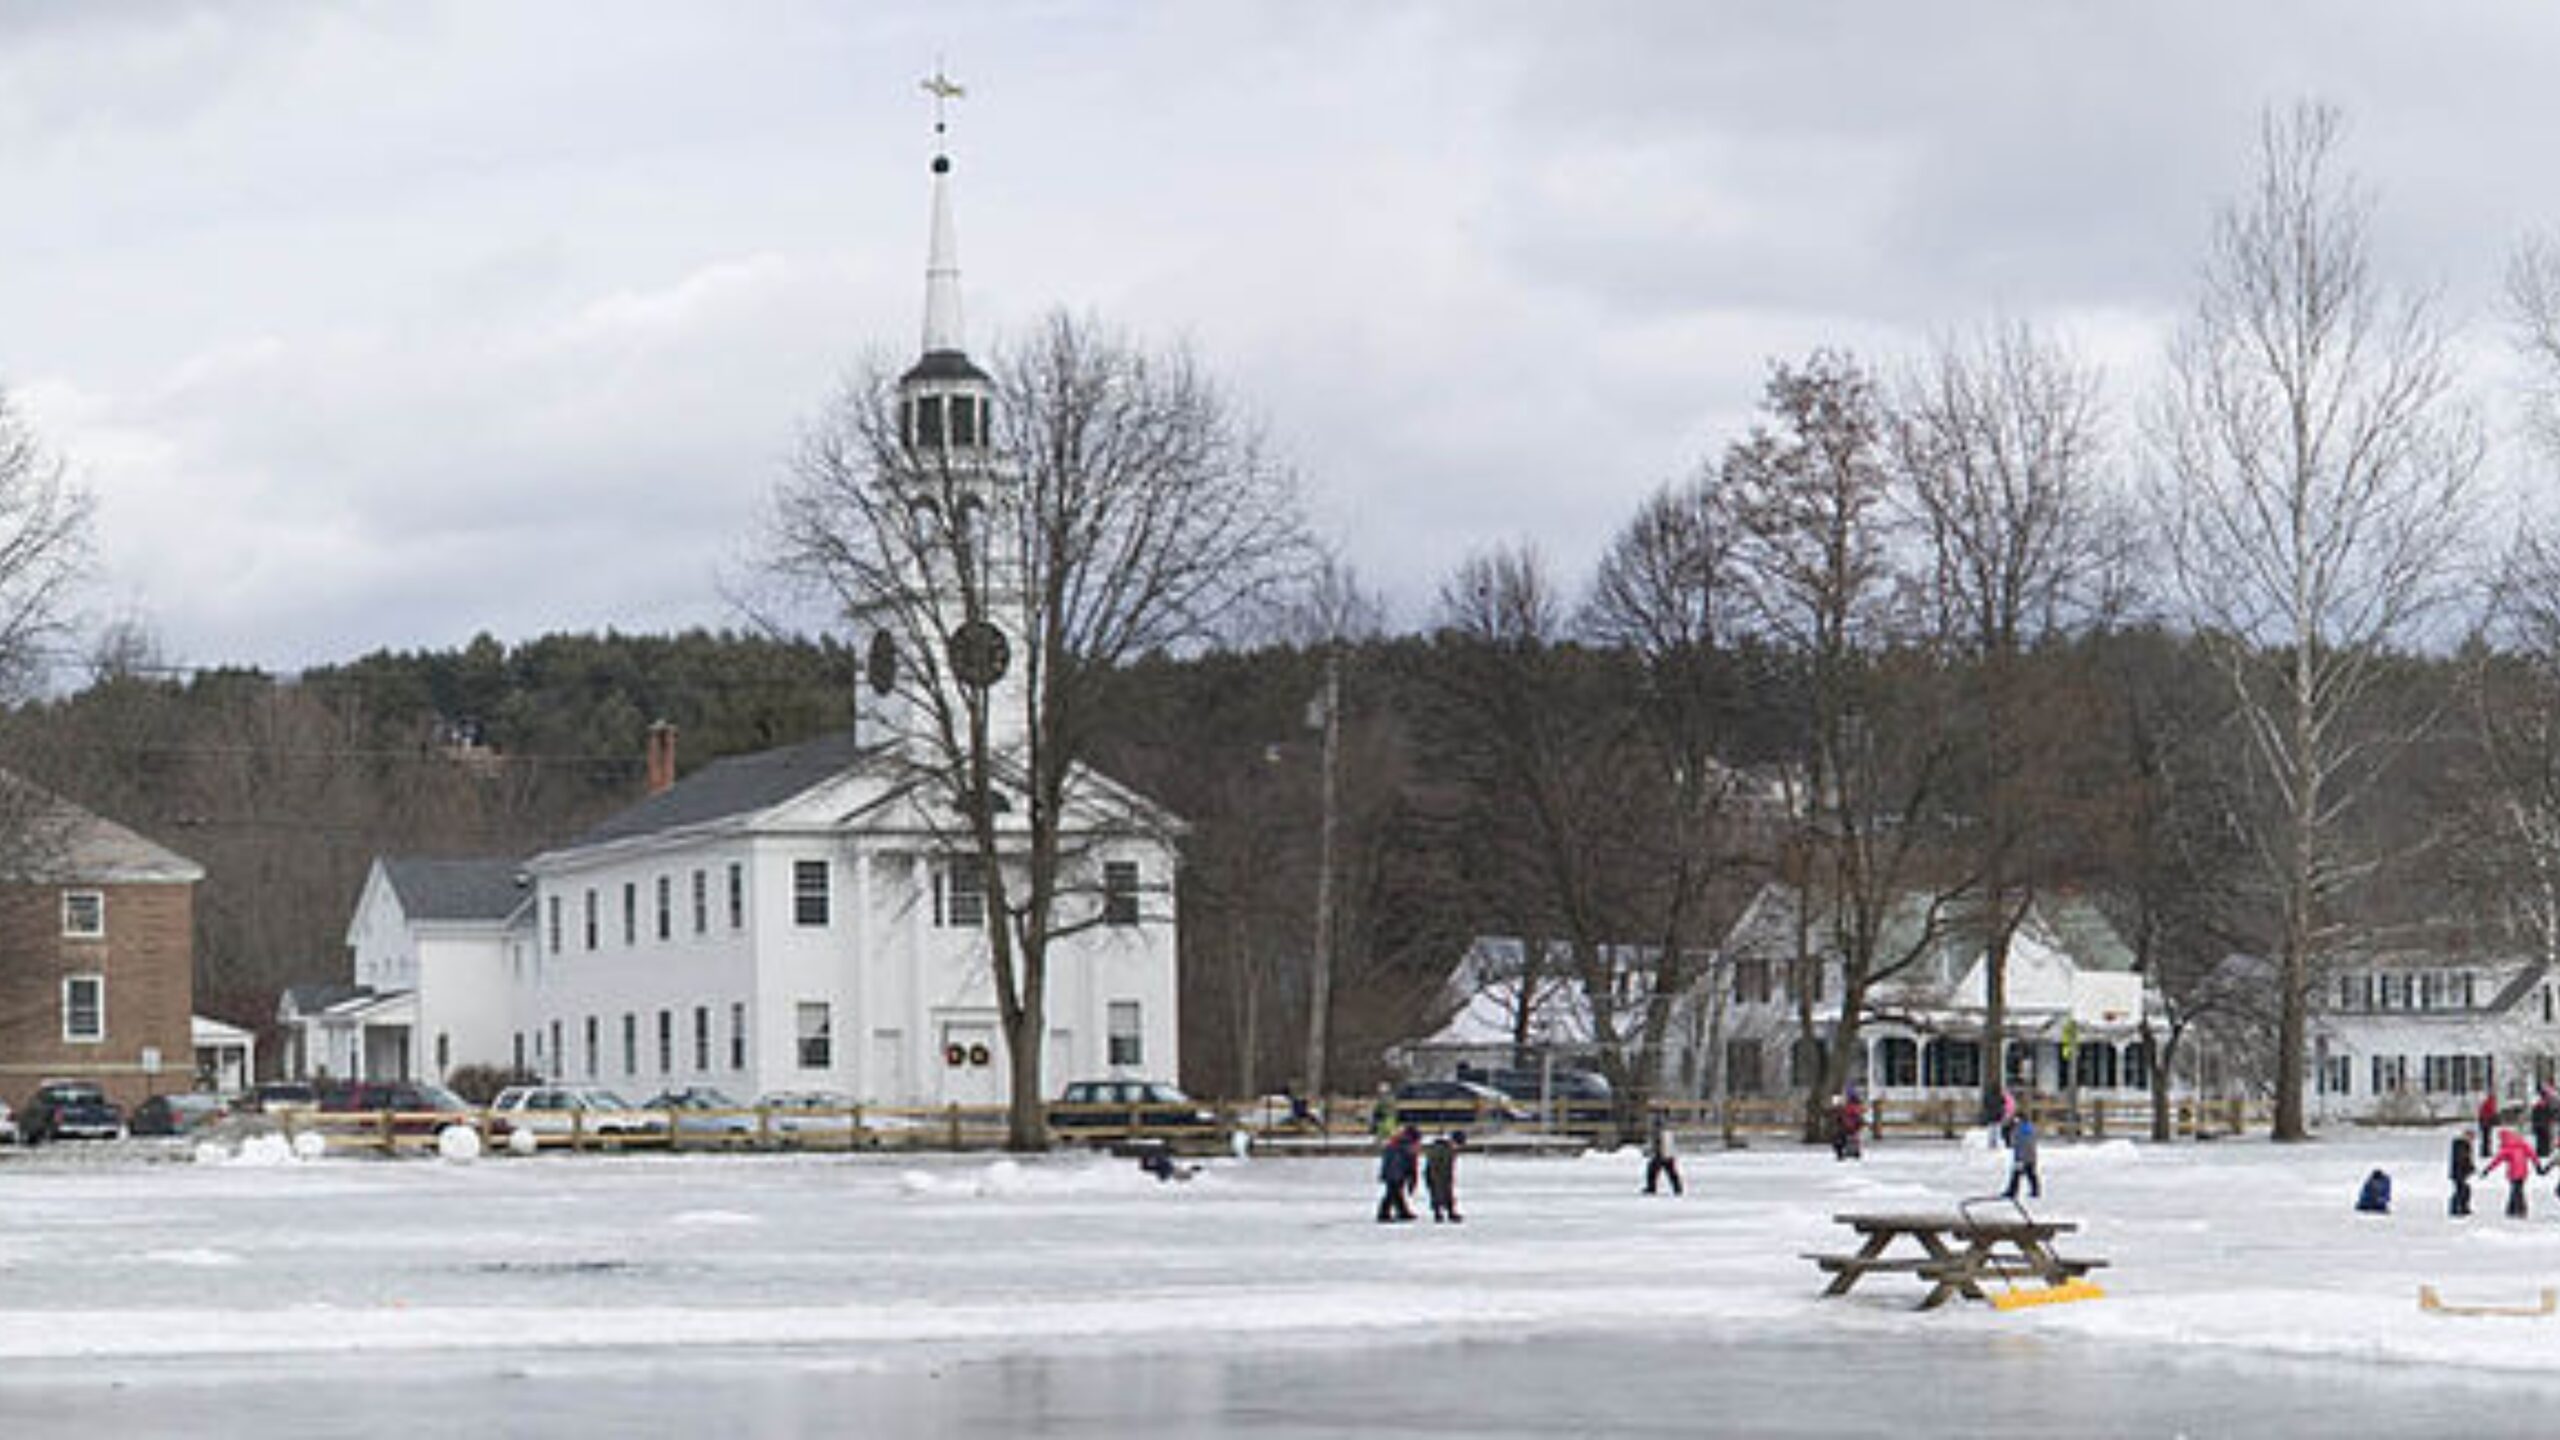
Norwich is just across the Connecticut River from Hanover, New Hampshire, home of Dartmouth College. This proximity gives Norwich a unique appeal — small-town Vermont charm combined with access to world-class education, healthcare, and culture.
Buyers are drawn to Norwich for its excellent schools, classic New England homes, and walkable village center. Strong demand, limited inventory, and high-income buyers have all contributed to its near-100% price increase since 2010. It remains a top choice for professionals and families seeking refined rural living.
3. Landgrove – 5.8% Home Price Decrease Since 2024
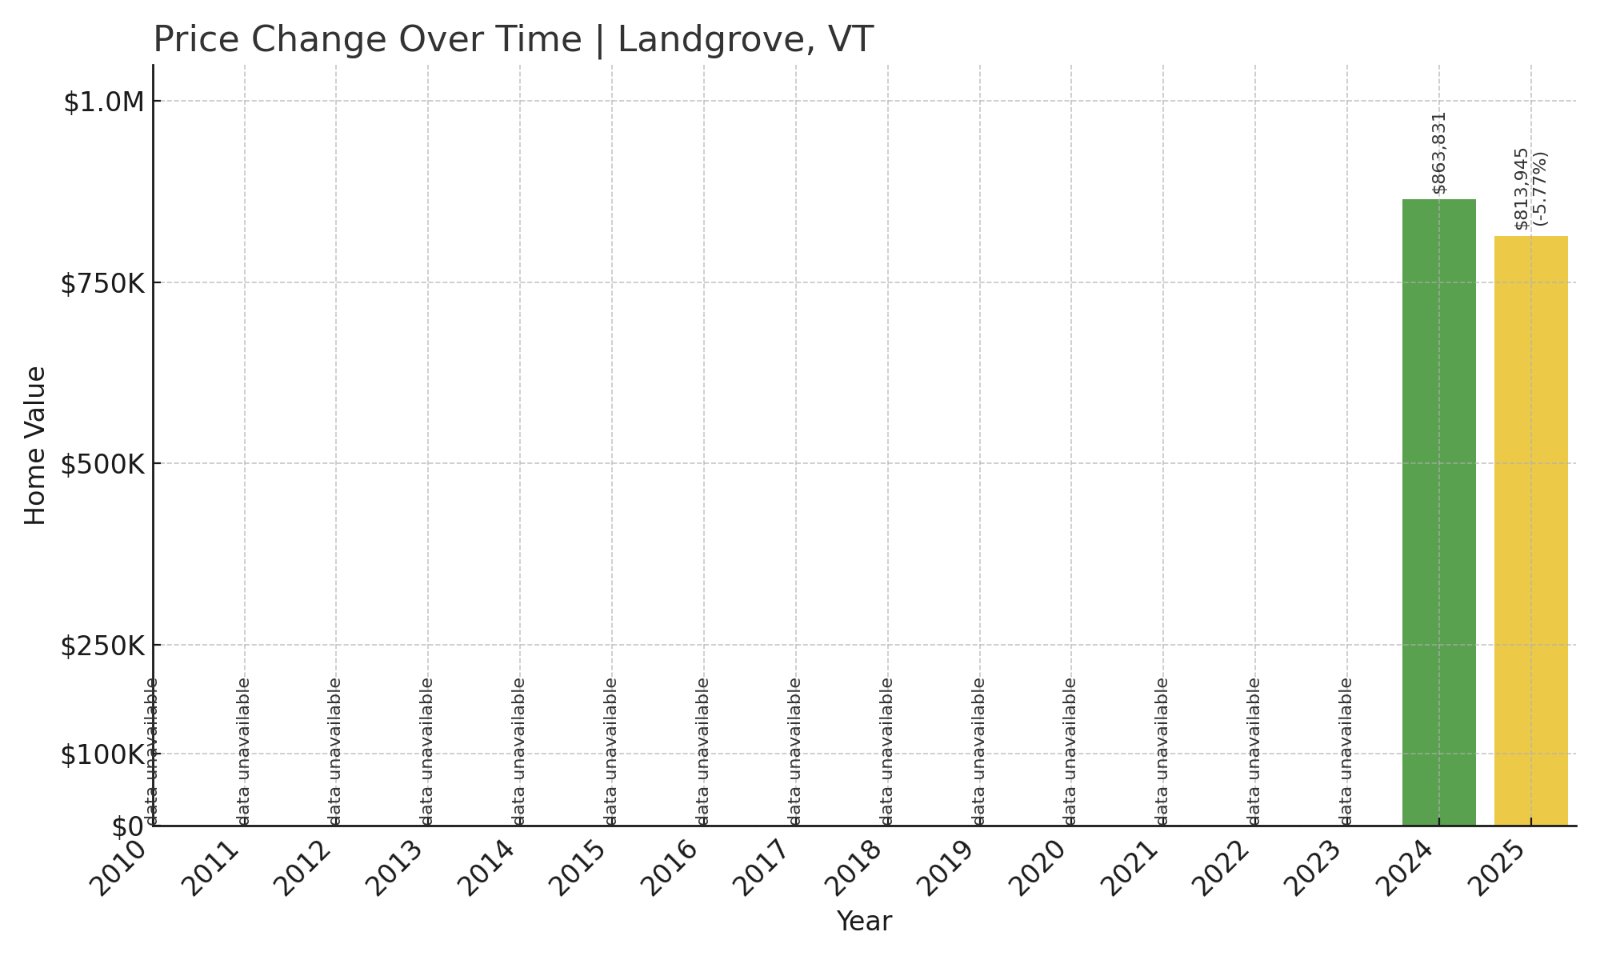
- 2024: $863,831
- 2025: $813,945 (-$49,886, -5.77%)
Landgrove only has two years of recorded data, with a nearly 6% price decline in 2025 following an extremely high 2024 valuation. Despite the short-term dip, the town’s average home price remains among the highest in Vermont.
Landgrove – Small in Size, High in Value
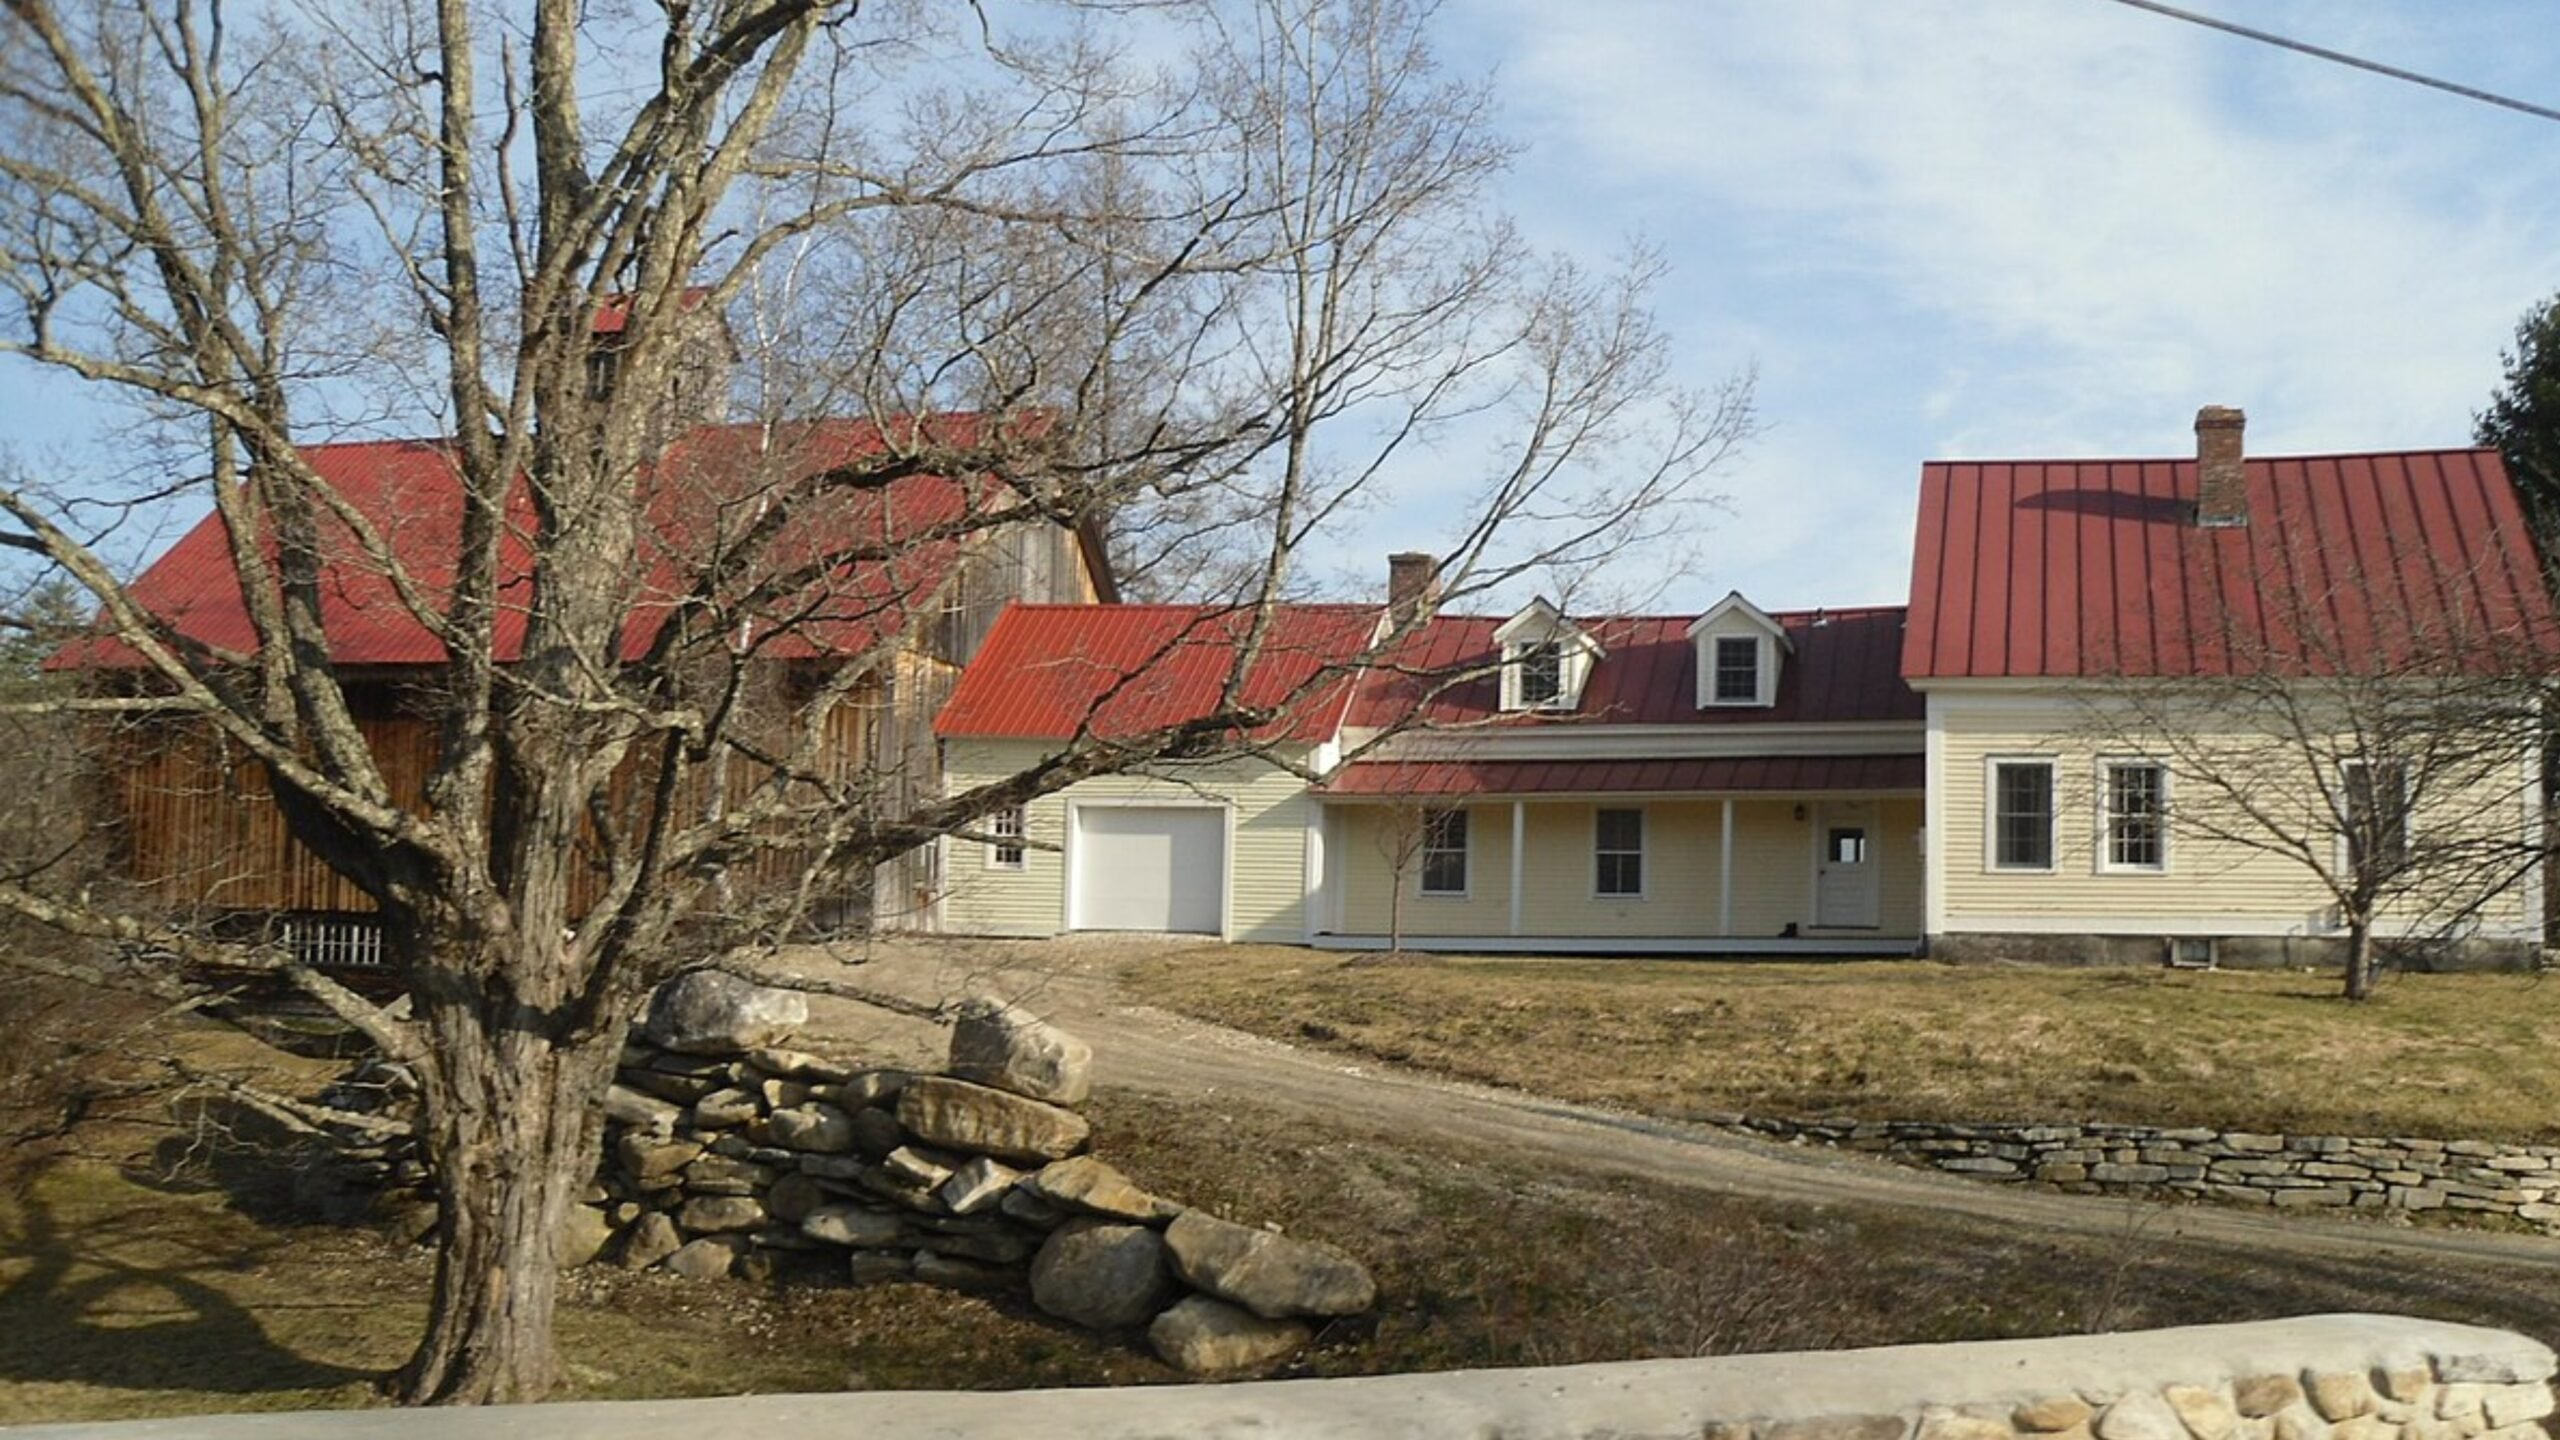
Landgrove is one of Vermont’s smallest towns by population, but it punches above its weight in terms of home values. Located near the Green Mountains and ski areas like Bromley and Stratton, it has become a niche luxury market, especially for second-home buyers.
Its secluded feel and natural beauty offer privacy that many high-income buyers prize. The lack of housing turnover and limited development help keep prices high, even as year-to-year fluctuations can be more pronounced in such a small market.
2. Charlotte – 102% Home Price Increase Since 2010

- 2010: $406,520
- 2011: $435,044 (+$28,524, +7.02%)
- 2012: $428,296 (-$6,748, -1.55%)
- 2013: $444,200 (+$15,904, +3.71%)
- 2014: $467,296 (+$23,097, +5.20%)
- 2015: $469,345 (+$2,049, +0.44%)
- 2016: $468,809 (-$536, -0.11%)
- 2017: $483,969 (+$15,160, +3.23%)
- 2018: $504,483 (+$20,514, +4.24%)
- 2019: $521,432 (+$16,949, +3.36%)
- 2020: $532,336 (+$10,904, +2.09%)
- 2021: $615,742 (+$83,406, +15.67%)
- 2022: $729,409 (+$113,667, +18.46%)
- 2023: $738,539 (+$9,130, +1.25%)
- 2024: $786,177 (+$47,638, +6.45%)
- 2025: $823,196 (+$37,019, +4.71%)
Charlotte’s home prices rose by 102% over 15 years, making it one of Vermont’s most consistently high-value towns. The largest jumps came after 2020, but even prior to that, values steadily increased.
Charlotte – Scenic, Spacious, and Highly Sought After
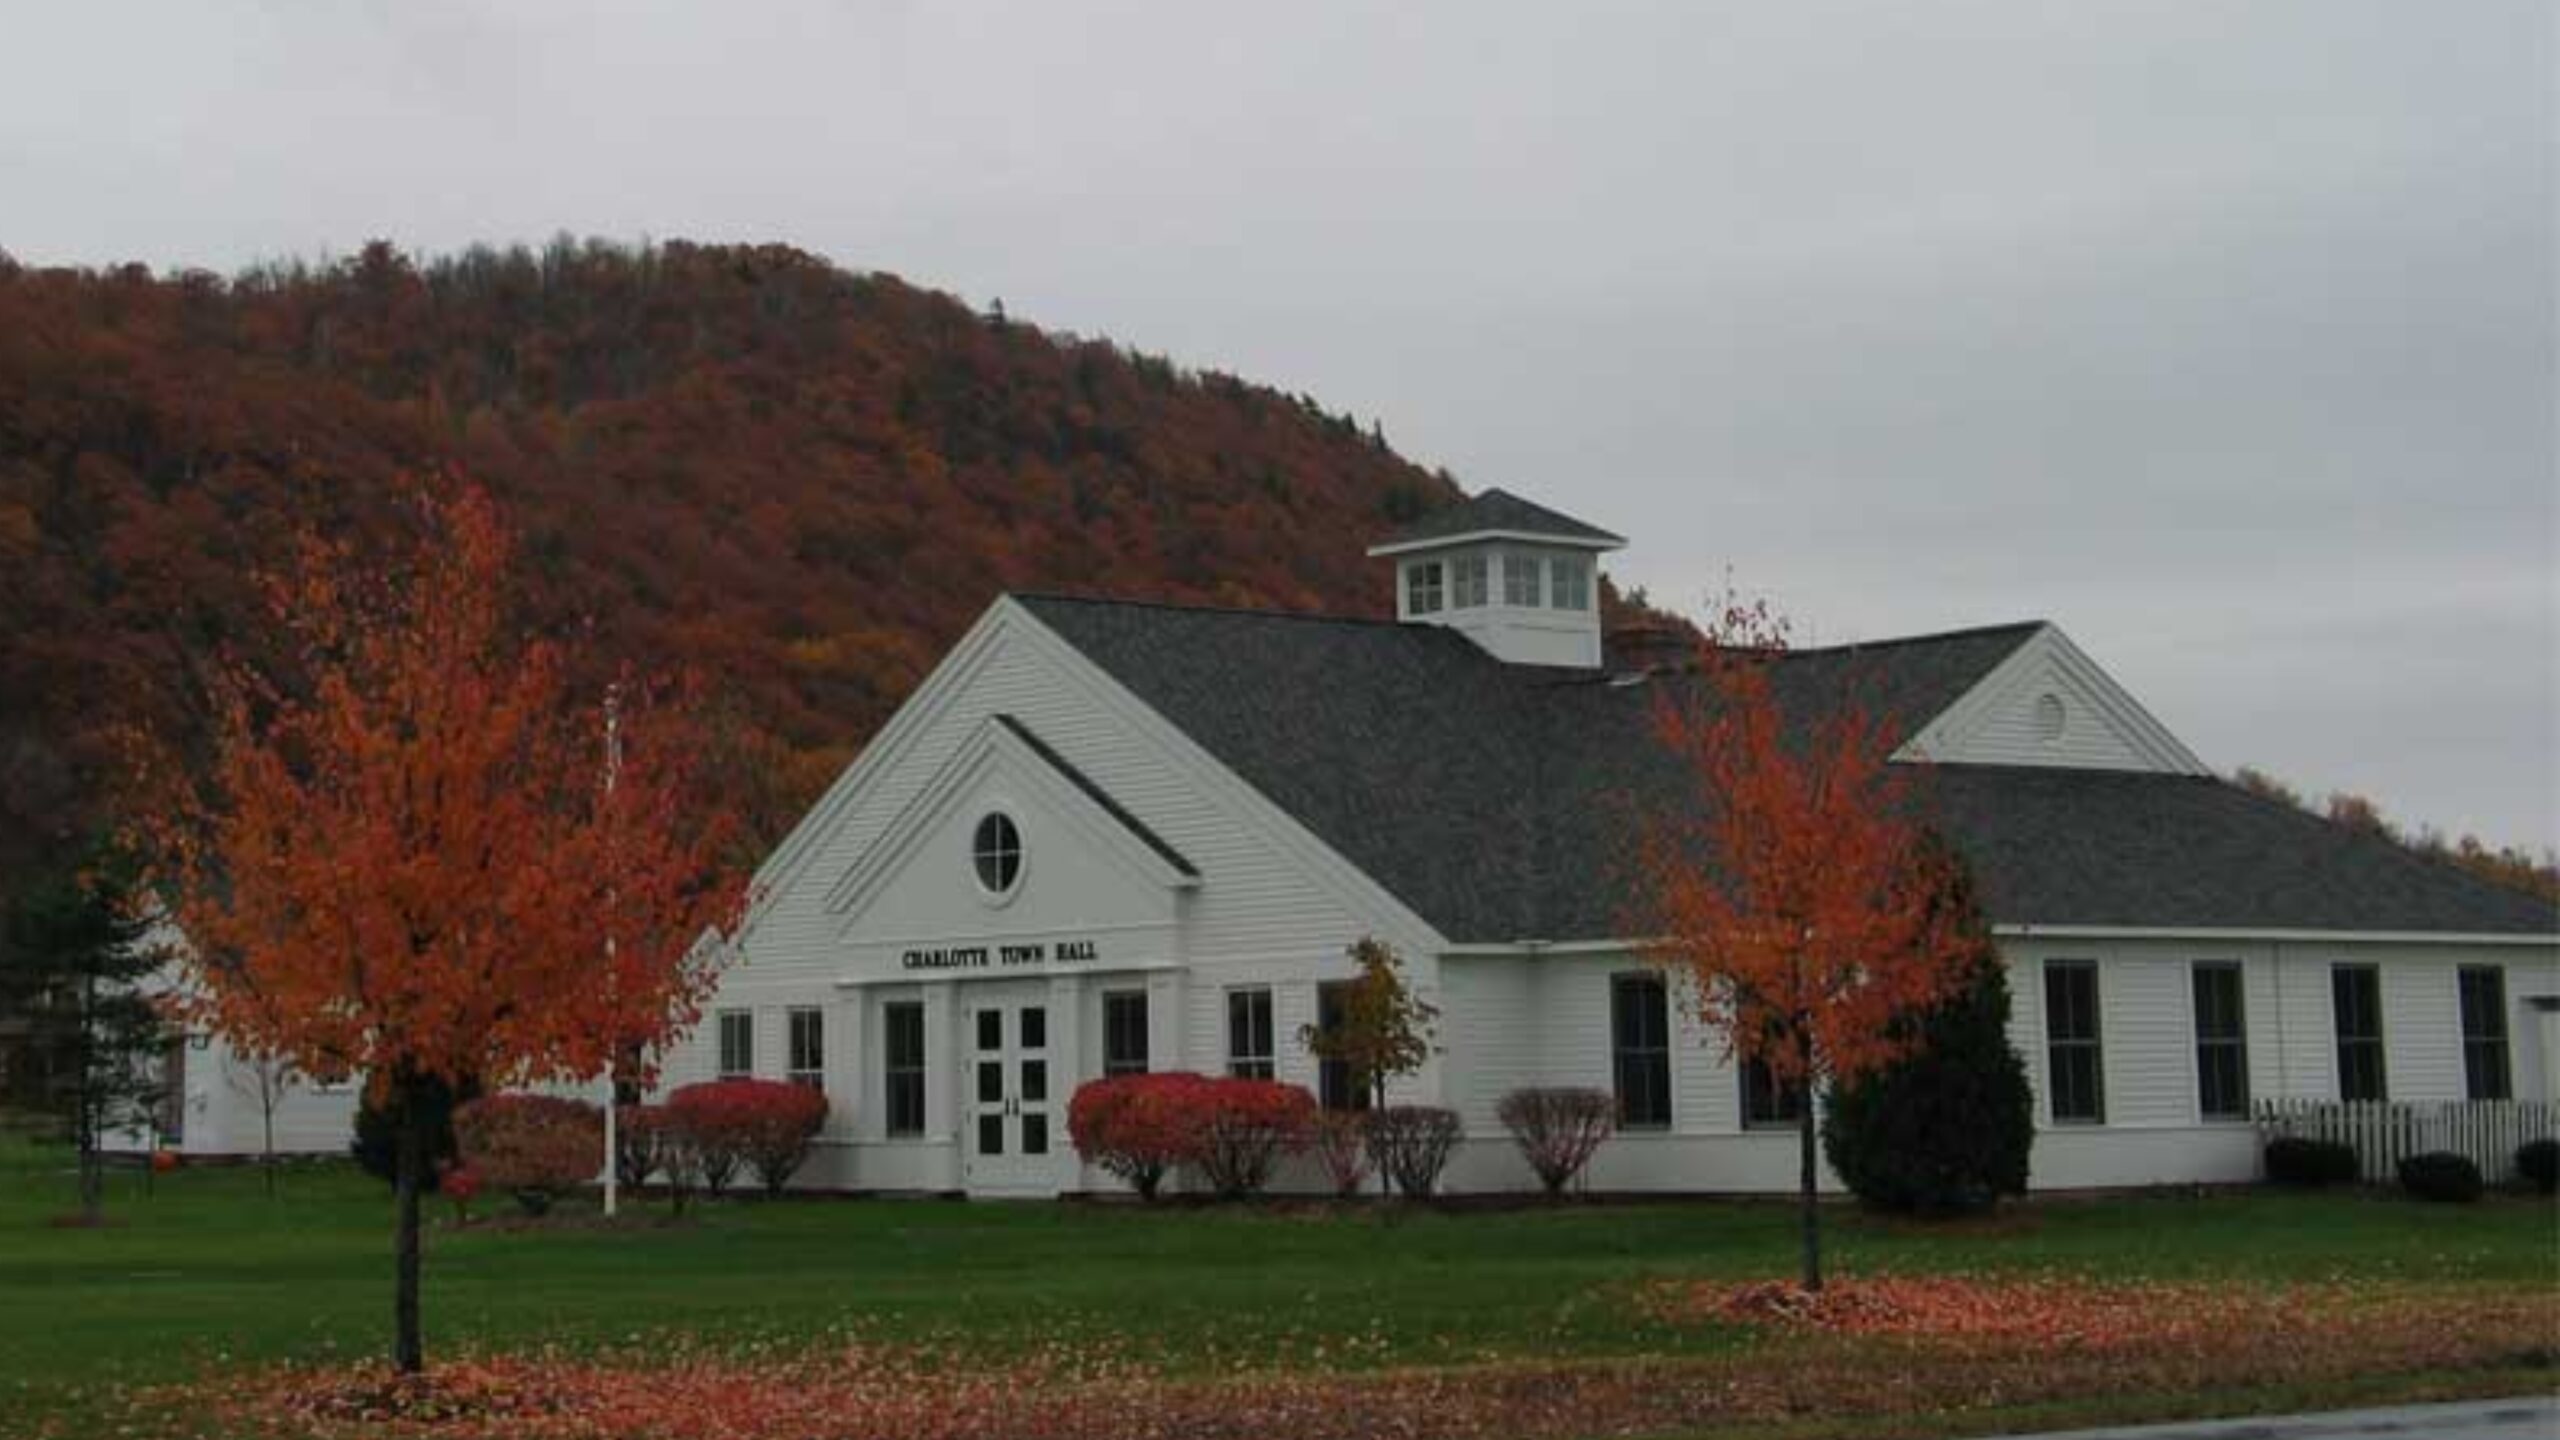
Set along Lake Champlain’s shoreline just south of Shelburne, Charlotte is known for panoramic views, wide open farmland, and some of the most scenic properties in the state. Its rural character, combined with high-end homes and proximity to Burlington, makes it especially attractive to affluent buyers.
The town’s growth reflects its blend of exclusivity and accessibility. It also benefits from high-performing schools, strong land-use planning, and a tight housing market. Charlotte’s home prices show no signs of slowing, even after 15 years of steady appreciation.
1. Stowe – 118% Home Price Increase Since 2010
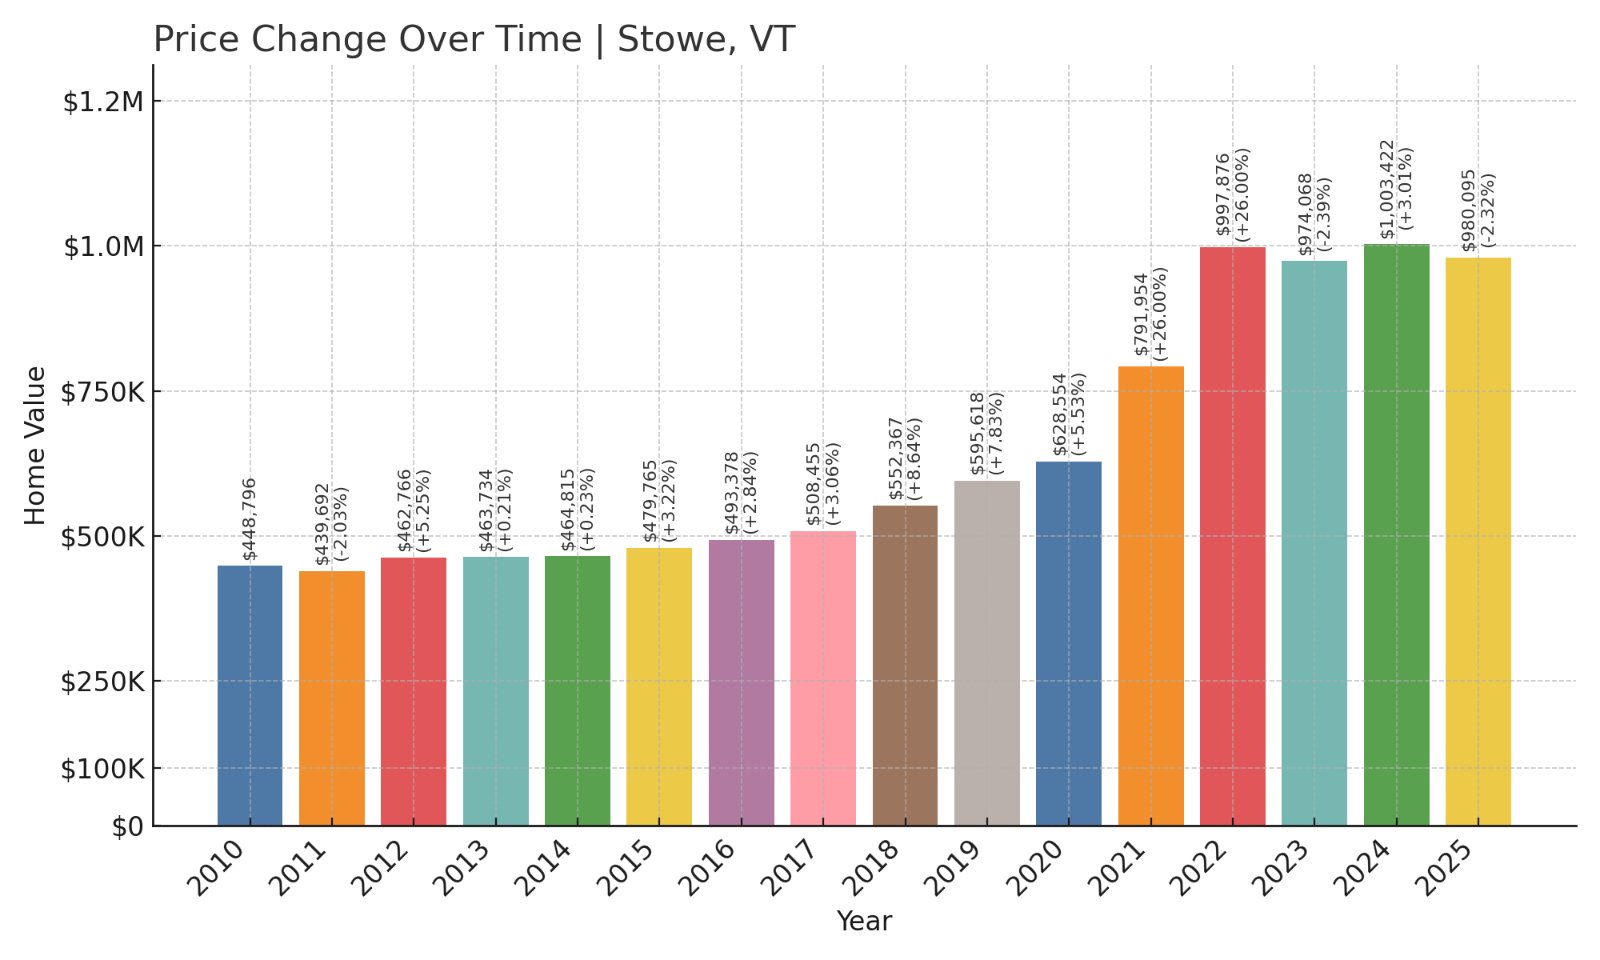
- 2010: $448,796
- 2011: $439,692 (-$9,104, -2.03%)
- 2012: $462,766 (+$23,074, +5.25%)
- 2013: $463,734 (+$967, +0.21%)
- 2014: $464,815 (+$1,081, +0.23%)
- 2015: $479,765 (+$14,950, +3.22%)
- 2016: $493,378 (+$13,613, +2.84%)
- 2017: $508,455 (+$15,077, +3.06%)
- 2018: $552,367 (+$43,912, +8.64%)
- 2019: $595,618 (+$43,251, +7.83%)
- 2020: $628,554 (+$32,936, +5.53%)
- 2021: $791,954 (+$163,400, +26.00%)
- 2022: $997,876 (+$205,921, +26.00%)
- 2023: $974,068 (-$23,808, -2.39%)
- 2024: $1,003,422 (+$29,354, +3.01%)
- 2025: $980,095 (-$23,326, -2.32%)
Stowe tops the list with a staggering 118% increase in home prices since 2010. The largest gains came in 2021 and 2022, when values skyrocketed by 26% each year. Even with small declines since, Stowe remains Vermont’s most expensive town by far.
Stowe – Vermont’s Premier Resort Town
With world-class skiing, mountain views, and luxury amenities, Stowe is Vermont’s crown jewel for high-end real estate. It draws buyers from across the country who are looking for four-season recreation, exceptional dining, and high-end homes nestled in the mountains.
Stowe’s housing market is driven by demand for vacation properties, limited supply, and a reputation for excellence. Even modest homes here command premium prices, and new development is closely managed. Stowe’s 15-year price trend reflects not just rising demand — but enduring prestige.