🔥 Would you like to save this?
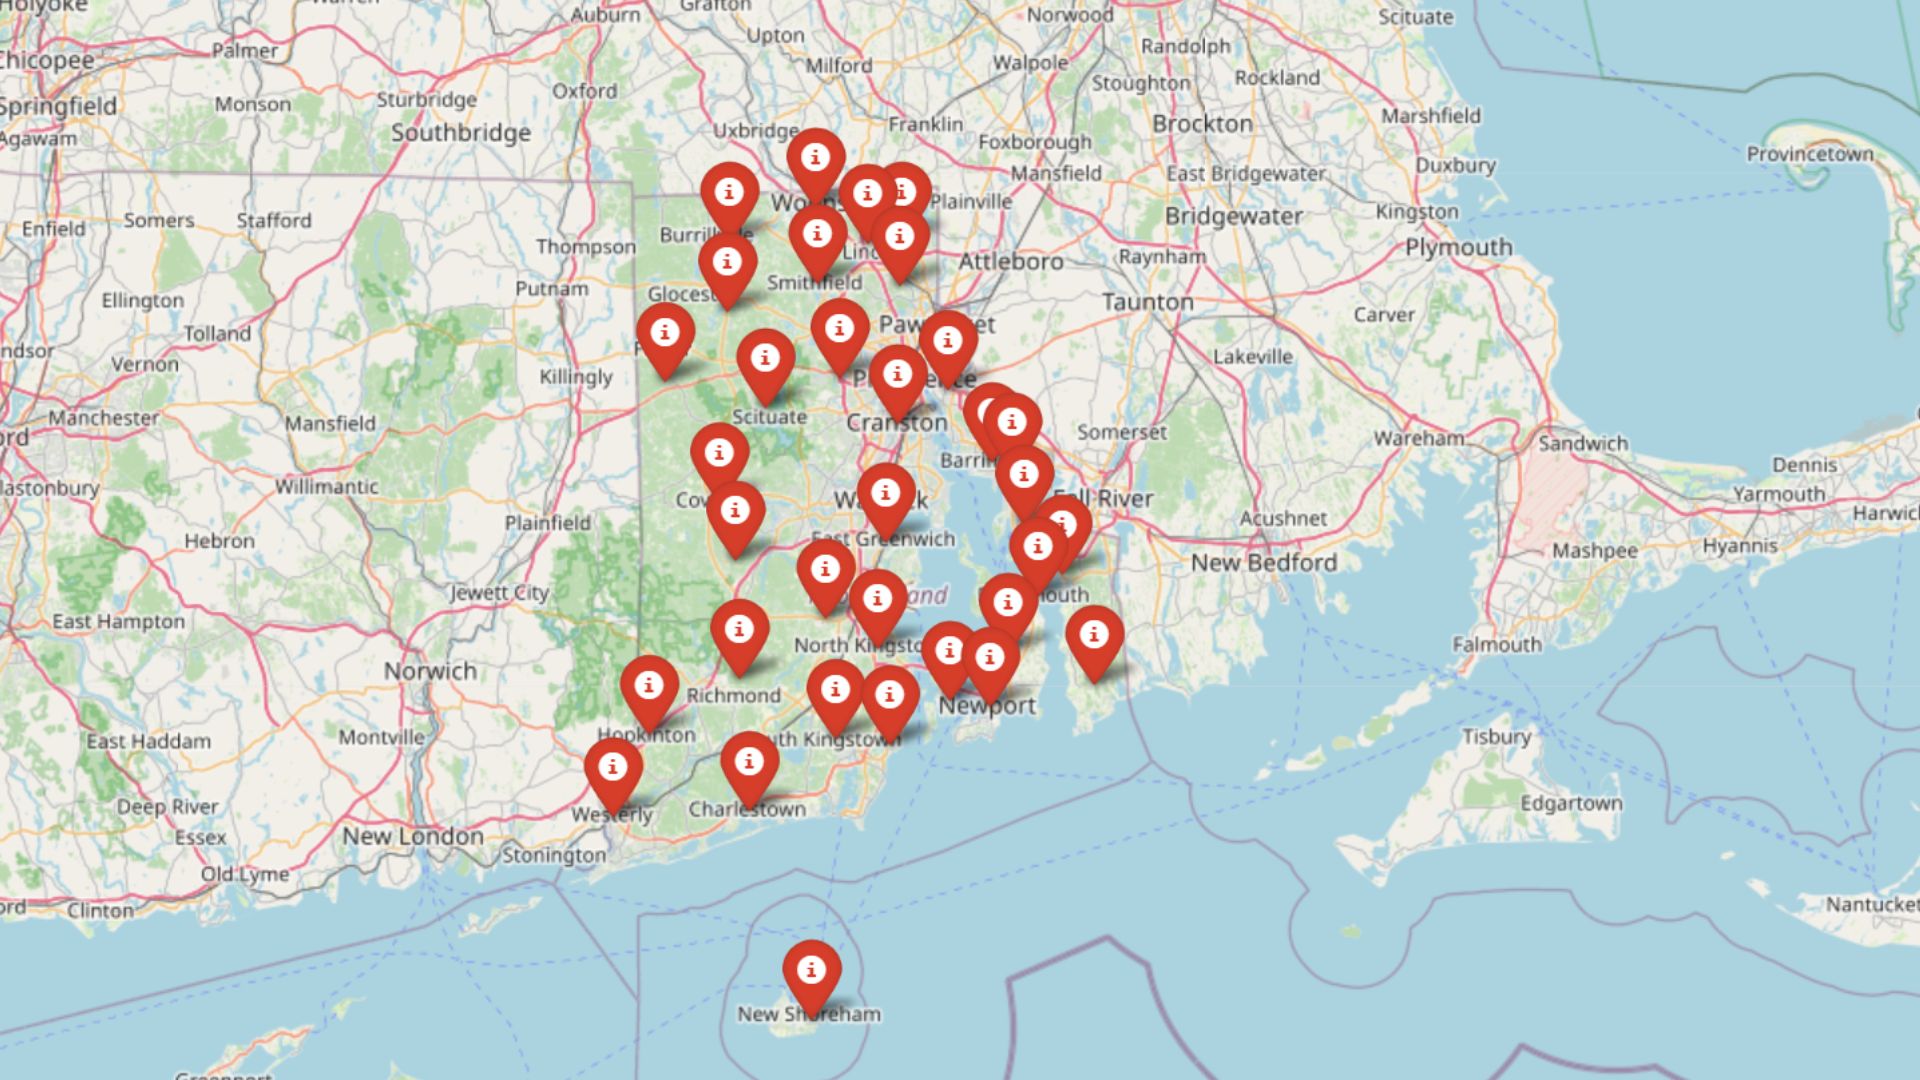
Coastal views and small-town charm aren’t coming cheap in Rhode Island anymore. The Zillow Home Value Index shows property prices across the Ocean State climbing to new highs, especially in the state’s most desirable towns. From waterfront escapes to inland retreats, many communities now carry price tags that’d make even luxury buyers flinch. Whether you’re house hunting or just curious how expensive life by the coast has become, these 33 towns show exactly where budgets get stretched the fastest.
33. Manville – 127.6% Home Price Increase Since 2010
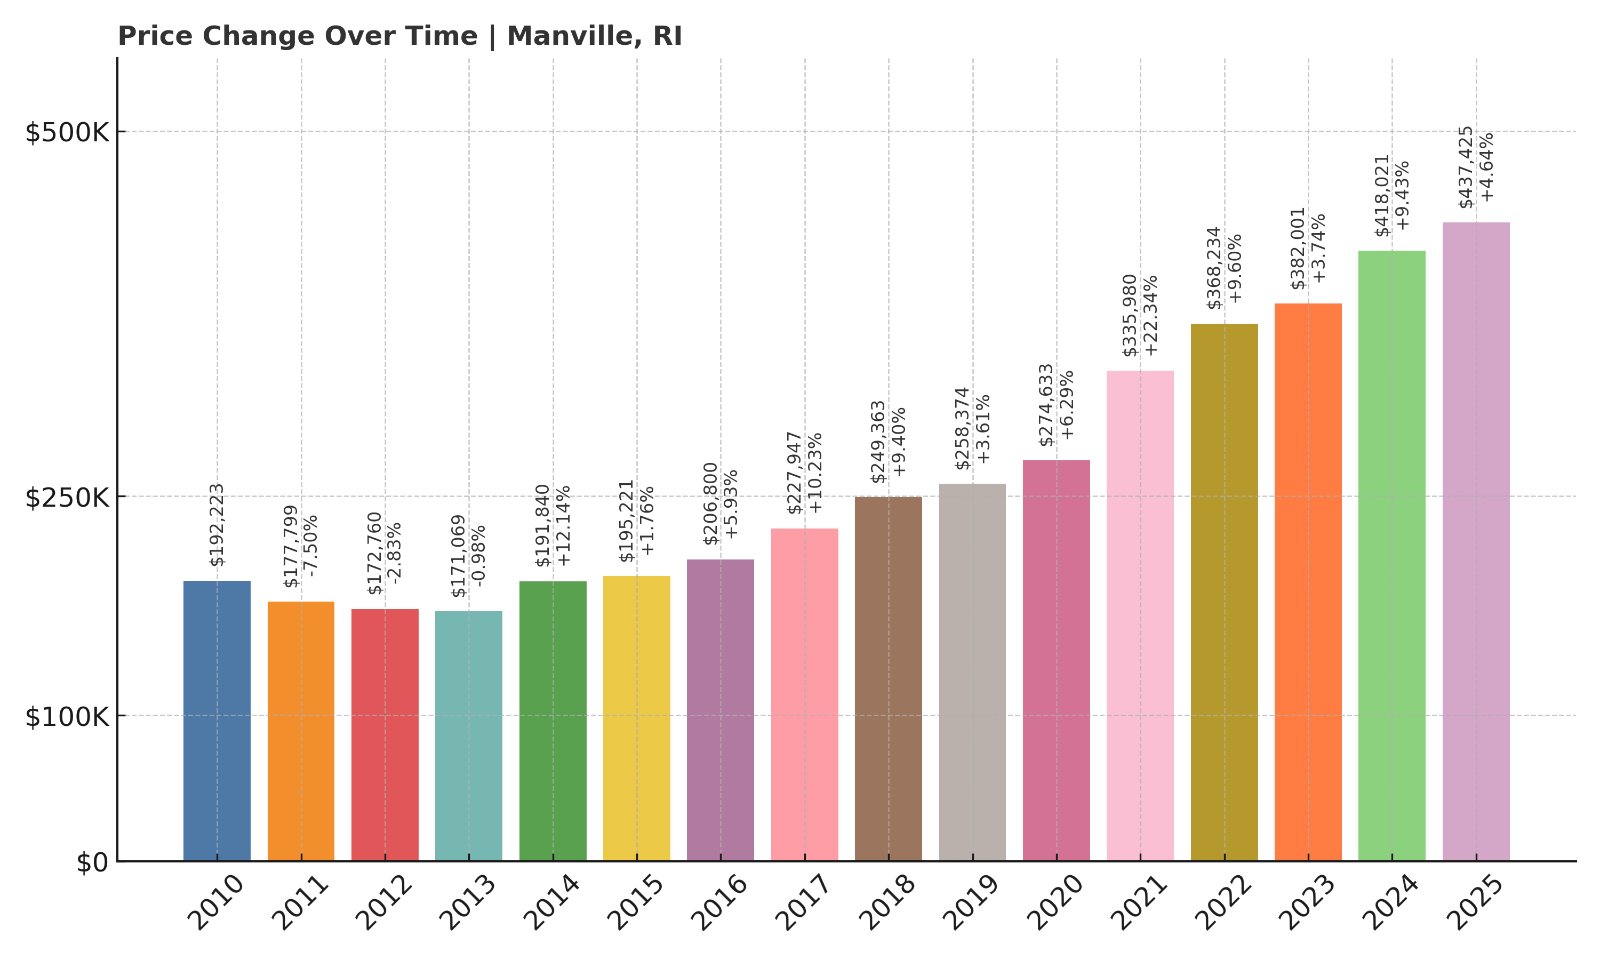
- 2010: $192,223
- 2011: $177,799 (-$14,424, -7.50% from previous year)
- 2012: $172,760 (-$5,039, -2.83% from previous year)
- 2013: $171,069 (-$1,691, -0.98% from previous year)
- 2014: $191,840 (+$20,771, +12.14% from previous year)
- 2015: $195,221 (+$3,381, +1.76% from previous year)
- 2016: $206,800 (+$11,579, +5.93% from previous year)
- 2017: $227,947 (+$21,147, +10.23% from previous year)
- 2018: $249,363 (+$21,416, +9.40% from previous year)
- 2019: $258,374 (+$9,011, +3.61% from previous year)
- 2020: $274,633 (+$16,259, +6.29% from previous year)
- 2021: $335,980 (+$61,347, +22.34% from previous year)
- 2022: $368,234 (+$32,254, +9.60% from previous year)
- 2023: $382,001 (+$13,767, +3.74% from previous year)
- 2024: $418,021 (+$36,020, +9.43% from previous year)
- 2025: $437,425 (+$19,404, +4.64% from previous year)
Home prices in Manville have climbed steadily since 2010, growing from just over $192K to more than $437K in 2025 — a 127.6% increase. The market saw its sharpest jump in 2021, when prices rose over 22% in a single year, reflecting widespread demand across smaller Rhode Island communities. Even in recent years, growth has continued with prices rising by over 9% in 2024 and nearly 5% in 2025.
In order to come up with the very specific design ideas, we create most designs with the assistance of state-of-the-art AI interior design software. Also, assume links that take you off the site are affiliate links such as links to Amazon. this means we may earn a commission if you buy something.
Manville – Strong Price Gains Driven by Location and Access
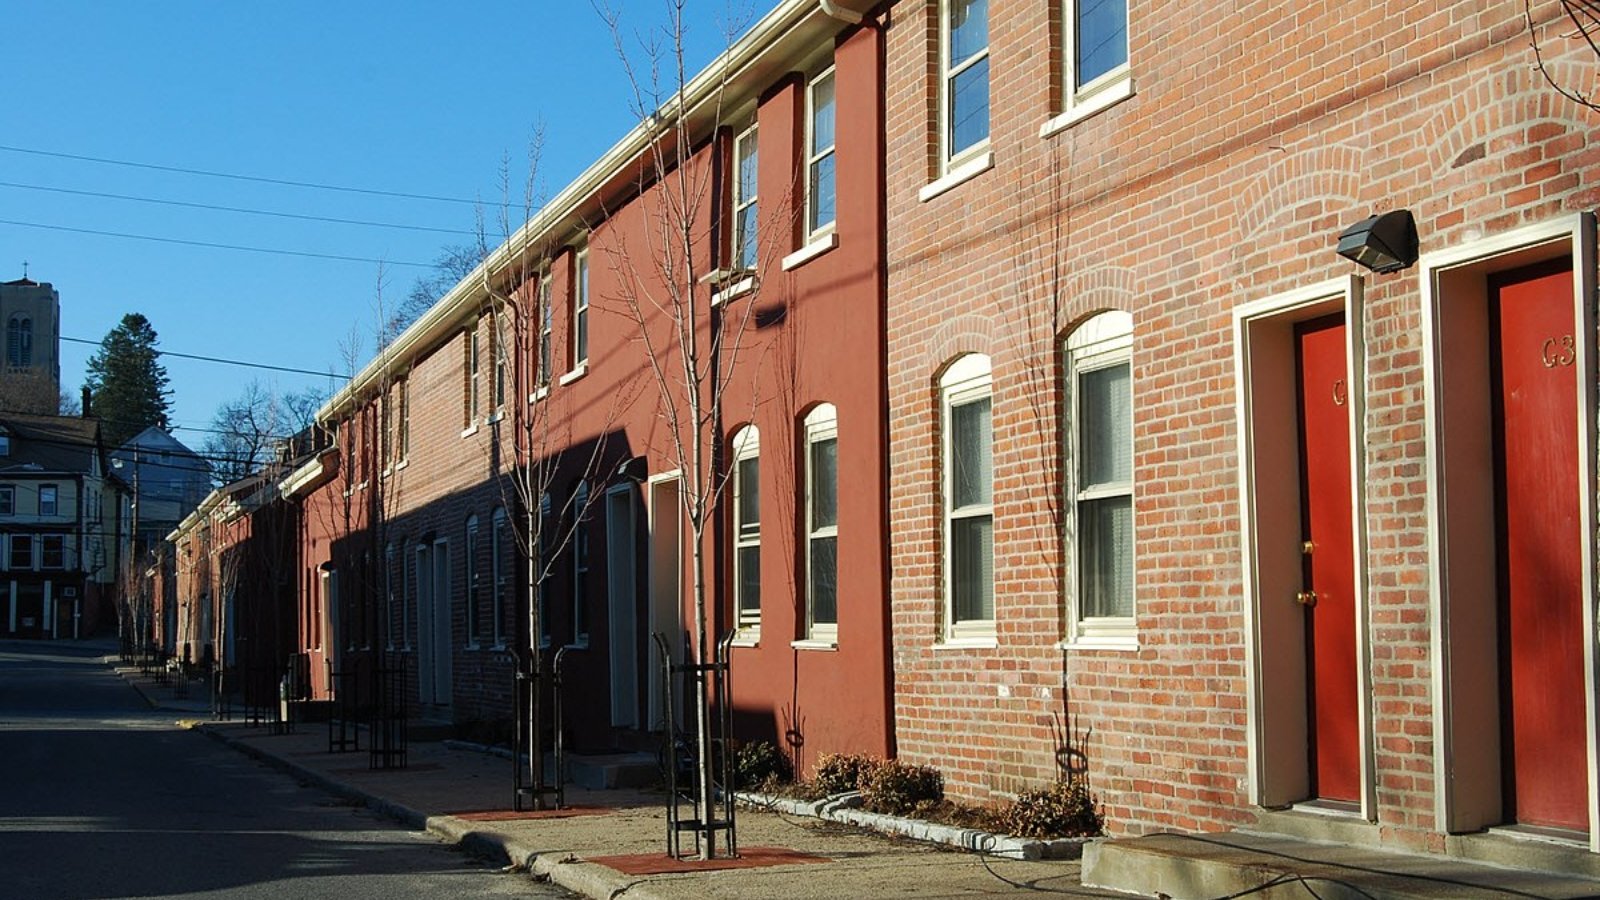
Manville, a village within the town of Lincoln, sits on the northern edge of Rhode Island near the Massachusetts border. Once rooted in mill industry, the area has shifted toward residential development, with buyers drawn by its small-town character and proximity to Providence (just 20 minutes away). The surge in price during 2021 mirrors broader regional patterns as remote work spurred demand for suburban living.
As of 2025, home values in Manville remain among the lowest in this ranking, but its consistent growth and rising buyer interest highlight its growing role as a commuter-friendly alternative to pricier metro areas. With public schools and parks nearby, it’s become increasingly attractive to families priced out of larger cities.
32. East Providence – 103.2% Home Price Increase Since 2010
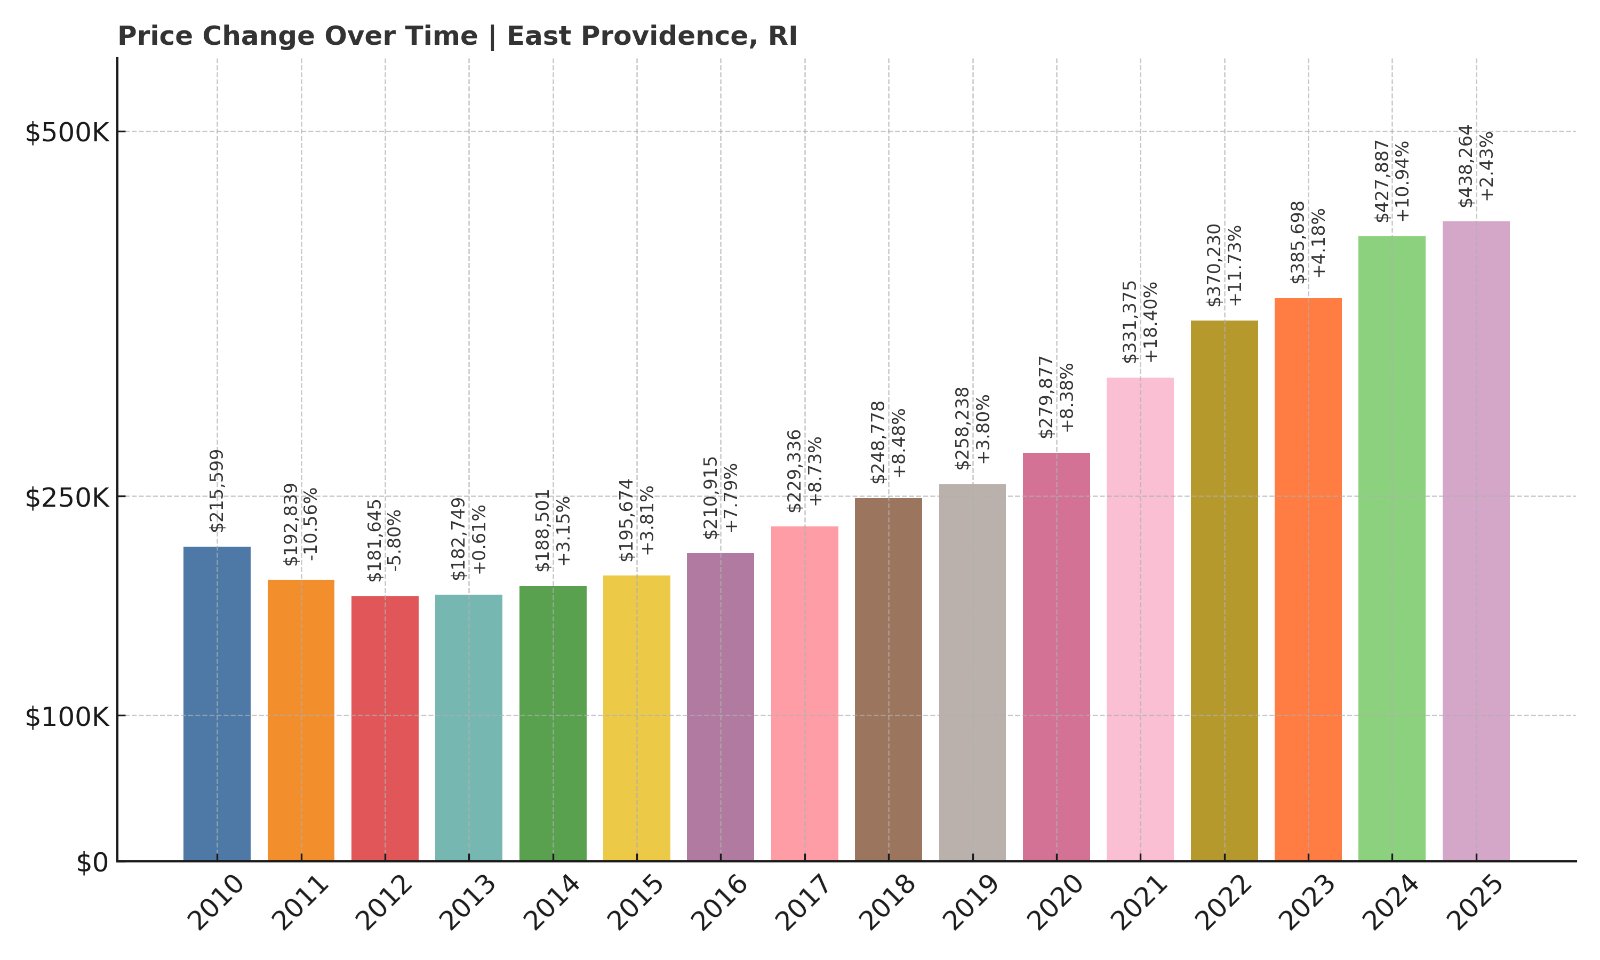
- 2010: $215,599
- 2011: $192,839 (-$22,760, -10.56% from previous year)
- 2012: $181,645 (-$11,194, -5.80% from previous year)
- 2013: $182,749 (+$1,104, +0.61% from previous year)
- 2014: $188,501 (+$5,752, +3.15% from previous year)
- 2015: $195,674 (+$7,173, +3.81% from previous year)
- 2016: $210,915 (+$15,241, +7.79% from previous year)
- 2017: $229,336 (+$18,421, +8.73% from previous year)
- 2018: $248,778 (+$19,442, +8.48% from previous year)
- 2019: $258,238 (+$9,460, +3.80% from previous year)
- 2020: $279,877 (+$21,639, +8.38% from previous year)
- 2021: $331,375 (+$51,498, +18.40% from previous year)
- 2022: $370,230 (+$38,855, +11.73% from previous year)
- 2023: $385,698 (+$15,468, +4.18% from previous year)
- 2024: $427,887 (+$42,189, +10.94% from previous year)
- 2025: $438,264 (+$10,377, +2.43% from previous year)
East Providence has seen home prices more than double since 2010. While early years were marked by declines, steady appreciation since 2015 has pushed prices from $215K to over $438K. The 18% spike in 2021 reflects pandemic-era buying patterns, but even into 2024 and 2025, values have continued their upward climb.
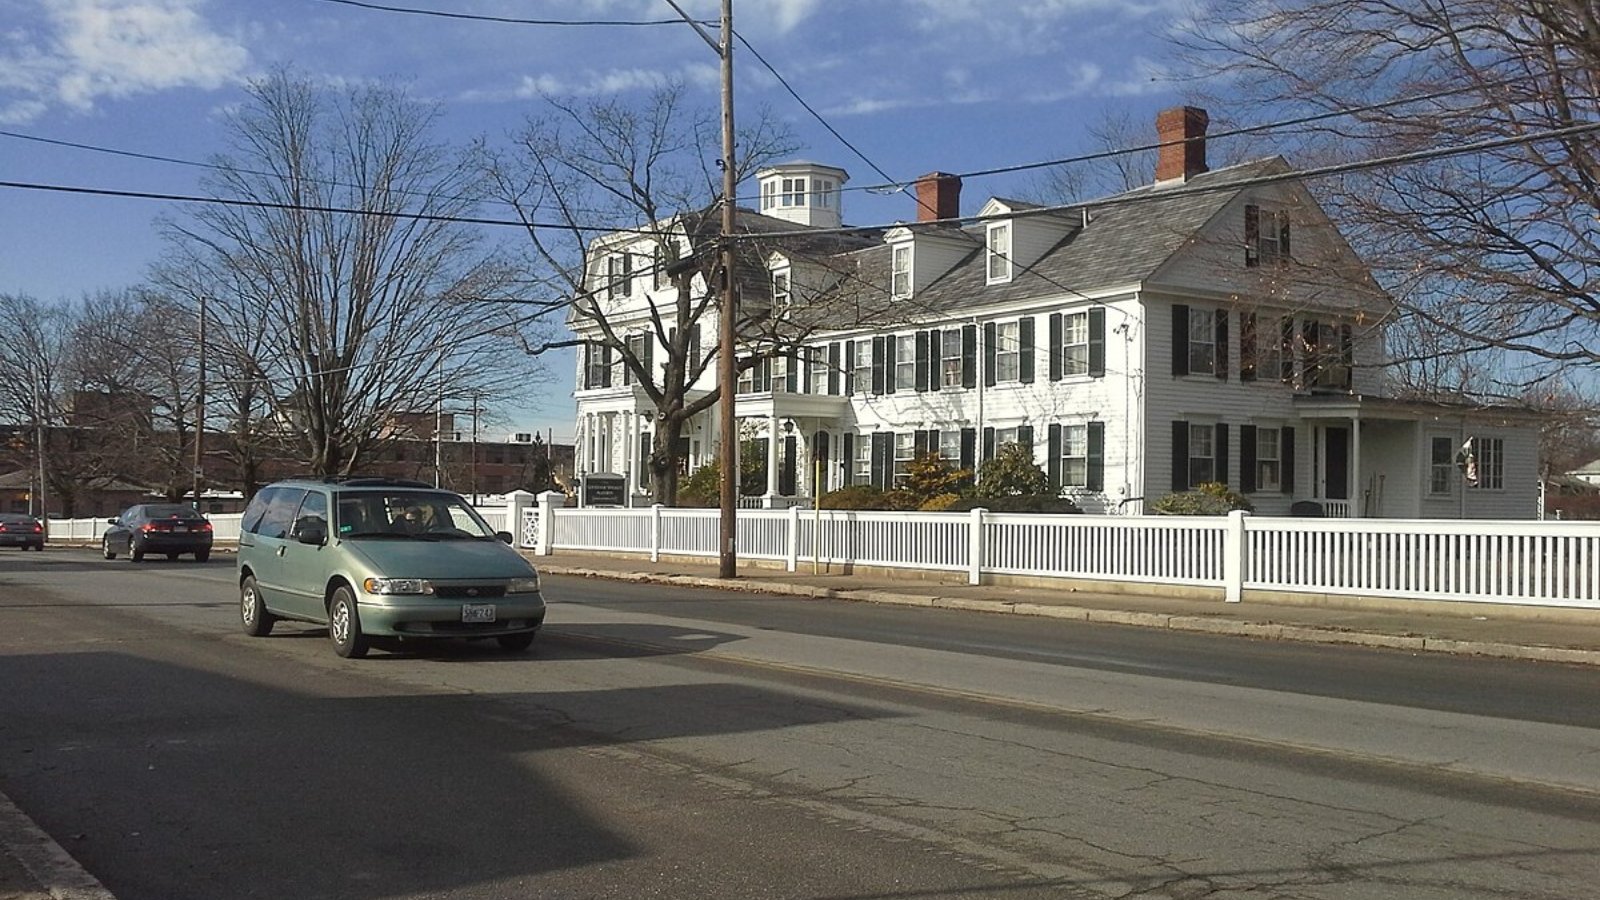
East Providence – Urban Convenience Meets Affordability
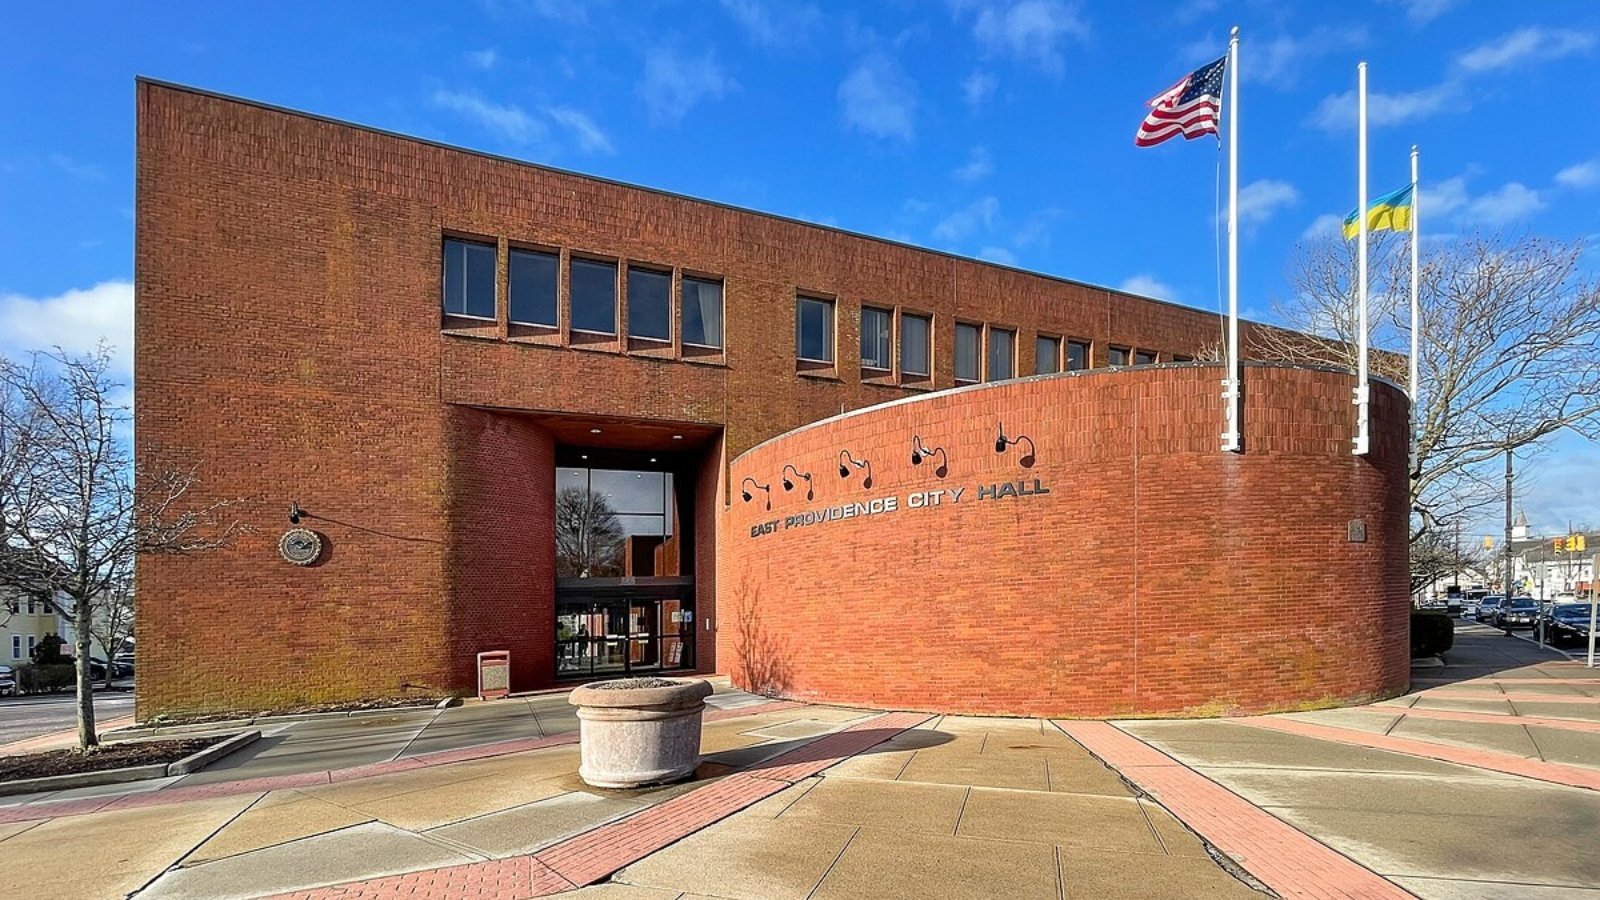
Situated directly across the Seekonk River from Providence, East Providence offers city access without city prices. Once overlooked, the town has grown in appeal thanks to improved transit routes, waterfront revitalization, and more diverse housing stock. Many homes offer walkable neighborhoods and short commutes into downtown Providence or over the border into Massachusetts.
The relatively moderate price point compared to neighboring communities, combined with urban amenities and development interest along the riverfront, has kept East Providence on buyers’ radar. Despite slower growth in 2025, long-term prospects remain solid due to its strategic location and livability.
31. Cranston – 111.9% Home Price Increase Since 2010

- 2010: $206,969
- 2011: $195,893 (-$11,076, -5.35% from previous year)
- 2012: $181,290 (-$14,603, -7.45% from previous year)
- 2013: $184,454 (+$3,164, +1.75% from previous year)
- 2014: $194,140 (+$9,686, +5.25% from previous year)
- 2015: $200,992 (+$6,852, +3.53% from previous year)
- 2016: $217,642 (+$16,650, +8.28% from previous year)
- 2017: $234,076 (+$16,434, +7.55% from previous year)
- 2018: $255,899 (+$21,823, +9.32% from previous year)
- 2019: $268,640 (+$12,741, +4.98% from previous year)
- 2020: $279,913 (+$11,273, +4.20% from previous year)
- 2021: $334,014 (+$54,101, +19.33% from previous year)
- 2022: $376,663 (+$42,649, +12.77% from previous year)
- 2023: $388,604 (+$11,941, +3.17% from previous year)
- 2024: $418,222 (+$29,618, +7.62% from previous year)
- 2025: $438,593 (+$20,371, +4.87% from previous year)
Home values in Cranston have more than doubled over the past 15 years. The 2021 spike was followed by consistent, moderate gains. In 2025, homes average nearly $439K — up 111.9% from 2010. The city’s diversified neighborhoods and ongoing suburban demand have helped it maintain steady growth even during national market slowdowns.
Cranston – One of Rhode Island’s Most Consistent Markets
Cranston, Rhode Island’s second-largest city, blends suburban living with city access. It boasts diverse neighborhoods ranging from historic Pawtuxet Village to newer developments in Western Cranston. Excellent highway access, shopping centers like Garden City, and strong school systems have all helped draw steady demand.
The city’s stability and broad housing options have made it a safe bet for buyers looking for space, convenience, and value — all while staying within reach of Providence. The city’s well-rounded appeal explains its consistent position in the middle tier of Rhode Island’s most expensive markets.
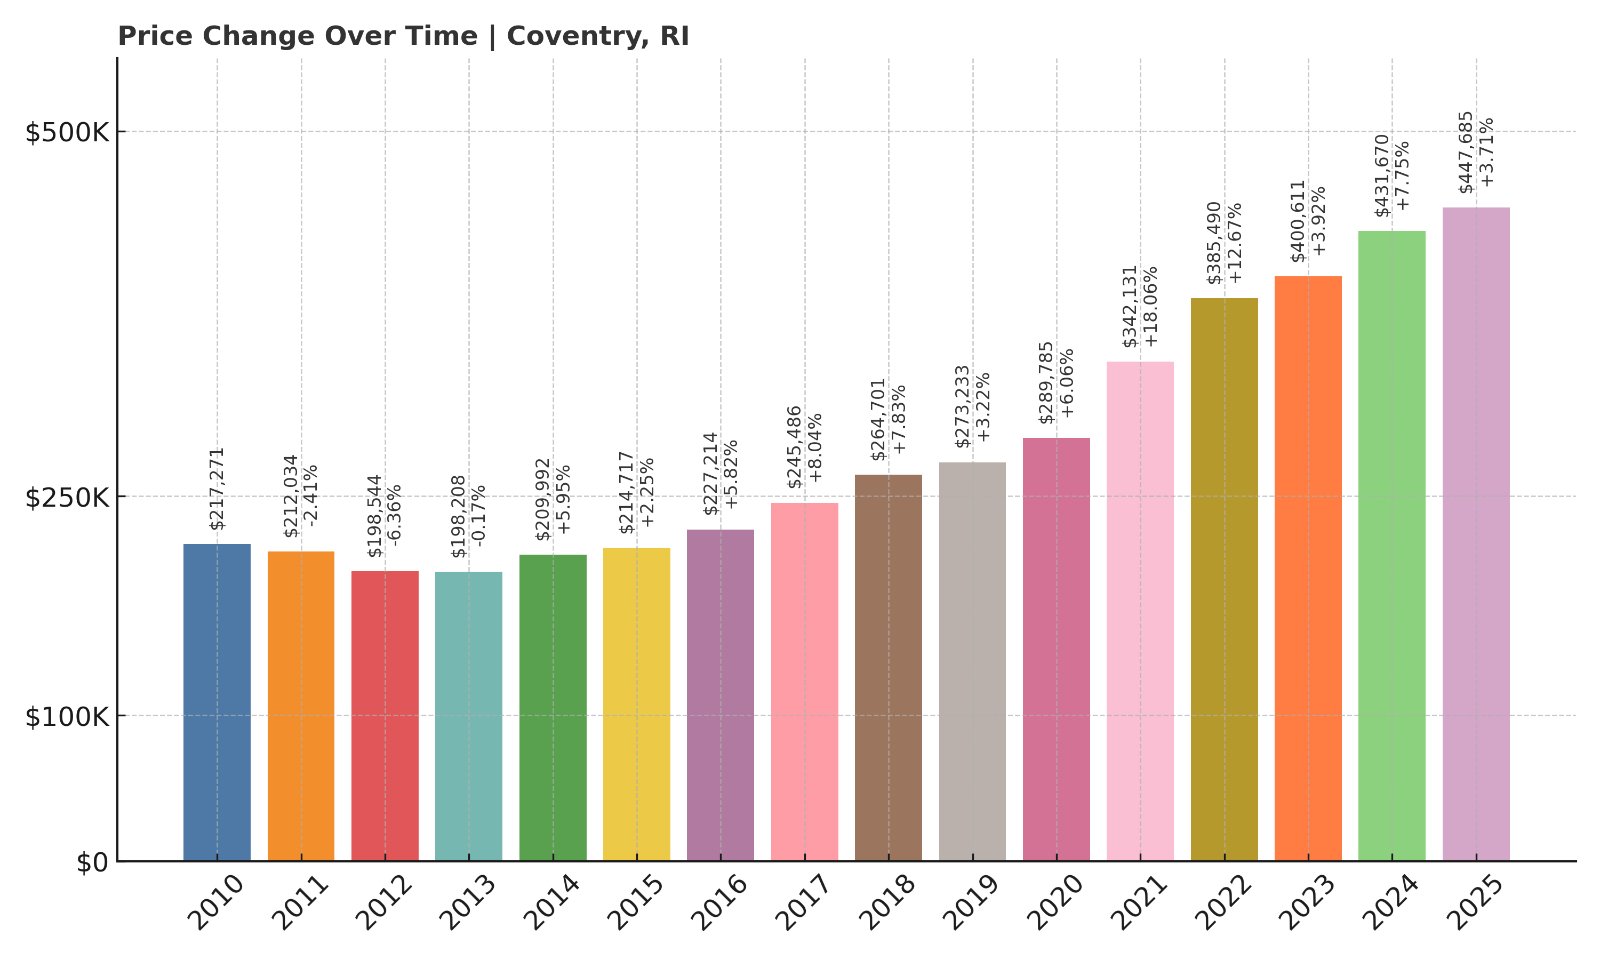
30. Coventry – 106.1% Home Price Increase Since 2010
- 2010: $217,271
- 2011: $212,034 (-$5,237, -2.41% from previous year)
- 2012: $198,544 (-$13,490, -6.36% from previous year)
- 2013: $198,208 (-$336, -0.17% from previous year)
- 2014: $209,992 (+$11,784, +5.95% from previous year)
- 2015: $214,717 (+$4,725, +2.25% from previous year)
- 2016: $227,214 (+$12,497, +5.82% from previous year)
- 2017: $245,486 (+$18,272, +8.04% from previous year)
- 2018: $264,701 (+$19,215, +7.83% from previous year)
- 2019: $273,233 (+$8,532, +3.22% from previous year)
- 2020: $289,785 (+$16,552, +6.06% from previous year)
- 2021: $342,131 (+$52,346, +18.06% from previous year)
- 2022: $385,490 (+$43,359, +12.67% from previous year)
- 2023: $400,611 (+$15,121, +3.92% from previous year)
- 2024: $431,670 (+$31,059, +7.75% from previous year)
- 2025: $447,685 (+$16,015, +3.71% from previous year)
Coventry home prices have grown steadily since 2010, with a total increase of 106.1%. After a few flat years early in the decade, price growth accelerated sharply in 2021 and hasn’t let up. Homes now average nearly $448K — a striking shift for this once budget-friendly town.
Coventry – From Rural Roots to Rising Demand
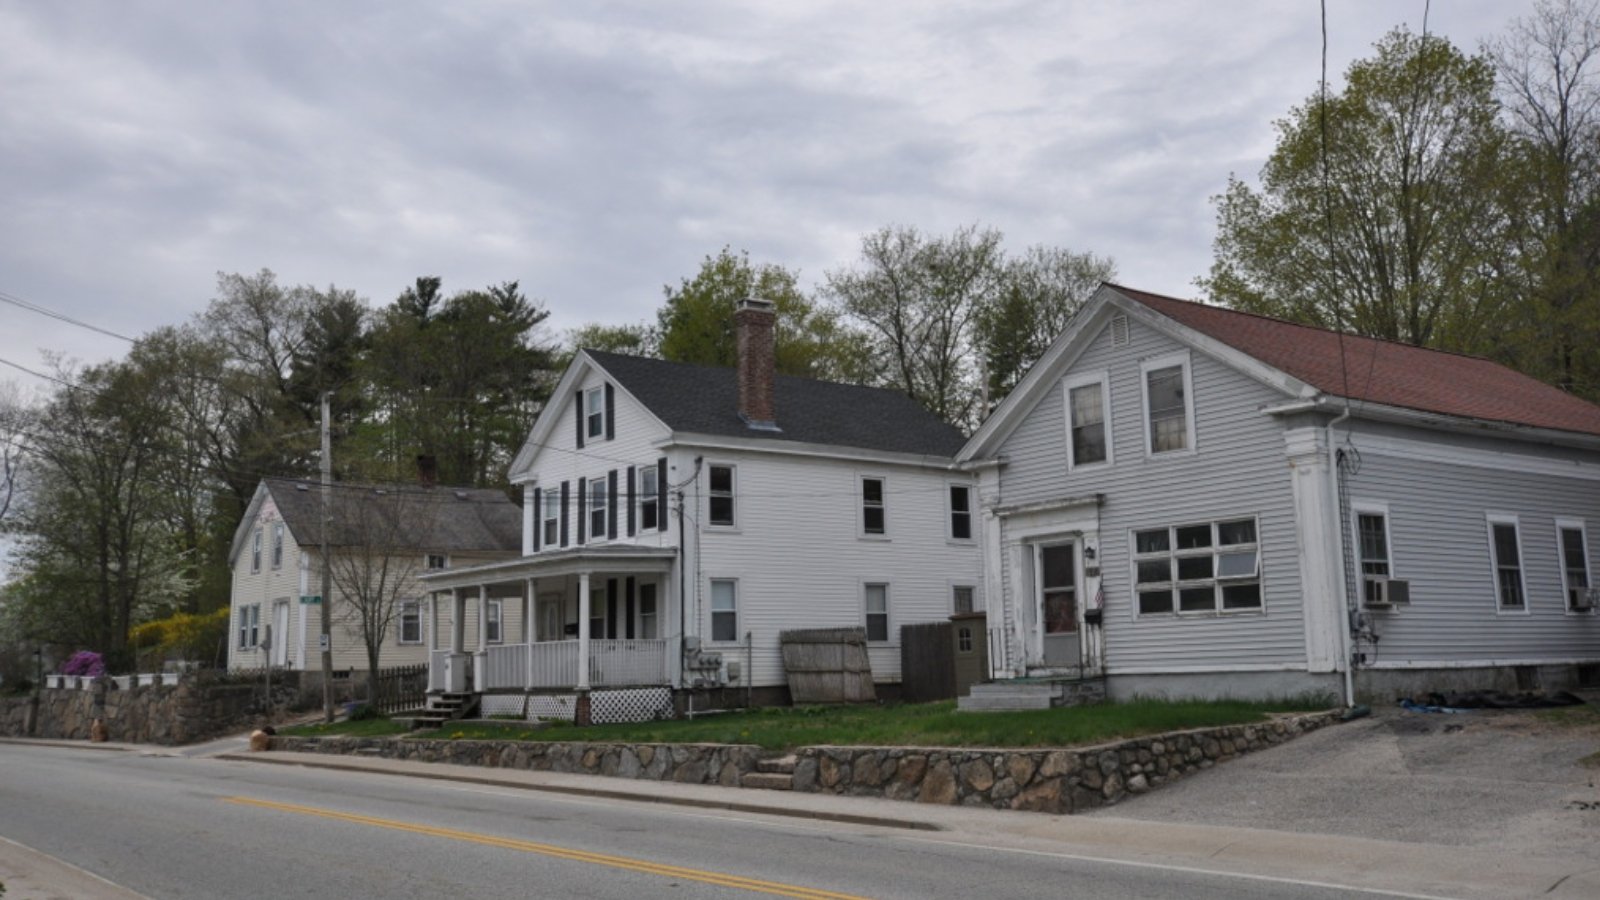
Located in central-western Rhode Island, Coventry is the state’s largest town by area. Its rural character, access to nature, and relative affordability have historically made it a quieter corner of the state — but recent demand has changed that. Buyers looking for space and lower prices compared to the coast have pushed Coventry’s market upward.
The surge in prices during 2021 and beyond reflects a growing trend toward suburban and exurban living, with Coventry benefiting from its mix of single-family homes, open space, and accessibility to Providence and I-95. Its transformation from rural to desirable suburban hub is still underway.
29. Johnston – 110.0% Home Price Increase Since 2010
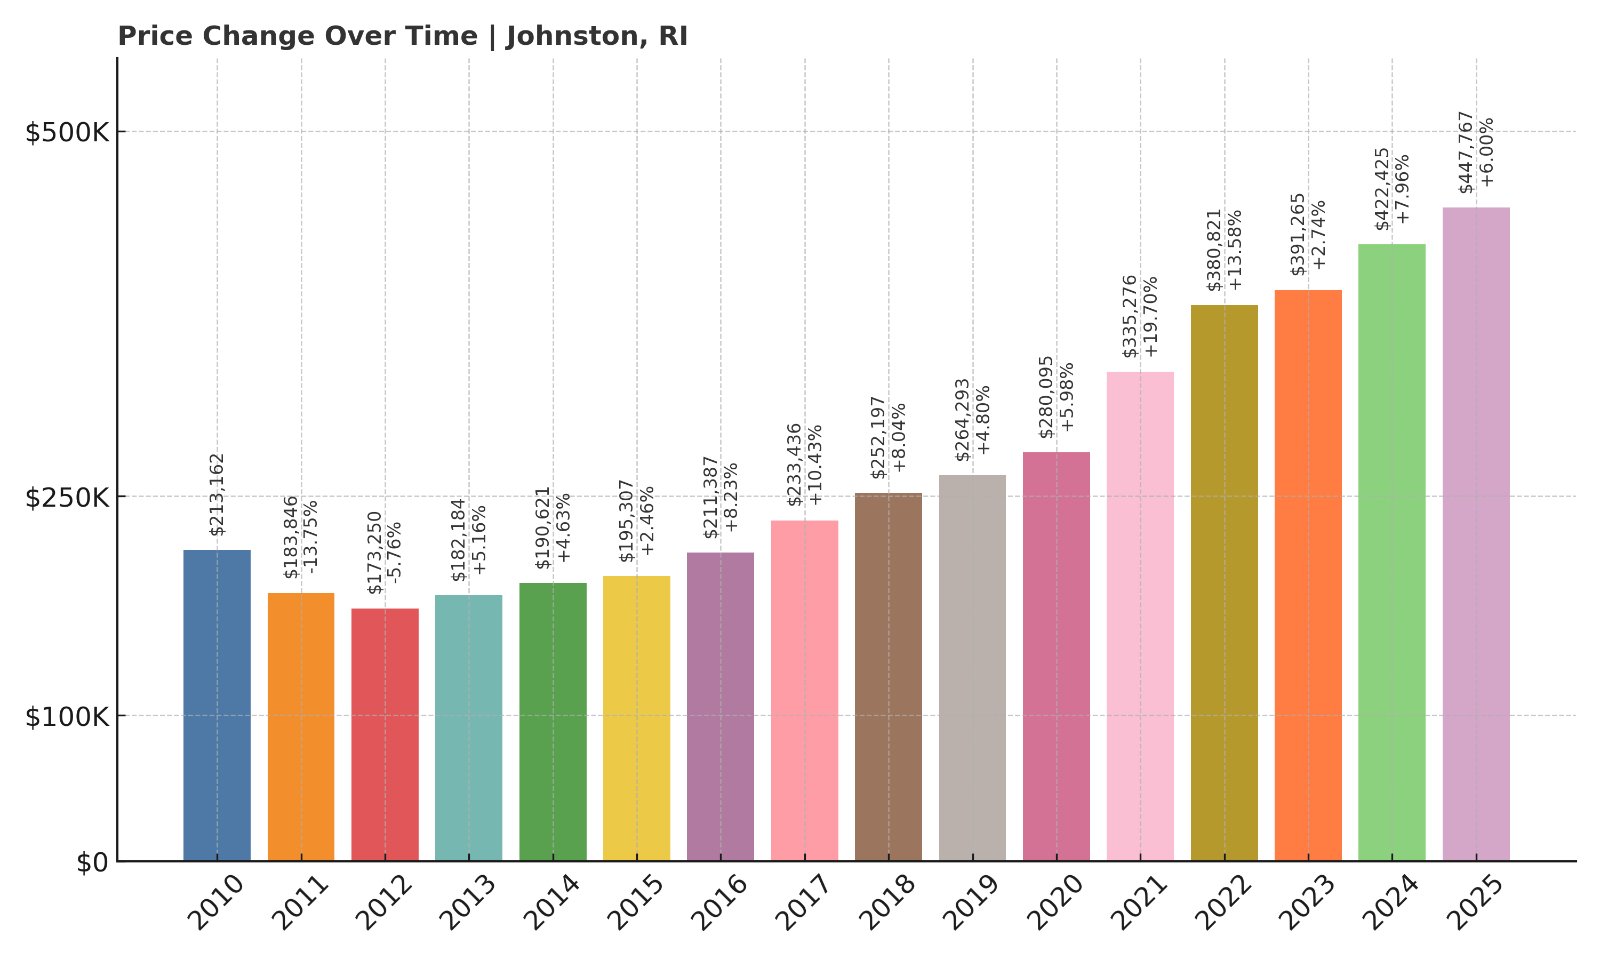
- 2010: $213,162
- 2011: $183,846 (-$29,316, -13.75% from previous year)
- 2012: $173,250 (-$10,596, -5.76% from previous year)
- 2013: $182,184 (+$8,934, +5.16% from previous year)
- 2014: $190,621 (+$8,437, +4.63% from previous year)
- 2015: $195,307 (+$4,686, +2.46% from previous year)
- 2016: $211,387 (+$16,080, +8.23% from previous year)
- 2017: $233,436 (+$22,049, +10.43% from previous year)
- 2018: $252,197 (+$18,761, +8.04% from previous year)
- 2019: $264,293 (+$12,096, +4.80% from previous year)
- 2020: $280,095 (+$15,802, +5.98% from previous year)
- 2021: $335,276 (+$55,181, +19.70% from previous year)
- 2022: $380,821 (+$45,545, +13.58% from previous year)
- 2023: $391,265 (+$10,444, +2.74% from previous year)
- 2024: $422,425 (+$31,160, +7.96% from previous year)
- 2025: $447,767 (+$25,342, +6.00% from previous year)
After a steep drop in the early 2010s, Johnston’s housing market rebounded impressively. Home values more than doubled between 2010 and 2025, increasing by 110%. Like many towns, the largest spike came in 2021, and steady gains have followed every year since.
Johnston – Suburban Growth with City Access
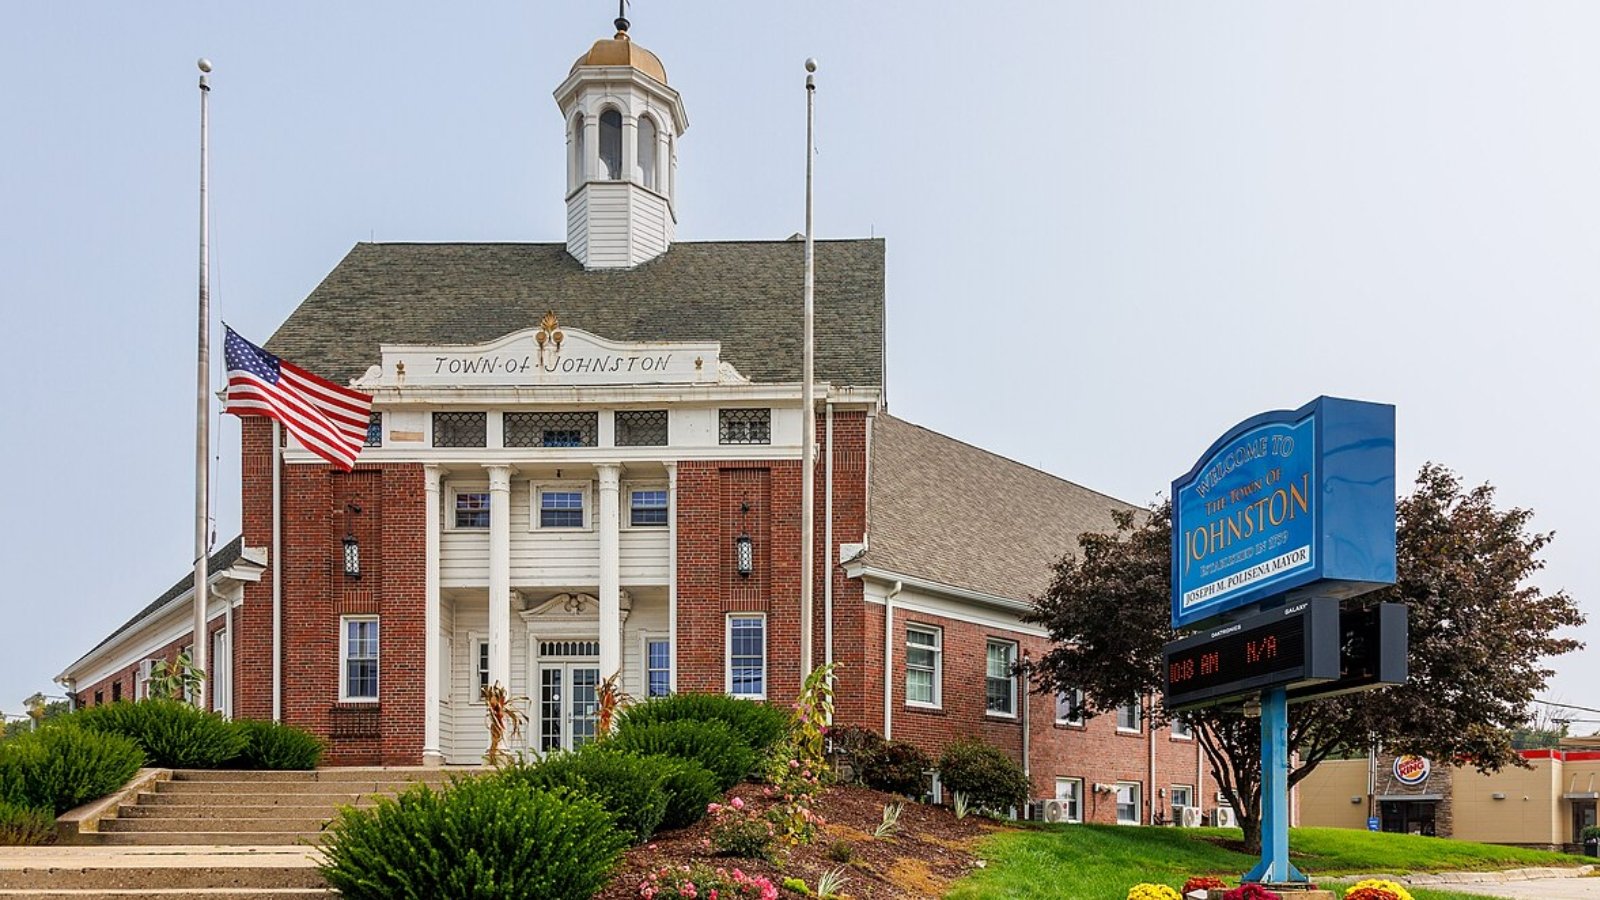
Johnston, located just west of Providence, offers the convenience of city proximity while maintaining a quieter, suburban feel. Its appeal lies in affordability relative to neighboring areas, solid infrastructure, and improved retail and commercial offerings. The new Citizens Bank corporate campus also brought economic attention to the area in recent years.
The continued climb in home prices is a testament to Johnston’s growing relevance among commuters and young families. The town’s upward trajectory reflects regional demand for properties that balance space and value, with good access to I-295 and nearby urban centers.
28. Burrillville – 93.3% Home Price Increase Since 2010
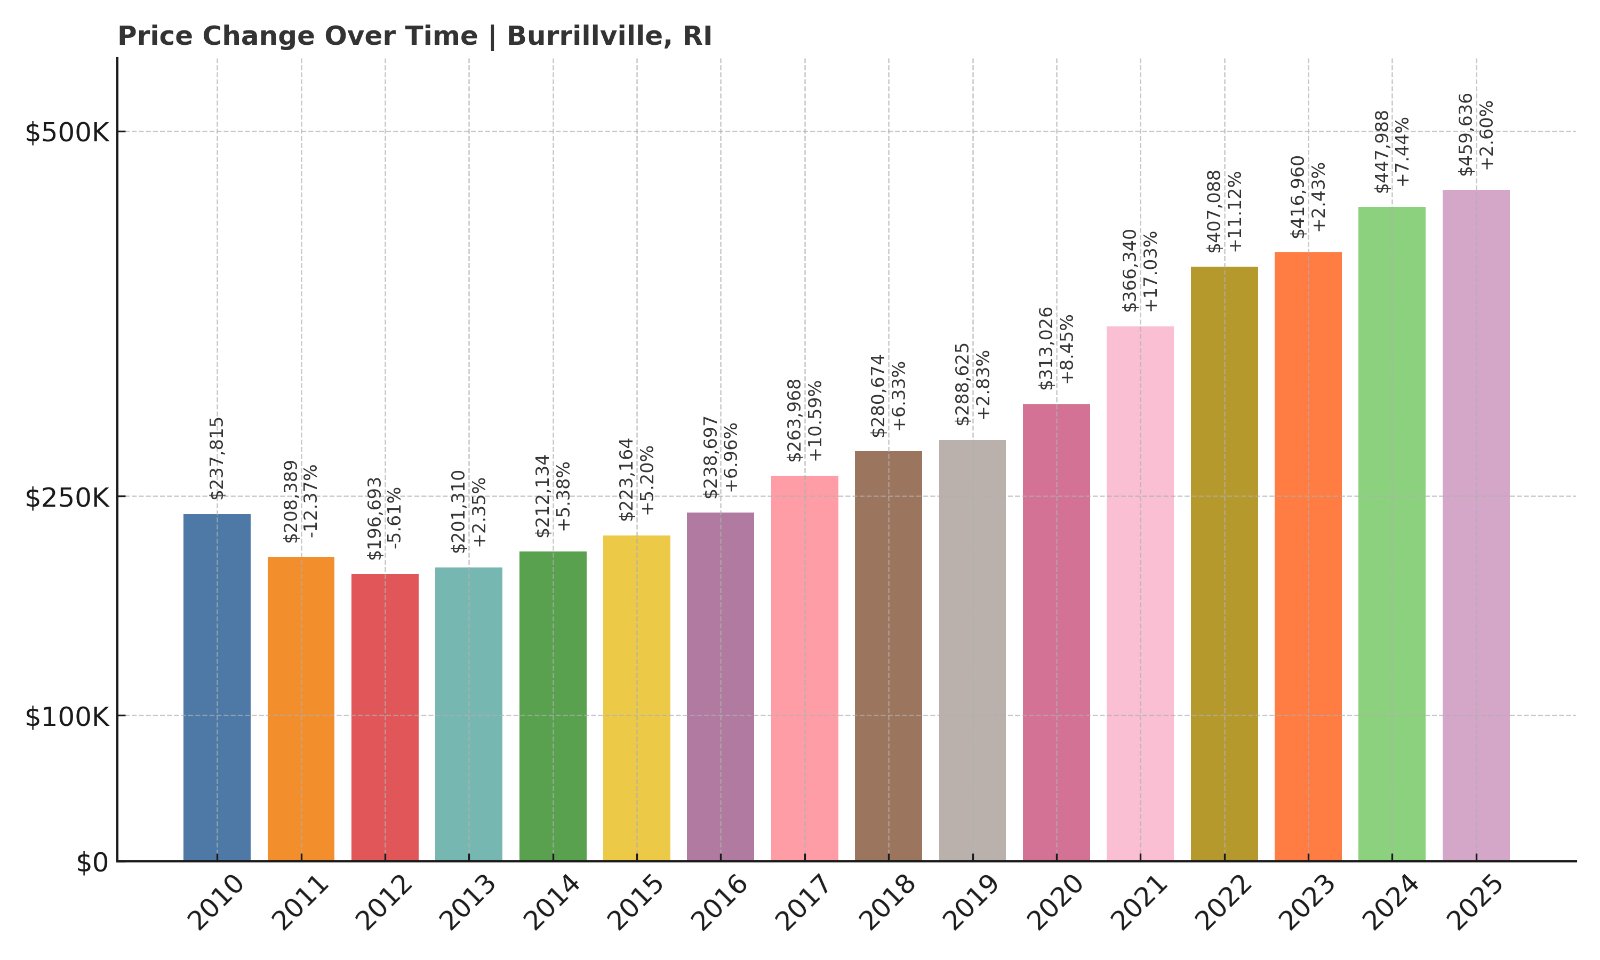
- 2010: $237,815
- 2011: $208,389 (-$29,426, -12.37% from previous year)
- 2012: $196,693 (-$11,696, -5.61% from previous year)
- 2013: $201,310 (+$4,617, +2.35% from previous year)
- 2014: $212,134 (+$10,824, +5.38% from previous year)
- 2015: $223,164 (+$11,030, +5.20% from previous year)
- 2016: $238,697 (+$15,533, +6.96% from previous year)
- 2017: $263,968 (+$25,271, +10.59% from previous year)
- 2018: $280,674 (+$16,706, +6.33% from previous year)
- 2019: $288,625 (+$7,951, +2.83% from previous year)
- 2020: $313,026 (+$24,401, +8.45% from previous year)
- 2021: $366,340 (+$53,314, +17.03% from previous year)
- 2022: $407,088 (+$40,748, +11.12% from previous year)
- 2023: $416,960 (+$9,872, +2.43% from previous year)
- 2024: $447,988 (+$31,028, +7.44% from previous year)
- 2025: $459,636 (+$11,648, +2.60% from previous year)
After a difficult start in the early 2010s, Burrillville’s housing market bounced back, rising from under $200K in 2012 to nearly $460K by 2025. That’s a 93.3% increase since 2010, fueled largely by double-digit growth between 2016 and 2022. More modest gains in recent years indicate a stabilizing market, though values remain high for the region.
Burrillville – Rural Charm Fuels Steady Appreciation
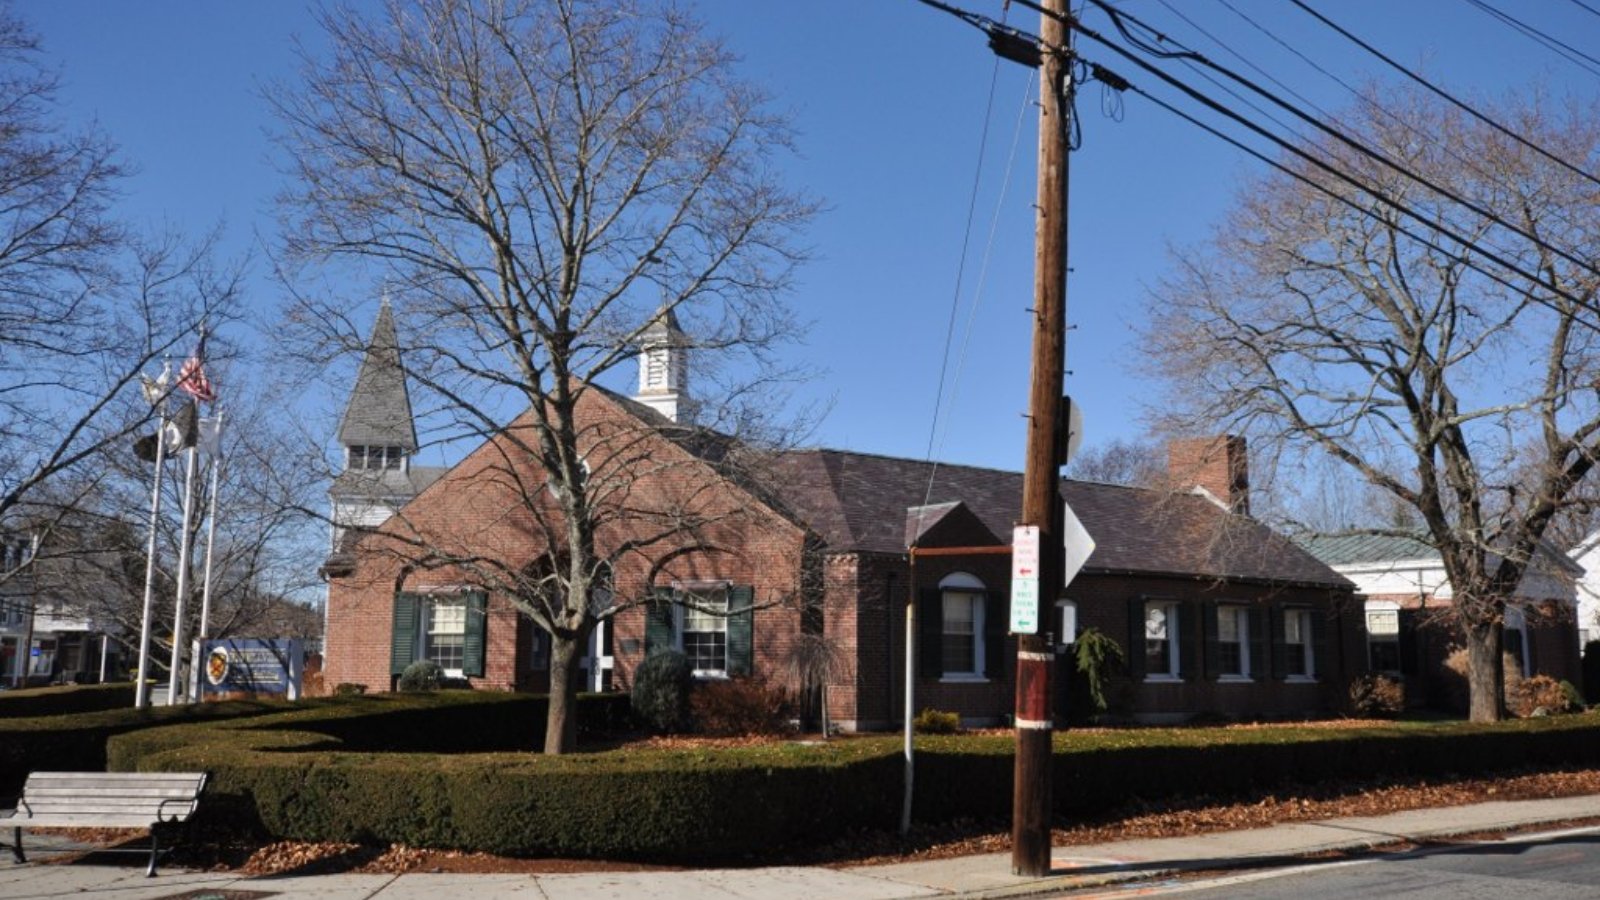
Located in the northwest corner of Rhode Island, Burrillville is known for its small-town charm and scenic countryside. With abundant green space, hiking trails, and historic mill villages, the town appeals to buyers seeking tranquility without being too far from Providence or Worcester, MA. Its affordability relative to more coastal towns made it especially attractive during the pandemic housing rush.
While demand has cooled slightly, Burrillville continues to offer strong value and livability. The consistent upward trend in home prices reflects both local appeal and broader regional trends toward rural residential living. Infrastructure improvements and proximity to Route 102 also help keep it connected.
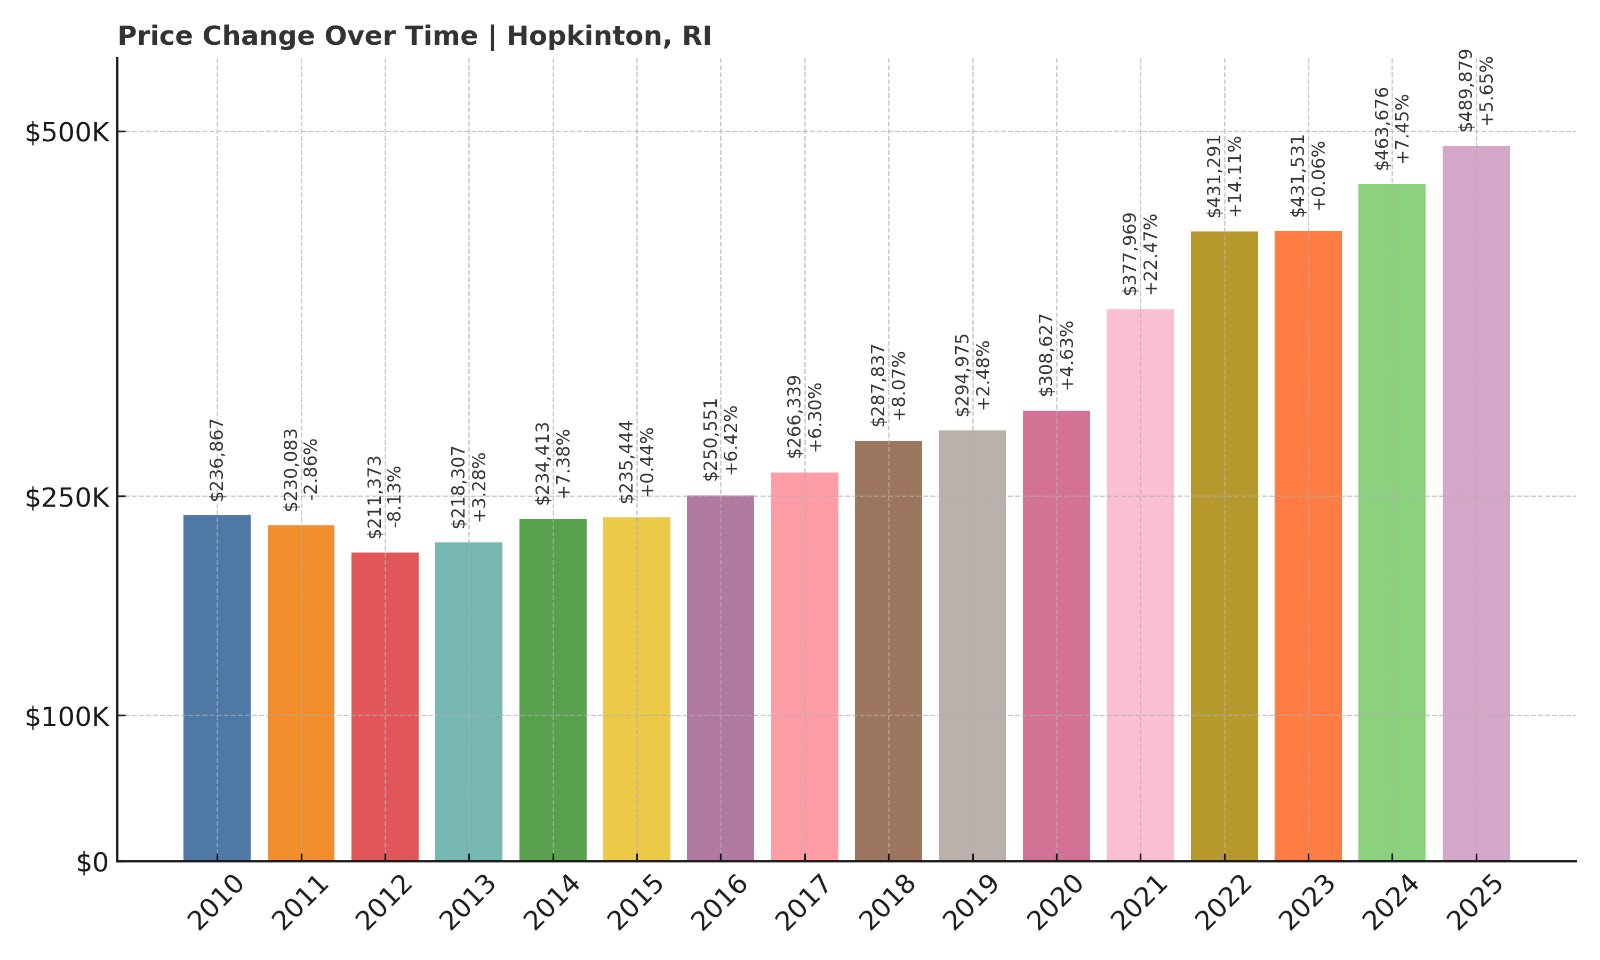
27. Hopkinton – 106.7% Home Price Increase Since 2010
🔥 Would you like to save this?
- 2010: $236,867
- 2011: $230,083 (-$6,784, -2.86% from previous year)
- 2012: $211,373 (-$18,710, -8.13% from previous year)
- 2013: $218,307 (+$6,934, +3.28% from previous year)
- 2014: $234,413 (+$16,106, +7.38% from previous year)
- 2015: $235,444 (+$1,031, +0.44% from previous year)
- 2016: $250,551 (+$15,107, +6.42% from previous year)
- 2017: $266,339 (+$15,788, +6.30% from previous year)
- 2018: $287,837 (+$21,498, +8.07% from previous year)
- 2019: $294,975 (+$7,138, +2.48% from previous year)
- 2020: $308,627 (+$13,652, +4.63% from previous year)
- 2021: $377,969 (+$69,342, +22.47% from previous year)
- 2022: $431,291 (+$53,322, +14.11% from previous year)
- 2023: $431,531 (+$240, +0.06% from previous year)
- 2024: $463,676 (+$32,145, +7.45% from previous year)
- 2025: $489,879 (+$26,203, +5.65% from previous year)
Hopkinton’s home prices have risen more than 106% since 2010, reaching nearly $490K in 2025. The town experienced a surge between 2020 and 2022, adding more than $120,000 in value in just two years. Since then, appreciation has continued at a slower but steady pace, reflecting the town’s resilience and lasting appeal.
Hopkinton – A Quiet Community with Strong Appeal
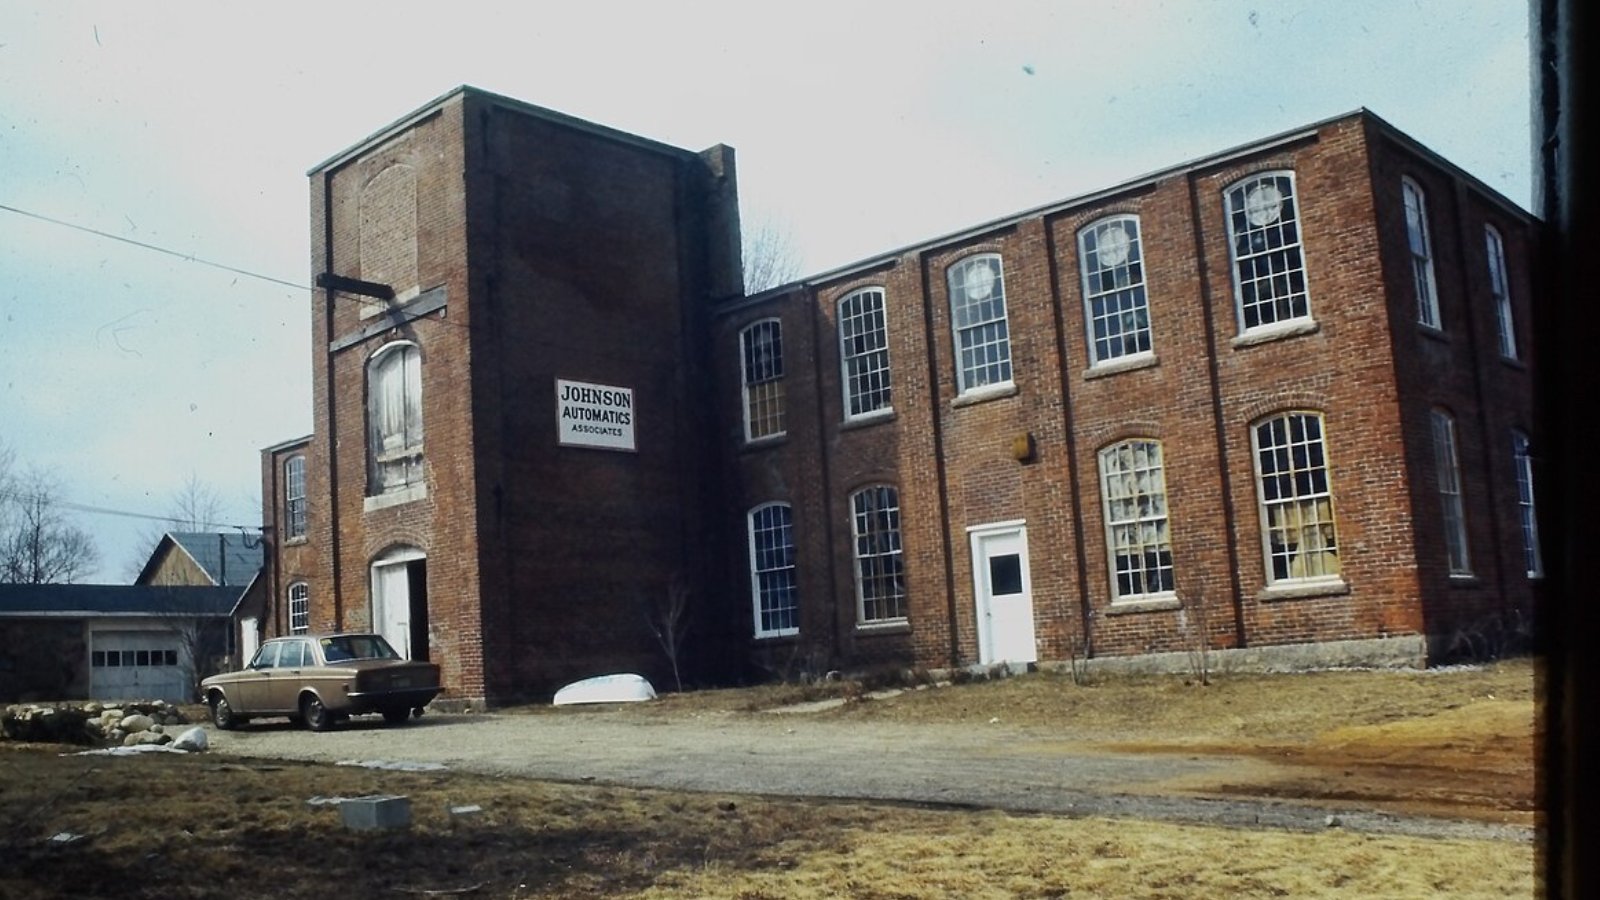
Set along Rhode Island’s southwestern border with Connecticut, Hopkinton offers rolling countryside, rural neighborhoods, and quick access to I-95. The town’s open spaces and lower density have attracted buyers seeking privacy, especially during the remote work boom. It also includes the villages of Ashaway and Hope Valley, known for historic buildings and a small-town feel.
Hopkinton’s strong price increases are tied to its transformation from overlooked rural town to a viable option for those commuting to Connecticut or the Providence metro. As interest in outer-ring towns grows, Hopkinton has stood out for its quality of life and growing popularity among families and remote workers.
26. Smithfield – 94.1% Home Price Increase Since 2010
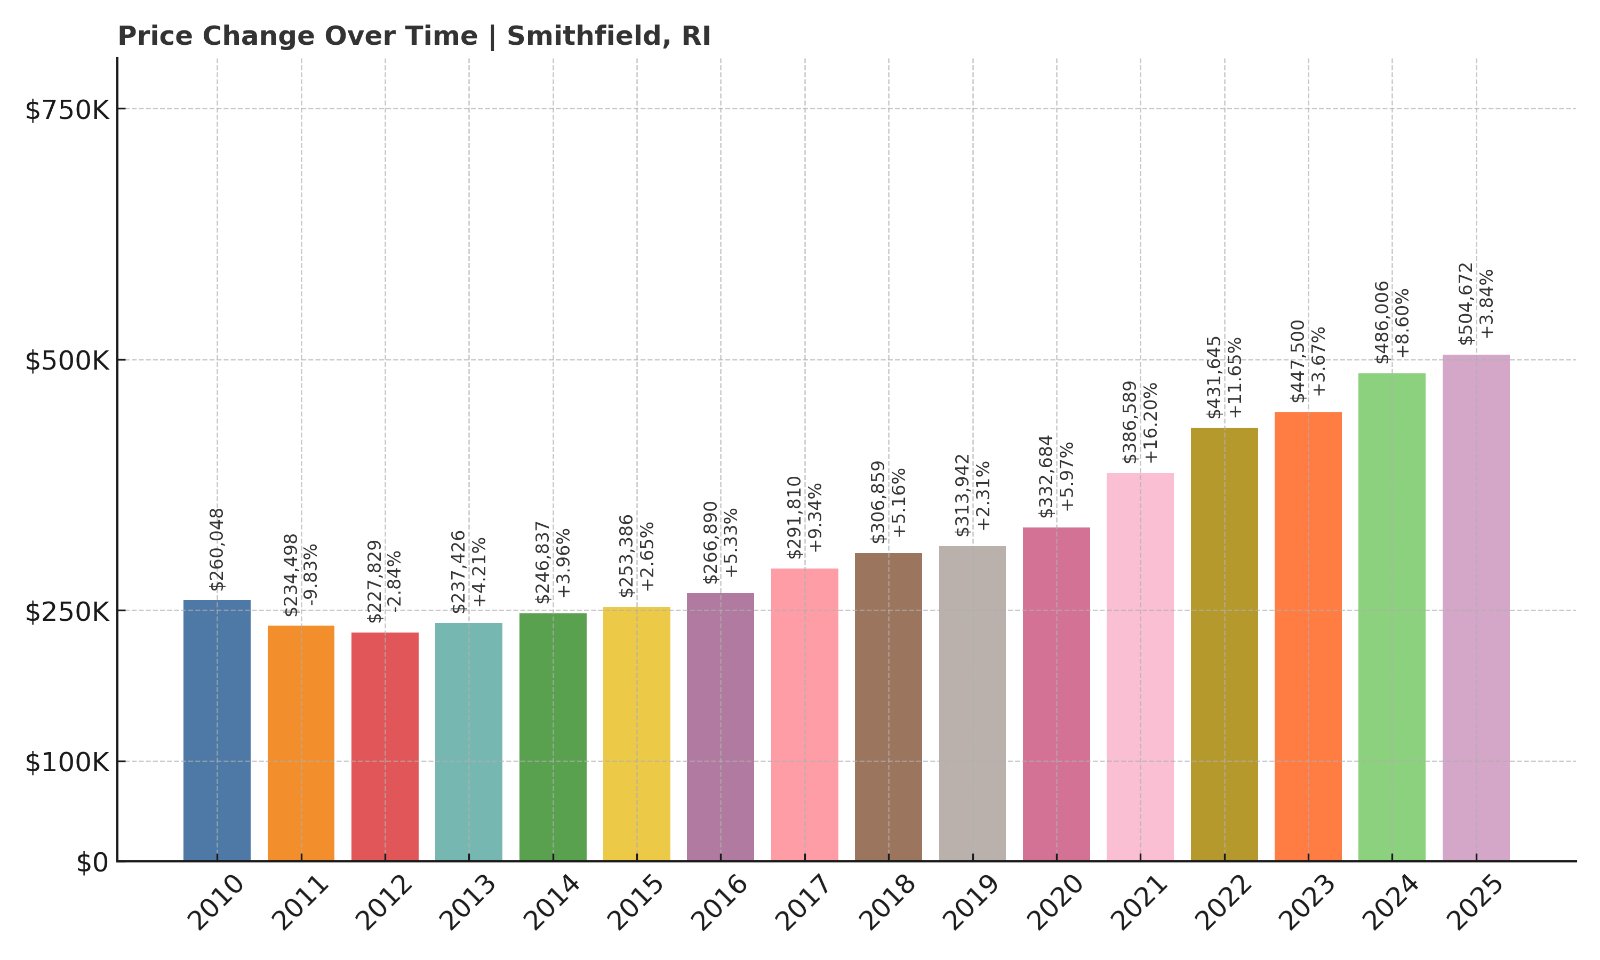
- 2010: $260,048
- 2011: $234,498 (-$25,550, -9.83% from previous year)
- 2012: $227,829 (-$6,669, -2.84% from previous year)
- 2013: $237,426 (+$9,597, +4.21% from previous year)
- 2014: $246,837 (+$9,411, +3.96% from previous year)
- 2015: $253,386 (+$6,549, +2.65% from previous year)
- 2016: $266,890 (+$13,504, +5.33% from previous year)
- 2017: $291,810 (+$24,920, +9.34% from previous year)
- 2018: $306,859 (+$15,049, +5.16% from previous year)
- 2019: $313,942 (+$7,083, +2.31% from previous year)
- 2020: $332,684 (+$18,742, +5.97% from previous year)
- 2021: $386,589 (+$53,905, +16.20% from previous year)
- 2022: $431,645 (+$45,056, +11.65% from previous year)
- 2023: $447,500 (+$15,855, +3.67% from previous year)
- 2024: $486,006 (+$38,506, +8.60% from previous year)
- 2025: $504,672 (+$18,666, +3.84% from previous year)
Smithfield’s home prices have climbed steadily, nearly doubling over the last 15 years. A standout year in 2021 saw values jump over 16%, followed by strong growth in 2022 and beyond. Prices reached just over $504K in 2025, up from $260K in 2010 — a 94.1% increase overall.
Smithfield – Balanced Growth and Solid Appeal
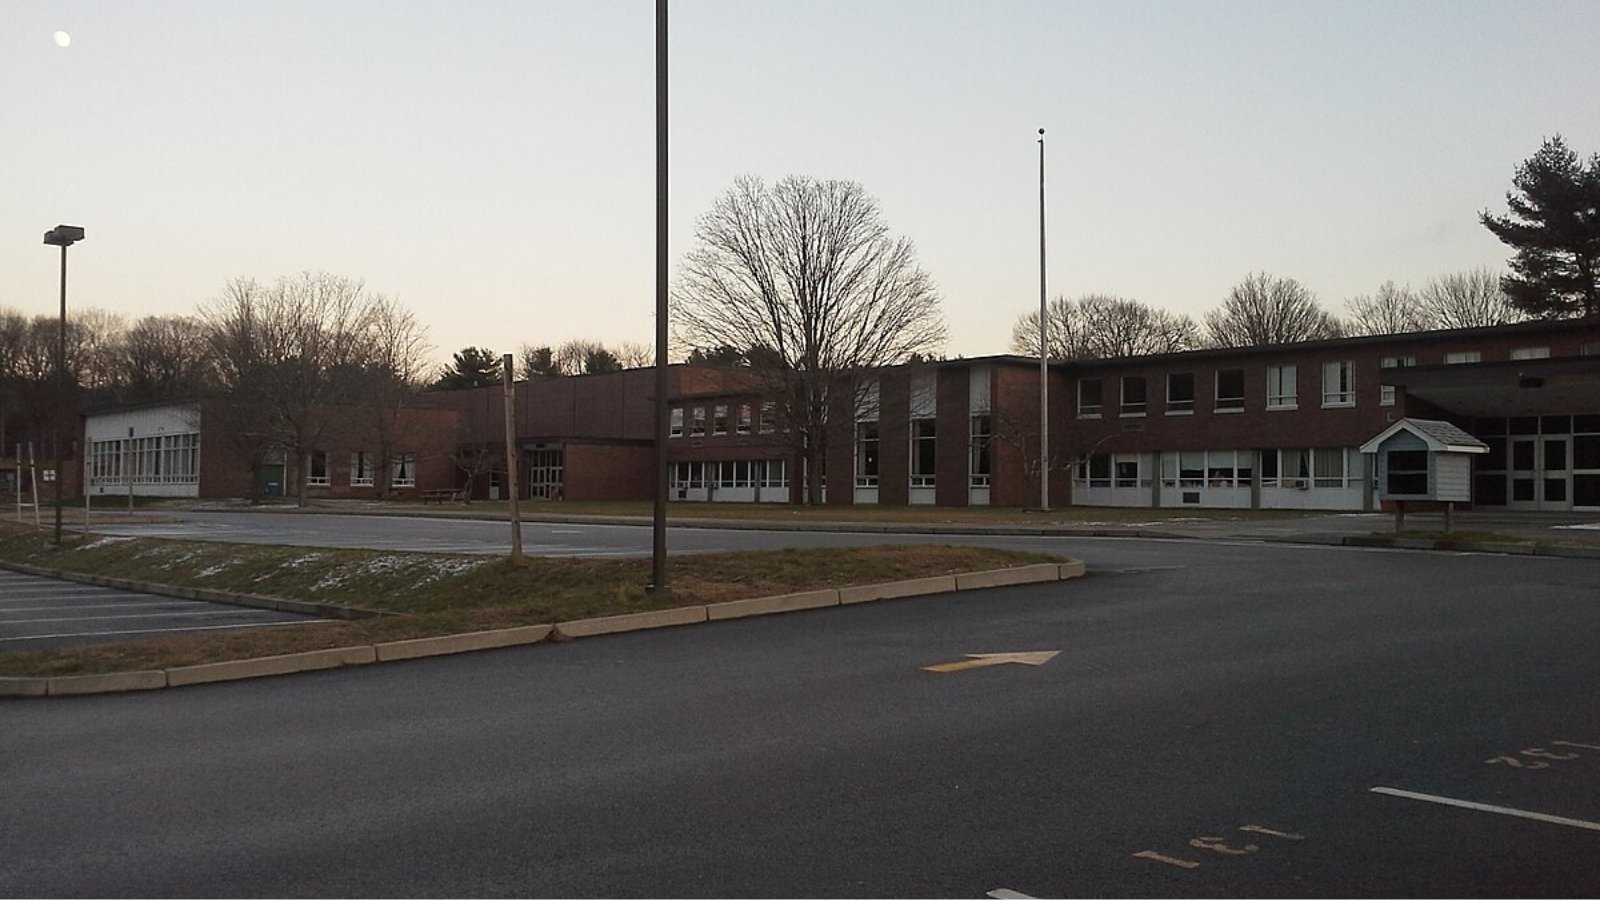
Smithfield, located northwest of Providence, is home to Bryant University and is known for its mix of residential neighborhoods, businesses, and green space. Its central location and access to major highways make it popular among commuters, while its school system and community amenities appeal to families and professionals.
Continued investment in retail and infrastructure has supported home price appreciation. As buyers move further out from Providence in search of more space and stability, Smithfield offers a middle ground — suburban convenience without losing access to job centers and urban attractions.
25. Glocester – 136.9% Home Price Increase Since 2010
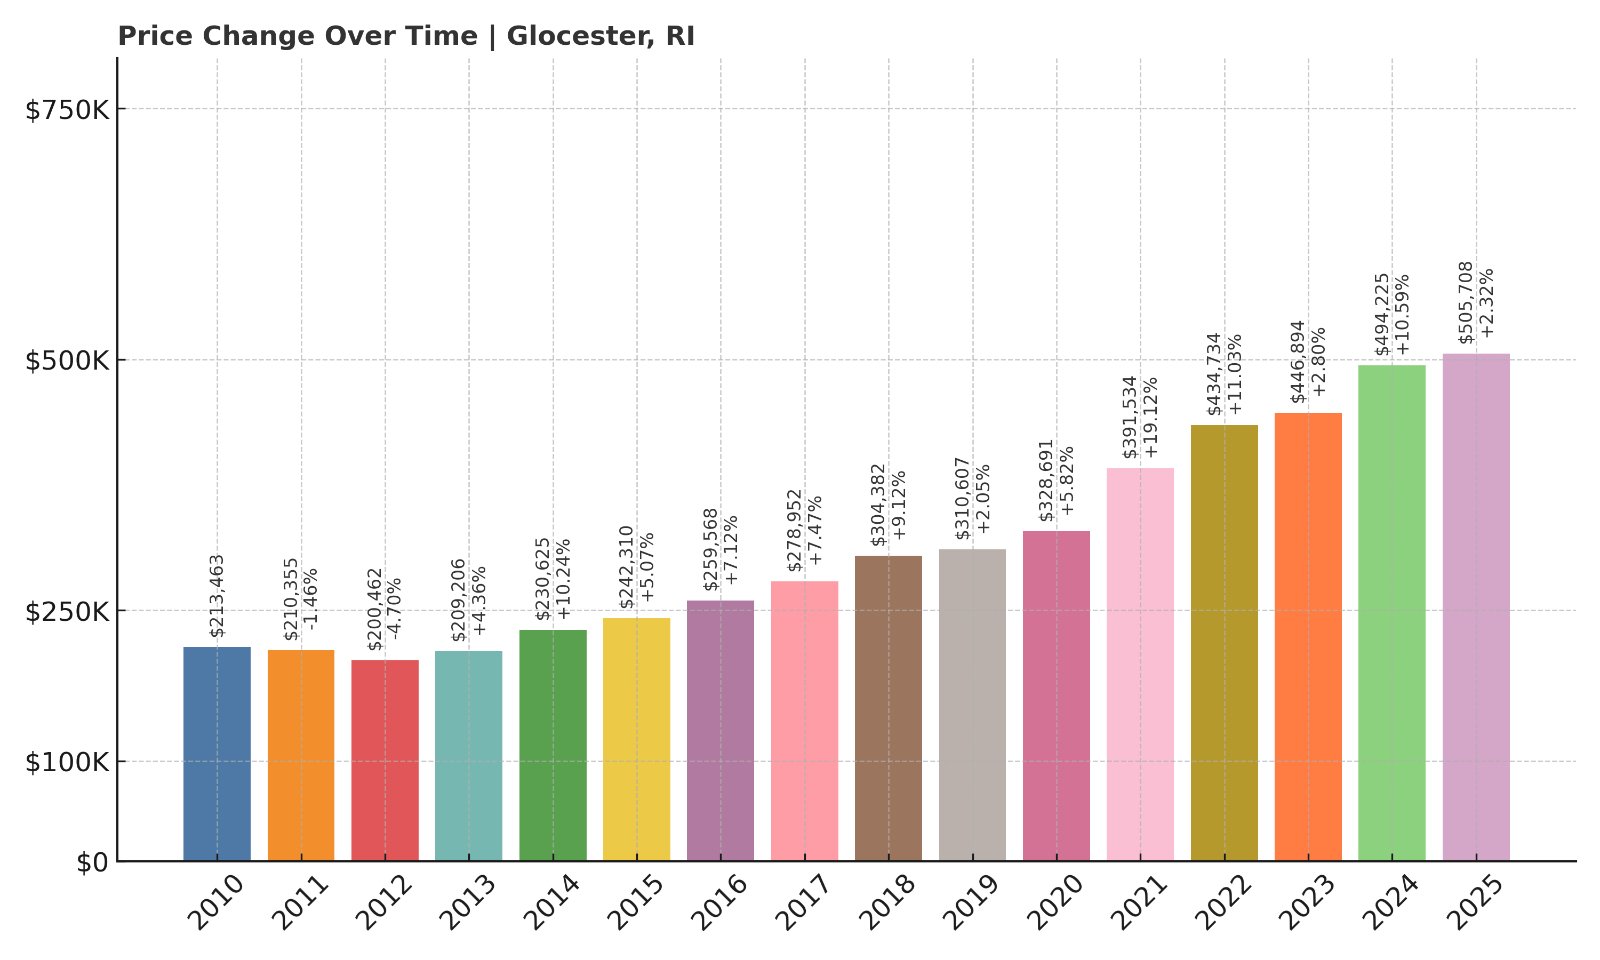
- 2010: $213,463
- 2011: $210,355 (-$3,108, -1.46% from previous year)
- 2012: $200,462 (-$9,893, -4.70% from previous year)
- 2013: $209,206 (+$8,744, +4.36% from previous year)
- 2014: $230,625 (+$21,419, +10.24% from previous year)
- 2015: $242,310 (+$11,685, +5.07% from previous year)
- 2016: $259,568 (+$17,258, +7.12% from previous year)
- 2017: $278,952 (+$19,384, +7.47% from previous year)
- 2018: $304,382 (+$25,430, +9.12% from previous year)
- 2019: $310,607 (+$6,225, +2.05% from previous year)
- 2020: $328,691 (+$18,084, +5.82% from previous year)
- 2021: $391,534 (+$62,843, +19.12% from previous year)
- 2022: $434,734 (+$43,200, +11.03% from previous year)
- 2023: $446,894 (+$12,160, +2.80% from previous year)
- 2024: $494,225 (+$47,331, +10.59% from previous year)
- 2025: $505,708 (+$11,483, +2.32% from previous year)
Glocester’s housing market has surged since 2010, with home prices jumping by nearly 137%. From $213K in 2010 to more than $505K in 2025, it’s one of the highest percentage gains among the lower half of this ranking. The town experienced rapid growth during the pandemic, especially between 2020 and 2022, and has maintained high valuations since.
Glocester – Rural Growth with a Modern Edge
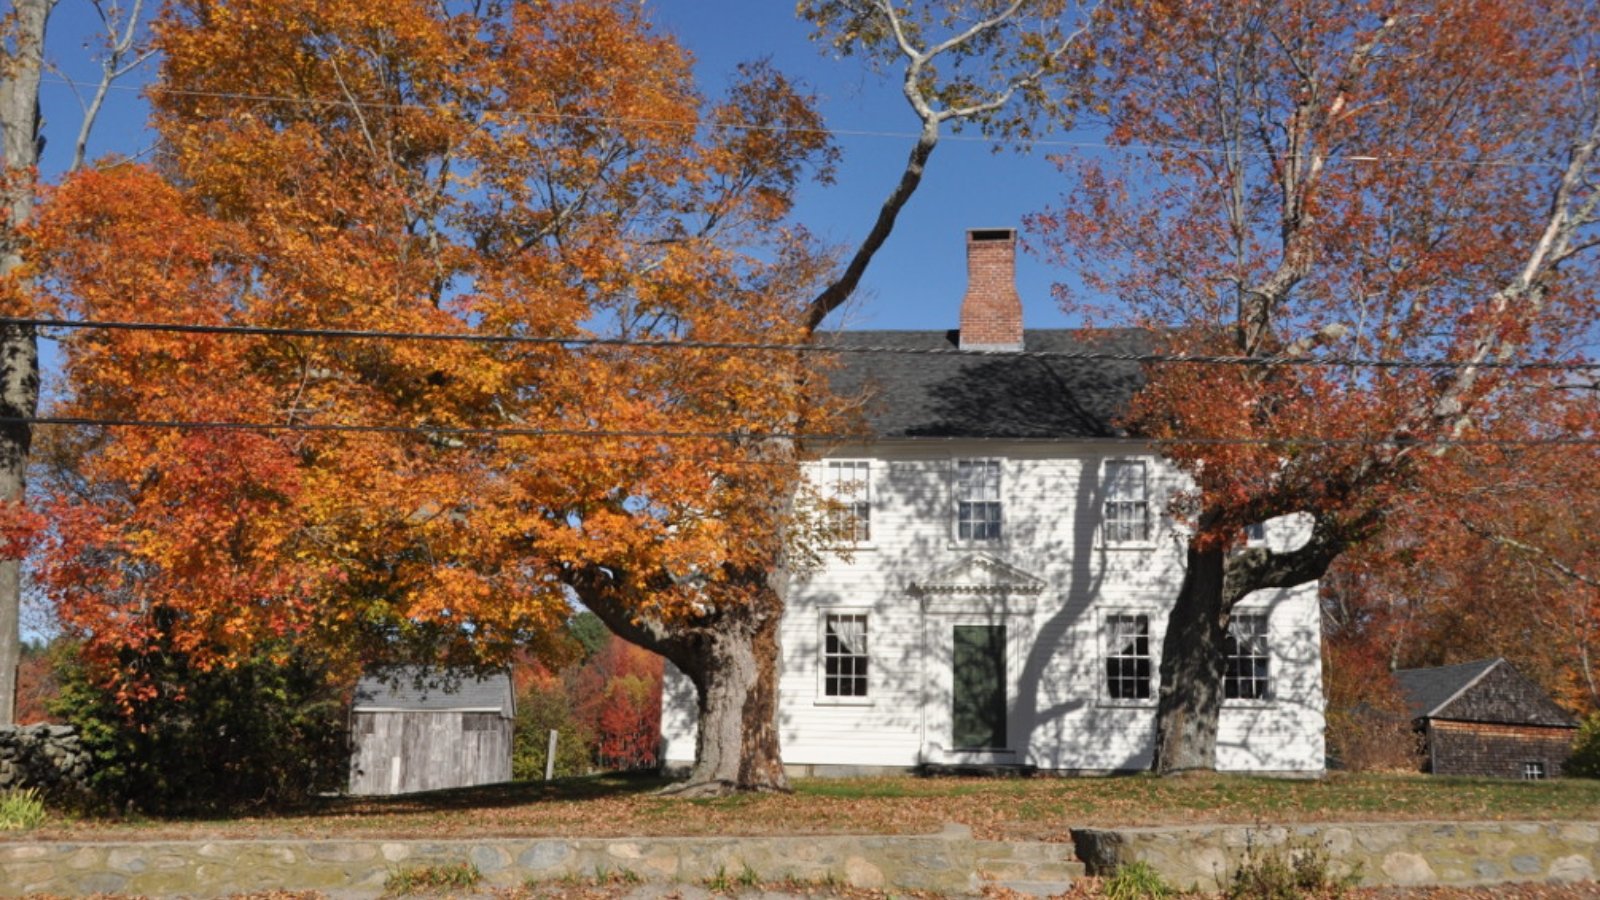
Glocester offers a serene, woodsy environment with historic villages like Chepachet, making it popular for buyers looking for rural charm with modern amenities. Located in northwestern Rhode Island, the town has long been considered a quiet retreat from city life.
Recent years have brought more interest from buyers priced out of more urban or coastal markets. Its open spaces, traditional New England architecture, and improved connectivity via Routes 44 and 102 have all contributed to its rise in home values. The balance of space, peace, and increasing demand makes Glocester one of the state’s most dynamic housing markets in 2025.
24. North Smithfield – 91.3% Home Price Increase Since 2010
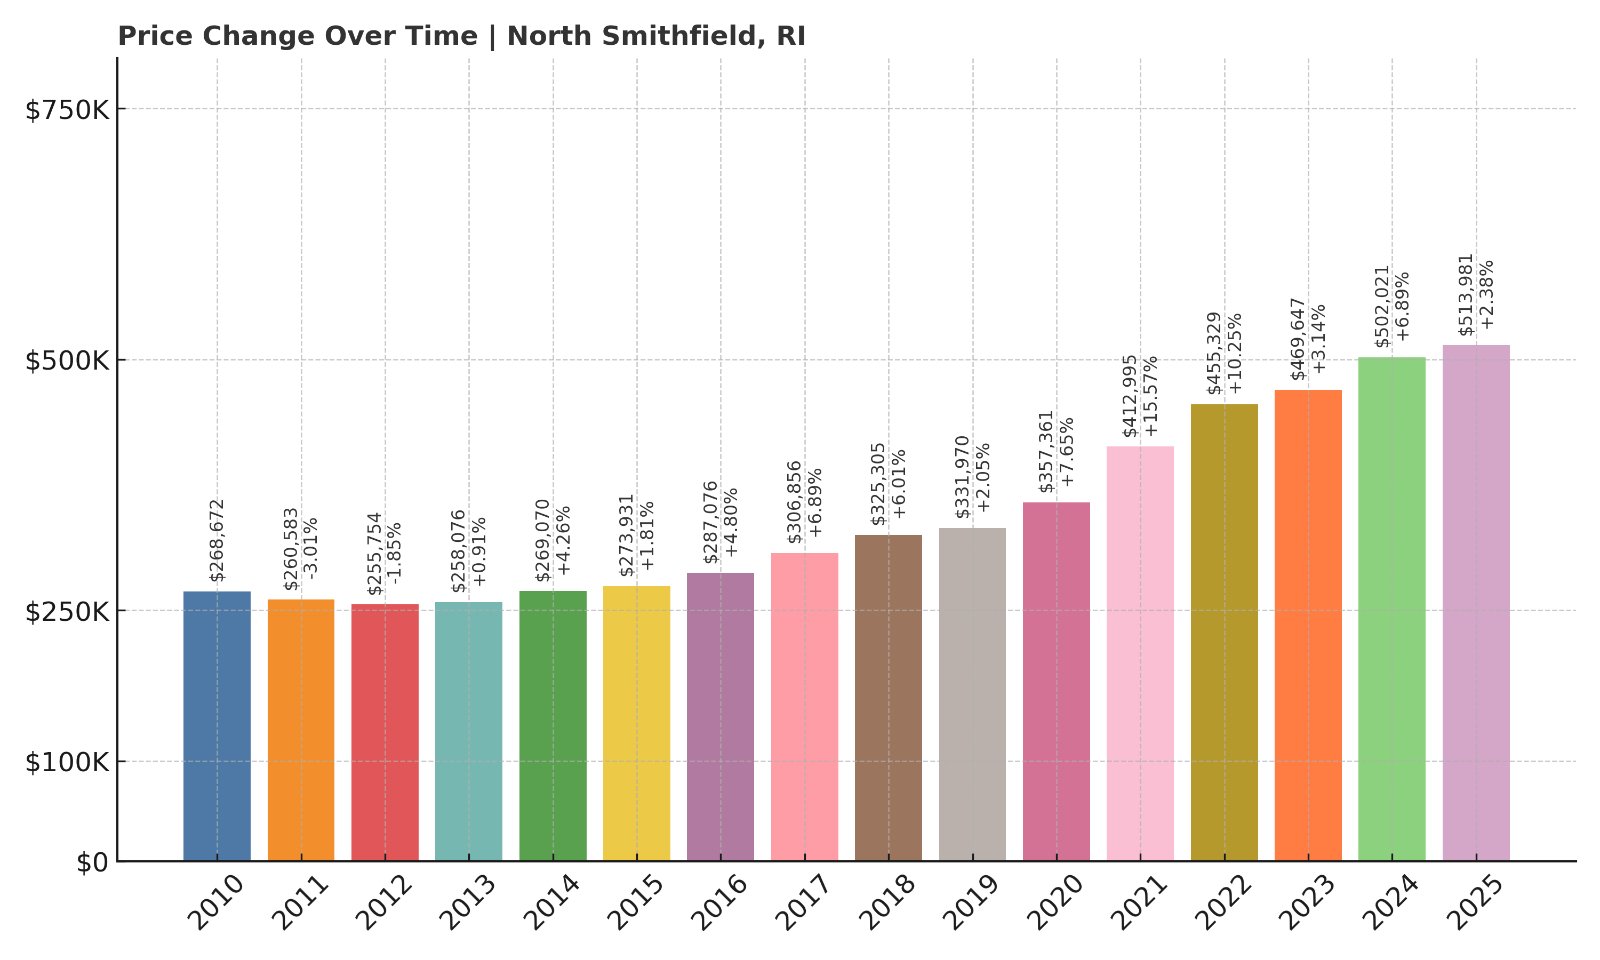
- 2010: $268,672
- 2011: $260,583 (-$8,089, -3.01% from previous year)
- 2012: $255,754 (-$4,829, -1.85% from previous year)
- 2013: $258,076 (+$2,322, +0.91% from previous year)
- 2014: $269,070 (+$10,994, +4.26% from previous year)
- 2015: $273,931 (+$4,861, +1.81% from previous year)
- 2016: $287,076 (+$13,145, +4.80% from previous year)
- 2017: $306,856 (+$19,780, +6.89% from previous year)
- 2018: $325,305 (+$18,449, +6.01% from previous year)
- 2019: $331,970 (+$6,665, +2.05% from previous year)
- 2020: $357,361 (+$25,391, +7.65% from previous year)
- 2021: $412,995 (+$55,634, +15.57% from previous year)
- 2022: $455,329 (+$42,334, +10.25% from previous year)
- 2023: $469,647 (+$14,318, +3.14% from previous year)
- 2024: $502,021 (+$32,374, +6.89% from previous year)
- 2025: $513,981 (+$11,960, +2.38% from previous year)
North Smithfield has seen home values rise 91.3% over 15 years, climbing from just under $269K in 2010 to over $513K in 2025. Price growth accelerated significantly from 2020 onward, with particularly sharp increases during the housing boom years of 2021 and 2022. While growth has slowed since, prices remain elevated and stable.
North Smithfield – Suburban Stability in Northern Rhode Island
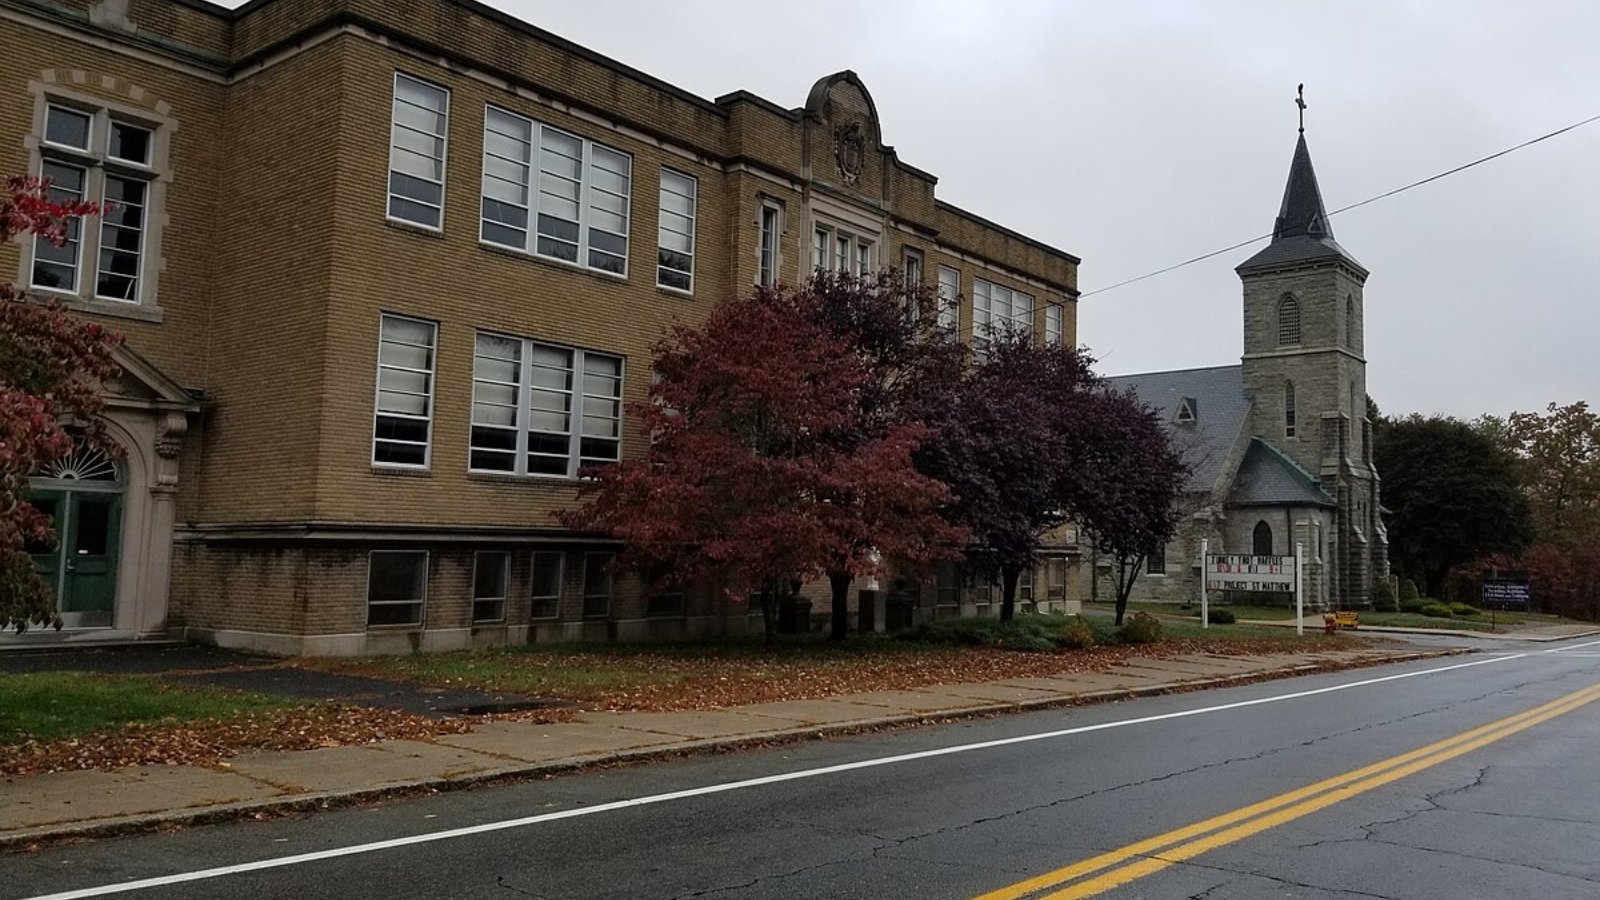
Located near the Massachusetts border, North Smithfield offers a balance of suburban living and rural landscapes. Its appeal lies in a mix of historic neighborhoods, modern developments, and a reputation for solid schools. Residents benefit from easy access to Worcester and Providence, making it a popular choice for cross-border commuters.
The consistent climb in values reflects North Smithfield’s attractiveness as a long-term investment. With steady demand and manageable development, it offers the kind of housing security many buyers look for — especially in a shifting market climate.
23. Cumberland – 97.5% Home Price Increase Since 2010
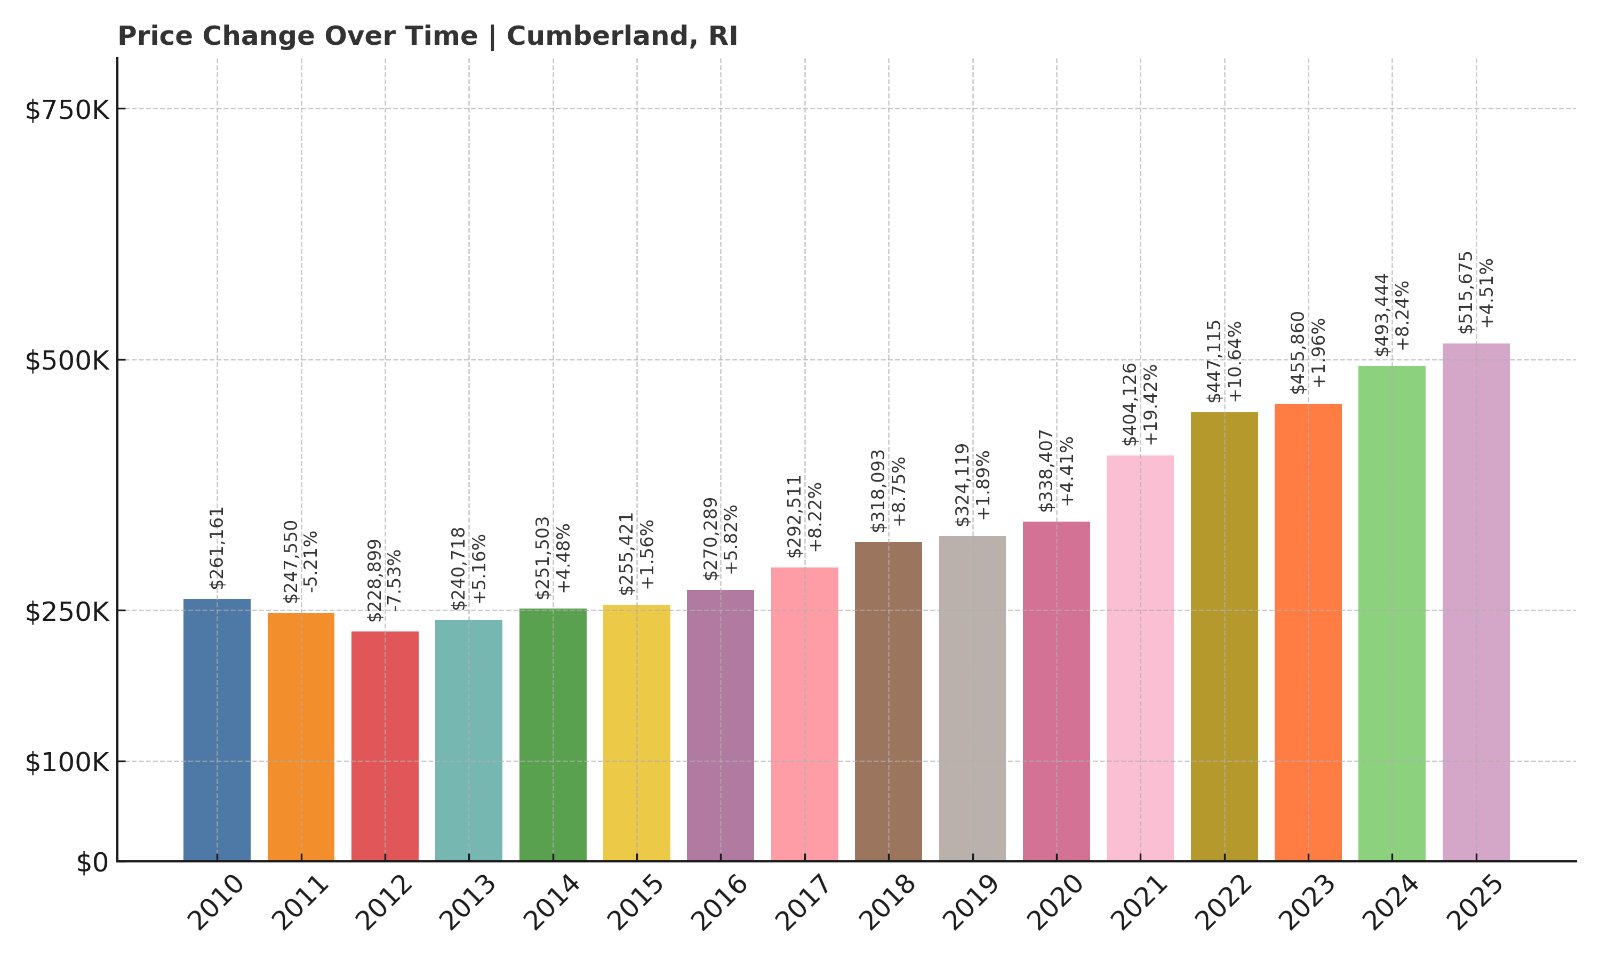
- 2010: $261,161
- 2011: $247,550 (-$13,611, -5.21% from previous year)
- 2012: $228,899 (-$18,651, -7.53% from previous year)
- 2013: $240,718 (+$11,819, +5.16% from previous year)
- 2014: $251,503 (+$10,785, +4.48% from previous year)
- 2015: $255,421 (+$3,918, +1.56% from previous year)
- 2016: $270,289 (+$14,868, +5.82% from previous year)
- 2017: $292,511 (+$22,222, +8.22% from previous year)
- 2018: $318,093 (+$25,582, +8.75% from previous year)
- 2019: $324,119 (+$6,026, +1.89% from previous year)
- 2020: $338,407 (+$14,288, +4.41% from previous year)
- 2021: $404,126 (+$65,719, +19.42% from previous year)
- 2022: $447,115 (+$42,989, +10.64% from previous year)
- 2023: $455,860 (+$8,745, +1.96% from previous year)
- 2024: $493,444 (+$37,584, +8.24% from previous year)
- 2025: $515,675 (+$22,231, +4.51% from previous year)
From $261K in 2010 to over $515K in 2025, Cumberland’s home prices have surged 97.5%. Like many Rhode Island communities, the largest jumps occurred between 2020 and 2022, when annual gains topped 10% and 19%. That growth has remained positive — and healthy — into 2025.
Cumberland – A Gateway Town with Enduring Demand
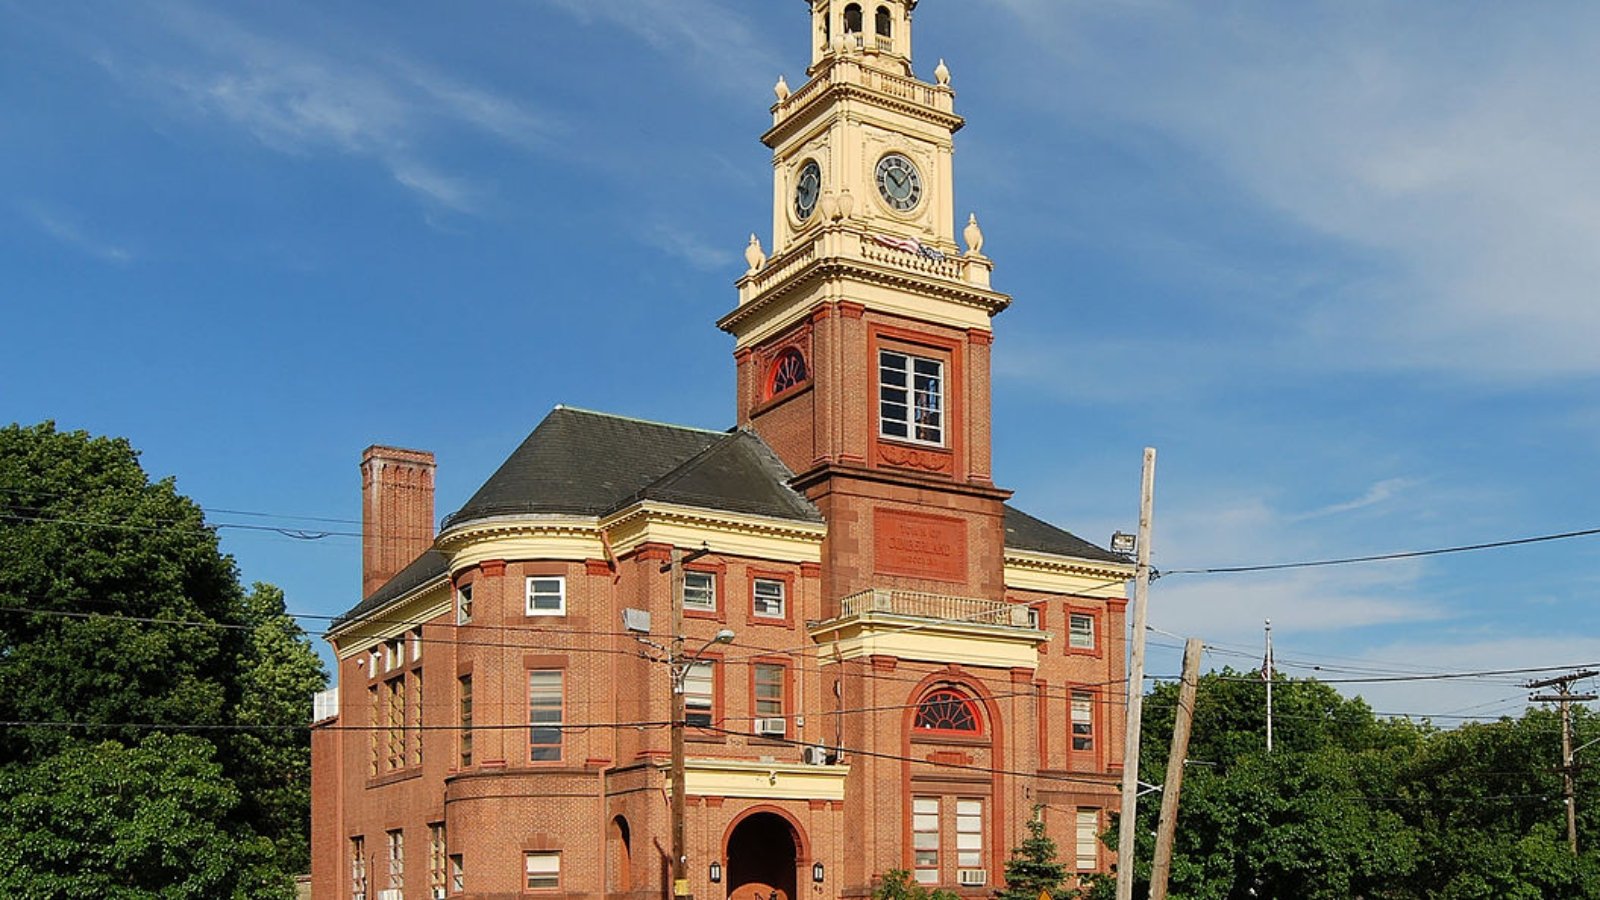
Bordering Massachusetts, Cumberland is one of the state’s most accessible towns for Boston-bound commuters. It offers a combination of suburban neighborhoods, walkable village centers, and family-friendly infrastructure. Proximity to I-295 and commuter rail lines adds to its attractiveness.
The town’s balanced price growth and economic appeal continue to draw interest from both Rhode Island and Massachusetts residents. With a strong school system and easy access to both Providence and Boston, Cumberland remains one of the more versatile markets in northern Rhode Island.
22. Richmond – 112.9% Home Price Increase Since 2010
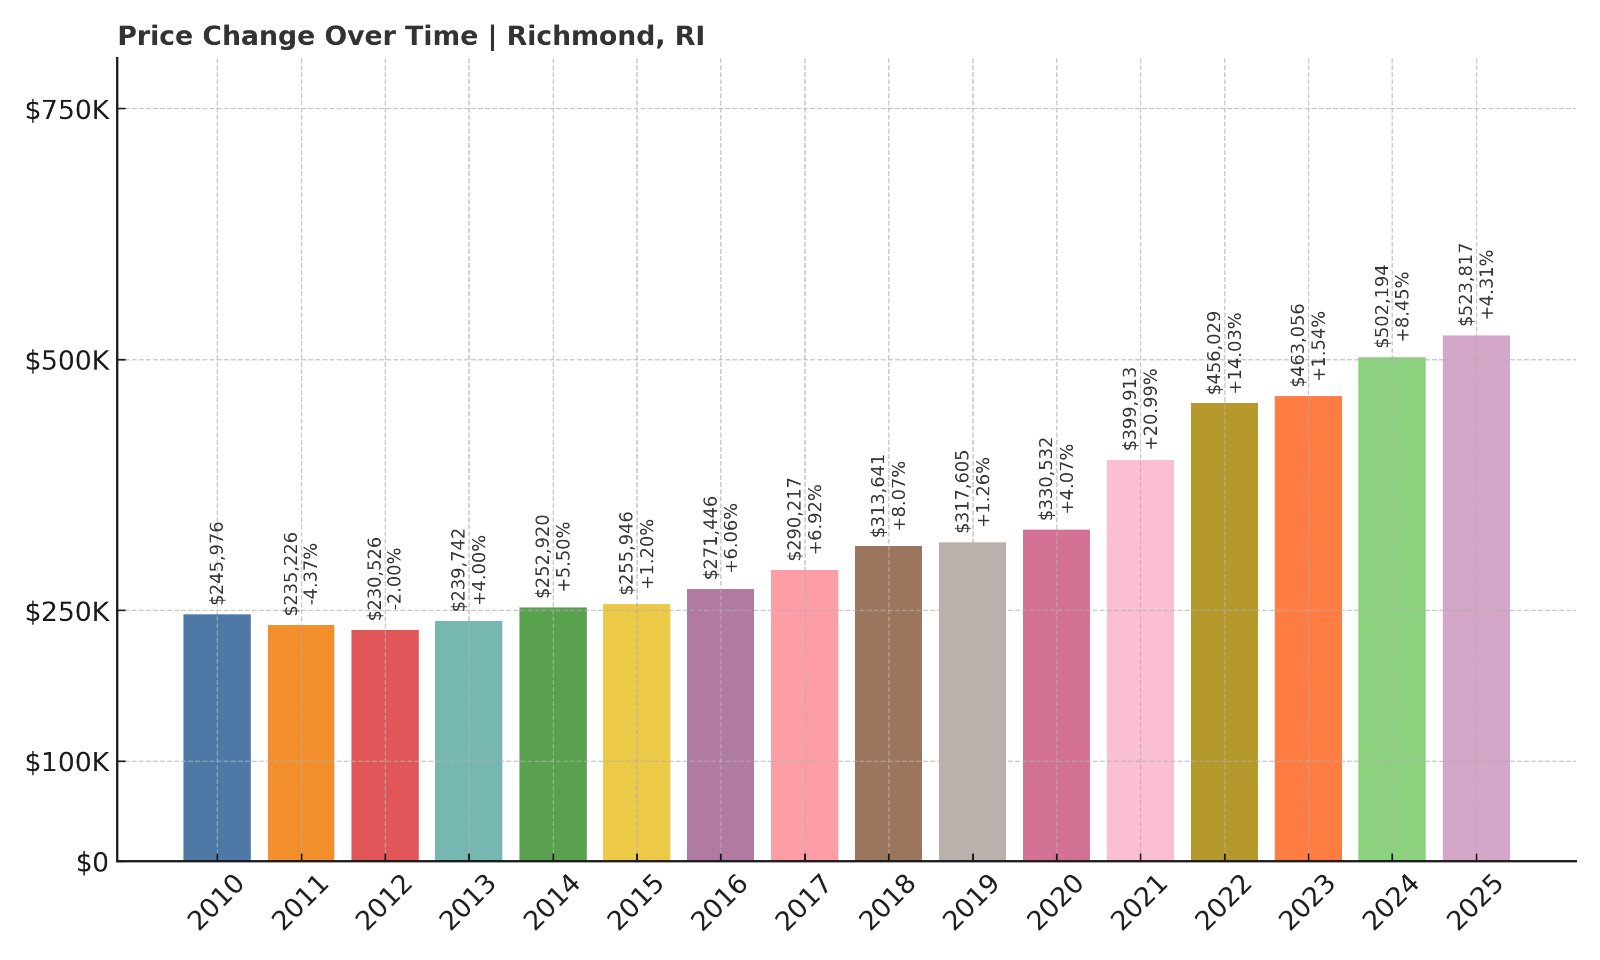
- 2010: $245,976
- 2011: $235,226 (-$10,750, -4.37% from previous year)
- 2012: $230,526 (-$4,700, -2.00% from previous year)
- 2013: $239,742 (+$9,216, +4.00% from previous year)
- 2014: $252,920 (+$13,178, +5.50% from previous year)
- 2015: $255,946 (+$3,026, +1.20% from previous year)
- 2016: $271,446 (+$15,500, +6.06% from previous year)
- 2017: $290,217 (+$18,771, +6.92% from previous year)
- 2018: $313,641 (+$23,424, +8.07% from previous year)
- 2019: $317,605 (+$3,964, +1.26% from previous year)
- 2020: $330,532 (+$12,927, +4.07% from previous year)
- 2021: $399,913 (+$69,381, +20.99% from previous year)
- 2022: $456,029 (+$56,116, +14.03% from previous year)
- 2023: $463,056 (+$7,027, +1.54% from previous year)
- 2024: $502,194 (+$39,138, +8.45% from previous year)
- 2025: $523,817 (+$21,623, +4.31% from previous year)
Richmond’s home values have more than doubled since 2010, rising by 112.9% to a 2025 average of $523,817. The 2020–2022 period saw particularly sharp growth — nearly 40% in just two years — while more recent gains have remained solid and sustainable.
Richmond – Rural Privacy and Regional Access
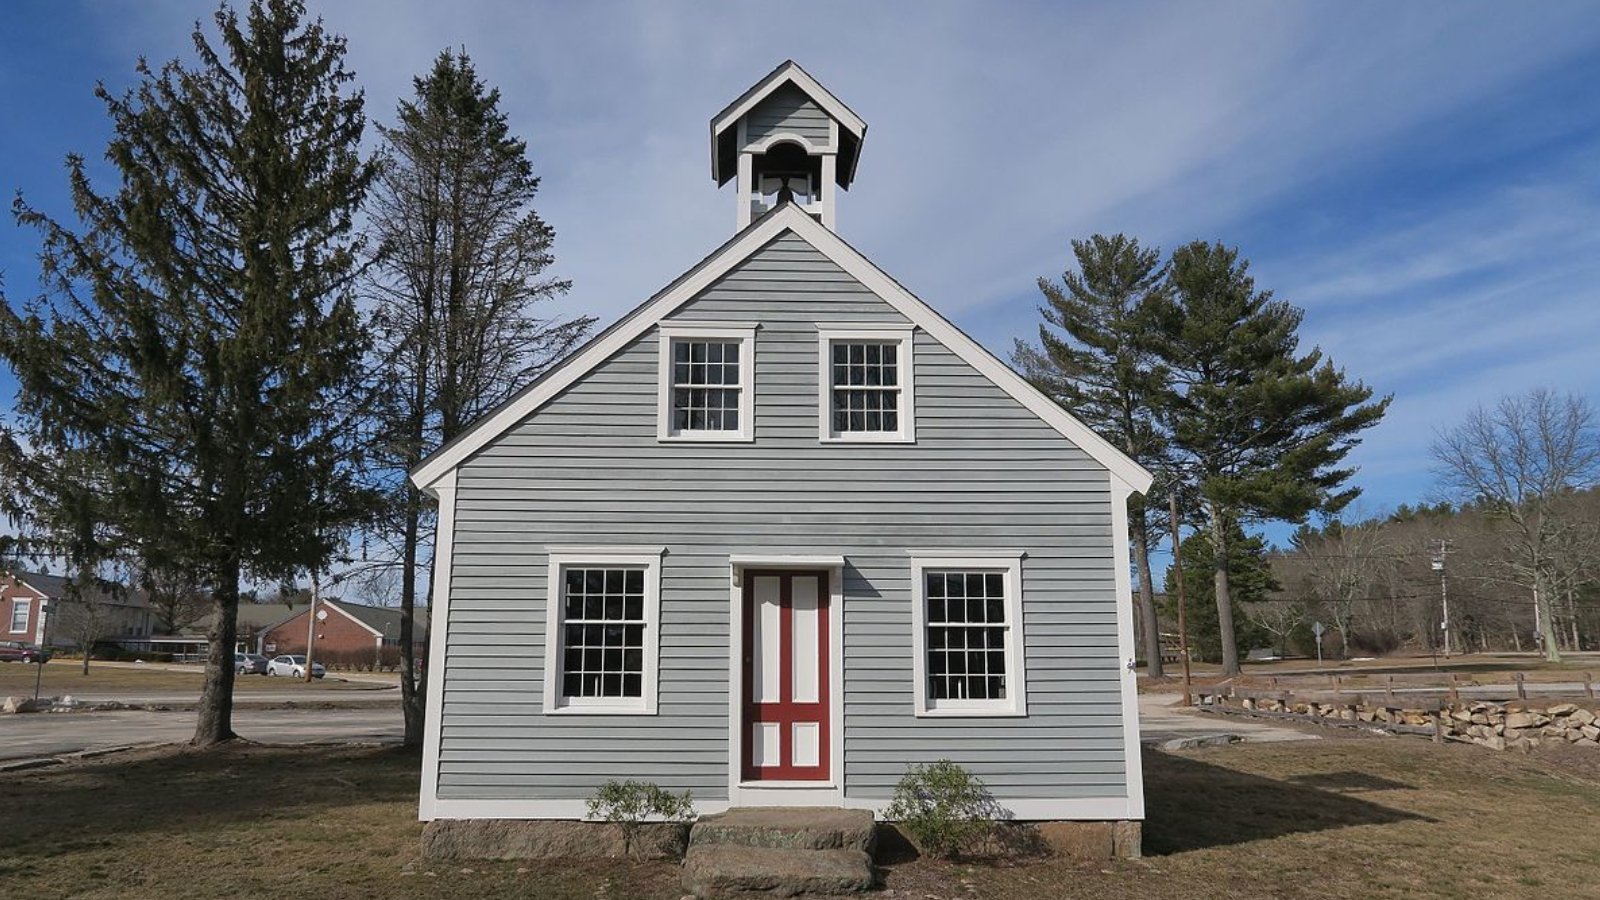
Set in the southwest part of the state, Richmond is a largely rural town with easy access to Route 95, making it a practical option for those commuting to southern Rhode Island or Connecticut. The town’s reputation for peace, open space, and affordability (compared to coastal areas) has fueled steady price growth.
As buyers shift toward privacy and green space, Richmond has become more competitive — especially among those priced out of towns closer to the water. Its rise in home values reflects this shift, as well as new residential development and interest in larger lots.
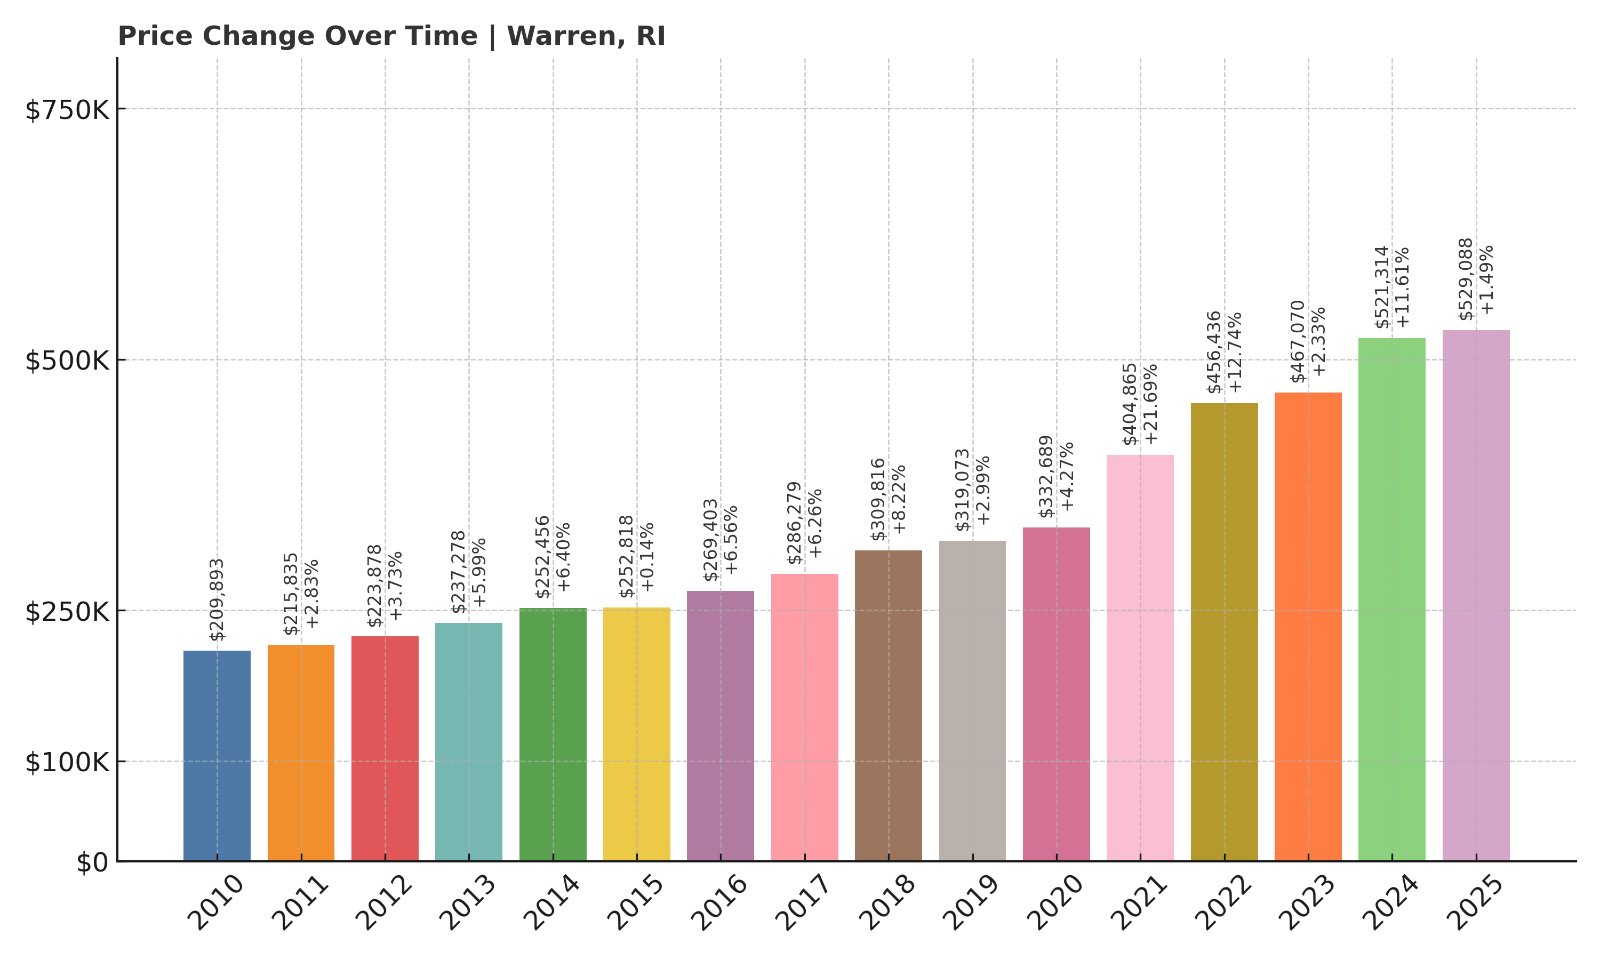
21. Warren – 152.2% Home Price Increase Since 2010
🔥 Would you like to save this?
- 2010: $209,893
- 2011: $215,835 (+$5,942, +2.83% from previous year)
- 2012: $223,878 (+$8,043, +3.73% from previous year)
- 2013: $237,278 (+$13,400, +5.99% from previous year)
- 2014: $252,456 (+$15,178, +6.40% from previous year)
- 2015: $252,818 (+$362, +0.14% from previous year)
- 2016: $269,403 (+$16,585, +6.56% from previous year)
- 2017: $286,279 (+$16,876, +6.26% from previous year)
- 2018: $309,816 (+$23,537, +8.22% from previous year)
- 2019: $319,073 (+$9,257, +2.99% from previous year)
- 2020: $332,689 (+$13,616, +4.27% from previous year)
- 2021: $404,865 (+$72,176, +21.69% from previous year)
- 2022: $456,436 (+$51,571, +12.74% from previous year)
- 2023: $467,070 (+$10,634, +2.33% from previous year)
- 2024: $521,314 (+$54,244, +11.61% from previous year)
- 2025: $529,088 (+$7,774, +1.49% from previous year)
Warren has experienced a remarkable 152.2% increase in home prices since 2010. From just under $210K to more than $529K in 2025, the town’s affordability has steadily declined as buyer interest has grown. The sharpest gains came between 2020 and 2022, with the market remaining hot through 2024.
Warren – Small Town Vibe, Big Price Momentum
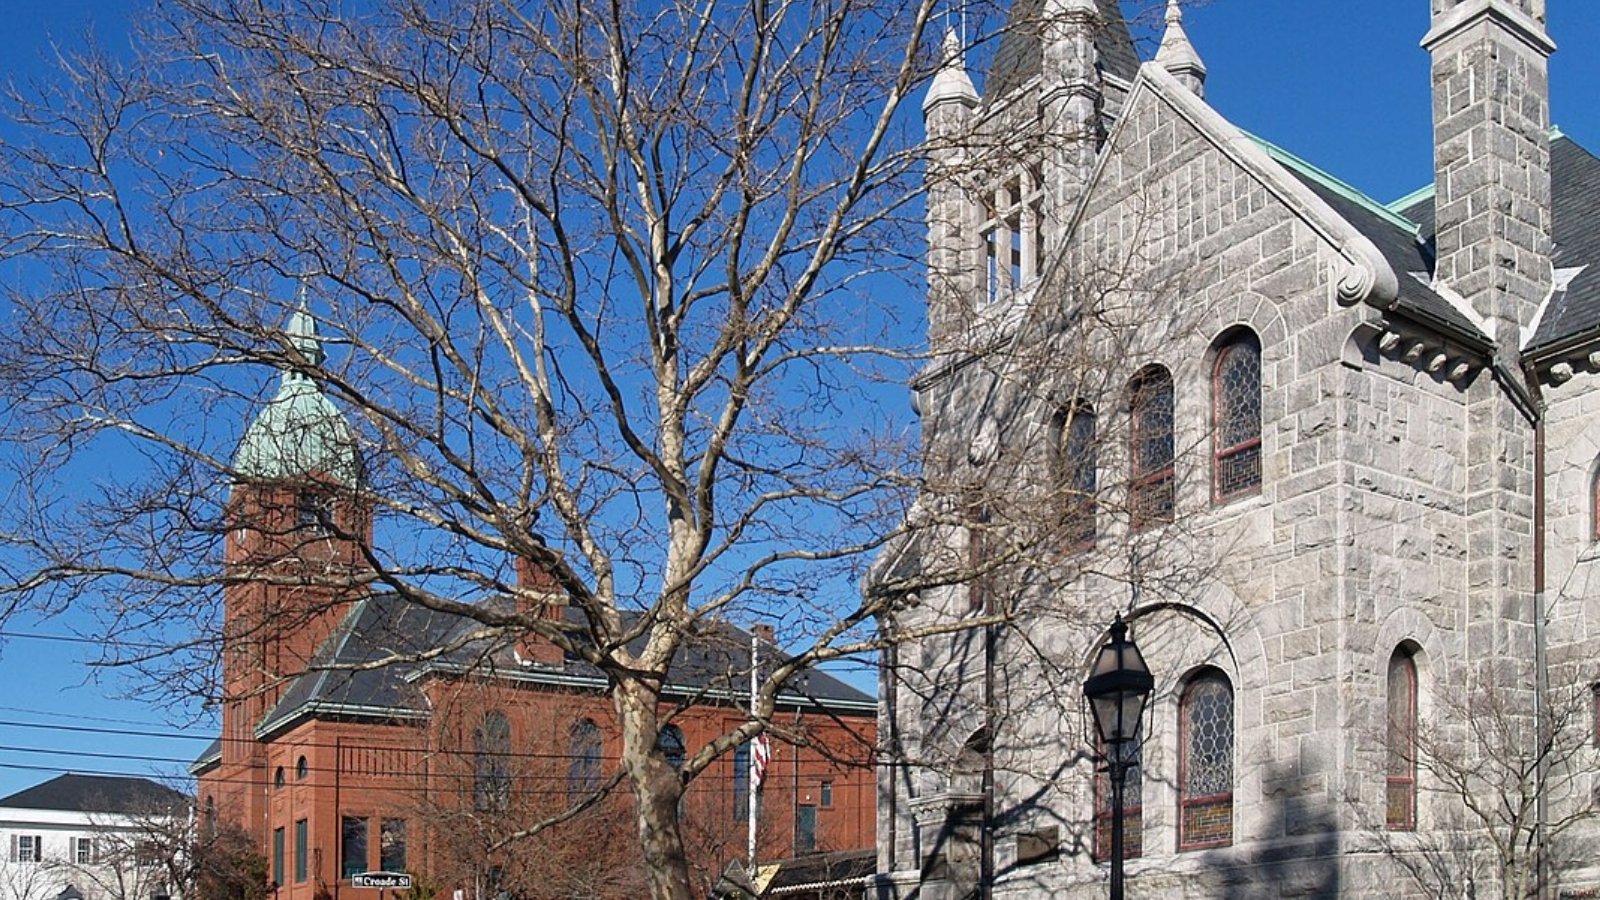
Warren is one of Rhode Island’s smallest towns, but it has seen outsized growth in home values thanks to its coastal charm, arts scene, and walkability. Set along the Warren River and bordering Bristol, the town offers water views and a thriving downtown with independent shops, galleries, and cafes.
The town’s appeal among younger buyers and creative professionals has helped drive demand. With easy access to both Providence and Newport County, Warren is a standout case of how lifestyle and character can turn a quiet town into one of the state’s most expensive real estate markets.
20. Tiverton – 124.8% Home Price Increase Since 2010
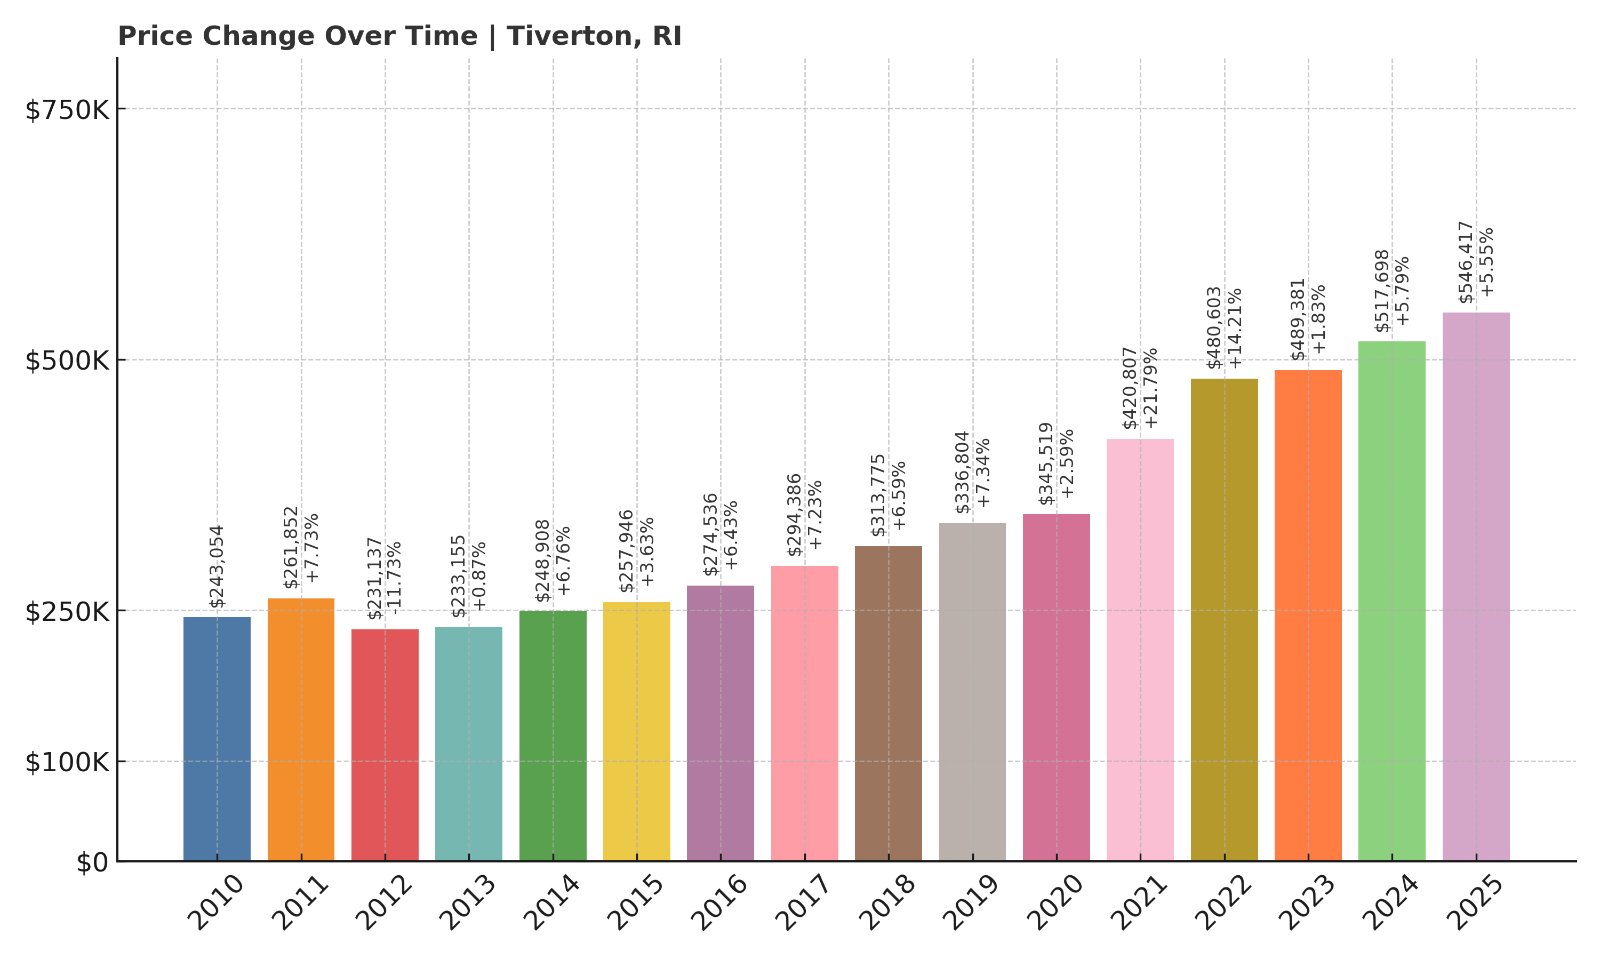
- 2010: $243,054
- 2011: $261,852 (+$18,798, +7.73% from previous year)
- 2012: $231,137 (-$30,715, -11.73% from previous year)
- 2013: $233,155 (+$2,018, +0.87% from previous year)
- 2014: $248,908 (+$15,753, +6.76% from previous year)
- 2015: $257,946 (+$9,038, +3.63% from previous year)
- 2016: $274,536 (+$16,590, +6.43% from previous year)
- 2017: $294,386 (+$19,850, +7.23% from previous year)
- 2018: $313,775 (+$19,389, +6.59% from previous year)
- 2019: $336,804 (+$23,029, +7.34% from previous year)
- 2020: $345,519 (+$8,715, +2.59% from previous year)
- 2021: $420,807 (+$75,288, +21.79% from previous year)
- 2022: $480,603 (+$59,796, +14.21% from previous year)
- 2023: $489,381 (+$8,778, +1.83% from previous year)
- 2024: $517,698 (+$28,317, +5.79% from previous year)
- 2025: $546,417 (+$28,719, +5.55% from previous year)
Over the past 15 years, Tiverton home values have climbed by nearly 125%, reaching over $546K in 2025. Price gains have been steady since 2014, with a breakout year in 2021 and continued momentum through 2025. This marks Tiverton as one of the top coastal communities for long-term appreciation.
Tiverton – Coastal Views Meet Community Growth
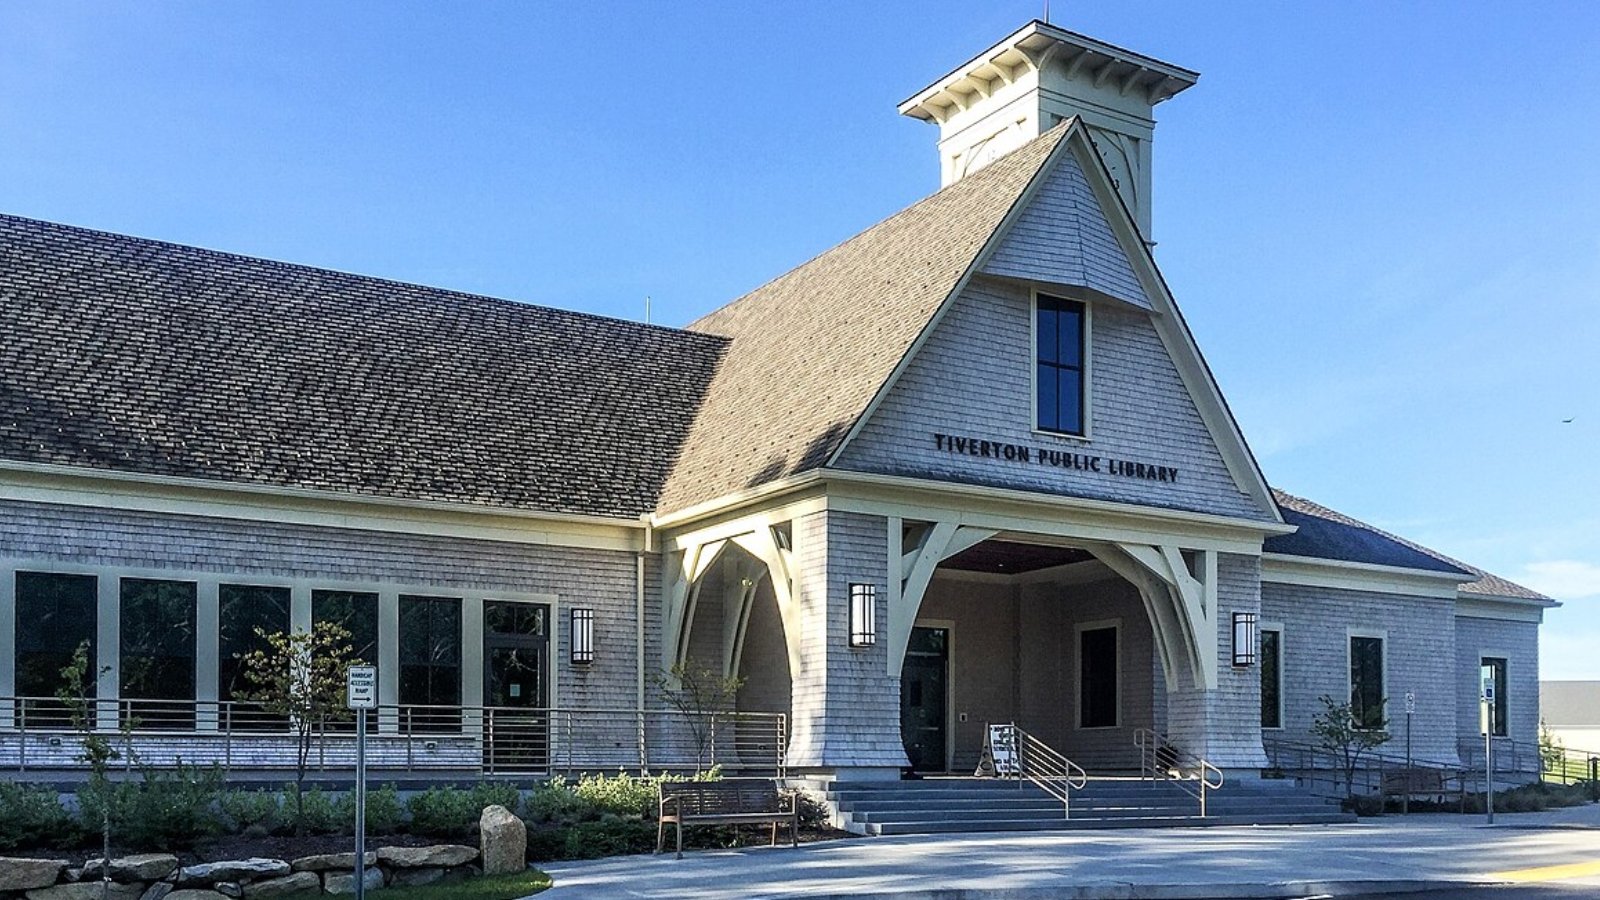
Tiverton sits along the Sakonnet River in eastern Rhode Island, offering ocean breezes, quaint New England homes, and increasing development interest. The area has grown more popular among second-home buyers and year-round residents alike, thanks in part to its scenic waterfront and access to nearby Massachusetts job markets.
Major projects like Tiverton Casino Hotel have added regional visibility, while Four Corners and Weetamoo Woods provide rustic charm and outdoor attractions. For buyers seeking a mix of nature, coastal proximity, and small-town community, Tiverton continues to rise as a high-demand market.
19. Scituate – 78.2% Home Price Increase Since 2010
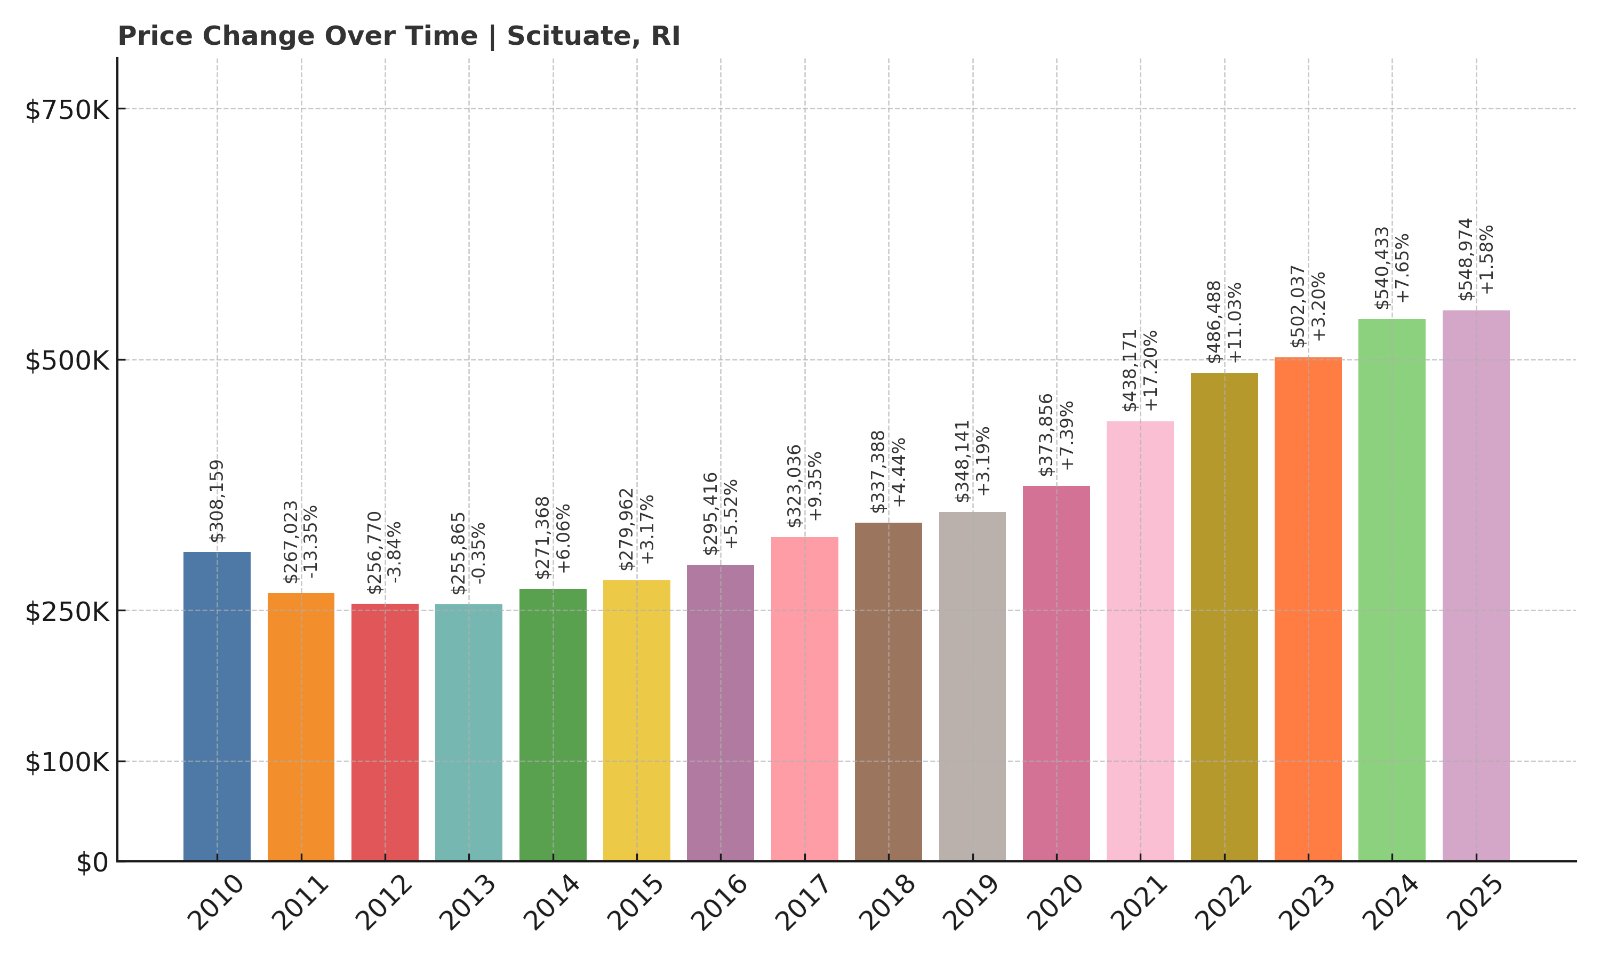
- 2010: $308,159
- 2011: $267,023 (-$41,136, -13.35% from previous year)
- 2012: $256,770 (-$10,253, -3.84% from previous year)
- 2013: $255,865 (-$905, -0.35% from previous year)
- 2014: $271,368 (+$15,503, +6.06% from previous year)
- 2015: $279,962 (+$8,594, +3.17% from previous year)
- 2016: $295,416 (+$15,454, +5.52% from previous year)
- 2017: $323,036 (+$27,620, +9.35% from previous year)
- 2018: $337,388 (+$14,352, +4.44% from previous year)
- 2019: $348,141 (+$10,753, +3.19% from previous year)
- 2020: $373,856 (+$25,715, +7.39% from previous year)
- 2021: $438,171 (+$64,315, +17.20% from previous year)
- 2022: $486,488 (+$48,317, +11.03% from previous year)
- 2023: $502,037 (+$15,549, +3.20% from previous year)
- 2024: $540,433 (+$38,396, +7.65% from previous year)
- 2025: $548,974 (+$8,541, +1.58% from previous year)
Scituate’s home prices are up 78.2% since 2010, reaching just under $549K in 2025. The market was flat in the early part of the decade, but surged from 2016 onward — with especially strong growth from 2020 to 2022. More modest gains in 2023 and 2025 reflect a maturing market.
Scituate – Reservoir Views and Expanding Appeal
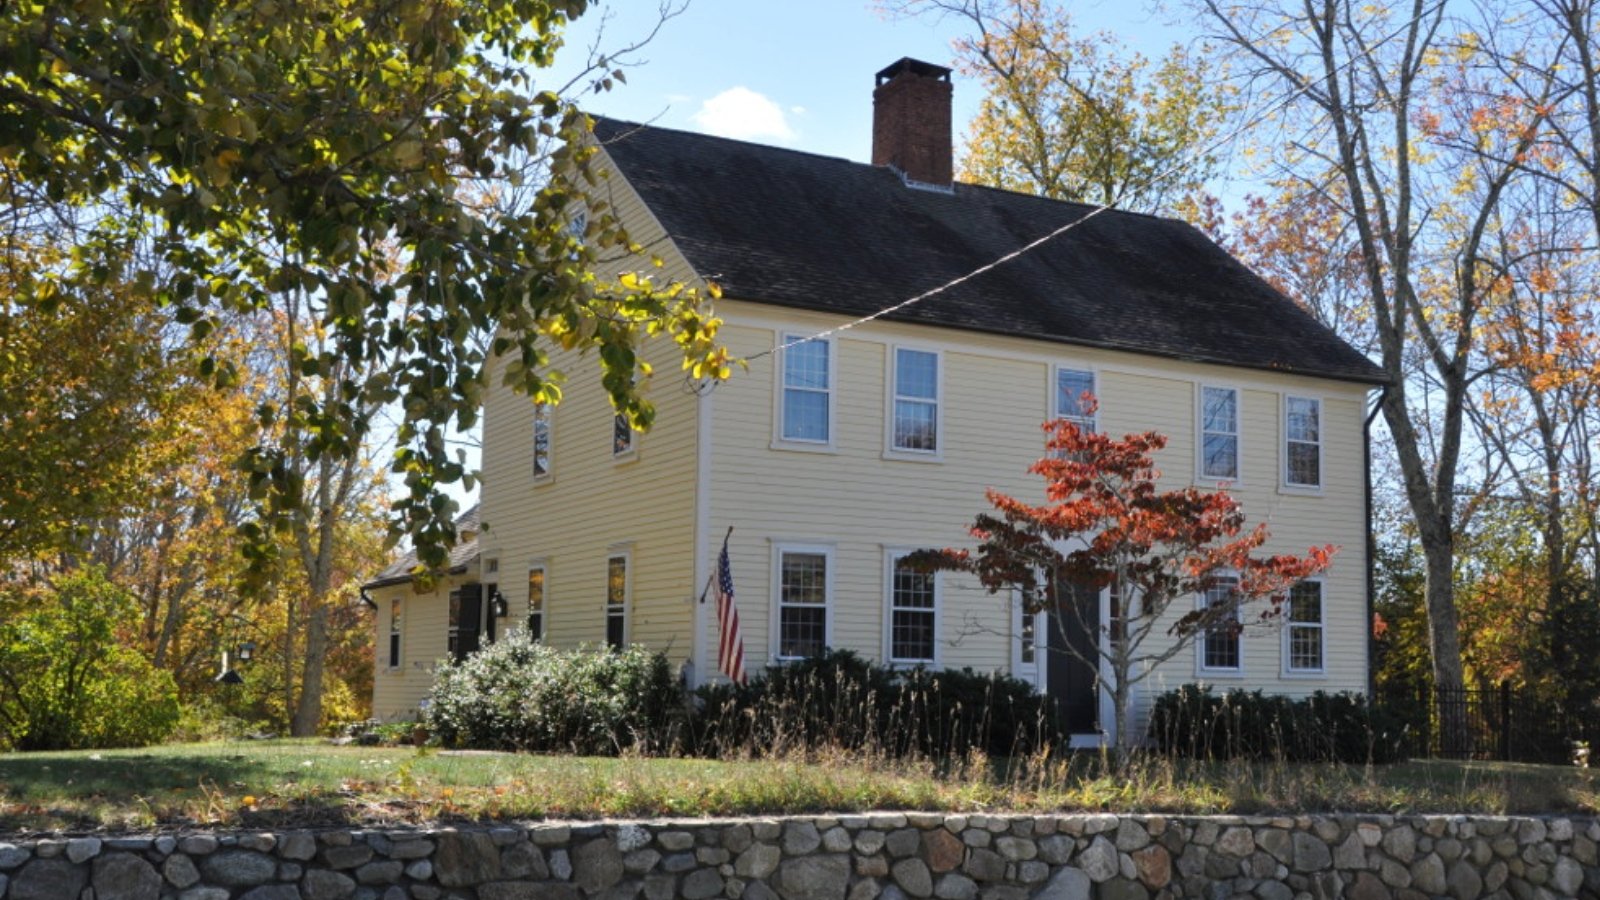
Home to the Scituate Reservoir, the largest freshwater body in Rhode Island, this town is rich in rural scenery and natural resources. Though traditionally quiet, Scituate has seen increased buyer interest for its charm, large lots, and escape-from-the-city feel — all while being within driving distance of Providence.
Development remains modest, helping preserve open space and contributing to the town’s exclusivity. For those seeking privacy, nature, and historic New England character, Scituate’s growing home values reflect its status as a desirable, low-density alternative to coastal markets.
18. Lincoln – 86.5% Home Price Increase Since 2010
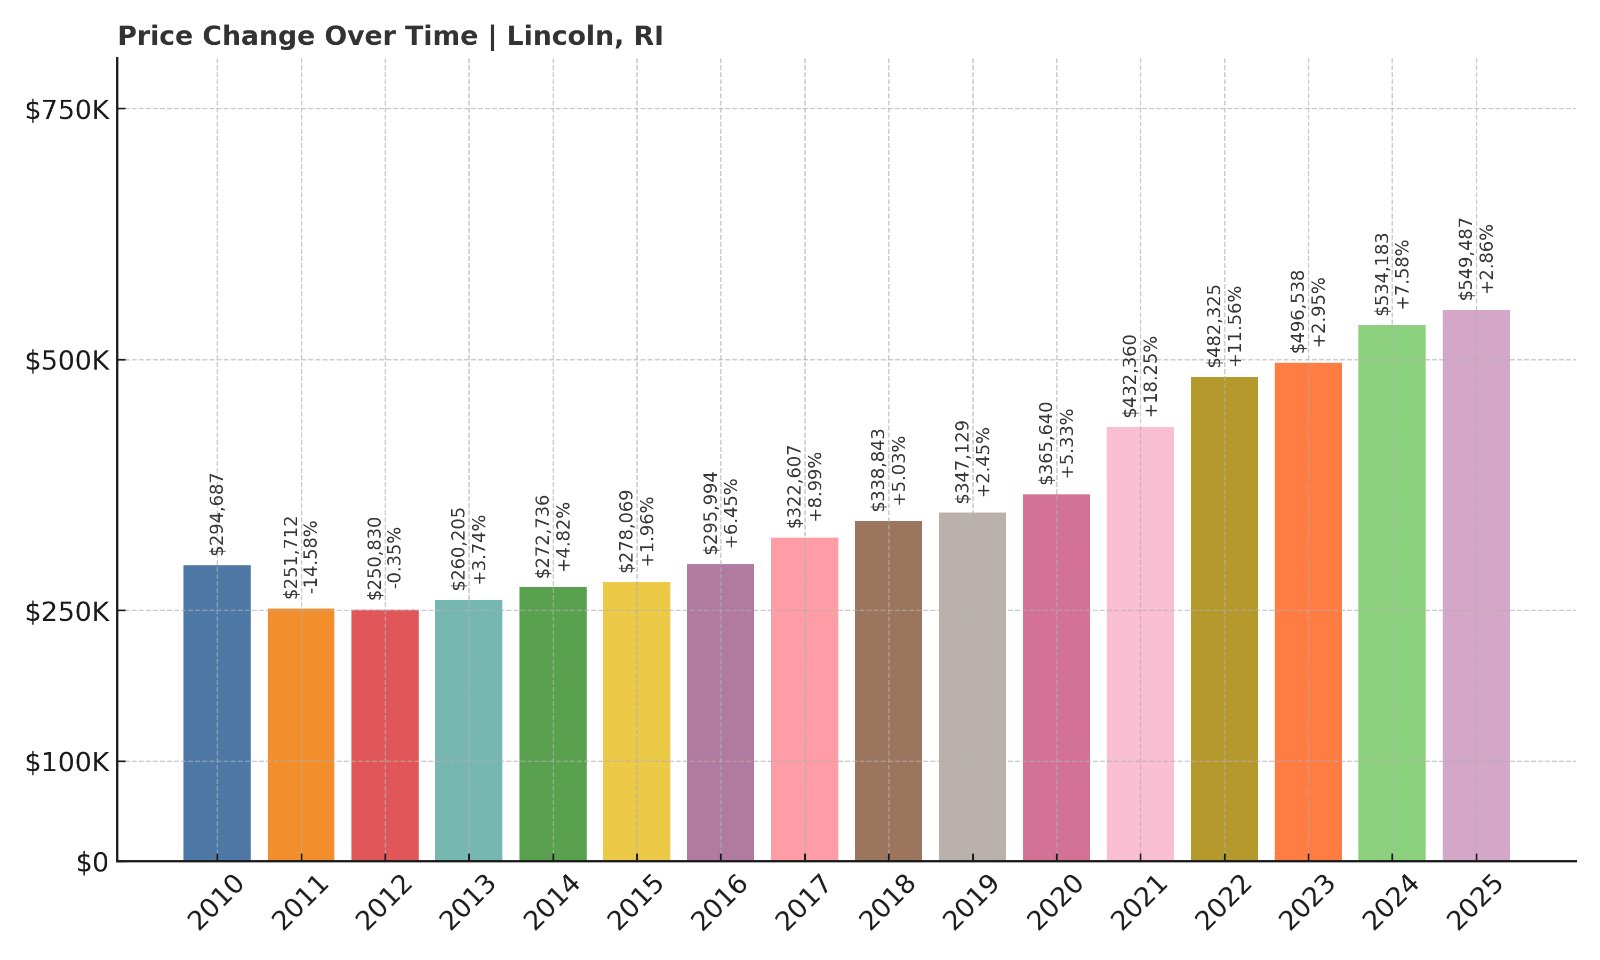
- 2010: $294,687
- 2011: $251,712 (-$42,975, -14.58% from previous year)
- 2012: $250,830 (-$882, -0.35% from previous year)
- 2013: $260,205 (+$9,375, +3.74% from previous year)
- 2014: $272,736 (+$12,531, +4.82% from previous year)
- 2015: $278,069 (+$5,333, +1.96% from previous year)
- 2016: $295,994 (+$17,925, +6.45% from previous year)
- 2017: $322,607 (+$26,613, +8.99% from previous year)
- 2018: $338,843 (+$16,236, +5.03% from previous year)
- 2019: $347,129 (+$8,286, +2.45% from previous year)
- 2020: $365,640 (+$18,511, +5.33% from previous year)
- 2021: $432,360 (+$66,720, +18.25% from previous year)
- 2022: $482,325 (+$49,965, +11.56% from previous year)
- 2023: $496,538 (+$14,213, +2.95% from previous year)
- 2024: $534,183 (+$37,645, +7.58% from previous year)
- 2025: $549,487 (+$15,304, +2.86% from previous year)
Home prices in Lincoln have climbed 86.5% since 2010, with the average value reaching nearly $550K in 2025. While the early part of the decade saw some fluctuation, the housing market has posted consistent gains since 2016 — peaking during the 2021 and 2022 boom years.
Lincoln – Parks, Access, and Steady Demand
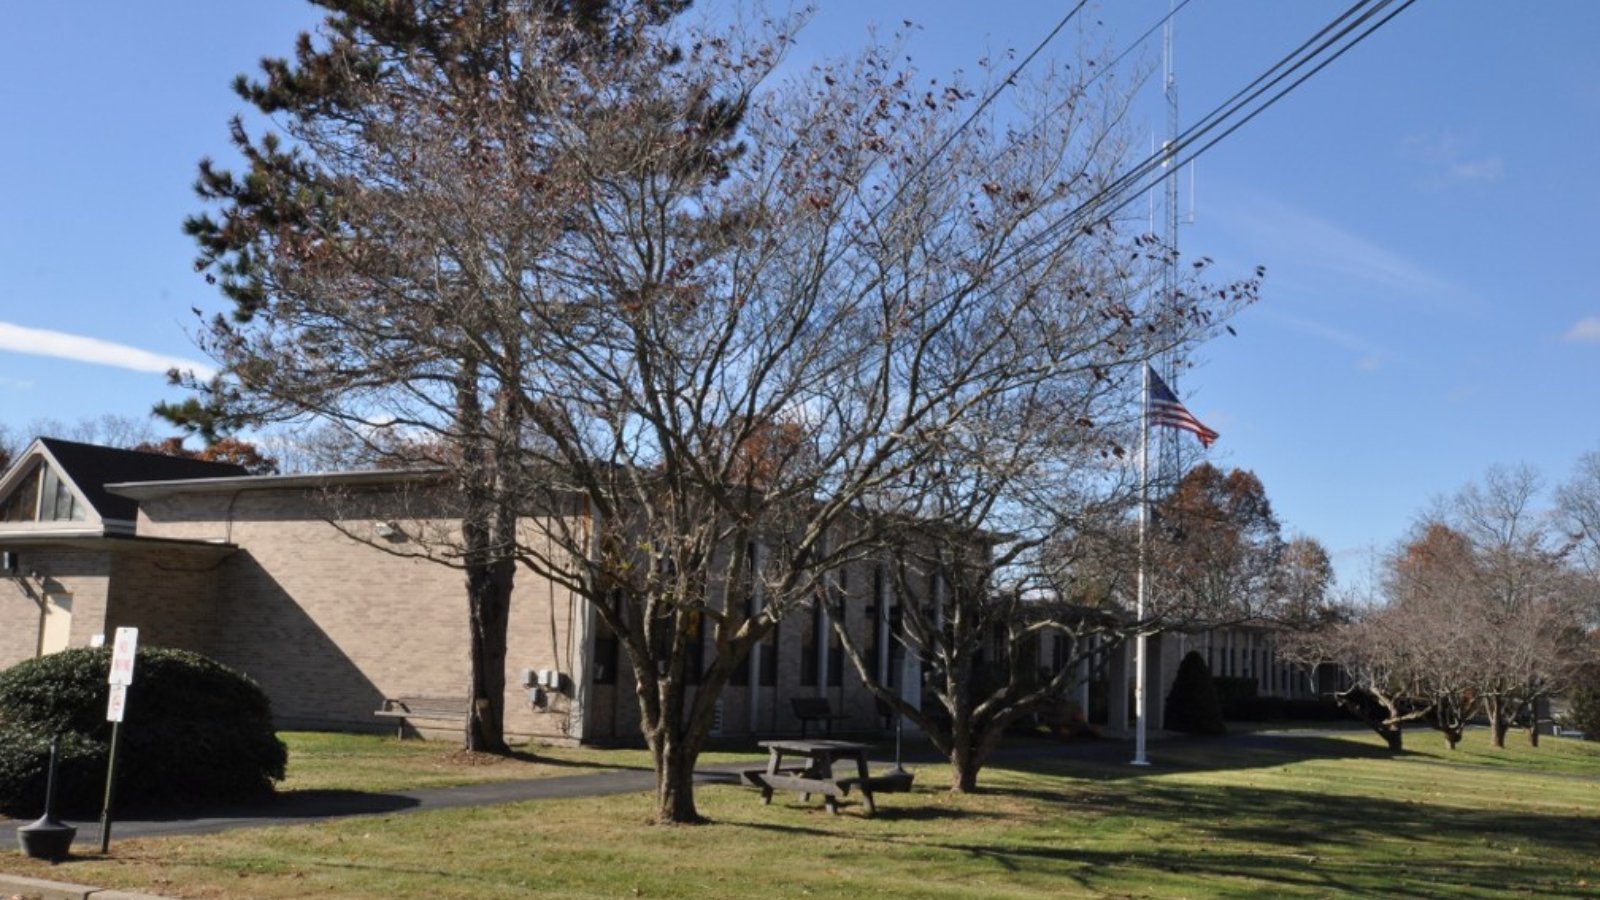
Lincoln is known for its blend of open space and convenience. Lincoln Woods State Park offers residents year-round outdoor activities, while easy access to I-295 and Route 146 make commuting to Providence or Worcester simple. With shopping centers, public golf courses, and a growing local economy, it’s become a balanced destination for homebuyers.
The town’s public schools, safe neighborhoods, and mix of housing styles contribute to its long-term growth in property values. With its 2025 prices nearing the $550K mark, Lincoln is a consistent performer among Rhode Island’s mid-to-upper tier towns.
17. Foster – 120.8% Home Price Increase Since 2010
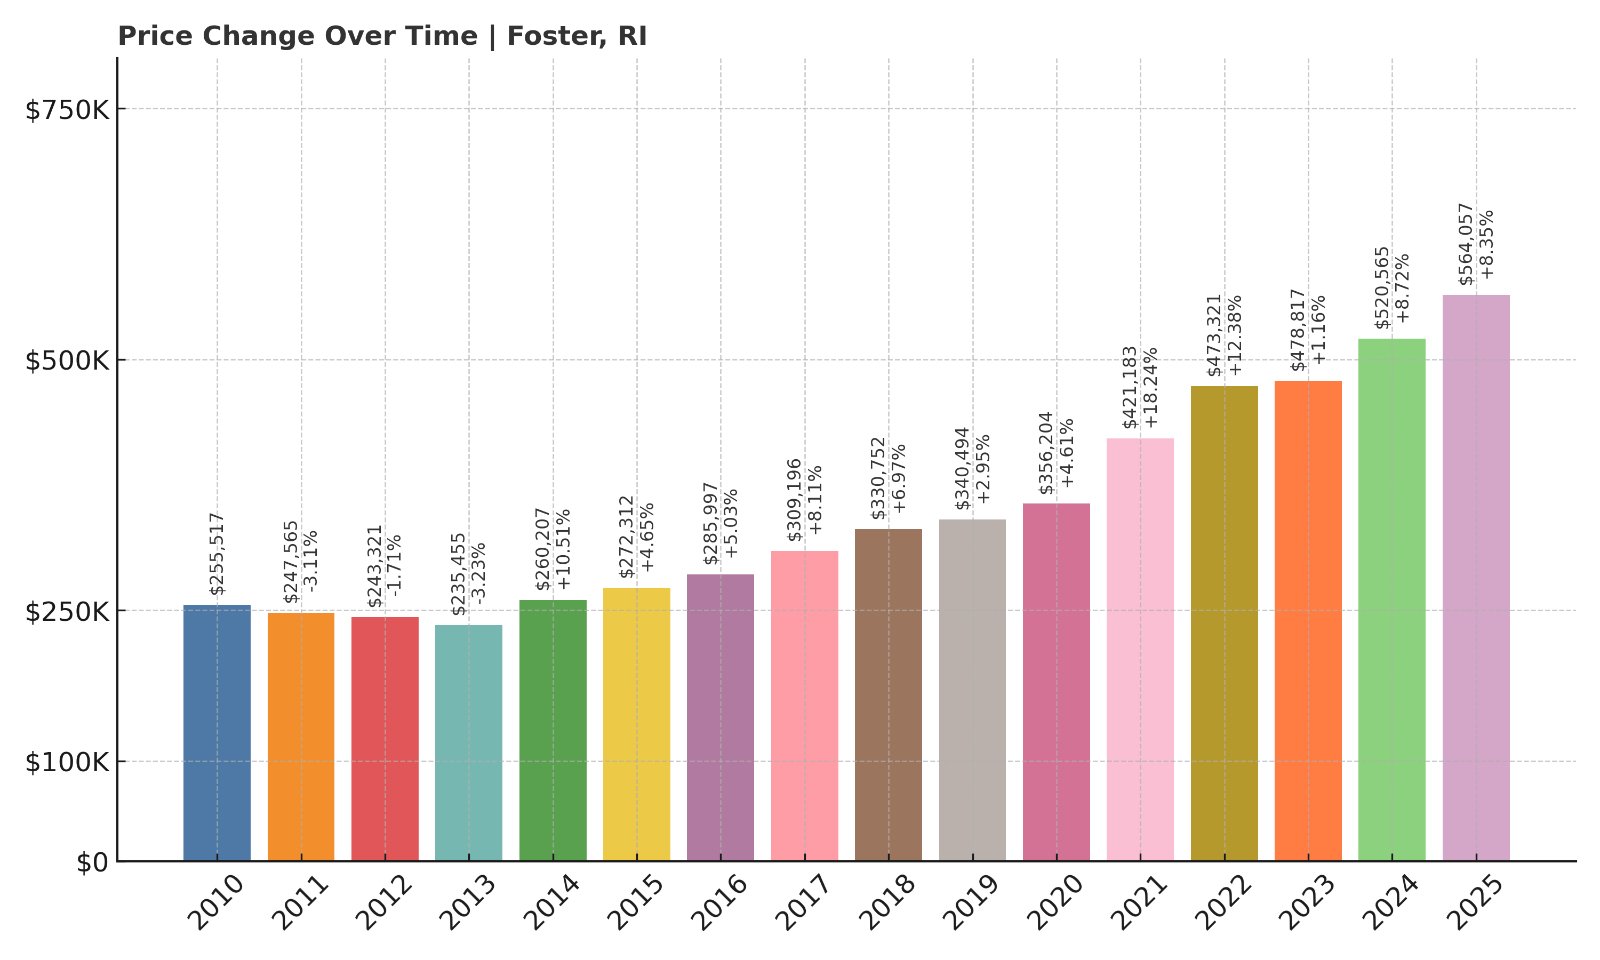
- 2010: $255,517
- 2011: $247,565 (-$7,952, -3.11% from previous year)
- 2012: $243,321 (-$4,244, -1.71% from previous year)
- 2013: $235,455 (-$7,866, -3.23% from previous year)
- 2014: $260,207 (+$24,752, +10.51% from previous year)
- 2015: $272,312 (+$12,105, +4.65% from previous year)
- 2016: $285,997 (+$13,685, +5.03% from previous year)
- 2017: $309,196 (+$23,199, +8.11% from previous year)
- 2018: $330,752 (+$21,556, +6.97% from previous year)
- 2019: $340,494 (+$9,742, +2.95% from previous year)
- 2020: $356,204 (+$15,710, +4.61% from previous year)
- 2021: $421,183 (+$64,979, +18.24% from previous year)
- 2022: $473,321 (+$52,138, +12.38% from previous year)
- 2023: $478,817 (+$5,496, +1.16% from previous year)
- 2024: $520,565 (+$41,748, +8.72% from previous year)
- 2025: $564,057 (+$43,492, +8.35% from previous year)
Foster has seen a substantial 120.8% increase in home values since 2010, with prices rising from around $255K to over $564K in 2025. The market showed strong, consistent growth across the past decade, capped by large gains in 2024 and 2025 that pushed it further up the ranking.
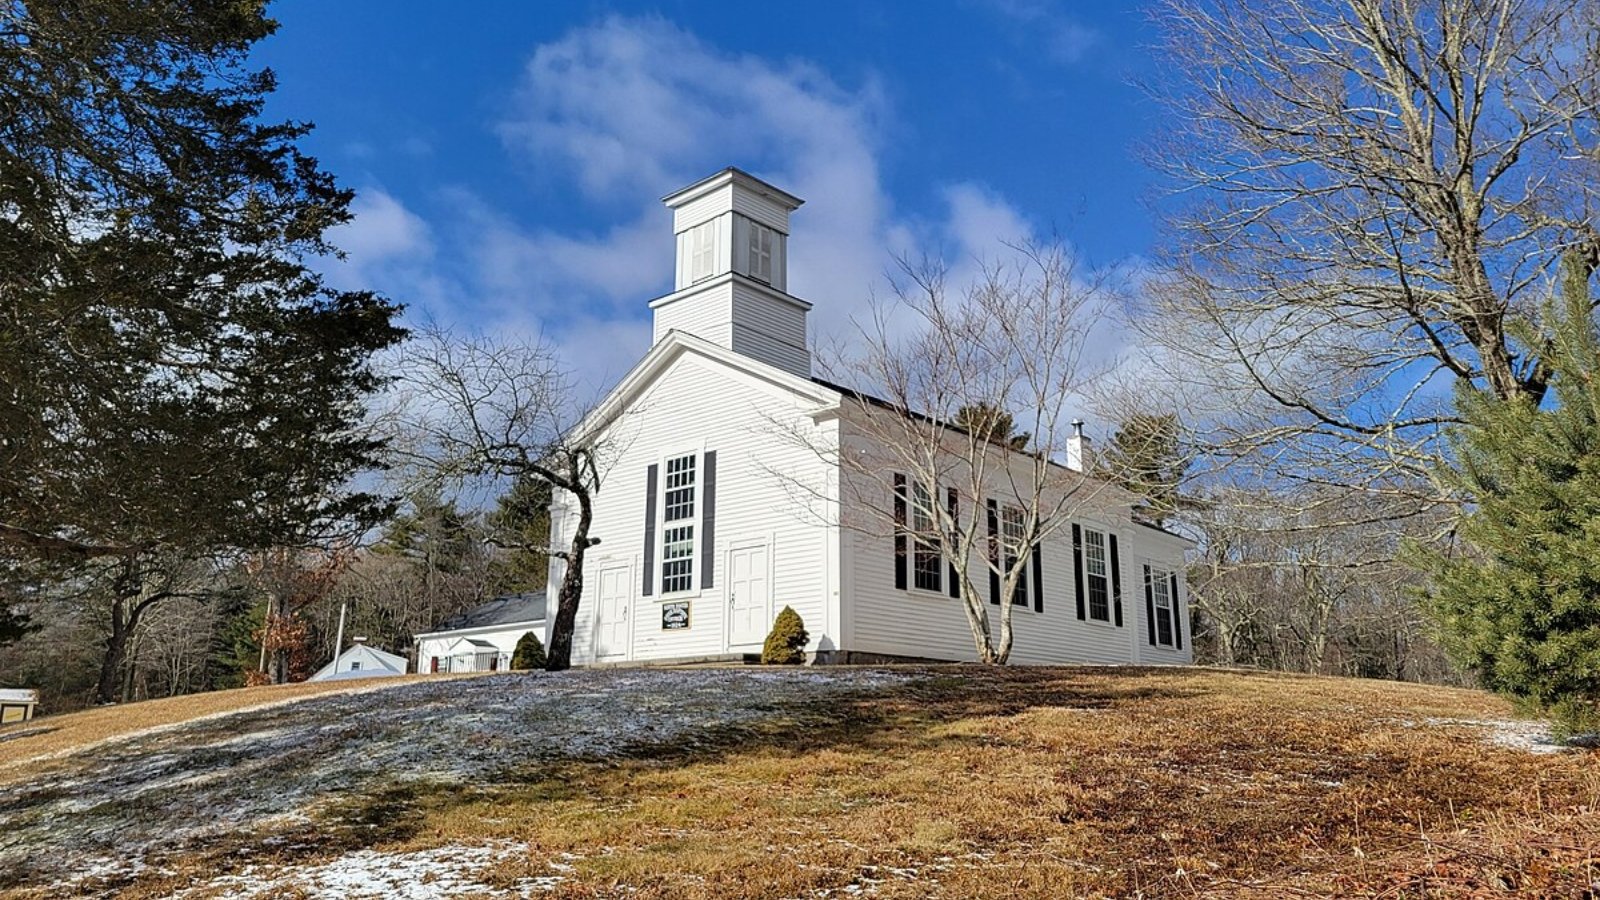
Foster – A Rural Retreat with High Demand
🔥 Would you like to save this?
Located in the far western part of Rhode Island, Foster is one of the most rural towns in the state. Its appeal lies in its quiet roads, large wooded lots, and privacy. As work-from-home culture has taken hold, many buyers have chosen Foster for its space and value compared to more urbanized areas.
Despite its low population density and distance from coastal hubs, Foster’s rising prices highlight strong interest from buyers seeking a country lifestyle. Its 2025 average price of over $560K underscores how dramatically demand for rural living has reshaped the Rhode Island housing market.
16. West Greenwich – 114.8% Home Price Increase Since 2010
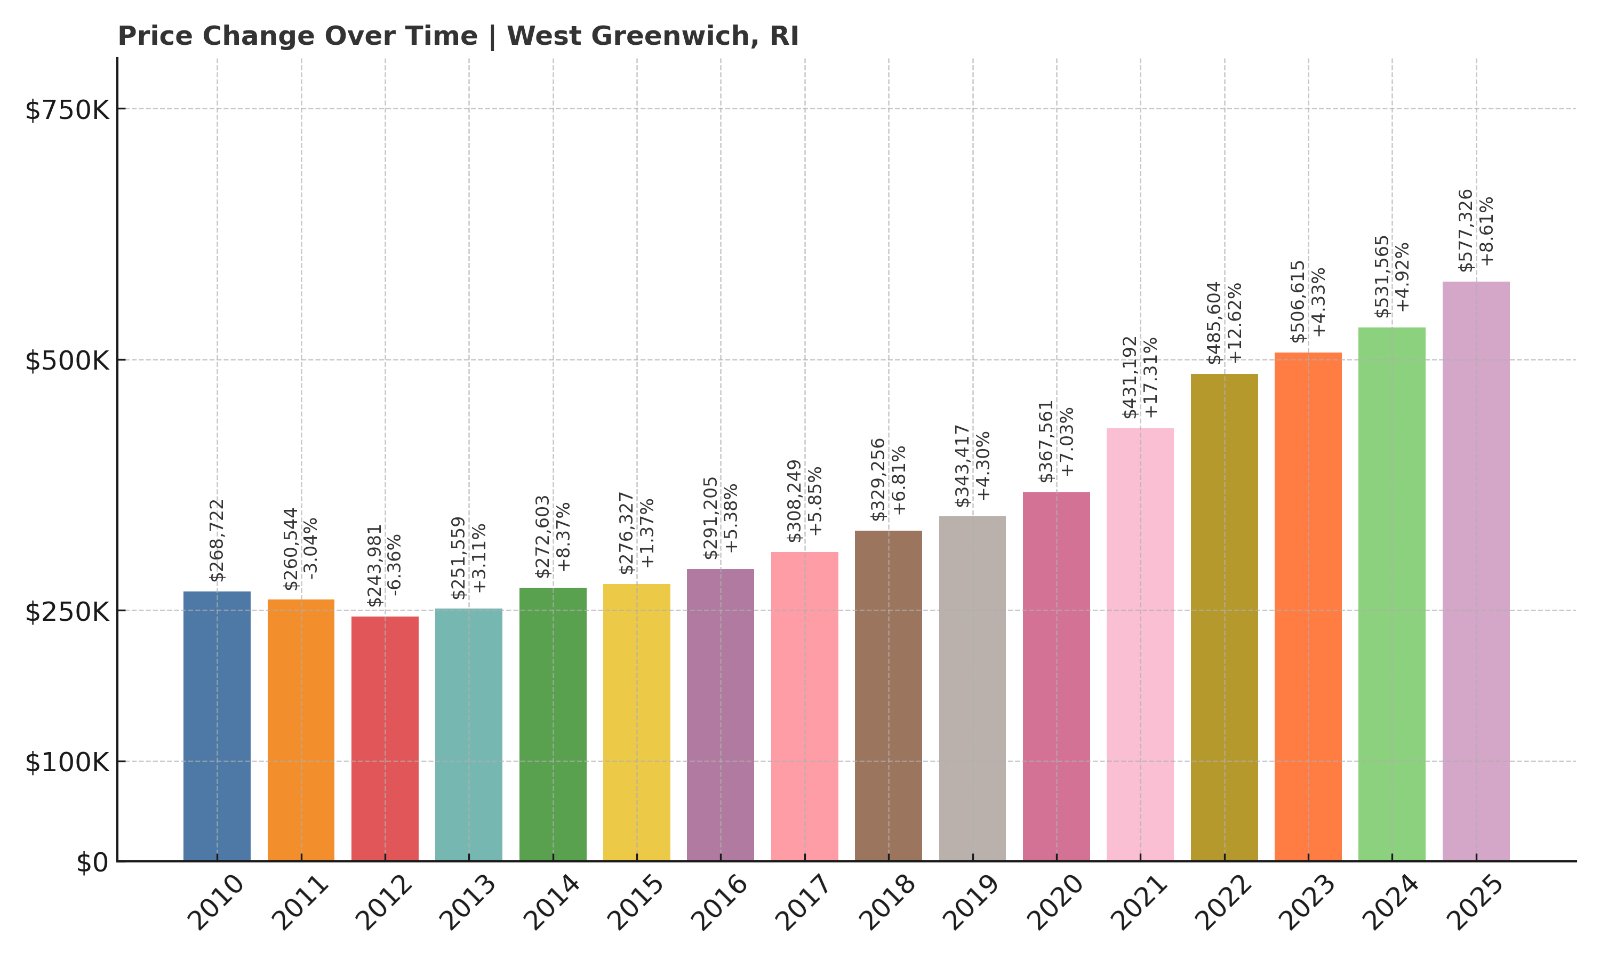
- 2010: $268,722
- 2011: $260,544 (-$8,178, -3.04% from previous year)
- 2012: $243,981 (-$16,563, -6.36% from previous year)
- 2013: $251,559 (+$7,578, +3.11% from previous year)
- 2014: $272,603 (+$21,044, +8.37% from previous year)
- 2015: $276,327 (+$3,724, +1.37% from previous year)
- 2016: $291,205 (+$14,878, +5.38% from previous year)
- 2017: $308,249 (+$17,044, +5.85% from previous year)
- 2018: $329,256 (+$21,007, +6.81% from previous year)
- 2019: $343,417 (+$14,161, +4.30% from previous year)
- 2020: $367,561 (+$24,144, +7.03% from previous year)
- 2021: $431,192 (+$63,631, +17.31% from previous year)
- 2022: $485,604 (+$54,412, +12.62% from previous year)
- 2023: $506,615 (+$21,011, +4.33% from previous year)
- 2024: $531,565 (+$24,950, +4.92% from previous year)
- 2025: $577,326 (+$45,761, +8.61% from previous year)
Home prices in West Greenwich have increased 114.8% since 2010, reaching over $577K in 2025. After early declines, the market began accelerating around 2014, with double-digit growth peaking during the 2020–2022 boom. The most recent year alone saw an 8.6% gain, signaling the town’s continued momentum.
West Greenwich – High Value and Expanding Interest
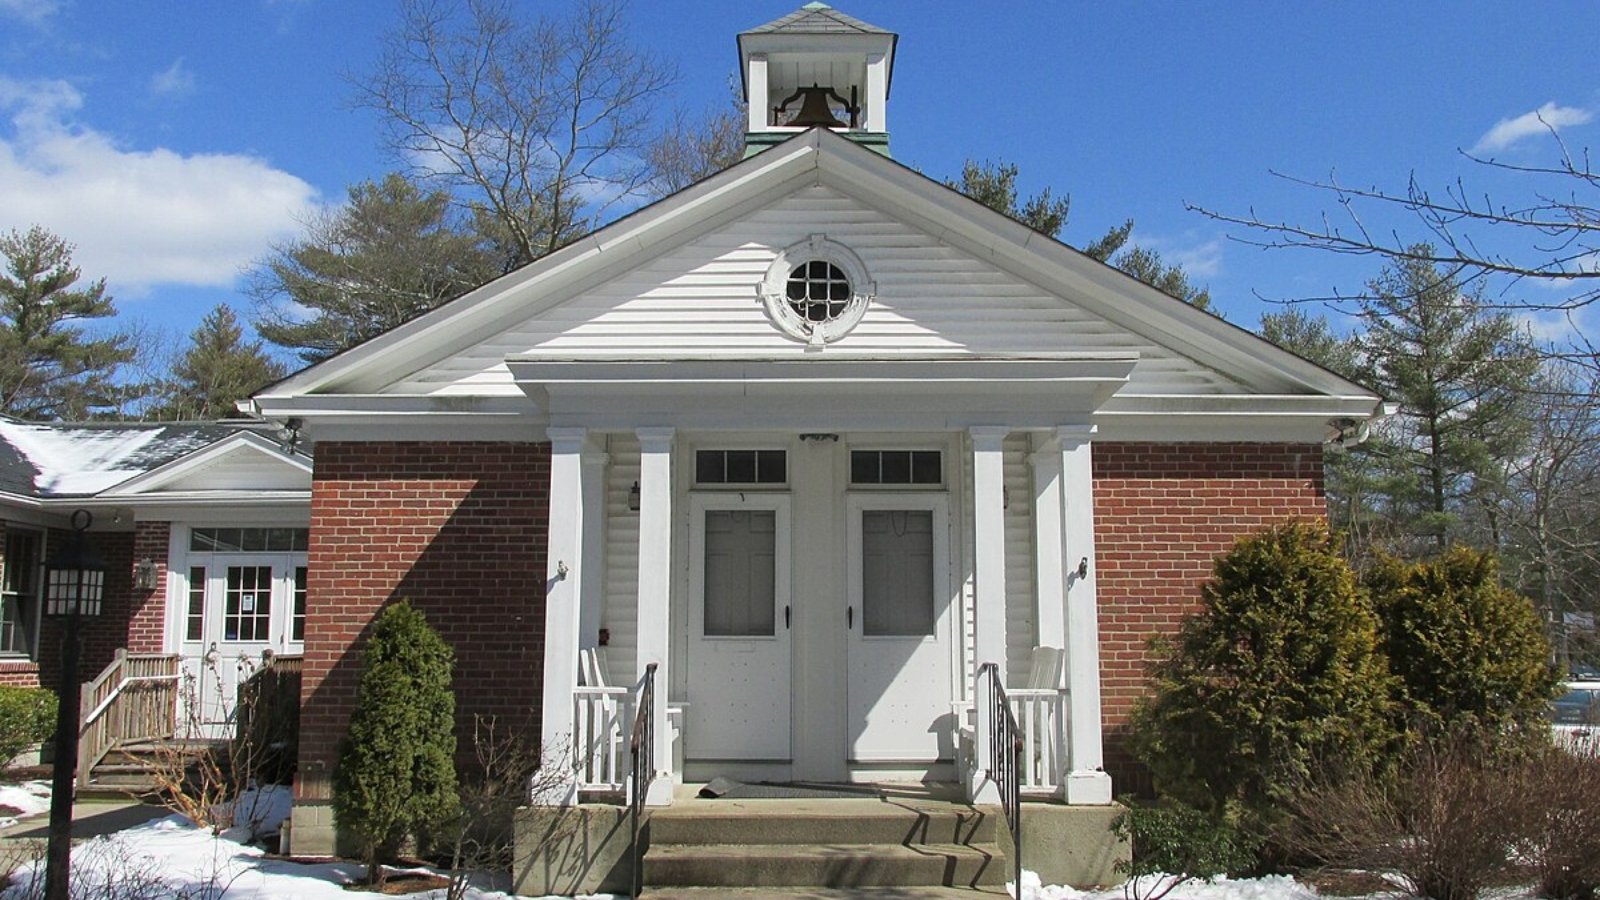
West Greenwich is a spacious, low-density community located off I-95 in western Rhode Island. Its access to both Connecticut and Providence job markets — combined with a reputation for good schools and quiet neighborhoods — has made it increasingly attractive to buyers seeking space without sacrificing convenience.
Once considered a rural outpost, West Greenwich now offers a blend of newer developments, access to Arcadia Management Area, and a rising profile among buyers priced out of the state’s coastal and urban areas. It’s one of the fastest-rising towns in terms of absolute home value.
15. Bristol – 127.9% Home Price Increase Since 2010
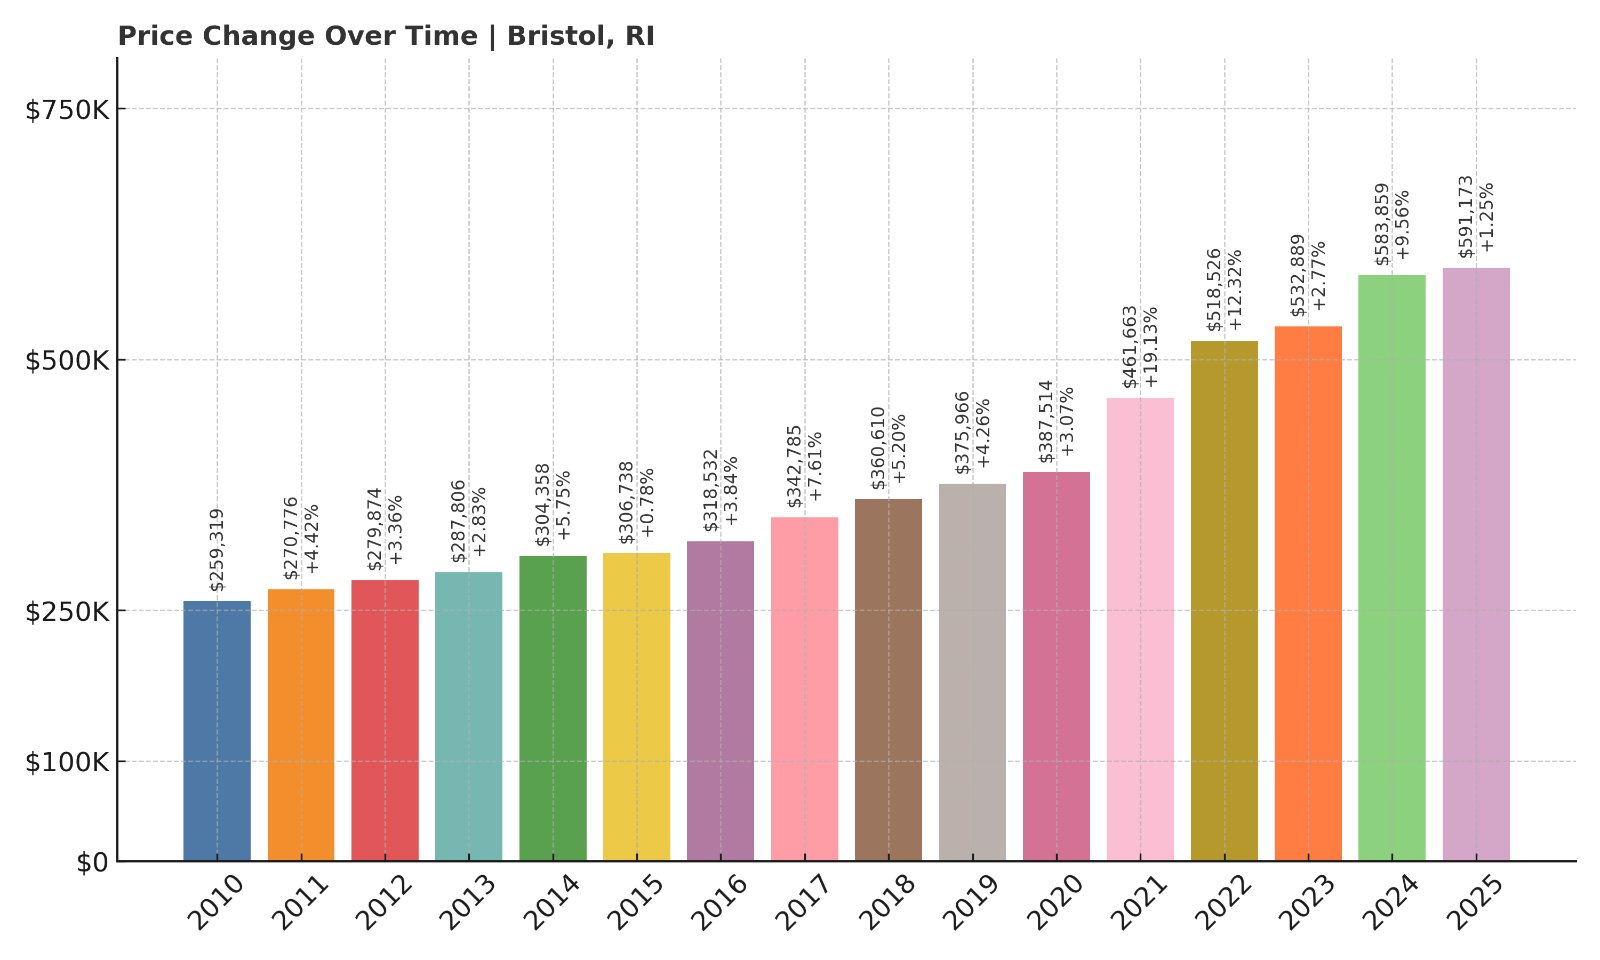
- 2010: $259,319
- 2011: $270,776 (+$11,457, +4.42% from previous year)
- 2012: $279,874 (+$9,098, +3.36% from previous year)
- 2013: $287,806 (+$7,932, +2.83% from previous year)
- 2014: $304,358 (+$16,552, +5.75% from previous year)
- 2015: $306,738 (+$2,380, +0.78% from previous year)
- 2016: $318,532 (+$11,794, +3.84% from previous year)
- 2017: $342,785 (+$24,253, +7.61% from previous year)
- 2018: $360,610 (+$17,825, +5.20% from previous year)
- 2019: $375,966 (+$15,356, +4.26% from previous year)
- 2020: $387,514 (+$11,548, +3.07% from previous year)
- 2021: $461,663 (+$74,149, +19.13% from previous year)
- 2022: $518,526 (+$56,863, +12.32% from previous year)
- 2023: $532,889 (+$14,363, +2.77% from previous year)
- 2024: $583,859 (+$50,970, +9.56% from previous year)
- 2025: $591,173 (+$7,314, +1.25% from previous year)
From just over $259K in 2010 to more than $591K in 2025, Bristol’s home prices have grown 127.9%. Much of that increase came after 2016, with massive gains during 2021 and a solid boost in 2024. While the pace has slowed, values remain strong heading into 2025.
Bristol – Coastal Charm and Year-Round Appeal
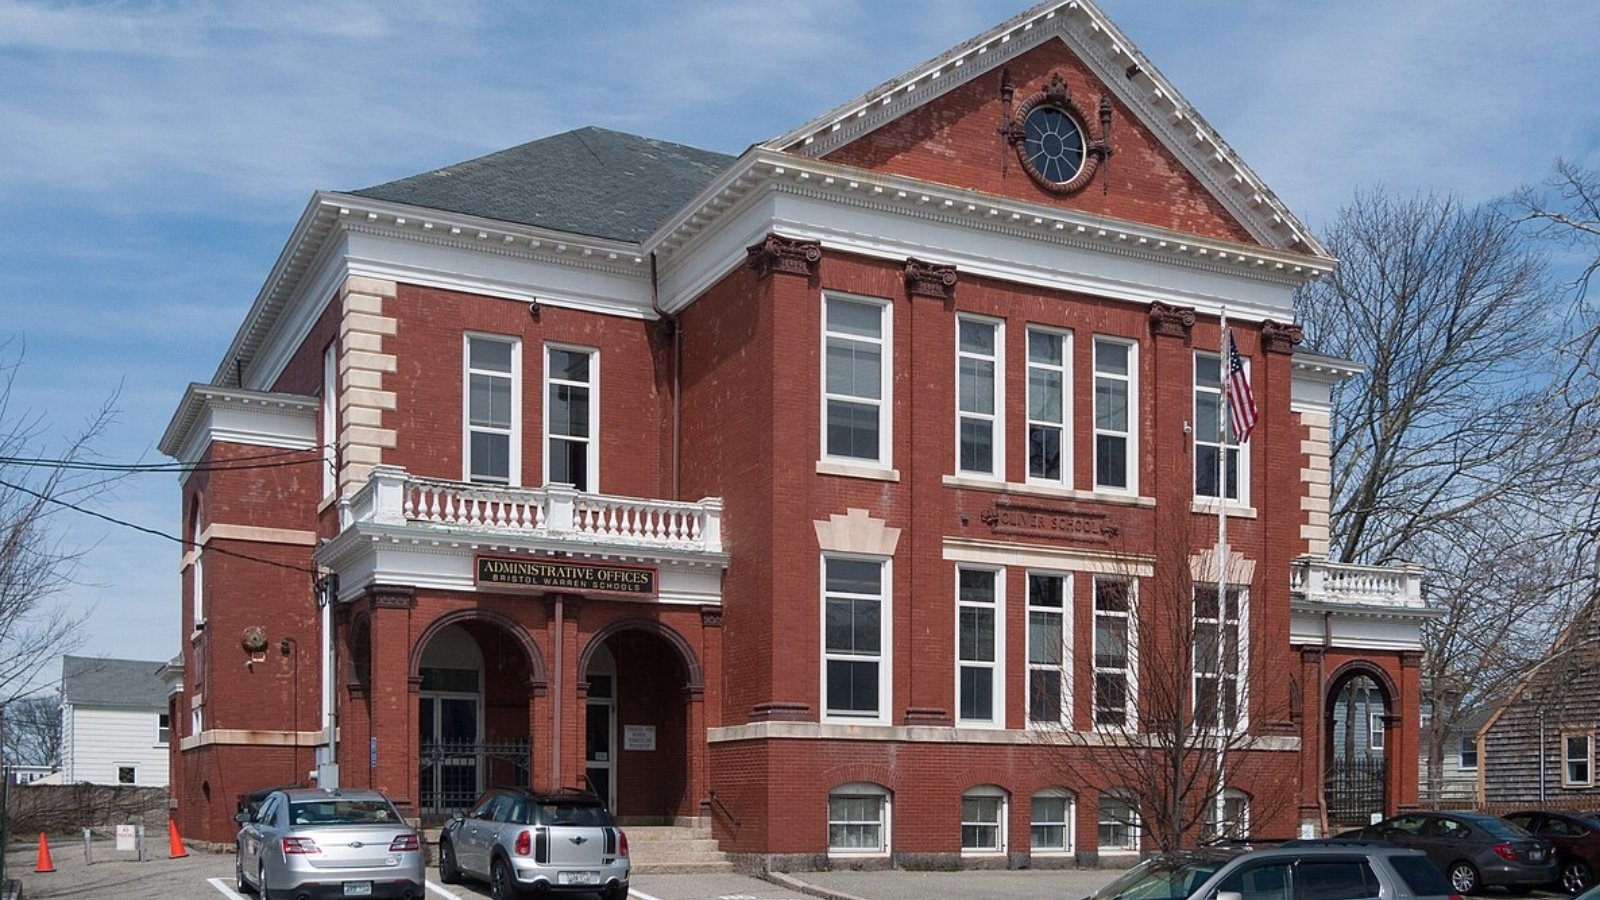
Bristol is a waterfront town on Narragansett Bay known for its historic downtown, harborside parks, and the nation’s oldest Fourth of July celebration. A blend of colonial architecture, walkable neighborhoods, and sweeping bay views continues to draw buyers from across Rhode Island and southern Massachusetts.
The town’s tight inventory, walkability, and easy access to both Providence and Newport County make it one of the state’s most sought-after markets. With prices topping $590K, Bristol continues to climb in both prestige and popularity.
14. Westerly – 94.7% Home Price Increase Since 2010
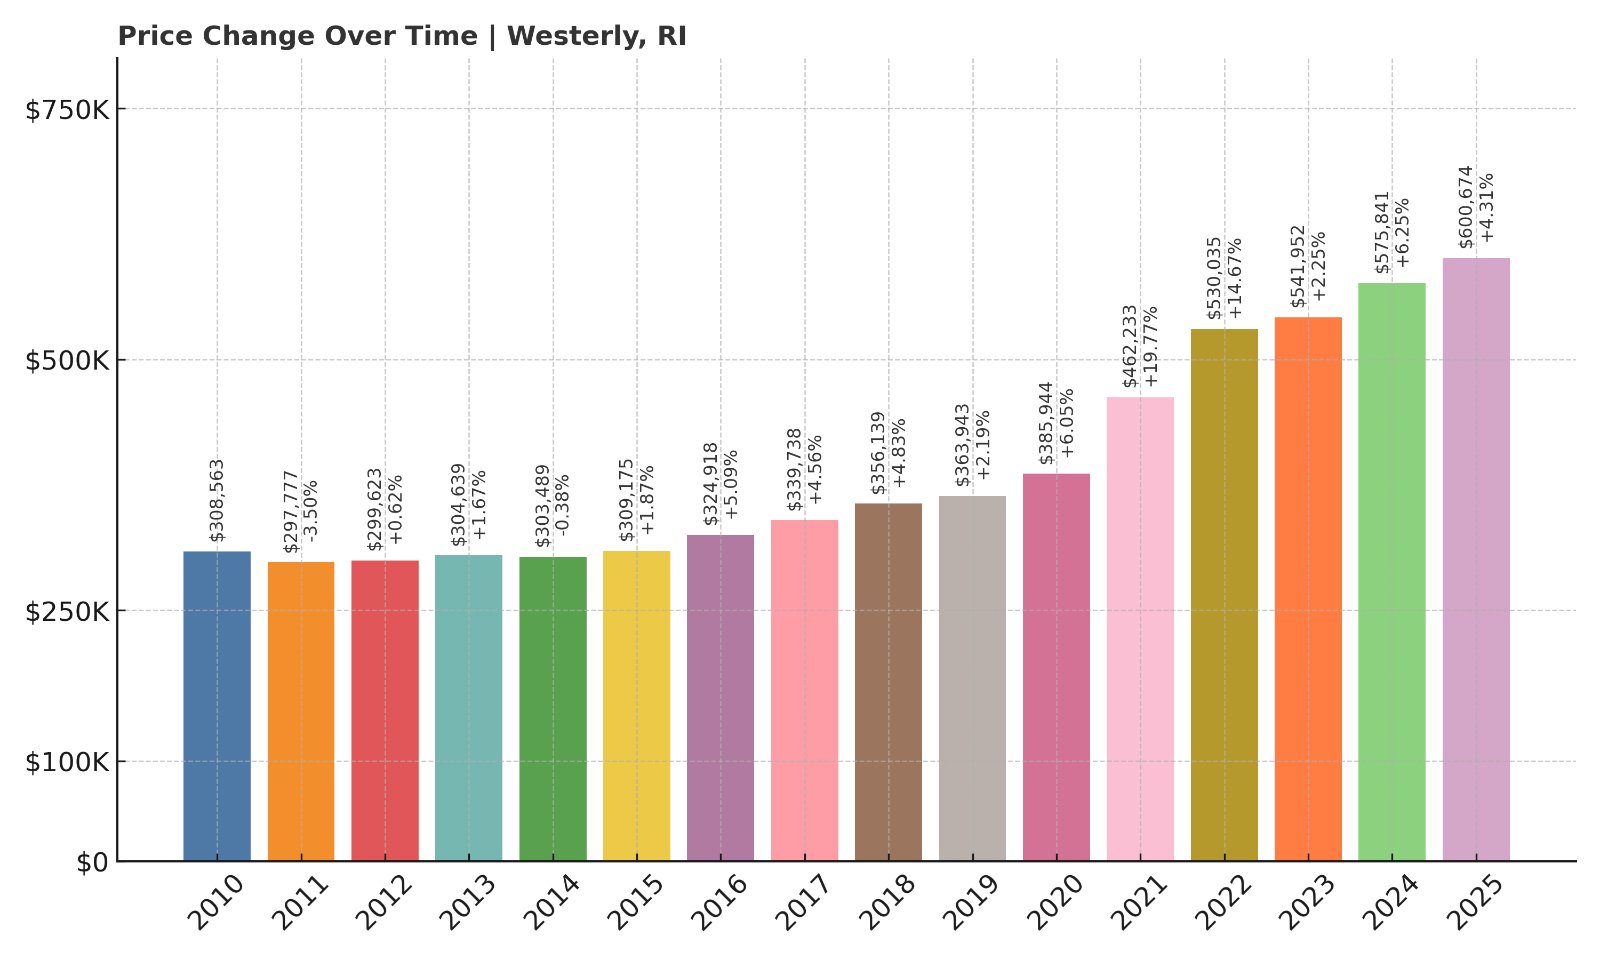
- 2010: $308,563
- 2011: $297,777 (-$10,786, -3.50% from previous year)
- 2012: $299,623 (+$1,846, +0.62% from previous year)
- 2013: $304,639 (+$5,016, +1.67% from previous year)
- 2014: $303,489 (-$1,150, -0.38% from previous year)
- 2015: $309,175 (+$5,686, +1.87% from previous year)
- 2016: $324,918 (+$15,743, +5.09% from previous year)
- 2017: $339,738 (+$14,820, +4.56% from previous year)
- 2018: $356,139 (+$16,401, +4.83% from previous year)
- 2019: $363,943 (+$7,804, +2.19% from previous year)
- 2020: $385,944 (+$22,001, +6.05% from previous year)
- 2021: $462,233 (+$76,289, +19.77% from previous year)
- 2022: $530,035 (+$67,802, +14.67% from previous year)
- 2023: $541,952 (+$11,917, +2.25% from previous year)
- 2024: $575,841 (+$33,889, +6.25% from previous year)
- 2025: $600,674 (+$24,833, +4.31% from previous year)
Westerly’s housing market has grown by 94.7% since 2010. A key turning point came in 2021, when prices jumped nearly 20% in a single year. Now topping $600K in 2025, the town has firmly established itself among Rhode Island’s elite coastal markets.
Westerly – Beaches, Culture, and Long-Term Value
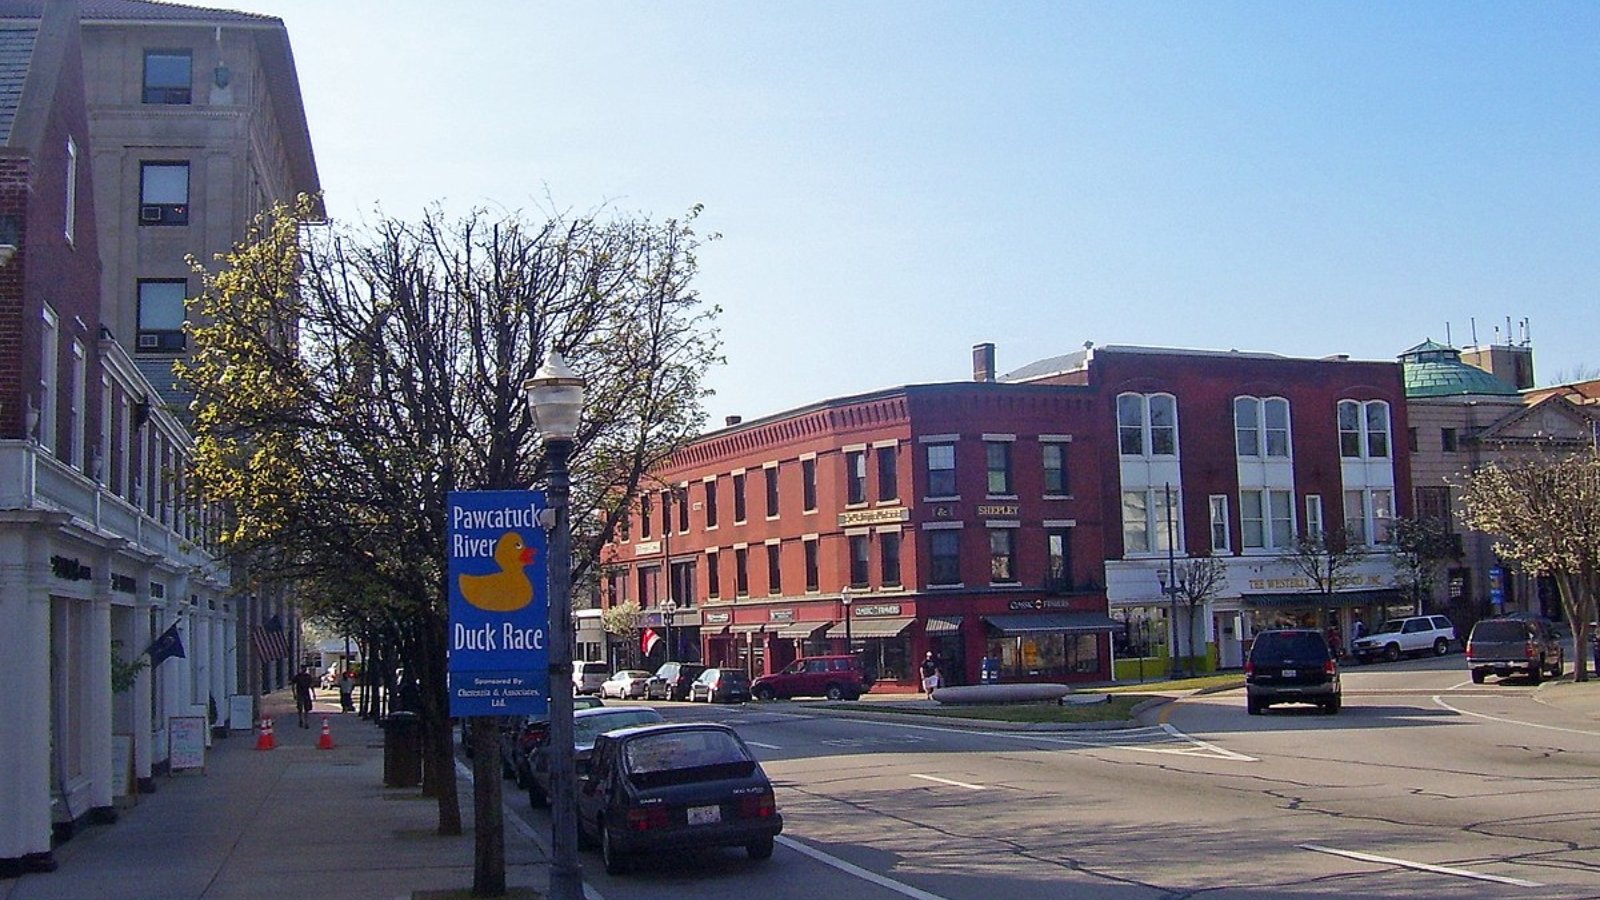
Westerly is home to Watch Hill, Misquamicut Beach, and a growing collection of cultural institutions and events. Its beachfront properties and historic downtown draw buyers seeking luxury second homes, retirees, and full-time residents who value coastal living and privacy.
Though early growth was moderate, Westerly’s recent gains reflect its evolution into a high-demand market, bolstered by strong tourism, seasonal appeal, and continued interest in Rhode Island’s southern shoreline. With limited buildable land, values are expected to remain high.
13. Exeter – 125.1% Home Price Increase Since 2010
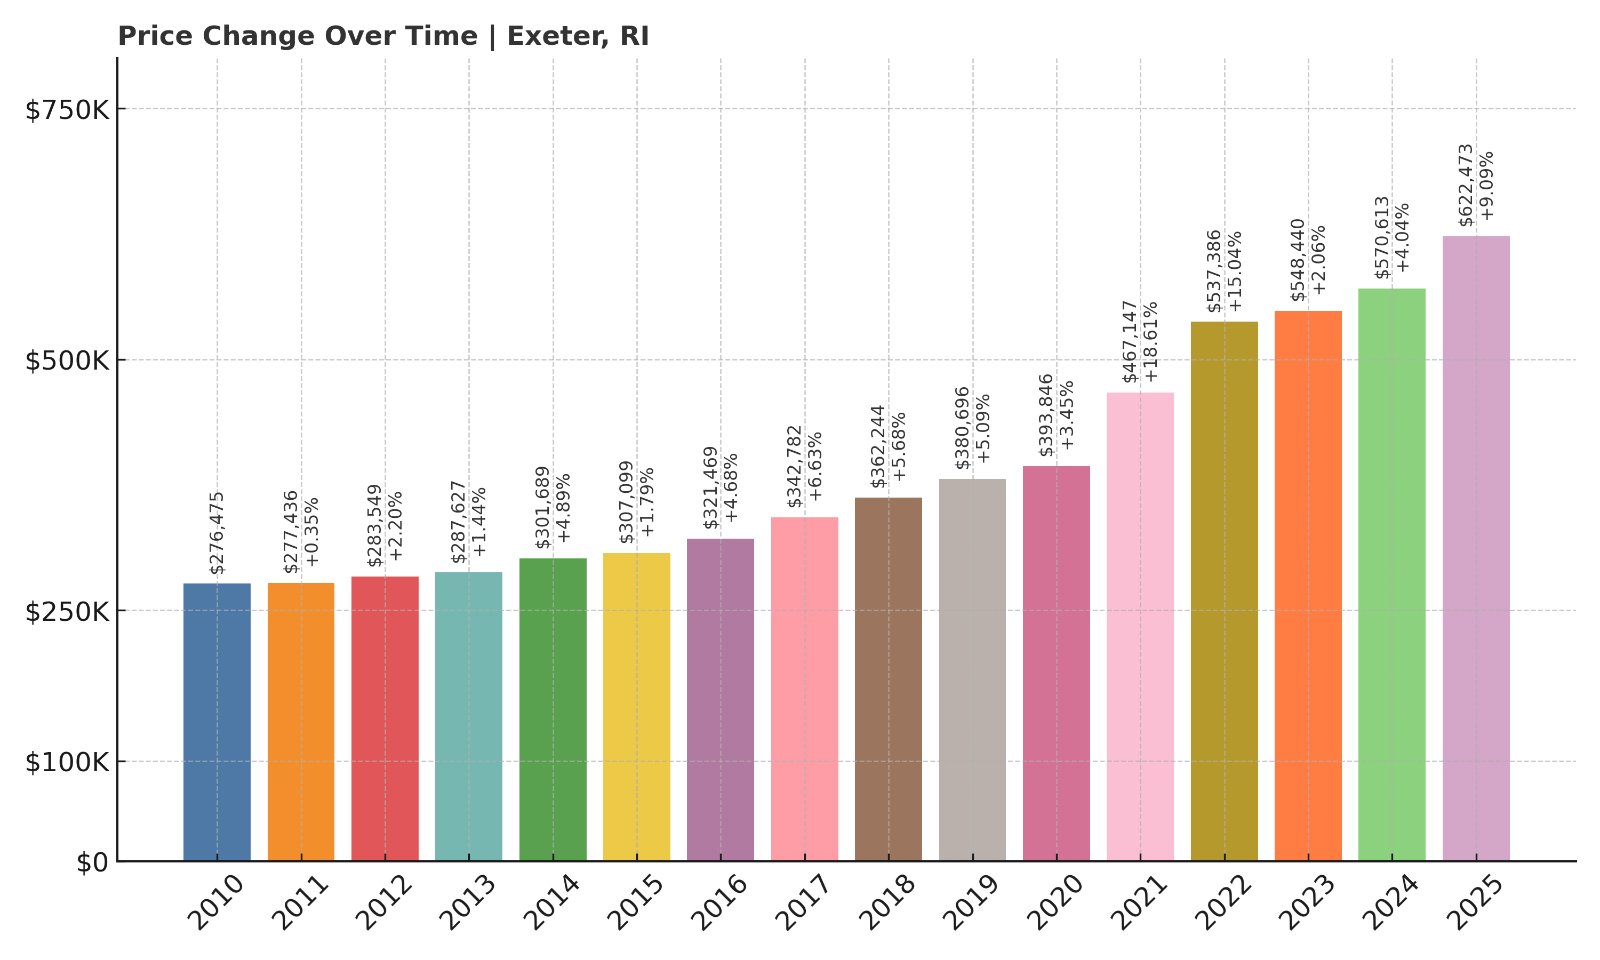
- 2010: $276,475
- 2011: $277,436 (+$961, +0.35% from previous year)
- 2012: $283,549 (+$6,113, +2.20% from previous year)
- 2013: $287,627 (+$4,078, +1.44% from previous year)
- 2014: $301,689 (+$14,062, +4.89% from previous year)
- 2015: $307,099 (+$5,410, +1.79% from previous year)
- 2016: $321,469 (+$14,370, +4.68% from previous year)
- 2017: $342,782 (+$21,313, +6.63% from previous year)
- 2018: $362,244 (+$19,462, +5.68% from previous year)
- 2019: $380,696 (+$18,452, +5.09% from previous year)
- 2020: $393,846 (+$13,150, +3.45% from previous year)
- 2021: $467,147 (+$73,301, +18.61% from previous year)
- 2022: $537,386 (+$70,239, +15.04% from previous year)
- 2023: $548,440 (+$11,054, +2.06% from previous year)
- 2024: $570,613 (+$22,173, +4.04% from previous year)
- 2025: $622,473 (+$51,860, +9.09% from previous year)
Exeter’s housing market has surged 125.1% since 2010, rising from $276K to over $622K in 2025. The town’s price growth picked up dramatically after 2020, including a 9.1% gain in the most recent year — one of the highest in the state for 2025.
Exeter – Open Land and Exceptional Growth
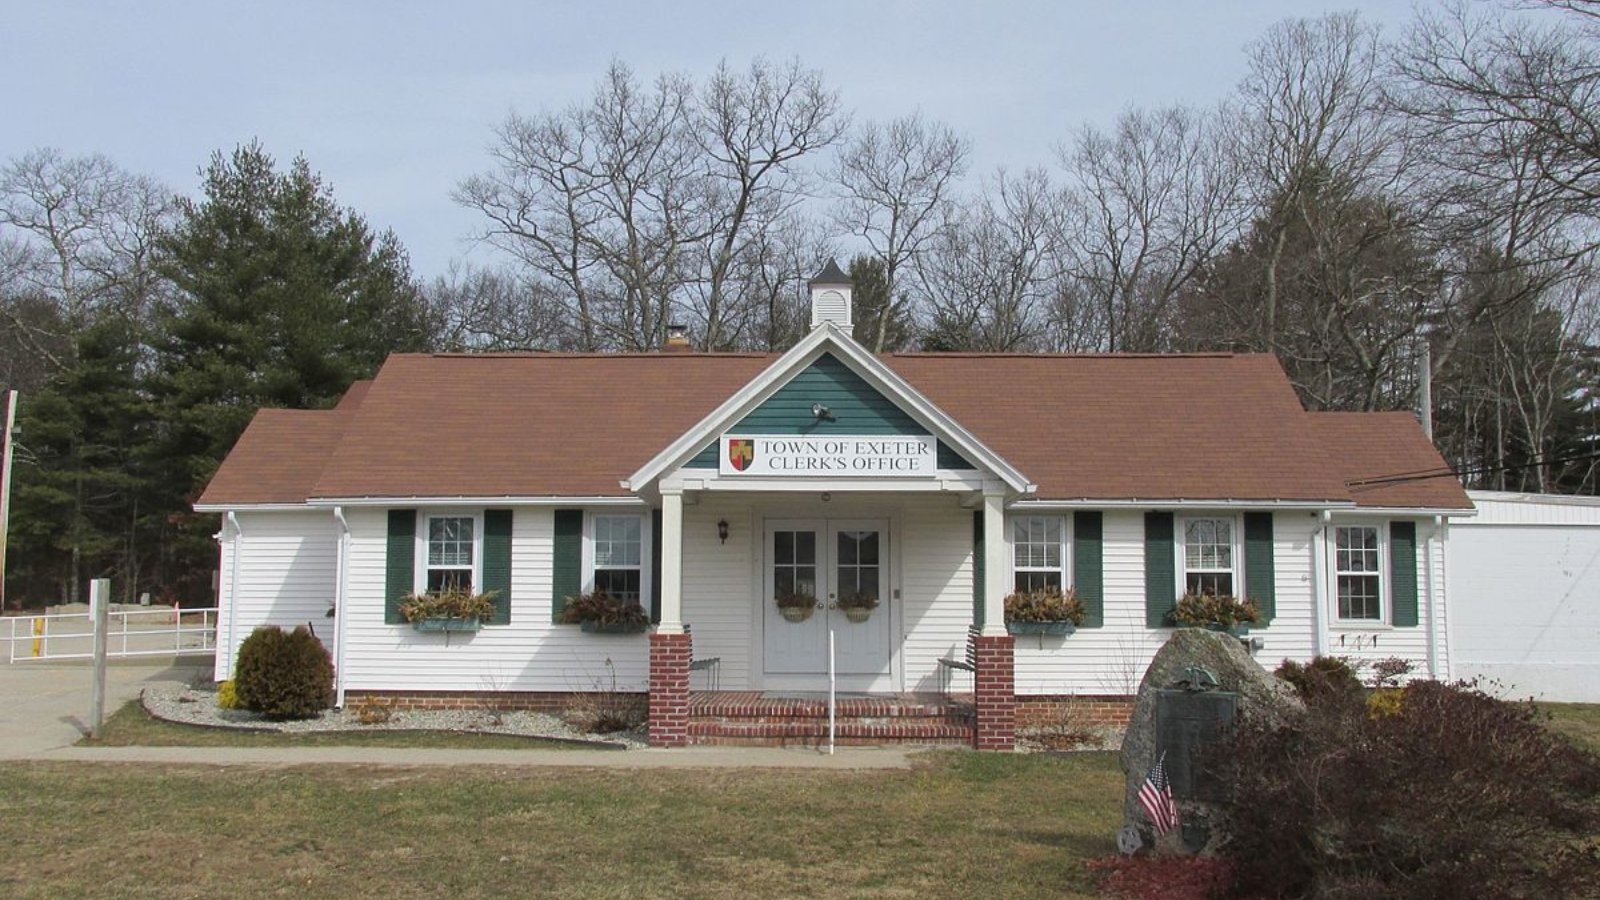
Located in southwestern Rhode Island, Exeter offers rural tranquility with quick access to URI, Route 2, and the coast. Known for equestrian properties, wooded acreage, and low population density, Exeter has drawn buyers interested in privacy, nature, and long-term investment potential.
Recent price increases highlight how Exeter’s reputation has evolved — from a quiet rural community to one of the fastest-appreciating towns in the state. Its strong growth trajectory makes it a standout in the 2025 Rhode Island housing market.
12. North Kingstown – 108.3% Home Price Increase Since 2010
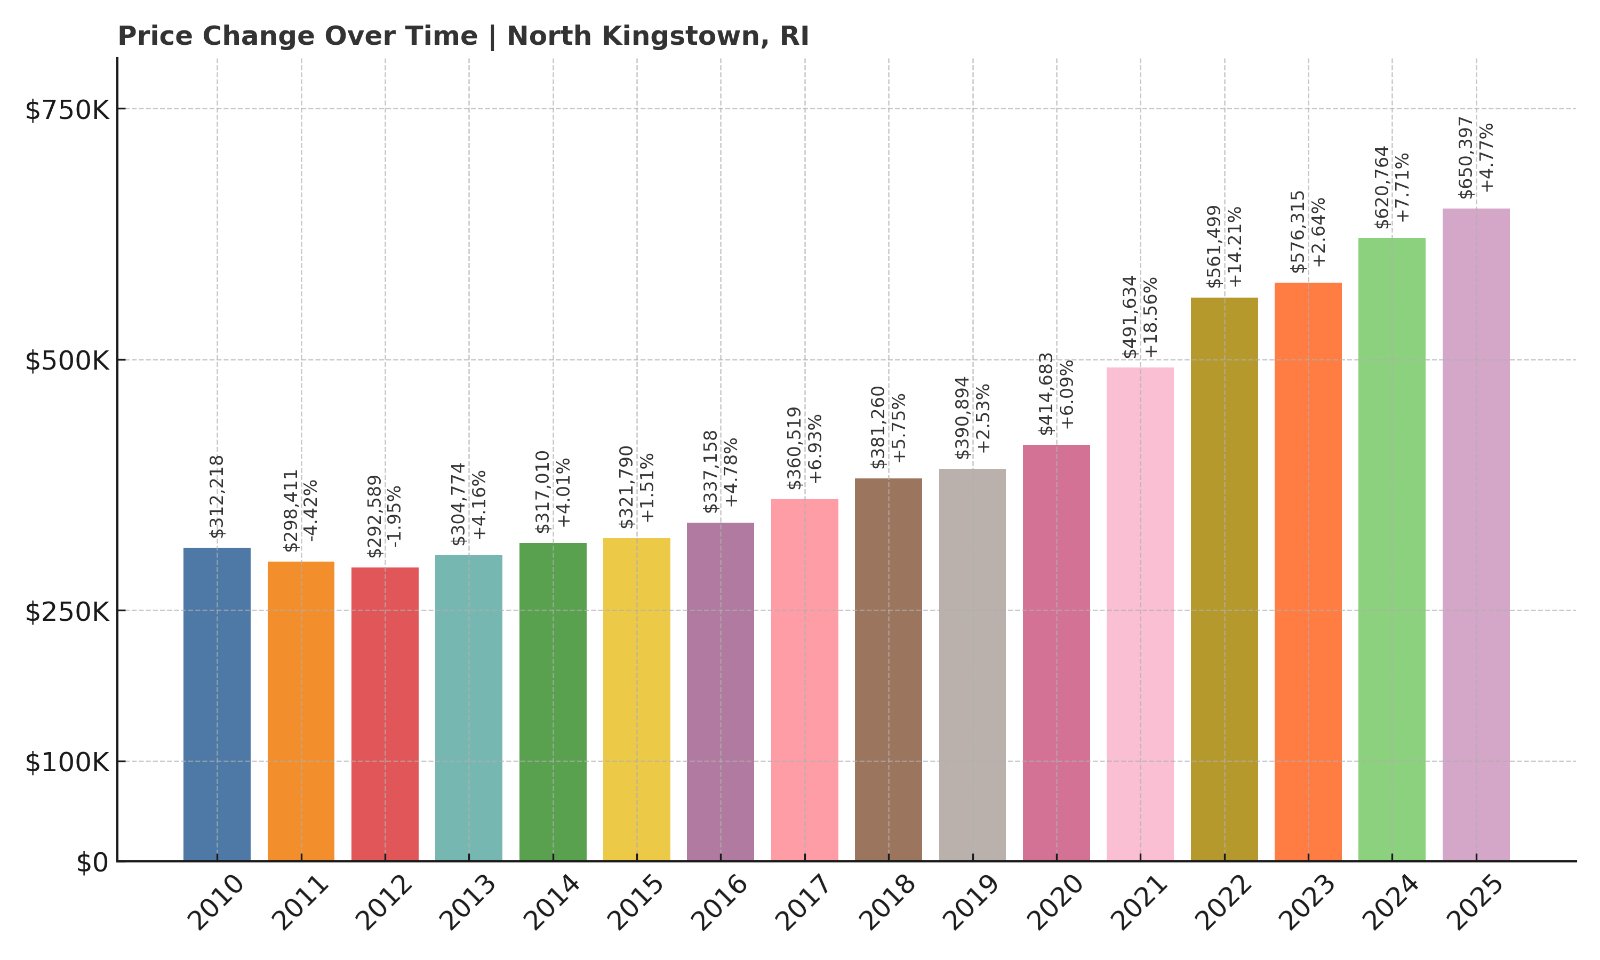
- 2010: $312,218
- 2011: $298,411 (-$13,807, -4.42% from previous year)
- 2012: $292,589 (-$5,822, -1.95% from previous year)
- 2013: $304,774 (+$12,185, +4.16% from previous year)
- 2014: $317,010 (+$12,236, +4.01% from previous year)
- 2015: $321,790 (+$4,780, +1.51% from previous year)
- 2016: $337,158 (+$15,368, +4.78% from previous year)
- 2017: $360,519 (+$23,361, +6.93% from previous year)
- 2018: $381,260 (+$20,741, +5.75% from previous year)
- 2019: $390,894 (+$9,634, +2.53% from previous year)
- 2020: $414,683 (+$23,789, +6.09% from previous year)
- 2021: $491,634 (+$76,951, +18.56% from previous year)
- 2022: $561,499 (+$69,865, +14.21% from previous year)
- 2023: $576,315 (+$14,816, +2.64% from previous year)
- 2024: $620,764 (+$44,449, +7.71% from previous year)
- 2025: $650,397 (+$29,633, +4.77% from previous year)
North Kingstown’s housing market has risen more than 108% since 2010, reaching over $650K in 2025. The biggest leaps came between 2020 and 2022, but the town has maintained impressive year-over-year growth through 2025, including nearly 5% in the past year alone.
North Kingstown – Coastal Access and Historic Charm
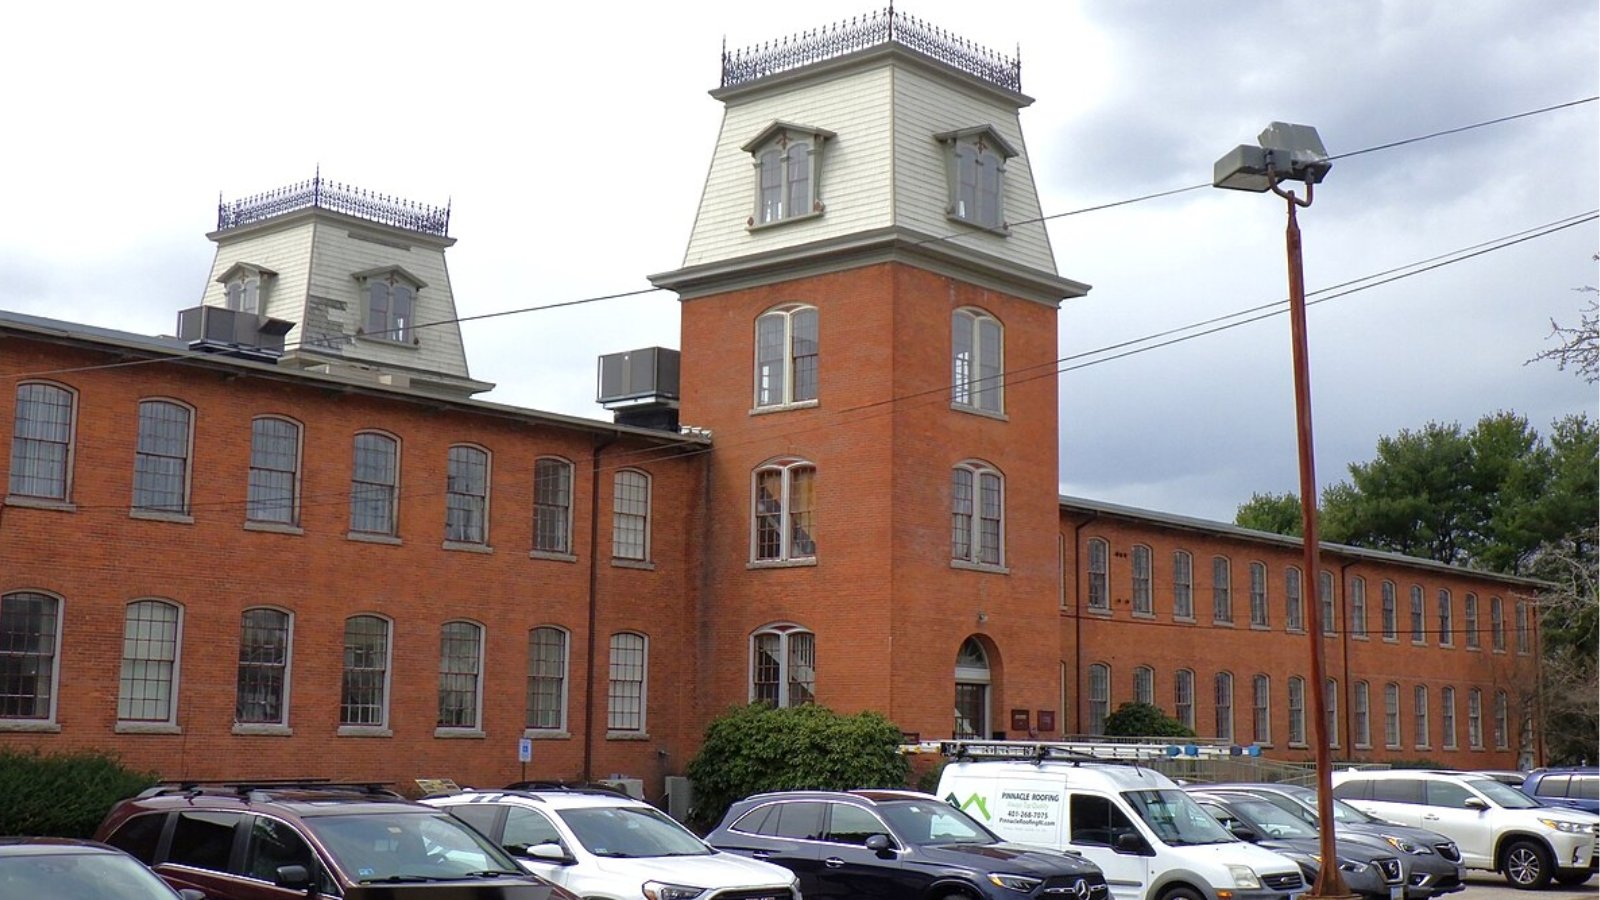
Home to Wickford Village and Quonset Point, North Kingstown offers waterfront living, historic neighborhoods, and a mix of colonial architecture and modern amenities. Its location along Narragansett Bay gives residents access to marinas, beaches, and commuter routes into Providence and Newport.
The town’s combination of scenic beauty, strong schools, and housing diversity makes it a perennial favorite in the Rhode Island market. Its upward trend in value reflects consistent demand from both full-time residents and second-home buyers looking for water access without Newport prices.
11. Portsmouth – 106.1% Home Price Increase Since 2010
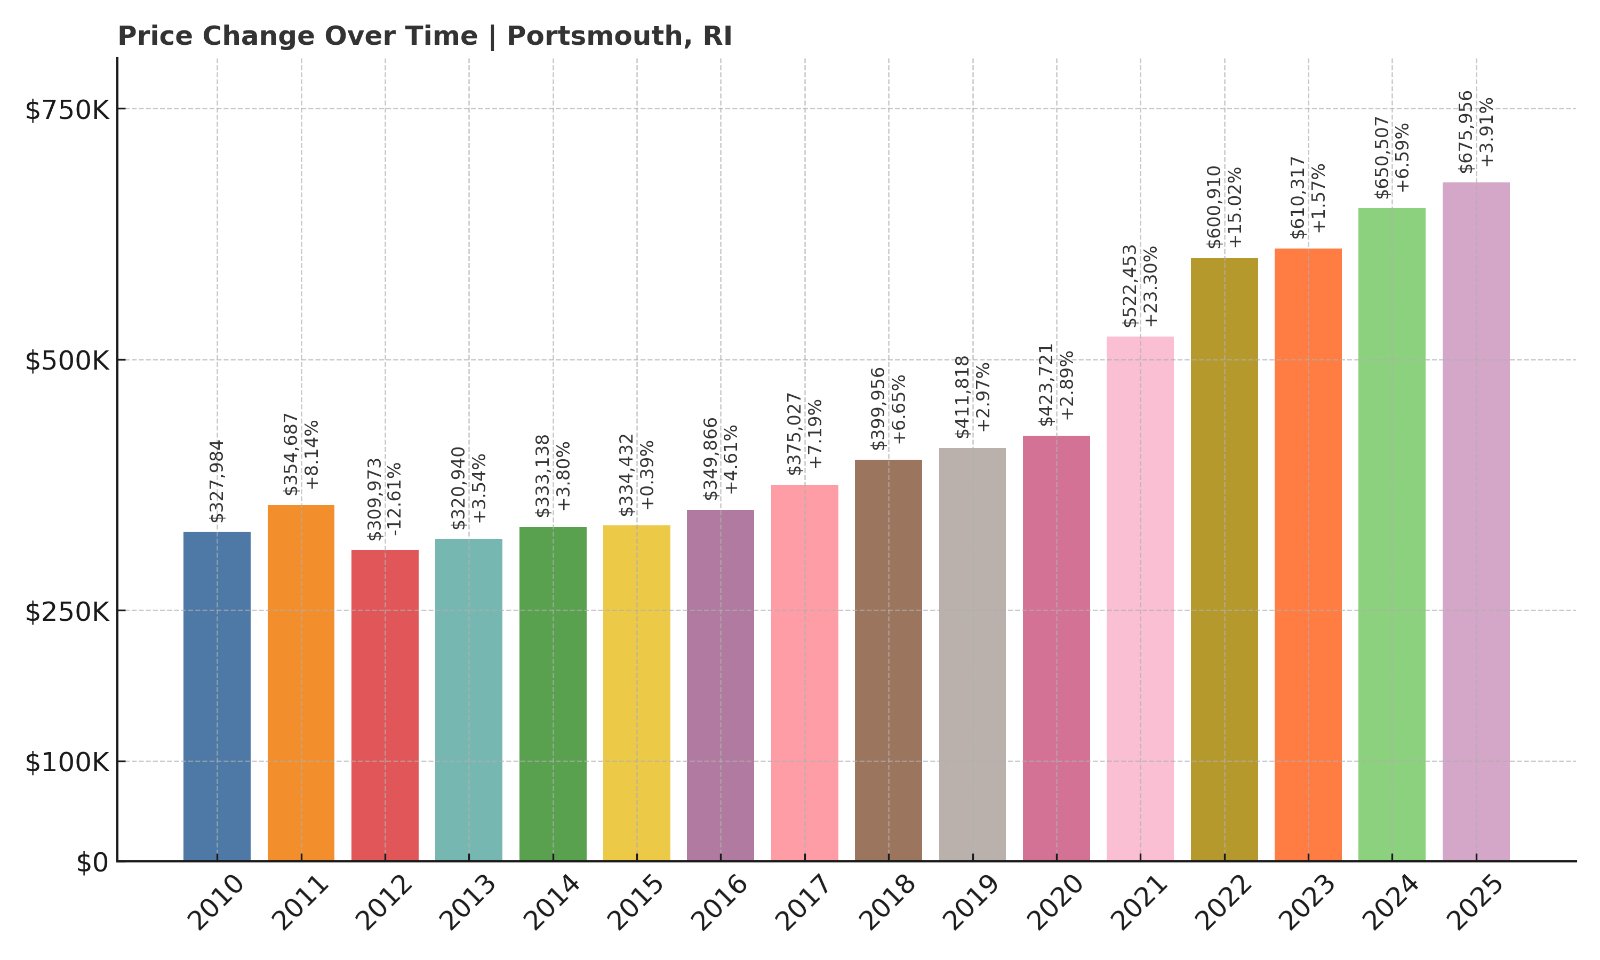
- 2010: $327,984
- 2011: $354,687 (+$26,703, +8.14% from previous year)
- 2012: $309,973 (-$44,714, -12.61% from previous year)
- 2013: $320,940 (+$10,967, +3.54% from previous year)
- 2014: $333,138 (+$12,198, +3.80% from previous year)
- 2015: $334,432 (+$1,294, +0.39% from previous year)
- 2016: $349,866 (+$15,434, +4.61% from previous year)
- 2017: $375,027 (+$25,161, +7.19% from previous year)
- 2018: $399,956 (+$24,929, +6.65% from previous year)
- 2019: $411,818 (+$11,862, +2.97% from previous year)
- 2020: $423,721 (+$11,903, +2.89% from previous year)
- 2021: $522,453 (+$98,732, +23.30% from previous year)
- 2022: $600,910 (+$78,457, +15.02% from previous year)
- 2023: $610,317 (+$9,407, +1.57% from previous year)
- 2024: $650,507 (+$40,190, +6.59% from previous year)
- 2025: $675,956 (+$25,449, +3.91% from previous year)
Portsmouth has experienced a 106.1% increase in home values since 2010. After a price dip in 2012, the town rebounded strongly, with enormous growth from 2020 to 2022. By 2025, average home prices had climbed to nearly $676K, solidifying its status as a top-tier coastal town.
Portsmouth – Water Views and Island Living
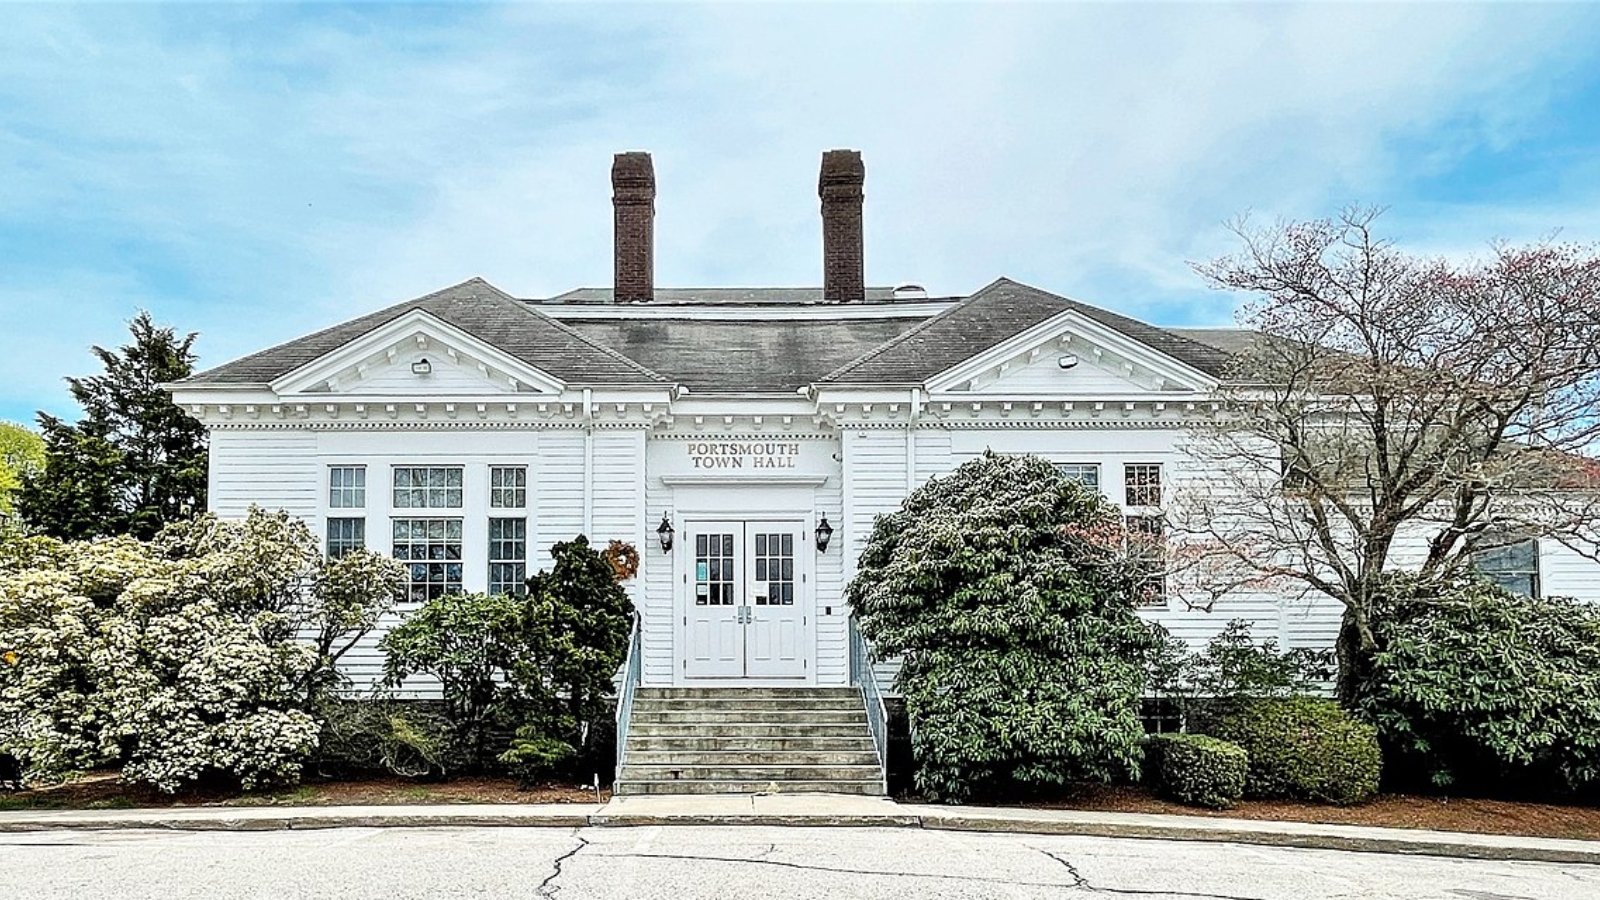
Located on Aquidneck Island, Portsmouth offers sweeping views of Narragansett Bay, as well as access to beaches, golf courses, and marine activities. It’s a quieter alternative to neighboring Newport, but still within reach of its cultural and commercial offerings.
Buyers are drawn to Portsmouth’s mix of historic homes, new builds, and water access, particularly in neighborhoods like Island Park and Common Fence Point. With a strong public school system and proximity to Naval Station Newport, the town continues to draw families, retirees, and military-affiliated residents alike.
10. South Kingstown – 111.9% Home Price Increase Since 2010
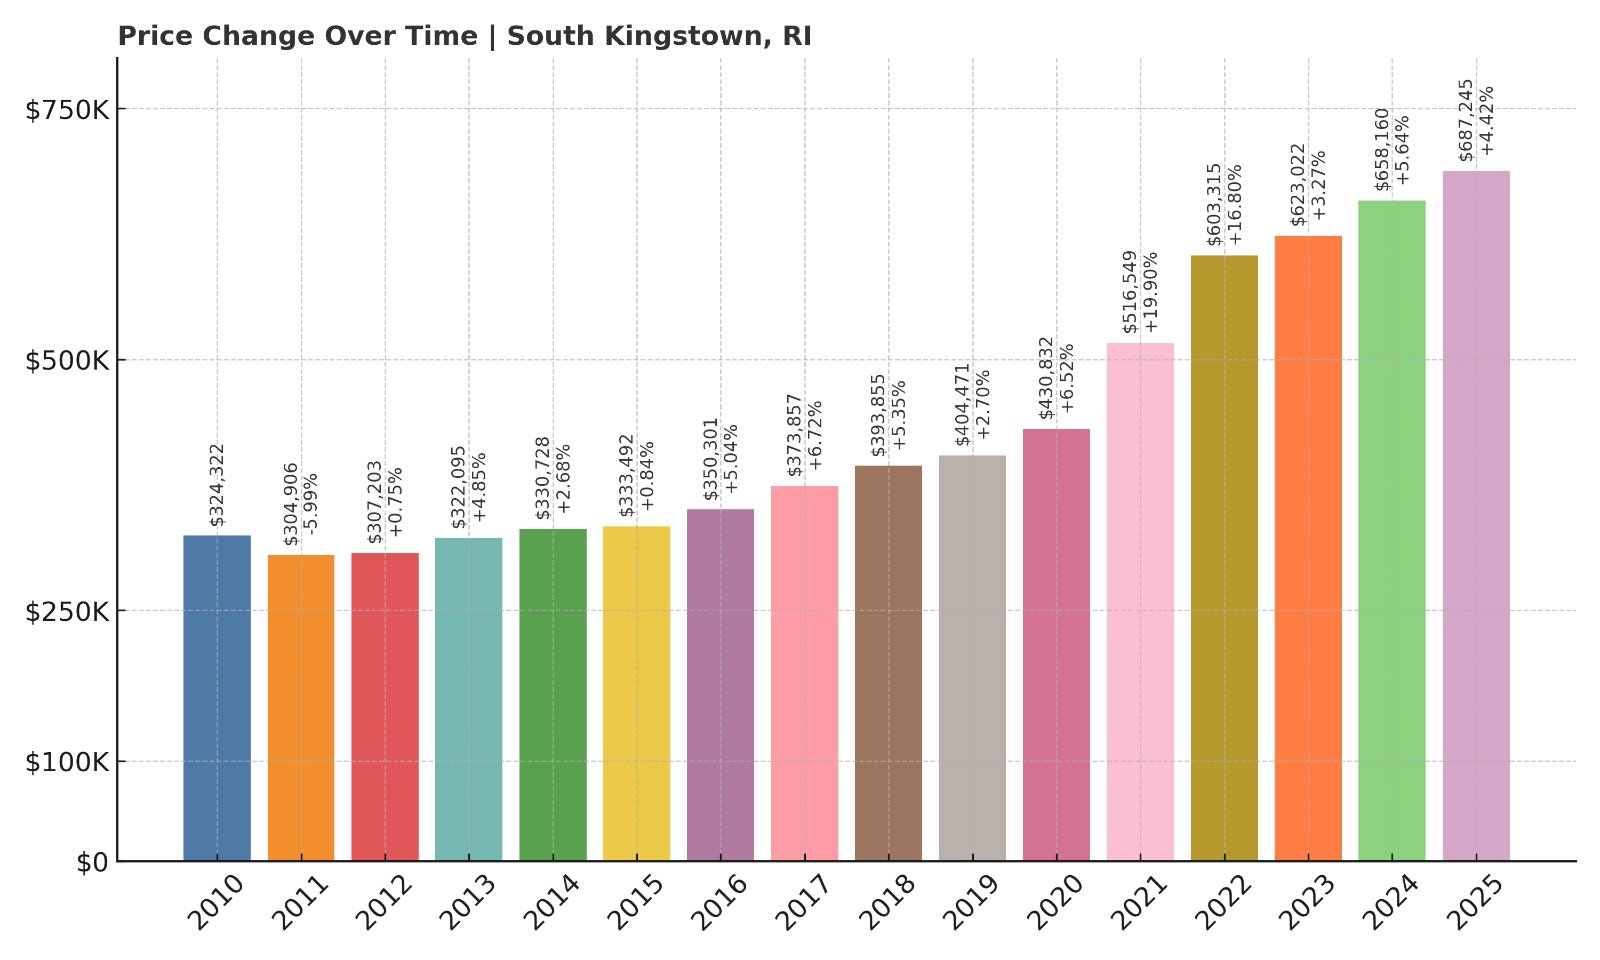
- 2010: $324,322
- 2011: $304,906 (-$19,416, -5.99% from previous year)
- 2012: $307,203 (+$2,297, +0.75% from previous year)
- 2013: $322,095 (+$14,892, +4.85% from previous year)
- 2014: $330,728 (+$8,633, +2.68% from previous year)
- 2015: $333,492 (+$2,764, +0.84% from previous year)
- 2016: $350,301 (+$16,809, +5.04% from previous year)
- 2017: $373,857 (+$23,556, +6.72% from previous year)
- 2018: $393,855 (+$19,998, +5.35% from previous year)
- 2019: $404,471 (+$10,616, +2.70% from previous year)
- 2020: $430,832 (+$26,361, +6.52% from previous year)
- 2021: $516,549 (+$85,717, +19.90% from previous year)
- 2022: $603,315 (+$86,766, +16.80% from previous year)
- 2023: $623,022 (+$19,707, +3.27% from previous year)
- 2024: $658,160 (+$35,138, +5.64% from previous year)
- 2025: $687,245 (+$29,085, +4.42% from previous year)
South Kingstown home prices have jumped nearly 112% since 2010, reaching over $687K in 2025. The town saw especially aggressive growth in 2021 and 2022, with continued appreciation in the years following. It remains one of the strongest-performing markets in southern Rhode Island.
South Kingstown – University Town with Coastal Appeal
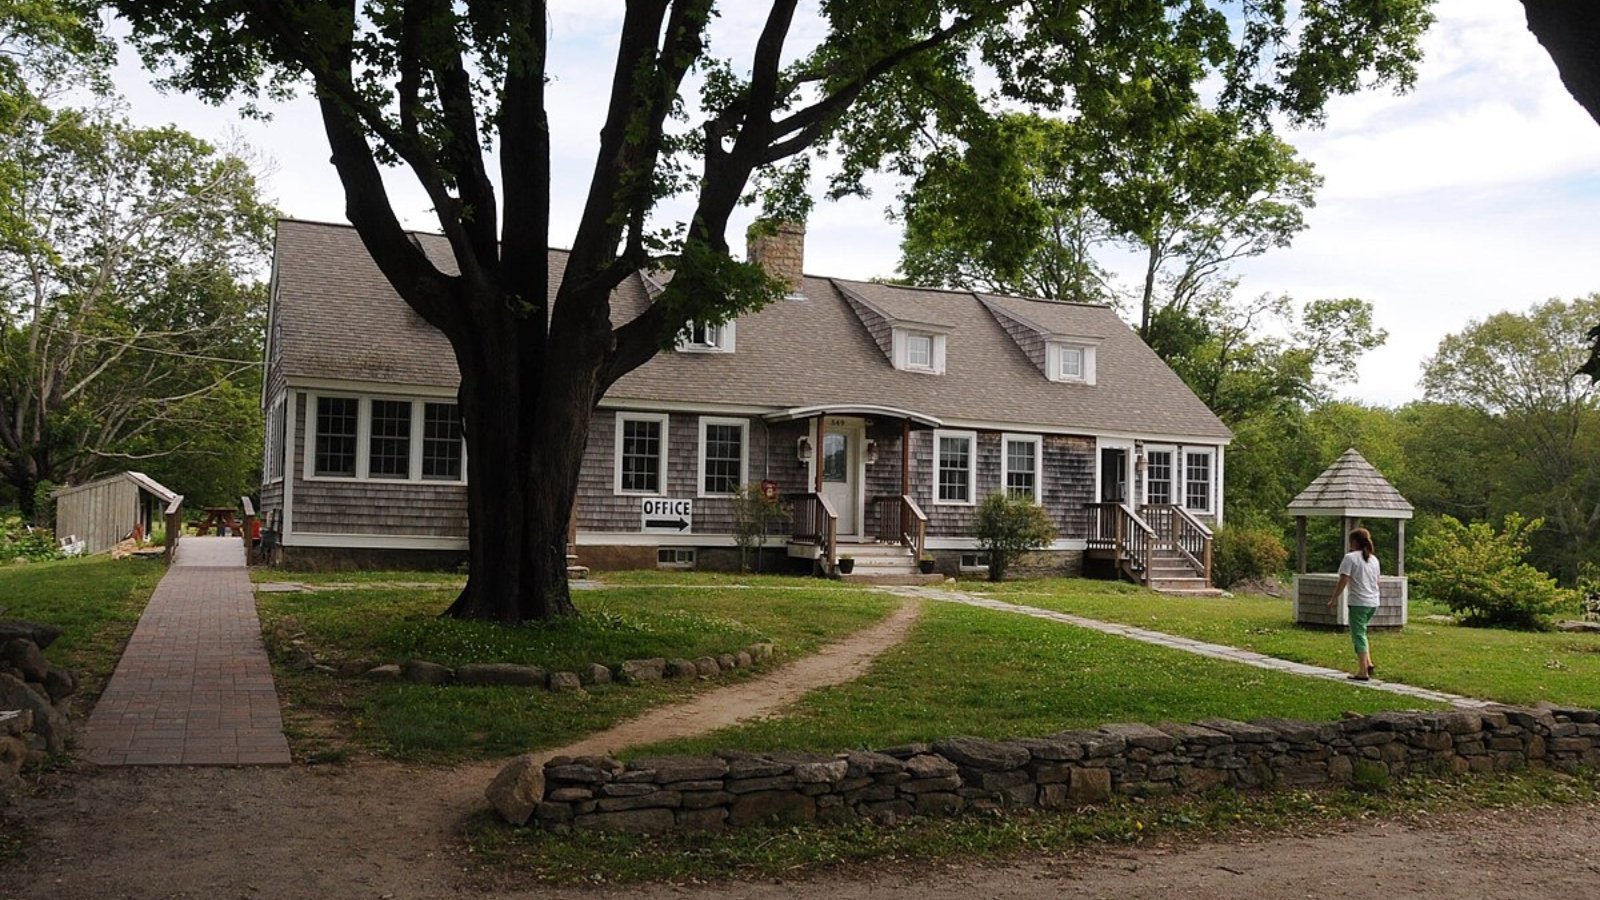
South Kingstown is home to the University of Rhode Island, as well as miles of coastline, rural farmlands, and village centers like Wakefield and Peace Dale. The combination of higher education, beach access, and charming historic districts makes it a magnet for families, professionals, and investors.
The town’s proximity to Narragansett, while offering more space and diversity in housing stock, gives buyers the best of both coastal access and community infrastructure. With strong rental demand and long-term buyer interest, South Kingstown continues to post impressive home value growth.
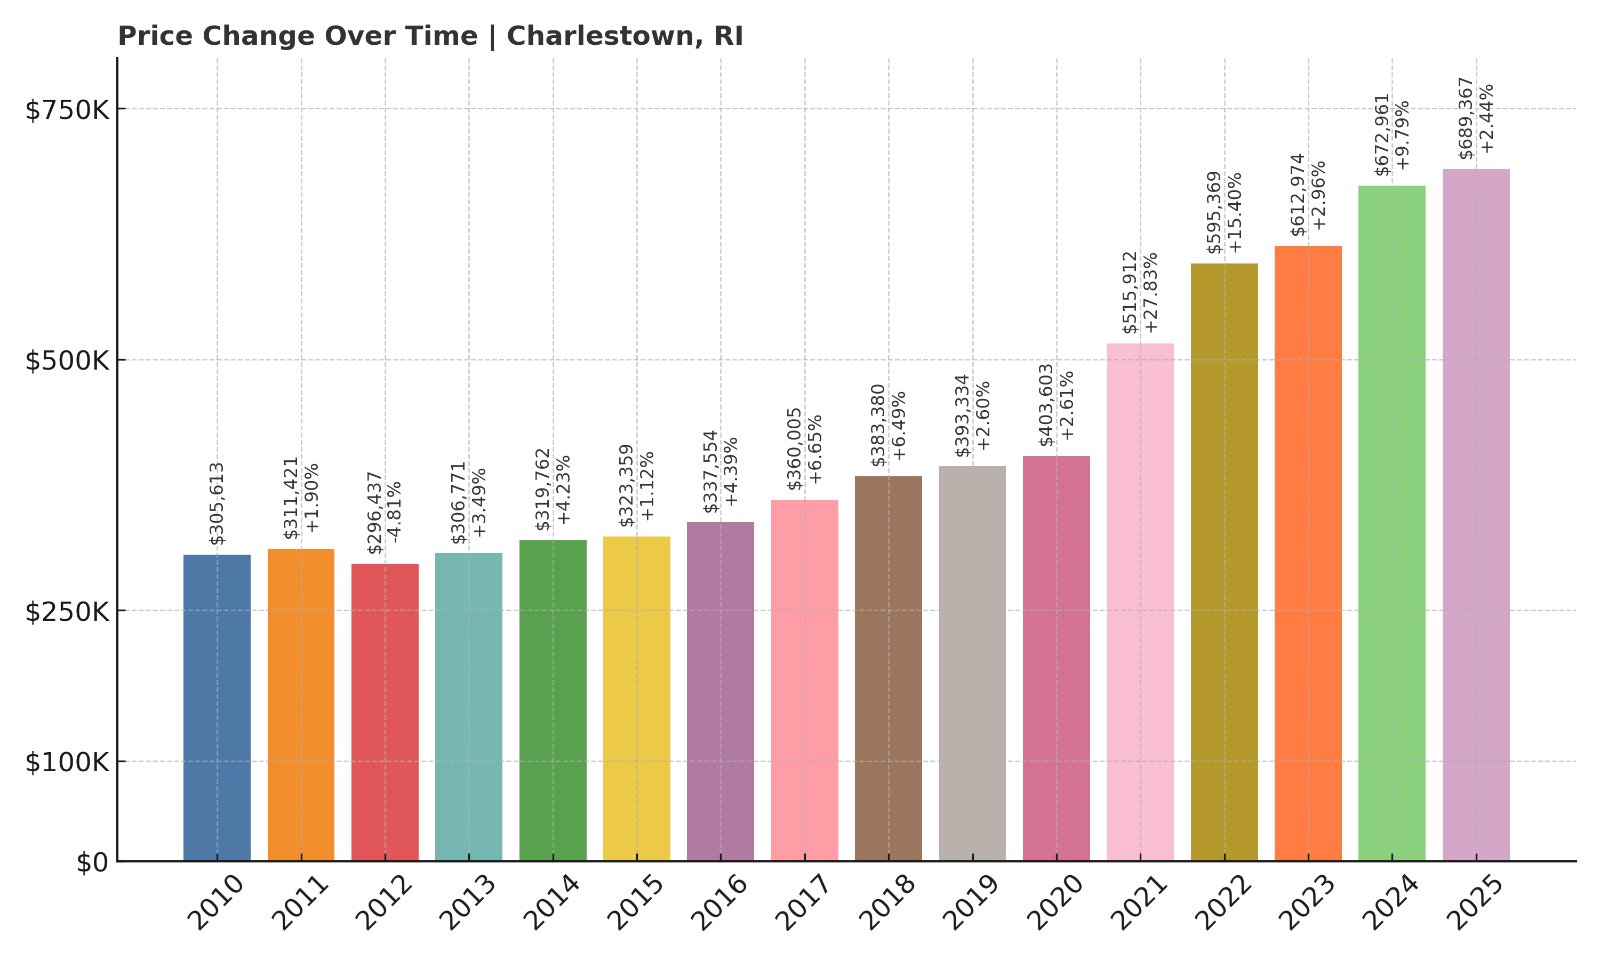
9. Charlestown – 125.7% Home Price Increase Since 2010
- 2010: $305,613
- 2011: $311,421 (+$5,808, +1.90% from previous year)
- 2012: $296,437 (-$14,984, -4.81% from previous year)
- 2013: $306,771 (+$10,334, +3.49% from previous year)
- 2014: $319,762 (+$12,991, +4.23% from previous year)
- 2015: $323,359 (+$3,597, +1.12% from previous year)
- 2016: $337,554 (+$14,195, +4.39% from previous year)
- 2017: $360,005 (+$22,451, +6.65% from previous year)
- 2018: $383,380 (+$23,375, +6.49% from previous year)
- 2019: $393,334 (+$9,954, +2.60% from previous year)
- 2020: $403,603 (+$10,269, +2.61% from previous year)
- 2021: $515,912 (+$112,309, +27.83% from previous year)
- 2022: $595,369 (+$79,457, +15.40% from previous year)
- 2023: $612,974 (+$17,605, +2.96% from previous year)
- 2024: $672,961 (+$59,987, +9.79% from previous year)
- 2025: $689,367 (+$16,406, +2.44% from previous year)
Charlestown’s home prices have more than doubled since 2010, with a 125.7% increase taking values to nearly $690K in 2025. Growth exploded during 2021 and 2022, with prices rising over $190K in those two years alone. Gains have moderated since but remain consistent.
Charlestown – Oceanfront Living Without the Crowds
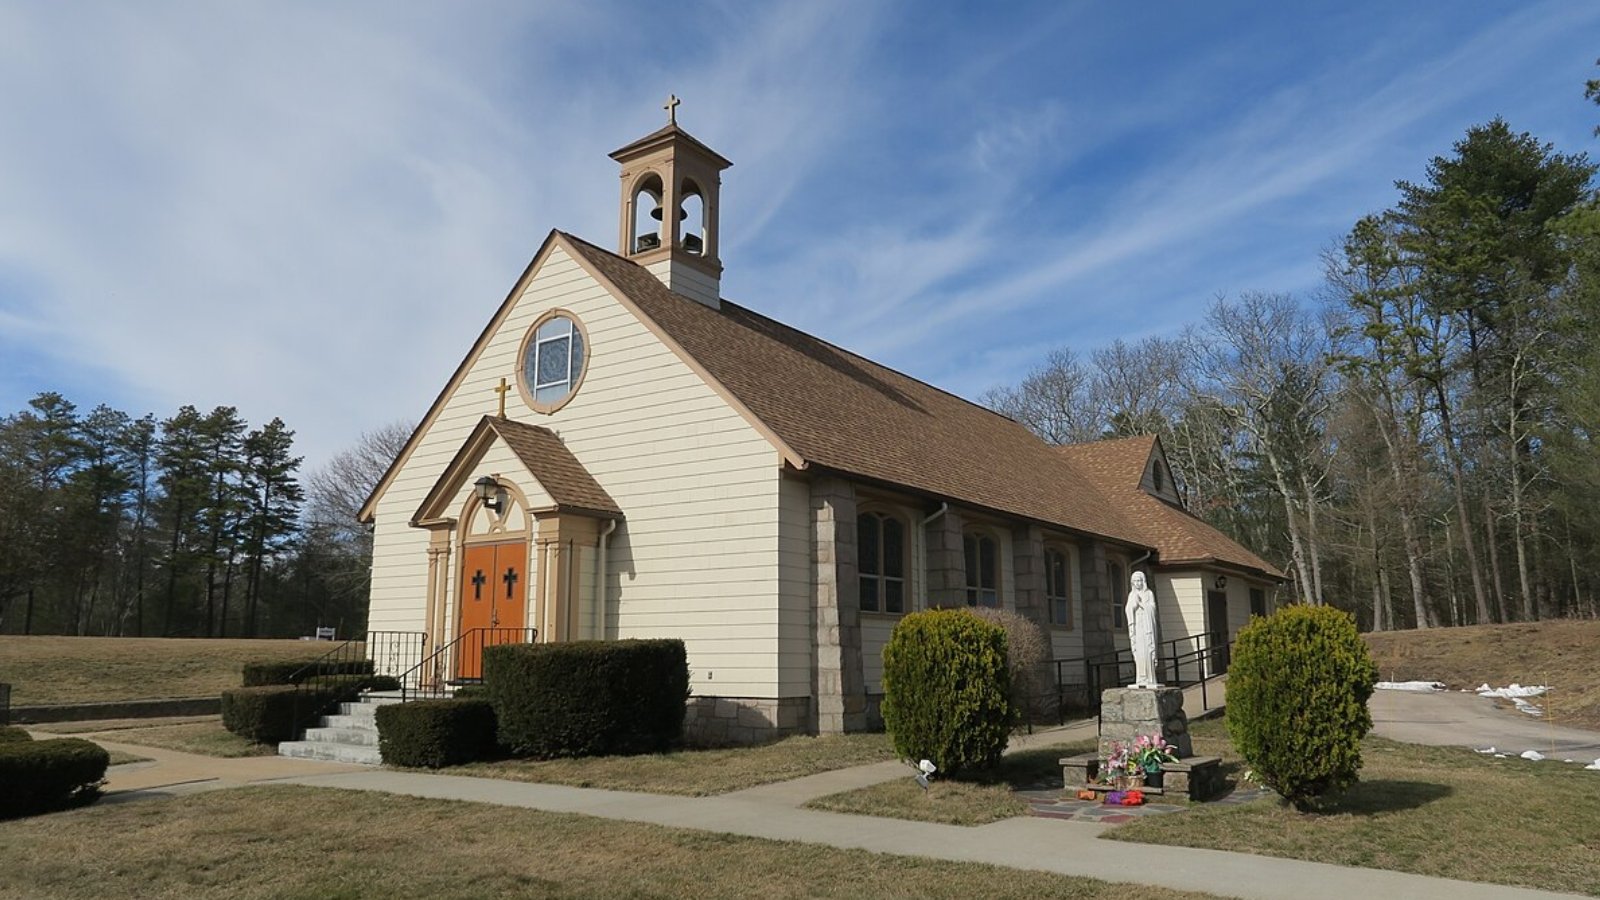
Charlestown offers pristine coastline, state beaches, and expansive salt ponds — all without the commercial bustle of some larger beach towns. It’s a favorite for second-home buyers and seasonal residents, particularly those seeking a quieter experience close to the shore.
With its conservation-focused development, limited commercial sprawl, and natural beauty, Charlestown remains highly desirable. Inventory is tight, and prices have risen as more buyers look for waterfront access with peace and privacy. It’s no surprise this town is climbing the list of Rhode Island’s most expensive places to buy.
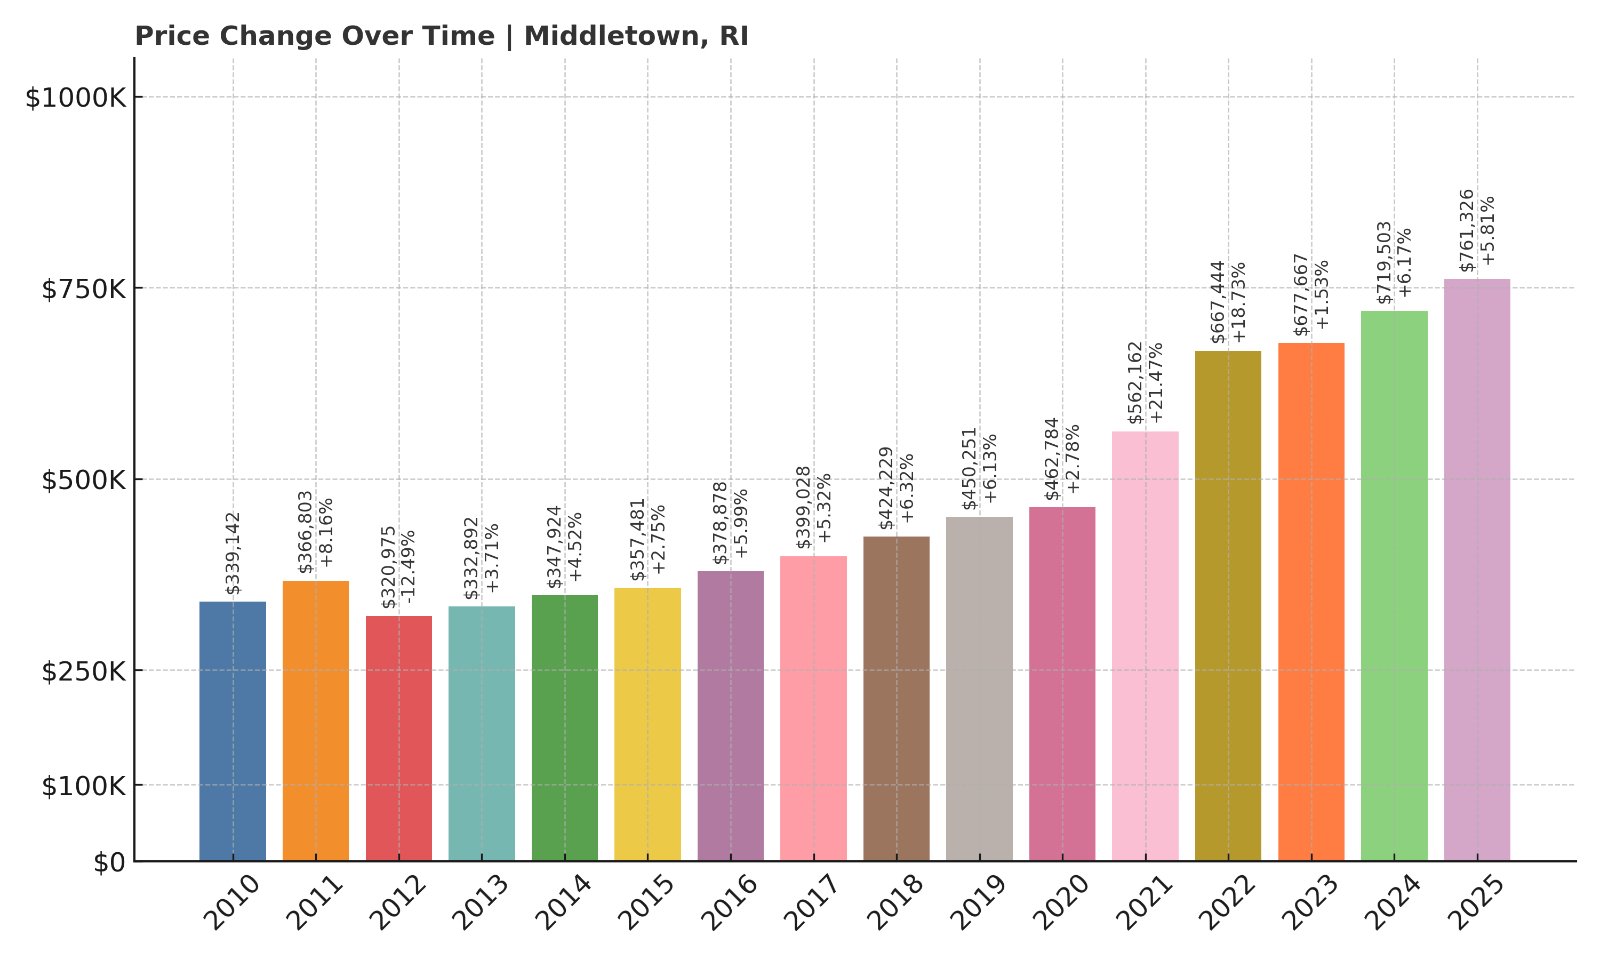
8. Middletown – 124.5% Home Price Increase Since 2010
- 2010: $339,142
- 2011: $366,803 (+$27,661, +8.16% from previous year)
- 2012: $320,975 (-$45,828, -12.49% from previous year)
- 2013: $332,892 (+$11,917, +3.71% from previous year)
- 2014: $347,924 (+$15,032, +4.52% from previous year)
- 2015: $357,481 (+$9,557, +2.75% from previous year)
- 2016: $378,878 (+$21,397, +5.99% from previous year)
- 2017: $399,028 (+$20,150, +5.32% from previous year)
- 2018: $424,229 (+$25,201, +6.32% from previous year)
- 2019: $450,251 (+$26,022, +6.13% from previous year)
- 2020: $462,784 (+$12,533, +2.78% from previous year)
- 2021: $562,162 (+$99,378, +21.47% from previous year)
- 2022: $667,444 (+$105,282, +18.73% from previous year)
- 2023: $677,667 (+$10,223, +1.53% from previous year)
- 2024: $719,503 (+$41,836, +6.17% from previous year)
- 2025: $761,326 (+$41,823, +5.81% from previous year)
Middletown’s home prices have jumped 124.5% since 2010, hitting over $761K in 2025. The market saw massive gains in 2021 and 2022, but even the past two years have seen continued growth. With its strategic location and increasing prestige, Middletown continues to attract steady buyer interest.
Middletown – A Coastal Hub Between Newport and the Bay
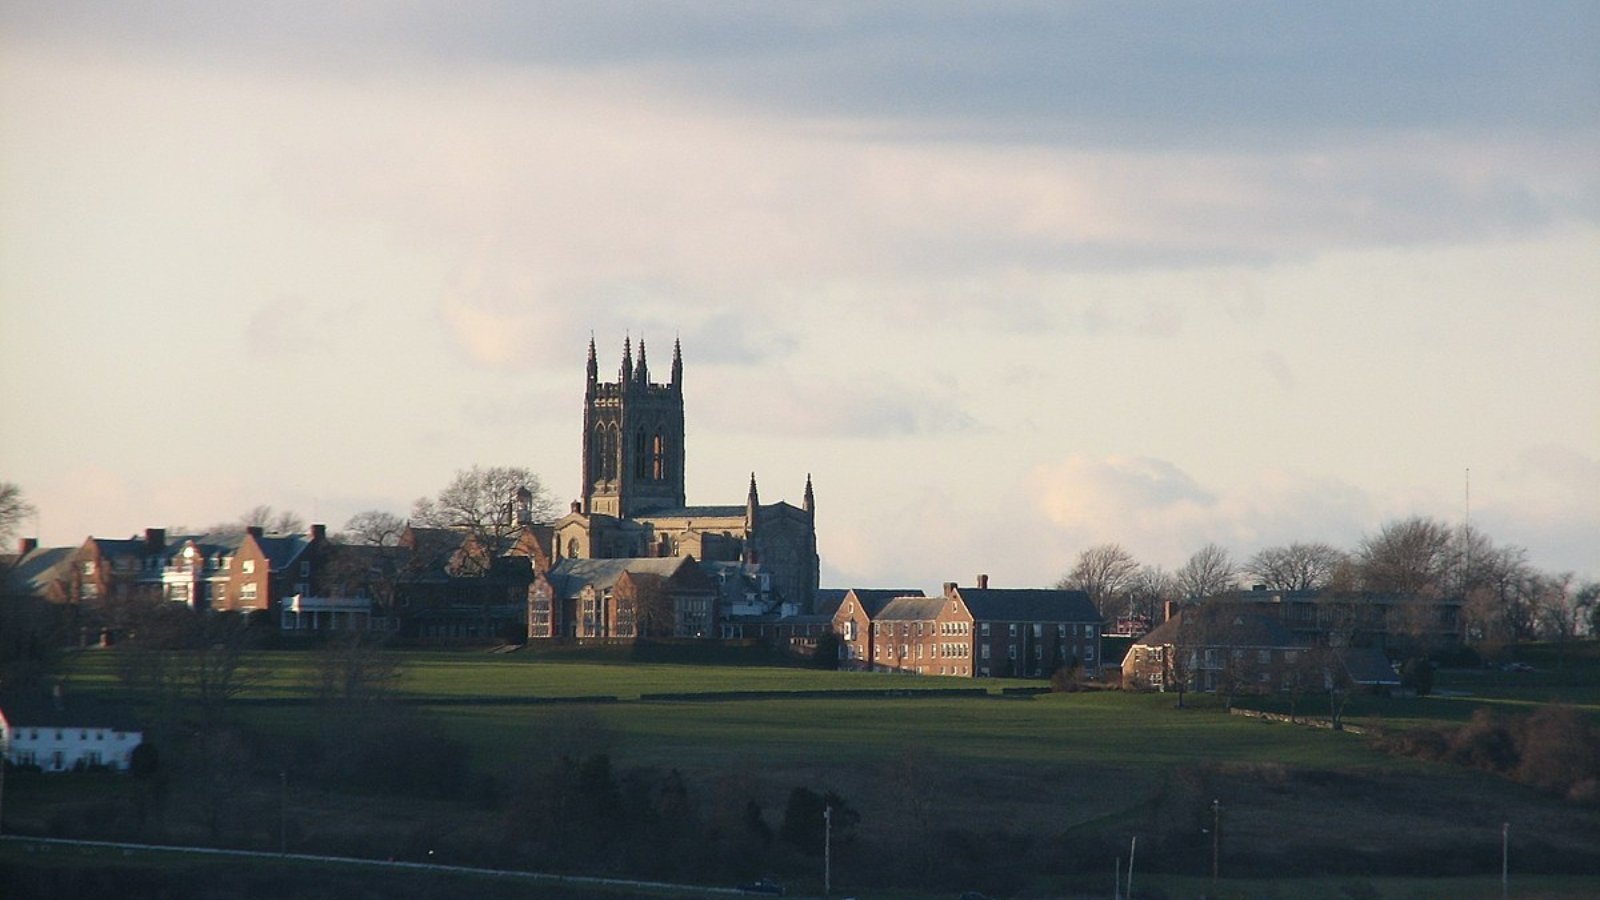
Nestled between Portsmouth and Newport on Aquidneck Island, Middletown blends residential neighborhoods, farmland, and beach access. Second Beach and Sachuest Point National Wildlife Refuge draw locals and visitors alike, while East Main Road and West Main Road offer retail convenience.
Its combination of accessibility, open space, and proximity to major destinations makes Middletown a prime location for homebuyers. Whether used as a primary residence or seasonal getaway, demand continues to rise — and home values have followed suit.
7. Barrington – 137.7% Home Price Increase Since 2010
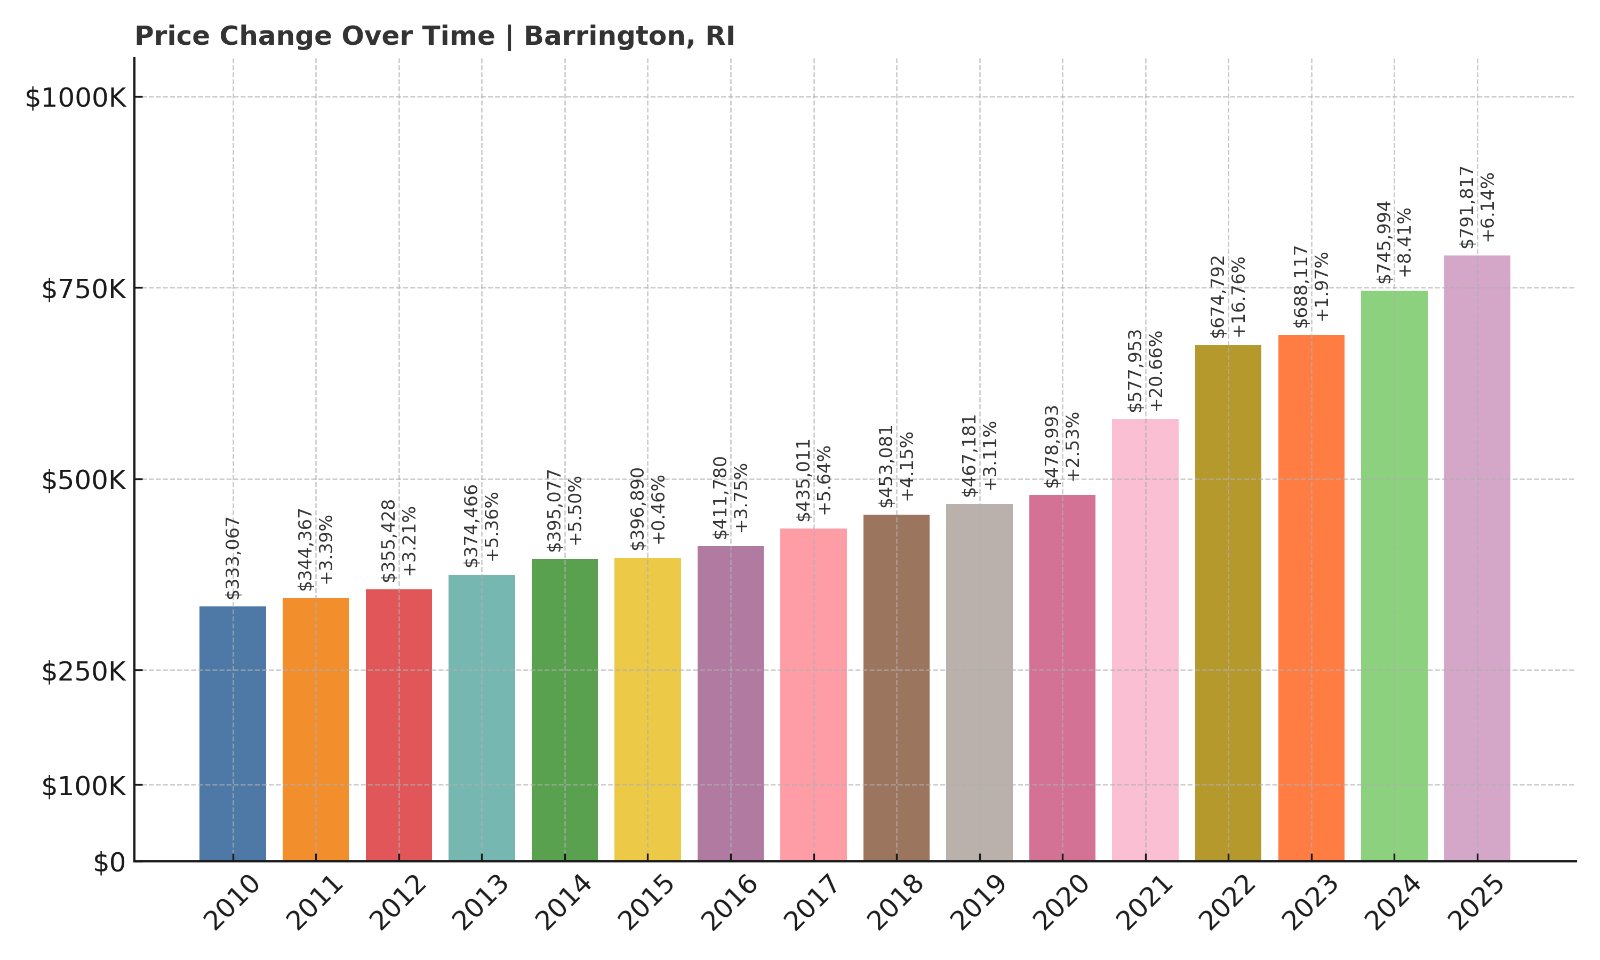
- 2010: $333,067
- 2011: $344,367 (+$11,300, +3.39% from previous year)
- 2012: $355,428 (+$11,061, +3.21% from previous year)
- 2013: $374,466 (+$19,038, +5.36% from previous year)
- 2014: $395,077 (+$20,611, +5.50% from previous year)
- 2015: $396,890 (+$1,813, +0.46% from previous year)
- 2016: $411,780 (+$14,890, +3.75% from previous year)
- 2017: $435,011 (+$23,231, +5.64% from previous year)
- 2018: $453,081 (+$18,070, +4.15% from previous year)
- 2019: $467,181 (+$14,100, +3.11% from previous year)
- 2020: $478,993 (+$11,812, +2.53% from previous year)
- 2021: $577,953 (+$98,960, +20.66% from previous year)
- 2022: $674,792 (+$96,839, +16.76% from previous year)
- 2023: $688,117 (+$13,325, +1.97% from previous year)
- 2024: $745,994 (+$57,877, +8.41% from previous year)
- 2025: $791,817 (+$45,823, +6.14% from previous year)
Home prices in Barrington have soared 137.7% since 2010. As of 2025, the average home value is just under $792K, up from $333K fifteen years ago. The largest jumps occurred from 2020 through 2022, and prices have continued to climb since then.
Barrington – Top-Tier Schools and Waterfront Living
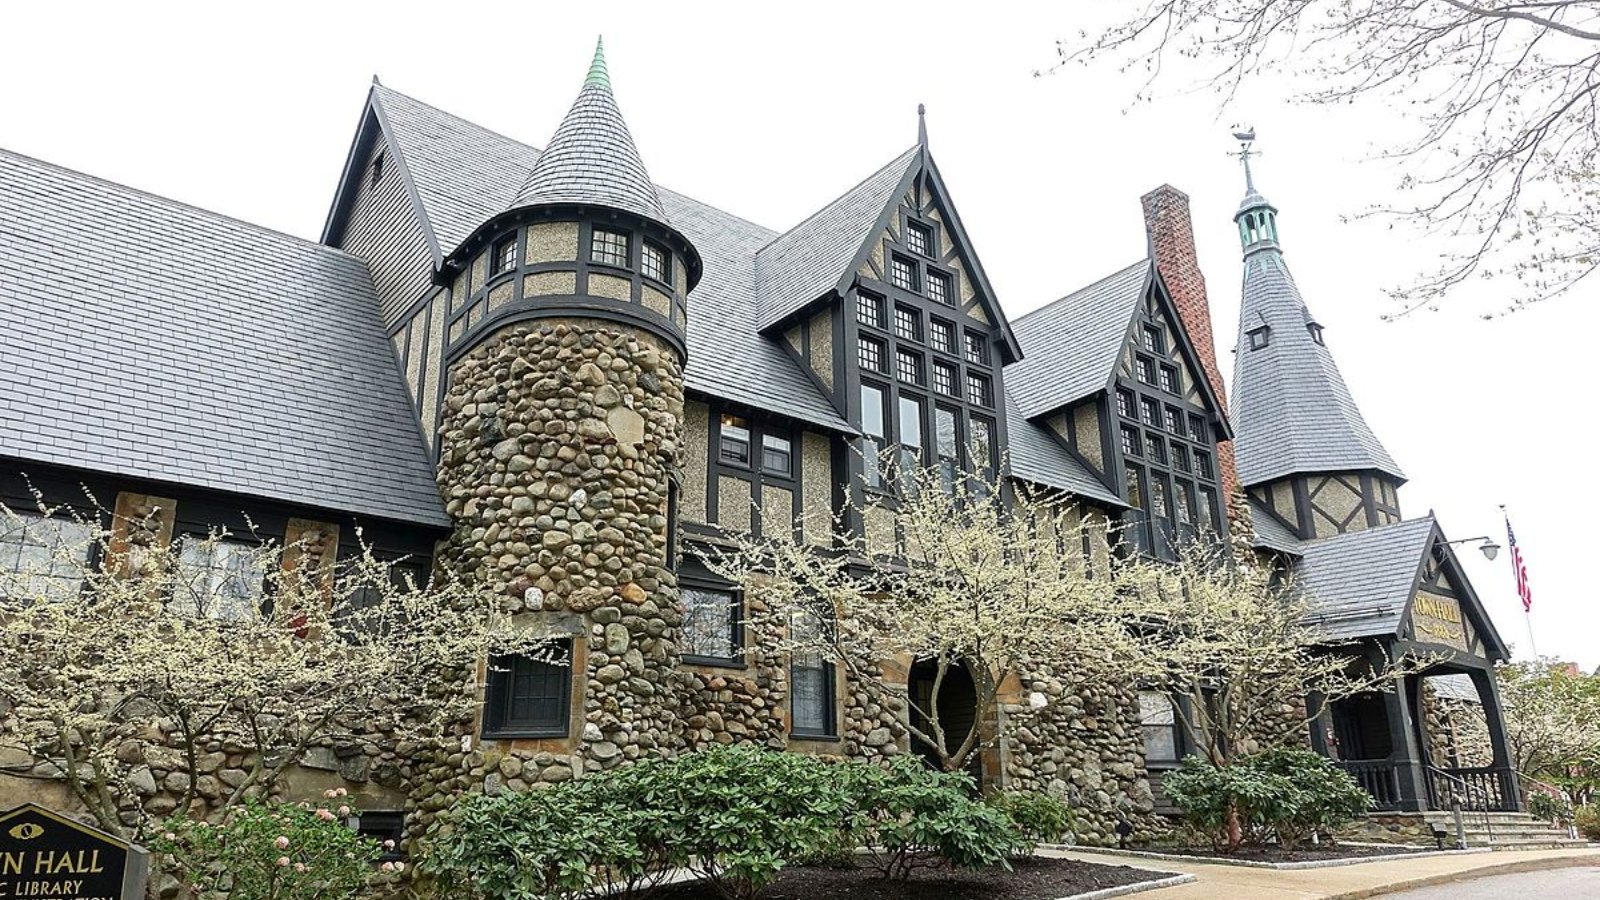
Barrington consistently ranks as one of Rhode Island’s most desirable suburbs, known for its top-rated schools, safe neighborhoods, and waterfront real estate. Its eastern shorelines along Narragansett Bay feature some of the most coveted properties in the state.
The town’s appeal among families and professionals keeps demand high and inventory tight. Its quiet streets, public access to the water, and proximity to Providence ensure continued appreciation. For buyers prioritizing education and lifestyle, Barrington remains a standout.
6. East Greenwich – 95.6% Home Price Increase Since 2010
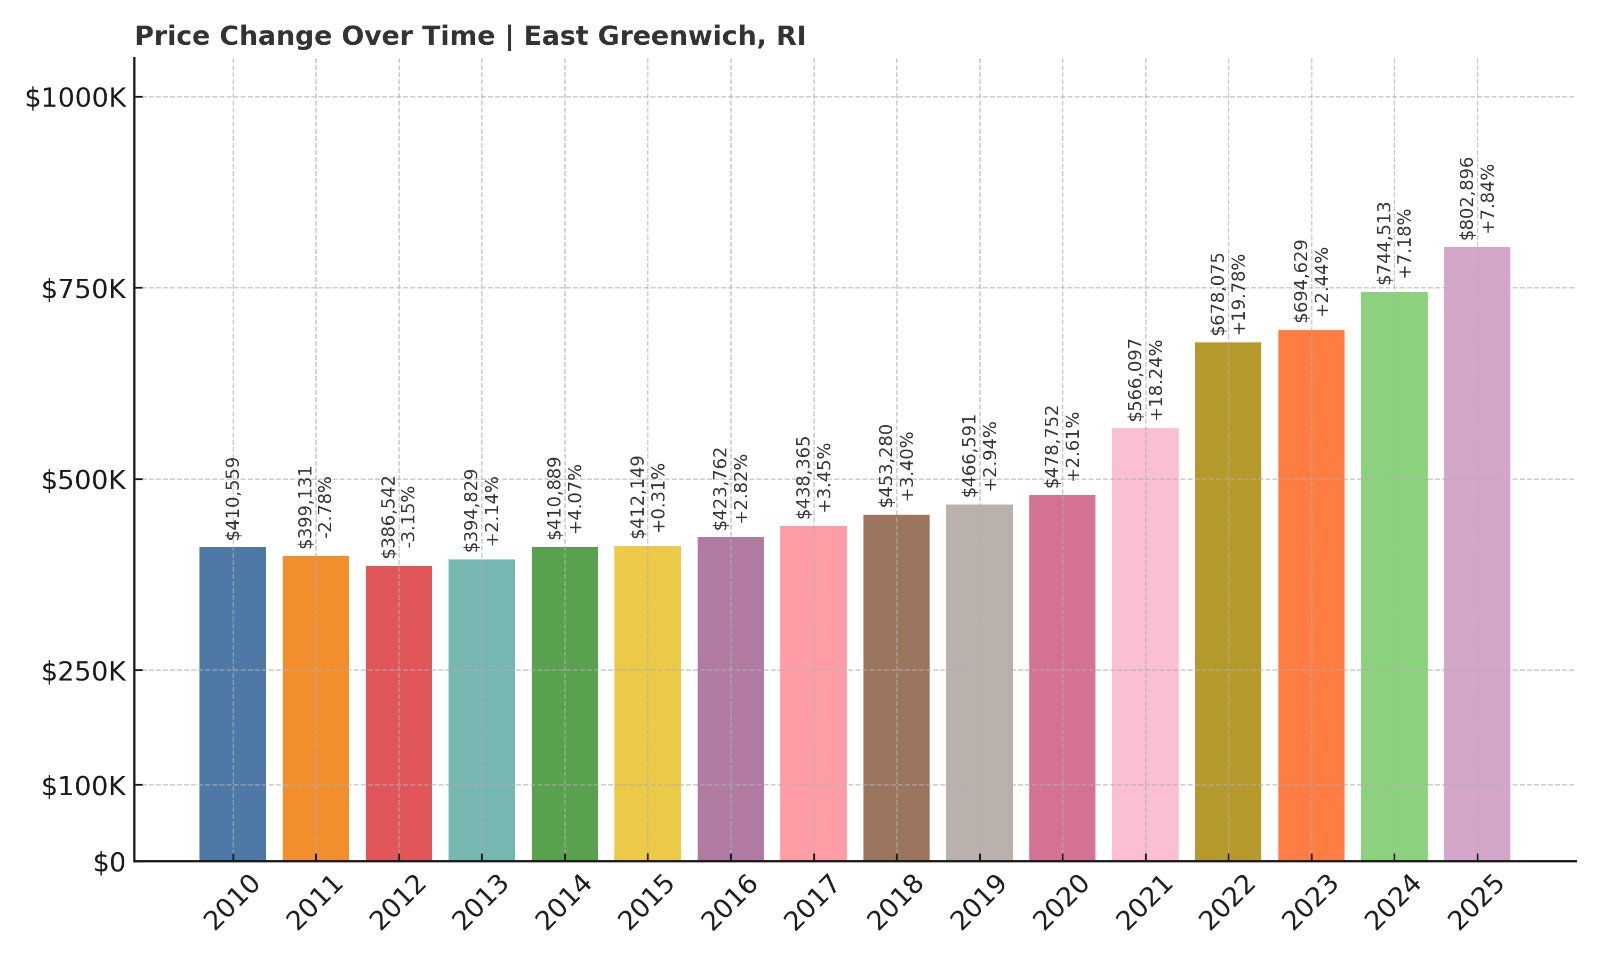
- 2010: $410,559
- 2011: $399,131 (-$11,428, -2.78% from previous year)
- 2012: $386,542 (-$12,589, -3.15% from previous year)
- 2013: $394,829 (+$8,287, +2.14% from previous year)
- 2014: $410,889 (+$16,060, +4.07% from previous year)
- 2015: $412,149 (+$1,260, +0.31% from previous year)
- 2016: $423,762 (+$11,613, +2.82% from previous year)
- 2017: $438,365 (+$14,603, +3.45% from previous year)
- 2018: $453,280 (+$14,915, +3.40% from previous year)
- 2019: $466,591 (+$13,311, +2.94% from previous year)
- 2020: $478,752 (+$12,161, +2.61% from previous year)
- 2021: $566,097 (+$87,345, +18.24% from previous year)
- 2022: $678,075 (+$111,978, +19.78% from previous year)
- 2023: $694,629 (+$16,554, +2.44% from previous year)
- 2024: $744,513 (+$49,884, +7.18% from previous year)
- 2025: $802,896 (+$58,383, +7.84% from previous year)
East Greenwich’s average home value has nearly doubled since 2010, rising by 95.6% to over $802K in 2025. The town’s biggest leaps came in 2021 and 2022, and it remains among the state’s most expensive housing markets with strong growth into 2025.
East Greenwich – Elegant and Established
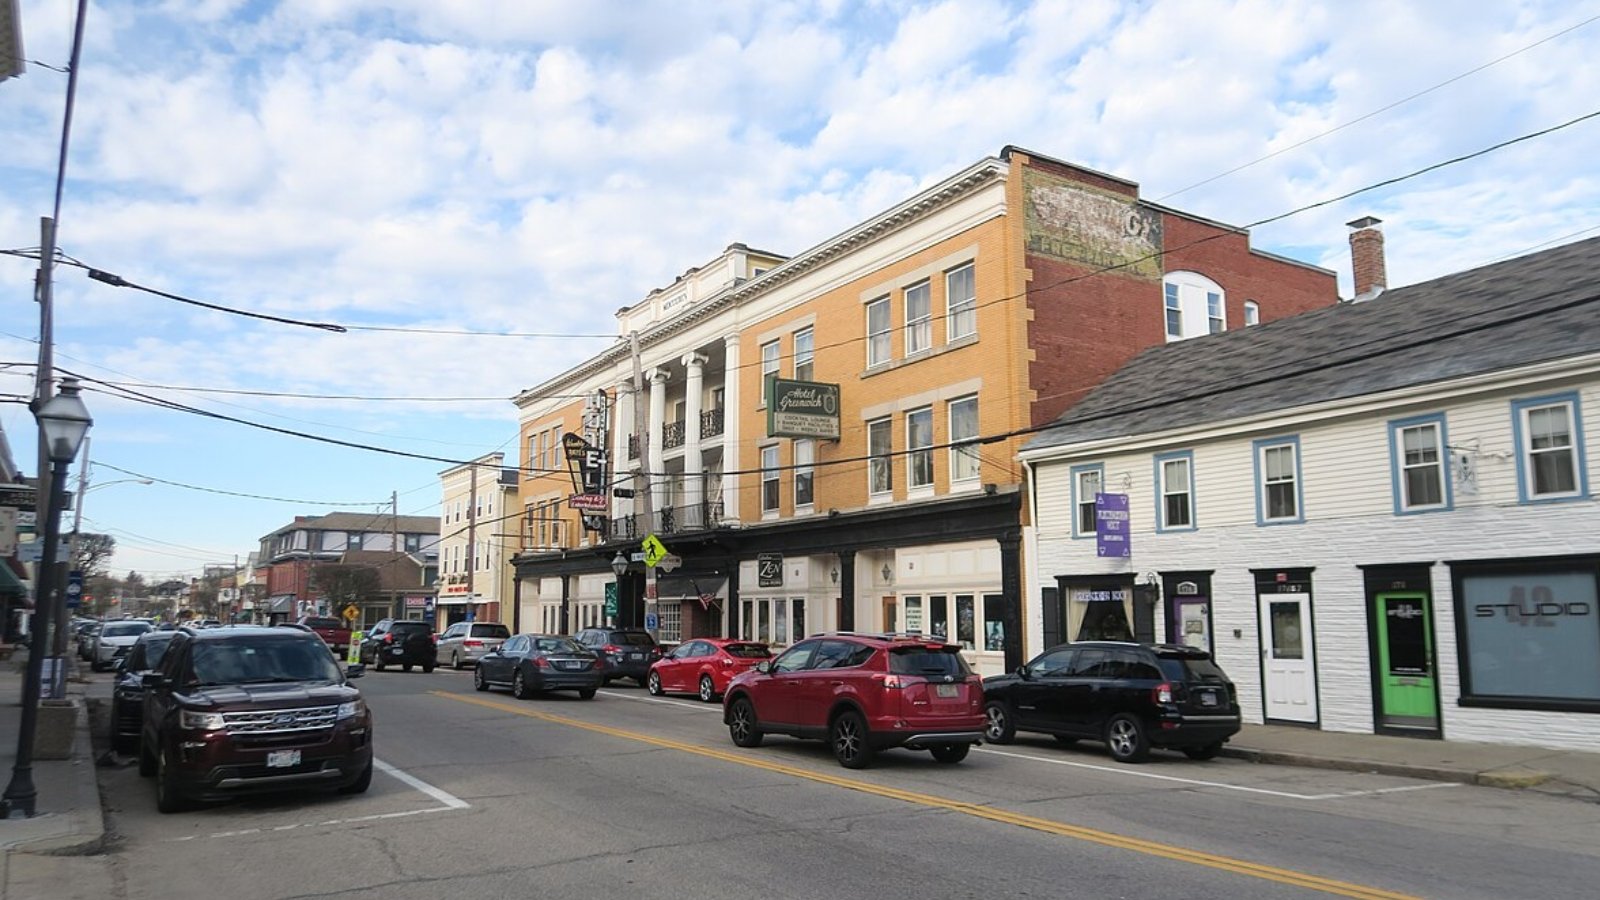
Known for its upscale homes, colonial heritage, and strong schools, East Greenwich is a quintessential Rhode Island success story. Its downtown offers fine dining, boutique shops, and marinas along Greenwich Bay, while large single-family homes dominate the western suburbs.
With a limited supply of new housing and high demand from professionals and families, East Greenwich continues to see strong price appreciation. Its combination of location, amenities, and reputation has made it one of the most elite zip codes in the state.
5. Narragansett – 149.6% Home Price Increase Since 2010
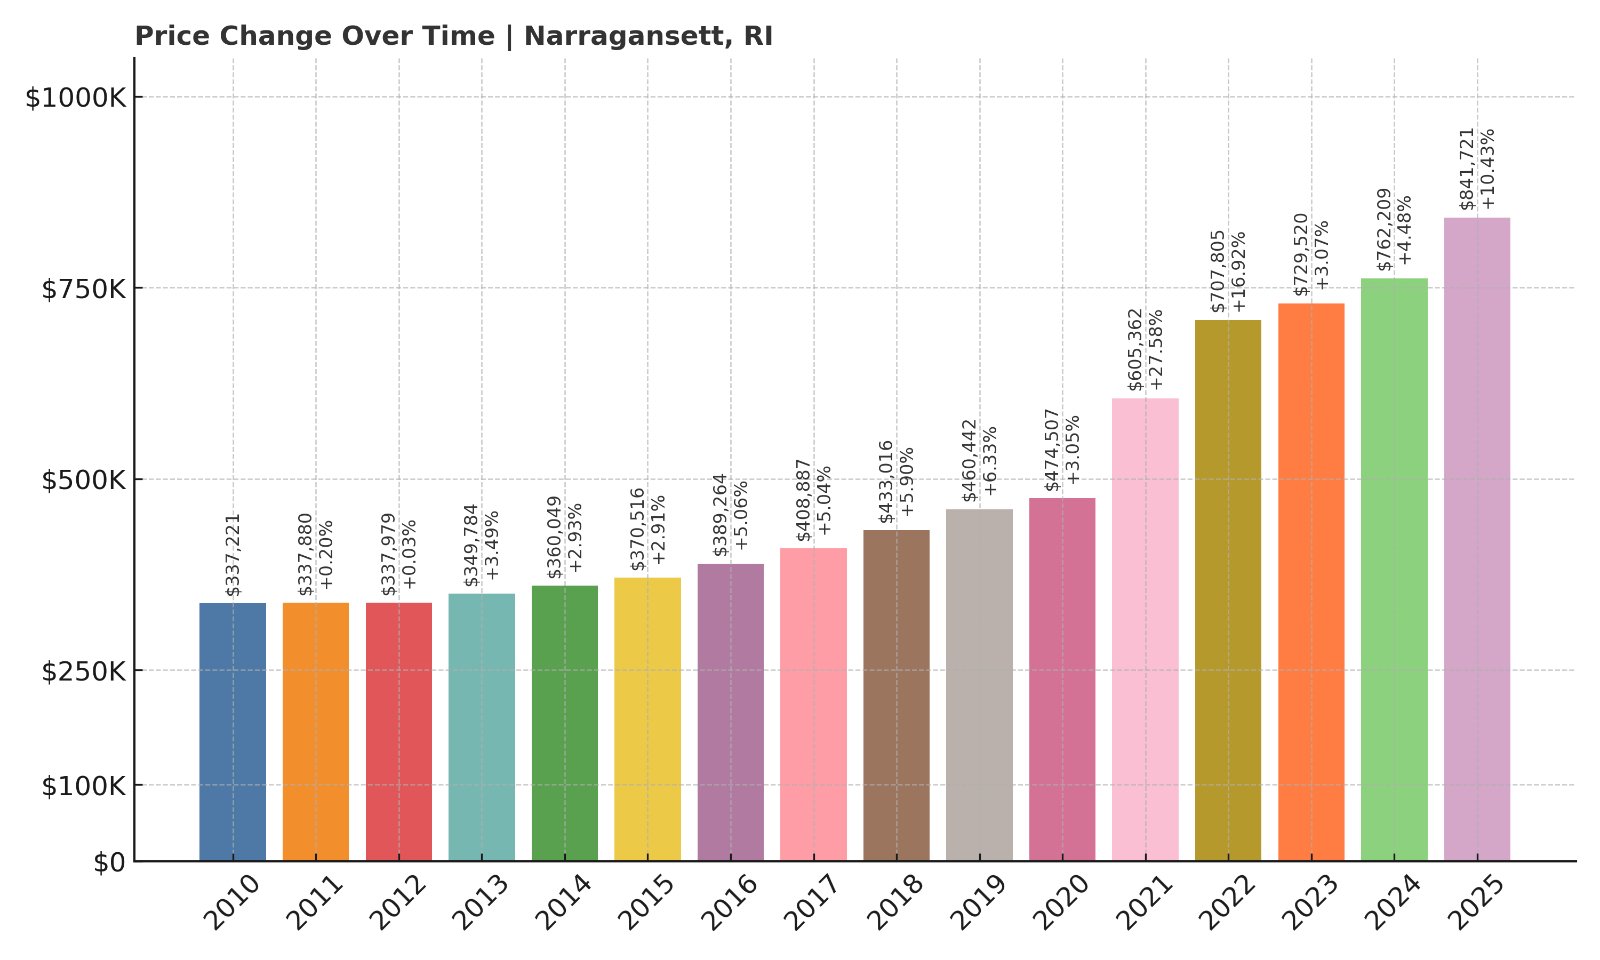
- 2010: $337,221
- 2011: $337,880 (+$659, +0.20% from previous year)
- 2012: $337,979 (+$99, +0.03% from previous year)
- 2013: $349,784 (+$11,805, +3.49% from previous year)
- 2014: $360,049 (+$10,265, +2.93% from previous year)
- 2015: $370,516 (+$10,467, +2.91% from previous year)
- 2016: $389,264 (+$18,748, +5.06% from previous year)
- 2017: $408,887 (+$19,623, +5.04% from previous year)
- 2018: $433,016 (+$24,129, +5.90% from previous year)
- 2019: $460,442 (+$27,426, +6.33% from previous year)
- 2020: $474,507 (+$14,065, +3.05% from previous year)
- 2021: $605,362 (+$130,855, +27.58% from previous year)
- 2022: $707,805 (+$102,443, +16.92% from previous year)
- 2023: $729,520 (+$21,715, +3.07% from previous year)
- 2024: $762,209 (+$32,689, +4.48% from previous year)
- 2025: $841,721 (+$79,512, +10.43% from previous year)
Narragansett has seen home prices rise nearly 150% since 2010, reaching over $841K in 2025. The town experienced meteoric growth in 2021 and 2022, and that momentum carried through with a 10.4% rise in the most recent year alone.
Narragansett – Rhode Island’s Premier Beach Destination
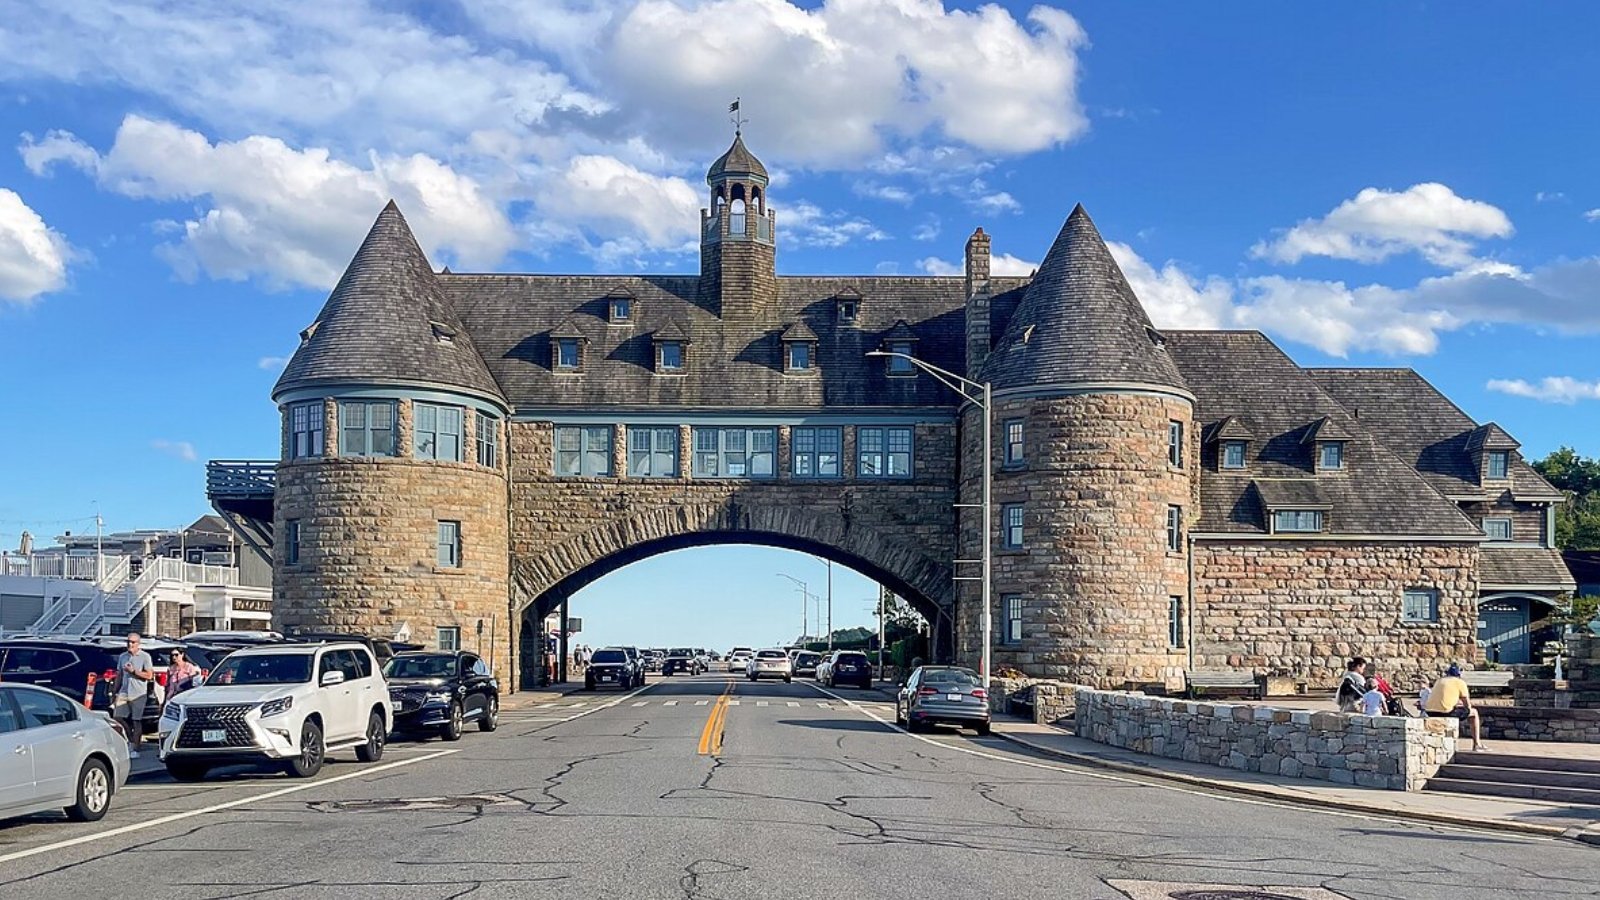
Famous for its iconic sea wall, wide beaches, and surf-friendly waves, Narragansett is a staple of Rhode Island’s vacation and second-home market. From Point Judith to Bonnet Shores, this coastal community attracts seasonal visitors and full-time residents alike.
Limited inventory, strong seasonal demand, and appeal to investors and retirees alike have kept the market red-hot. With median prices soaring, Narragansett is now firmly among the most expensive towns in the Ocean State.
4. Newport – 136.7% Home Price Increase Since 2010
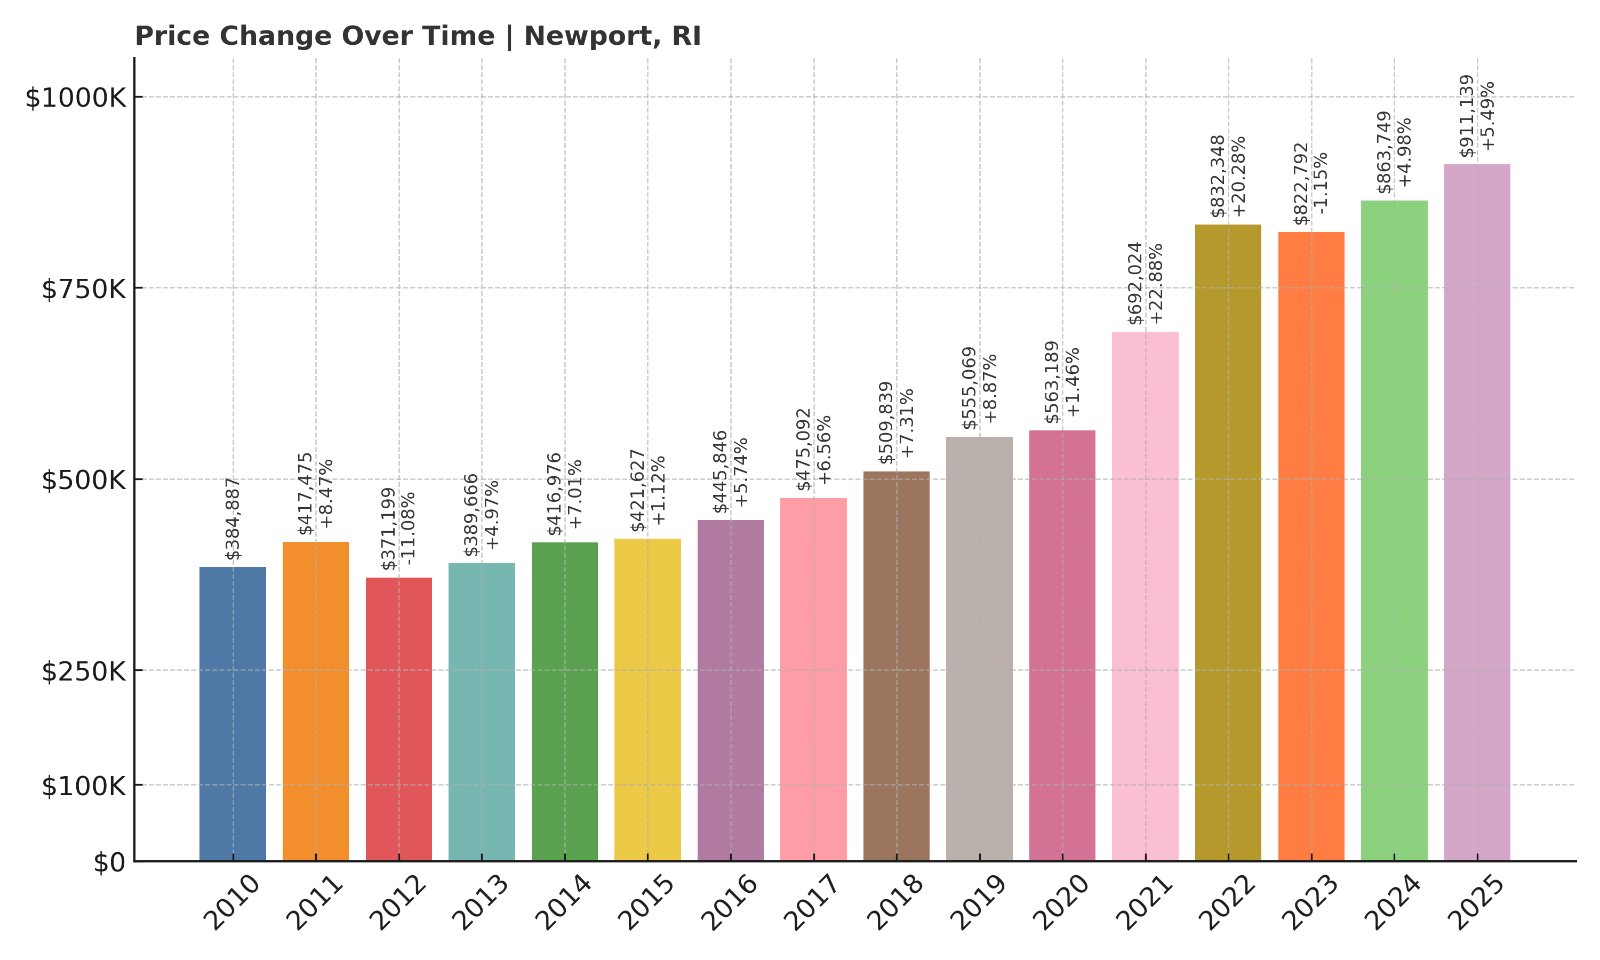
- 2010: $384,887
- 2011: $406,860 (+$21,973, +5.71%)
- 2012: $393,274 (–$13,586, –3.34%)
- 2013: $411,451 (+$18,177, +4.62%)
- 2014: $435,489 (+$24,038, +5.84%)
- 2015: $428,268 (–$7,221, –1.66%)
- 2016: $451,057 (+$22,789, +5.32%)
- 2017: $470,974 (+$19,917, +4.42%)
- 2018: $494,770 (+$23,796, +5.05%)
- 2019: $520,832 (+$26,062, +5.27%)
- 2020: $541,501 (+$20,669, +3.97%)
- 2021: $653,243 (+$111,742, +20.63%)
- 2022: $762,574 (+$109,331, +16.73%)
- 2023: $780,143 (+$17,569, +2.30%)
- 2024: $854,205 (+$74,062, +9.49%)
- 2025: $911,139 (+$56,934, +6.66%)
Newport’s property values have more than doubled since 2010, with the average home reaching over $911K in 2025. After a strong surge in 2021–2022, growth has continued at a healthy pace, making it the fourth most expensive town in the state.
Newport – Gilded Glamour and Seaside Prestige
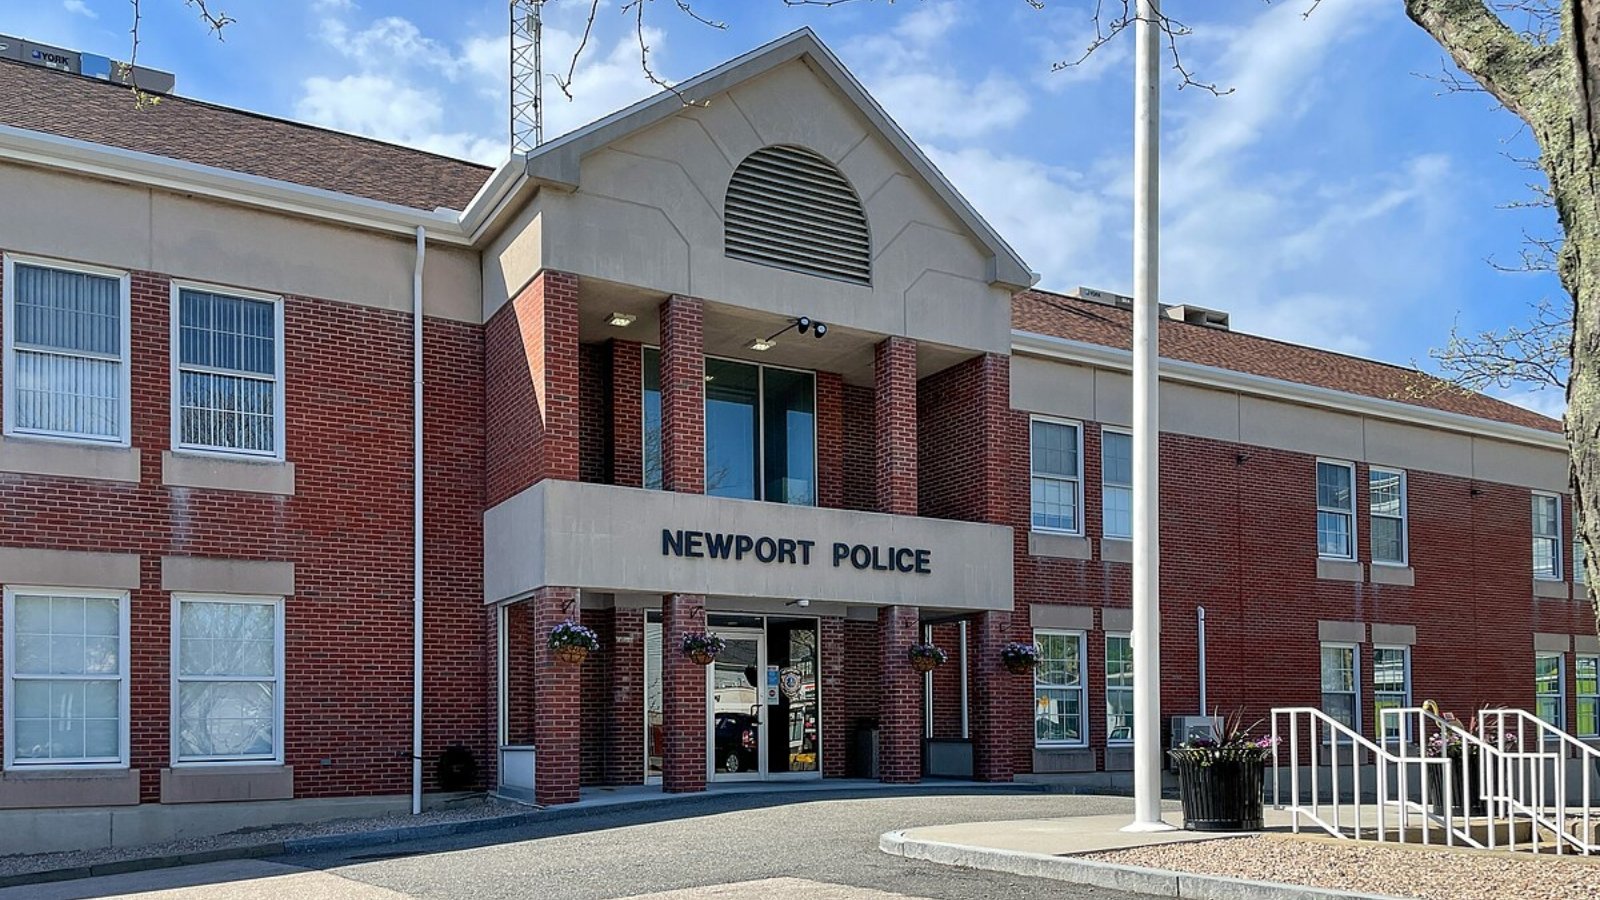
Home to historic mansions, yacht clubs, festivals, and breathtaking coastline, Newport remains Rhode Island’s most iconic destination. While once #1 in price, it now ranks fourth, edged out by rising demand in smaller, more exclusive markets — but it remains the gold standard for cultural cachet and scenic grandeur.
3. Little Compton – 118.5% Home Price Increase Since 2011
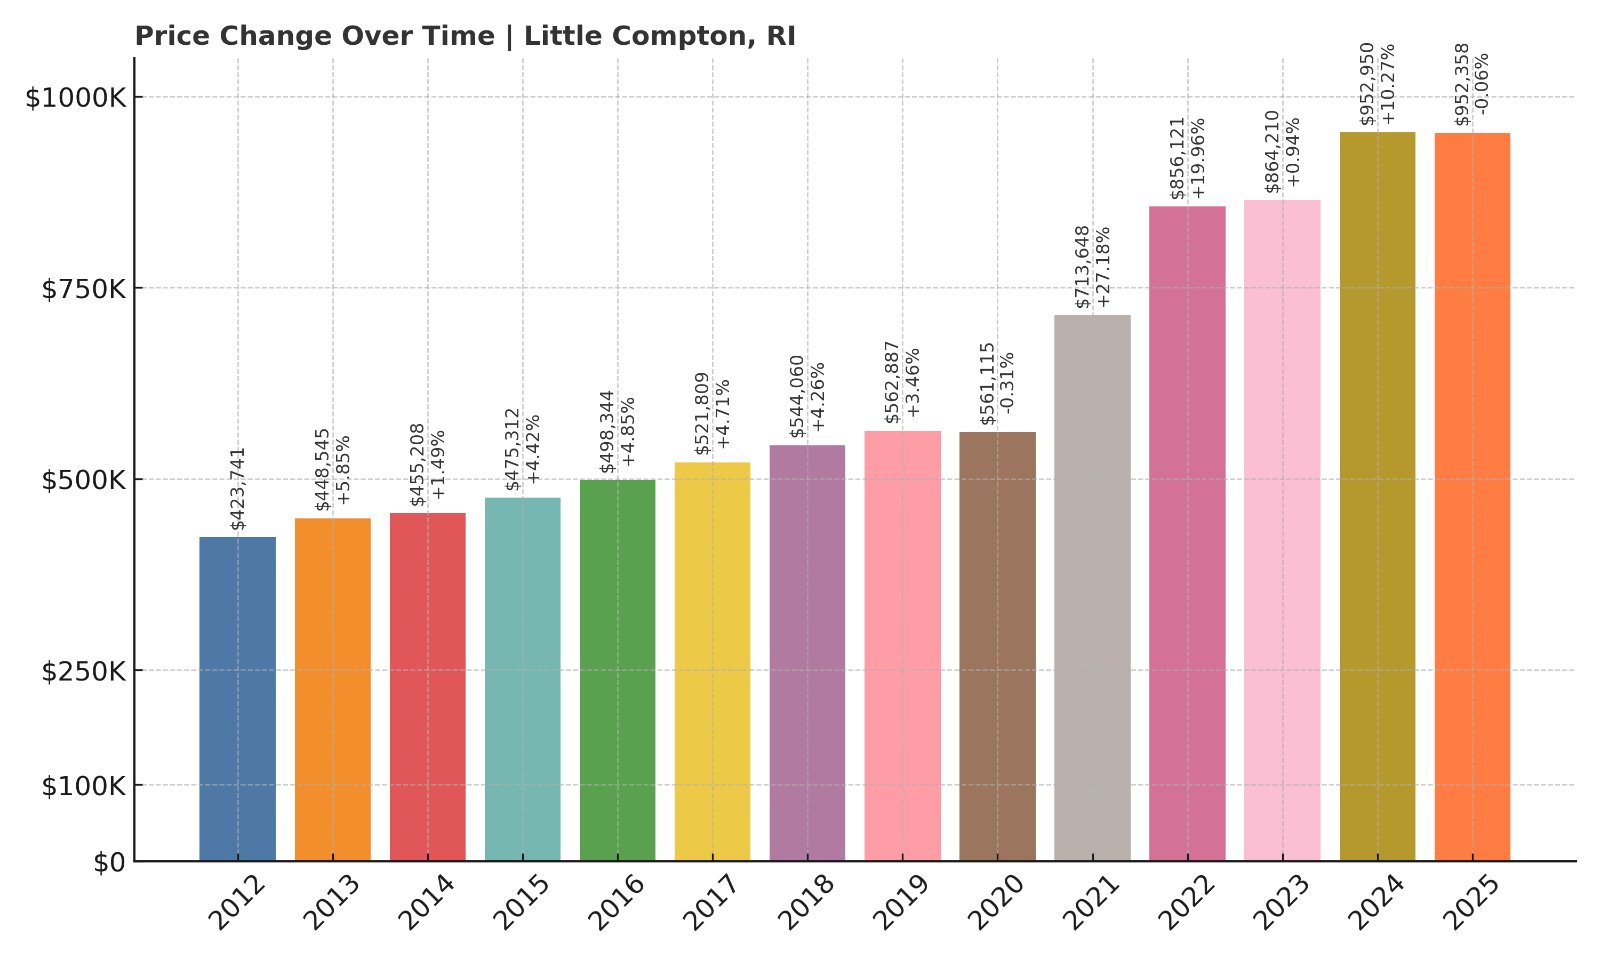
- 2011: $436,032
- 2012: $429,918 (–$6,114, –1.40%)
- 2013: $446,451 (+$16,533, +3.85%)
- 2014: $464,453 (+$18,002, +4.03%)
- 2015: $470,884 (+$6,431, +1.38%)
- 2016: $493,931 (+$23,047, +4.89%)
- 2017: $520,399 (+$26,468, +5.36%)
- 2018: $547,983 (+$27,584, +5.30%)
- 2019: $564,788 (+$16,805, +3.07%)
- 2020: $599,611 (+$34,823, +6.16%)
- 2021: $737,285 (+$137,674, +22.96%)
- 2022: $834,826 (+$97,541, +13.23%)
- 2023: $868,208 (+$33,382, +4.00%)
- 2024: $904,620 (+$36,412, +4.19%)
- 2025: $952,358 (+$47,738, +5.27%)
Little Compton has climbed steadily to nearly $1 million by 2025, with home values rising 118.5% since 2011 (2010 data not available). The town has posted strong and consistent growth, with large jumps post-2020 as demand for quiet coastal living exploded.
Little Compton – Bucolic Coastal Privacy
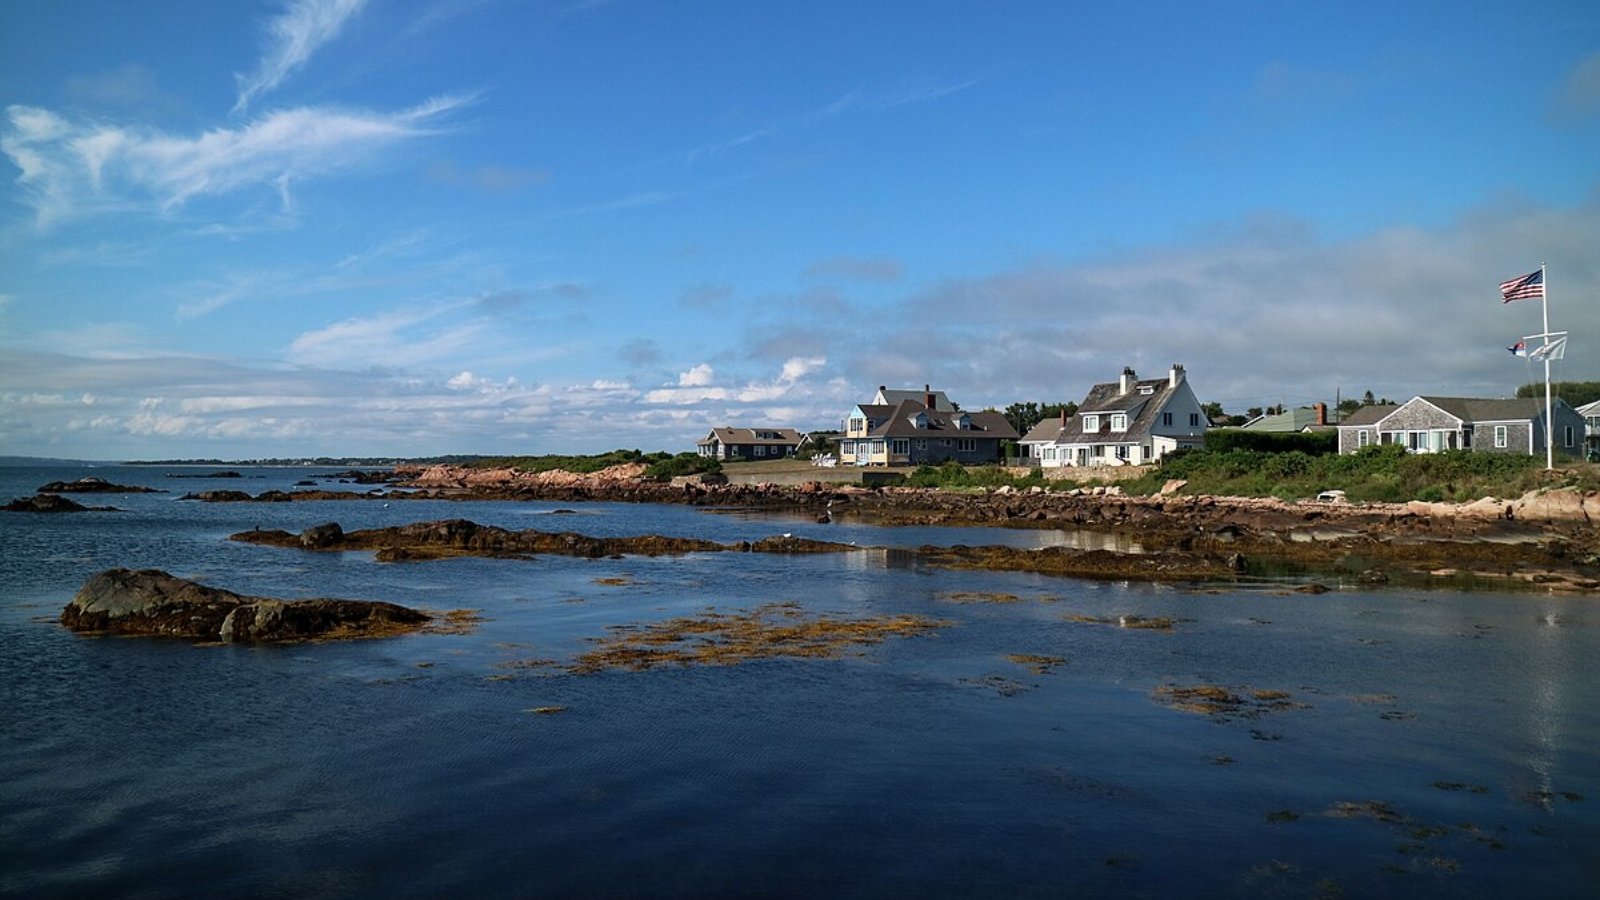
This pastoral South Coast community offers sweeping views, open farmland, and protected shoreline — with very little commercial development. Low-density zoning and historic farms have kept supply tight, drawing high-end buyers from Boston, New York, and beyond.
2. Jamestown – 118.4% Home Price Increase Since 2010
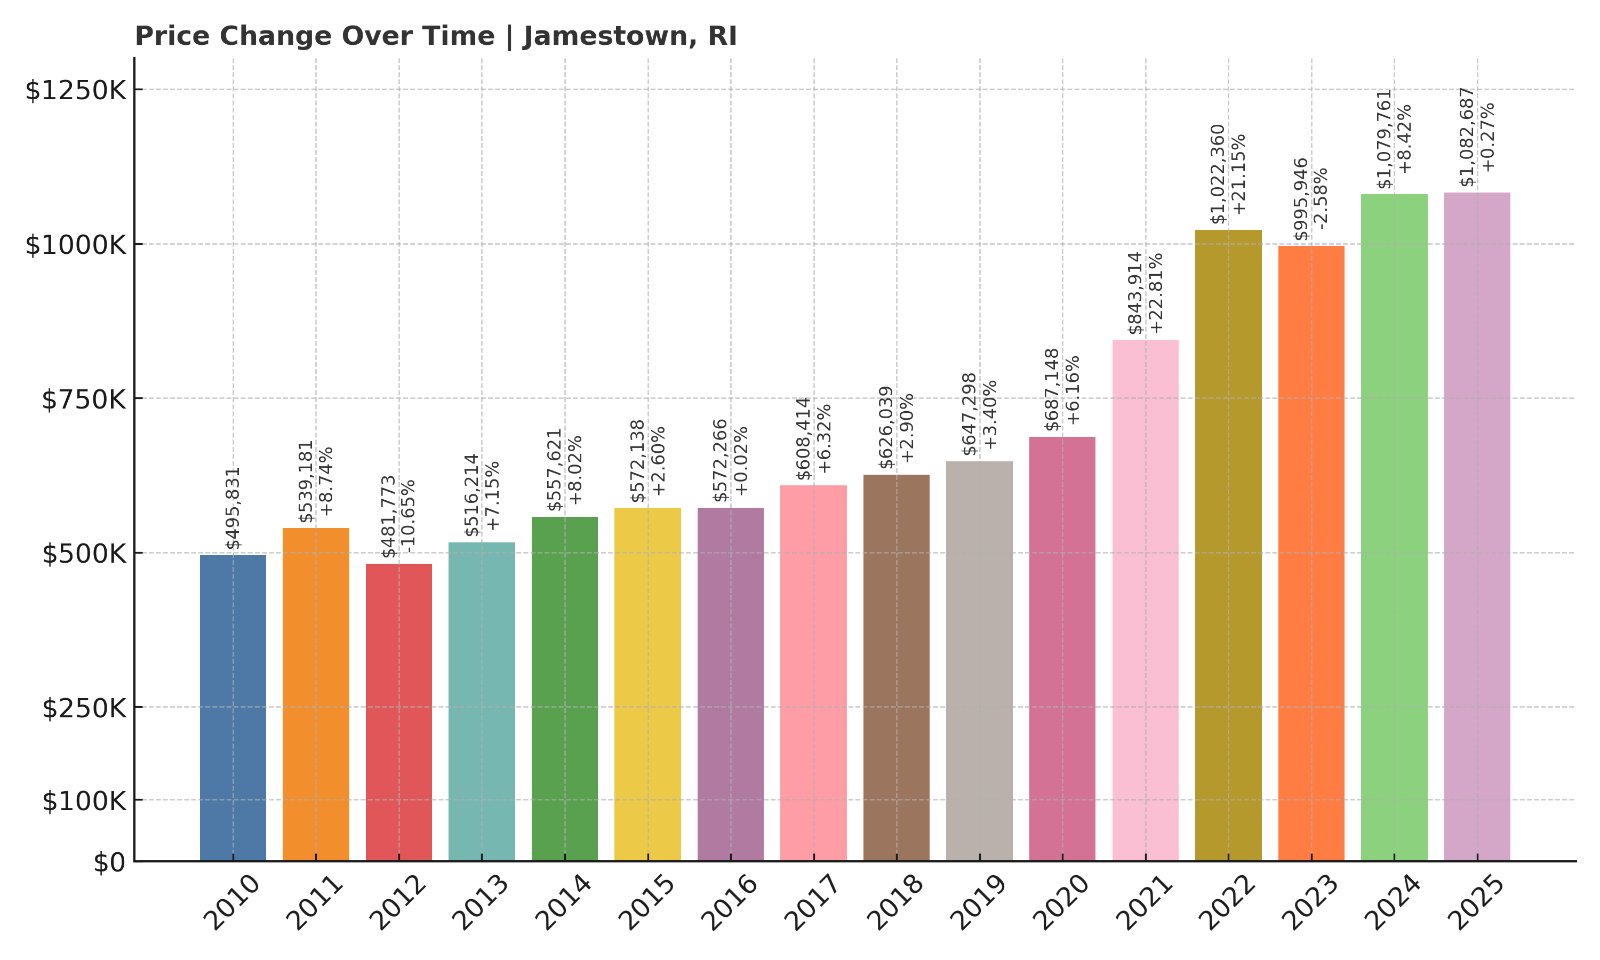
- 2010: $495,831
- 2011: $539,181 (+$43,350, +8.74%)
- 2012: $481,773 (–$57,408, –10.64%)
- 2013: $516,214 (+$34,441, +7.15%)
- 2014: $557,621 (+$41,407, +8.02%)
- 2015: $543,258 (–$14,363, –2.58%)
- 2016: $590,531 (+$47,273, +8.70%)
- 2017: $609,112 (+$18,581, +3.15%)
- 2018: $640,217 (+$31,105, +5.11%)
- 2019: $660,794 (+$20,577, +3.21%)
- 2020: $677,626 (+$16,832, +2.55%)
- 2021: $846,075 (+$168,449, +24.85%)
- 2022: $1,003,312 (+$157,237, +18.59%)
- 2023: $997,134 (–$6,178, –0.62%)
- 2024: $1,046,808 (+$49,674, +4.98%)
- 2025: $1,082,687 (+$35,879, +3.43%)
Jamestown home values have risen 118.4% since 2010, topping $1.08 million in 2025. Growth accelerated post-2020, with a massive jump in 2021 and another surge in 2022. Though it dipped slightly in 2023, it remains one of the hottest high-end markets in the state.
Jamestown – Refined Island Living
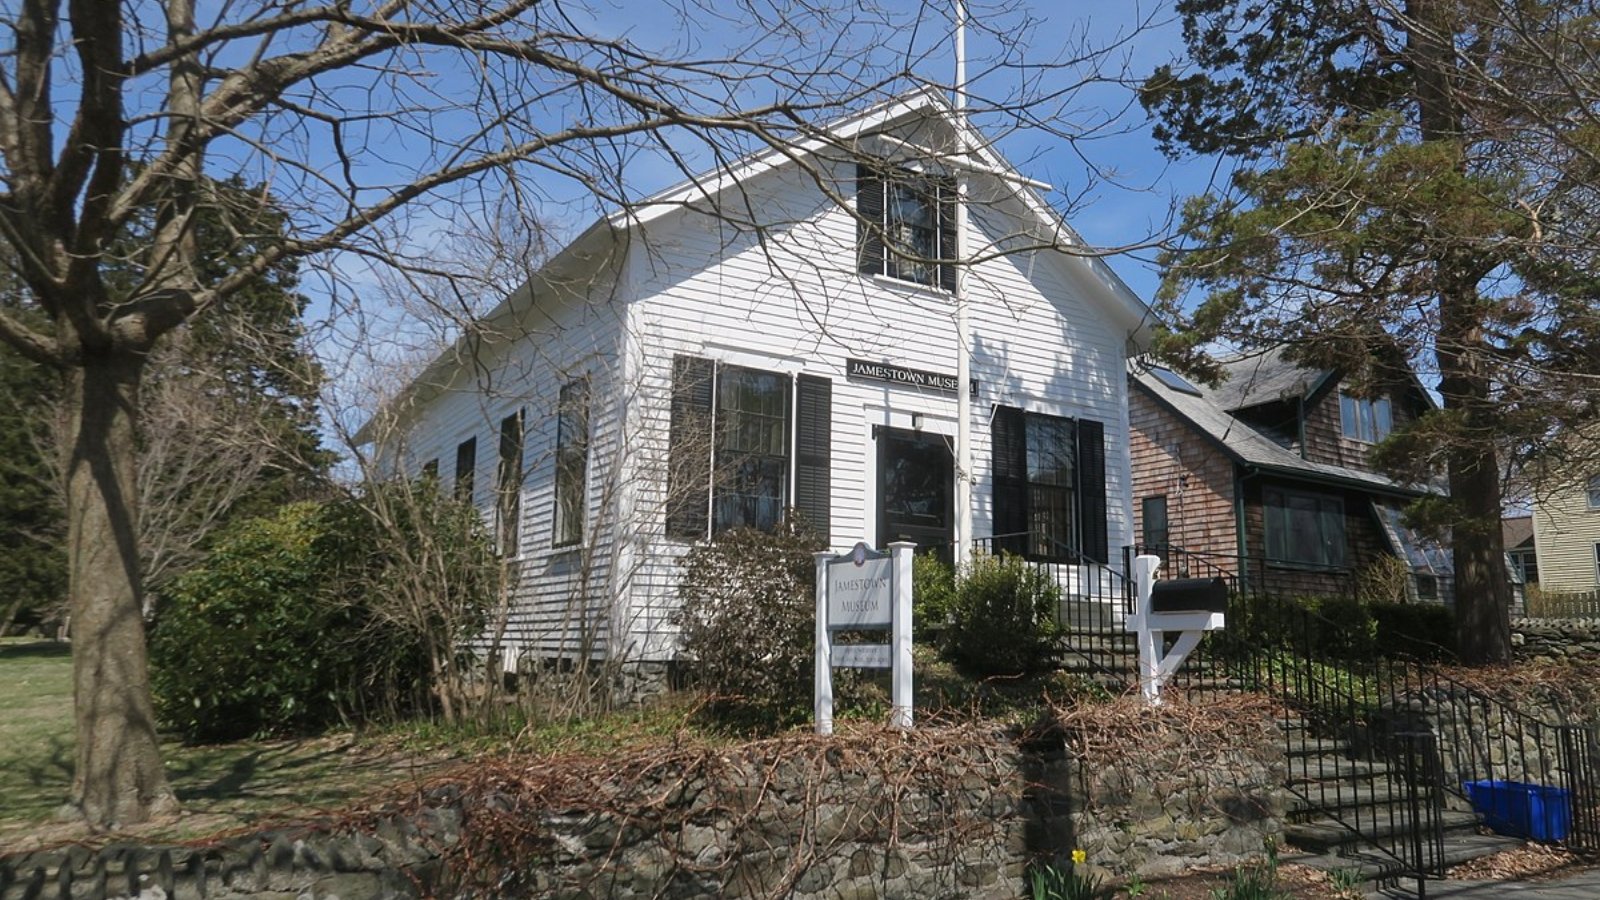
Located on Conanicut Island, Jamestown is known for its seclusion, large lots, and luxurious waterfront homes. With limited development and ferry access to Newport, the town has become a top-tier retreat for those seeking both privacy and prestige.
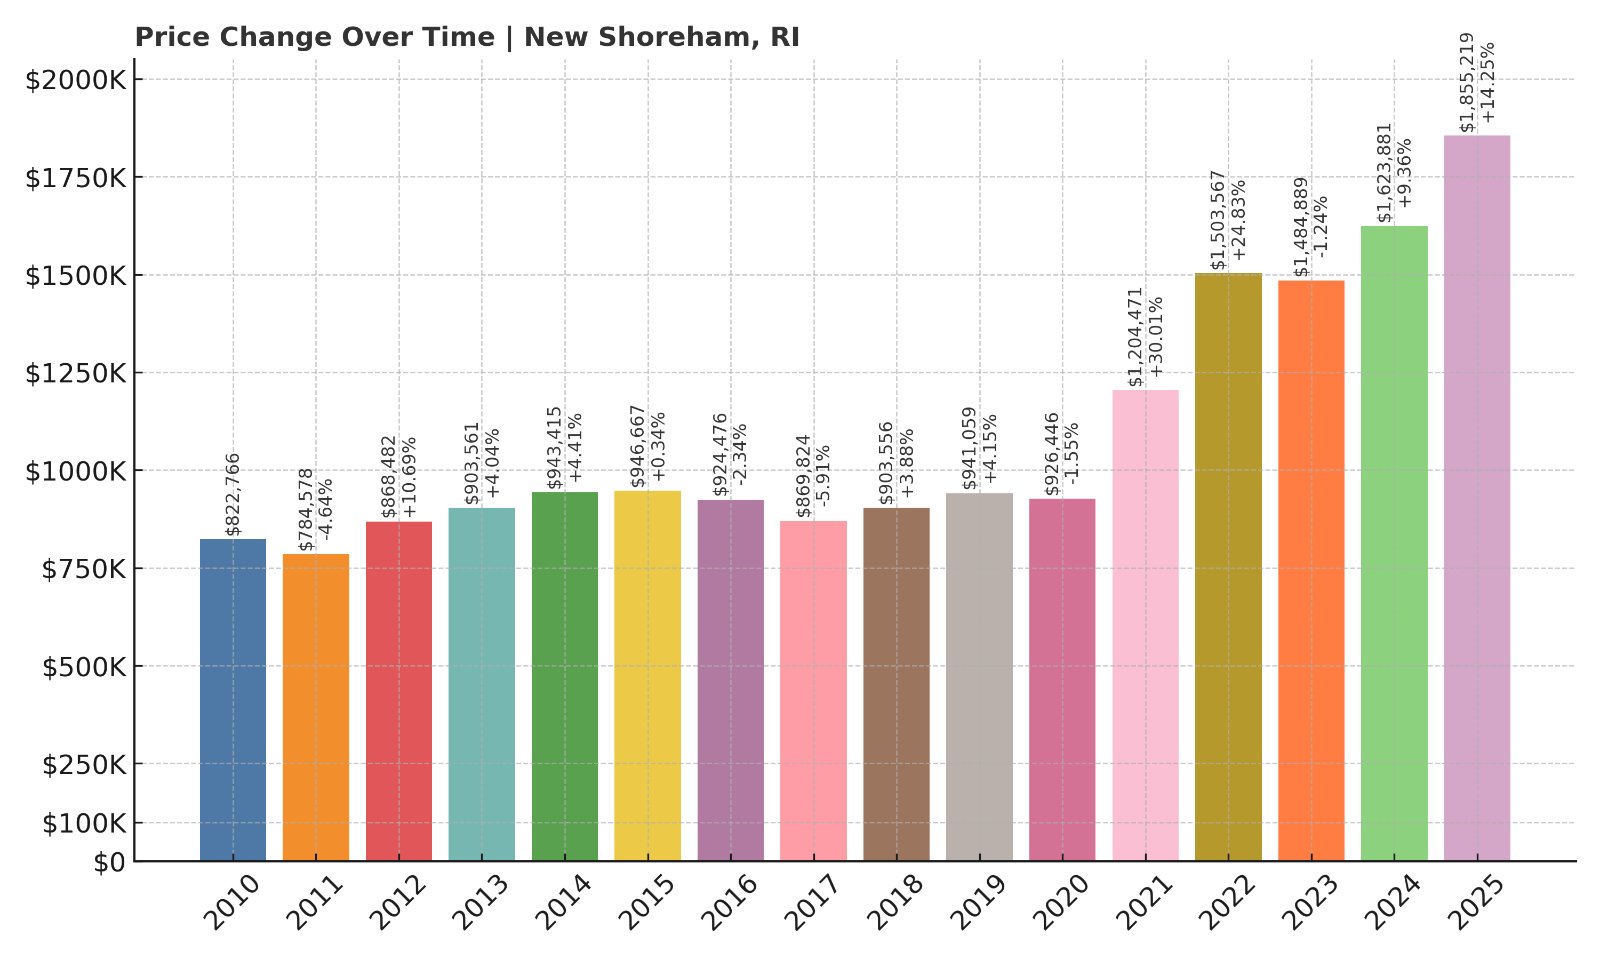
1. New Shoreham (Block Island) – 125.5% Home Price Increase Since 2010
- 2010: $822,766
- 2011: $834,246 (+$11,480, +1.40%)
- 2012: $784,601 (–$49,645, –5.95%)
- 2013: $816,755 (+$32,154, +4.10%)
- 2014: $834,685 (+$17,930, +2.20%)
- 2015: $814,143 (–$20,542, –2.46%)
- 2016: $839,064 (+$24,921, +3.06%)
- 2017: $855,594 (+$16,530, +1.97%)
- 2018: $880,569 (+$24,975, +2.92%)
- 2019: $880,238 (–$331, –0.04%)
- 2020: $902,792 (+$22,554, +2.56%)
- 2021: $1,065,173 (+$162,381, +17.98%)
- 2022: $1,227,591 (+$162,418, +15.25%)
- 2023: $1,306,529 (+$78,938, +6.43%)
- 2024: $1,526,842 (+$220,313, +16.86%)
- 2025: $1,855,219 (+$328,377, +21.51%)
New Shoreham (Block Island) leads the state with a jaw-dropping $1.86 million average home value in 2025. Up 125.5% since 2010, the market has exploded post-pandemic, with three consecutive years of double-digit growth — and no signs of slowing.
Block Island – Seclusion at a Premium

With ferry-only access, strict zoning, and limited housing stock, Block Island is the most exclusive market in Rhode Island. Its dramatic cliffs, beaches, and rural atmosphere draw affluent second-home buyers and investors who prize natural beauty and total privacy.


