🔥 Would you like to save this?
South Carolina’s housing market isn’t slowing down. Data from the Zillow Home Value Index shows property prices skyrocketing in towns that used to fly under the radar. Oceanfront escapes, charming suburbs, even once-sleepy inland communities—buyers are paying top dollar just to get a foothold. Over the past 15 years, some towns have seen prices climb so sharply that first-time buyers barely stand a chance. Whether you’re scouting for a beach house or just curious where money disappears fastest, these 35 towns reveal where South Carolina real estate has truly taken off.
35. Murrells Inlet – 101% Home Price Increase Since 2010
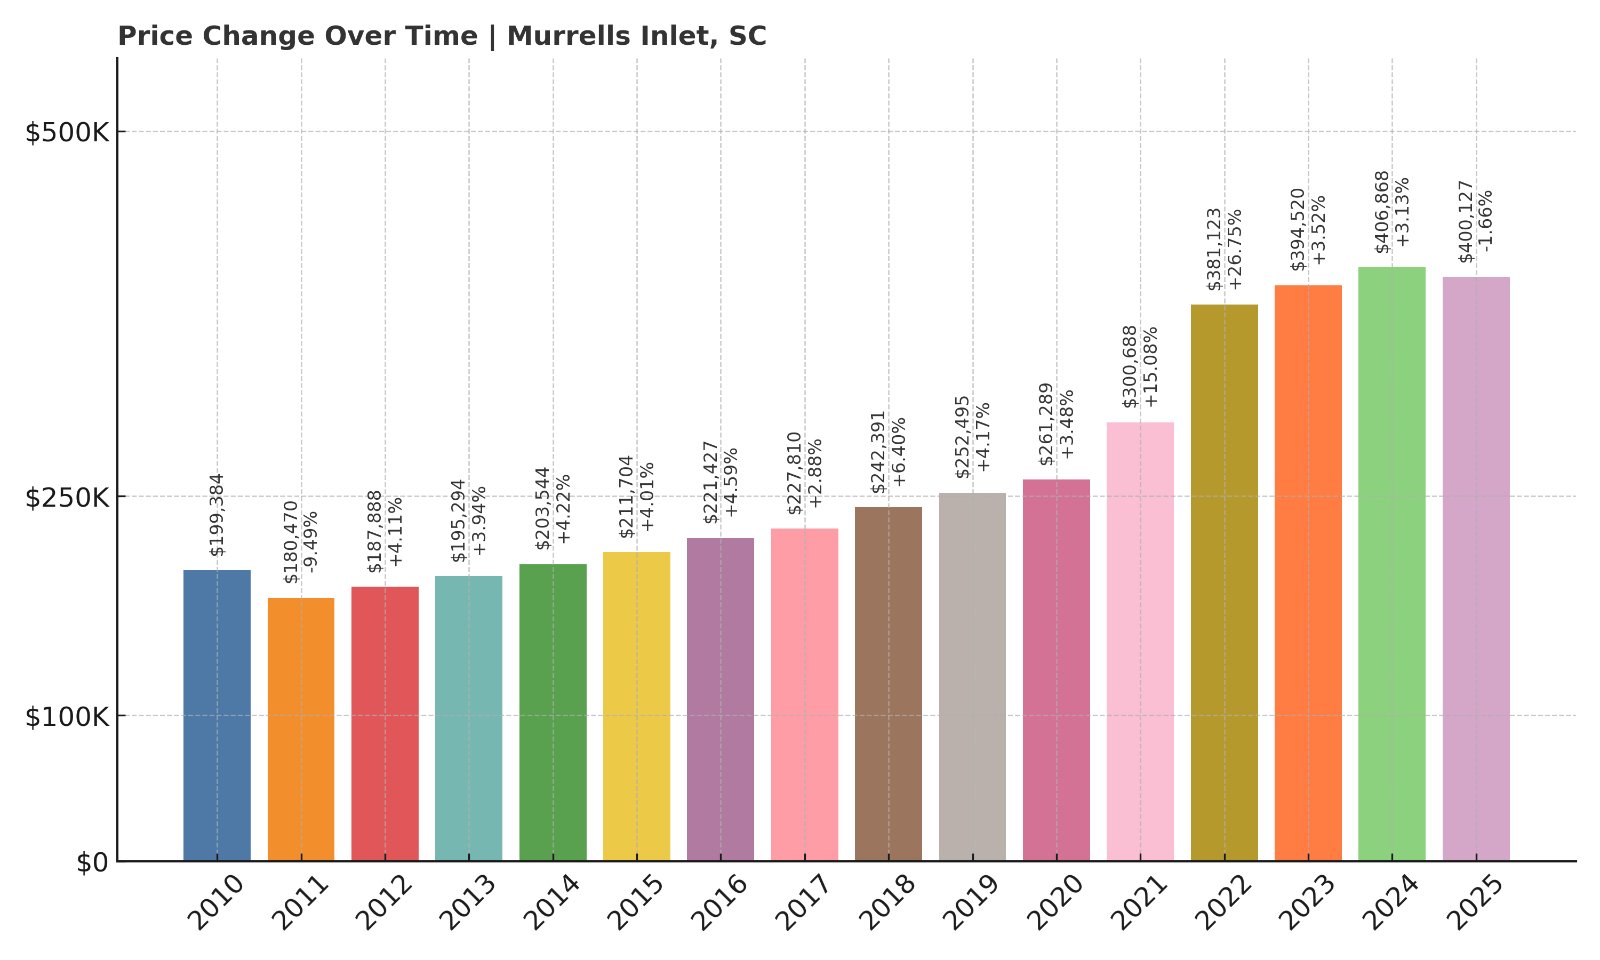
- 2010: $199,384
- 2011: $180,470 (-$18,914, -9.49% from previous year)
- 2012: $187,888 (+$7,419, +4.11% from previous year)
- 2013: $195,294 (+$7,406, +3.94% from previous year)
- 2014: $203,544 (+$8,250, +4.22% from previous year)
- 2015: $211,704 (+$8,159, +4.01% from previous year)
- 2016: $221,427 (+$9,724, +4.59% from previous year)
- 2017: $227,810 (+$6,383, +2.88% from previous year)
- 2018: $242,391 (+$14,580, +6.40% from previous year)
- 2019: $252,495 (+$10,104, +4.17% from previous year)
- 2020: $261,289 (+$8,794, +3.48% from previous year)
- 2021: $300,688 (+$39,400, +15.08% from previous year)
- 2022: $381,123 (+$80,434, +26.75% from previous year)
- 2023: $394,520 (+$13,397, +3.52% from previous year)
- 2024: $406,868 (+$12,348, +3.13% from previous year)
- 2025: $400,127 (-$6,740, -1.66% from previous year)
Murrells Inlet has seen a steady climb in home values, doubling since 2010. While prices dipped slightly in 2025, the long-term trend remains upward. Its coastal charm continues to attract buyers even amid recent cooling.
In order to come up with the very specific design ideas, we create most designs with the assistance of state-of-the-art AI interior design software. Also, assume links that take you off the site are affiliate links such as links to Amazon. this means we may earn a commission if you buy something.
Murrells Inlet – Coastal Living with a Laid-Back Feel
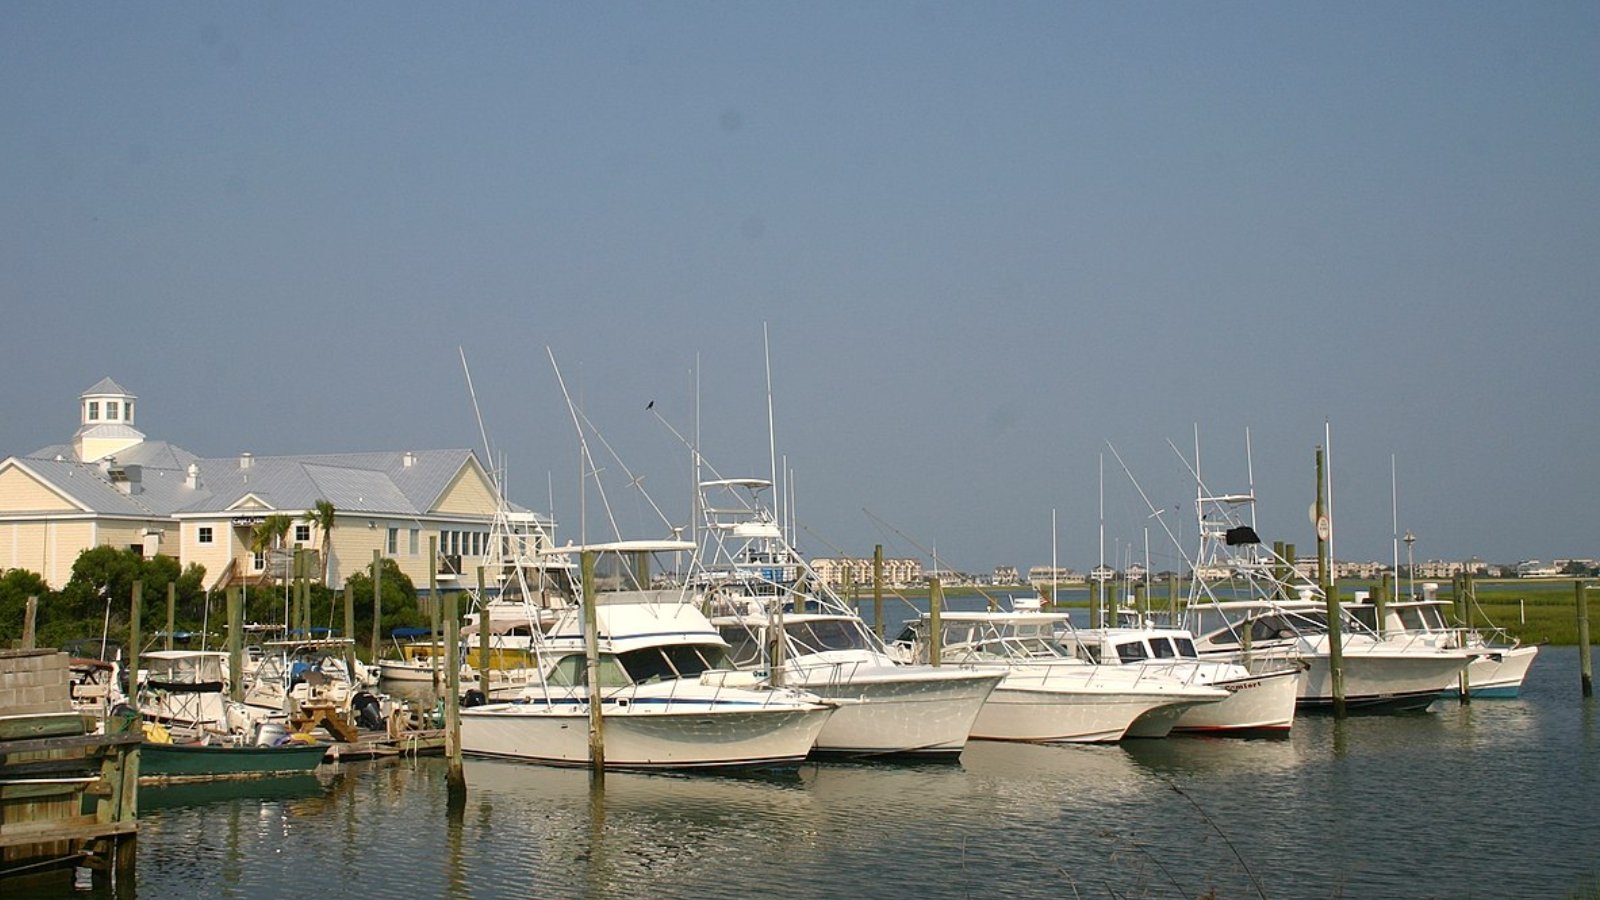
Located along the Grand Strand just south of Myrtle Beach, Murrells Inlet is known for its seafood restaurants, boardwalks, and marsh views. Its appeal as a quieter alternative to Myrtle Beach has helped fuel demand for homes. The sharp increases in 2021 and 2022 likely reflect a post-pandemic surge as more people sought homes near the water.
Despite a slight price dip in 2025, typical home values remain just over $400,000. The inlet’s lifestyle offerings—from boating to bike paths—continue to draw buyers looking for scenic living with plenty of amenities.
34. Townville – 111% Home Price Increase Since 2010
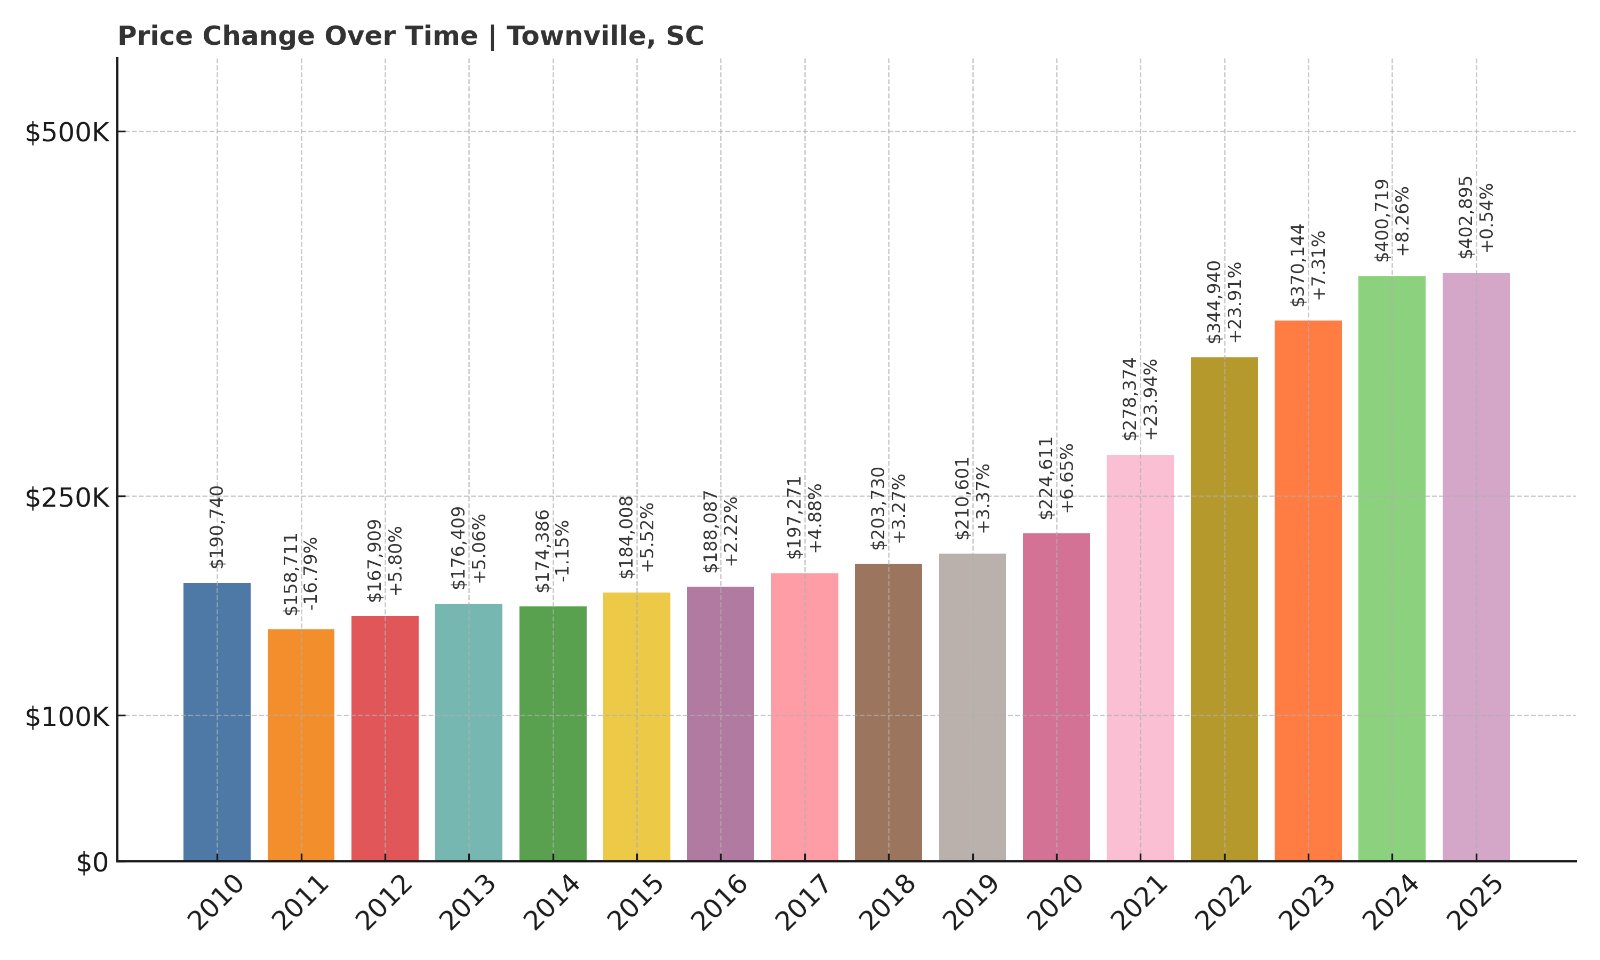
- 2010: $190,740
- 2011: $158,711 (-$32,029, -16.79% from previous year)
- 2012: $167,909 (+$9,198, +5.80% from previous year)
- 2013: $176,409 (+$8,500, +5.06% from previous year)
- 2014: $174,386 (-$2,022, -1.15% from previous year)
- 2015: $184,008 (+$9,622, +5.52% from previous year)
- 2016: $188,087 (+$4,079, +2.22% from previous year)
- 2017: $197,271 (+$9,183, +4.88% from previous year)
- 2018: $203,730 (+$6,459, +3.27% from previous year)
- 2019: $210,601 (+$6,871, +3.37% from previous year)
- 2020: $224,611 (+$14,010, +6.65% from previous year)
- 2021: $278,374 (+$53,763, +23.94% from previous year)
- 2022: $344,940 (+$66,566, +23.91% from previous year)
- 2023: $370,144 (+$25,204, +7.31% from previous year)
- 2024: $400,719 (+$30,576, +8.26% from previous year)
- 2025: $402,895 (+$2,176, +0.54% from previous year)
Townville home prices have more than doubled since 2010, with a dramatic acceleration starting in 2020. That spike reflects regional demand combined with relatively affordable prices compared to coastal areas.
Townville – Rural Roots, Rapid Rise
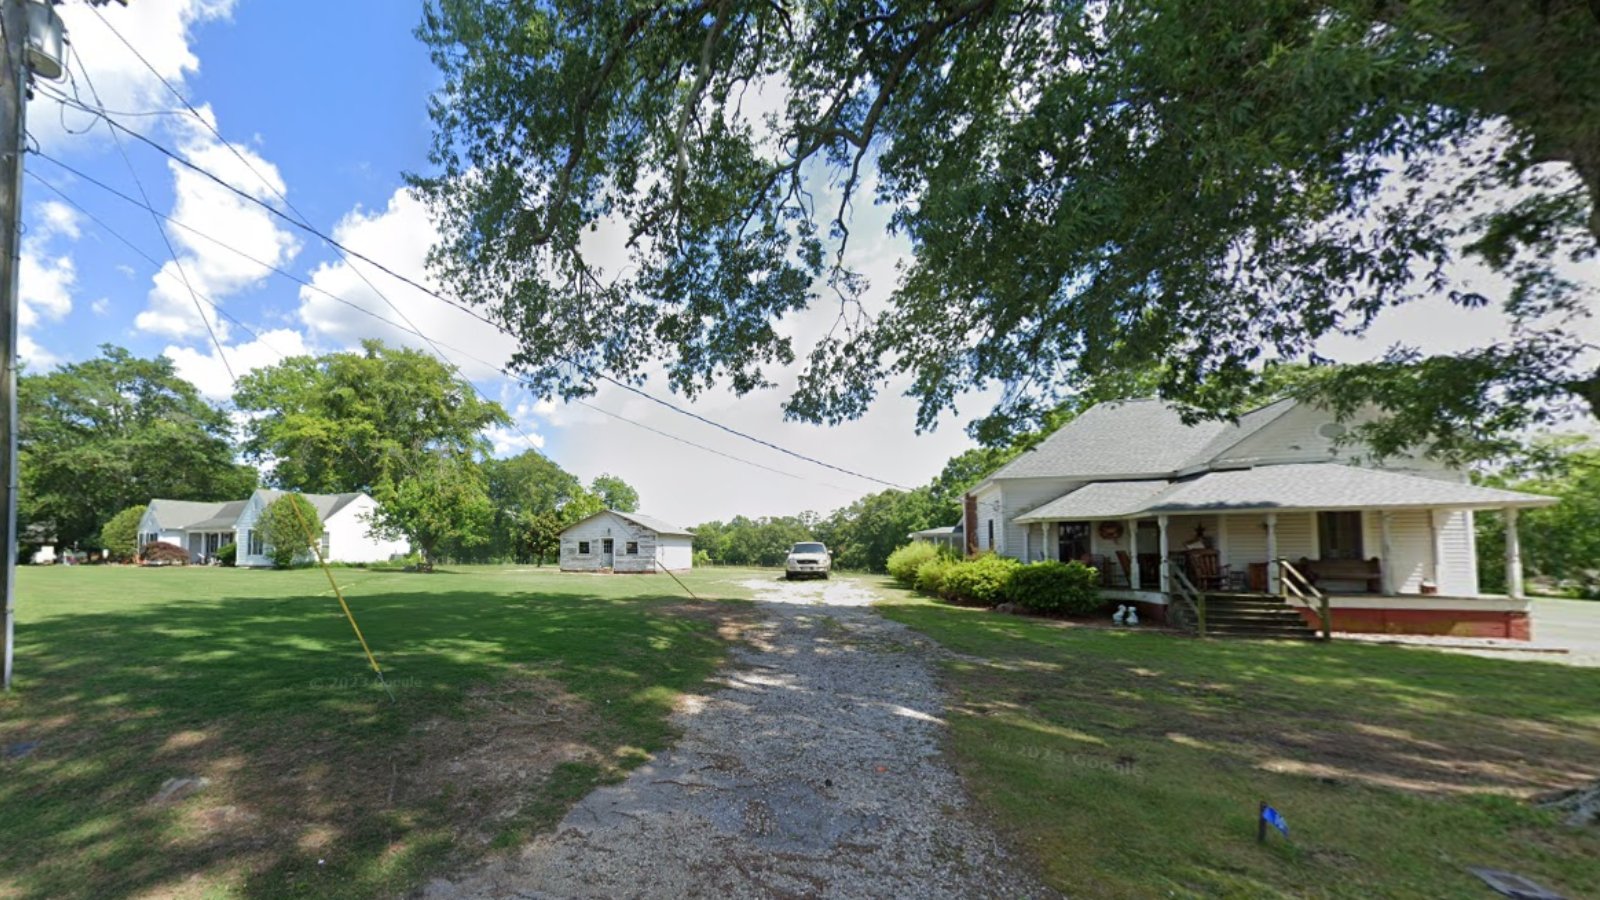
Tucked in the northwest corner of South Carolina near Lake Hartwell, Townville blends rural tranquility with lakefront living. Its low starting home prices in the early 2010s allowed room for significant appreciation.
In recent years, increased interest from retirees and remote workers has added pressure to the market. Despite a cooling off in 2025, prices are holding above $400,000—a significant climb for a town that was below $200,000 just 10 years ago.
33. Clemson – 118% Home Price Increase Since 2010
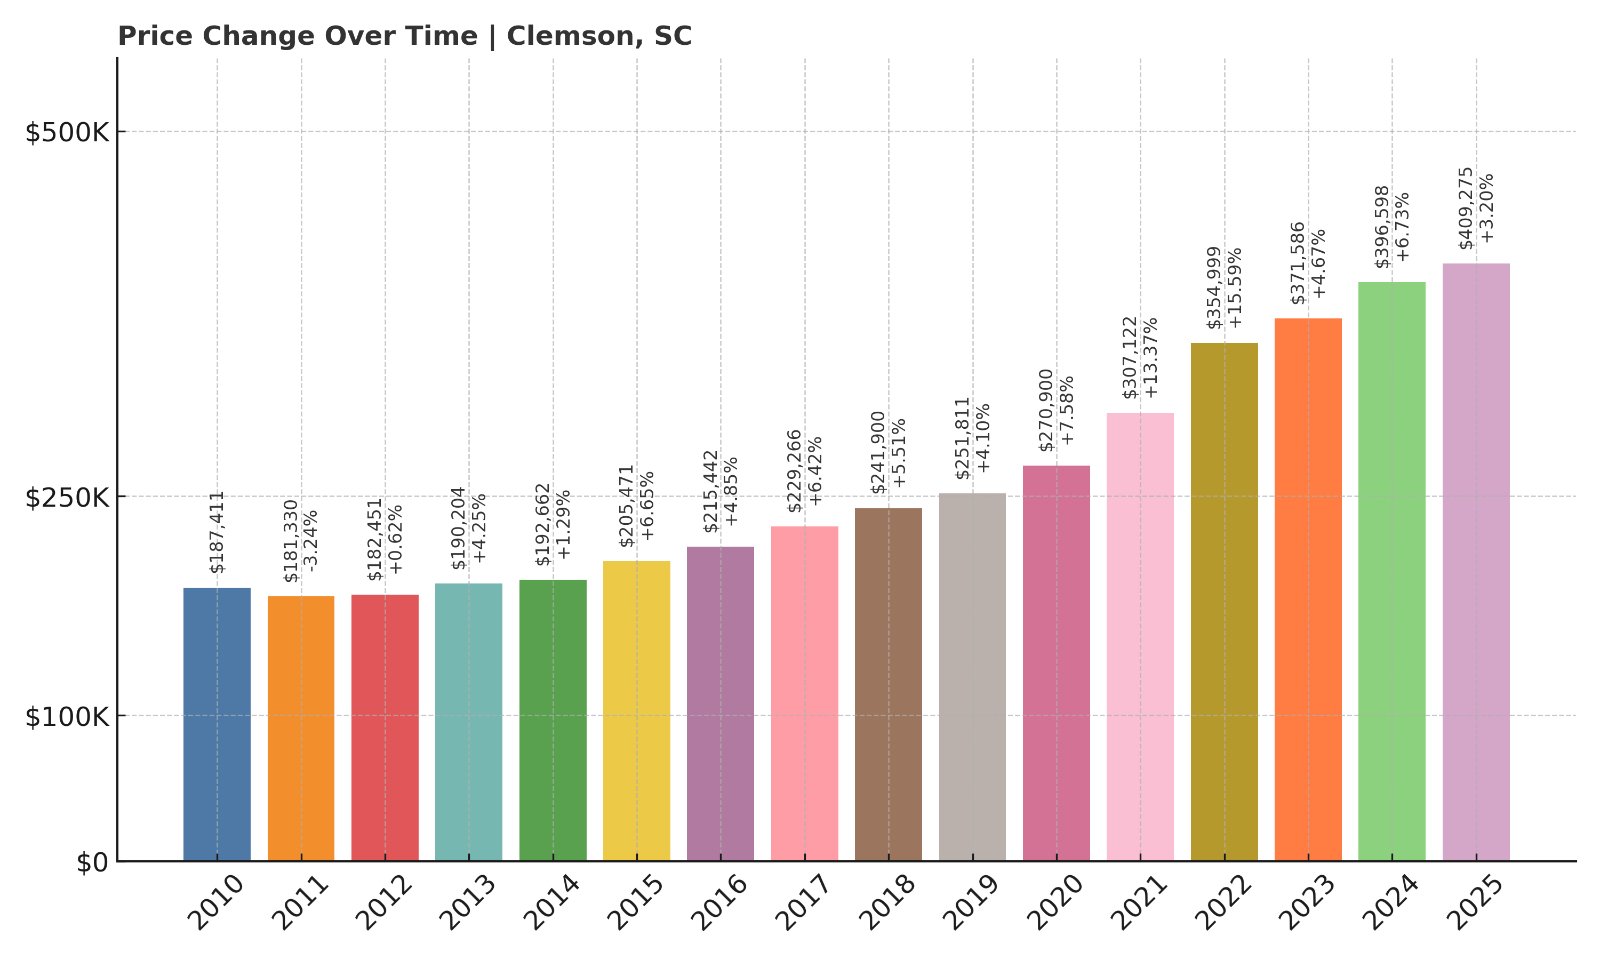
- 2010: $187,411
- 2011: $181,330 (-$6,081, -3.24% from previous year)
- 2012: $182,451 (+$1,121, +0.62% from previous year)
- 2013: $190,204 (+$7,753, +4.25% from previous year)
- 2014: $192,662 (+$2,458, +1.29% from previous year)
- 2015: $205,471 (+$12,809, +6.65% from previous year)
- 2016: $215,442 (+$9,971, +4.85% from previous year)
- 2017: $229,266 (+$13,825, +6.42% from previous year)
- 2018: $241,900 (+$12,634, +5.51% from previous year)
- 2019: $251,811 (+$9,911, +4.10% from previous year)
- 2020: $270,900 (+$19,089, +7.58% from previous year)
- 2021: $307,122 (+$36,222, +13.37% from previous year)
- 2022: $354,999 (+$47,877, +15.59% from previous year)
- 2023: $371,586 (+$16,587, +4.67% from previous year)
- 2024: $396,598 (+$25,012, +6.73% from previous year)
- 2025: $409,275 (+$12,677, +3.20% from previous year)
Home values in Clemson have more than doubled since 2010, with a notably fast-paced climb after 2020. Price growth has been consistent, supported by ongoing demand tied to the university and town infrastructure.
Clemson – A University Town on the Move
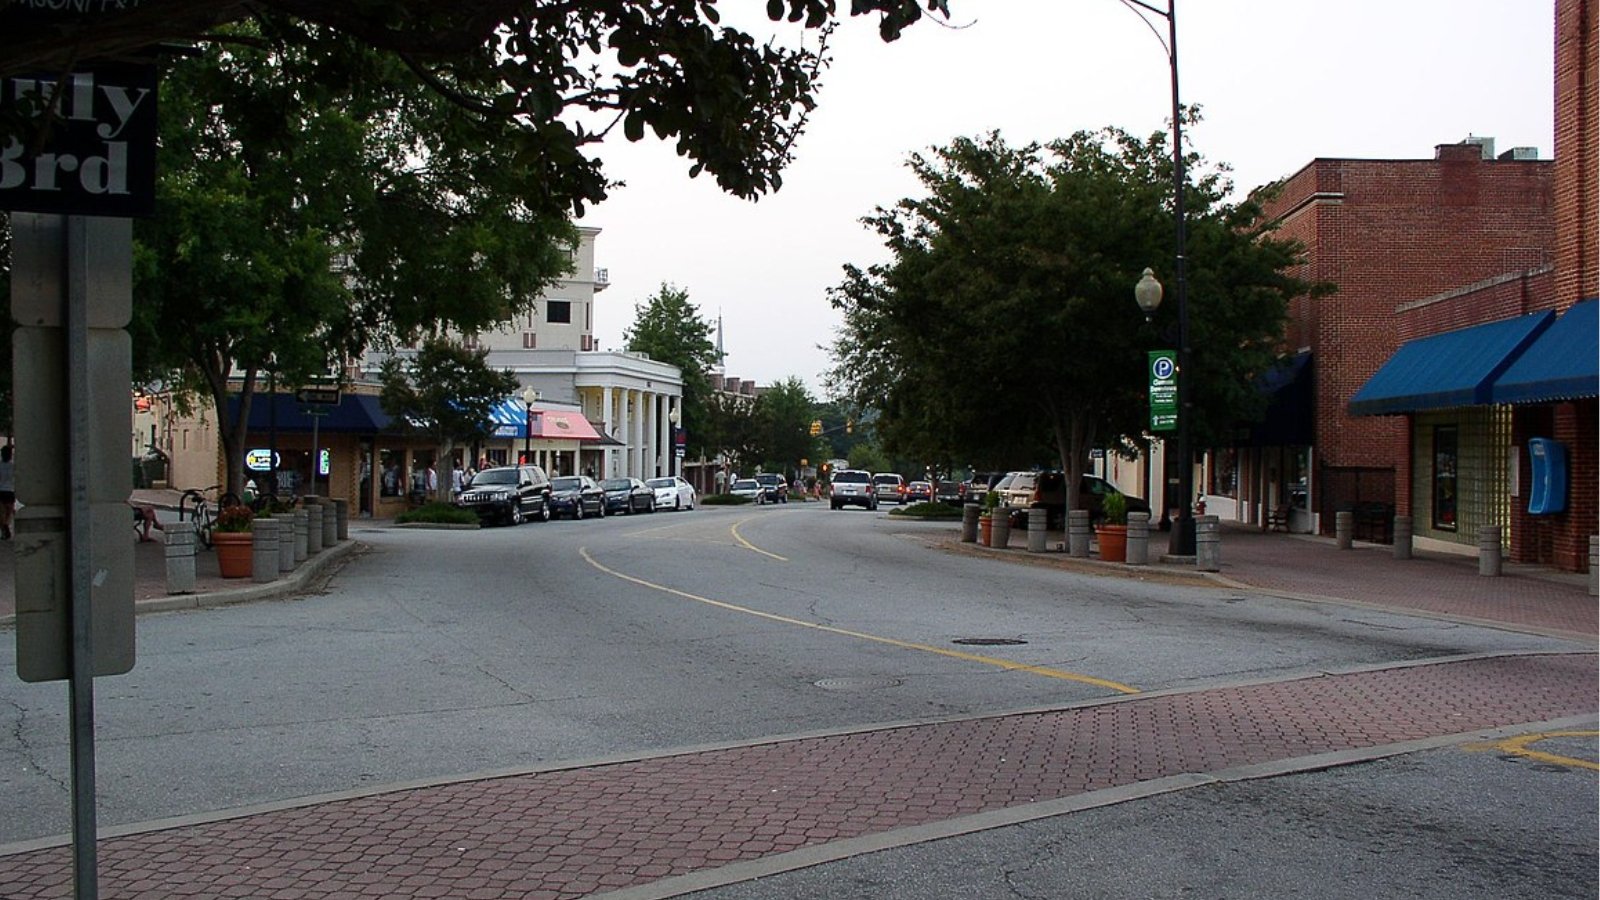
As the home of Clemson University, the town has a built-in demand for housing from students, faculty, and staff. The area also benefits from its position along Lake Hartwell and proximity to the Blue Ridge Mountains.
With a 2025 median price over $400,000, Clemson has become one of the most expensive inland towns in South Carolina. Demand for investment properties, rentals, and permanent homes continues to drive prices upward.
32. Beaufort – 97% Home Price Increase Since 2012
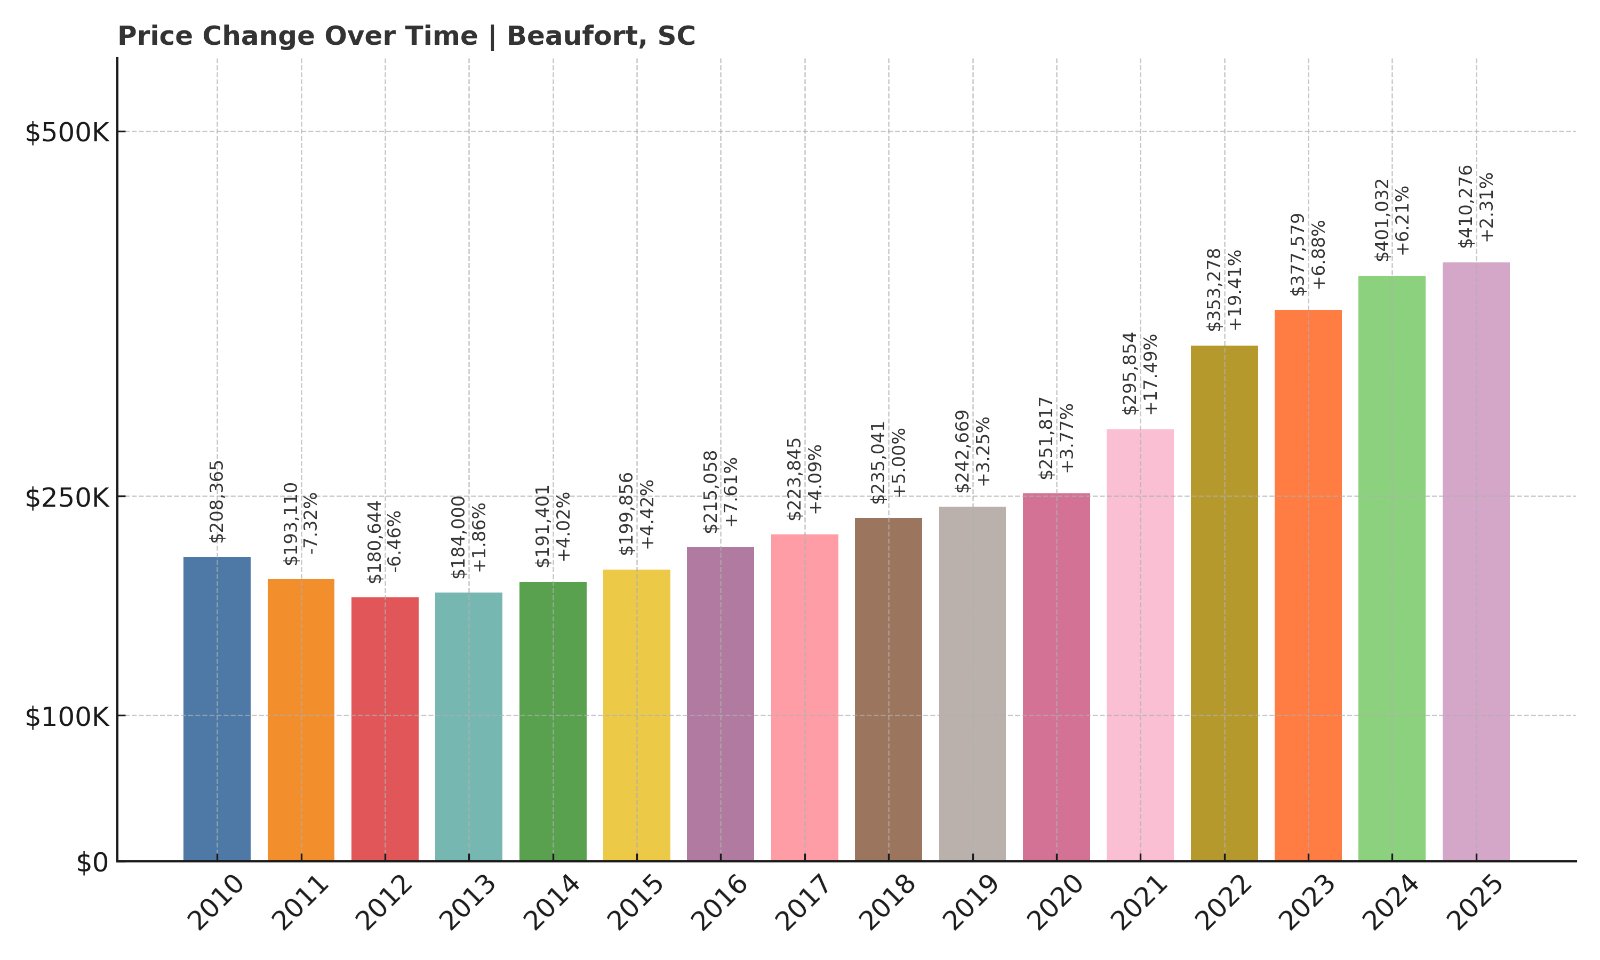
- 2012: $180,644
- 2013: $184,000 (+$3,356, +1.86% from previous year)
- 2014: $191,401 (+$7,401, +4.02% from previous year)
- 2015: $199,856 (+$8,455, +4.42% from previous year)
- 2016: $215,058 (+$15,202, +7.61% from previous year)
- 2017: $223,845 (+$8,786, +4.09% from previous year)
- 2018: $235,041 (+$11,197, +5.00% from previous year)
- 2019: $242,669 (+$7,628, +3.25% from previous year)
- 2020: $251,817 (+$9,148, +3.77% from previous year)
- 2021: $295,854 (+$44,037, +17.49% from previous year)
- 2022: $353,278 (+$57,424, +19.41% from previous year)
- 2023: $377,579 (+$24,301, +6.88% from previous year)
- 2024: $401,032 (+$23,452, +6.21% from previous year)
- 2025: $410,276 (+$9,244, +2.30% from previous year)
Beaufort’s home prices have nearly doubled since 2012, rising steadily year after year. With strong growth in the 2020s, the town remains a popular destination for homebuyers along the coast.
Beaufort – Southern Charm Meets Coastal Appeal
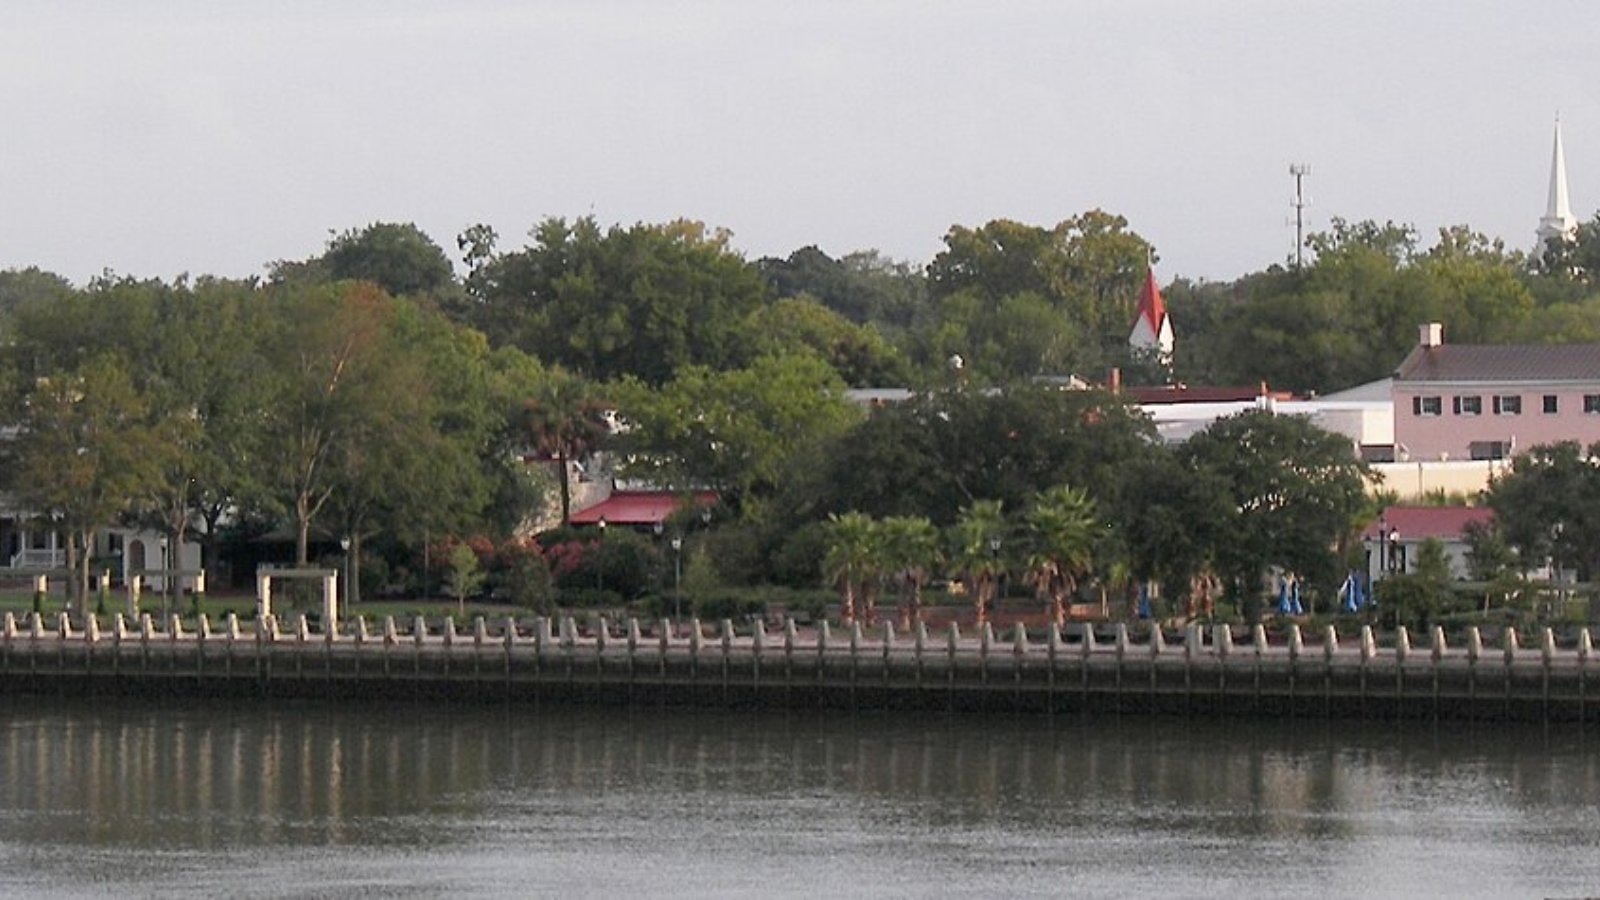
Set along the Intracoastal Waterway, Beaufort boasts antebellum architecture, historic charm, and walkable neighborhoods. It has long been a magnet for retirees, military families from nearby Parris Island, and anyone drawn to the Lowcountry lifestyle.
The rapid increases in 2021 and 2022 pushed median values past $400,000, and prices have held strong since. Its mix of culture, history, and scenic views continues to bolster long-term value.
31. Hanahan – 124% Home Price Increase Since 2010
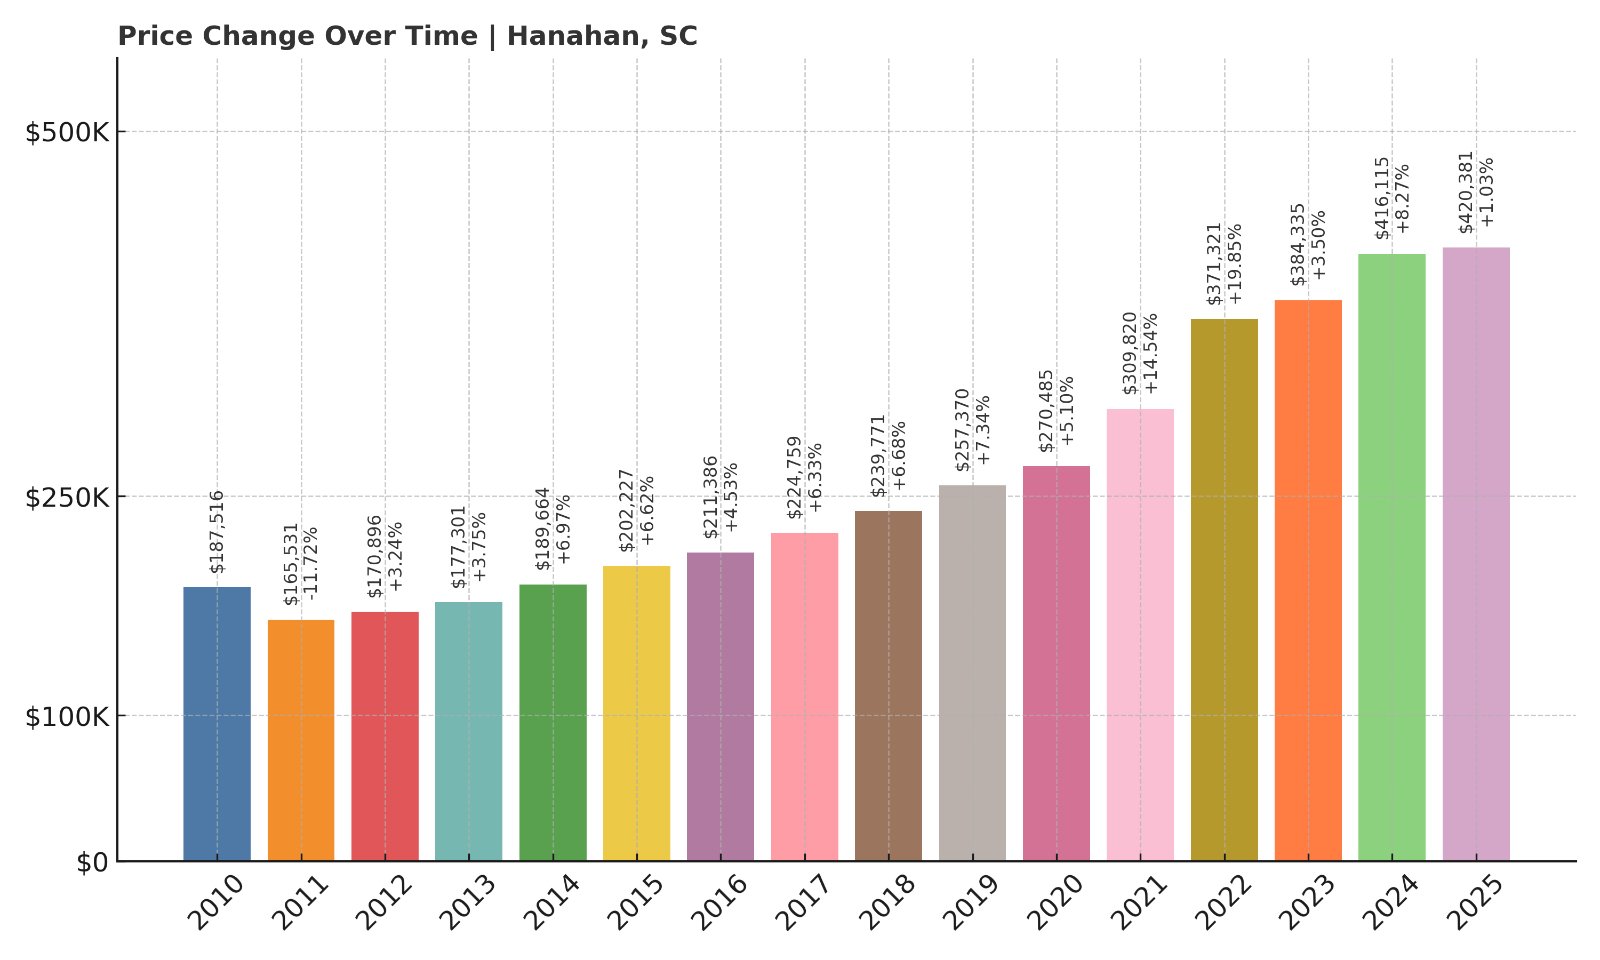
- 2010: $187,516
- 2011: $165,531 (-$21,985, -11.72% from previous year)
- 2012: $170,896 (+$5,365, +3.24% from previous year)
- 2013: $177,301 (+$6,405, +3.75% from previous year)
- 2014: $189,664 (+$12,363, +6.97% from previous year)
- 2015: $202,227 (+$12,563, +6.62% from previous year)
- 2016: $211,386 (+$9,159, +4.53% from previous year)
- 2017: $224,759 (+$13,374, +6.33% from previous year)
- 2018: $239,771 (+$15,011, +6.68% from previous year)
- 2019: $257,370 (+$17,599, +7.34% from previous year)
- 2020: $270,485 (+$13,115, +5.10% from previous year)
- 2021: $309,820 (+$39,335, +14.54% from previous year)
- 2022: $371,321 (+$61,501, +19.85% from previous year)
- 2023: $384,335 (+$13,014, +3.50% from previous year)
- 2024: $416,115 (+$31,781, +8.27% from previous year)
- 2025: $420,381 (+$4,265, +1.03% from previous year)
Hanahan has experienced a 124% increase in home values since 2010, with steady gains and a major boom in 2021–2022. Recent years show slower growth, but prices have held strong above $400,000.
Hanahan – Charleston Suburb with Big Appeal
Situated just north of Charleston, Hanahan is a favorite for families and professionals looking for more space without leaving the metro area. Its schools, parks, and access to the Cooper River make it a well-rounded option.
The surge in prices during the pandemic years mirrors many other Charleston suburbs. With a strong local economy and continued interest from out-of-state buyers, Hanahan’s market has remained tight and competitive.
30. Clover – 131% Home Price Increase Since 2010
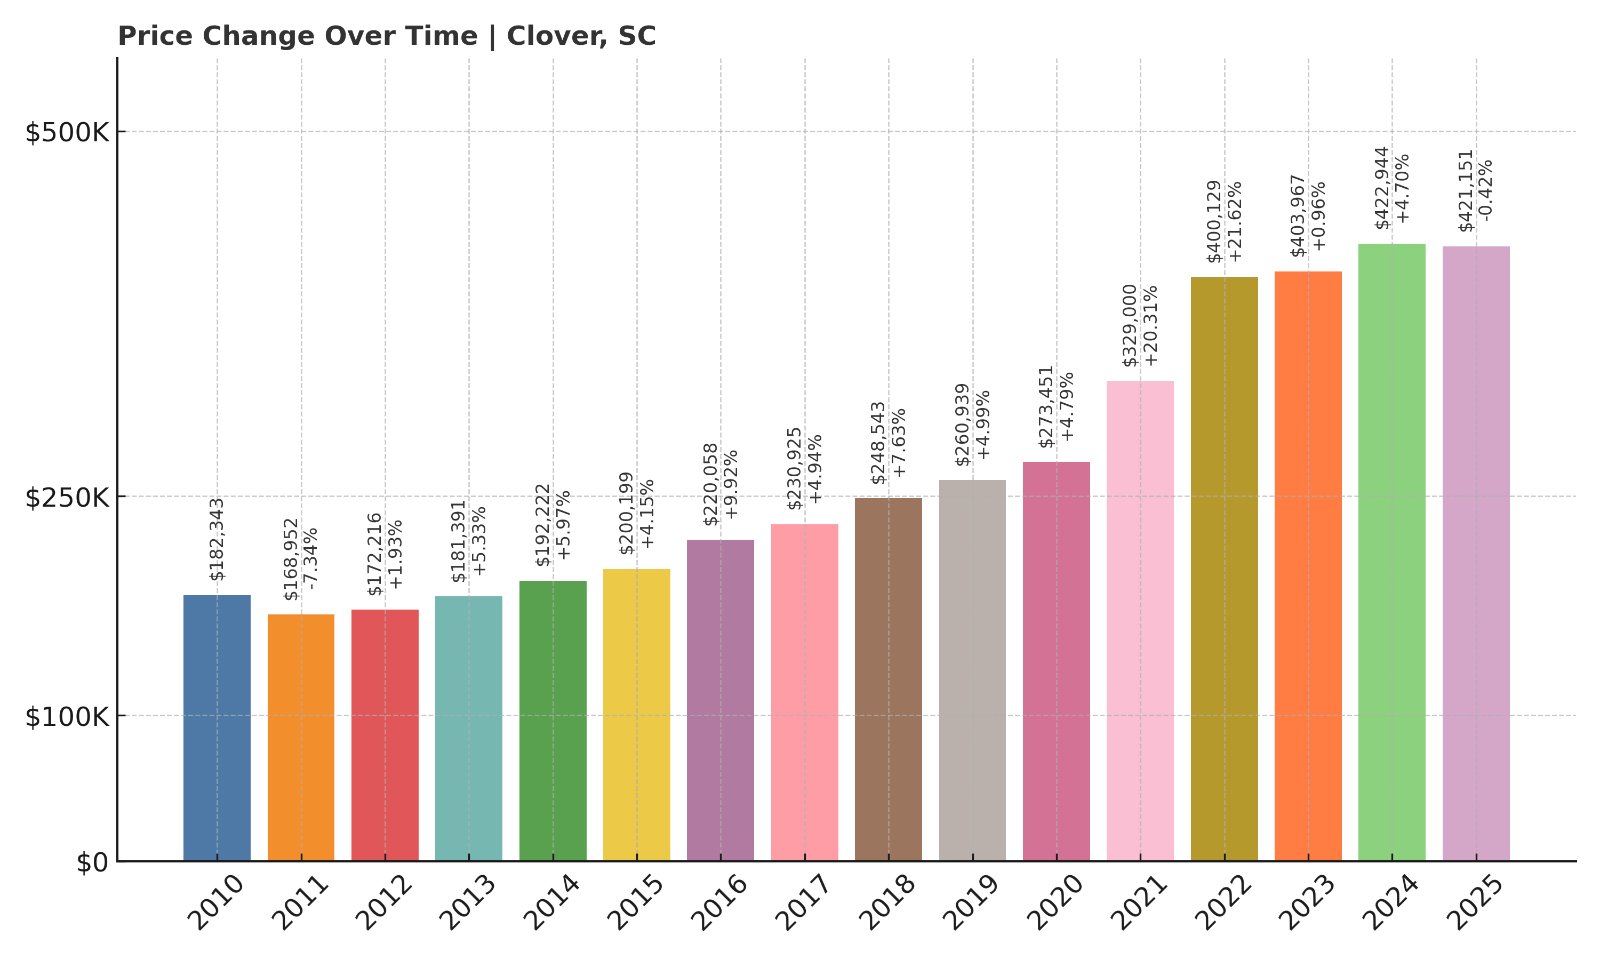
- 2010: $182,343
- 2011: $168,952 (-$13,391, -7.34% from previous year)
- 2012: $172,216 (+$3,264, +1.93% from previous year)
- 2013: $181,391 (+$9,175, +5.33% from previous year)
- 2014: $192,222 (+$10,831, +5.97% from previous year)
- 2015: $200,199 (+$7,977, +4.15% from previous year)
- 2016: $220,058 (+$19,860, +9.92% from previous year)
- 2017: $230,925 (+$10,867, +4.94% from previous year)
- 2018: $248,543 (+$17,618, +7.63% from previous year)
- 2019: $260,939 (+$12,396, +4.99% from previous year)
- 2020: $273,451 (+$12,512, +4.79% from previous year)
- 2021: $329,000 (+$55,549, +20.31% from previous year)
- 2022: $400,129 (+$71,129, +21.62% from previous year)
- 2023: $403,967 (+$3,838, +0.96% from previous year)
- 2024: $422,944 (+$18,977, +4.70% from previous year)
- 2025: $421,151 (-$1,793, -0.42% from previous year)
Clover home values have soared 131% since 2010, reflecting sustained growth driven by its strategic location near the North Carolina border. While 2025 brought a minor price dip, overall values remain elevated.
Clover – Small Town Charm on Charlotte’s Edge
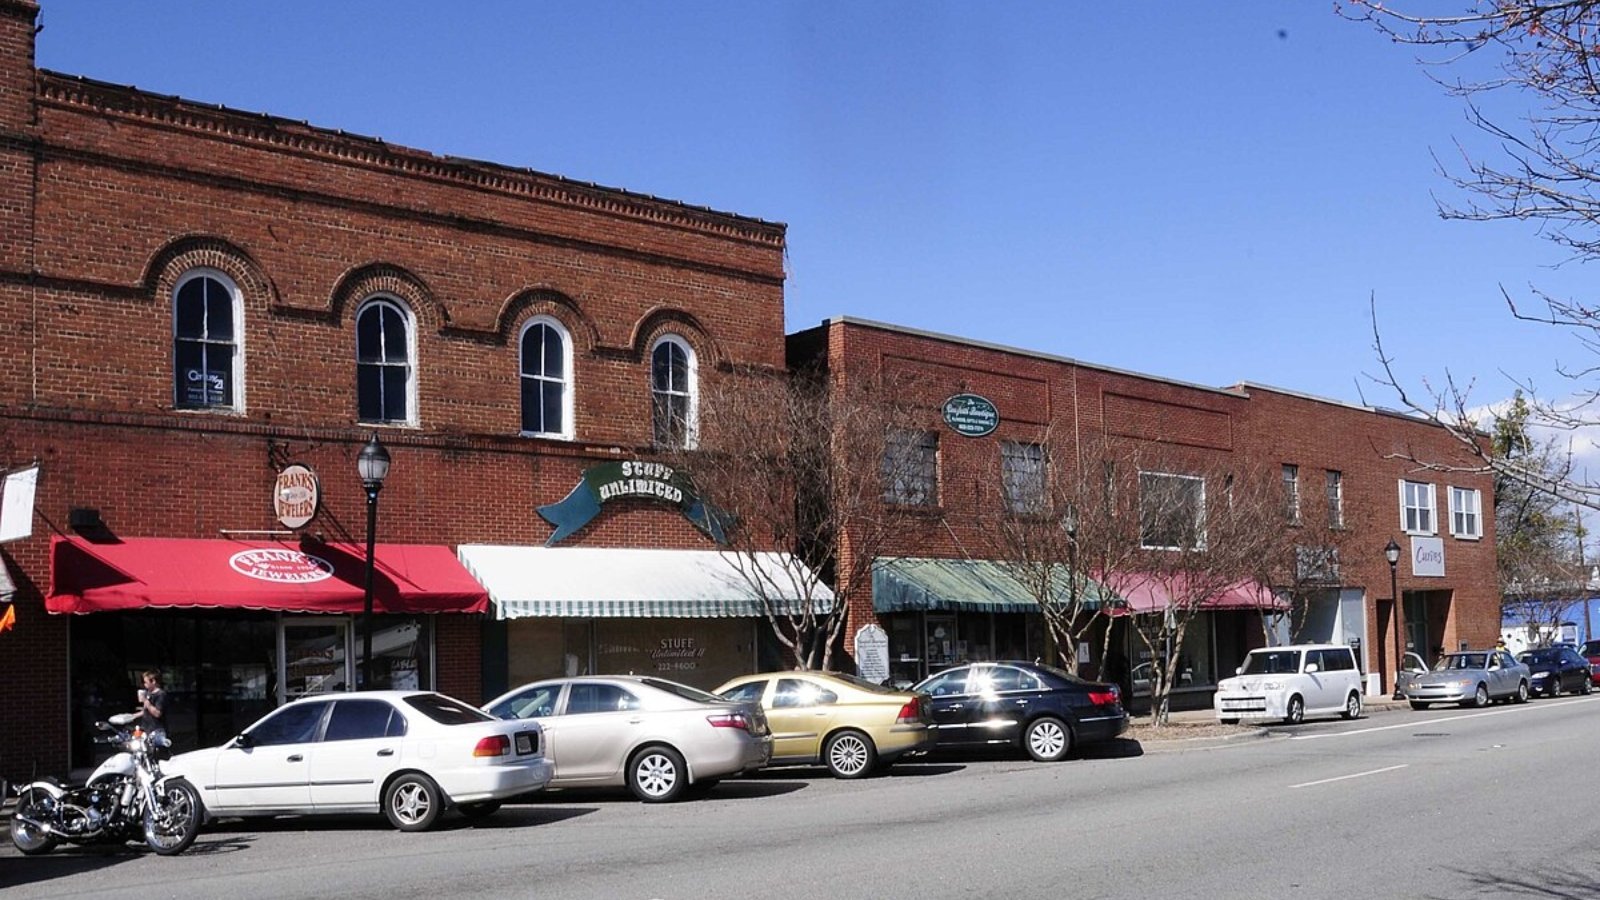
Located just south of Charlotte, Clover blends small-town life with easy commuter access to one of the Southeast’s largest metro areas. It’s part of the fast-growing York County corridor, which has seen widespread suburban expansion over the past decade.
Clover’s largest gains came during the 2021–2022 boom, when home values jumped by more than $125,000 in just two years. With a 2025 typical price above $420,000, Clover is now among South Carolina’s most expensive small towns.
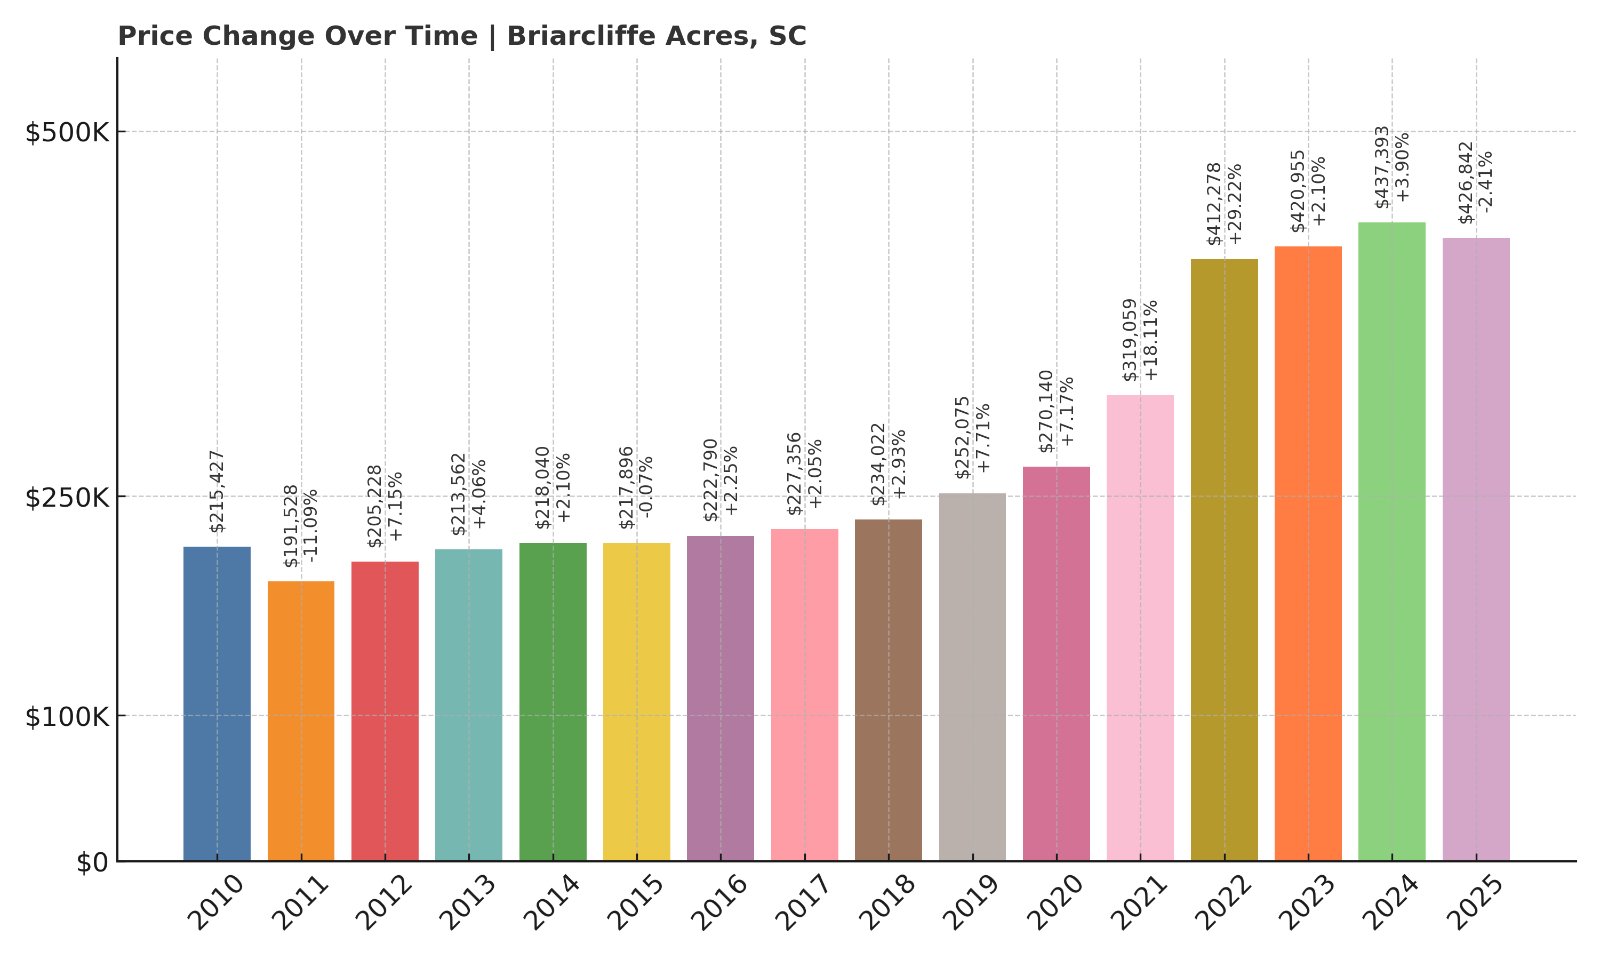
29. Briarcliffe Acres – 98% Home Price Increase Since 2010
🔥 Would you like to save this?
- 2010: $215,427
- 2011: $191,528 (-$23,899, -11.09% from previous year)
- 2012: $205,228 (+$13,700, +7.15% from previous year)
- 2013: $213,562 (+$8,335, +4.06% from previous year)
- 2014: $218,040 (+$4,478, +2.10% from previous year)
- 2015: $217,896 (-$144, -0.07% from previous year)
- 2016: $222,790 (+$4,893, +2.25% from previous year)
- 2017: $227,356 (+$4,566, +2.05% from previous year)
- 2018: $234,022 (+$6,666, +2.93% from previous year)
- 2019: $252,075 (+$18,053, +7.71% from previous year)
- 2020: $270,140 (+$18,065, +7.17% from previous year)
- 2021: $319,059 (+$48,919, +18.11% from previous year)
- 2022: $412,278 (+$93,220, +29.22% from previous year)
- 2023: $420,955 (+$8,677, +2.10% from previous year)
- 2024: $437,393 (+$16,438, +3.90% from previous year)
- 2025: $426,842 (-$10,550, -2.41% from previous year)
Prices in Briarcliffe Acres have nearly doubled since 2010, spiking particularly in 2021 and 2022. While 2025 saw a slight pullback, prices remain above $425,000.
Briarcliffe Acres – A Quiet Retreat Between Myrtle and North Myrtle
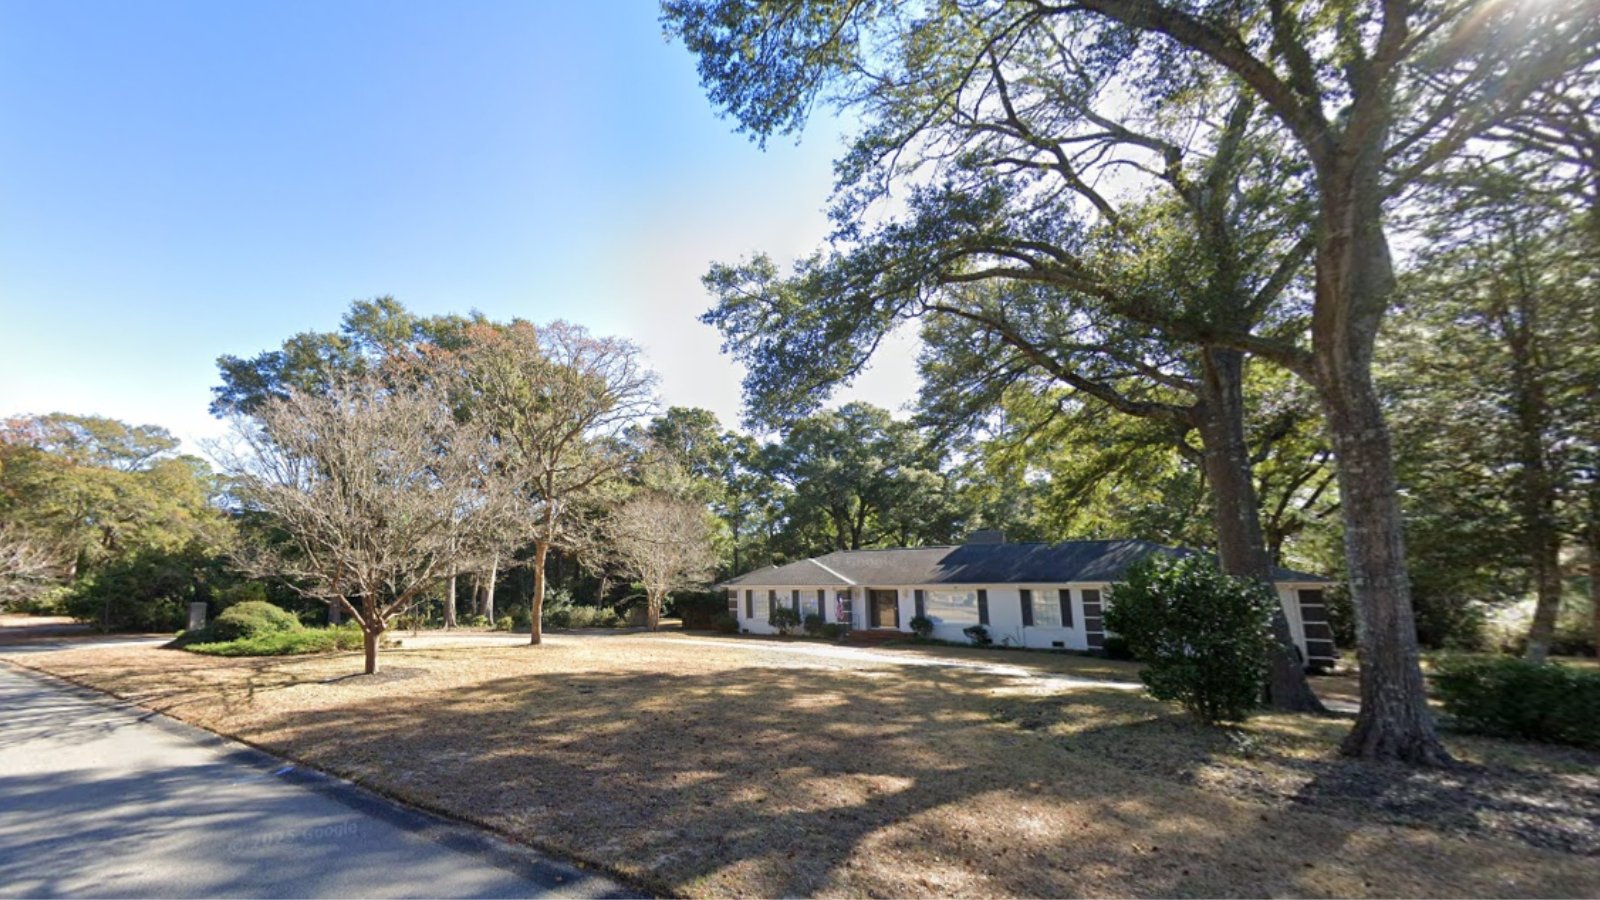
Briarcliffe Acres offers a rare blend of privacy and coastal proximity. Nestled between two of South Carolina’s most developed beach cities, it maintains a quiet residential atmosphere with wooded lots and deeded beach access.
Its exclusivity and location contributed to a dramatic price surge in the early 2020s. While some cooling occurred in 2025, Briarcliffe still commands premium values thanks to its unique positioning and coastal appeal.
28. Six Mile – 129% Home Price Increase Since 2010
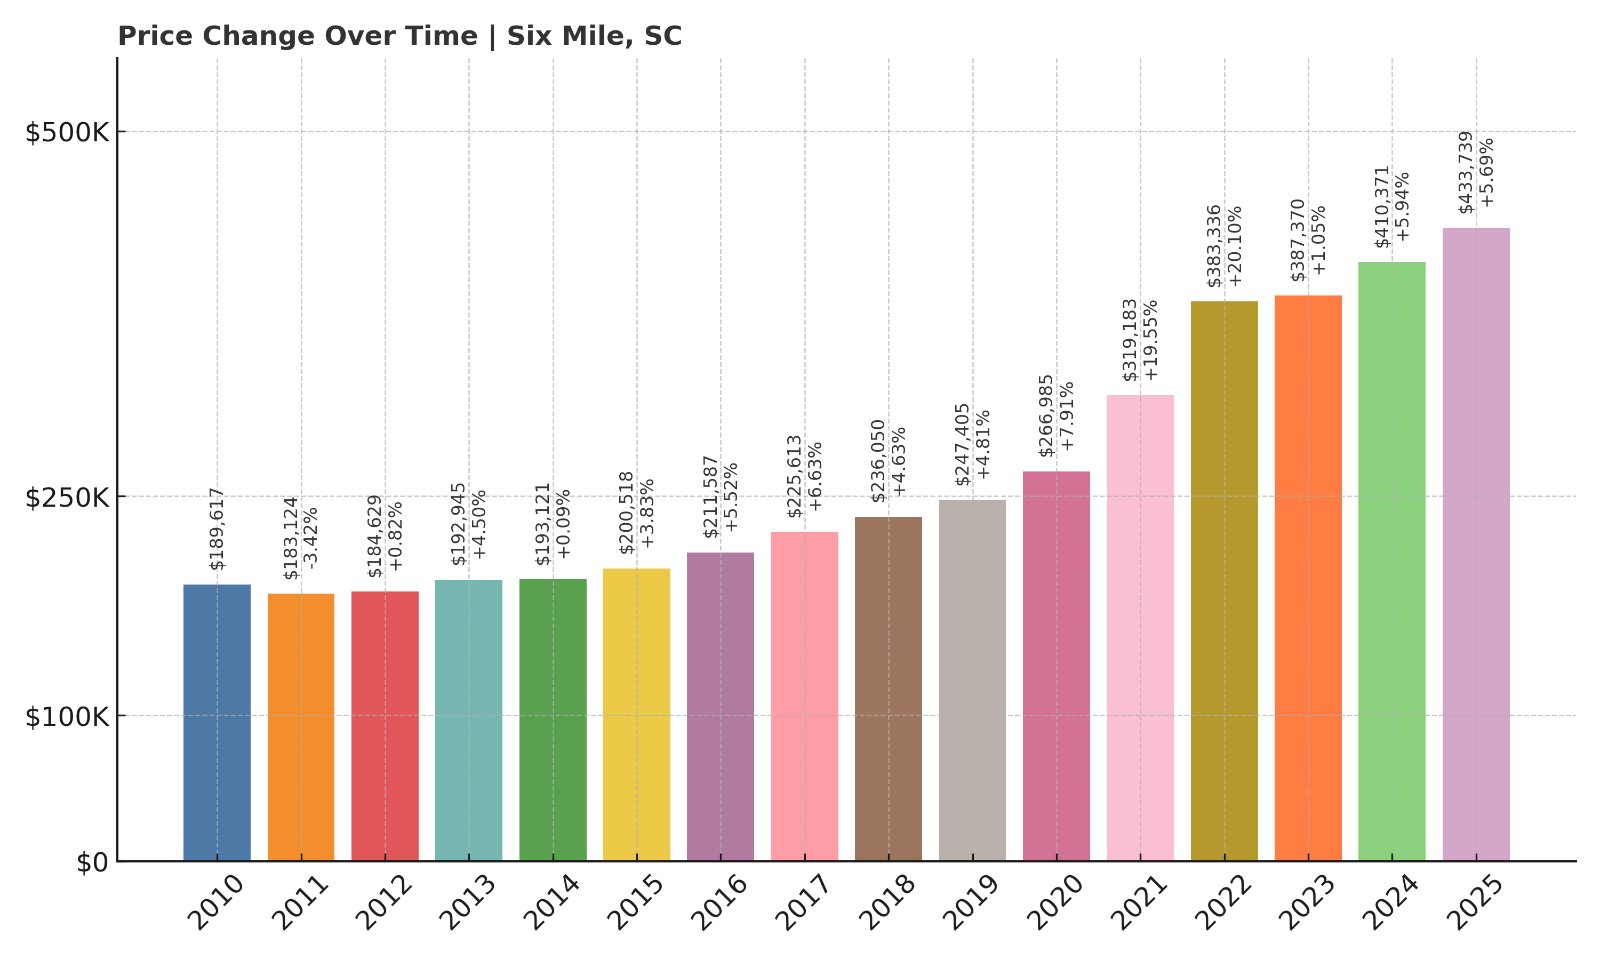
- 2010: $189,617
- 2011: $183,124 (-$6,493, -3.42% from previous year)
- 2012: $184,629 (+$1,505, +0.82% from previous year)
- 2013: $192,945 (+$8,316, +4.50% from previous year)
- 2014: $193,121 (+$176, +0.09% from previous year)
- 2015: $200,518 (+$7,398, +3.83% from previous year)
- 2016: $211,587 (+$11,068, +5.52% from previous year)
- 2017: $225,613 (+$14,026, +6.63% from previous year)
- 2018: $236,050 (+$10,437, +4.63% from previous year)
- 2019: $247,405 (+$11,355, +4.81% from previous year)
- 2020: $266,985 (+$19,580, +7.91% from previous year)
- 2021: $319,183 (+$52,198, +19.55% from previous year)
- 2022: $383,336 (+$64,153, +20.10% from previous year)
- 2023: $387,370 (+$4,035, +1.05% from previous year)
- 2024: $410,371 (+$23,001, +5.94% from previous year)
- 2025: $433,739 (+$23,368, +5.69% from previous year)
Six Mile has experienced a 129% rise in home values since 2010, with an especially sharp rise from 2020 onward. Prices have steadily increased even as some other towns cooled.
Six Mile – Lake Proximity and Strong Demand
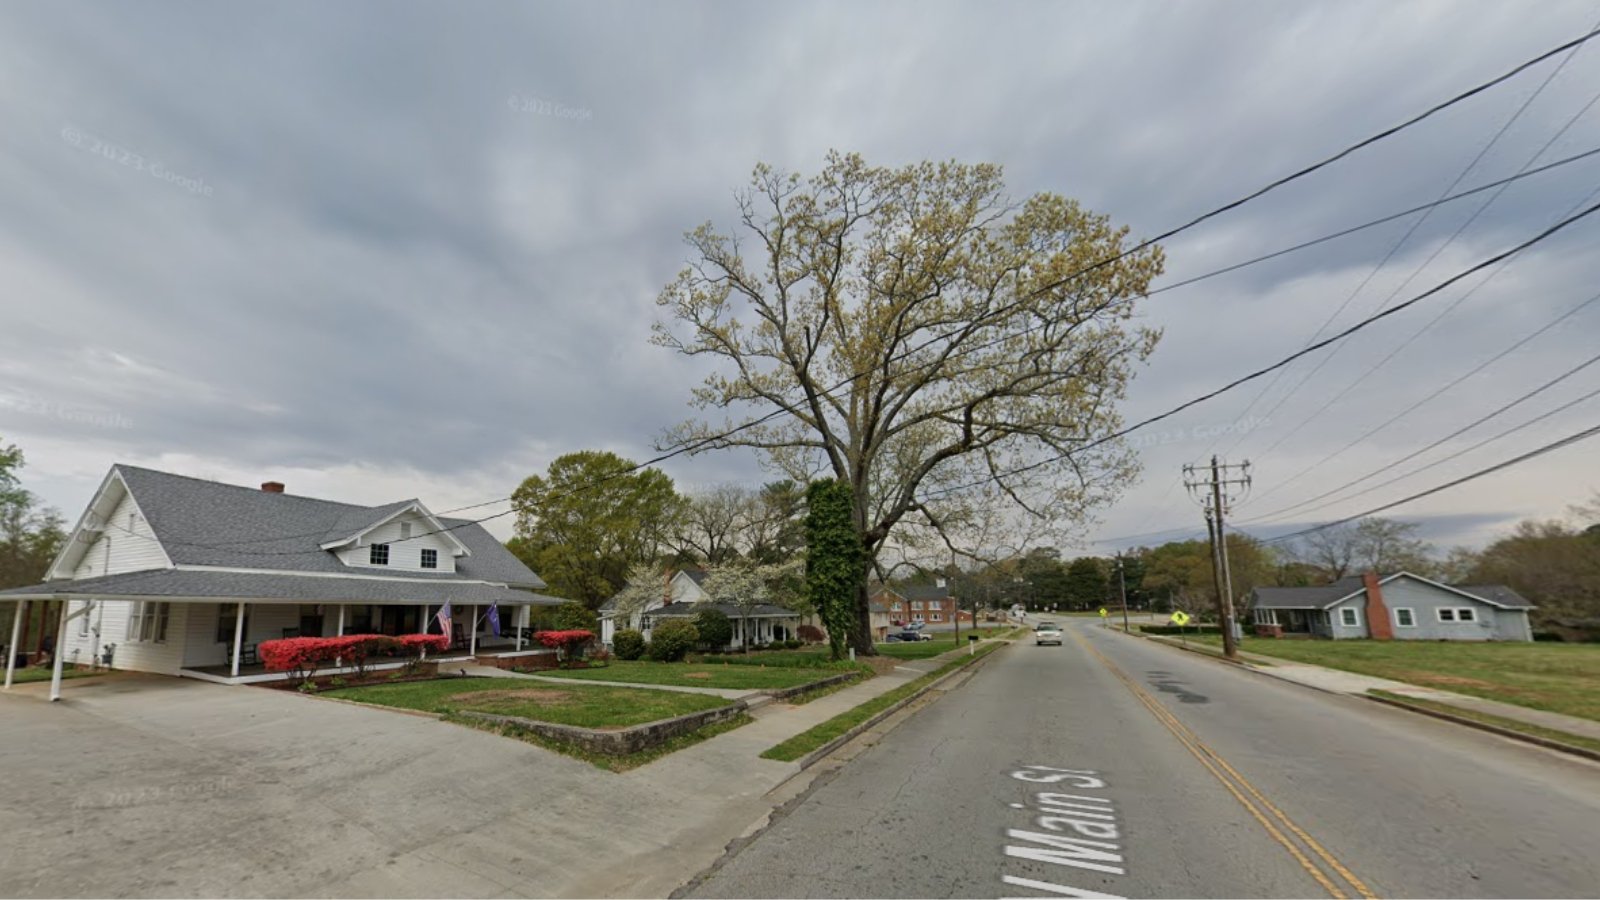
Located near Lake Keowee and the Blue Ridge foothills, Six Mile has benefited from regional demand for vacation and retirement homes. The town’s peaceful rural setting with access to outdoor recreation makes it attractive year-round.
Recent years saw prices climbing past $430,000, with continued appreciation in 2025. Compared to other lake-region towns, Six Mile has maintained value due to limited supply and consistent demand.
27. McClellanville – 142% Home Price Increase Since 2010
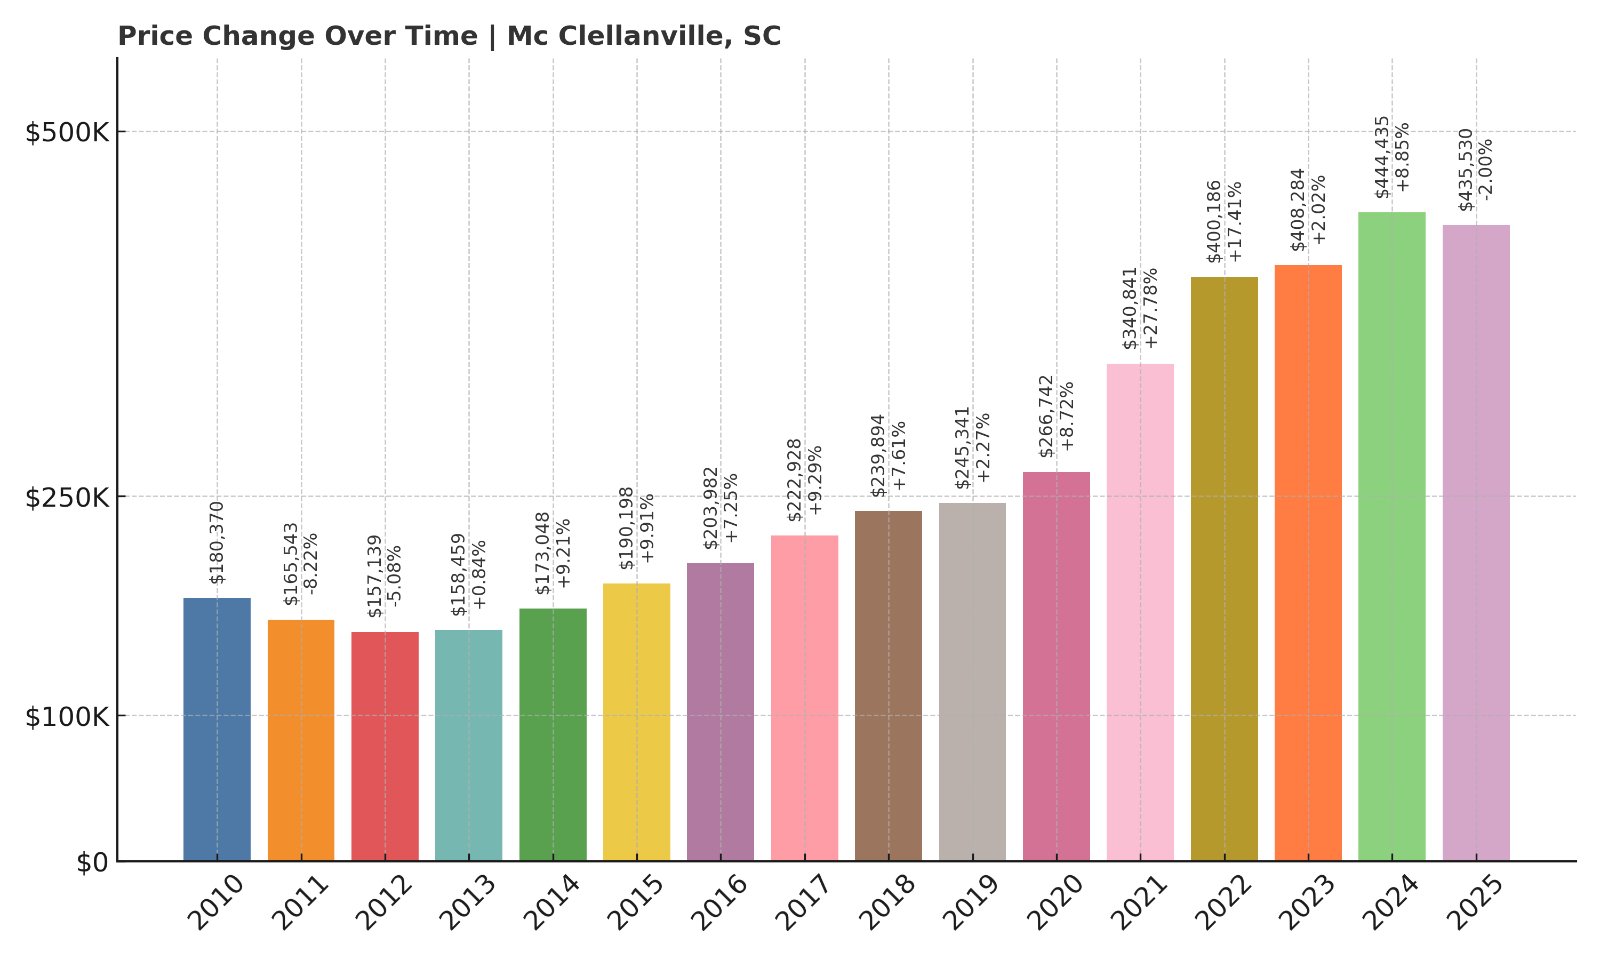
- 2010: $180,370
- 2011: $165,543 (-$14,827, -8.22% from previous year)
- 2012: $157,139 (-$8,405, -5.08% from previous year)
- 2013: $158,459 (+$1,320, +0.84% from previous year)
- 2014: $173,048 (+$14,589, +9.21% from previous year)
- 2015: $190,198 (+$17,150, +9.91% from previous year)
- 2016: $203,982 (+$13,783, +7.25% from previous year)
- 2017: $222,928 (+$18,947, +9.29% from previous year)
- 2018: $239,894 (+$16,966, +7.61% from previous year)
- 2019: $245,341 (+$5,447, +2.27% from previous year)
- 2020: $266,742 (+$21,401, +8.72% from previous year)
- 2021: $340,841 (+$74,099, +27.78% from previous year)
- 2022: $400,186 (+$59,345, +17.41% from previous year)
- 2023: $408,284 (+$8,097, +2.02% from previous year)
- 2024: $444,435 (+$36,151, +8.85% from previous year)
- 2025: $435,530 (-$8,904, -2.00% from previous year)
McClellanville’s home prices have risen more than 140% since 2010. While the last year saw a modest correction, the town remains one of the priciest in rural South Carolina.
McClellanville – Historic Seaport with Exclusive Appeal
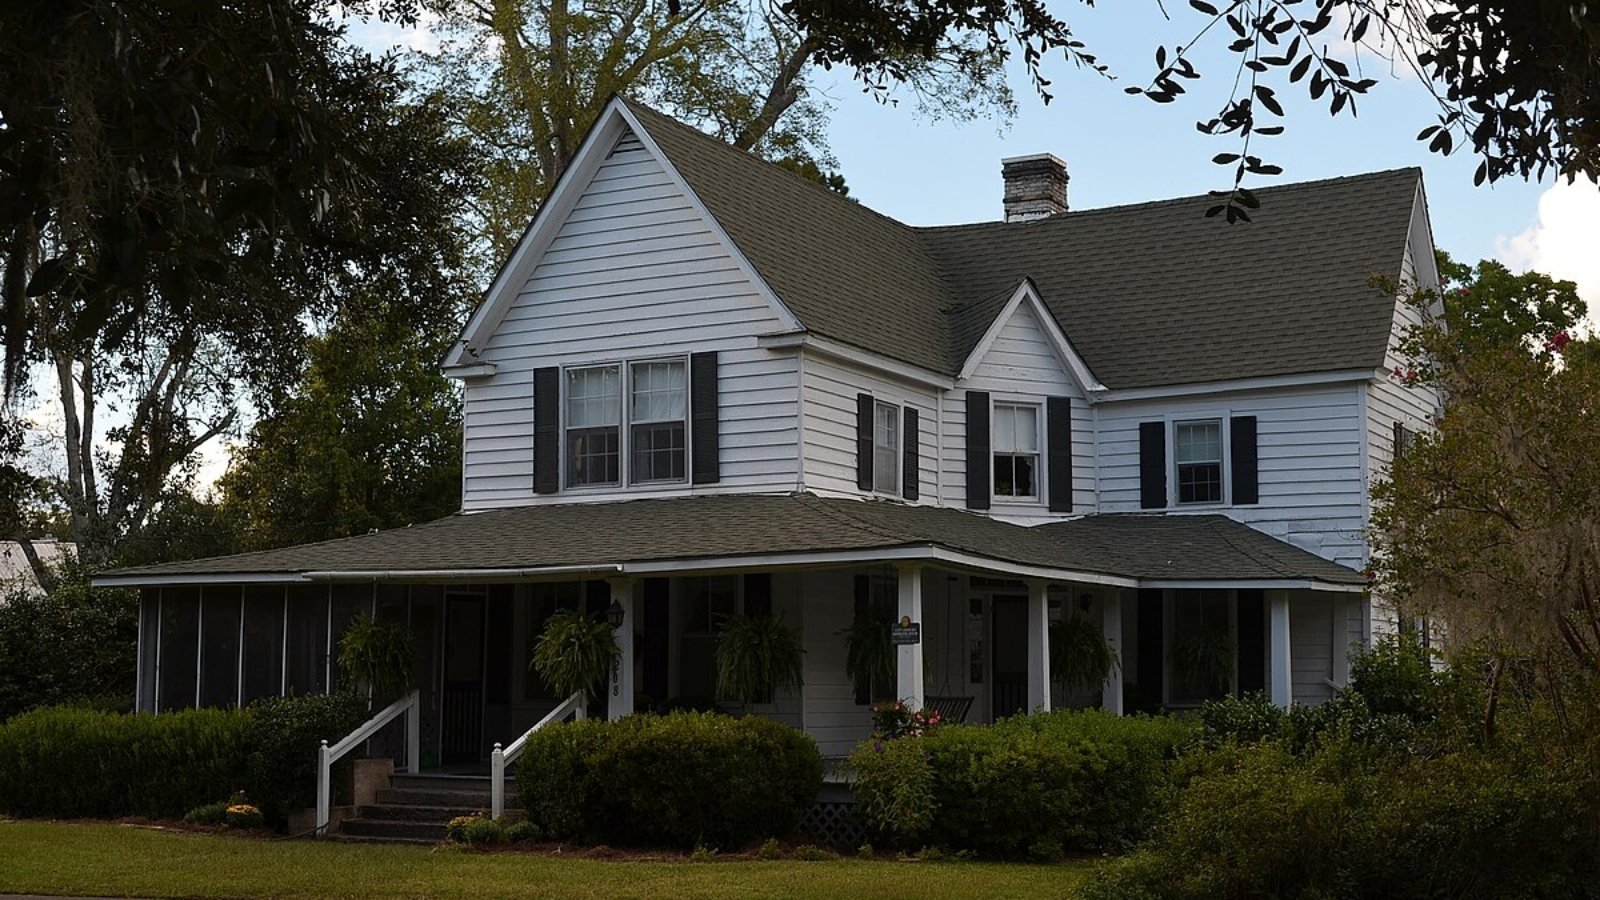
This small fishing village north of Charleston has preserved its historic charm and natural setting. Strict zoning and development limits have helped keep housing inventory low, adding to its exclusivity.
Large annual jumps in 2021 and 2022 reflect increased interest in remote, less-developed towns with character. Even with a small drop in 2025, home values remain well above $435,000—remarkable for a town of its size and remoteness.
26. Chapin – 94% Home Price Increase Since 2010
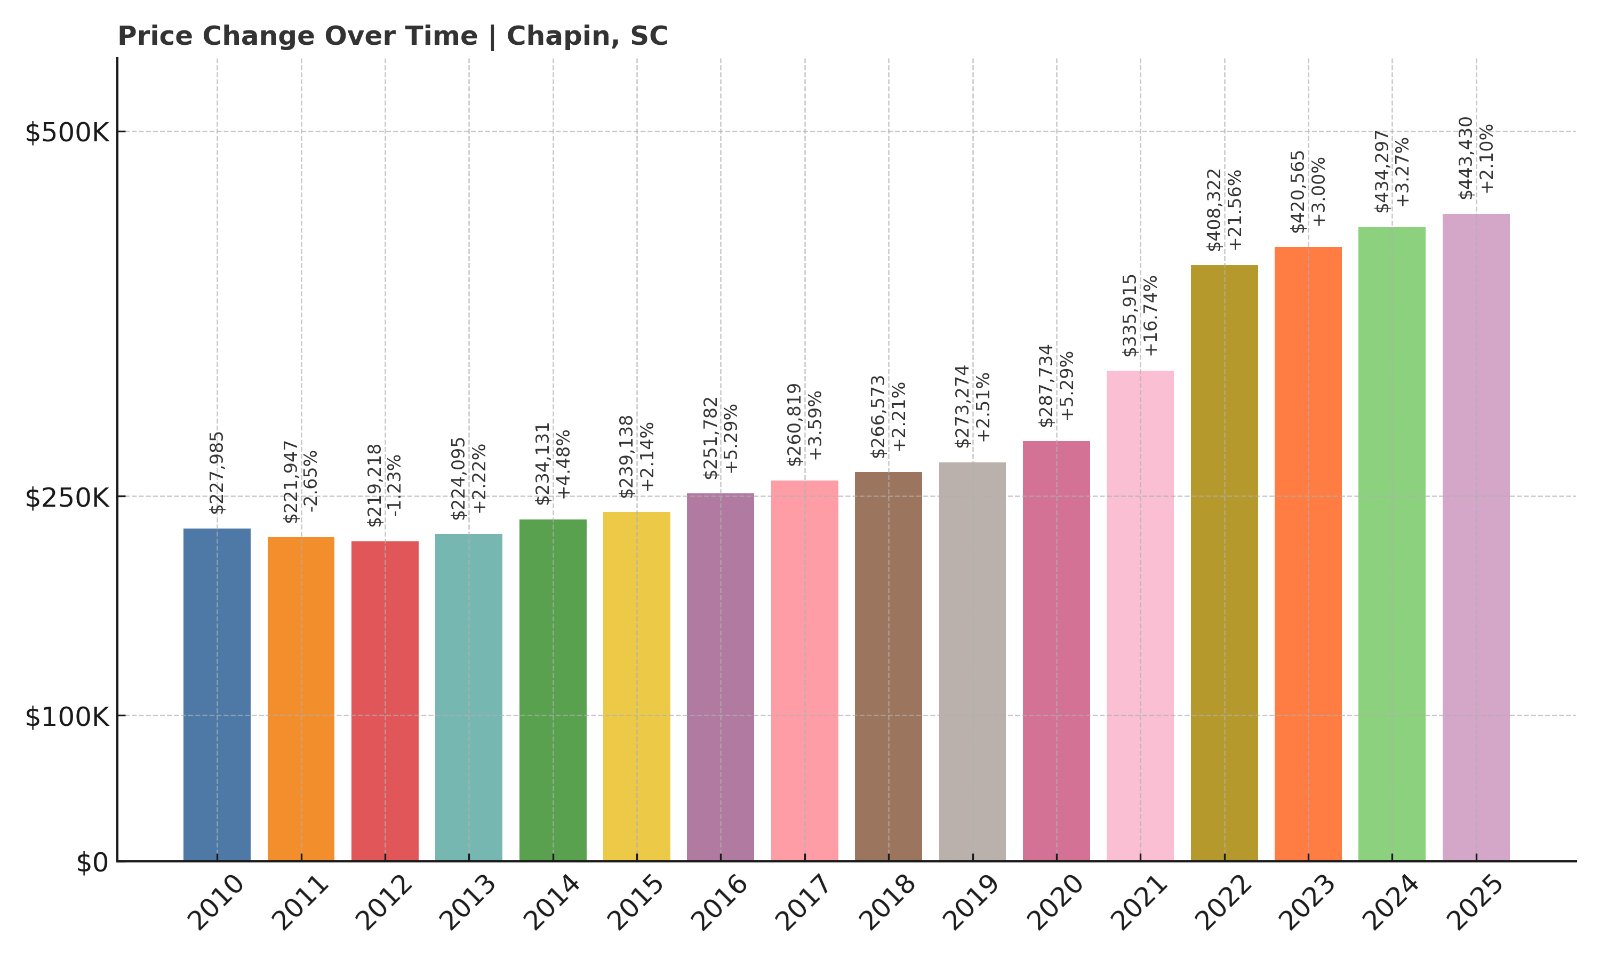
- 2010: $227,985
- 2011: $221,947 (-$6,037, -2.65% from previous year)
- 2012: $219,218 (-$2,729, -1.23% from previous year)
- 2013: $224,095 (+$4,877, +2.22% from previous year)
- 2014: $234,131 (+$10,036, +4.48% from previous year)
- 2015: $239,138 (+$5,008, +2.14% from previous year)
- 2016: $251,782 (+$12,644, +5.29% from previous year)
- 2017: $260,819 (+$9,037, +3.59% from previous year)
- 2018: $266,573 (+$5,753, +2.21% from previous year)
- 2019: $273,274 (+$6,702, +2.51% from previous year)
- 2020: $287,734 (+$14,460, +5.29% from previous year)
- 2021: $335,915 (+$48,181, +16.74% from previous year)
- 2022: $408,322 (+$72,407, +21.56% from previous year)
- 2023: $420,565 (+$12,243, +3.00% from previous year)
- 2024: $434,297 (+$13,732, +3.27% from previous year)
- 2025: $443,430 (+$9,133, +2.10% from previous year)
Chapin’s home values have climbed steadily since 2010, nearly doubling over the 15-year period. A big surge in the early 2020s has leveled off into more modest growth through 2025.
Chapin – Lake Town Growth in the Midlands
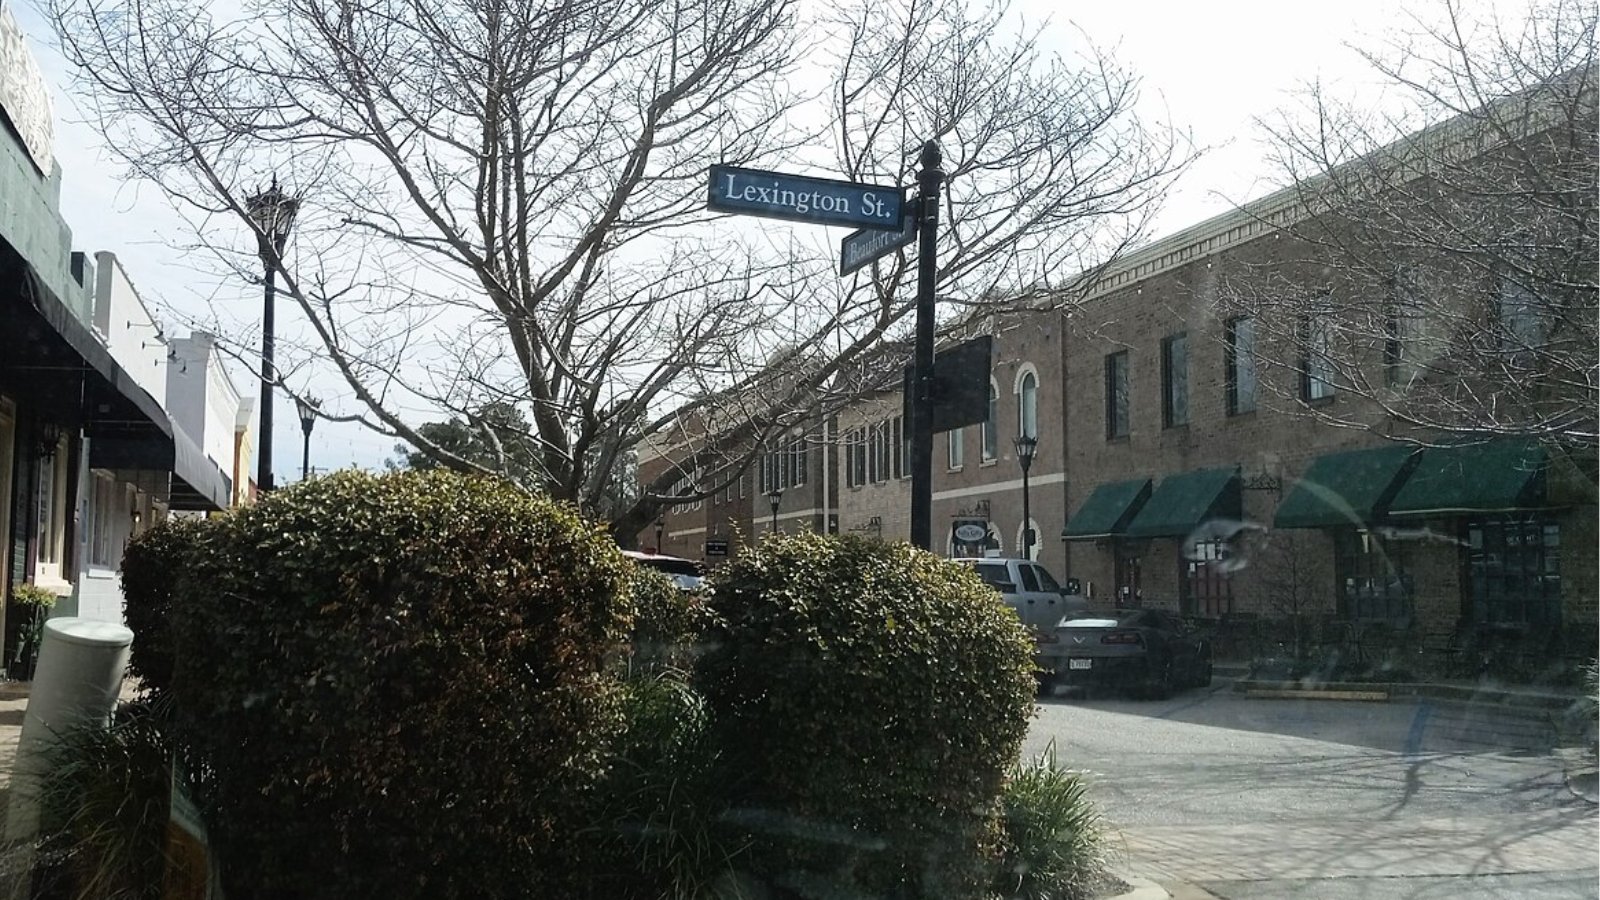
Positioned along the north shore of Lake Murray, Chapin is a popular residential town within commuting distance of Columbia. Its lakefront access, good schools, and peaceful environment appeal to a wide range of buyers.
With typical home values now topping $440,000, Chapin has become one of the Midlands’ most expensive zip codes. The pandemic’s boost to lake-area housing gave this town a major lift in the early 2020s, and prices have continued to rise—albeit more slowly—in 2025.
25. Hardeeville – 163% Home Price Increase Since 2010
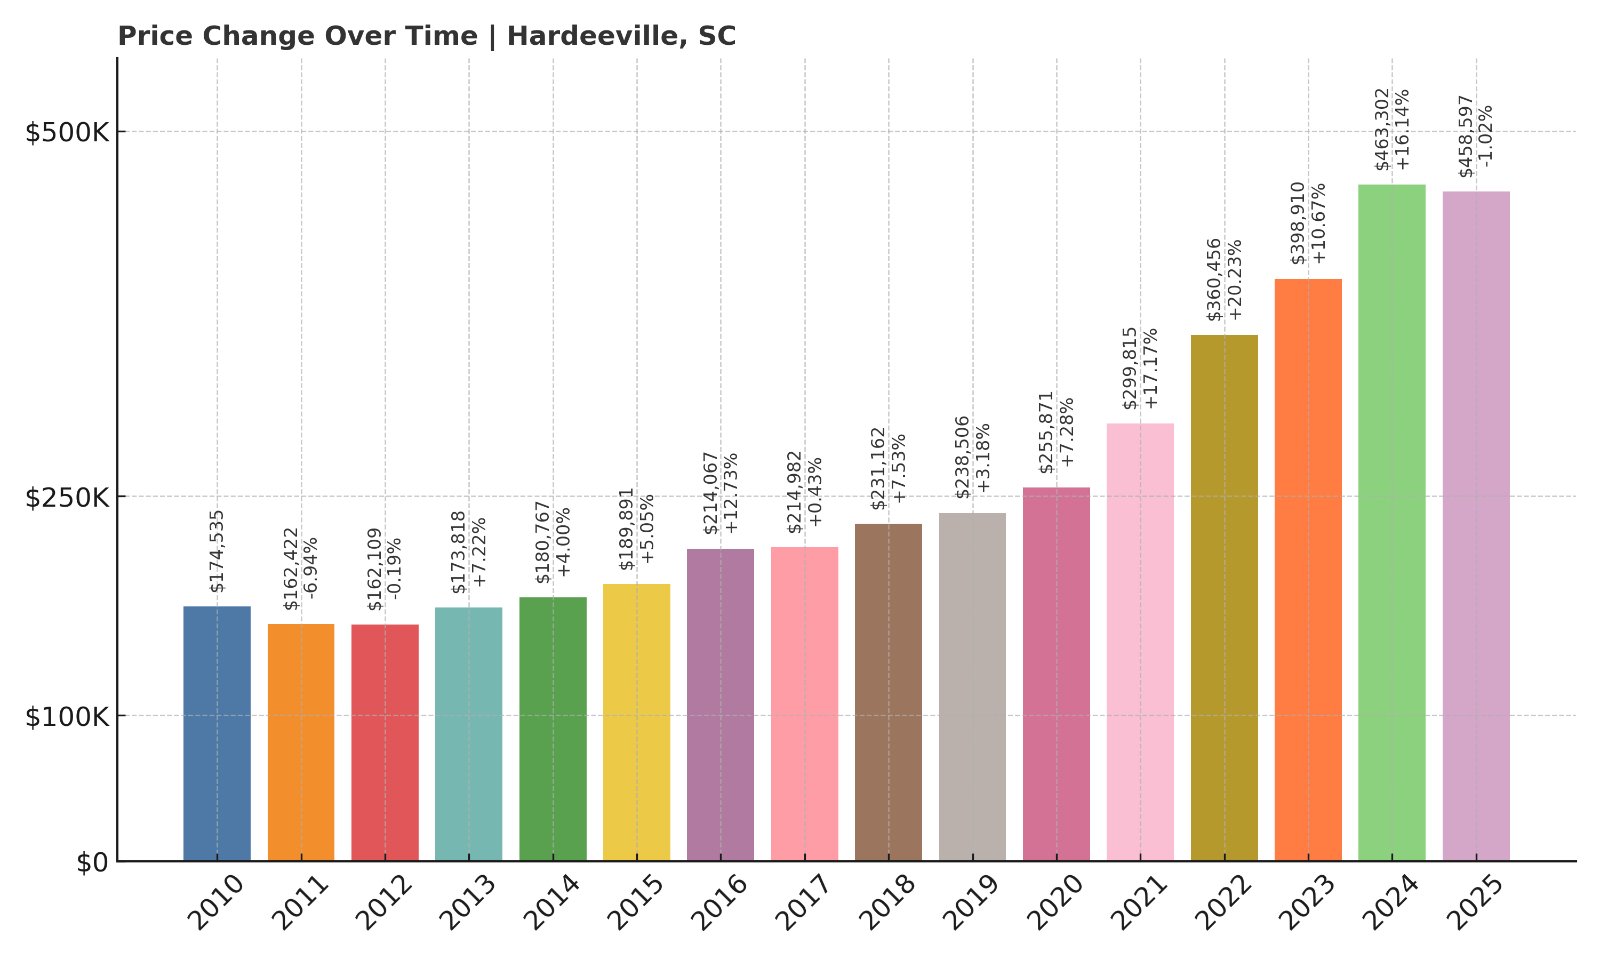
- 2010: $174,535
- 2011: $162,422 (-$12,113, -6.94% from previous year)
- 2012: $162,109 (-$313, -0.19% from previous year)
- 2013: $173,818 (+$11,710, +7.22% from previous year)
- 2014: $180,767 (+$6,949, +4.00% from previous year)
- 2015: $189,891 (+$9,124, +5.05% from previous year)
- 2016: $214,067 (+$24,176, +12.73% from previous year)
- 2017: $214,982 (+$915, +0.43% from previous year)
- 2018: $231,162 (+$16,179, +7.53% from previous year)
- 2019: $238,506 (+$7,344, +3.18% from previous year)
- 2020: $255,871 (+$17,365, +7.28% from previous year)
- 2021: $299,815 (+$43,944, +17.17% from previous year)
- 2022: $360,456 (+$60,641, +20.23% from previous year)
- 2023: $398,910 (+$38,454, +10.67% from previous year)
- 2024: $463,302 (+$64,392, +16.14% from previous year)
- 2025: $458,597 (-$4,705, -1.02% from previous year)
Hardeeville’s typical home price has jumped 163% since 2010, with prices surging past $450,000 in 2025. Although the most recent year shows a slight dip, the longer-term growth has been significant.
Hardeeville – A Boomtown Near the Georgia Border
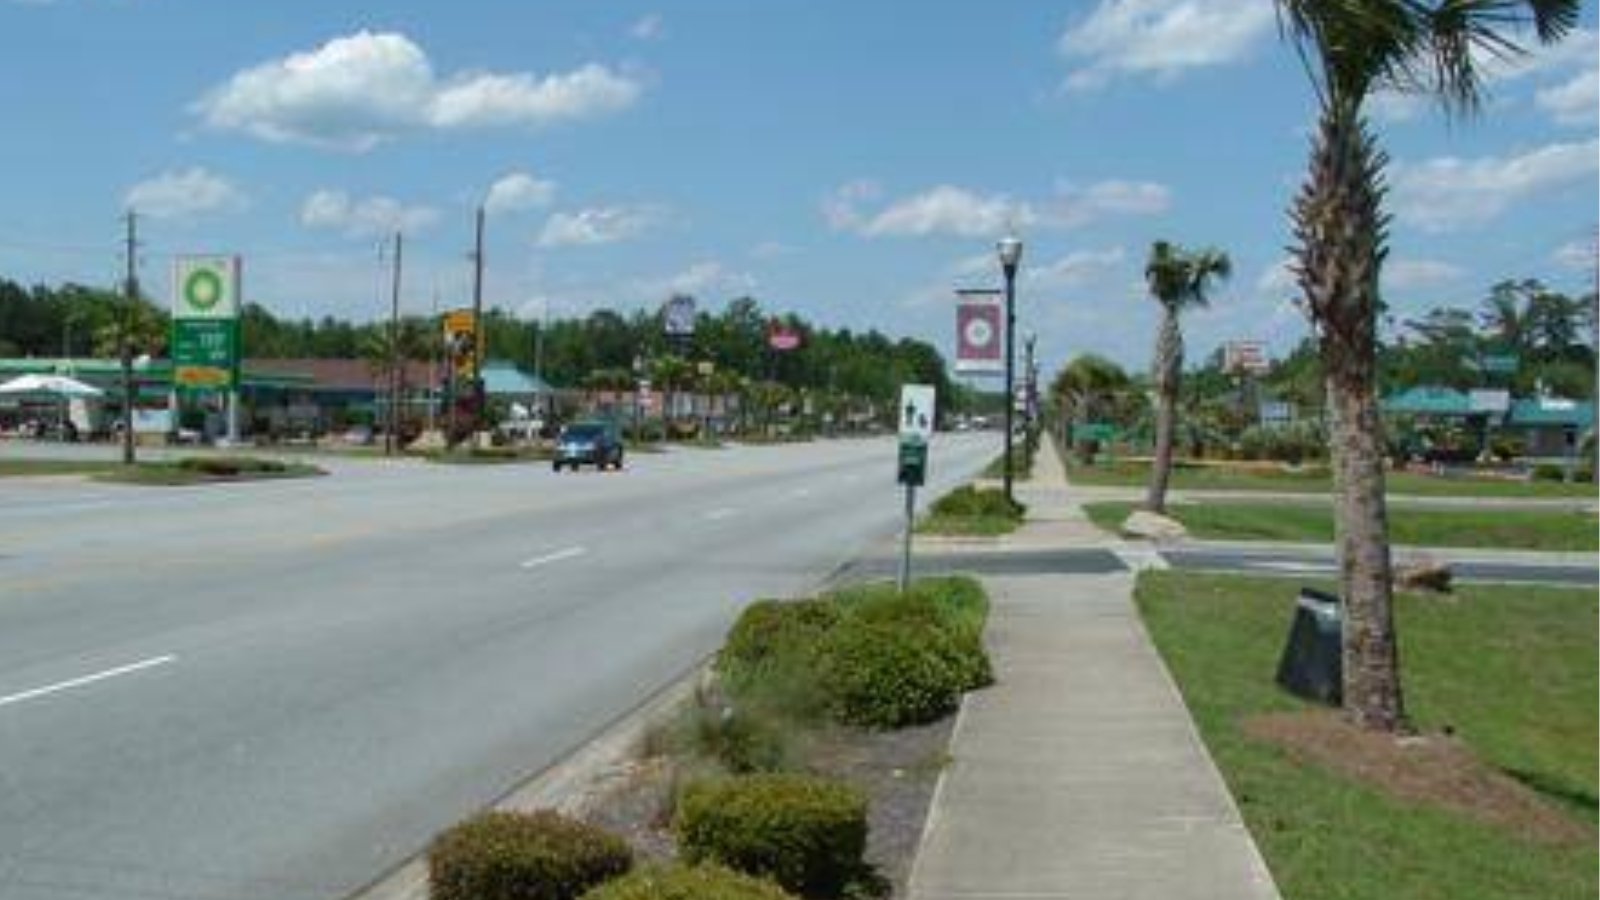
Located just west of Hilton Head Island and north of Savannah, Hardeeville has become a hub for development in the Lowcountry. Its strategic location off I-95 and proximity to major employers have driven demand and construction.
Many new neighborhoods and planned communities have cropped up, pushing median home values steadily higher—especially during the growth years of 2021 through 2024. Even with a minor correction, Hardeeville remains one of the region’s hottest housing markets.
24. Saint Helena Island – 97% Home Price Increase Since 2010
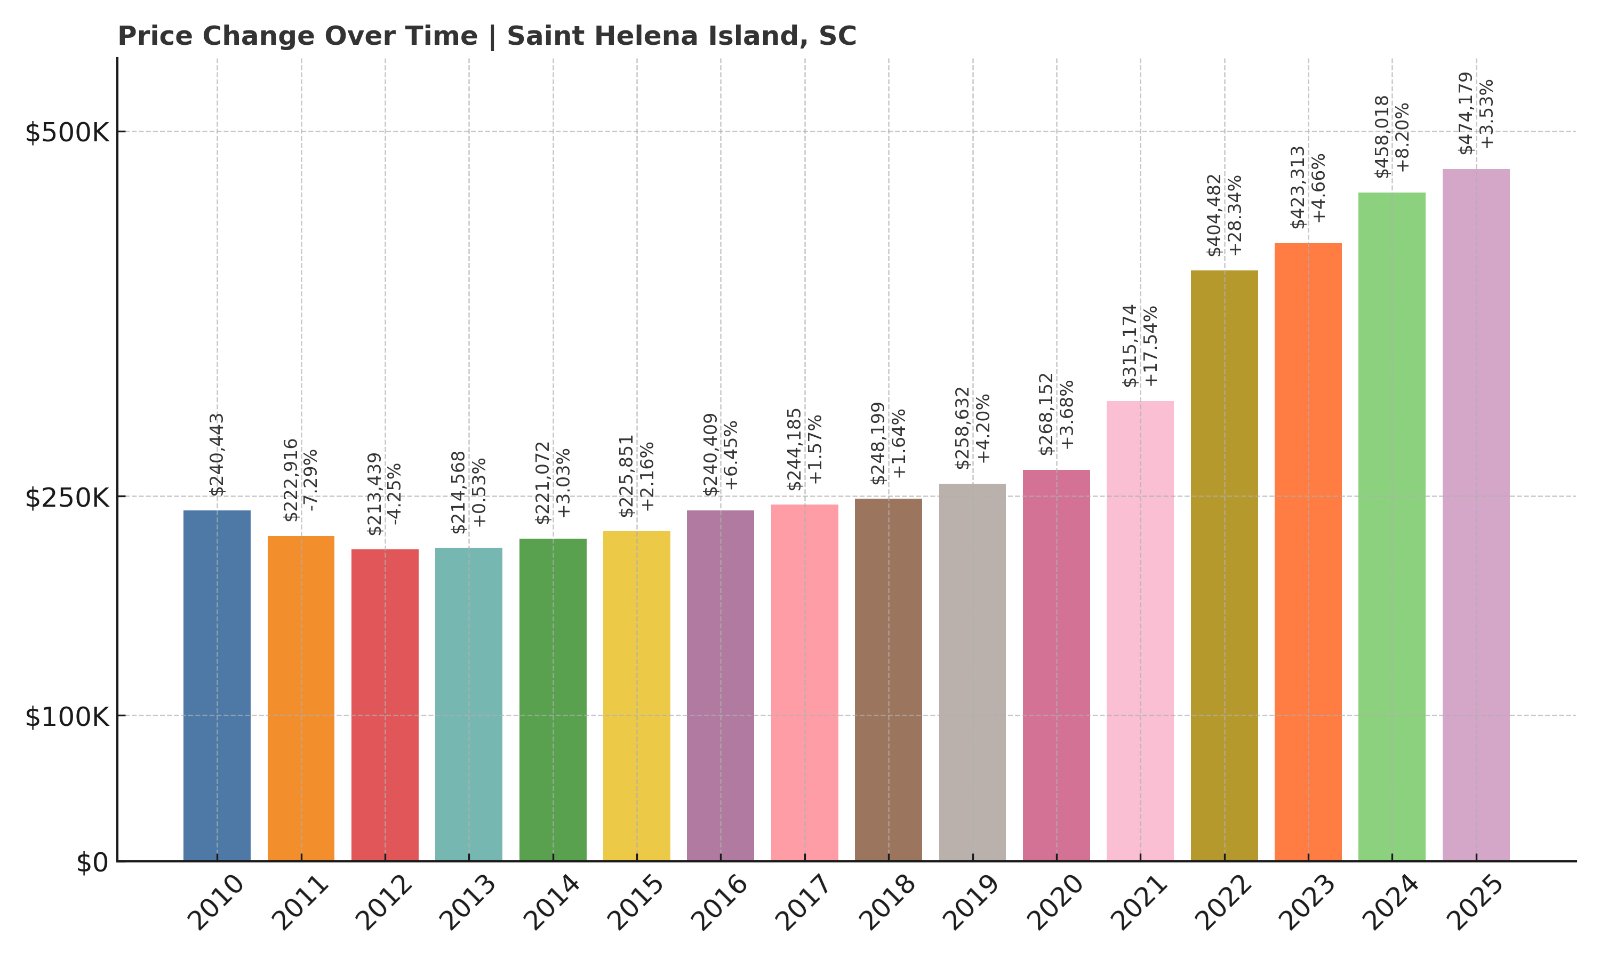
- 2010: $240,443
- 2011: $222,916 (-$17,527, -7.29% from previous year)
- 2012: $213,439 (-$9,477, -4.25% from previous year)
- 2013: $214,568 (+$1,129, +0.53% from previous year)
- 2014: $221,072 (+$6,503, +3.03% from previous year)
- 2015: $225,851 (+$4,779, +2.16% from previous year)
- 2016: $240,409 (+$14,558, +6.45% from previous year)
- 2017: $244,185 (+$3,777, +1.57% from previous year)
- 2018: $248,199 (+$4,014, +1.64% from previous year)
- 2019: $258,632 (+$10,433, +4.20% from previous year)
- 2020: $268,152 (+$9,520, +3.68% from previous year)
- 2021: $315,174 (+$47,022, +17.54% from previous year)
- 2022: $404,482 (+$89,308, +28.34% from previous year)
- 2023: $423,313 (+$18,831, +4.66% from previous year)
- 2024: $458,018 (+$34,705, +8.20% from previous year)
- 2025: $474,179 (+$16,161, +3.53% from previous year)
Saint Helena Island has seen a steady climb in home prices over the last decade and a half, almost doubling since 2010. The most dramatic jumps occurred between 2020 and 2022, and prices have continued to edge upward.
Saint Helena Island – A Cultural Landmark with Coastal Growth
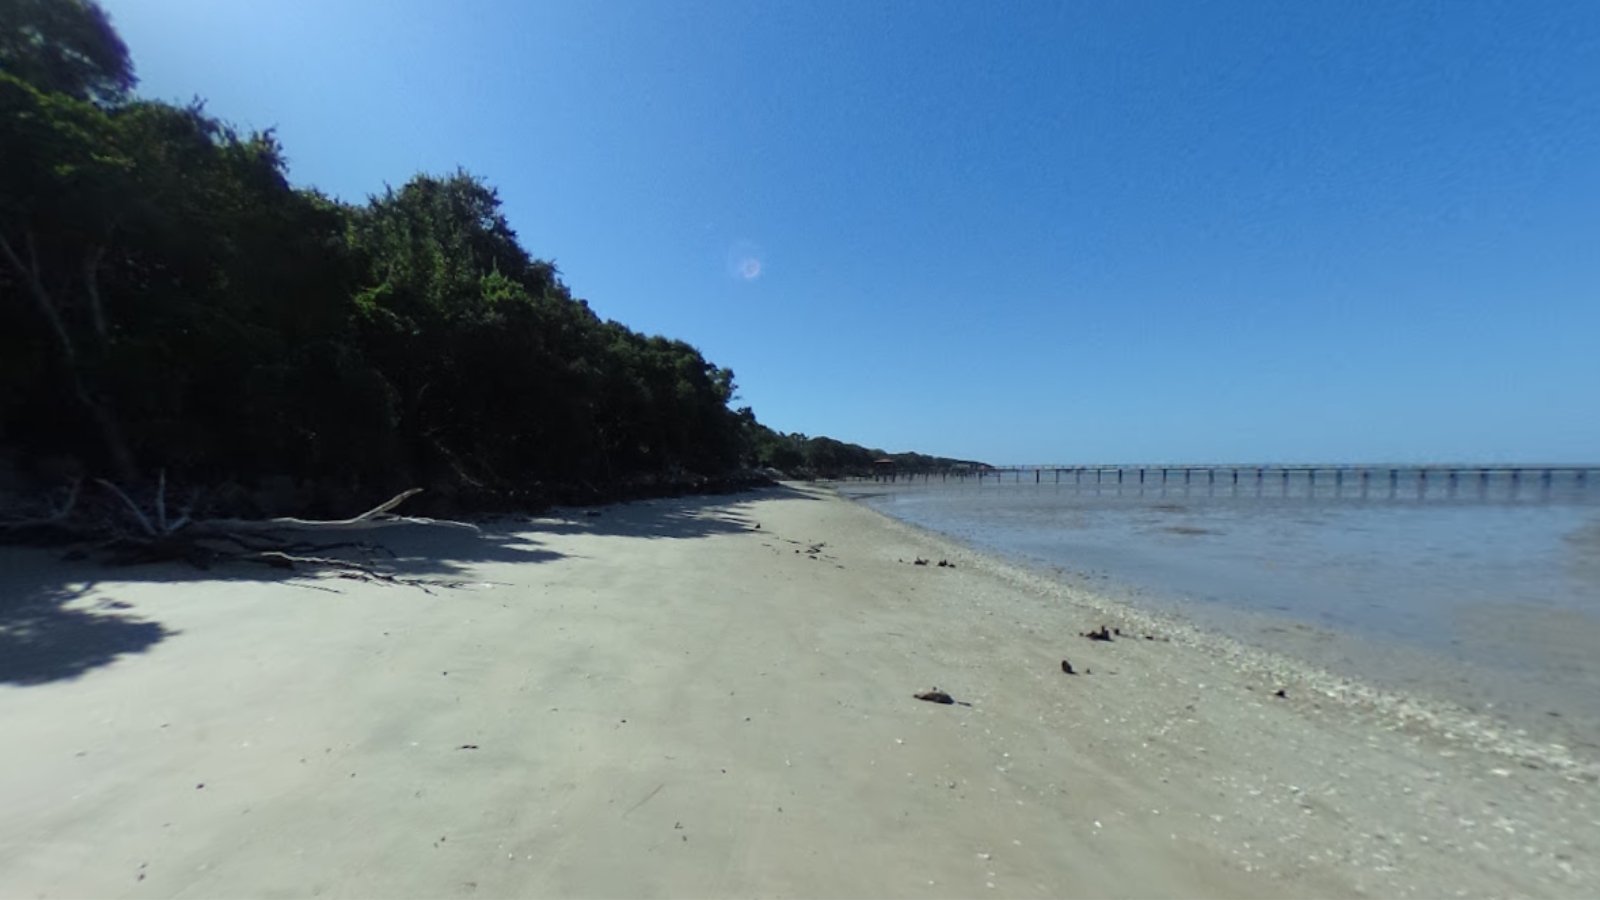
A key part of the South Carolina Sea Islands, Saint Helena Island is renowned for its Gullah Geechee heritage, rural beauty, and cultural history. It has also seen increased residential interest due to its scenic views and proximity to Beaufort.
Limited development and historic preservation efforts have kept inventory low. That, combined with growing regional interest, has pushed values up to nearly $475,000 in 2025. The island remains an attractive option for buyers seeking quiet, culturally rich surroundings.
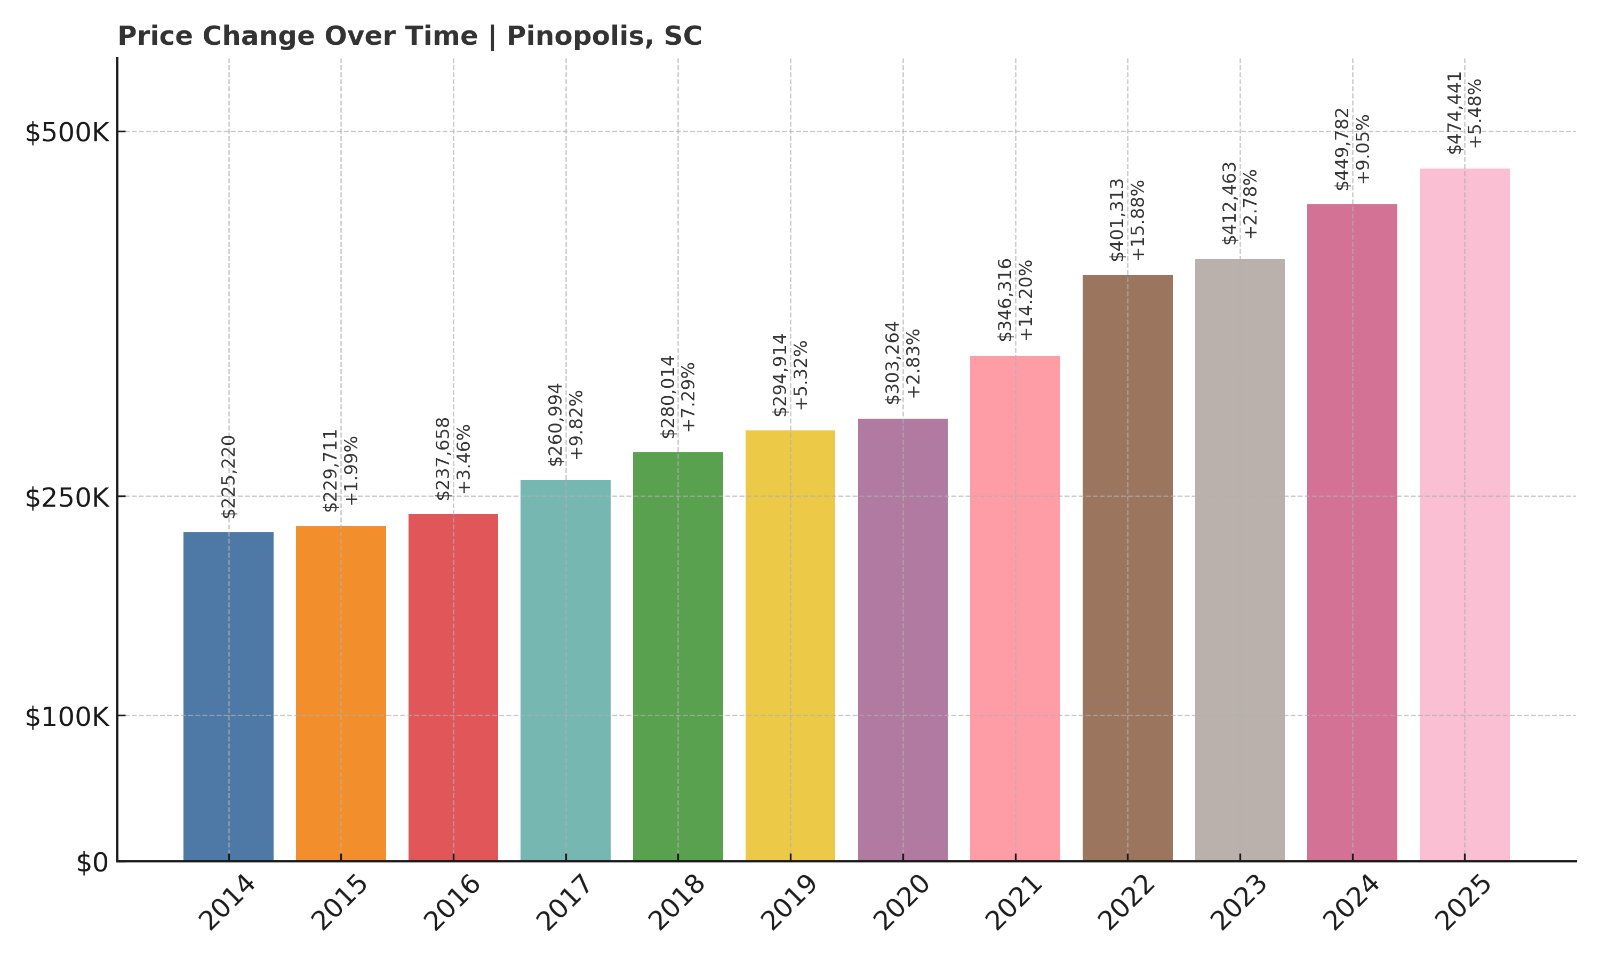
23. Pinopolis – 111% Home Price Increase Since 2014
🔥 Would you like to save this?
- 2014: $225,220
- 2015: $229,711 (+$4,492, +1.99% from previous year)
- 2016: $237,658 (+$7,947, +3.46% from previous year)
- 2017: $260,994 (+$23,336, +9.82% from previous year)
- 2018: $280,014 (+$19,020, +7.29% from previous year)
- 2019: $294,914 (+$14,900, +5.32% from previous year)
- 2020: $303,264 (+$8,350, +2.83% from previous year)
- 2021: $346,316 (+$43,052, +14.20% from previous year)
- 2022: $401,313 (+$54,997, +15.88% from previous year)
- 2023: $412,463 (+$11,150, +2.78% from previous year)
- 2024: $449,782 (+$37,319, +9.05% from previous year)
- 2025: $474,441 (+$24,660, +5.48% from previous year)
Home values in Pinopolis have grown by more than 110% since 2014, with consistent year-over-year increases and especially strong growth from 2021 to 2025. It’s one of South Carolina’s most desirable inland markets today.
Pinopolis – Lakeside Living with a Historic Edge
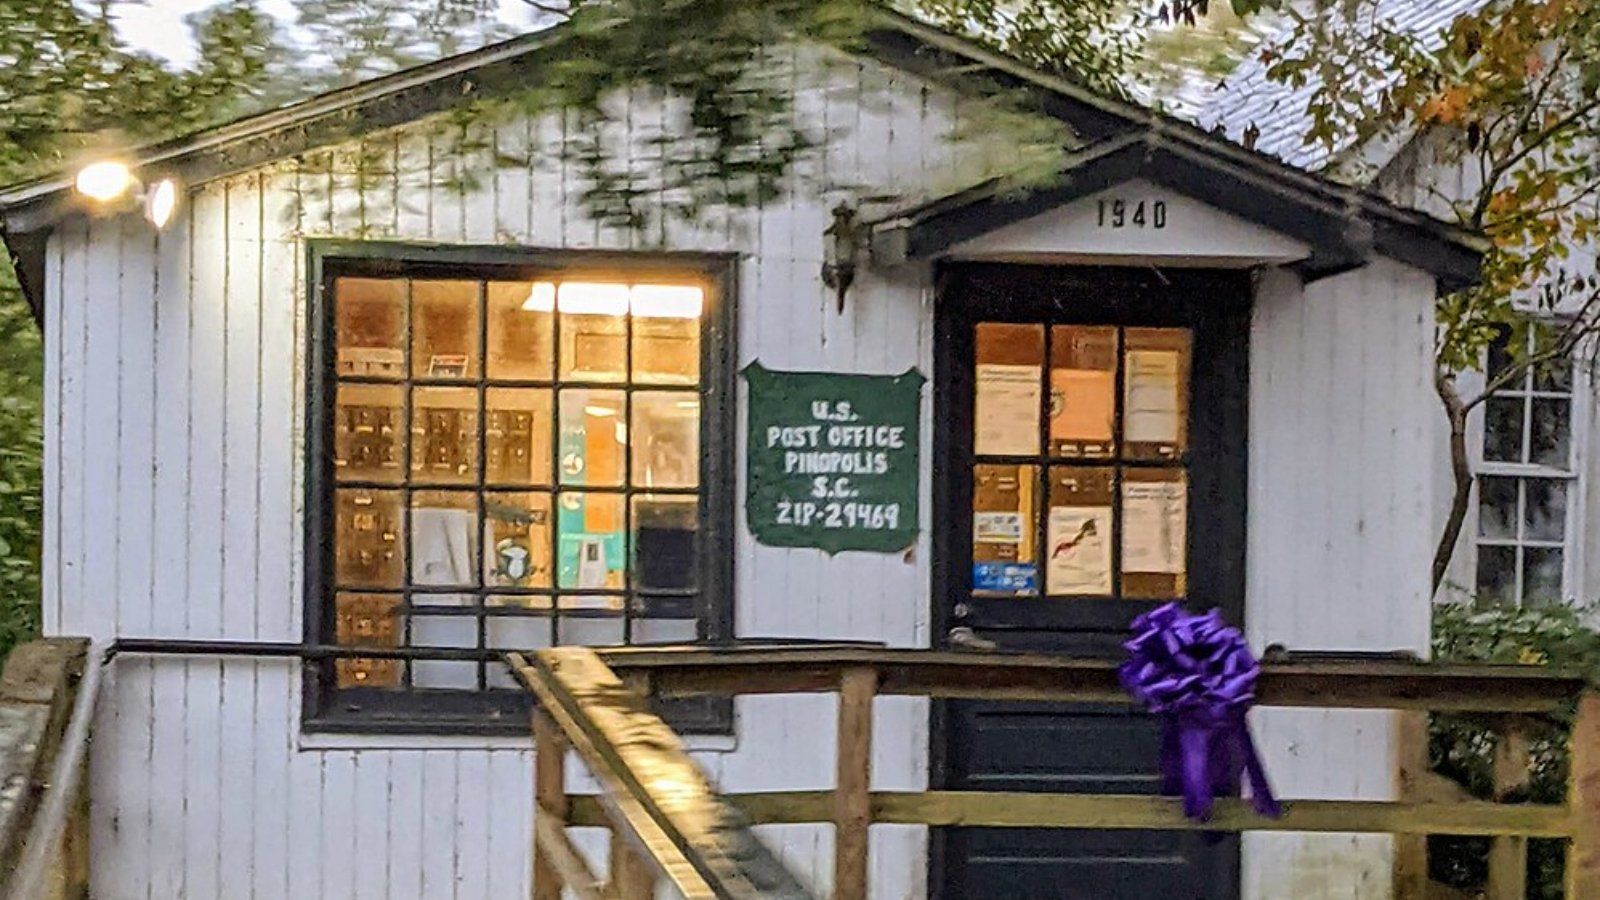
Pinopolis is a small, quiet community in Berkeley County on a peninsula in Lake Moultrie. Originally developed as a summer retreat in the 1800s, it remains prized for its lake views, boating access, and historic charm.
Strong interest in waterfront properties has driven up values in recent years. With homes now priced above $470,000, Pinopolis has become one of the Midlands’ most expensive lakeside communities, drawing both locals and out-of-state buyers.
22. Huger – 150% Home Price Increase Since 2010
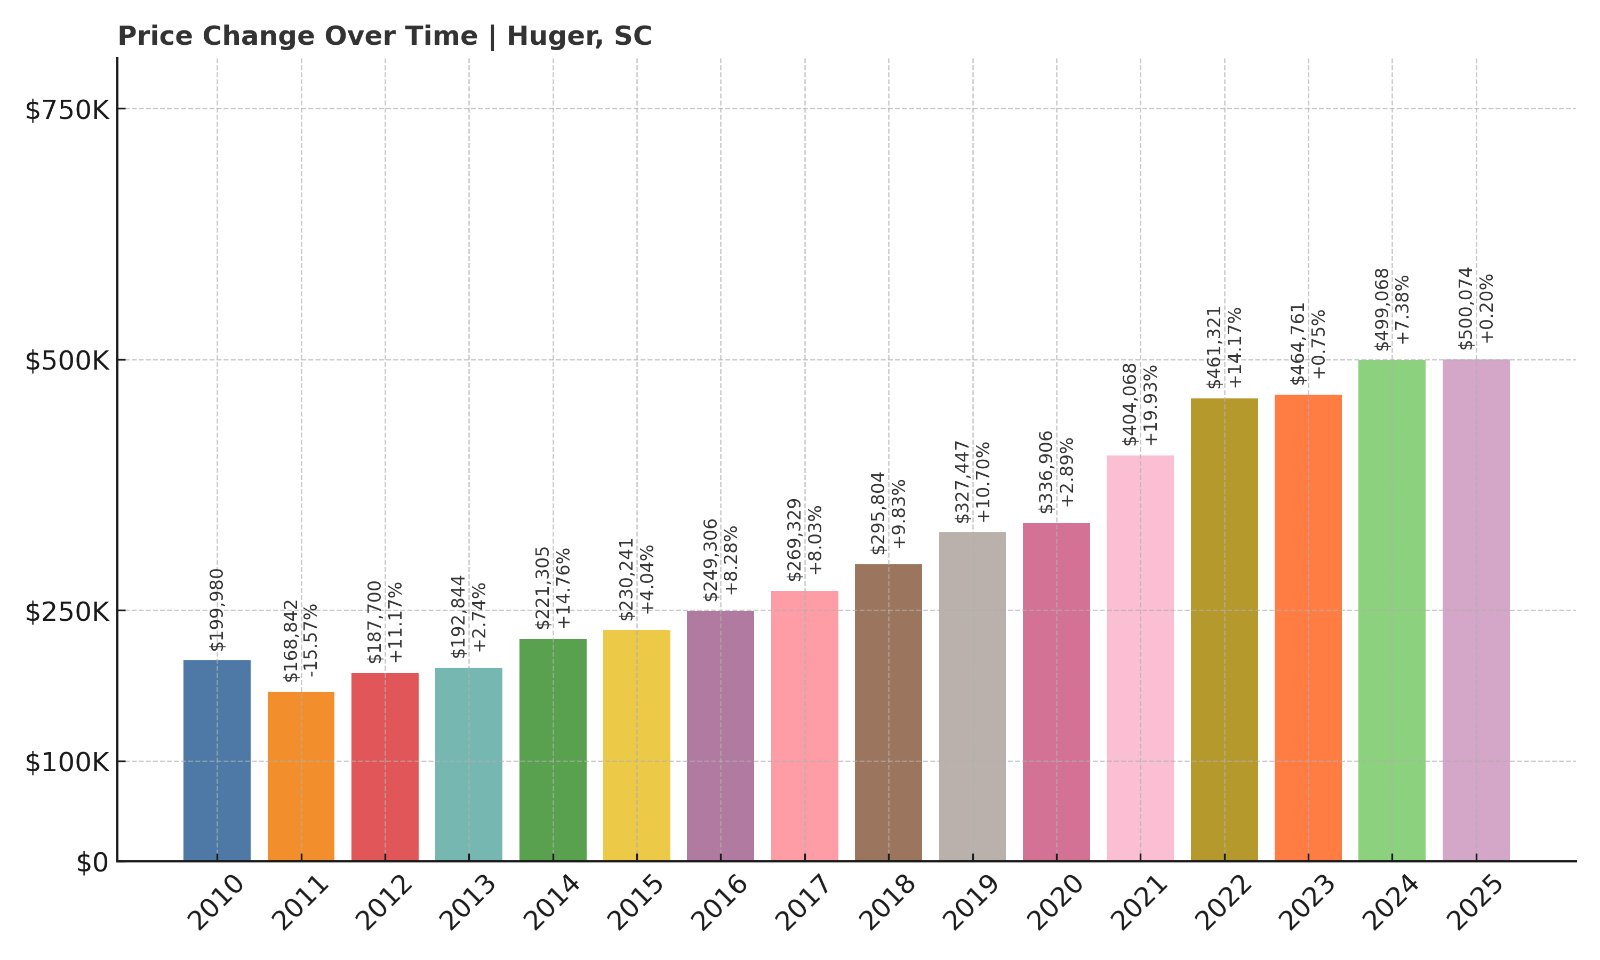
- 2010: $199,980
- 2011: $168,842 (-$31,139, -15.57% from previous year)
- 2012: $187,700 (+$18,858, +11.17% from previous year)
- 2013: $192,844 (+$5,144, +2.74% from previous year)
- 2014: $221,305 (+$28,461, +14.76% from previous year)
- 2015: $230,241 (+$8,937, +4.04% from previous year)
- 2016: $249,306 (+$19,064, +8.28% from previous year)
- 2017: $269,329 (+$20,024, +8.03% from previous year)
- 2018: $295,804 (+$26,475, +9.83% from previous year)
- 2019: $327,447 (+$31,643, +10.70% from previous year)
- 2020: $336,906 (+$9,459, +2.89% from previous year)
- 2021: $404,068 (+$67,162, +19.94% from previous year)
- 2022: $461,321 (+$57,253, +14.17% from previous year)
- 2023: $464,761 (+$3,440, +0.75% from previous year)
- 2024: $499,068 (+$34,307, +7.38% from previous year)
- 2025: $500,074 (+$1,006, +0.20% from previous year)
Huger has experienced a remarkable 150% rise in home prices since 2010, driven by growth in surrounding areas and an increased desire for space outside city centers.
Huger – Rural Growth Backed by Regional Demand
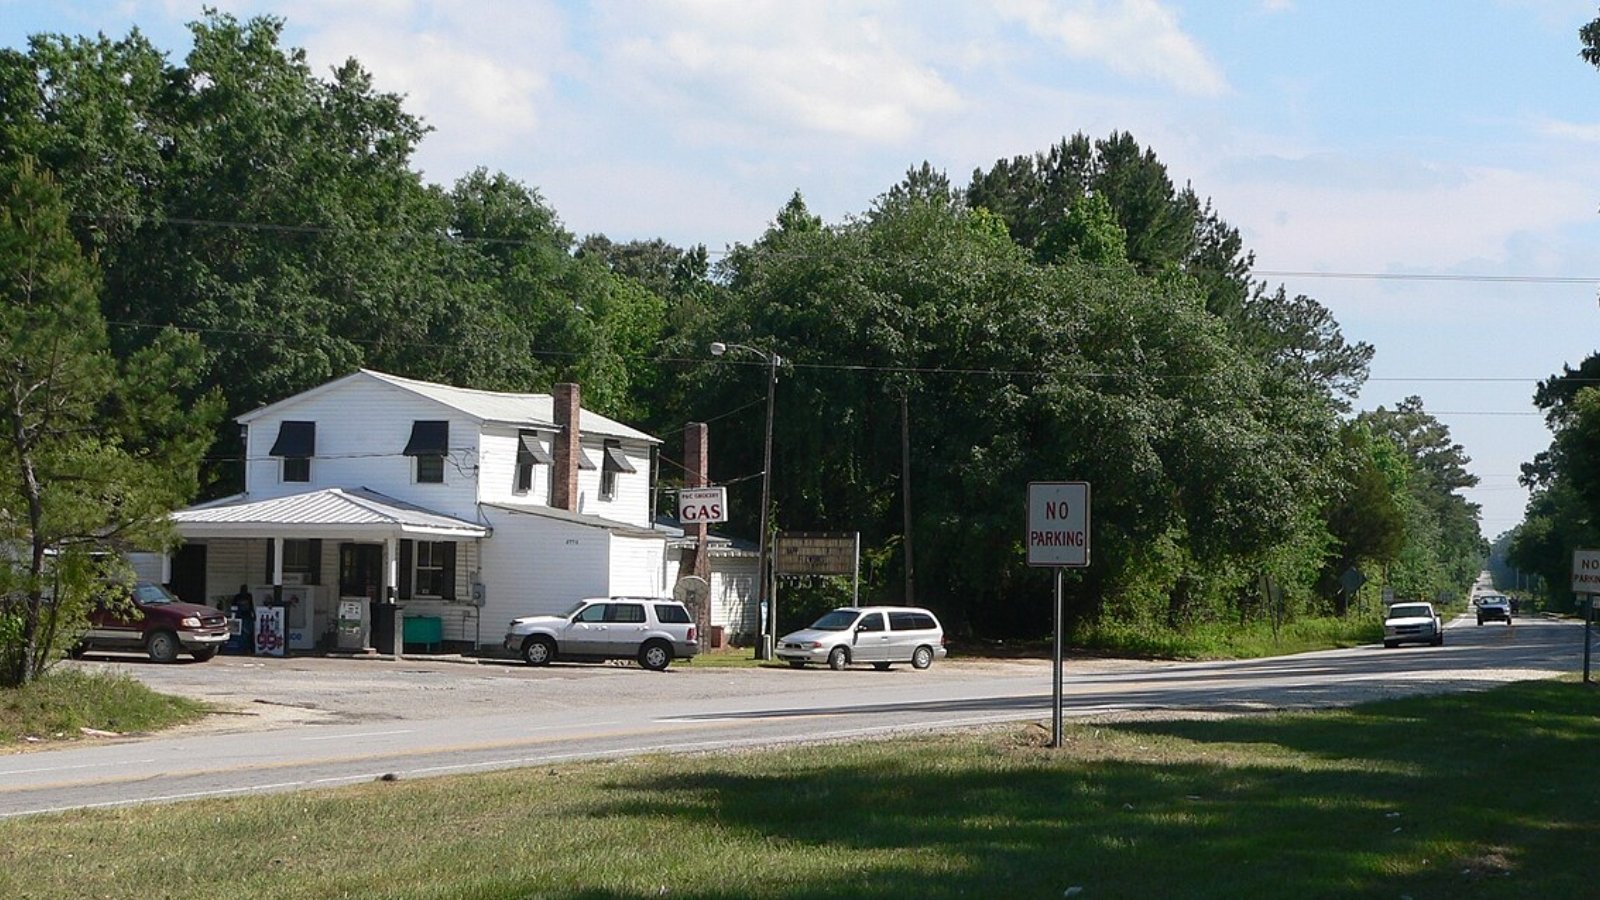
Situated just north of Mount Pleasant, Huger is a rural area that has seen strong residential growth as Charleston expands outward. Larger lots and proximity to Francis Marion National Forest make it appealing to those seeking privacy and nature.
Home prices pushed past $500,000 in 2025, reflecting a long trend of steady increases. Even without a standout downtown or commercial center, Huger’s location and affordability compared to the coast have made it a key growth zone.
21. Ravenel – 166% Home Price Increase Since 2010
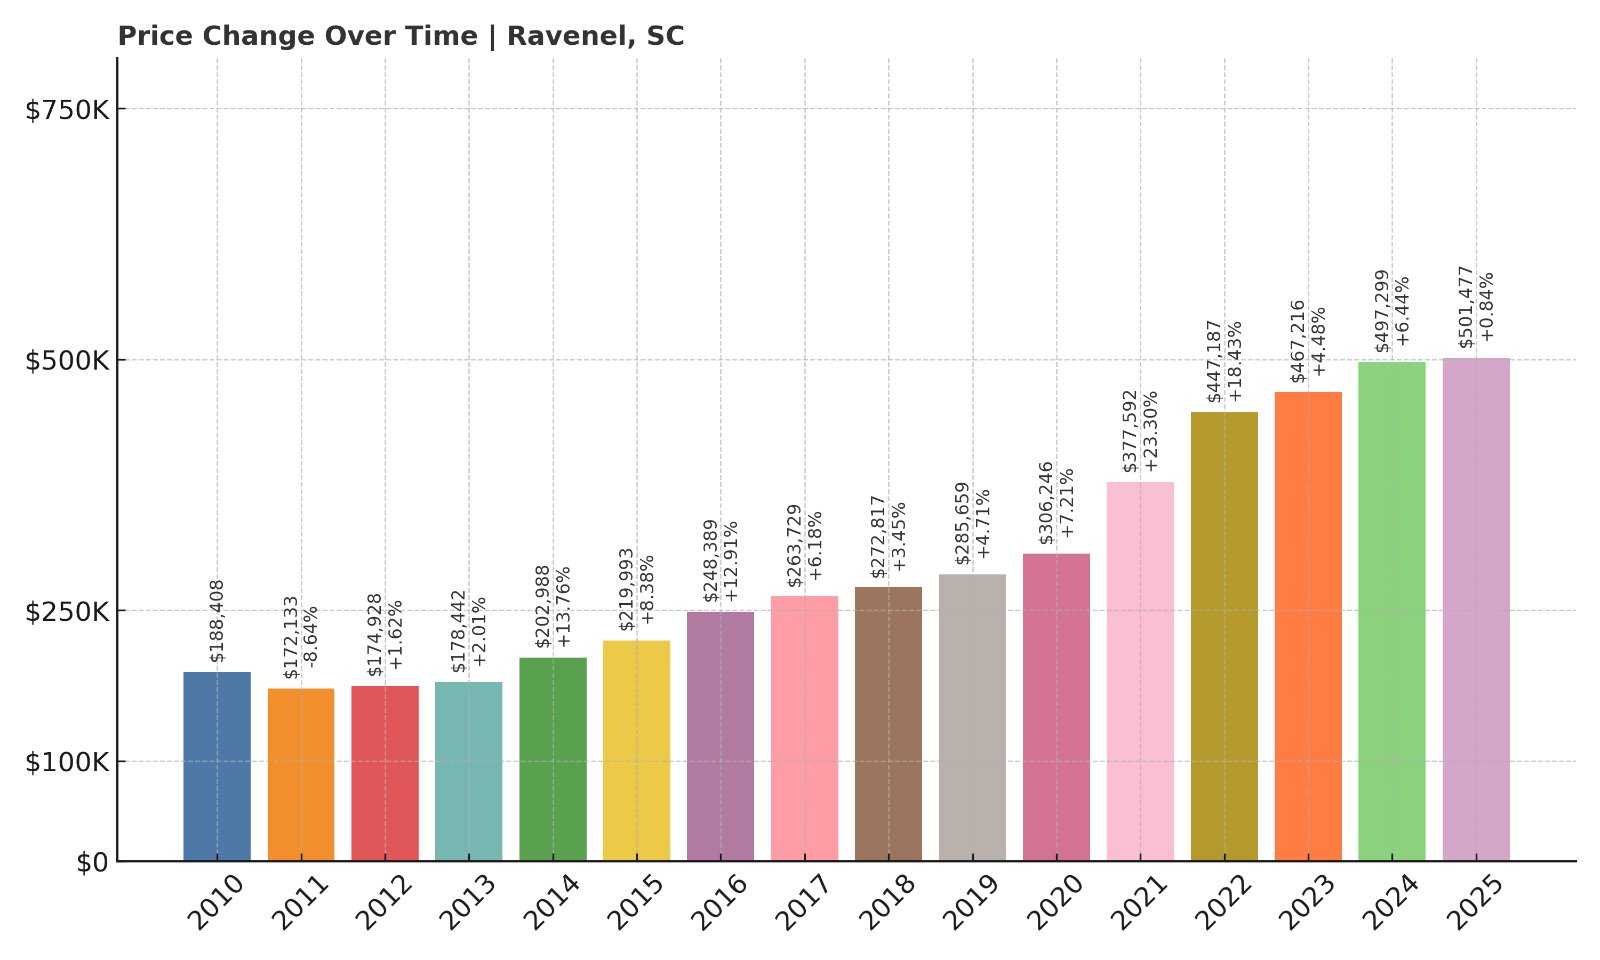
- 2010: $188,408
- 2011: $172,133 (-$16,275, -8.64% from previous year)
- 2012: $174,928 (+$2,795, +1.62% from previous year)
- 2013: $178,442 (+$3,514, +2.01% from previous year)
- 2014: $202,988 (+$24,545, +13.76% from previous year)
- 2015: $219,993 (+$17,005, +8.38% from previous year)
- 2016: $248,389 (+$28,397, +12.91% from previous year)
- 2017: $263,729 (+$15,339, +6.18% from previous year)
- 2018: $272,817 (+$9,089, +3.45% from previous year)
- 2019: $285,659 (+$12,842, +4.71% from previous year)
- 2020: $306,246 (+$20,587, +7.21% from previous year)
- 2021: $377,592 (+$71,346, +23.30% from previous year)
- 2022: $447,187 (+$69,595, +18.43% from previous year)
- 2023: $467,216 (+$20,029, +4.48% from previous year)
- 2024: $497,299 (+$30,083, +6.44% from previous year)
- 2025: $501,477 (+$4,178, +0.84% from previous year)
Ravenel home values have jumped more than 165% since 2010. Though the 2025 increase was modest, the town’s long-term trajectory continues to reflect strong upward momentum.
Ravenel – West of Charleston and Growing Steadily
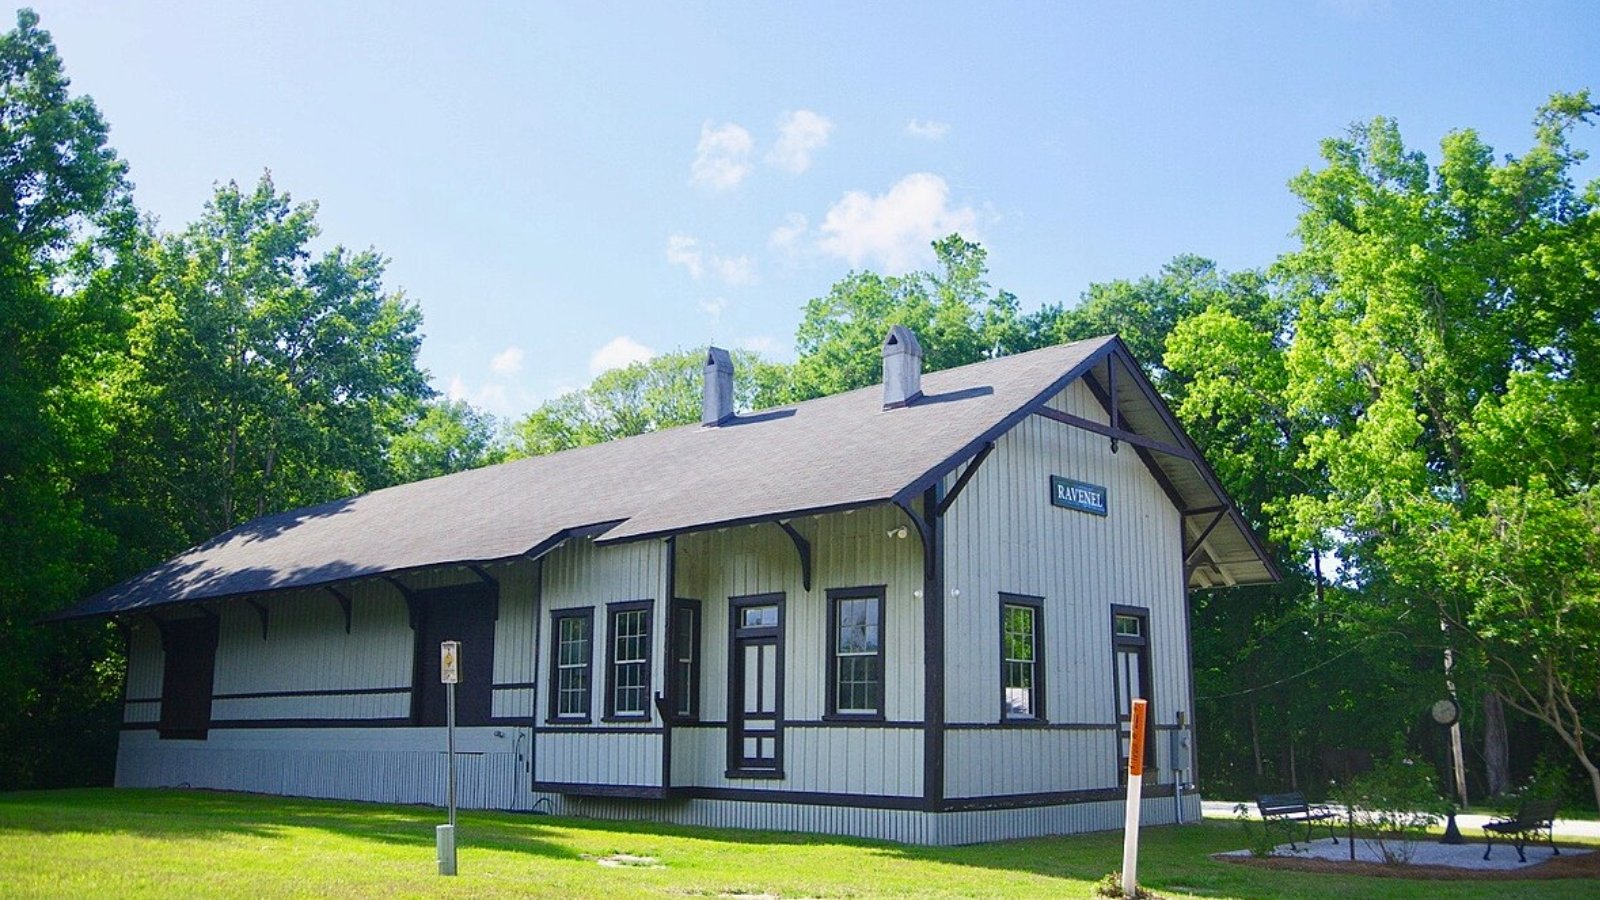
Located along Highway 17 southwest of Charleston, Ravenel offers access to the metro area without the congestion. With nearby Johns Island and West Ashley growing quickly, Ravenel has absorbed some of that spillover interest.
Its more rural character and relative affordability compared to Charleston have made it popular with buyers seeking space and value. With home prices topping $500,000 in 2025, Ravenel is no longer a budget option but still offers a quieter lifestyle than its coastal neighbors.
20. Bluffton – 108% Home Price Increase Since 2010
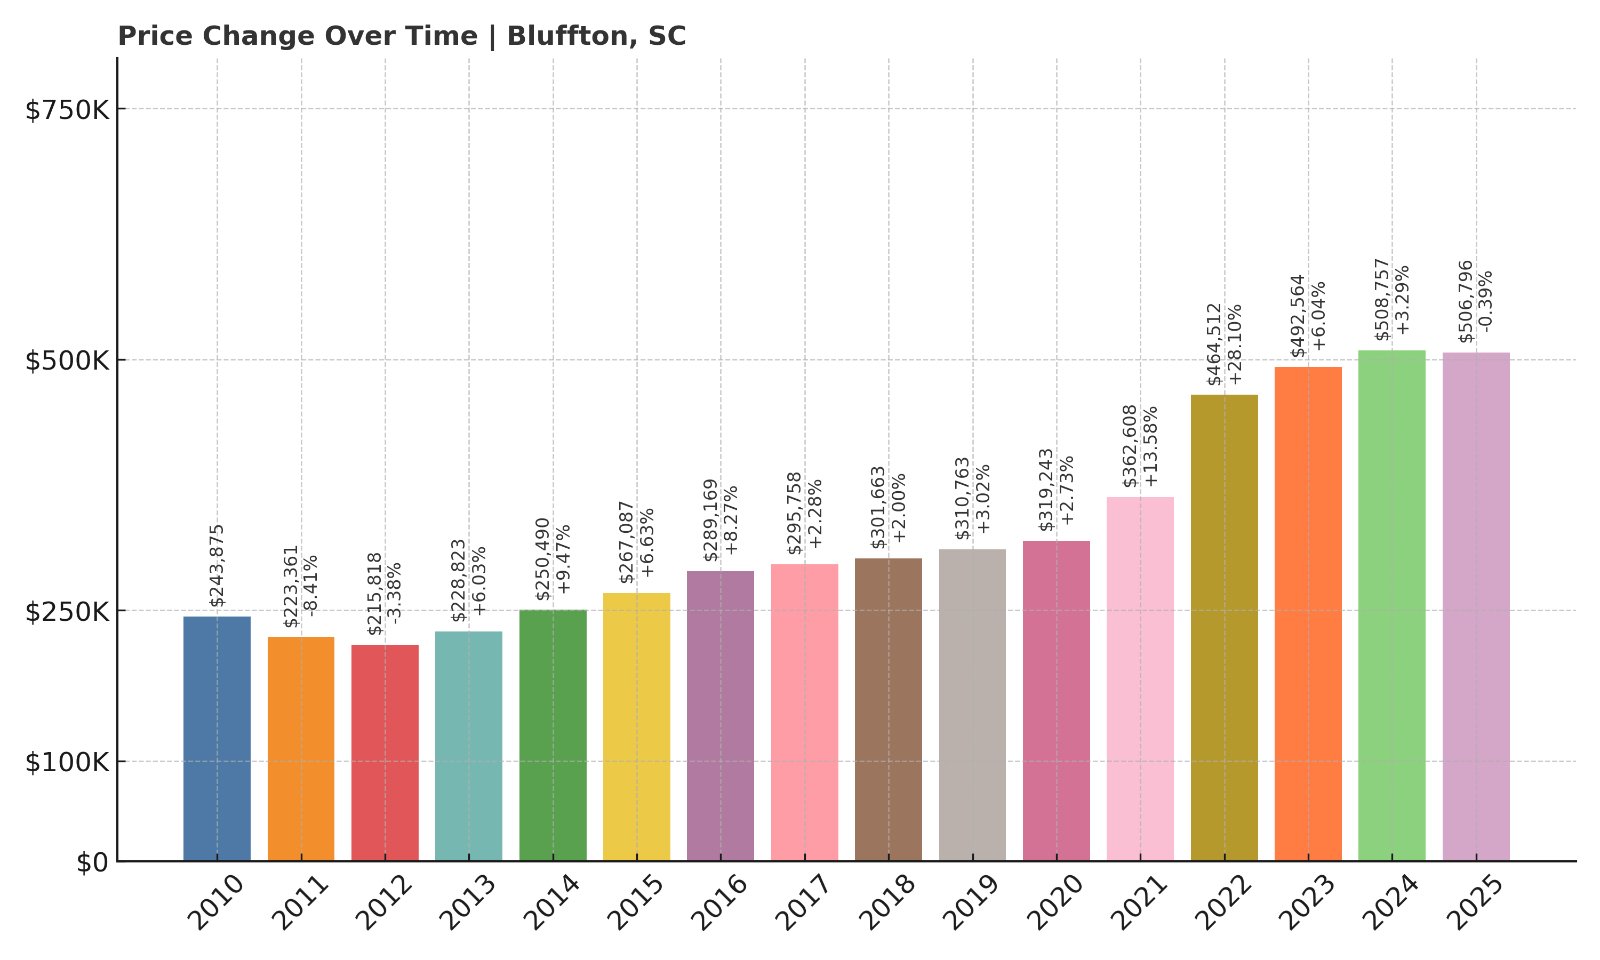
- 2010: $243,875
- 2011: $223,361 (-$20,515, -8.41% from previous year)
- 2012: $215,818 (-$7,543, -3.38% from previous year)
- 2013: $228,823 (+$13,006, +6.03% from previous year)
- 2014: $250,490 (+$21,666, +9.47% from previous year)
- 2015: $267,087 (+$16,597, +6.63% from previous year)
- 2016: $289,169 (+$22,082, +8.27% from previous year)
- 2017: $295,758 (+$6,589, +2.28% from previous year)
- 2018: $301,663 (+$5,904, +2.00% from previous year)
- 2019: $310,763 (+$9,101, +3.02% from previous year)
- 2020: $319,243 (+$8,480, +2.73% from previous year)
- 2021: $362,608 (+$43,365, +13.58% from previous year)
- 2022: $464,512 (+$101,904, +28.10% from previous year)
- 2023: $492,564 (+$28,053, +6.04% from previous year)
- 2024: $508,757 (+$16,192, +3.29% from previous year)
- 2025: $506,796 (-$1,960, -0.39% from previous year)
Home values in Bluffton have increased 108% since 2010, with explosive growth starting in 2020. Even with a slight dip in 2025, the median home price remains above half a million dollars.
Bluffton – The Gateway to Hilton Head Sees Soaring Demand
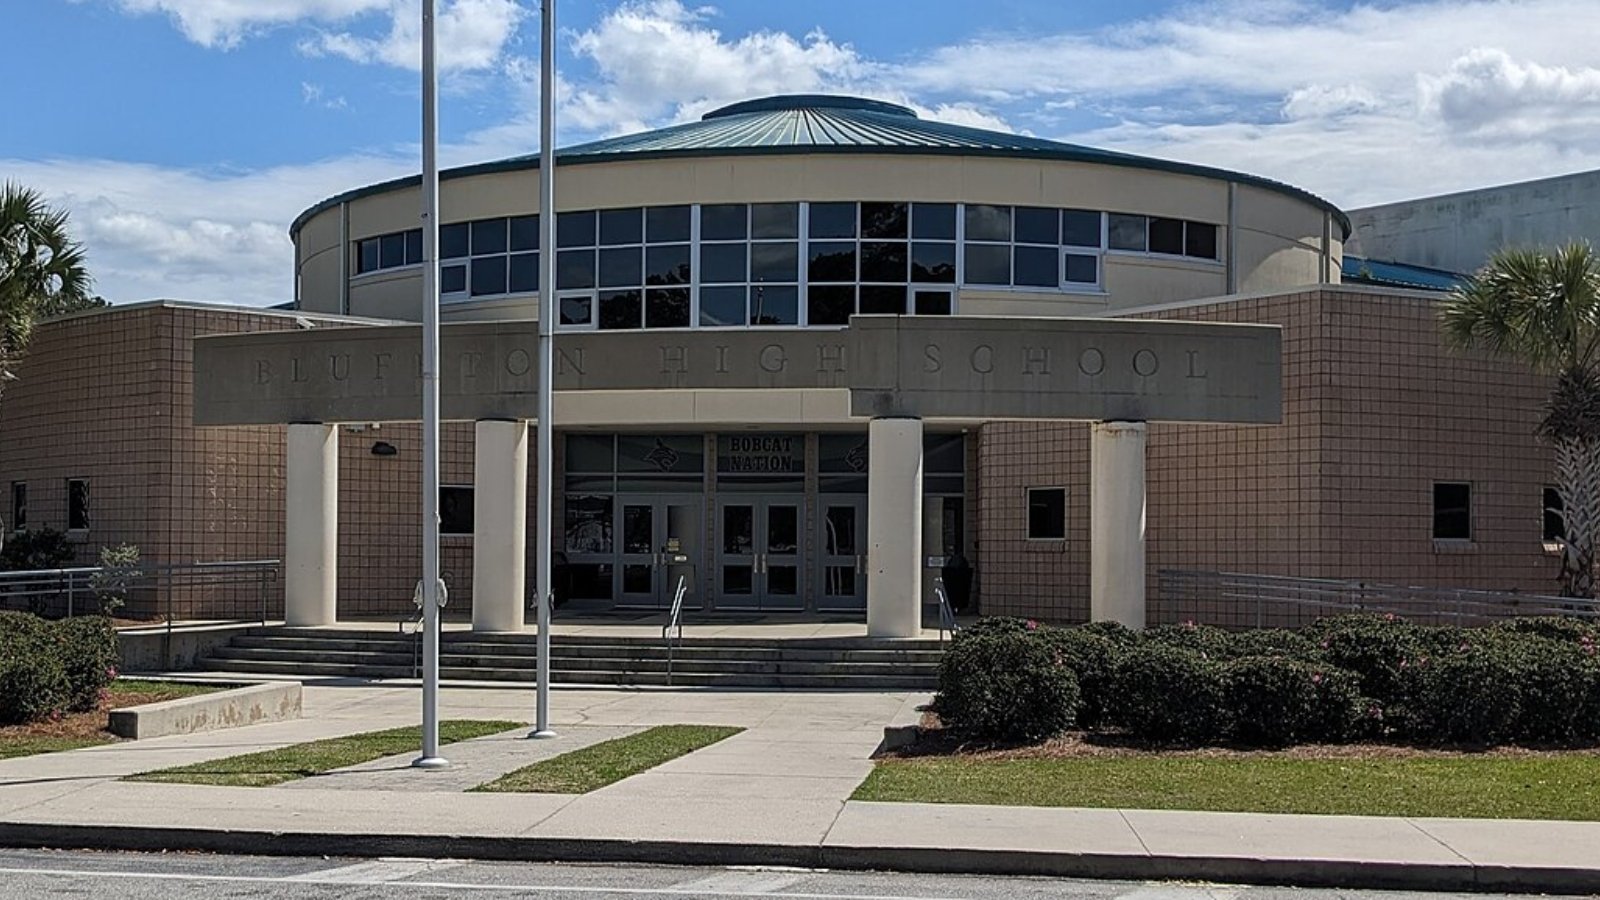
Bluffton’s location just west of Hilton Head Island and near Savannah has made it one of the most sought-after communities in the Lowcountry. It has transformed from a small fishing town into a thriving suburb with master-planned neighborhoods and a historic downtown.
The combination of coastal access, job growth, and lifestyle amenities has attracted families, retirees, and remote workers alike. After surging past $500,000 in 2023, prices are now stabilizing, yet Bluffton continues to be one of South Carolina’s top-tier housing markets.
19. Hollywood – 122% Home Price Increase Since 2010
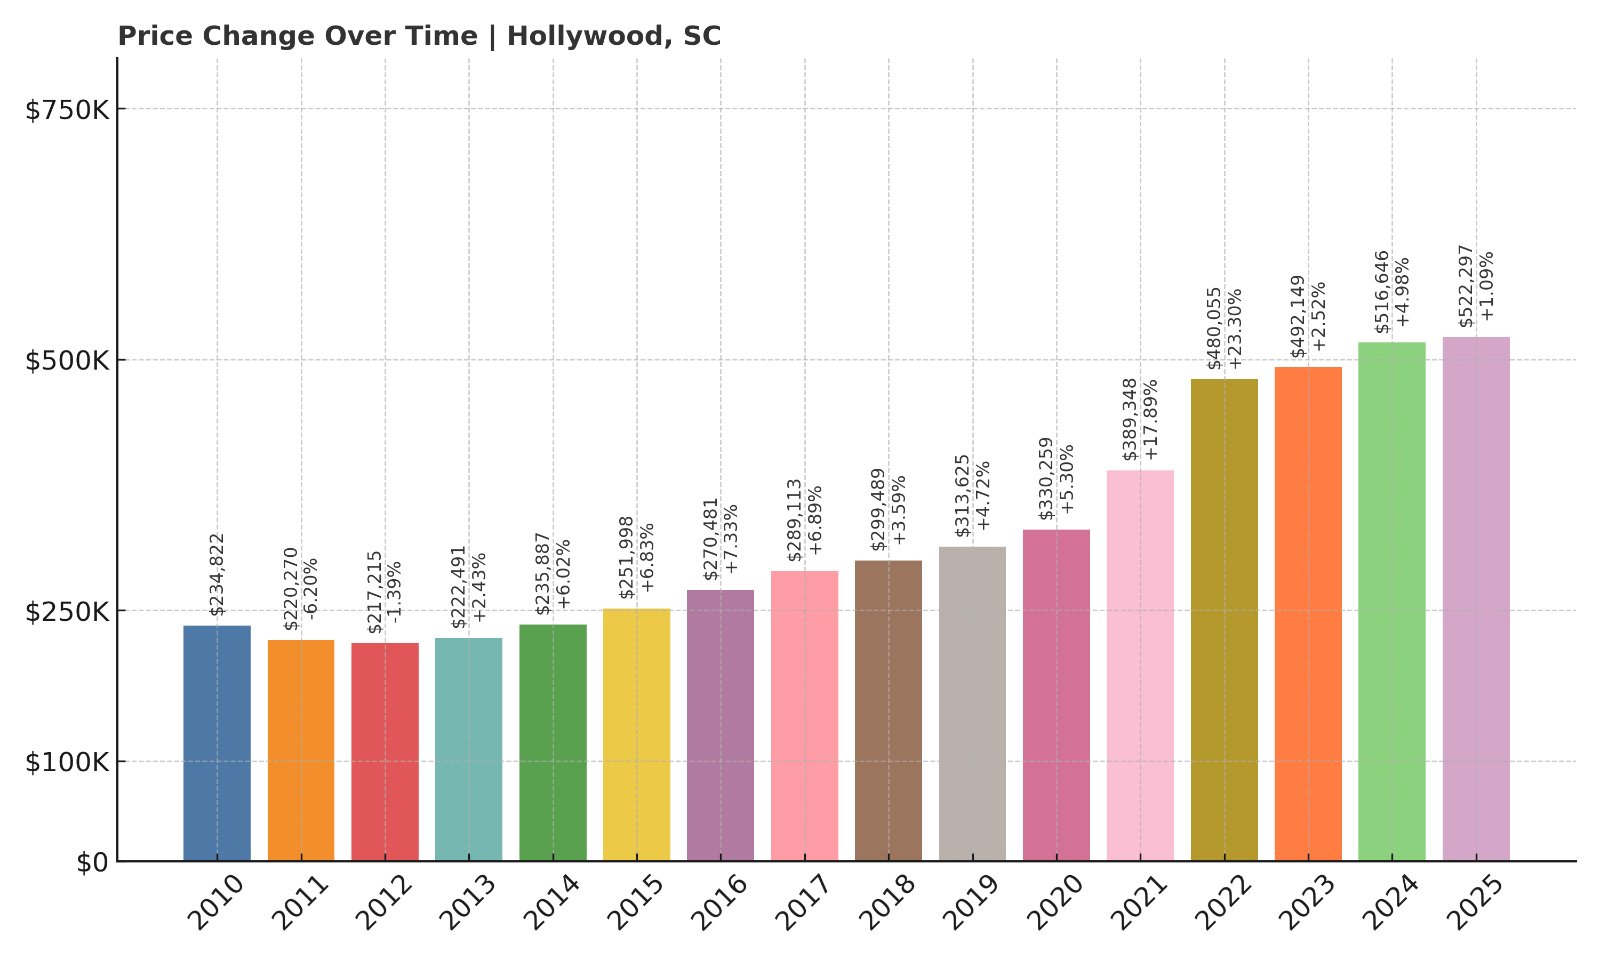
- 2010: $234,822
- 2011: $220,270 (-$14,552, -6.20% from previous year)
- 2012: $217,215 (-$3,055, -1.39% from previous year)
- 2013: $222,491 (+$5,277, +2.43% from previous year)
- 2014: $235,887 (+$13,395, +6.02% from previous year)
- 2015: $251,998 (+$16,112, +6.83% from previous year)
- 2016: $270,481 (+$18,483, +7.33% from previous year)
- 2017: $289,113 (+$18,632, +6.89% from previous year)
- 2018: $299,489 (+$10,376, +3.59% from previous year)
- 2019: $313,625 (+$14,136, +4.72% from previous year)
- 2020: $330,259 (+$16,634, +5.30% from previous year)
- 2021: $389,348 (+$59,089, +17.89% from previous year)
- 2022: $480,055 (+$90,707, +23.30% from previous year)
- 2023: $492,149 (+$12,094, +2.52% from previous year)
- 2024: $516,646 (+$24,497, +4.98% from previous year)
- 2025: $522,297 (+$5,651, +1.09% from previous year)
Hollywood’s home values have surged 122% since 2010, with the biggest gains coming in the early 2020s. Prices have remained strong into 2025, with homes now averaging over $520,000.
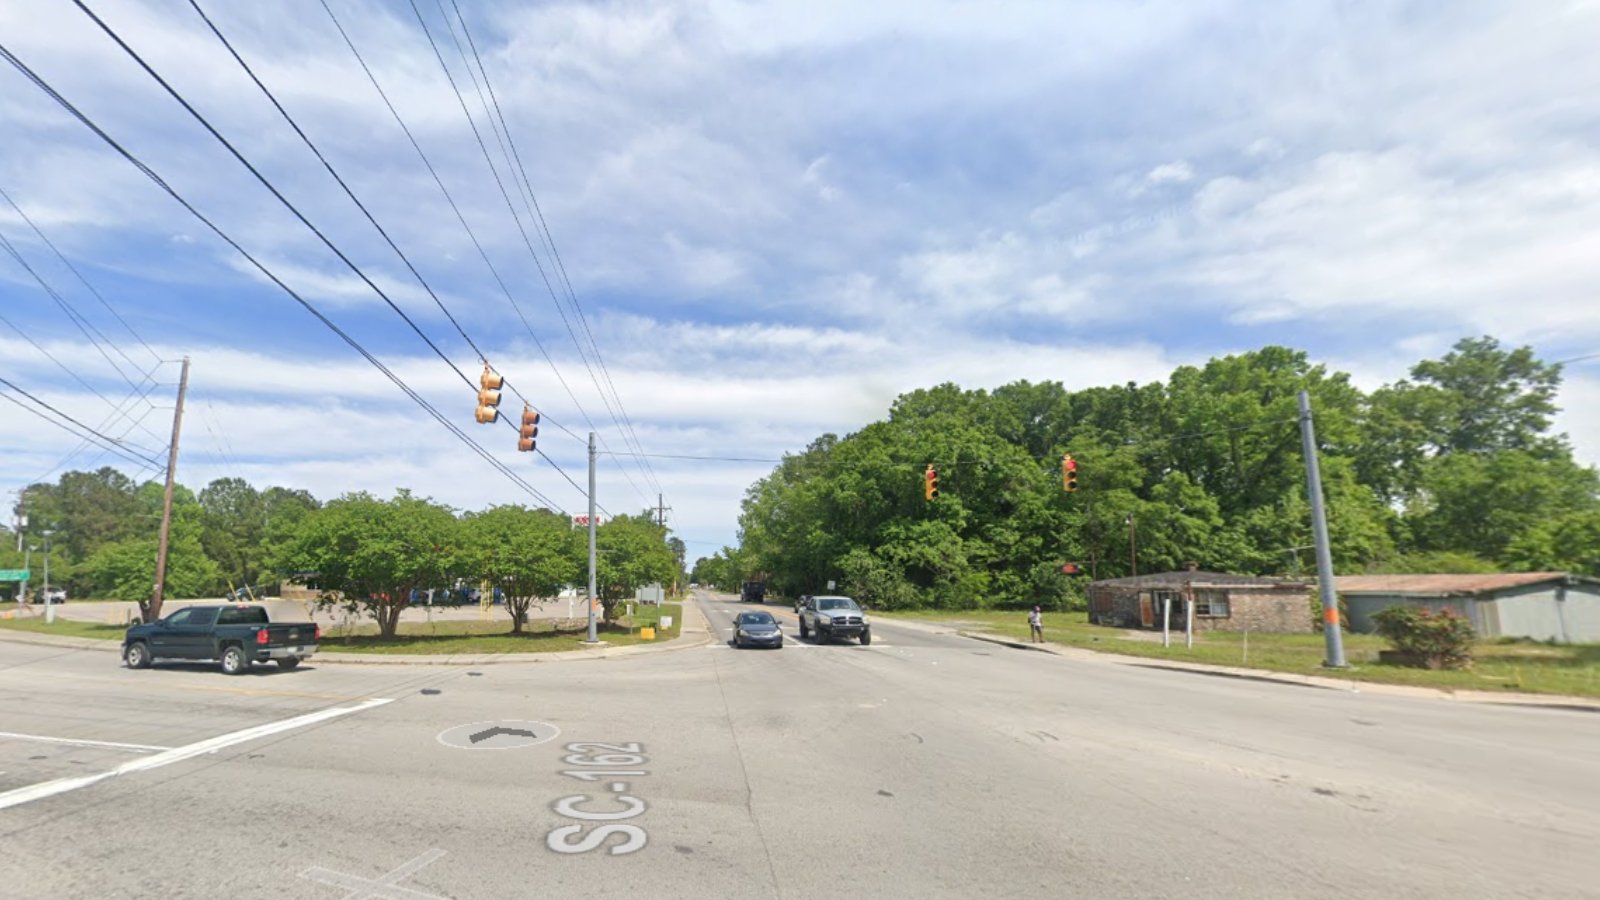
Hollywood – Peaceful Countryside with Big Price Tags
🔥 Would you like to save this?
West of Charleston and nestled among marshlands, creeks, and horse farms, Hollywood offers a more rural lifestyle with easy access to the city. It’s a favorite for buyers who want acreage and quiet while still being close to Charleston jobs and amenities.
Hollywood’s market benefitted from the pandemic-fueled search for space, and prices have climbed steadily since 2020. While growth has tapered slightly, the town remains in high demand among both locals and newcomers to the Lowcountry.
18. Salem – 111% Home Price Increase Since 2011
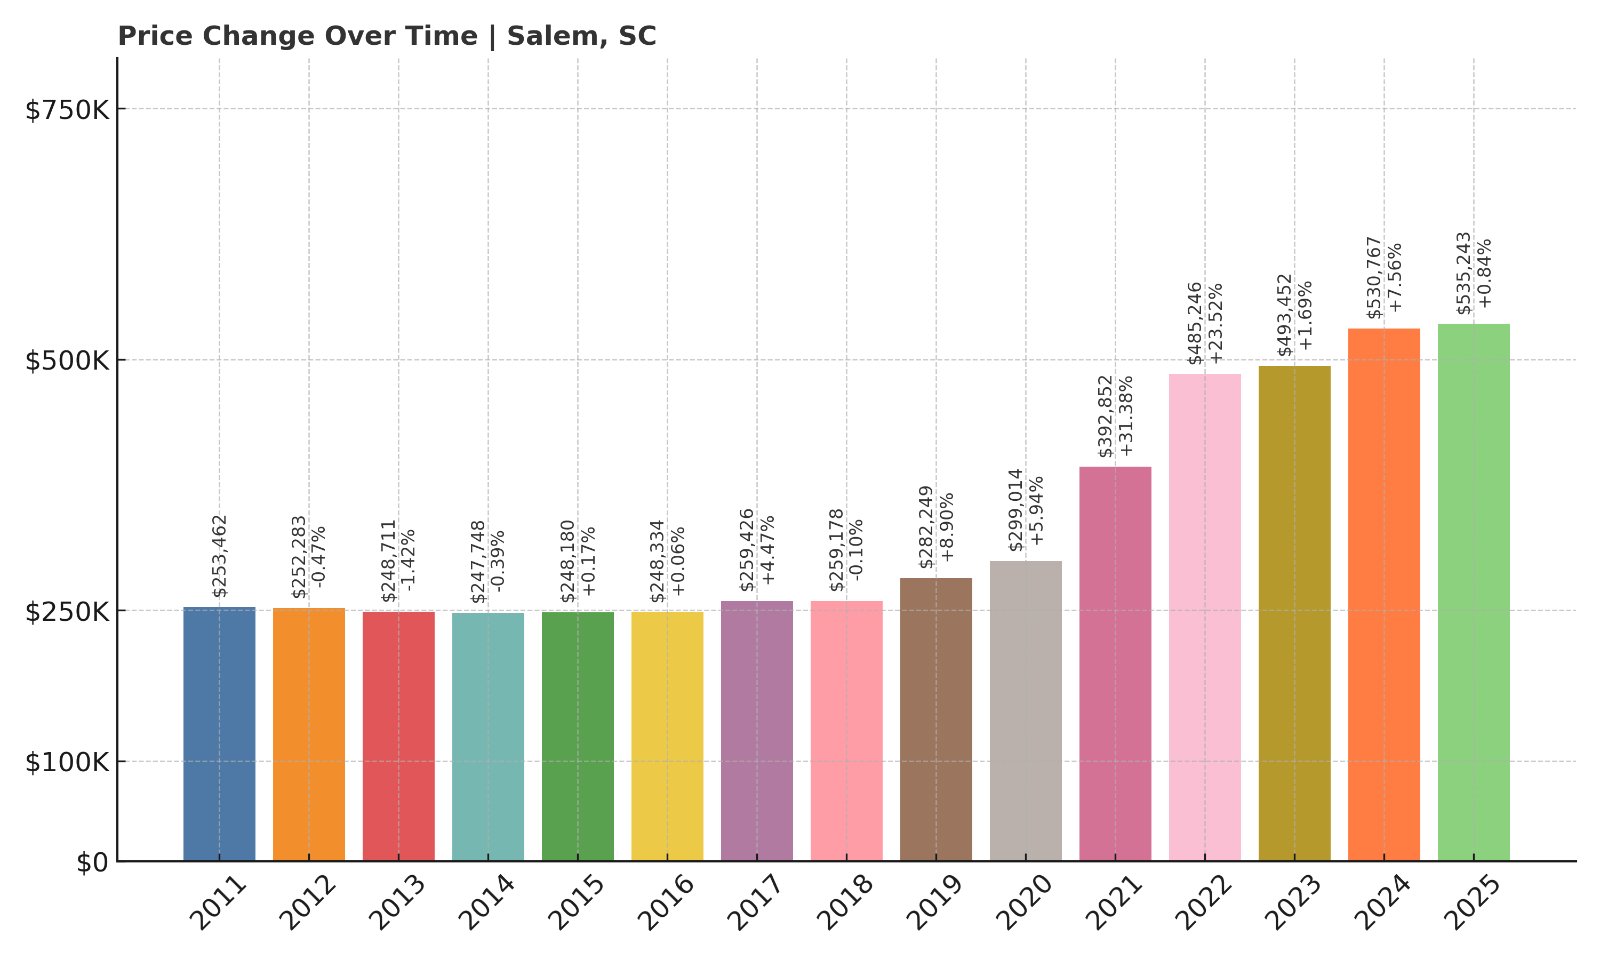
- 2011: $253,462
- 2012: $252,283 (-$1,179, -0.47% from previous year)
- 2013: $248,711 (-$3,572, -1.42% from previous year)
- 2014: $247,748 (-$964, -0.39% from previous year)
- 2015: $248,180 (+$433, +0.17% from previous year)
- 2016: $248,334 (+$154, +0.06% from previous year)
- 2017: $259,426 (+$11,092, +4.47% from previous year)
- 2018: $259,178 (-$248, -0.10% from previous year)
- 2019: $282,249 (+$23,072, +8.90% from previous year)
- 2020: $299,014 (+$16,764, +5.94% from previous year)
- 2021: $392,852 (+$93,838, +31.38% from previous year)
- 2022: $485,246 (+$92,394, +23.52% from previous year)
- 2023: $493,452 (+$8,206, +1.69% from previous year)
- 2024: $530,767 (+$37,315, +7.56% from previous year)
- 2025: $535,243 (+$4,476, +0.84% from previous year)
Salem’s housing market has doubled in value since 2011, with steep increases beginning in 2020. Prices topped $530,000 in 2024 and have remained elevated.
Salem – Lake Keowee Views Fuel High Prices
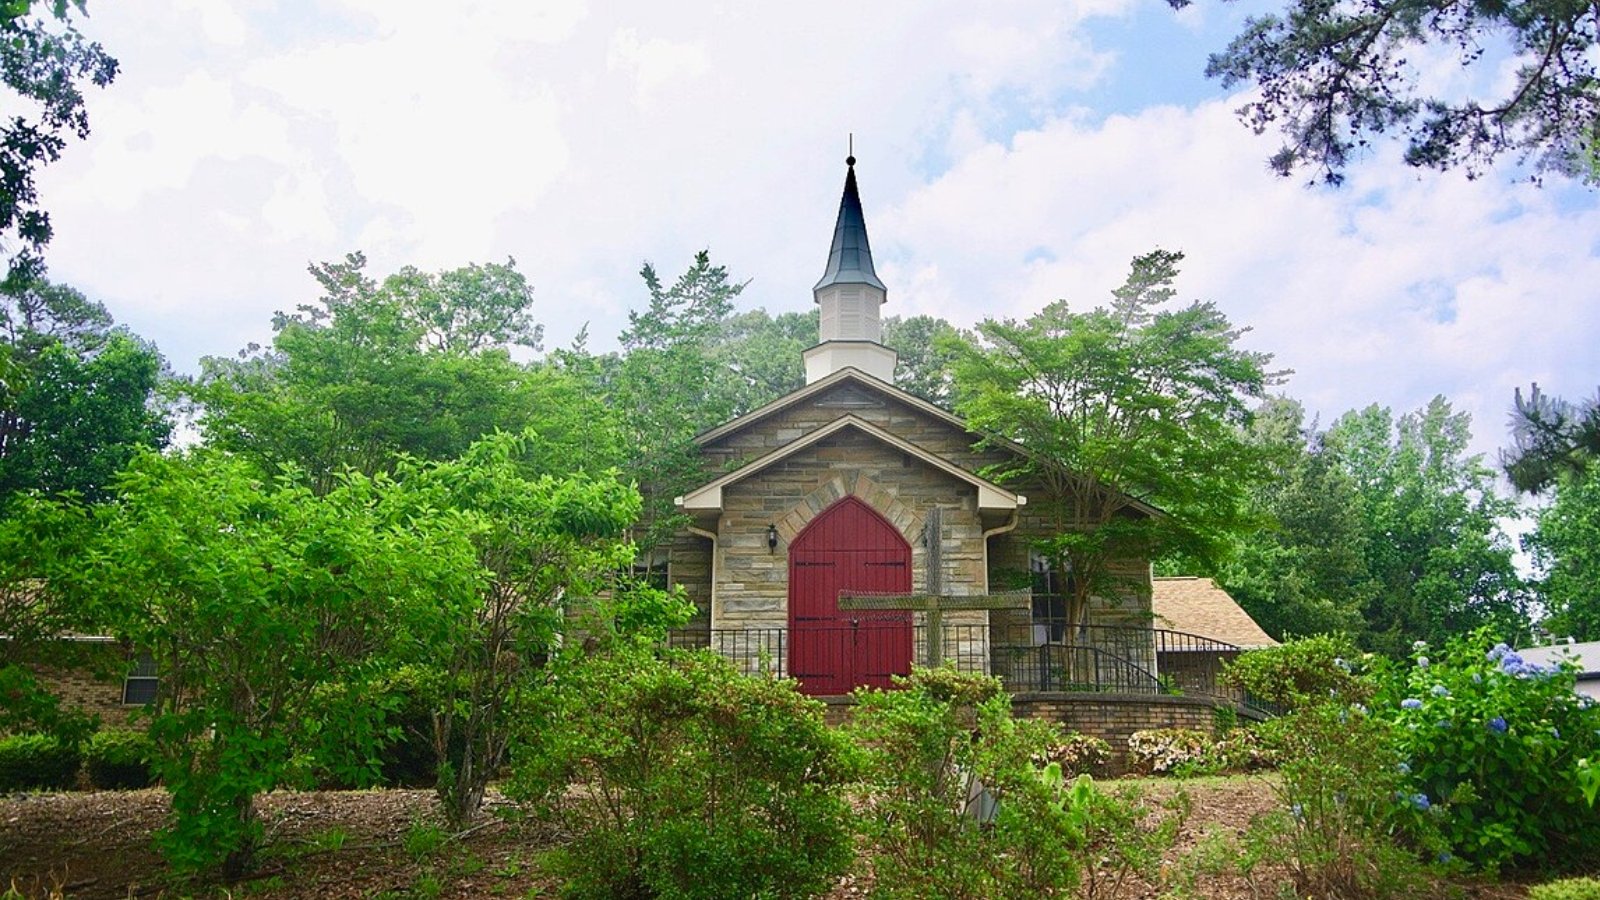
Salem sits on the north end of Lake Keowee in Oconee County, a region increasingly popular for second homes and lakefront living. With its quiet mountain setting and water access, Salem has drawn buyers from Atlanta, Charlotte, and beyond.
High demand for scenic, private properties accelerated growth during the pandemic. Now one of the most expensive towns in the Upstate, Salem’s home prices reflect its status as a luxury lake destination.
17. Fort Mill – 125% Home Price Increase Since 2010
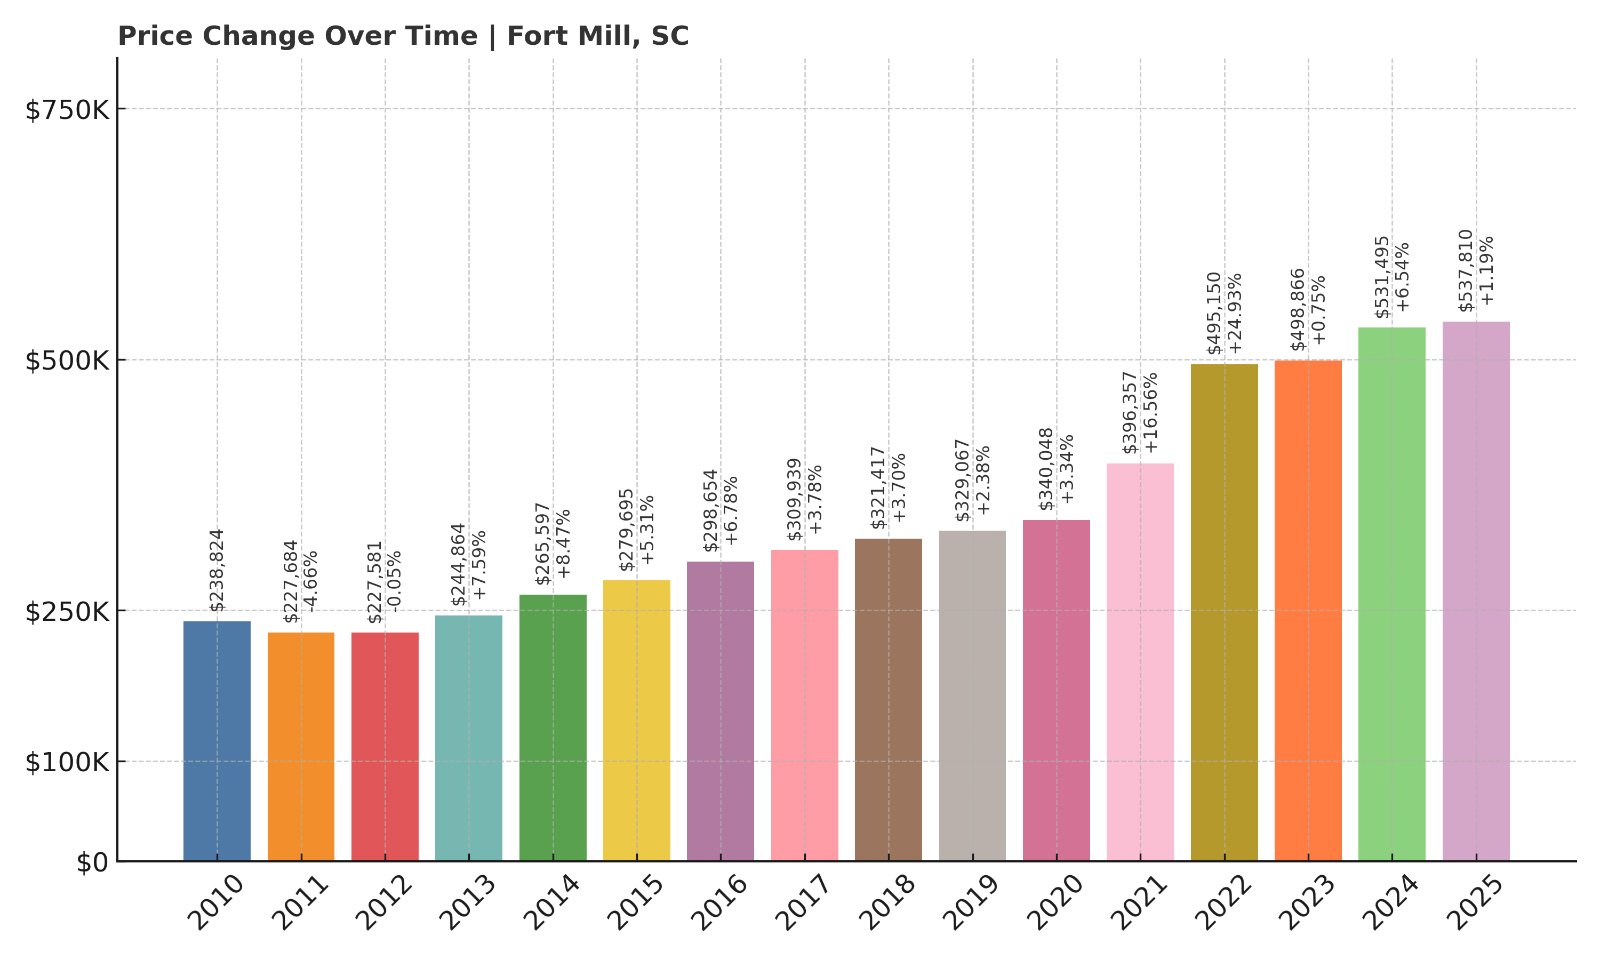
- 2010: $238,824
- 2011: $227,684 (-$11,140, -4.66% from previous year)
- 2012: $227,581 (-$103, -0.05% from previous year)
- 2013: $244,864 (+$17,282, +7.59% from previous year)
- 2014: $265,597 (+$20,733, +8.47% from previous year)
- 2015: $279,695 (+$14,099, +5.31% from previous year)
- 2016: $298,654 (+$18,959, +6.78% from previous year)
- 2017: $309,939 (+$11,285, +3.78% from previous year)
- 2018: $321,417 (+$11,479, +3.70% from previous year)
- 2019: $329,067 (+$7,649, +2.38% from previous year)
- 2020: $340,048 (+$10,981, +3.34% from previous year)
- 2021: $396,357 (+$56,309, +16.56% from previous year)
- 2022: $495,150 (+$98,794, +24.93% from previous year)
- 2023: $498,866 (+$3,716, +0.75% from previous year)
- 2024: $531,495 (+$32,629, +6.54% from previous year)
- 2025: $537,810 (+$6,315, +1.19% from previous year)
Fort Mill’s housing prices have jumped 125% since 2010. It’s been a consistent growth market, with especially strong appreciation between 2020 and 2022.
Fort Mill – Charlotte Suburb with Top-Rated Schools
One of the most desirable towns in the Charlotte metro region, Fort Mill is known for its excellent schools, family-friendly neighborhoods, and low South Carolina property taxes. It has become a relocation magnet.
With a typical home now selling for more than $530,000, Fort Mill offers the feel of suburban North Carolina with the benefits of South Carolina residency. The town’s popularity shows no signs of waning, even as price growth slows.
16. Pawleys Island – 110% Home Price Increase Since 2012
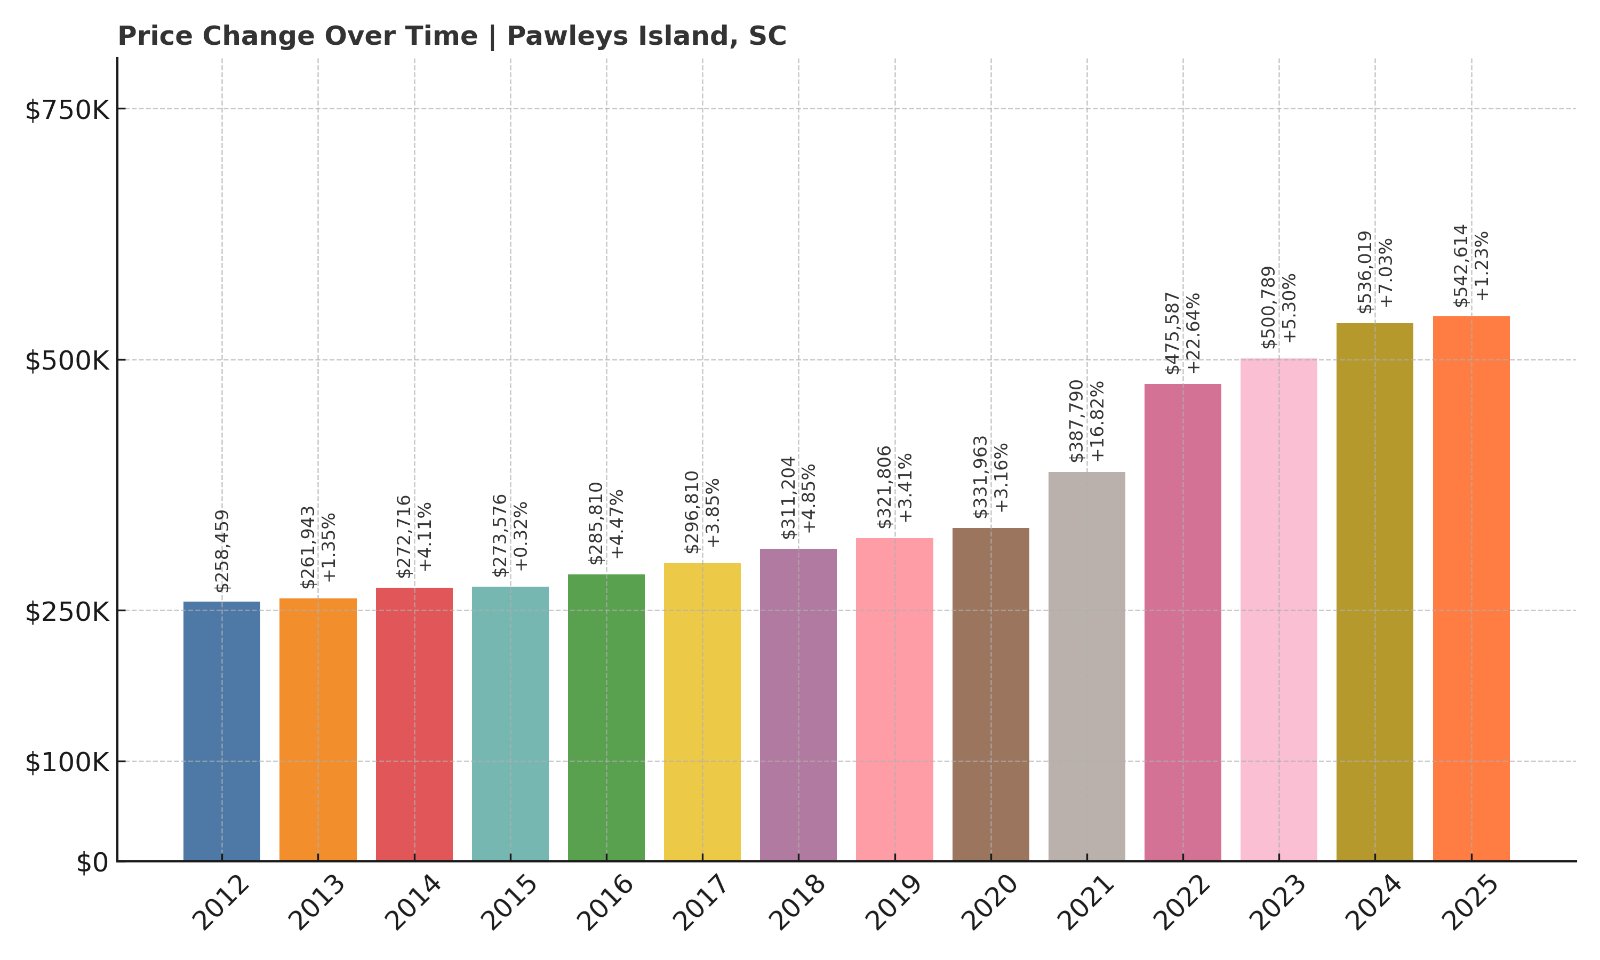
- 2012: $258,459
- 2013: $261,943 (+$3,485, +1.35% from previous year)
- 2014: $272,716 (+$10,773, +4.11% from previous year)
- 2015: $273,576 (+$860, +0.32% from previous year)
- 2016: $285,810 (+$12,233, +4.47% from previous year)
- 2017: $296,810 (+$11,000, +3.85% from previous year)
- 2018: $311,204 (+$14,395, +4.85% from previous year)
- 2019: $321,806 (+$10,602, +3.41% from previous year)
- 2020: $331,963 (+$10,157, +3.16% from previous year)
- 2021: $387,790 (+$55,827, +16.82% from previous year)
- 2022: $475,587 (+$87,797, +22.64% from previous year)
- 2023: $500,789 (+$25,202, +5.30% from previous year)
- 2024: $536,019 (+$35,230, +7.03% from previous year)
- 2025: $542,614 (+$6,595, +1.23% from previous year)
Home values in Pawleys Island have more than doubled since 2012, continuing their climb even into 2025. It’s now one of the most expensive coastal towns in the state.
Pawleys Island – Old South Serenity with Modern Demand
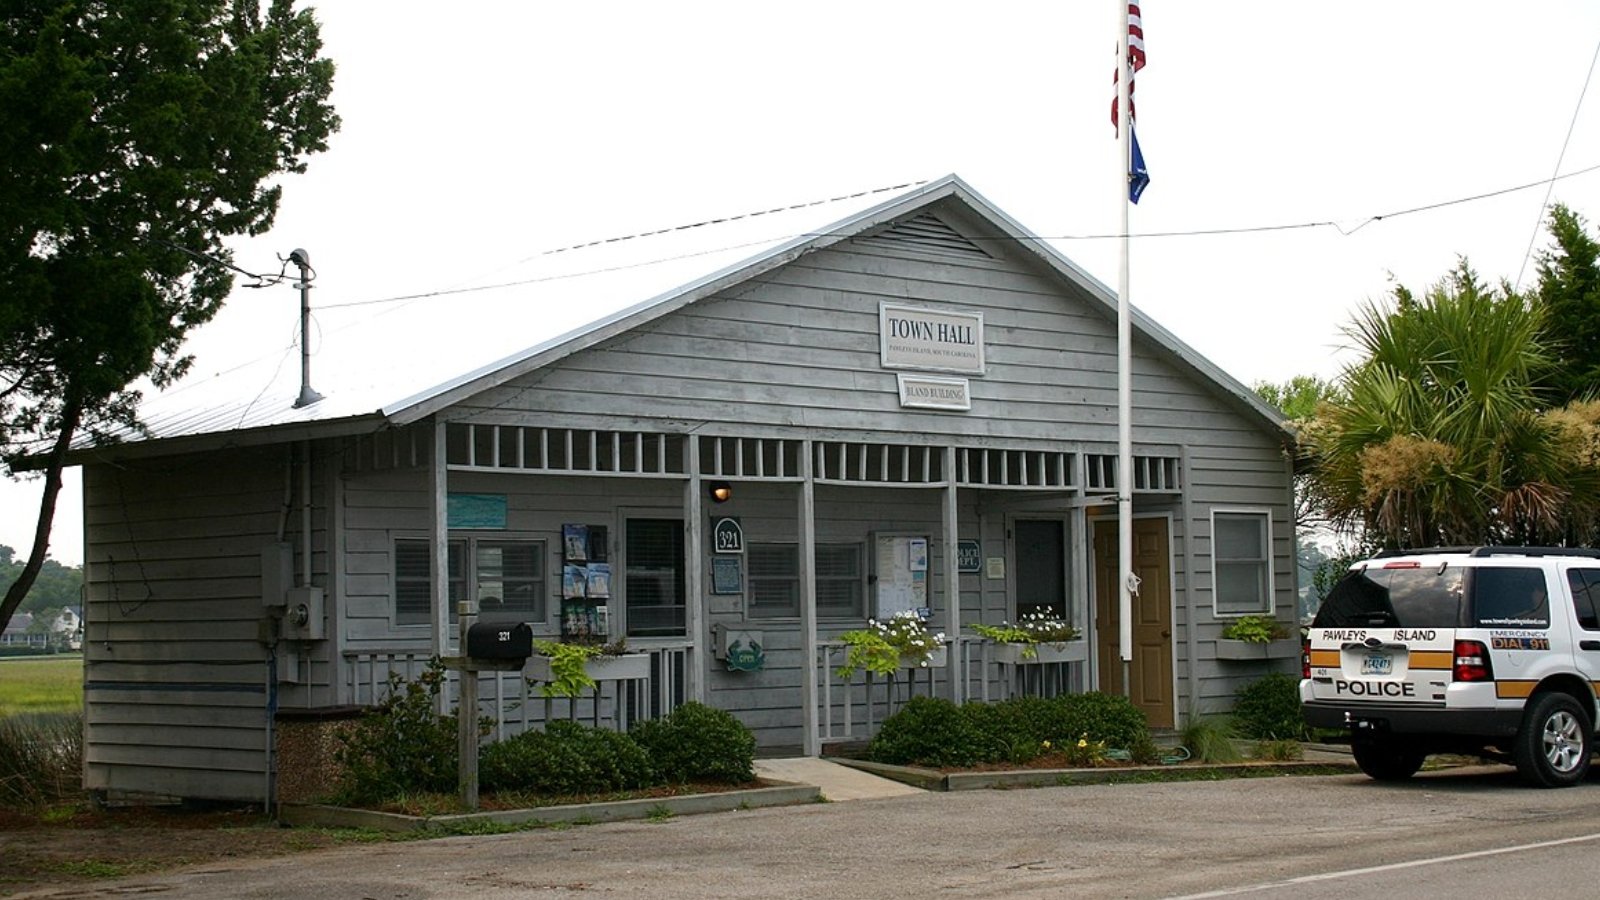
Famous for its laid-back lifestyle and beaches without high-rises, Pawleys Island has long been a favorite among South Carolina’s well-heeled vacationers. Its historic cottages, golf courses, and tidal creeks offer a unique blend of charm and exclusivity.
Pandemic-era migration and remote work amplified its appeal, driving prices up by nearly $220,000 from 2020 to 2025. With median values surpassing $540,000, Pawleys Island is no longer just a summer escape—it’s a year-round investment.
15. Charleston – 161% Home Price Increase Since 2010
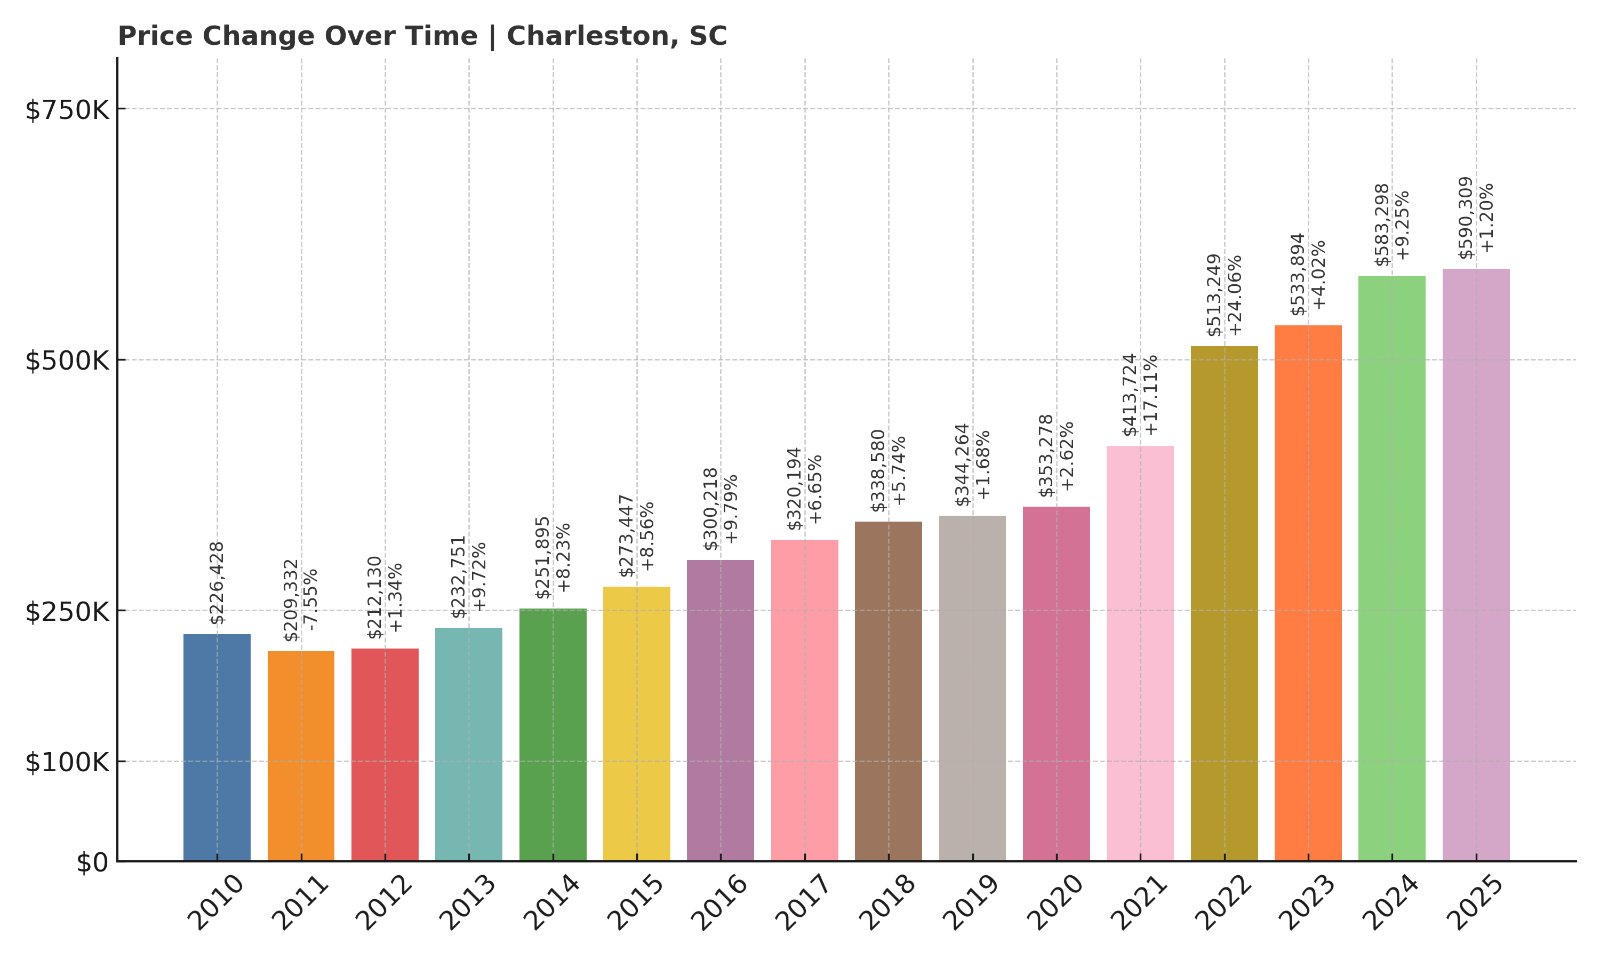
- 2010: $226,428
- 2011: $209,332 (-$17,096, -7.55% from previous year)
- 2012: $212,130 (+$2,798, +1.34% from previous year)
- 2013: $232,751 (+$20,622, +9.72% from previous year)
- 2014: $251,895 (+$19,144, +8.22% from previous year)
- 2015: $273,447 (+$21,552, +8.56% from previous year)
- 2016: $300,218 (+$26,771, +9.79% from previous year)
- 2017: $320,194 (+$19,976, +6.65% from previous year)
- 2018: $338,580 (+$18,386, +5.74% from previous year)
- 2019: $344,264 (+$5,684, +1.68% from previous year)
- 2020: $353,278 (+$9,015, +2.62% from previous year)
- 2021: $413,724 (+$60,446, +17.11% from previous year)
- 2022: $513,249 (+$99,525, +24.06% from previous year)
- 2023: $533,894 (+$20,645, +4.02% from previous year)
- 2024: $583,298 (+$49,404, +9.25% from previous year)
- 2025: $590,309 (+$7,011, +1.20% from previous year)
Charleston’s home prices have soared by 161% since 2010, making it one of the most expensive cities in the state. Despite moderating growth in recent years, prices now sit just under $600,000.
Charleston – Historic Charm Meets Skyrocketing Prices
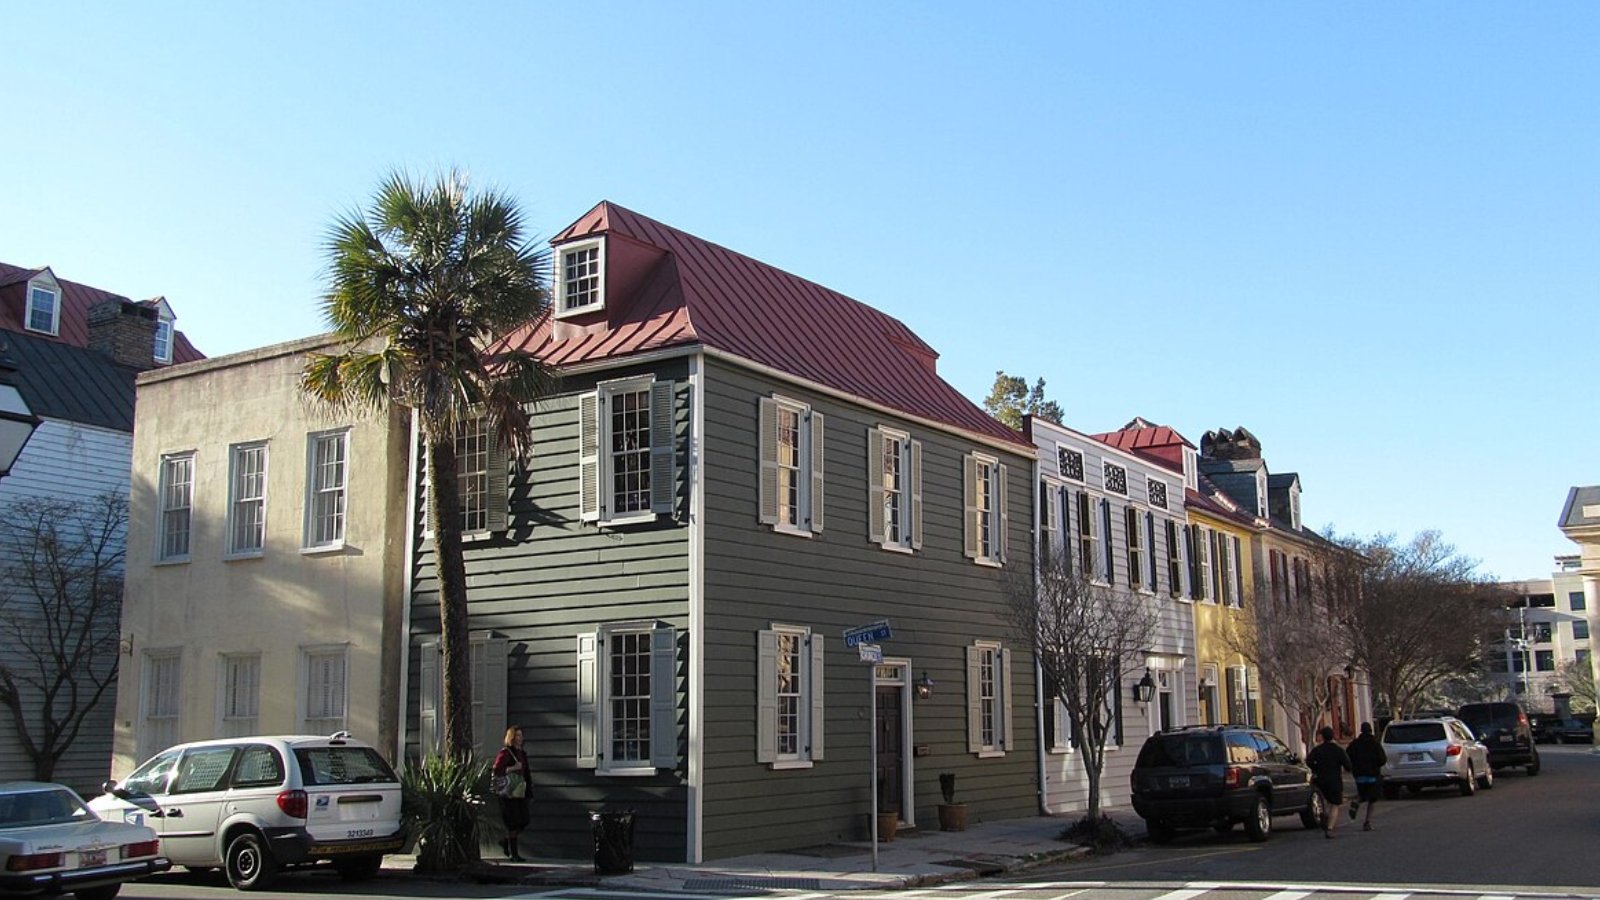
As one of the most iconic and well-known cities in the South, Charleston blends cobblestone streets and antebellum architecture with a booming food scene, deepwater ports, and a growing tech industry. These diverse attractions have driven consistent demand across all housing types.
The largest price jumps occurred between 2020 and 2022, as pandemic relocations, investor interest, and limited supply pushed values upward. Even as growth slows in 2025, Charleston remains among the state’s priciest markets with no signs of long-term cooling.
14. Tega Cay – 123% Home Price Increase Since 2010
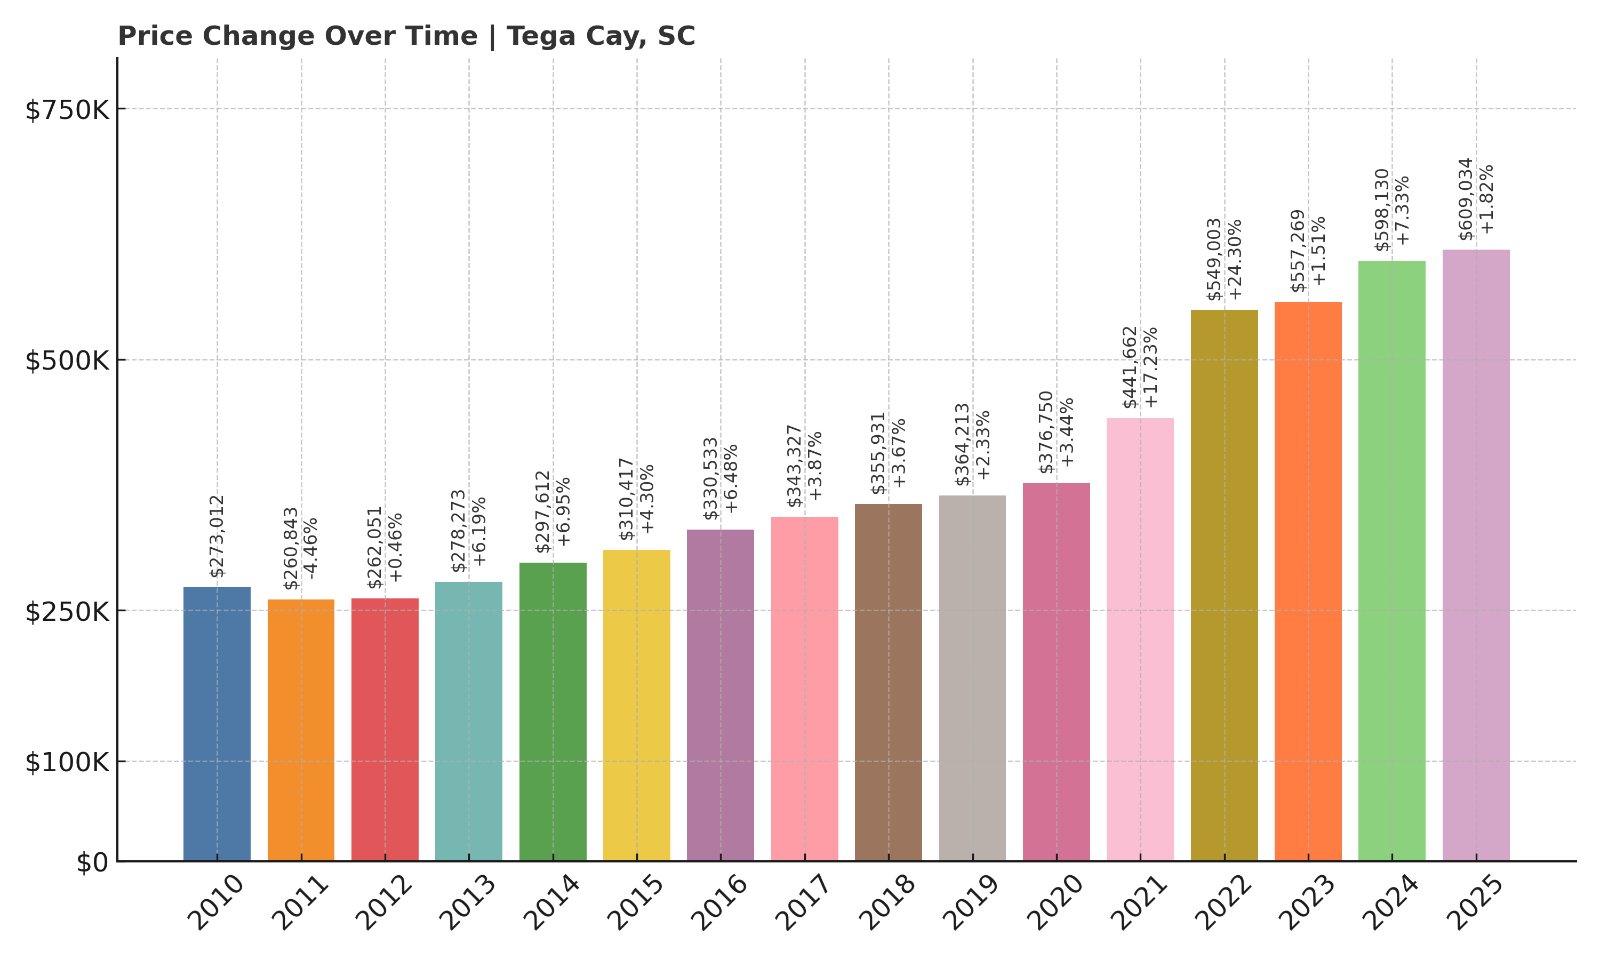
- 2010: $273,012
- 2011: $260,843 (-$12,168, -4.46% from previous year)
- 2012: $262,051 (+$1,208, +0.46% from previous year)
- 2013: $278,273 (+$16,222, +6.19% from previous year)
- 2014: $297,612 (+$19,339, +6.95% from previous year)
- 2015: $310,417 (+$12,805, +4.30% from previous year)
- 2016: $330,533 (+$20,116, +6.48% from previous year)
- 2017: $343,327 (+$12,794, +3.87% from previous year)
- 2018: $355,931 (+$12,604, +3.67% from previous year)
- 2019: $364,213 (+$8,282, +2.33% from previous year)
- 2020: $376,750 (+$12,537, +3.44% from previous year)
- 2021: $441,662 (+$64,912, +17.23% from previous year)
- 2022: $549,003 (+$107,340, +24.30% from previous year)
- 2023: $557,269 (+$8,267, +1.51% from previous year)
- 2024: $598,130 (+$40,861, +7.33% from previous year)
- 2025: $609,034 (+$10,903, +1.82% from previous year)
Tega Cay has experienced a 123% price increase since 2010, largely driven by its lakeside setting and growth as a Charlotte-area suburb. Prices remain high, with the average home now exceeding $600,000.
Tega Cay – Lakefront Living Just Minutes from Charlotte
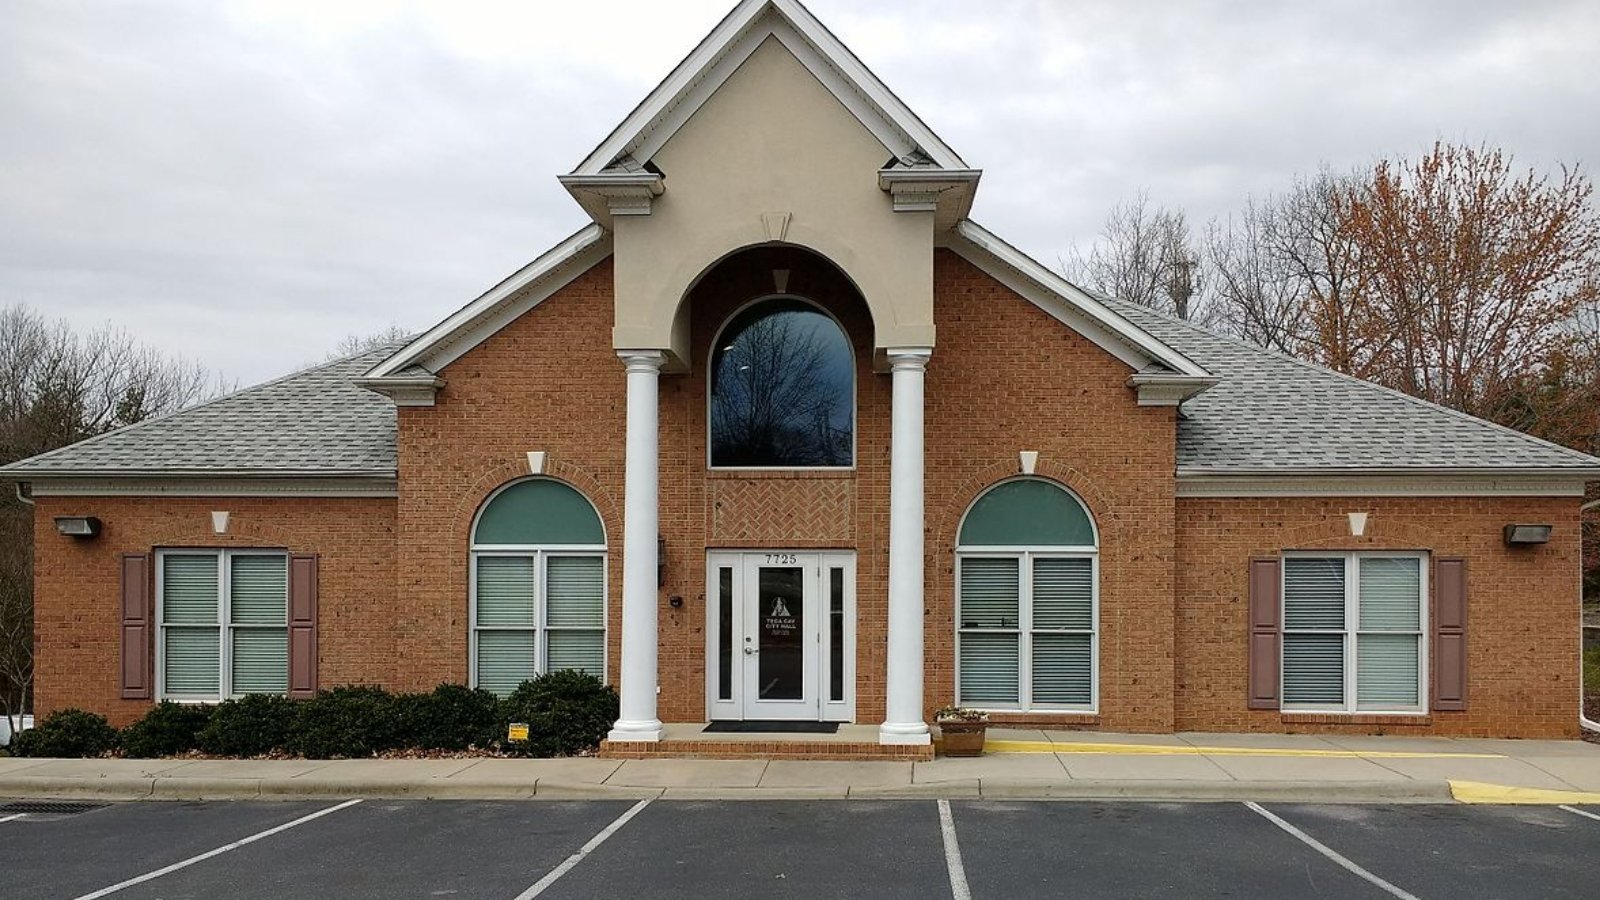
Situated along the banks of Lake Wylie, Tega Cay is a planned community known for its golf courses, marina, and family-friendly amenities. Its location in York County makes it a top destination for commuters working in Charlotte but seeking South Carolina’s lower taxes.
Rapid appreciation in the early 2020s was followed by more tempered growth in 2023–2025. Still, with limited land for expansion and premium homes dominating the market, Tega Cay remains among the most elite towns in the state.
13. Wadmalaw Island – 152% Home Price Increase Since 2010
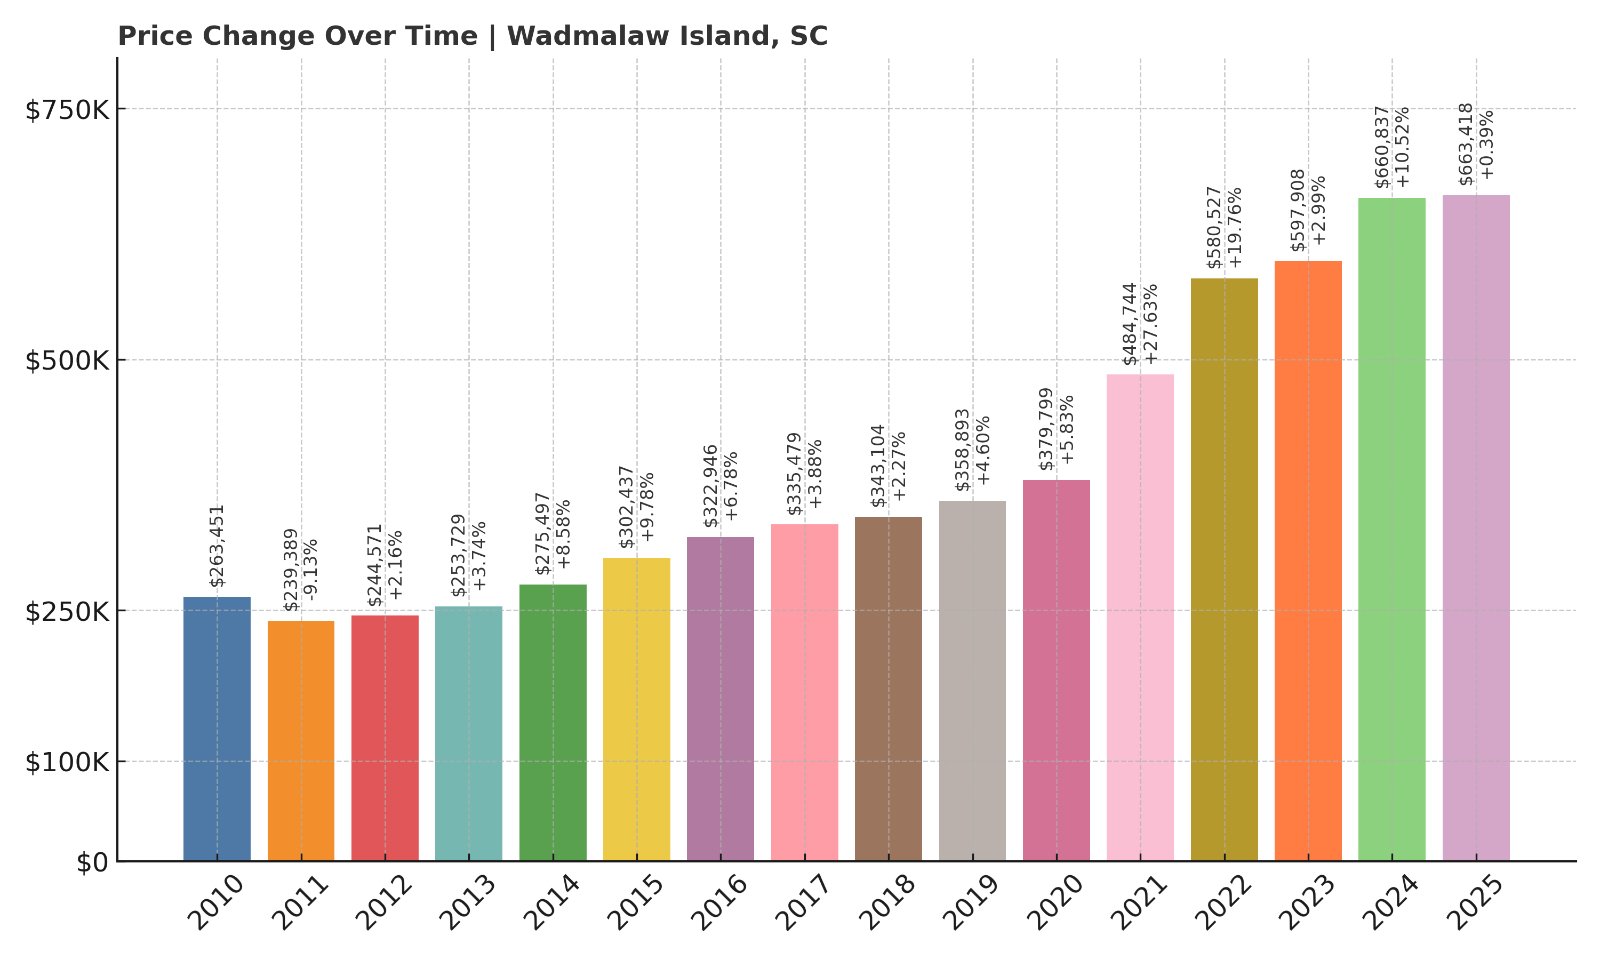
- 2010: $263,451
- 2011: $239,389 (-$24,062, -9.13% from previous year)
- 2012: $244,571 (+$5,181, +2.16% from previous year)
- 2013: $253,729 (+$9,159, +3.74% from previous year)
- 2014: $275,497 (+$21,768, +8.58% from previous year)
- 2015: $302,437 (+$26,939, +9.78% from previous year)
- 2016: $322,946 (+$20,509, +6.78% from previous year)
- 2017: $335,479 (+$12,533, +3.88% from previous year)
- 2018: $343,104 (+$7,625, +2.27% from previous year)
- 2019: $358,893 (+$15,789, +4.60% from previous year)
- 2020: $379,799 (+$20,907, +5.83% from previous year)
- 2021: $484,744 (+$104,945, +27.63% from previous year)
- 2022: $580,527 (+$95,783, +19.76% from previous year)
- 2023: $597,908 (+$17,381, +2.99% from previous year)
- 2024: $660,837 (+$62,929, +10.52% from previous year)
- 2025: $663,418 (+$2,580, +0.39% from previous year)
Wadmalaw Island’s home prices have surged more than 150% since 2010, with remarkable gains during the pandemic years. It remains a premium location with home values over $660,000.
Wadmalaw Island – Rural Prestige in the Lowcountry
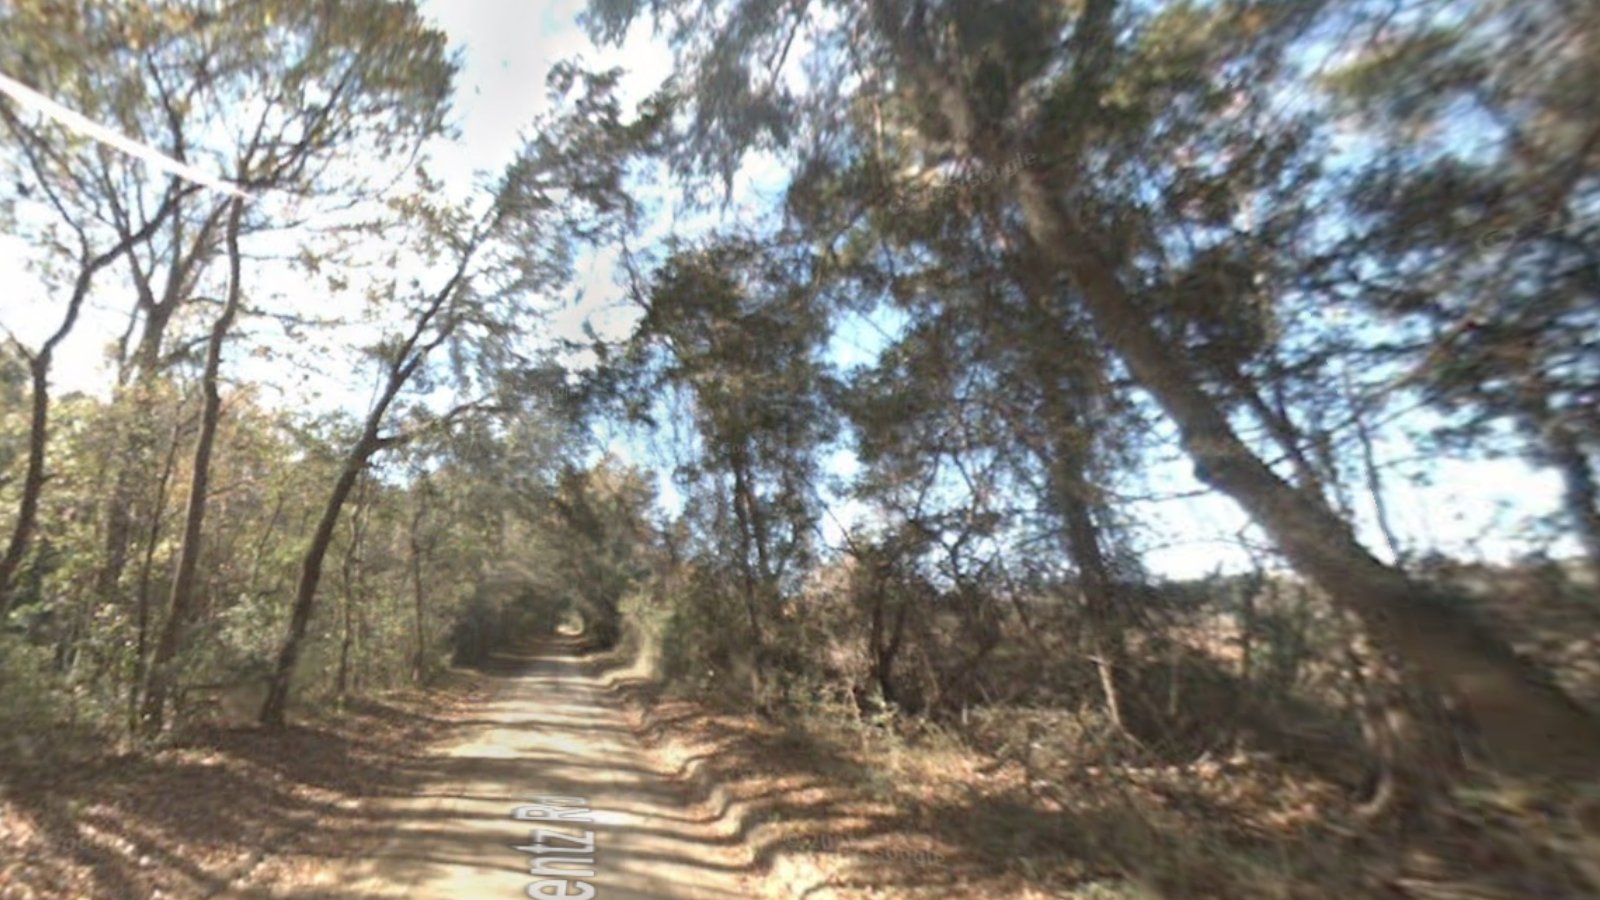
Located southwest of Charleston, Wadmalaw Island is known for its rolling farmland, scenic marshes, and limited development. Its blend of seclusion and natural beauty has made it popular for high-end estates and retreats.
Price gains have continued since 2020, with homes now exceeding $660,000 on average. With limited infrastructure and zoning constraints, Wadmalaw is likely to remain a quiet, high-value enclave on South Carolina’s coast.
12. Meggett – 139% Home Price Increase Since 2010
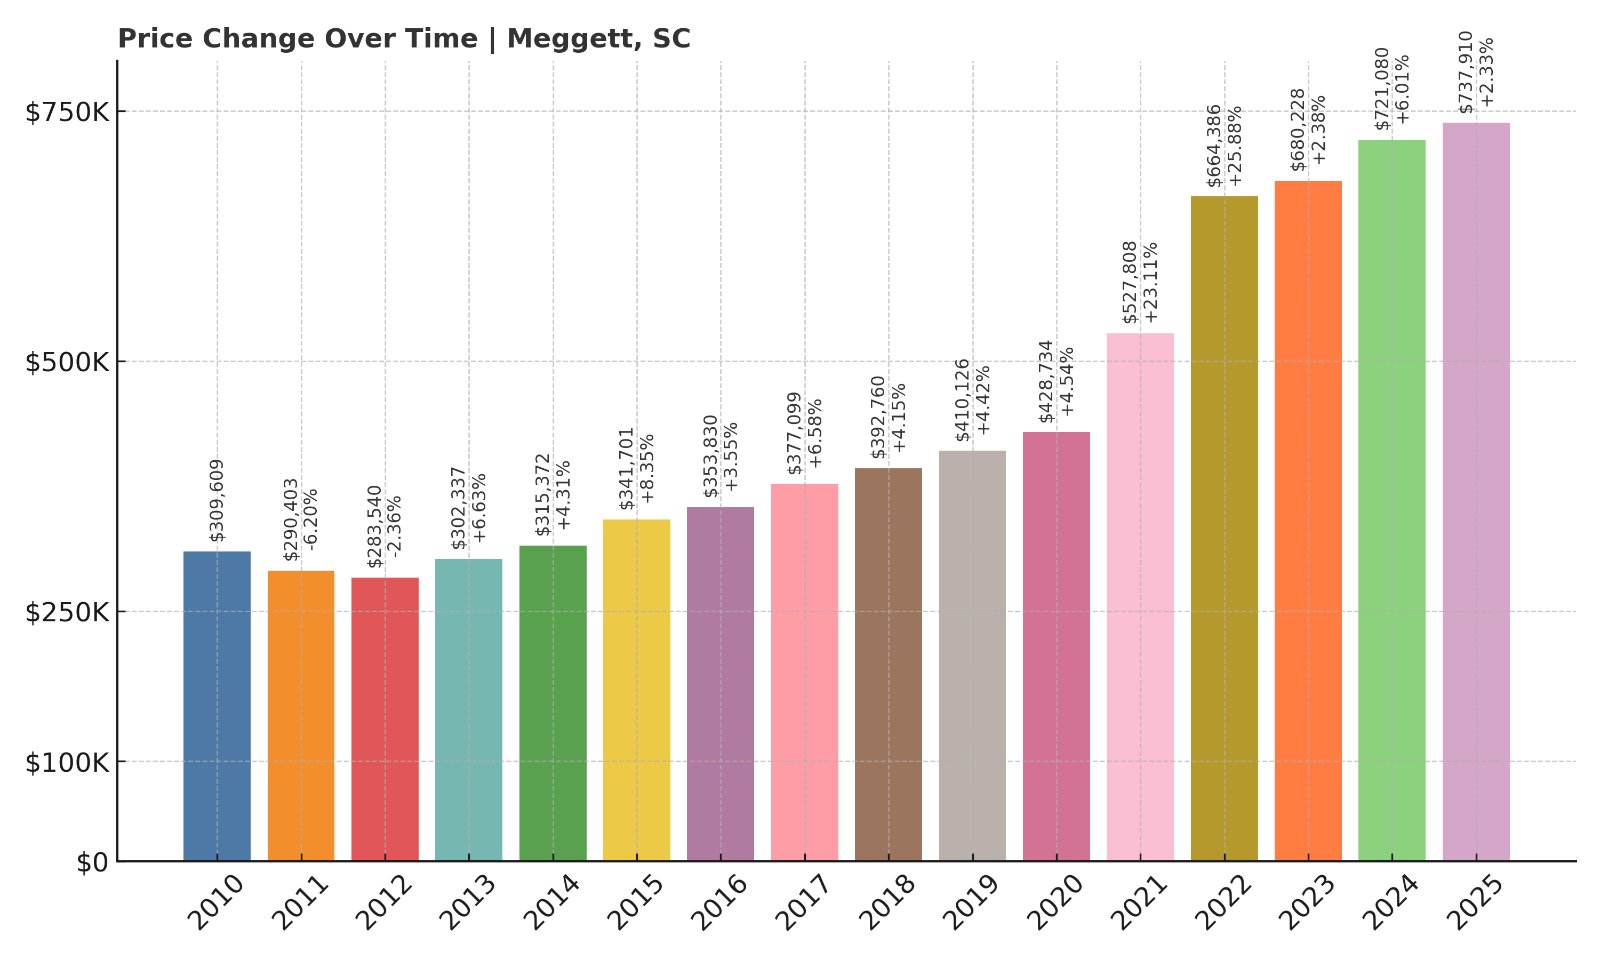
- 2010: $309,609
- 2011: $290,403 (-$19,207, -6.20% from previous year)
- 2012: $283,540 (-$6,863, -2.36% from previous year)
- 2013: $302,337 (+$18,797, +6.63% from previous year)
- 2014: $315,372 (+$13,035, +4.31% from previous year)
- 2015: $341,701 (+$26,329, +8.35% from previous year)
- 2016: $353,830 (+$12,129, +3.55% from previous year)
- 2017: $377,099 (+$23,268, +6.58% from previous year)
- 2018: $392,760 (+$15,661, +4.15% from previous year)
- 2019: $410,126 (+$17,366, +4.42% from previous year)
- 2020: $428,734 (+$18,607, +4.54% from previous year)
- 2021: $527,808 (+$99,075, +23.11% from previous year)
- 2022: $664,386 (+$136,578, +25.88% from previous year)
- 2023: $680,228 (+$15,841, +2.38% from previous year)
- 2024: $721,080 (+$40,852, +6.01% from previous year)
- 2025: $737,910 (+$16,830, +2.33% from previous year)
Meggett home values have climbed nearly 140% since 2010. Strong gains in 2021 and 2022 pushed the average price well above $700,000 by 2025.
Meggett – Waterfront Appeal Without the Crowds
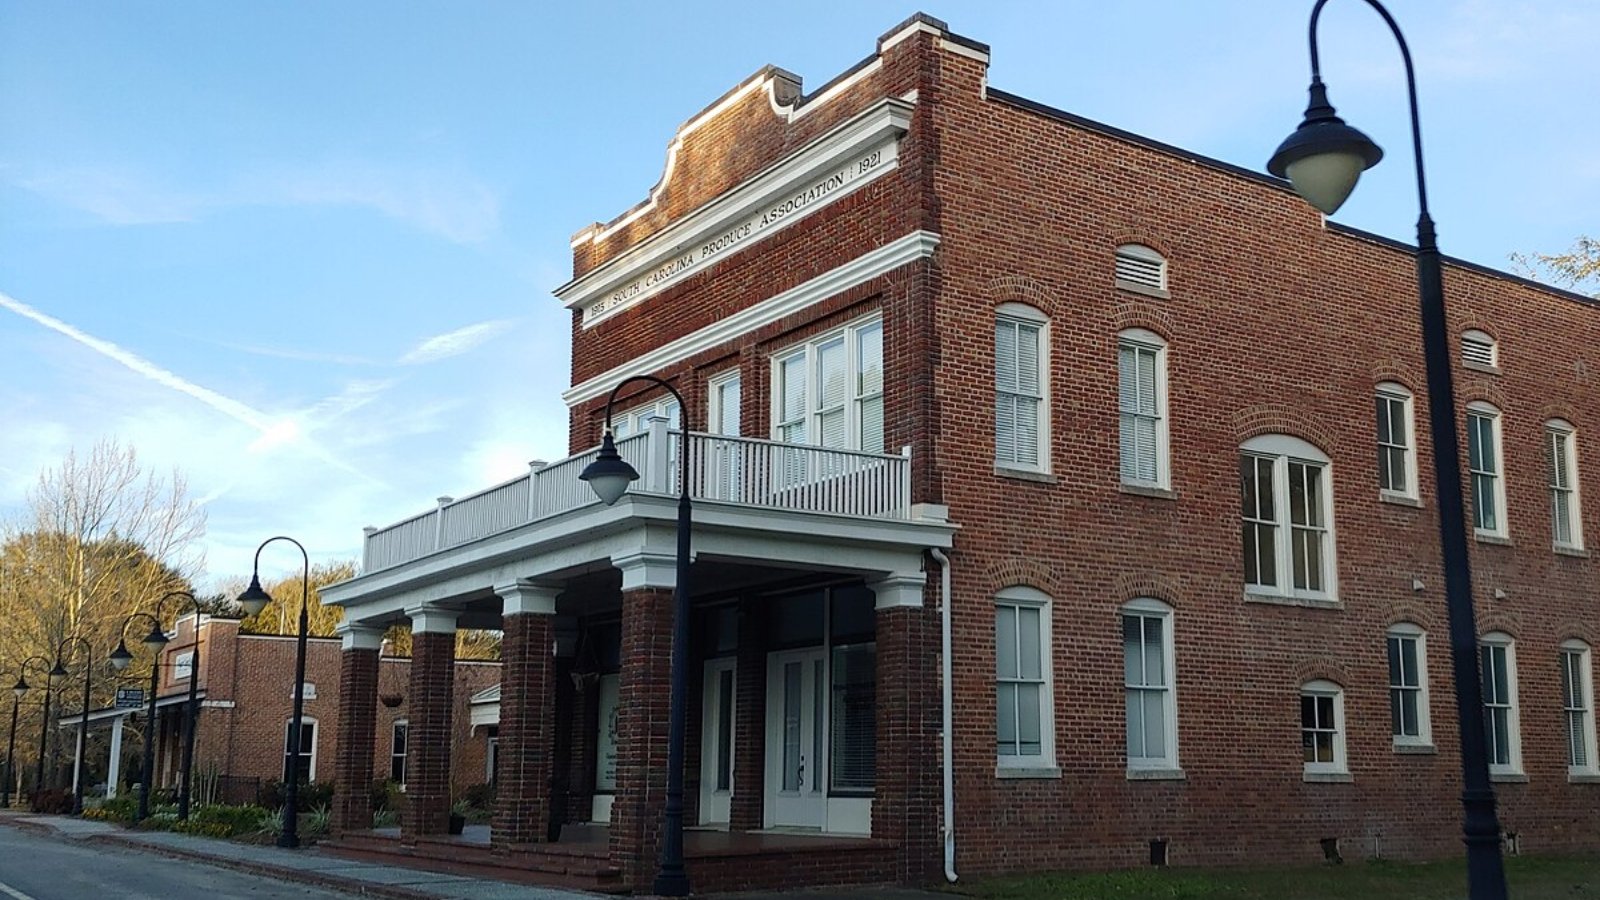
Located in Charleston County, Meggett offers scenic Lowcountry views and deepwater access without the heavy development seen in neighboring communities. It’s a favorite for custom homes and luxury buyers seeking peace and proximity to Charleston.
Prices spiked dramatically from 2020 to 2022, and while growth has since moderated, demand remains strong. Meggett’s rural character and waterfront access continue to support its premium home values.
11. Edisto Beach – 142% Home Price Increase Since 2010
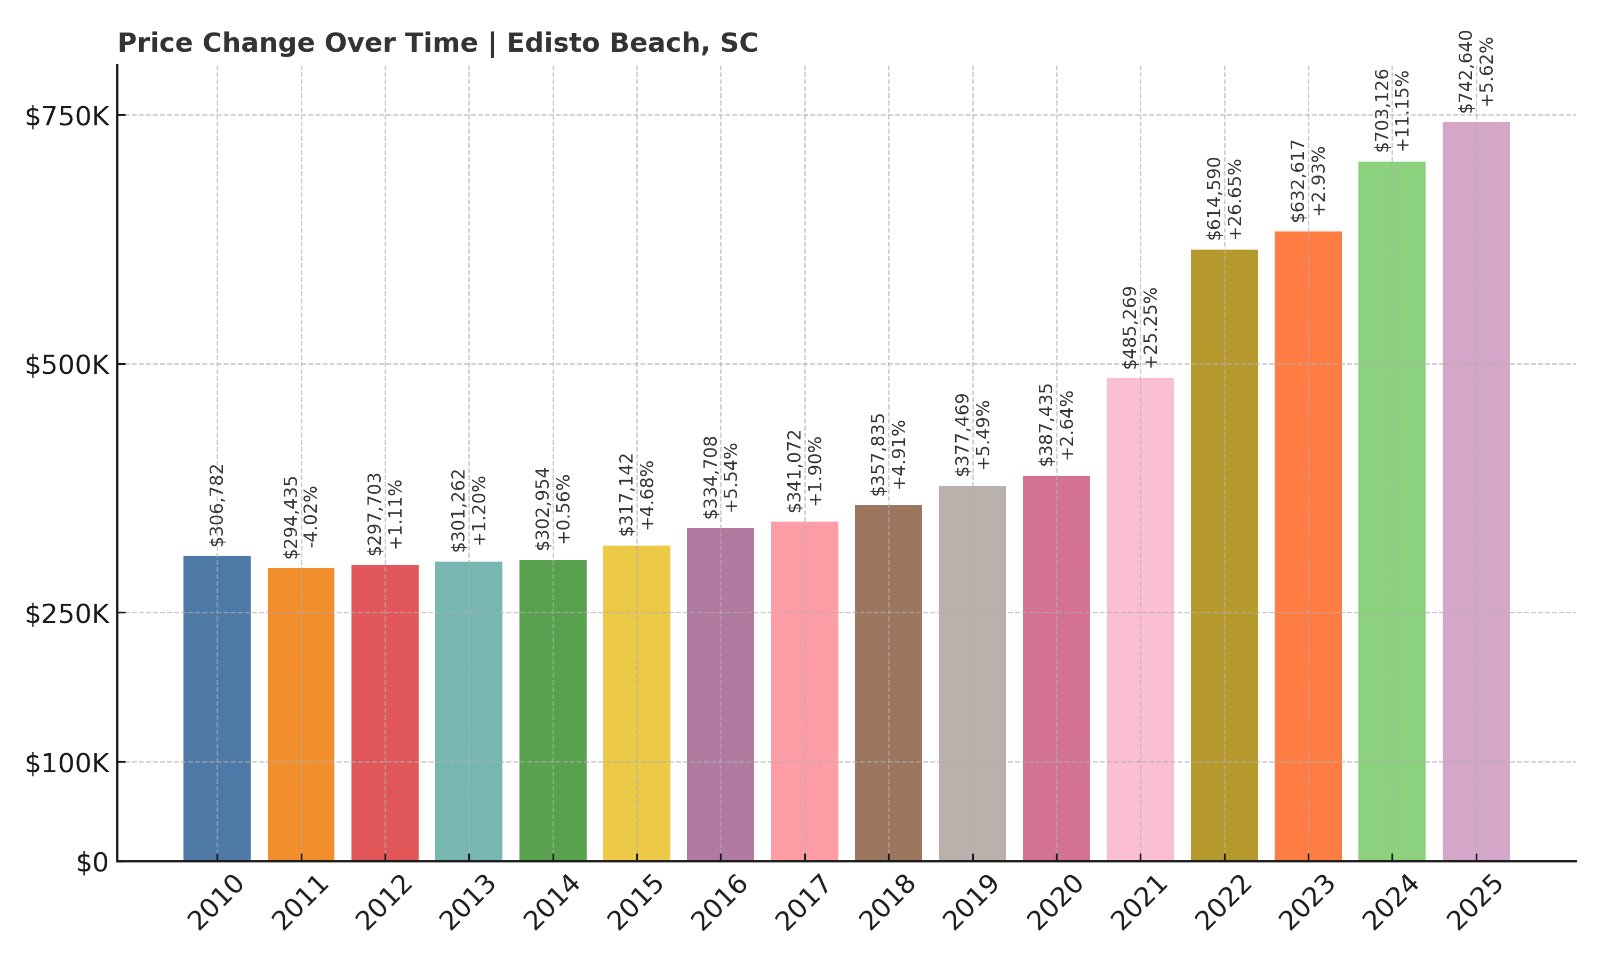
- 2010: $306,782
- 2011: $294,435 (-$12,348, -4.02% from previous year)
- 2012: $297,703 (+$3,269, +1.11% from previous year)
- 2013: $301,262 (+$3,558, +1.20% from previous year)
- 2014: $302,954 (+$1,692, +0.56% from previous year)
- 2015: $317,142 (+$14,188, +4.68% from previous year)
- 2016: $334,708 (+$17,566, +5.54% from previous year)
- 2017: $341,072 (+$6,364, +1.90% from previous year)
- 2018: $357,835 (+$16,763, +4.91% from previous year)
- 2019: $377,469 (+$19,634, +5.49% from previous year)
- 2020: $387,435 (+$9,965, +2.64% from previous year)
- 2021: $485,269 (+$97,834, +25.25% from previous year)
- 2022: $614,590 (+$129,322, +26.65% from previous year)
- 2023: $632,617 (+$18,027, +2.93% from previous year)
- 2024: $703,126 (+$70,509, +11.15% from previous year)
- 2025: $742,640 (+$39,514, +5.62% from previous year)
Home prices in Edisto Beach have grown 142% since 2010, with values surpassing $740,000 in 2025. A series of strong gains in the 2020s made it one of the state’s priciest coastal communities.
Edisto Beach – Quiet Shoreline with Premium Prices
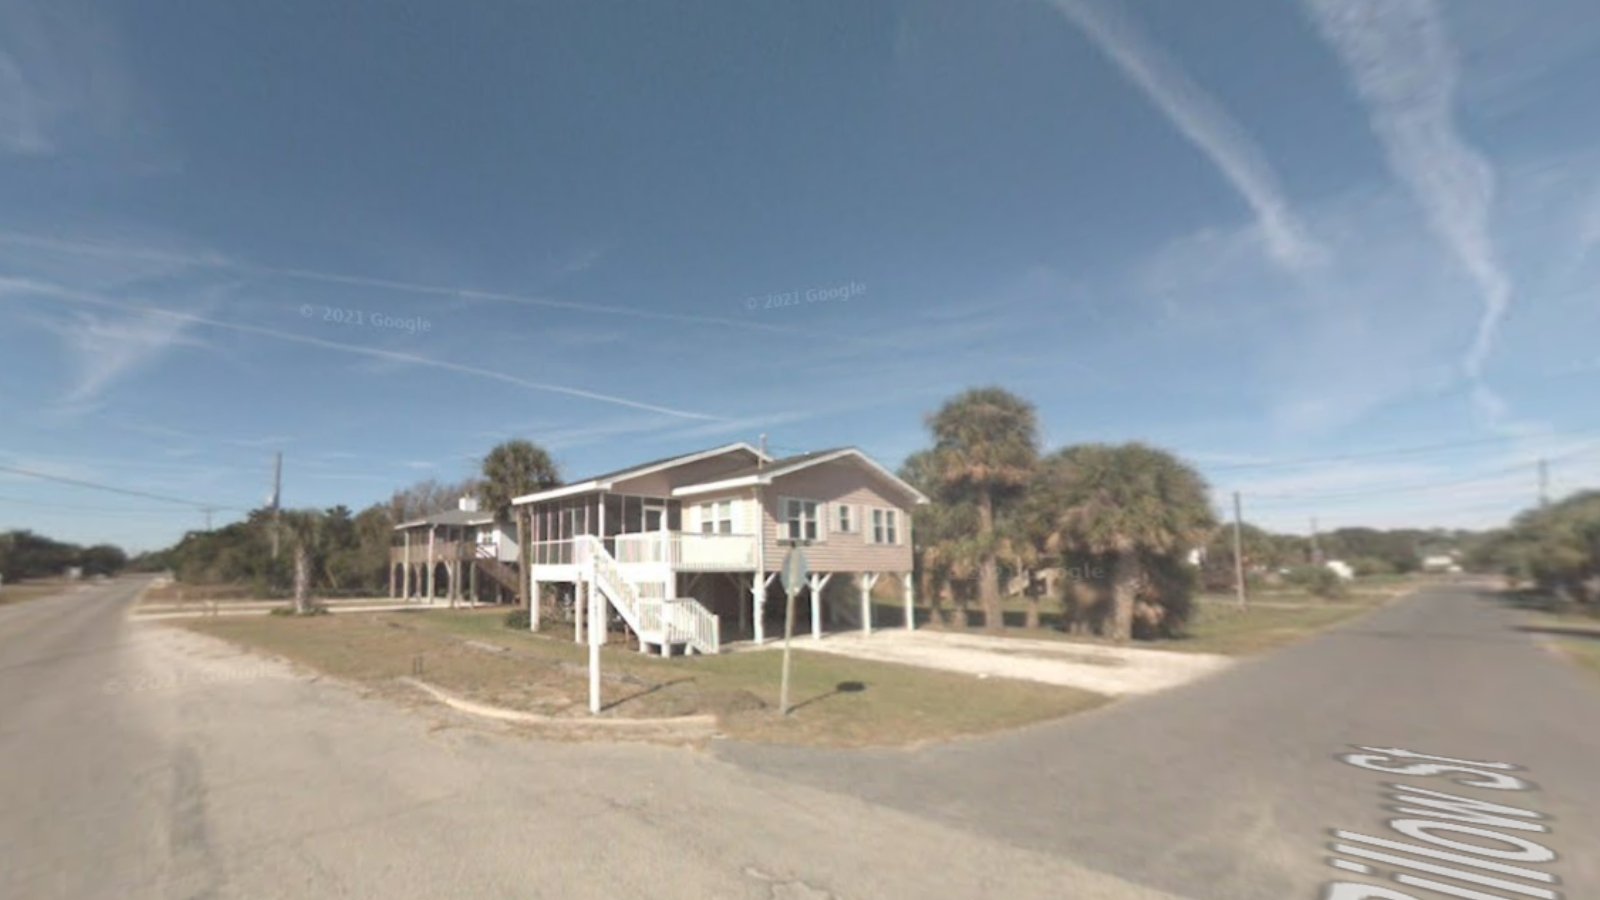
Edisto Beach offers a low-key alternative to more developed coastal towns. With limited commercial sprawl and no high-rise condos, it has preserved its vintage beach-town vibe.
That charm comes at a price—literally. Edisto Beach saw dramatic gains during the pandemic and beyond, with prices rising over $250,000 since 2020 alone. It continues to command high demand from buyers seeking oceanfront peace and long-term investment.
10. Hilton Head Island – 100% Home Price Increase Since 2010
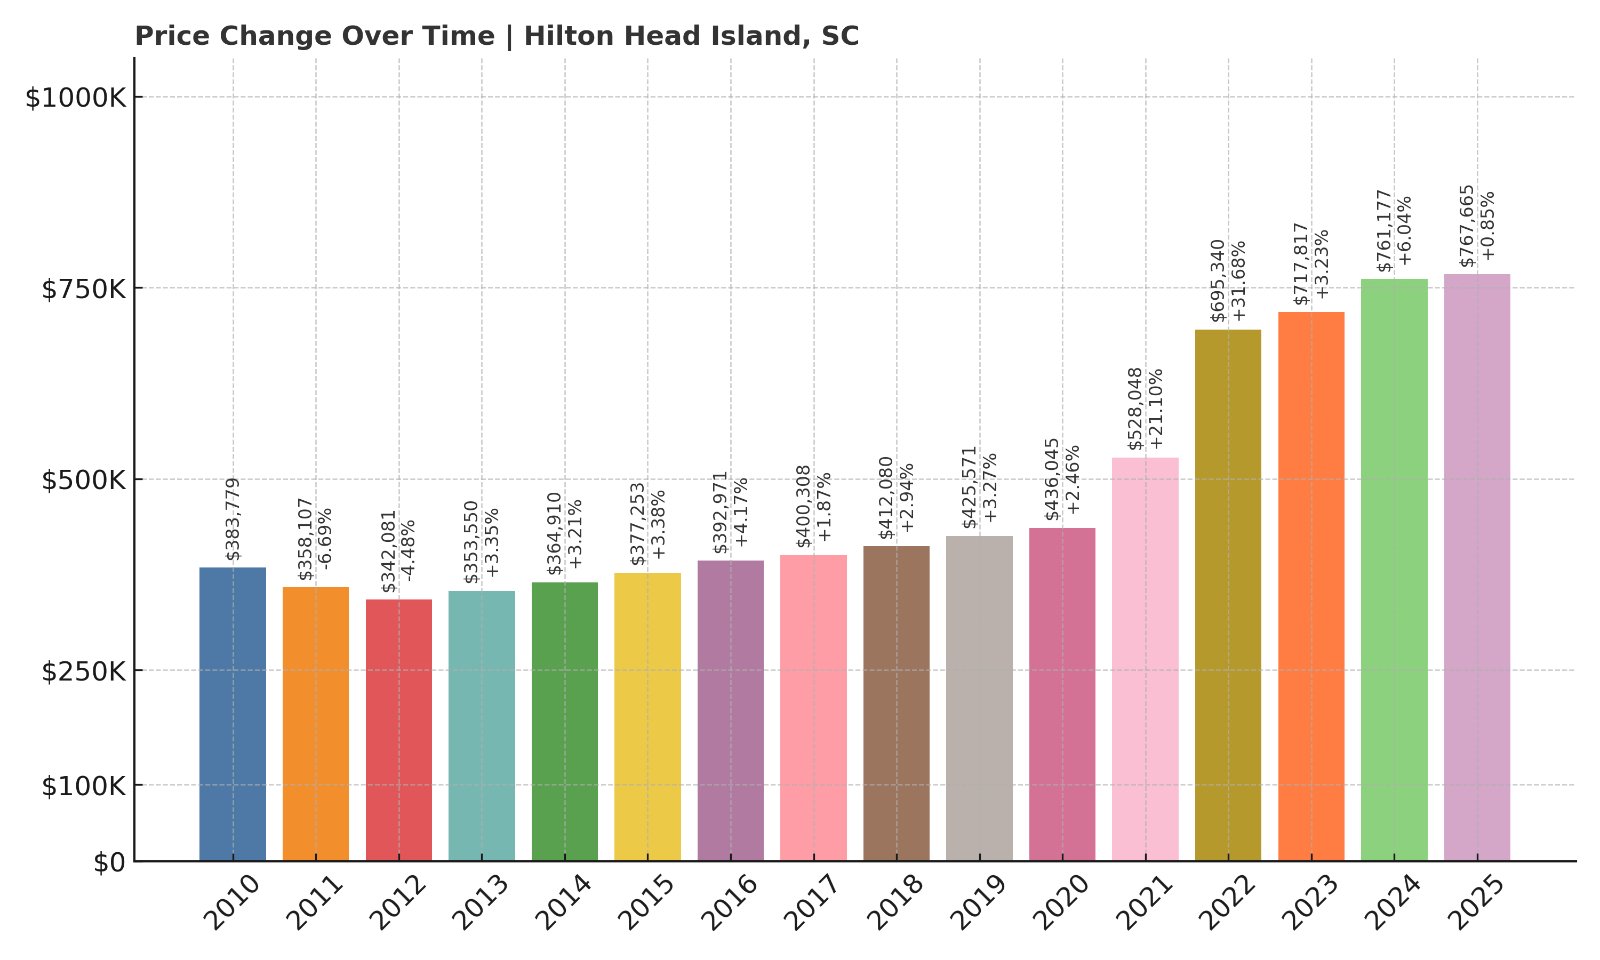
- 2010: $383,779
- 2011: $358,107 (-$25,672, -6.69% from previous year)
- 2012: $342,081 (-$16,025, -4.47% from previous year)
- 2013: $353,550 (+$11,469, +3.35% from previous year)
- 2014: $364,910 (+$11,360, +3.21% from previous year)
- 2015: $377,253 (+$12,343, +3.38% from previous year)
- 2016: $392,971 (+$15,717, +4.17% from previous year)
- 2017: $400,308 (+$7,337, +1.87% from previous year)
- 2018: $412,080 (+$11,772, +2.94% from previous year)
- 2019: $425,571 (+$13,491, +3.27% from previous year)
- 2020: $436,045 (+$10,474, +2.46% from previous year)
- 2021: $528,048 (+$92,003, +21.10% from previous year)
- 2022: $695,340 (+$167,292, +31.68% from previous year)
- 2023: $717,817 (+$22,477, +3.23% from previous year)
- 2024: $761,177 (+$43,360, +6.04% from previous year)
- 2025: $767,665 (+$6,488, +0.85% from previous year)
Hilton Head Island home values have doubled since 2010, reaching nearly $770,000 in 2025. The sharpest gains came during the post-2020 buying surge, and values remain strong.
Hilton Head Island – Resort Destination with Lasting Demand
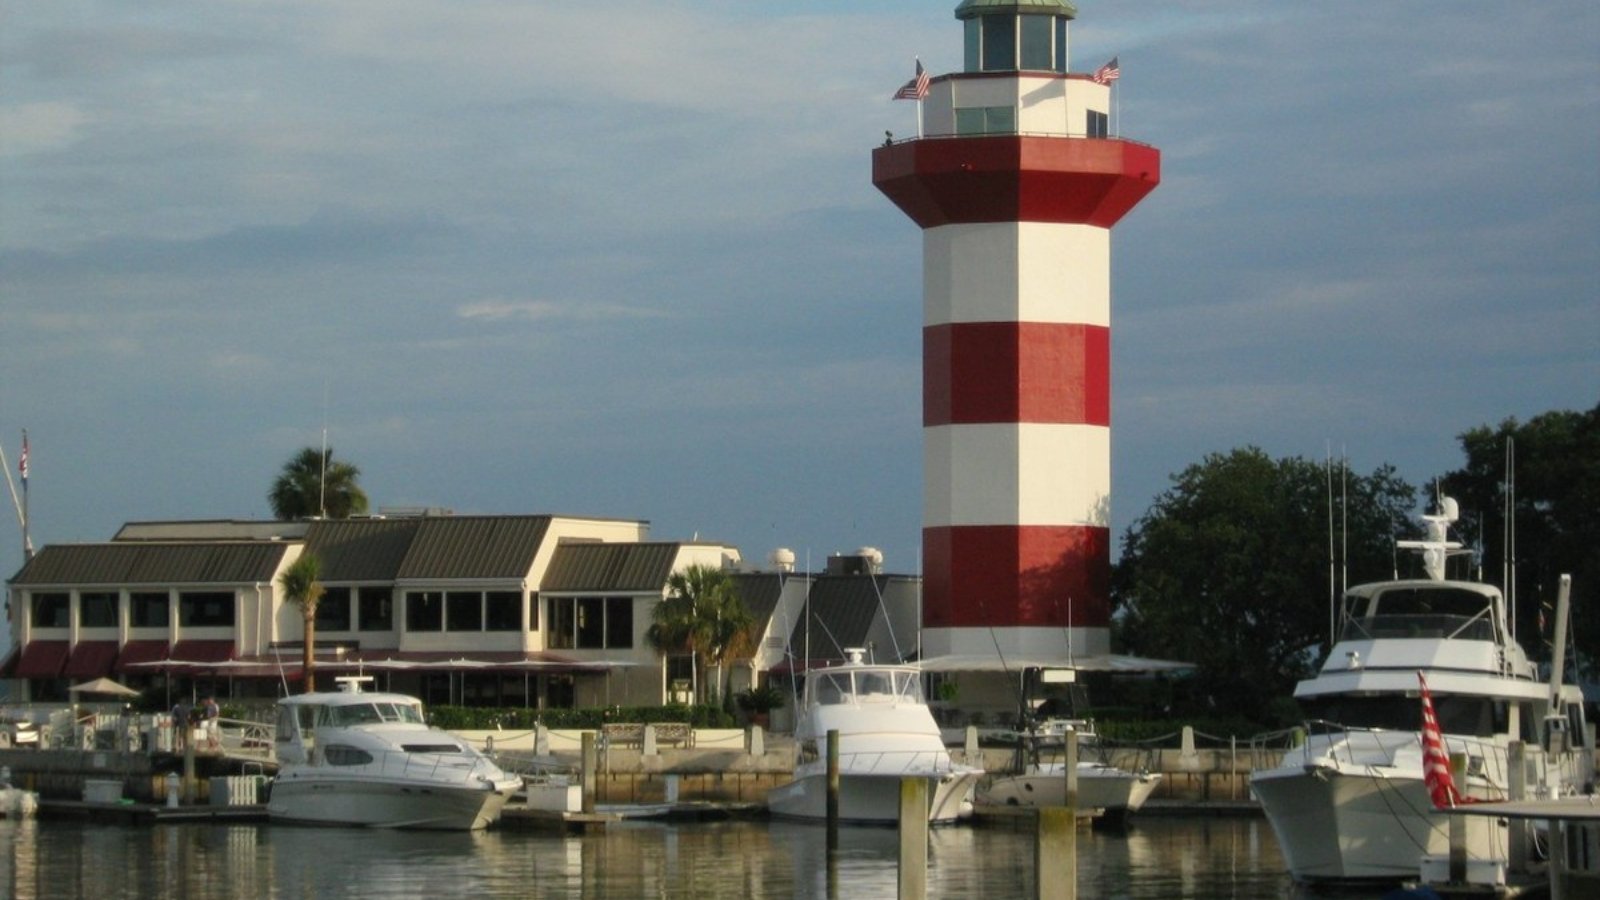
As one of the most prestigious beach towns in the Southeast, Hilton Head Island has long attracted wealthy retirees, vacationers, and second-home buyers. World-class golf, pristine beaches, and protected natural areas create a high-end coastal experience.
Prices jumped significantly between 2020 and 2022, with sustained interest from out-of-state buyers and investors. Hilton Head continues to be one of South Carolina’s most exclusive markets, where price growth has slowed but not stopped.
9. Awendaw – 183% Home Price Increase Since 2010
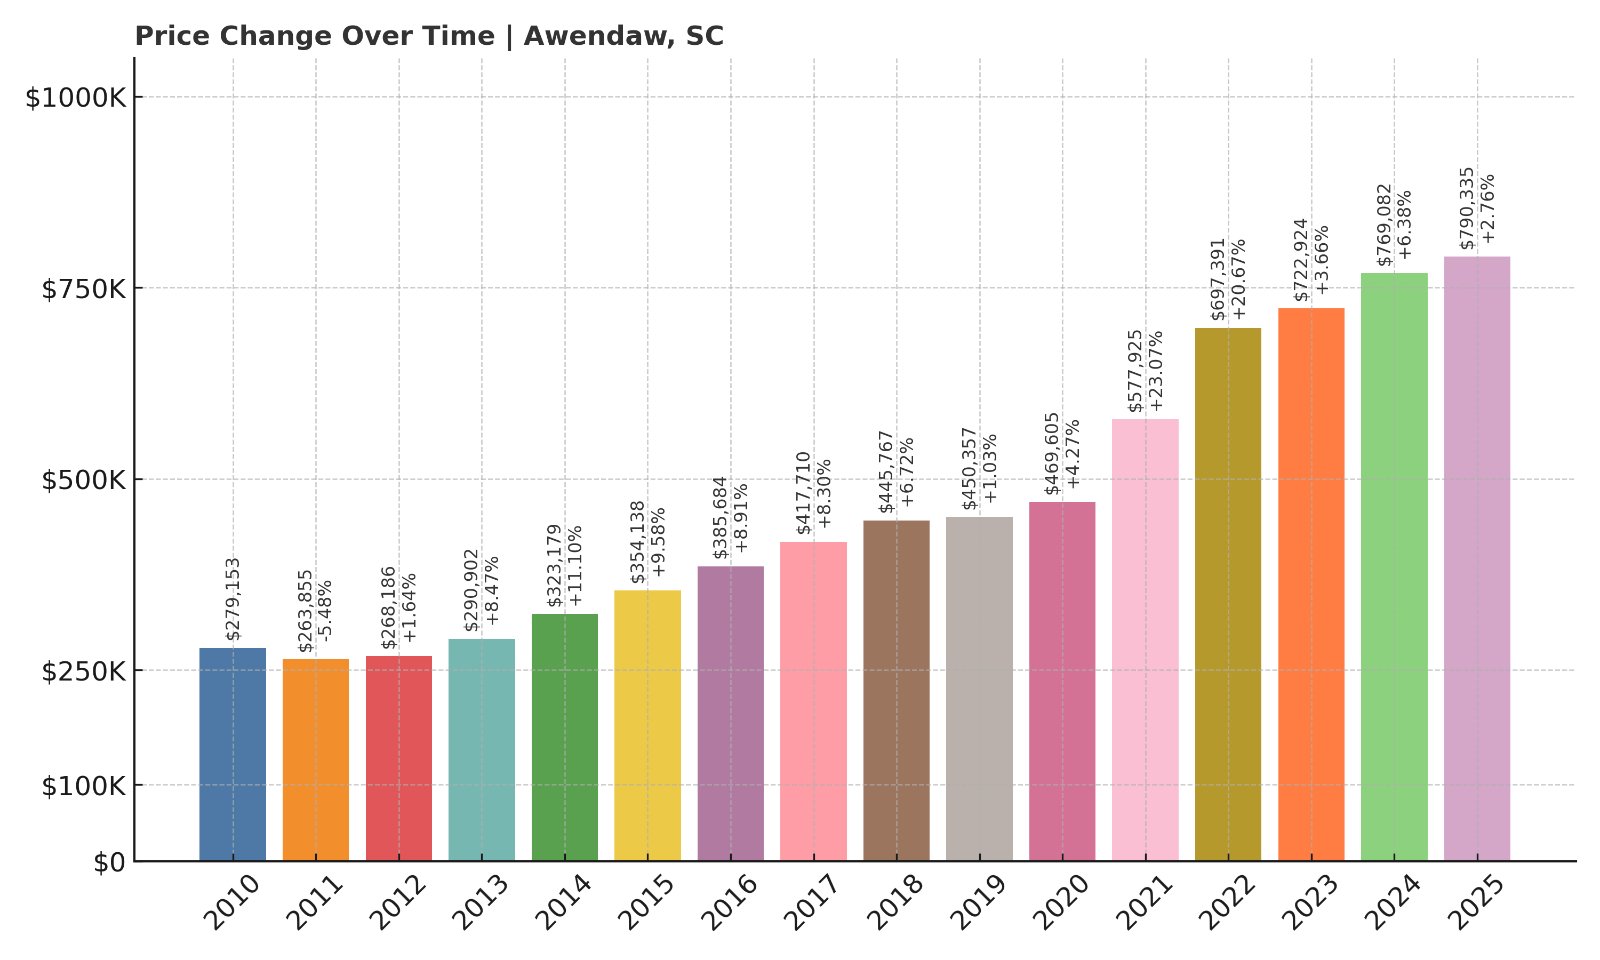
- 2010: $279,153
- 2011: $263,855 (-$15,298, -5.48% from previous year)
- 2012: $268,186 (+$4,330, +1.64% from previous year)
- 2013: $290,902 (+$22,716, +8.47% from previous year)
- 2014: $323,179 (+$32,277, +11.10% from previous year)
- 2015: $354,138 (+$30,960, +9.58% from previous year)
- 2016: $385,684 (+$31,546, +8.91% from previous year)
- 2017: $417,710 (+$32,026, +8.30% from previous year)
- 2018: $445,767 (+$28,058, +6.72% from previous year)
- 2019: $450,357 (+$4,590, +1.03% from previous year)
- 2020: $469,605 (+$19,248, +4.27% from previous year)
- 2021: $577,925 (+$108,320, +23.07% from previous year)
- 2022: $697,391 (+$119,466, +20.67% from previous year)
- 2023: $722,924 (+$25,533, +3.66% from previous year)
- 2024: $769,082 (+$46,158, +6.38% from previous year)
- 2025: $790,335 (+$21,252, +2.76% from previous year)
Home values in Awendaw have soared by 183% since 2010, reflecting its growing appeal as a rural-luxury market just outside Charleston.
Awendaw – Rural, Scenic, and Seriously Expensive
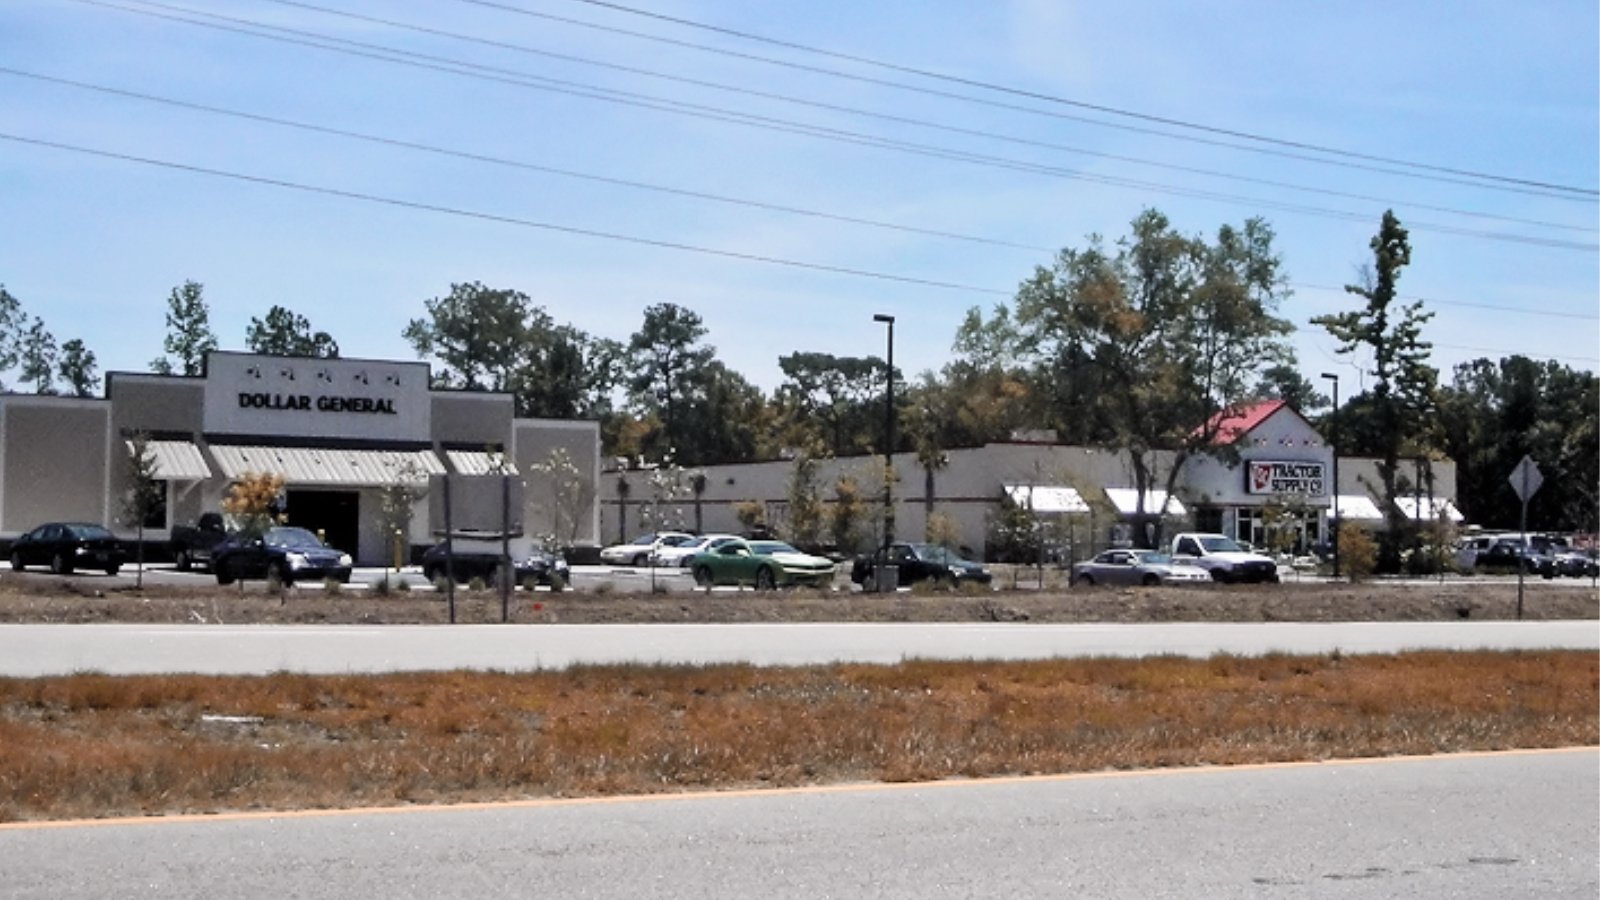
Awendaw lies between Mount Pleasant and McClellanville, offering large lots, maritime forests, and marsh views. It has long attracted those seeking quiet and privacy without straying far from Charleston’s amenities.
Home values took off during the 2020s, particularly in 2021 and 2022. In 2025, prices top $790,000 on average, driven by high demand for land and custom homes in an area with limited development.
8. Mount Pleasant – 185% Home Price Increase Since 2010
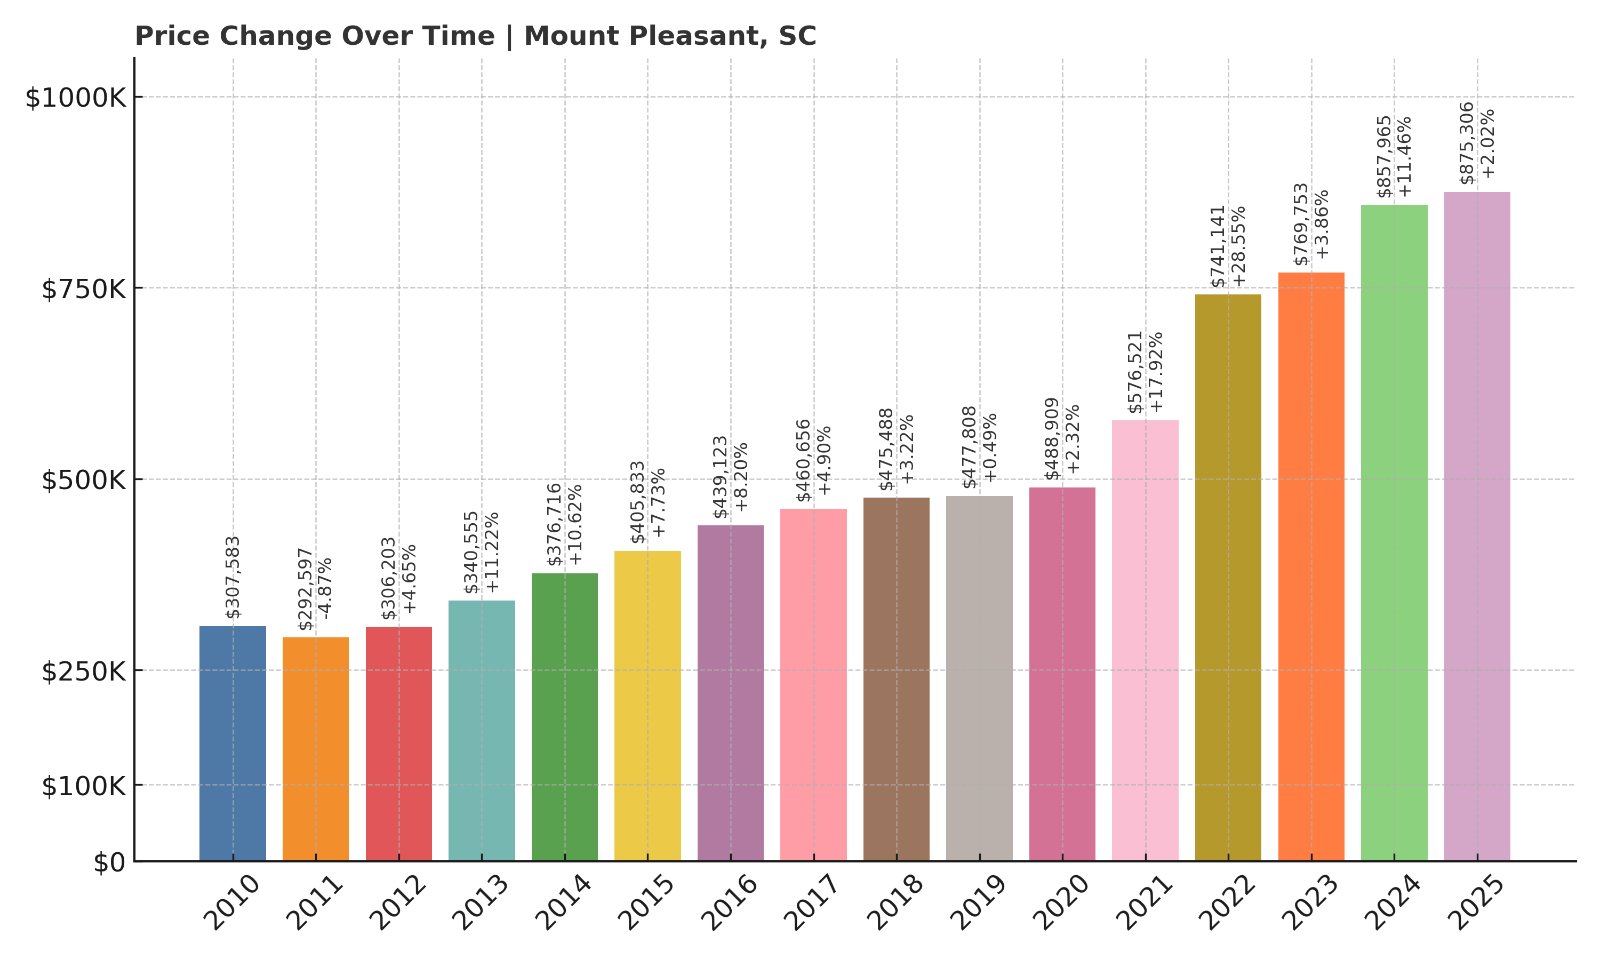
- 2010: $307,583
- 2011: $292,597 (-$14,987, -4.87% from previous year)
- 2012: $306,203 (+$13,606, +4.65% from previous year)
- 2013: $340,555 (+$34,352, +11.22% from previous year)
- 2014: $376,716 (+$36,161, +10.62% from previous year)
- 2015: $405,833 (+$29,117, +7.73% from previous year)
- 2016: $439,123 (+$33,290, +8.20% from previous year)
- 2017: $460,656 (+$21,533, +4.90% from previous year)
- 2018: $475,488 (+$14,832, +3.22% from previous year)
- 2019: $477,808 (+$2,320, +0.49% from previous year)
- 2020: $488,909 (+$11,101, +2.32% from previous year)
- 2021: $576,521 (+$87,612, +17.92% from previous year)
- 2022: $741,141 (+$164,620, +28.55% from previous year)
- 2023: $769,753 (+$28,612, +3.86% from previous year)
- 2024: $857,965 (+$88,213, +11.46% from previous year)
- 2025: $875,306 (+$17,341, +2.02% from previous year)
Mount Pleasant home prices have grown by 185% since 2010, reaching over $875,000 in 2025. One of South Carolina’s largest and most sought-after suburbs, it continues to lead the Lowcountry market.
Mount Pleasant – Where Growth and Luxury Intersect
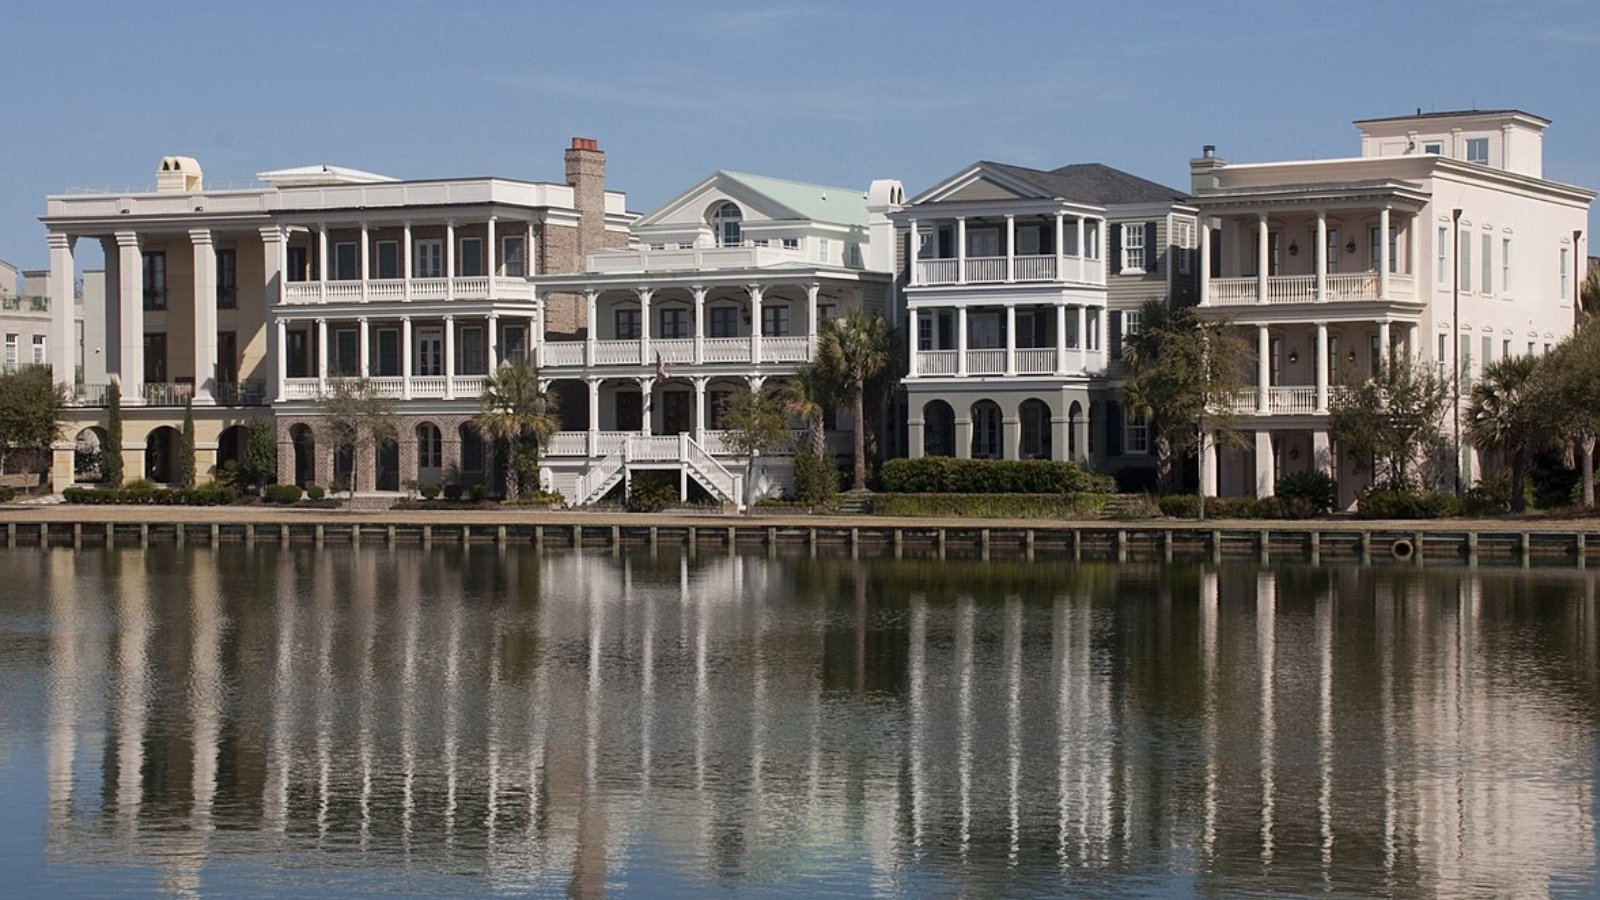
As a suburb of Charleston, Mount Pleasant offers a rare blend of waterfront neighborhoods, high-end schools, and access to both beaches and downtown. Its rapid growth has been met with luxury development and high demand.
The years 2021 and 2022 were particularly explosive, with prices jumping over $250,000 in that span alone. Today, Mount Pleasant is one of the most competitive and expensive towns in the Southeast, not just in South Carolina.
7. Seabrook Island – 107% Home Price Increase Since 2010
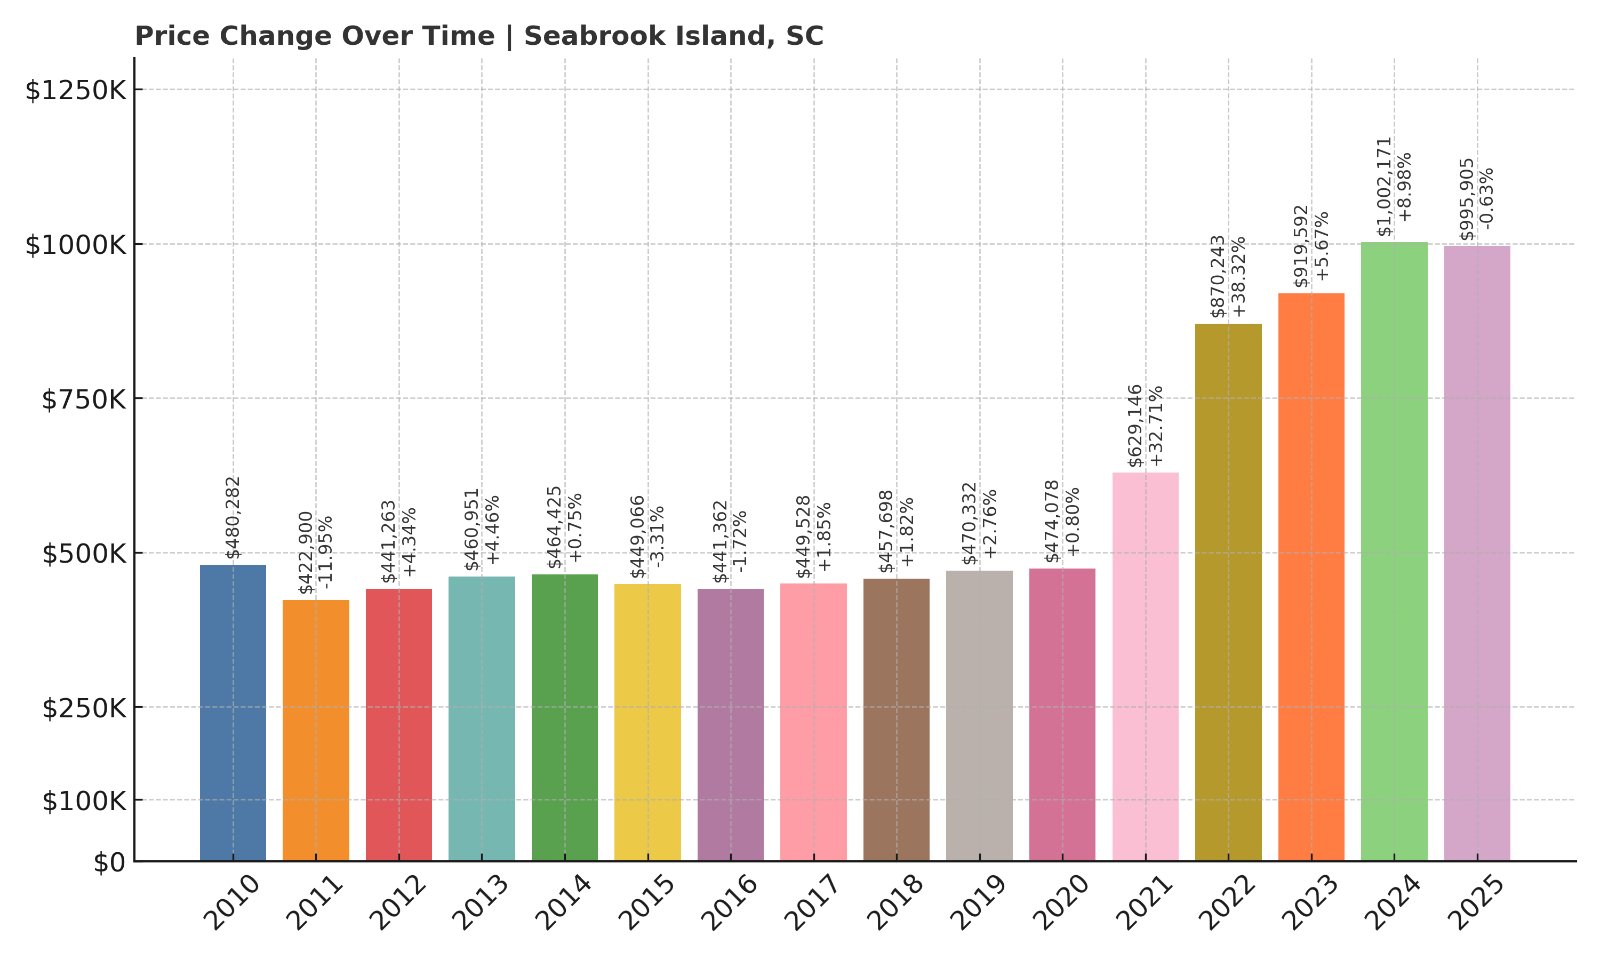
- 2010: $480,282
- 2011: $422,900 (-$57,382, -11.95% from previous year)
- 2012: $441,263 (+$18,363, +4.34% from previous year)
- 2013: $460,951 (+$19,688, +4.46% from previous year)
- 2014: $464,425 (+$3,474, +0.75% from previous year)
- 2015: $449,066 (-$15,359, -3.31% from previous year)
- 2016: $441,362 (-$7,704, -1.72% from previous year)
- 2017: $449,528 (+$8,166, +1.85% from previous year)
- 2018: $457,698 (+$8,170, +1.82% from previous year)
- 2019: $470,332 (+$12,633, +2.76% from previous year)
- 2020: $474,078 (+$3,747, +0.80% from previous year)
- 2021: $629,146 (+$155,068, +32.71% from previous year)
- 2022: $870,243 (+$241,097, +38.32% from previous year)
- 2023: $919,592 (+$49,349, +5.67% from previous year)
- 2024: $1,002,171 (+$82,579, +8.98% from previous year)
- 2025: $995,905 (-$6,266, -0.63% from previous year)
Seabrook Island prices have more than doubled since 2010, peaking in 2024 before a small decline in 2025. Prices remain among the highest in the state, just under $1 million.
Seabrook Island – Private Island, Premium Real Estate
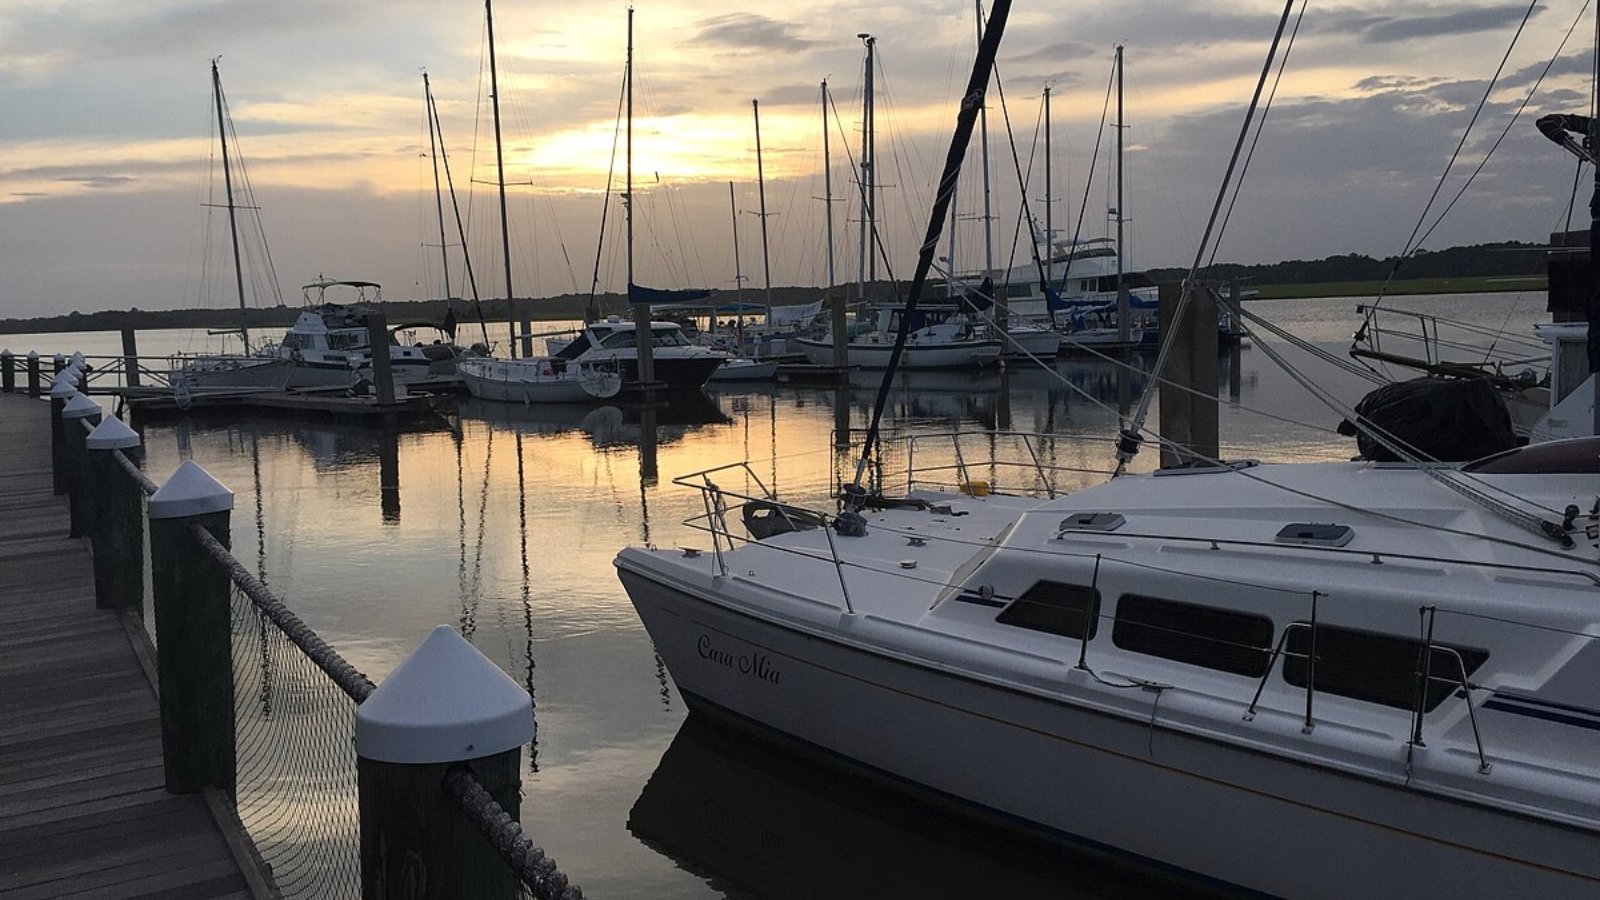
Located just south of Kiawah, Seabrook Island is a gated resort community with golf courses, equestrian centers, and exclusive beachfront access. It’s known for its natural beauty and luxury appeal.
Seabrook saw massive price spikes in 2021 and 2022, with demand outpacing supply. While the market cooled slightly in 2025, home values are still near record highs. Buyers are paying for privacy and prestige in one of South Carolina’s most coveted locations.
6. Folly Beach – 160% Home Price Increase Since 2010
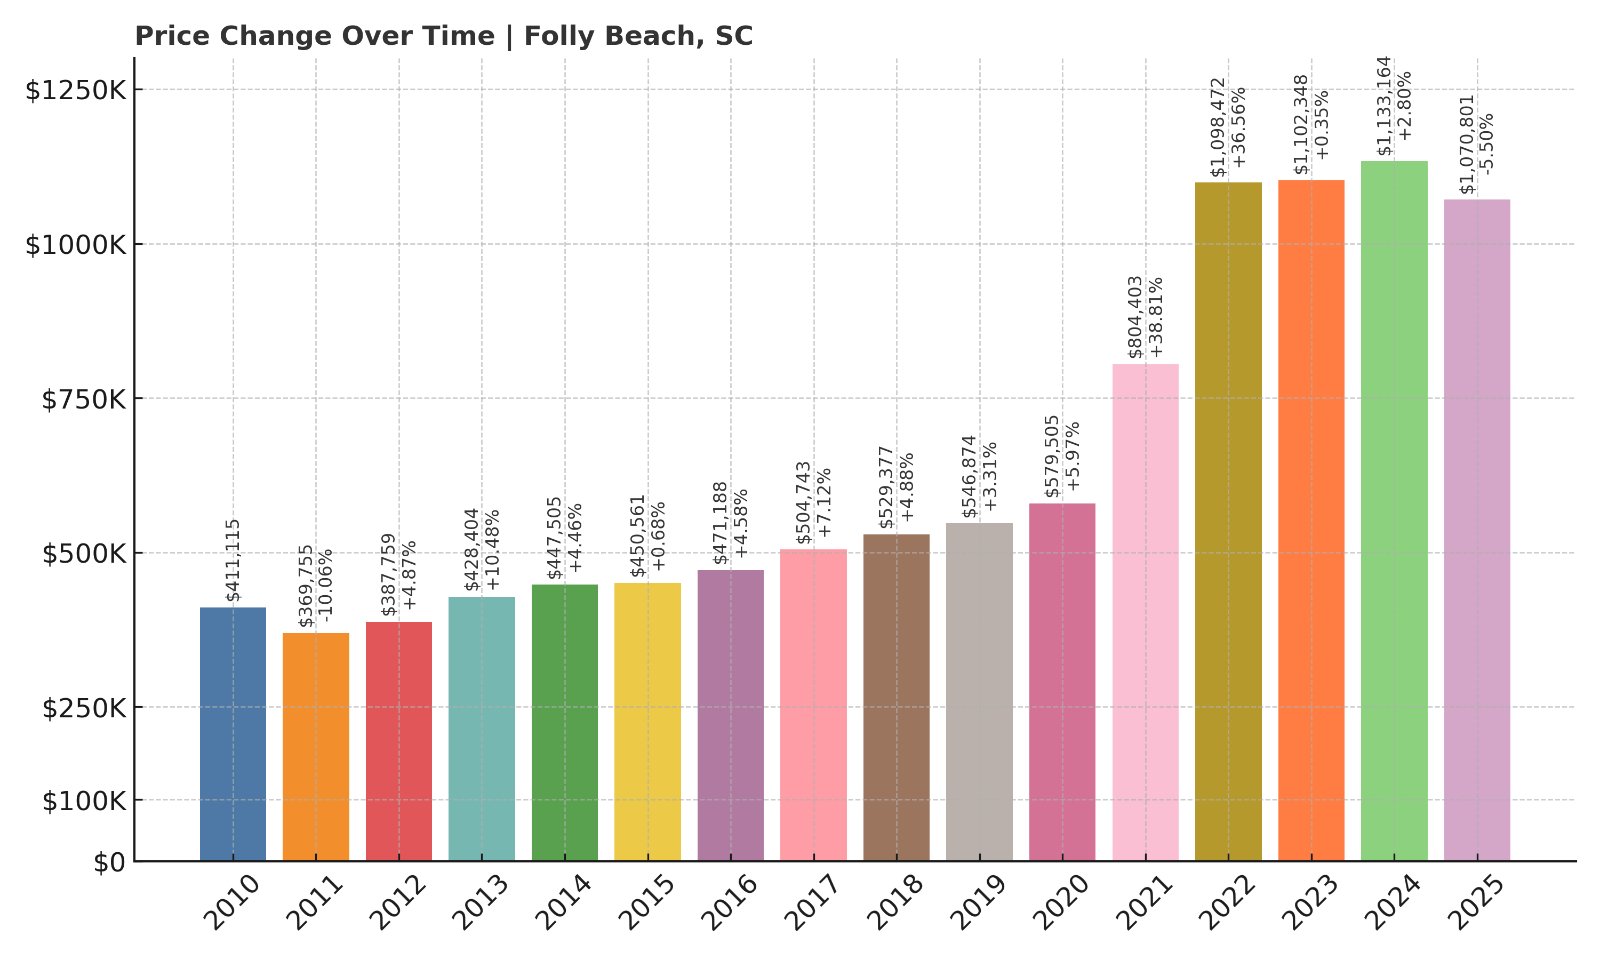
- 2010: $411,115
- 2011: $369,755 (-$41,360, -10.06% from previous year)
- 2012: $387,759 (+$18,004, +4.87% from previous year)
- 2013: $428,404 (+$40,646, +10.48% from previous year)
- 2014: $447,505 (+$19,101, +4.46% from previous year)
- 2015: $450,561 (+$3,056, +0.68% from previous year)
- 2016: $471,188 (+$20,627, +4.58% from previous year)
- 2017: $504,743 (+$33,555, +7.12% from previous year)
- 2018: $529,377 (+$24,634, +4.88% from previous year)
- 2019: $546,874 (+$17,496, +3.31% from previous year)
- 2020: $579,505 (+$32,631, +5.97% from previous year)
- 2021: $804,403 (+$224,898, +38.81% from previous year)
- 2022: $1,098,472 (+$294,069, +36.56% from previous year)
- 2023: $1,102,348 (+$3,876, +0.35% from previous year)
- 2024: $1,133,164 (+$30,816, +2.80% from previous year)
- 2025: $1,070,801 (-$62,363, -5.50% from previous year)
Folly Beach home values have surged by 160% since 2010. Although 2025 saw a rare decline, prices remain above $1 million, making it one of the most expensive beach towns in the state.
Folly Beach – Surging Values on the Edge of Charleston
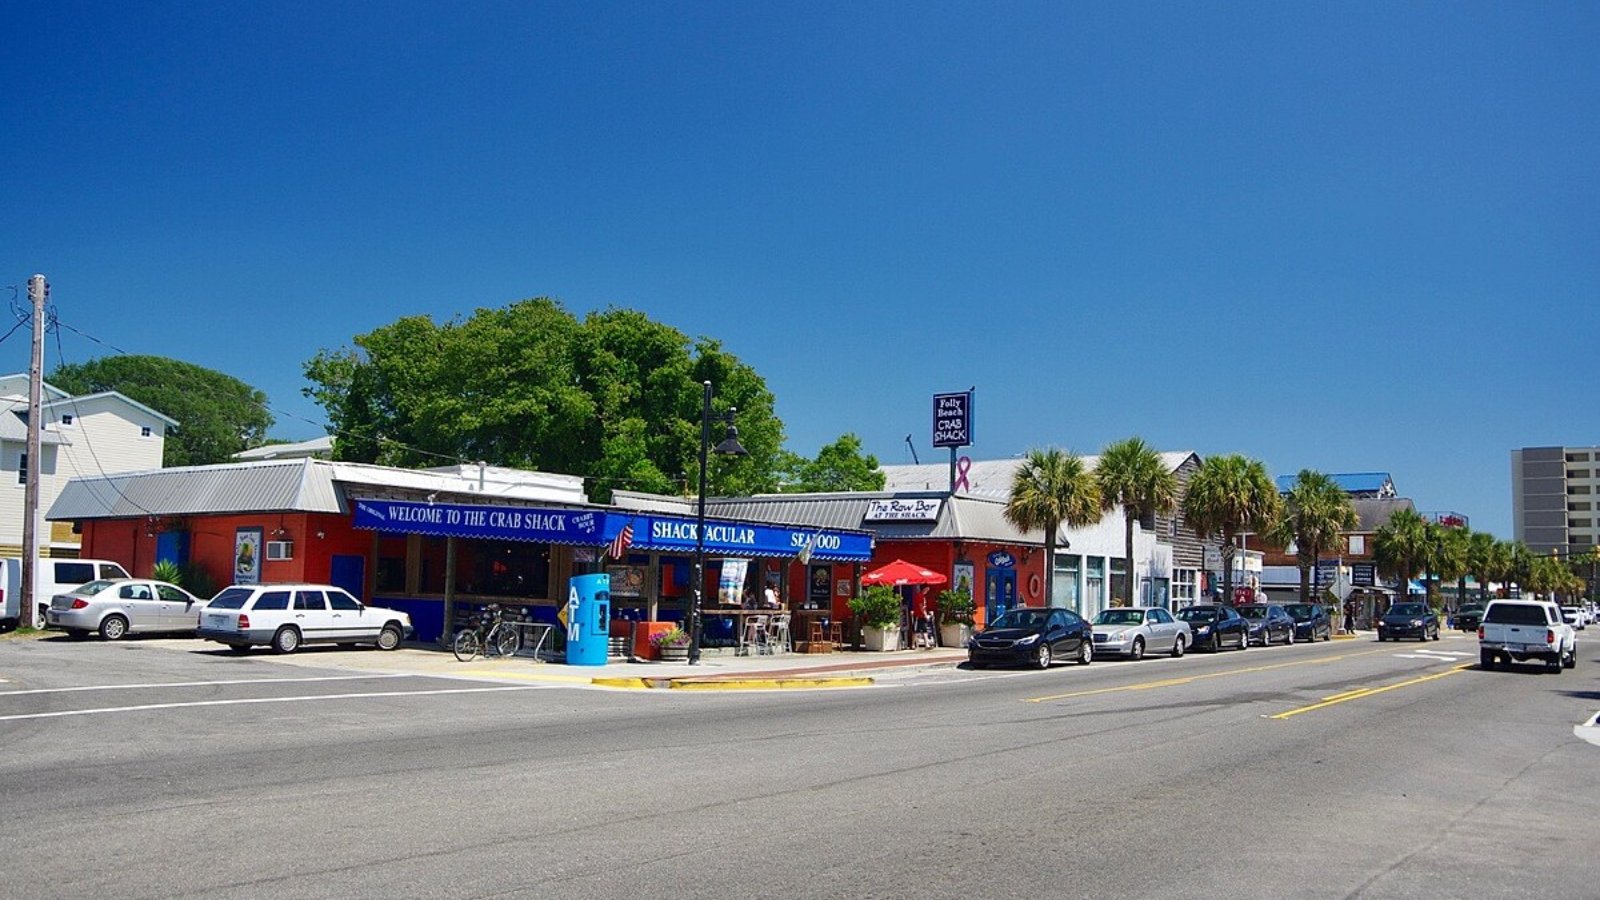
Folly Beach, known for its vibrant surf culture and laid-back charm, is just a short drive from downtown Charleston. This barrier island has long been popular with vacationers, investors, and full-time residents alike.
The area experienced tremendous growth in 2021 and 2022, when prices shot up by over $500,000 in just two years. Even after a dip in 2025, Folly Beach remains a premier destination for buyers willing to pay for ocean views and a unique community vibe.
5. Sunset – 159% Home Price Increase Since 2010
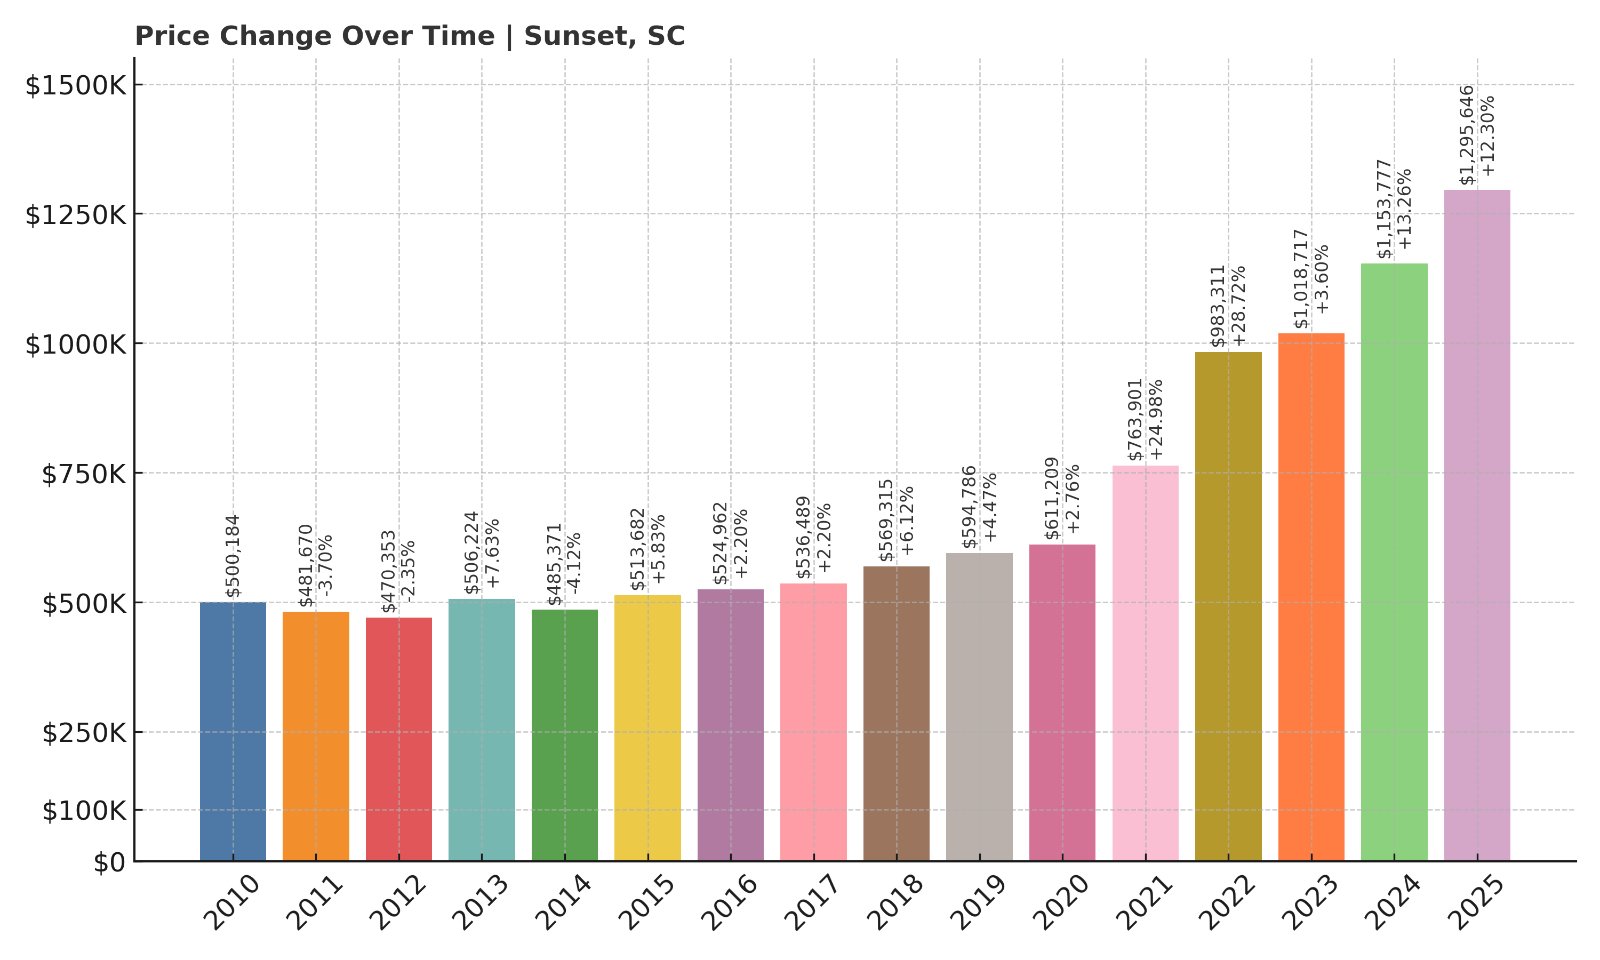
- 2010: $500,184
- 2011: $481,670 (-$18,514, -3.70% from previous year)
- 2012: $470,353 (-$11,317, -2.35%)
- 2013: $506,224 (+$35,871, +7.63%)
- 2014: $485,371 (-$20,853, -4.12%)
- 2015: $513,682 (+$28,311, +5.83%)
- 2016: $524,962 (+$11,280, +2.20%)
- 2017: $536,489 (+$11,527, +2.20%)
- 2018: $569,315 (+$32,826, +6.12%)
- 2019: $594,786 (+$25,471, +4.47%)
- 2020: $611,209 (+$16,423, +2.76%)
- 2021: $763,901 (+$152,692, +24.98%)
- 2022: $983,311 (+$219,410, +28.72%)
- 2023: $1,018,717 (+$35,406, +3.60%)
- 2024: $1,153,777 (+$135,060, +13.26%)
- 2025: $1,295,646 (+$141,869, +12.30%)
Home prices in Sunset have surged 159% since 2010. This small town near Lake Keowee has transformed into a high-end retreat with multi-million-dollar homes and gated communities.
Sunset – The Mountain-Lake Luxury Destination
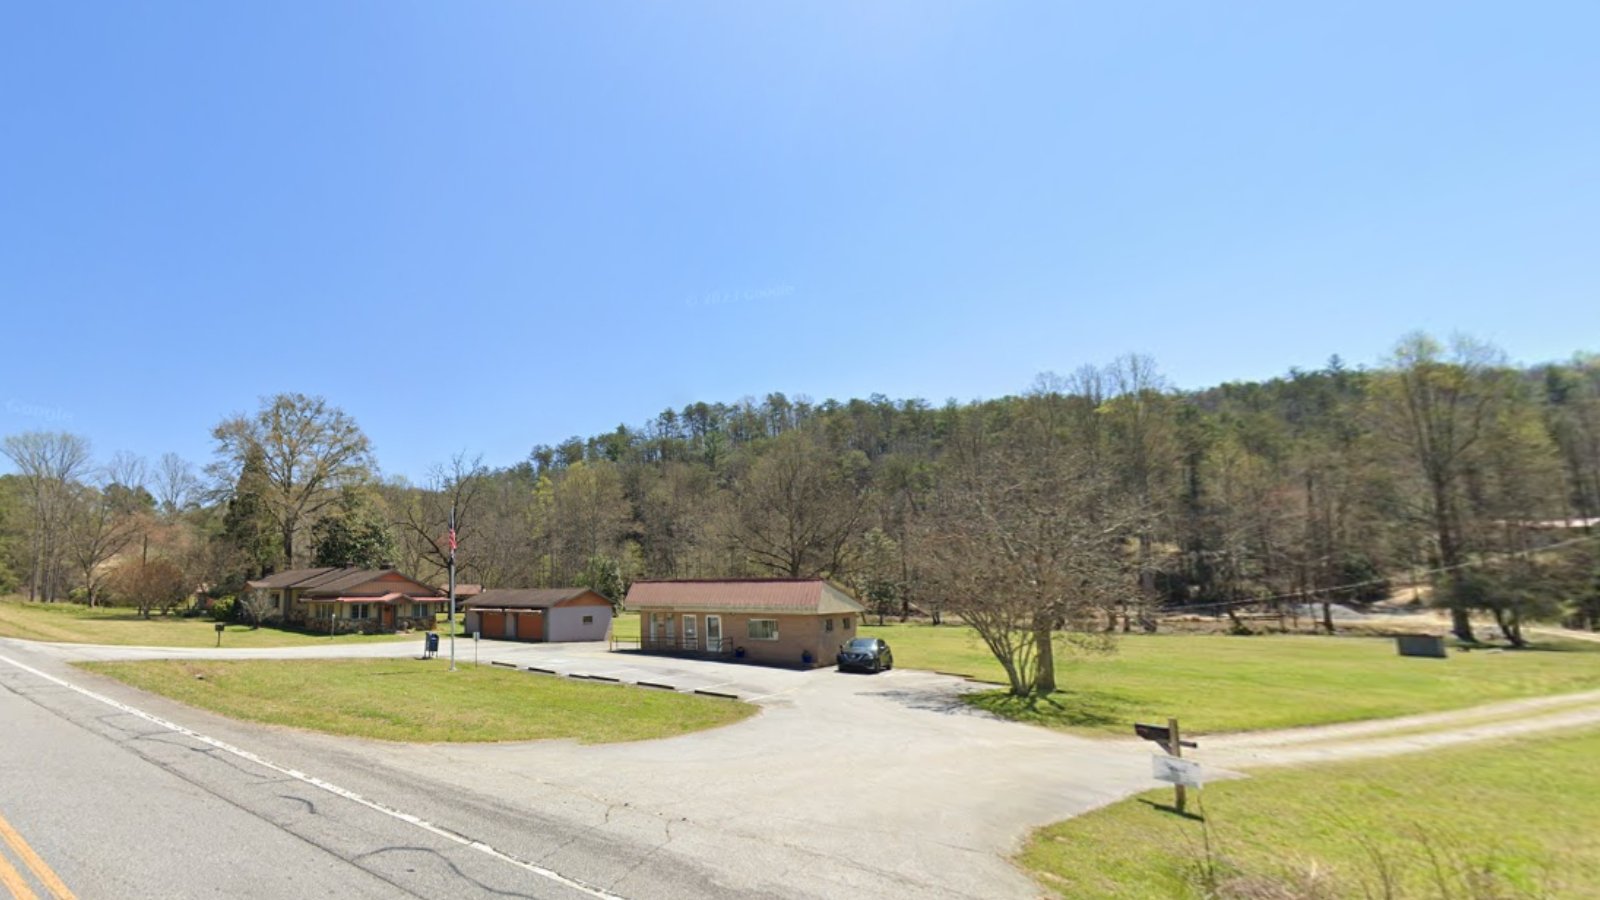
Located in the foothills of the Blue Ridge Mountains, Sunset is home to The Reserve at Lake Keowee and other exclusive developments. Buyers flock here for lake access, golf, and quiet luxury. Prices have accelerated sharply in recent years and show no signs of slowing.
4. Isle of Palms – 164% Home Price Increase Since 2010
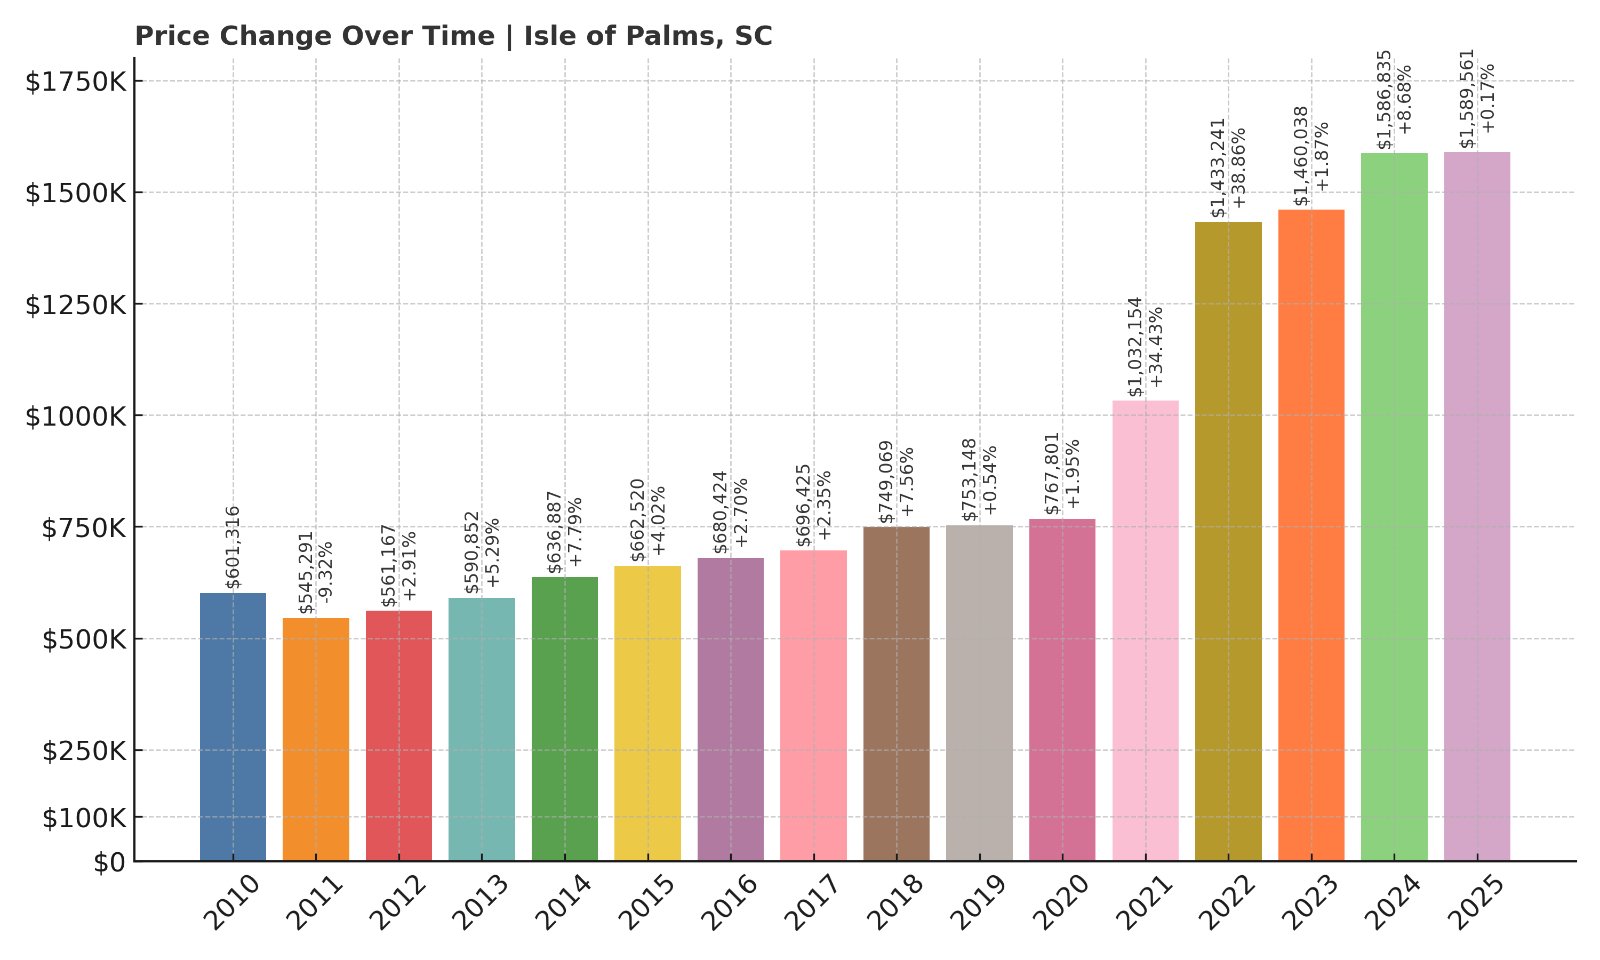
- 2010: $601,316
- 2011: $545,291 (-$56,025, -9.32%)
- 2012: $561,168 (+$15,877, +2.91%)
- 2013: $590,852 (+$29,684, +5.29%)
- 2014: $636,887 (+$46,035, +7.79%)
- 2015: $662,520 (+$25,633, +4.02%)
- 2016: $680,424 (+$17,904, +2.70%)
- 2017: $696,425 (+$16,001, +2.35%)
- 2018: $749,069 (+$52,644, +7.56%)
- 2019: $753,148 (+$4,079, +0.54%)
- 2020: $767,801 (+$14,653, +1.95%)
- 2021: $1,032,154 (+$264,353, +34.42%)
- 2022: $1,433,241 (+$401,087, +38.85%)
- 2023: $1,460,038 (+$26,797, +1.87%)
- 2024: $1,586,835 (+$126,797, +8.69%)
- 2025: $1,589,561 (+$2,726, +0.17%)
Isle of Palms has seen a 164% price increase since 2010, driven by demand for beachfront living near Charleston. Average home values in 2025 exceed $1.58 million.
Isle of Palms – Prized Beachfront Real Estate
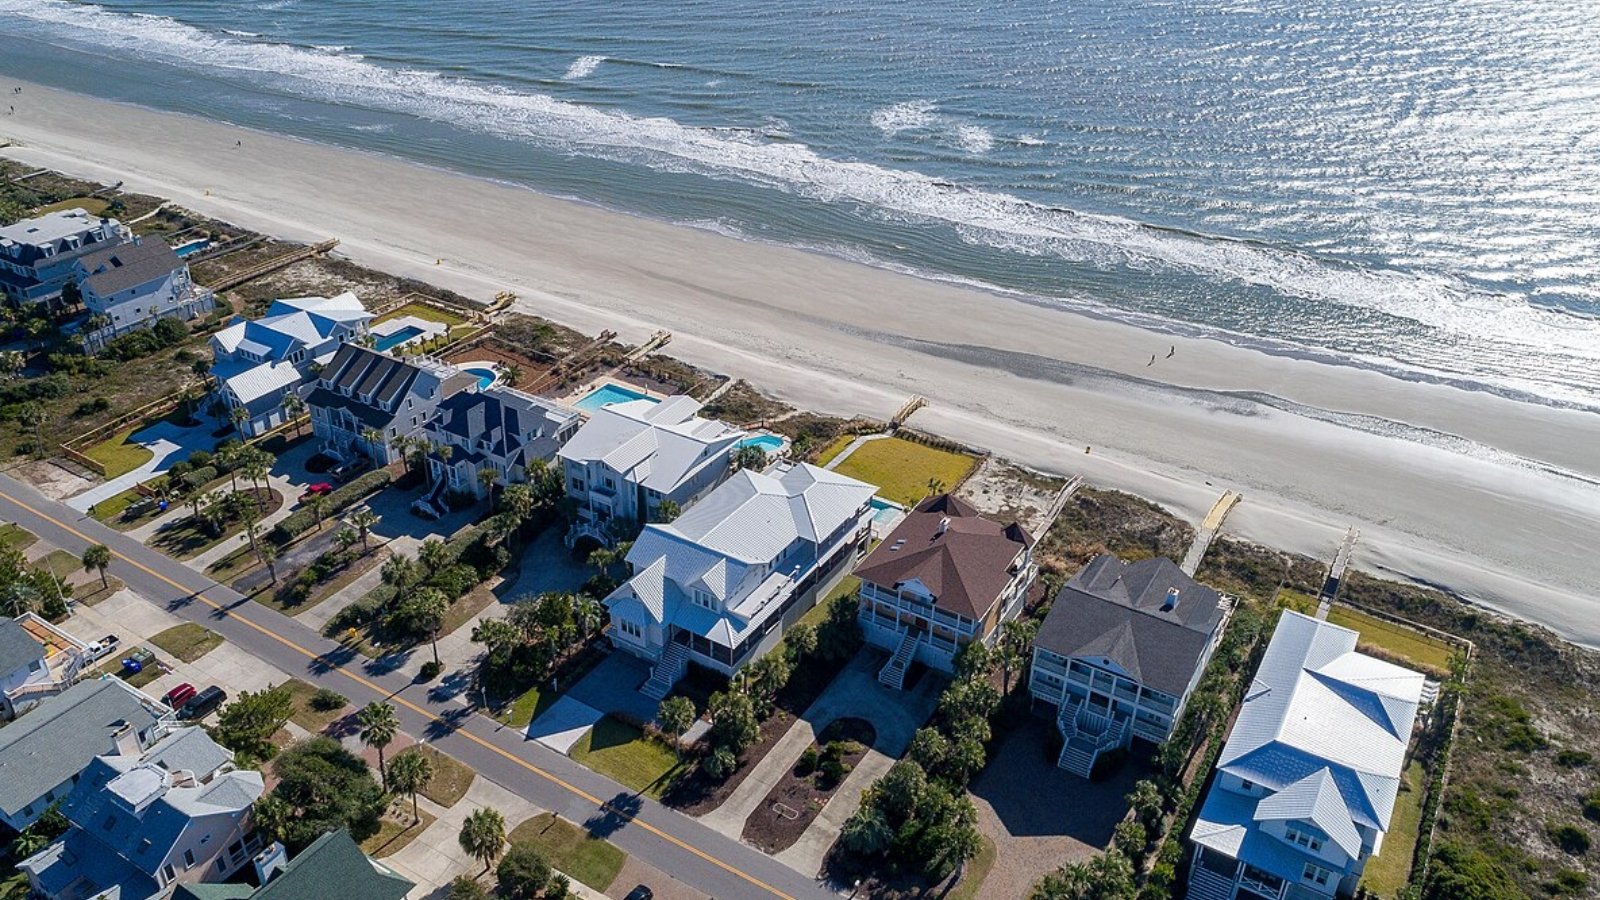
Isle of Palms is a classic South Carolina barrier island community with wide beaches and upscale homes. It attracts both full-time residents and vacation home buyers. After explosive growth in 2021–2022, values have stabilized at record highs.
3. Kiawah Island – 127% Home Price Increase Since 2010
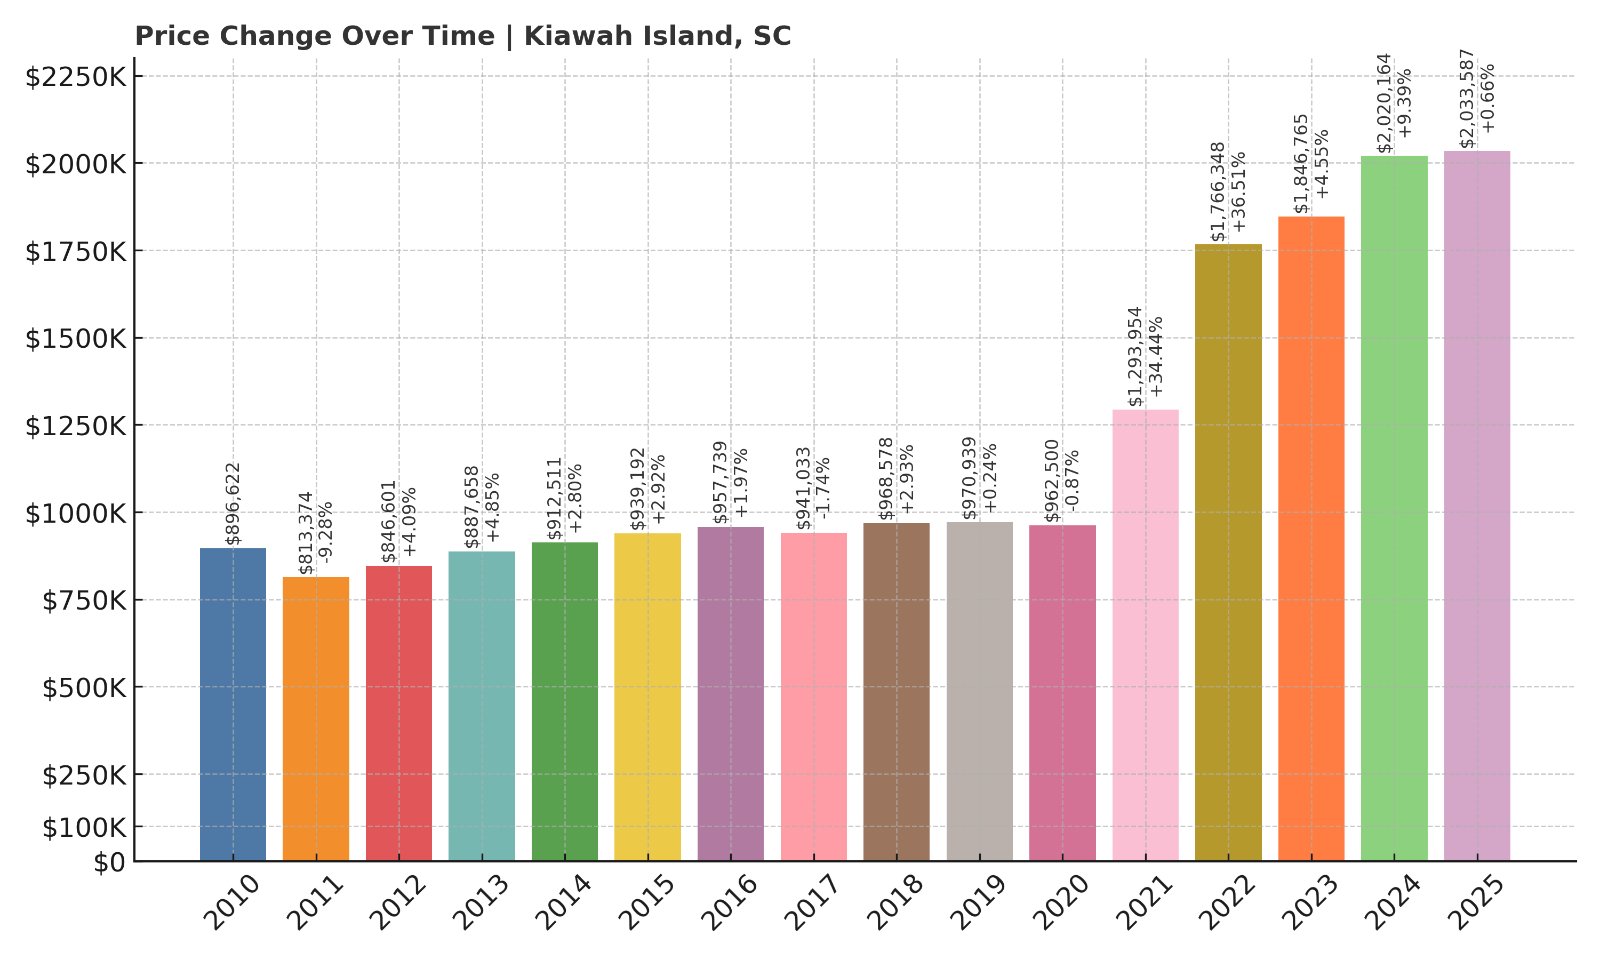
- 2010: $896,622
- 2011: $813,374 (-$83,248, -9.29%)
- 2012: $846,601 (+$33,227, +4.09%)
- 2013: $887,658 (+$41,057, +4.85%)
- 2014: $912,512 (+$24,854, +2.80%)
- 2015: $939,192 (+$26,680, +2.92%)
- 2016: $957,739 (+$18,547, +1.97%)
- 2017: $941,033 (-$16,706, -1.74%)
- 2018: $968,578 (+$27,545, +2.93%)
- 2019: $970,939 (+$2,361, +0.24%)
- 2020: $962,500 (-$8,439, -0.87%)
- 2021: $1,293,954 (+$331,454, +34.45%)
- 2022: $1,766,348 (+$472,394, +36.50%)
- 2023: $1,846,765 (+$80,417, +4.55%)
- 2024: $2,020,164 (+$173,399, +9.39%)
- 2025: $2,033,587 (+$13,423, +0.66%)
Kiawah Island’s average home value has grown from $896K to over $2M since 2010, a 127% increase. Its combination of luxury, exclusivity, and nature makes it a perennial top-tier market.
Kiawah Island – South Carolina’s Luxury Epicenter
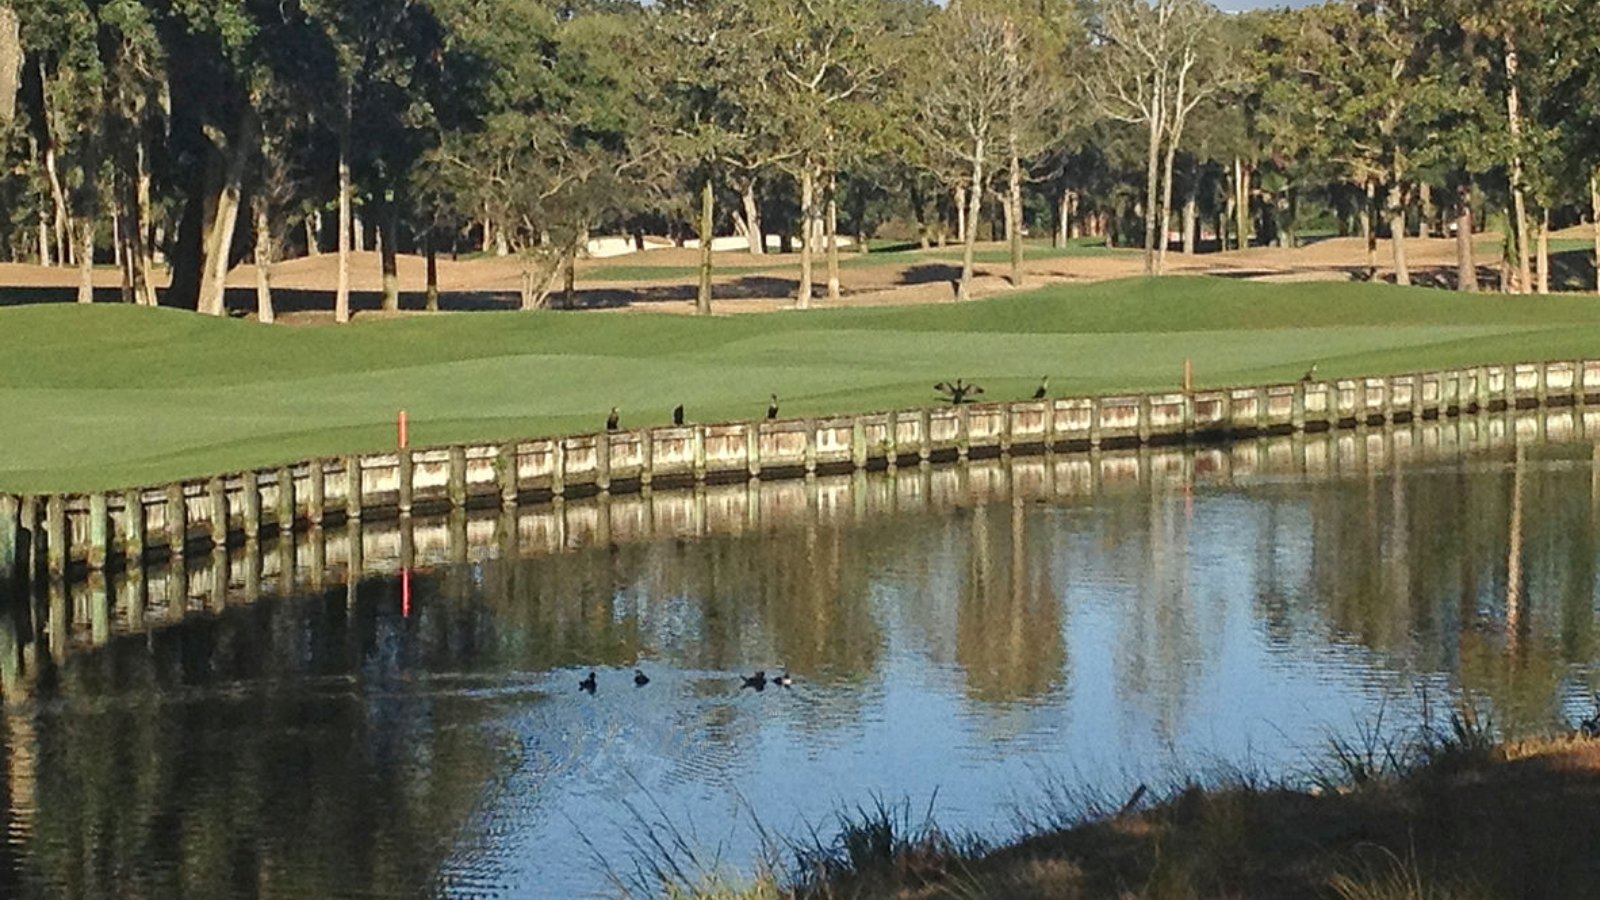
Kiawah’s gated resort community is known for its golf courses, upscale homes, and nature preserves. High-income buyers continue to pour in, keeping property values among the highest in the state.
2. Sheldon – Data Surged in Recent Years
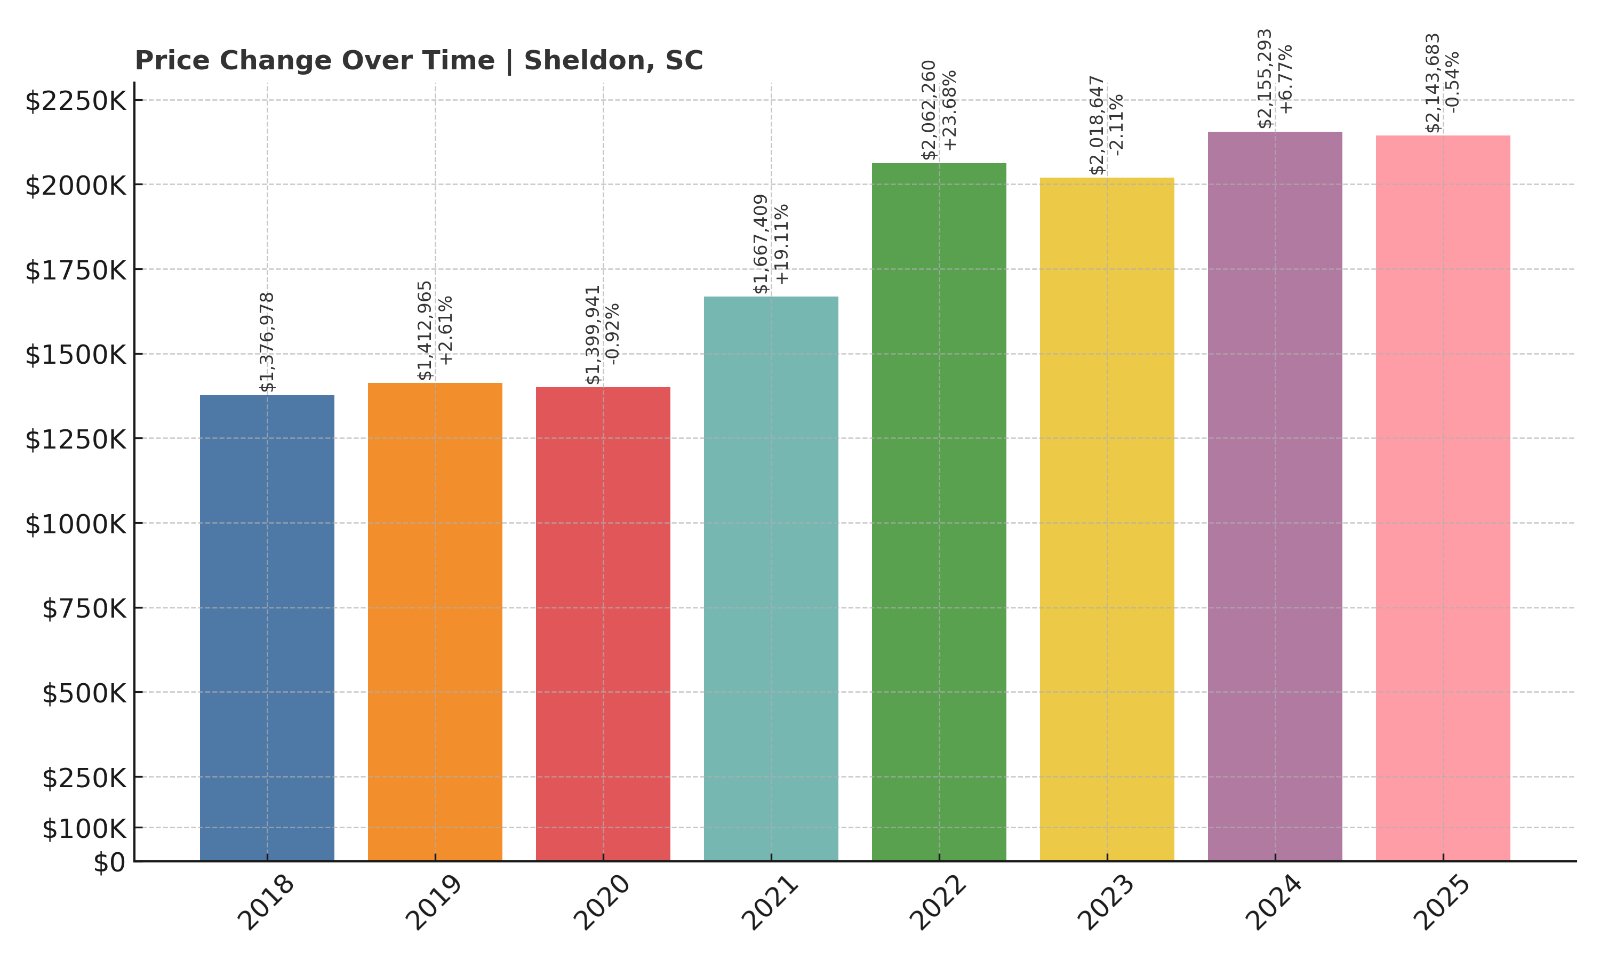
- 2018: $1,376,978
- 2019: $1,412,965 (+$35,987, +2.61%)
- 2020: $1,399,941 (-$13,024, -0.92%)
- 2021: $1,667,409 (+$267,468, +19.11%)
- 2022: $2,062,260 (+$394,851, +23.68%)
- 2023: $2,018,647 (-$43,613, -2.11%)
- 2024: $2,155,293 (+$136,646, +6.77%)
- 2025: $2,143,683 (-$11,610, -0.54%)
Though earlier data is missing, Sheldon has emerged as one of the most expensive places in SC, with values peaking above $2.1 million in 2025. Its rural luxury estates are driving this trend.
Sheldon – Hidden Wealth in the Lowcountry
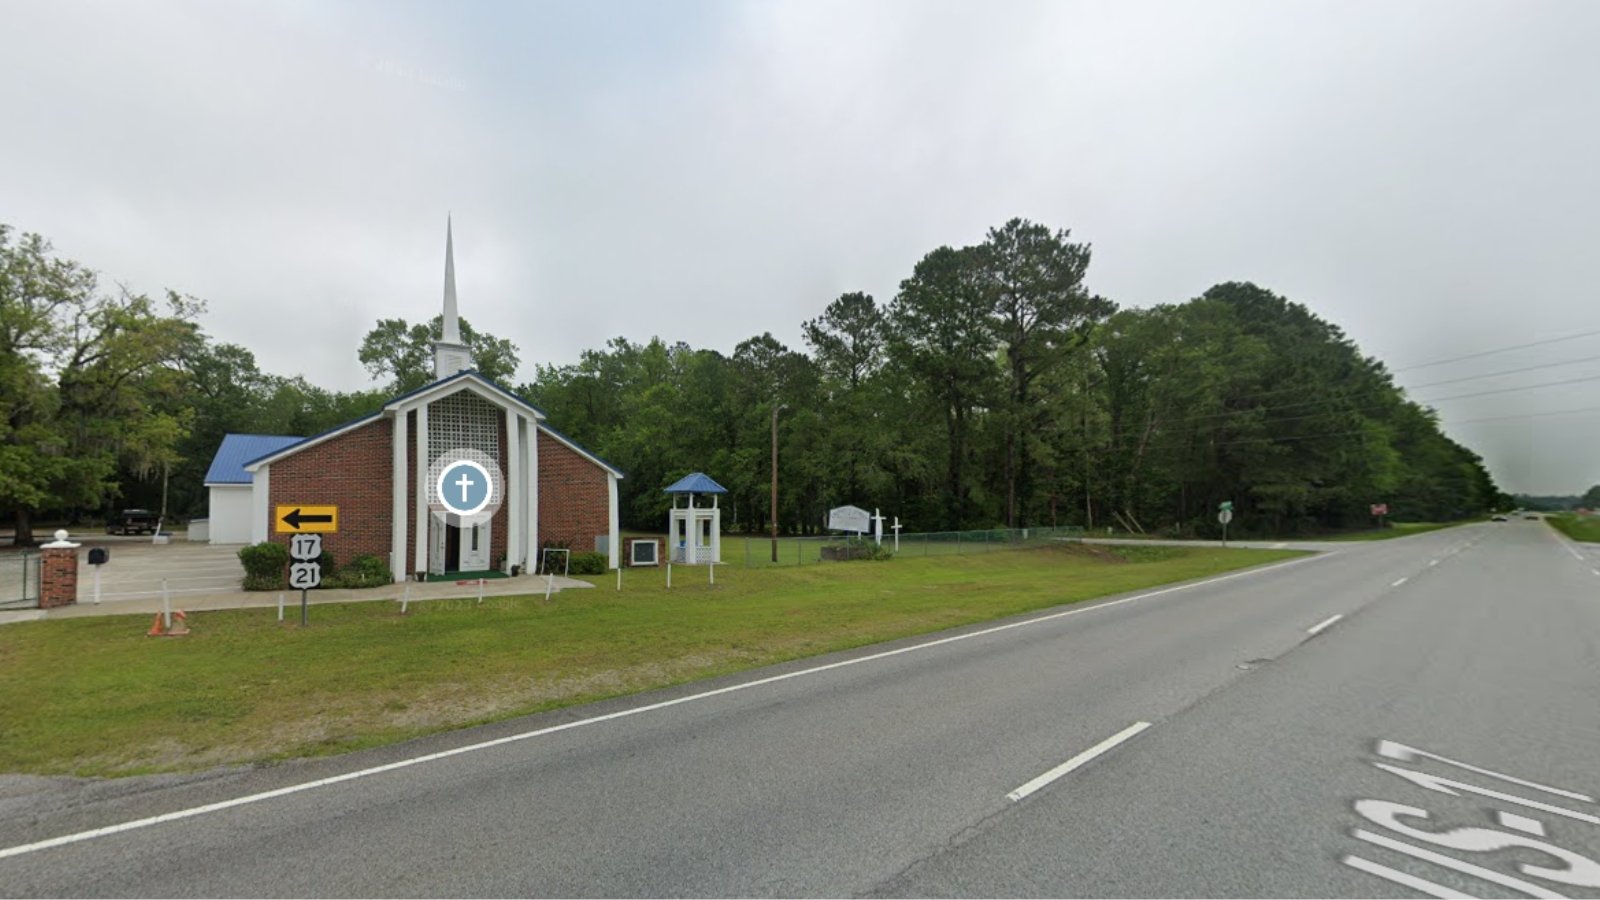
Located in Beaufort County, Sheldon features high-end riverfront homes and large estate properties. While not widely known, it has quietly become a haven for wealthy homeowners seeking privacy.
1. Sullivan’s Island – 245% Home Price Increase Since 2010
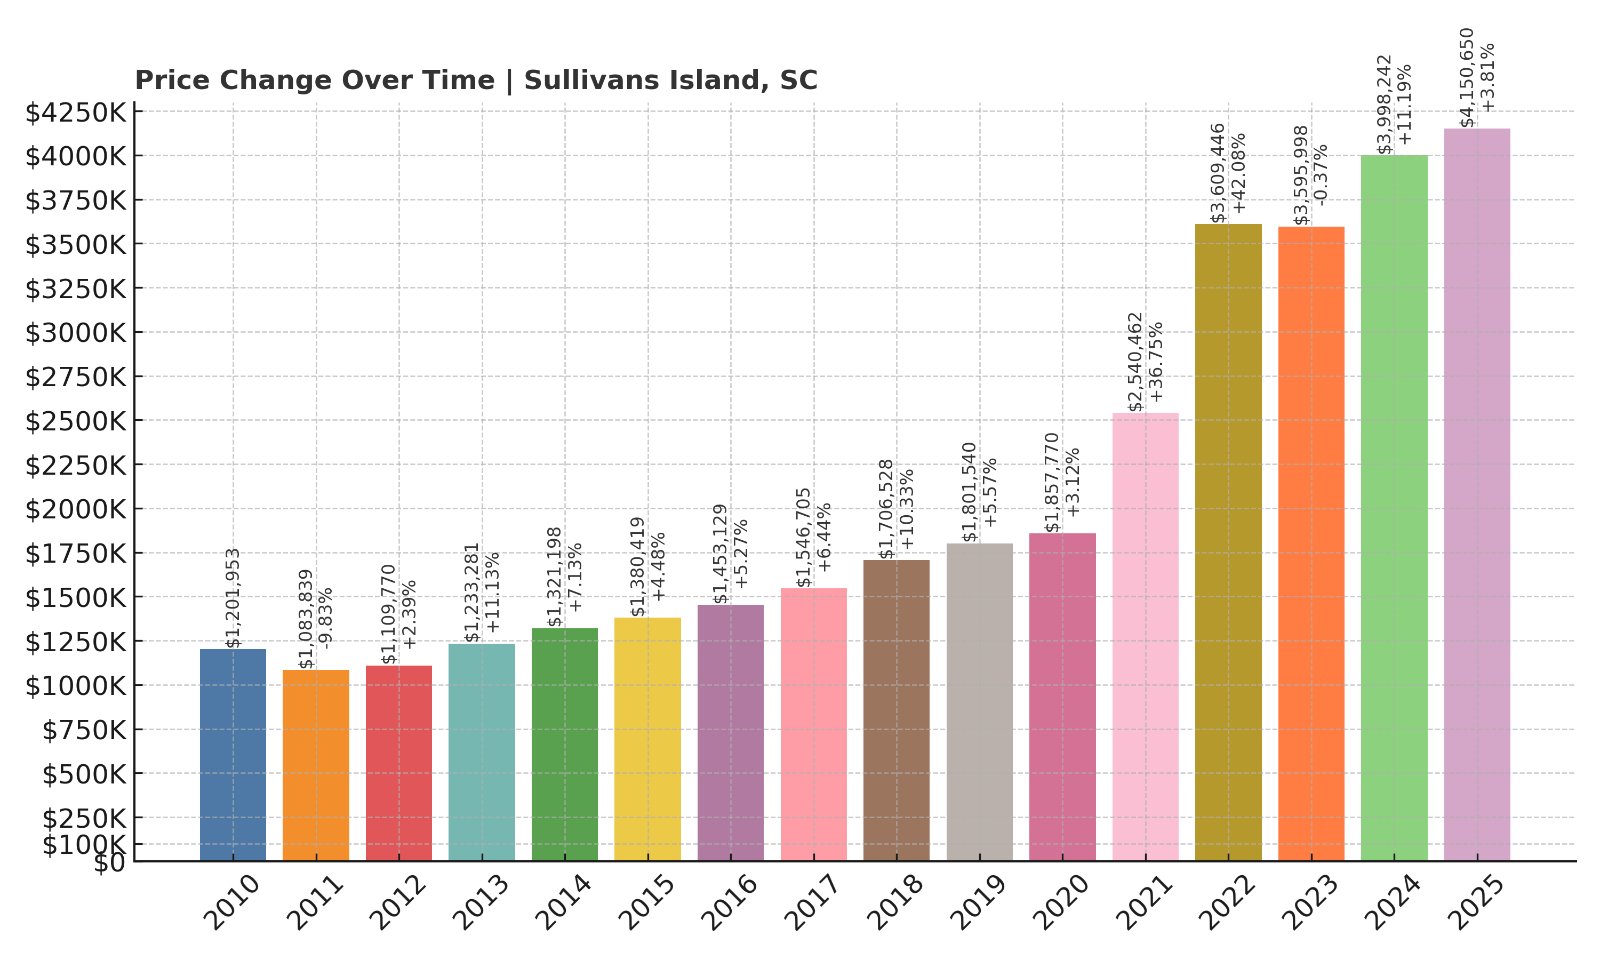
- 2010: $1,201,953
- 2011: $1,083,839 (-$118,114, -9.83%)
- 2012: $1,109,770 (+$25,931, +2.39%)
- 2013: $1,233,281 (+$123,511, +11.13%)
- 2014: $1,321,198 (+$87,917, +7.13%)
- 2015: $1,380,419 (+$59,221, +4.48%)
- 2016: $1,453,129 (+$72,710, +5.27%)
- 2017: $1,546,705 (+$93,576, +6.44%)
- 2018: $1,706,528 (+$159,823, +10.33%)
- 2019: $1,801,540 (+$95,012, +5.57%)
- 2020: $1,857,770 (+$56,230, +3.12%)
- 2021: $2,540,462 (+$682,692, +36.74%)
- 2022: $3,609,446 (+$1,068,984, +42.06%)
- 2023: $3,595,998 (-$13,448, -0.37%)
- 2024: $3,998,242 (+$402,244, +11.18%)
- 2025: $4,150,649 (+$152,407, +3.81%)
Sullivan’s Island tops the list with an average home value of $4.15 million in 2025 — a 245% increase since 2010. It’s not just South Carolina’s most expensive town, but one of the priciest on the East Coast.
Sullivan’s Island – Coastal Luxury at Its Peak
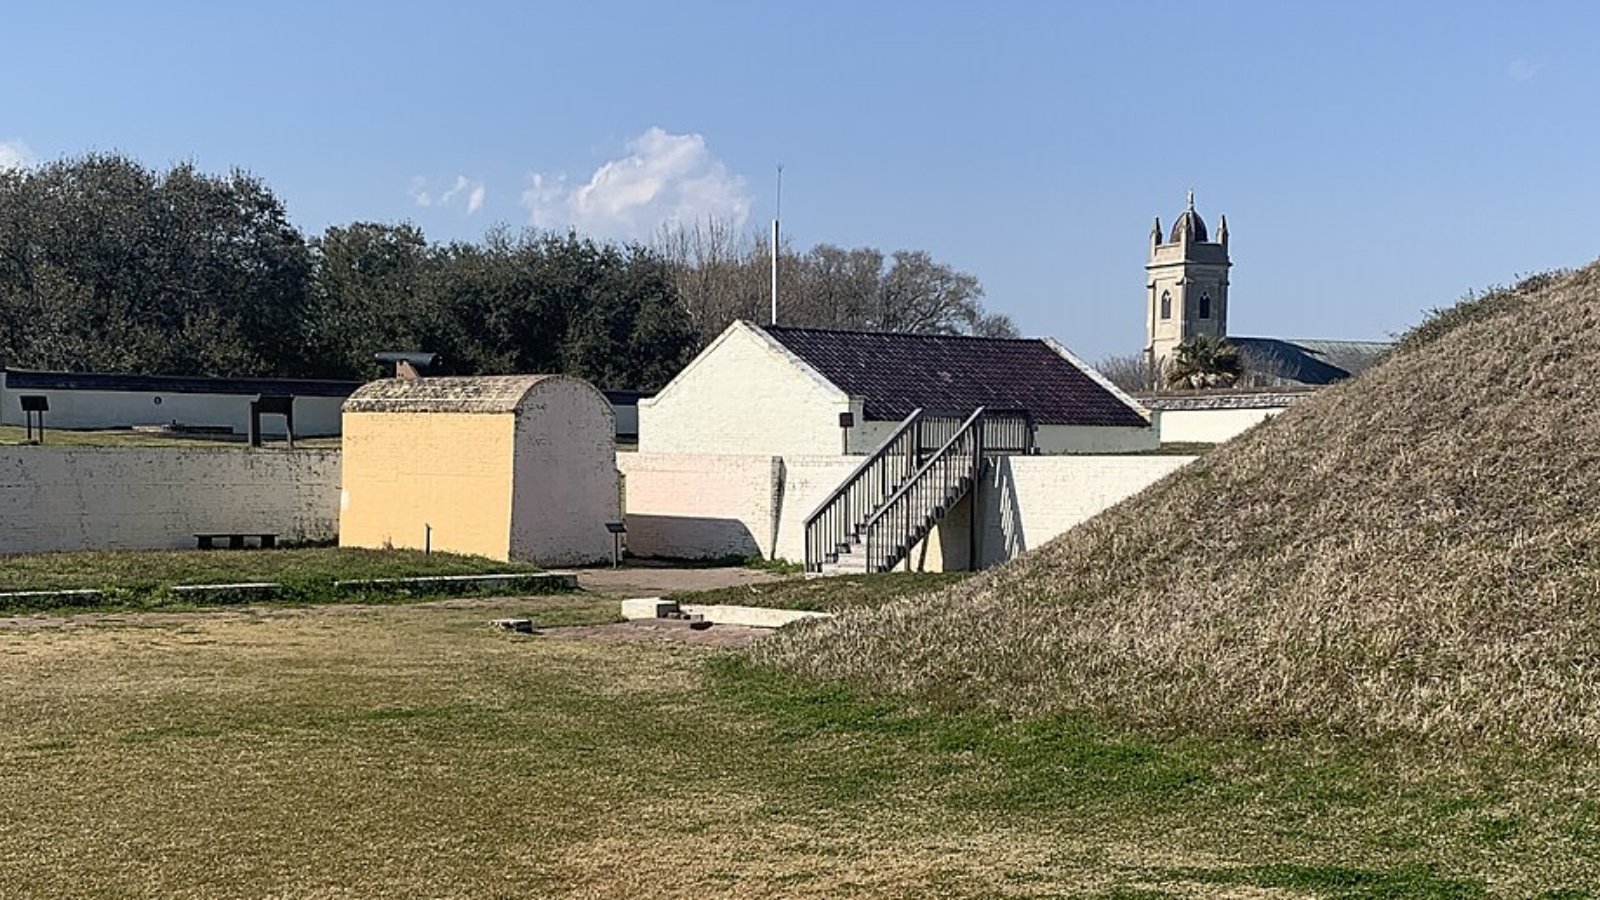
With limited inventory, oceanfront estates, and proximity to Charleston, Sullivan’s Island is the ultimate destination for elite buyers. Its strict zoning and laid-back prestige create long-term value.