Would you like to save this?
From beach towns to high-desert retreats, Oregon’s housing market isn’t just hot—it’s out of control. The Zillow Home Value Index shows property prices skyrocketing in 30 towns that now dominate the state’s real estate scene. Some saw slow, steady gains; others shot up overnight—but all now carry price tags that’ll make even seasoned buyers wince. Whether it’s coastal charm or Portland suburb convenience driving the demand, these towns prove that buying a home in Oregon isn’t for the faint of wallet anymore.
30. Garden Home-Whitford – 116.6% Home Price Increase Since 2012
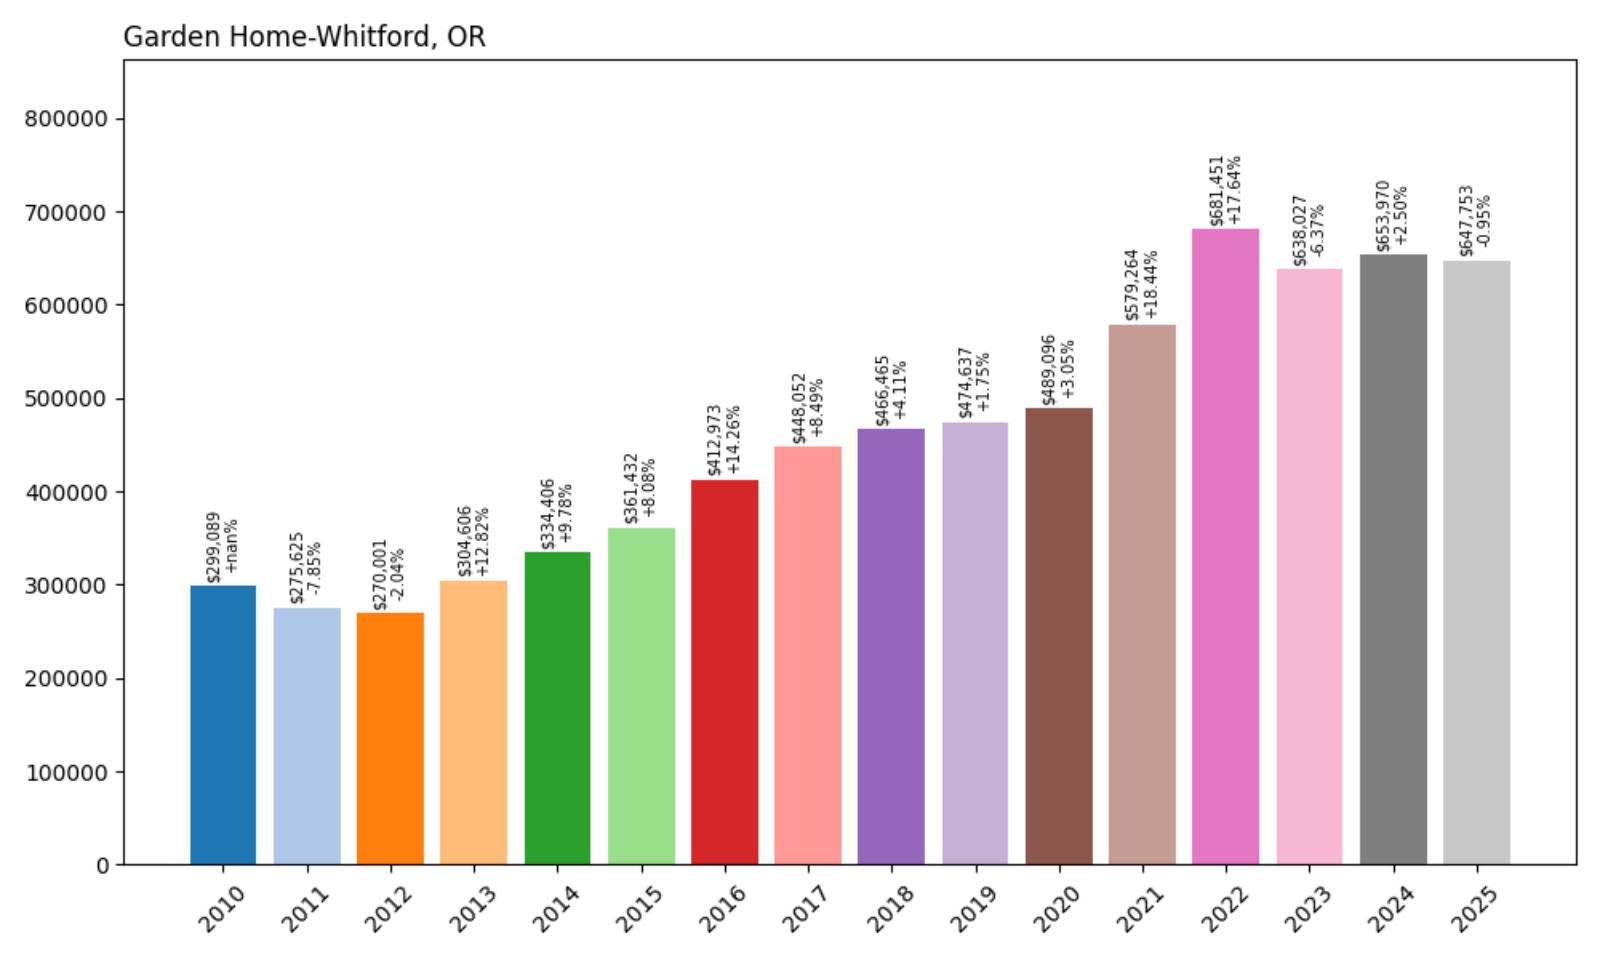
- 2010: $299,089
- 2011: $275,625 (−$23,464, −7.85% from previous year)
- 2012: $270,001 (−$5,623, −2.04% from previous year)
- 2013: $304,606 (+$34,604, +12.82% from previous year)
- 2014: $334,406 (+$29,801, +9.78% from previous year)
- 2015: $361,432 (+$27,026, +8.08% from previous year)
- 2016: $412,973 (+$51,541, +14.26% from previous year)
- 2017: $448,052 (+$35,079, +8.49% from previous year)
- 2018: $466,465 (+$18,413, +4.11% from previous year)
- 2019: $474,637 (+$8,172, +1.75% from previous year)
- 2020: $489,096 (+$14,459, +3.05% from previous year)
- 2021: $579,264 (+$90,169, +18.44% from previous year)
- 2022: $681,451 (+$102,186, +17.64% from previous year)
- 2023: $638,027 (−$43,424, −6.37% from previous year)
- 2024: $653,970 (+$15,944, +2.50% from previous year)
- 2025: $647,753 (−$6,217, −0.95% from previous year)
Since 2012, home values in Garden Home-Whitford have surged by 116.6%, climbing from $270,001 to $647,753 in 2025. After early dips in 2011 and 2012, prices began a sharp upward climb, peaking in 2022. While recent years saw some fluctuation—most notably a drop in 2023—the overall trend remains strongly upward. This growth, especially during the 2013 to 2022 stretch, highlights the area’s increasing appeal and housing demand. Even with slight declines toward 2025, values remain significantly higher than a decade ago.
Garden Home-Whitford – Convenient Suburban Living Near Portland
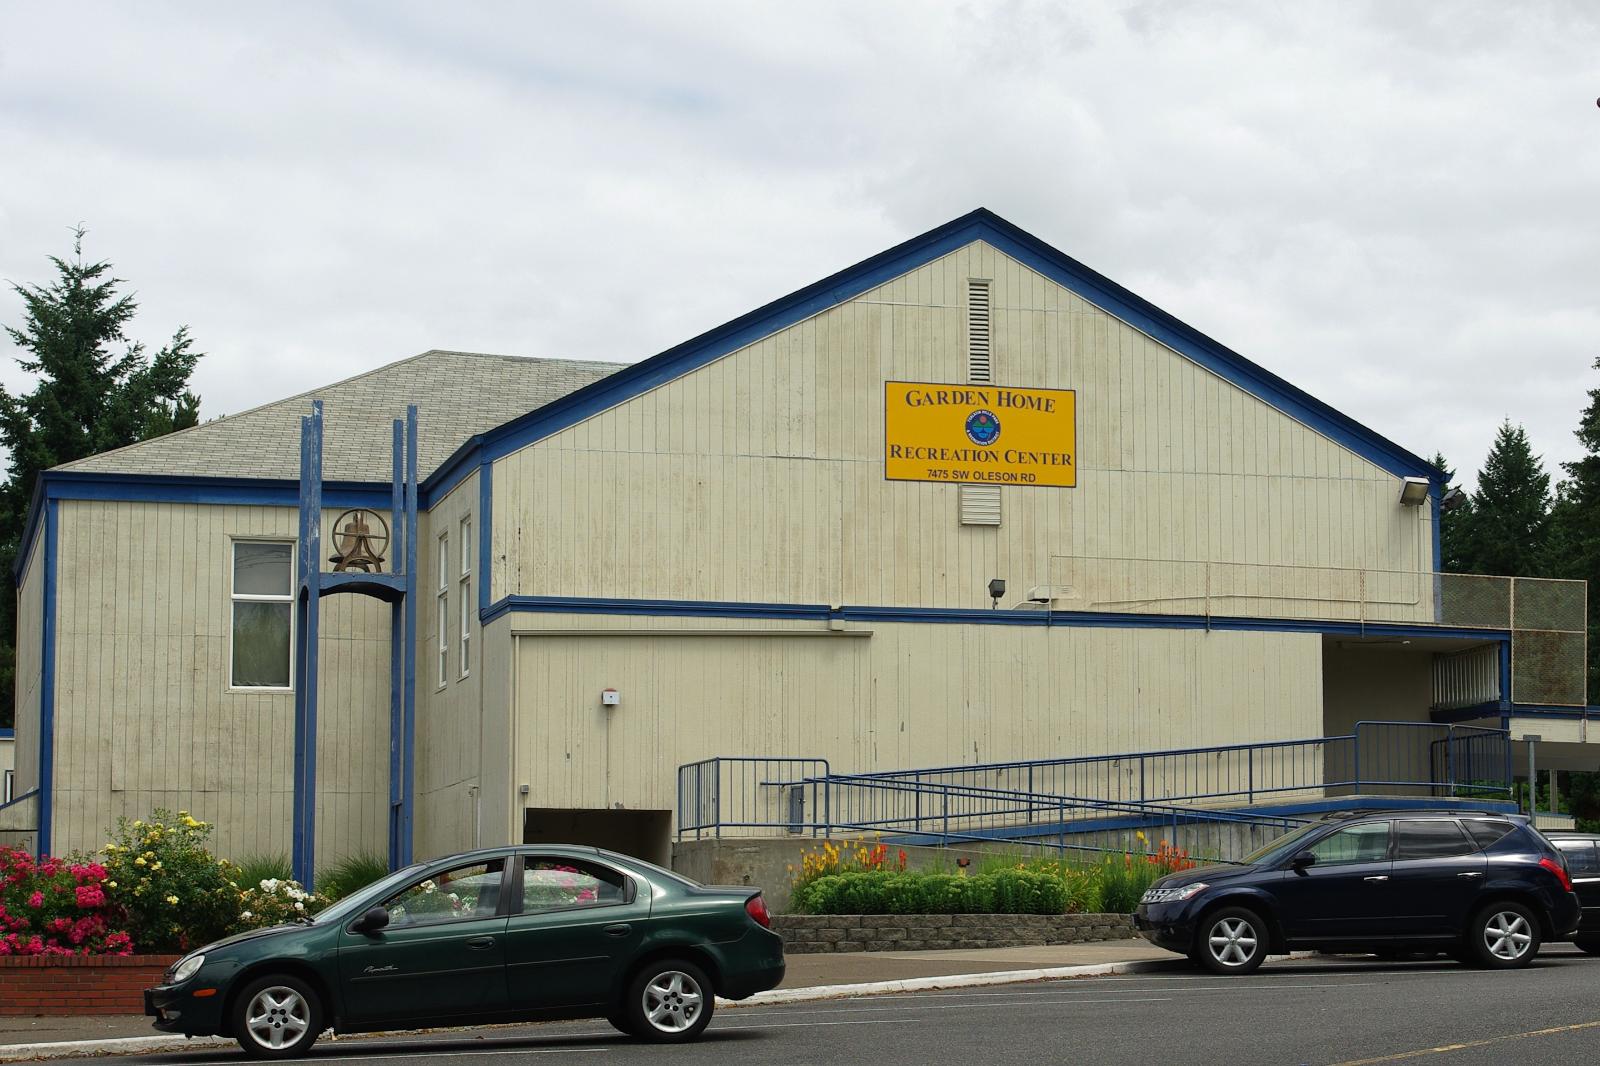
Located just southwest of Portland, Garden Home-Whitford is a tight-knit suburb known for its quiet neighborhoods and easy access to the city. With parks, grocery stores, and schools all within a few minutes’ drive, the area attracts a steady mix of families and retirees looking for stability and convenience. This town isn’t flashy—but it’s incredibly livable, and the numbers reflect that desirability. The consistent growth through the 2010s and early 2020s corresponds with Portland’s own expansion, as more residents sought comfortable housing within commuting distance.
One reason home prices remained resilient is the balance Garden Home-Whitford strikes between tranquility and accessibility. It’s not a destination for tourists or a trendy hotspot, but rather a place where people settle for the long term. With average home values now hovering around $647,000, the town has outpaced many nearby communities. While 2023 marked a minor dip, prices have largely stabilized again, and the long-term trajectory remains solid. The overall pattern here reflects strong fundamentals more than speculative booms.
29. Sherwood – 141.6% Home Price Increase Since 2012

- 2010: $302,691
- 2011: $274,671 (−$28,021, −9.26% from previous year)
- 2012: $268,825 (−$5,846, −2.13% from previous year)
- 2013: $300,081 (+$31,256, +11.63% from previous year)
- 2014: $330,436 (+$30,355, +10.12% from previous year)
- 2015: $358,508 (+$28,072, +8.50% from previous year)
- 2016: $400,312 (+$41,805, +11.66% from previous year)
- 2017: $433,994 (+$33,682, +8.41% from previous year)
- 2018: $454,597 (+$20,603, +4.75% from previous year)
- 2019: $467,089 (+$12,492, +2.75% from previous year)
- 2020: $482,676 (+$15,587, +3.34% from previous year)
- 2021: $568,632 (+$85,956, +17.81% from previous year)
- 2022: $671,837 (+$103,204, +18.15% from previous year)
- 2023: $645,163 (−$26,674, −3.97% from previous year)
- 2024: $652,637 (+$7,474, +1.16% from previous year)
- 2025: $649,708 (−$2,929, −0.45% from previous year)
Sherwood’s home values have climbed from $268,825 in 2012 to $649,708 in 2025—an impressive 141.6% increase. The town posted especially strong gains between 2013 and 2022, with double-digit jumps in several years. Even with a modest drop in 2023, home values remain substantially above pre-pandemic levels. Sherwood’s consistent demand and strong growth streak make it one of the most robust markets in the state.
Sherwood – Family-Friendly Growth Hub
Sherwood is one of the fastest-growing suburbs in the Portland metro area, popular with young families and professionals. Its award-winning school district, ample green spaces, and suburban charm have made it a magnet for upwardly mobile buyers. Located in Washington County, Sherwood has transformed from a small town into a polished, desirable community over the past decade. That transformation is clearly reflected in its home price data, which saw dramatic growth from the early 2010s onward.
The town’s housing market remains relatively stable despite recent economic headwinds. Sherwood’s low crime rate and carefully planned neighborhoods continue to appeal to buyers seeking more space and a quieter lifestyle. With homes now approaching $650,000 on average, it’s not the bargain it once was, but the quality of life and demand haven’t faded. The slight price drops of 2023 and 2025 likely reflect short-term market adjustments rather than a long-term shift in desirability.
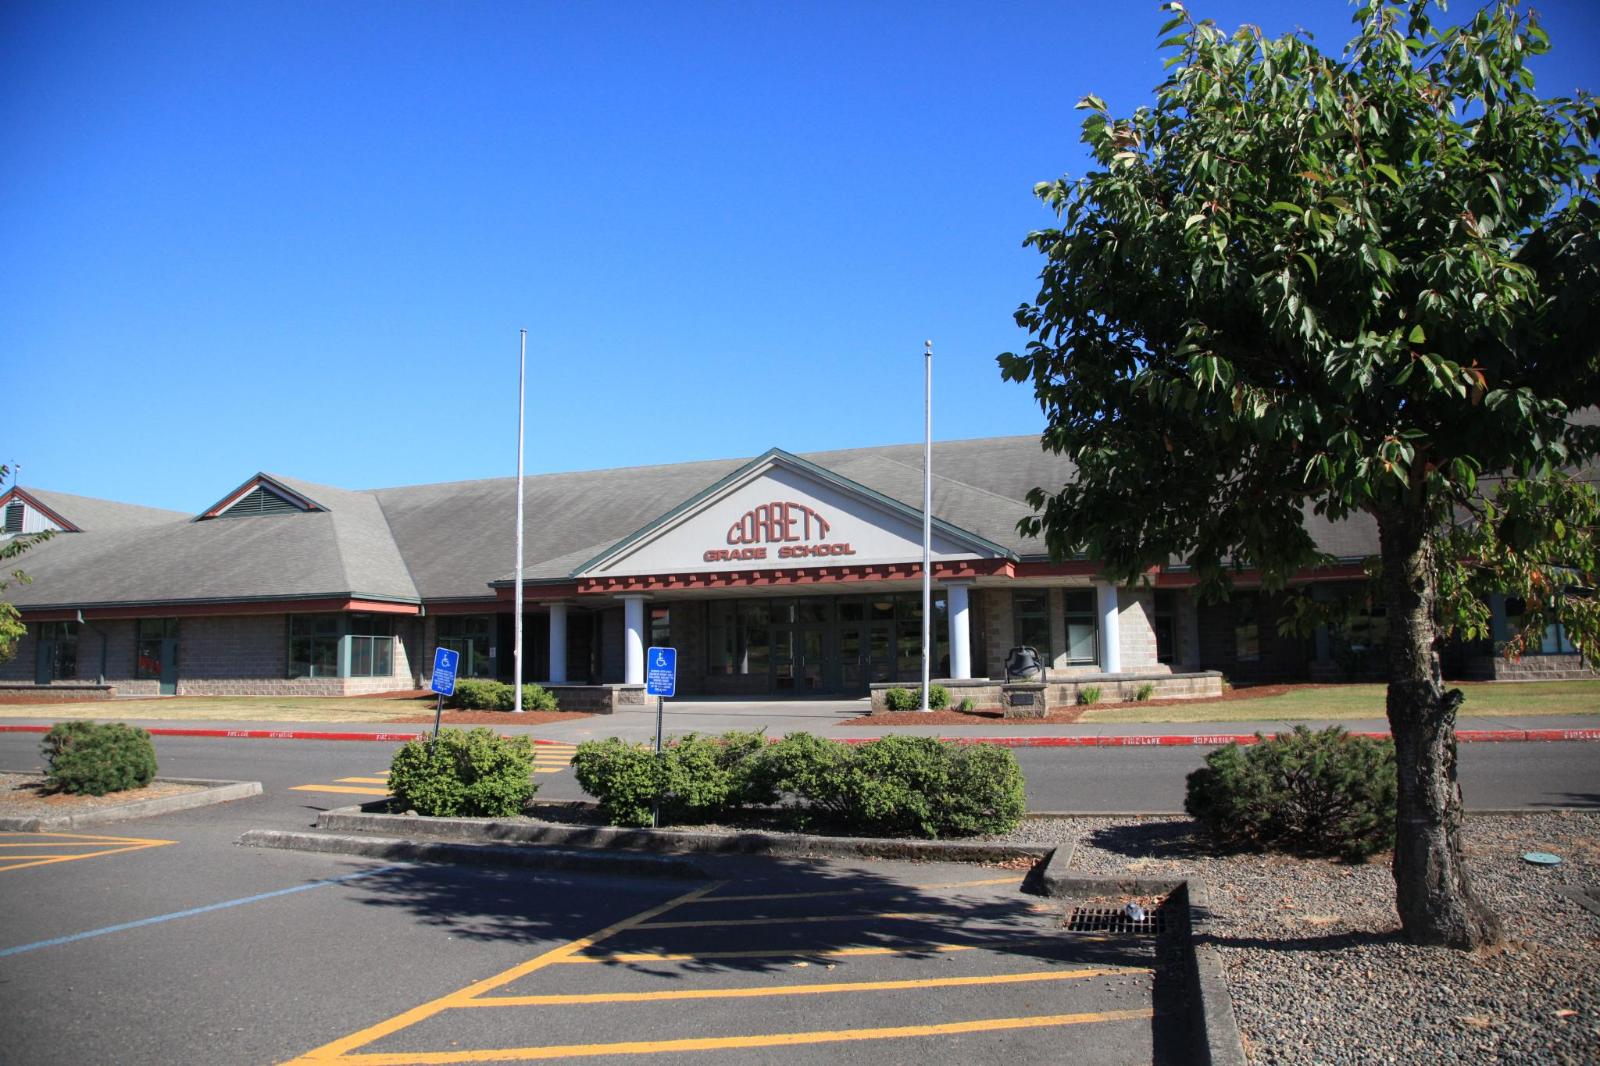
28. Corbett – 133.8% Home Price Increase Since 2012
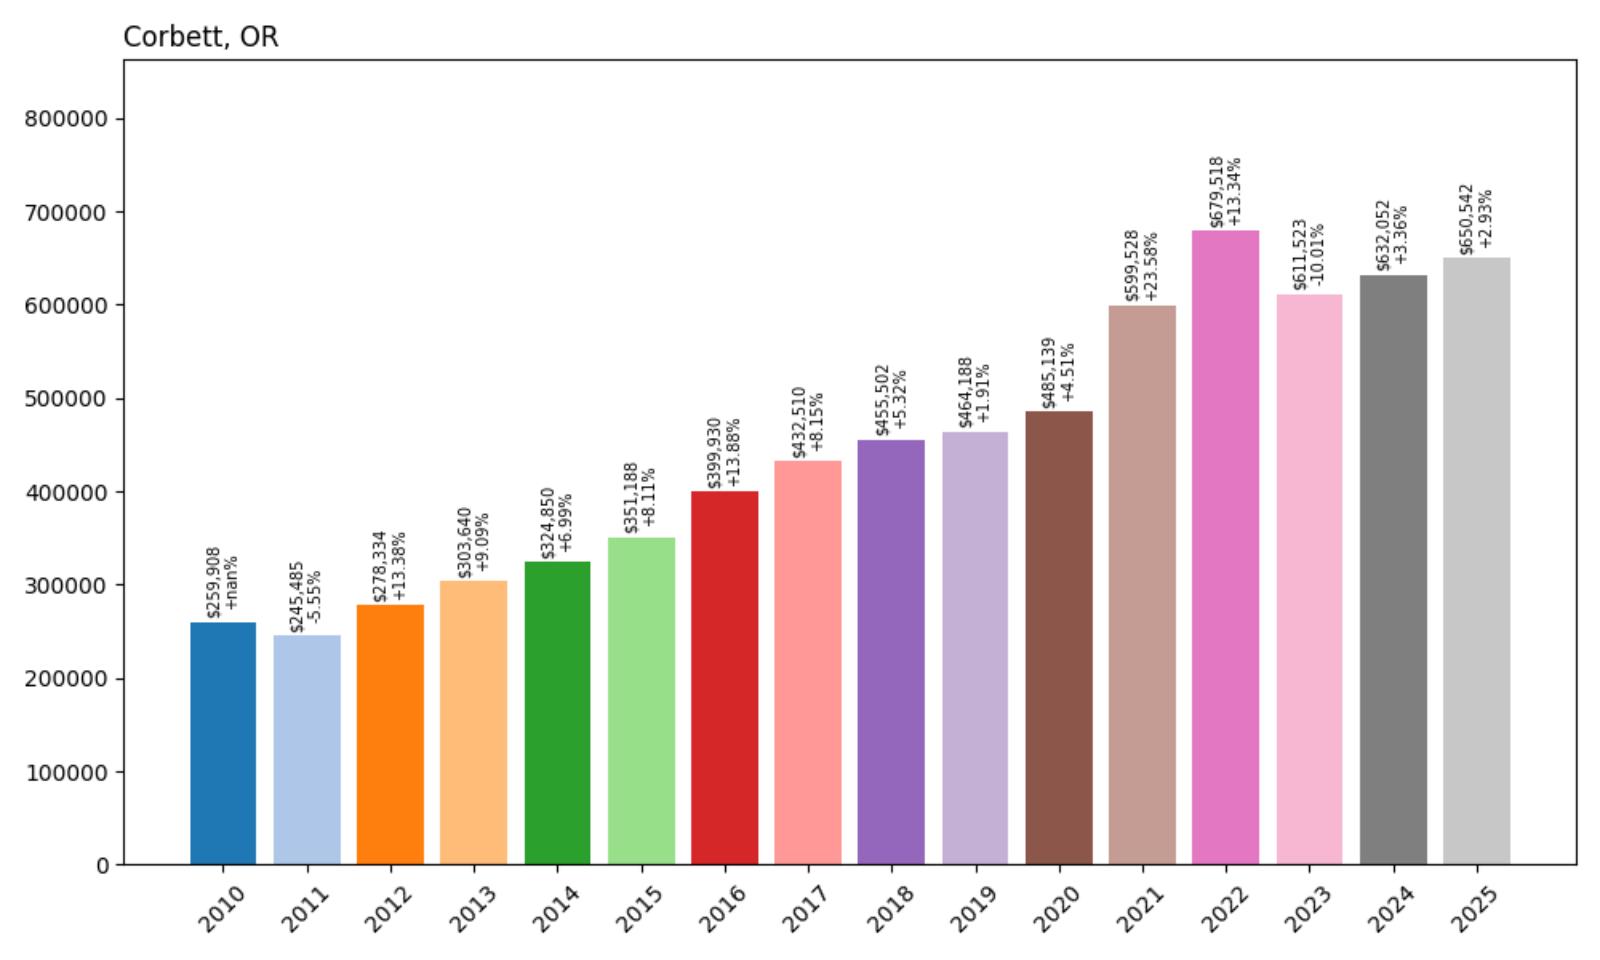
- 2010: $259,908
- 2011: $245,485 (−$14,422, −5.55% from previous year)
- 2012: $278,334 (+$32,849, +13.38% from previous year)
- 2013: $303,640 (+$25,306, +9.09% from previous year)
- 2014: $324,850 (+$21,210, +6.99% from previous year)
- 2015: $351,188 (+$26,337, +8.11% from previous year)
- 2016: $399,930 (+$48,742, +13.88% from previous year)
- 2017: $432,510 (+$32,580, +8.15% from previous year)
- 2018: $455,502 (+$22,993, +5.32% from previous year)
- 2019: $464,188 (+$8,686, +1.91% from previous year)
- 2020: $485,139 (+$20,951, +4.51% from previous year)
- 2021: $599,528 (+$114,389, +23.58% from previous year)
- 2022: $679,518 (+$79,990, +13.34% from previous year)
- 2023: $611,523 (−$67,995, −10.01% from previous year)
- 2024: $632,052 (+$20,529, +3.36% from previous year)
- 2025: $650,542 (+$18,490, +2.93% from previous year)
Corbett’s home values have jumped 133.8% since 2012, rising from $278,334 to $650,542 in 2025. This town experienced powerful growth during the 2015–2022 period, culminating in a peak in 2022. Though 2023 saw a sharp correction, prices have since recovered steadily. The long-term trajectory remains firmly upward, indicating that the dip may have been temporary.
Corbett – Scenic Bluffside Homes Near the Gorge
Would you like to save this?
Corbett is perched on the edge of the Columbia River Gorge, offering some of the most scenic vistas in Oregon. The town’s stunning location and secluded feel have made it popular with buyers who want space and privacy without straying too far from the Portland area. It’s just a short drive to Troutdale and I-84, making it surprisingly accessible despite its remote feel. These geographic advantages have supported a steep climb in home values over the last decade.
What sets Corbett apart is its unique mix of rustic charm and million-dollar views. The town is dotted with forested lots, hillside homes, and wide-open properties that cater to a specific kind of homeowner—someone willing to pay a premium for privacy and natural beauty. While 2023 brought a temporary drop in values, likely due to macroeconomic factors, the area bounced back quickly. With values now topping $650,000, Corbett’s market shows resilience rooted in scarcity and setting.
27. Wilsonville – 123.2% Home Price Increase Since 2012
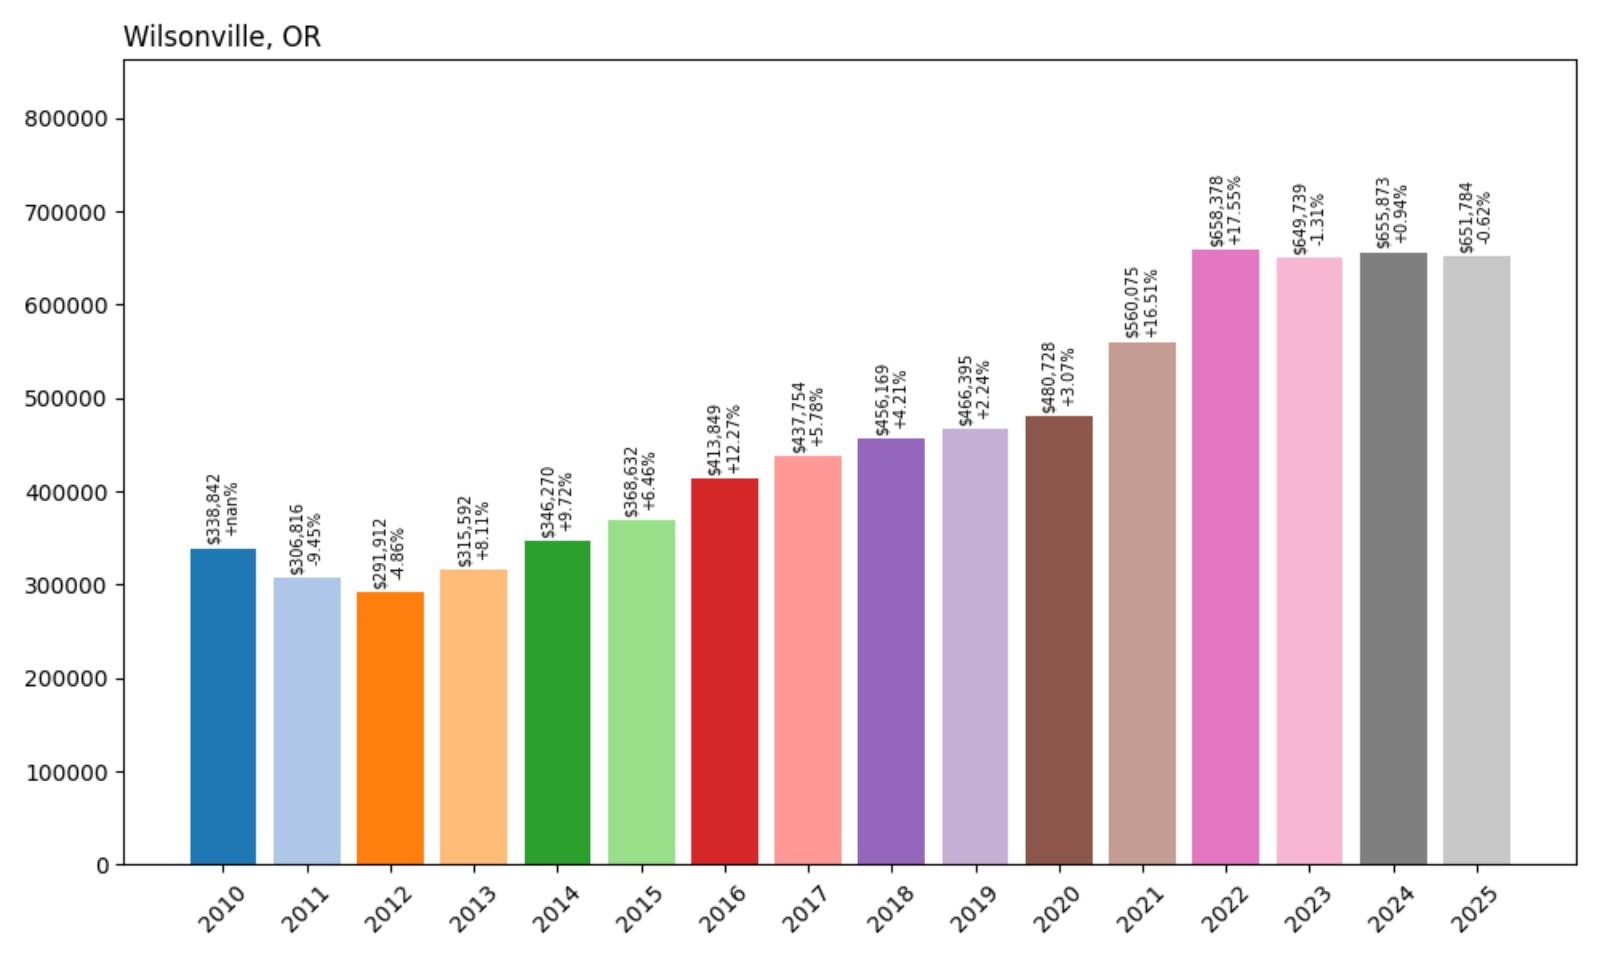
- 2010: $338,842
- 2011: $306,816 (−$32,027, −9.45% from previous year)
- 2012: $291,912 (−$14,904, −4.86% from previous year)
- 2013: $315,592 (+$23,680, +8.11% from previous year)
- 2014: $346,270 (+$30,678, +9.72% from previous year)
- 2015: $368,632 (+$22,362, +6.46% from previous year)
- 2016: $413,849 (+$45,218, +12.27% from previous year)
- 2017: $437,754 (+$23,904, +5.78% from previous year)
- 2018: $456,169 (+$18,416, +4.21% from previous year)
- 2019: $466,395 (+$10,226, +2.24% from previous year)
- 2020: $480,728 (+$14,332, +3.07% from previous year)
- 2021: $560,075 (+$79,348, +16.51% from previous year)
- 2022: $658,378 (+$98,302, +17.55% from previous year)
- 2023: $649,739 (−$8,639, −1.31% from previous year)
- 2024: $655,873 (+$6,134, +0.94% from previous year)
- 2025: $651,784 (−$4,089, −0.62% from previous year)
Wilsonville has seen home values climb by 123.2% since 2012, rising from $291,912 to $651,784 in 2025. That growth was especially strong during the mid-2010s and again during the pandemic housing surge of 2020 to 2022. Though prices dipped slightly in 2023 and again in 2025, the overall trend remains a steady upward climb, reflecting consistent demand in this growing Portland-area city.
Wilsonville – High-Tech Growth and Modern Suburban Appeal
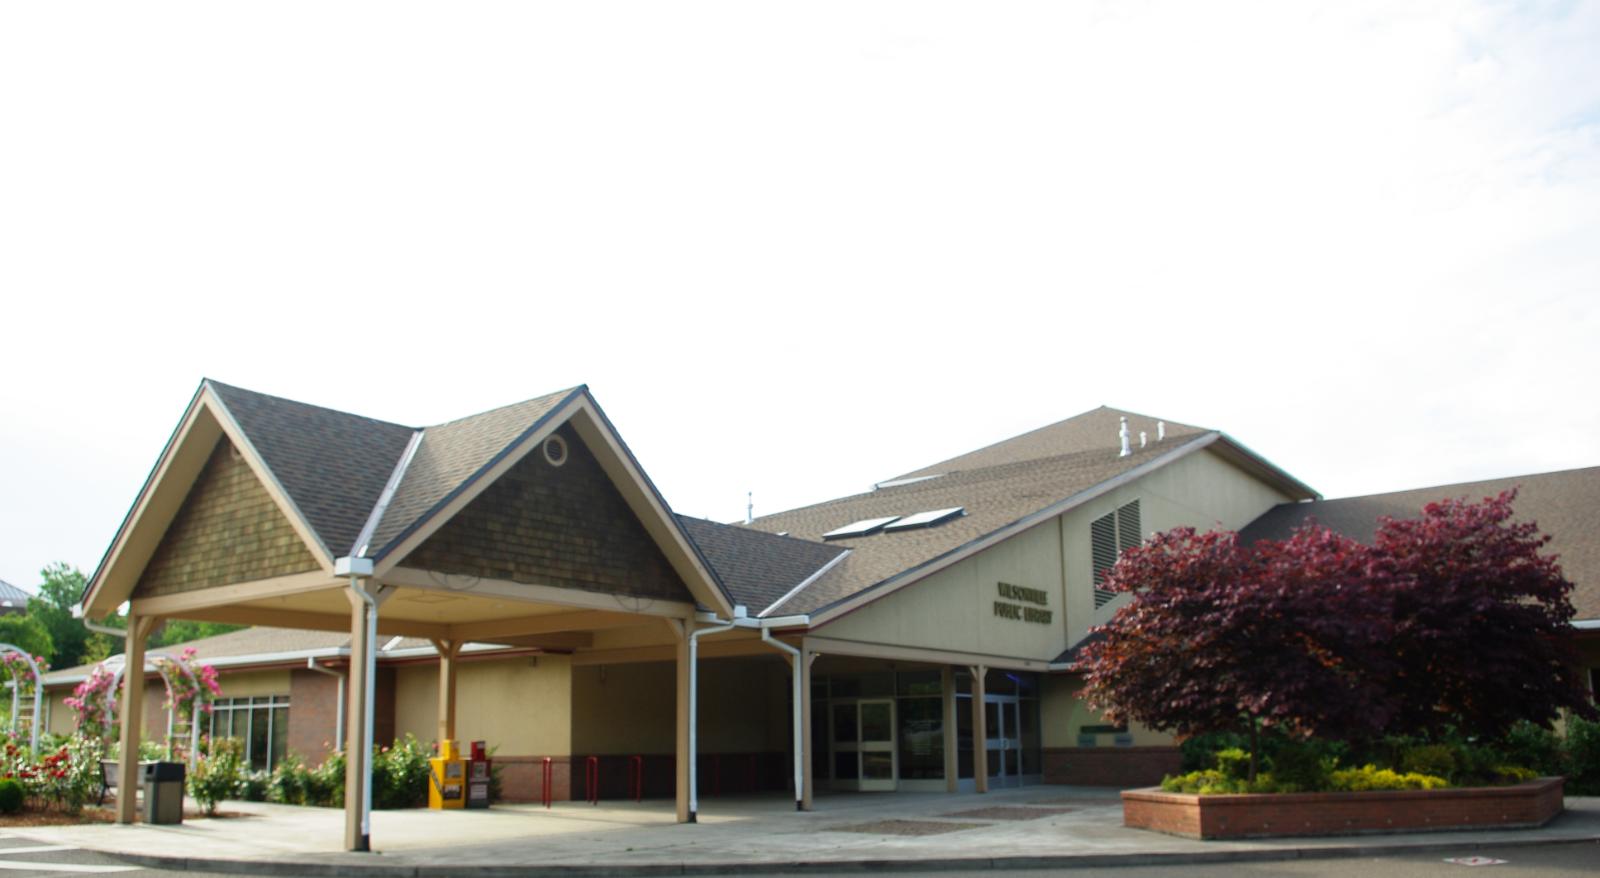
Wilsonville has evolved into a key suburban tech corridor just south of Portland, drawing residents with its master-planned communities, robust job market, and polished amenities. As the home of several tech and engineering firms, including Xerox and FLIR Systems, the town has long attracted professionals looking for an alternative to urban living. This combination of economic stability and livability has made Wilsonville a consistent climber in Oregon’s housing rankings.
Easy access to I-5, good schools, and modern residential development have helped the town maintain steady housing growth even during turbulent economic periods. The city’s investment in parks, public transportation, and smart zoning also played a role. Though prices peaked in 2022, Wilsonville’s slight price corrections in 2023 and 2025 appear mild compared to broader market fluctuations, and the current average of $651,784 still reflects strong long-term appreciation and buyer confidence in the area’s future.
26. Tualatin – 133.0% Home Price Increase Since 2012

- 2010: $316,055
- 2011: $285,334 (−$30,721, −9.72% from previous year)
- 2012: $280,646 (−$4,689, −1.64% from previous year)
- 2013: $312,301 (+$31,656, +11.28% from previous year)
- 2014: $340,545 (+$28,243, +9.04% from previous year)
- 2015: $367,008 (+$26,463, +7.77% from previous year)
- 2016: $413,060 (+$46,052, +12.55% from previous year)
- 2017: $444,095 (+$31,035, +7.51% from previous year)
- 2018: $466,969 (+$22,874, +5.15% from previous year)
- 2019: $478,664 (+$11,695, +2.50% from previous year)
- 2020: $496,364 (+$17,700, +3.70% from previous year)
- 2021: $582,141 (+$85,777, +17.28% from previous year)
- 2022: $690,594 (+$108,453, +18.63% from previous year)
- 2023: $655,588 (−$35,005, −5.07% from previous year)
- 2024: $659,651 (+$4,062, +0.62% from previous year)
- 2025: $653,944 (−$5,707, −0.87% from previous year)
Since 2012, Tualatin’s home prices have increased by 133%, from $280,646 to $653,944. The town saw major gains between 2013 and 2022, with particularly strong growth during the post-pandemic boom. Despite slight pullbacks in recent years, the market remains elevated, and home prices continue to trend above the state average for mid-sized suburban areas.
Tualatin – Well-Planned Suburb with Steady Demand
Tualatin is a family-oriented suburb located in the Tualatin Valley, nestled between Tigard and Wilsonville. Known for its strong public schools and commercial centers like Bridgeport Village, the town has long been a reliable choice for buyers seeking a mix of comfort and convenience. Major employers in the area, along with its proximity to I-5 and I-205, help drive consistent demand for housing. These factors are clearly reflected in the town’s housing appreciation over the last decade.
The price surge through the 2010s and early 2020s was likely driven by Tualatin’s strong fundamentals. It didn’t see the same speculative spikes as some other Oregon towns, and its small price drops in 2023 and 2025 seem more like normal market corrections than red flags. Today, with home values approaching $654,000, the town remains one of the more expensive and desirable Portland suburbs, especially for buyers looking for quality schools and stable investment potential.
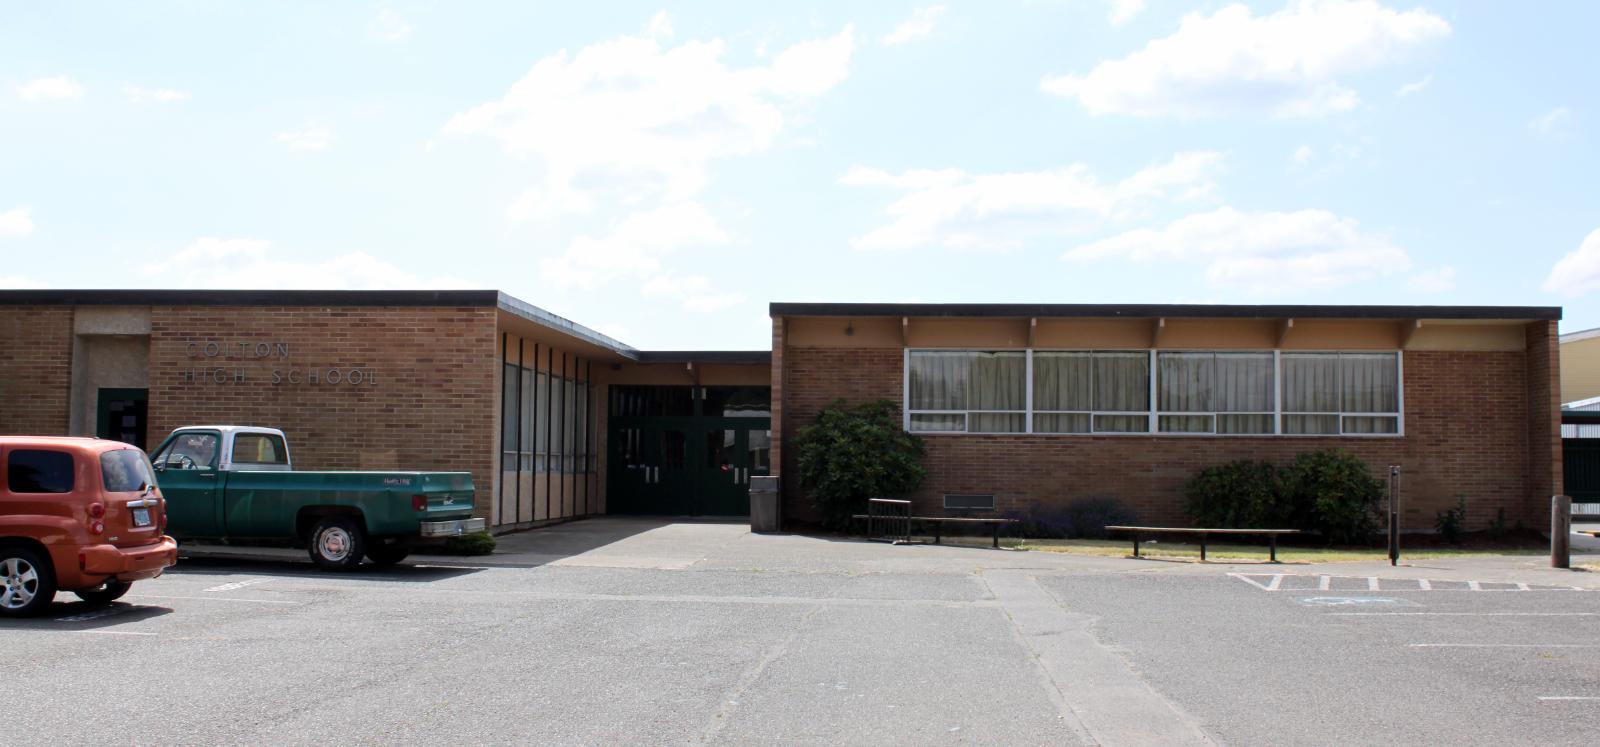
25. Colton – 167.7% Home Price Increase Since 2012
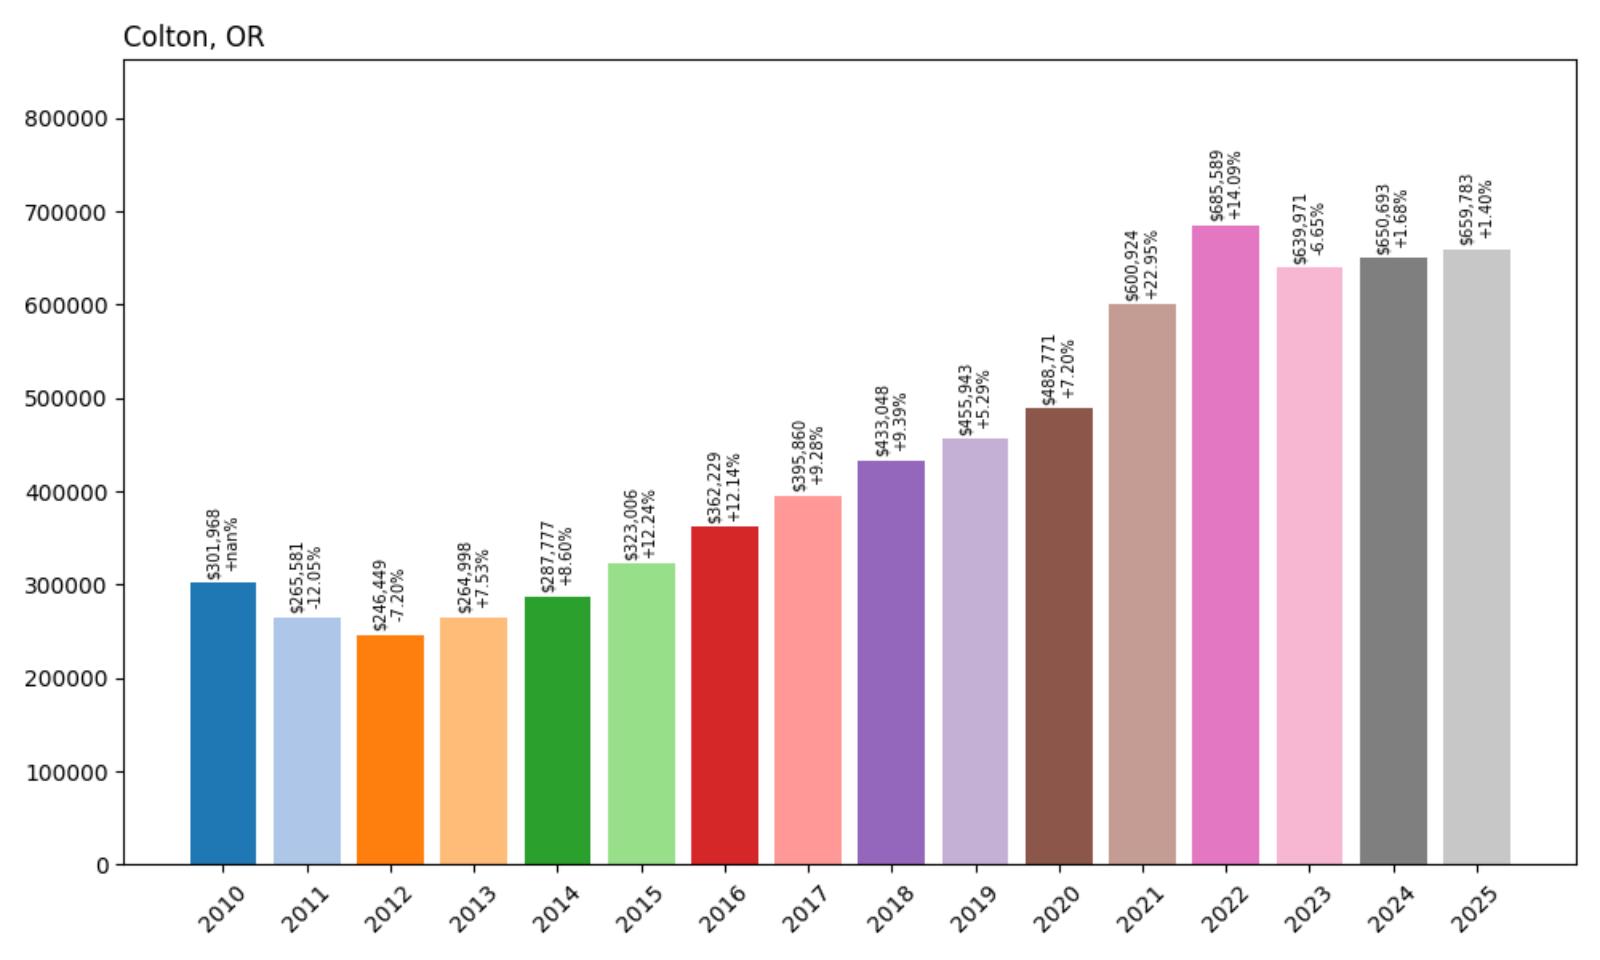
- 2010: $301,968
- 2011: $265,581 (−$36,387, −12.05% from previous year)
- 2012: $246,449 (−$19,132, −7.20% from previous year)
- 2013: $264,998 (+$18,549, +7.53% from previous year)
- 2014: $287,777 (+$22,779, +8.60% from previous year)
- 2015: $323,006 (+$35,229, +12.24% from previous year)
- 2016: $362,229 (+$39,223, +12.14% from previous year)
- 2017: $395,860 (+$33,631, +9.28% from previous year)
- 2018: $433,048 (+$37,188, +9.39% from previous year)
- 2019: $455,943 (+$22,895, +5.29% from previous year)
- 2020: $488,771 (+$32,828, +7.20% from previous year)
- 2021: $600,924 (+$112,153, +22.95% from previous year)
- 2022: $685,589 (+$84,665, +14.09% from previous year)
- 2023: $639,971 (−$45,617, −6.65% from previous year)
- 2024: $650,693 (+$10,722, +1.68% from previous year)
- 2025: $659,783 (+$9,090, +1.40% from previous year)
Colton’s housing market has experienced a remarkable 167.7% increase since 2012, with prices rising from $246,449 to $659,783 by 2025. Much of this growth took place steadily across the 2010s, with acceleration during the post-pandemic housing boom. Despite a dip in 2023, the town quickly rebounded, and prices continued to rise slightly through 2025, suggesting ongoing resilience.
Colton – Rural Space and Price Stability
Colton is a quiet, unincorporated community in Clackamas County, about 45 minutes southeast of Portland. What it lacks in density, it makes up for with spacious lots, forested surroundings, and a peaceful rural setting. Many buyers are drawn here for the tranquility and the chance to own more land. That lifestyle, combined with regional price pressures, has steadily pushed Colton’s home values upward over the last decade.
During the pandemic, demand for homes in less crowded, more open areas skyrocketed—and Colton was no exception. From 2020 to 2022, the town experienced double-digit annual increases, peaking in 2022 before a modest correction in 2023. Still, prices in 2025 remain well above pre-pandemic levels. As remote work continues and buyers expand their search beyond traditional suburbs, Colton offers a compelling value with long-term potential.
24. Pleasant Hill – 147.9% Home Price Increase Since 2012
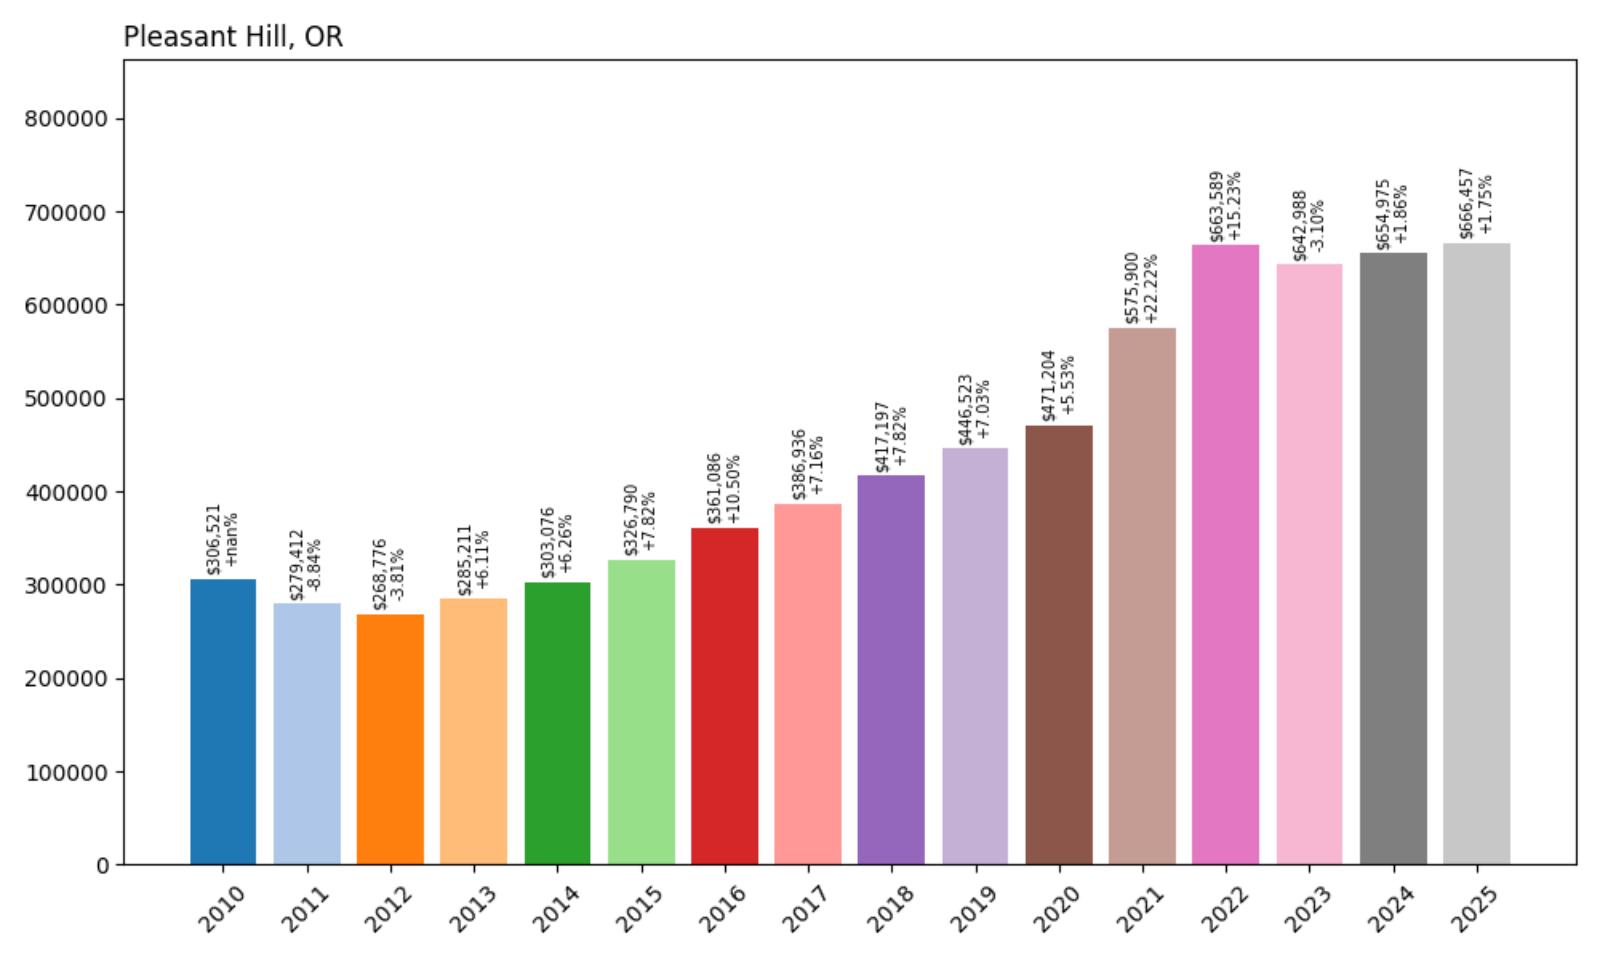
- 2010: $306,521
- 2011: $279,412 (−$27,110, −8.84% from previous year)
- 2012: $268,776 (−$10,635, −3.81% from previous year)
- 2013: $285,211 (+$16,435, +6.11% from previous year)
- 2014: $303,076 (+$17,865, +6.26% from previous year)
- 2015: $326,790 (+$23,713, +7.82% from previous year)
- 2016: $361,086 (+$34,297, +10.50% from previous year)
- 2017: $386,936 (+$25,850, +7.16% from previous year)
- 2018: $417,197 (+$30,261, +7.82% from previous year)
- 2019: $446,523 (+$29,326, +7.03% from previous year)
- 2020: $471,204 (+$24,681, +5.53% from previous year)
- 2021: $575,900 (+$104,696, +22.22% from previous year)
- 2022: $663,589 (+$87,690, +15.23% from previous year)
- 2023: $642,988 (−$20,602, −3.10% from previous year)
- 2024: $654,975 (+$11,987, +1.86% from previous year)
- 2025: $666,457 (+$11,482, +1.75% from previous year)
Since 2012, Pleasant Hill’s home values have risen 147.9%, from $268,776 to $666,457. Strong yearly gains during the 2010s built a solid foundation, and the town saw especially rapid appreciation from 2020 through 2022. Prices softened a bit in 2023, but the recovery in 2024 and 2025 shows the area’s appeal is holding strong.
Pleasant Hill – A Rural-Suburban Hybrid Near Eugene
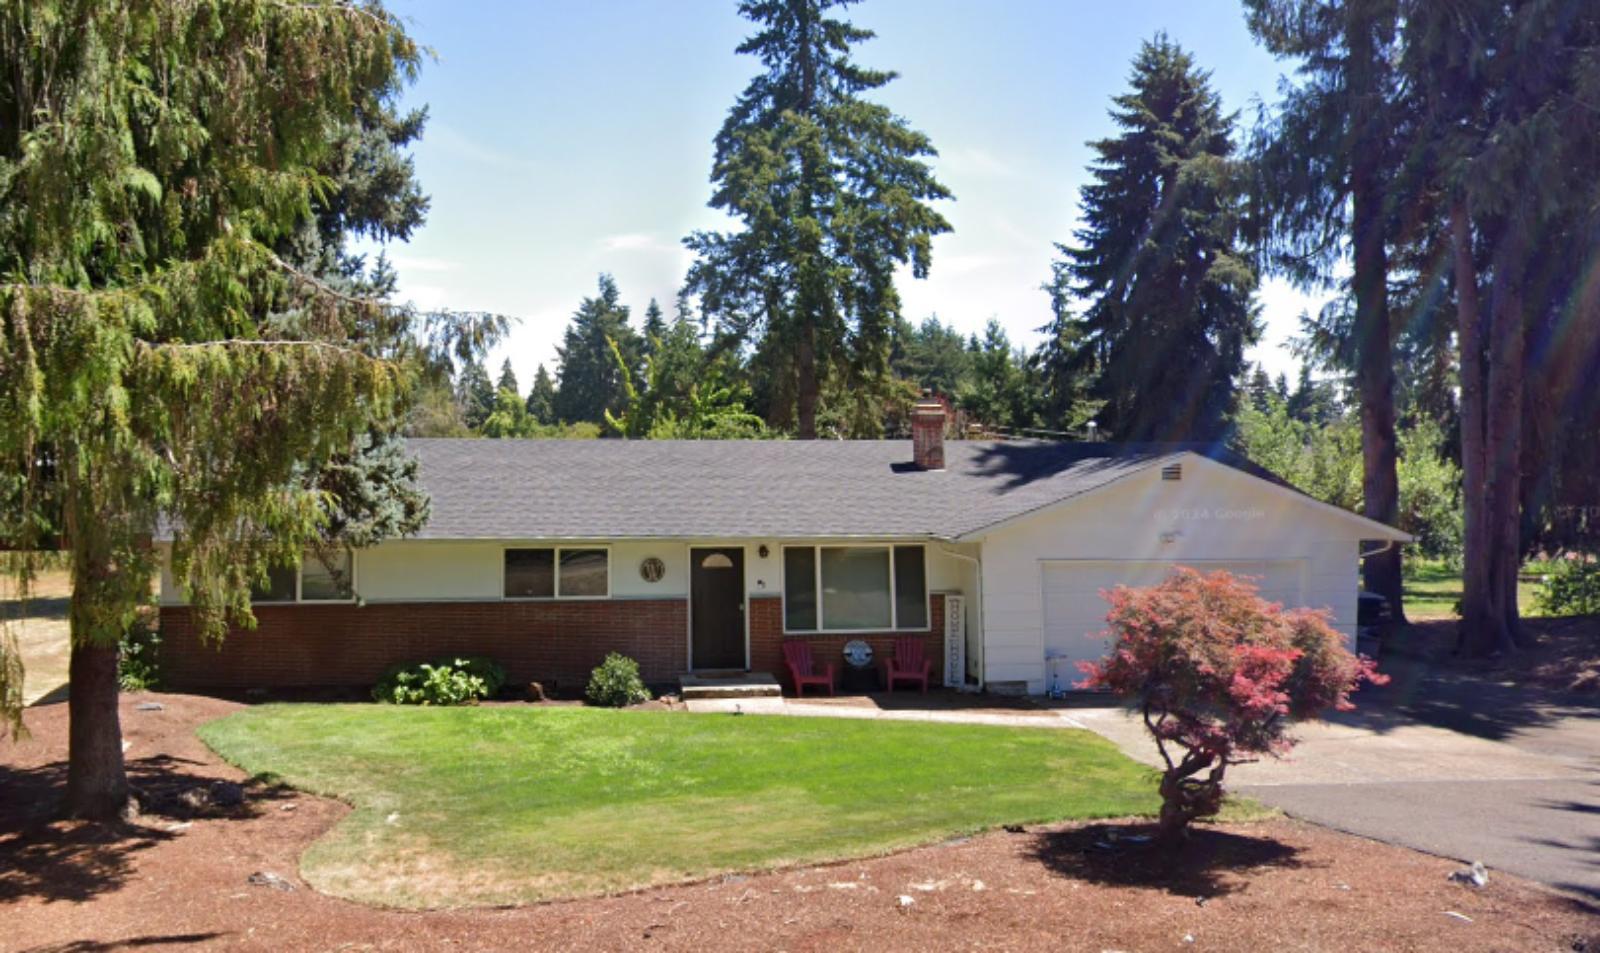
Situated just southeast of Eugene, Pleasant Hill offers a quiet, semi-rural lifestyle with convenient access to a major city. This blend appeals to buyers seeking elbow room and privacy while still being within a reasonable drive of urban amenities. The area is known for its school district, rolling farmland, and a growing number of upscale homes that cater to professionals and retirees alike.
Pleasant Hill’s housing market has reflected its desirability with consistent price appreciation. Even during periods of broader market correction, the town’s values remained relatively stable. The 2020–2022 boom pushed prices higher than ever, but the gradual corrections since then have been modest. With current prices approaching $667,000, Pleasant Hill continues to be a high-demand option for buyers prioritizing space, peace, and proximity to Eugene.
23. Eagle Creek – 158.7% Home Price Increase Since 2012
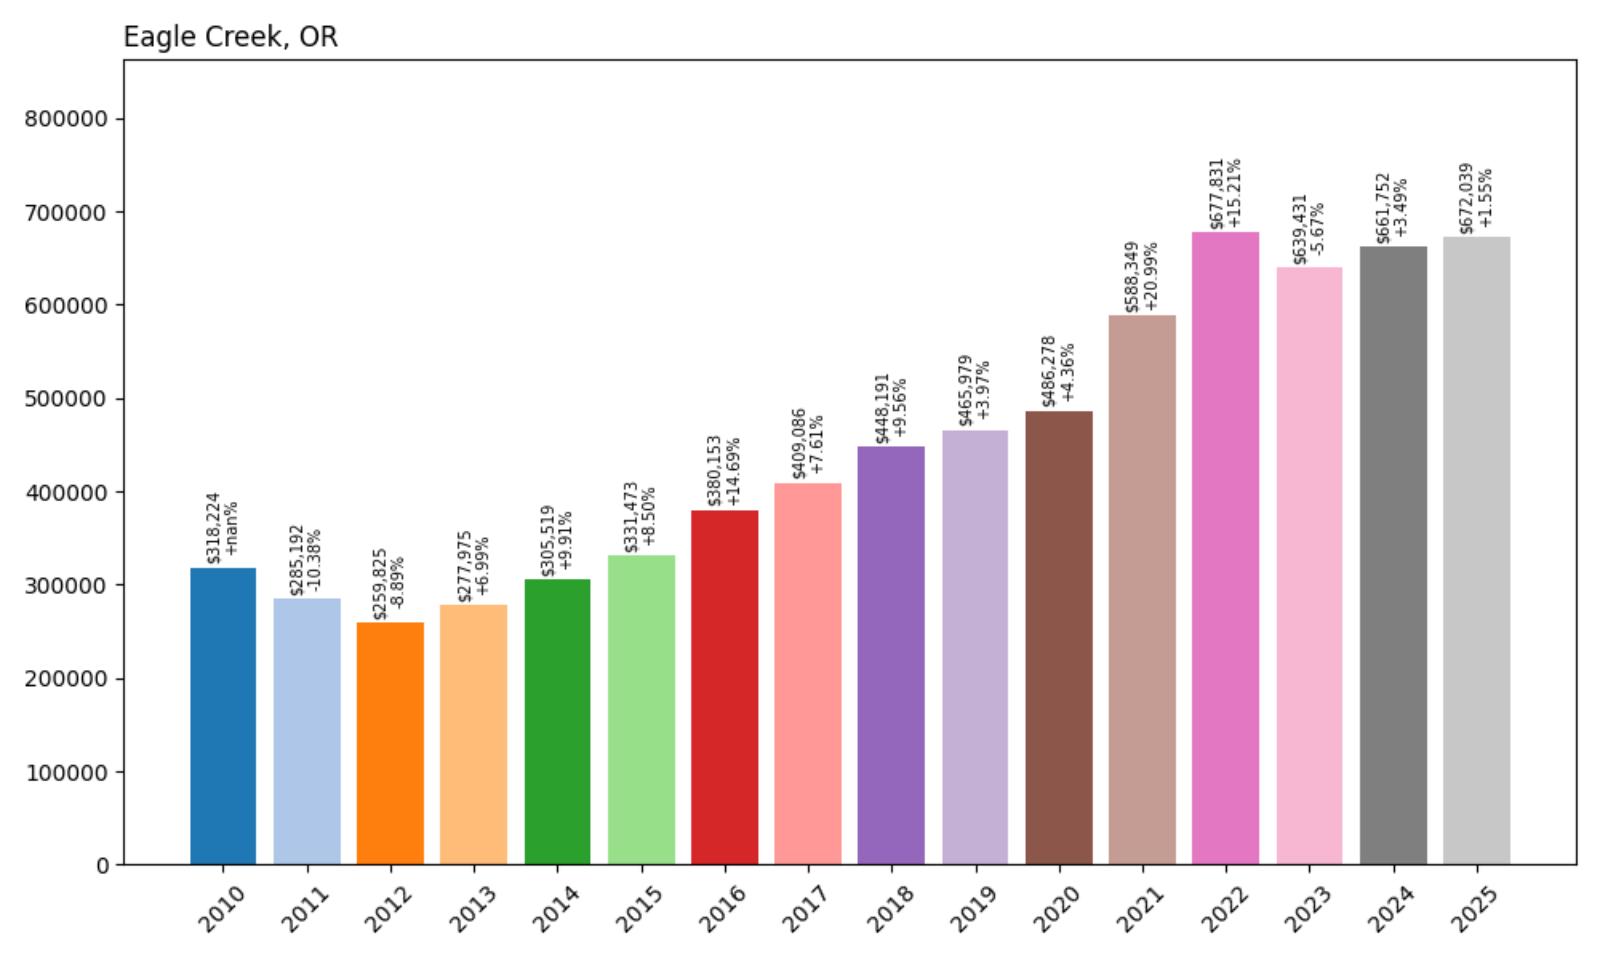
- 2010: $318,224
- 2011: $285,192 (−$33,032, −10.38% from previous year)
- 2012: $259,825 (−$25,367, −8.89% from previous year)
- 2013: $277,975 (+$18,150, +6.99% from previous year)
- 2014: $305,519 (+$27,544, +9.91% from previous year)
- 2015: $331,473 (+$25,954, +8.50% from previous year)
- 2016: $380,153 (+$48,681, +14.69% from previous year)
- 2017: $409,086 (+$28,933, +7.61% from previous year)
- 2018: $448,191 (+$39,105, +9.56% from previous year)
- 2019: $465,979 (+$17,788, +3.97% from previous year)
- 2020: $486,278 (+$20,298, +4.36% from previous year)
- 2021: $588,349 (+$102,071, +20.99% from previous year)
- 2022: $677,831 (+$89,482, +15.21% from previous year)
- 2023: $639,431 (−$38,399, −5.67% from previous year)
- 2024: $661,752 (+$22,321, +3.49% from previous year)
- 2025: $672,039 (+$10,286, +1.55% from previous year)
Home prices in Eagle Creek have soared 158.7% since 2012, increasing from $259,825 to $672,039. The biggest growth happened between 2015 and 2022, with several years of double-digit gains. Though prices dropped in 2023, they’ve since recovered, and values continue to hover in the mid-$600Ks.
Eagle Creek – Forested Acreage and Open-Space Living
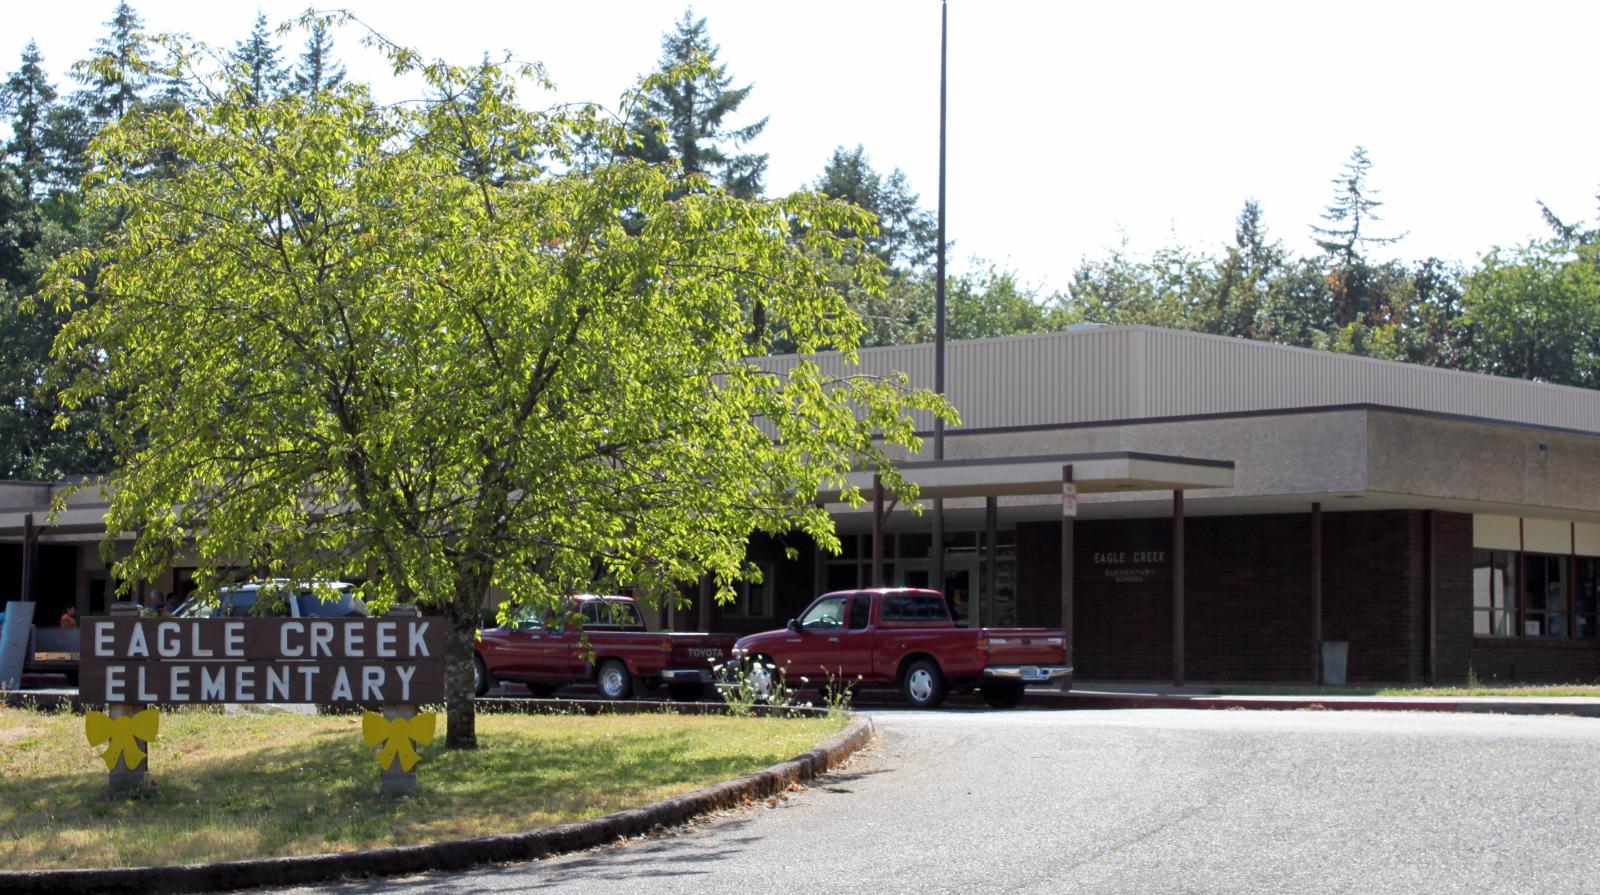
Eagle Creek sits in a forested pocket of Clackamas County and is known for large lots, rural charm, and access to outdoor recreation. The town is a popular choice for buyers looking to escape the city without moving too far. While it’s still largely undeveloped compared to neighboring towns, the lack of density is exactly what attracts many of its residents.
Growth in Eagle Creek has been largely organic, fueled by word of mouth and regional demand. The area saw one of its strongest years in 2021, jumping by more than $100,000 in just 12 months. With a relatively small housing stock, even modest demand can drive prices upward. Today’s values reflect a high level of interest in Oregon’s countryside communities that offer privacy and greenery without the inconvenience of extreme remoteness.
22. Damascus – 141.0% Home Price Increase Since 2012
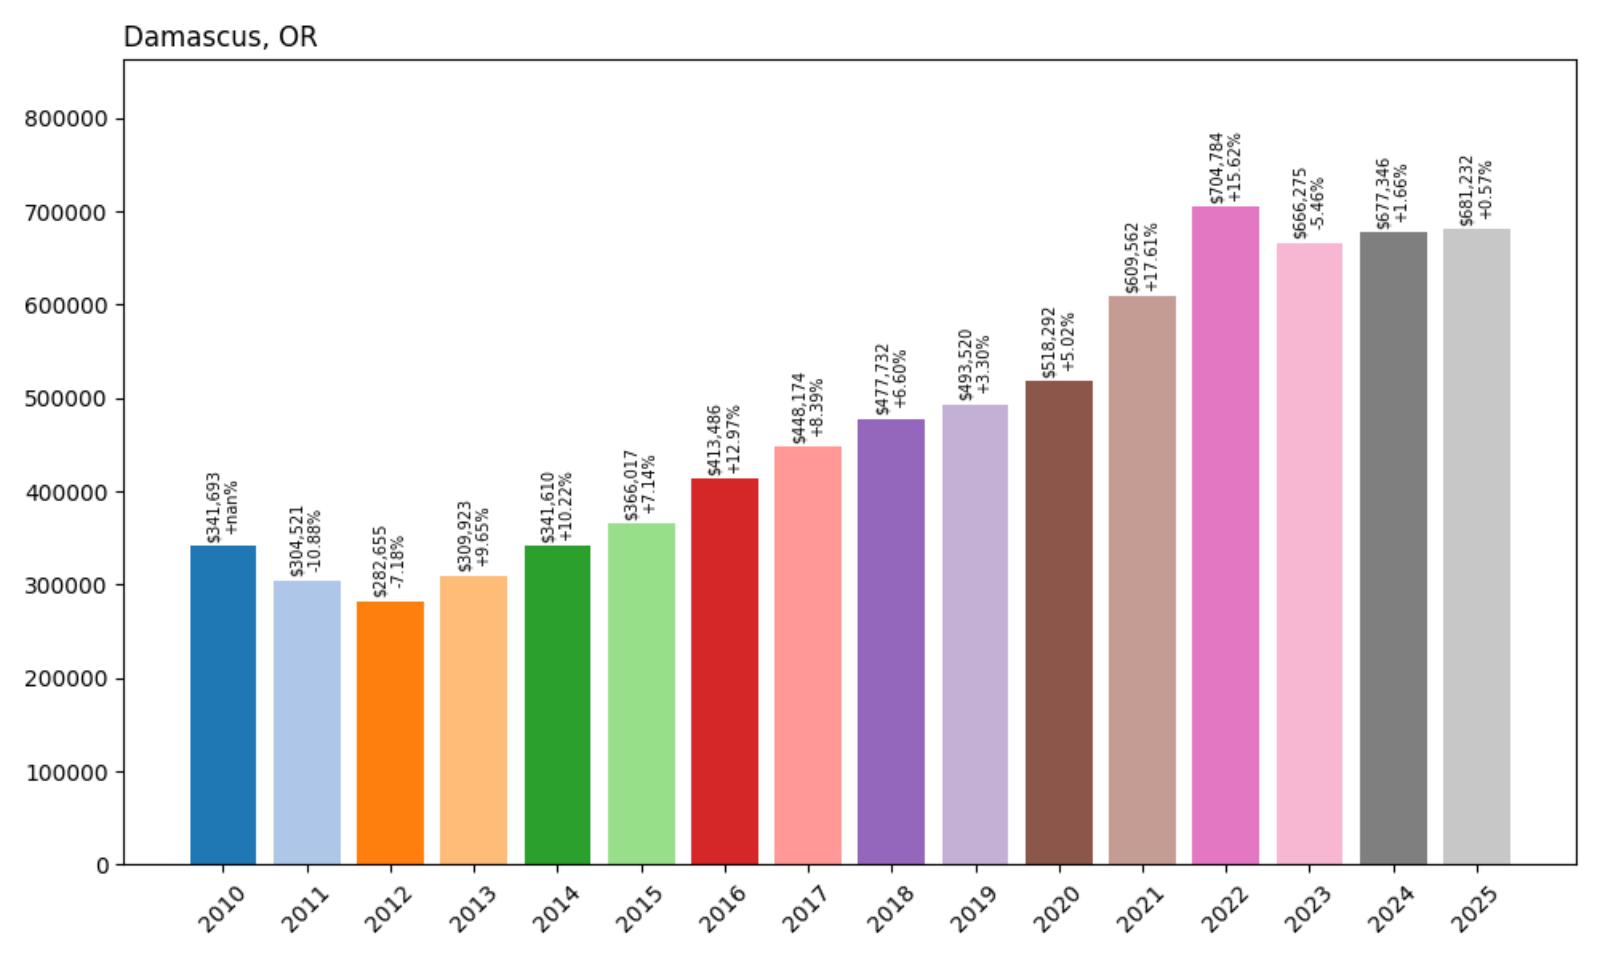
- 2010: $341,693
- 2011: $304,521 (−$37,171, −10.88% from previous year)
- 2012: $282,655 (−$21,866, −7.18% from previous year)
- 2013: $309,923 (+$27,268, +9.65% from previous year)
- 2014: $341,610 (+$31,687, +10.22% from previous year)
- 2015: $366,017 (+$24,407, +7.14% from previous year)
- 2016: $413,486 (+$47,469, +12.97% from previous year)
- 2017: $448,174 (+$34,687, +8.39% from previous year)
- 2018: $477,732 (+$29,558, +6.60% from previous year)
- 2019: $493,520 (+$15,788, +3.30% from previous year)
- 2020: $518,292 (+$24,772, +5.02% from previous year)
- 2021: $609,562 (+$91,270, +17.61% from previous year)
- 2022: $704,784 (+$95,222, +15.62% from previous year)
- 2023: $666,275 (−$38,509, −5.46% from previous year)
- 2024: $677,346 (+$11,071, +1.66% from previous year)
- 2025: $681,232 (+$3,886, +0.57% from previous year)
Home values in Damascus have climbed from $282,655 in 2012 to $681,232 in 2025—a 141% increase. The market saw steady appreciation throughout the 2010s, followed by a surge in 2021 and 2022. While prices dipped slightly in 2023, they have since stabilized and remain at some of the highest levels ever recorded for the area. This long-term trajectory points to growing buyer demand and sustained interest in this eastern Portland suburb.
Damascus – A Growing Suburb With Room to Expand
Damascus is a semi-rural community located southeast of Portland, straddling the line between the city’s urban fringe and the forested hills of Clackamas County. For years, it was best known for its battles over incorporation and land use planning—but despite the political back-and-forth, the housing market here has consistently gained ground. Much of this growth stems from the town’s proximity to rapidly expanding neighbors like Happy Valley and Gresham, which have funneled buyer interest into surrounding areas with available land and slightly lower prices per square foot.
With open space, newer developments, and improving infrastructure, Damascus has become increasingly attractive to families looking for more space without venturing too far from the metro area. Home prices spiked sharply in 2021 and 2022 as remote workers and suburban movers flooded into the market, pushing average values above $700,000. Although prices dipped in 2023, they quickly rebounded and have hovered in the high $600,000s since. The upward pressure on values reflects not only proximity to Portland, but also the ongoing appeal of homes with larger lots and access to nature—a trend that continues to shape housing preferences across Oregon.
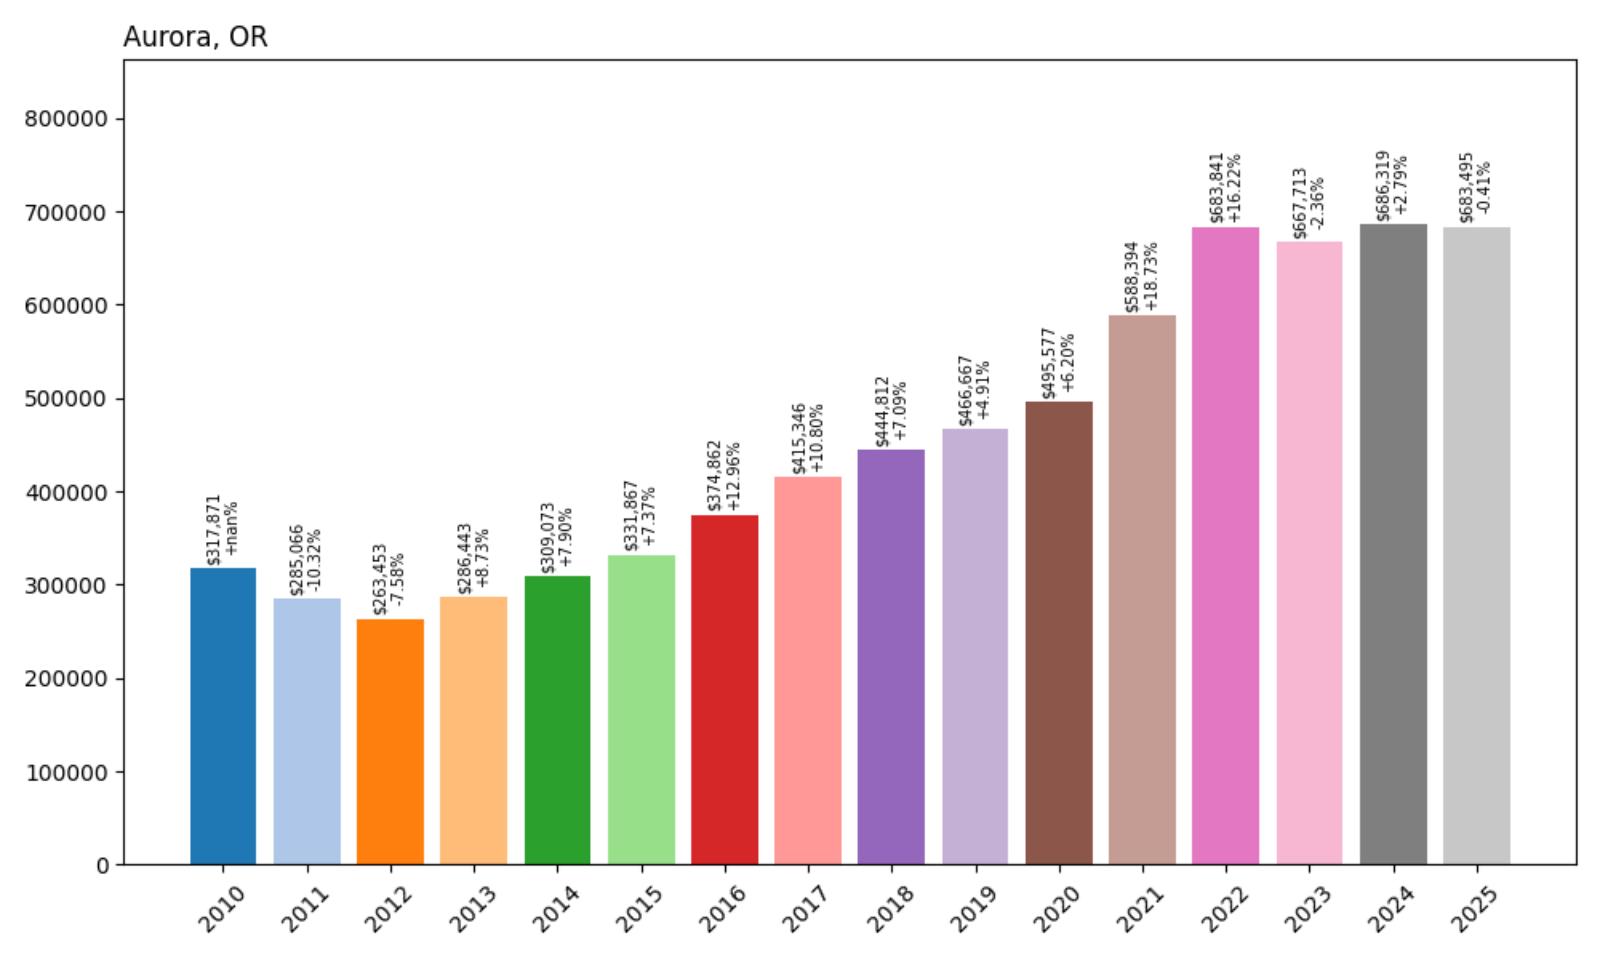
21. Aurora – 159.4% Home Price Increase Since 2012
Would you like to save this?
- 2010: $317,871
- 2011: $285,066 (−$32,805, −10.32% from previous year)
- 2012: $263,453 (−$21,613, −7.58% from previous year)
- 2013: $286,443 (+$22,990, +8.73% from previous year)
- 2014: $309,073 (+$22,630, +7.90% from previous year)
- 2015: $331,867 (+$22,794, +7.37% from previous year)
- 2016: $374,862 (+$42,996, +12.96% from previous year)
- 2017: $415,346 (+$40,483, +10.80% from previous year)
- 2018: $444,812 (+$29,467, +7.09% from previous year)
- 2019: $466,667 (+$21,855, +4.91% from previous year)
- 2020: $495,577 (+$28,910, +6.20% from previous year)
- 2021: $588,394 (+$92,817, +18.73% from previous year)
- 2022: $683,841 (+$95,446, +16.22% from previous year)
- 2023: $667,713 (−$16,128, −2.36% from previous year)
- 2024: $686,319 (+$18,606, +2.79% from previous year)
- 2025: $683,495 (−$2,824, −0.41% from previous year)
Aurora’s home prices have grown by 159.4% since 2012, jumping from $263,453 to $683,495 in 2025. The steady rise over the last decade has been punctuated by major spikes from 2020 to 2022. Even with minor pullbacks in recent years, the market remains elevated, supported by strong fundamentals and consistent buyer interest.
Aurora – Historic Charm Meets Steady Growth
Located in Marion County just north of Salem, Aurora is a small town with a big reputation for its antique stores and preserved 19th-century buildings. Its charm, combined with easy access to both Portland and the Willamette Valley, has made it increasingly attractive to homeowners. Aurora offers a rare mix of rural ambiance and regional connectivity, and that unique positioning has pushed up property values consistently over time.
In recent years, Aurora has benefited from spillover demand as nearby areas have grown more crowded and expensive. The town’s appeal lies in its sense of place—walkable streets, preserved architecture, and a slower pace of life—all of which continue to drive real estate interest. While 2023 and 2025 saw small dips in average values, the overall price level remains high, and the long-term outlook for Aurora is one of stability and modest continued growth.
20. Gaston – 167.1% Home Price Increase Since 2012
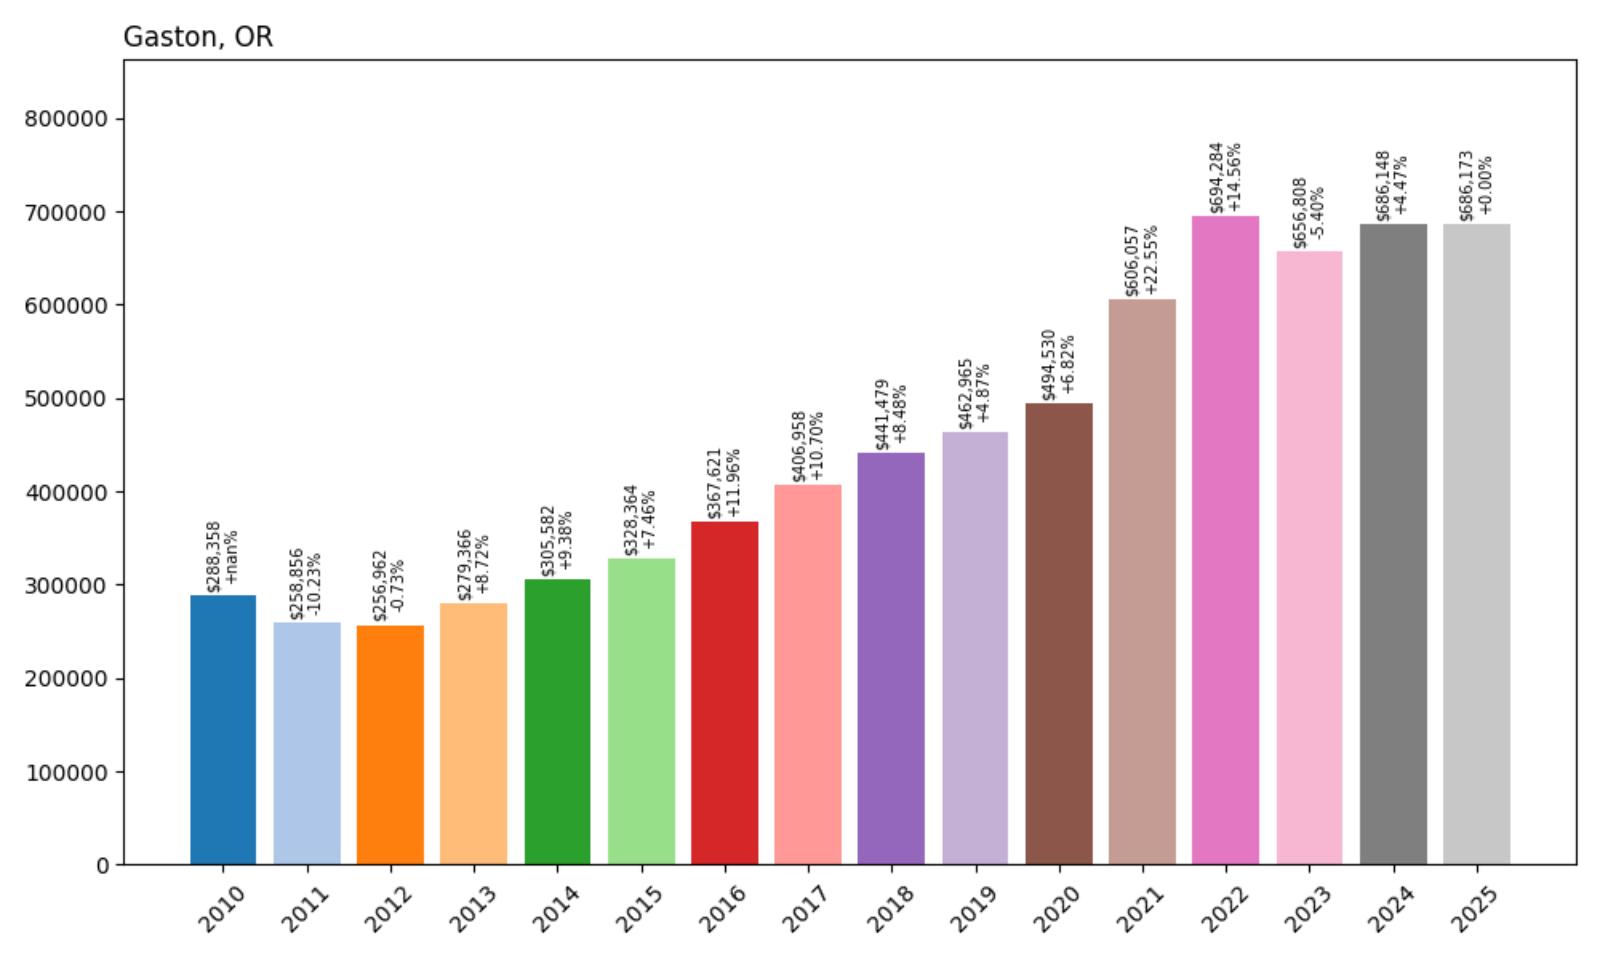
- 2010: $288,358
- 2011: $258,856 (−$29,502, −10.23% from previous year)
- 2012: $256,962 (−$1,893, −0.73% from previous year)
- 2013: $279,366 (+$22,403, +8.72% from previous year)
- 2014: $305,582 (+$26,216, +9.38% from previous year)
- 2015: $328,364 (+$22,782, +7.46% from previous year)
- 2016: $367,621 (+$39,257, +11.96% from previous year)
- 2017: $406,958 (+$39,338, +10.70% from previous year)
- 2018: $441,479 (+$34,520, +8.48% from previous year)
- 2019: $462,965 (+$21,486, +4.87% from previous year)
- 2020: $494,530 (+$31,566, +6.82% from previous year)
- 2021: $606,057 (+$111,527, +22.55% from previous year)
- 2022: $694,284 (+$88,228, +14.56% from previous year)
- 2023: $656,808 (−$37,476, −5.40% from previous year)
- 2024: $686,148 (+$29,340, +4.47% from previous year)
- 2025: $686,173 (+$25, +0.00% from previous year)
Home prices in Gaston have surged by 167.1% since 2012, climbing from $256,962 to $686,173. The town saw rapid gains between 2015 and 2022, and while 2023 saw a dip, values quickly rebounded and stabilized by 2025. The data reflects strong, long-term growth with minimal volatility in recent years.
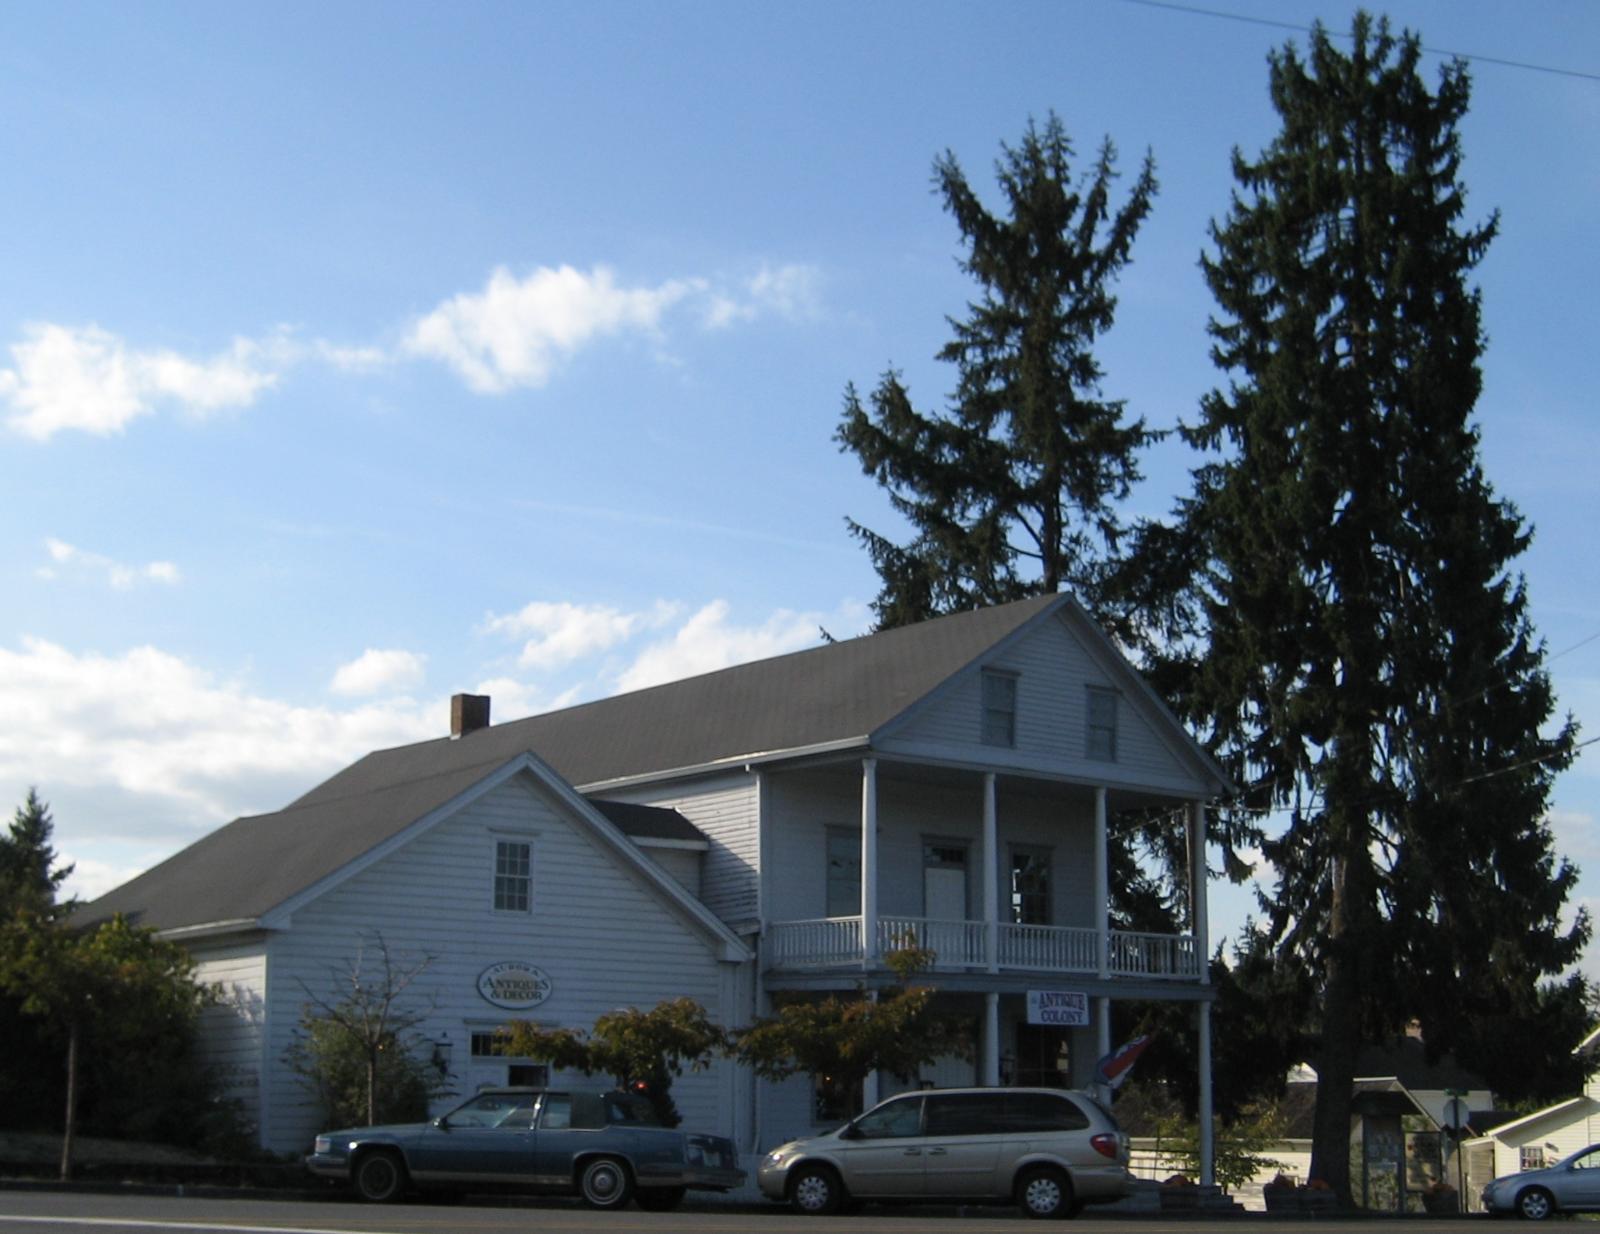
Gaston – Wine Country Living with Strong Appeal
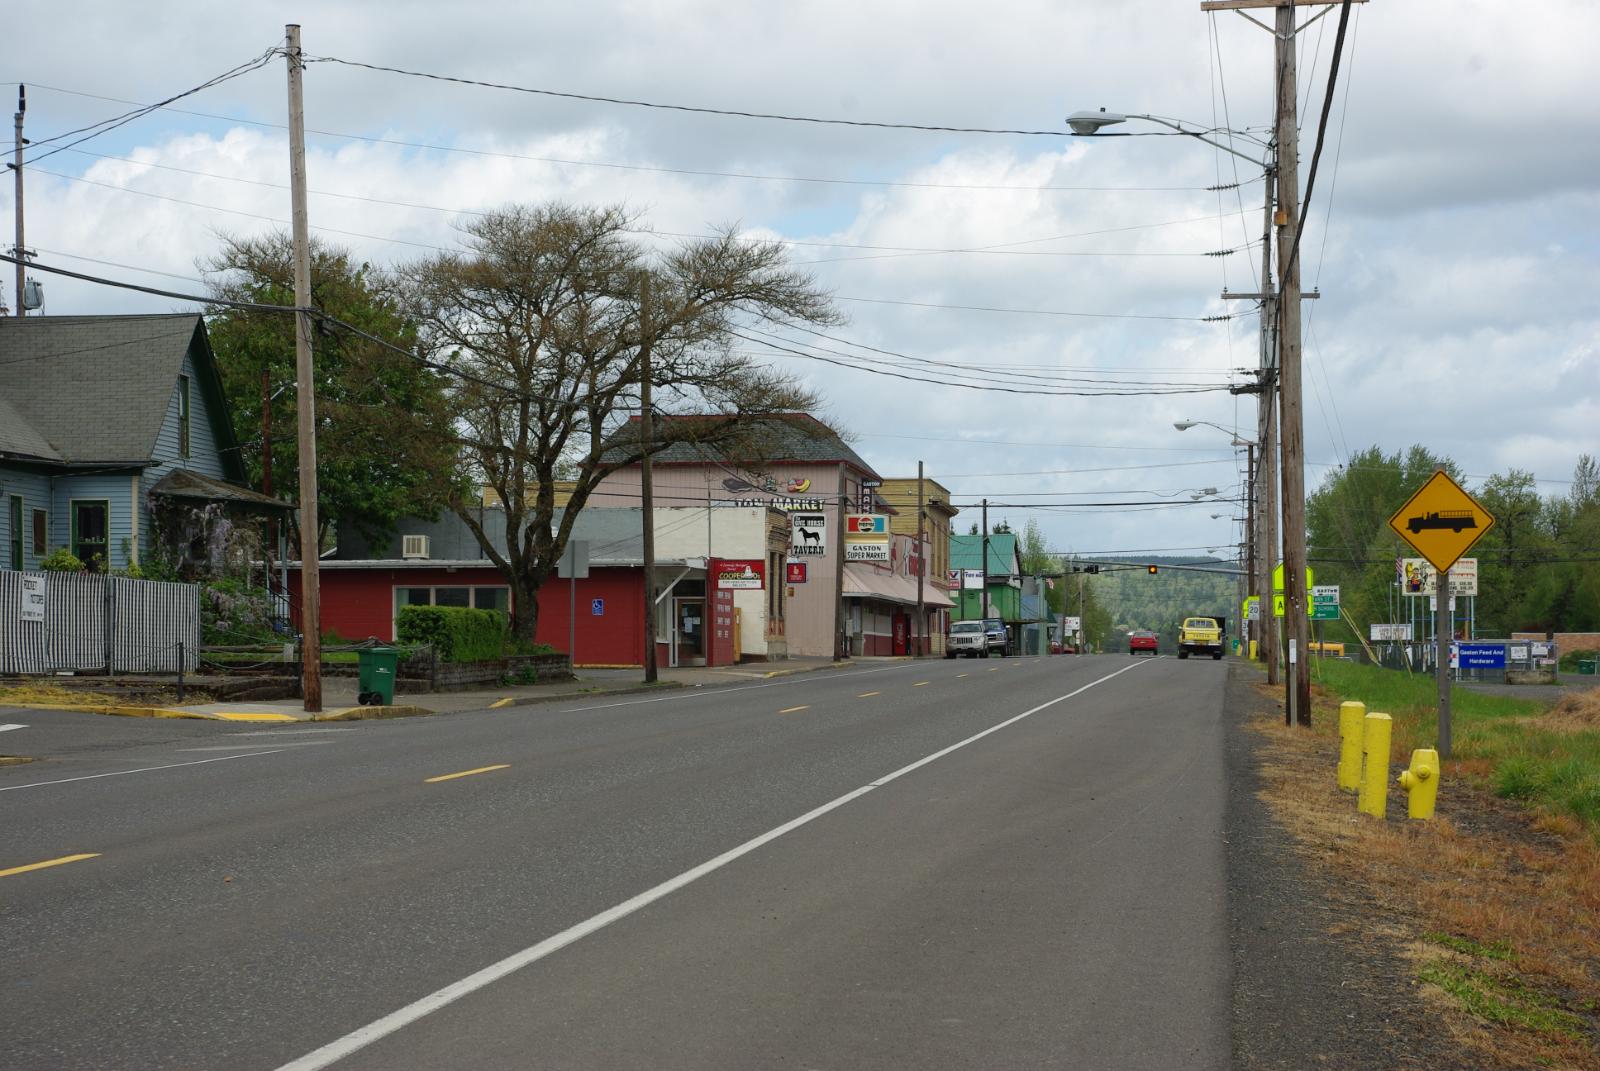
Gaston is nestled in the northern Willamette Valley, surrounded by vineyards, rolling farmland, and scenic views. This rural town offers a peaceful lifestyle within reach of the Portland metro area. As interest in Oregon wine country has grown, so too has Gaston’s profile among buyers looking for charm, space, and long-term investment potential. The town has increasingly appealed to telecommuters and retirees seeking quieter living without being completely off the grid.
Much of Gaston’s housing growth has been tied to lifestyle-driven migration and proximity to Hillsboro’s expanding tech sector. As employers have embraced hybrid work models, buyers are more willing to live further out—and Gaston’s value has soared in response. Its modest population and limited housing supply help maintain pressure on prices. With home values near $686,000 in 2025, the town is no longer a hidden bargain, but it still offers one of the most desirable rural-suburban balances in northwest Oregon.
19. Mount Hood Parkdale – 125.3% Home Price Increase Since 2012
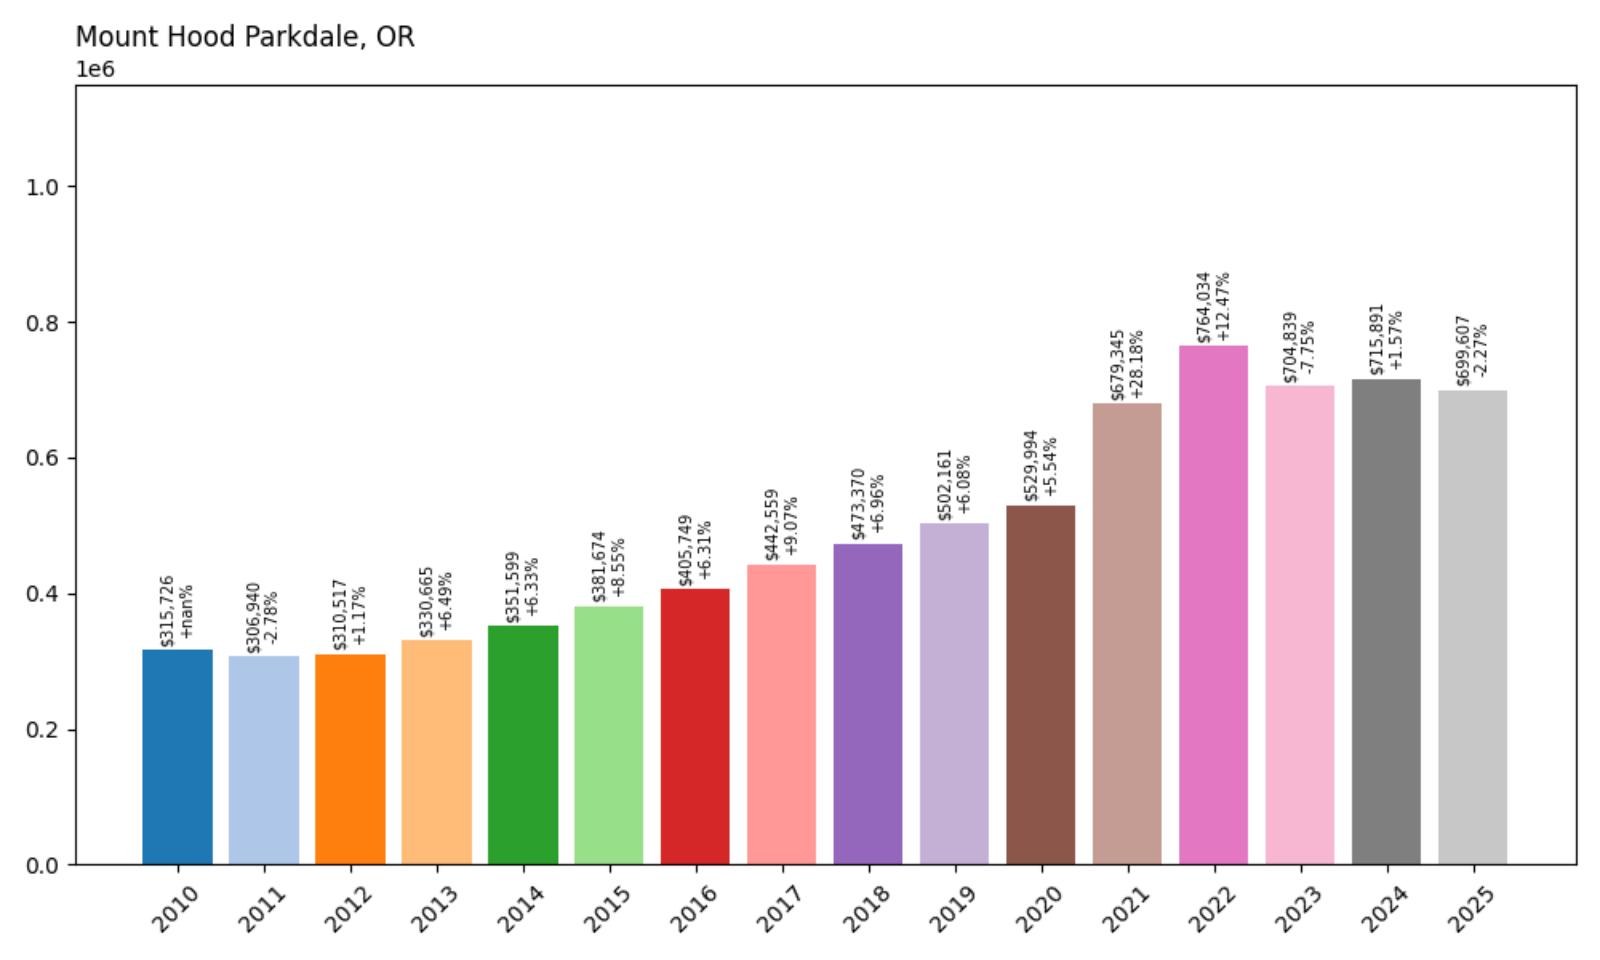
- 2010: $315,726
- 2011: $306,940 (−$8,787, −2.78% from previous year)
- 2012: $310,517 (+$3,577, +1.17% from previous year)
- 2013: $330,665 (+$20,149, +6.49% from previous year)
- 2014: $351,599 (+$20,933, +6.33% from previous year)
- 2015: $381,674 (+$30,075, +8.55% from previous year)
- 2016: $405,749 (+$24,075, +6.31% from previous year)
- 2017: $442,559 (+$36,810, +9.07% from previous year)
- 2018: $473,370 (+$30,811, +6.96% from previous year)
- 2019: $502,161 (+$28,792, +6.08% from previous year)
- 2020: $529,994 (+$27,833, +5.54% from previous year)
- 2021: $679,345 (+$149,351, +28.18% from previous year)
- 2022: $764,034 (+$84,688, +12.47% from previous year)
- 2023: $704,839 (−$59,195, −7.75% from previous year)
- 2024: $715,891 (+$11,052, +1.57% from previous year)
- 2025: $699,607 (−$16,284, −2.27% from previous year)
Home prices in Mount Hood Parkdale have risen by 125.3% since 2012, moving from $310,517 to $699,607 in 2025. After a period of steady growth, the town experienced a massive jump in 2021 and 2022 before declining slightly in the years that followed. Still, the market remains elevated and well above pre-pandemic levels.
Mount Hood Parkdale – Gateway to Outdoor Adventure
Situated near the base of Oregon’s iconic Mount Hood, Parkdale is a small town that punches above its weight in outdoor appeal. With easy access to skiing, hiking, and the Hood River Valley’s agricultural corridor, the area attracts both second-home buyers and year-round residents. Its housing market surged during the pandemic as remote workers and outdoor enthusiasts sought out more scenic, spacious living.
The significant price spikes in 2021 and 2022 likely reflected this surge in demand. While values have dipped slightly in 2023 and 2025, they remain far higher than a decade ago. Parkdale’s appeal lies not just in its views, but in its positioning as a true four-season recreational hub. This lifestyle-driven interest should continue to support long-term value, especially as Oregon’s outdoor destinations grow increasingly popular with permanent residents.
18. Happy Valley – 124.7% Home Price Increase Since 2012
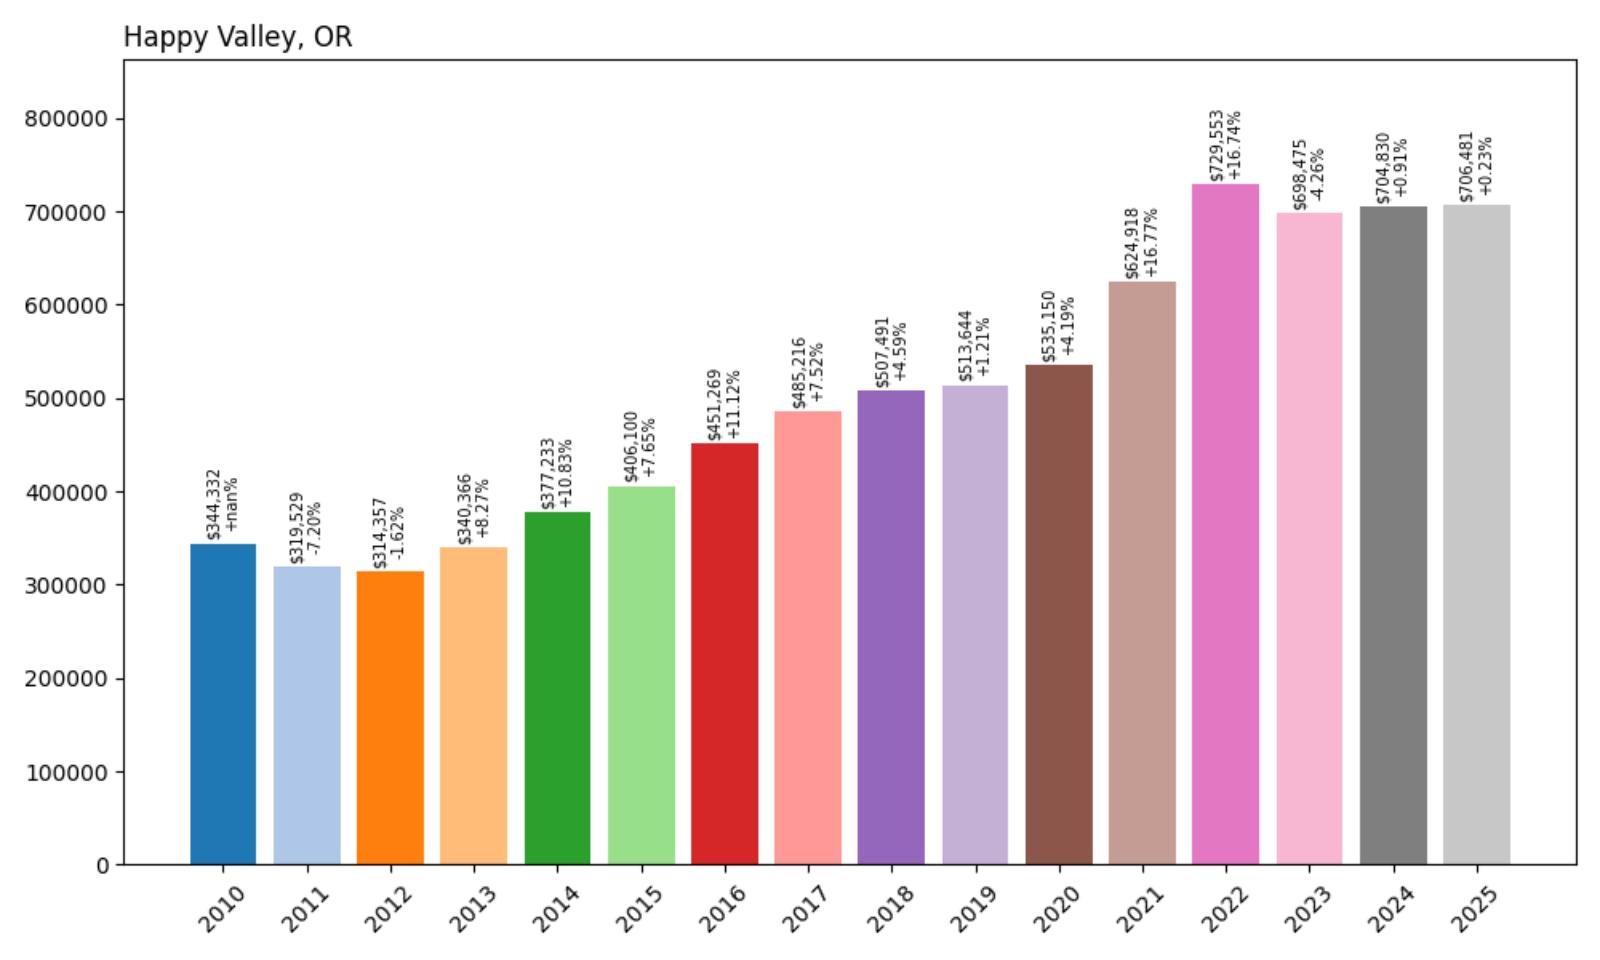
- 2010: $344,332
- 2011: $319,529 (−$24,803, −7.20% from previous year)
- 2012: $314,357 (−$5,172, −1.62% from previous year)
- 2013: $340,366 (+$26,009, +8.27% from previous year)
- 2014: $377,233 (+$36,867, +10.83% from previous year)
- 2015: $406,100 (+$28,867, +7.65% from previous year)
- 2016: $451,269 (+$45,168, +11.12% from previous year)
- 2017: $485,216 (+$33,947, +7.52% from previous year)
- 2018: $507,491 (+$22,275, +4.59% from previous year)
- 2019: $513,644 (+$6,153, +1.21% from previous year)
- 2020: $535,150 (+$21,507, +4.19% from previous year)
- 2021: $624,918 (+$89,767, +16.77% from previous year)
- 2022: $729,553 (+$104,635, +16.74% from previous year)
- 2023: $698,475 (−$31,078, −4.26% from previous year)
- 2024: $704,830 (+$6,355, +0.91% from previous year)
- 2025: $706,481 (+$1,652, +0.23% from previous year)
Happy Valley’s home prices rose by 124.7% from $314,357 in 2012 to $706,481 in 2025. The town saw steady growth throughout the 2010s, followed by explosive gains in 2021 and 2022. While prices dipped in 2023, they’ve since stabilized, with the market maintaining its premium status.
Happy Valley – Upscale Suburb with Expanding Growth
Happy Valley is a prime example of suburban expansion in Oregon. Located just southeast of Portland, it has transformed over the last 15 years from a quiet outpost into one of the metro area’s fastest-growing and most affluent suburbs. With new construction, shopping centers, and well-ranked schools, it’s become a top destination for families and professionals.
High demand for space, combined with limited land and continued development, has pushed prices steadily upward. Happy Valley also saw a pandemic-era boom that drove values to new highs. While the market cooled slightly in 2023, the town’s fundamentals remain strong. With modern housing stock, a convenient location, and rising prestige, it remains a top-tier choice for buyers in the Portland area.
17. Mulino – 163.2% Home Price Increase Since 2012
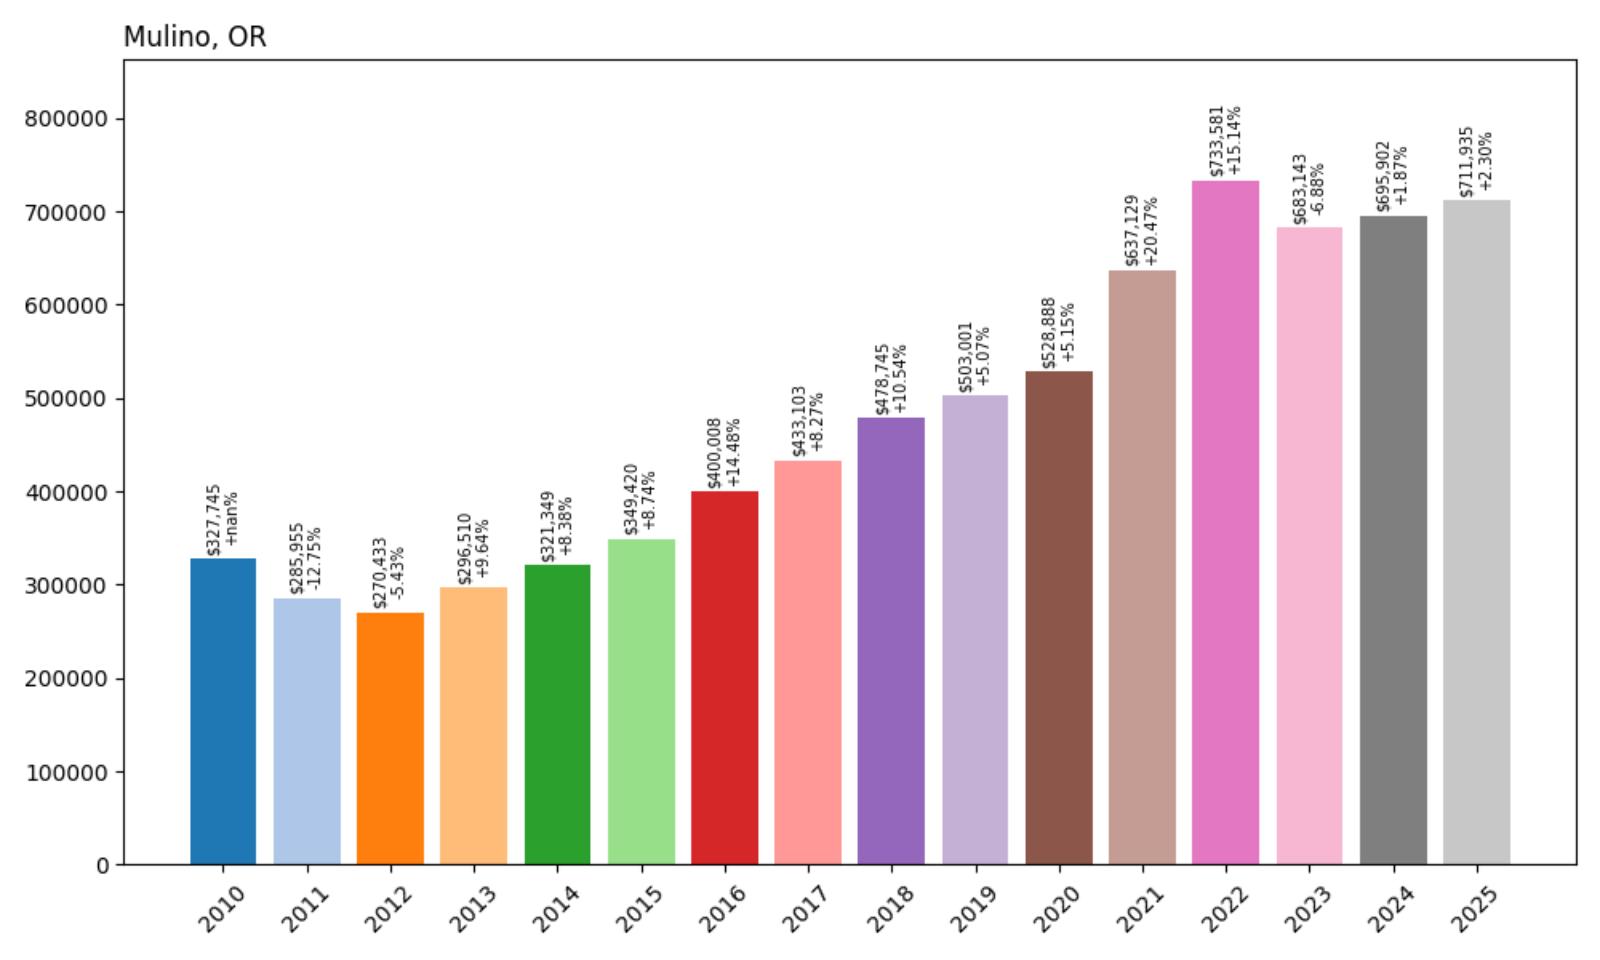
- 2010: $327,745
- 2011: $285,955 (−$41,790, −12.75% from previous year)
- 2012: $270,433 (−$15,522, −5.43% from previous year)
- 2013: $296,510 (+$26,078, +9.64% from previous year)
- 2014: $321,349 (+$24,839, +8.38% from previous year)
- 2015: $349,420 (+$28,071, +8.74% from previous year)
- 2016: $400,008 (+$50,588, +14.48% from previous year)
- 2017: $433,103 (+$33,095, +8.27% from previous year)
- 2018: $478,745 (+$45,642, +10.54% from previous year)
- 2019: $503,001 (+$24,256, +5.07% from previous year)
- 2020: $528,888 (+$25,887, +5.15% from previous year)
- 2021: $637,129 (+$108,241, +20.47% from previous year)
- 2022: $733,581 (+$96,453, +15.14% from previous year)
- 2023: $683,143 (−$50,438, −6.88% from previous year)
- 2024: $695,902 (+$12,759, +1.87% from previous year)
- 2025: $711,935 (+$16,033, +2.30% from previous year)
Mulino’s home values rose by 163.2% from 2012 to 2025, climbing from $270,433 to $711,935. The market was especially strong during the 2016–2022 period, with consistent double-digit gains. Though there was a sharp pullback in 2023, prices have since rebounded and are continuing to grow steadily in 2025.
Mulino – Expansive Land and Long-Term Appeal

Mulino is an unincorporated community nestled in the foothills of Clackamas County, about 30 miles south of Portland. Known for its large lots, small farms, and peaceful surroundings, Mulino offers the kind of space that’s increasingly hard to find in Oregon’s growing metro areas. While it’s not a high-density destination, its appeal has grown steadily thanks to buyers seeking acreage and quiet away from the city rush.
What’s striking about Mulino is the consistency of its price increases through very different economic periods. The town saw substantial growth in the late 2010s, followed by explosive jumps in 2021 and 2022 during the remote work boom. Although 2023 brought a dip of nearly $50,000, the bounceback in 2024 and 2025 suggests that underlying demand remains strong. With average home values now surpassing $710,000, Mulino is increasingly on the radar of buyers looking to invest in open space and long-term livability.
16. Hood River – 138.4% Home Price Increase Since 2012
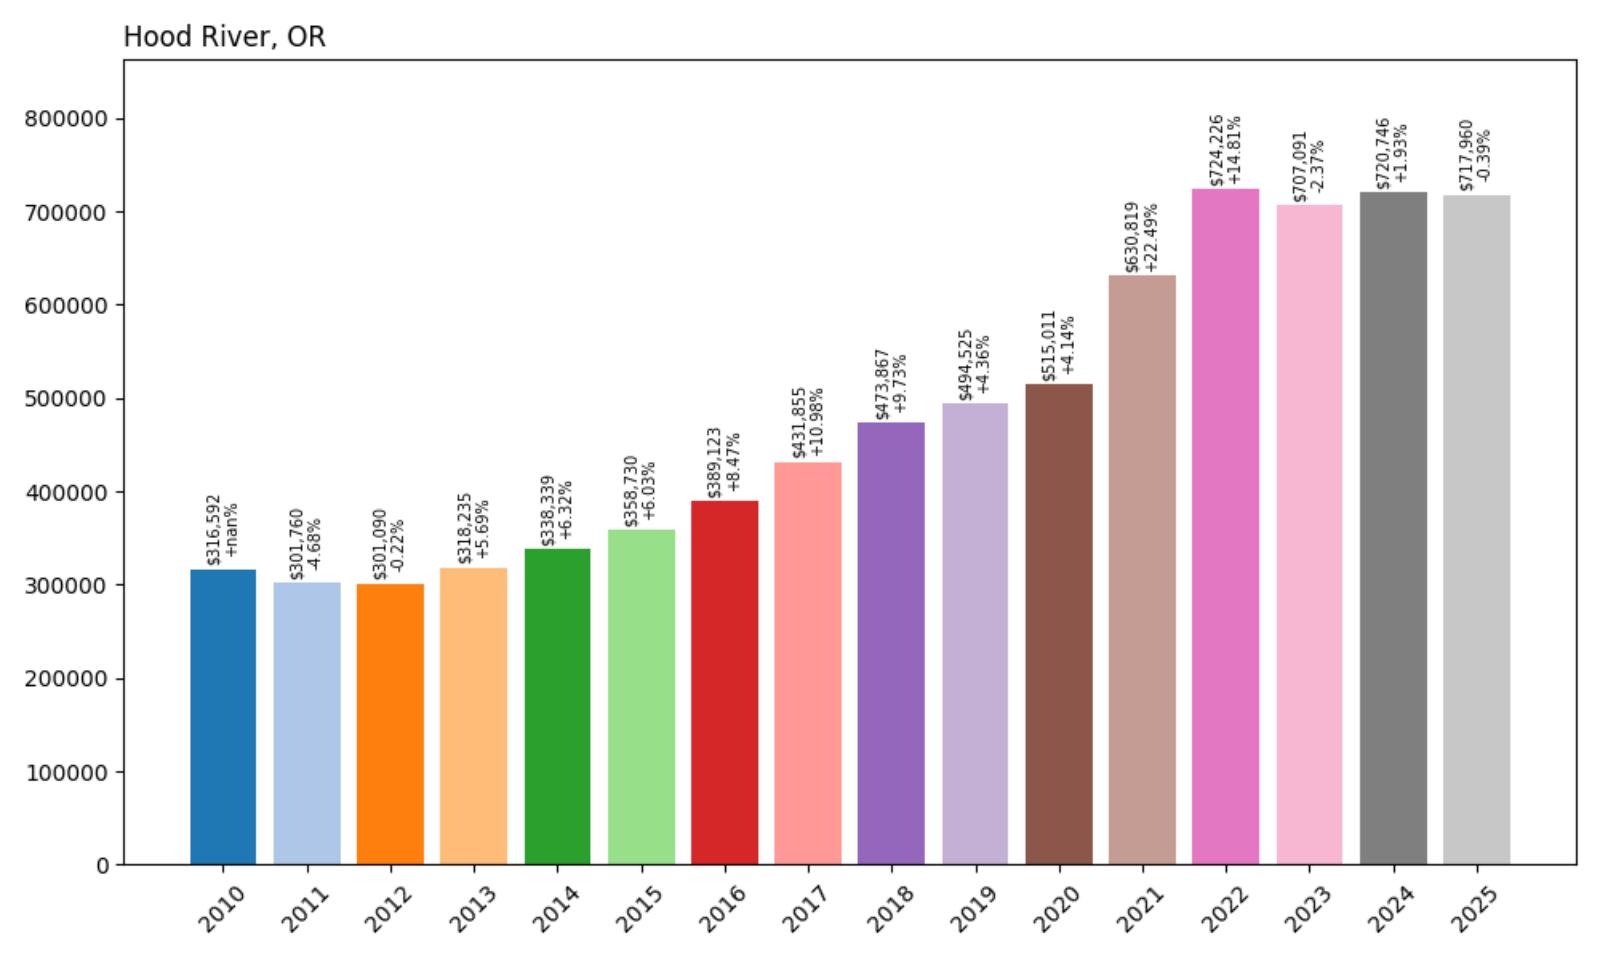
- 2010: $316,592
- 2011: $301,760 (−$14,831, −4.68% from previous year)
- 2012: $301,090 (−$670, −0.22% from previous year)
- 2013: $318,235 (+$17,145, +5.69% from previous year)
- 2014: $338,339 (+$20,103, +6.32% from previous year)
- 2015: $358,730 (+$20,392, +6.03% from previous year)
- 2016: $389,123 (+$30,393, +8.47% from previous year)
- 2017: $431,855 (+$42,732, +10.98% from previous year)
- 2018: $473,867 (+$42,013, +9.73% from previous year)
- 2019: $494,525 (+$20,658, +4.36% from previous year)
- 2020: $515,011 (+$20,486, +4.14% from previous year)
- 2021: $630,819 (+$115,808, +22.49% from previous year)
- 2022: $724,226 (+$93,407, +14.81% from previous year)
- 2023: $707,091 (−$17,136, −2.37% from previous year)
- 2024: $720,746 (+$13,655, +1.93% from previous year)
- 2025: $717,960 (−$2,786, −0.39% from previous year)
Since 2012, Hood River’s home prices have increased by 138.4%, rising from $301,090 to $717,960. The town posted steady year-over-year gains for more than a decade, including major jumps during the 2021–2022 period. A slight dip in 2023 hasn’t derailed its long-term upward trend.
Hood River – Recreation Hub With High-End Demand
Perched above the Columbia River Gorge, Hood River is known for its world-class windsurfing, craft breweries, and easy access to Mount Hood. The town blends a vibrant outdoor lifestyle with small-town charm, attracting a mix of tourists, remote workers, and Portlanders looking for a weekend escape—or a permanent change. Its real estate market has surged as a result, especially among second-home buyers and professionals seeking better work-life balance.
The price trends align with Hood River’s growing national recognition. Between 2020 and 2022, average home values rose by over $200,000. Even with a small correction in 2023 and a plateau in 2025, the market remains strong, hovering near $720,000. As long as Hood River retains its unique mix of amenities, views, and year-round outdoor options, housing demand is likely to remain steady—and prices will continue reflecting that demand.
15. Boring – 142.3% Home Price Increase Since 2012
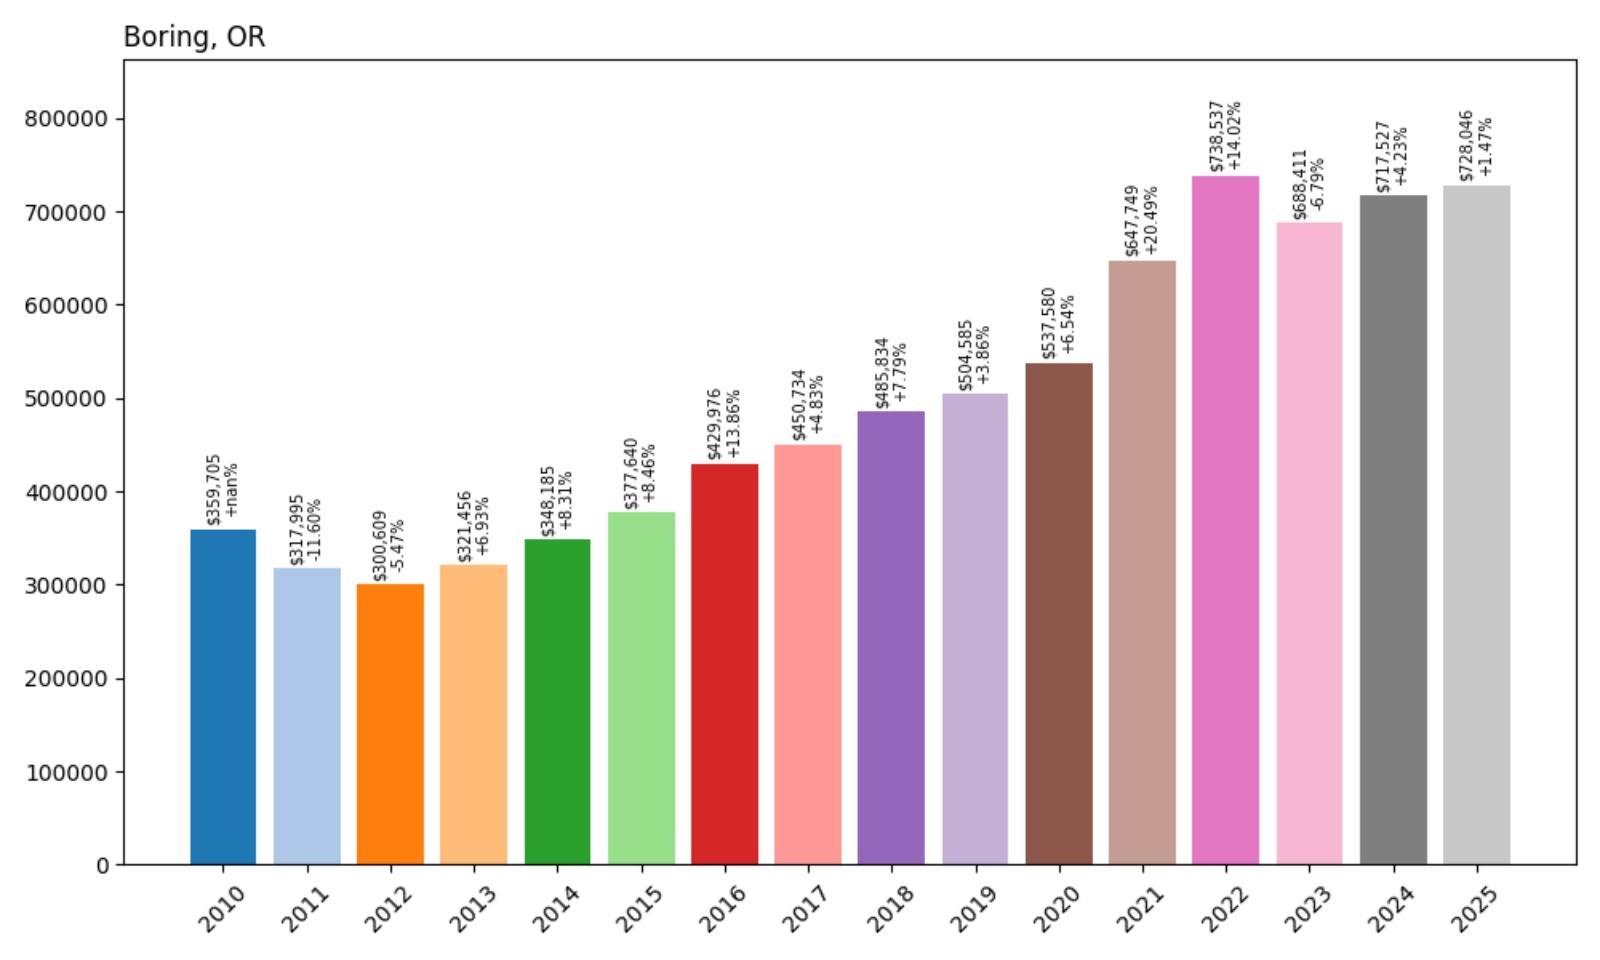
- 2010: $359,705
- 2011: $317,995 (−$41,710, −11.60% from previous year)
- 2012: $300,609 (−$17,386, −5.47% from previous year)
- 2013: $321,456 (+$20,846, +6.93% from previous year)
- 2014: $348,185 (+$26,729, +8.31% from previous year)
- 2015: $377,640 (+$29,456, +8.46% from previous year)
- 2016: $429,976 (+$52,336, +13.86% from previous year)
- 2017: $450,734 (+$20,758, +4.83% from previous year)
- 2018: $485,834 (+$35,100, +7.79% from previous year)
- 2019: $504,585 (+$18,751, +3.86% from previous year)
- 2020: $537,580 (+$32,995, +6.54% from previous year)
- 2021: $647,749 (+$110,169, +20.49% from previous year)
- 2022: $738,537 (+$90,788, +14.02% from previous year)
- 2023: $688,411 (−$50,126, −6.79% from previous year)
- 2024: $717,527 (+$29,116, +4.23% from previous year)
- 2025: $728,046 (+$10,519, +1.47% from previous year)
Home values in Boring have climbed by 142.3% since 2012, from $300,609 to $728,046. Growth was particularly strong from 2016 through 2022, with double-digit increases in multiple years. Prices dipped in 2023, but quickly recovered and hit a new high in 2025.
Boring – Rural Roots With Rising Prestige
Despite the name, Boring is far from dull. This unincorporated community in Clackamas County is best known for its quiet, rural character—and more recently, for its appeal to buyers looking for room to breathe without straying too far from Portland. With a mix of farmland, forests, and custom homes, Boring offers a slower pace of life that continues to draw families, retirees, and telecommuters alike.
The housing data tells a story of growing interest, especially after 2020. Large lots, privacy, and proximity to Mount Hood made Boring a pandemic-era favorite. While prices briefly fell in 2023, they regained momentum the following year, and now sit comfortably above $725,000. For buyers who want a balance of space and access to the Portland metro, Boring offers long-term appeal—and its rising home values reflect that demand.
14. Bend – 145.3% Home Price Increase Since 2012
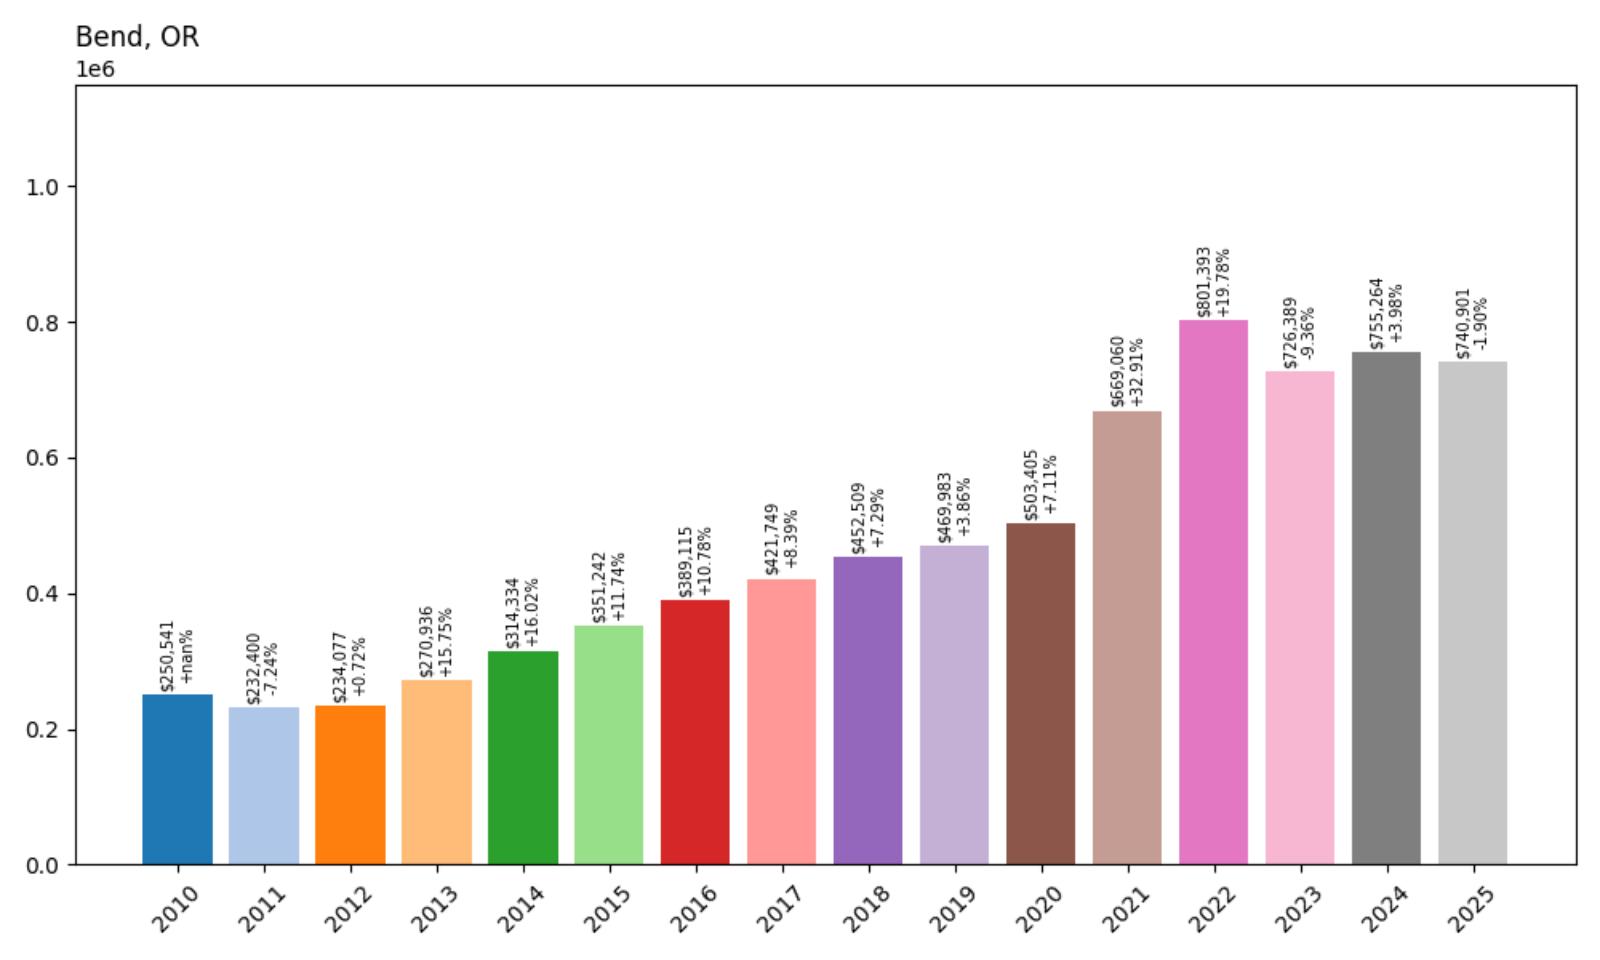
- 2010: $250,541
- 2011: $232,400 (−$18,142, −7.24% from previous year)
- 2012: $234,077 (+$1,678, +0.72% from previous year)
- 2013: $270,936 (+$36,859, +15.75% from previous year)
- 2014: $314,334 (+$43,398, +16.02% from previous year)
- 2015: $351,242 (+$36,908, +11.74% from previous year)
- 2016: $389,115 (+$37,873, +10.78% from previous year)
- 2017: $421,749 (+$32,634, +8.39% from previous year)
- 2018: $452,509 (+$30,761, +7.29% from previous year)
- 2019: $469,983 (+$17,474, +3.86% from previous year)
- 2020: $503,405 (+$33,422, +7.11% from previous year)
- 2021: $669,060 (+$165,654, +32.91% from previous year)
- 2022: $801,393 (+$132,333, +19.78% from previous year)
- 2023: $726,389 (−$75,004, −9.36% from previous year)
- 2024: $755,264 (+$28,876, +3.98% from previous year)
- 2025: $740,901 (−$14,364, −1.90% from previous year)
Home prices in Bend have increased by 145.3% since 2012, from $234,077 to $740,901. The market took off after 2013, with huge gains during the pandemic years. Though prices have cooled slightly since 2022, Bend remains one of Oregon’s hottest real estate markets.
Bend – Booming Outdoor Destination Turned Investment Hotspot
Located in Central Oregon, Bend is often cited as one of the most desirable places to live in the Pacific Northwest. With its proximity to mountains, rivers, and forests—not to mention a booming craft beer scene—Bend has grown from a mountain town to a full-fledged metro hub. Its housing market reflects that trajectory, especially with tech workers and retirees pouring in from California and Portland in recent years.
The steep gains in 2020 through 2022 sent Bend’s median prices soaring. While the post-boom correction in 2023 knocked prices down slightly, the market stabilized in 2024 and 2025. At nearly $741,000, Bend’s average home price underscores the city’s transformation from sleepy high desert town to one of the priciest—and most desirable—communities in Oregon.
13. Camp Sherman – 53.7% Home Price Increase Since 2020
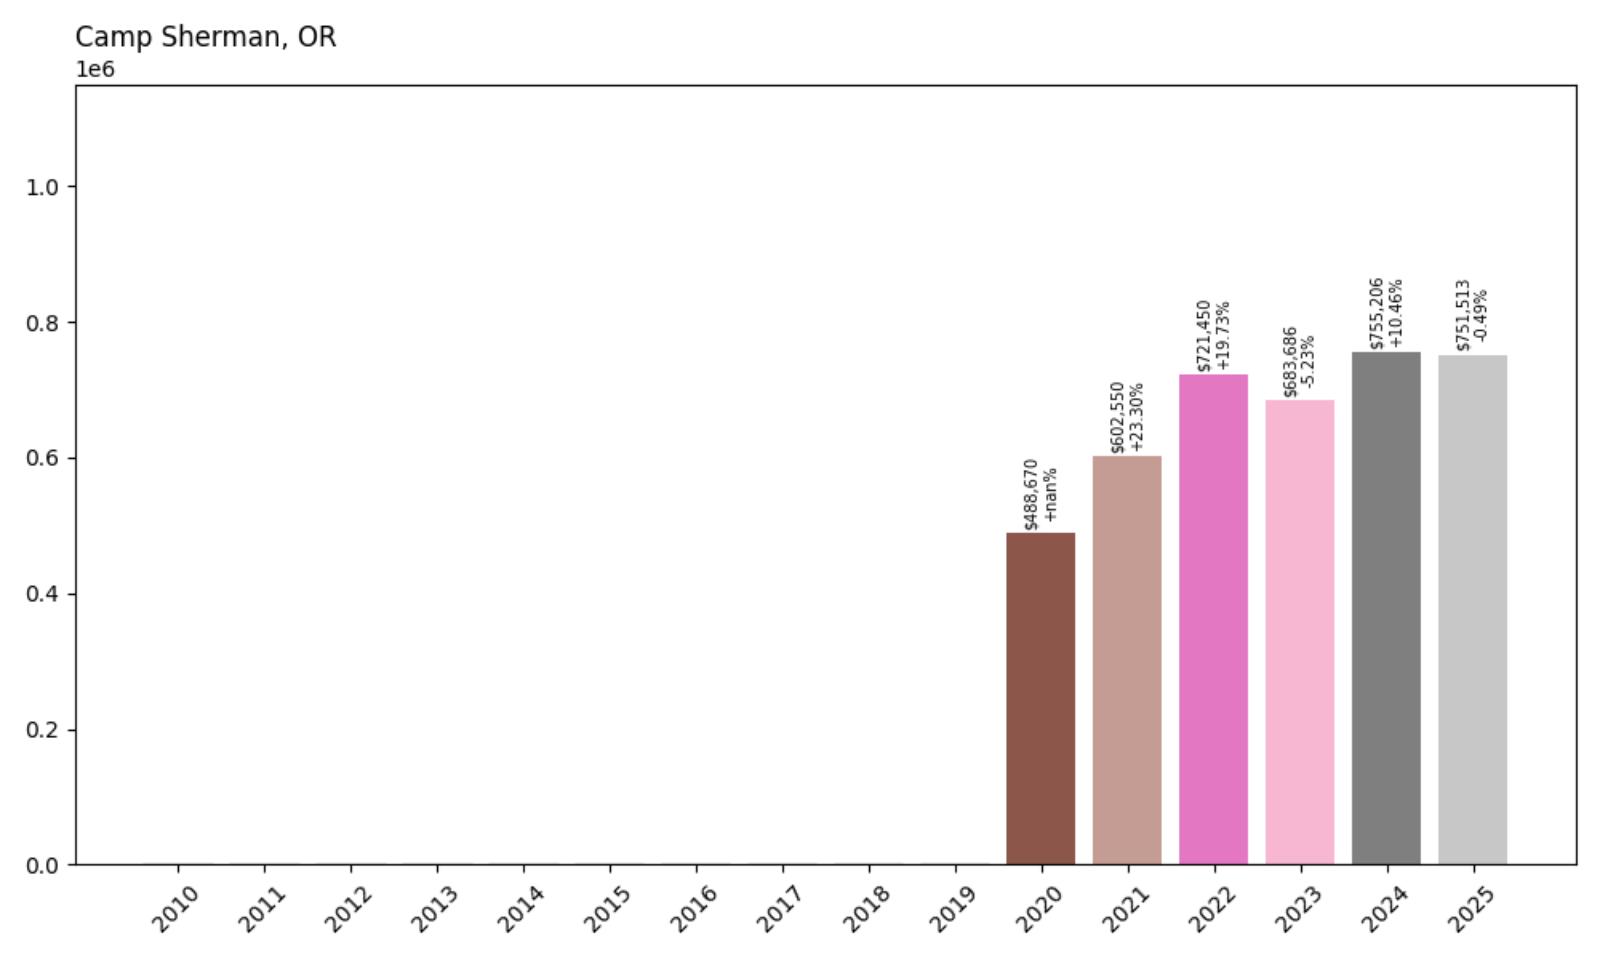
- 2010: $NA
- 2011: $NA
- 2012: $NA
- 2013: $NA
- 2014: $NA
- 2015: $NA
- 2016: $NA
- 2017: $NA
- 2018: $NA
- 2019: $NA
- 2020: $488,670
- 2021: $602,550 (+$113,880, +23.30% from previous year)
- 2022: $721,450 (+$118,901, +19.73% from previous year)
- 2023: $683,686 (−$37,764, −5.23% from previous year)
- 2024: $755,206 (+$71,520, +10.46% from previous year)
- 2025: $751,513 (−$3,694, −0.49% from previous year)
Although Camp Sherman lacks data before 2020, home values have still surged 53.7% in just five years, climbing from $488,670 to $751,513. The town saw steep appreciation between 2020 and 2022 before fluctuating slightly in recent years. Despite minor dips, 2025 values remain near their all-time peak, reflecting strong demand in this secluded high-desert community.
Camp Sherman – Remote, Scenic, and Surprisingly Pricey

Camp Sherman is tucked away along the Metolius River in Central Oregon, known for its rustic cabins, towering ponderosa pines, and quiet fly-fishing culture. It’s a small, unincorporated community without big-box stores or subdivisions—but that’s exactly the appeal. Homes here are often second residences or legacy properties passed down through families, and that scarcity of listings creates upward pressure on prices whenever something comes up for sale. Many properties here offer river frontage, mountain views, or unique architecture, all of which add to the premium. Though it’s off the beaten path, Camp Sherman has become one of the most expensive per-square-foot markets in the state thanks to its exclusivity and timeless charm.
Because inventory is so limited, the housing market in Camp Sherman tends to react quickly and sharply to shifts in demand. The years following 2020 brought a flood of interest in quiet, scenic locations, and prices in this tiny community exploded in response. Even after a pullback in 2023, values shot back up in 2024 and remained high in 2025. With its location near Black Butte Ranch and Sisters, and surrounded by protected forestland, Camp Sherman has few new builds and even fewer transactions—making every sale a high-stakes, high-dollar affair. For buyers looking for privacy, nature, and a river running through it, there’s almost nowhere in Oregon quite like it.
12. Rickreall – 132.2% Home Price Increase Since 2012
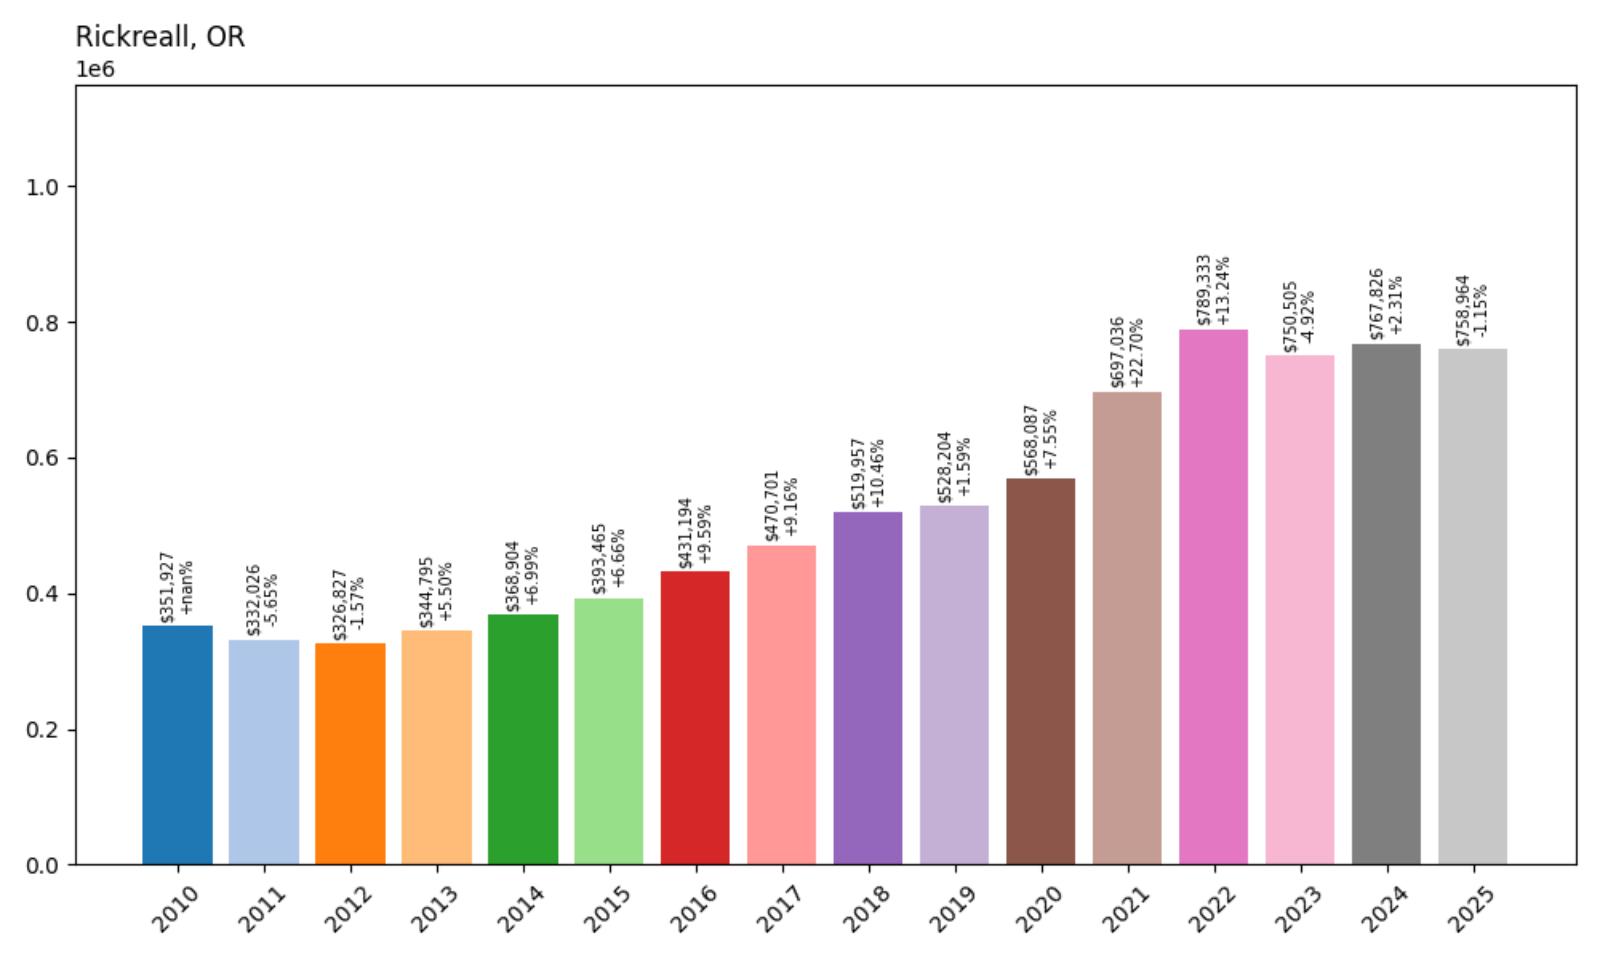
- 2010: $351,927
- 2011: $332,026 (−$19,901, −5.65% from previous year)
- 2012: $326,827 (−$5,199, −1.57% from previous year)
- 2013: $344,795 (+$17,968, +5.50% from previous year)
- 2014: $368,904 (+$24,109, +6.99% from previous year)
- 2015: $393,465 (+$24,561, +6.66% from previous year)
- 2016: $431,194 (+$37,729, +9.59% from previous year)
- 2017: $470,701 (+$39,507, +9.16% from previous year)
- 2018: $519,957 (+$49,256, +10.46% from previous year)
- 2019: $528,204 (+$8,248, +1.59% from previous year)
- 2020: $568,087 (+$39,882, +7.55% from previous year)
- 2021: $697,036 (+$128,949, +22.70% from previous year)
- 2022: $789,333 (+$92,296, +13.24% from previous year)
- 2023: $750,505 (−$38,828, −4.92% from previous year)
- 2024: $767,826 (+$17,321, +2.31% from previous year)
- 2025: $758,964 (−$8,862, −1.15% from previous year)
Rickreall’s home values have grown from $326,827 in 2012 to $758,964 in 2025—an impressive 132.2% increase. After steady climbs through the 2010s, the market took off in 2021, with a huge jump of over $128,000 in a single year. While prices have fluctuated slightly since peaking in 2022, they remain significantly elevated and remarkably resilient.
Rickreall – Quiet Wine Country Living With Big Growth
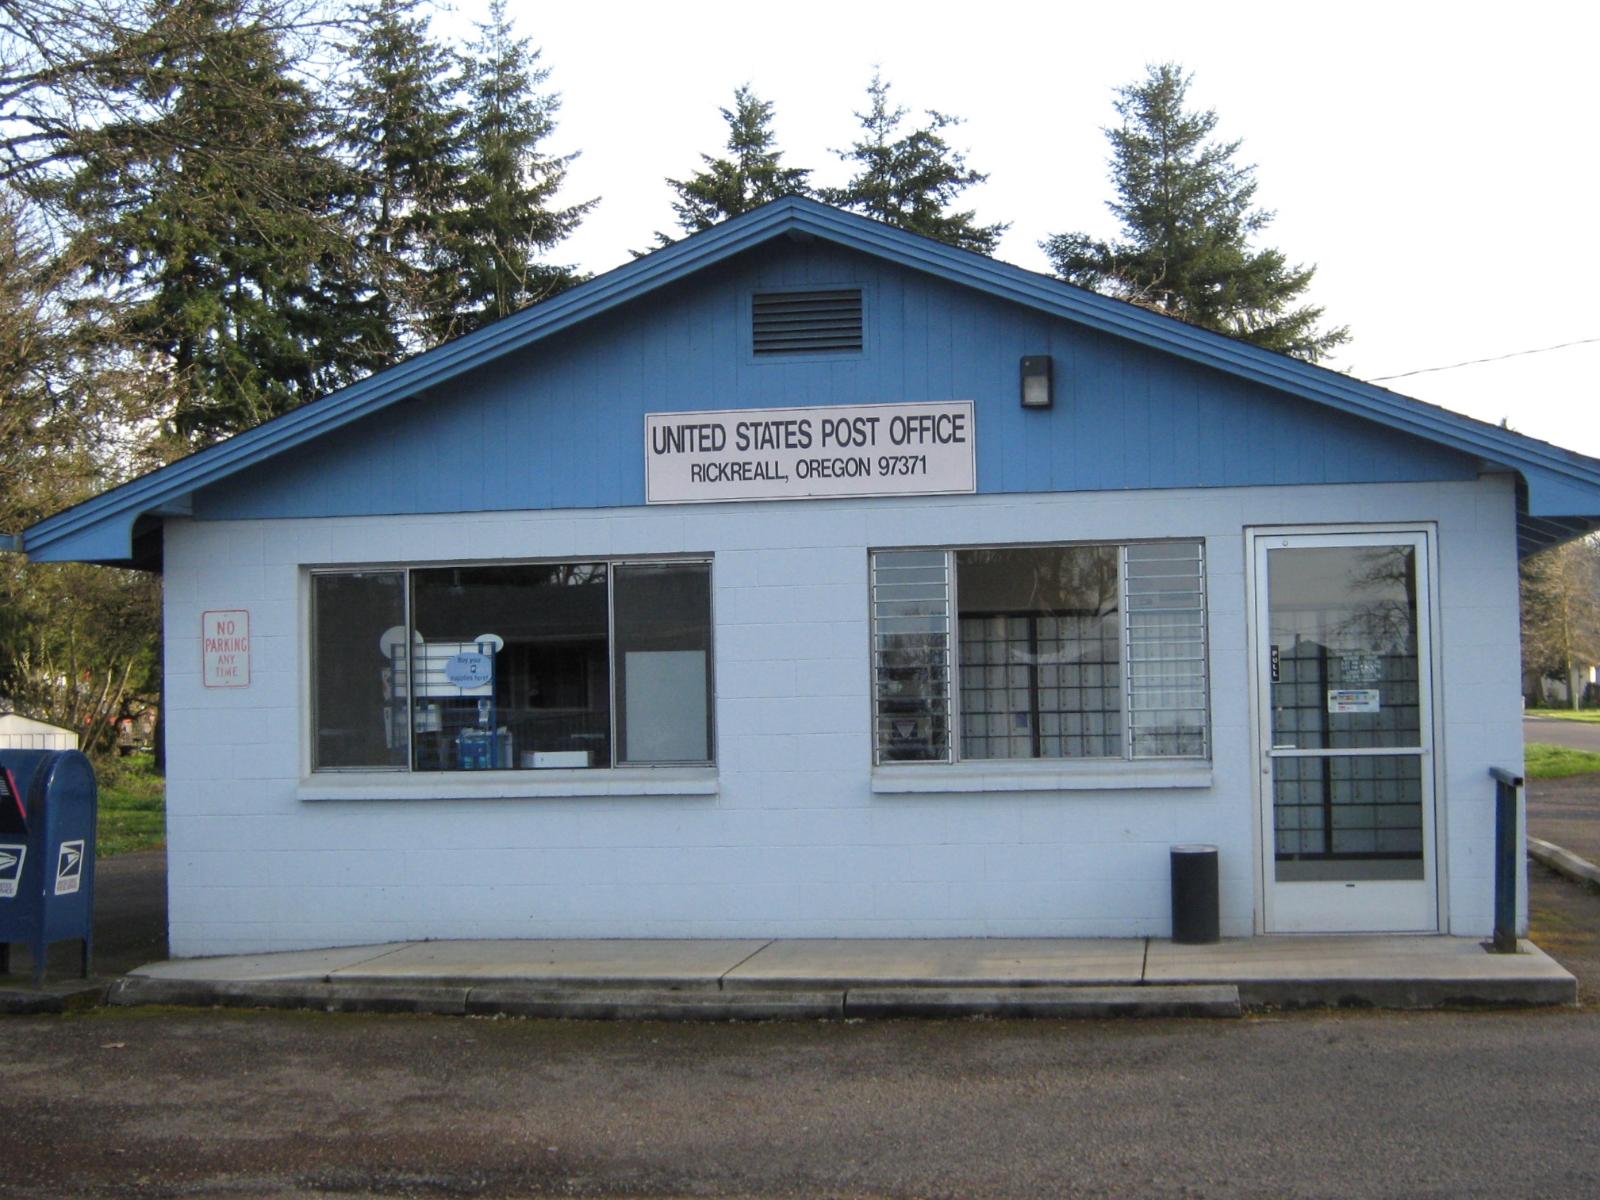
Rickreall is a small farming town in Polk County, just west of Salem. While it doesn’t often make headlines, it’s become an increasingly attractive location for homebuyers seeking large properties, open views, and easy access to Oregon’s wine country. With a low population and minimal development pressure, the housing market here has grown quietly but steadily. The area offers a peaceful, rural atmosphere while still being just 20 minutes from the state capital. That combination has made Rickreall an appealing option for those looking to stretch their budgets without giving up amenities or access to larger job markets.
The real estate surge of 2020 to 2022 was felt even in Rickreall, where values jumped by more than $220,000 over those three years. These increases were likely fueled by remote work and a renewed appreciation for space and outdoor access. While price growth cooled off after 2022, and even declined slightly in 2023 and 2025, the broader trajectory remains upward. Rickreall’s limited housing stock, combined with rising interest in the surrounding Eola-Amity Hills wine region, has created a market where prices are likely to remain high for the foreseeable future. It’s not a flashy town—but it doesn’t need to be to command a strong premium.
11. Beavercreek – 161.2% Home Price Increase Since 2012
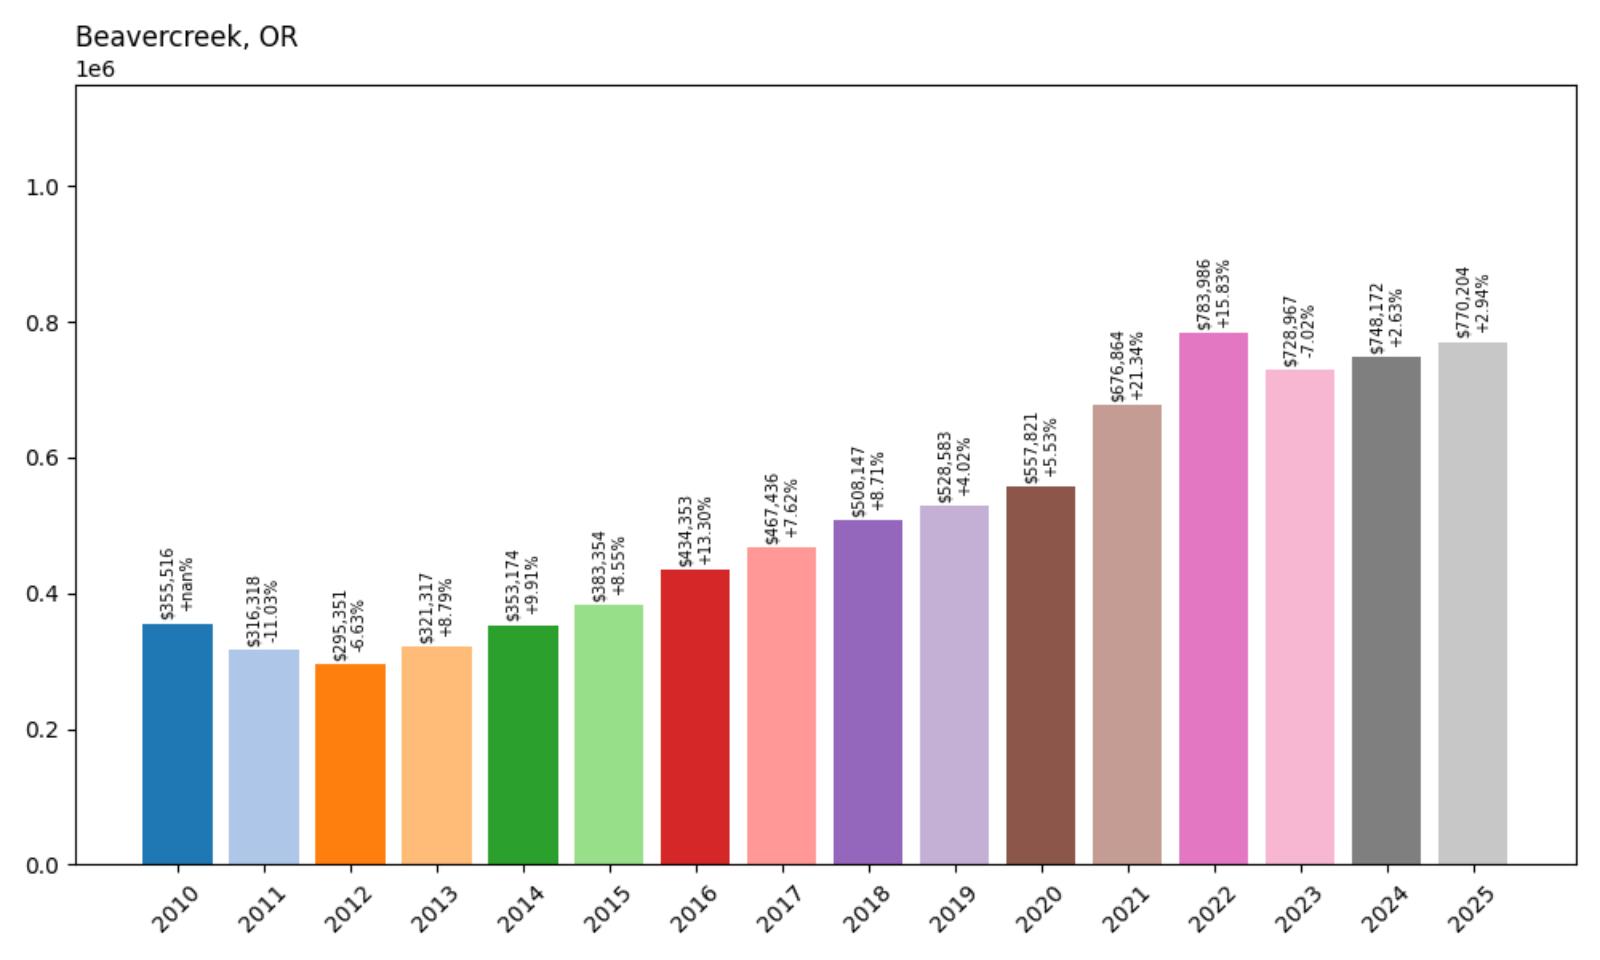
- 2010: $355,516
- 2011: $316,318 (−$39,198, −11.03% from previous year)
- 2012: $295,351 (−$20,966, −6.63% from previous year)
- 2013: $321,317 (+$25,966, +8.79% from previous year)
- 2014: $353,174 (+$31,857, +9.91% from previous year)
- 2015: $383,354 (+$30,180, +8.55% from previous year)
- 2016: $434,353 (+$50,999, +13.30% from previous year)
- 2017: $467,436 (+$33,083, +7.62% from previous year)
- 2018: $508,147 (+$40,711, +8.71% from previous year)
- 2019: $528,583 (+$20,436, +4.02% from previous year)
- 2020: $557,821 (+$29,237, +5.53% from previous year)
- 2021: $676,864 (+$119,043, +21.34% from previous year)
- 2022: $783,986 (+$107,122, +15.83% from previous year)
- 2023: $728,967 (−$55,019, −7.02% from previous year)
- 2024: $748,172 (+$19,204, +2.63% from previous year)
- 2025: $770,204 (+$22,033, +2.94% from previous year)
Beavercreek’s home prices have more than doubled since 2012, rising 161.2% from $295,351 to $770,204. Price increases were strong throughout the 2010s, and the market really took off between 2020 and 2022. Despite a dip in 2023, values have recovered and continue to trend upward in 2025.
Beavercreek – Spacious Rural Living Near the Urban Edge
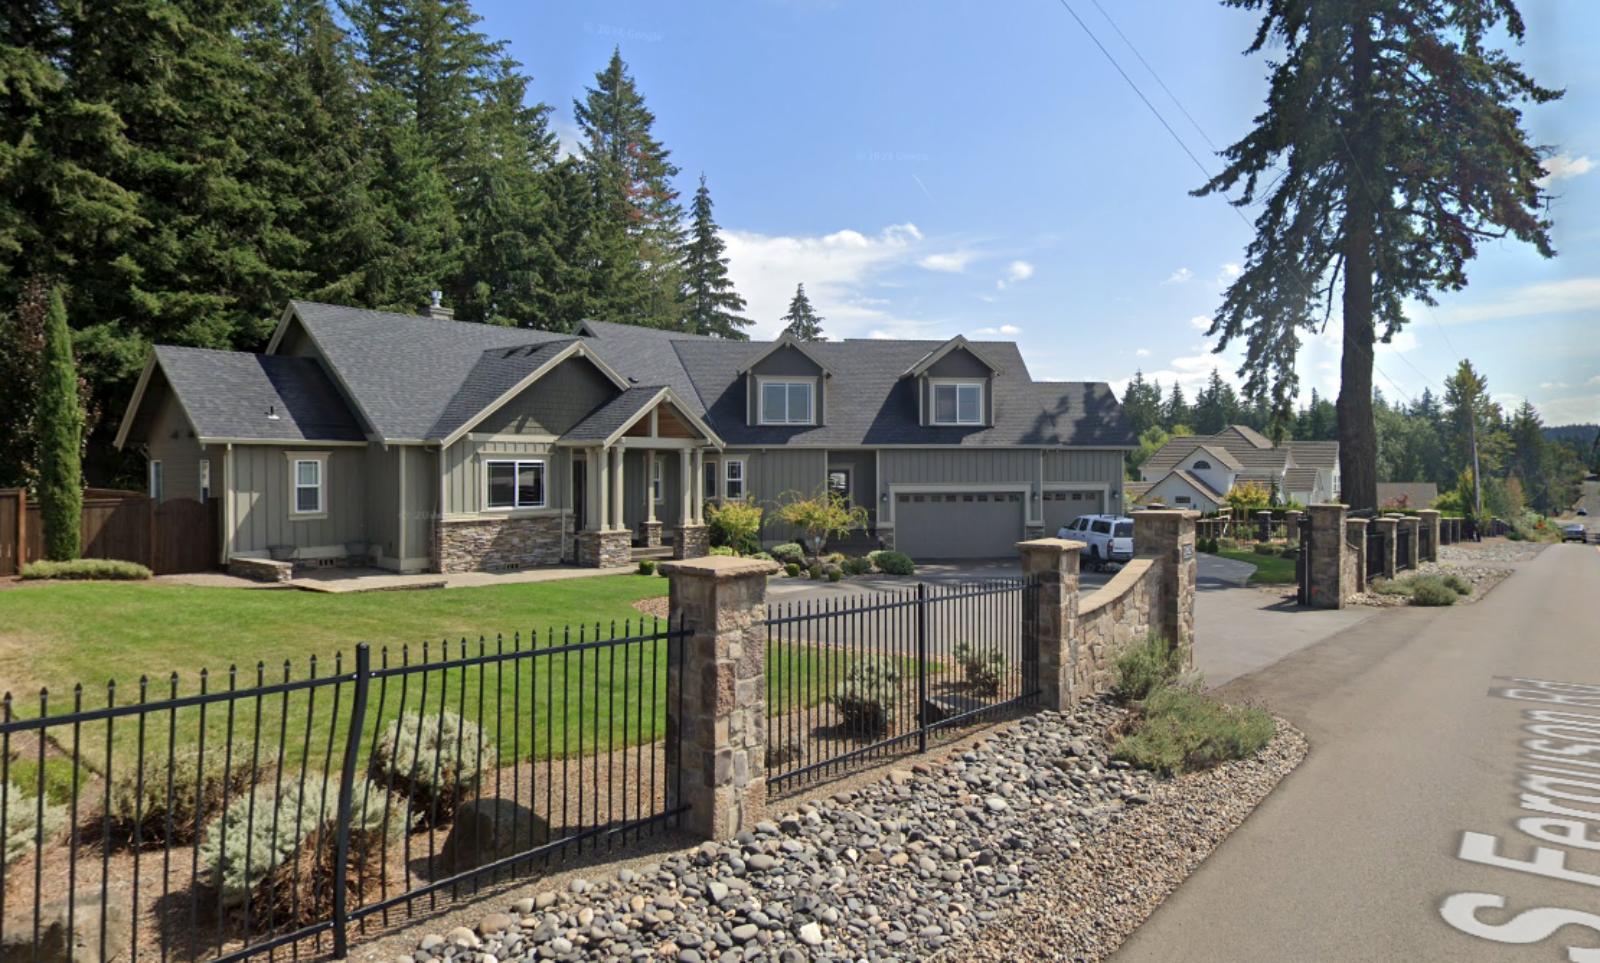
Located just south of Oregon City, Beavercreek offers large residential lots, horse properties, and wooded retreats with close proximity to the Portland metro. It’s a haven for those who want a country lifestyle with modern conveniences just a short drive away. As buyers fled the city in search of open space during the pandemic, Beavercreek’s appeal skyrocketed. Many homes here are custom-built or on multi-acre parcels, which gives them higher-than-average valuations and long-term value stability. It’s the kind of place where people put down roots—and where that stability has translated into a robust housing market.
The data shows a market that has weathered ups and downs with relative ease. Beavercreek gained more than $200,000 in value between 2020 and 2022 alone. Though prices dipped in 2023—mirroring national trends—they quickly rebounded by 2025. The area’s mix of privacy, nature, and access to highways and job centers continues to attract both Portland-area professionals and retirees. With values now pushing past $770,000, Beavercreek has firmly cemented itself as one of the most desirable—and expensive—rural markets in the state.
10. West Linn – 103.0% Home Price Increase Since 2012

- 2010: $383,864
- 2011: $349,600 (−$34,264, −8.93% from previous year)
- 2012: $334,107 (−$15,494, −4.43% from previous year)
- 2013: $365,766 (+$31,660, +9.48% from previous year)
- 2014: $400,449 (+$34,683, +9.48% from previous year)
- 2015: $426,951 (+$26,501, +6.62% from previous year)
- 2016: $474,079 (+$47,128, +11.04% from previous year)
- 2017: $505,488 (+$31,409, +6.63% from previous year)
- 2018: $529,792 (+$24,304, +4.81% from previous year)
- 2019: $540,744 (+$10,952, +2.07% from previous year)
- 2020: $562,378 (+$21,634, +4.00% from previous year)
- 2021: $660,382 (+$98,004, +17.43% from previous year)
- 2022: $783,828 (+$123,446, +18.69% from previous year)
- 2023: $765,846 (−$17,982, −2.29% from previous year)
- 2024: $778,934 (+$13,088, +1.71% from previous year)
- 2025: $779,441 (+$507, +0.07% from previous year)
West Linn home values have doubled since 2012, rising from $334,107 to $779,441—a gain of 103.0%. The strongest surge occurred between 2020 and 2022, when prices jumped by more than $220,000 in just two years. After a minor dip in 2023, the market stabilized in 2024 and remained virtually unchanged in 2025, reflecting consistent demand and high-value retention.
West Linn – One of Portland’s Most Sought-After Suburbs
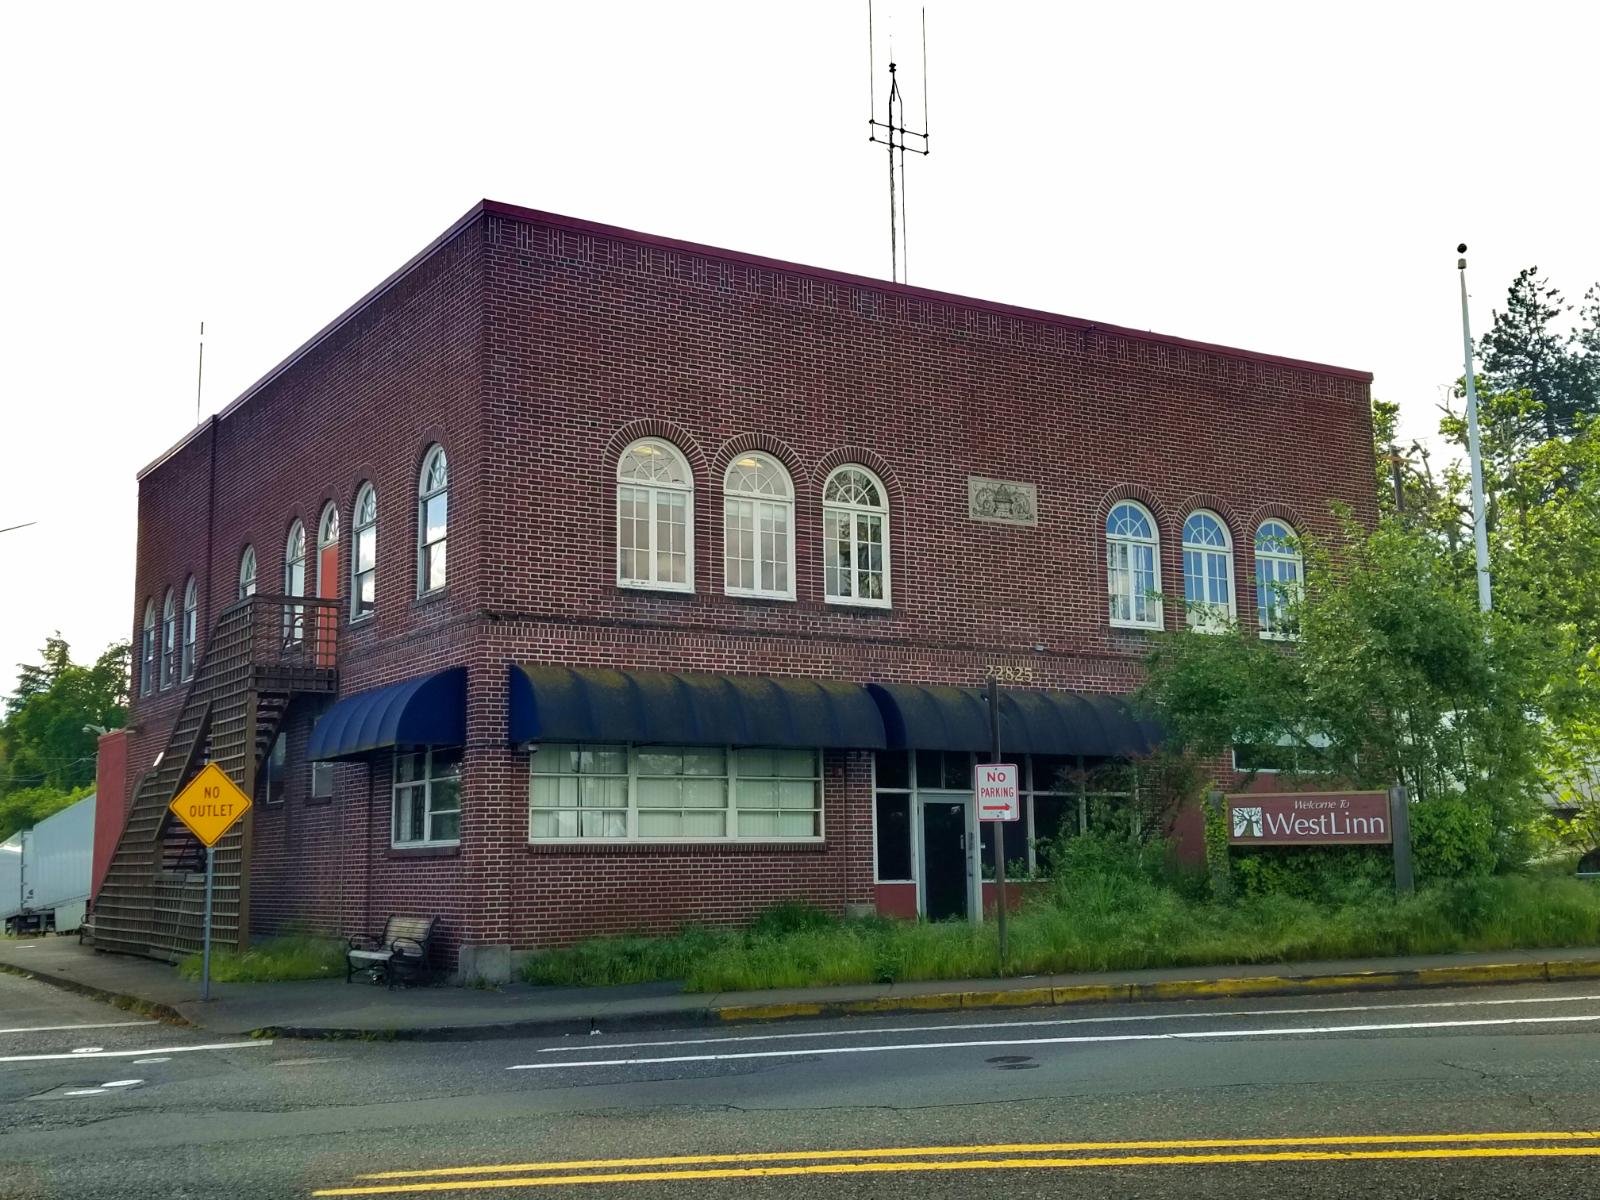
West Linn has earned its reputation as one of the Portland metro’s most desirable suburbs. Nestled along the Willamette River with panoramic views, top-tier schools, and low crime, it attracts families, professionals, and retirees alike. The area features a mix of historic homes, luxury developments, and tree-lined neighborhoods with access to nature trails and public parks. Commuters benefit from its proximity to downtown Portland while enjoying a slower, community-focused pace of life. This balance of convenience and livability keeps home prices elevated year after year, and buyers are often willing to pay a premium to secure property in this competitive market.
Price growth here hasn’t just been steady—it’s been robust. The data shows a particularly strong upswing between 2020 and 2022, when the city’s strong fundamentals and school ratings continued to appeal to remote workers and relocating families. While prices cooled slightly in 2023, they bounced back in 2024 and held firm in 2025. With the median home value now over $779,000, West Linn stands out not just for its amenities, but for its ability to maintain long-term value even in fluctuating markets. This enduring demand helps explain why it consistently ranks among the priciest towns in Oregon.
9. West Slope – 141.4% Home Price Increase Since 2012
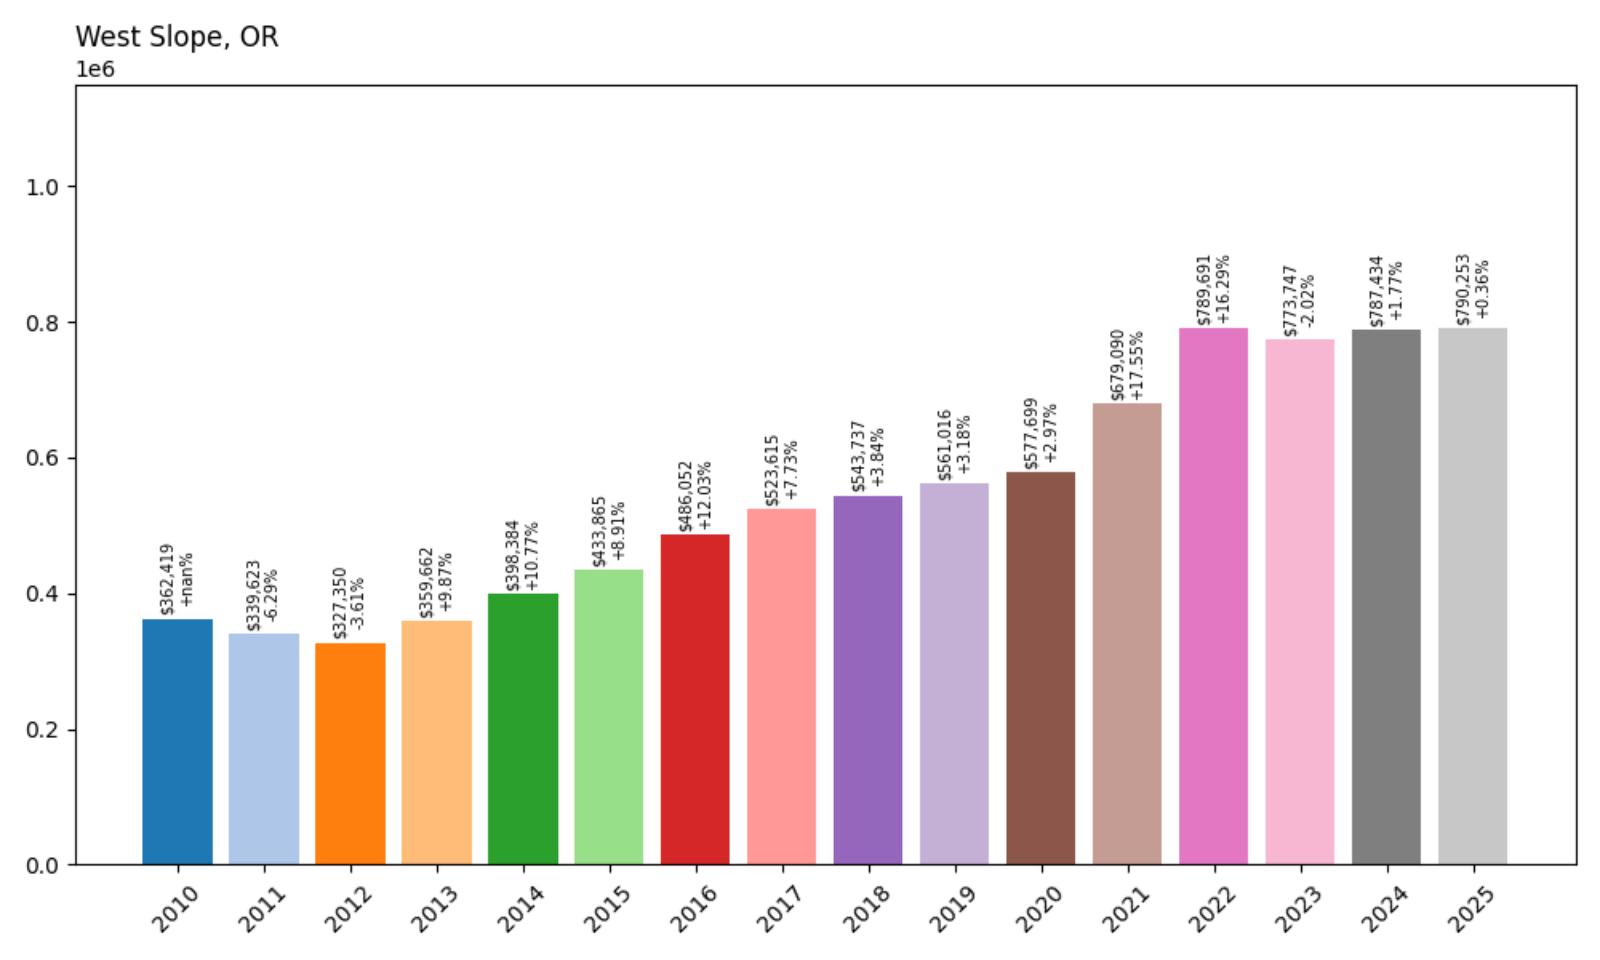
- 2010: $362,419
- 2011: $339,623 (−$22,796, −6.29% from previous year)
- 2012: $327,350 (−$12,273, −3.61% from previous year)
- 2013: $359,662 (+$32,312, +9.87% from previous year)
- 2014: $398,384 (+$38,722, +10.77% from previous year)
- 2015: $433,865 (+$35,481, +8.91% from previous year)
- 2016: $486,052 (+$52,187, +12.03% from previous year)
- 2017: $523,615 (+$37,563, +7.73% from previous year)
- 2018: $543,737 (+$20,122, +3.84% from previous year)
- 2019: $561,016 (+$17,279, +3.18% from previous year)
- 2020: $577,699 (+$16,683, +2.97% from previous year)
- 2021: $679,090 (+$101,391, +17.55% from previous year)
- 2022: $789,691 (+$110,601, +16.29% from previous year)
- 2023: $773,747 (−$15,944, −2.02% from previous year)
- 2024: $787,434 (+$13,688, +1.77% from previous year)
- 2025: $790,253 (+$2,818, +0.36% from previous year)
Home prices in West Slope increased by 141.4% between 2012 and 2025, with values climbing from $327,350 to $790,253. The steepest gains occurred between 2020 and 2022, when the town added over $200,000 in value. Although there was a small dip in 2023, prices have since leveled off, indicating sustained demand and resilience in a tight real estate market.
West Slope – Quiet Affluence on Portland’s Edge
West Slope is a small, affluent enclave just west of downtown Portland, known for its leafy streets, quiet charm, and mid-century architecture. Although technically part of unincorporated Washington County, it functions like a high-end Portland suburb, offering quick access to the city while maintaining a distinctly residential feel. Excellent public schools and a low crime rate continue to draw families and professionals who want proximity to Portland without the density. Homes here range from renovated bungalows to modern builds tucked into wooded lots, and prices reflect that desirable mix of convenience and seclusion.
The data illustrates just how steady and impressive West Slope’s growth has been. Even during market turbulence in 2023, values held strong compared to many other towns. With home prices now hovering around $790,000, it’s clear that demand in this area has staying power. Its location along Highway 26 makes commuting simple, and nearby shopping in Beaverton and the Cedar Hills area adds to the appeal. West Slope’s consistent appreciation over the past decade-plus isn’t just a fluke—it’s a result of sustained interest in small, upscale neighborhoods that offer both tranquility and access to the region’s job centers.
8. Durham – 136.4% Home Price Increase Since 2012
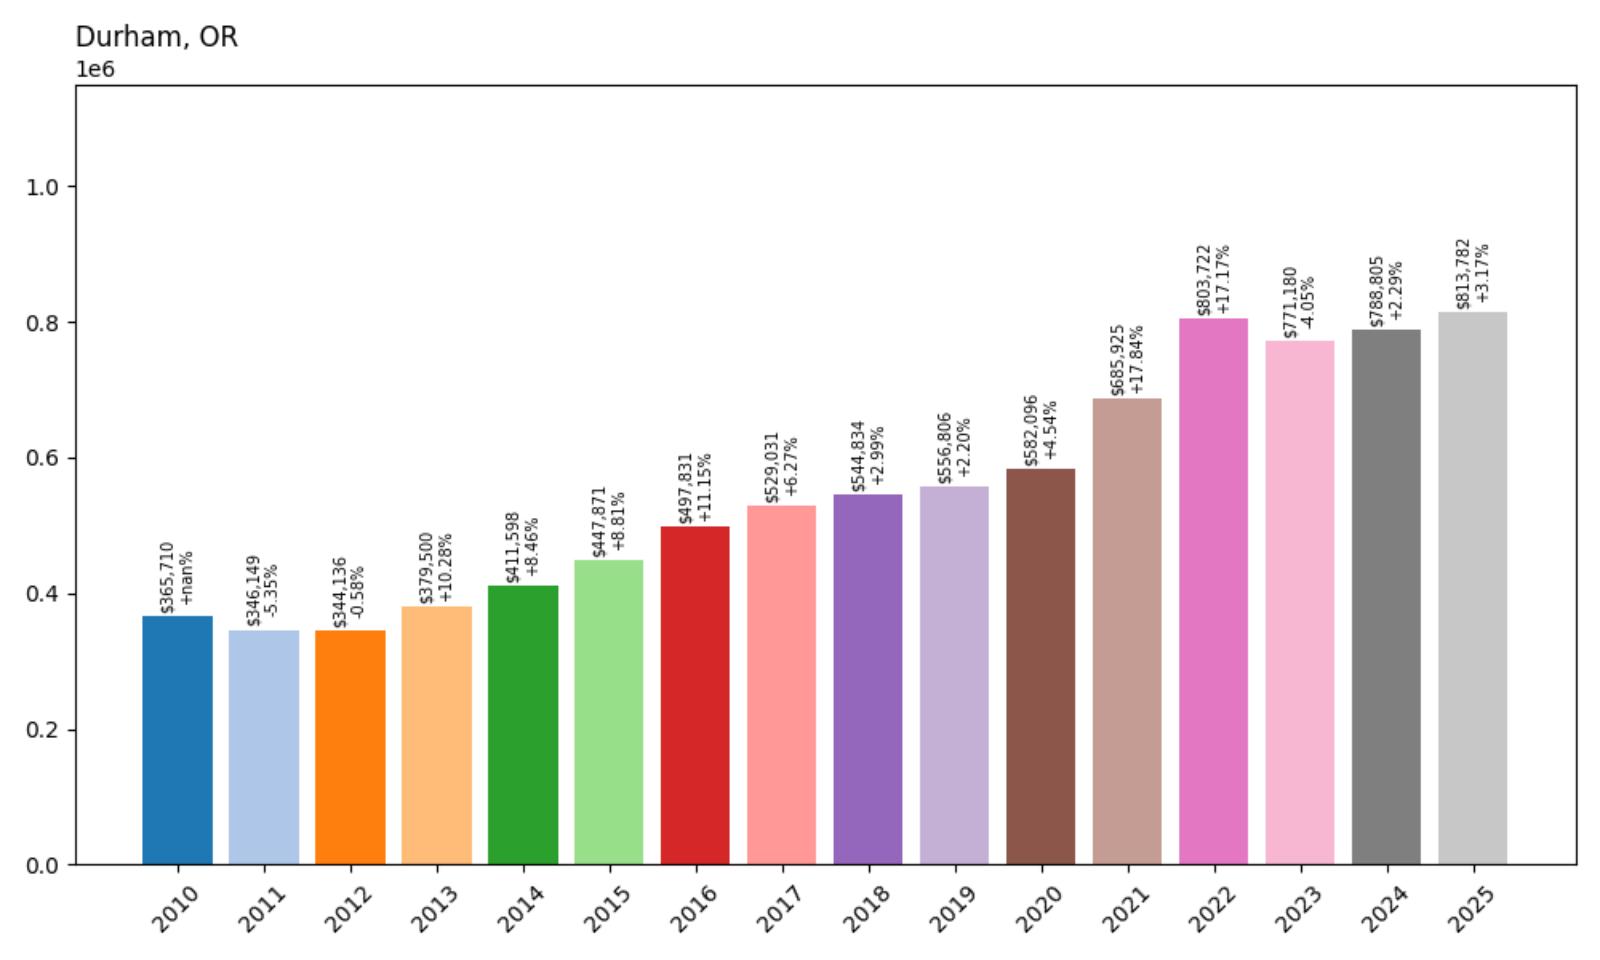
- 2010: $365,710
- 2011: $346,149 (−$19,560, −5.35% from previous year)
- 2012: $344,136 (−$2,014, −0.58% from previous year)
- 2013: $379,500 (+$35,365, +10.28% from previous year)
- 2014: $411,598 (+$32,098, +8.46% from previous year)
- 2015: $447,871 (+$36,273, +8.81% from previous year)
- 2016: $497,831 (+$49,959, +11.15% from previous year)
- 2017: $529,031 (+$31,201, +6.27% from previous year)
- 2018: $544,834 (+$15,802, +2.99% from previous year)
- 2019: $556,806 (+$11,973, +2.20% from previous year)
- 2020: $582,096 (+$25,289, +4.54% from previous year)
- 2021: $685,925 (+$103,829, +17.84% from previous year)
- 2022: $803,722 (+$117,797, +17.17% from previous year)
- 2023: $771,180 (−$32,542, −4.05% from previous year)
- 2024: $788,805 (+$17,625, +2.29% from previous year)
- 2025: $813,782 (+$24,977, +3.17% from previous year)
Durham’s home prices rose from $344,136 in 2012 to $813,782 in 2025, a 136.4% increase over 13 years. After peaking in 2022, values briefly dipped but rebounded in 2024 and 2025, showing a strong recovery and continued demand for real estate in the area.
Durham – A Small Town with Big Appeal
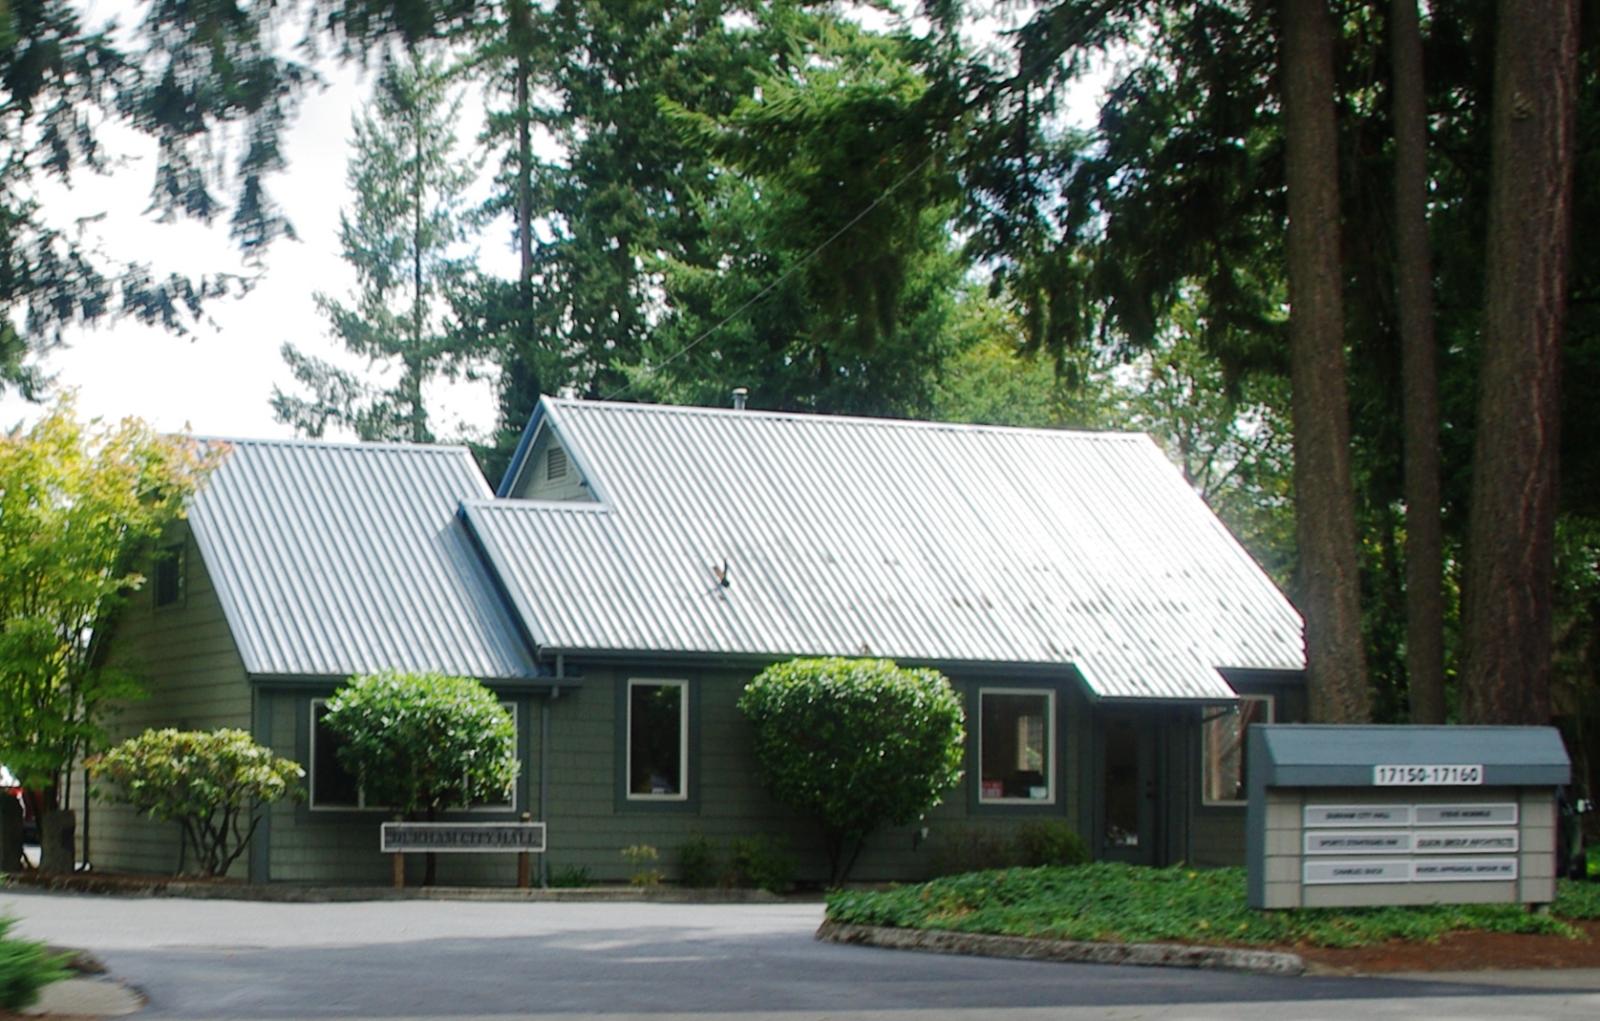
Durham may be one of Oregon’s smallest incorporated cities by land area, but it punches well above its weight when it comes to home values. Tucked between Tigard, Tualatin, and Lake Oswego, Durham offers a prime location within the Portland metro without feeling congested. It’s mostly residential, surrounded by parks and green space like Durham City Park and Cook Park along the Tualatin River. This has made it particularly attractive to families and professionals looking for a quiet, forested setting with easy freeway access to I-5 and Hwy 217.
With home values now surpassing $800,000, Durham has transitioned from an overlooked suburb into one of the more exclusive corners of the region. Its limited land availability and resistance to overdevelopment have helped protect property values. While the 2023 dip raised some eyebrows, the quick rebound in 2024 and 2025 confirms that demand remains solid. For buyers seeking a peaceful pocket close to major job centers and amenities, Durham continues to hold strong appeal—and that’s clearly reflected in its home price trends.
7. Sisters – 156.4% Home Price Increase Since 2012
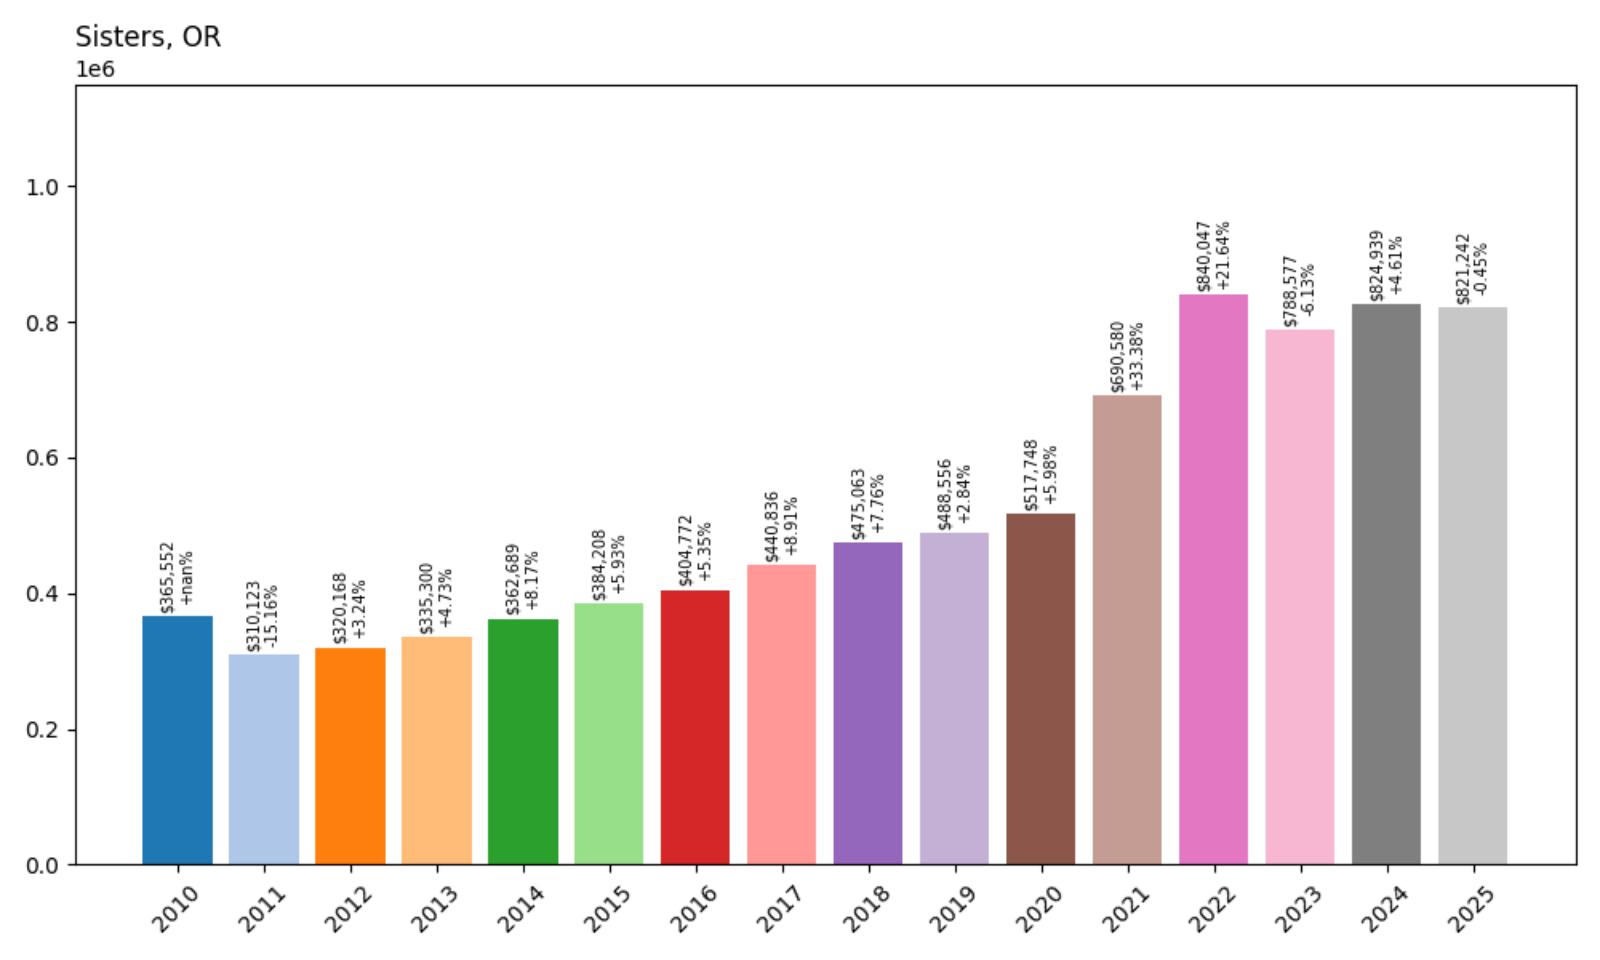
- 2010: $365,552
- 2011: $310,123 (−$55,430, −15.16% from previous year)
- 2012: $320,168 (+$10,045, +3.24% from previous year)
- 2013: $335,300 (+$15,132, +4.73% from previous year)
- 2014: $362,689 (+$27,389, +8.17% from previous year)
- 2015: $384,208 (+$21,519, +5.93% from previous year)
- 2016: $404,772 (+$20,564, +5.35% from previous year)
- 2017: $440,836 (+$36,064, +8.91% from previous year)
- 2018: $475,063 (+$34,228, +7.76% from previous year)
- 2019: $488,556 (+$13,492, +2.84% from previous year)
- 2020: $517,748 (+$29,192, +5.98% from previous year)
- 2021: $690,580 (+$172,832, +33.38% from previous year)
- 2022: $840,047 (+$149,467, +21.64% from previous year)
- 2023: $788,577 (−$51,469, −6.13% from previous year)
- 2024: $824,939 (+$36,362, +4.61% from previous year)
- 2025: $821,242 (−$3,697, −0.45% from previous year)
Sisters has experienced a remarkable 156.4% increase in home values since 2012, moving from $320,168 to $821,242 in 2025. The largest single-year jump came in 2021, where values leapt by over $170,000. Despite a dip in 2023, the market quickly rebounded, affirming the area’s long-term desirability and resilience.
Sisters – A High-Elevation Market with Scenic Momentum

Perched at the edge of the Cascade Mountains, Sisters is a magnet for outdoor lovers, retirees, and remote workers alike. Known for its postcard-perfect downtown and western-themed architecture, this small town offers a blend of boutique charm and access to vast natural surroundings. Whether it’s hiking in the Three Sisters Wilderness, fishing in nearby rivers, or skiing at Hoodoo, the lifestyle appeal here is undeniable. That draw has increasingly translated into higher home values, particularly post-2020 when remote work trends pushed buyers toward smaller scenic markets like Sisters with strong broadband and recreation opportunities.
What stands out about Sisters is its consistent growth trajectory followed by major leaps during pandemic-era market shifts. Even with a notable price correction in 2023, values surged again in 2024, reflecting renewed interest and a strong market floor. With median home prices now over $820,000, this former frontier town has matured into a premium destination for buyers seeking natural beauty and a vibrant, small-town community. Limited housing stock and zoning controls have also helped maintain upward pressure on prices, ensuring Sisters continues to rank among the most expensive places to live in Oregon.
6. Manzanita – 121.8% Home Price Increase Since 2012
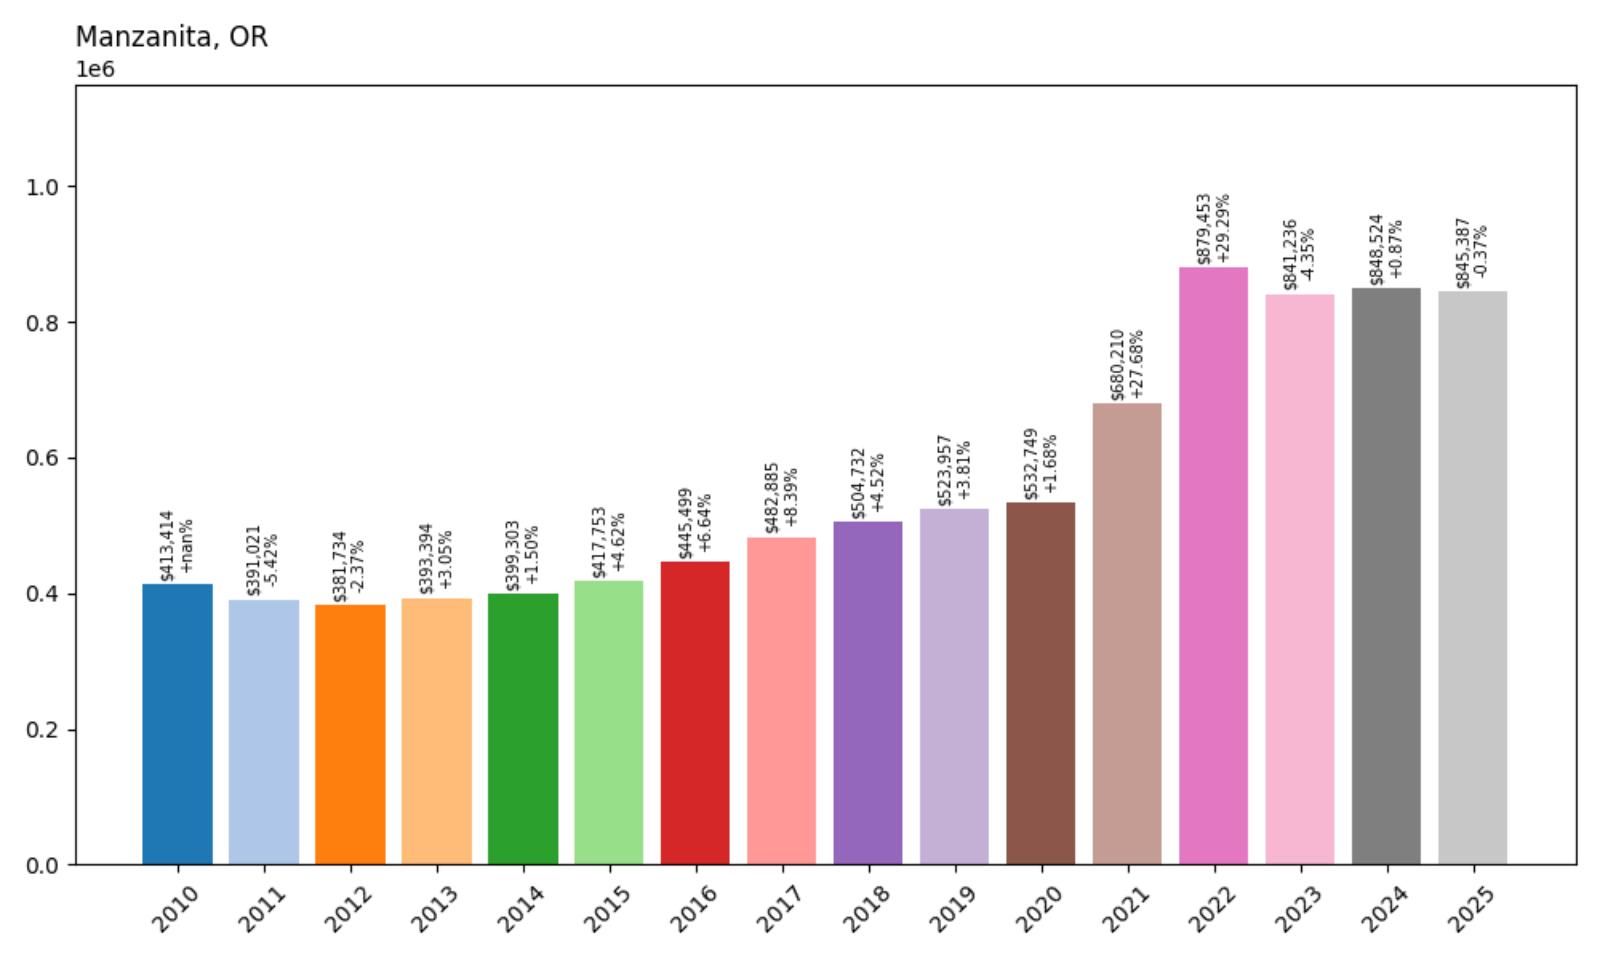
- 2010: $413,414
- 2011: $391,021 (−$22,393, −5.42% from previous year)
- 2012: $381,734 (−$9,287, −2.37% from previous year)
- 2013: $393,394 (+$11,660, +3.05% from previous year)
- 2014: $399,303 (+$5,909, +1.50% from previous year)
- 2015: $417,753 (+$18,450, +4.62% from previous year)
- 2016: $445,499 (+$27,746, +6.64% from previous year)
- 2017: $482,885 (+$37,386, +8.39% from previous year)
- 2018: $504,732 (+$21,846, +4.52% from previous year)
- 2019: $523,957 (+$19,226, +3.81% from previous year)
- 2020: $532,749 (+$8,792, +1.68% from previous year)
- 2021: $680,210 (+$147,461, +27.68% from previous year)
- 2022: $879,453 (+$199,243, +29.29% from previous year)
- 2023: $841,236 (−$38,217, −4.35% from previous year)
- 2024: $848,524 (+$7,288, +0.87% from previous year)
- 2025: $845,387 (−$3,137, −0.37% from previous year)
Manzanita’s home prices have surged by 121.8% since 2012, climbing from $381,734 to $845,387 in 2025. The largest growth spurt came between 2020 and 2022, when the median value soared by nearly $350,000 in just two years. Although prices dipped in 2023 and saw minor movement in 2024–2025, overall growth remains substantial and shows how this coastal retreat continues to command top-tier prices.
Manzanita – Tranquil Beaches and Soaring Property Values
Manzanita is a small town on the northern Oregon Coast known for its uncrowded beach, artistic flair, and low-key, upscale atmosphere. Unlike busier coastal destinations like Seaside or Lincoln City, Manzanita’s appeal lies in its quiet sophistication. The town offers dramatic ocean views, charming local shops, and proximity to Neahkahnie Mountain, which provides outdoor enthusiasts with excellent hiking and panoramic vistas. This restrained development and natural beauty create an exclusive feel that has driven demand for second homes and retirement properties over the past decade. The lack of commercial clutter helps maintain a sense of escape, and homebuyers seeking peace and scenery have increasingly set their sights here.
Much of Manzanita’s dramatic price appreciation happened between 2020 and 2022, when remote work trends and pandemic-era relocations pushed buyers toward scenic and tranquil locations. During that time, the town added nearly $350,000 to its median home value. Even with slight market corrections in the years that followed, prices in 2025 remain more than double what they were in 2012. Manzanita’s limited inventory, paired with enduring demand for coastal real estate, makes it one of Oregon’s most expensive—and sought-after—beach towns. As of 2025, homes here average over $845,000, securing Manzanita’s place as a top-tier coastal market with long-term growth potential.
5. Lake Oswego – 136.3% Home Price Increase Since 2012

- 2010: $436,499
- 2011: $400,470 (−$36,029, −8.25% from previous year)
- 2012: $377,722 (−$22,749, −5.68% from previous year)
- 2013: $414,770 (+$37,049, +9.81% from previous year)
- 2014: $455,862 (+$41,092, +9.91% from previous year)
- 2015: $490,433 (+$34,571, +7.58% from previous year)
- 2016: $546,627 (+$56,194, +11.46% from previous year)
- 2017: $583,579 (+$36,952, +6.76% from previous year)
- 2018: $600,863 (+$17,284, +2.96% from previous year)
- 2019: $608,566 (+$7,703, +1.28% from previous year)
- 2020: $631,566 (+$23,000, +3.78% from previous year)
- 2021: $759,653 (+$128,087, +20.28% from previous year)
- 2022: $891,941 (+$132,288, +17.41% from previous year)
- 2023: $868,404 (−$23,537, −2.64% from previous year)
- 2024: $883,805 (+$15,401, +1.77% from previous year)
- 2025: $893,051 (+$9,246, +1.05% from previous year)
Lake Oswego’s home prices have climbed from $377,722 in 2012 to $893,051 in 2025—an impressive 136.3% increase. The biggest leaps came during 2021 and 2022, with nearly $260,000 added in just two years. While the market softened slightly in 2023, prices regained ground and continue to reflect strong demand for this high-end Portland suburb.
Lake Oswego – Luxury, Lifestyle, and Long-Term Demand
Lake Oswego is synonymous with wealth, prestige, and upscale living in the Portland metro area. Set around its namesake lake and backed by lush hills, the town boasts some of Oregon’s most exclusive real estate, along with top-rated schools, country clubs, and boutique shopping. The downtown core is walkable and refined, offering high-end dining and a strong sense of community. These features make it a magnet for both longtime Oregon residents and transplants looking for a quiet, beautiful, and well-managed place to live within commuting distance to downtown Portland.
The housing market here is shaped by persistent demand and limited space for expansion, which helps explain the consistently strong appreciation. During the 2021–2022 boom, prices skyrocketed—driven by buyers flush with equity and eager to invest in lifestyle-focused locations. While Lake Oswego is not immune to broader market corrections, its fundamentals remain strong: low inventory, stable incomes, and consistently high desirability. By 2025, values reached nearly $900,000, cementing Lake Oswego’s position as one of Oregon’s most expensive—and resilient—housing markets.
4. Cannon Beach – 124.7% Home Price Increase Since 2012
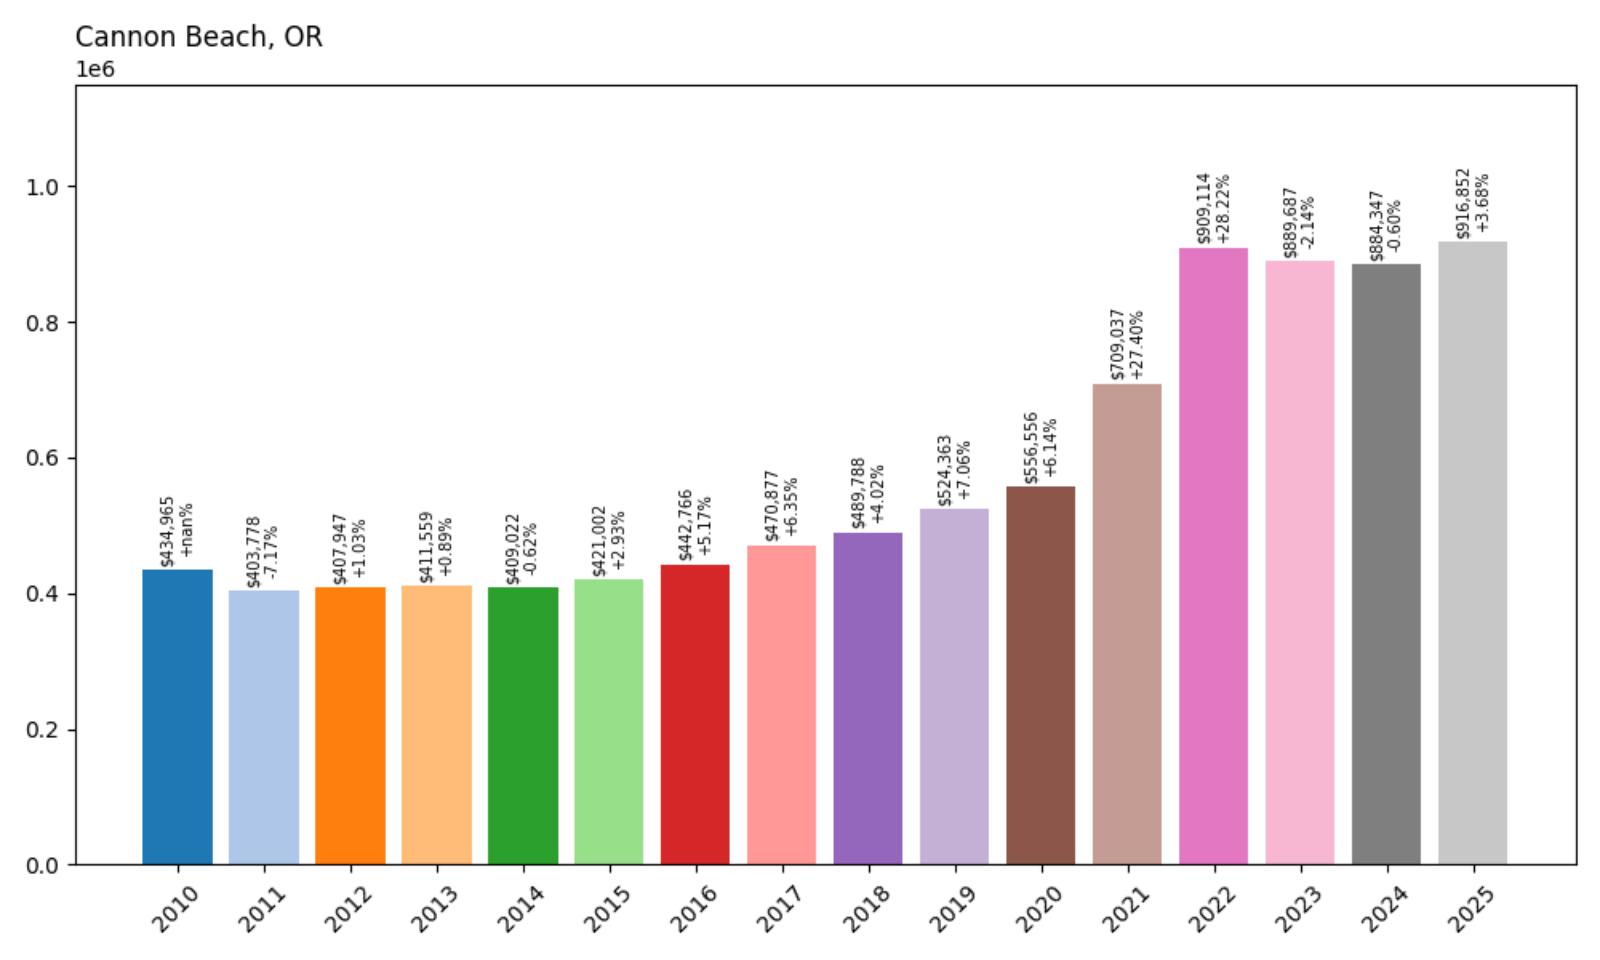
- 2010: $434,965
- 2011: $403,778 (−$31,188, −7.17% from previous year)
- 2012: $407,947 (+$4,169, +1.03% from previous year)
- 2013: $411,559 (+$3,612, +0.89% from previous year)
- 2014: $409,022 (−$2,537, −0.62% from previous year)
- 2015: $421,002 (+$11,981, +2.93% from previous year)
- 2016: $442,766 (+$21,764, +5.17% from previous year)
- 2017: $470,877 (+$28,111, +6.35% from previous year)
- 2018: $489,788 (+$18,911, +4.02% from previous year)
- 2019: $524,363 (+$34,575, +7.06% from previous year)
- 2020: $556,556 (+$32,193, +6.14% from previous year)
- 2021: $709,037 (+$152,480, +27.40% from previous year)
- 2022: $909,114 (+$200,078, +28.22% from previous year)
- 2023: $889,687 (−$19,427, −2.14% from previous year)
- 2024: $884,347 (−$5,340, −0.60% from previous year)
- 2025: $916,852 (+$32,505, +3.68% from previous year)
Since 2012, Cannon Beach’s home values have surged from $407,947 to $916,852—up 124.7%. The bulk of this growth came from 2020 to 2022, when the median price rose by more than $350,000. Despite minor declines in 2023 and 2024, prices are climbing again in 2025, keeping this coastal favorite firmly in Oregon’s top-tier real estate markets.
Cannon Beach – Oregon’s Most Iconic Coastal Town
Cannon Beach is famous for its dramatic shoreline, Haystack Rock, and charming downtown art galleries. It’s one of the most recognized and frequently visited beach towns in the Pacific Northwest, attracting tourists and homebuyers alike. The town enforces strict building codes to preserve its small-town charm and scenic integrity, which naturally limits new development and drives up property values. While primarily known as a vacation and second-home market, an increasing number of retirees and remote workers have made Cannon Beach their permanent residence.
The town’s appeal exploded during the pandemic housing boom, and its price history reflects that with back-to-back double-digit gains in 2021 and 2022. Even though values dipped slightly in the two years that followed, they rebounded in 2025 and now sit at over $916,000. As supply remains constrained and short-term rental demand continues, Cannon Beach stands out as both a lifestyle haven and a durable real estate investment.
3. Raleigh Hills – 136.0% Home Price Increase Since 2012
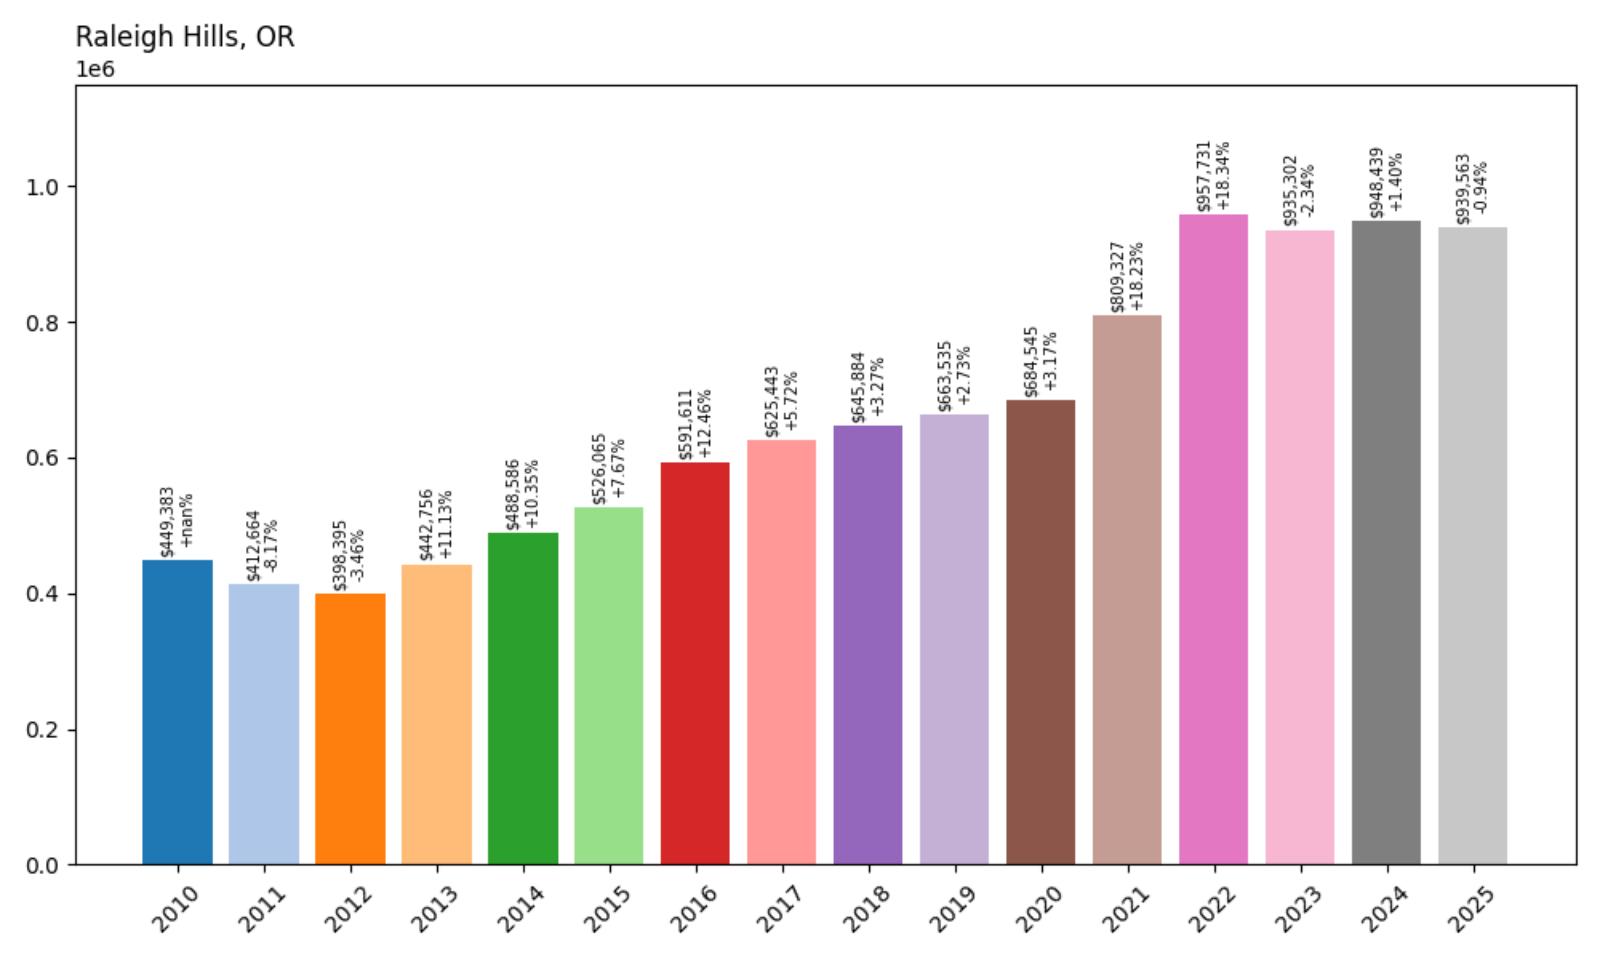
- 2010: $449,383
- 2011: $412,664 (−$36,719, −8.17% from previous year)
- 2012: $398,395 (−$14,269, −3.46% from previous year)
- 2013: $442,756 (+$44,361, +11.13% from previous year)
- 2014: $488,586 (+$45,830, +10.35% from previous year)
- 2015: $526,065 (+$37,479, +7.67% from previous year)
- 2016: $591,611 (+$65,546, +12.46% from previous year)
- 2017: $625,443 (+$33,832, +5.72% from previous year)
- 2018: $645,884 (+$20,441, +3.27% from previous year)
- 2019: $663,535 (+$17,651, +2.73% from previous year)
- 2020: $684,545 (+$21,010, +3.17% from previous year)
- 2021: $809,327 (+$124,782, +18.23% from previous year)
- 2022: $957,731 (+$148,404, +18.34% from previous year)
- 2023: $935,302 (−$22,429, −2.34% from previous year)
- 2024: $948,439 (+$13,137, +1.40% from previous year)
- 2025: $939,563 (−$8,876, −0.94% from previous year)
Raleigh Hills saw a 136.0% increase in home values from $398,395 in 2012 to $939,563 in 2025. Most of that growth occurred between 2015 and 2022, with values nearly doubling in just seven years. Though the last two years included minor fluctuations, the overall trend shows strong long-term appreciation.
Raleigh Hills – Quiet Elegance Near the Portland Core
Located just west of Portland, Raleigh Hills offers a blend of urban convenience and suburban peace. Its tree-lined streets and proximity to downtown, Washington Square Mall, and excellent schools make it a preferred location for professionals and families alike. Though often overshadowed by flashier neighbors like Beaverton or Lake Oswego, Raleigh Hills has quietly built a reputation for spacious homes, stable neighborhoods, and strong property values. The community vibe here is peaceful and established—ideal for those looking to escape Portland’s density without sacrificing accessibility.
The housing data reveals Raleigh Hills’ enduring appeal. Its values rose steadily before spiking dramatically during the 2021–2022 period. Even with some price softening afterward, homes in this area remain among the most valuable in the state. With 2025 values above $930,000, Raleigh Hills is a clear example of how location and livability continue to anchor real estate markets in Oregon’s inner suburbs.
2. Arch Cape – 117.4% Home Price Increase Since 2012
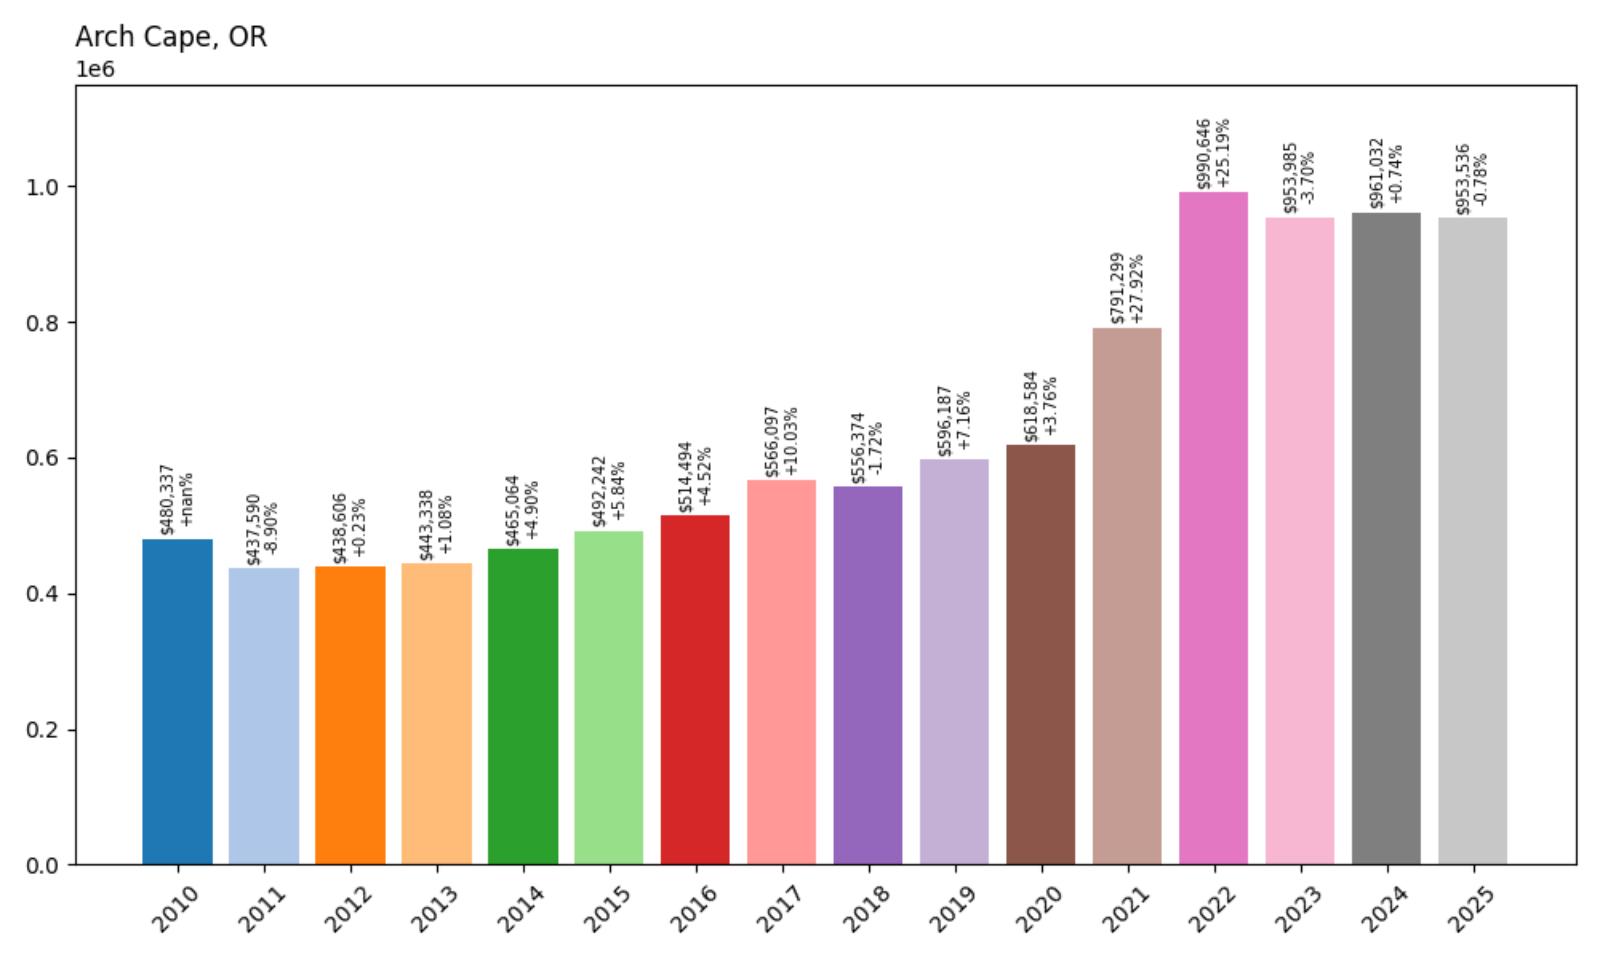
- 2010: $480,337
- 2011: $437,590 (−$42,747, −8.90% from previous year)
- 2012: $438,606 (+$1,016, +0.23% from previous year)
- 2013: $443,338 (+$4,732, +1.08% from previous year)
- 2014: $465,064 (+$21,727, +4.90% from previous year)
- 2015: $492,242 (+$27,178, +5.84% from previous year)
- 2016: $514,494 (+$22,252, +4.52% from previous year)
- 2017: $566,097 (+$51,603, +10.03% from previous year)
- 2018: $556,374 (−$9,723, −1.72% from previous year)
- 2019: $596,187 (+$39,813, +7.16% from previous year)
- 2020: $618,584 (+$22,396, +3.76% from previous year)
- 2021: $791,299 (+$172,716, +27.92% from previous year)
- 2022: $990,646 (+$199,347, +25.19% from previous year)
- 2023: $953,985 (−$36,661, −3.70% from previous year)
- 2024: $961,032 (+$7,047, +0.74% from previous year)
- 2025: $953,536 (−$7,496, −0.78% from previous year)
Arch Cape’s home prices have risen by 117.4% since 2012, increasing from $438,606 to $953,536 in 2025. The most dramatic gains came during 2021 and 2022, with back-to-back increases totaling more than $370,000. While prices pulled back slightly in later years, the long-term growth trend remains one of the steepest on Oregon’s coast.
Arch Cape – Secluded, Scenic, and Highly Prized
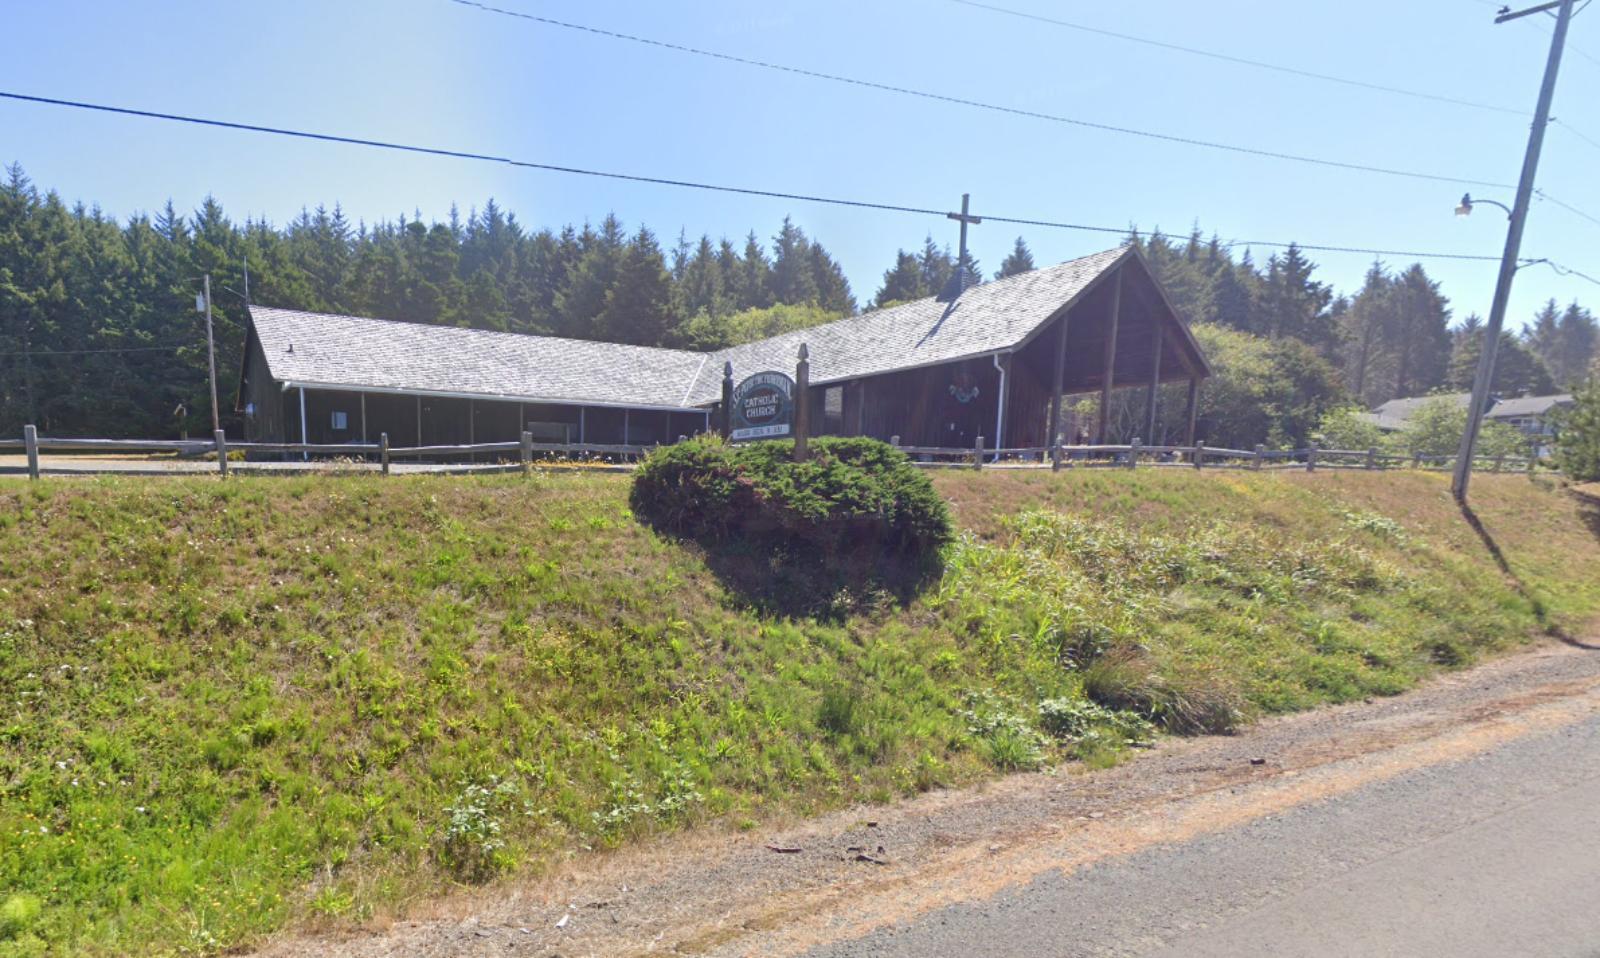
Arch Cape is one of Oregon’s most exclusive coastal enclaves. Located just south of Cannon Beach, it offers dramatic cliffside views, rocky tide pools, and a sense of isolation that makes it ideal for private retreats. Unlike more developed beach towns, Arch Cape has no commercial center and minimal tourism infrastructure—features that make it especially appealing to high-net-worth buyers seeking solitude and scenery. Its limited housing stock, strict land-use protections, and location along the Pacific Ocean have kept demand high and supply low. As such, it’s no surprise that home values more than doubled over the past 13 years, with prices approaching $1 million as of 2025.
Most of Arch Cape’s explosive growth happened during the pandemic-era housing rush, when remote work and a desire for coastal seclusion led to intense competition in Oregon’s beach markets. In just two years, from 2020 to 2022, the median home price shot up by over $370,000. Although there’s been a mild correction since, the area has retained its position as one of the most expensive ZIP codes in the state. For buyers who prioritize privacy, proximity to natural beauty, and long-term investment potential, Arch Cape remains a top-tier choice. Its stability, scarcity of listings, and timeless appeal mean it’s likely to stay near the top of Oregon’s luxury real estate rankings for years to come.
1. Powell Butte – 232% Home Price Increase Since 2012
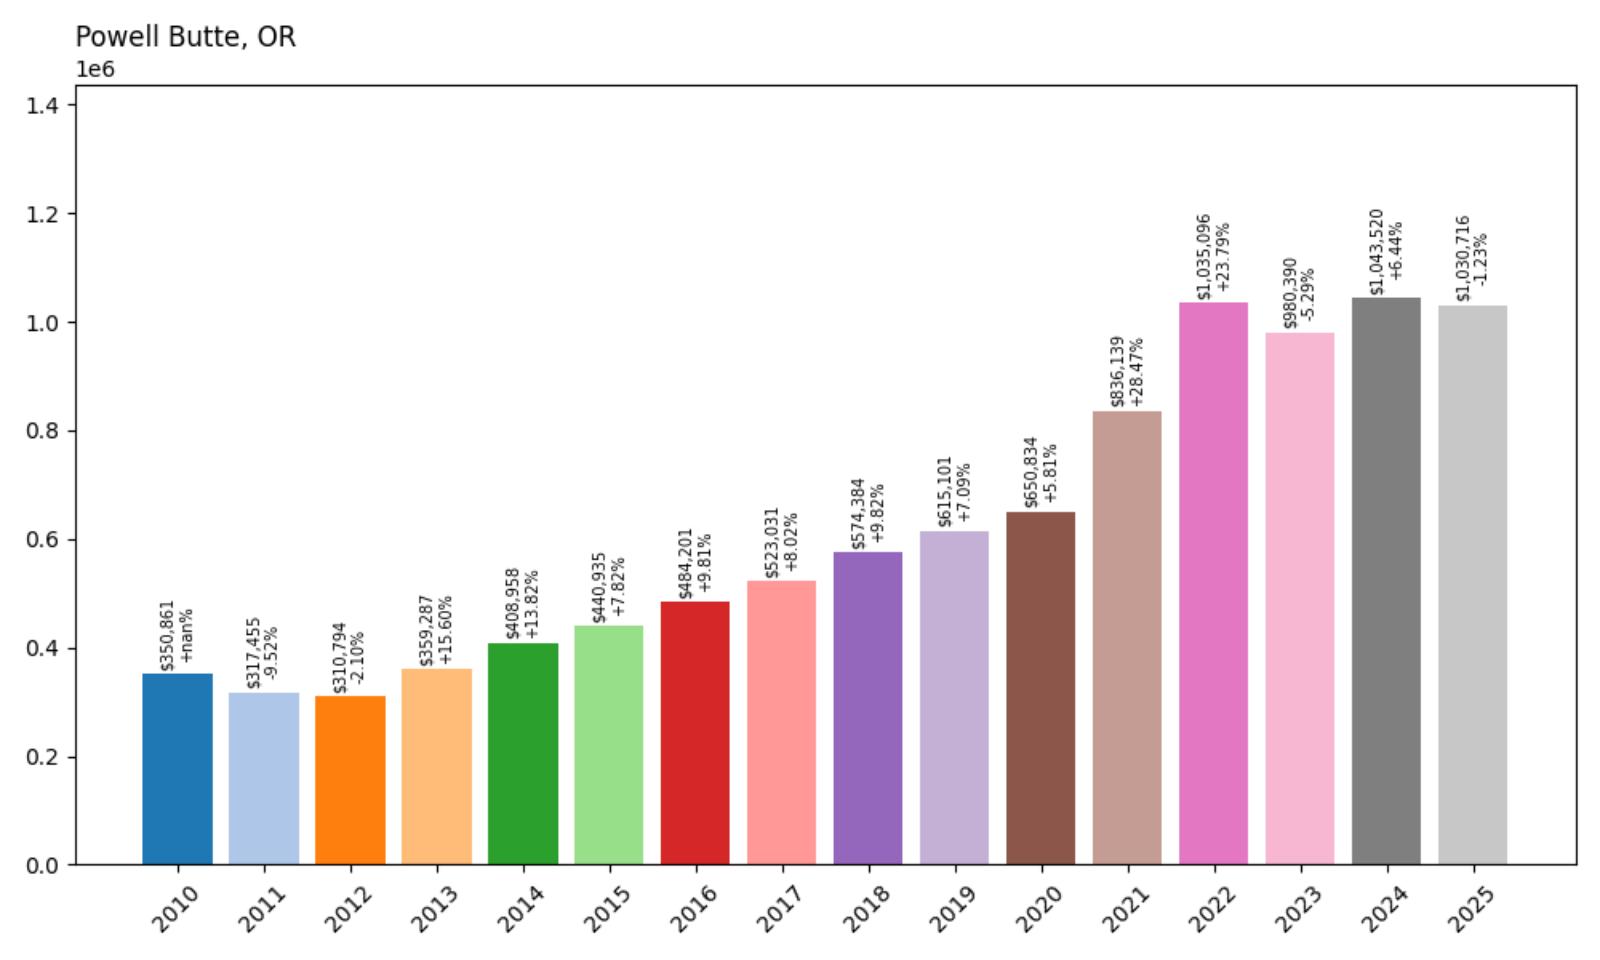
- 2010: $350,861
- 2011: $317,455 (−$33,406, −9.52% from previous year)
- 2012: $310,794 (−$6,660, −2.10% from previous year)
- 2013: $359,287 (+$48,493, +15.60% from previous year)
- 2014: $408,958 (+$49,671, +13.82% from previous year)
- 2015: $440,935 (+$31,977, +7.82% from previous year)
- 2016: $484,201 (+$43,266, +9.81% from previous year)
- 2017: $523,031 (+$38,830, +8.02% from previous year)
- 2018: $574,384 (+$51,353, +9.82% from previous year)
- 2019: $615,101 (+$40,717, +7.09% from previous year)
- 2020: $650,834 (+$35,733, +5.81% from previous year)
- 2021: $836,139 (+$185,305, +28.47% from previous year)
- 2022: $1,035,096 (+$198,957, +23.79% from previous year)
- 2023: $980,390 (−$54,706, −5.29% from previous year)
- 2024: $1,043,520 (+$63,130, +6.44% from previous year)
- 2025: $1,030,716 (−$12,804, −1.23% from previous year)
Powell Butte has seen a massive 232% increase in home prices since 2012, making it the fastest-appreciating town in Oregon by a wide margin. The median home value jumped from $310,794 in 2012 to $1,030,716 in 2025, more than tripling over a 13-year span. The town experienced a particularly intense surge between 2020 and 2022, when prices spiked by nearly $385,000 in just two years. Although 2023 saw a moderate dip, the rebound in 2024 helped stabilize prices well above the million-dollar threshold. For buyers and investors alike, Powell Butte’s housing trajectory reflects serious long-term momentum.
Powell Butte – Million-Dollar Homes in a Wide-Open Setting
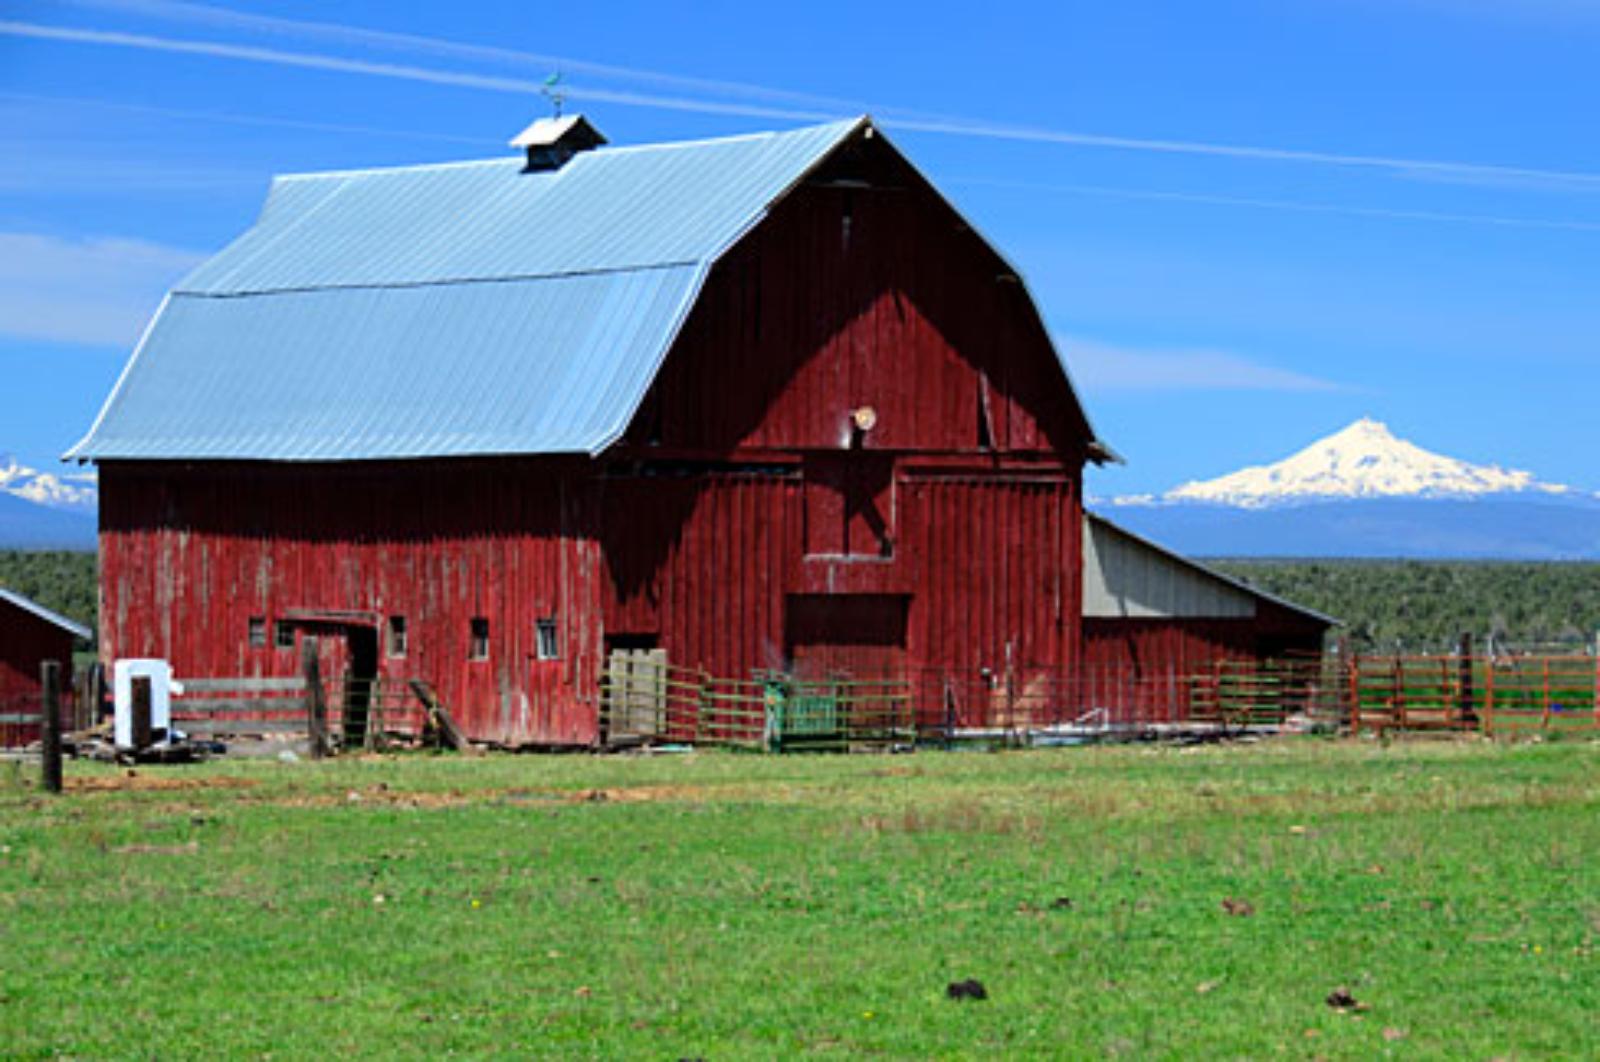
Powell Butte sits just outside Bend and Redmond in Central Oregon and has quietly become one of the most exclusive and fastest-growing luxury housing markets in the state. What was once a modest rural community is now home to sprawling estate properties, custom homes on acreage, and high-end developments like the acclaimed Brasada Ranch. Its scenic setting, with views of the Cascade Mountains and access to outdoor recreation, has proven irresistible for wealthy transplants, retirees, and professionals escaping city congestion. Unlike the urban growth seen elsewhere, Powell Butte’s expansion has been upscale and spacious, catering to buyers who want both luxury and land. That blend of open space and high-end amenities has propelled its housing market into the seven-figure bracket in just over a decade.
The steep climb in home values reflects more than just market trends—it points to a lifestyle shift among Oregon’s upper-tier buyers. In 2012, homes in Powell Butte were valued in the low $300,000s. By 2022, the average price had crossed the $1 million mark, a transformation fueled by increased demand for privacy, views, and resort-style living. Even with some price softening in 2023, the market remains remarkably strong. Buyers continue to be drawn by the town’s low-density layout, equestrian properties, and access to golf, hiking, and horseback trails. Powell Butte’s combination of natural beauty, limited inventory, and high desirability means that it’s likely to remain one of Oregon’s most valuable markets for years to come—and its #1 ranking here underscores just how much it has evolved.