🔥 Would you like to save this?
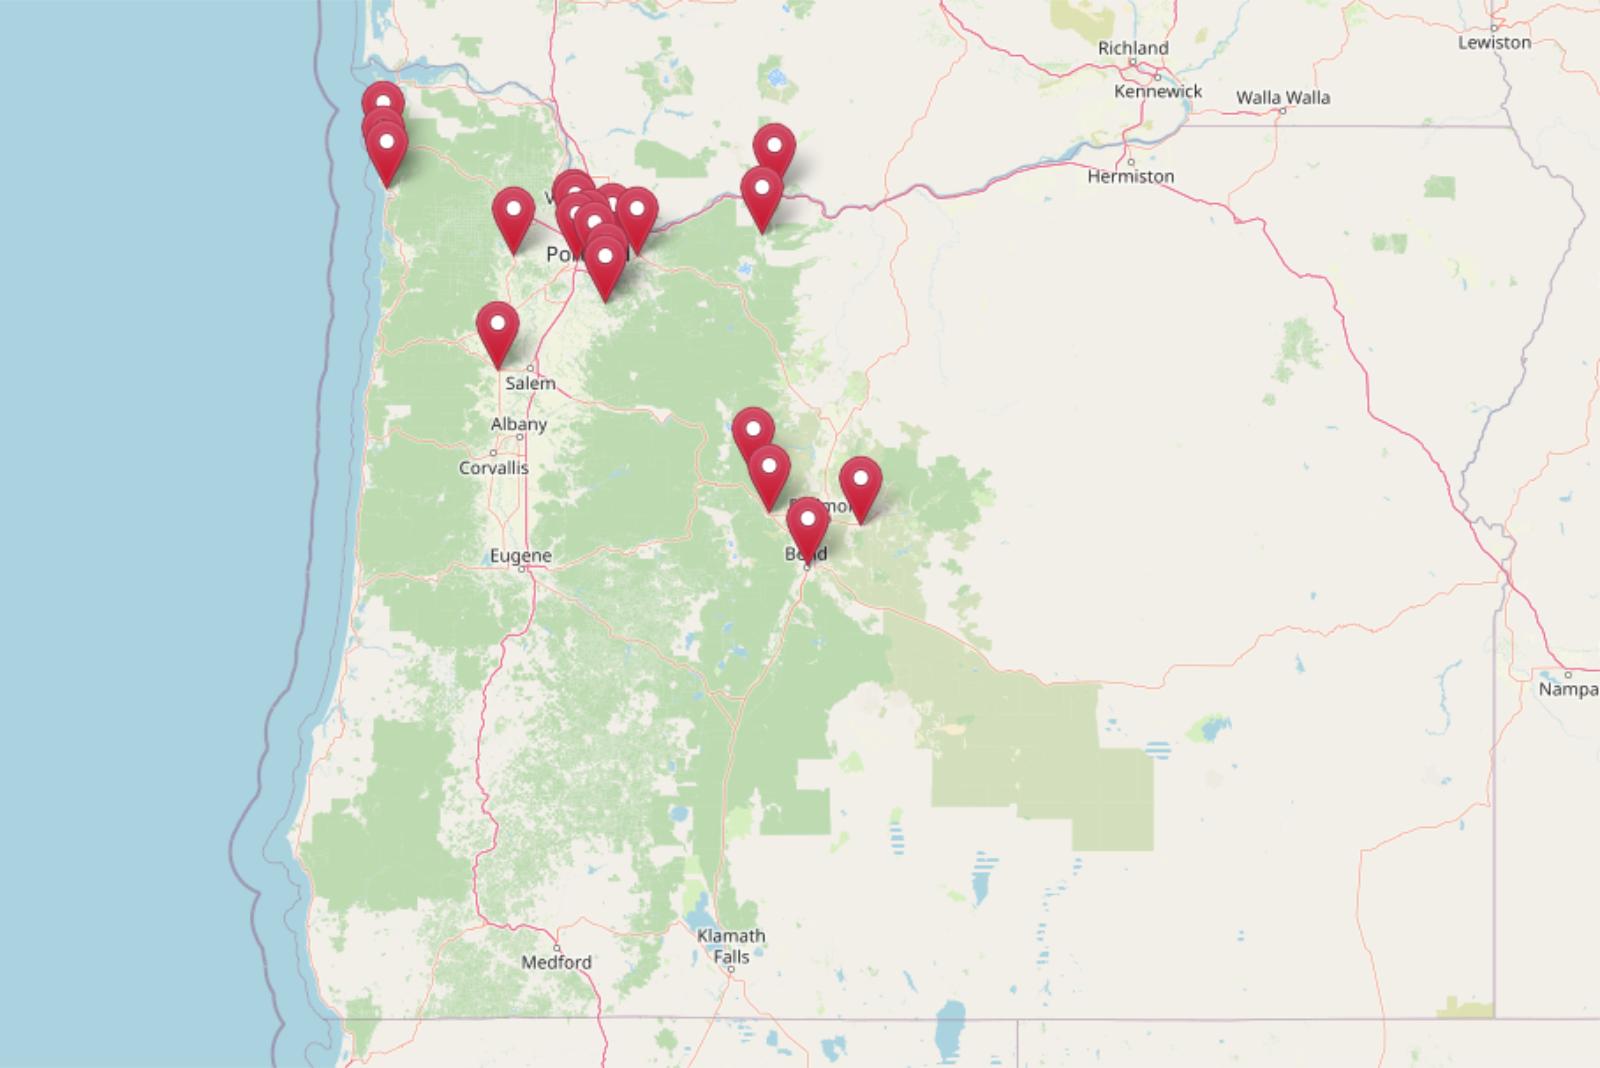
Oregon’s housing market has hit new highs in towns both big and small. According to the Zillow Home Value Index, property prices across the state have surged over the past decade, with some towns more than doubling in value since 2010. Whether it’s riverside communities, mountain getaways, or high-demand suburbs outside Portland, these 20 Oregon towns now rank among the most expensive places to buy a home. Each one reflects a mix of limited inventory, scenic appeal, and long-term buyer demand—explaining why prices keep climbing year after year.
20. Gaston – 137% Home Price Increase Since 2011
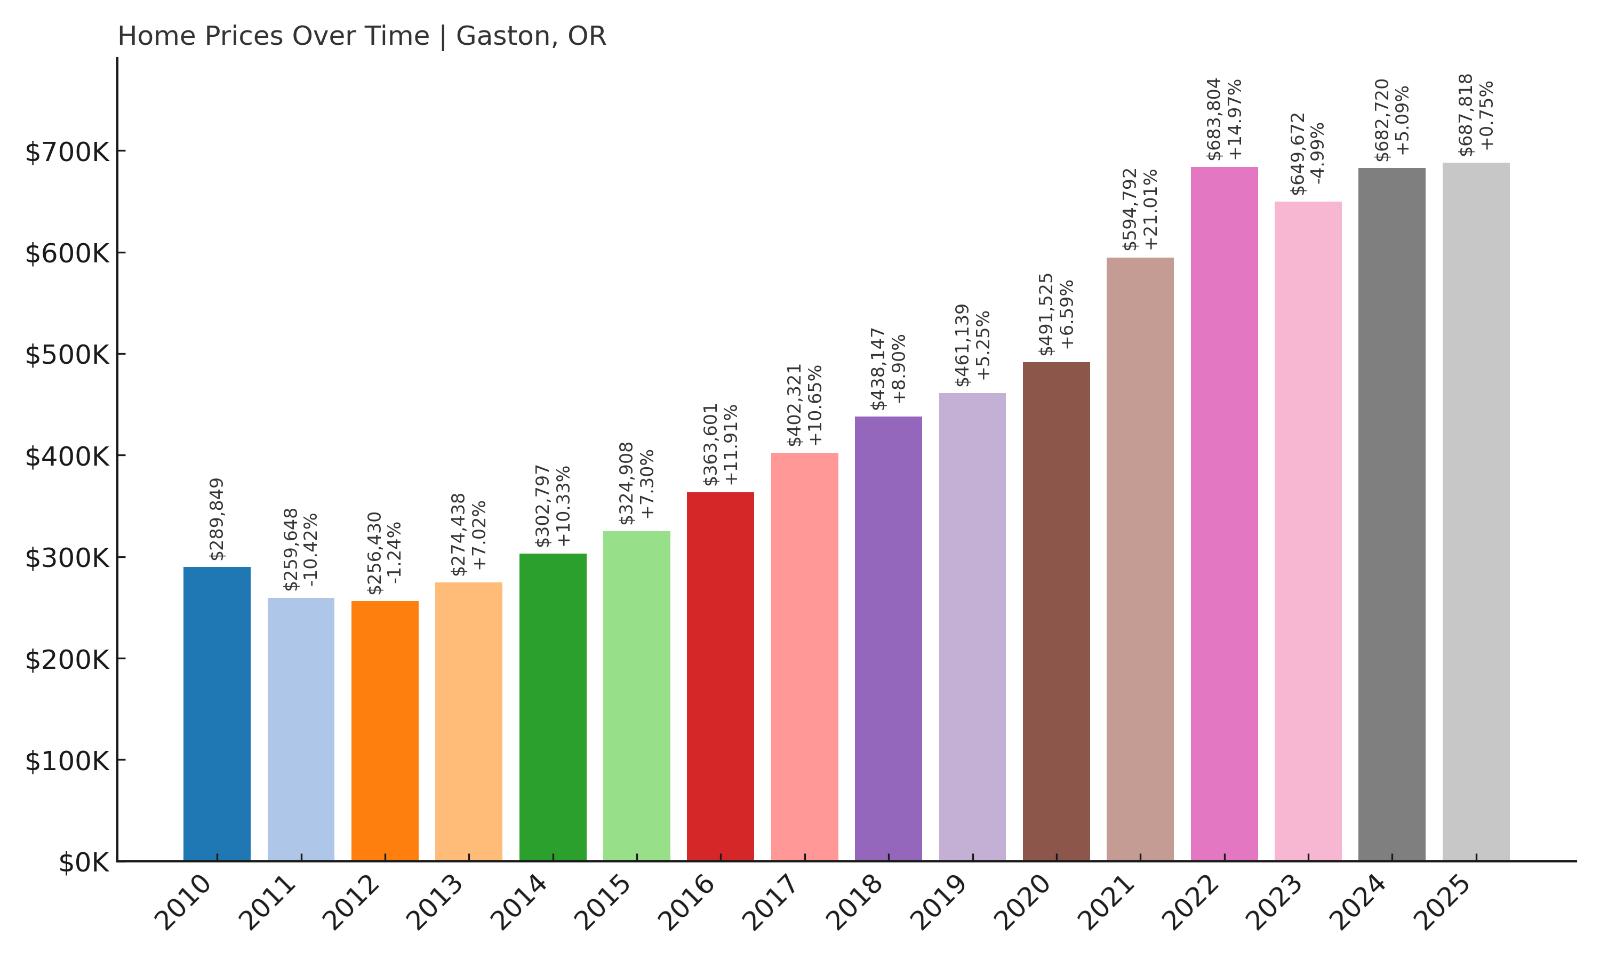
- 2010: $289,849
- 2011: $259,648 (-$30,201, -10.42% from previous year)
- 2012: $256,430 (-$3,218, -1.24% from previous year)
- 2013: $274,438 (+$18,008, +7.02% from previous year)
- 2014: $302,797 (+$28,359, +10.33% from previous year)
- 2015: $324,908 (+$22,111, +7.30% from previous year)
- 2016: $363,601 (+$38,693, +11.91% from previous year)
- 2017: $402,321 (+$38,720, +10.65% from previous year)
- 2018: $438,147 (+$35,826, +8.90% from previous year)
- 2019: $461,139 (+$22,992, +5.25% from previous year)
- 2020: $491,525 (+$30,386, +6.59% from previous year)
- 2021: $594,792 (+$103,267, +21.01% from previous year)
- 2022: $683,804 (+$89,012, +14.97% from previous year)
- 2023: $649,672 (-$34,132, -4.99% from previous year)
- 2024: $682,720 (+$33,048, +5.09% from previous year)
- 2025: $687,818 (+$5,098, +0.75% from previous year)
Gaston has seen a striking 137% increase in home values since 2011, climbing from just under $260K to nearly $688K in 2025. The town’s housing market bounced back quickly after the early-2010s slump, with consistent annual appreciation through 2022. Its largest annual jump came in 2021, when prices surged more than $100,000 in a single year. Though prices briefly dipped in 2023, they’ve mostly held strong and recovered modestly. Gaston’s year-by-year numbers reveal steady upward movement driven by long-term demand, with the market showing more resilience than volatility over time.
In order to come up with the very specific design ideas, we create most designs with the assistance of state-of-the-art AI interior design software.
Gaston – Small-Town Privacy Meets Wine Country Growth
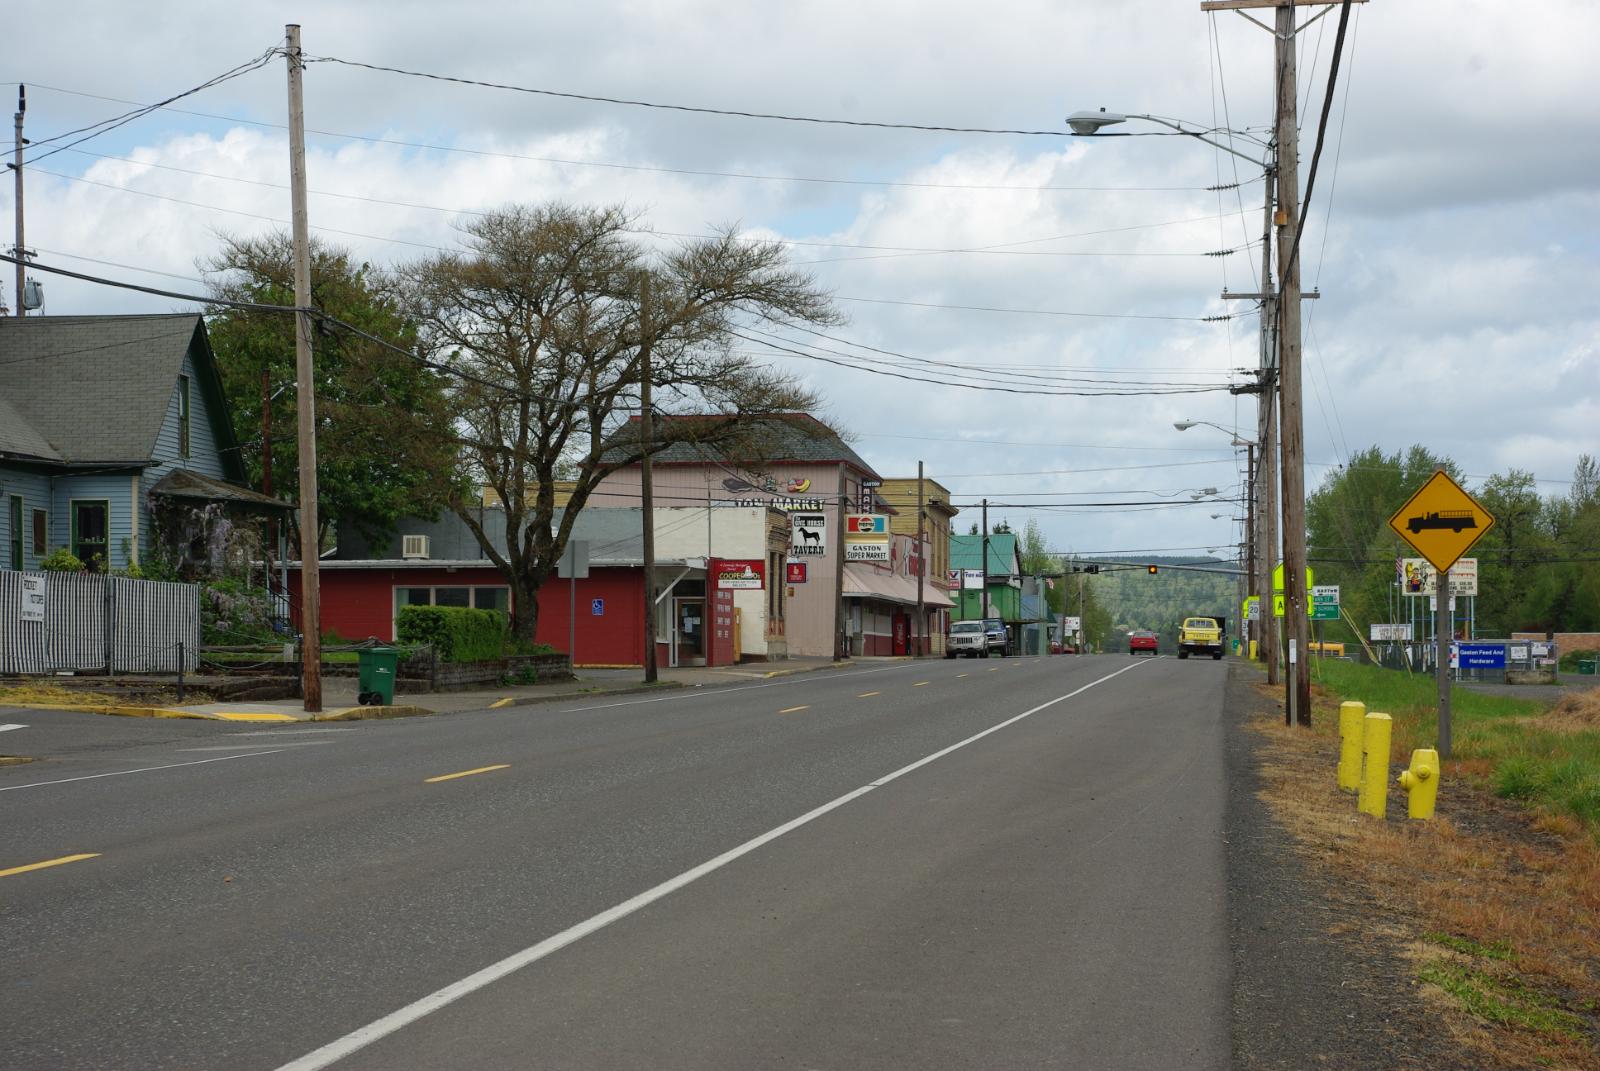
Located in Washington County, just west of Newberg and within reach of Portland’s tech corridor, Gaston is a small rural town that’s become increasingly attractive to buyers seeking space, charm, and access to Oregon’s wine country. With a population under 700, it’s not the kind of place typically associated with explosive price growth. But that quiet appeal is part of the story — especially as remote work and lifestyle changes have drawn attention to smaller communities with natural beauty. Gaston sits along the Tualatin Valley Scenic Drive, and is surrounded by vineyards and farmland, making it ideal for those seeking retreat without complete isolation.
The town’s real estate has benefited from both regional spillover and internal development. As nearby cities like Hillsboro and Forest Grove grew more expensive, Gaston emerged as a quieter alternative — still accessible, but with larger lots and more space per dollar. Its growth is tied closely to lifestyle-driven migration and a scarcity of new housing supply, which has kept prices high. As of 2025, homes here cost more than double what they did in 2011, marking it as one of Oregon’s standout markets for long-term appreciation.
19. Mount Hood Parkdale – 128% Home Price Increase Since 2011
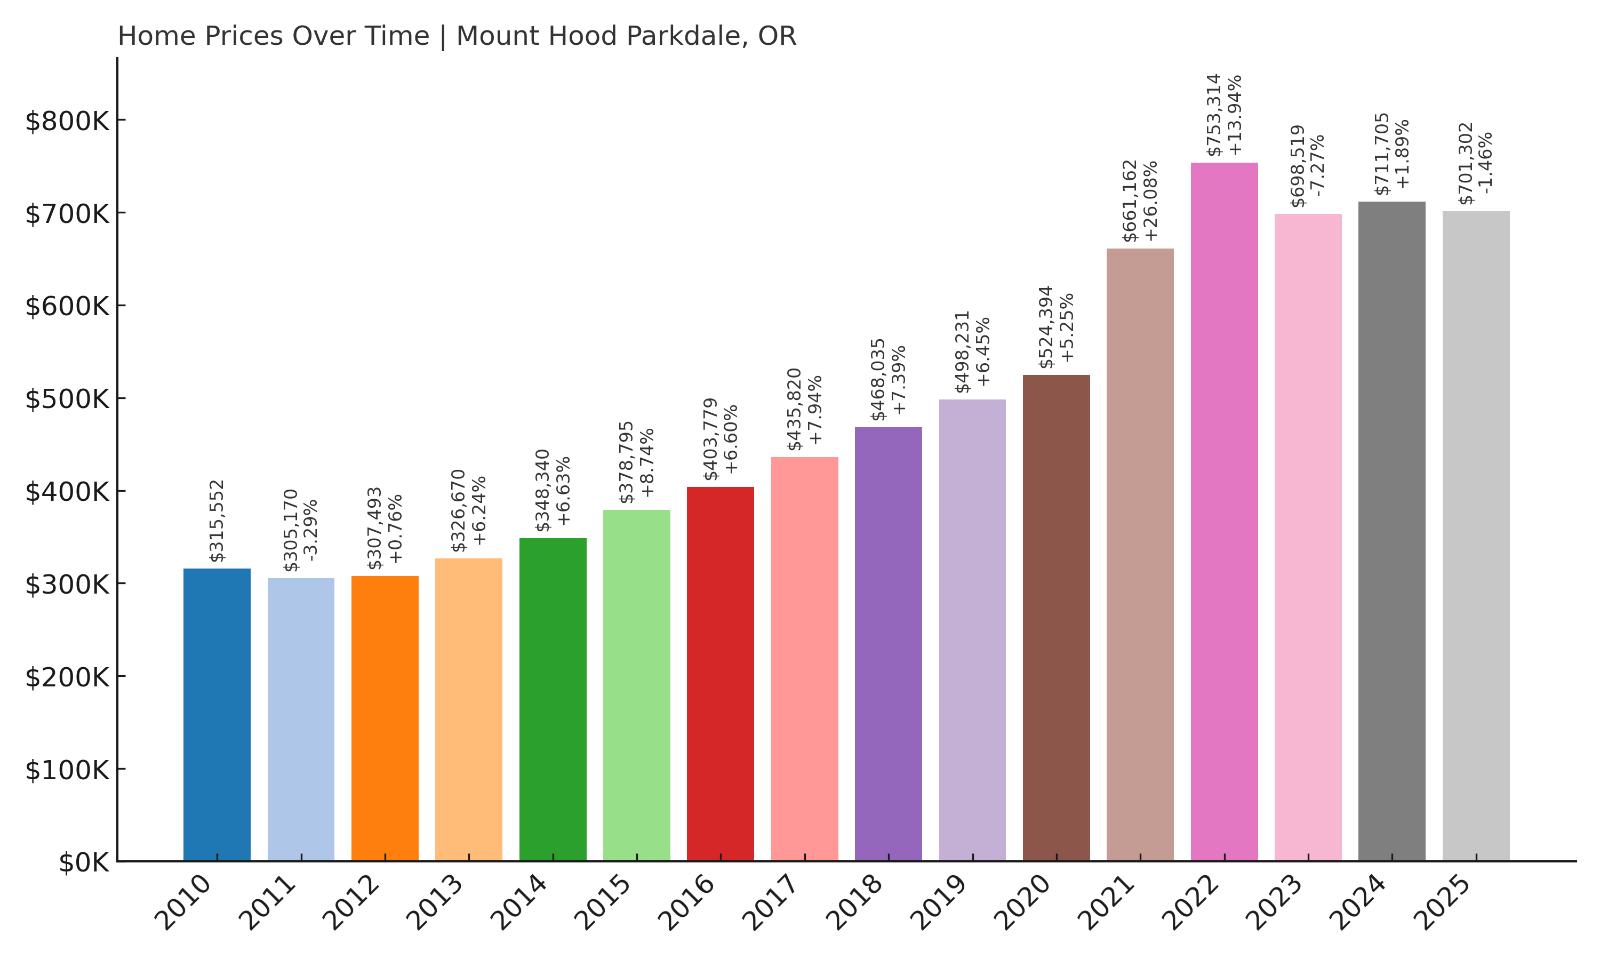
- 2010: $315,552
- 2011: $305,170 (-$10,381, -3.29% from previous year)
- 2012: $307,493 (+$2,323, +0.76% from previous year)
- 2013: $326,670 (+$19,176, +6.24% from previous year)
- 2014: $348,340 (+$21,671, +6.63% from previous year)
- 2015: $378,795 (+$30,454, +8.74% from previous year)
- 2016: $403,779 (+$24,984, +6.60% from previous year)
- 2017: $435,820 (+$32,041, +7.94% from previous year)
- 2018: $468,035 (+$32,215, +7.39% from previous year)
- 2019: $498,231 (+$30,196, +6.45% from previous year)
- 2020: $524,394 (+$26,164, +5.25% from previous year)
- 2021: $661,162 (+$136,768, +26.08% from previous year)
- 2022: $753,314 (+$92,152, +13.94% from previous year)
- 2023: $698,519 (-$54,795, -7.27% from previous year)
- 2024: $711,705 (+$13,186, +1.89% from previous year)
- 2025: $701,302 (-$10,403, -1.46% from previous year)
Mount Hood Parkdale has posted a 128% increase in home prices since 2011, with values rising from $305K to over $701K by 2025. The most rapid appreciation came between 2020 and 2022, when the area added over $225,000 in value across just two years. Though prices dipped in both 2023 and 2025, the overall trajectory remains sharply upward. Even with recent corrections, the current price is more than double its early 2010s level, indicating lasting demand in this rural mountain region.
Mount Hood Parkdale – High Elevation, Higher Demand
Situated in Hood River County at the foot of Oregon’s iconic Mount Hood, this small community offers unbeatable views, cool climate, and quick access to world-class skiing and hiking. Its scenic location and outdoor recreation have made it popular with second-home buyers and remote workers looking to relocate from Portland or out of state. The town is also near Hood River, a well-known outdoor mecca, further boosting demand. Despite its rural setting, Parkdale’s appeal has grown thanks to its unique balance of seclusion and access to amenities in nearby towns.
The post-pandemic years accelerated the town’s popularity, driving a sharp price surge in 2021 and 2022. As new residents discovered the area, limited inventory and protected zoning ensured prices stayed elevated. While there’s been some softening since the 2022 peak, current values remain historically high. Mount Hood Parkdale’s housing market now reflects not just lifestyle-driven interest, but a broader trend of premium pricing in Oregon’s most picturesque locales.
18. Happy Valley – 118% Home Price Increase Since 2012
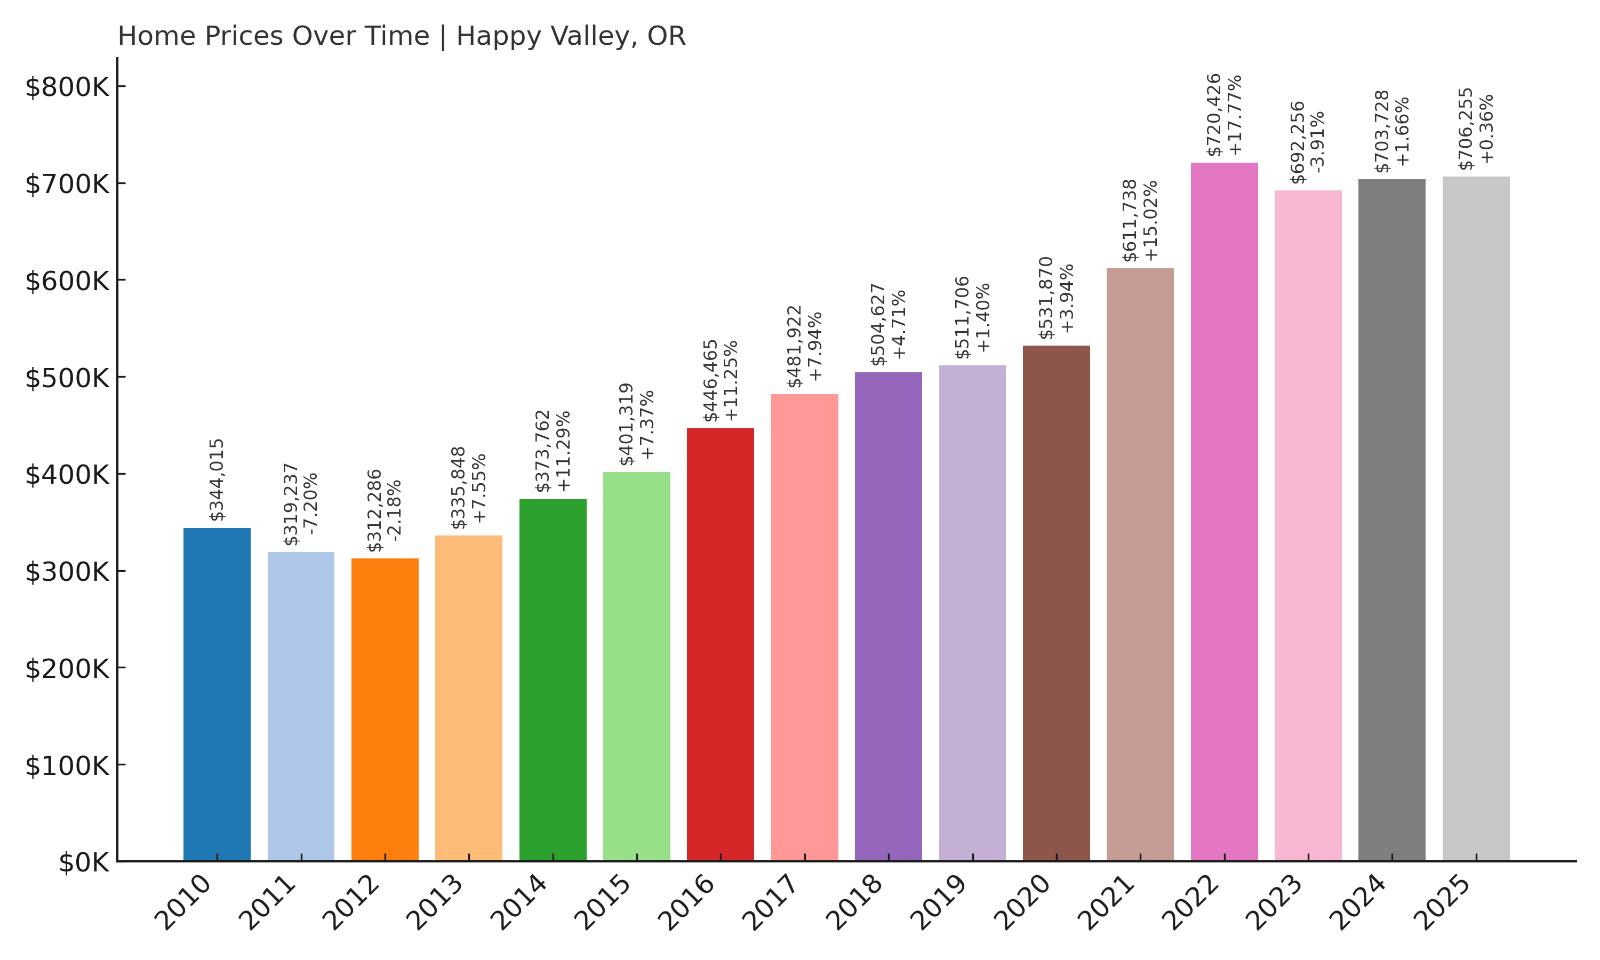
- 2010: $344,015
- 2011: $319,237 (-$24,778, -7.20% from previous year)
- 2012: $312,286 (-$6,951, -2.18% from previous year)
- 2013: $335,848 (+$23,562, +7.55% from previous year)
- 2014: $373,762 (+$37,914, +11.29% from previous year)
- 2015: $401,319 (+$27,557, +7.37% from previous year)
- 2016: $446,465 (+$45,146, +11.25% from previous year)
- 2017: $481,922 (+$35,457, +7.94% from previous year)
- 2018: $504,627 (+$22,705, +4.71% from previous year)
- 2019: $511,706 (+$7,079, +1.40% from previous year)
- 2020: $531,870 (+$20,164, +3.94% from previous year)
- 2021: $611,738 (+$79,868, +15.02% from previous year)
- 2022: $720,426 (+$108,689, +17.77% from previous year)
- 2023: $692,256 (-$28,170, -3.91% from previous year)
- 2024: $703,728 (+$11,472, +1.66% from previous year)
- 2025: $706,255 (+$2,527, +0.36% from previous year)
Happy Valley home prices have jumped 118% since 2012, rising from just over $312K to more than $706K in 2025. Growth was slow but steady through most of the 2010s, with strong double-digit gains starting around 2014. The biggest surge came between 2020 and 2022, when prices jumped by nearly $190,000 in just two years. While 2023 saw a modest dip, prices have largely leveled off since. The upward trend over the past decade remains clear, confirming Happy Valley’s place among Oregon’s costliest real estate markets.
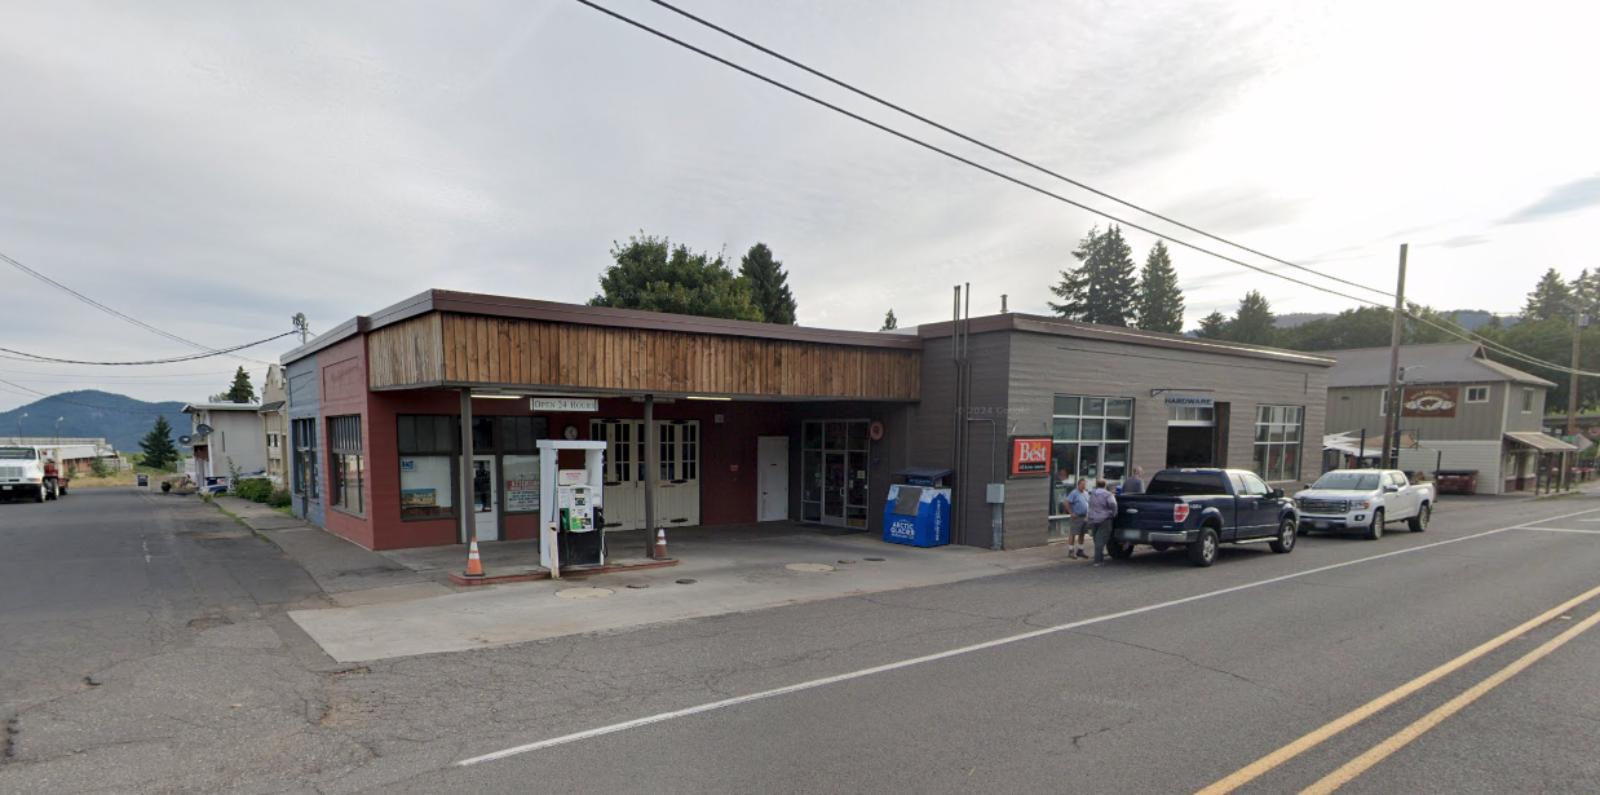
Happy Valley – Portland Suburb With Big Growth
Happy Valley is a fast-growing suburb located southeast of Portland in Clackamas County. Once a quiet outpost, it’s become one of the Portland metro area’s most desirable addresses. With its newer housing stock, modern schools, and master-planned neighborhoods, the city has attracted a surge of high-income buyers, especially during the post-2020 housing boom. Many homes here are newer builds with upgraded amenities, and large homes on quiet cul-de-sacs are typical. Easy access to I-205 and the Portland airport makes it convenient for commuters while still offering a peaceful, suburban setting.
Real estate demand here exploded in the early 2020s as buyers looked for larger spaces without leaving the metro entirely. The city responded with major development projects, including shopping centers and new school campuses. The combination of good schools, open green spaces, and large modern homes has pushed values far above average. Though price growth has cooled, the town remains a hotspot for upper-middle-class families and professionals priced out of Portland’s inner neighborhoods but still seeking upscale amenities and city access.
17. Hood River – 138% Home Price Increase Since 2012
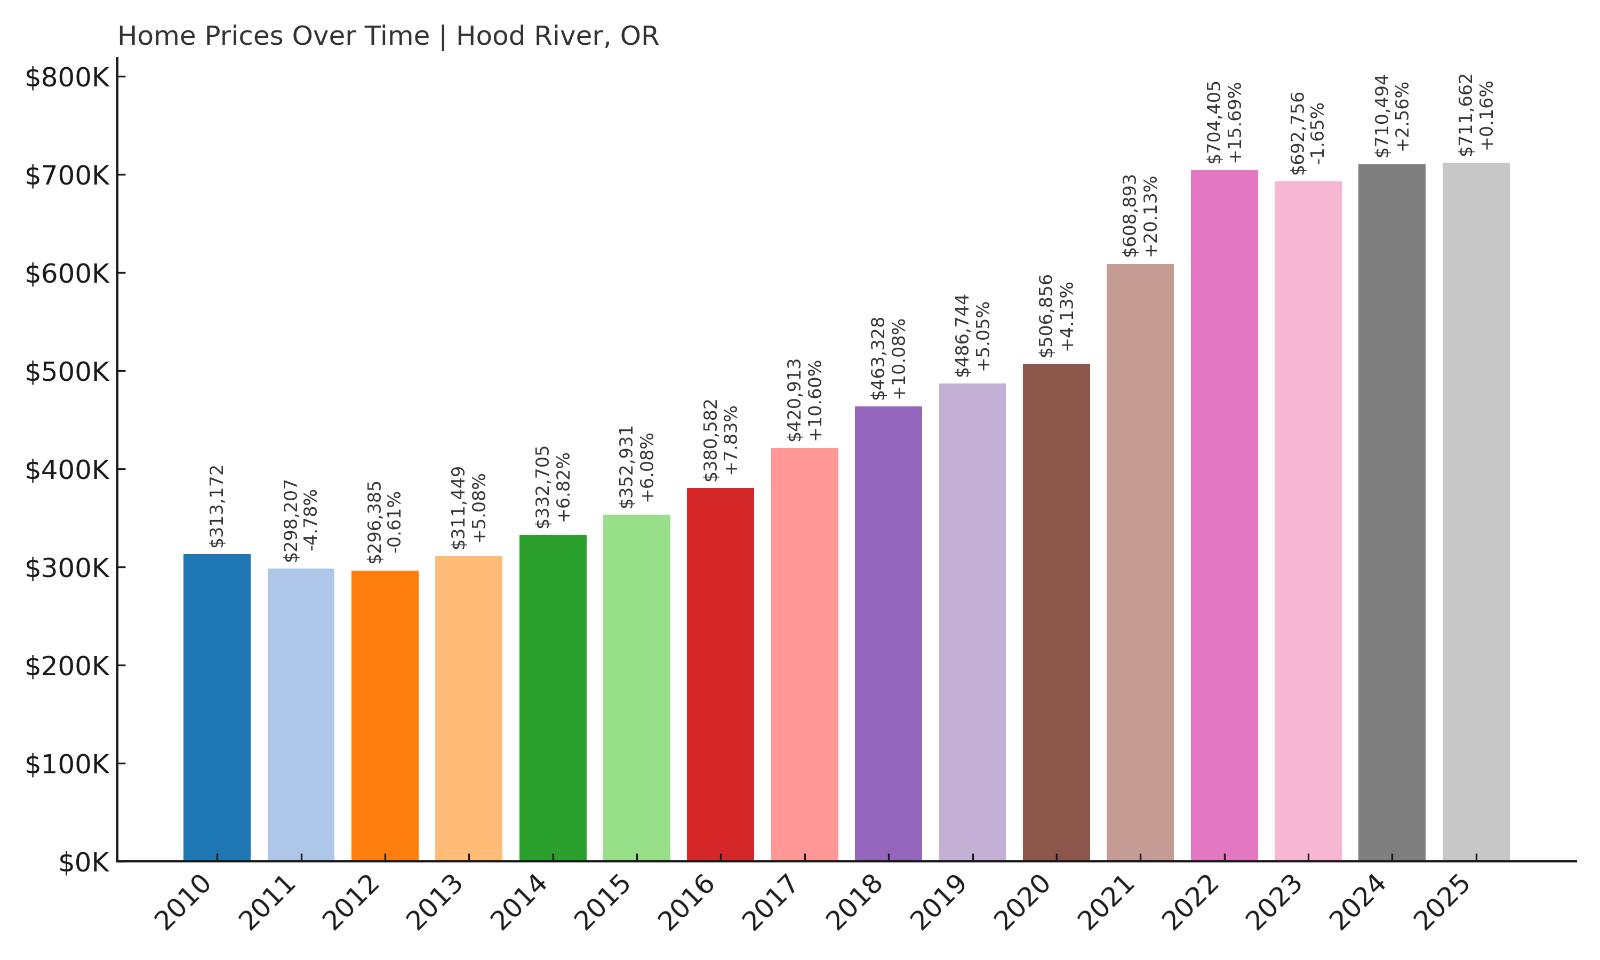
- 2010: $313,172
- 2011: $298,207 (-$14,965, -4.78% from previous year)
- 2012: $296,385 (-$1,822, -0.61% from previous year)
- 2013: $311,449 (+$15,064, +5.08% from previous year)
- 2014: $332,705 (+$21,256, +6.82% from previous year)
- 2015: $352,931 (+$20,226, +6.08% from previous year)
- 2016: $380,582 (+$27,651, +7.83% from previous year)
- 2017: $420,913 (+$40,332, +10.60% from previous year)
- 2018: $463,328 (+$42,415, +10.08% from previous year)
- 2019: $486,744 (+$23,416, +5.05% from previous year)
- 2020: $506,856 (+$20,112, +4.13% from previous year)
- 2021: $608,893 (+$102,037, +20.13% from previous year)
- 2022: $704,405 (+$95,512, +15.69% from previous year)
- 2023: $692,756 (-$11,649, -1.65% from previous year)
- 2024: $710,494 (+$17,738, +2.56% from previous year)
- 2025: $711,662 (+$1,168, +0.16% from previous year)
Hood River’s home values have increased 138% since 2012, with prices more than doubling from just under $300K to over $711K. The strongest acceleration occurred between 2016 and 2022, when year-over-year growth regularly topped 10%. The area saw one of its most significant jumps in 2021, adding more than $100K in value. Even after a small drop in 2023, prices have remained near peak levels, with only minor fluctuations since. Overall, the town’s long-term price trajectory has been steep and sustained.
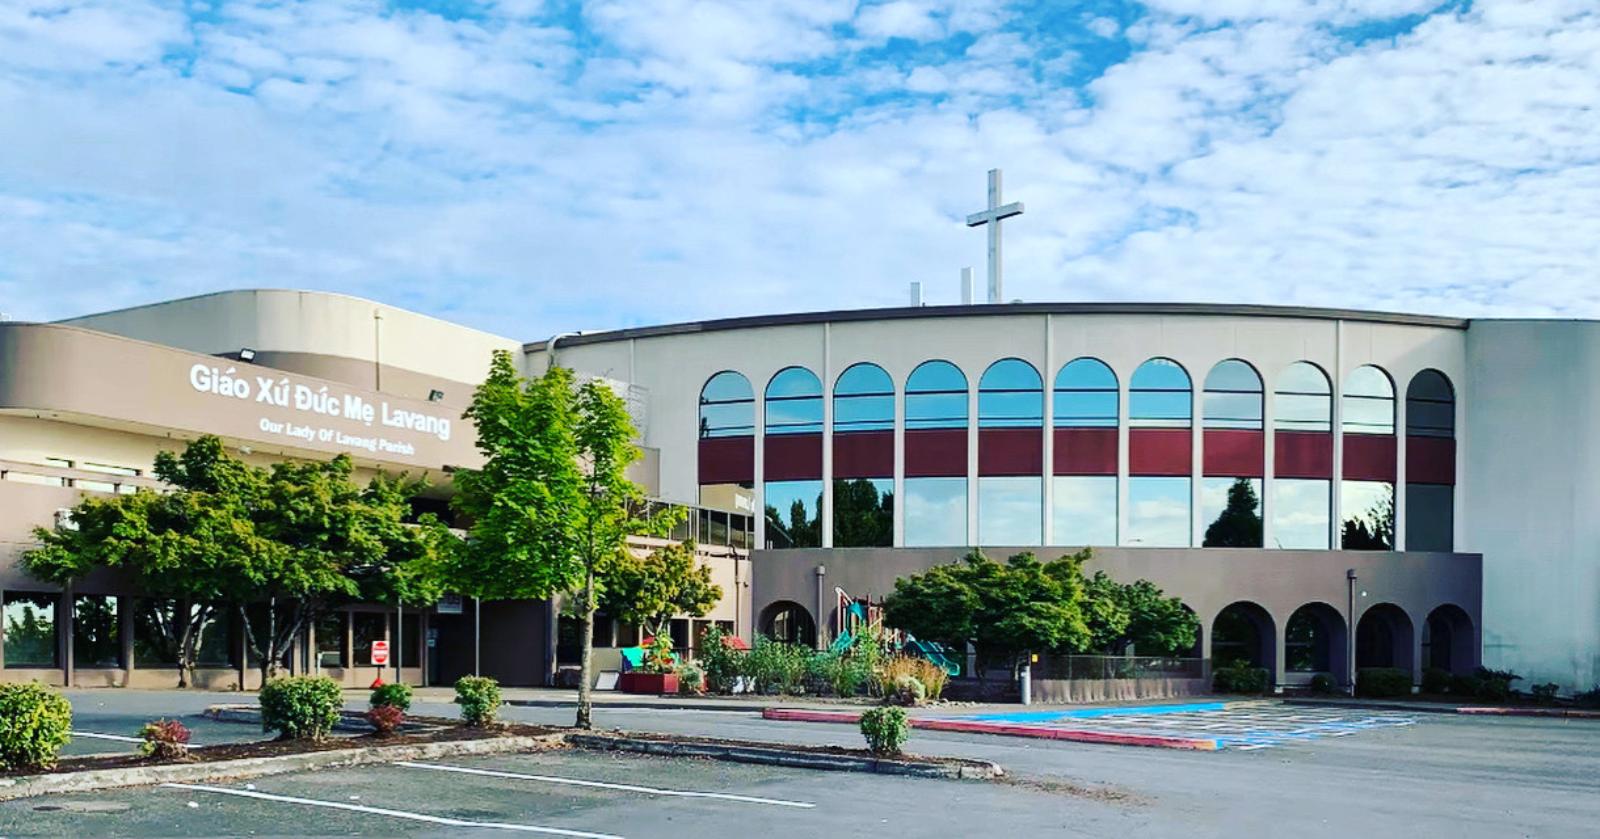
Hood River – Outdoor Destination With Urban Appeal
Hood River is both a tourist magnet and a working town, offering windsurfing, mountain biking, and some of the best views in the Columbia River Gorge. It sits along the riverbank, about 60 miles east of Portland, and blends scenic beauty with a thriving local economy centered on outdoor recreation, tourism, and agriculture. In recent years, tech workers and remote professionals have joined the mix, pushing up housing demand while inventory stayed tight. Despite its small size, Hood River feels vibrant and well-resourced, with restaurants, breweries, and walkable neighborhoods just minutes from major trails and parks.
The town’s housing market has benefitted from limited space for expansion and a steady stream of newcomers. With many older homes being updated or replaced with higher-end builds, the average price has risen rapidly. Second-home buyers from Portland and Seattle have also driven demand, particularly for river-view and hillside properties. Hood River’s real estate combines lifestyle value with long-term investment potential, making it one of the most sought-after — and expensive — towns in the Gorge region.
16. Mulino – 145% Home Price Increase Since 2012

- 2010: $329,880
- 2011: $291,814 (-$38,066, -11.54% from previous year)
- 2012: $271,050 (-$20,764, -7.12% from previous year)
- 2013: $294,021 (+$22,971, +8.47% from previous year)
- 2014: $320,134 (+$26,113, +8.88% from previous year)
- 2015: $347,081 (+$26,947, +8.42% from previous year)
- 2016: $398,476 (+$51,395, +14.81% from previous year)
- 2017: $432,745 (+$34,269, +8.60% from previous year)
- 2018: $478,150 (+$45,405, +10.49% from previous year)
- 2019: $504,317 (+$26,168, +5.47% from previous year)
- 2020: $531,580 (+$27,263, +5.41% from previous year)
- 2021: $630,149 (+$98,569, +18.54% from previous year)
- 2022: $729,482 (+$99,333, +15.76% from previous year)
- 2023: $684,613 (-$44,869, -6.15% from previous year)
- 2024: $696,664 (+$12,051, +1.76% from previous year)
- 2025: $714,847 (+$18,183, +2.61% from previous year)
Mulino has gained 145% in home value since 2012, making it one of the fastest-appreciating rural markets in Oregon. Prices rose from $271K to nearly $715K, with much of the growth happening between 2016 and 2022. Several years during that span saw double-digit percentage increases. While 2023 saw a short-term dip, recent gains suggest the market remains strong. With limited supply and a growing appeal among buyers looking beyond urban centers, Mulino continues to see steady upward movement in housing value.
Mulino – Rural Acreage With Strong Appreciation

Mulino is an unincorporated community in Clackamas County, located along Highway 213 between Oregon City and Molalla. Though it’s small and mostly rural, its proximity to growing cities has turned it into a hotspot for buyers seeking acreage and privacy. Unlike more suburban areas, Mulino offers homes on large lots, often with outbuildings, farmland, or forested backdrops. This appeal has grown in recent years, especially among people who work remotely or want to live closer to nature without giving up access to city conveniences.
With few new homes being built, the existing housing stock has become more valuable, especially as nearby towns have filled out. The 2020s brought a rush of new interest in rural Oregon properties, and Mulino was well positioned to benefit. Buyers priced out of Happy Valley or Oregon City have turned to Mulino for more space and long-term investment potential. Its growth has been quiet but consistent — and the numbers now put it firmly in Oregon’s top 20 most expensive markets.
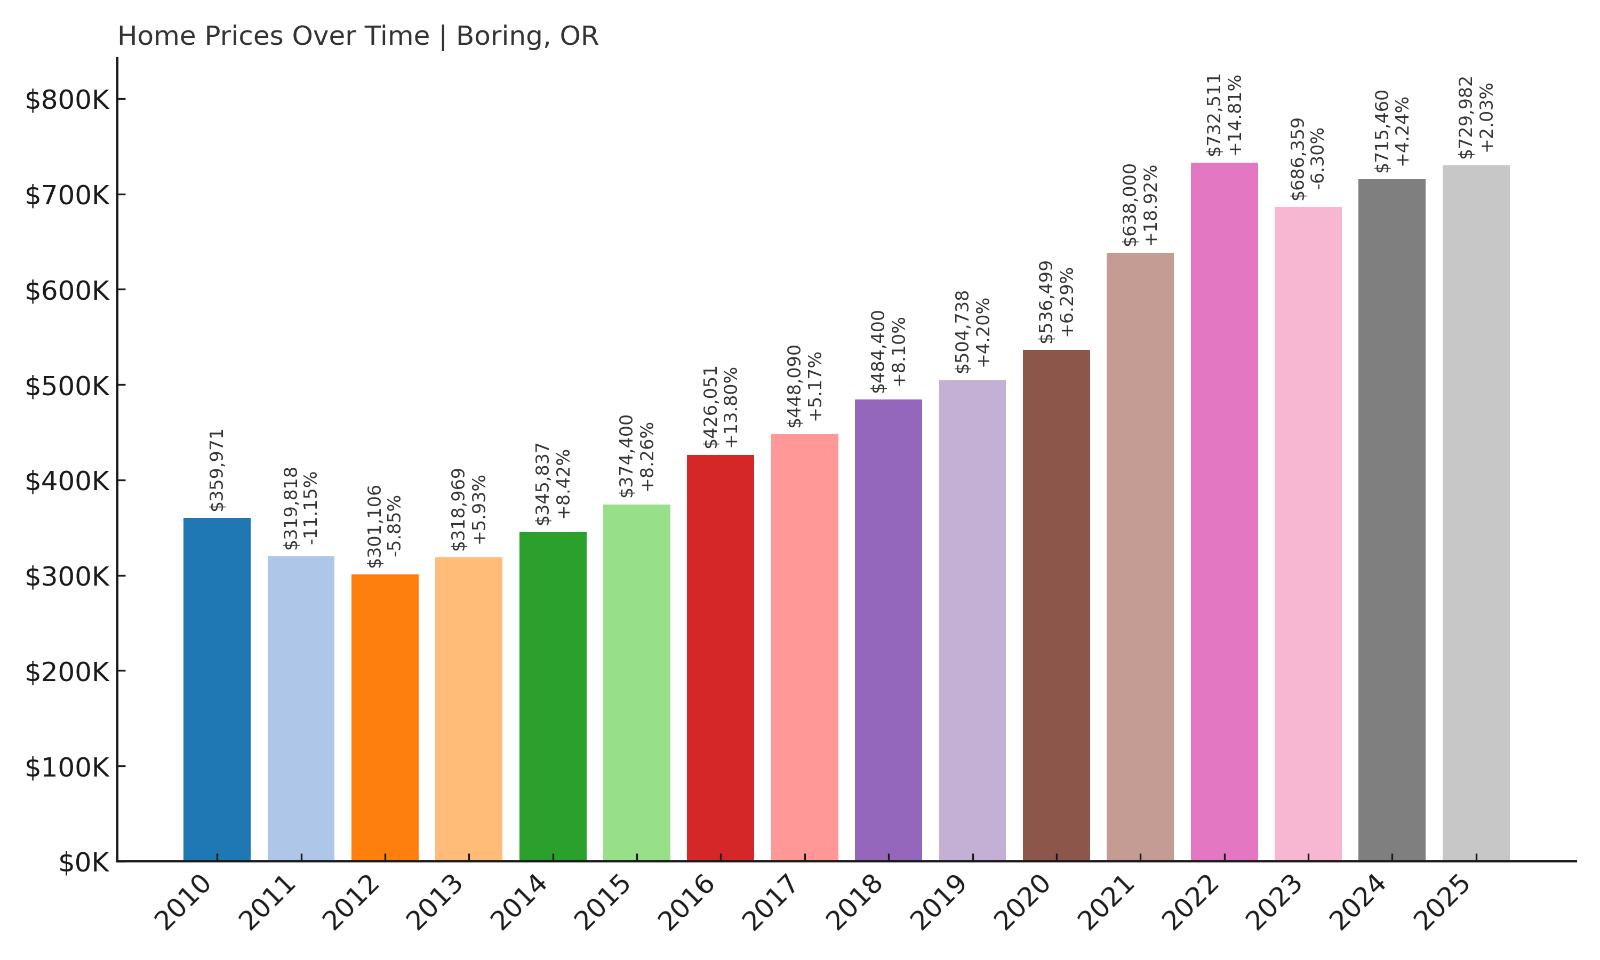
15. Boring – 143% Home Price Increase Since 2012
- 2010: $359,971
- 2011: $319,818 (-$40,153, -11.15% from previous year)
- 2012: $301,106 (-$18,712, -5.85% from previous year)
- 2013: $318,969 (+$17,862, +5.93% from previous year)
- 2014: $345,837 (+$26,868, +8.42% from previous year)
- 2015: $374,400 (+$28,563, +8.26% from previous year)
- 2016: $426,051 (+$51,651, +13.80% from previous year)
- 2017: $448,090 (+$22,039, +5.17% from previous year)
- 2018: $484,400 (+$36,310, +8.10% from previous year)
- 2019: $504,738 (+$20,337, +4.20% from previous year)
- 2020: $536,499 (+$31,761, +6.29% from previous year)
- 2021: $638,000 (+$101,501, +18.92% from previous year)
- 2022: $732,511 (+$94,510, +14.81% from previous year)
- 2023: $686,359 (-$46,152, -6.30% from previous year)
- 2024: $715,460 (+$29,101, +4.24% from previous year)
- 2025: $729,982 (+$14,522, +2.03% from previous year)
Boring has experienced a 143% increase in home prices since 2012, moving from $301K to over $729K by 2025. This growth has been remarkably steady, driven by consistent year-over-year increases throughout the late 2010s and early 2020s. The town had standout surges in 2021 and 2022, adding nearly $200,000 in just those two years combined. Although 2023 saw a dip, values quickly rebounded, showing the strength of the underlying demand. Over the past decade, Boring has transitioned from a quiet rural area to one of Oregon’s highest-priced communities.
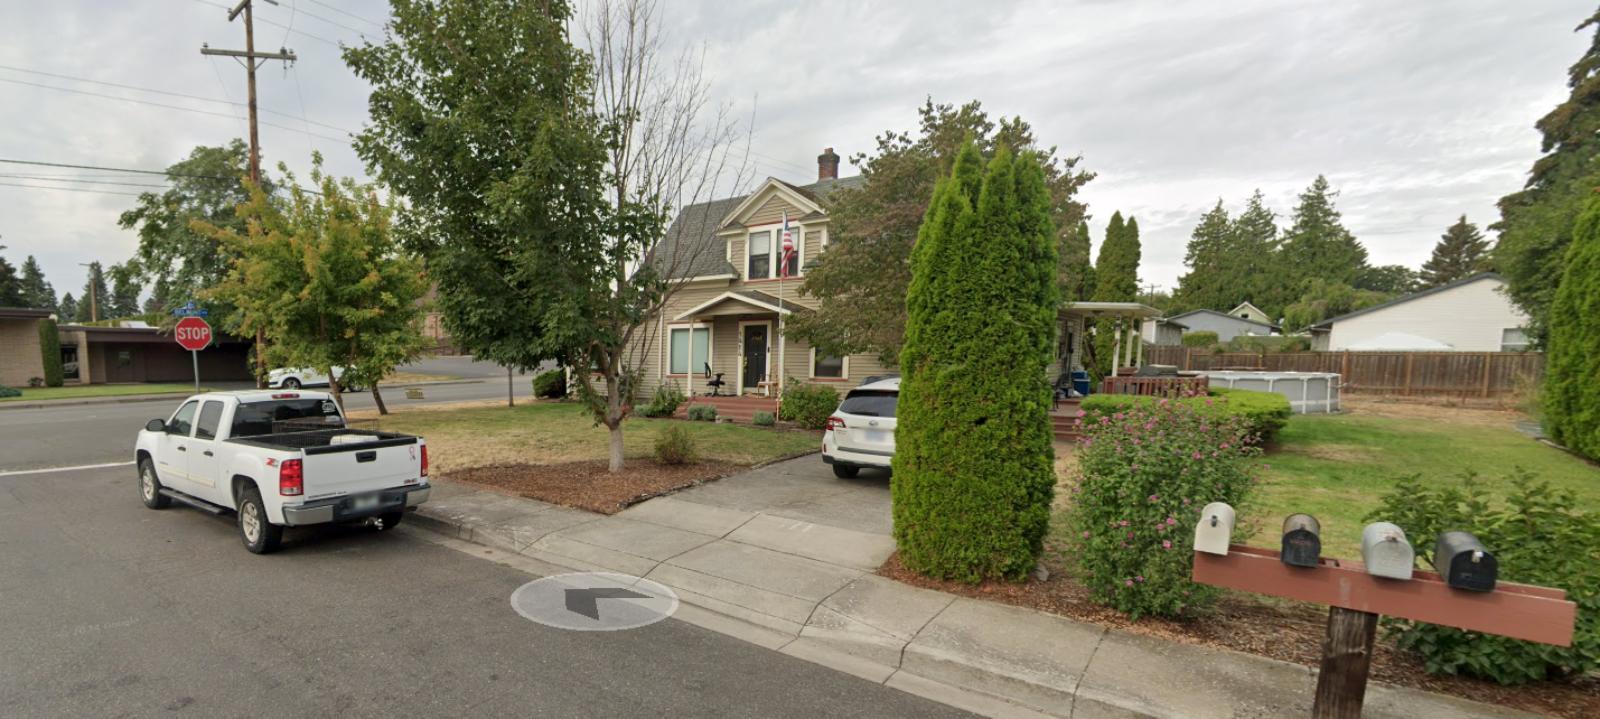
Boring – Rural Setting With Strong Price Momentum
Boring sits at the edge of Clackamas County, southeast of Gresham and not far from the Mount Hood National Forest. Despite its name, the town has become an increasingly popular destination for buyers seeking quiet living within driving distance of Portland. Many properties in Boring offer acreage, mature trees, and views of the Cascades, making them especially attractive to those looking for space and privacy. It also benefits from limited development and zoning that favors low-density housing — a factor that’s kept inventory tight even as demand surged.
The town’s rural charm, proximity to outdoor recreation, and relatively easy commute have made it a prime spot for long-term home value growth. Many homeowners have upgraded older homes or built custom properties, further driving up the average price. Boring’s housing stock now attracts a mix of retirees, remote professionals, and families looking for large lots and scenic surroundings without venturing too far from the city. Its name may be unassuming, but the real estate market here is anything but.
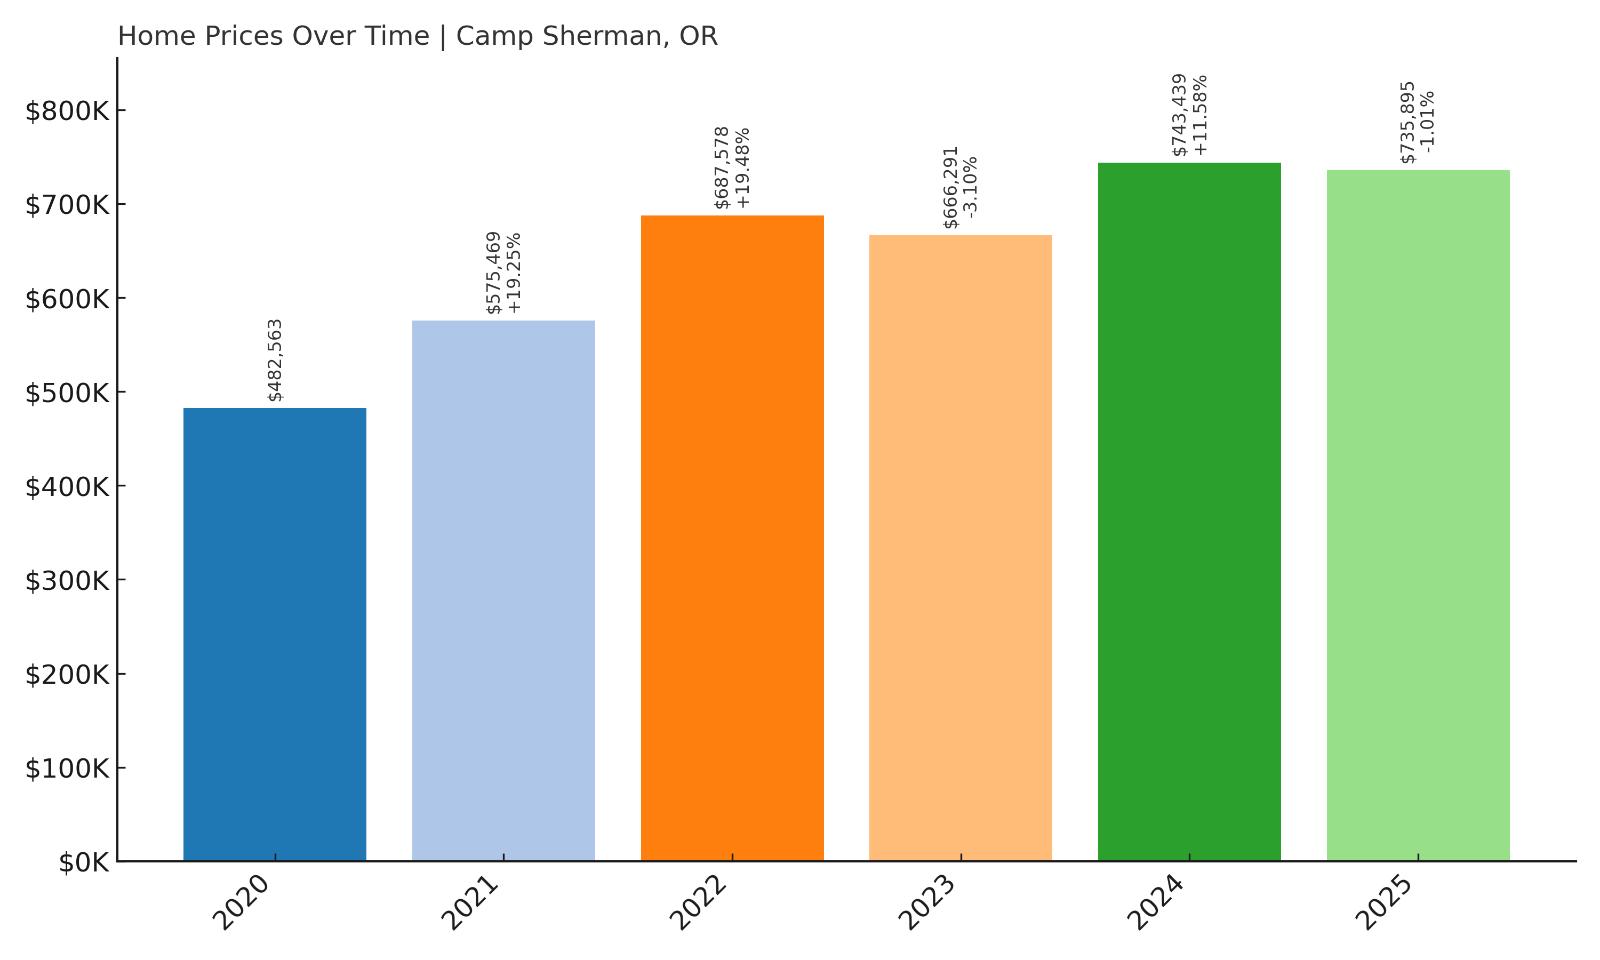
14. Camp Sherman – 52% Home Price Increase Since 2020
🔥 Would you like to save this?
- 2010: $N/A
- 2011: $N/A
- 2012: $N/A
- 2013: $N/A
- 2014: $N/A
- 2015: $N/A
- 2016: $N/A
- 2017: $N/A
- 2018: $N/A
- 2019: $N/A
- 2020: $482,563
- 2021: $575,469 (+$92,906, +19.25% from previous year)
- 2022: $687,578 (+$112,110, +19.48% from previous year)
- 2023: $666,291 (-$21,288, -3.10% from previous year)
- 2024: $743,439 (+$77,148, +11.58% from previous year)
- 2025: $735,895 (-$7,544, -1.01% from previous year)
Camp Sherman’s home prices have jumped 52% since 2020, despite only having data available from that year onward. In 2021 and 2022 alone, prices climbed by more than $200,000, reflecting a sudden surge of interest in this remote and scenic location. Although there have been slight pullbacks in 2023 and 2025, prices remain well above their pre-pandemic levels. The volatility reflects how niche markets like Camp Sherman can experience sharp changes when demand shifts in small, supply-constrained communities.
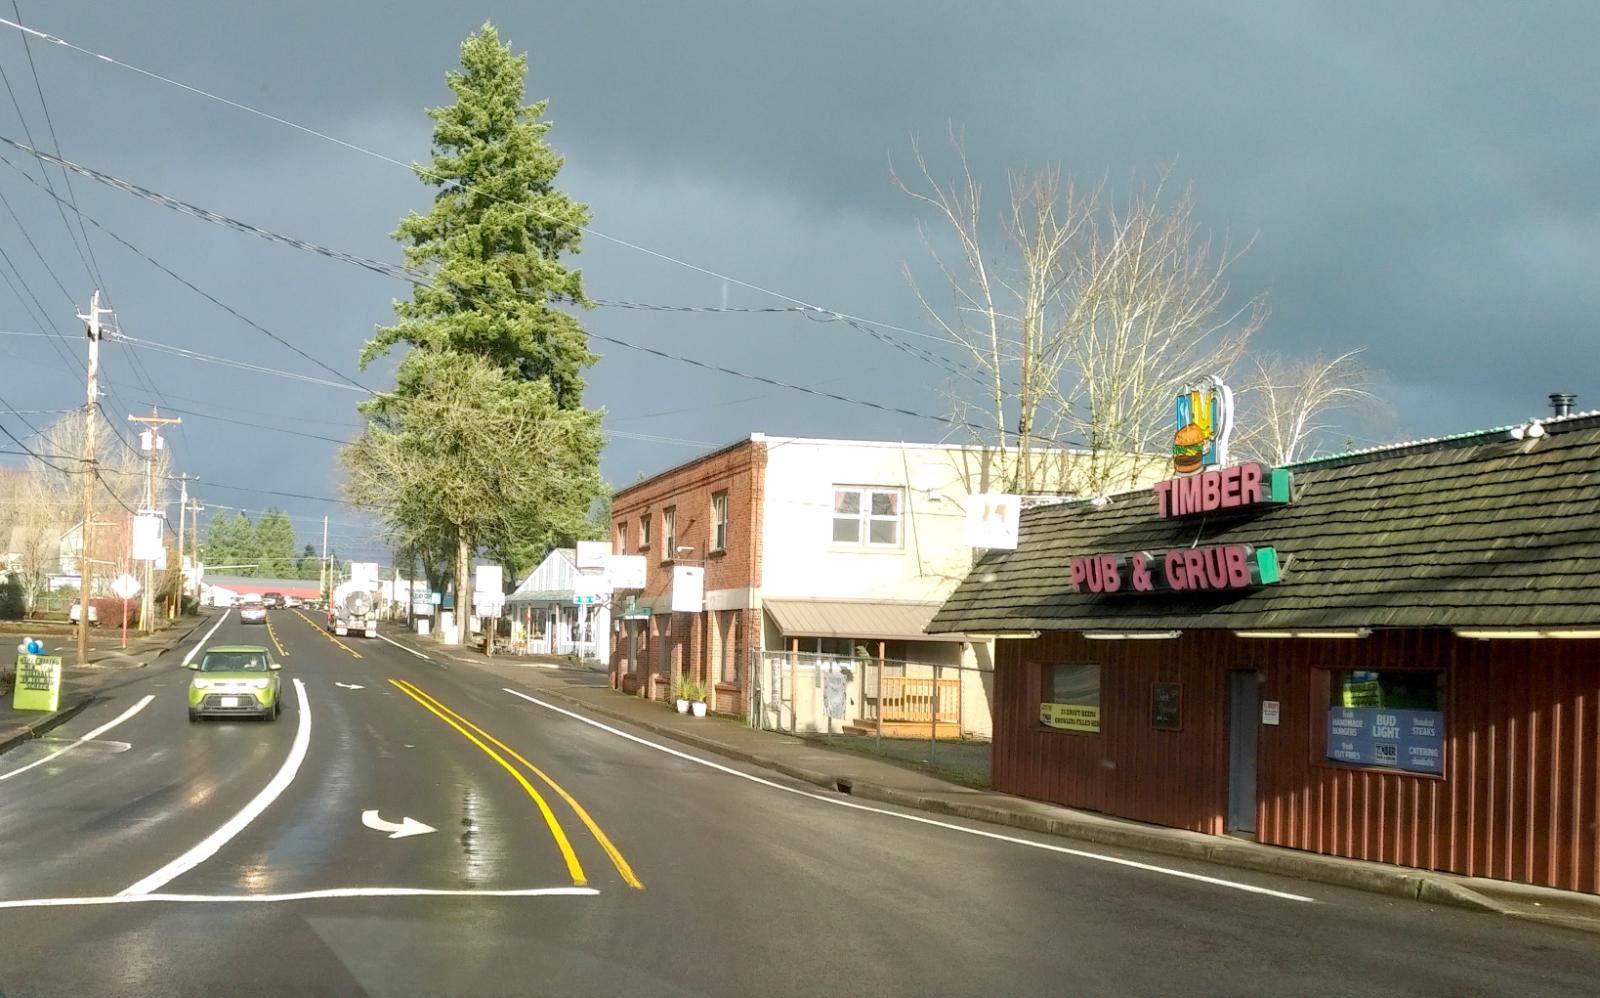
Camp Sherman – Remote Luxury in the Heart of Central Oregon

Tucked along the Metolius River in Jefferson County, Camp Sherman is known for its rustic cabins, fly fishing, and proximity to the Deschutes National Forest. It’s one of Oregon’s smallest and most secluded luxury markets, with a tiny year-round population but growing popularity among high-net-worth individuals looking for second homes or long-term retreats. The town’s remote charm, riverfront views, and protected forest land make new development rare — which has only intensified competition for available properties.
Camp Sherman’s home prices reflect its exclusivity. With just a handful of homes on the market at any given time, prices respond quickly to changes in demand. The pandemic years brought an influx of wealthy buyers seeking privacy and space, which drove values up steeply in 2021 and 2022. Since then, price growth has moderated, but the area remains firmly in Oregon’s luxury tier. The community’s isolation may not appeal to everyone, but for those looking for a true retreat — without compromising on price appreciation — Camp Sherman has proven its worth.
13. Bend – 221% Home Price Increase Since 2012
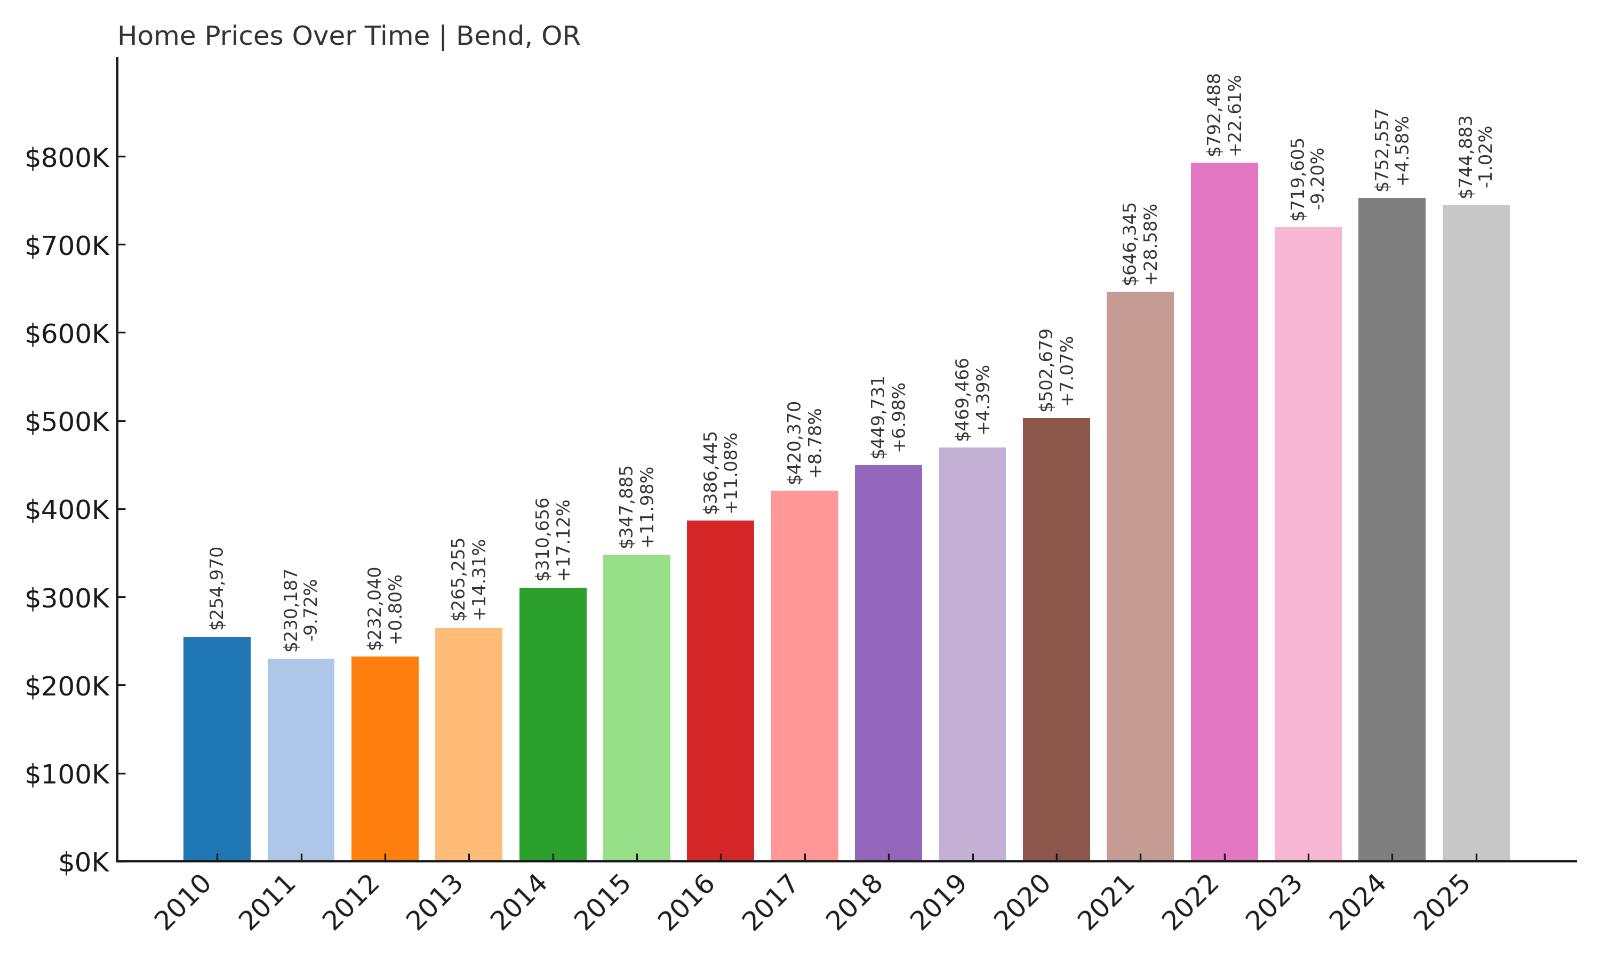
- 2010: $254,970
- 2011: $230,187 (-$24,783, -9.72% from previous year)
- 2012: $232,040 (+$1,853, +0.80% from previous year)
- 2013: $265,255 (+$33,215, +14.31% from previous year)
- 2014: $310,656 (+$45,401, +17.12% from previous year)
- 2015: $347,885 (+$37,228, +11.98% from previous year)
- 2016: $386,445 (+$38,560, +11.08% from previous year)
- 2017: $420,370 (+$33,925, +8.78% from previous year)
- 2018: $449,731 (+$29,361, +6.98% from previous year)
- 2019: $469,466 (+$19,735, +4.39% from previous year)
- 2020: $502,679 (+$33,213, +7.07% from previous year)
- 2021: $646,345 (+$143,665, +28.58% from previous year)
- 2022: $792,488 (+$146,144, +22.61% from previous year)
- 2023: $719,605 (-$72,883, -9.20% from previous year)
- 2024: $752,557 (+$32,952, +4.58% from previous year)
- 2025: $744,883 (-$7,675, -1.02% from previous year)
Bend has seen a massive 221% increase in home values since 2012, when the average price was just $232,040. By 2025, that figure had skyrocketed to $744,883, making it one of the most significant long-term gainers in Oregon. The most intense growth came in the early 2020s, when values jumped by nearly $290,000 in just two years. While 2023 brought a notable decline, prices partially rebounded in 2024 and have largely held steady into 2025. The overall trajectory is still sharply upward, confirming Bend’s transformation into one of the state’s premier real estate markets.
Bend – From Affordable Escape to Premier Destination
Bend is no longer the well-kept secret it was a decade ago. Situated in Central Oregon, it has become a year-round destination thanks to its unbeatable access to outdoor activities, from skiing at Mt. Bachelor to hiking along the Deschutes River. The city also boasts a vibrant downtown, breweries, strong healthcare infrastructure, and a reputation as a remote work hub. Its diverse appeal has drawn a steady wave of transplants from Portland, Seattle, and California, turning Bend into one of the fastest-growing cities in the state — and one of the most expensive.
This influx of high-income buyers has transformed Bend’s housing market. What was once considered an affordable mountain town now regularly sees home listings topping $800,000, with some neighborhoods commanding even higher premiums. Limited new construction, combined with land use restrictions and strong buyer demand, have created lasting price pressure. Even with minor dips in recent years, Bend’s housing values have shown remarkable resilience. The mix of natural beauty, urban convenience, and economic opportunity has solidified its place as a top-tier Oregon market.
12. Rickreall – 134% Home Price Increase Since 2012

- 2010: $355,259
- 2011: $335,109 (-$20,150, -5.67% from previous year)
- 2012: $328,773 (-$6,336, -1.89% from previous year)
- 2013: $343,994 (+$15,222, +4.63% from previous year)
- 2014: $369,084 (+$25,090, +7.29% from previous year)
- 2015: $394,398 (+$25,314, +6.86% from previous year)
- 2016: $428,855 (+$34,457, +8.74% from previous year)
- 2017: $470,332 (+$41,477, +9.67% from previous year)
- 2018: $520,684 (+$50,353, +10.71% from previous year)
- 2019: $532,462 (+$11,778, +2.26% from previous year)
- 2020: $571,025 (+$38,563, +7.24% from previous year)
- 2021: $688,651 (+$117,626, +20.60% from previous year)
- 2022: $783,963 (+$95,312, +13.84% from previous year)
- 2023: $751,490 (-$32,474, -4.14% from previous year)
- 2024: $771,739 (+$20,249, +2.69% from previous year)
- 2025: $768,472 (-$3,267, -0.42% from previous year)
Rickreall’s home values have risen 134% since 2012, climbing from $328,773 to $768,472. The town’s strongest price growth occurred between 2016 and 2022, with gains that consistently exceeded 8%–10% annually. Particularly in 2021, prices jumped by over $117,000 — an enormous increase for a rural area. While prices dipped slightly in 2023, they’ve largely stabilized in recent years. As of 2025, the market remains strong and near peak levels, confirming Rickreall’s emergence as one of Oregon’s most valuable rural communities.
Rickreall – Rural Roots With Rising Demand
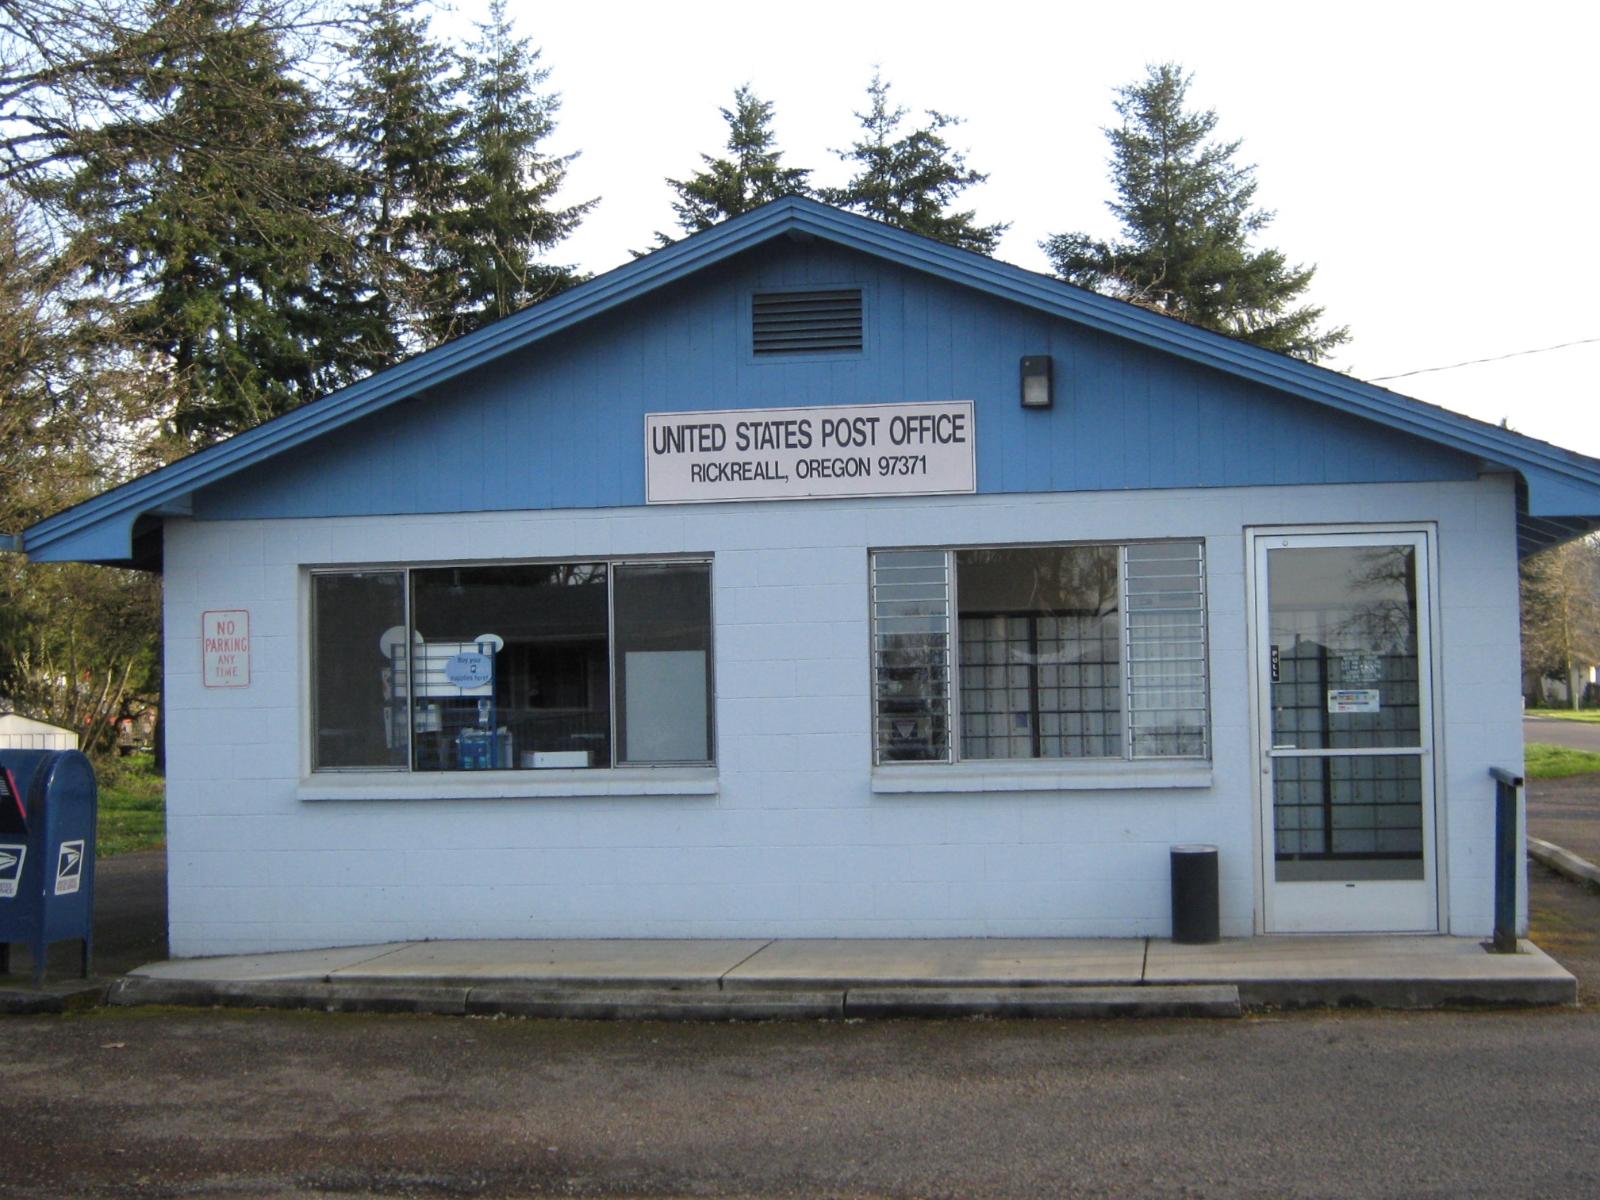
Rickreall is a quiet, unincorporated community in Polk County, just a few miles west of Salem. It lies in the heart of the Willamette Valley wine region, and while it lacks the name recognition of nearby towns like McMinnville or Amity, it’s drawn increasing attention from buyers looking for land and long-term investment potential. The surrounding countryside is dotted with vineyards, farmland, and scenic open spaces. As urban and suburban markets have become overcrowded or overpriced, Rickreall has stood out as a place where space and privacy are still attainable — though increasingly expensive.
The homes in Rickreall tend to be custom or semi-rural builds on large lots, many with agricultural zoning. That makes the area appealing for buyers in wine, farming, or lifestyle-focused industries. Highway 99W runs directly through the area, offering convenient access to Salem and the rest of the mid-Willamette Valley. While it may not have a walkable downtown or planned subdivisions, its rural authenticity and proximity to top-tier vineyards have proven to be major draws. Rickreall has shown that price growth doesn’t always follow city lights — sometimes it follows the vines.
11. Beavercreek – 162% Home Price Increase Since 2012

- 2010: $355,949
- 2011: $320,295 (-$35,654, -10.02% from previous year)
- 2012: $294,585 (-$25,709, -8.03% from previous year)
- 2013: $318,463 (+$23,878, +8.11% from previous year)
- 2014: $350,688 (+$32,224, +10.12% from previous year)
- 2015: $379,693 (+$29,005, +8.27% from previous year)
- 2016: $430,748 (+$51,055, +13.45% from previous year)
- 2017: $466,012 (+$35,264, +8.19% from previous year)
- 2018: $505,742 (+$39,730, +8.53% from previous year)
- 2019: $527,417 (+$21,675, +4.29% from previous year)
- 2020: $557,517 (+$30,101, +5.71% from previous year)
- 2021: $663,825 (+$106,308, +19.07% from previous year)
- 2022: $775,279 (+$111,454, +16.79% from previous year)
- 2023: $727,970 (-$47,309, -6.10% from previous year)
- 2024: $745,615 (+$17,645, +2.42% from previous year)
- 2025: $771,439 (+$25,824, +3.46% from previous year)
Beavercreek has experienced a 162% increase in home values since 2012, growing from $294,585 to $771,439 in just over a decade. This appreciation has been remarkably steady, with double-digit annual growth showing up regularly between 2015 and 2022. Notably, the town added over $217,000 in home value between 2020 and 2022 alone. While a dip occurred in 2023, values quickly recovered, and 2025 prices are now hovering close to the town’s peak. The data points to long-term strength in this growing rural market.
Beavercreek – Acreage, Privacy, and Persistent Demand
Beavercreek is a rural area in Clackamas County that combines quiet farmland with convenient access to Oregon City and the broader Portland metro. Unlike suburban communities, Beavercreek offers space — and plenty of it. Most homes sit on several acres, with space for gardens, workshops, animals, or hobby farms. That flexibility has made the area particularly attractive to buyers escaping denser cities in search of a slower pace and more control over their land. While it lacks a dense commercial core, that’s exactly what many residents prefer.
Its proximity to Portland means Beavercreek is never too far from urban conveniences, but zoning restrictions and its unincorporated status have preserved the area’s rural character. The result is limited housing stock and strong upward pressure on prices. Especially during and after the pandemic, Beavercreek became a go-to spot for those prioritizing space and self-sufficiency — trends that haven’t faded. In 2025, it continues to command some of the highest home values among rural communities in the state, proof that demand for land and lifestyle is still very real.
10. West Linn – 134% Home Price Increase Since 2012
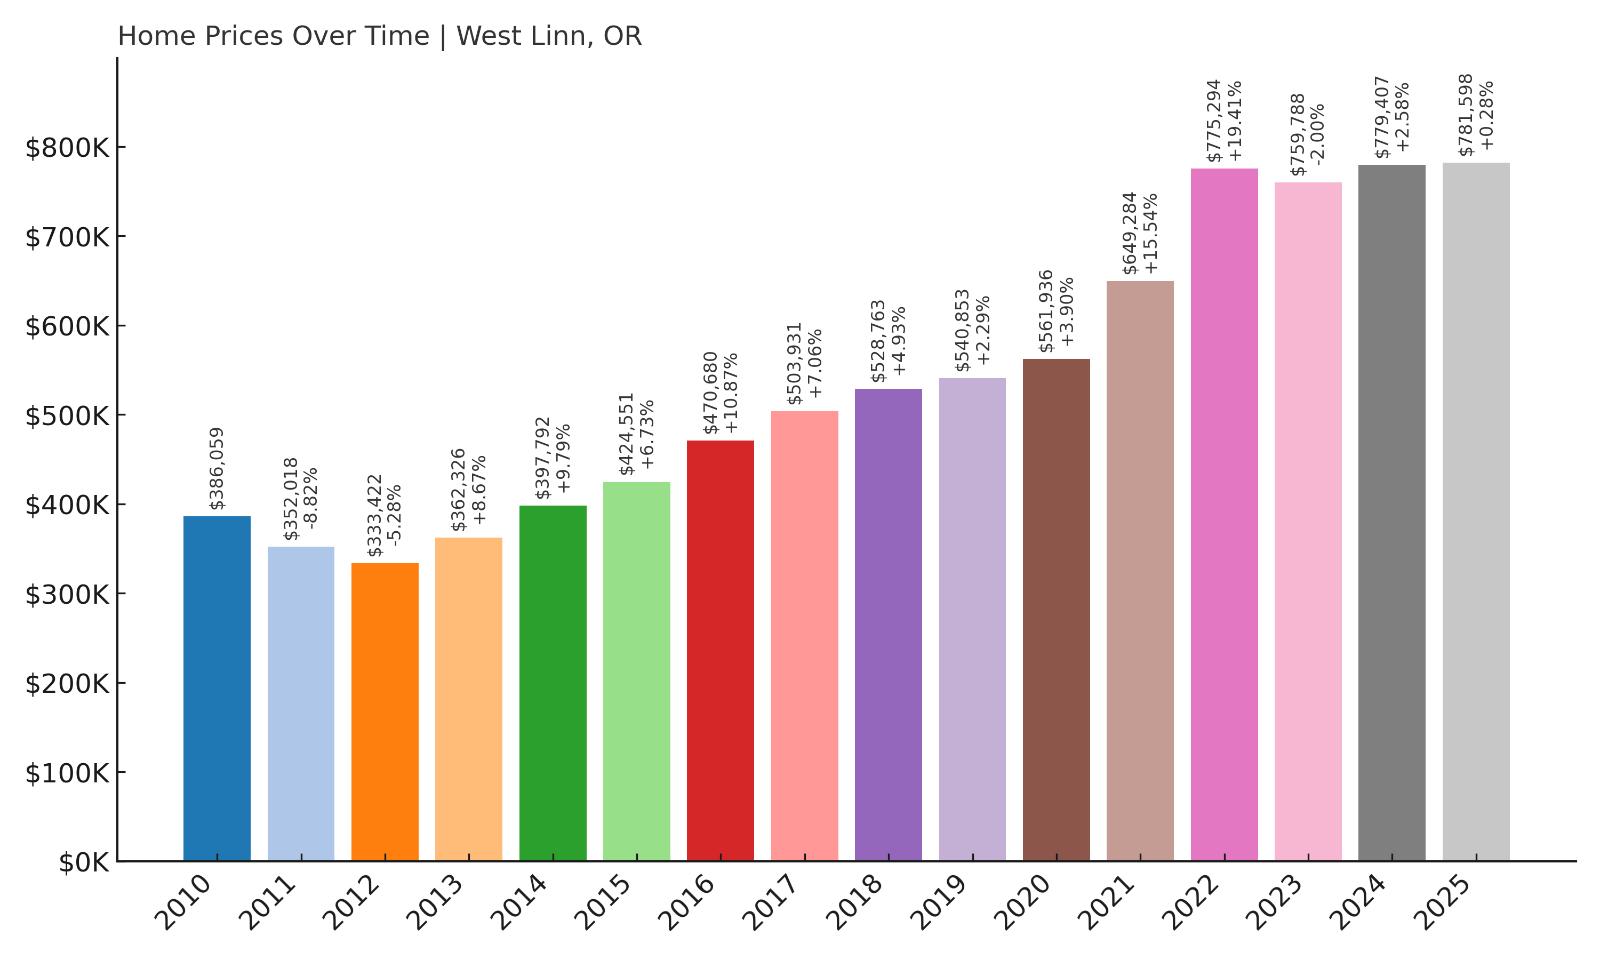
- 2010: $386,059
- 2011: $352,018 (-$34,040, -8.82% from previous year)
- 2012: $333,422 (-$18,596, -5.28% from previous year)
- 2013: $362,326 (+$28,904, +8.67% from previous year)
- 2014: $397,792 (+$35,466, +9.79% from previous year)
- 2015: $424,551 (+$26,759, +6.73% from previous year)
- 2016: $470,680 (+$46,129, +10.87% from previous year)
- 2017: $503,931 (+$33,251, +7.06% from previous year)
- 2018: $528,763 (+$24,832, +4.93% from previous year)
- 2019: $540,853 (+$12,090, +2.29% from previous year)
- 2020: $561,936 (+$21,083, +3.90% from previous year)
- 2021: $649,284 (+$87,348, +15.54% from previous year)
- 2022: $775,294 (+$126,010, +19.41% from previous year)
- 2023: $759,788 (-$15,506, -2.00% from previous year)
- 2024: $779,407 (+$19,619, +2.58% from previous year)
- 2025: $781,598 (+$2,191, +0.28% from previous year)
West Linn’s home values have increased 134% since 2012, rising from $333,422 to $781,598 by 2025. The town’s upward momentum was especially strong from 2016 to 2022, with several years of double-digit growth. Even as the market cooled slightly in 2023, values have remained high and largely stable. West Linn’s position as one of the most desirable Portland suburbs continues to sustain demand and high property values into 2025.
West Linn – Prestige Living With River Views
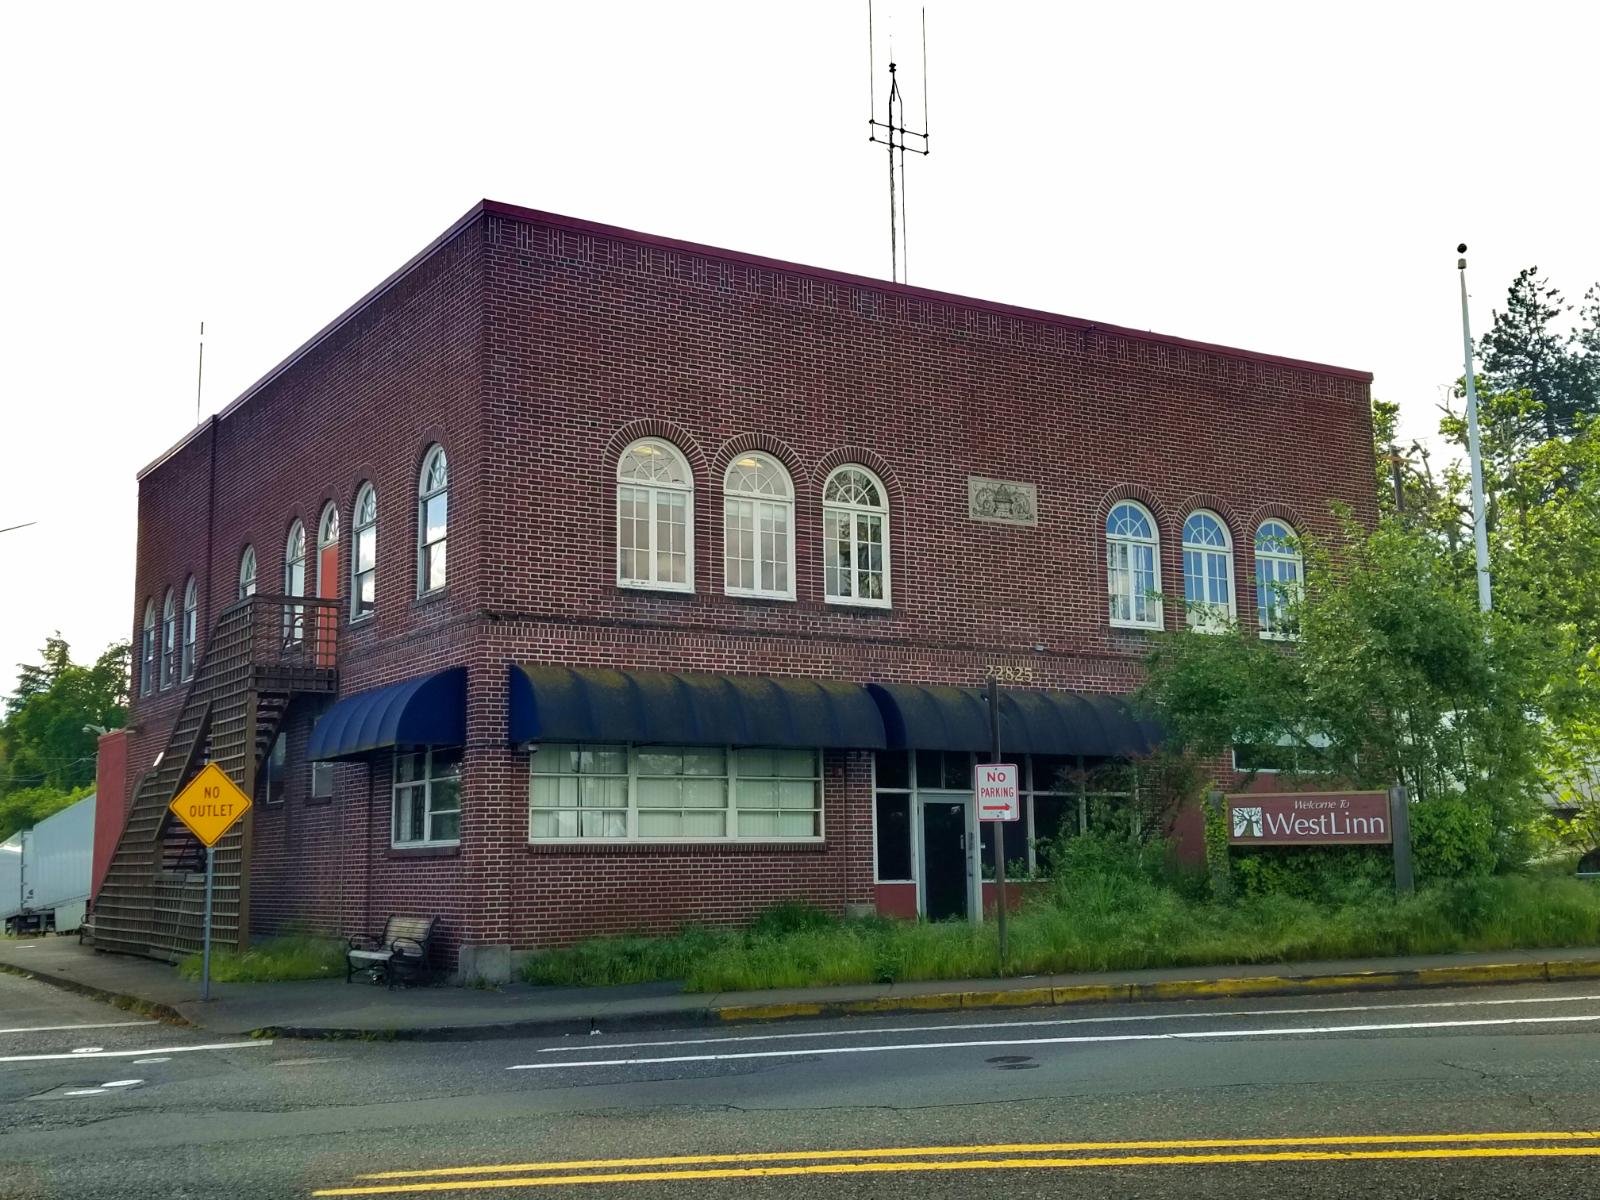
West Linn is one of the most sought-after suburbs in the Portland metro area, known for its quiet neighborhoods, excellent schools, and dramatic Willamette River scenery. Located just south of Lake Oswego, the city offers a mix of large custom homes, upscale developments, and older riverfront properties that have been modernized over time. West Linn’s real estate has long commanded premium prices, but the past decade has accelerated that trend, driven by continued demand from high-income buyers looking for safety, space, and prestige just outside the city core.
Its school district consistently ranks among the best in Oregon, and the area’s natural topography — with bluffs, forests, and waterfront views — contributes to its desirability. While new development has been modest due to geographic and zoning constraints, that scarcity has helped drive values higher. West Linn benefits from strong transportation access via I-205, but maintains a quiet, residential feel with limited commercial intrusion. In 2025, the data confirms what many already know: West Linn is one of the most stable and expensive housing markets in the state.
9. West Slope – 143% Home Price Increase Since 2012
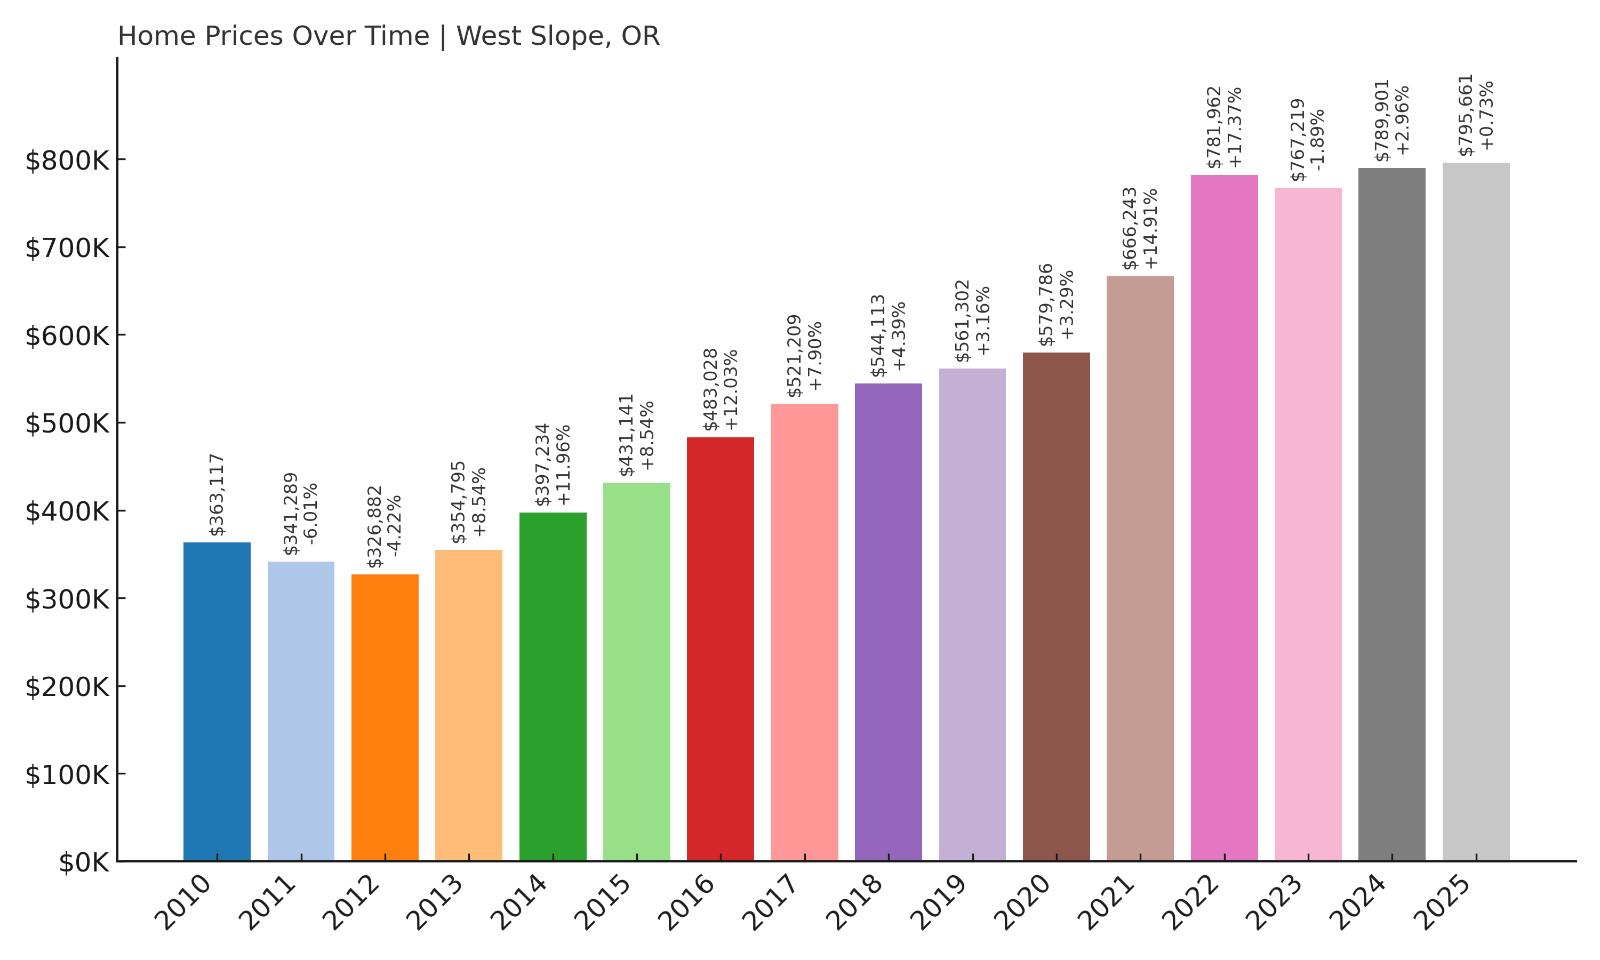
- 2010: $363,117
- 2011: $341,289 (-$21,829, -6.01% from previous year)
- 2012: $326,882 (-$14,406, -4.22% from previous year)
- 2013: $354,795 (+$27,912, +8.54% from previous year)
- 2014: $397,234 (+$42,440, +11.96% from previous year)
- 2015: $431,141 (+$33,906, +8.54% from previous year)
- 2016: $483,028 (+$51,887, +12.03% from previous year)
- 2017: $521,209 (+$38,180, +7.90% from previous year)
- 2018: $544,113 (+$22,905, +4.39% from previous year)
- 2019: $561,302 (+$17,189, +3.16% from previous year)
- 2020: $579,786 (+$18,484, +3.29% from previous year)
- 2021: $666,243 (+$86,457, +14.91% from previous year)
- 2022: $781,962 (+$115,718, +17.37% from previous year)
- 2023: $767,219 (-$14,743, -1.89% from previous year)
- 2024: $789,901 (+$22,682, +2.96% from previous year)
- 2025: $795,661 (+$5,760, +0.73% from previous year)
Home prices in West Slope have grown 143% since 2012, with values jumping from $326,882 to $795,661 in 2025. The strongest growth occurred from 2014 through 2022, where gains frequently topped 10% annually. Even with a slight pullback in 2023, the market quickly regained ground. As of 2025, prices remain just below all-time highs, confirming West Slope’s place among the most valuable residential areas in Oregon.
West Slope – Close to Everything, Hidden From Most
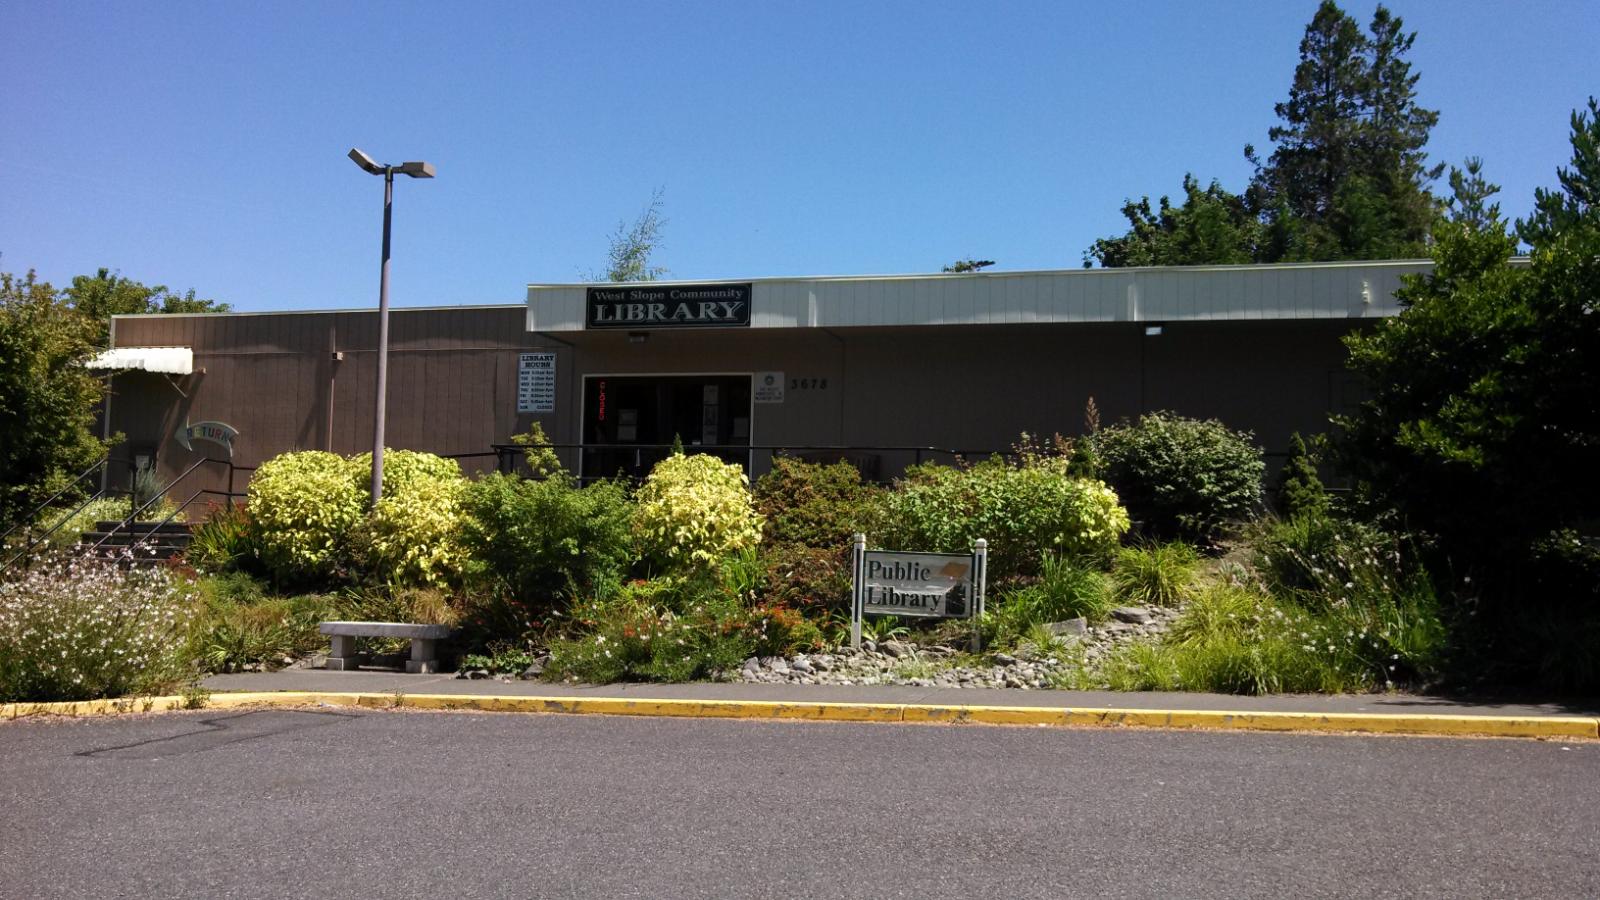
West Slope is a small unincorporated area just west of Portland, nestled between Beaverton and Highway 26. While it doesn’t carry the name recognition of some neighboring towns, its location is hard to beat — just minutes from downtown Portland, the Nike campus, and the high-tech corridor of Washington County. The area features a mix of mid-century homes, newer infill developments, and tree-lined streets that give it a quiet suburban feel despite its proximity to urban amenities. It’s a rare find for those who want short commute times and a neighborhood that feels tucked away.
Demand for West Slope homes has grown steadily over the past decade as buyers seek alternatives to the higher prices in central Portland or Lake Oswego. Limited space for new development has contributed to price gains, as has the area’s top-rated schools and peaceful ambiance. Home values surged in the early 2020s as remote work increased interest in centrally located neighborhoods with privacy and charm. In 2025, West Slope remains an under-the-radar market with top-tier real estate numbers to match.
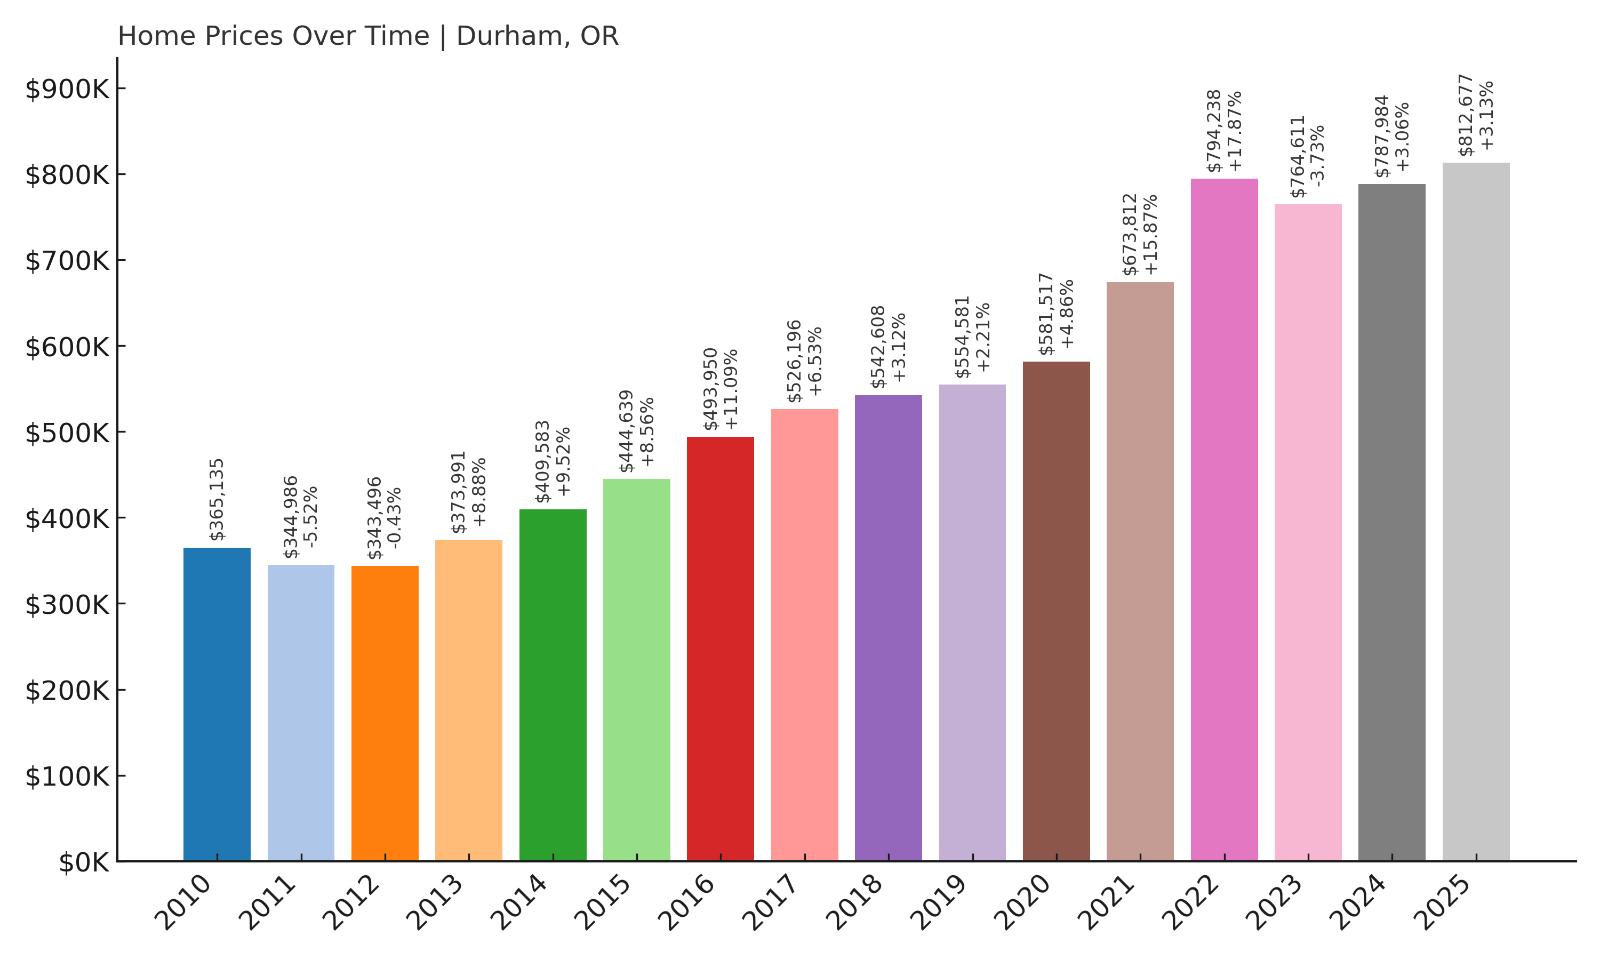
8. Durham – 137% Home Price Increase Since 2012
🔥 Would you like to save this?
- 2010: $365,135
- 2011: $344,986 (-$20,148, -5.52% from previous year)
- 2012: $343,496 (-$1,491, -0.43% from previous year)
- 2013: $373,991 (+$30,496, +8.88% from previous year)
- 2014: $409,583 (+$35,592, +9.52% from previous year)
- 2015: $444,639 (+$35,056, +8.56% from previous year)
- 2016: $493,950 (+$49,311, +11.09% from previous year)
- 2017: $526,196 (+$32,246, +6.53% from previous year)
- 2018: $542,608 (+$16,412, +3.12% from previous year)
- 2019: $554,581 (+$11,973, +2.21% from previous year)
- 2020: $581,517 (+$26,936, +4.86% from previous year)
- 2021: $673,812 (+$92,295, +15.87% from previous year)
- 2022: $794,238 (+$120,426, +17.87% from previous year)
- 2023: $764,611 (-$29,627, -3.73% from previous year)
- 2024: $787,984 (+$23,374, +3.06% from previous year)
- 2025: $812,677 (+$24,693, +3.13% from previous year)
Durham’s home prices have increased 137% since 2012, climbing from $343,496 to $812,677 by 2025. While growth was steady through the 2010s, the steepest increases happened in 2021 and 2022, when the market added over $210,000 in just two years. Despite a dip in 2023, prices rebounded and hit new highs in 2025, signaling sustained strength in this small but well-located community.
Durham – Tiny in Size, Huge in Value
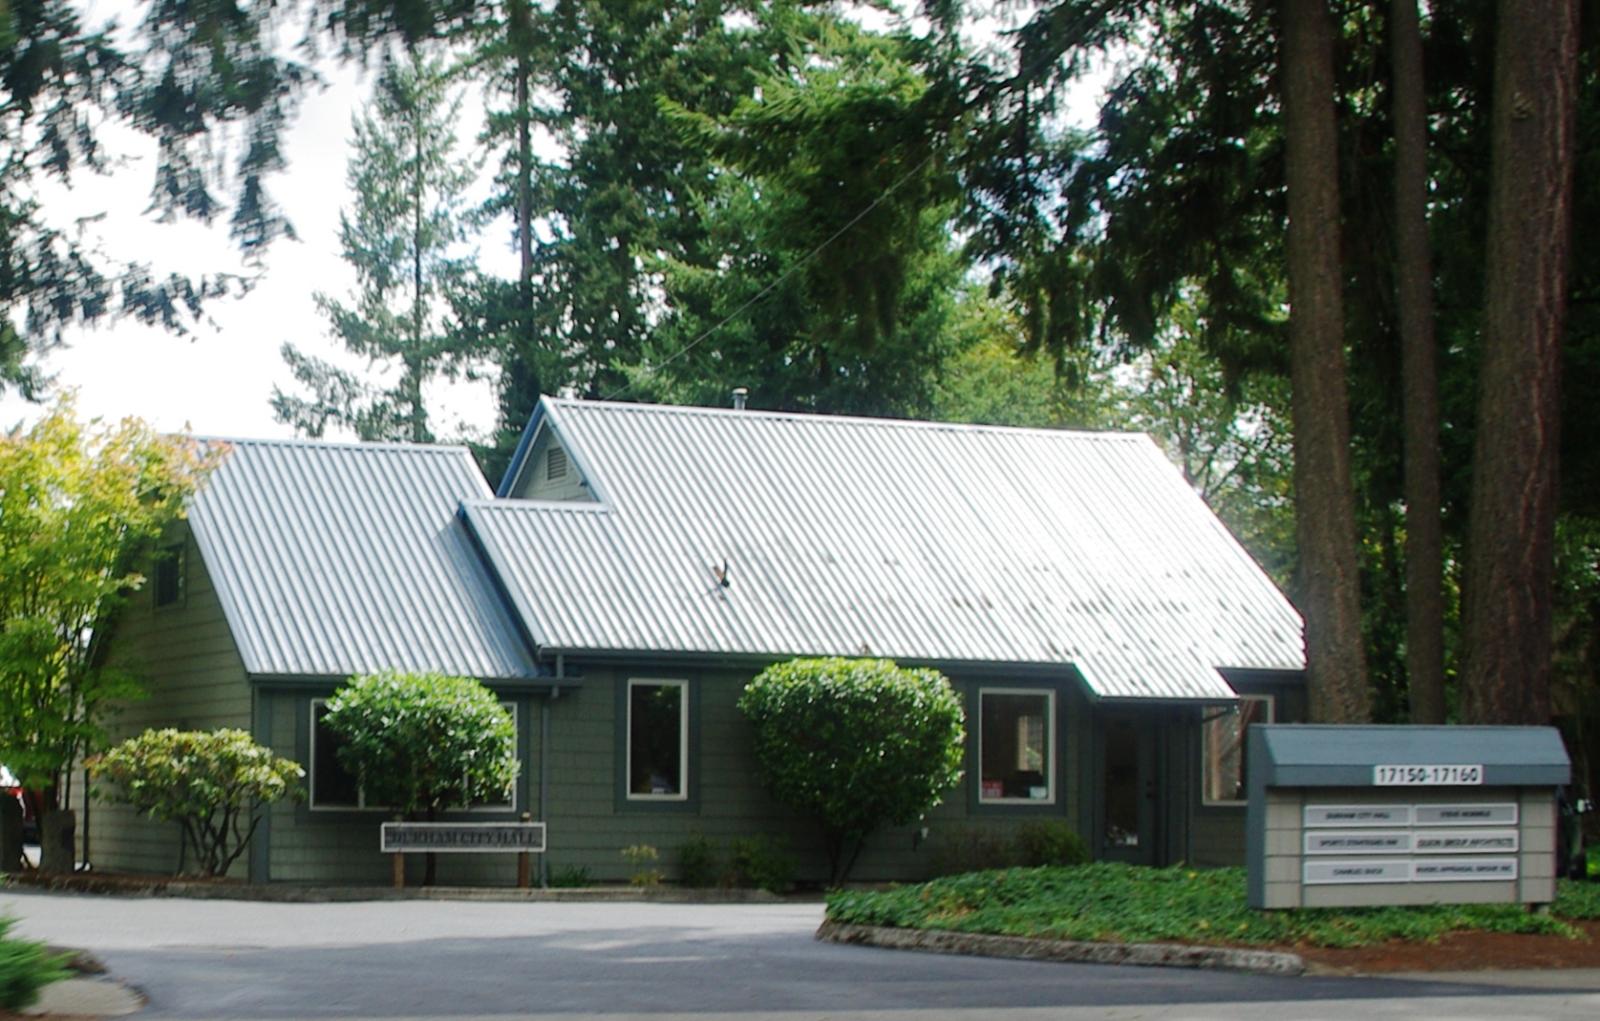
Durham is a compact city located between Tigard and Tualatin in Washington County, with a population of fewer than 2,000 residents. Though small in size, it packs a punch in real estate value. Its appeal lies in location: residents have access to Bridgeport Village, top-rated schools, and quick commutes to major employers in both Portland and the tech hubs of Beaverton. With few commercial distractions and plenty of green space, Durham offers an almost hidden pocket of suburban calm in an otherwise fast-growing region.
What makes Durham especially unique is its balance of exclusivity and accessibility. The city has limited housing inventory and strict zoning that preserves its low-density character. This has helped drive up home prices as more buyers discover the area. Homes don’t hit the market often, and when they do, they move quickly. As of 2025, Durham continues to outperform much larger cities in home value growth, proving that even small places can make a big impact on the state’s housing map.
7. Sisters – 159% Home Price Increase Since 2012
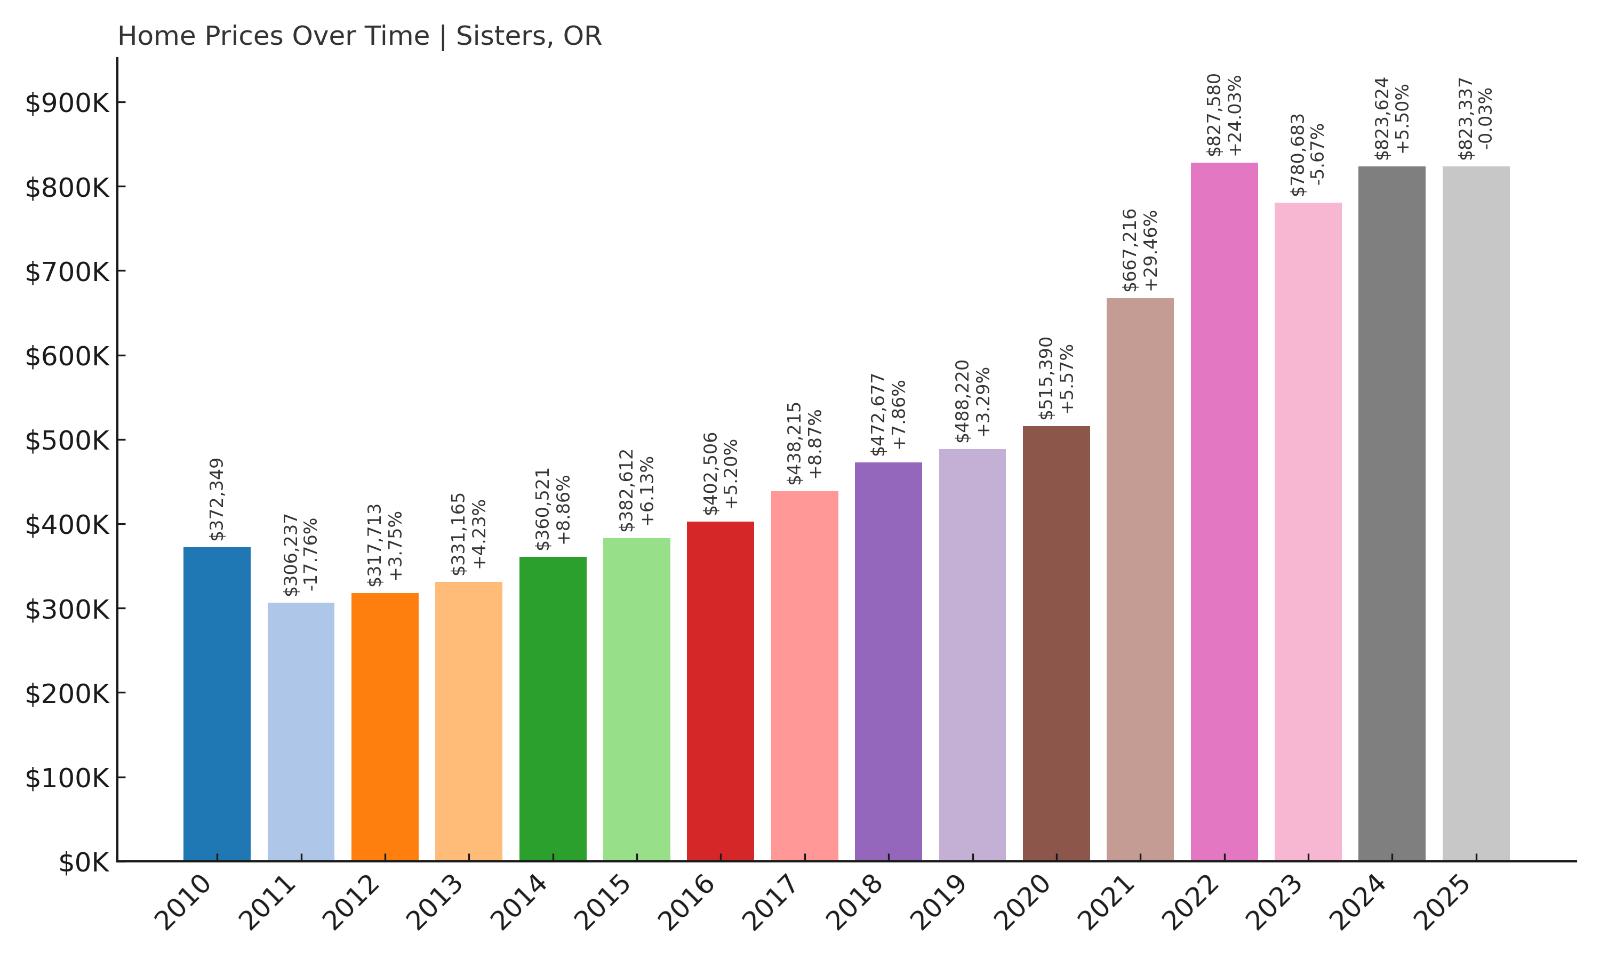
- 2010: $372,349
- 2011: $306,237 (-$66,112, -17.76% from previous year)
- 2012: $317,713 (+$11,476, +3.75% from previous year)
- 2013: $331,165 (+$13,452, +4.23% from previous year)
- 2014: $360,521 (+$29,355, +8.86% from previous year)
- 2015: $382,612 (+$22,091, +6.13% from previous year)
- 2016: $402,506 (+$19,893, +5.20% from previous year)
- 2017: $438,215 (+$35,709, +8.87% from previous year)
- 2018: $472,677 (+$34,462, +7.86% from previous year)
- 2019: $488,220 (+$15,543, +3.29% from previous year)
- 2020: $515,390 (+$27,169, +5.56% from previous year)
- 2021: $667,216 (+$151,826, +29.46% from previous year)
- 2022: $827,580 (+$160,365, +24.03% from previous year)
- 2023: $780,683 (-$46,897, -5.67% from previous year)
- 2024: $823,624 (+$42,940, +5.50% from previous year)
- 2025: $823,337 (-$287, -0.03% from previous year)
Sisters’ home prices have surged by 159% since 2012, rising from $317,713 to $823,337 in 2025. The town saw especially dramatic gains during 2021 and 2022, adding more than $310,000 in value across just those two years. Though the market corrected in 2023, it bounced back strongly in 2024 and remains one of Oregon’s most expensive rural markets. The long-term trend shows consistent growth fueled by demand for lifestyle properties and proximity to Central Oregon’s amenities.
Sisters – A Western Vibe With Premium Prices

Sisters is a small city in Deschutes County, located northwest of Bend, known for its charming Western-themed downtown, music festivals, and access to hiking, fishing, and skiing. It’s often seen as a quieter, more rustic alternative to Bend — but with home prices that now rival and in some cases exceed it. The town’s blend of artistic culture, scenic views of the Three Sisters mountains, and boutique shopping make it popular with retirees, second-home buyers, and remote workers seeking a slower pace without giving up quality of life.
The limited size of the town and high demand for real estate have pushed prices up dramatically in recent years. Many homes here are custom builds on large lots, and new construction is carefully controlled to preserve the area’s look and feel. This scarcity of inventory, combined with an influx of buyers post-2020, caused a sharp spike in values. As of 2025, even with some recent leveling off, Sisters remains one of Oregon’s top-tier rural housing markets — a place where buyers pay a premium for charm, nature, and community atmosphere.
6. Manzanita – 156% Home Price Increase Since 2012
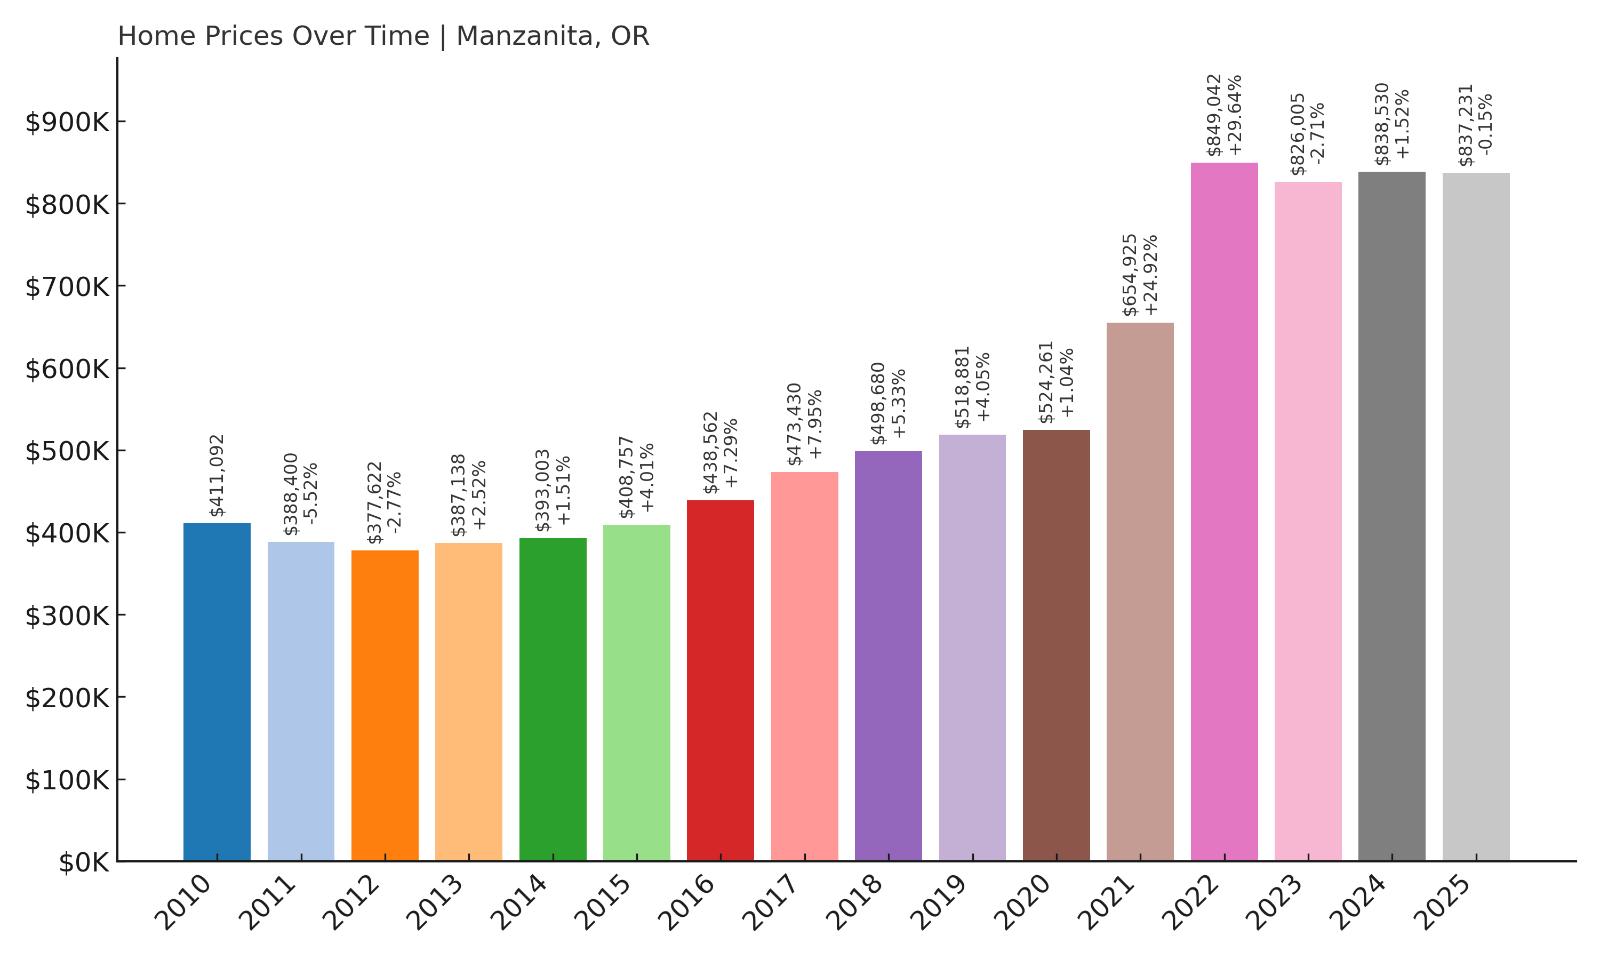
- 2010: $411,092
- 2011: $388,400 (-$22,692, -5.52% from previous year)
- 2012: $377,622 (-$10,777, -2.77% from previous year)
- 2013: $387,138 (+$9,516, +2.52% from previous year)
- 2014: $393,003 (+$5,865, +1.51% from previous year)
- 2015: $408,757 (+$15,754, +4.01% from previous year)
- 2016: $438,562 (+$29,804, +7.29% from previous year)
- 2017: $473,430 (+$34,868, +7.95% from previous year)
- 2018: $498,680 (+$25,250, +5.33% from previous year)
- 2019: $518,881 (+$20,201, +4.05% from previous year)
- 2020: $524,261 (+$5,380, +1.04% from previous year)
- 2021: $654,925 (+$130,664, +24.92% from previous year)
- 2022: $849,042 (+$194,118, +29.64% from previous year)
- 2023: $826,005 (-$23,037, -2.71% from previous year)
- 2024: $838,530 (+$12,525, +1.52% from previous year)
- 2025: $837,231 (-$1,298, -0.15% from previous year)
Manzanita’s home values have climbed 156% since 2012, rising from $377,622 to $837,231 by 2025. The most explosive growth happened between 2020 and 2022, when the town’s average home price jumped by over $320,000. While values have flattened slightly since, they remain well above pre-2020 levels. The numbers show that coastal Oregon markets, especially high-end ones like Manzanita, continue to command strong pricing despite broader market shifts.
Manzanita – Coastal Calm With High-End Appeal
Manzanita is a small coastal town on the northern Oregon coast, known for its broad beach, boutique shops, and peaceful vibe. Unlike some of the busier tourist hubs further south, Manzanita has cultivated a quiet, upscale reputation — and its home prices reflect that. Many properties offer ocean views or sit within walking distance of the beach, attracting second-home buyers from Portland, Seattle, and beyond. The town has maintained its charm by limiting large developments and protecting the natural beauty that makes it special.
The housing market here has exploded in recent years as more buyers look to the coast for vacation homes or remote living options. The limited number of homes, combined with high demand, has pushed prices sharply higher. While new listings are rare and sell quickly, the town has avoided overbuilding, keeping the supply low and values high. Manzanita may be small in size, but its real estate market is firmly in luxury territory — a trend that seems likely to continue given ongoing interest in Oregon’s coastline and the town’s growing reputation.
5. Lake Oswego – 164% Home Price Increase Since 2012
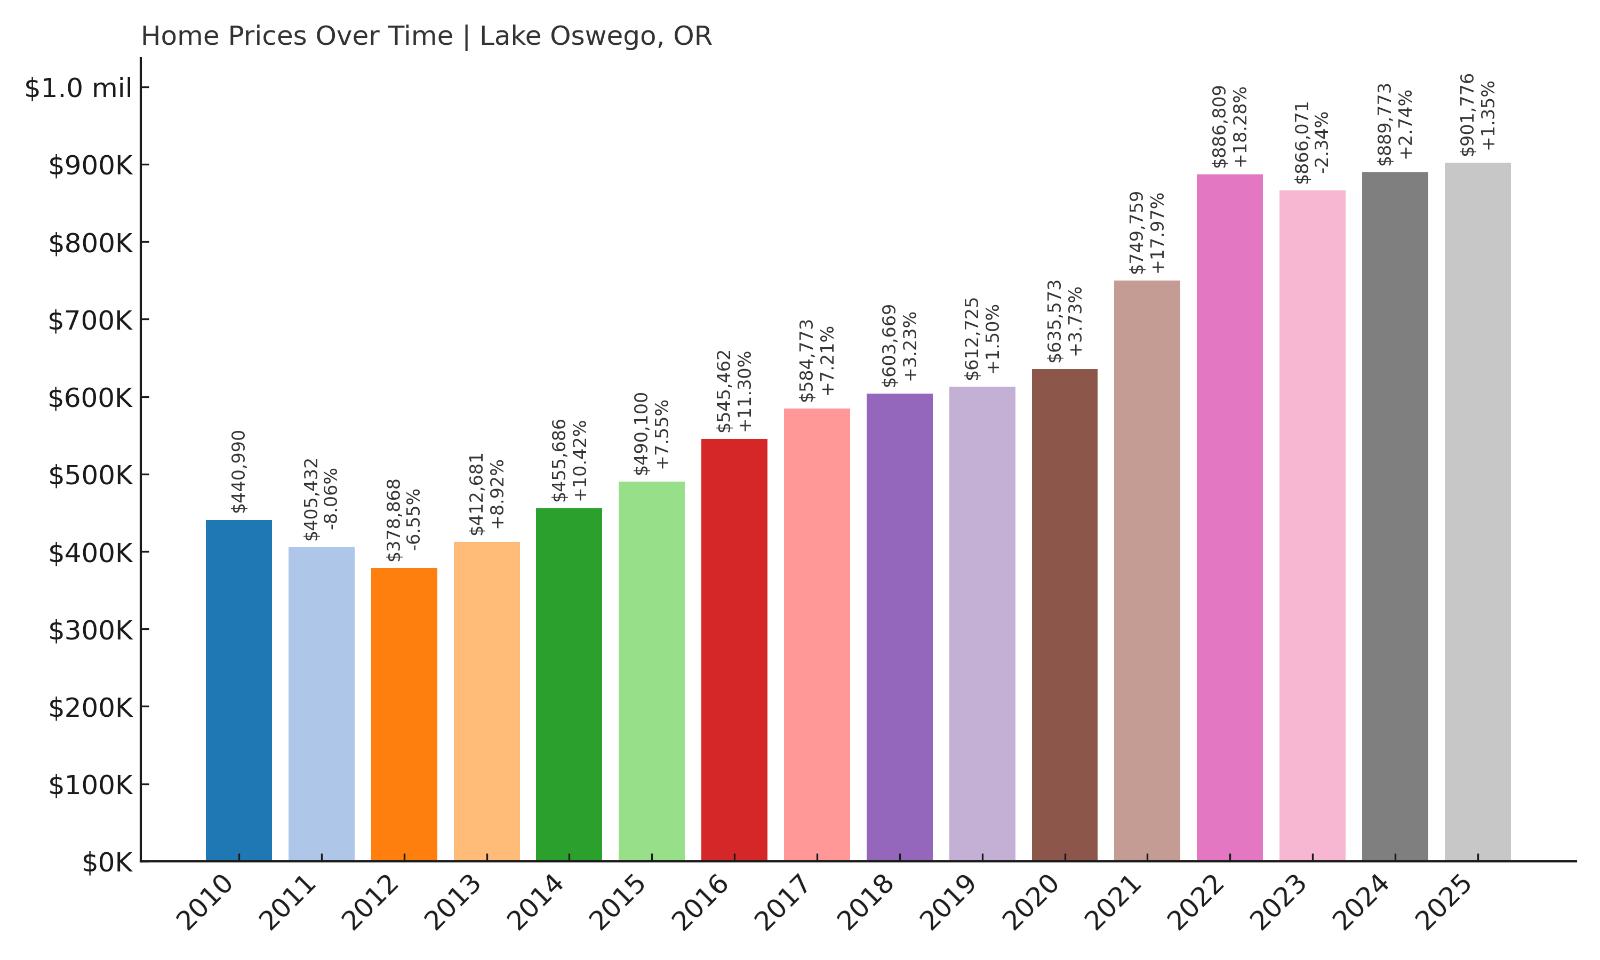
- 2010: $440,990
- 2011: $405,432 (-$35,558, -8.06% from previous year)
- 2012: $378,868 (-$26,564, -6.55% from previous year)
- 2013: $412,681 (+$33,812, +8.92% from previous year)
- 2014: $455,686 (+$43,005, +10.42% from previous year)
- 2015: $490,100 (+$34,414, +7.55% from previous year)
- 2016: $545,462 (+$55,363, +11.30% from previous year)
- 2017: $584,773 (+$39,310, +7.21% from previous year)
- 2018: $603,669 (+$18,897, +3.23% from previous year)
- 2019: $612,725 (+$9,056, +1.50% from previous year)
- 2020: $635,573 (+$22,848, +3.73% from previous year)
- 2021: $749,759 (+$114,186, +17.97% from previous year)
- 2022: $886,809 (+$137,050, +18.28% from previous year)
- 2023: $866,071 (-$20,738, -2.34% from previous year)
- 2024: $889,773 (+$23,701, +2.74% from previous year)
- 2025: $901,776 (+$12,003, +1.35% from previous year)
Lake Oswego’s home prices have risen 164% since 2012, climbing from $378,868 to $901,776 in 2025. This affluent suburb posted strong year-over-year growth throughout the 2010s and experienced rapid acceleration during the early 2020s. Even though prices dipped slightly in 2023, they quickly recovered, pushing Lake Oswego into Oregon’s top five most expensive housing markets.
Lake Oswego – Luxury, Location, and Legacy
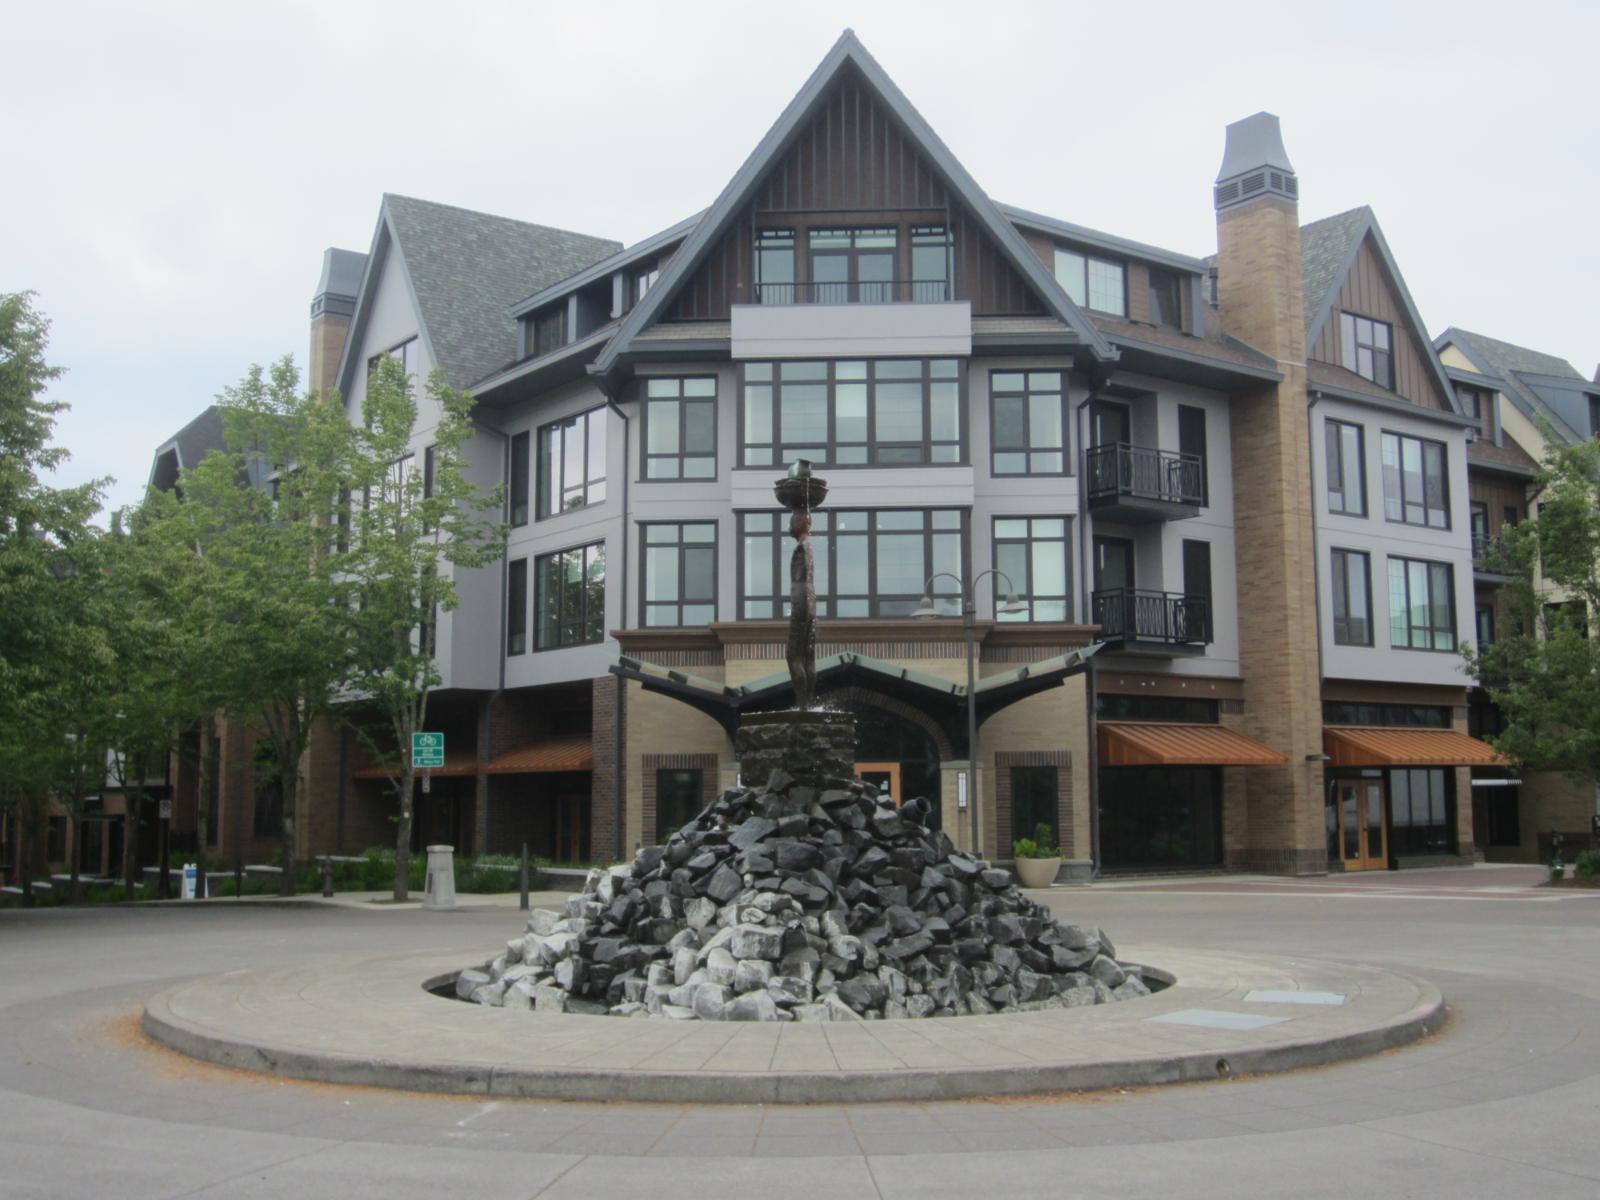
Lake Oswego is synonymous with upscale living in Oregon. Located just south of Portland, it has long been home to some of the state’s most luxurious real estate. The city surrounds a private lake and offers top-tier schools, high-end shopping, fine dining, and beautiful parks. With its manicured neighborhoods and architectural variety — from mid-century moderns to multimillion-dollar custom homes — Lake Oswego has maintained elite status for decades. It’s no surprise that home prices have climbed steadily, making it a favorite among executives, retirees, and out-of-state transplants alike.
What sets Lake Oswego apart is not just its wealth, but its planning and preservation. Strict zoning laws, a focus on quality design, and resistance to overdevelopment have created an environment where supply is perpetually tight. That scarcity, paired with enduring demand, has led to persistent price pressure. Buyers seeking exclusivity, convenience, and enduring property value have consistently chosen Lake Oswego — and the numbers show that trend is still going strong in 2025.
4. Cannon Beach – 141% Home Price Increase Since 2012
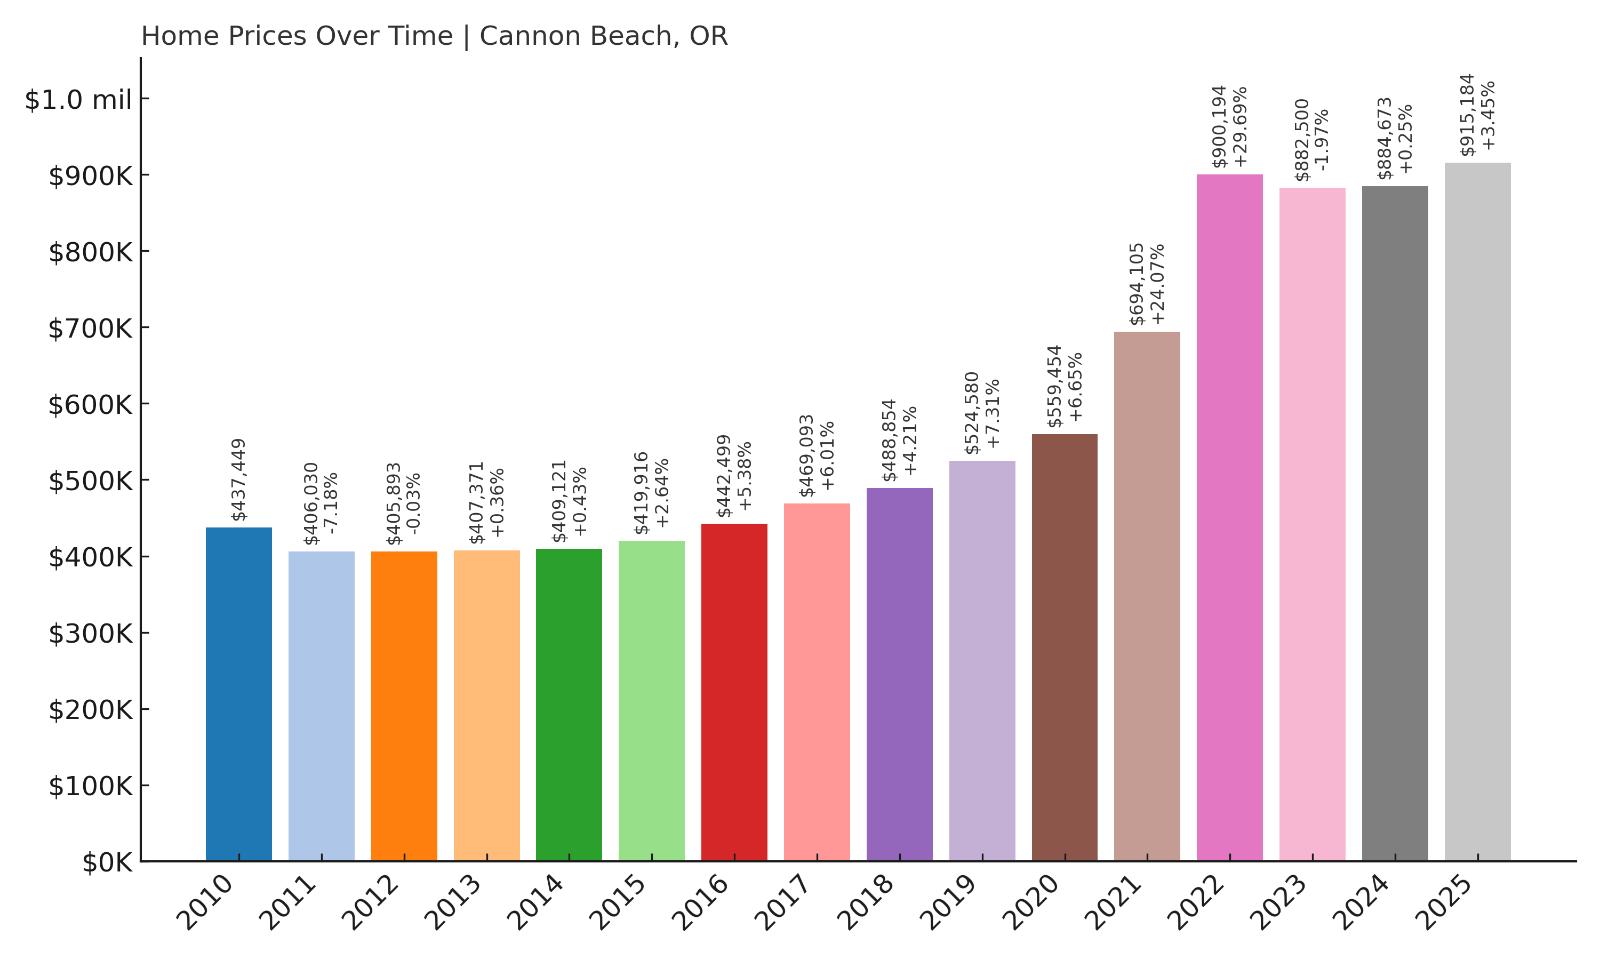
- 2010: $437,449
- 2011: $406,030 (-$31,419, -7.18% from previous year)
- 2012: $405,893 (-$137, -0.03% from previous year)
- 2013: $407,371 (+$1,477, +0.36% from previous year)
- 2014: $409,121 (+$1,750, +0.43% from previous year)
- 2015: $419,916 (+$10,795, +2.64% from previous year)
- 2016: $442,499 (+$22,583, +5.38% from previous year)
- 2017: $469,093 (+$26,594, +6.01% from previous year)
- 2018: $488,854 (+$19,761, +4.21% from previous year)
- 2019: $524,580 (+$35,726, +7.31% from previous year)
- 2020: $559,454 (+$34,874, +6.65% from previous year)
- 2021: $694,105 (+$134,651, +24.07% from previous year)
- 2022: $900,194 (+$206,088, +29.69% from previous year)
- 2023: $882,500 (-$17,694, -1.97% from previous year)
- 2024: $884,673 (+$2,174, +0.25% from previous year)
- 2025: $915,184 (+$30,511, +3.45% from previous year)
Cannon Beach has posted a 141% increase in home values since 2012, rising from $405,893 to $915,184 by 2025. The steepest gains came between 2020 and 2022, when prices surged by over $340,000 in just two years. Despite a slight dip in 2023, values have recovered, leaving Cannon Beach as one of the most expensive coastal markets in Oregon.
Cannon Beach – Oregon Coast’s Crown Jewel
🔥 Would you like to save this?
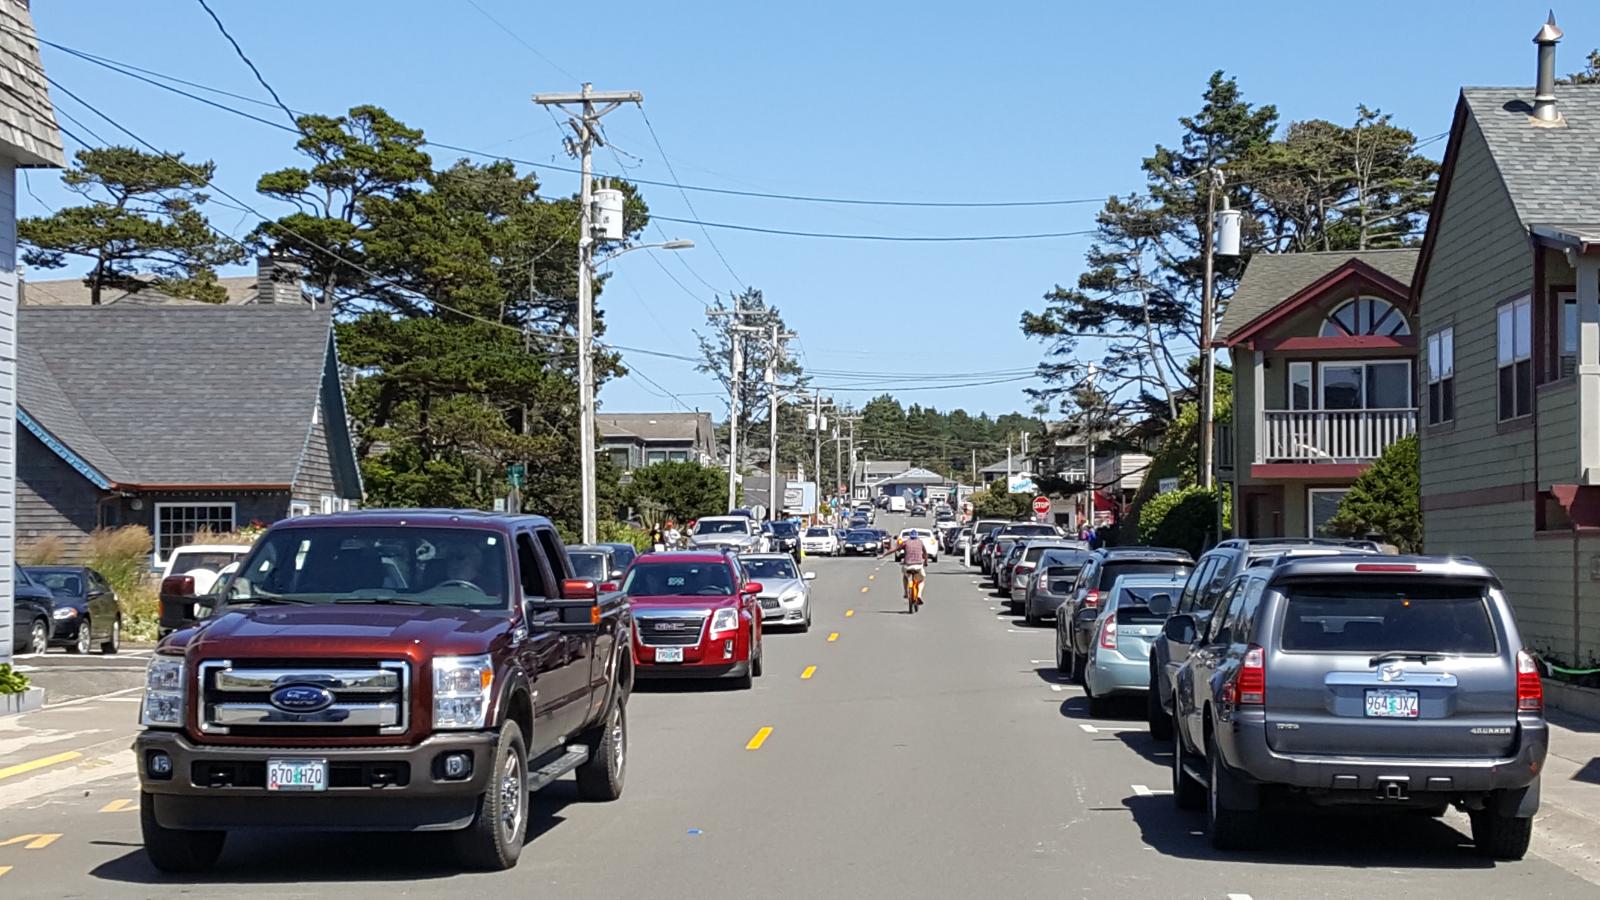
Cannon Beach is often regarded as the most iconic beach town in Oregon. Known for the dramatic backdrop of Haystack Rock, wide sandy beaches, and an upscale yet artsy feel, it draws tourists and second-home buyers year-round. The town has resisted overdevelopment, preserving its charm with strict building codes, no high-rises, and a walkable downtown lined with boutiques, art galleries, and fine restaurants. This has helped keep real estate inventory low and home values high.
The market here is largely driven by demand from affluent Portland-area buyers and out-of-state vacation home seekers. Cannon Beach homes, especially those with ocean views, rarely come on the market — and when they do, they fetch premium prices. The town’s limited land base and protected coastline ensure that supply will remain tight for years to come. Even small cottages routinely list for well over $1 million. In 2025, Cannon Beach remains the gold standard for luxury coastal property in Oregon.
3. Arch Cape – 118% Home Price Increase Since 2012
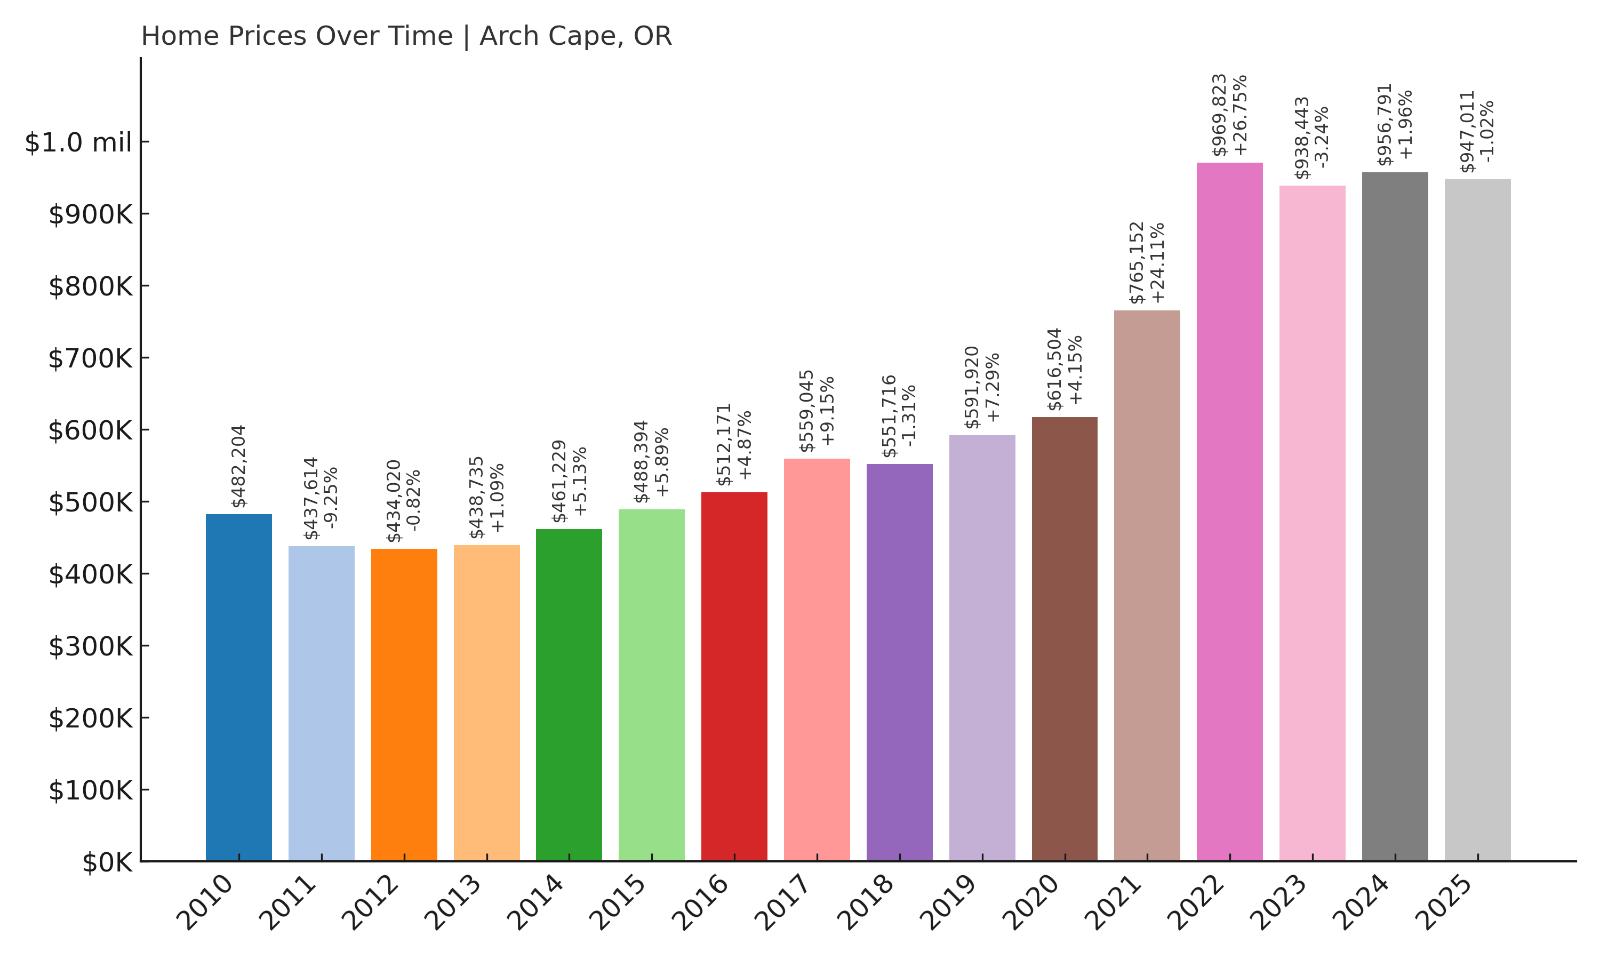
- 2010: $482,204
- 2011: $437,614 (-$44,590, -9.25% from previous year)
- 2012: $434,020 (-$3,594, -0.82% from previous year)
- 2013: $438,735 (+$4,716, +1.09% from previous year)
- 2014: $461,229 (+$22,493, +5.13% from previous year)
- 2015: $488,394 (+$27,166, +5.89% from previous year)
- 2016: $512,171 (+$23,777, +4.87% from previous year)
- 2017: $559,045 (+$46,874, +9.15% from previous year)
- 2018: $551,716 (-$7,329, -1.31% from previous year)
- 2019: $591,920 (+$40,204, +7.29% from previous year)
- 2020: $616,504 (+$24,584, +4.15% from previous year)
- 2021: $765,152 (+$148,648, +24.11% from previous year)
- 2022: $969,823 (+$204,671, +26.75% from previous year)
- 2023: $938,443 (-$31,380, -3.24% from previous year)
- 2024: $956,791 (+$18,348, +1.96% from previous year)
- 2025: $947,011 (-$9,781, -1.02% from previous year)
Arch Cape’s home values have risen 118% since 2012, climbing from $434,020 to $947,011 in 2025. The sharpest appreciation occurred during the boom years of 2021 and 2022, with over $350,000 in combined value added. Prices have cooled slightly in the past two years but remain near record highs, keeping Arch Cape firmly among Oregon’s most elite coastal housing markets.
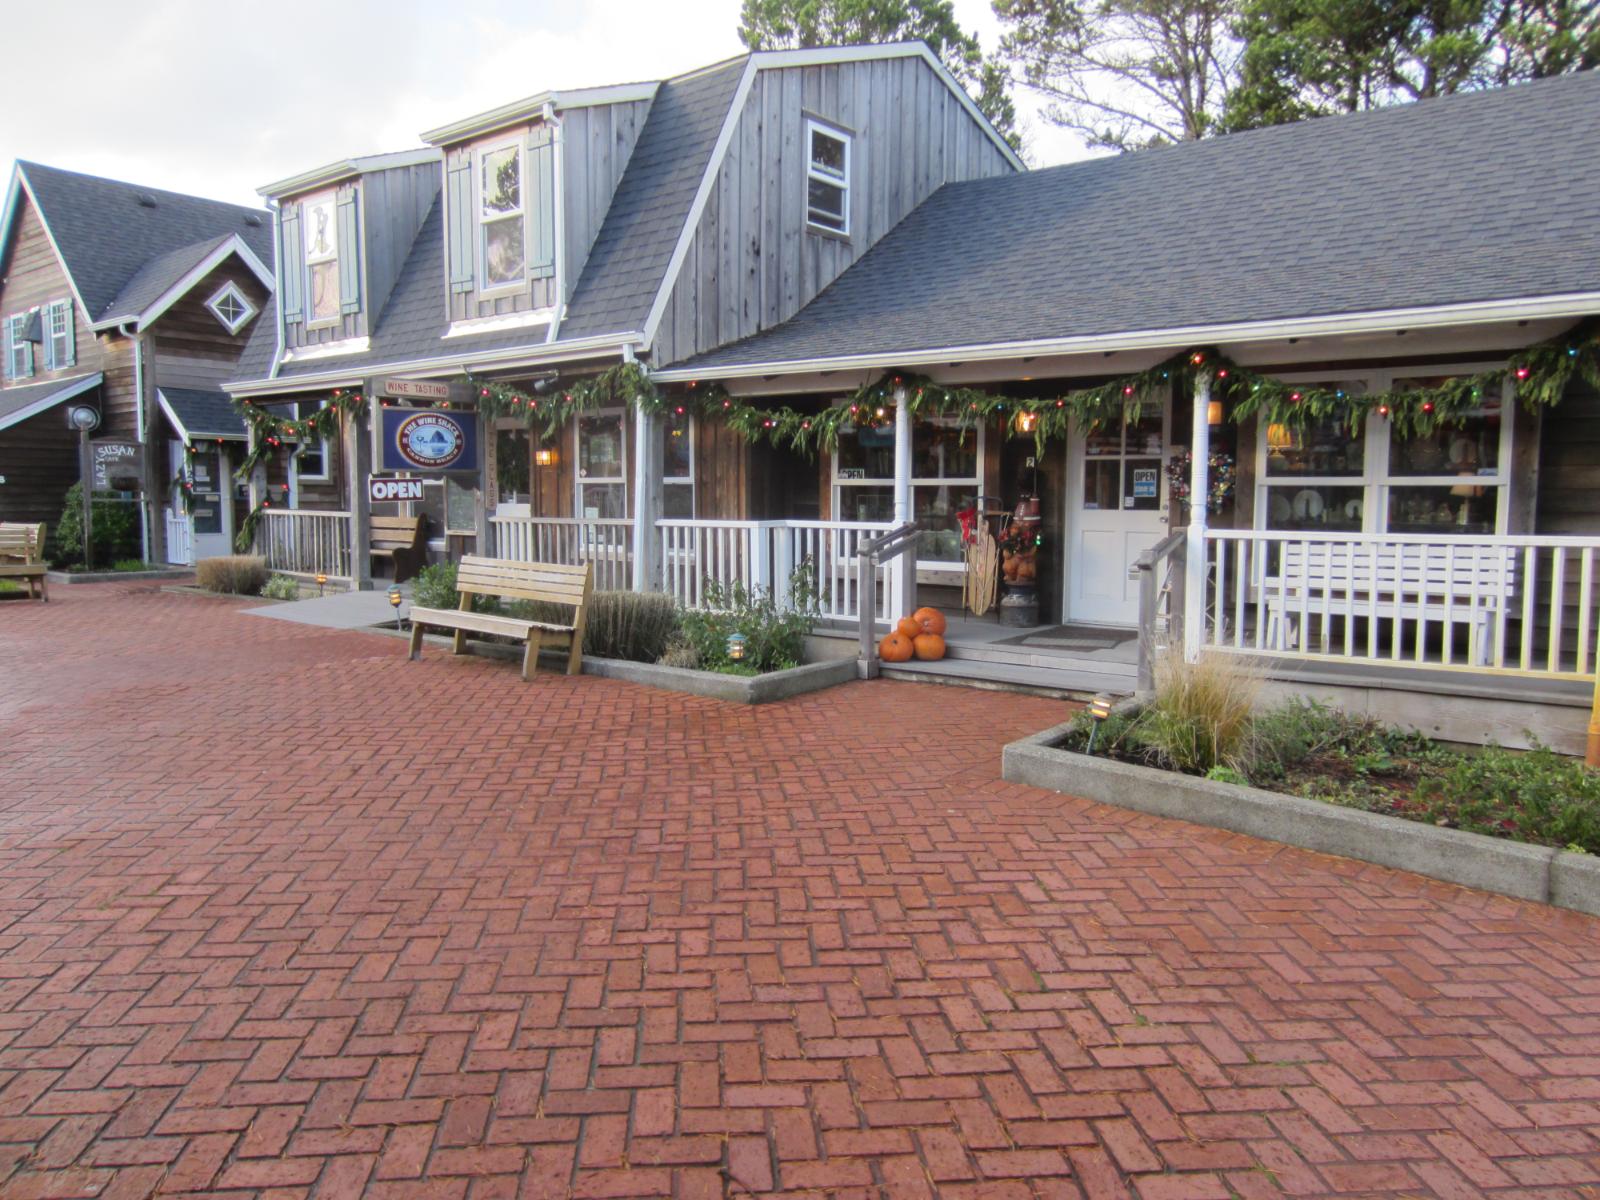
Arch Cape – Seclusion by the Sea
Located just south of Cannon Beach, Arch Cape is a tiny residential enclave known for its seclusion, stunning coastal views, and high-end real estate. There are no commercial businesses, only a cluster of homes between the ocean and forested hillsides. This isolation, paired with world-class scenery, has made it one of the most desirable — and exclusive — places to own property on the Oregon Coast. Homeowners here are often second-home buyers or long-term investors looking for privacy and oceanfront value that will endure.
Because the town is unincorporated and surrounded by protected forest and parkland, there is very little room for new development. That extreme scarcity, coupled with intense demand from wealthy buyers, has kept home values climbing year after year. While prices dipped slightly in 2023 and 2025, the broader trend has been remarkably strong. In 2025, Arch Cape remains a small but mighty force in Oregon’s luxury real estate scene.
2. Raleigh Hills – 111% Home Price Increase Since 2012
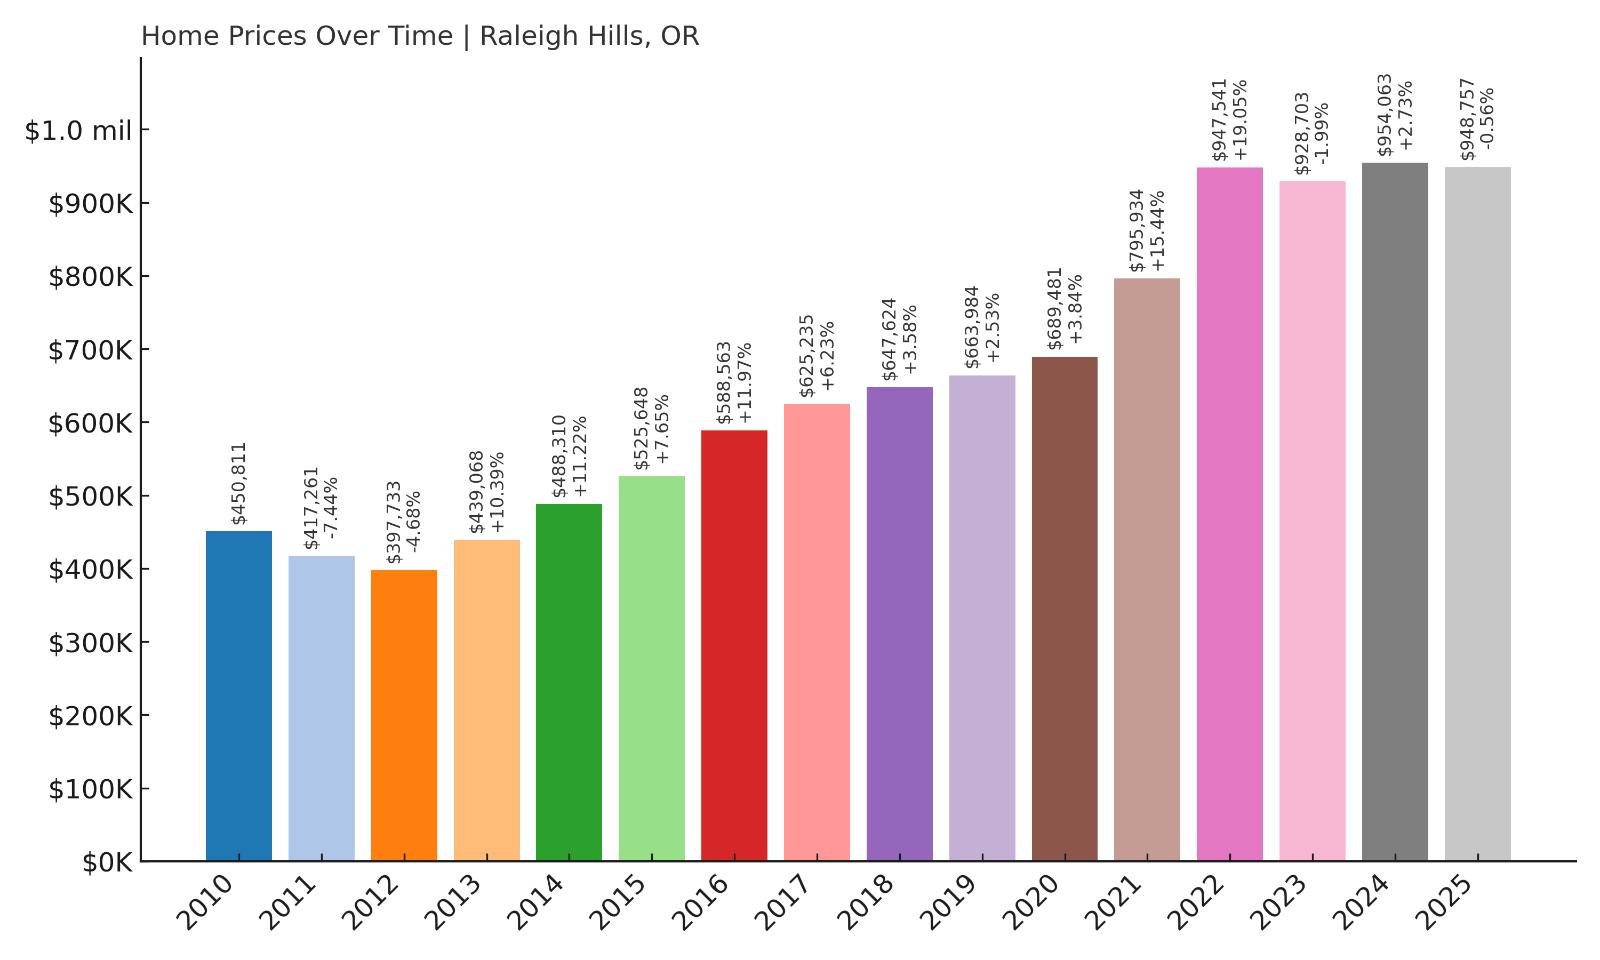
- 2010: $450,811
- 2011: $417,261 (-$33,549, -7.44% from previous year)
- 2012: $397,733 (-$19,528, -4.68% from previous year)
- 2013: $439,068 (+$41,335, +10.39% from previous year)
- 2014: $488,310 (+$49,242, +11.22% from previous year)
- 2015: $525,648 (+$37,338, +7.65% from previous year)
- 2016: $588,563 (+$62,915, +11.97% from previous year)
- 2017: $625,235 (+$36,672, +6.23% from previous year)
- 2018: $647,624 (+$22,389, +3.58% from previous year)
- 2019: $663,984 (+$16,361, +2.53% from previous year)
- 2020: $689,481 (+$25,497, +3.84% from previous year)
- 2021: $795,934 (+$106,453, +15.44% from previous year)
- 2022: $947,541 (+$151,607, +19.05% from previous year)
- 2023: $928,703 (-$18,838, -1.99% from previous year)
- 2024: $954,063 (+$25,360, +2.73% from previous year)
- 2025: $948,757 (-$5,306, -0.56% from previous year)
Raleigh Hills has experienced one of the steadiest and most impressive home price trajectories in Oregon, with values climbing from $397,733 in 2012 to $948,757 in 2025 — an overall increase of 111%. The sharpest spikes occurred in 2021 and 2022, when values jumped by more than $250,000 over two years. Despite a minor dip in 2023, the market corrected with renewed growth in 2024 before leveling slightly in 2025. This long-term upward trend reflects Raleigh Hills’ deep-rooted appeal as a high-end suburban enclave with enduring demand.
Raleigh Hills – Suburban Elegance Meets Urban Access
Nestled between Beaverton and Portland’s Southwest Hills, Raleigh Hills has carved out a niche as a refined, well-established residential area that offers tranquility and convenience in equal measure. The neighborhood is prized for its tree-lined streets, proximity to top-ranked schools, and blend of mid-century and modern homes on larger-than-average lots. Buyers are drawn to its quiet charm without sacrificing access to shopping centers, parks, and employment hubs in Portland. Raleigh Hills Elementary School and Jesuit High School add strong educational appeal for families prioritizing long-term residency and academic performance. Despite its suburban feel, downtown Portland is just a 15-minute drive, making Raleigh Hills ideal for commuters who want space without a long haul.
While home values here command a premium, they are rooted in more than just location — they’re supported by limited inventory, zoning restrictions that prevent overdevelopment, and a highly desirable demographic profile. Homebuyers typically enter the market here looking for a long-term investment, and with steady demand from professionals, retirees, and families alike, Raleigh Hills has remained resilient through economic cycles. The housing market here has proven stable, with fewer foreclosures or speculative fluctuations than more recently gentrified areas. For those seeking a polished, low-turnover neighborhood with deep roots and high value, Raleigh Hills continues to deliver.
1. Powell Butte – 191% Home Price Increase Since 2012
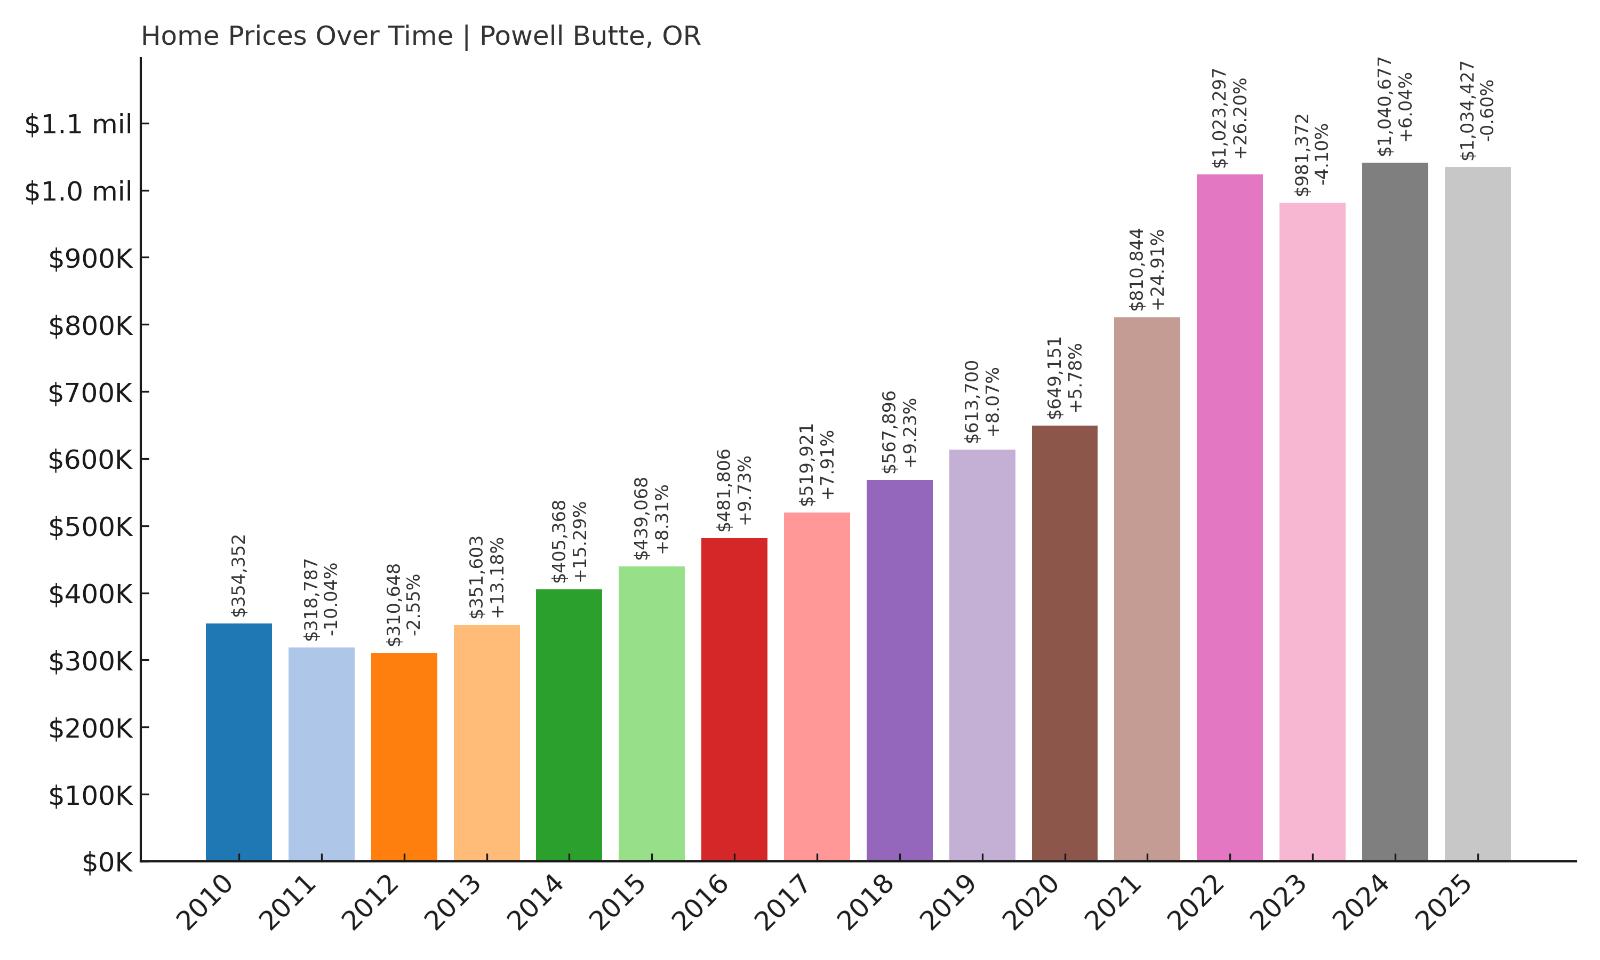
- 2010: $354,352
- 2011: $318,787 (-$35,565, -10.04% from previous year)
- 2012: $310,648 (-$8,139, -2.55% from previous year)
- 2013: $351,603 (+$40,955, +13.18% from previous year)
- 2014: $405,368 (+$53,765, +15.29% from previous year)
- 2015: $439,068 (+$33,700, +8.31% from previous year)
- 2016: $481,806 (+$42,738, +9.73% from previous year)
- 2017: $519,921 (+$38,115, +7.91% from previous year)
- 2018: $567,896 (+$47,975, +9.23% from previous year)
- 2019: $613,700 (+$45,804, +8.07% from previous year)
- 2020: $649,151 (+$35,450, +5.78% from previous year)
- 2021: $810,844 (+$161,693, +24.91% from previous year)
- 2022: $1,023,297 (+$212,453, +26.20% from previous year)
- 2023: $981,372 (-$41,925, -4.10% from previous year)
- 2024: $1,040,677 (+$59,304, +6.04% from previous year)
- 2025: $1,034,427 (-$6,250, -0.60% from previous year)
Powell Butte claims the top spot in Oregon’s most expensive towns list, with an astonishing rise in home values — from $310,648 in 2012 to $1,034,427 in 2025. That’s a jump of over 191%, driven by particularly explosive gains between 2020 and 2022 when property values soared by over $374,000 in just two years. Even with a modest dip in 2023, the upward pressure returned in 2024, cementing Powell Butte’s place at the pinnacle of Oregon’s luxury housing market. The numbers reflect more than inflation; they reflect a decisive market shift into elite pricing territory.
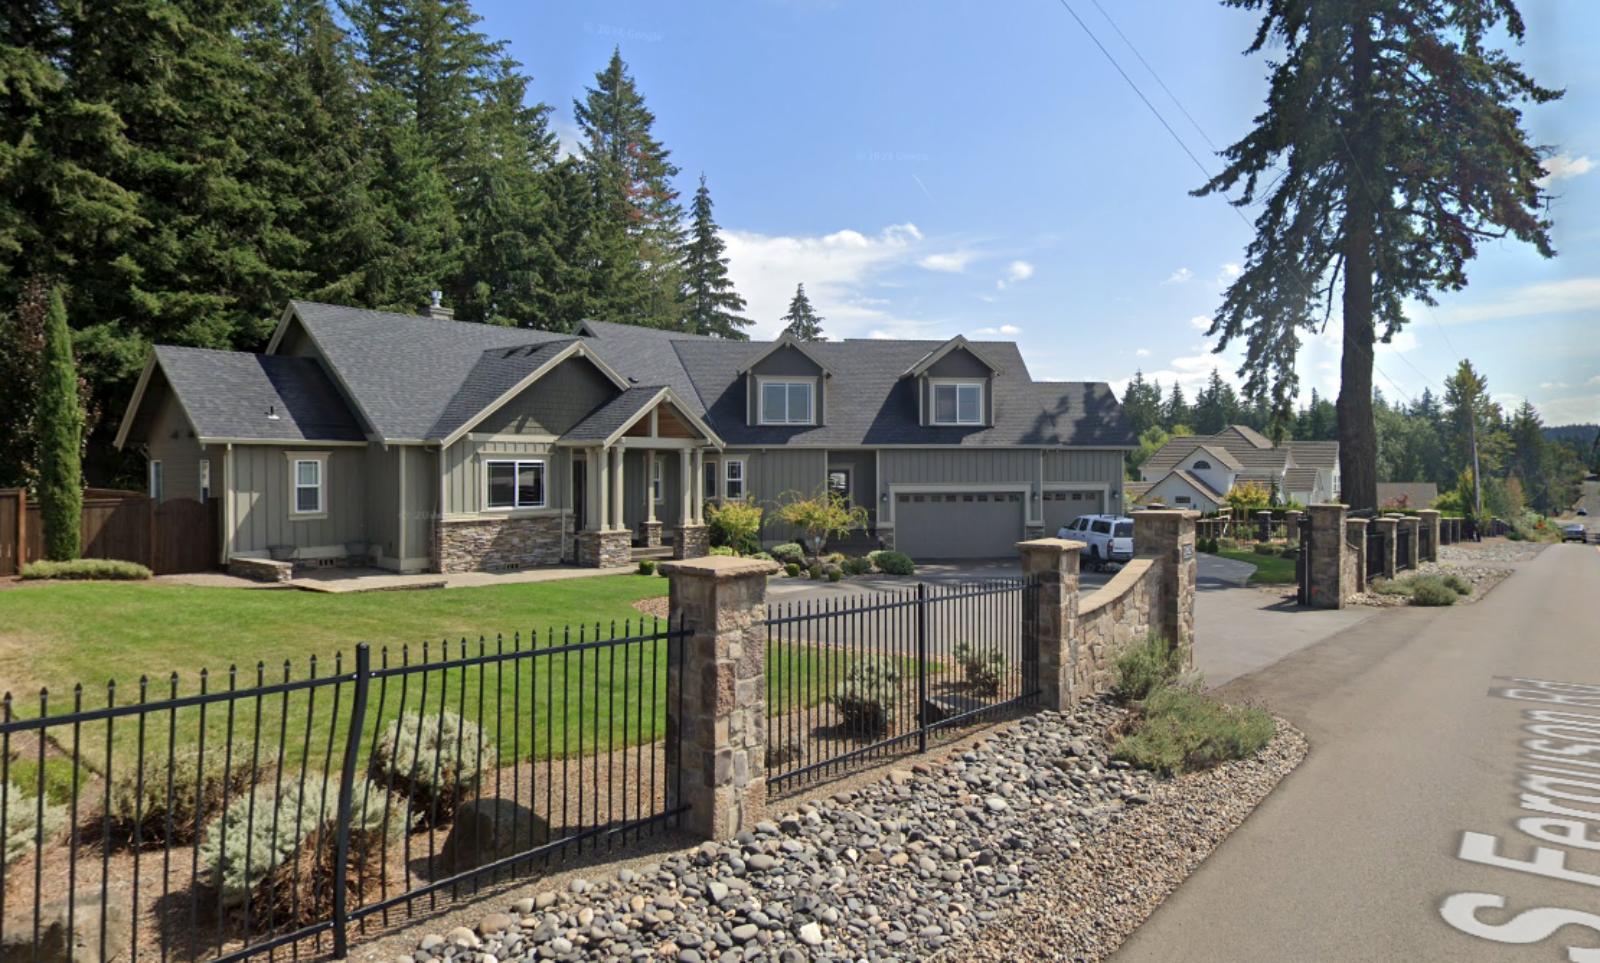
Powell Butte – Scenic Luxury and Rural Prestige
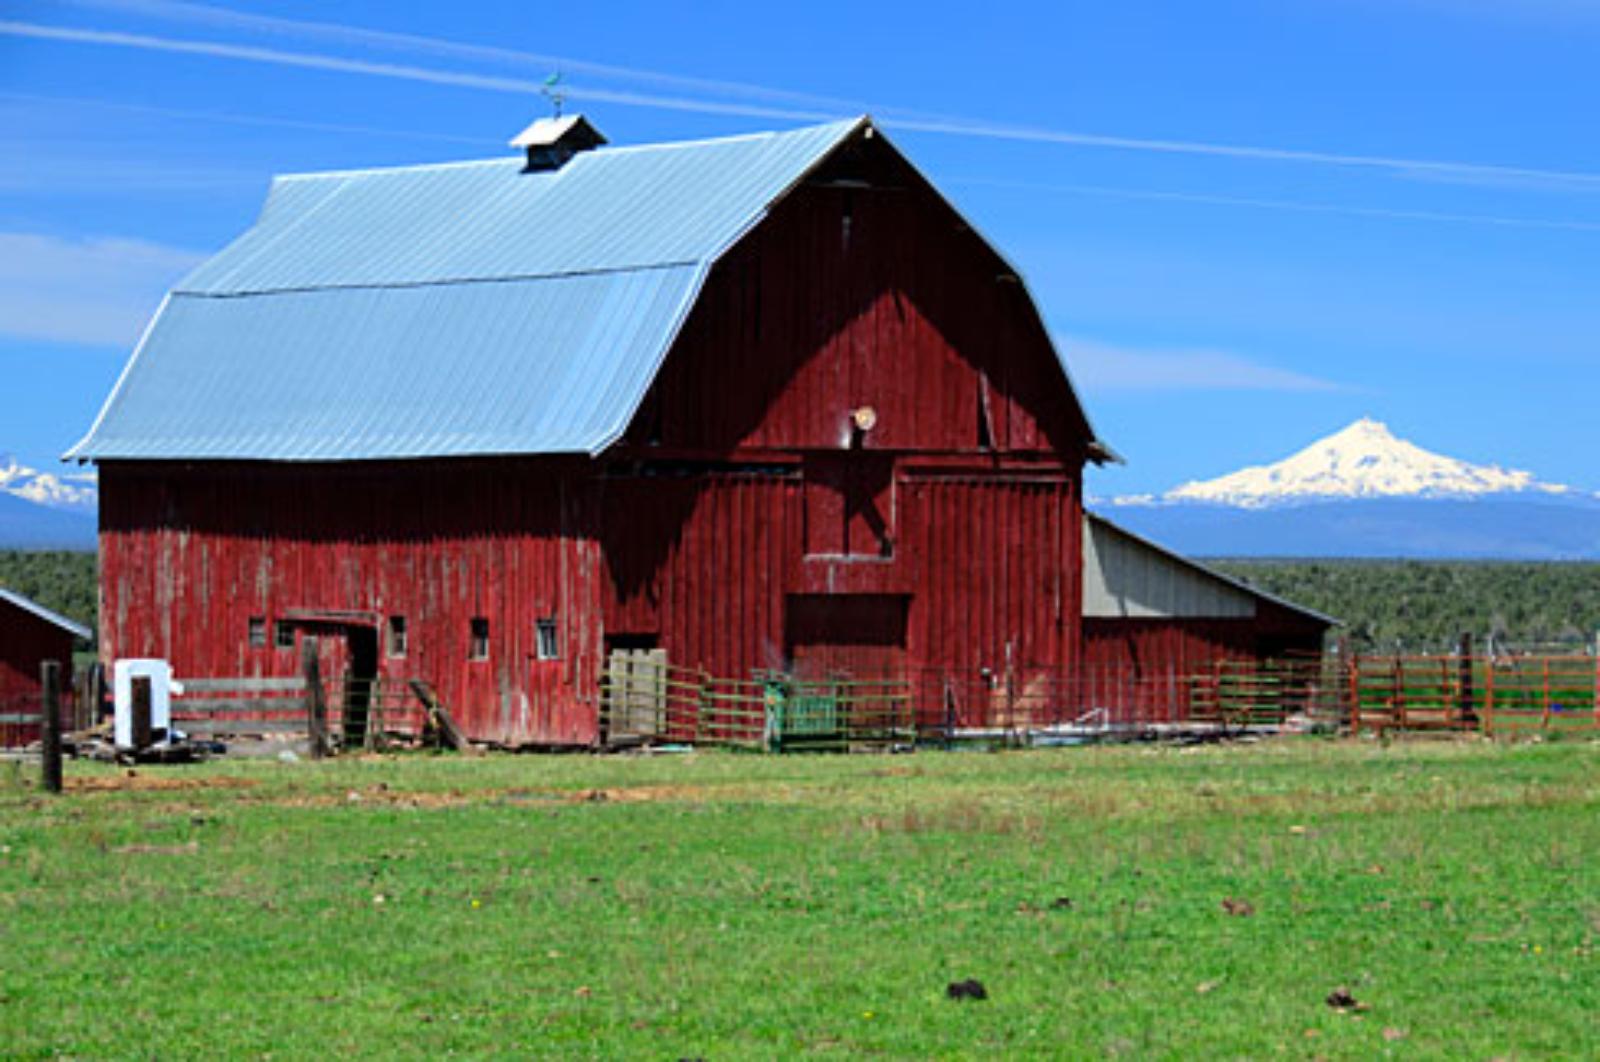
Set against the high-desert backdrop of Central Oregon, Powell Butte offers a rare mix of wide-open spaces, panoramic views of the Cascades, and high-end rural living. This unincorporated community in Crook County has become a magnet for buyers looking to escape dense urban cores while maintaining a lifestyle of comfort, seclusion, and natural beauty. Large-acre properties, equestrian estates, and custom-built homes define the area’s real estate offerings, and proximity to both Redmond and Bend makes it logistically viable for remote workers or retirees with flexible schedules. The presence of Brasada Ranch — a luxury resort and golf community — has further elevated the town’s profile, introducing resort-grade amenities and attracting a national clientele.
Powell Butte’s market reflects the emerging appetite for luxury in non-urban settings. As Oregon’s urban centers become denser and pricier, affluent buyers have increasingly sought expansive, self-contained properties where privacy meets prestige. Limited housing inventory, high construction costs, and environmental desirability have all contributed to Powell Butte’s market escalation. While this boom brings concerns about affordability for locals, the town’s economic trajectory remains firmly upward. With its mix of ranch culture, mountain views, and premium real estate developments, Powell Butte is a case study in how rural areas can become elite enclaves — and command prices to match.


