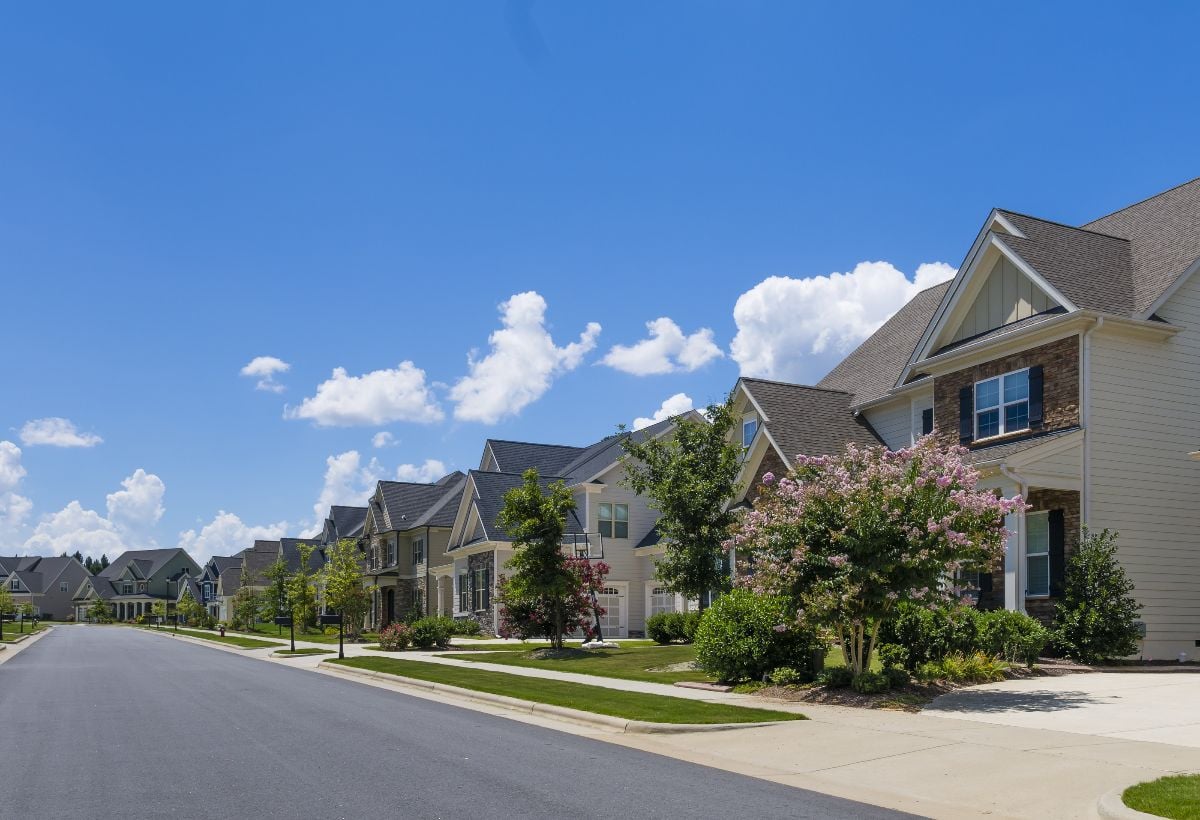
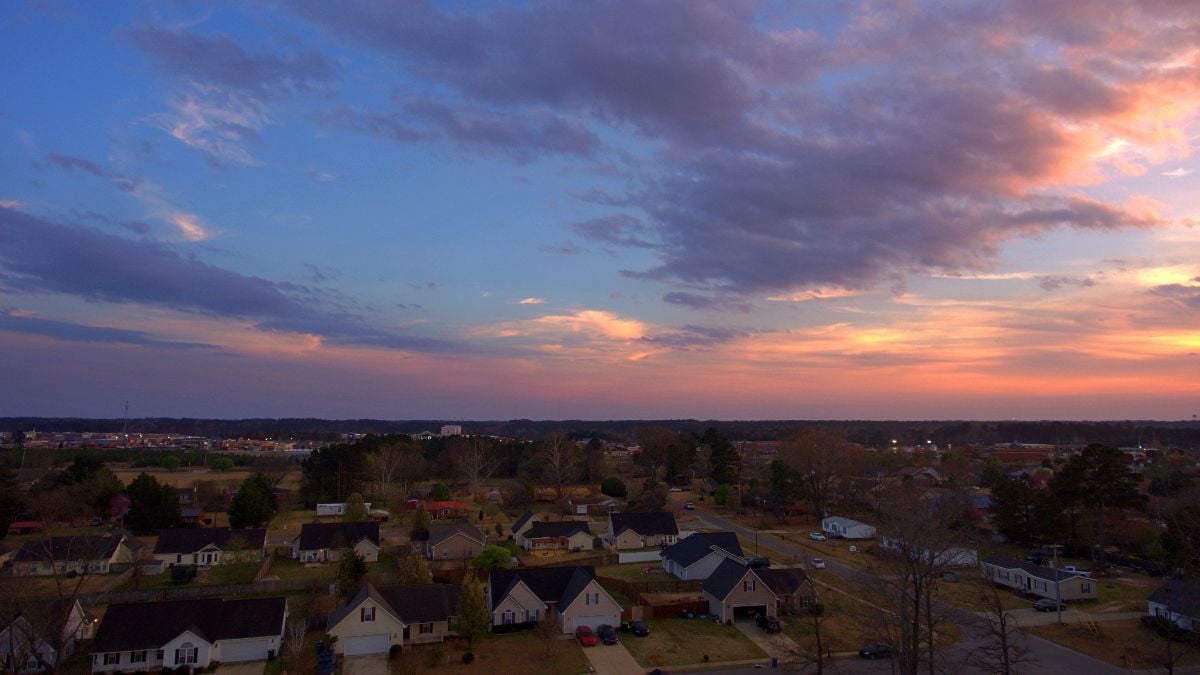
North Carolina was the darling of the post-pandemic housing boom. Remote workers flocked to Raleigh, Charlotte exploded with corporate relocations, and the coast and mountains became second-home magnets. But the July 2025 data paints a more complicated picture. Inventories are swelling, homes are taking longer to move, and statewide medians are slipping for the first time in years. Luxury remains strong, but the everyday buyer is running into affordability ceilings, and the everyday seller is losing leverage.
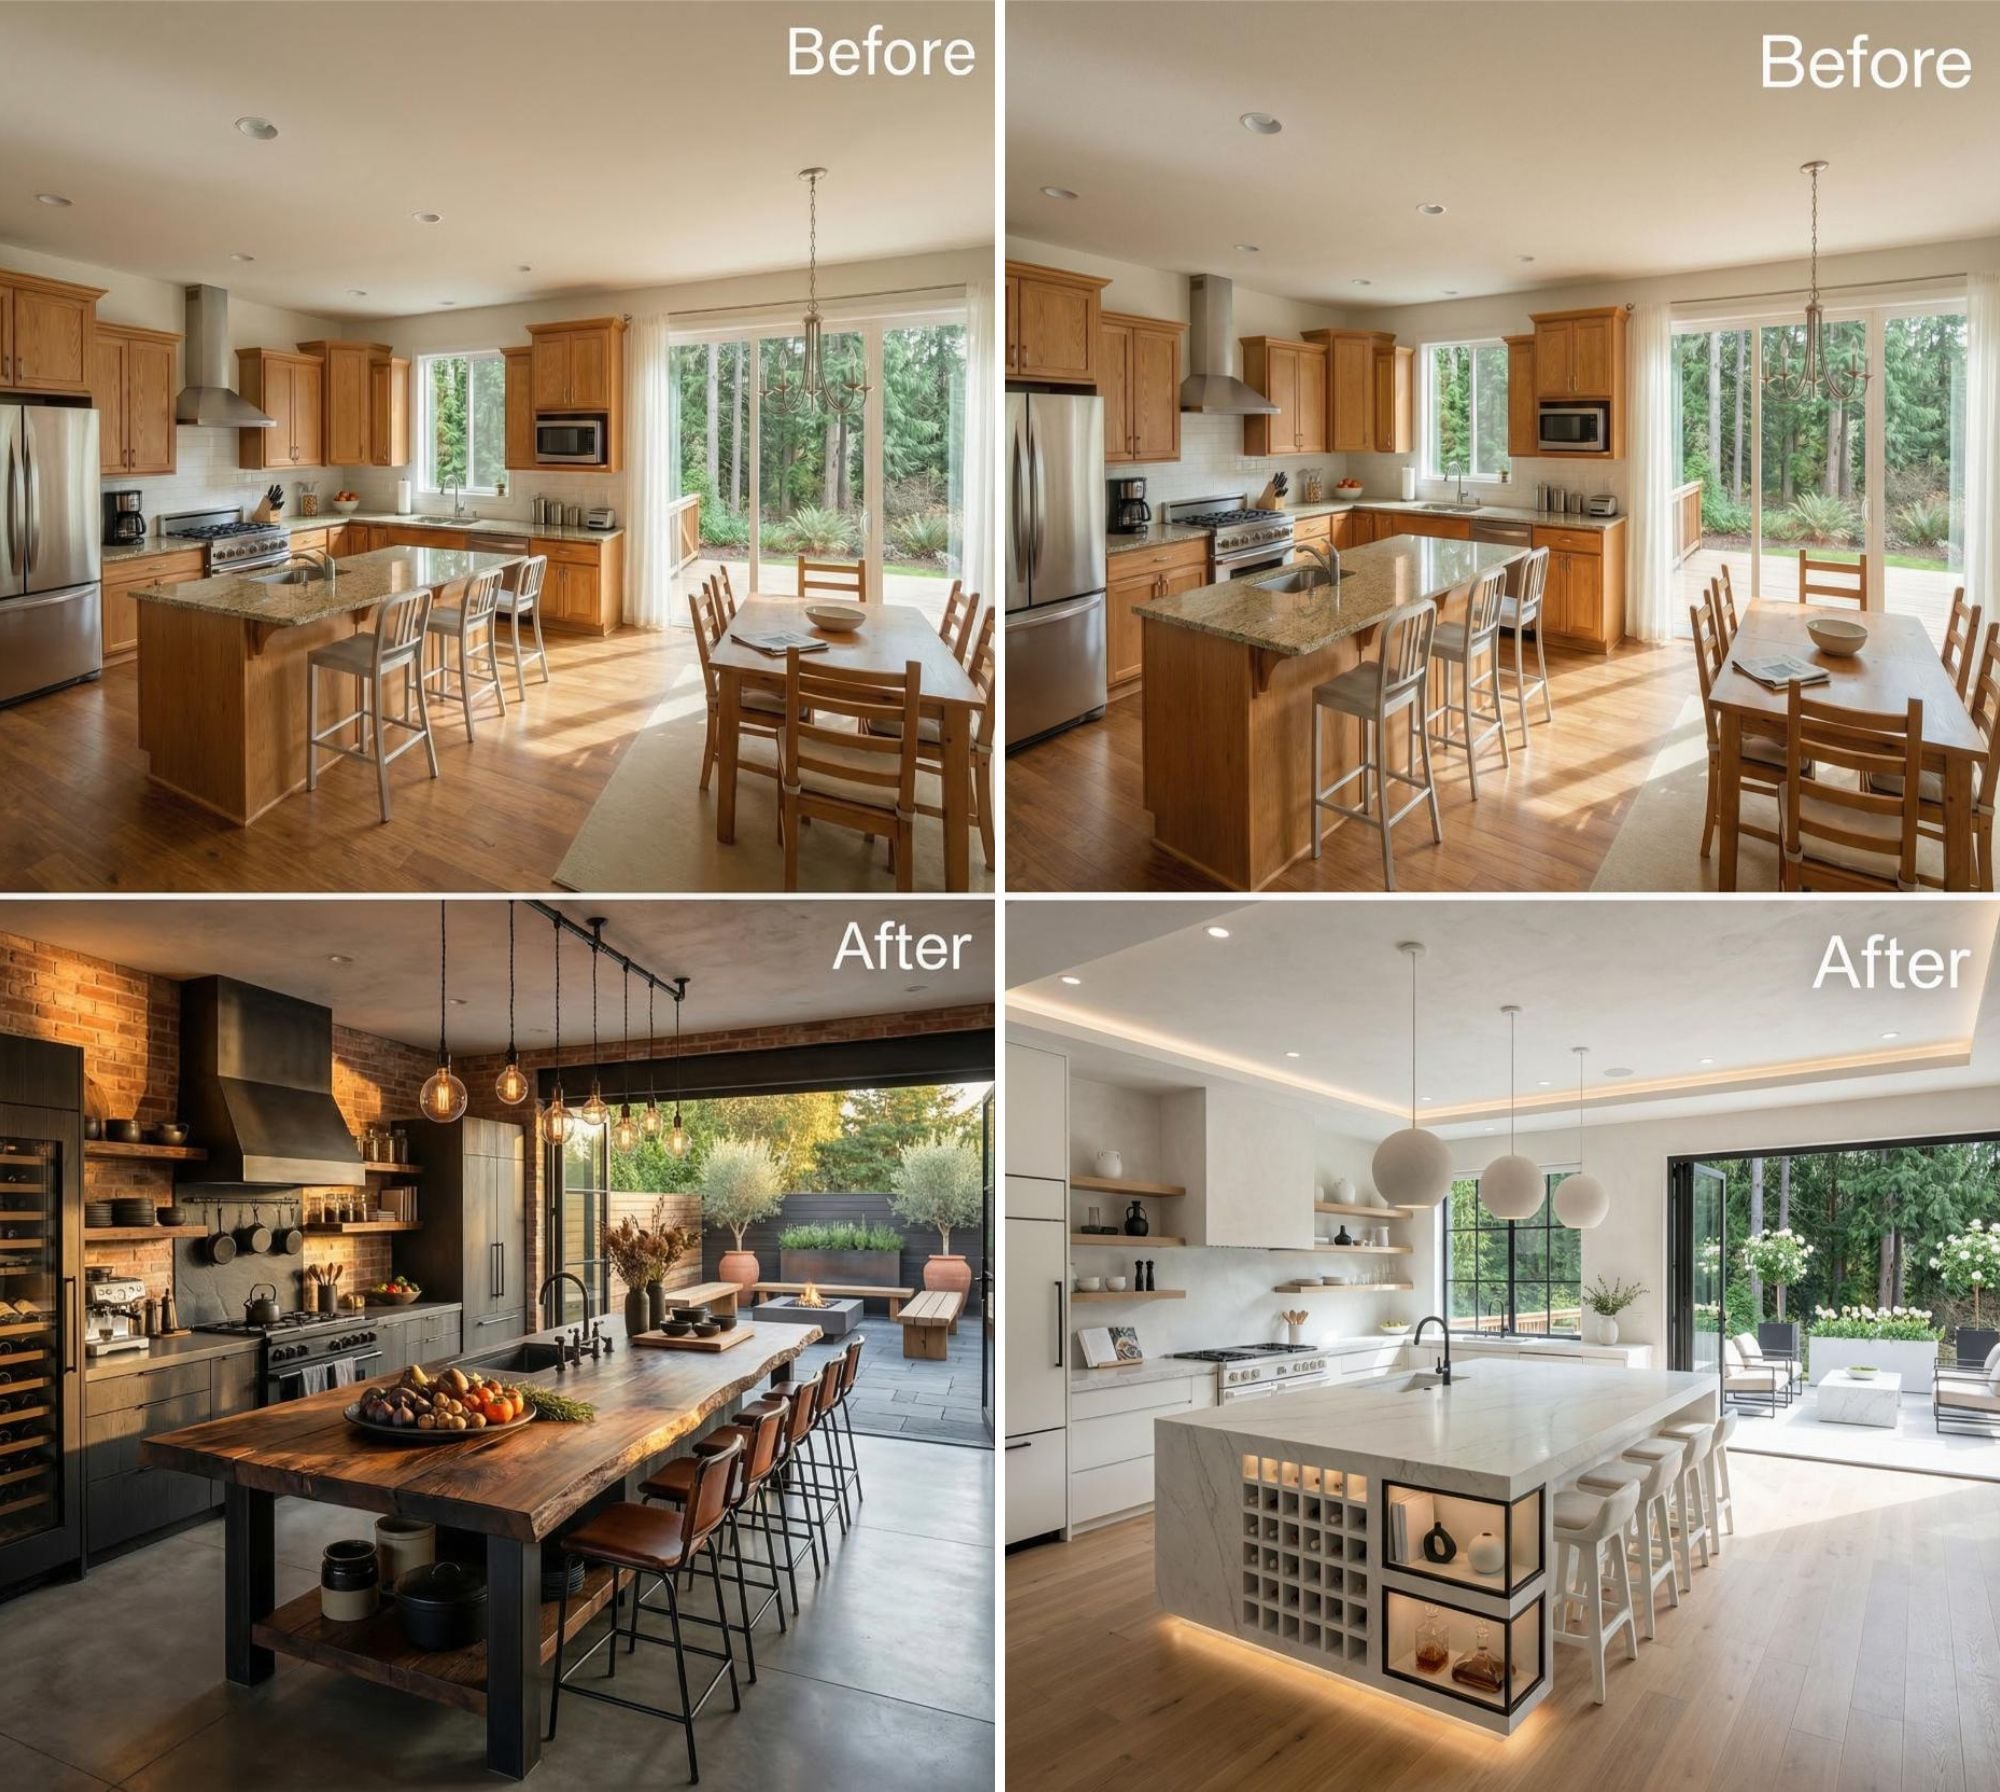
In order to come up with the very specific design ideas, we create most designs with the assistance of state-of-the-art AI interior design software.
Here’s your #30 to #1 countdown of the most alarming housing facts in North Carolina right now—and why each one matters when you put it in context. Data courtesy of Zillow Home Value Index (which we analyzed extensively… all of it).
30. Your “typical NC town” now sits near $272,523
That’s the median home value across 669 North Carolina towns. A decade ago, much of the state was comfortably sub-$200K. Crossing $270K means the state has officially priced out a wide swath of first-time buyers who once viewed North Carolina as the last bastion of affordable homeownership in the Southeast.
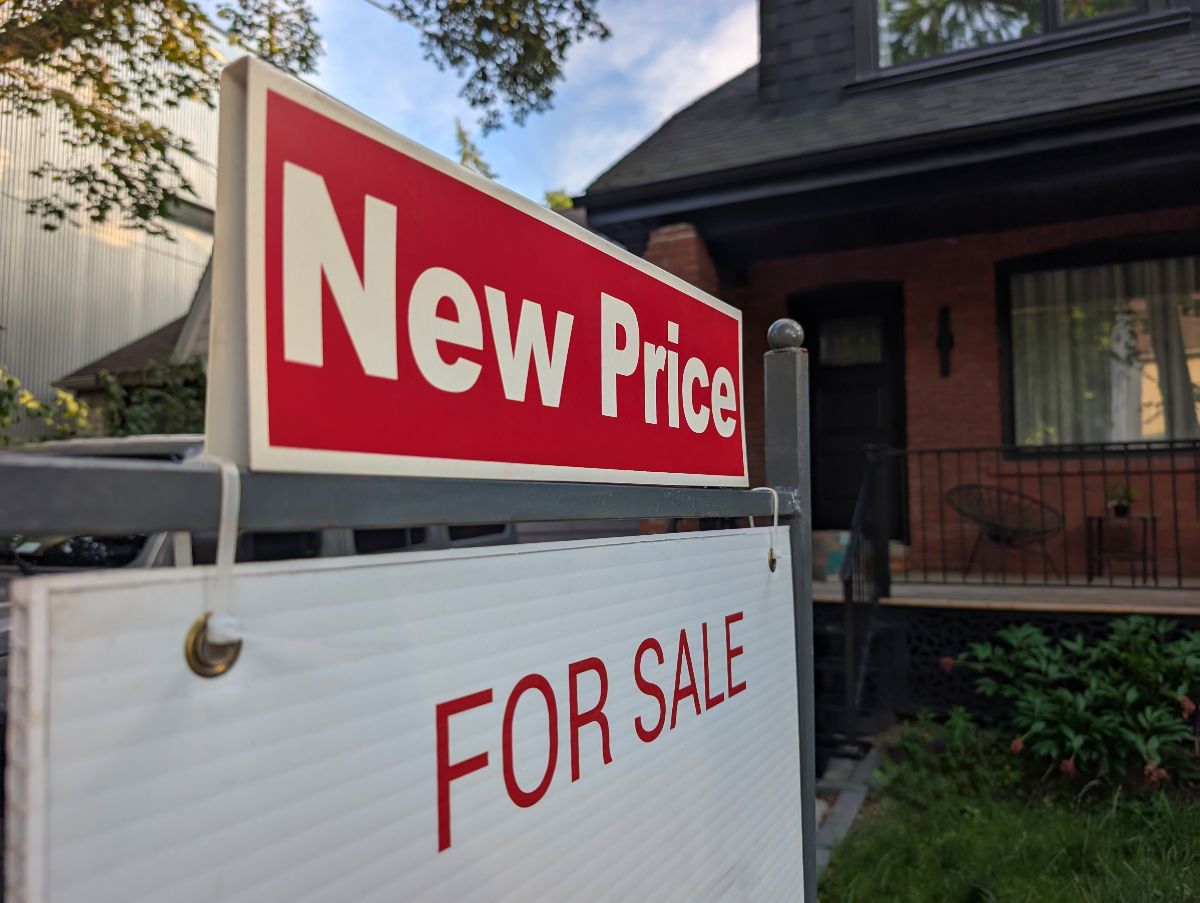
29. Town prices slipped ~0.53% YoY
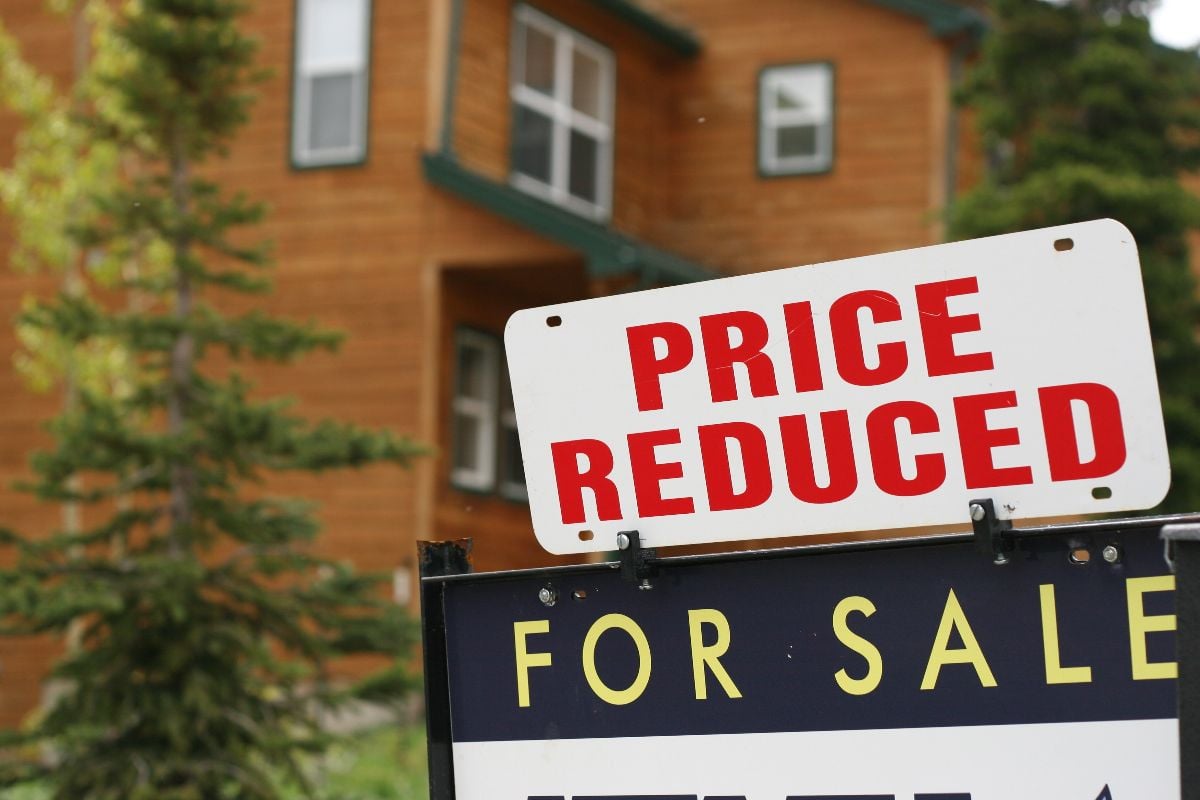
It’s a small drop, but after years of nonstop gains, it’s a big psychological shift. From $273,964 (July 2024) → $272,523 (July 2025), this is the first median statewide contraction in years. Sellers who assumed “values always go up here” are now facing a rude awakening. Historically, even a 1% slide tends to trigger heavier discounting in the following quarters.
28. Statewide inventory is now 45,212 listings
That’s the total number of homes on the market across all metros. For context, during the pandemic frenzy, statewide active inventory fell below 20,000. Doubling that in just a few years shows demand has cooled dramatically while supply has swelled—an unmistakable warning sign.
27. Inventory jumped ~29.8% YoY and ~3.9% MoM
Year-over-year, the state added nearly 10,400 more homes for sale. Even month-to-month (June → July), supply rose almost 4%. Normally July is peak selling season; the fact that inventory grew anyway tells you homes are lingering rather than selling through.
26. Sales went sideways: 7,806 in July (-0.1% YoY)

Transactions basically flatlined compared to last July (7,814 → 7,806). But remember: this comes against the backdrop of nearly 30% more listings. Demand didn’t rise to meet supply. In market history, flat sales + rising inventory = downward price pressure in the quarters ahead.
25. Months of supply ballooned to ~5.79 (from ~4.46 a year ago)

Economists watch months of supply like hawks. Anything below 4 suggests bidding wars. Around 6 means buyers and sellers are finally on even footing. NC has crossed from “hot” into “balanced,” and the trajectory points toward a buyer-leaning market if inventory keeps climbing.
24. Pendings slowed sharply: ~40.7 days (↑ ~11 days YoY)
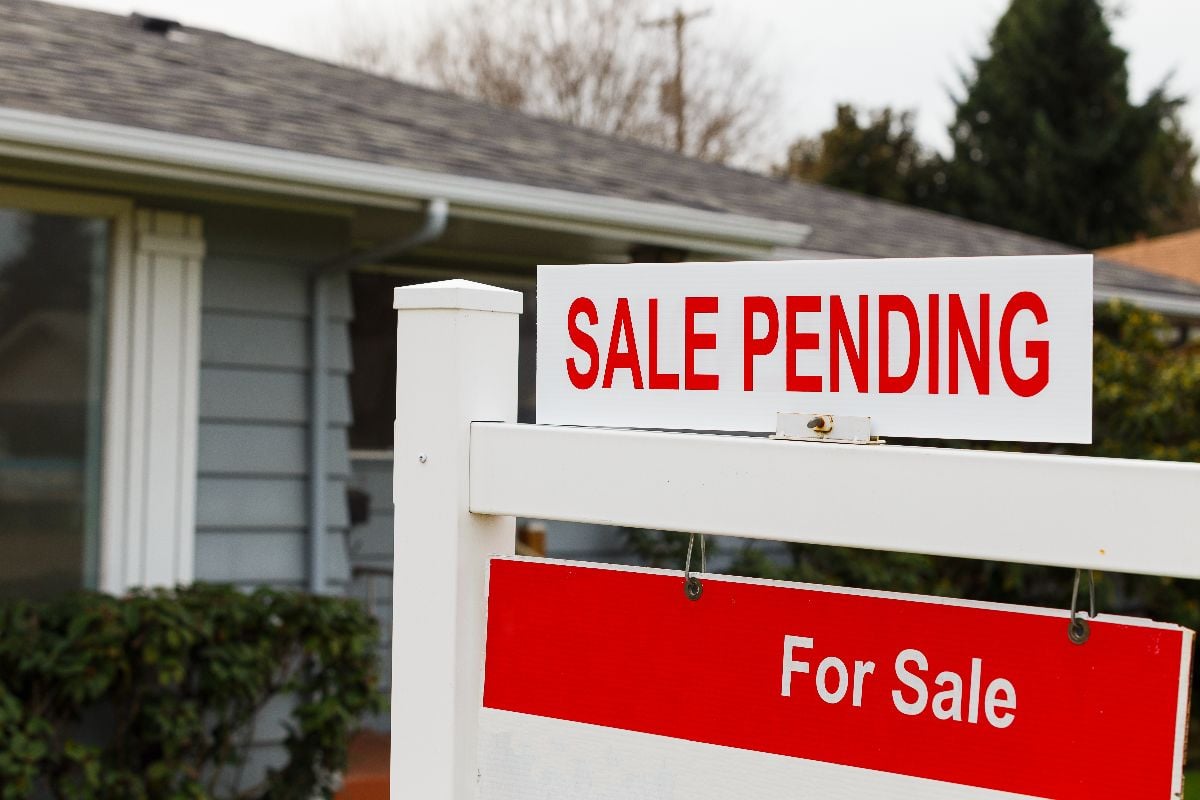
A year ago, homes were under contract in just 30 days. Now it’s over 40. That’s nearly a 40% slowdown in buyer urgency. Historically, such a sharp jump in pending days signals that buyers expect more supply coming—and feel comfortable waiting for a deal.
23. Market Temperature cooled to ~47.9 (from ~55.0 YoY)

The market temperature index is an all-in measure of competitiveness. Dropping over 7 points in a year isn’t noise, it’s a clear signal: NC buyers have regained leverage. Historically, every time the index dips below 50, statewide price growth either stalls or goes negative within the next two quarters.
22. The state’s “middle 80% of towns” spans ~$140K → ~$503K

That’s the 10th to 90th percentile range. In other words, most NC towns cluster between a starter-home $140K and a half-million. The spread is wide enough that averages are misleading. Affordability exists, but only in rural pockets, while metro-adjacent towns push toward half-million territory.
21. The cheapest town in NC? Roxobel (~$54,633)
At just over $54K, Roxobel is technically “affordable,” but it’s not where job growth or infrastructure investment is flowing. The alarming part is the state has such stark extremes: tiny towns where homes cost less than a car, versus coastal enclaves topping $1.5M.
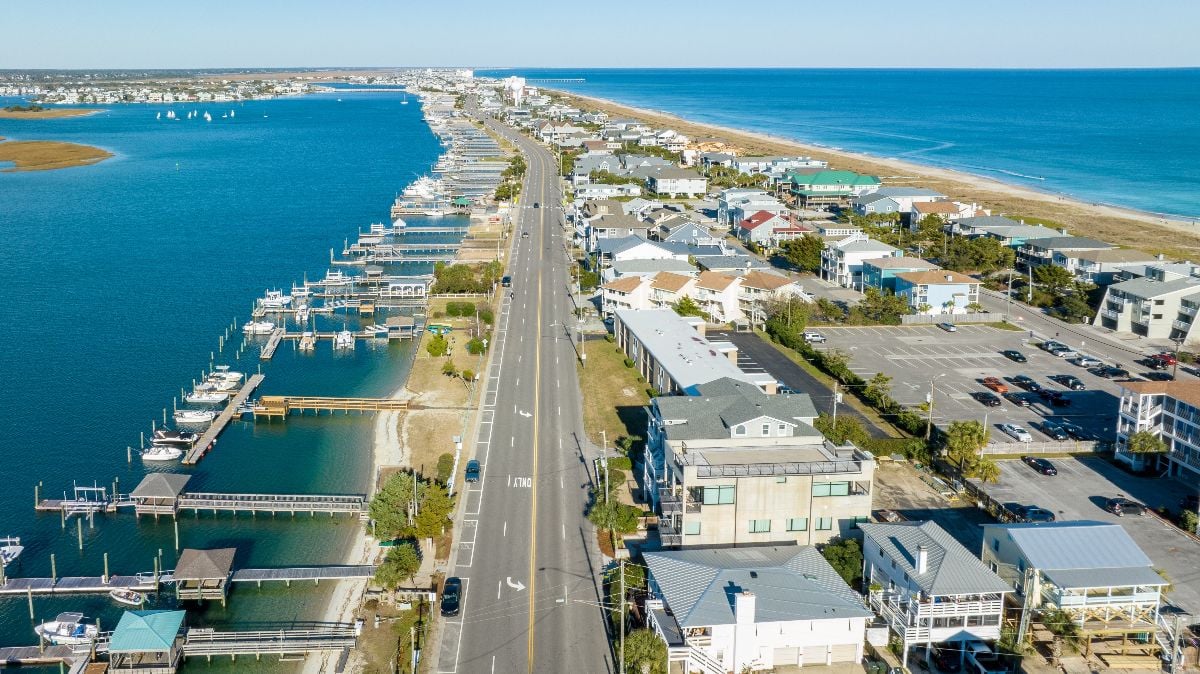
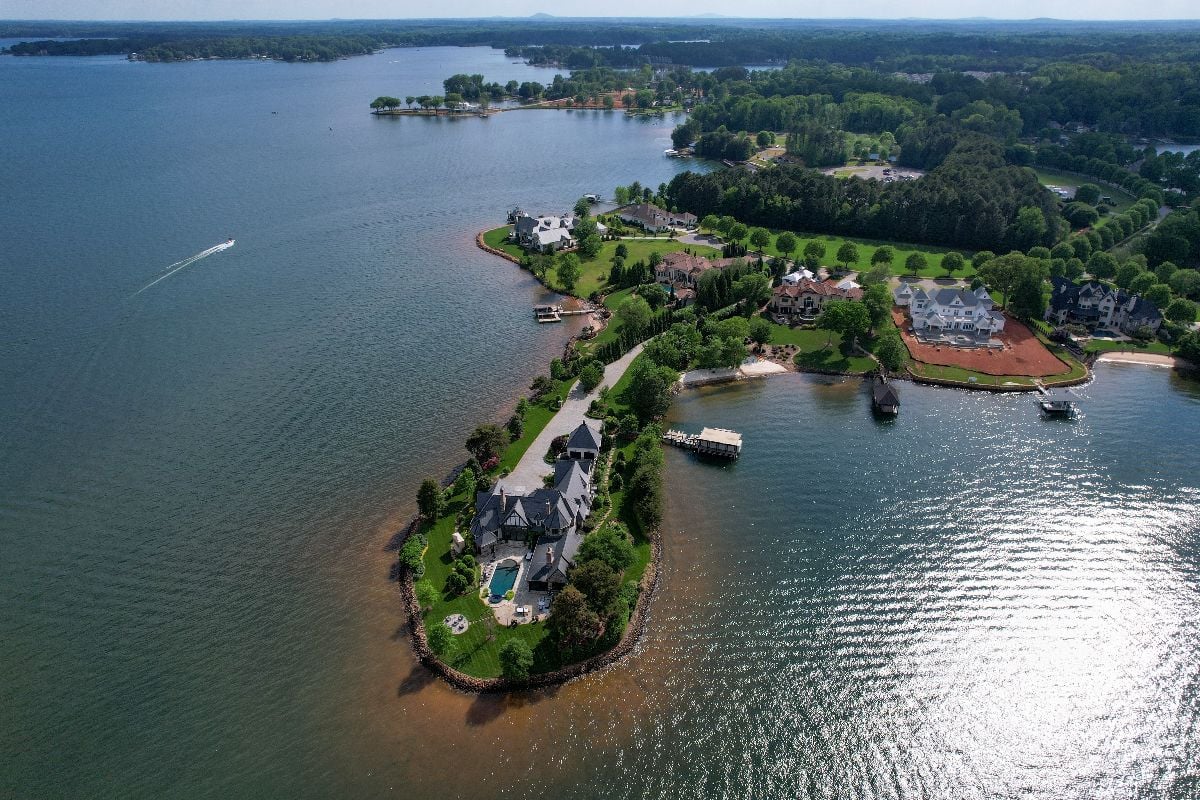
20. The priciest town? Wrightsville Beach (~$1,572,888)
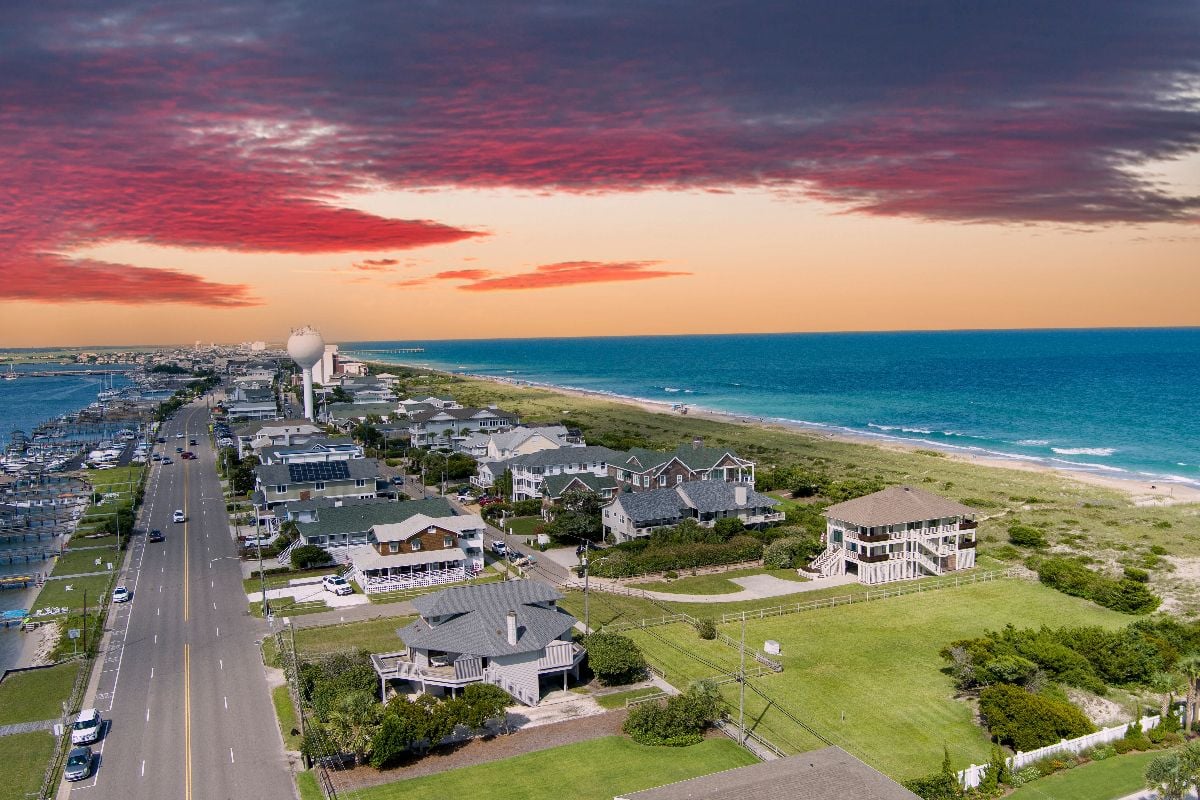
This isn’t surprising to locals—it’s coastal, exclusive, and supply-limited. But historically, towns like Wrightsville were second-home markets. The fact that median prices now sit north of $1.5M underscores how wealth inflows and second-home demand have transformed coastal NC into a luxury zone.
19. The top-to-bottom town spread is ~28.8×
From Roxobel’s $54K to Wrightsville Beach’s $1.57M is a 28-fold difference. That level of inequality is alarming because state averages become meaningless. Policy that helps Roxobel buyers won’t even register for Wrightsville, and vice versa. Historically, such wide spreads indicate segmented, unstable markets.
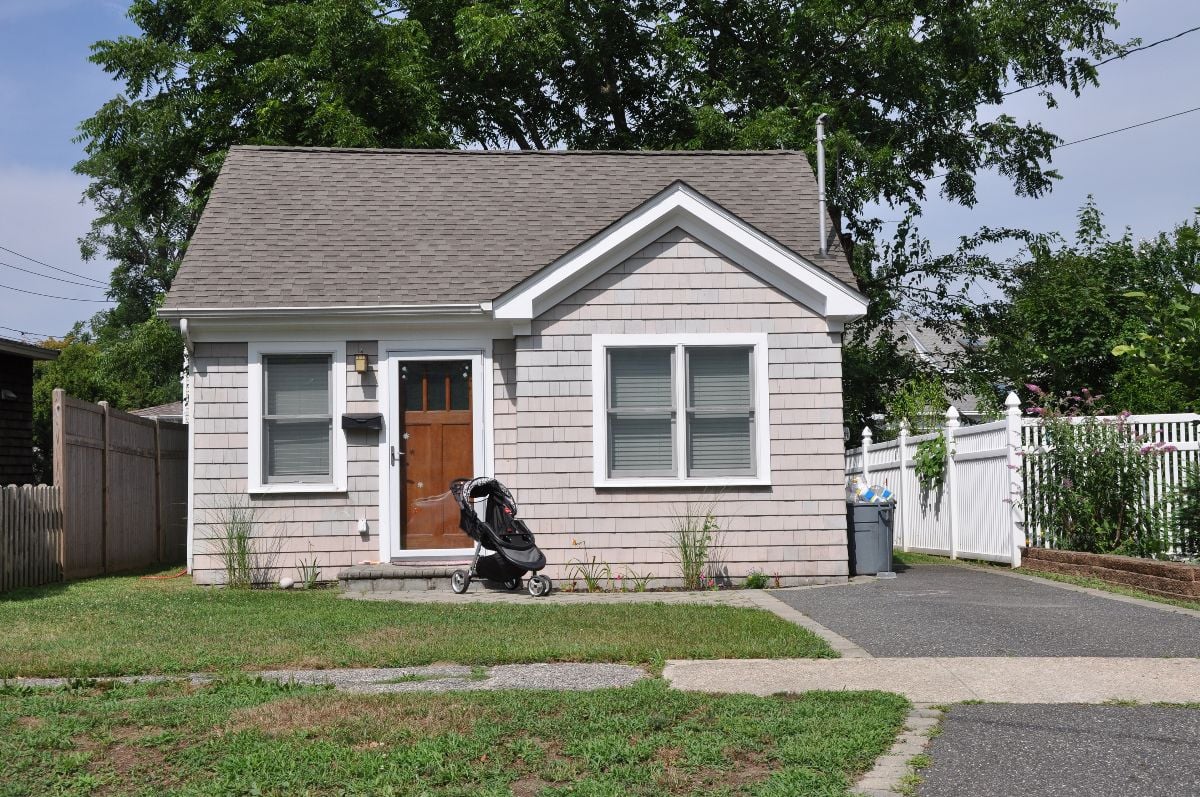
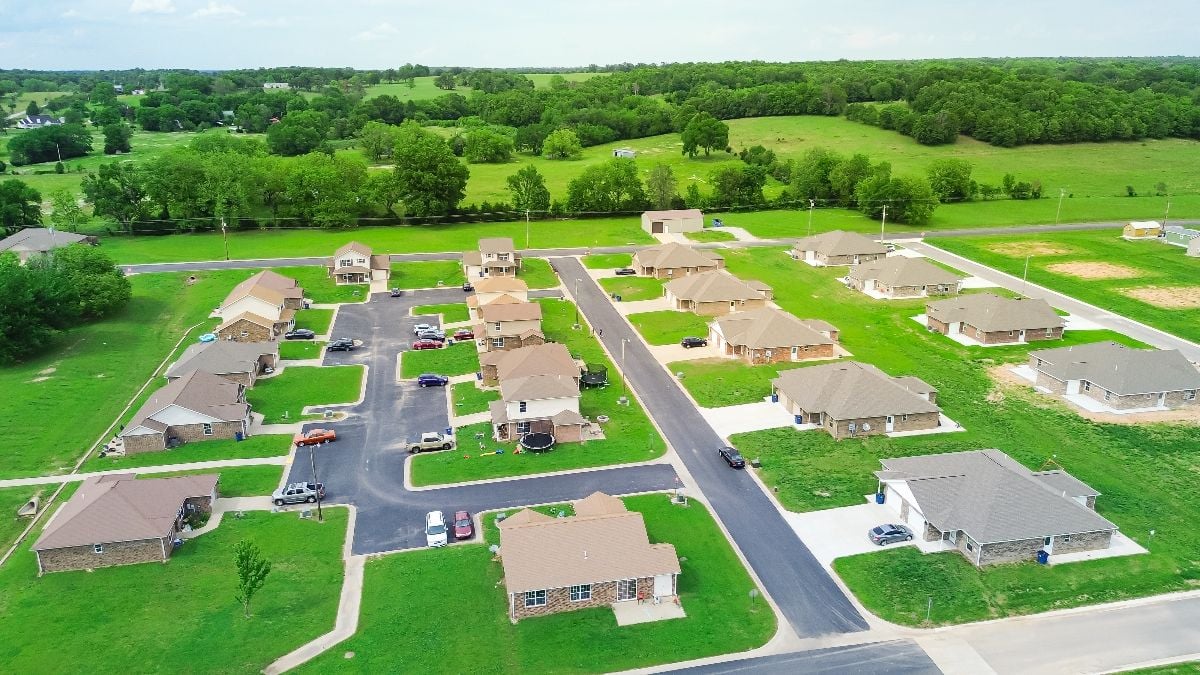
18. 40.4% of towns are still under $250K
🔥 Would you like to save this?
That’s good news for affordability—but alarming in a different way. These towns are increasingly concentrated in rural counties losing population. Buyers may snag a $200K home, but long-term resale value and job opportunities are far from guaranteed.
17. Another 37.5% of towns sit $250K–$400K
This is North Carolina’s broad middle. The problem? With today’s mortgage rates, even a $300K home pushes many households to the edge of debt-to-income limits. Historically, this is the band that drives statewide growth. If it weakens, the whole state does.
16. Only ~3.1% of towns top $700K
On the surface, that sounds tiny. But the alarming part is that this sliver—coastal gems and Charlotte suburbs—dominates headlines and shapes perceptions. It’s the “tail wagging the dog,” making the state look richer and hotter than it really is.
15. Neighborhood-level read: 765 NC neighborhoods analyzed
The statewide median neighborhood value is ~$283,103. That’s actually higher than the town median ($272K), reflecting that many neighborhoods are in growing metros. Historically, this “metro premium” has widened in boom years; the concern is that it may shrink if urban demand falters.
14. NC’s elite neighborhoods punch over $1.7M

Eastover in Charlotte ($2.15M), Copperleaf in Cary ($1.88M), Myers Park ($1.72M), The Oaks in Chapel Hill ($1.70M)—these are luxury zones pulling away from the pack. Historically, such enclaves weather downturns better, which widens the inequality gap.
13. The bottom neighborhoods are still sub-$120K
Windsor Terrace in Fayetteville (~$79.8K) or North East Winston in Winston-Salem (~$88K) highlight that extreme affordability exists—but in economically struggling areas. Historically, these neighborhoods appreciate far slower and are hit harder in downturns.
12. Under $200K neighborhoods still make up a big chunk
About 13% of neighborhoods are under $200K. That sounds healthy, but compare it to a decade ago when more than half of neighborhoods were sub-$200K. The erosion of low-end supply is alarming for workforce housing.
11. $200K–$350K neighborhoods form the real working middle
About 35% of neighborhoods are in this band. Historically, this is the “sweet spot” for first-time buyers. But with insurance and maintenance, even these middle-tier homes now strain budgets. That squeeze is a leading indicator of slower household formation.
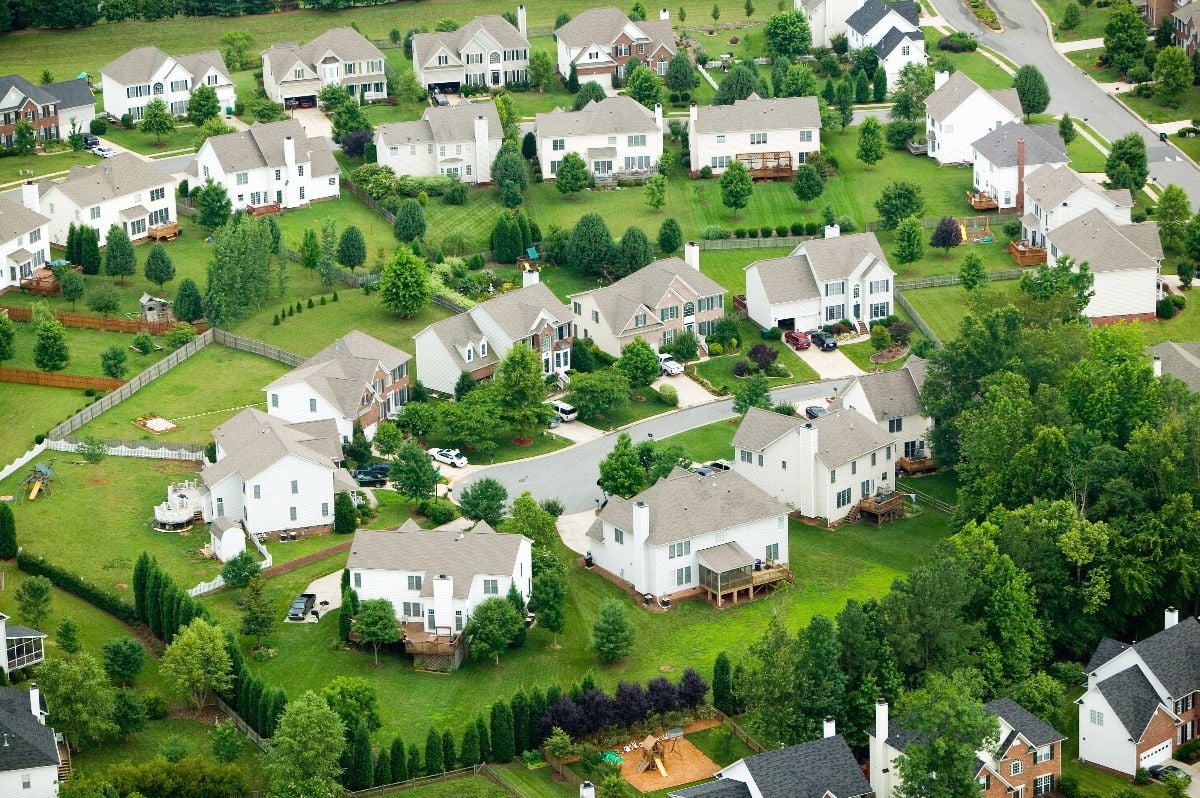
10. > $700K neighborhoods are a visible upper tail
Over 13% of neighborhoods now exceed $700K—once unheard of in NC. Historically, such growth at the top signals outside money flowing in (second homes, relocations), which often destabilizes local affordability and drives gentrification.
9. Raleigh looks tighter than the state average
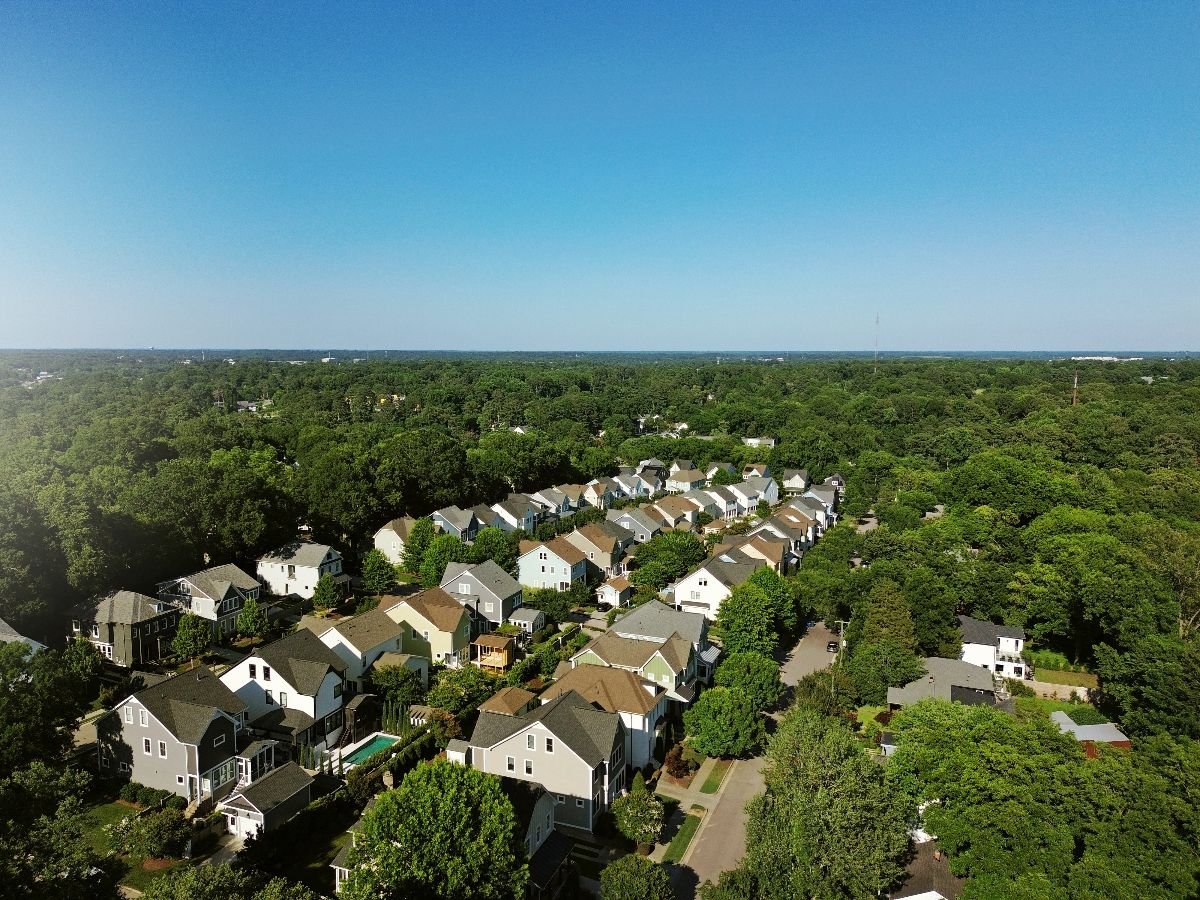
With ~5,488 listings, ~1,756 sales, ~39 days pending, TempIdx ~51, and ~3.1 months of supply, Raleigh is bucking the cooling trend. Historically, Raleigh’s job growth props up demand—but the gap between Raleigh and other metros is widening, which creates migration bottlenecks.
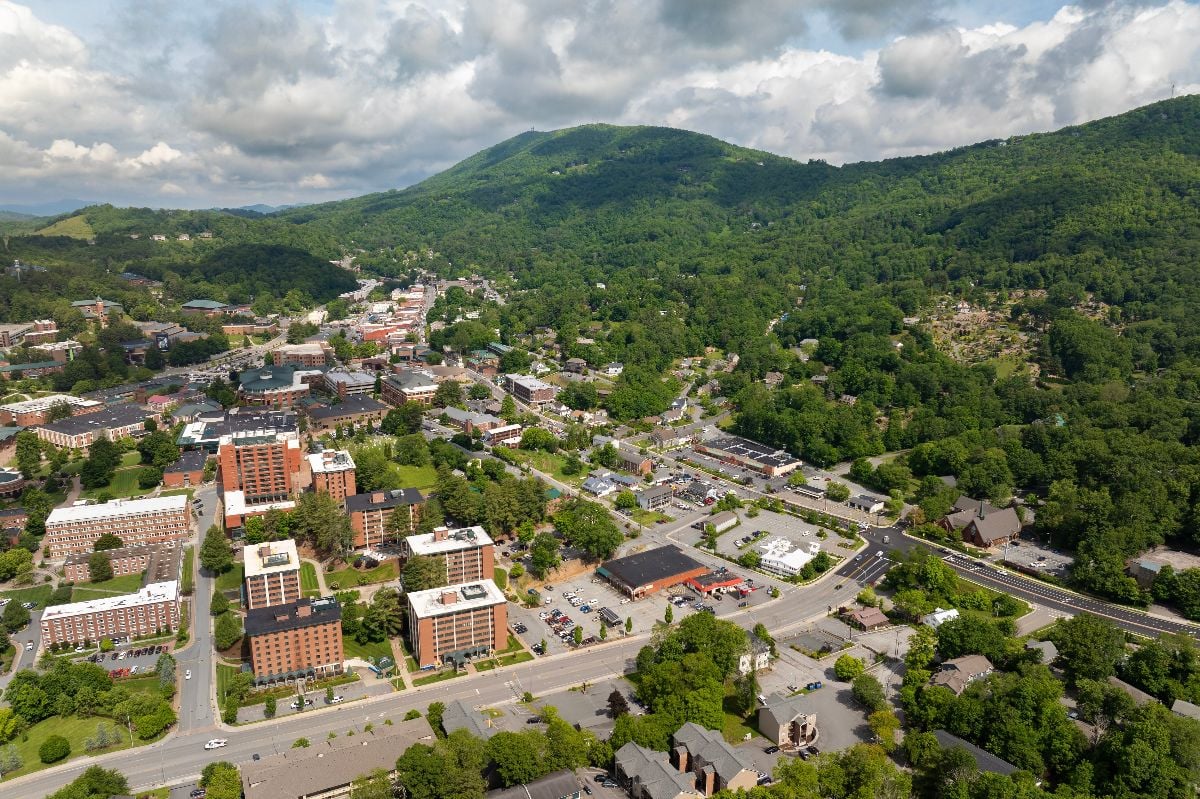
8. Asheville is cold on paper
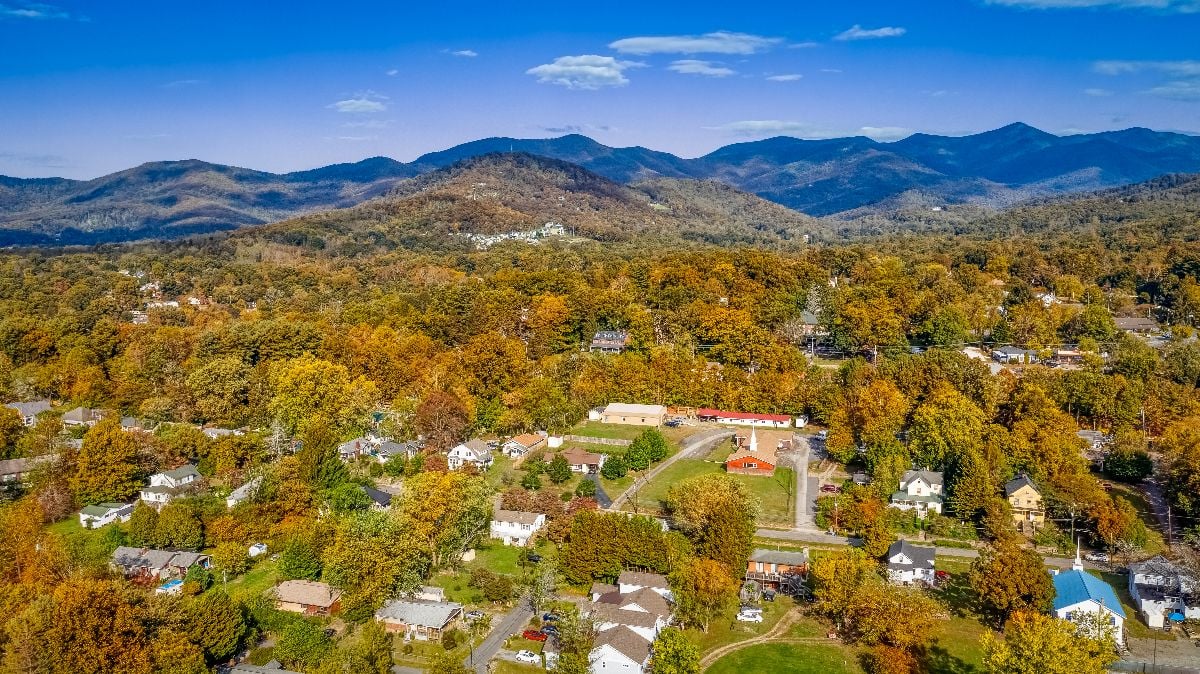
3,585 listings, ~74 days pending, TempIdx ~26. That’s frigid. Asheville historically attracts cash buyers and retirees. The fact that it looks this weak suggests that rate-sensitive buyers are holding off, and lifestyle demand alone can’t carry the load.
7. Wilmington is cooling too
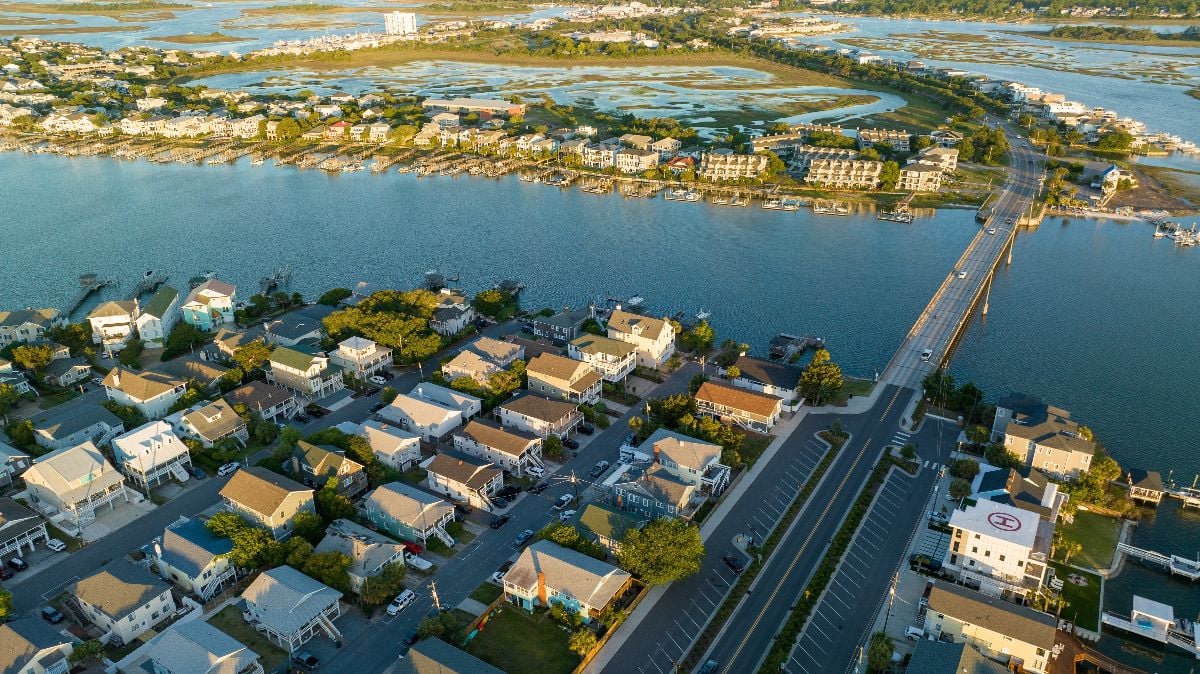
1,845 listings, ~51 days pending, TempIdx ~45. The coast once seemed untouchable. The fact that buyers are hesitating here is alarming—because historically, once luxury buyers pull back, mid-tier sellers panic.
6. Fayetteville leans stronger than you’d think
🔥 Would you like to save this?
2,112 listings, ~43 days pending, TempIdx ~53. That’s healthier than the statewide read. Historically a military-driven market, Fayetteville’s resilience is good news locally—but it underscores that other metros are cooling much faster.
5. Sales didn’t vanish—but urgency did
Statewide sales stayed flat. But pending times jumped 11 days, and months of supply ballooned. Historically, demand without urgency leads to one thing: discounting.
4. The statewide temperature drop (~55 → ~48) is real

A 7-point drop in a year is rare. Historically, whenever NC’s temp index dropped this far, price growth slowed to nearly zero within 6–12 months.
3. The MoM picture isn’t bailing you out

July is supposed to be peak season. Instead, inventory rose, sales fell ~6%, pendings slowed further, and temperatures dipped again. Historically, when summer can’t save the curve, fall looks grim.
2. The distribution proves there’s no single “NC price”
From Roxobel at $54K to Wrightsville Beach at $1.57M, from Windsor Terrace at $80K to Eastover at $2.15M, North Carolina isn’t one market. Historically, such fragmentation makes state averages useless—and creates pockets of sharp corrections even while luxury hums.
1. Add it up: NC is flirting with a broader reset

Inventory up 30%, pendings much slower, temp index down 7 points, months of supply near 6, and town medians slipping YoY. Historically, this combo has always preceded corrections. North Carolina isn’t collapsing—but the data says sellers are about to lose the upper hand in a way they haven’t since 2008.
Quick Reference (North Carolina as of July 2025)
- Towns analyzed: 669
- Town median ZHVI: $272,523 (↓ ~0.53% YoY from ~$273,964)
- Town p10–p90 (ZHVI): $140,368 → $502,520
- Cheapest town: Roxobel ~ $54,633
- Most expensive town: Wrightsville Beach ~ $1,572,888
- Share of towns: < $250K = 40.4% • $250–400K = 37.5% • > $700K = 3.1%
- Neighborhoods analyzed: 765
- Neighborhood median ZHVI: $283,103
- Neighborhood p10–p90: $176,475 → $603,448
- Low neighborhoods (examples): Windsor Terrace (Fayetteville) ~ $79.8K; North East Winston ~ $88.4K
- High neighborhoods (examples): Eastover (Charlotte) ~ $2.15M; Copperleaf (Cary) ~ $1.88M
Statewide (metros aggregated):
- Inventory: 45,212 (↑ ~29.8% YoY, ↑ ~3.9% MoM)
- Sales: 7,806 (- ~0.1% YoY, – ~6.0% MoM)
- Months of supply: ~5.79 (vs ~4.46 last July)
- Mean days pending: ~40.7 (↑ ~10.9 YoY, ↑ ~2.6 MoM)
- Market temperature: ~47.9 (↓ ~7.2 YoY, ↓ ~0.5 MoM)
Selected metros (July 2025):
- Raleigh: ~5,488 inventory • ~1,756 sales • ~39 days pending • TempIdx ~51 • ~3.1 MOS
- Asheville: ~3,585 inventory • ~74 days pending • TempIdx ~26
- Wilmington: ~1,845 inventory • ~51 days pending • TempIdx ~45
- Fayetteville: ~2,112 inventory • ~43 days pending • TempIdx ~53