Nevada’s most expensive towns aren’t all flashing lights and roulette wheels—some are quiet lakeside retreats or booming tech burbs where homes now cost a small fortune. Zillow’s Home Value Index shows prices in these 21 spots have skyrocketed through 2025, with some doubling since 2010. From posh pockets near Lake Tahoe to high-dollar enclaves outside Reno, these places prove Nevada’s luxury market is more than just Vegas glitz. If you’re wondering where the big money lands—or just how wild Nevada real estate has gotten—this list lays it all out.
21. Moapa – 143% Home Price Increase Since 2012
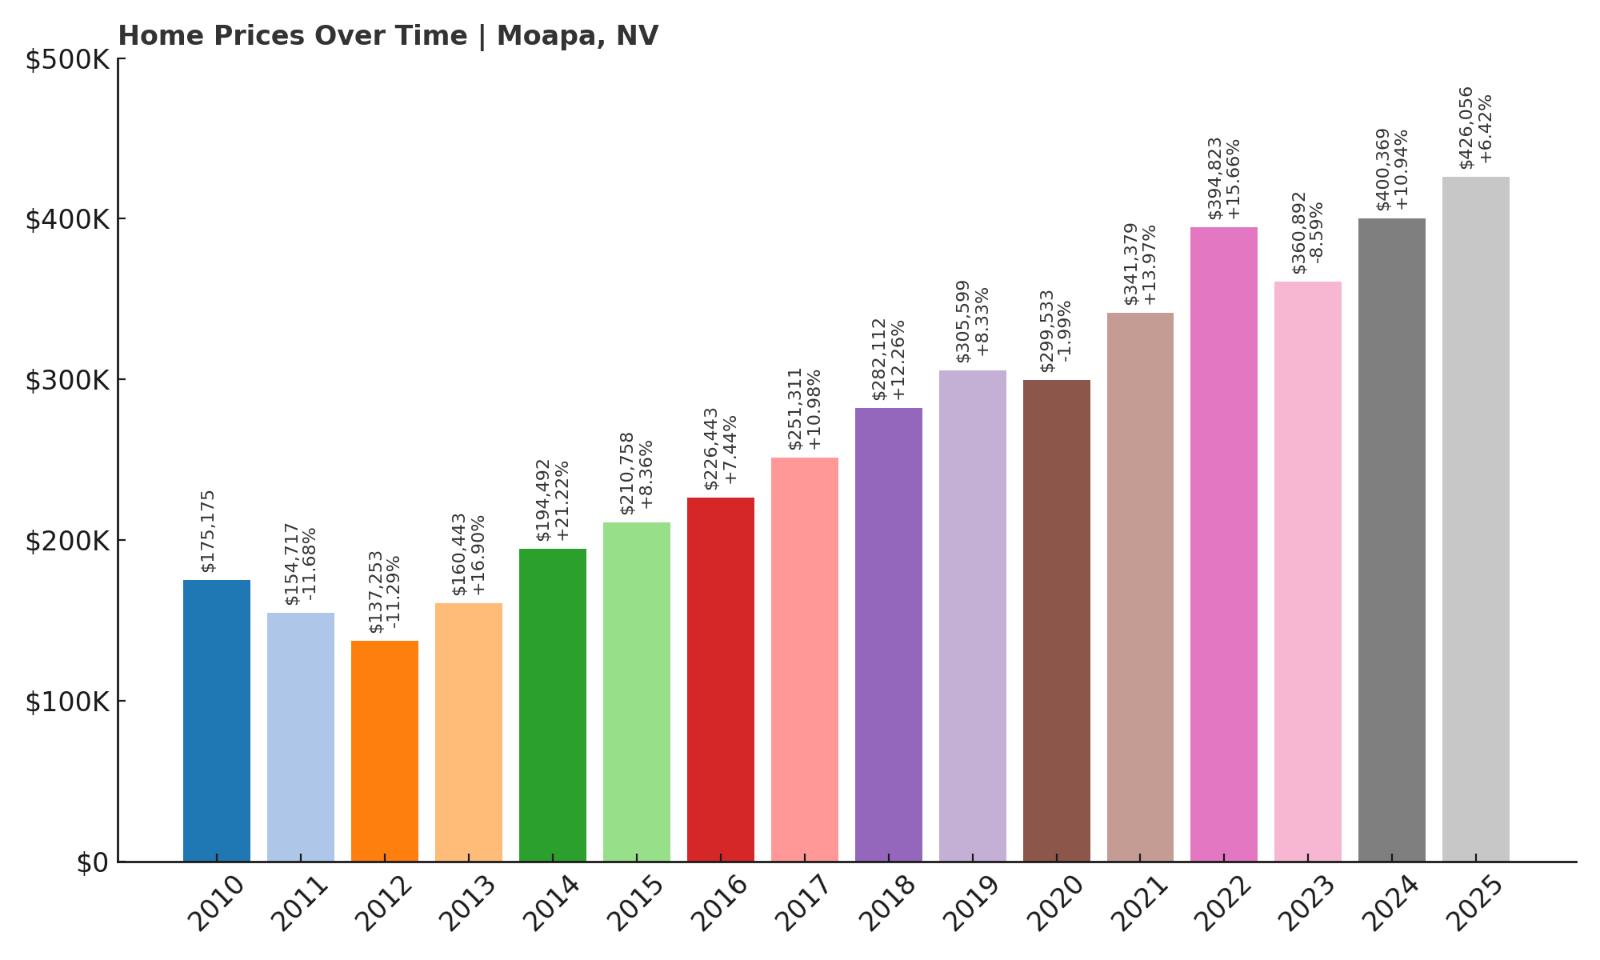
- 2010: $175,175
- 2011: $154,717 (-$20,458, -11.68% from previous year)
- 2012: $137,253 (-$17,464, -11.29% from previous year)
- 2013: $160,443 (+$23,190, +16.90% from previous year)
- 2014: $194,492 (+$34,050, +21.22% from previous year)
- 2015: $210,758 (+$16,266, +8.36% from previous year)
- 2016: $226,443 (+$15,685, +7.44% from previous year)
- 2017: $251,311 (+$24,868, +10.98% from previous year)
- 2018: $282,112 (+$30,801, +12.26% from previous year)
- 2019: $305,599 (+$23,487, +8.33% from previous year)
- 2020: $299,533 (-$6,066, -1.99% from previous year)
- 2021: $341,379 (+$41,846, +13.97% from previous year)
- 2022: $394,823 (+$53,444, +15.66% from previous year)
- 2023: $360,892 (-$33,931, -8.59% from previous year)
- 2024: $400,369 (+$39,477, +10.94% from previous year)
- 2025: $426,056 (+$25,687, +6.42% from previous year)
Moapa’s home prices have risen substantially since 2012, with a cumulative gain of around 143% over that span. After bottoming out in 2012, the town saw a dramatic upward trend in the years that followed, particularly between 2013 and 2022. Although prices briefly dipped in 2020 and 2023, the overall trajectory remains strong. In 2025, the typical home in Moapa is valued at $426,056, up from just $137,253 in 2012. This pattern shows both strong growth and resilience. The local housing market has managed to rebound quickly from short-term pullbacks, suggesting confidence from buyers and investors alike.
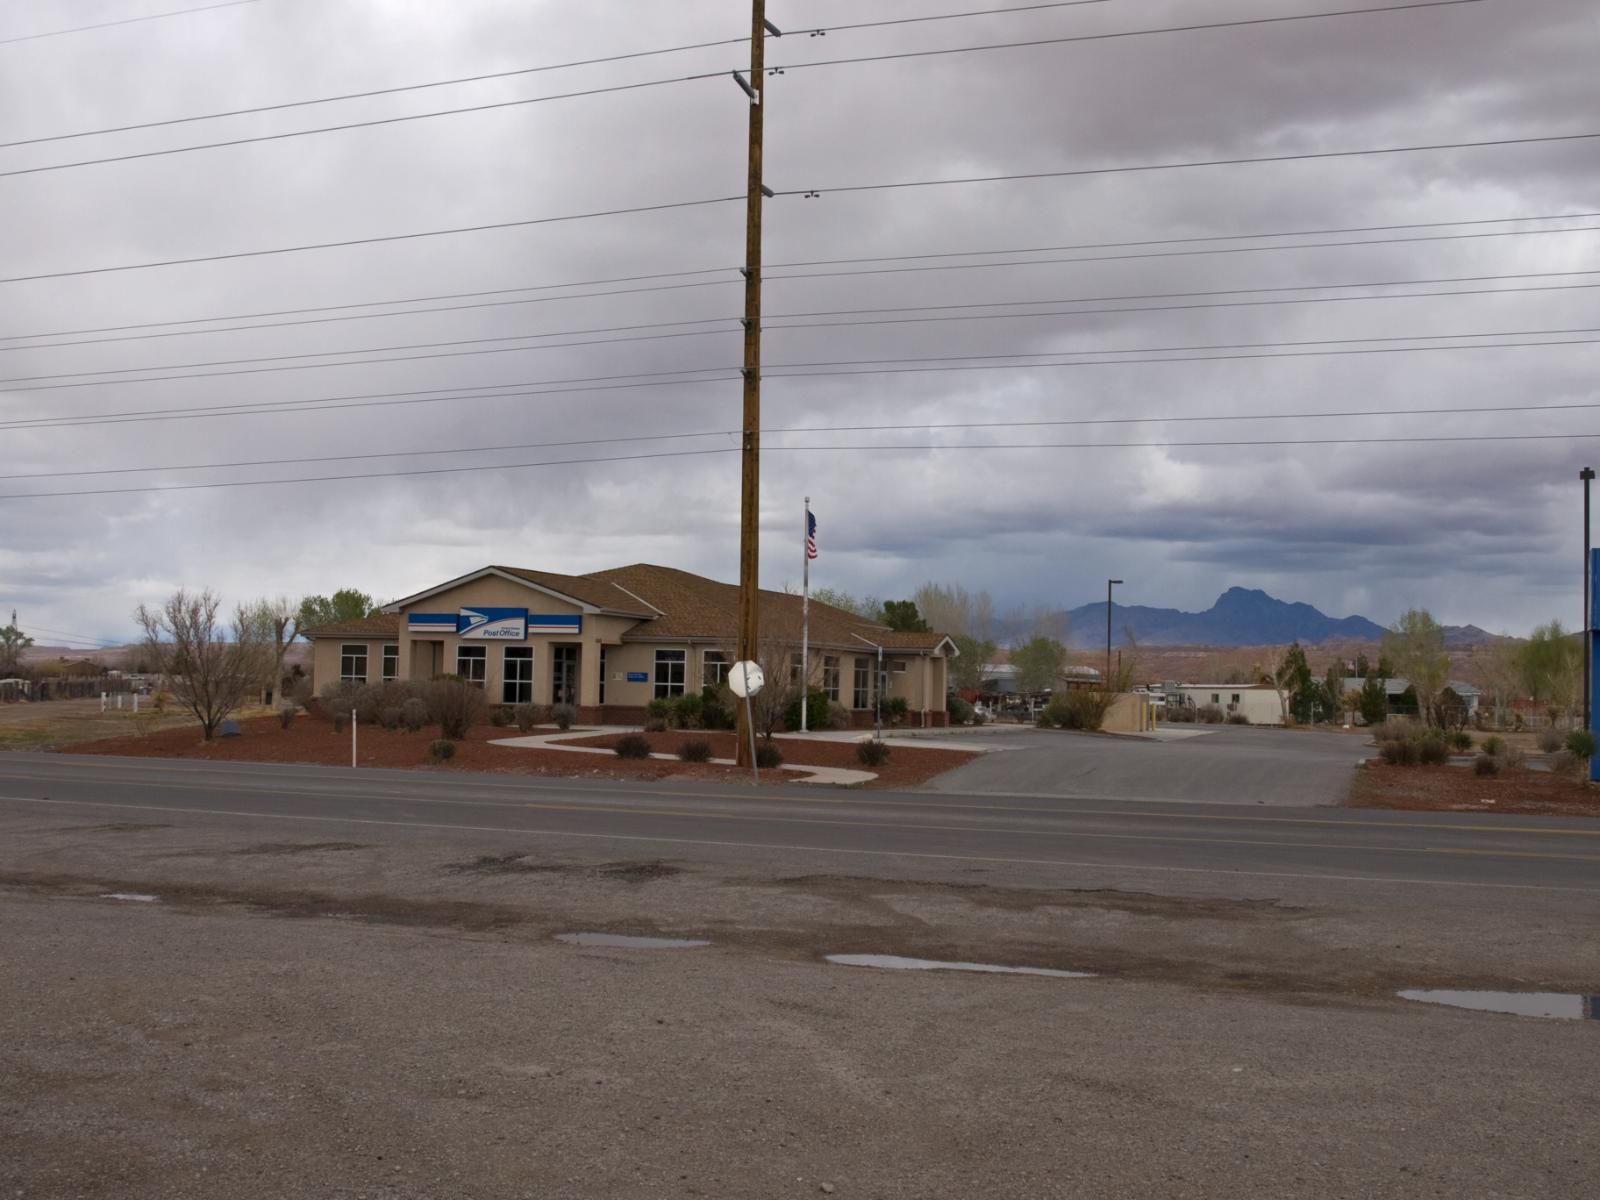
Moapa – Rural Growth Driven by Las Vegas Spillover
=>Southern Farmhouse-Style 4-Bedroom Home with Wraparound Porch and Jack & Jill Bath (Floor Plan)
Located in Clark County, Moapa is a rural town just north of Las Vegas. While it may not have the glitz of the Strip, its affordability and space have attracted residents seeking alternatives to the metro area’s dense housing. Moapa’s accessibility via Interstate 15 has made it a spillover option for commuters and families wanting more land and privacy. It’s also adjacent to protected lands and natural desert beauty, offering an appealing environment for those looking to live away from urban congestion.
Moapa’s housing stock remains modest compared to major cities, but the consistent demand has helped drive long-term appreciation. While 2023 saw a brief softening, likely due to broader national market trends, prices have rebounded again in 2024 and 2025. This recovery supports the idea that Moapa is building long-term value, especially as pressure from nearby Las Vegas continues to ripple outward into surrounding communities.
20. Sun Valley – 323% Home Price Increase Since 2012
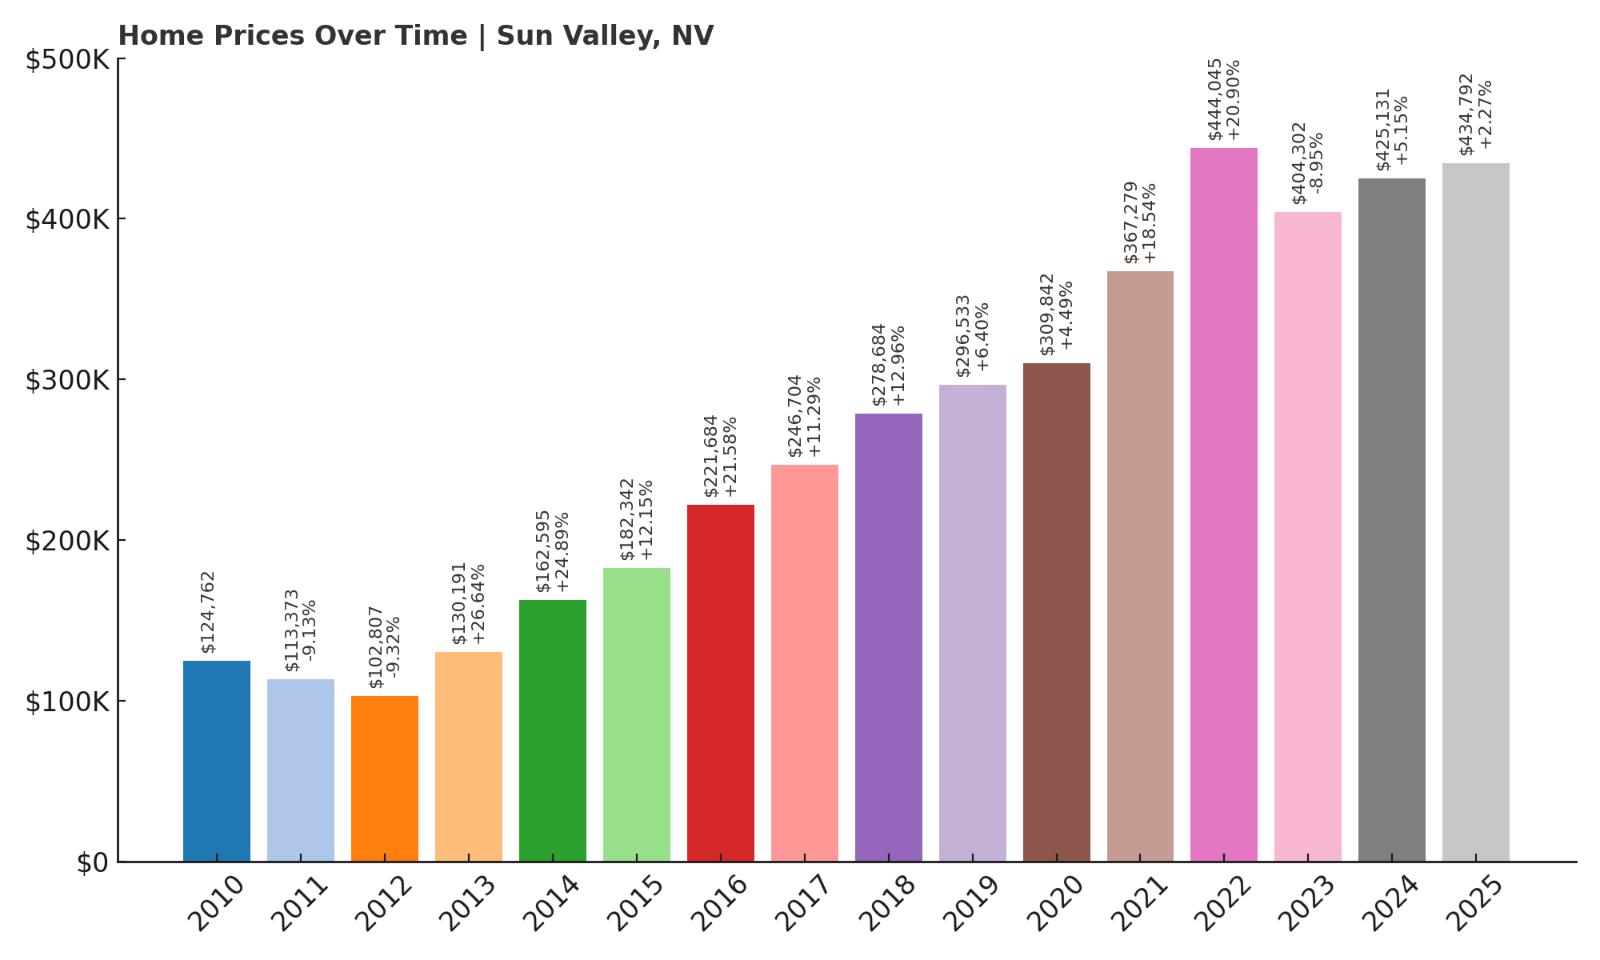
- 2010: $124,762
- 2011: $113,373 (-$11,389, -9.13% from previous year)
- 2012: $102,807 (-$10,566, -9.32% from previous year)
- 2013: $130,191 (+$27,384, +26.64% from previous year)
- 2014: $162,595 (+$32,404, +24.89% from previous year)
- 2015: $182,342 (+$19,748, +12.15% from previous year)
- 2016: $221,684 (+$39,342, +21.58% from previous year)
- 2017: $246,704 (+$25,020, +11.29% from previous year)
- 2018: $278,684 (+$31,980, +12.96% from previous year)
- 2019: $296,533 (+$17,849, +6.40% from previous year)
- 2020: $309,842 (+$13,309, +4.49% from previous year)
- 2021: $367,279 (+$57,438, +18.54% from previous year)
- 2022: $444,045 (+$76,766, +20.90% from previous year)
- 2023: $404,302 (-$39,743, -8.95% from previous year)
- 2024: $425,131 (+$20,829, +5.15% from previous year)
- 2025: $434,792 (+$9,661, +2.27% from previous year)
Sun Valley’s housing market has exploded in the last decade, rising over 323% since 2012. The area experienced a particularly steep climb from 2013 to 2022, driven by demand from nearby Reno and the broader growth of northern Nevada. Prices dropped slightly in 2023, reflecting a cooling trend across the country, but stabilized again in 2024 and 2025. The median home now costs $434,792 — a far cry from the $102,807 average seen in 2012. Sun Valley’s affordability during the early 2010s made it an entry point for many homebuyers, but rising interest has turned it into one of the region’s most valuable markets.
Sun Valley – A Budget-Friendly Reno Suburb That’s Soaring
Sun Valley lies just outside Reno and offers more affordable housing than the city center, making it a top choice for working-class families and first-time buyers. This proximity to a major employment hub has made the town particularly attractive as Reno’s costs have surged. The community features public parks, schools, and residential developments that continue to expand as demand grows.
Because of its strategic location and relatively low cost base in the early 2010s, Sun Valley was well-positioned for rapid appreciation. The 2021–2022 boom pushed values sharply upward, with more than $140,000 in price gains over just two years. Although 2023 introduced a modest dip, the market has recovered and is trending upward again. This indicates steady long-term demand and a housing market that’s maturing into a strong Reno alternative.
19. Las Vegas – 268% Home Price Increase Since 2012
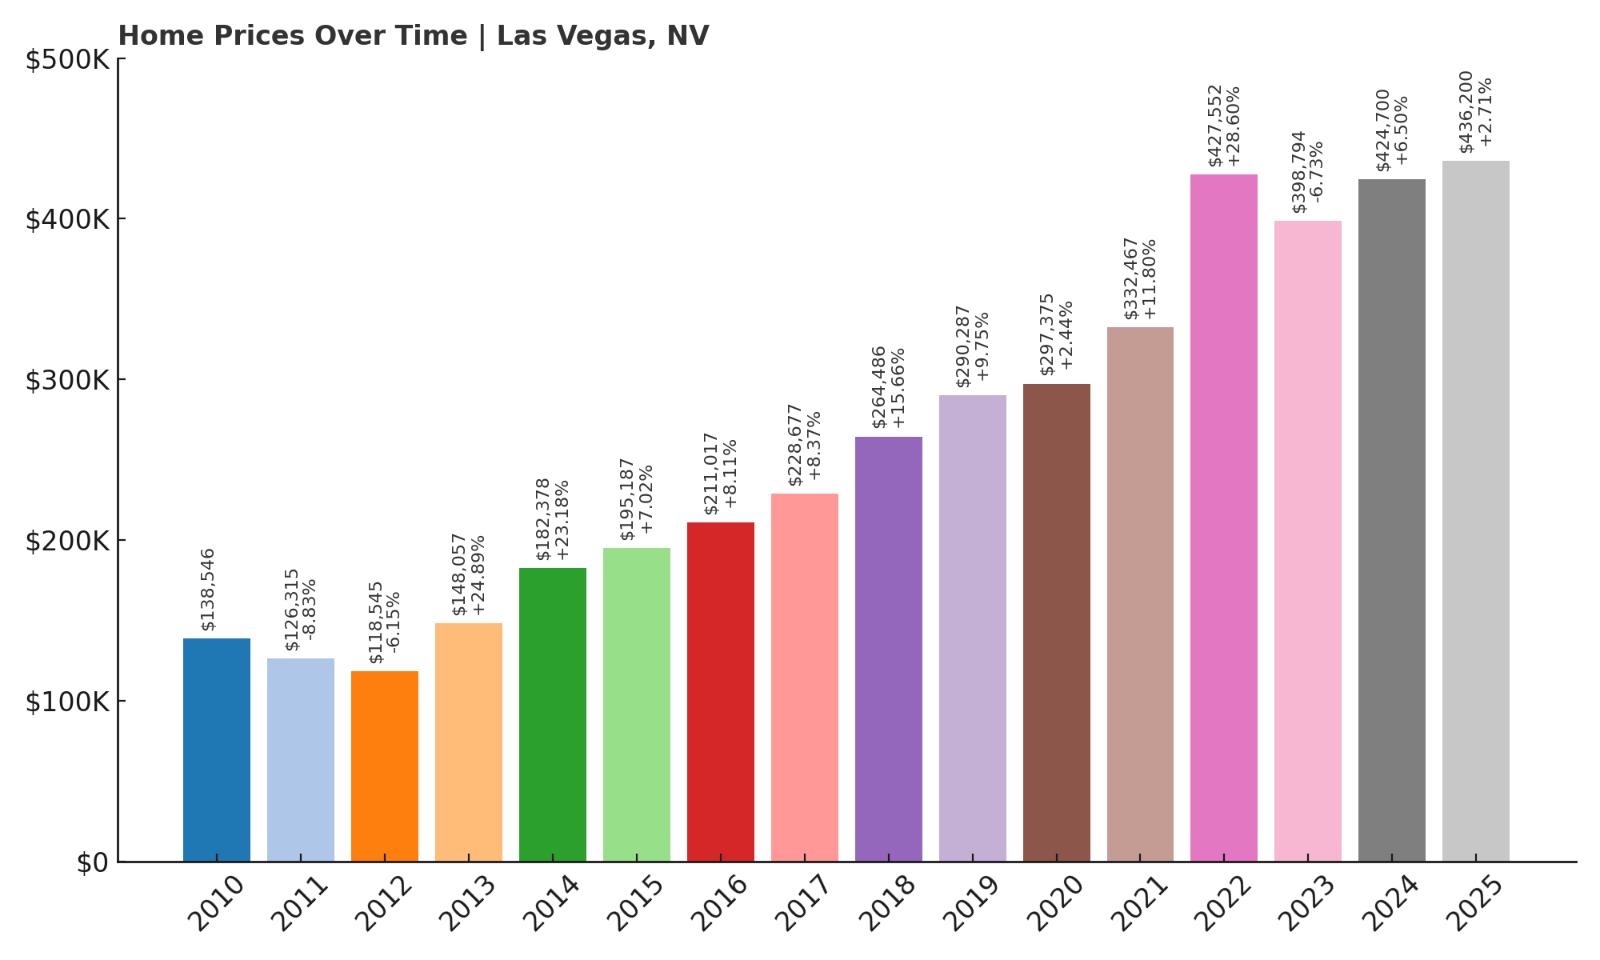
- 2010: $138,546
- 2011: $126,315 (-$12,232, -8.83% from previous year)
- 2012: $118,545 (-$7,769, -6.15% from previous year)
- 2013: $148,057 (+$29,512, +24.89% from previous year)
- 2014: $182,378 (+$34,321, +23.18% from previous year)
- 2015: $195,187 (+$12,809, +7.02% from previous year)
- 2016: $211,017 (+$15,830, +8.11% from previous year)
- 2017: $228,677 (+$17,660, +8.37% from previous year)
- 2018: $264,486 (+$35,810, +15.66% from previous year)
- 2019: $290,287 (+$25,800, +9.75% from previous year)
- 2020: $297,375 (+$7,088, +2.44% from previous year)
- 2021: $332,467 (+$35,092, +11.80% from previous year)
- 2022: $427,552 (+$95,085, +28.60% from previous year)
- 2023: $398,794 (-$28,758, -6.73% from previous year)
- 2024: $424,700 (+$25,906, +6.50% from previous year)
- 2025: $436,200 (+$11,500, +2.71% from previous year)
Las Vegas home prices have more than tripled since 2012, rising from just under $119,000 to over $436,000 in 2025. The years following the Great Recession marked a strong rebound for Vegas, with double-digit annual increases becoming common. A steep rise in 2022, followed by a brief correction in 2023, reflects broader national trends rather than local weakness. The Vegas market continues to attract strong interest thanks to population growth, jobs, and tourism recovery.
Las Vegas – Real Estate Heat Driven by Tourism and Growth
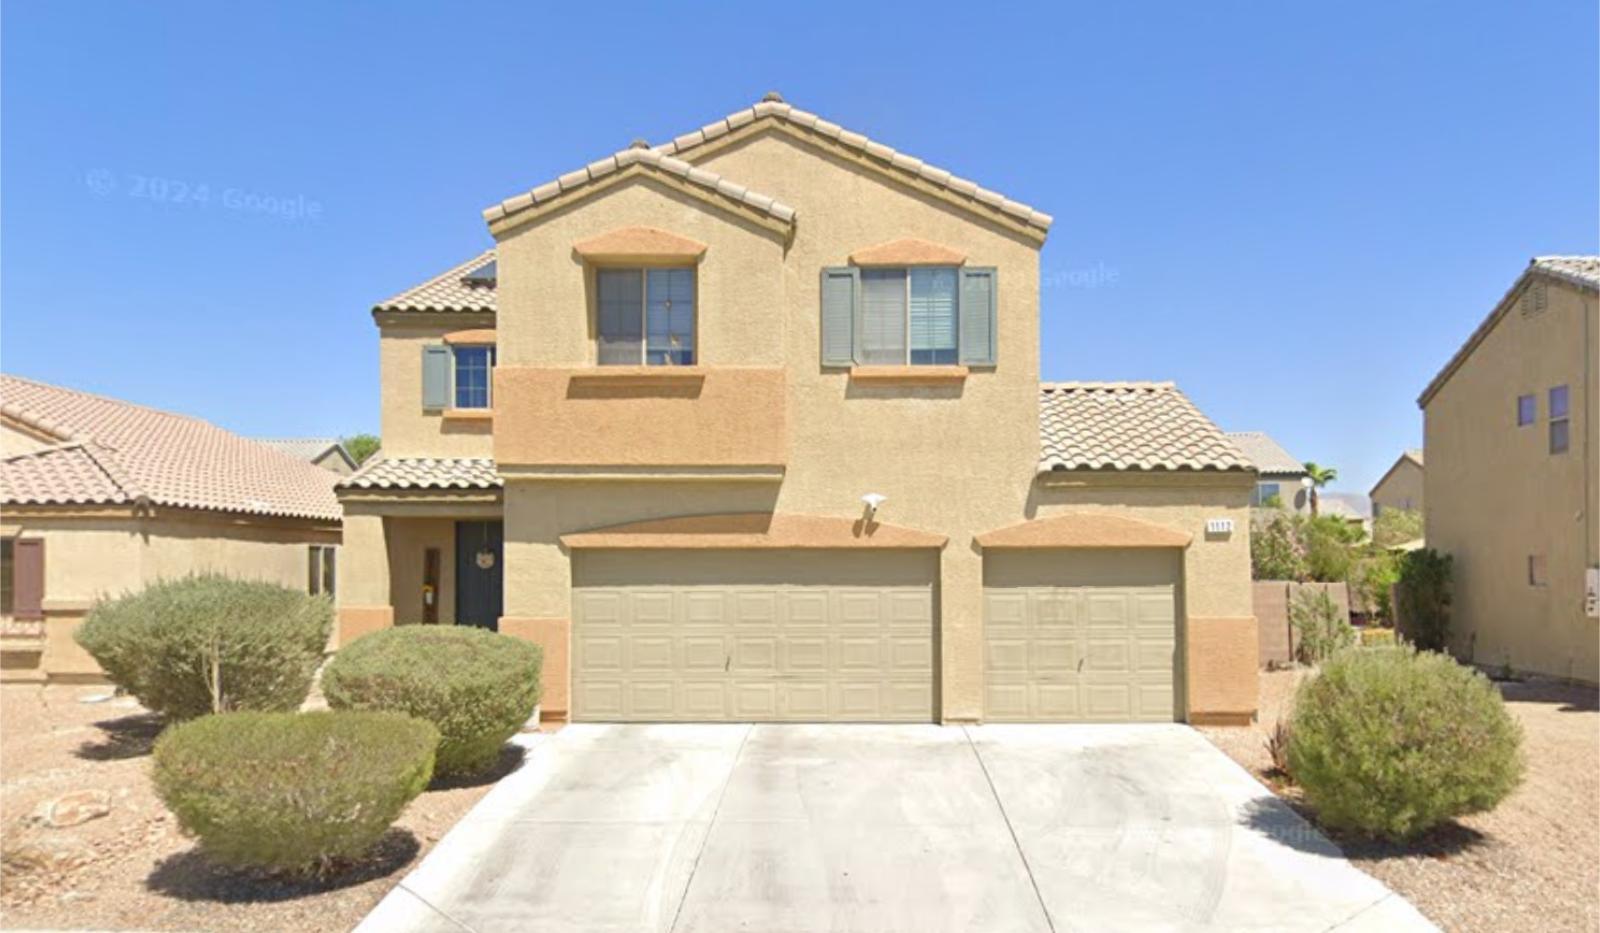
Las Vegas remains the heartbeat of Nevada’s economy and population growth. As one of the fastest-growing metro areas in the country, it draws new residents from California and other states seeking lower taxes and affordable living. The job market — particularly in entertainment, construction, and logistics — continues to expand, supporting a robust housing sector.
Luxury development, suburban sprawl, and city reinvestment projects have all contributed to a sharp rise in housing demand. Even with a temporary setback in 2023, prices remain near historic highs and continue to show upward momentum. With a 2025 home value averaging over $436,000, Las Vegas proves its staying power in the Southwest’s property scene.
18. Dayton – 258% Home Price Increase Since 2012

- 2010: $148,542
- 2011: $130,034 (-$18,509, -12.46% from previous year)
- 2012: $126,162 (-$3,872, -2.98% from previous year)
- 2013: $141,538 (+$15,376, +12.19% from previous year)
- 2014: $174,190 (+$32,652, +23.07% from previous year)
- 2015: $189,440 (+$15,250, +8.75% from previous year)
- 2016: $219,352 (+$29,912, +15.79% from previous year)
- 2017: $247,813 (+$28,462, +12.98% from previous year)
- 2018: $287,358 (+$39,545, +15.96% from previous year)
- 2019: $315,013 (+$27,655, +9.62% from previous year)
- 2020: $333,808 (+$18,795, +5.97% from previous year)
- 2021: $391,834 (+$58,026, +17.38% from previous year)
- 2022: $463,050 (+$71,216, +18.18% from previous year)
- 2023: $426,351 (-$36,698, -7.93% from previous year)
- 2024: $440,475 (+$14,124, +3.31% from previous year)
- 2025: $452,364 (+$11,889, +2.70% from previous year)
Dayton’s housing market has grown steadily and dramatically since hitting a low in 2012. At that time, the average home price was just $126,162 — but by 2025, prices have jumped to over $452,000, marking a 258% increase. The growth was especially sharp between 2013 and 2022, where values climbed nearly every year in strong double digits. Although there was a dip in 2023, the town quickly regained momentum, suggesting that buyer interest has remained resilient. The most recent years show a more measured pace of appreciation, but prices remain at historic highs. These numbers reflect a shift in perception: Dayton is no longer seen as a simple satellite of Carson City but rather as a competitive market in its own right. Overall, the trajectory here reflects both long-term stability and a notable surge in property investment interest.
Dayton – Suburban Expansion Meets Nevada History
Dayton is one of Nevada’s oldest settlements, located just southeast of Carson City along the Carson River. Historically rooted in mining and early pioneer activity, the town has evolved into a residential area that offers a quieter alternative to Reno and Carson City. The growth of nearby tech hubs, particularly those centered around the Reno-Tahoe Industrial Center, has helped bring new attention to Dayton as a viable place to live and work.
The area’s appeal lies in its blend of affordability (at least historically), open land, and proximity to job centers. Residential developments have expanded steadily, giving homebuyers more modern inventory while preserving the town’s rural charm. With recent price increases, Dayton is now competing with larger neighboring cities, showing that its market has matured significantly. Continued regional growth, combined with its small-town lifestyle and easy highway access, is likely to keep demand strong here even amid market fluctuations.
17. Boulder City – 167% Home Price Increase Since 2012

=> Designers Agree These 29 Common Home Design Habits Make Your House Look Cheap
- 2010: $233,284
- 2011: $202,070 (-$31,214, -13.38% from previous year)
- 2012: $178,563 (-$23,507, -11.63% from previous year)
- 2013: $201,004 (+$22,441, +12.57% from previous year)
- 2014: $234,374 (+$33,370, +16.60% from previous year)
- 2015: $257,201 (+$22,827, +9.74% from previous year)
- 2016: $270,362 (+$13,161, +5.12% from previous year)
- 2017: $284,257 (+$13,895, +5.14% from previous year)
- 2018: $308,675 (+$24,418, +8.59% from previous year)
- 2019: $331,055 (+$22,379, +7.25% from previous year)
- 2020: $336,077 (+$5,022, +1.52% from previous year)
- 2021: $383,686 (+$47,610, +14.17% from previous year)
- 2022: $456,391 (+$72,705, +18.95% from previous year)
- 2023: $432,364 (-$24,027, -5.26% from previous year)
- 2024: $461,306 (+$28,942, +6.69% from previous year)
- 2025: $478,237 (+$16,931, +3.67% from previous year)
Boulder City has seen prices rise by 167% since 2012, climbing from under $179,000 to nearly $478,000 in 2025. After years of mild and consistent growth, the market experienced a major upswing starting in 2021, with two consecutive years of double-digit gains. This upward pressure appears to be tied to a wave of demand for properties near Lake Mead and accessible to Las Vegas, but without the hustle of city living. While 2023 saw a minor retreat in prices, the following years regained momentum. Notably, even with small downturns, Boulder City hasn’t experienced the volatility seen in some other areas — its long-term price curve remains smooth and positive. That’s likely a reflection of both lifestyle-driven demand and supply constraints rooted in strict development rules.
Boulder City – Scenic Appeal With Controlled Growth
Boulder City is unique among Nevada towns — not just because of its scenic location above the Colorado River and Lake Mead, but also because it’s one of the few places in the state that restricts gambling. That policy has shaped its residential character, making it a more family-oriented and relaxed alternative to Las Vegas, just 30 miles away. The town’s history is closely linked to the Hoover Dam and remains a point of pride and tourism.
Strict growth controls and zoning policies have helped limit overdevelopment, which in turn has preserved home values and prevented market oversupply. This kind of planning has made Boulder City a standout in terms of housing stability. Local amenities include well-maintained parks, historic buildings, museums, and outdoor recreation at Lake Mead National Recreation Area. These features make it especially attractive to retirees, families, and professionals looking for a quieter base near the Las Vegas metro. With limited new inventory and steady demand, the town’s home prices are likely to keep inching upward in the years to come.
16. Henderson – 216% Home Price Increase Since 2012
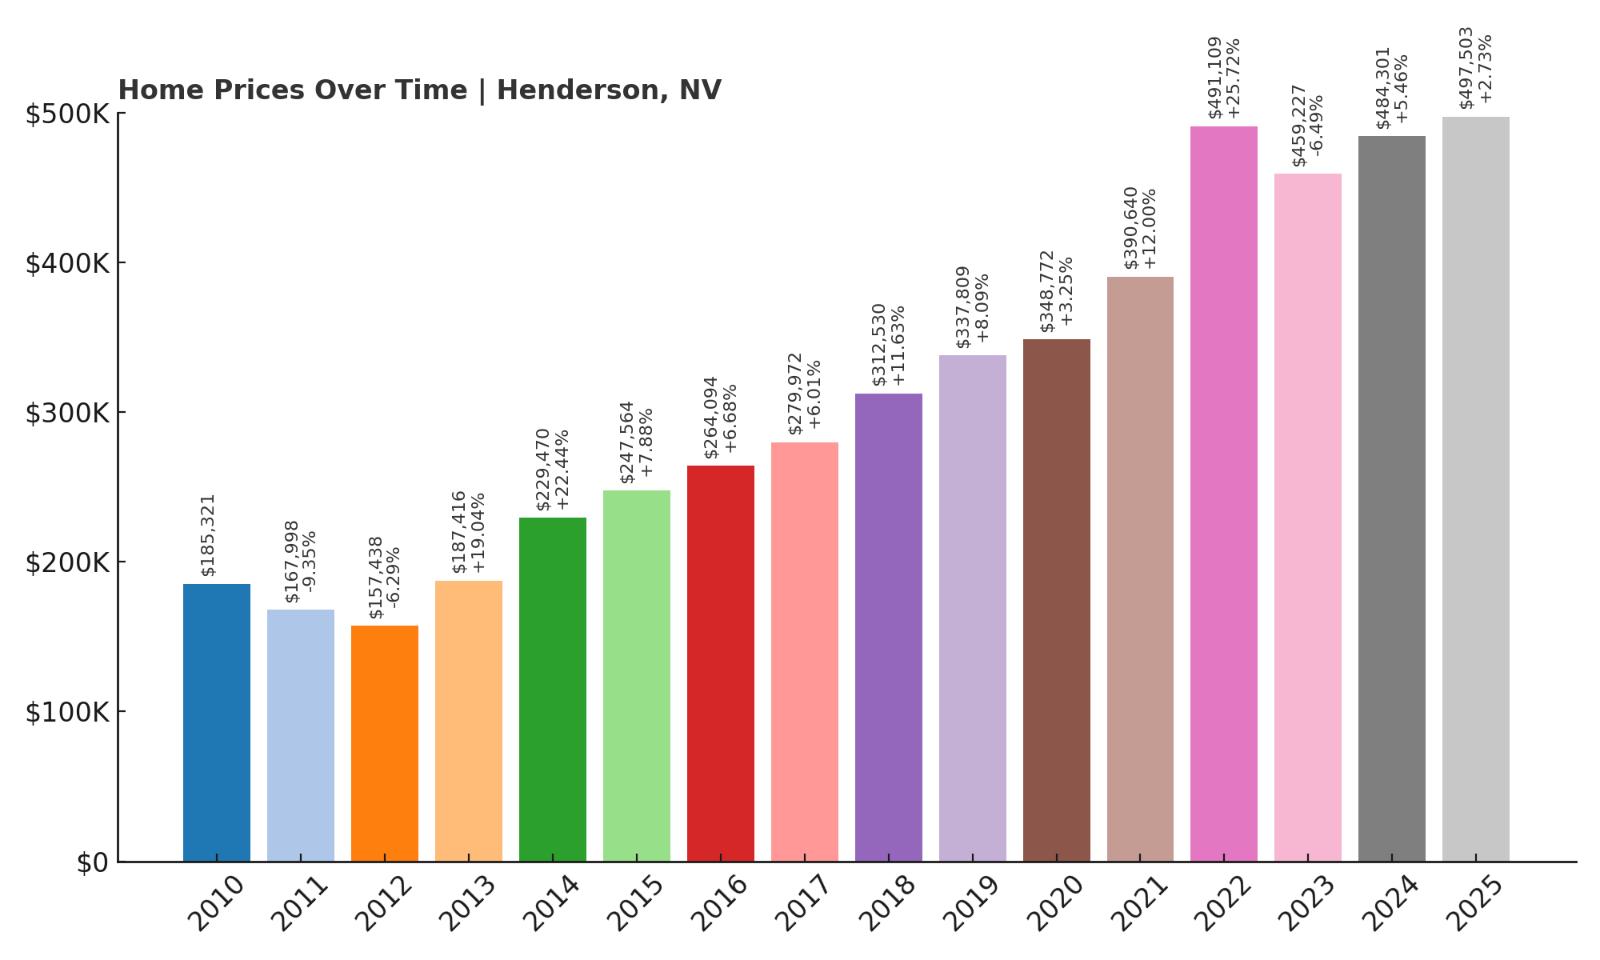
- 2010: $185,321
- 2011: $167,998 (-$17,323, -9.35% from previous year)
- 2012: $157,438 (-$10,560, -6.29% from previous year)
- 2013: $187,416 (+$29,978, +19.04% from previous year)
- 2014: $229,470 (+$42,054, +22.44% from previous year)
- 2015: $247,564 (+$18,094, +7.88% from previous year)
- 2016: $264,094 (+$16,530, +6.68% from previous year)
- 2017: $279,972 (+$15,878, +6.01% from previous year)
- 2018: $312,530 (+$32,558, +11.63% from previous year)
- 2019: $337,809 (+$25,279, +8.09% from previous year)
- 2020: $348,772 (+$10,963, +3.25% from previous year)
- 2021: $390,640 (+$41,868, +12.00% from previous year)
- 2022: $491,109 (+$100,468, +25.72% from previous year)
- 2023: $459,227 (-$31,882, -6.49% from previous year)
- 2024: $484,301 (+$25,074, +5.46% from previous year)
- 2025: $497,503 (+$13,202, +2.73% from previous year)
Henderson has emerged as one of Nevada’s most dependable housing markets, recording a remarkable 216% increase in home prices since 2012. From a low of $157,438 in that year to $497,503 in 2025, the trajectory has been overwhelmingly positive, driven by a mix of local economic growth and high demand from people relocating to the Las Vegas metro area. The years 2021 and 2022 were especially notable, with prices jumping by over $140,000 in just two years. Even though 2023 saw a minor pullback, the town quickly returned to growth in 2024 and 2025. This pattern reflects strong market fundamentals, including a growing population, steady employment base, and broad appeal among families and retirees alike. With limited inventory and continued pressure from urban migration, Henderson’s housing market appears positioned for more stable growth over the long term.
Henderson – A Desert City Built for Long-Term Living
Located just southeast of Las Vegas, Henderson has evolved from a bedroom community into a full-fledged city with its own identity. It’s the second-largest city in Nevada, known for its master-planned neighborhoods, clean public spaces, and robust municipal services. With over 300 days of sunshine per year, a lower crime rate compared to Las Vegas, and access to shopping, healthcare, and entertainment, Henderson has become one of the most desirable residential areas in the state. Developments like Inspirada and MacDonald Highlands offer luxury amenities and stunning desert views, further fueling demand.
In terms of education, Henderson is home to a mix of public and private schools, as well as satellite campuses of several universities. It’s also close to nature — Lake Mead and Sloan Canyon National Conservation Area are both within easy reach. This proximity to both outdoor recreation and urban amenities is a major draw for young professionals and retirees alike. With limited space for new construction in its more popular neighborhoods and strong ongoing demand, Henderson’s housing market shows no signs of cooling significantly. The long-term appeal of a well-maintained, services-rich community in the greater Las Vegas area continues to drive property values higher year after year.
15. Carson City – 229% Home Price Increase Since 2012
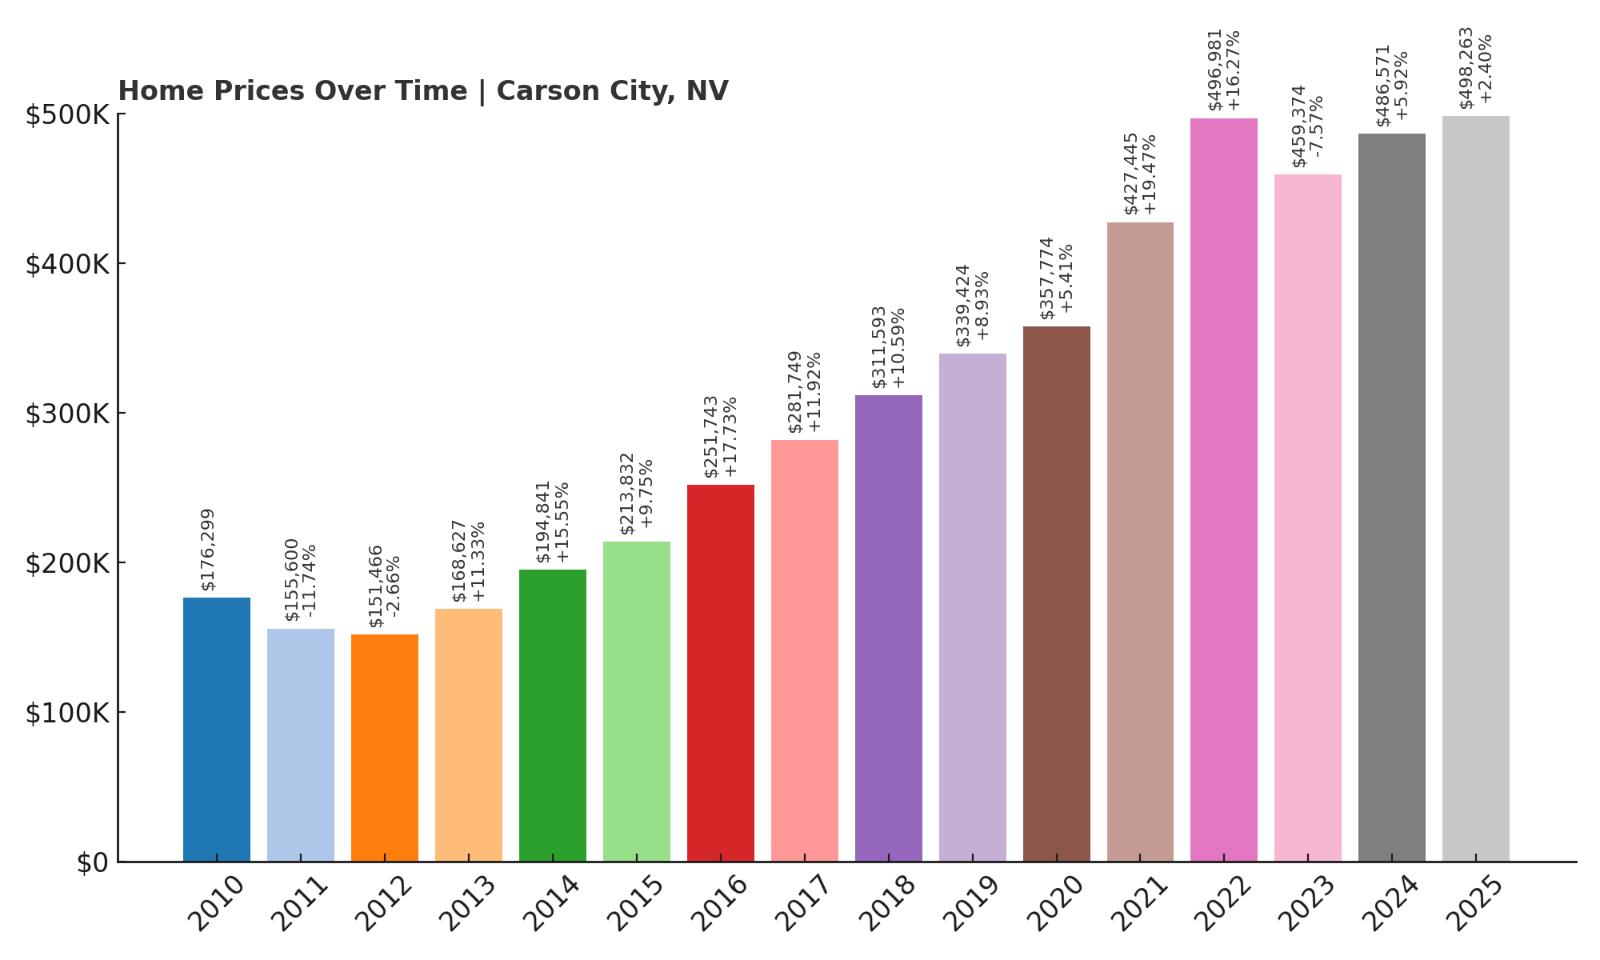
- 2010: $176,299
- 2011: $155,600 (-$20,699, -11.74% from previous year)
- 2012: $151,466 (-$4,134, -2.66% from previous year)
- 2013: $168,627 (+$17,161, +11.33% from previous year)
- 2014: $194,841 (+$26,213, +15.55% from previous year)
- 2015: $213,832 (+$18,991, +9.75% from previous year)
- 2016: $251,743 (+$37,911, +17.73% from previous year)
- 2017: $281,749 (+$30,006, +11.92% from previous year)
- 2018: $311,593 (+$29,844, +10.59% from previous year)
- 2019: $339,424 (+$27,831, +8.93% from previous year)
- 2020: $357,774 (+$18,350, +5.41% from previous year)
- 2021: $427,445 (+$69,670, +19.47% from previous year)
- 2022: $496,981 (+$69,537, +16.27% from previous year)
- 2023: $459,374 (-$37,607, -7.57% from previous year)
- 2024: $486,571 (+$27,196, +5.92% from previous year)
- 2025: $498,263 (+$11,692, +2.40% from previous year)
Carson City has quietly delivered impressive gains in the Nevada housing market, with home prices more than tripling since 2012. Back then, the typical home value was just $151,466. By 2025, it has climbed to $498,263 — an increase of nearly 230%. After a period of moderate, consistent gains from 2013 to 2020, the city experienced a sharp jump in 2021 and 2022. These two years alone saw values rise by nearly $140,000. A short-lived drop in 2023 gave way to renewed growth, showing that buyer demand hasn’t waned significantly. Carson City’s stability, combined with its government presence and proximity to Lake Tahoe, gives it an edge over more volatile markets in the state.
Carson City – Government Hub With Scenic Living

As the capital of Nevada, Carson City offers a rare combination of economic steadiness and natural beauty. It’s nestled at the eastern edge of the Sierra Nevada mountains, with quick access to Lake Tahoe, making it a desirable place to live for outdoor enthusiasts and public-sector employees alike. The presence of state government offices helps anchor the local economy, contributing to a relatively recession-resistant housing market. Carson City also offers a walkable historic downtown, a growing arts scene, and year-round recreational options.
Unlike rapidly expanding metros, Carson City has managed its growth carefully. Residential development has kept pace with infrastructure, helping prevent the kind of sprawl seen in other parts of the state. At the same time, it’s remained relatively affordable by capital city standards, especially when compared to urban centers in nearby California. Its location, just 30 minutes from Reno and 20 minutes from South Lake Tahoe, offers both economic opportunity and outdoor escape. With limited available land and enduring demand, Carson City’s price growth is unlikely to flatten any time soon.
14. Logandale – 194% Home Price Increase Since 2012
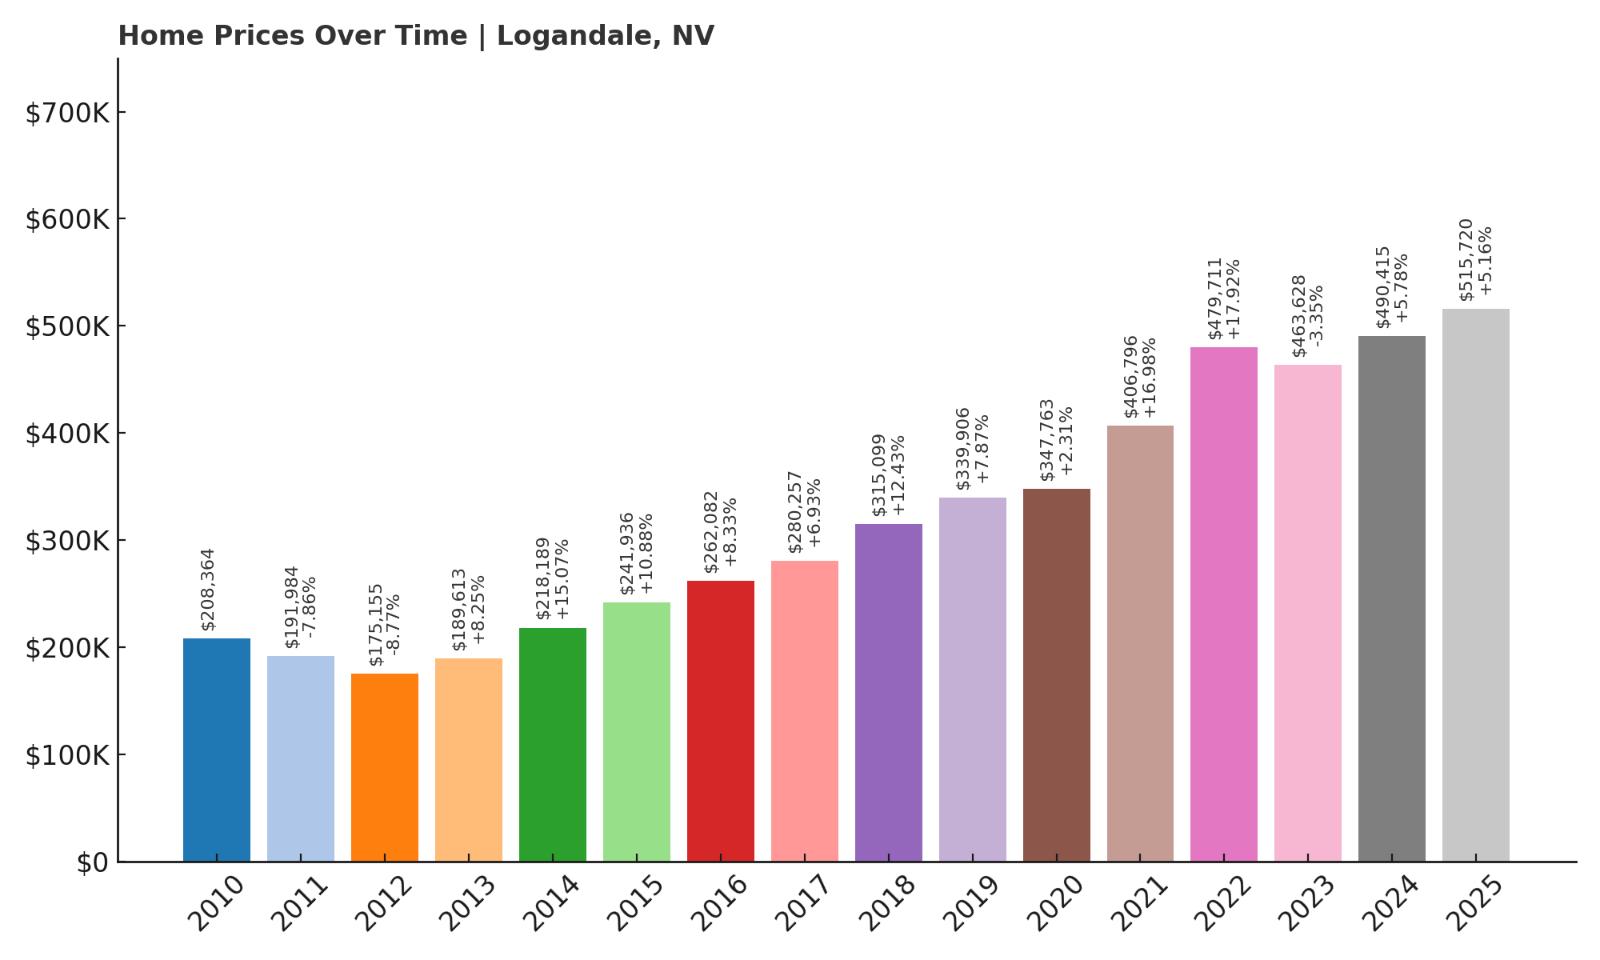
- 2010: $208,364
- 2011: $191,984 (-$16,380, -7.86% from previous year)
- 2012: $175,155 (-$16,829, -8.77% from previous year)
- 2013: $189,613 (+$14,458, +8.25% from previous year)
- 2014: $218,189 (+$28,576, +15.07% from previous year)
- 2015: $241,936 (+$23,747, +10.88% from previous year)
- 2016: $262,082 (+$20,146, +8.33% from previous year)
- 2017: $280,257 (+$18,175, +6.93% from previous year)
- 2018: $315,099 (+$34,842, +12.43% from previous year)
- 2019: $339,906 (+$24,807, +7.87% from previous year)
- 2020: $347,763 (+$7,856, +2.31% from previous year)
- 2021: $406,796 (+$59,033, +16.98% from previous year)
- 2022: $479,711 (+$72,916, +17.92% from previous year)
- 2023: $463,628 (-$16,084, -3.35% from previous year)
- 2024: $490,415 (+$26,787, +5.78% from previous year)
- 2025: $515,720 (+$25,305, +5.16% from previous year)
Logandale has seen an extraordinary turnaround in home values since 2012, when the typical property was worth just $175,155. In the years that followed, prices surged almost uninterrupted, reaching $515,720 by 2025 — a 194% increase. Between 2013 and 2022, the town experienced strong annual growth, often in the double digits. The only real slowdown came in 2023 with a modest dip, but prices quickly bounced back, rising by over $50,000 in just the following two years. These gains point to a rising demand for homes in quieter, more spacious areas outside the core Las Vegas region. Buyers are drawn to towns like Logandale for their balance of affordability and quality of life, and the price data here supports that shift in sentiment.
Logandale – Small-Town Life With Easy Vegas Access
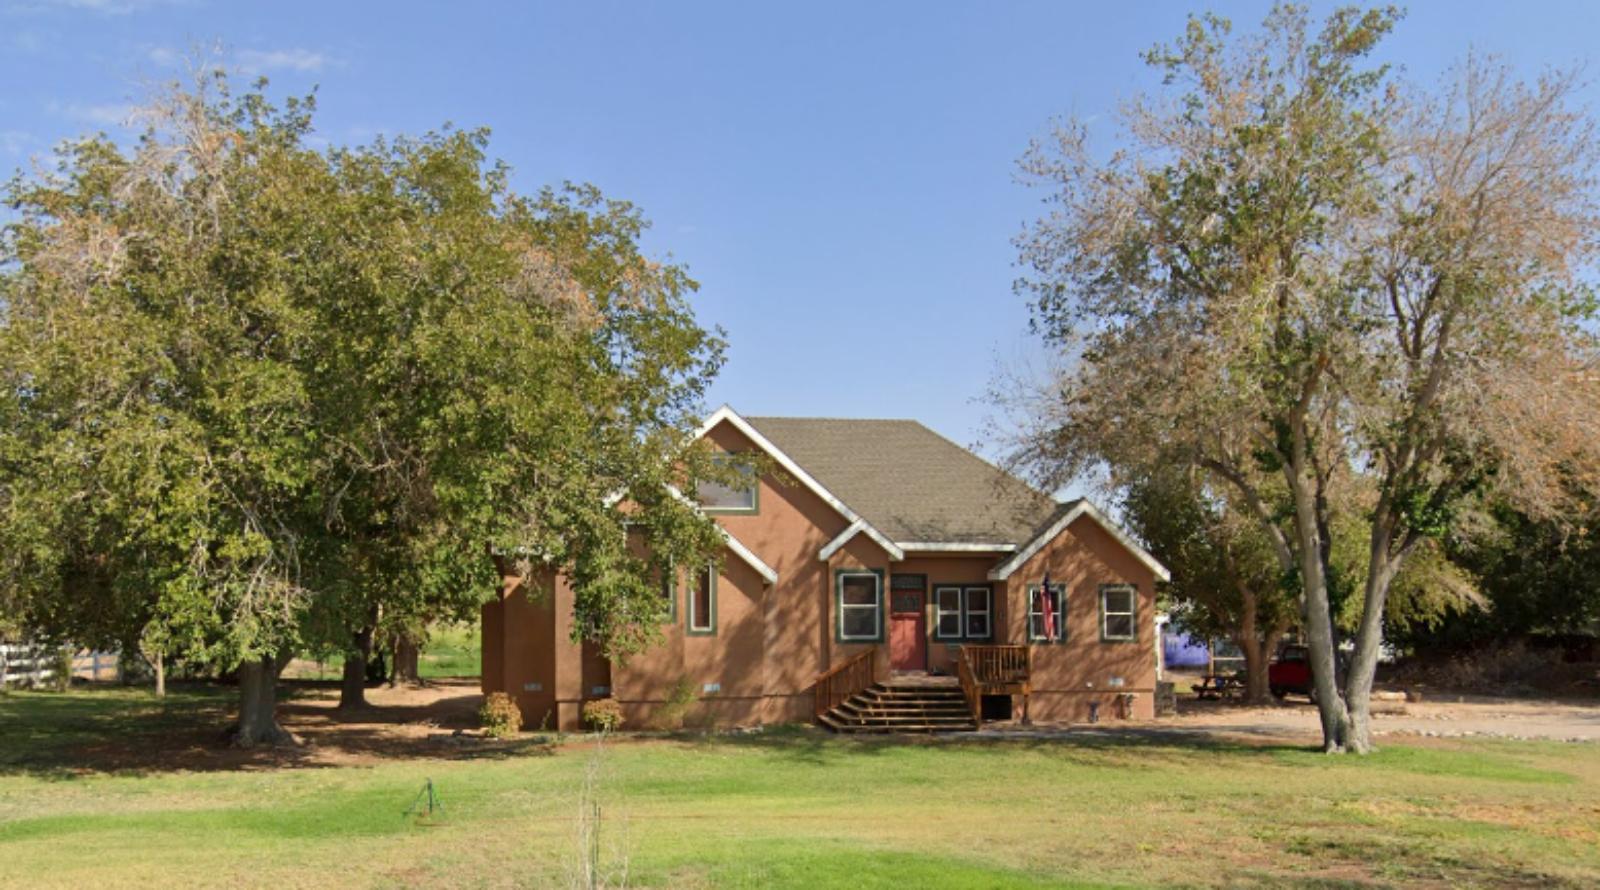
Located in the Moapa Valley about 60 miles northeast of Las Vegas, Logandale offers a slower pace of life in a region steeped in agricultural history and natural beauty. The town is part of Clark County but feels worlds apart from the city lights of Vegas. It’s surrounded by mesas, red rock formations, and the wide-open spaces typical of rural Nevada. Yet despite its remote feel, Logandale is surprisingly well-connected — it lies along the I-15 corridor, making commuting to the metro area realistic for those working in Las Vegas or North Las Vegas.
One major draw is the Moapa Valley National Wildlife Refuge and the annual Clark County Fair and Rodeo, which give Logandale a strong sense of community and place. There’s also a growing number of families settling here, thanks to local schools and large property lots that offer space to grow — literally and figuratively. With limited housing inventory, steady demand, and more interest in exurban living post-pandemic, Logandale’s price trends suggest that it could continue to outperform better-known suburbs in the long term.
13. Sparks – 251% Home Price Increase Since 2012

- 2010: $182,861
- 2011: $164,206 (-$18,655, -10.20% from previous year)
- 2012: $150,372 (-$13,834, -8.42% from previous year)
- 2013: $181,436 (+$31,063, +20.66% from previous year)
- 2014: $220,140 (+$38,705, +21.33% from previous year)
- 2015: $248,497 (+$28,357, +12.88% from previous year)
- 2016: $286,589 (+$38,092, +15.33% from previous year)
- 2017: $310,949 (+$24,360, +8.50% from previous year)
- 2018: $346,293 (+$35,344, +11.37% from previous year)
- 2019: $367,598 (+$21,305, +6.15% from previous year)
- 2020: $381,958 (+$14,360, +3.91% from previous year)
- 2021: $451,887 (+$69,930, +18.31% from previous year)
- 2022: $547,804 (+$95,917, +21.23% from previous year)
- 2023: $499,443 (-$48,361, -8.83% from previous year)
- 2024: $521,032 (+$21,589, +4.32% from previous year)
- 2025: $527,275 (+$6,243, +1.20% from previous year)
Sparks has been one of Nevada’s most aggressive housing markets over the last decade, with values climbing from $150,372 in 2012 to $527,275 by 2025. That’s a 251% increase, placing it squarely among the state’s top-performing cities. The years from 2013 through 2022 saw unrelenting upward pressure on prices, fueled by regional economic expansion and a population surge in the Reno metro. While 2023 saw a price correction, values have since stabilized and begun ticking upward again. The city’s long-term pricing arc shows strong resilience, suggesting deep-rooted demand and a maturing urban profile. Sparks isn’t just riding Reno’s coattails — it’s establishing its own real estate identity.
Sparks – Northern Nevada’s Growth Engine
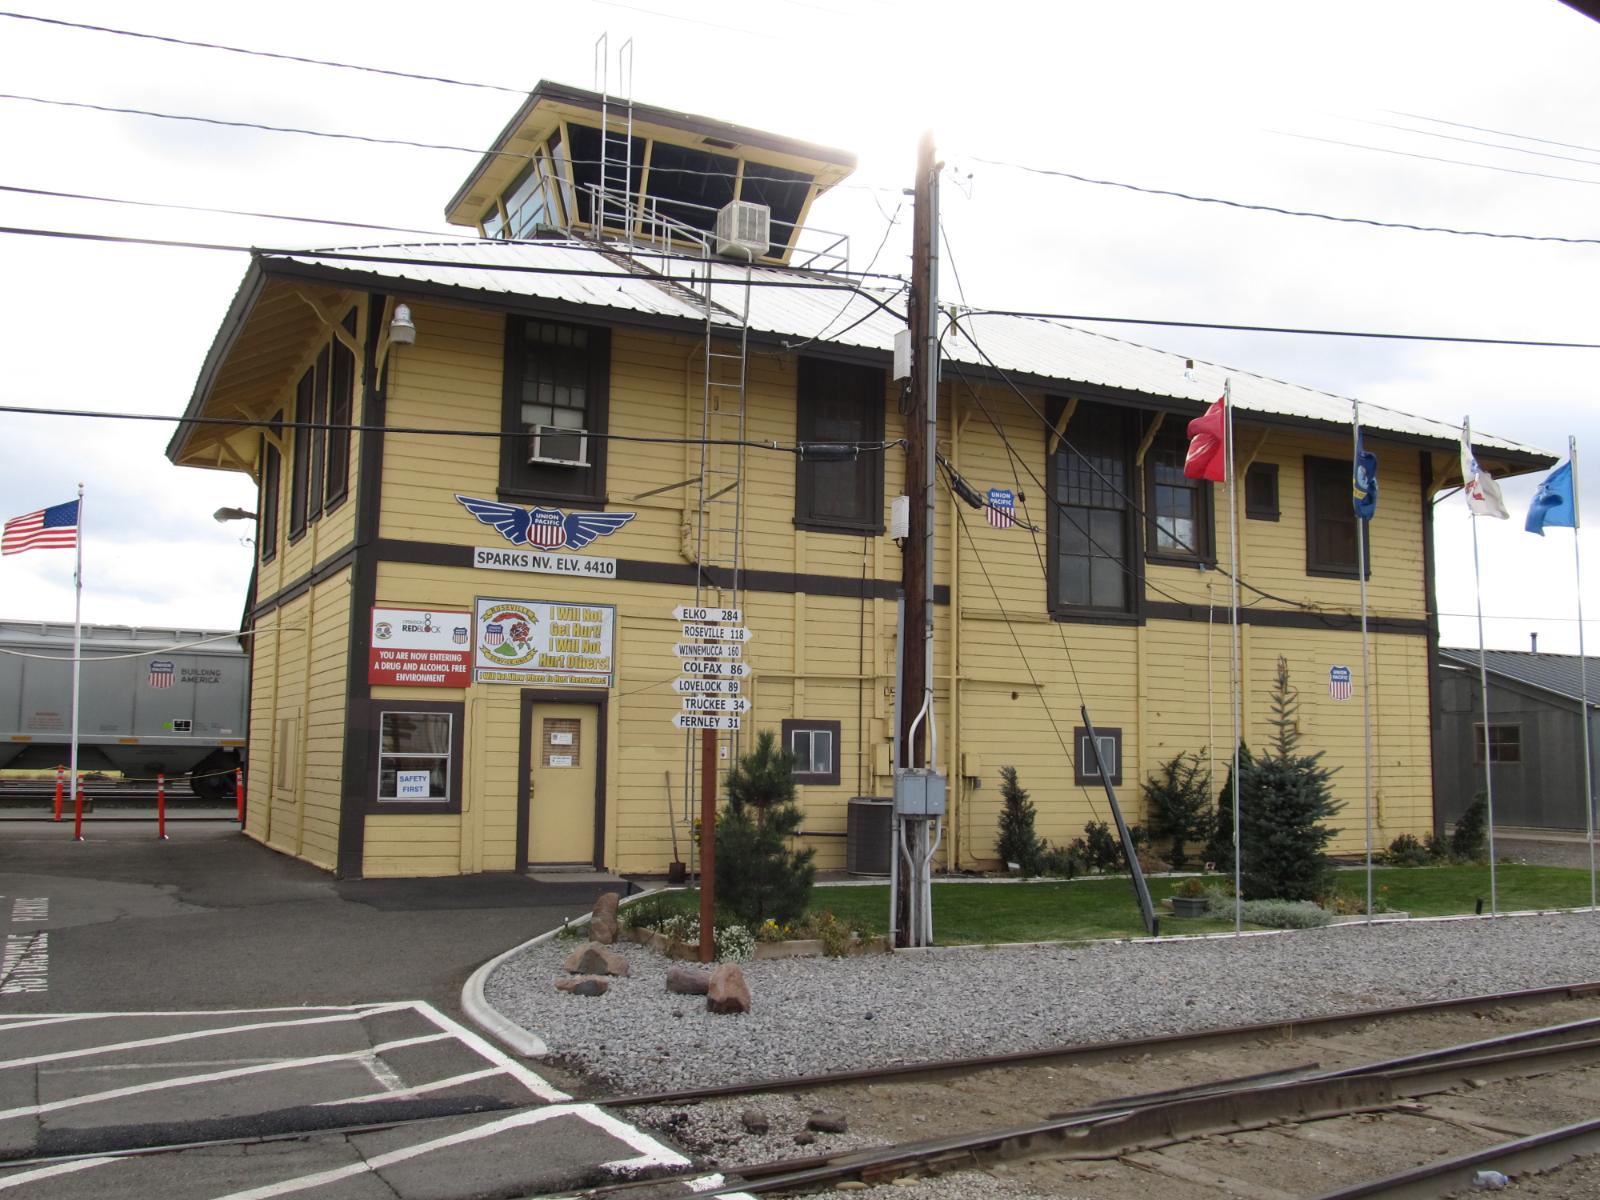
Sparks is nestled alongside Reno but has increasingly carved out its own reputation as a destination for families, professionals, and investors alike. With significant investment in parks, schools, and infrastructure, the city has kept pace with its rapid population growth. Located close to the Tahoe-Reno Industrial Center — home to major employers like Tesla and Switch — Sparks offers convenient access to one of the largest economic zones in the region. That proximity has contributed directly to housing demand, especially among younger buyers looking for affordability and convenience.
The city’s development has been balanced, mixing new residential subdivisions with revived historic neighborhoods near Victorian Avenue. Parks like Sparks Marina and shopping centers like Legends offer amenities that rival much larger cities. Local officials have invested in long-term planning, helping manage growth responsibly while preserving quality of life. With a robust job market, good schools, and a strong housing pipeline, Sparks is well positioned to remain a standout performer in Nevada’s real estate landscape — even if future growth moderates slightly from the frenzied pace of the last decade.
12. Wellington – 179% Home Price Increase Since 2012
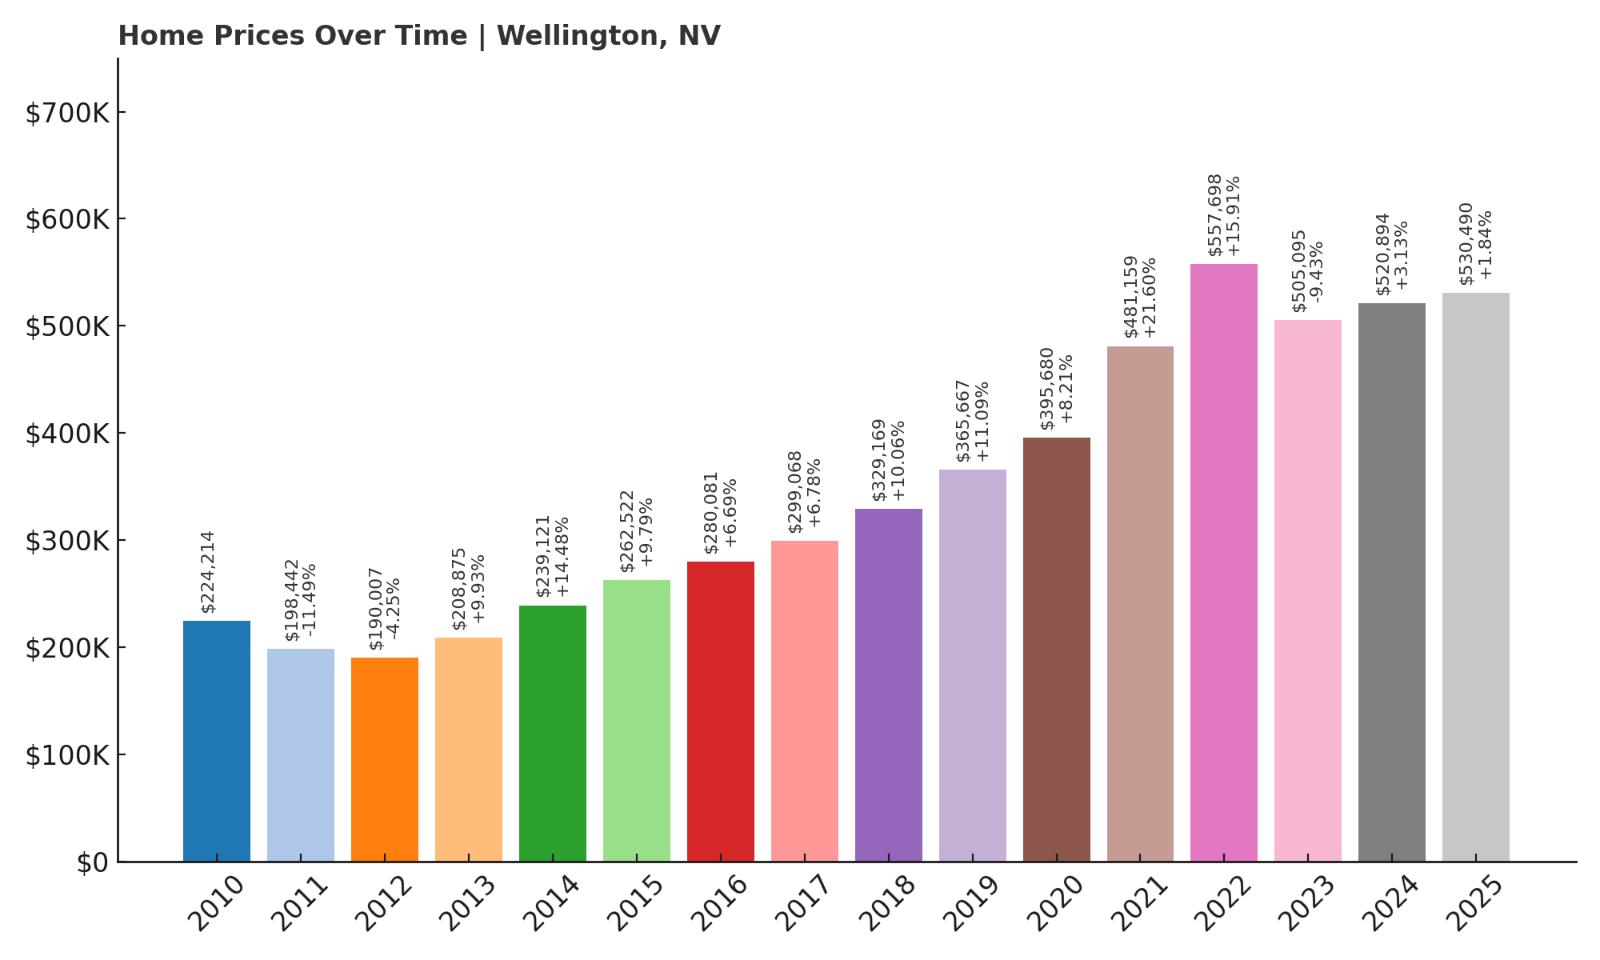
- 2010: $224,214
- 2011: $198,442 (-$25,772, -11.49% from previous year)
- 2012: $190,007 (-$8,435, -4.25% from previous year)
- 2013: $208,875 (+$18,868, +9.93% from previous year)
- 2014: $239,121 (+$30,246, +14.48% from previous year)
- 2015: $262,522 (+$23,401, +9.79% from previous year)
- 2016: $280,081 (+$17,560, +6.69% from previous year)
- 2017: $299,068 (+$18,987, +6.78% from previous year)
- 2018: $329,169 (+$30,101, +10.06% from previous year)
- 2019: $365,667 (+$36,499, +11.09% from previous year)
- 2020: $395,680 (+$30,013, +8.21% from previous year)
- 2021: $481,159 (+$85,479, +21.60% from previous year)
- 2022: $557,698 (+$76,539, +15.91% from previous year)
- 2023: $505,095 (-$52,603, -9.43% from previous year)
- 2024: $520,894 (+$15,799, +3.13% from previous year)
- 2025: $530,490 (+$9,596, +1.84% from previous year)
Wellington’s housing prices have soared 179% since 2012, rising from $190,007 to over $530,000 in 2025. While it may not grab headlines like Reno or Las Vegas, this small town in Lyon County has carved out a niche among buyers seeking rural properties with ample land and privacy. The strongest gains occurred between 2013 and 2022, as new arrivals poured into Nevada from California and elsewhere, looking for affordability and breathing room. Wellington’s 2023 price dip was the steepest among the top 15 towns in this list, but the rebound in 2024 and 2025 shows that interest remains strong. The steady upward climb in nearly every prior year suggests that the long-term growth story is still very much intact.
Wellington – High Desert Appeal and Wide-Open Living
Wellington is located in western Nevada, southeast of Yerington and near the Smith Valley region. Known for its rural charm, large ranch-style properties, and high desert vistas, it has become increasingly popular with homebuyers looking for space, peace, and panoramic views. While remote by urban standards, it’s within driving distance of both Reno and Carson City, making it a viable choice for remote workers or those who don’t need to commute daily. The appeal here lies in lifestyle: horseback trails, farmland, and quiet roads — not traffic and strip malls.
Recent price trends show that Wellington is no longer a well-kept secret. As more buyers seek out land-rich alternatives to dense suburbs, areas like this are seeing increased interest. Zoning rules have kept housing density low, and new development has been minimal, which helps support pricing over time. While it may not have the commercial base of larger towns, what Wellington lacks in convenience, it makes up for in natural serenity and space. Those who move here are often in it for the long haul, and that kind of resident base often contributes to stronger, more stable property values.
11. Mount Charleston – 159% Home Price Increase Since 2012
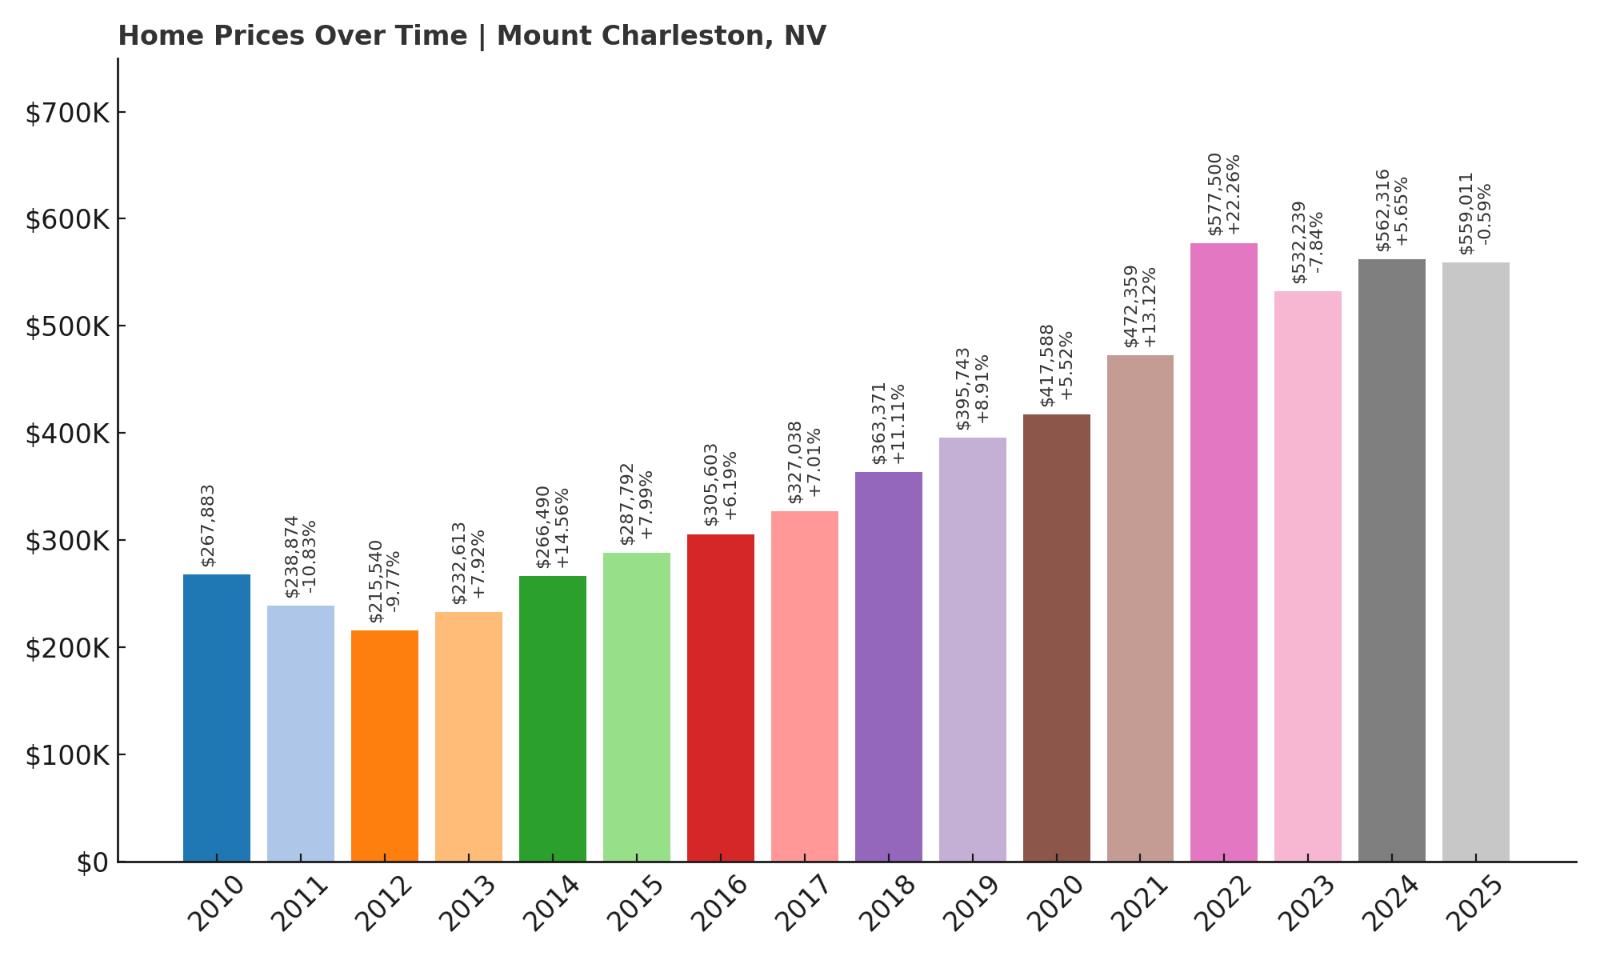
- 2010: $267,883
- 2011: $238,874 (-$29,009, -10.83% from previous year)
- 2012: $215,540 (-$23,334, -9.77% from previous year)
- 2013: $232,613 (+$17,073, +7.92% from previous year)
- 2014: $266,490 (+$33,877, +14.56% from previous year)
- 2015: $287,792 (+$21,302, +7.99% from previous year)
- 2016: $305,603 (+$17,811, +6.19% from previous year)
- 2017: $327,038 (+$21,435, +7.01% from previous year)
- 2018: $363,371 (+$36,334, +11.11% from previous year)
- 2019: $395,743 (+$32,371, +8.91% from previous year)
- 2020: $417,588 (+$21,845, +5.52% from previous year)
- 2021: $472,359 (+$54,771, +13.12% from previous year)
- 2022: $577,500 (+$105,141, +22.26% from previous year)
- 2023: $532,239 (-$45,262, -7.84% from previous year)
- 2024: $562,316 (+$30,078, +5.65% from previous year)
- 2025: $559,011 (-$3,305, -0.59% from previous year)
Mount Charleston’s home prices rose 159% from 2012 to 2025, climbing from $215,540 to $559,011. For a remote alpine town with limited housing stock, that’s a substantial shift. Prices saw consistent yearly gains throughout the 2010s, with a particularly dramatic surge in 2022 when values jumped over $100,000 in just one year. A correction followed in 2023, which may have been driven by broader market pullbacks rather than local weakness. Prices have since leveled off, indicating stabilization rather than further decline. Mount Charleston’s high price tag is justified by its scarce inventory, unique geography, and lifestyle-driven demand, all of which are reflected in its long-term home value trends.
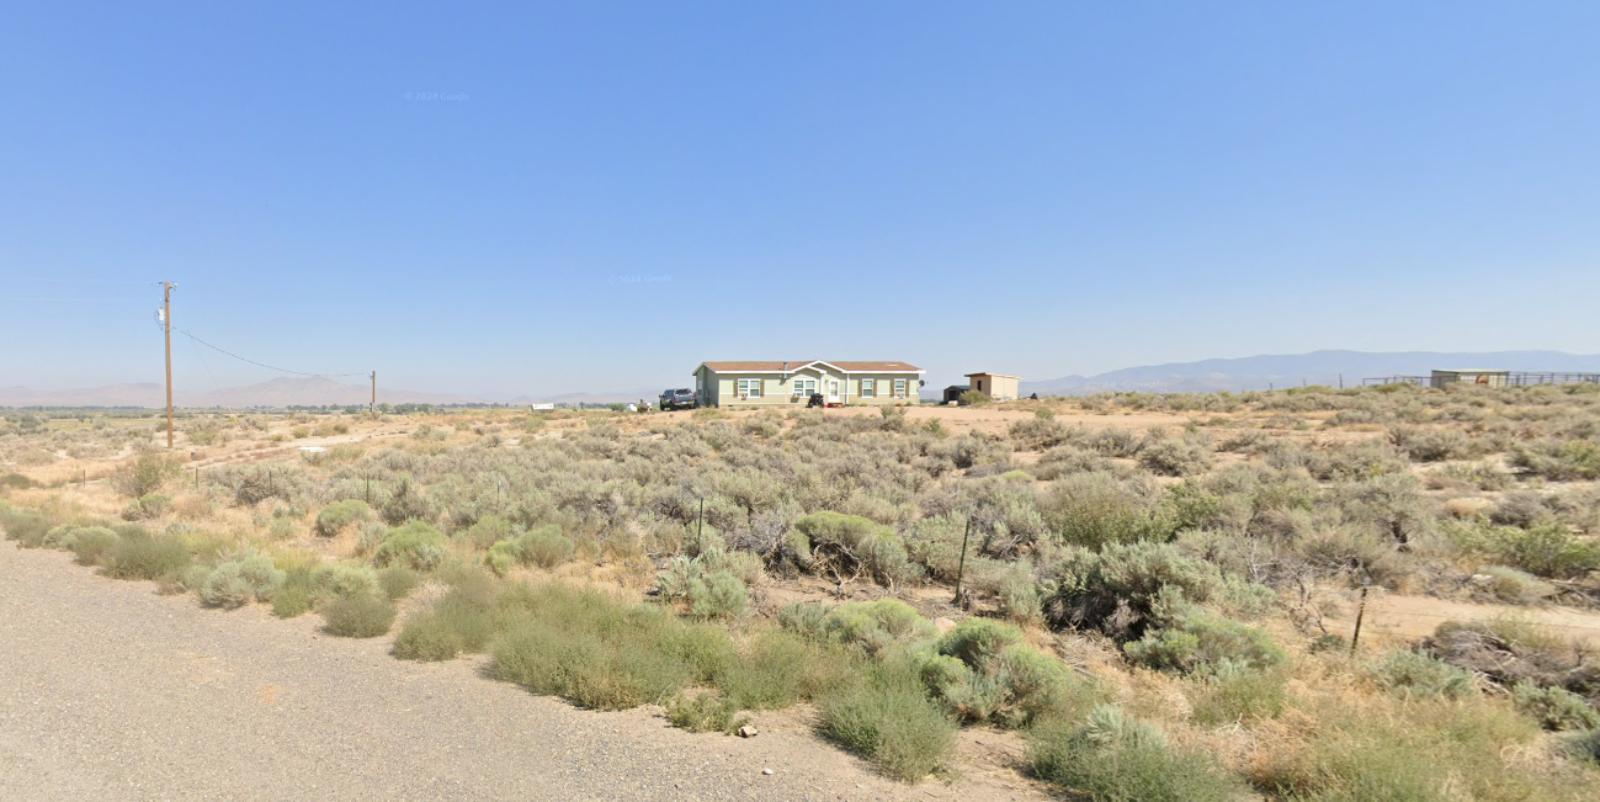
Mount Charleston – Nevada’s Alpine Outlier

Mount Charleston is unlike anywhere else in Nevada. Located in the Spring Mountains about 45 minutes northwest of Las Vegas, it offers a cooler, forested environment with snowfall in the winter — a true alpine escape in a desert state. The area is known for outdoor recreation, including hiking, skiing, and snowboarding at Lee Canyon. It’s also one of the few places in southern Nevada with dense forests and mountain vistas. As such, homes here are limited, often cabin-style or custom builds nestled into steep terrain.
Buyers in Mount Charleston aren’t usually looking for convenience — they’re seeking retreat, seclusion, and natural beauty. The scarcity of new builds and tight environmental controls keep the housing supply low, which has helped buoy prices over the years. It’s a niche market, and one that has matured as high-income buyers from Las Vegas and California search for weekend homes or full-time mountain living. Even after a slight drop in 2023 and 2025, values remain well above historical levels, signaling sustained interest in this one-of-a-kind mountain community.
10. Reno – 254% Home Price Increase Since 2012
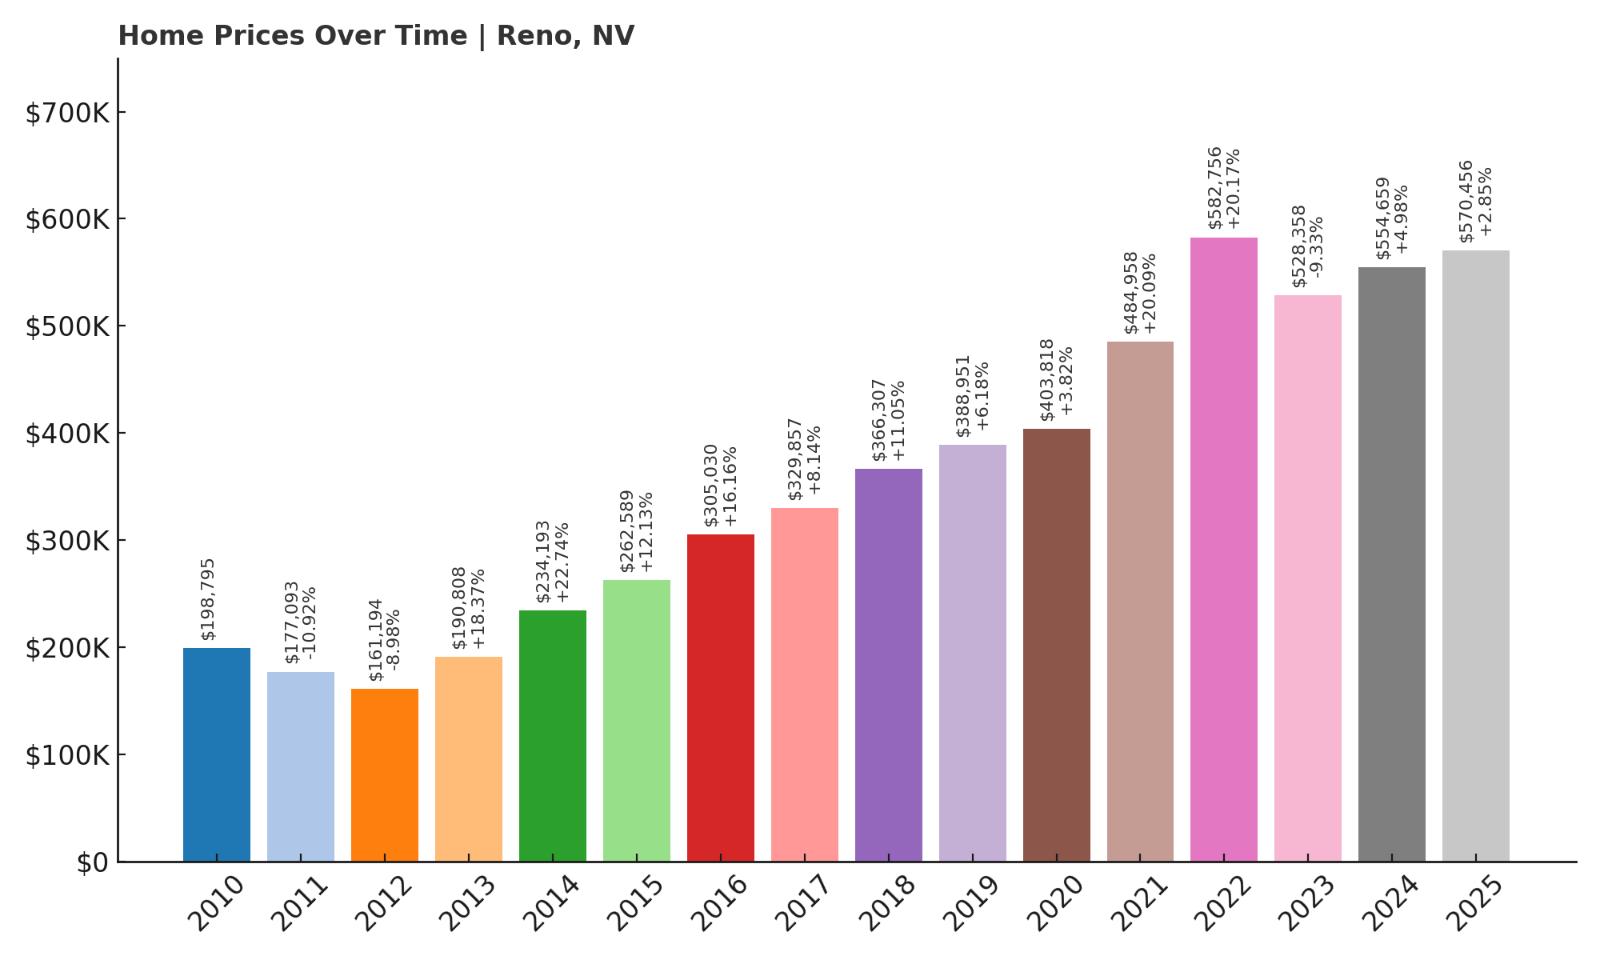
- 2010: $198,795
- 2011: $177,093 (-$21,702, -10.92% from previous year)
- 2012: $161,194 (-$15,900, -8.98% from previous year)
- 2013: $190,808 (+$29,615, +18.37% from previous year)
- 2014: $234,193 (+$43,384, +22.74% from previous year)
- 2015: $262,589 (+$28,396, +12.13% from previous year)
- 2016: $305,030 (+$42,441, +16.16% from previous year)
- 2017: $329,857 (+$24,828, +8.14% from previous year)
- 2018: $366,307 (+$36,449, +11.05% from previous year)
- 2019: $388,951 (+$22,644, +6.18% from previous year)
- 2020: $403,818 (+$14,867, +3.82% from previous year)
- 2021: $484,958 (+$81,141, +20.09% from previous year)
- 2022: $582,756 (+$97,798, +20.17% from previous year)
- 2023: $528,358 (-$54,398, -9.33% from previous year)
- 2024: $554,659 (+$26,300, +4.98% from previous year)
- 2025: $570,456 (+$15,798, +2.85% from previous year)
Reno’s housing market has undergone a full transformation over the past decade. In 2012, home prices had fallen to just $161,194, but by 2025, they’ve reached $570,456 — a 254% increase. This growth has been driven by a booming tech sector, high-profile employers, and a migration wave from California that dramatically increased demand for housing. Between 2013 and 2022, prices rose at a blistering pace, adding hundreds of thousands in value. Even after a sharp correction in 2023, the recovery was swift, with two consecutive years of moderate gains. Reno’s price trends now reflect a mature but still growing city with solid fundamentals.
Reno – From Casinos to Tech Hub
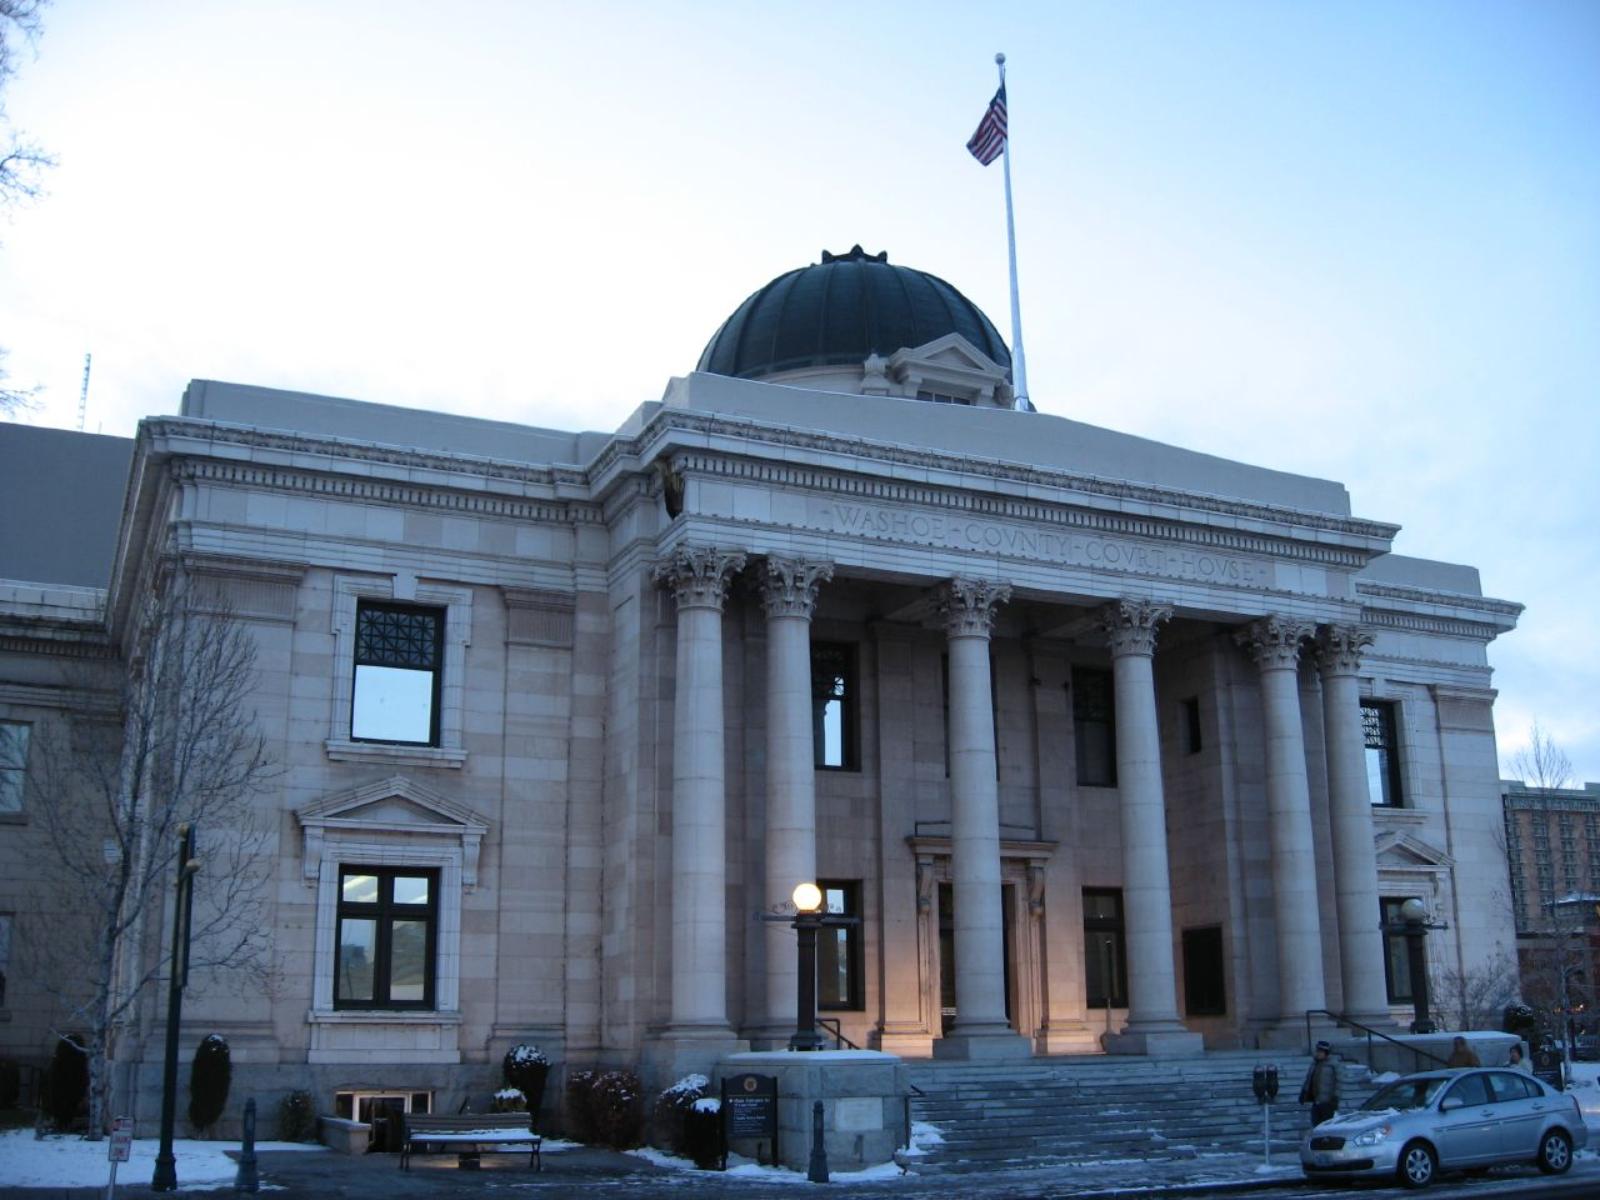
Once known mainly for its casinos and proximity to Lake Tahoe, Reno has reinvented itself over the last decade. It is now home to a growing tech and logistics economy, with major employers like Tesla, Apple, and Google setting up operations in the region. The resulting job growth has drawn thousands of new residents, transforming the housing market and urban landscape. Downtown revitalization projects, university expansion, and an influx of capital have turned Reno into a modern, dynamic city that balances outdoor access with urban energy.
Reno offers all-season appeal — skiing in winter, hiking and biking in summer, and year-round events like the Reno River Festival and Hot August Nights. The city also benefits from being just a short drive to Truckee and Lake Tahoe. Its schools, transit improvements, and emerging arts scene have helped attract not just workers but families and retirees as well. Though affordability has become a concern, demand remains strong, and the modest recovery after 2023’s dip suggests the city’s upward momentum is far from over.
9. Smith – 190% Home Price Increase Since 2012

- 2010: $238,292
- 2011: $210,861 (-$27,431, -11.51% from previous year)
- 2012: $203,551 (-$7,309, -3.47% from previous year)
- 2013: $223,645 (+$20,094, +9.87% from previous year)
- 2014: $256,791 (+$33,146, +14.82% from previous year)
- 2015: $285,936 (+$29,145, +11.35% from previous year)
- 2016: $310,895 (+$24,959, +8.73% from previous year)
- 2017: $331,858 (+$20,963, +6.74% from previous year)
- 2018: $364,321 (+$32,463, +9.78% from previous year)
- 2019: $403,713 (+$39,392, +10.81% from previous year)
- 2020: $434,882 (+$31,169, +7.72% from previous year)
- 2021: $516,505 (+$81,622, +18.77% from previous year)
- 2022: $604,441 (+$87,936, +17.03% from previous year)
- 2023: $534,012 (-$70,429, -11.65% from previous year)
- 2024: $565,354 (+$31,342, +5.87% from previous year)
- 2025: $591,079 (+$25,725, +4.55% from previous year)
Smith has delivered an impressive 190% increase in home prices since 2012, moving from $203,551 to $591,079 by 2025. This rural area in Lyon County saw steady growth throughout the 2010s, followed by a massive spike in 2021 and 2022 that added over $170,000 in just two years. A significant pullback came in 2023, but the market quickly bounced back with back-to-back years of recovery. The long-term trend is clearly positive, indicating that Smith has become an increasingly attractive option for buyers looking outside Nevada’s better-known markets.
Smith – Quiet, Scenic, and On the Rise
Smith is an unincorporated community in western Nevada, nestled near the East Walker River and surrounded by farmland, mountains, and open sky. It’s an ideal location for buyers looking to get away from traffic and crowds without giving up basic amenities. Though the area is small, it benefits from its proximity to both Wellington and Yerington, while still being within reach of larger centers like Carson City and Reno. The town’s rural setting appeals particularly to those interested in hobby farms, ranching, or simply living a quieter life.
The rise in property values here has been driven in part by the growing desire for larger lots, custom homes, and detached living. As home prices across Nevada surged, Smith remained relatively under the radar, which made it an appealing alternative during the state’s housing boom. The sharp rebound after 2023’s dip suggests the local market has legs — and that interest in small-town Nevada is still strong. With limited housing stock and stable demand, Smith’s property market is likely to remain competitive for years to come.
8. Gardnerville – 204% Home Price Increase Since 2012
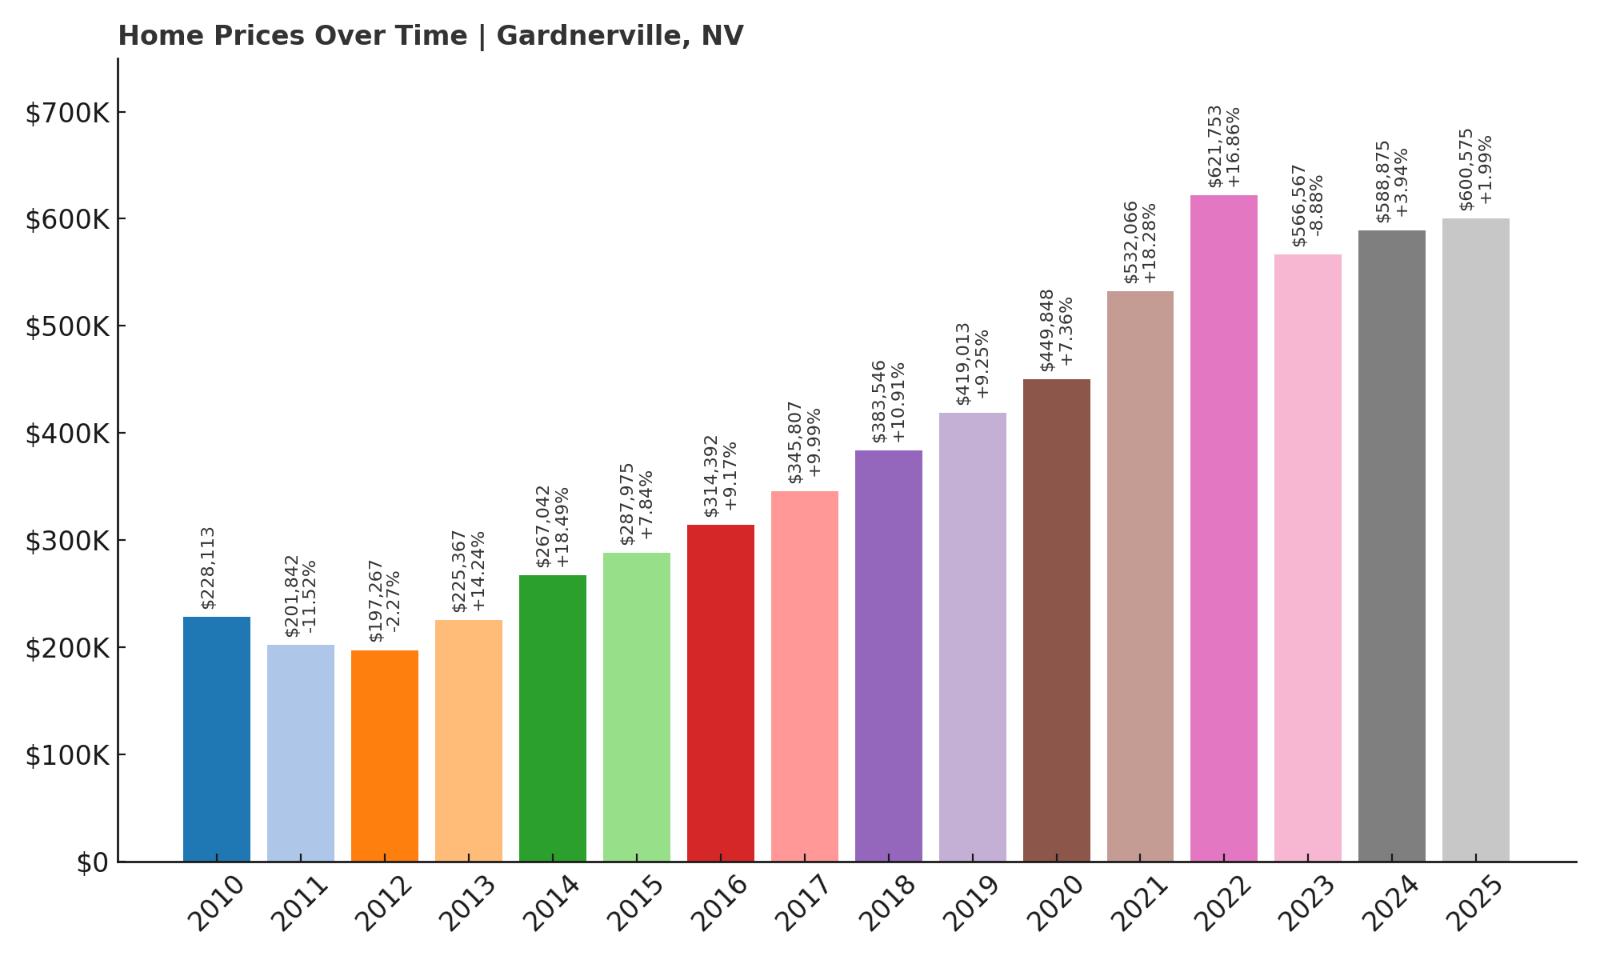
- 2010: $228,113
- 2011: $201,842 (-$26,272, -11.52% from previous year)
- 2012: $197,267 (-$4,574, -2.27% from previous year)
- 2013: $225,367 (+$28,099, +14.24% from previous year)
- 2014: $267,042 (+$41,676, +18.49% from previous year)
- 2015: $287,975 (+$20,933, +7.84% from previous year)
- 2016: $314,392 (+$26,416, +9.17% from previous year)
- 2017: $345,807 (+$31,416, +9.99% from previous year)
- 2018: $383,546 (+$37,738, +10.91% from previous year)
- 2019: $419,013 (+$35,467, +9.25% from previous year)
- 2020: $449,848 (+$30,836, +7.36% from previous year)
- 2021: $532,066 (+$82,218, +18.28% from previous year)
- 2022: $621,753 (+$89,687, +16.86% from previous year)
- 2023: $566,567 (-$55,186, -8.88% from previous year)
- 2024: $588,875 (+$22,307, +3.94% from previous year)
- 2025: $600,575 (+$11,700, +1.99% from previous year)
Gardnerville has seen home values increase by over 204% since 2012, growing from $197,267 to $600,575 in just over a decade. The town’s housing market boomed from 2013 through 2022, with a stretch of nine consecutive years of solid gains. Price appreciation was particularly sharp from 2020 to 2022, with back-to-back double-digit jumps adding nearly $175,000 in value. A dip in 2023 brought prices down temporarily, but that decline proved short-lived as values began climbing again in the following years. The overall pattern suggests that demand for Gardnerville remains robust, and its price growth reflects a long-term shift in regional homebuying preferences.
Gardnerville – A Scenic Valley Town With Steady Demand
Located in the Carson Valley just south of Carson City, Gardnerville is one of northern Nevada’s most picturesque communities. It’s framed by the eastern Sierra Nevada and offers expansive views, open space, and a friendly, small-town feel. While the area retains its rural character, Gardnerville has steadily grown in popularity thanks to its blend of accessibility and tranquility. With proximity to Minden, Genoa, and Lake Tahoe, residents enjoy the best of both recreation and convenience.
Homebuyers are drawn to Gardnerville for its newer residential developments, good schools, and strong sense of community. Outdoor activities are a major part of daily life, from hiking and biking to fishing in the Carson River. The town’s limited land availability and slow-growth approach have helped keep inventory low, which has further supported rising home values. Even after a brief decline, the recent uptick suggests that Gardnerville’s housing market remains resilient, anchored by both lifestyle appeal and regional desirability.
7. Minden – 185% Home Price Increase Since 2012
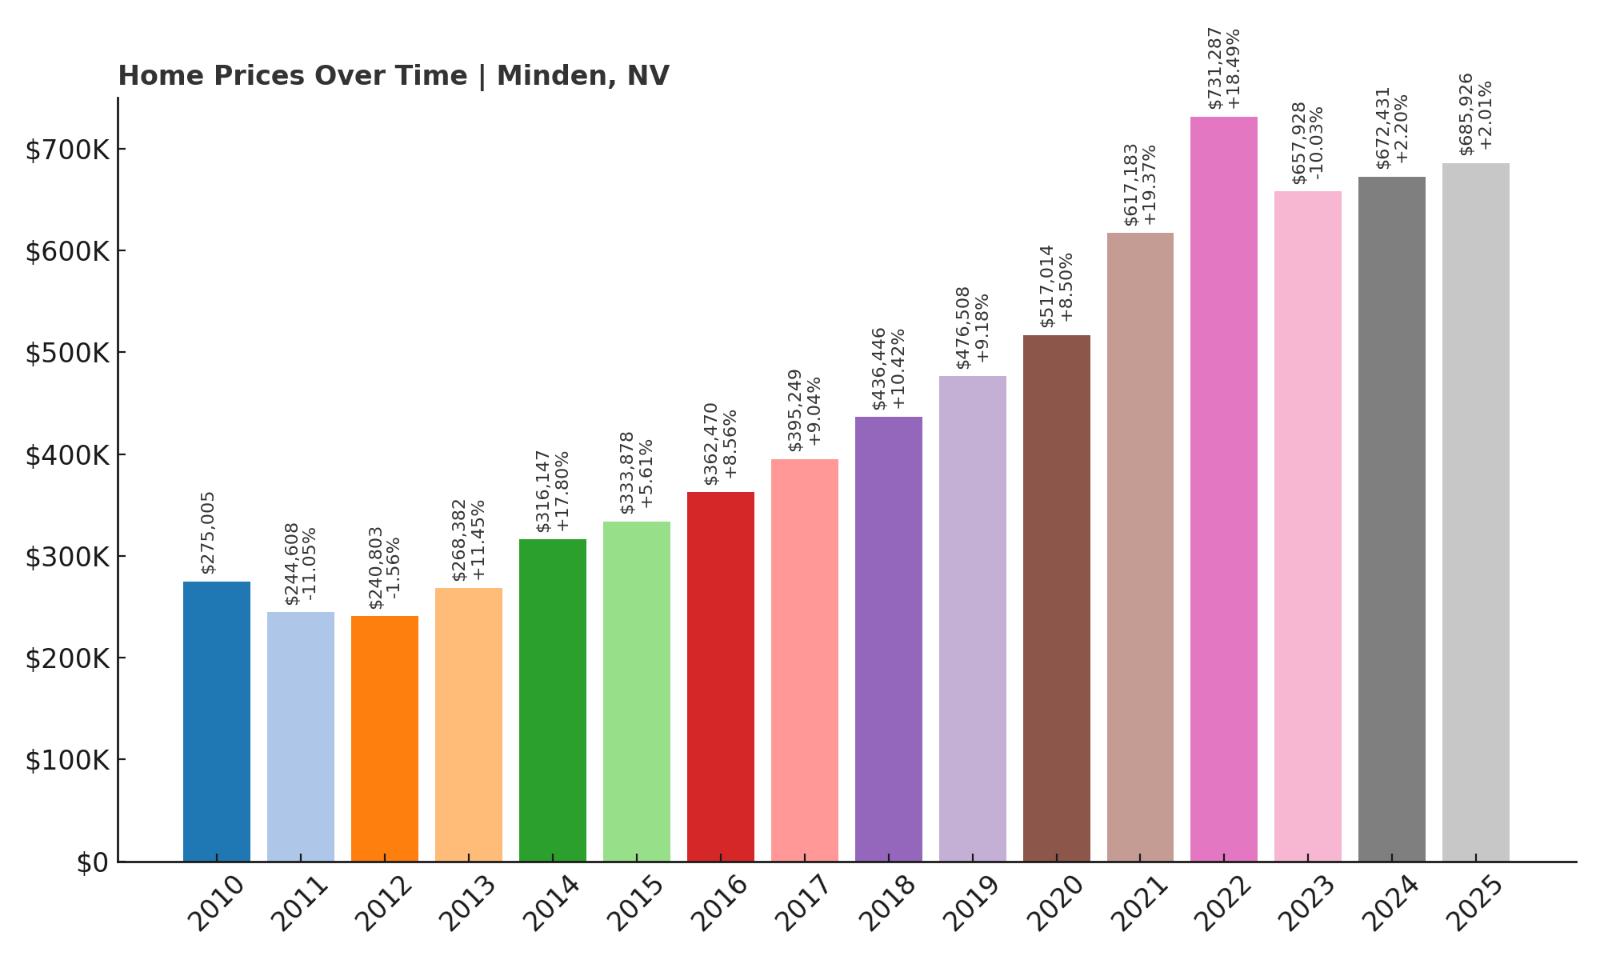
- 2010: $275,005
- 2011: $244,608 (-$30,396, -11.05% from previous year)
- 2012: $240,803 (-$3,806, -1.56% from previous year)
- 2013: $268,382 (+$27,579, +11.45% from previous year)
- 2014: $316,147 (+$47,766, +17.80% from previous year)
- 2015: $333,878 (+$17,730, +5.61% from previous year)
- 2016: $362,470 (+$28,593, +8.56% from previous year)
- 2017: $395,249 (+$32,779, +9.04% from previous year)
- 2018: $436,446 (+$41,197, +10.42% from previous year)
- 2019: $476,508 (+$40,062, +9.18% from previous year)
- 2020: $517,014 (+$40,506, +8.50% from previous year)
- 2021: $617,183 (+$100,169, +19.37% from previous year)
- 2022: $731,287 (+$114,103, +18.49% from previous year)
- 2023: $657,928 (-$73,359, -10.03% from previous year)
- 2024: $672,431 (+$14,503, +2.20% from previous year)
- 2025: $685,926 (+$13,496, +2.01% from previous year)
Minden’s housing market has grown 185% since 2012, when the typical home was valued at just over $240,000. By 2025, that figure has climbed to $685,926. The biggest price surges came in 2021 and 2022, with a combined increase of more than $214,000 in just two years. This kind of movement places Minden among Nevada’s top housing performers. While prices did correct slightly in 2023, the market began to recover again the following year. Minden’s consistent value growth is tied to its location, quality of life, and appeal to professionals and retirees looking for a slower pace outside the big cities.
Minden – Community Character and Expanding Appeal
Minden is a historic town in Douglas County, immediately adjacent to Gardnerville. Known for its charming downtown, community events, and walkable streets, Minden has become a destination for homebuyers seeking something different from suburban sprawl. It offers a high quality of life with relatively low congestion, and its architectural character — including preserved buildings and clean layouts — adds to its desirability. Access to Carson City and Lake Tahoe adds even more value, giving residents a scenic, central home base.
The town’s schools, parks, and family-friendly reputation have fueled interest among in-state movers and California transplants alike. Minden’s residential development has mostly kept up with demand, though zoning restrictions have helped maintain its small-town character. This balance has kept inventory relatively tight, which is one reason home prices have stayed high even when broader markets slowed. The town’s well-rounded appeal and strategic location suggest its housing market will remain strong for the foreseeable future.
6. Stateline – 139% Home Price Increase Since 2012

- 2010: $436,207
- 2011: $386,728 (-$49,479, -11.34% from previous year)
- 2012: $374,169 (-$12,559, -3.25% from previous year)
- 2013: $406,487 (+$32,318, +8.64% from previous year)
- 2014: $489,619 (+$83,132, +20.45% from previous year)
- 2015: $527,269 (+$37,651, +7.69% from previous year)
- 2016: $522,797 (-$4,472, -0.85% from previous year)
- 2017: $539,894 (+$17,097, +3.27% from previous year)
- 2018: $560,416 (+$20,521, +3.80% from previous year)
- 2019: $604,416 (+$44,000, +7.85% from previous year)
- 2020: $657,499 (+$53,083, +8.78% from previous year)
- 2021: $794,447 (+$136,948, +20.83% from previous year)
- 2022: $958,439 (+$163,992, +20.64% from previous year)
- 2023: $820,101 (-$138,338, -14.43% from previous year)
- 2024: $786,934 (-$33,167, -4.04% from previous year)
- 2025: $781,287 (-$5,647, -0.72% from previous year)
Stateline’s housing market climbed 139% from 2012 to 2025, despite a three-year correction that began in 2023. Prices peaked in 2022 at just under $960,000, before retreating by nearly $180,000 over the next few years. However, even with that decline, the typical home in 2025 still commands $781,287 — a figure well above its 2012 level of $374,169. The earlier growth was driven by a mix of high-income buyers, Lake Tahoe tourism appeal, and luxury development in the area. While some volatility has emerged, especially post-pandemic, the market remains fundamentally strong due to tight supply and lasting lifestyle demand.
Stateline – A Lakefront Market With Resort-Like Demand
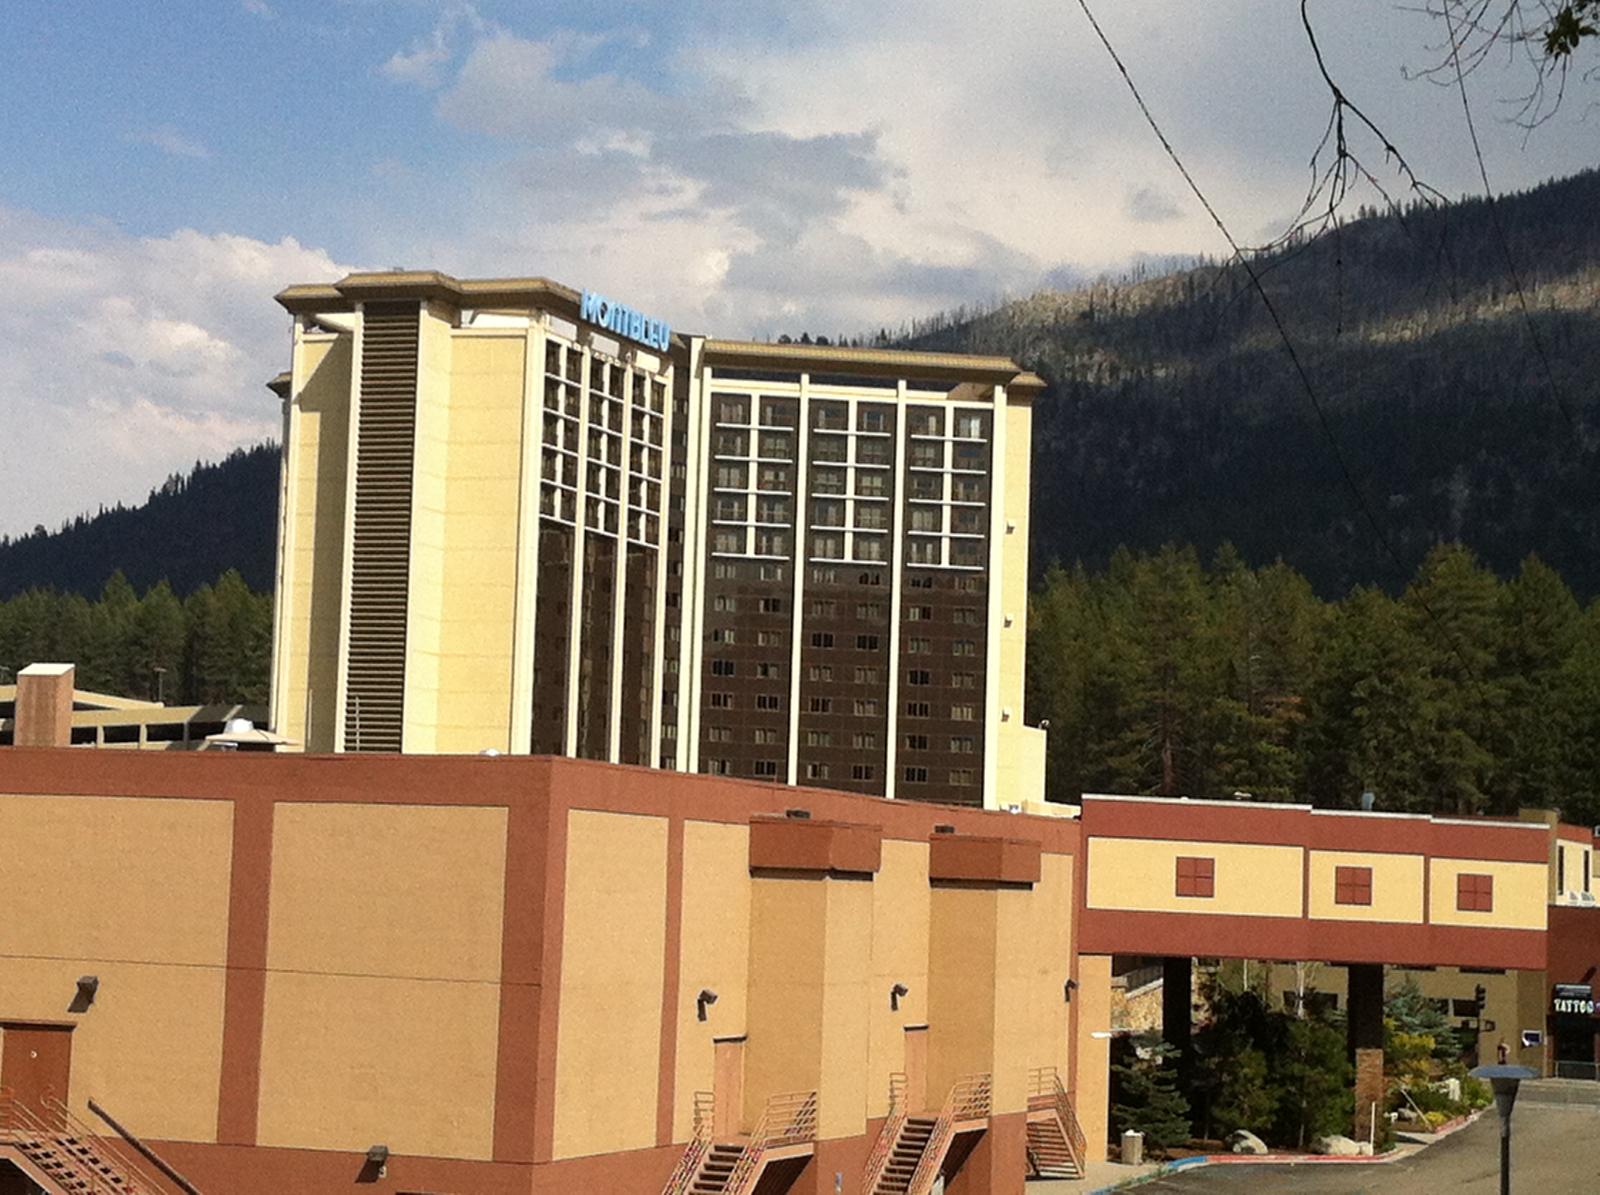
Situated right on the border of Nevada and California along the shores of Lake Tahoe, Stateline blends the natural beauty of the Sierra Nevada with the energy of a mini resort town. It’s known for casinos, ski resorts, and upscale housing tucked into wooded neighborhoods with panoramic lake views. The area attracts a steady stream of visitors and second-home buyers, especially from California, looking for tax advantages and vacation-friendly amenities.
The challenge for Stateline is inventory — the geography limits development, and zoning further restricts expansion. These constraints help explain why prices skyrocketed through 2022. Although the market cooled somewhat, demand hasn’t disappeared. Buyers remain interested in properties near the lake, and local rentals, especially short-term, continue to be strong performers. Stateline’s mix of scenery, entertainment, and limited housing make it one of the most sought-after locations on Tahoe’s eastern shore.
5. Verdi – 281% Home Price Increase Since 2012
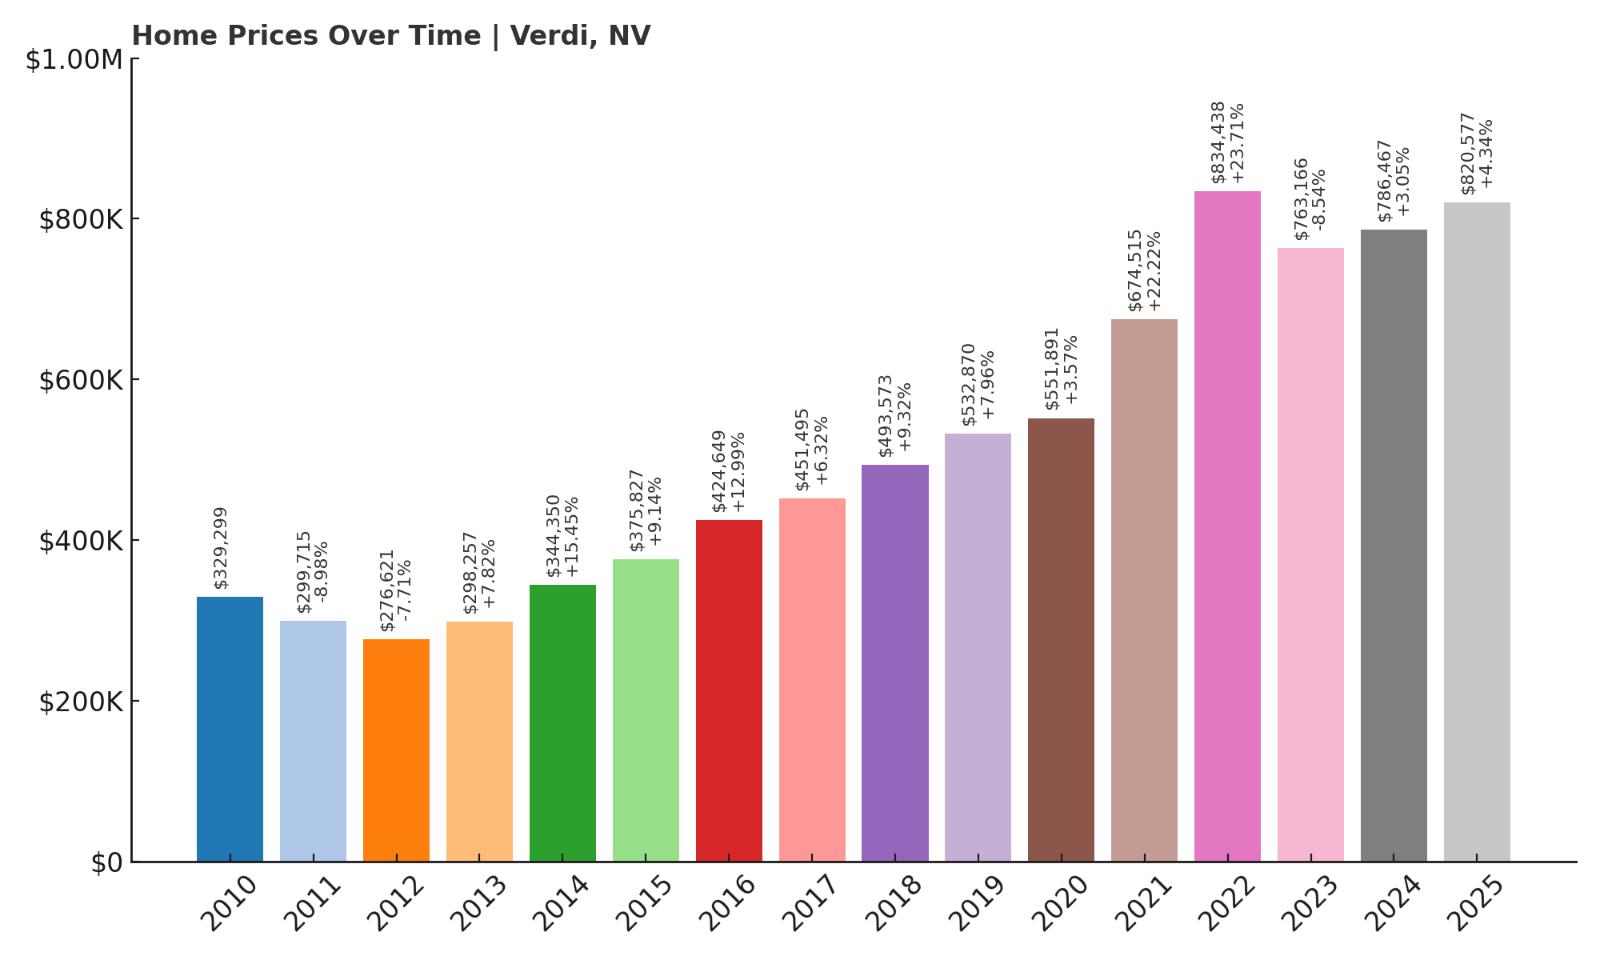
- 2010: $329,299
- 2011: $299,715 (-$29,584, -8.98% from previous year)
- 2012: $276,621 (-$23,094, -7.71% from previous year)
- 2013: $298,257 (+$21,636, +7.82% from previous year)
- 2014: $344,350 (+$46,093, +15.45% from previous year)
- 2015: $375,827 (+$31,476, +9.14% from previous year)
- 2016: $424,649 (+$48,823, +12.99% from previous year)
- 2017: $451,495 (+$26,846, +6.32% from previous year)
- 2018: $493,573 (+$42,078, +9.32% from previous year)
- 2019: $532,870 (+$39,297, +7.96% from previous year)
- 2020: $551,891 (+$19,021, +3.57% from previous year)
- 2021: $674,515 (+$122,624, +22.22% from previous year)
- 2022: $834,438 (+$159,922, +23.71% from previous year)
- 2023: $763,166 (-$71,272, -8.54% from previous year)
- 2024: $786,467 (+$23,301, +3.05% from previous year)
- 2025: $820,577 (+$34,110, +4.34% from previous year)
Verdi has emerged as a powerhouse housing market in northern Nevada, posting a 281% price increase since 2012. Back then, the typical home cost just $276,621. Now, that figure has reached $820,577 in 2025. The town’s rise was fueled by its proximity to Reno and the influx of tech-related development in nearby industrial parks. Between 2020 and 2022 alone, prices soared by more than $280,000. Although the market cooled slightly in 2023, values have bounced back in recent years. Verdi is now one of the most desirable suburban addresses in the Reno metro area.
Verdi – Where Tech Boom Meets Mountain Backdrop

Verdi sits just west of Reno near the California border and combines small-town living with access to one of the fastest-growing economic corridors in the region. It’s only minutes from the Tahoe-Reno Industrial Center and benefits from the same wave of population and job growth that’s transformed Reno and Sparks. But unlike its neighbors, Verdi offers more privacy, larger lots, and easier access to the Sierra Nevada foothills — an appealing mix for professionals and remote workers alike.
The area’s housing market is defined by high demand and limited inventory. Much of Verdi’s development has been in the form of planned communities and custom homes, which helps explain its higher price point. Interest remains strong in both new construction and resale properties. With scenic trails, good schools, and a quick drive to downtown Reno or Lake Tahoe, Verdi represents the best of what modern Nevada living has to offer — and its property values reflect that.
4. Genoa – 160% Home Price Increase Since 2012
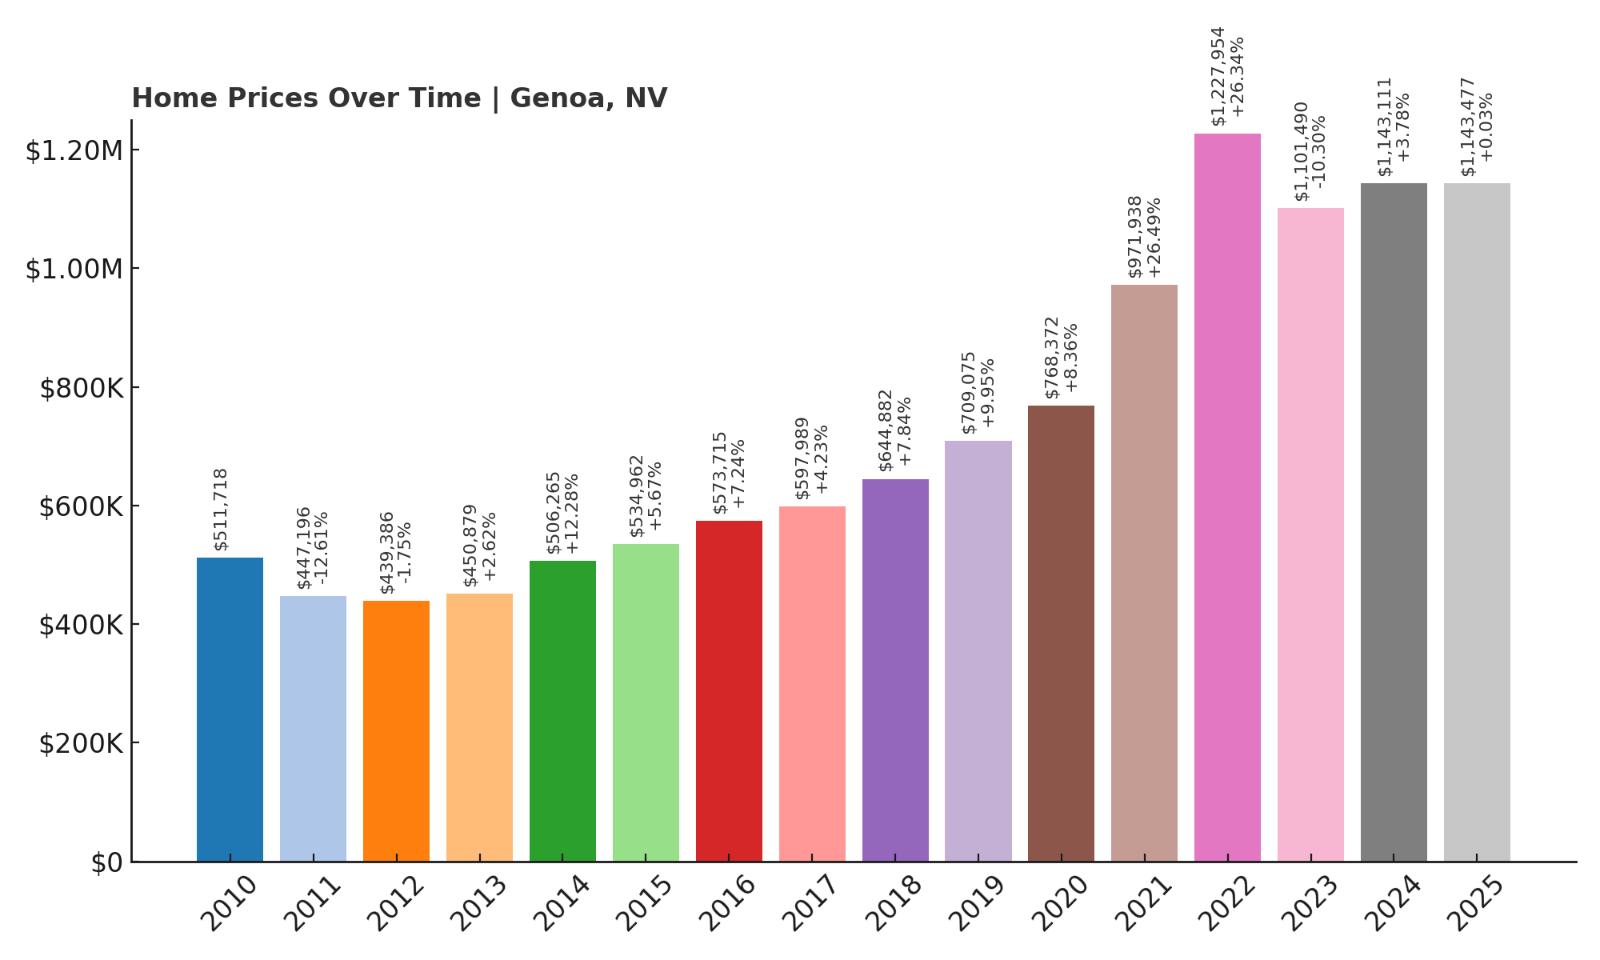
- 2010: $511,718
- 2011: $447,196 (-$64,522, -12.61% from previous year)
- 2012: $439,386 (-$7,810, -1.75% from previous year)
- 2013: $450,879 (+$11,493, +2.62% from previous year)
- 2014: $506,265 (+$55,386, +12.28% from previous year)
- 2015: $534,962 (+$28,697, +5.67% from previous year)
- 2016: $573,715 (+$38,753, +7.24% from previous year)
- 2017: $597,989 (+$24,274, +4.23% from previous year)
- 2018: $644,882 (+$46,892, +7.84% from previous year)
- 2019: $709,075 (+$64,193, +9.95% from previous year)
- 2020: $768,372 (+$59,297, +8.36% from previous year)
- 2021: $971,938 (+$203,566, +26.49% from previous year)
- 2022: $1,227,954 (+$256,017, +26.34% from previous year)
- 2023: $1,101,490 (-$126,464, -10.30% from previous year)
- 2024: $1,143,111 (+$41,621, +3.78% from previous year)
- 2025: $1,143,477 (+$366, +0.03% from previous year)
Genoa’s home prices climbed 160% between 2012 and 2025, moving from $439,386 to $1,143,477. This historic town experienced dramatic appreciation during the early 2020s, especially between 2020 and 2022 when prices skyrocketed by over $450,000. Although the market corrected slightly in 2023, values have since stabilized. As one of the most exclusive and picturesque locations in Nevada, Genoa’s market reflects both lifestyle-driven demand and scarcity of available homes. Even modest year-over-year increases now occur on a base price that exceeds $1.1 million.
Genoa – Nevada’s Oldest Town With Premium Appeal
Founded in 1851, Genoa is the oldest permanent settlement in Nevada and retains a classic charm that’s become increasingly rare in the state. Nestled in the Carson Valley at the foot of the Sierra Nevada, it boasts tree-lined streets, historic architecture, and panoramic views. Its peaceful ambiance, boutique shops, and seasonal festivals attract both tourists and long-term residents. Homes here are often custom or semi-custom, and most are situated on larger lots.
Because of Genoa’s historic status and zoning constraints, new housing supply is extremely limited. That exclusivity has helped drive prices ever higher. Its close proximity to Lake Tahoe and Carson City further boosts its appeal. Genoa remains a favorite among retirees, remote professionals, and second-home buyers seeking both privacy and sophistication. Though annual price increases have slowed, demand continues to outpace supply — making it one of the most stable high-end markets in the state.
3. Zephyr Cove – 178% Home Price Increase Since 2012

- 2010: $561,477
- 2011: $506,272 (-$55,205, -9.83% from previous year)
- 2012: $492,664 (-$13,608, -2.69% from previous year)
- 2013: $502,404 (+$9,739, +1.98% from previous year)
- 2014: $606,130 (+$103,727, +20.65% from previous year)
- 2015: $654,361 (+$48,231, +7.96% from previous year)
- 2016: $653,179 (-$1,182, -0.18% from previous year)
- 2017: $722,903 (+$69,724, +10.67% from previous year)
- 2018: $804,307 (+$81,404, +11.26% from previous year)
- 2019: $879,929 (+$75,622, +9.40% from previous year)
- 2020: $929,270 (+$49,341, +5.61% from previous year)
- 2021: $1,226,144 (+$296,874, +31.95% from previous year)
- 2022: $1,520,960 (+$294,816, +24.04% from previous year)
- 2023: $1,357,270 (-$163,690, -10.76% from previous year)
- 2024: $1,366,622 (+$9,351, +0.69% from previous year)
- 2025: $1,368,931 (+$2,309, +0.17% from previous year)
Zephyr Cove’s home prices have surged by 178% since 2012, with values rising from $492,664 to $1,368,931 in just over a decade. The growth here has been dramatic, particularly between 2020 and 2022, when prices jumped by nearly $600,000 in just two years. While the town experienced a notable price correction in 2023 — down by over $160,000 — the market has since found a new equilibrium, with mild positive gains in the following years. Zephyr Cove’s exceptional location on the southeastern shore of Lake Tahoe has long made it one of the most desirable places to live in Nevada. Despite its recent plateau, prices remain sky-high by state and national standards, a reflection of the town’s luxury appeal and lack of available inventory.
Zephyr Cove – Prestigious Living Along the Tahoe Shoreline
Zephyr Cove is a premier residential enclave known for its lakefront homes, towering pines, and sweeping views of Lake Tahoe’s deep-blue waters. Positioned along Highway 50 just minutes from the California border, this unincorporated community offers a rare combination of mountain seclusion and luxury lifestyle. Properties here are often multimillion-dollar custom homes, many with direct lake access or panoramic vistas. The shoreline itself is lined with private beaches, boat docks, and exclusive neighborhoods that are highly sought after by high-income buyers from across the country.
The limited number of available properties — due in large part to strict building regulations and geographic constraints — has contributed to consistently high demand. Many homes in Zephyr Cove are second residences or vacation rentals, and the town’s real estate market reflects both lifestyle and investment value. Its proximity to skiing at Heavenly, dining in South Lake Tahoe, and the casinos of Stateline make it a hub for year-round recreation and entertainment. Even as prices level off post-peak, the underlying fundamentals remain strong. Zephyr Cove will likely remain one of the priciest and most exclusive corners of Nevada real estate for the foreseeable future.
2. Incline Village – 182% Home Price Increase Since 2012
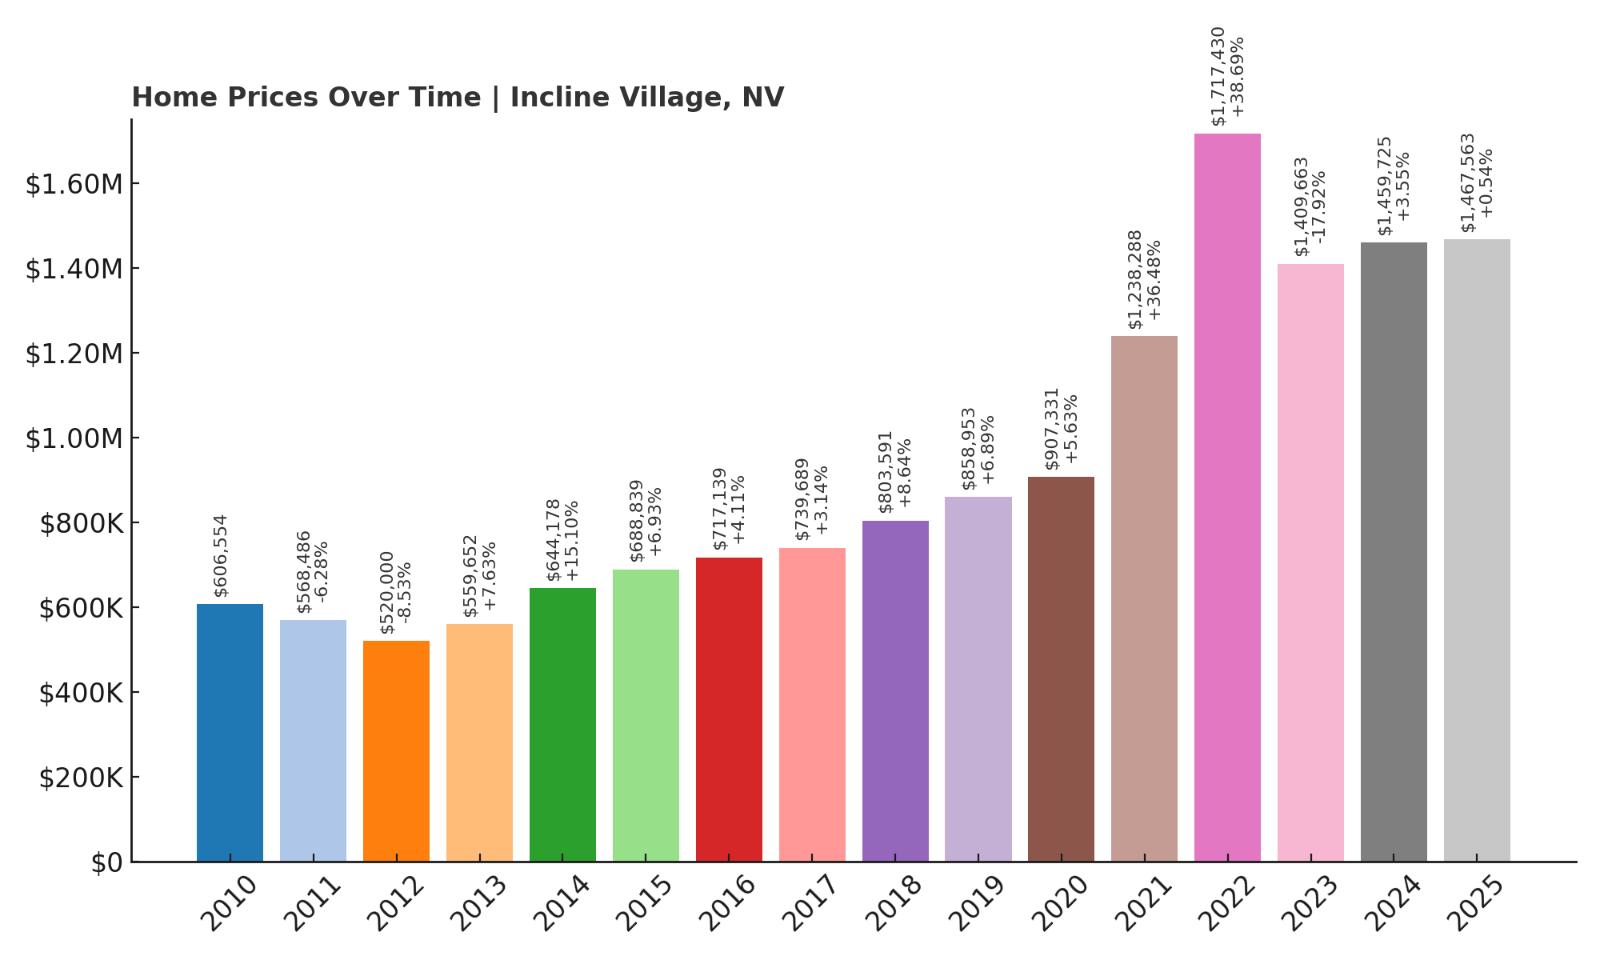
- 2010: $606,554
- 2011: $568,486 (-$38,068, -6.28% from previous year)
- 2012: $520,000 (-$48,486, -8.53% from previous year)
- 2013: $559,652 (+$39,652, +7.63% from previous year)
- 2014: $644,178 (+$84,526, +15.10% from previous year)
- 2015: $688,839 (+$44,661, +6.93% from previous year)
- 2016: $717,139 (+$28,300, +4.11% from previous year)
- 2017: $739,689 (+$22,551, +3.14% from previous year)
- 2018: $803,591 (+$63,902, +8.64% from previous year)
- 2019: $858,953 (+$55,362, +6.89% from previous year)
- 2020: $907,331 (+$48,379, +5.63% from previous year)
- 2021: $1,238,288 (+$330,957, +36.48% from previous year)
- 2022: $1,717,430 (+$479,142, +38.69% from previous year)
- 2023: $1,409,663 (-$307,767, -17.92% from previous year)
- 2024: $1,459,725 (+$50,061, +3.55% from previous year)
- 2025: $1,467,563 (+$7,838, +0.54% from previous year)
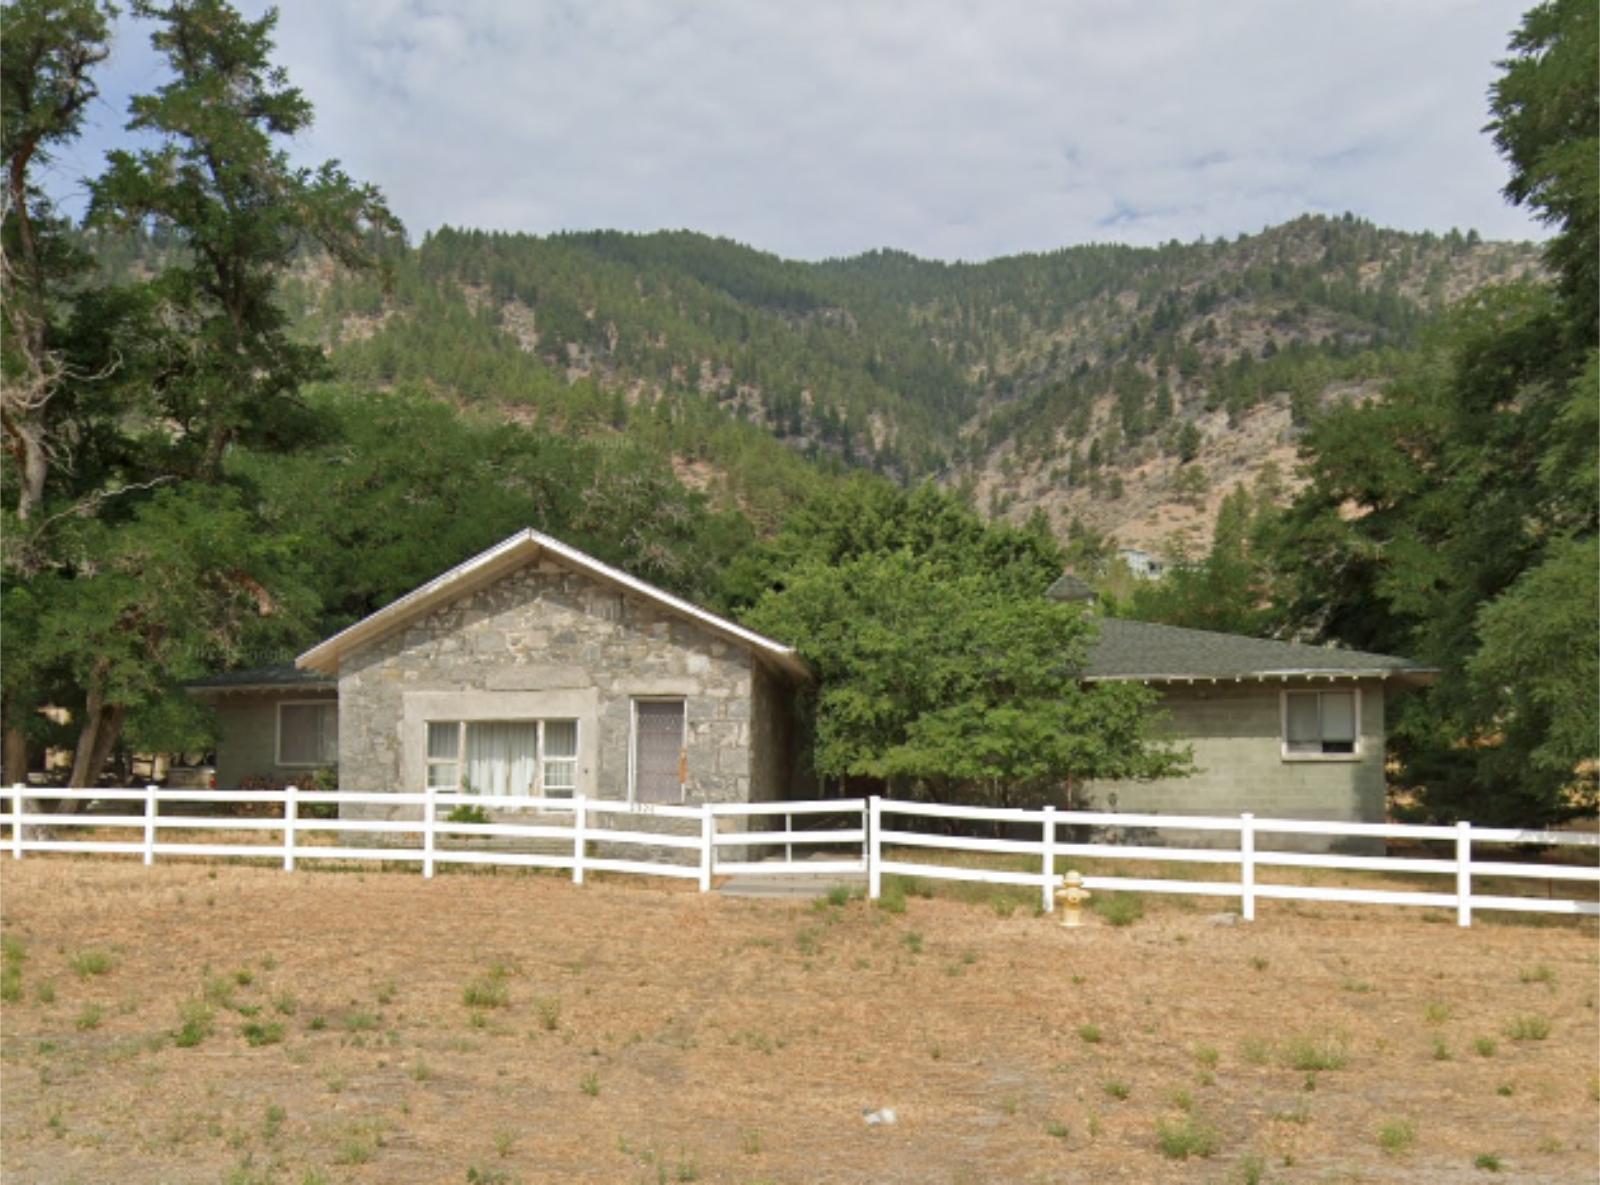
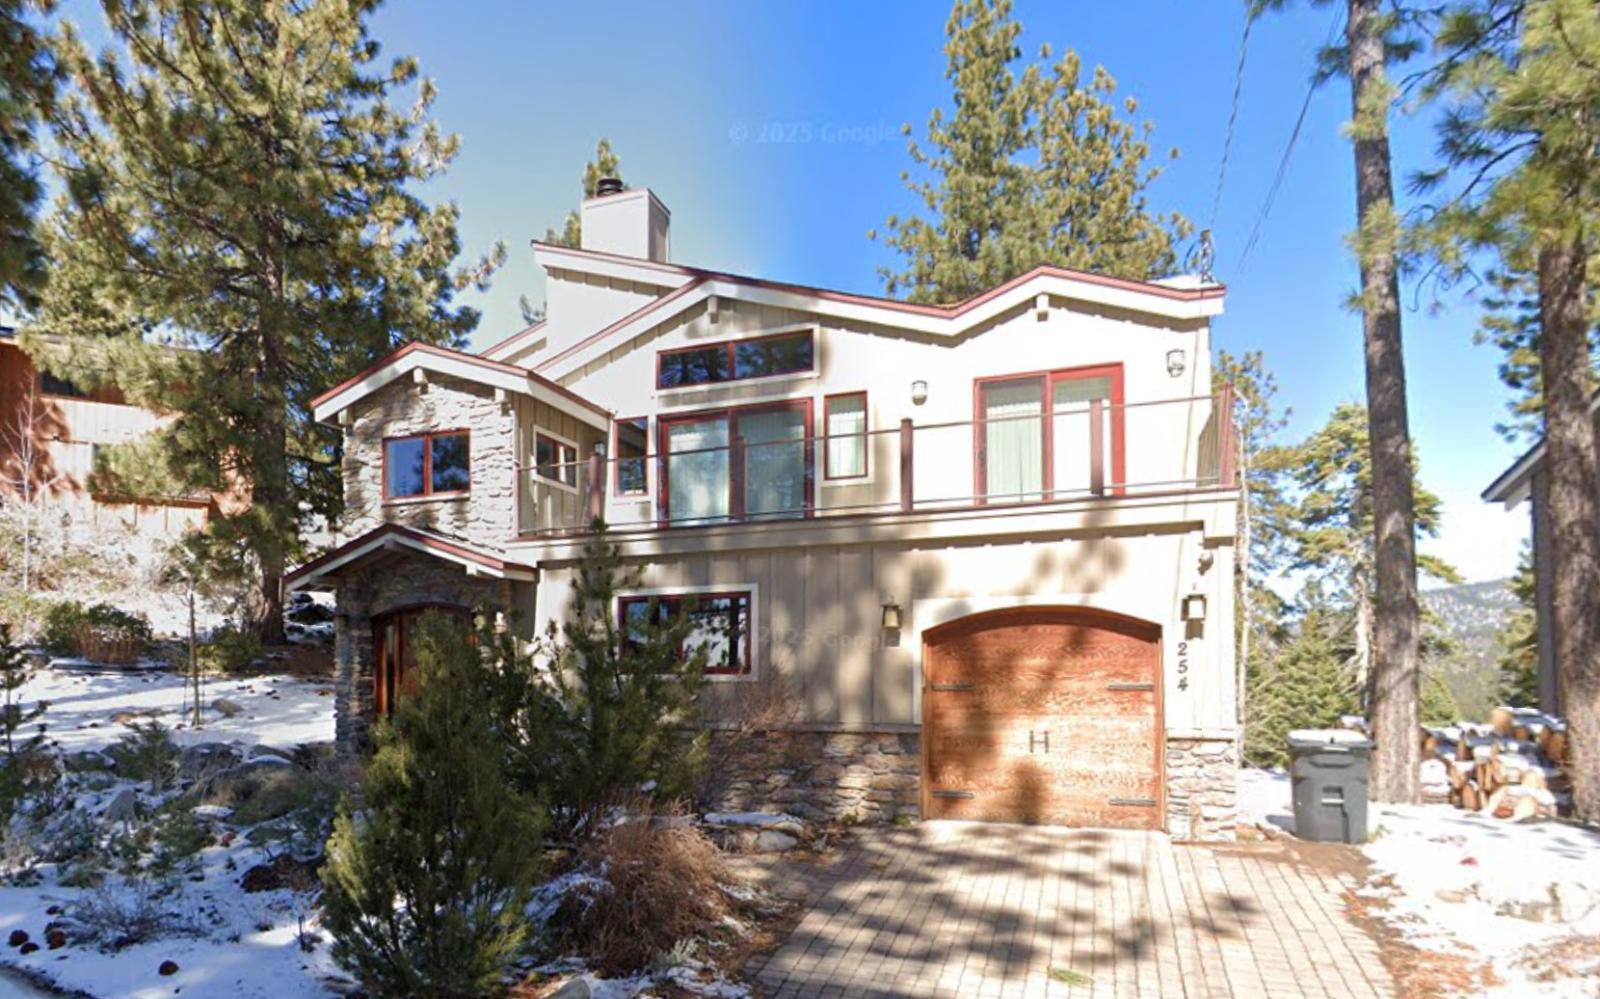
Incline Village has seen home values climb from $520,000 in 2012 to a staggering $1,467,563 in 2025 — a gain of over 182%. Once a relatively quiet Lake Tahoe outpost, the area has become one of the most coveted luxury markets in the western U.S. Between 2020 and 2022 alone, prices jumped by nearly $800,000, spurred by remote work trends, investor interest, and an influx of buyers seeking tax advantages. Although 2023 brought a steep correction, the years since have seen modest stabilization. Even at a plateau, Incline Village remains one of the most expensive and exclusive communities in the entire state.
Incline Village – Nevada’s Luxury Flagship at Lake Tahoe
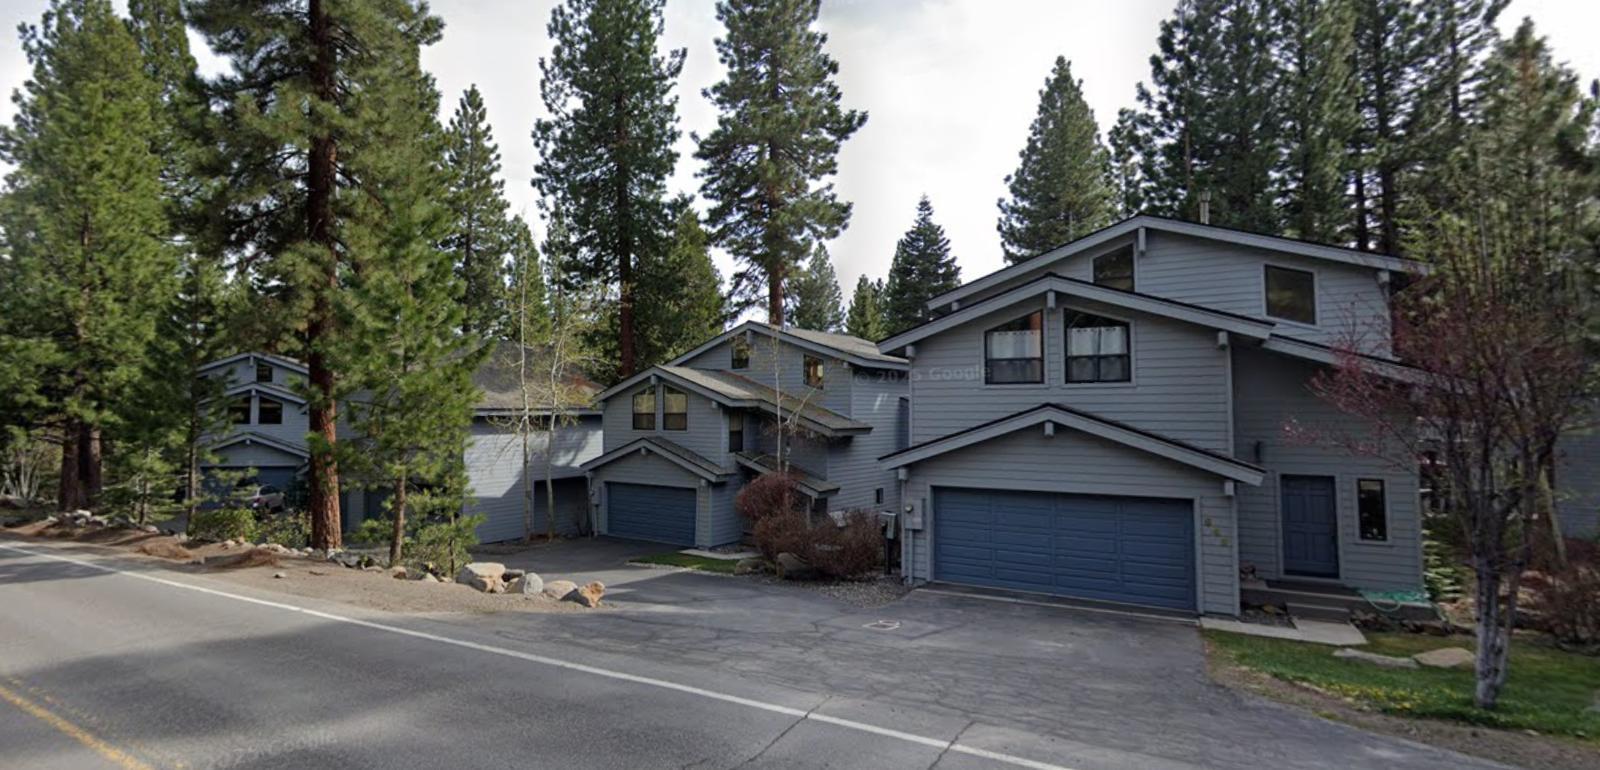
Incline Village sits along the north shore of Lake Tahoe and is widely considered Nevada’s most prestigious residential destination. The town boasts world-class amenities including private beaches, championship golf courses, ski resorts, and gated neighborhoods that attract executives, retirees, and high-net-worth individuals. Many homes are designed for entertaining, complete with lake views, custom architecture, and high-end finishes. Properties rarely stay on the market for long, and bidding wars were common during the 2020–2022 boom.
Aside from its breathtaking views and high-end housing, Incline Village offers a financial incentive: Nevada’s tax structure. The absence of a state income tax has lured wealthy residents away from neighboring California. With extremely limited space for new construction and strict environmental regulations protecting the lake, future development is capped, which supports long-term price appreciation. Even with recent cooling, Incline’s housing market remains among the most robust in the state, if not the entire Mountain West region.
1. Glenbrook – 159% Home Price Increase Since 2012
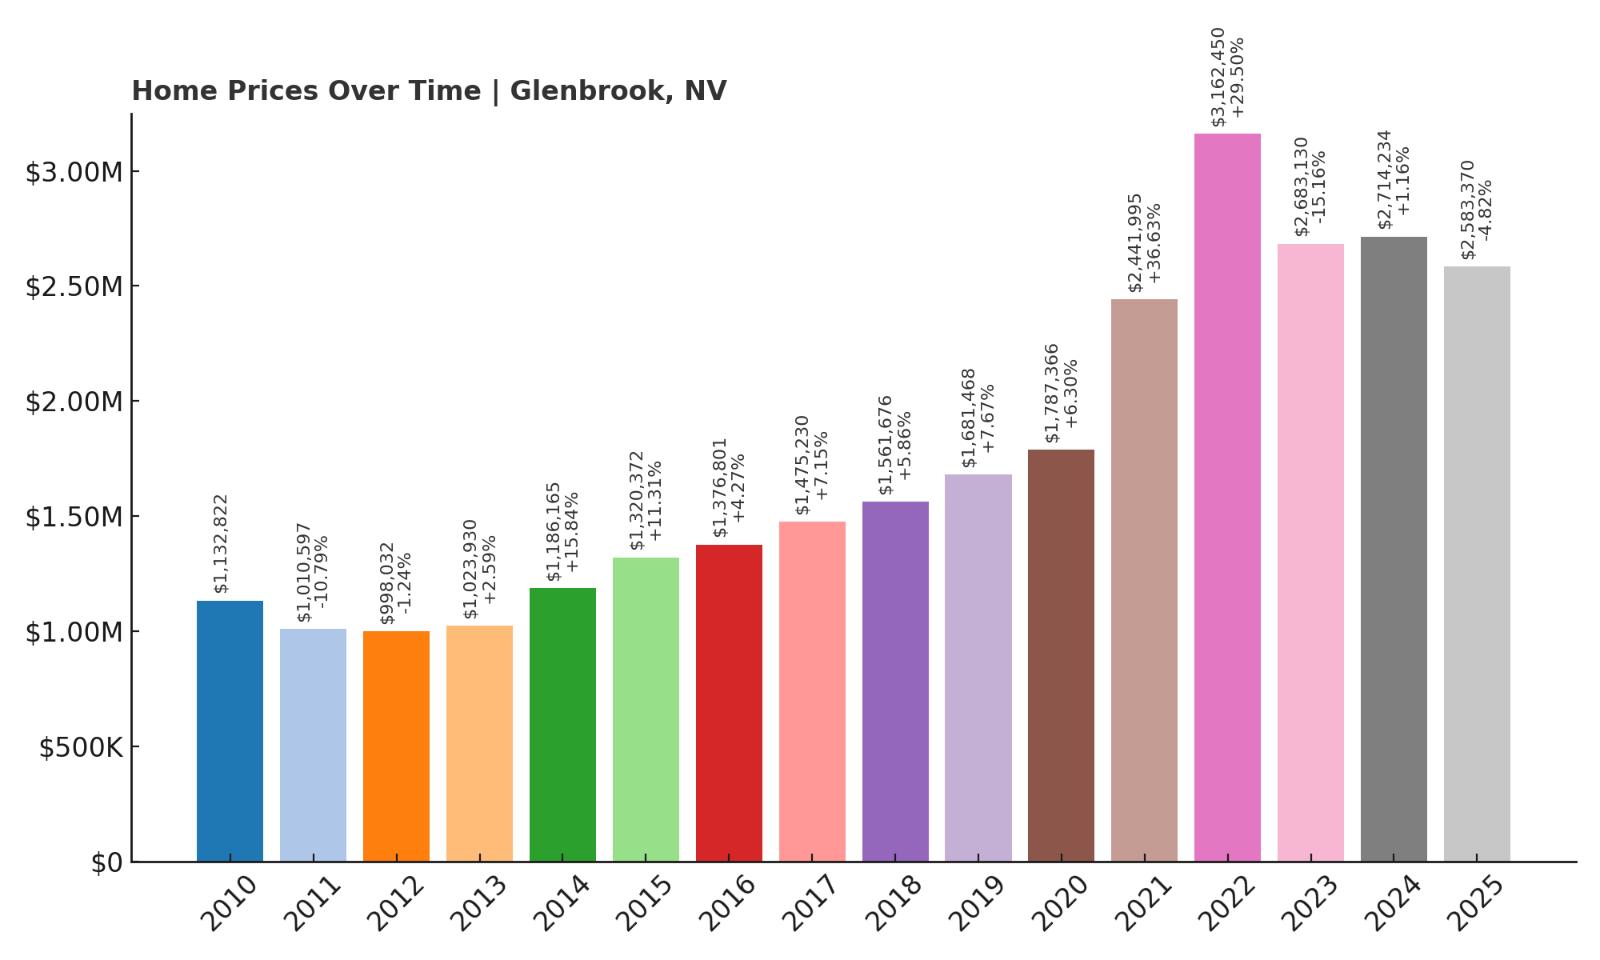
- 2010: $1,132,822
- 2011: $1,010,597 (-$122,225, -10.79% from previous year)
- 2012: $998,032 (-$12,566, -1.24% from previous year)
- 2013: $1,023,930 (+$25,898, +2.59% from previous year)
- 2014: $1,186,165 (+$162,235, +15.84% from previous year)
- 2015: $1,320,372 (+$134,208, +11.31% from previous year)
- 2016: $1,376,801 (+$56,429, +4.27% from previous year)
- 2017: $1,475,230 (+$98,429, +7.15% from previous year)
- 2018: $1,561,676 (+$86,446, +5.86% from previous year)
- 2019: $1,681,468 (+$119,792, +7.67% from previous year)
- 2020: $1,787,366 (+$105,898, +6.30% from previous year)
- 2021: $2,441,995 (+$654,629, +36.63% from previous year)
- 2022: $3,162,450 (+$720,455, +29.50% from previous year)
- 2023: $2,683,130 (-$479,320, -15.16% from previous year)
- 2024: $2,714,234 (+$31,104, +1.16% from previous year)
- 2025: $2,583,370 (-$130,864, -4.82% from previous year)
Glenbrook holds the top spot in Nevada’s housing market with an average home value of $2,583,370 in 2025 — a 159% increase since 2012. The area experienced explosive price growth during the early 2020s, gaining over $1.3 million between 2020 and 2022 alone. While prices have declined slightly in the past two years, they remain astronomically high, cementing Glenbrook as Nevada’s most exclusive and expensive residential area. The luxury market here is highly niche, driven by buyers with ultra-high net worth who seek seclusion, security, and access to Lake Tahoe’s most prestigious shoreline.
Glenbrook – The Pinnacle of Privacy and Prestige in Nevada
Glenbrook is a gated community perched on the eastern shore of Lake Tahoe, offering unmatched luxury, limited access, and multimillion-dollar estates. This elite enclave is home to some of the wealthiest individuals in the state — and the country — many of whom own second or third homes here. Properties in Glenbrook are rarely listed publicly and often sell privately. The community includes private roads, its own golf course, and exclusive lake access, reinforcing its identity as one of the most secure and private communities on Tahoe’s shoreline.
Because of Glenbrook’s exclusivity and tight zoning regulations, the real estate market here is not subject to the same fluctuations seen elsewhere. Inventory is perpetually low, and homes that do come available are often custom-built with extraordinary amenities. While recent market cooling has nudged prices down slightly, demand remains strong among elite buyers who value Glenbrook for its location, discretion, and lifestyle. This town’s stratospheric prices reflect not just the properties themselves, but the rarefied world they represent.


