🔥 Would you like to save this?
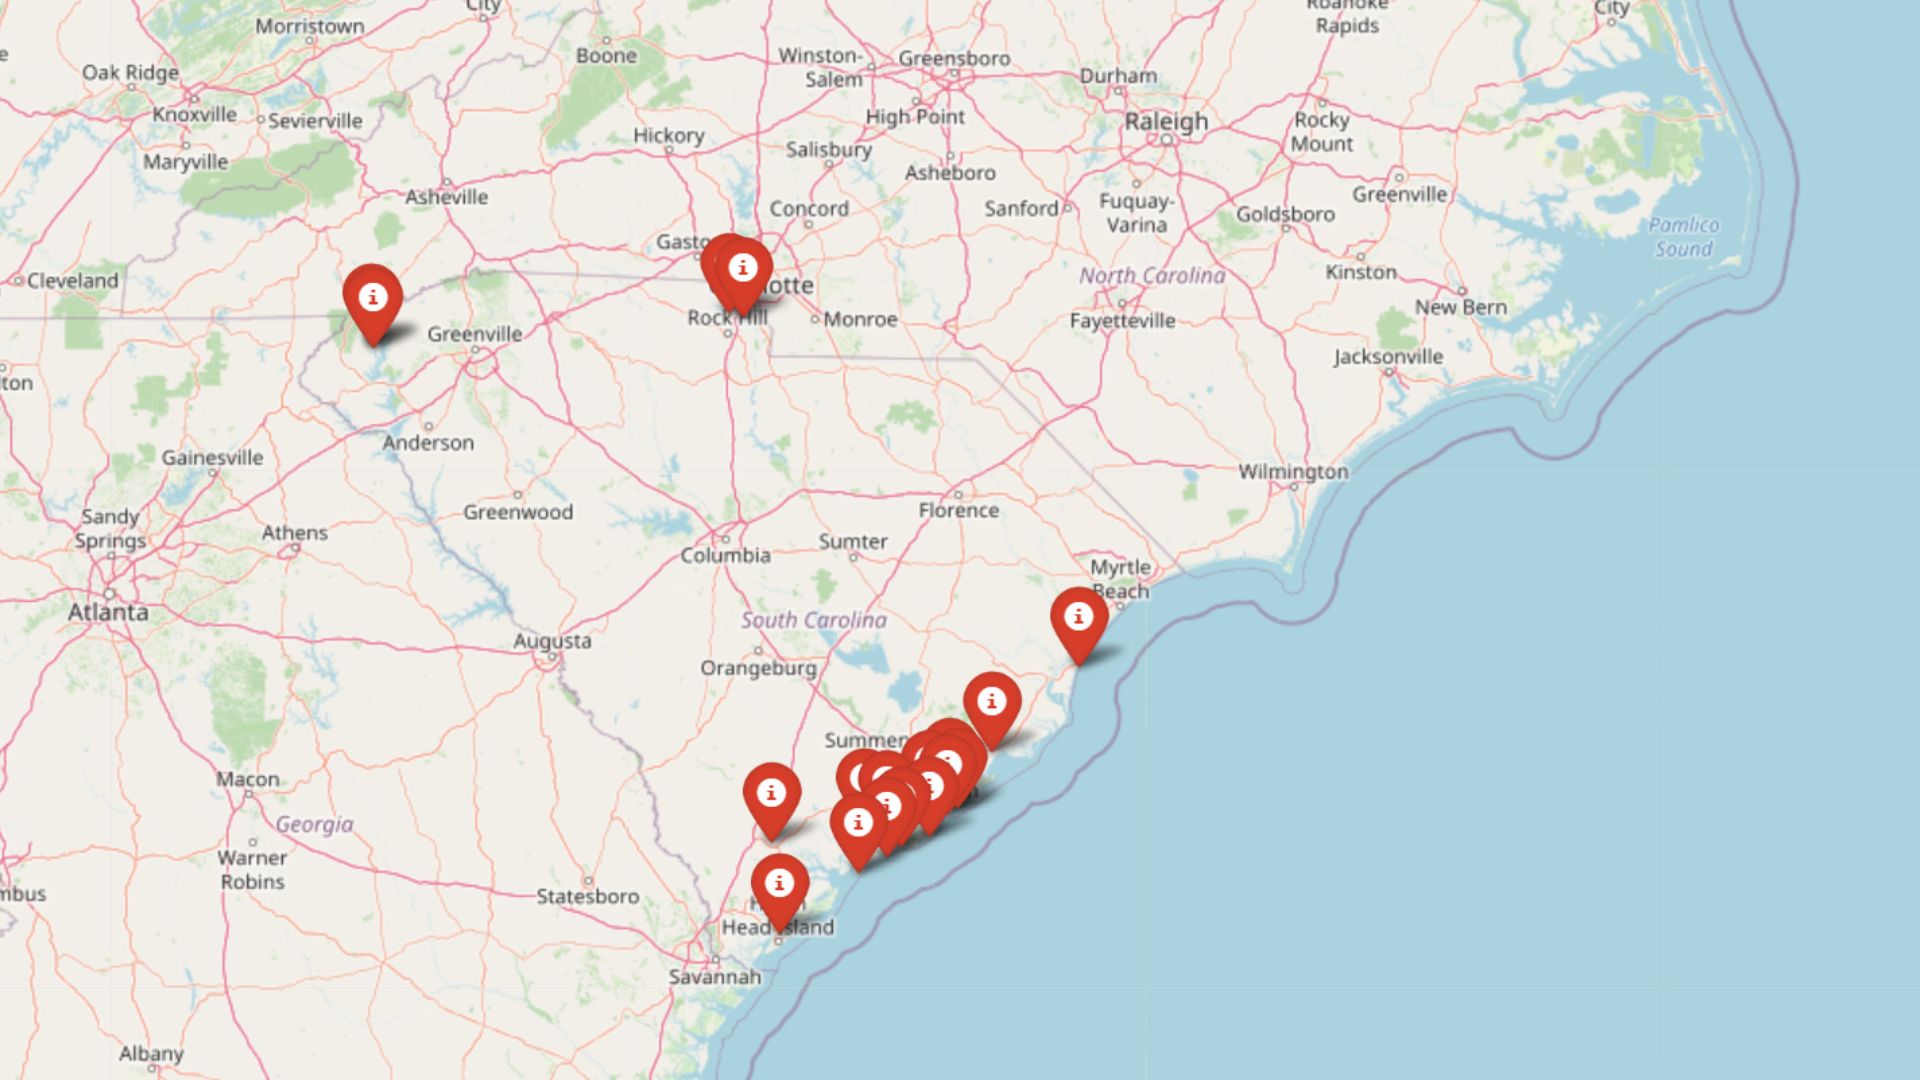
South Carolina’s most expensive towns in 2025 span private island enclaves, booming lakeside communities, and historic suburbs where home prices have climbed steeply. Using the latest data from the Zillow Home Value Index, this list highlights the state’s top-tier housing markets—places where buyers are paying a premium for location, lifestyle, and exclusivity. From the coast to the upstate, these towns are shaping the future of luxury real estate in the Palmetto State.
18. Salem – 108% Home Price Increase Since 2011
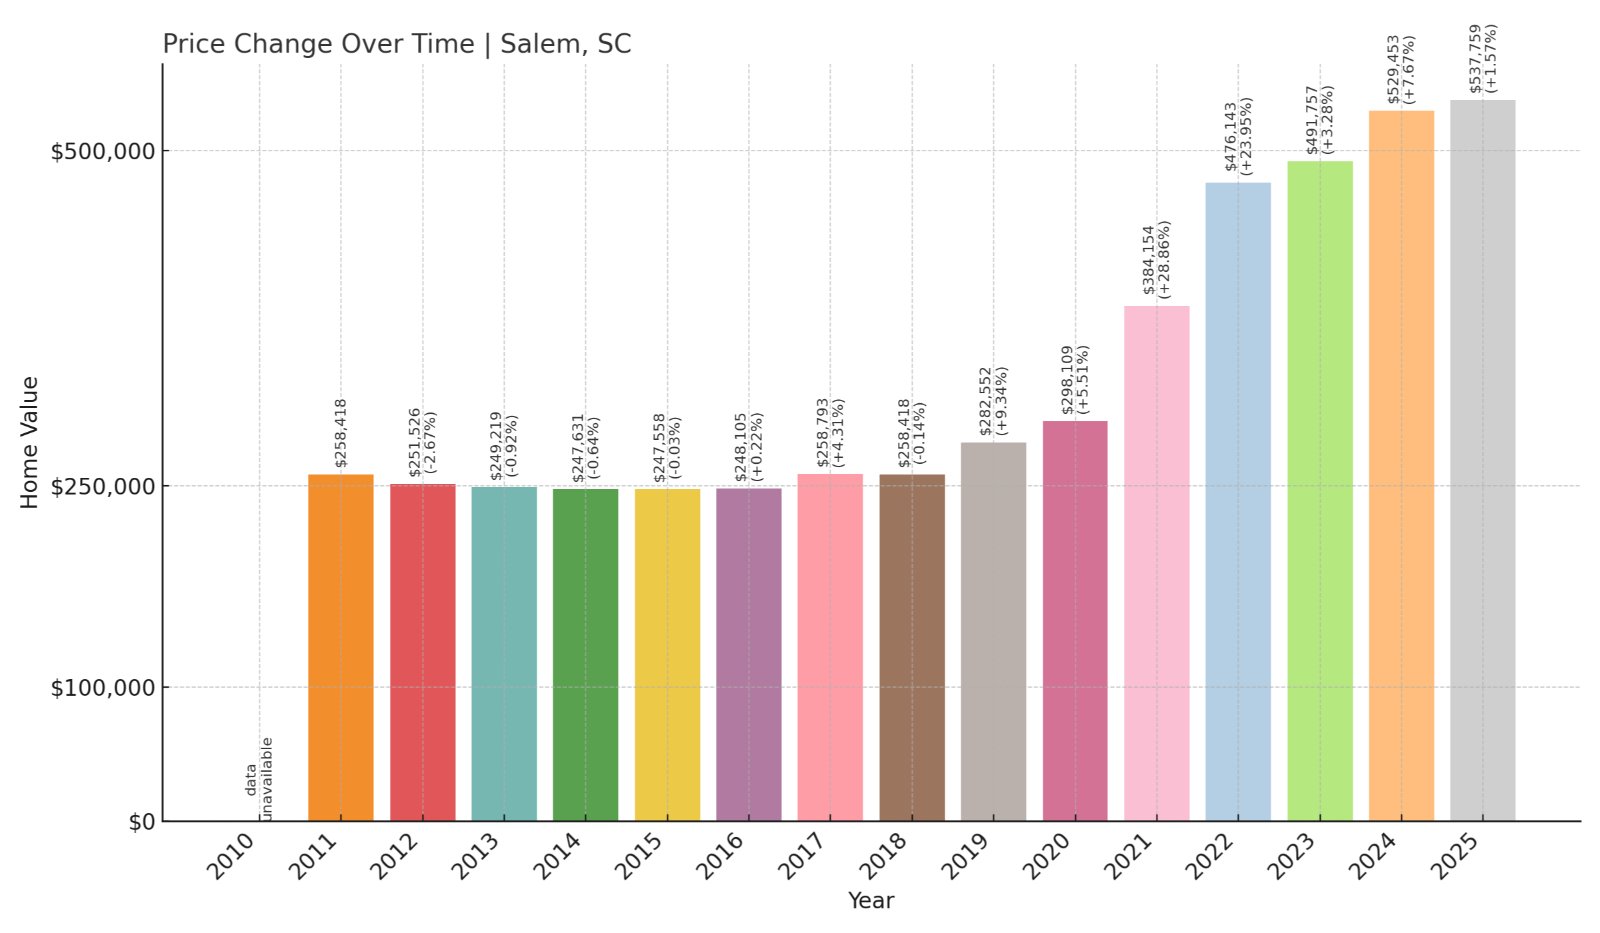
- 2011: $258,418
- 2012: $251,526 (-$6,892, -2.67% from previous year)
- 2013: $249,219 (-$2,307, -0.92% from previous year)
- 2014: $247,631 (-$1,588, -0.64% from previous year)
- 2015: $247,558 (-$73, -0.03% from previous year)
- 2016: $248,105 (+$547, +0.22% from previous year)
- 2017: $258,793 (+$10,688, +4.31% from previous year)
- 2018: $258,418 (-$376, -0.15% from previous year)
- 2019: $282,552 (+$24,134, +9.34% from previous year)
- 2020: $298,109 (+$15,557, +5.51% from previous year)
- 2021: $384,154 (+$86,046, +28.86% from previous year)
- 2022: $476,143 (+$91,988, +23.95% from previous year)
- 2023: $491,757 (+$15,614, +3.28% from previous year)
- 2024: $529,453 (+$37,696, +7.67% from previous year)
- 2025: $537,759 (+$8,307, +1.57% from previous year)
Salem has seen a dramatic 108% increase in home values since 2011, fueled by consistent demand and several years of rapid appreciation—especially between 2020 and 2022. While growth has slowed slightly in the last two years, the town remains firmly on the map as one of South Carolina’s most desirable upscale rural destinations.
In order to come up with the very specific design ideas, we create most designs with the assistance of state-of-the-art AI interior design software. Also, assume links that take you off the site are affiliate links such as links to Amazon. this means we may earn a commission if you buy something.
Salem – Lakeside Serenity with Soaring Value
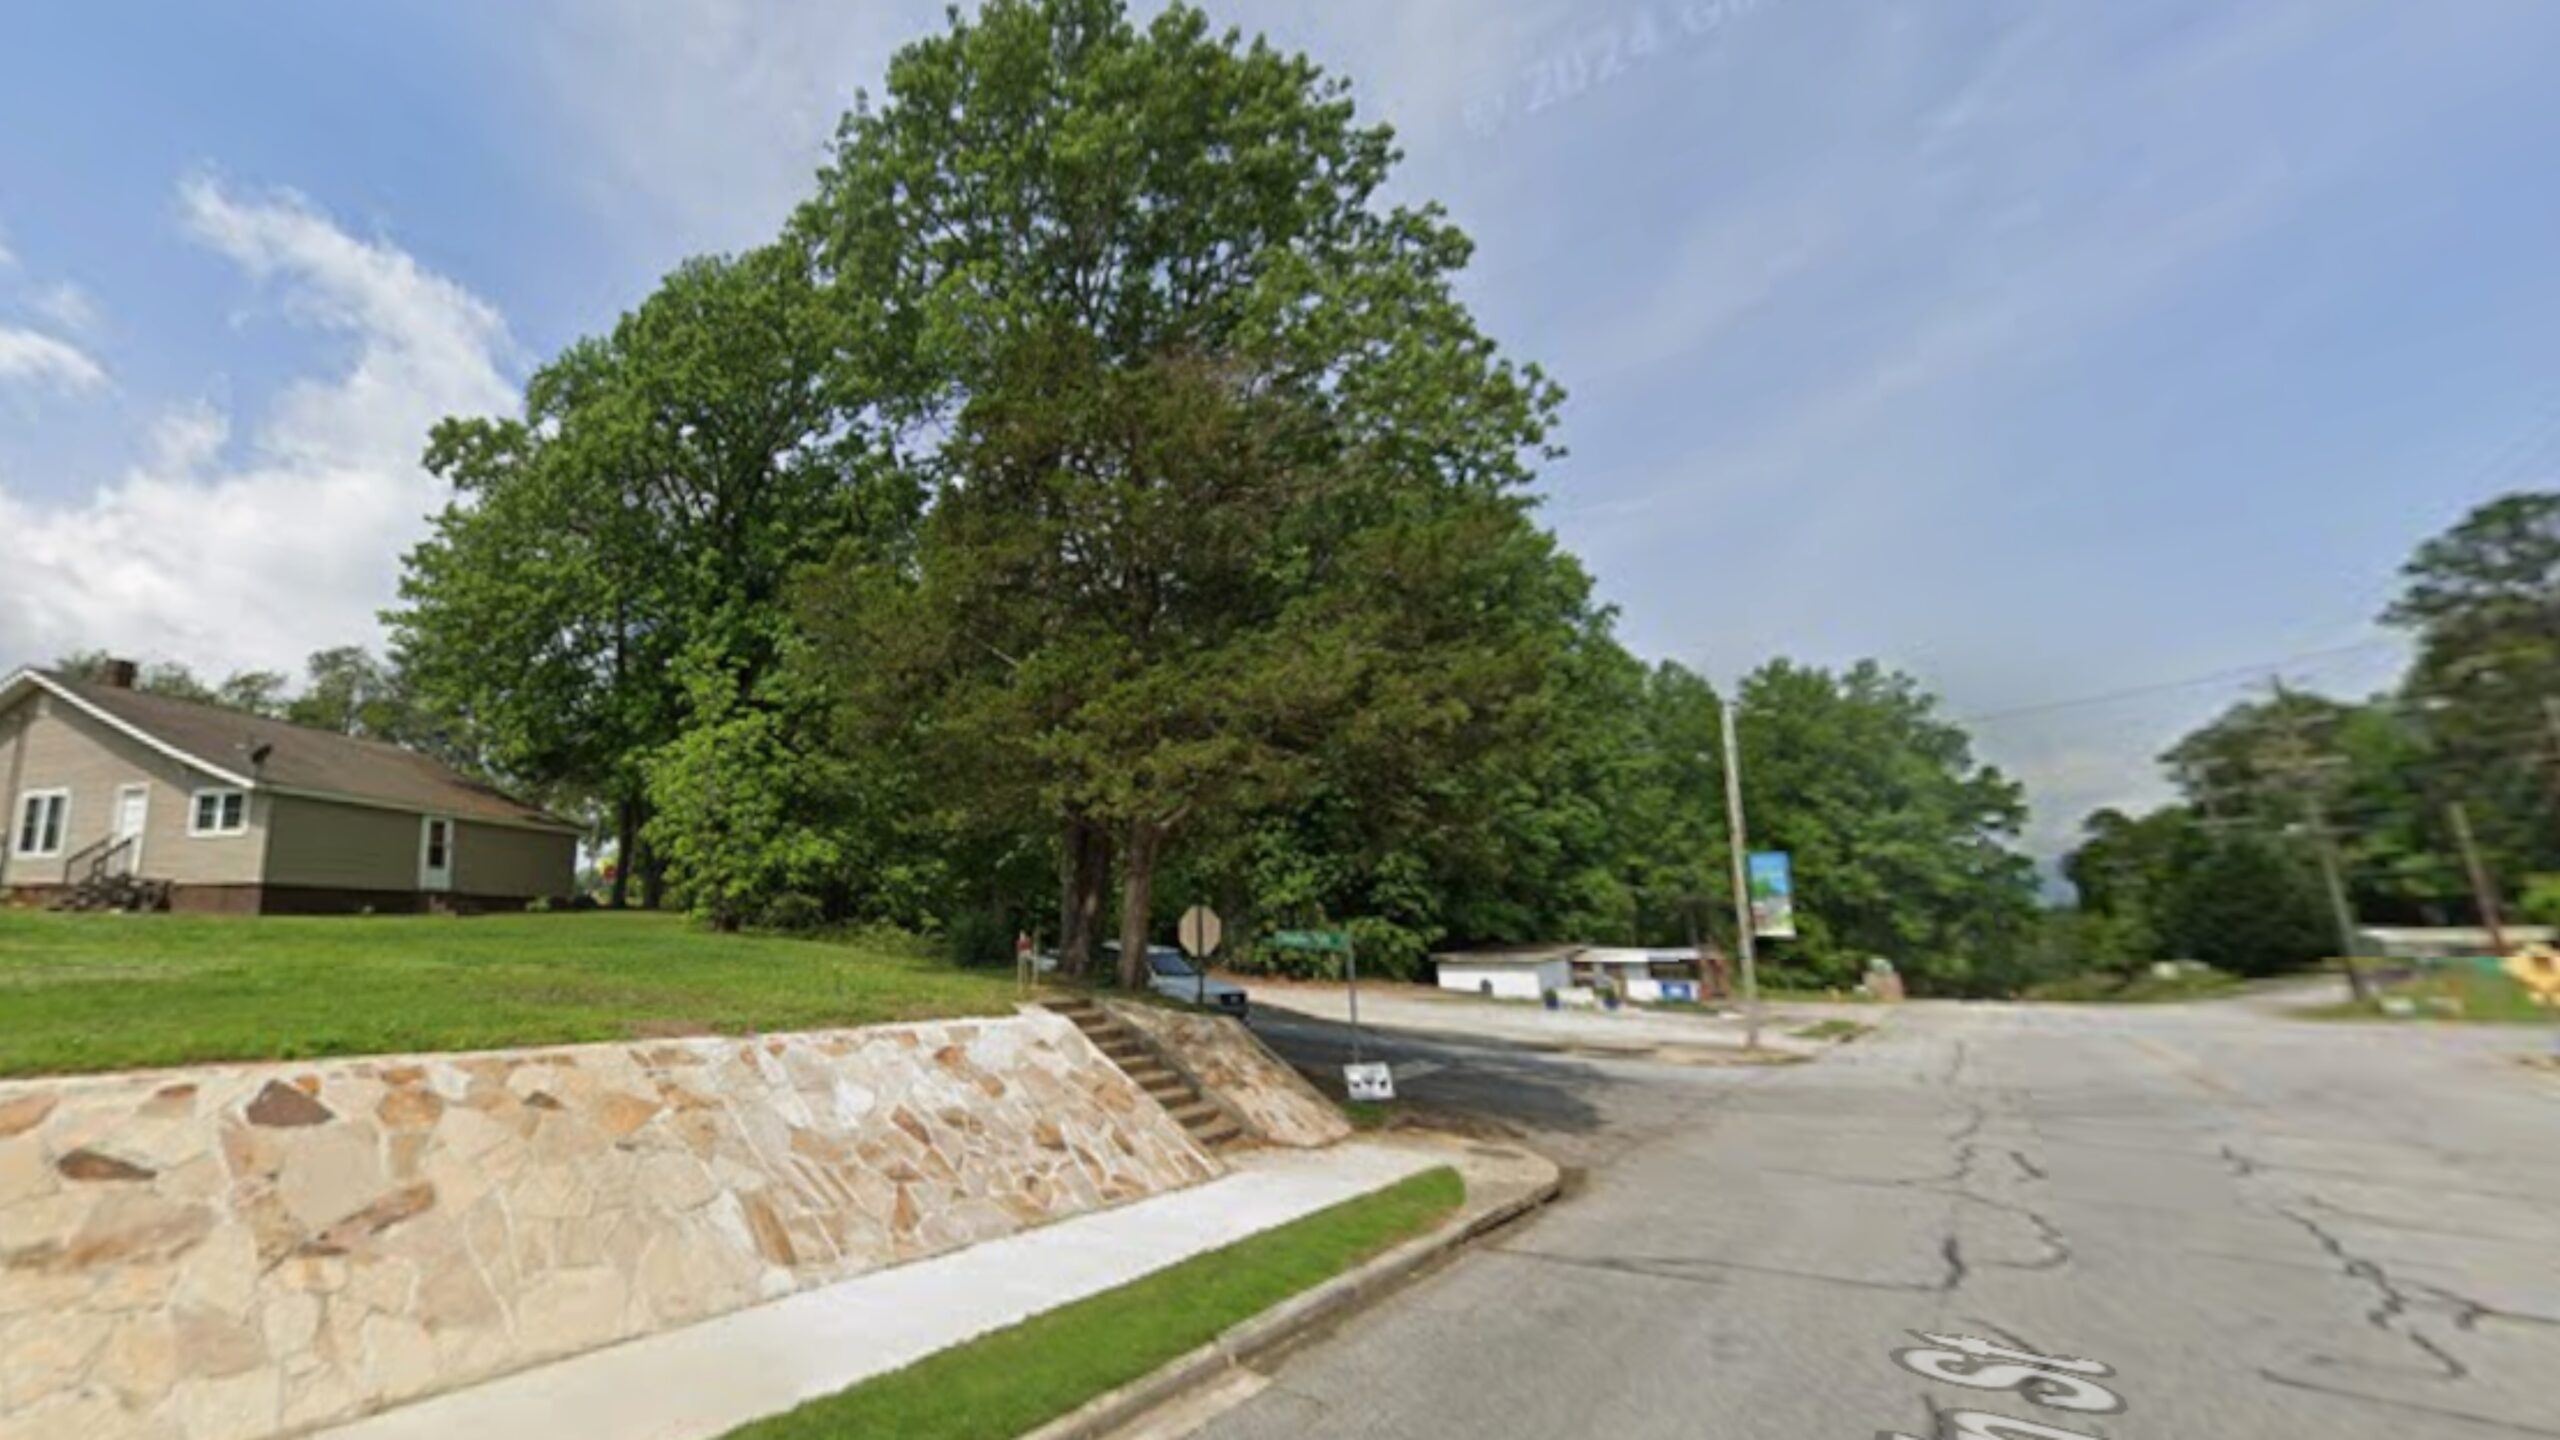
Salem is tucked along the northern edge of Lake Keowee in Oconee County, known for its peaceful environment and dramatic mountain-lake scenery. With Clemson just a short drive away, the town draws a mix of retirees and second-home buyers seeking quietude without sacrificing proximity to culture and services.
As one of the smaller and less commercialized towns on this list, Salem’s appeal lies in its combination of natural beauty, low population density, and luxury lakeside developments. Home values have steadily risen thanks to a limited housing supply and continued demand for private, high-end waterfront property.
17. Fort Mill – 125% Home Price Increase Since 2010

- 2010: $238,518
- 2011: $227,786 (-$10,732, -4.50% from previous year)
- 2012: $226,609 (-$1,177, -0.52% from previous year)
- 2013: $242,539 (+$15,930, +7.03% from previous year)
- 2014: $264,277 (+$21,738, +8.96% from previous year)
- 2015: $278,300 (+$14,023, +5.31% from previous year)
- 2016: $297,298 (+$18,997, +6.83% from previous year)
- 2017: $308,252 (+$10,955, +3.68% from previous year)
- 2018: $320,673 (+$12,420, +4.03% from previous year)
- 2019: $327,856 (+$7,184, +2.24% from previous year)
- 2020: $338,491 (+$10,634, +3.24% from previous year)
- 2021: $388,350 (+$49,860, +14.73% from previous year)
- 2022: $486,761 (+$98,410, +25.34% from previous year)
- 2023: $495,243 (+$8,482, +1.74% from previous year)
- 2024: $530,254 (+$35,011, +7.07% from previous year)
- 2025: $538,026 (+$7,772, +1.47% from previous year)
Home values in Fort Mill have surged by 125% since 2010, with especially strong gains between 2020 and 2022. While prices have leveled out a bit since, they remain among the highest in the state, driven by the town’s excellent livability and proximity to Charlotte.
Fort Mill – Suburban Growth Near the State Line
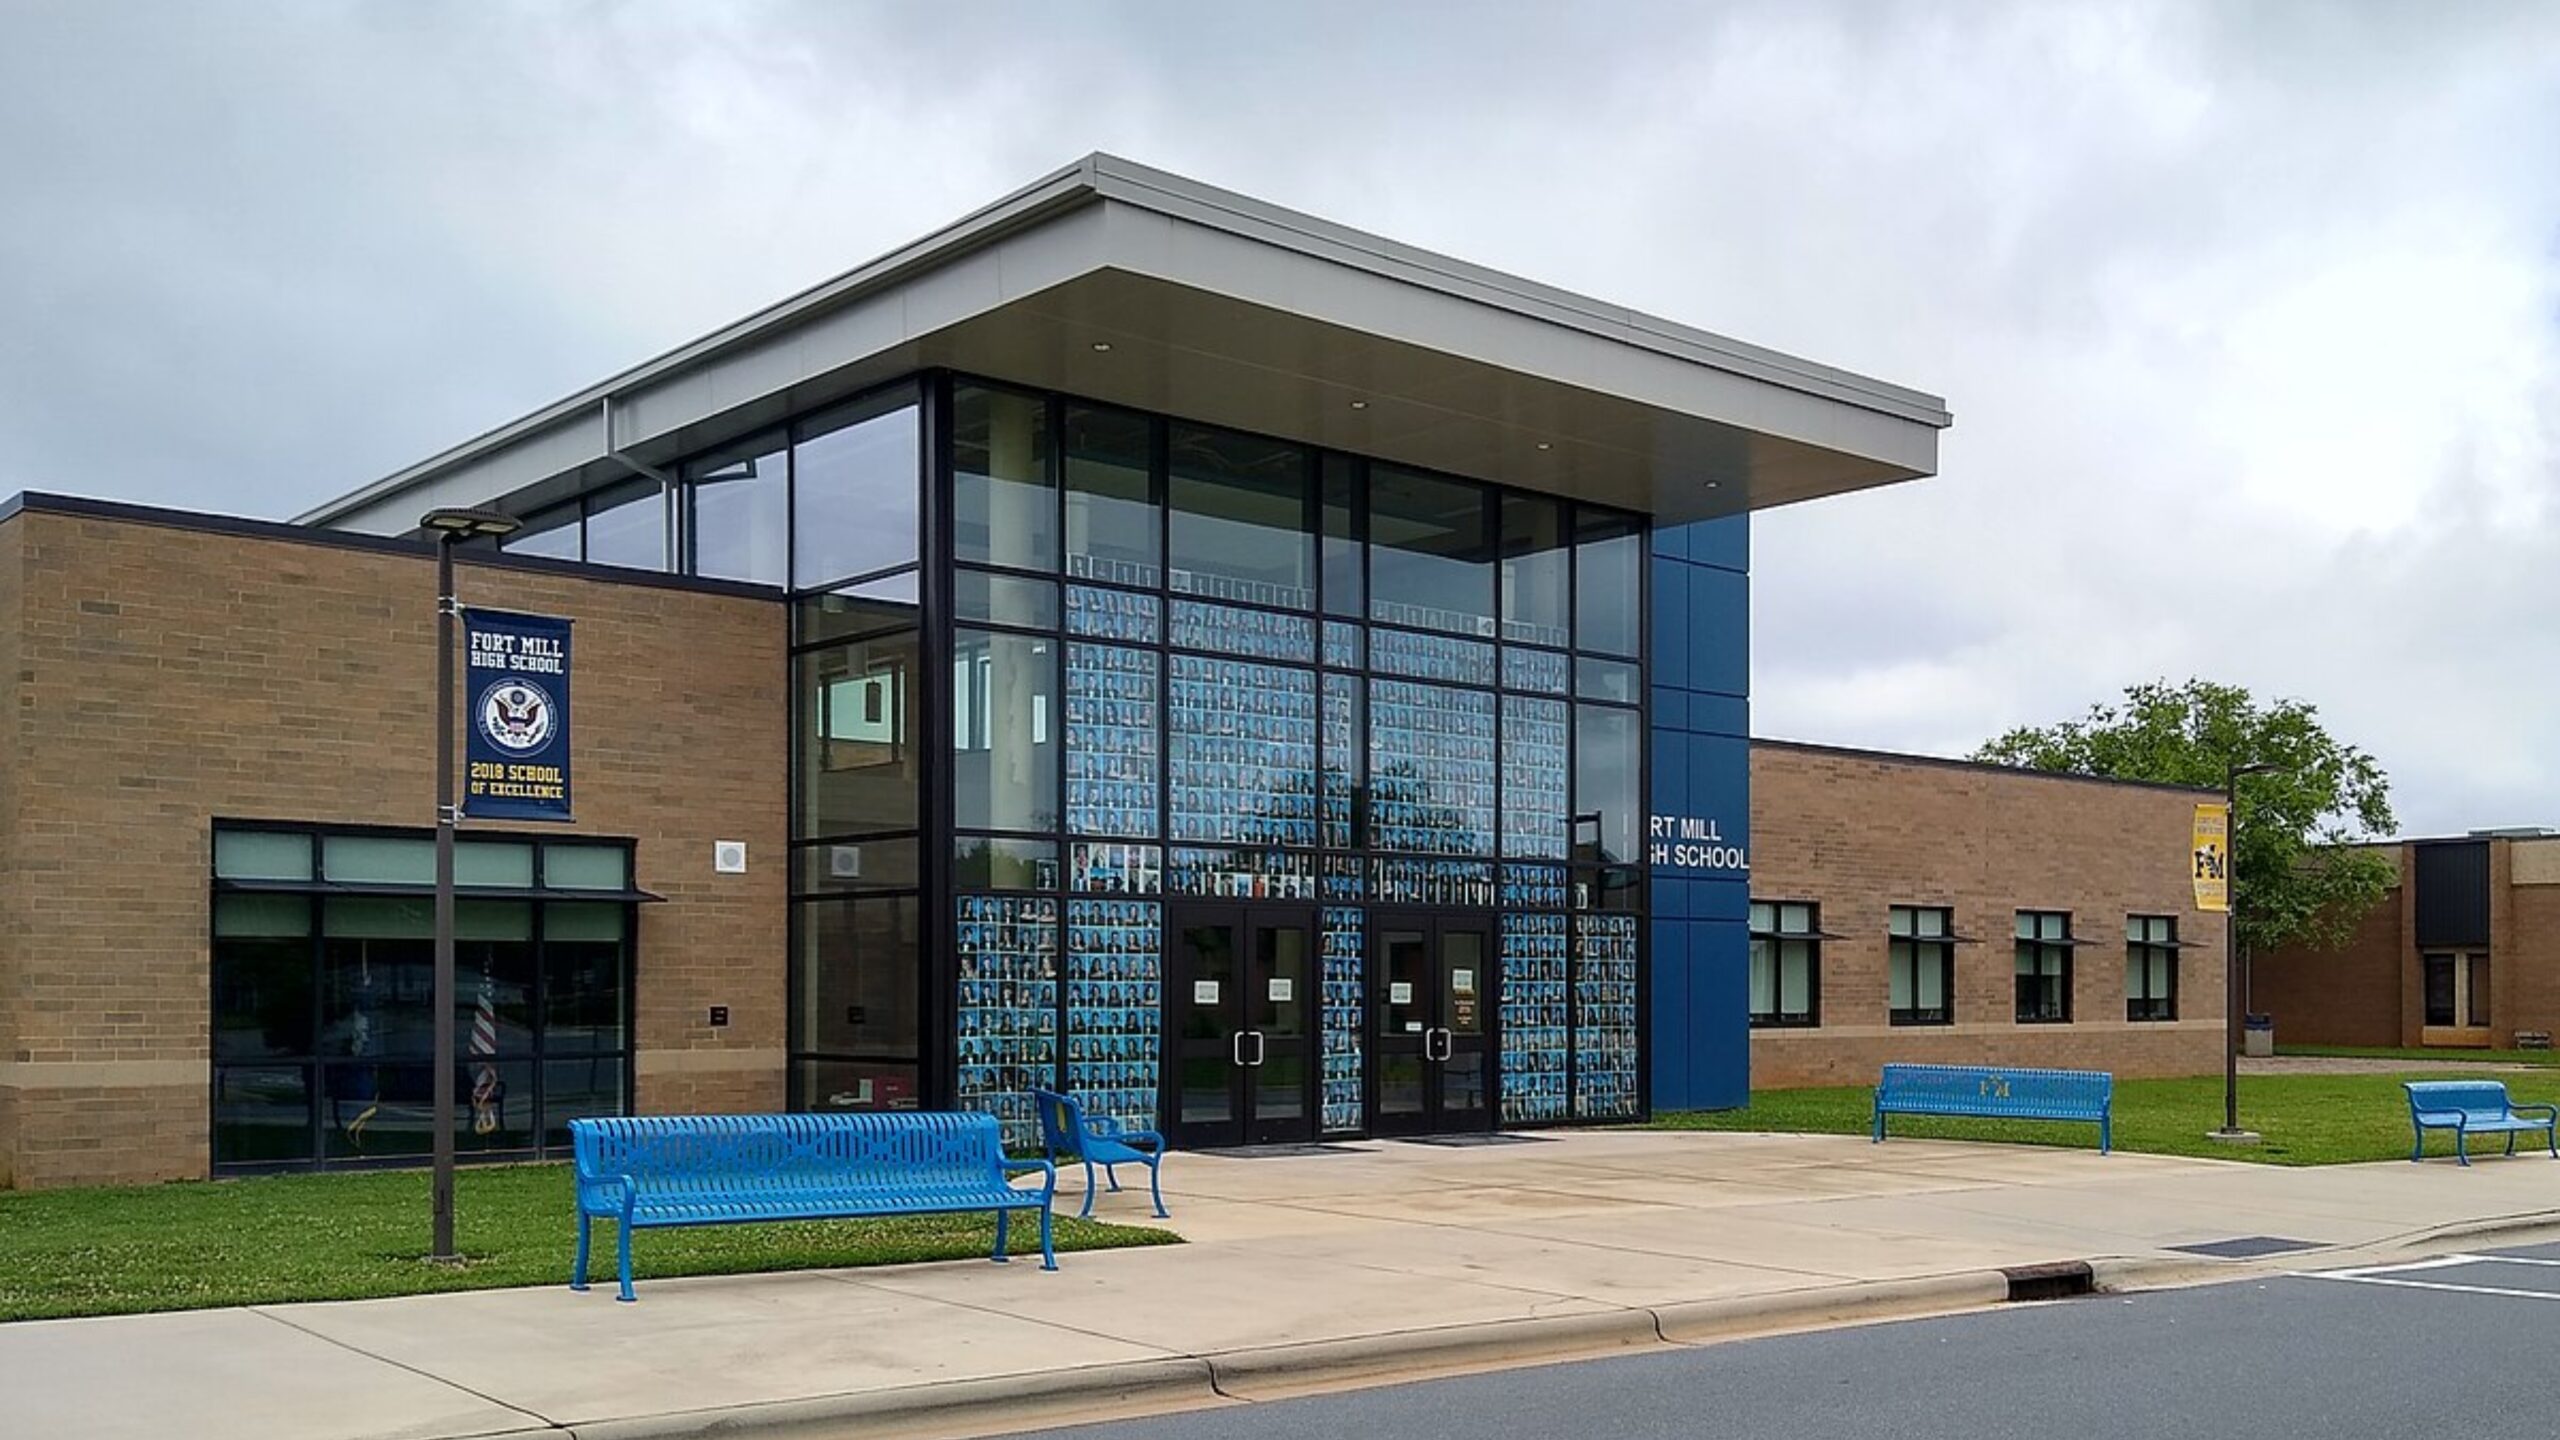
Located just south of Charlotte, Fort Mill offers a high quality of life with top-ranked schools, well-kept neighborhoods, and a mix of historic charm and new development. It’s become a magnet for families and professionals working in Charlotte who want more space and lower property taxes.
The town features a revitalized downtown, the popular Anne Springs Close Greenway, and access to major highways. These assets—along with strong regional job growth—have pushed demand and prices steadily upward. The median home value now sits over $538,000, more than double its 2010 figure.
16. Pawleys Island – 111% Home Price Increase Since 2012
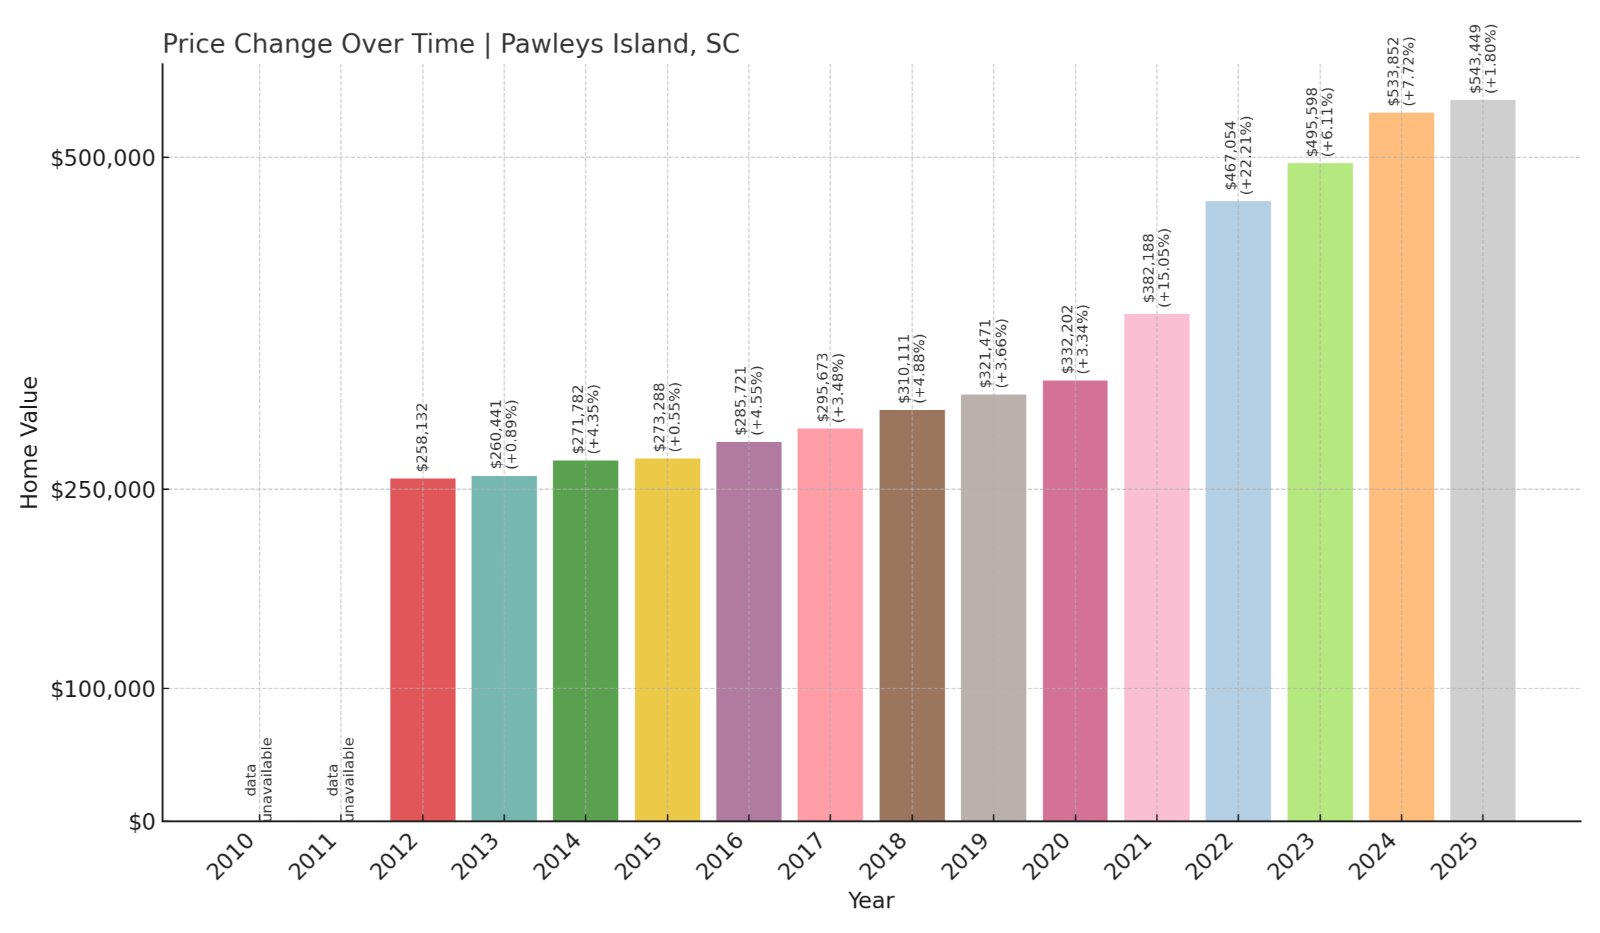
- 2012: $258,132
- 2013: $260,441 (+$2,308, +0.89% from previous year)
- 2014: $271,782 (+$11,341, +4.35% from previous year)
- 2015: $273,288 (+$1,506, +0.55% from previous year)
- 2016: $285,721 (+$12,433, +4.55% from previous year)
- 2017: $295,673 (+$9,951, +3.48% from previous year)
- 2018: $310,111 (+$14,438, +4.88% from previous year)
- 2019: $321,471 (+$11,361, +3.66% from previous year)
- 2020: $332,202 (+$10,731, +3.34% from previous year)
- 2021: $382,188 (+$49,986, +15.05% from previous year)
- 2022: $467,054 (+$84,865, +22.21% from previous year)
- 2023: $495,598 (+$28,545, +6.11% from previous year)
- 2024: $533,852 (+$38,254, +7.72% from previous year)
- 2025: $543,449 (+$9,596, +1.80% from previous year)
Pawleys Island has seen home values climb over 111% since 2012, reflecting its appeal as a low-key beach town with historic charm. While prices have moderated in recent years, the area’s reputation as a premium destination remains secure.
Pawleys Island – History and Coastal Appeal
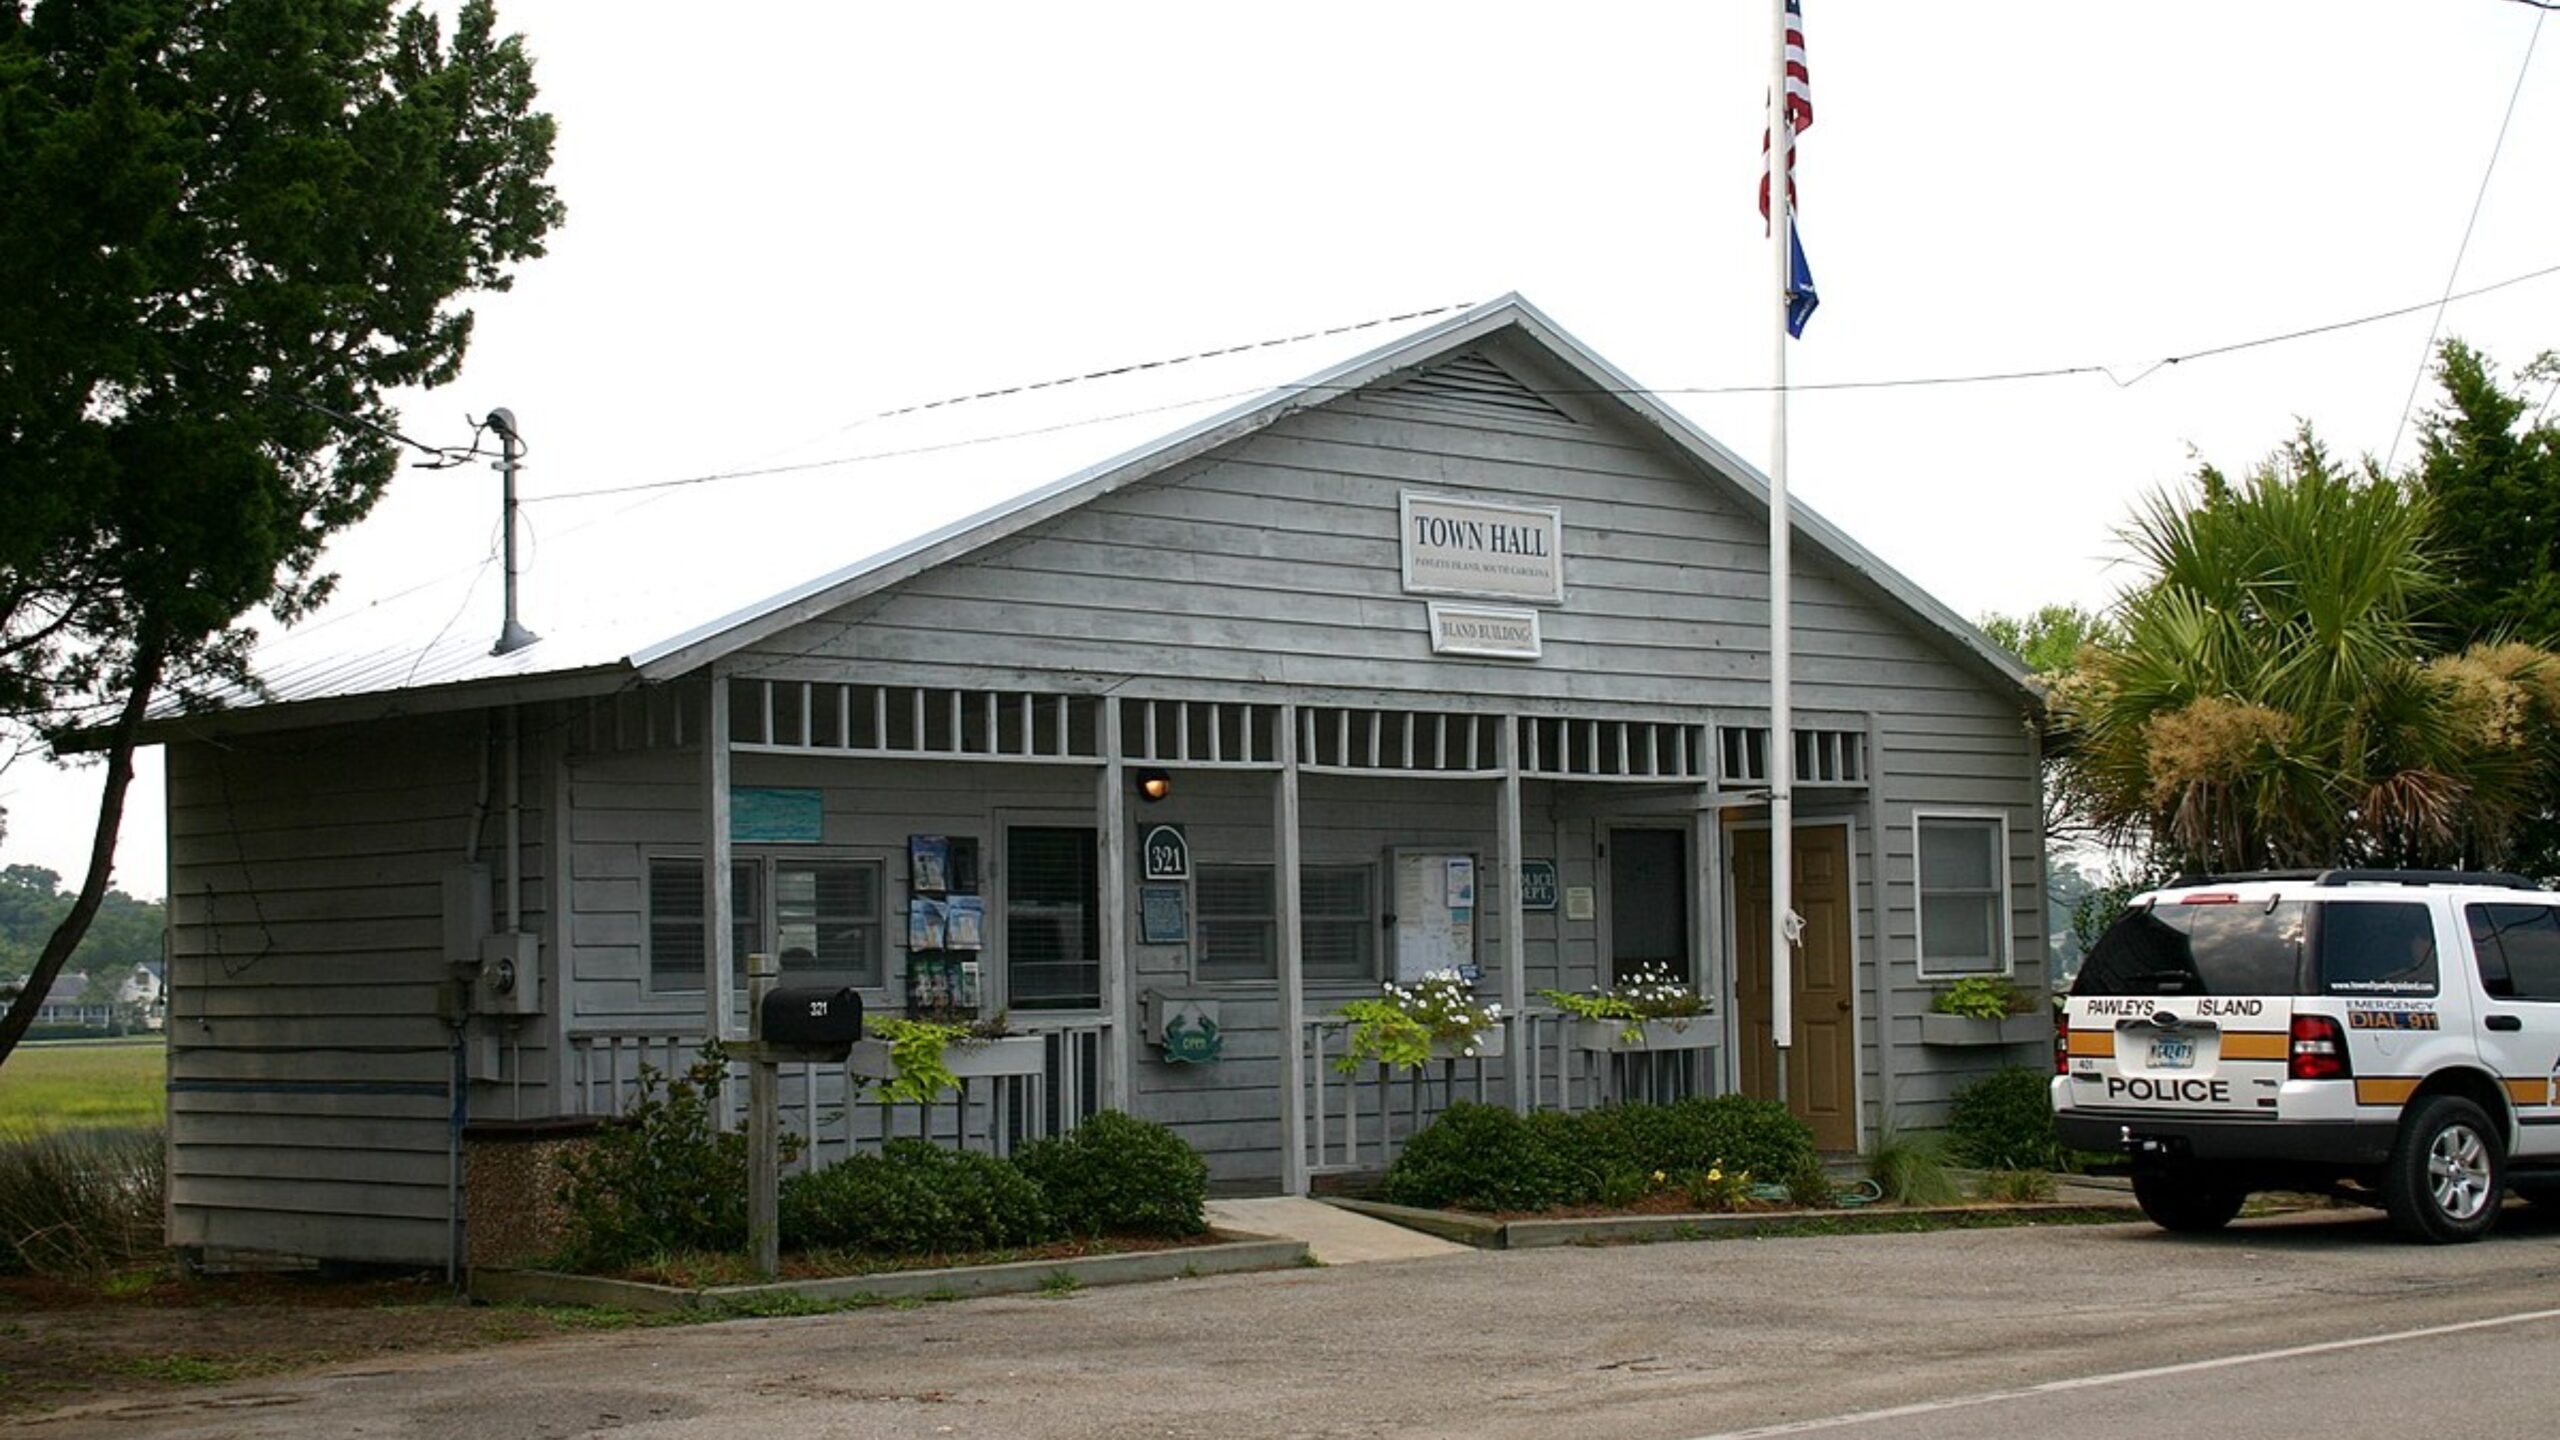
Located south of Myrtle Beach, Pawleys Island is one of the oldest summer resort destinations in the country. Known for its relaxed pace and scenic marsh views, the island blends unspoiled beaches with classic Southern architecture and a strong sense of place.
Limited land availability, combined with high demand for oceanfront and marsh-view homes, has fueled steady price increases. The town’s popularity with retirees and vacation home buyers has kept the market competitive, with 2025 values averaging over $543,000. Preservation of character and natural beauty remain central to Pawleys Island’s long-term appeal.
15. Charleston – 160% Home Price Increase Since 2010
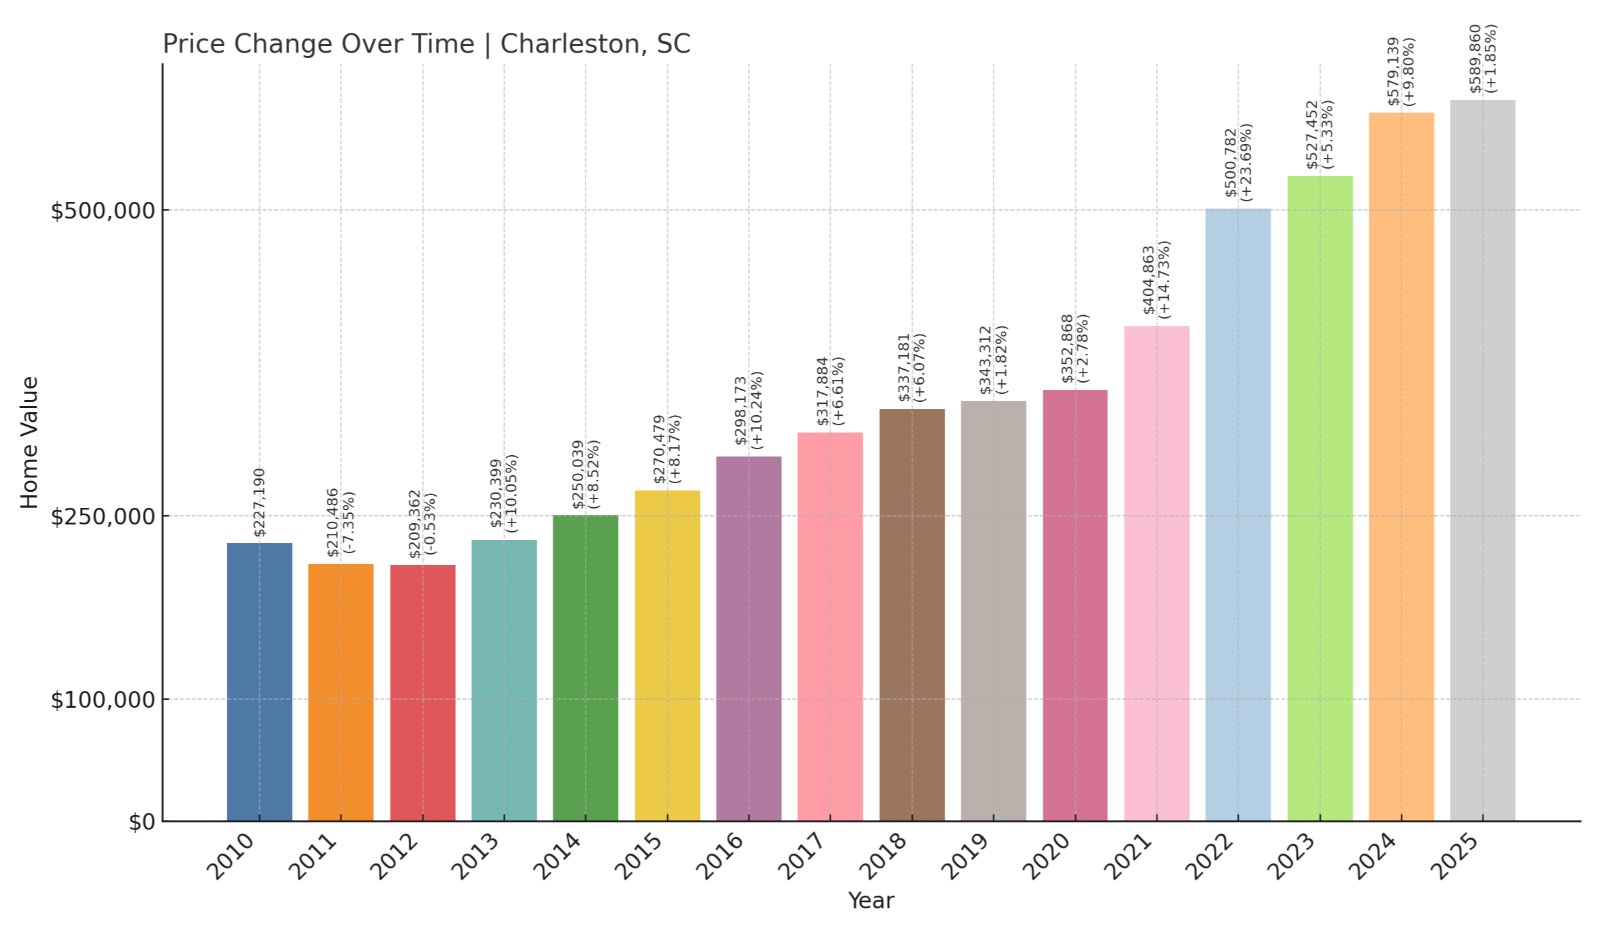
- 2010: $227,190
- 2011: $210,486 (-$16,704, -7.35% from previous year)
- 2012: $209,362 (-$1,123, -0.53% from previous year)
- 2013: $230,399 (+$21,037, +10.05% from previous year)
- 2014: $250,039 (+$19,639, +8.52% from previous year)
- 2015: $270,479 (+$20,440, +8.17% from previous year)
- 2016: $298,173 (+$27,694, +10.24% from previous year)
- 2017: $317,884 (+$19,711, +6.61% from previous year)
- 2018: $337,181 (+$19,297, +6.07% from previous year)
- 2019: $343,312 (+$6,131, +1.82% from previous year)
- 2020: $352,868 (+$9,556, +2.78% from previous year)
- 2021: $404,863 (+$51,995, +14.73% from previous year)
- 2022: $500,782 (+$95,919, +23.69% from previous year)
- 2023: $527,452 (+$26,670, +5.33% from previous year)
- 2024: $579,139 (+$51,688, +9.80% from previous year)
- 2025: $589,860 (+$10,721, +1.85% from previous year)
Charleston’s home values have surged 160% since 2010, a remarkable increase for a city of its size and historic footprint. While the largest gains came post-2020, the overall trend over the past 15 years has been steady and strong, driven by growing demand and regional appeal.
Charleston – Historic City, Modern Momentum
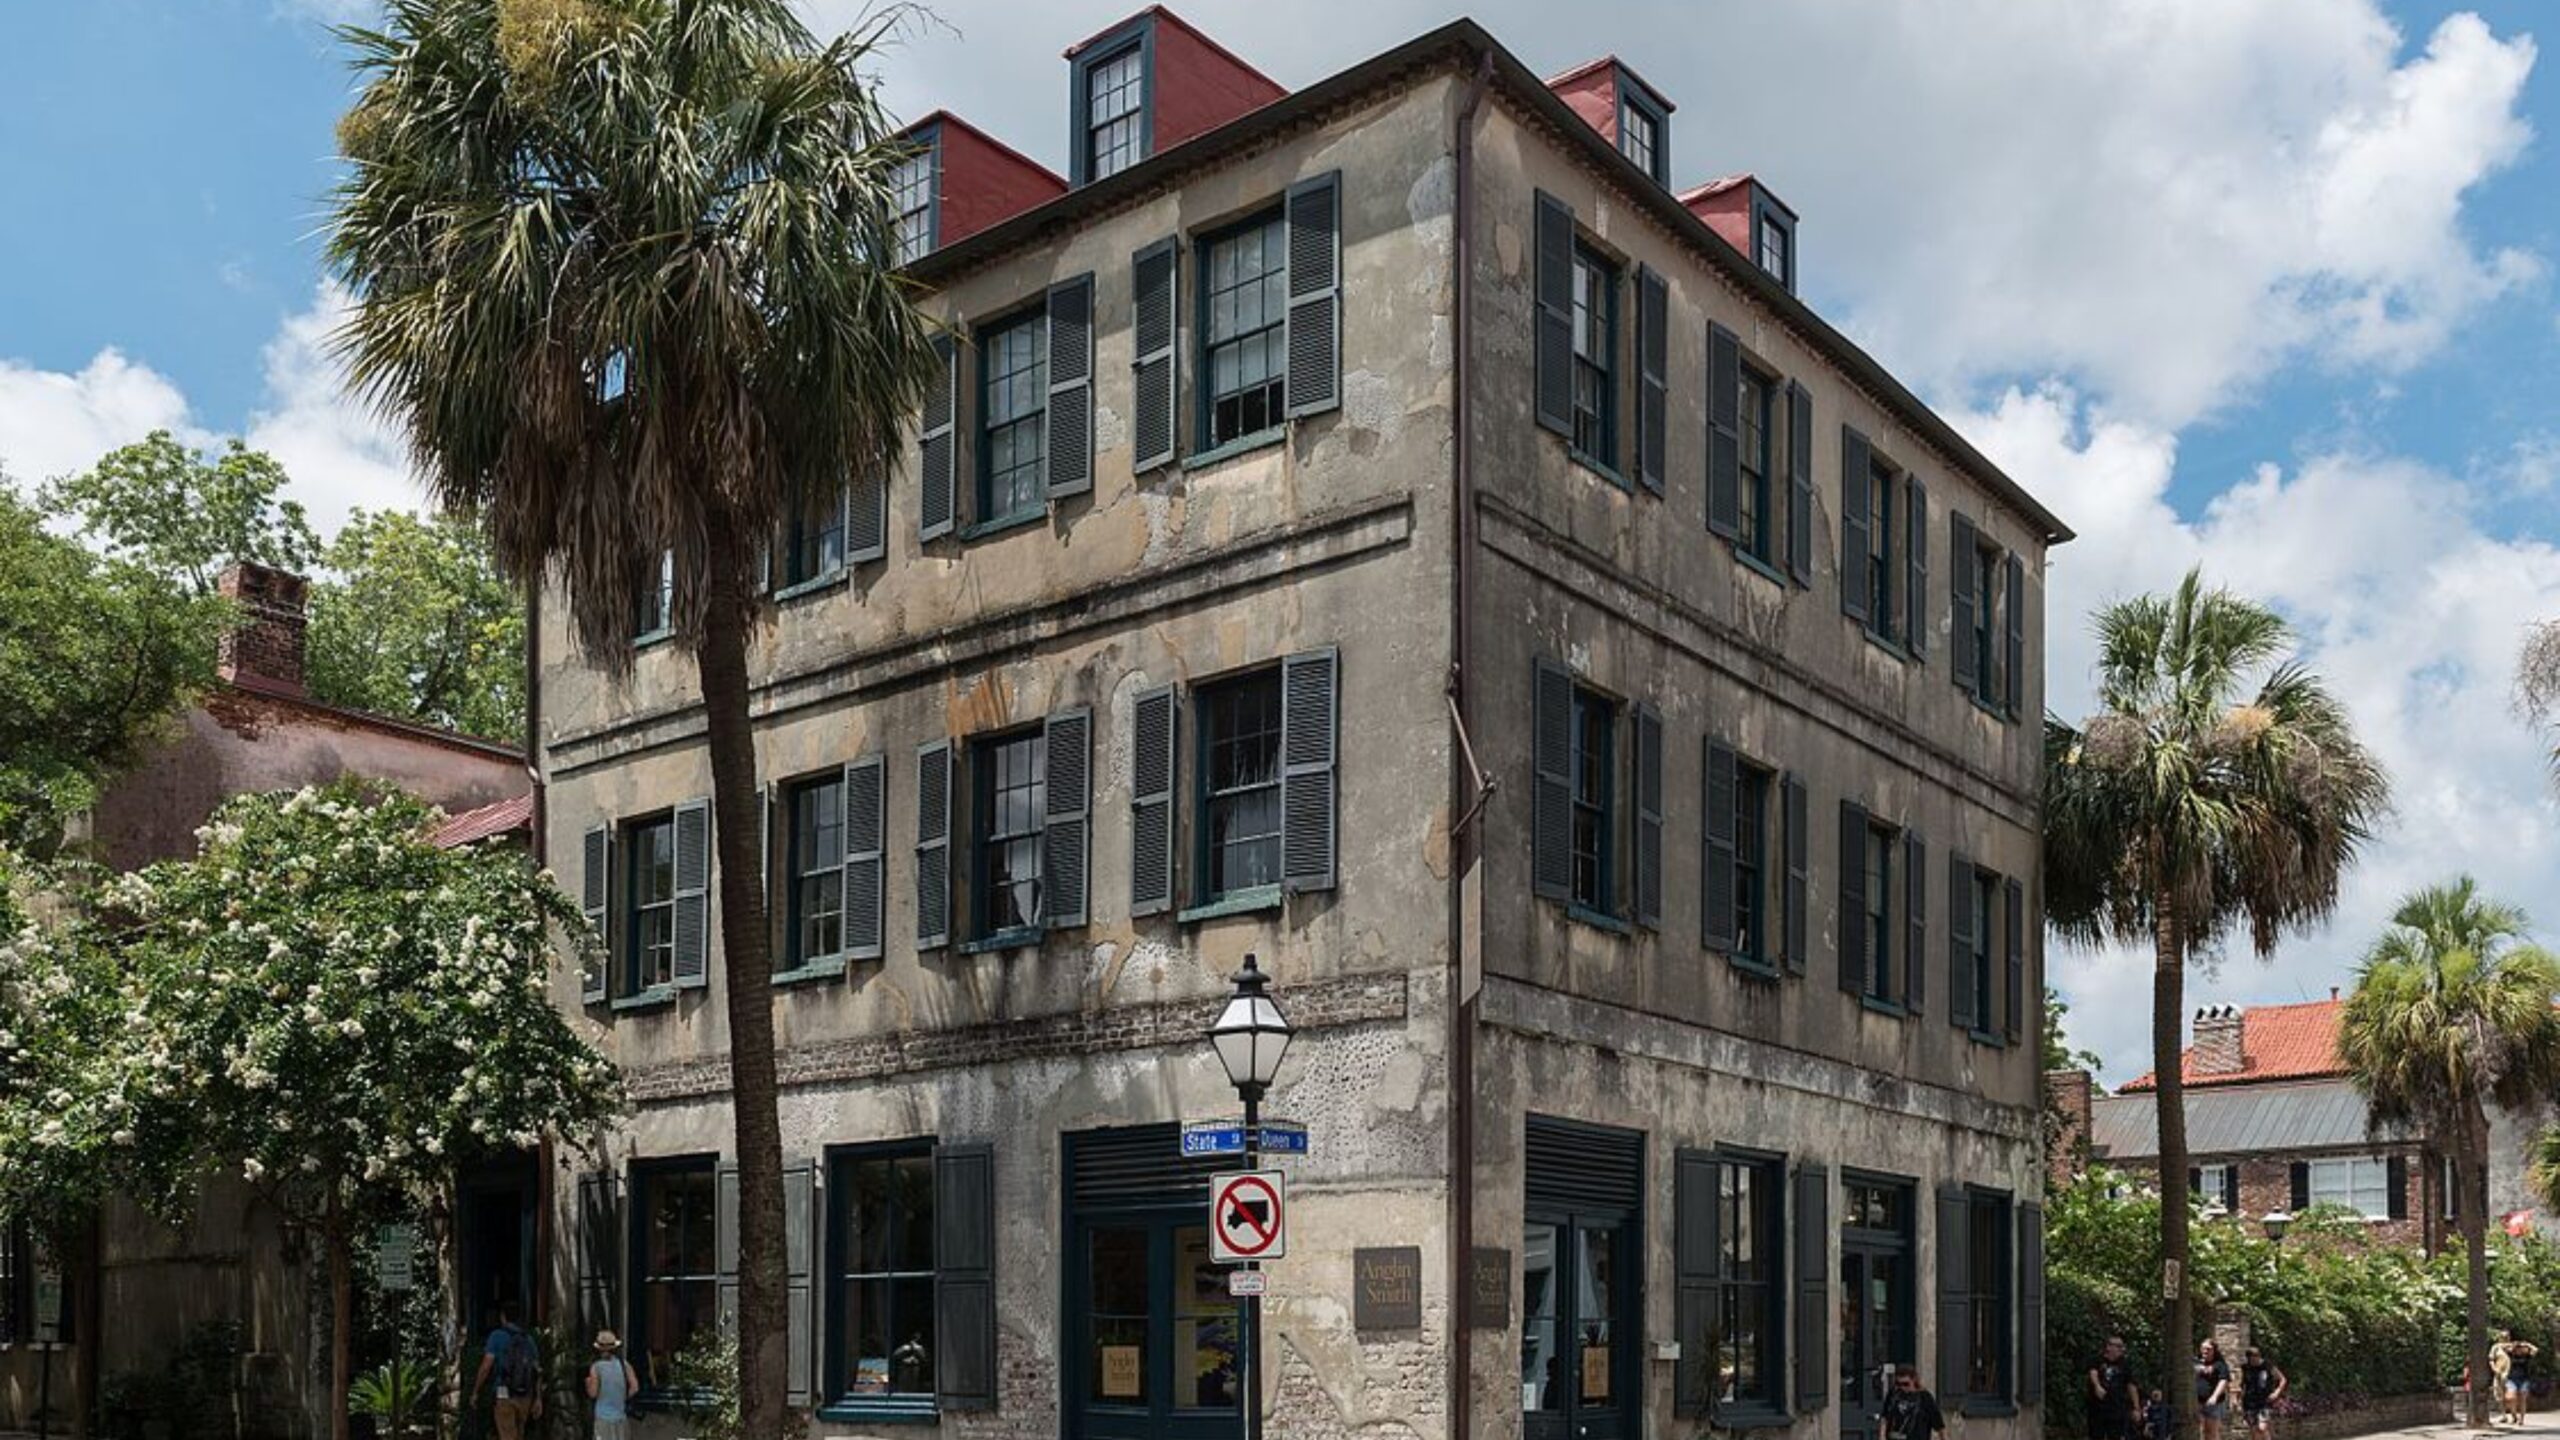
Charleston blends historic architecture, coastal living, and a thriving cultural scene. The city is renowned for its cobblestone streets, antebellum homes, and active harbor, as well as a dynamic food and arts scene that continues to attract newcomers nationwide. Its reputation as one of the South’s most livable cities keeps housing demand strong.
The city’s growth has led to new development across the peninsula and into surrounding areas like West Ashley and James Island. Charleston’s universities, medical centers, and tourism industry support a strong local economy, while limited available land continues to drive up prices. With a median home price nearing $590,000, Charleston remains one of the most expensive and sought-after markets in the state.
14. Tega Cay – 124% Home Price Increase Since 2010
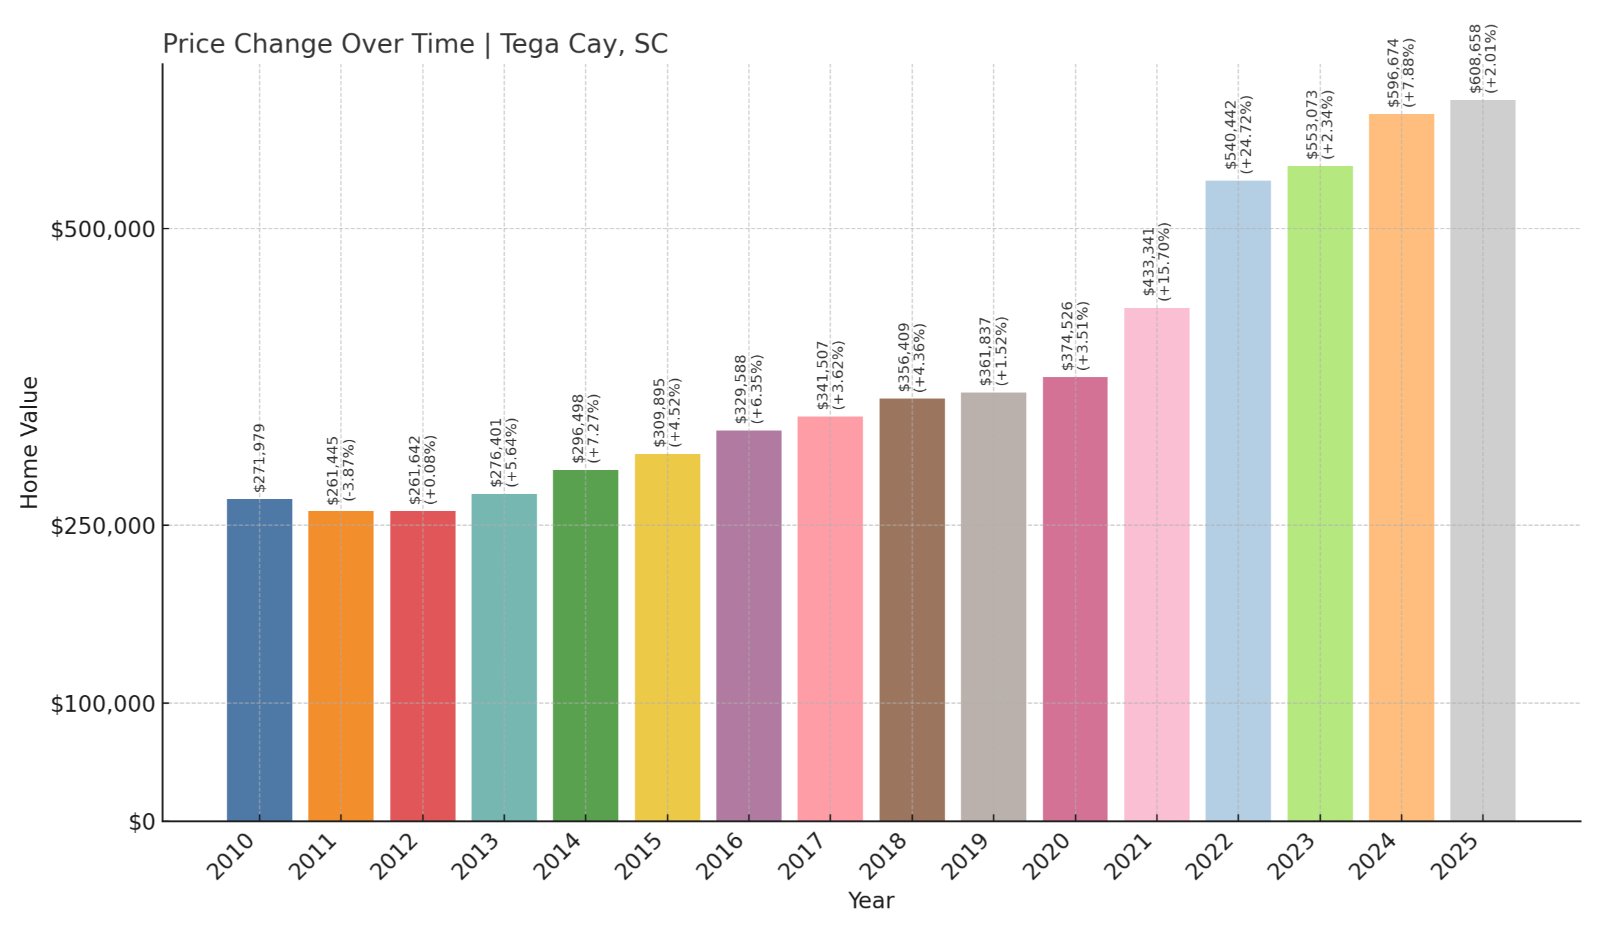
- 2010: $271,979
- 2011: $261,445 (-$10,534, -3.87% from previous year)
- 2012: $261,642 (+$197, +0.08% from previous year)
- 2013: $276,401 (+$14,759, +5.64% from previous year)
- 2014: $296,498 (+$20,097, +7.27% from previous year)
- 2015: $309,895 (+$13,397, +4.52% from previous year)
- 2016: $329,588 (+$19,693, +6.35% from previous year)
- 2017: $341,507 (+$11,919, +3.62% from previous year)
- 2018: $356,409 (+$14,902, +4.36% from previous year)
- 2019: $361,837 (+$5,428, +1.52% from previous year)
- 2020: $374,526 (+$12,689, +3.51% from previous year)
- 2021: $433,341 (+$58,815, +15.70% from previous year)
- 2022: $540,442 (+$107,101, +24.72% from previous year)
- 2023: $553,073 (+$12,631, +2.34% from previous year)
- 2024: $596,674 (+$43,601, +7.88% from previous year)
- 2025: $608,658 (+$11,983, +2.01% from previous year)
Home prices in Tega Cay have risen 124% since 2010, with particularly sharp jumps during the 2021–2022 housing boom. While recent growth has been more moderate, the market remains elevated, crossing the $600,000 mark in 2025.
Tega Cay – Resort Lifestyle Near Charlotte
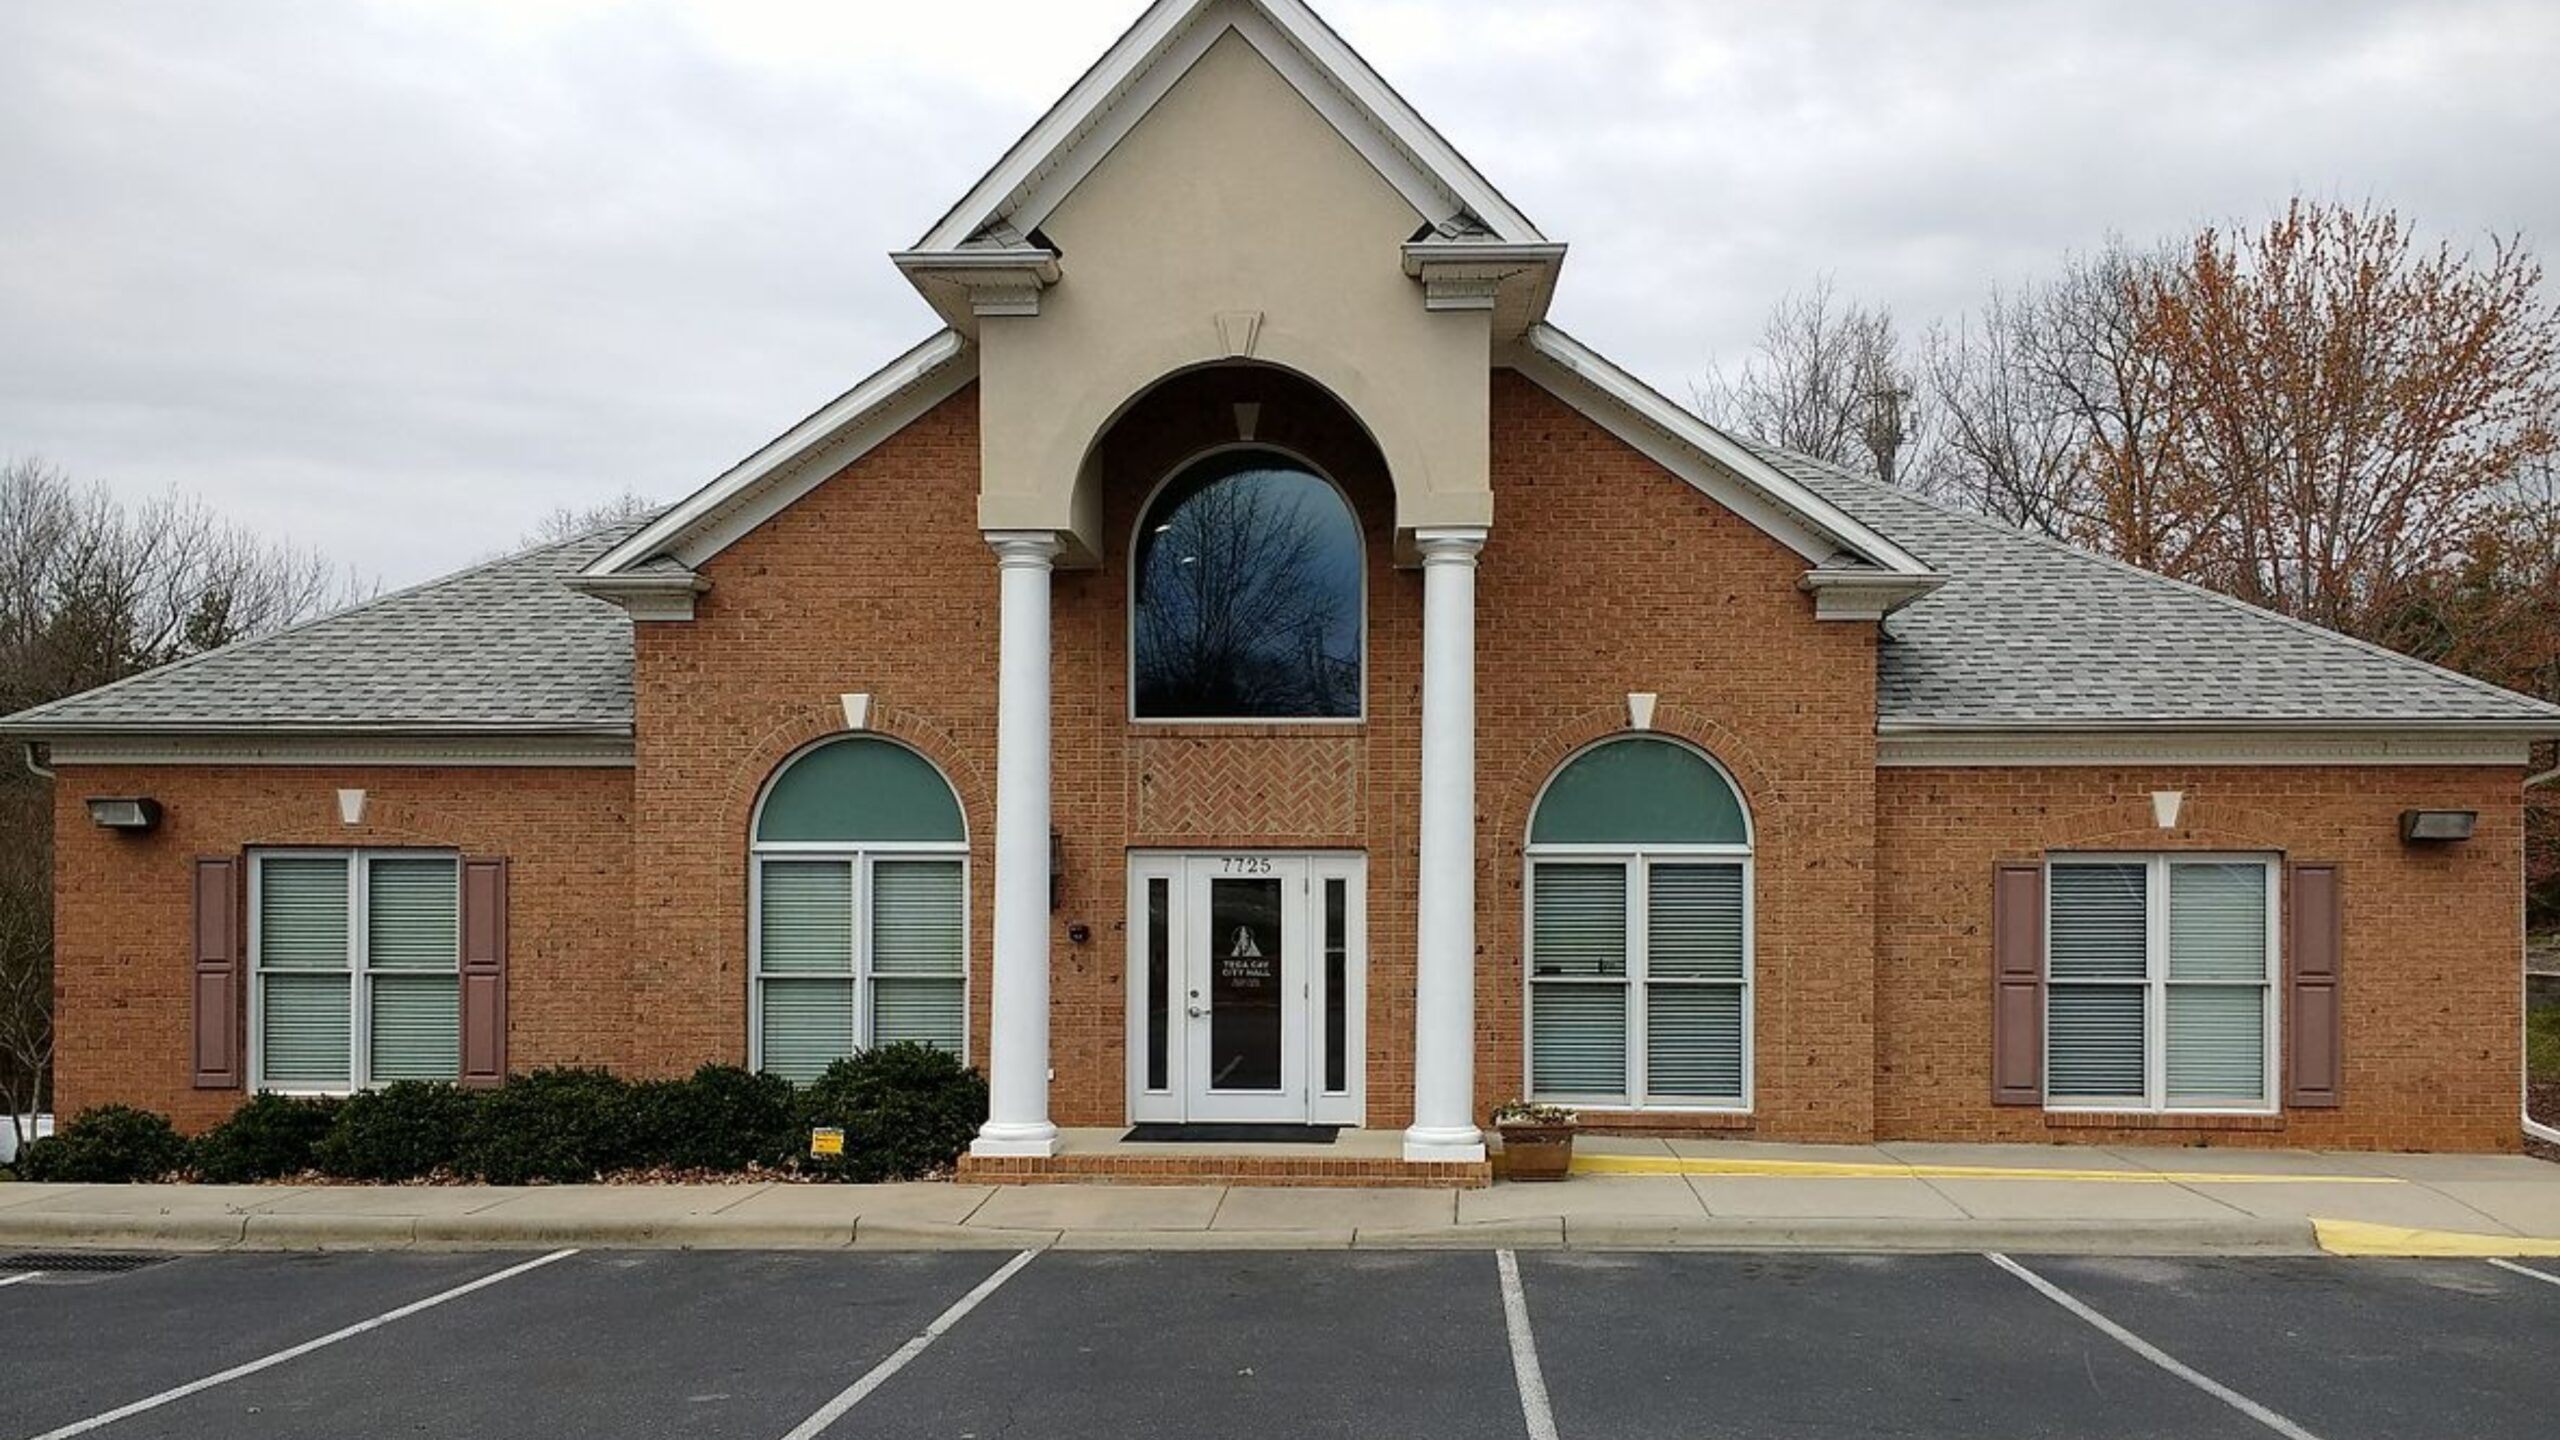
Tega Cay sits along Lake Wylie in northern York County, just southwest of Charlotte. The town’s name, which means “Beautiful Peninsula” in Polynesian, reflects its lakefront setting, golf courses, and miles of walking trails. With top-rated schools and planned neighborhoods, it’s become a preferred destination for professionals and families relocating from nearby metro areas.
As demand has surged for scenic, suburban living within commuting distance to Charlotte, Tega Cay’s limited supply of lakeside properties has driven up values. Community amenities like a marina, beach club, and parks have made it even more attractive for higher-end buyers. That combination of location, lifestyle, and leisure has kept prices high and climbing.
13. Wadmalaw Island – 150% Home Price Increase Since 2010
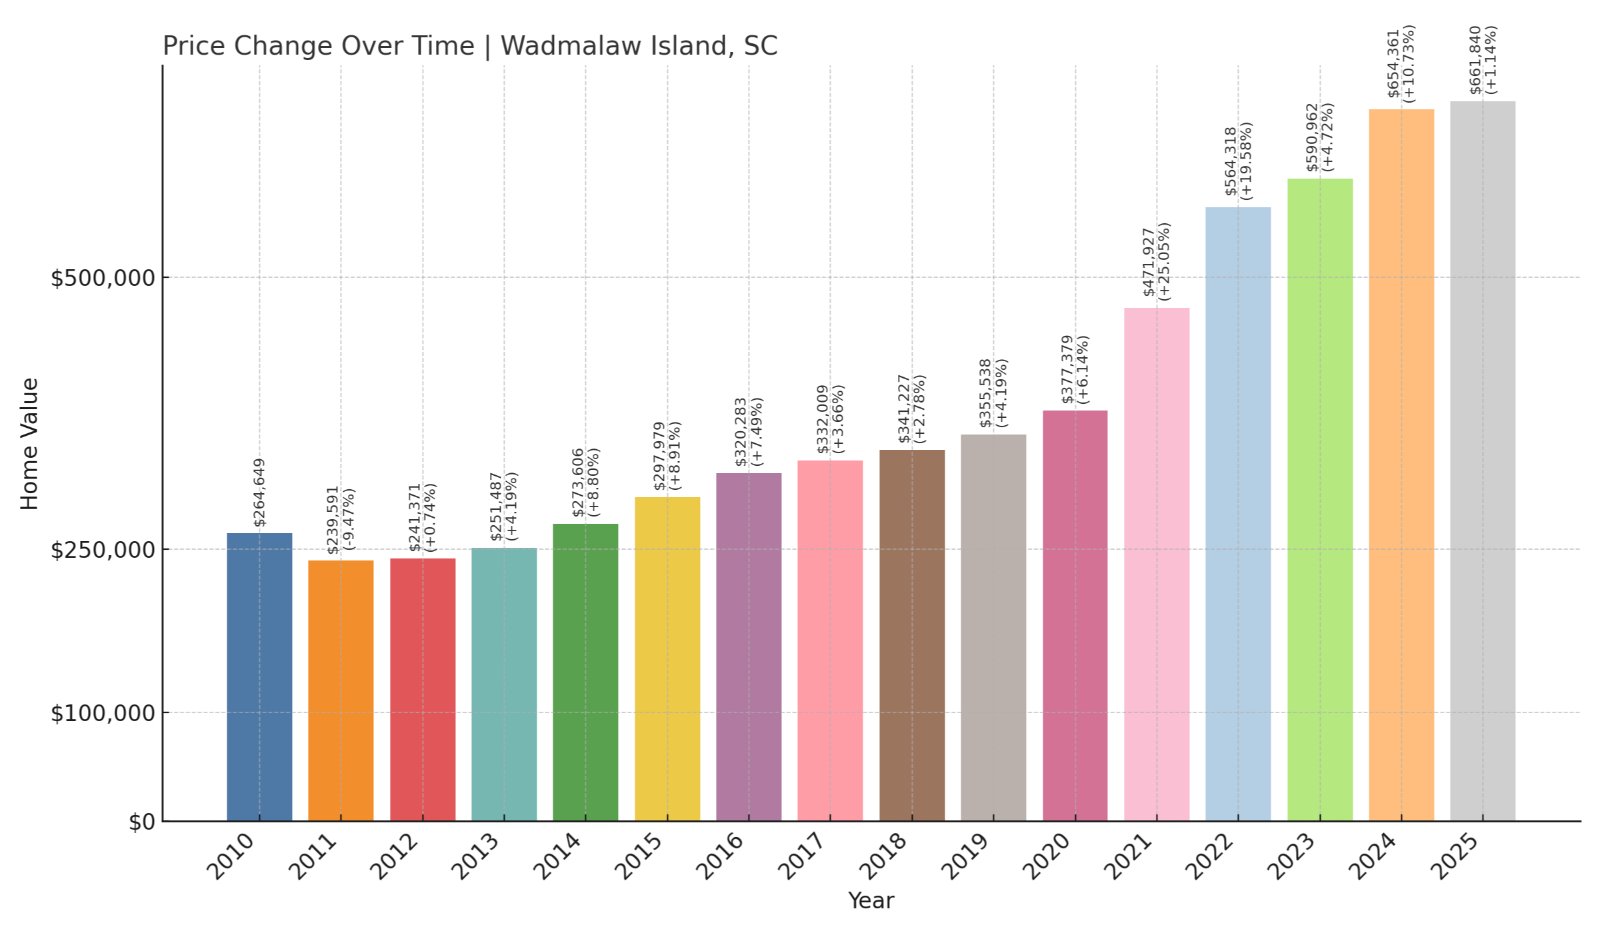
- 2010: $264,649
- 2011: $239,591 (-$25,057, -9.47% from previous year)
- 2012: $241,371 (+$1,779, +0.74% from previous year)
- 2013: $251,487 (+$10,116, +4.19% from previous year)
- 2014: $273,606 (+$22,119, +8.80% from previous year)
- 2015: $297,979 (+$24,373, +8.91% from previous year)
- 2016: $320,283 (+$22,304, +7.49% from previous year)
- 2017: $332,009 (+$11,725, +3.66% from previous year)
- 2018: $341,227 (+$9,219, +2.78% from previous year)
- 2019: $355,538 (+$14,310, +4.19% from previous year)
- 2020: $377,379 (+$21,842, +6.14% from previous year)
- 2021: $471,927 (+$94,548, +25.05% from previous year)
- 2022: $564,318 (+$92,391, +19.58% from previous year)
- 2023: $590,962 (+$26,643, +4.72% from previous year)
- 2024: $654,361 (+$63,399, +10.73% from previous year)
- 2025: $661,840 (+$7,479, +1.14% from previous year)
Wadmalaw Island has experienced a 150% increase in home prices since 2010, with significant jumps post-2020. Although appreciation has slowed, the area remains highly valued for its privacy and rural setting near Charleston.
Wadmalaw Island – Rural Luxury Close to the Coast
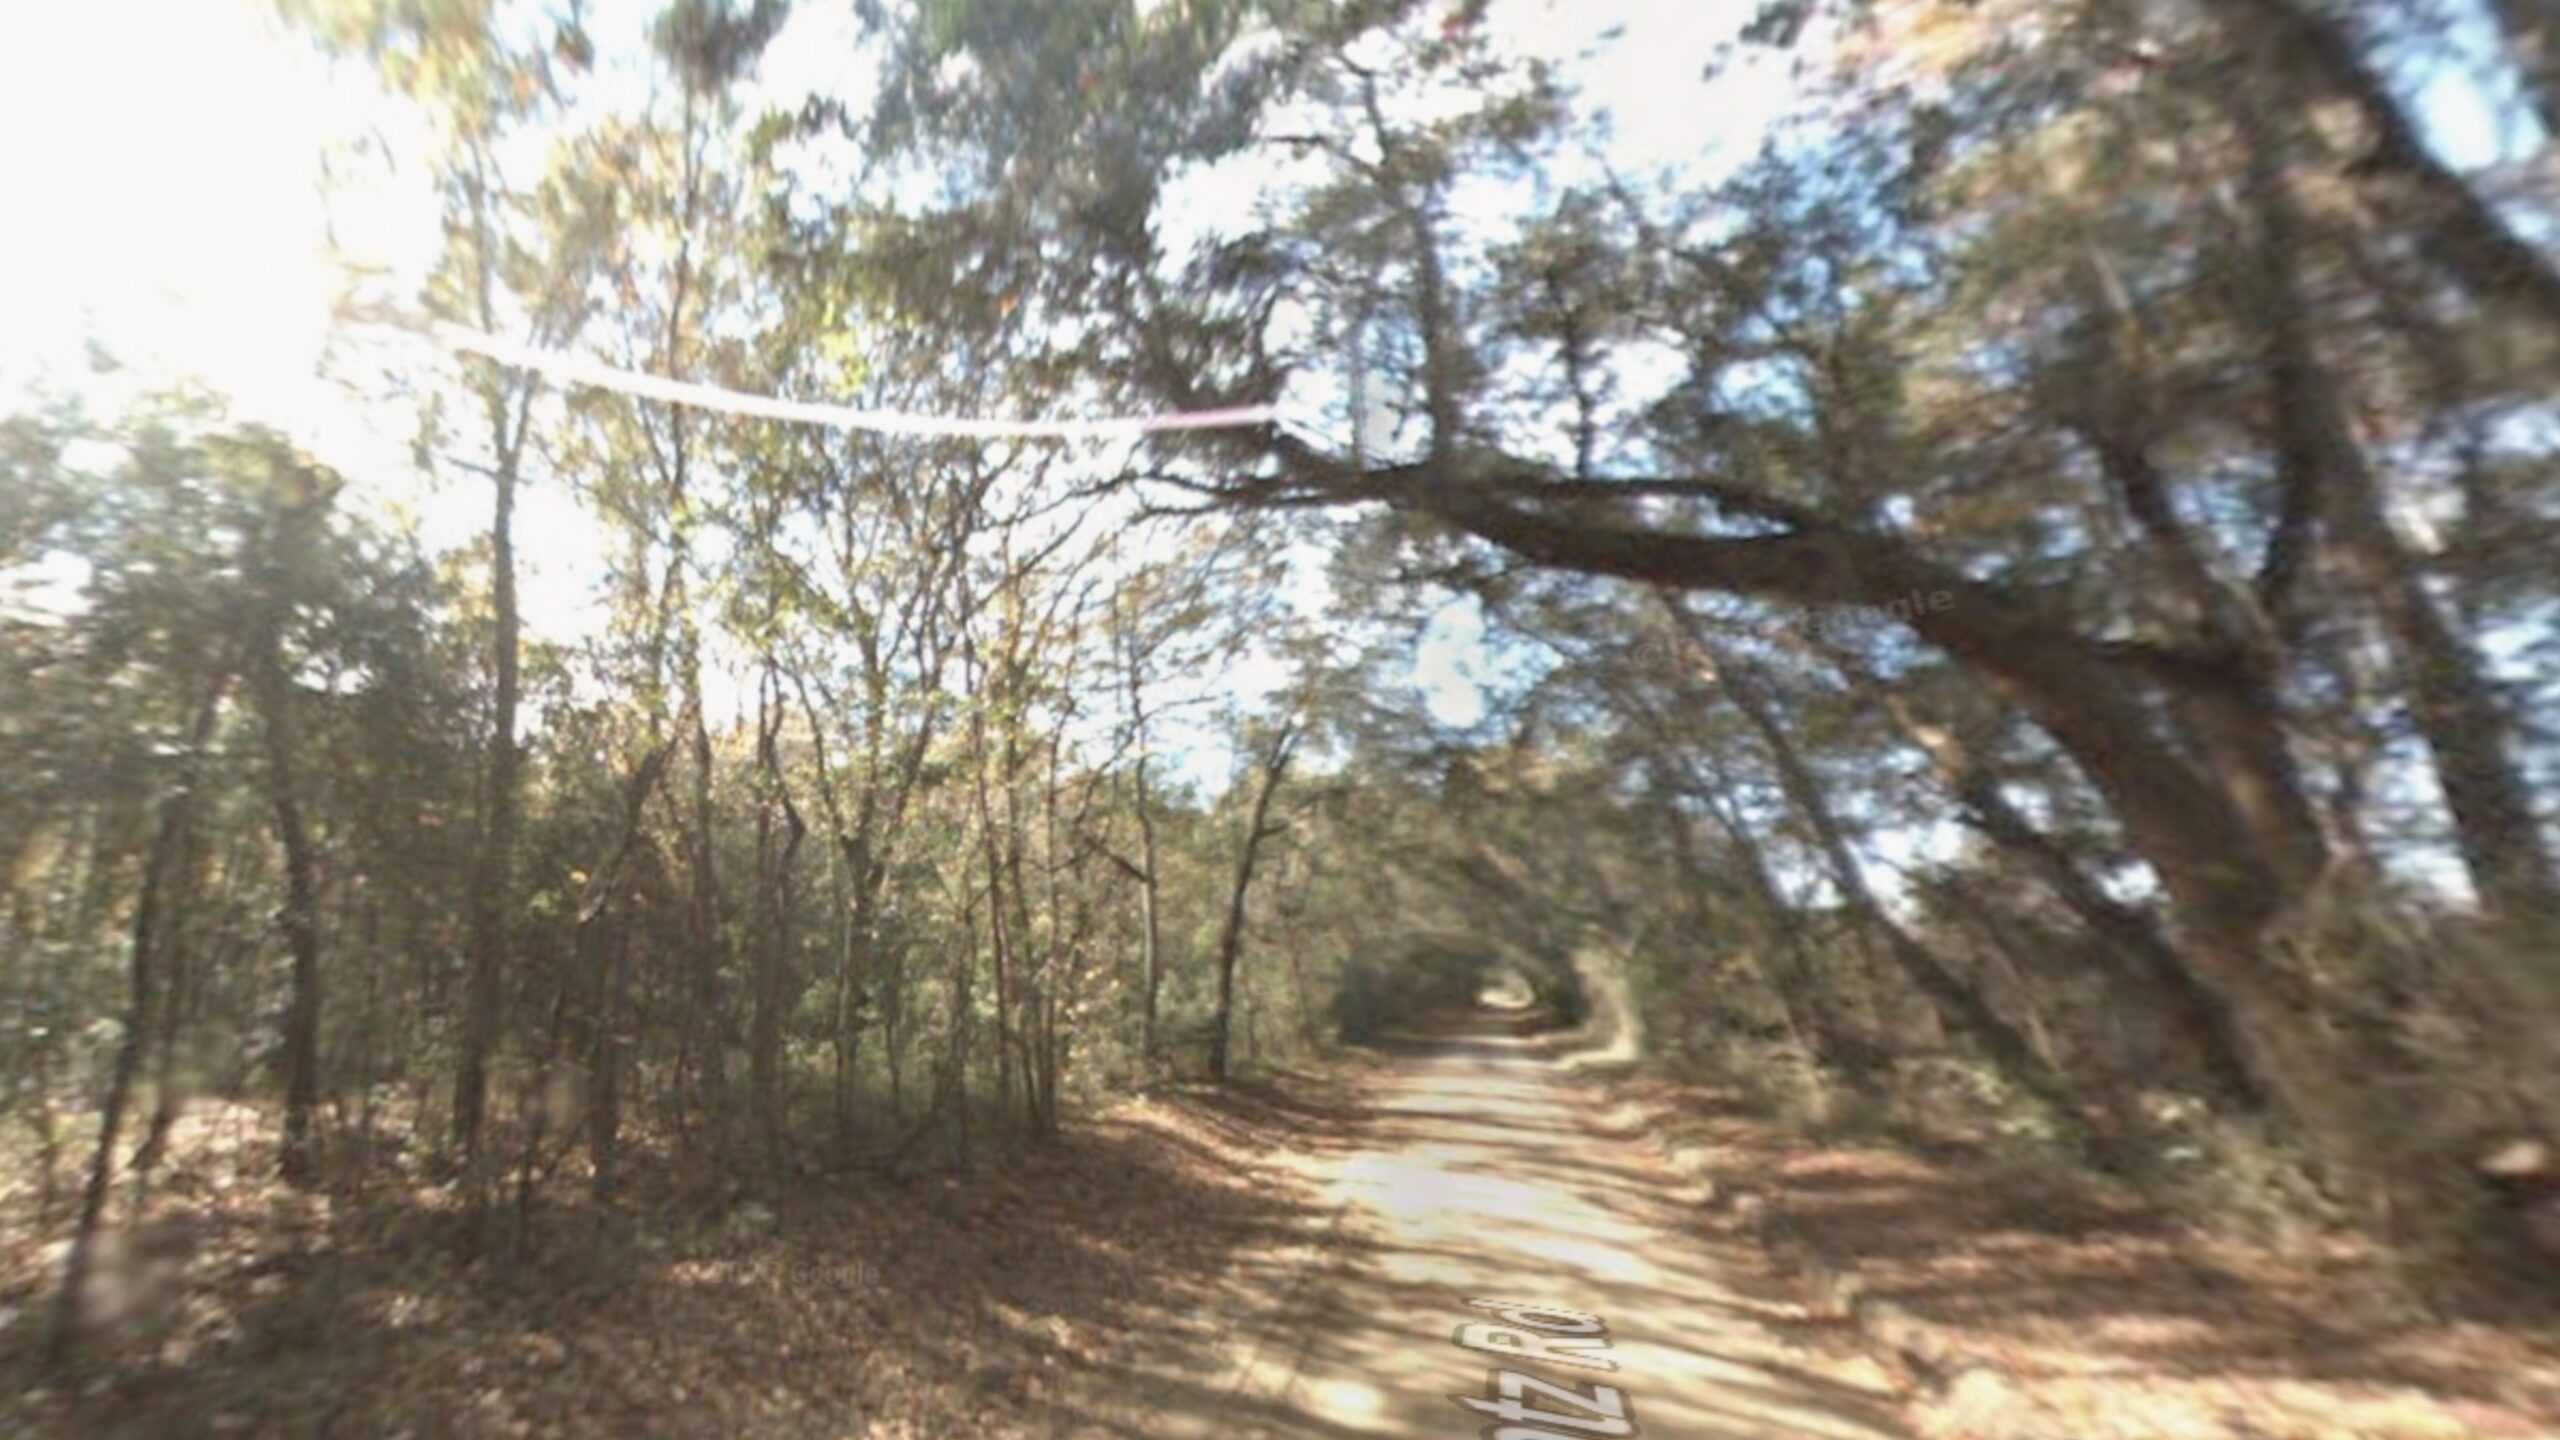
Wadmalaw Island is located southwest of Johns Island and is one of the last undeveloped sea islands in the Charleston area. Known for its scenic farmland, tidal creeks, and oak-lined roads, the island appeals to buyers looking for space and seclusion—without straying far from city amenities.
With limited development and large estate-style properties, Wadmalaw Island caters to a niche market that values quiet and exclusivity. Recent years have seen an influx of high-end buyers seeking custom homes and waterfront acreage, contributing to the rise in values. The area’s beauty, privacy, and proximity to Charleston continue to drive interest despite fewer homes on the market.
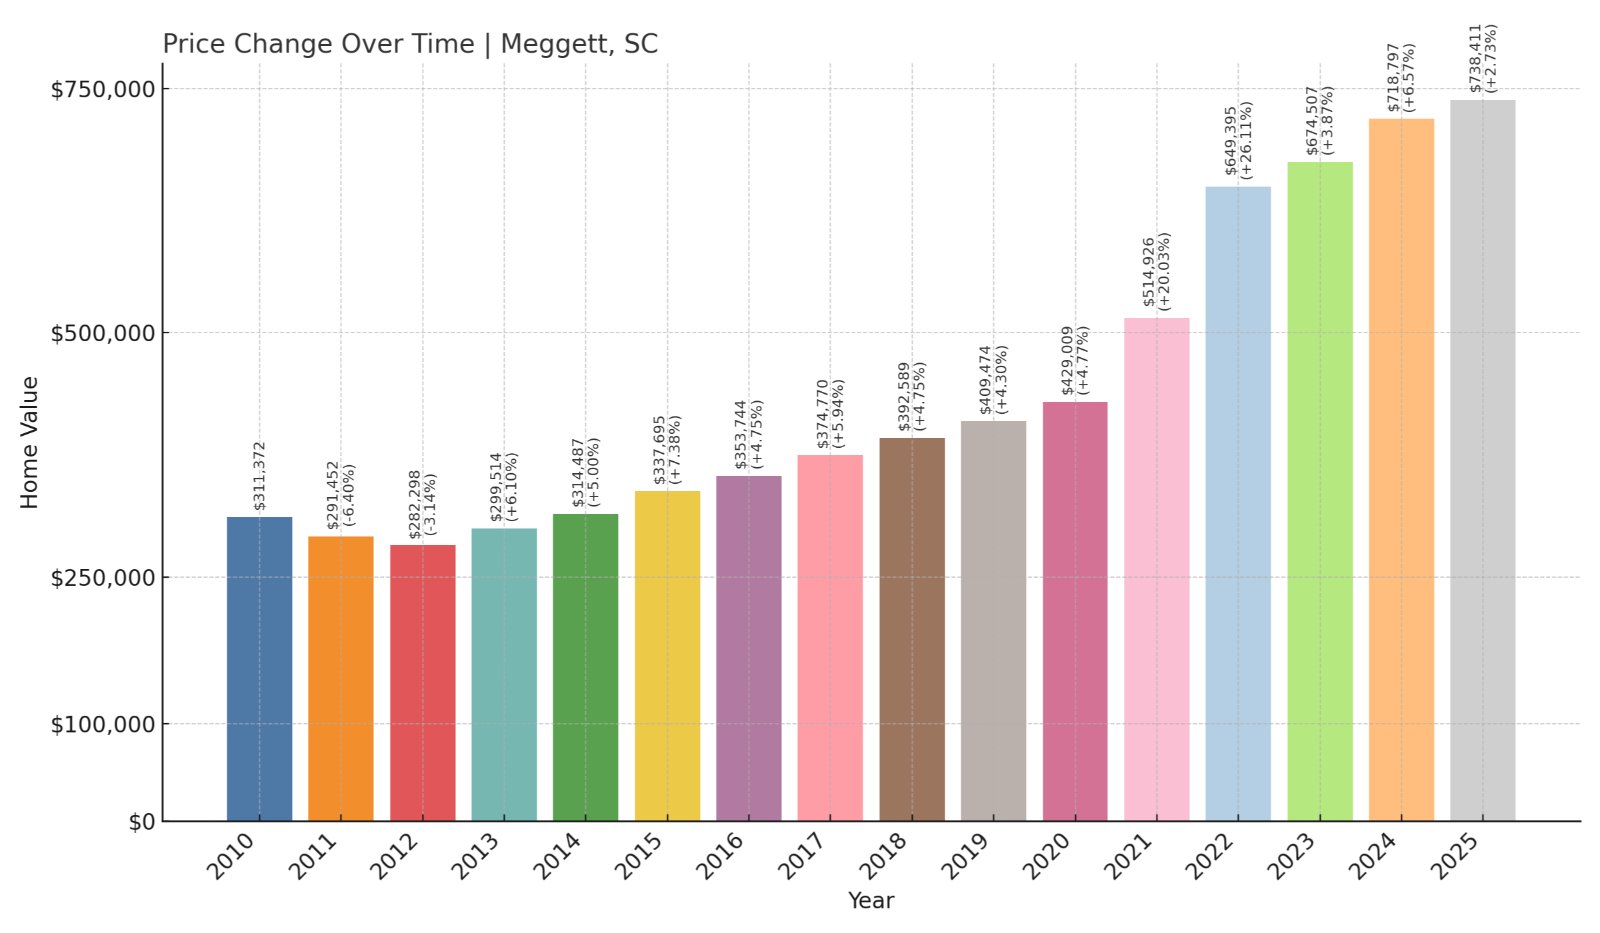
12. Meggett – 137% Home Price Increase Since 2010
🔥 Would you like to save this?
- 2010: $311,372
- 2011: $291,452 (-$19,920, -6.40% from previous year)
- 2012: $282,298 (-$9,155, -3.14% from previous year)
- 2013: $299,514 (+$17,216, +6.10% from previous year)
- 2014: $314,487 (+$14,972, +5.00% from previous year)
- 2015: $337,695 (+$23,209, +7.38% from previous year)
- 2016: $353,744 (+$16,049, +4.75% from previous year)
- 2017: $374,770 (+$21,027, +5.94% from previous year)
- 2018: $392,589 (+$17,819, +4.75% from previous year)
- 2019: $409,474 (+$16,885, +4.30% from previous year)
- 2020: $429,009 (+$19,535, +4.77% from previous year)
- 2021: $514,926 (+$85,916, +20.03% from previous year)
- 2022: $649,395 (+$134,469, +26.11% from previous year)
- 2023: $674,507 (+$25,113, +3.87% from previous year)
- 2024: $718,797 (+$44,290, +6.57% from previous year)
- 2025: $738,411 (+$19,614, +2.73% from previous year)
Home values in Meggett have risen by 137% since 2010, with explosive appreciation during the 2020–2022 housing boom. While the pace has tempered, prices remain high as buyers continue to value its combination of privacy, space, and natural surroundings.
Meggett – Country Setting with Coastal Proximity
Meggett is a rural town in Charleston County bordered by marshlands and creeks that feed into the Atlantic. With a population of under 2,000, the town offers large lots, waterfront acreage, and quiet roads that attract buyers seeking a slower pace near the coast. Its location—about 20 miles southwest of Charleston—makes it a viable retreat for those looking to stay close to the city while enjoying privacy.
Unlike resort-focused beach towns, Meggett’s real estate market is driven by custom homes, small farms, and estate-style living. Prices climbed significantly as remote work and lifestyle shifts pushed more buyers toward secluded areas. The 2025 average home price now exceeds $738,000, showing that this hidden corner of the Lowcountry has entered the luxury tier.
11. Edisto Beach – 141% Home Price Increase Since 2010
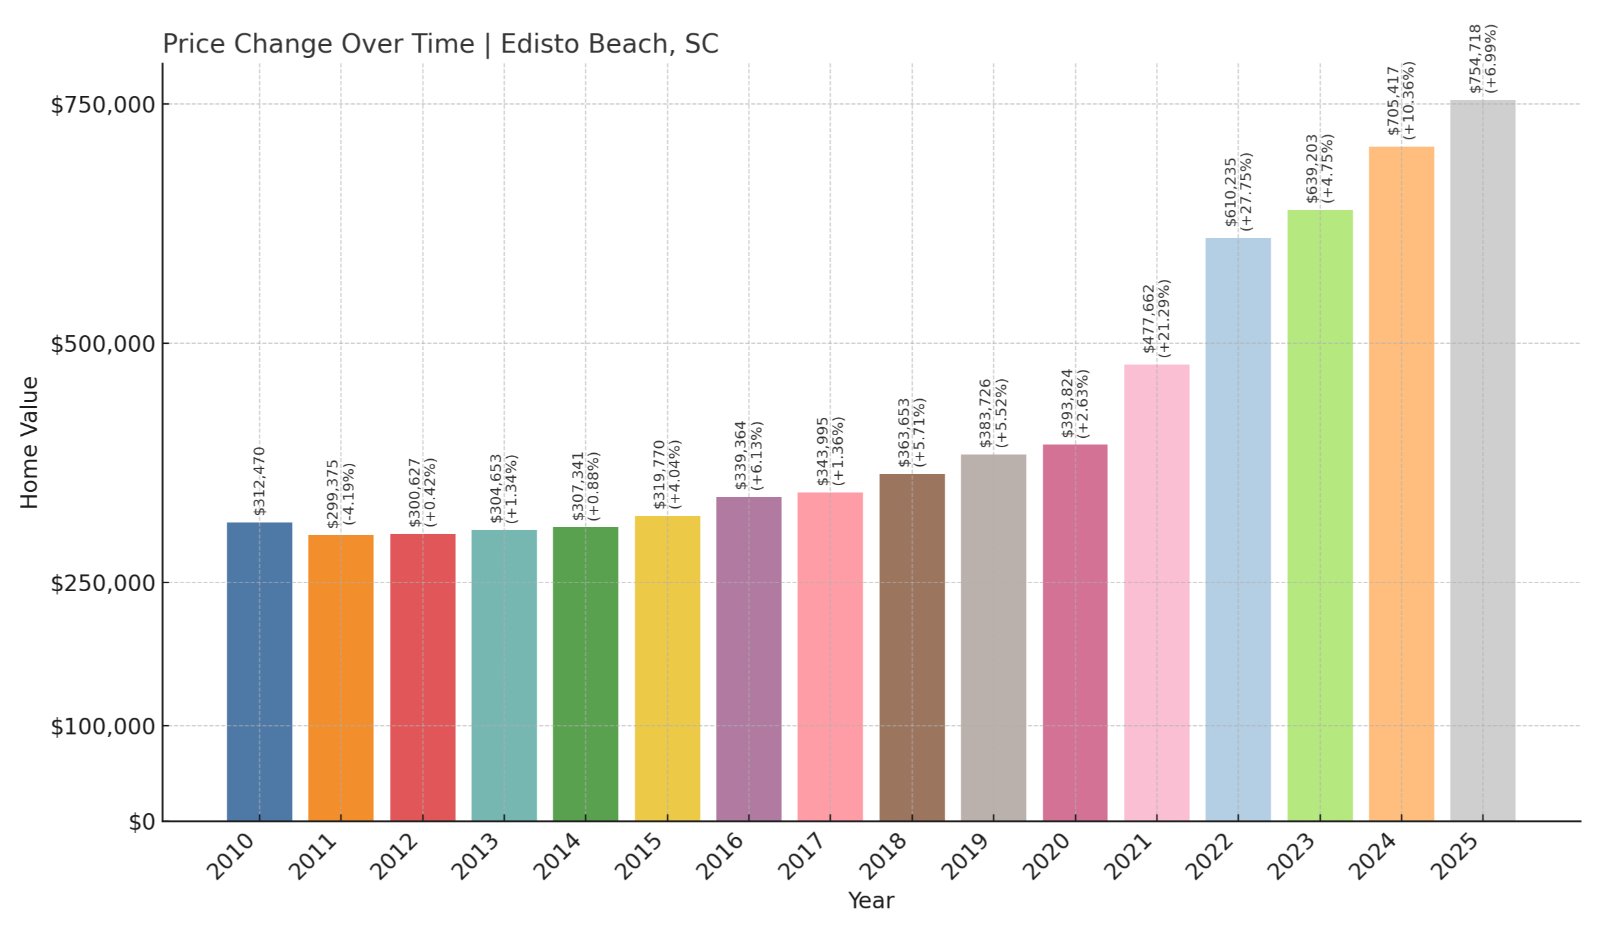
- 2010: $312,470
- 2011: $299,375 (-$13,095, -4.19% from previous year)
- 2012: $300,627 (+$1,253, +0.42% from previous year)
- 2013: $304,653 (+$4,026, +1.34% from previous year)
- 2014: $307,341 (+$2,688, +0.88% from previous year)
- 2015: $319,770 (+$12,428, +4.04% from previous year)
- 2016: $339,364 (+$19,594, +6.13% from previous year)
- 2017: $343,995 (+$4,631, +1.36% from previous year)
- 2018: $363,653 (+$19,658, +5.71% from previous year)
- 2019: $383,726 (+$20,072, +5.52% from previous year)
- 2020: $393,824 (+$10,099, +2.63% from previous year)
- 2021: $477,662 (+$83,838, +21.29% from previous year)
- 2022: $610,235 (+$132,573, +27.75% from previous year)
- 2023: $639,203 (+$28,968, +4.75% from previous year)
- 2024: $705,417 (+$66,214, +10.36% from previous year)
- 2025: $754,718 (+$49,301, +6.99% from previous year)
Edisto Beach has seen a 141% rise in home prices since 2010. Appreciation surged particularly in 2021 and 2022 and has continued upward, with the 2025 average home price nearing $755,000.
Edisto Beach – A Quiet Beachfront Alternative
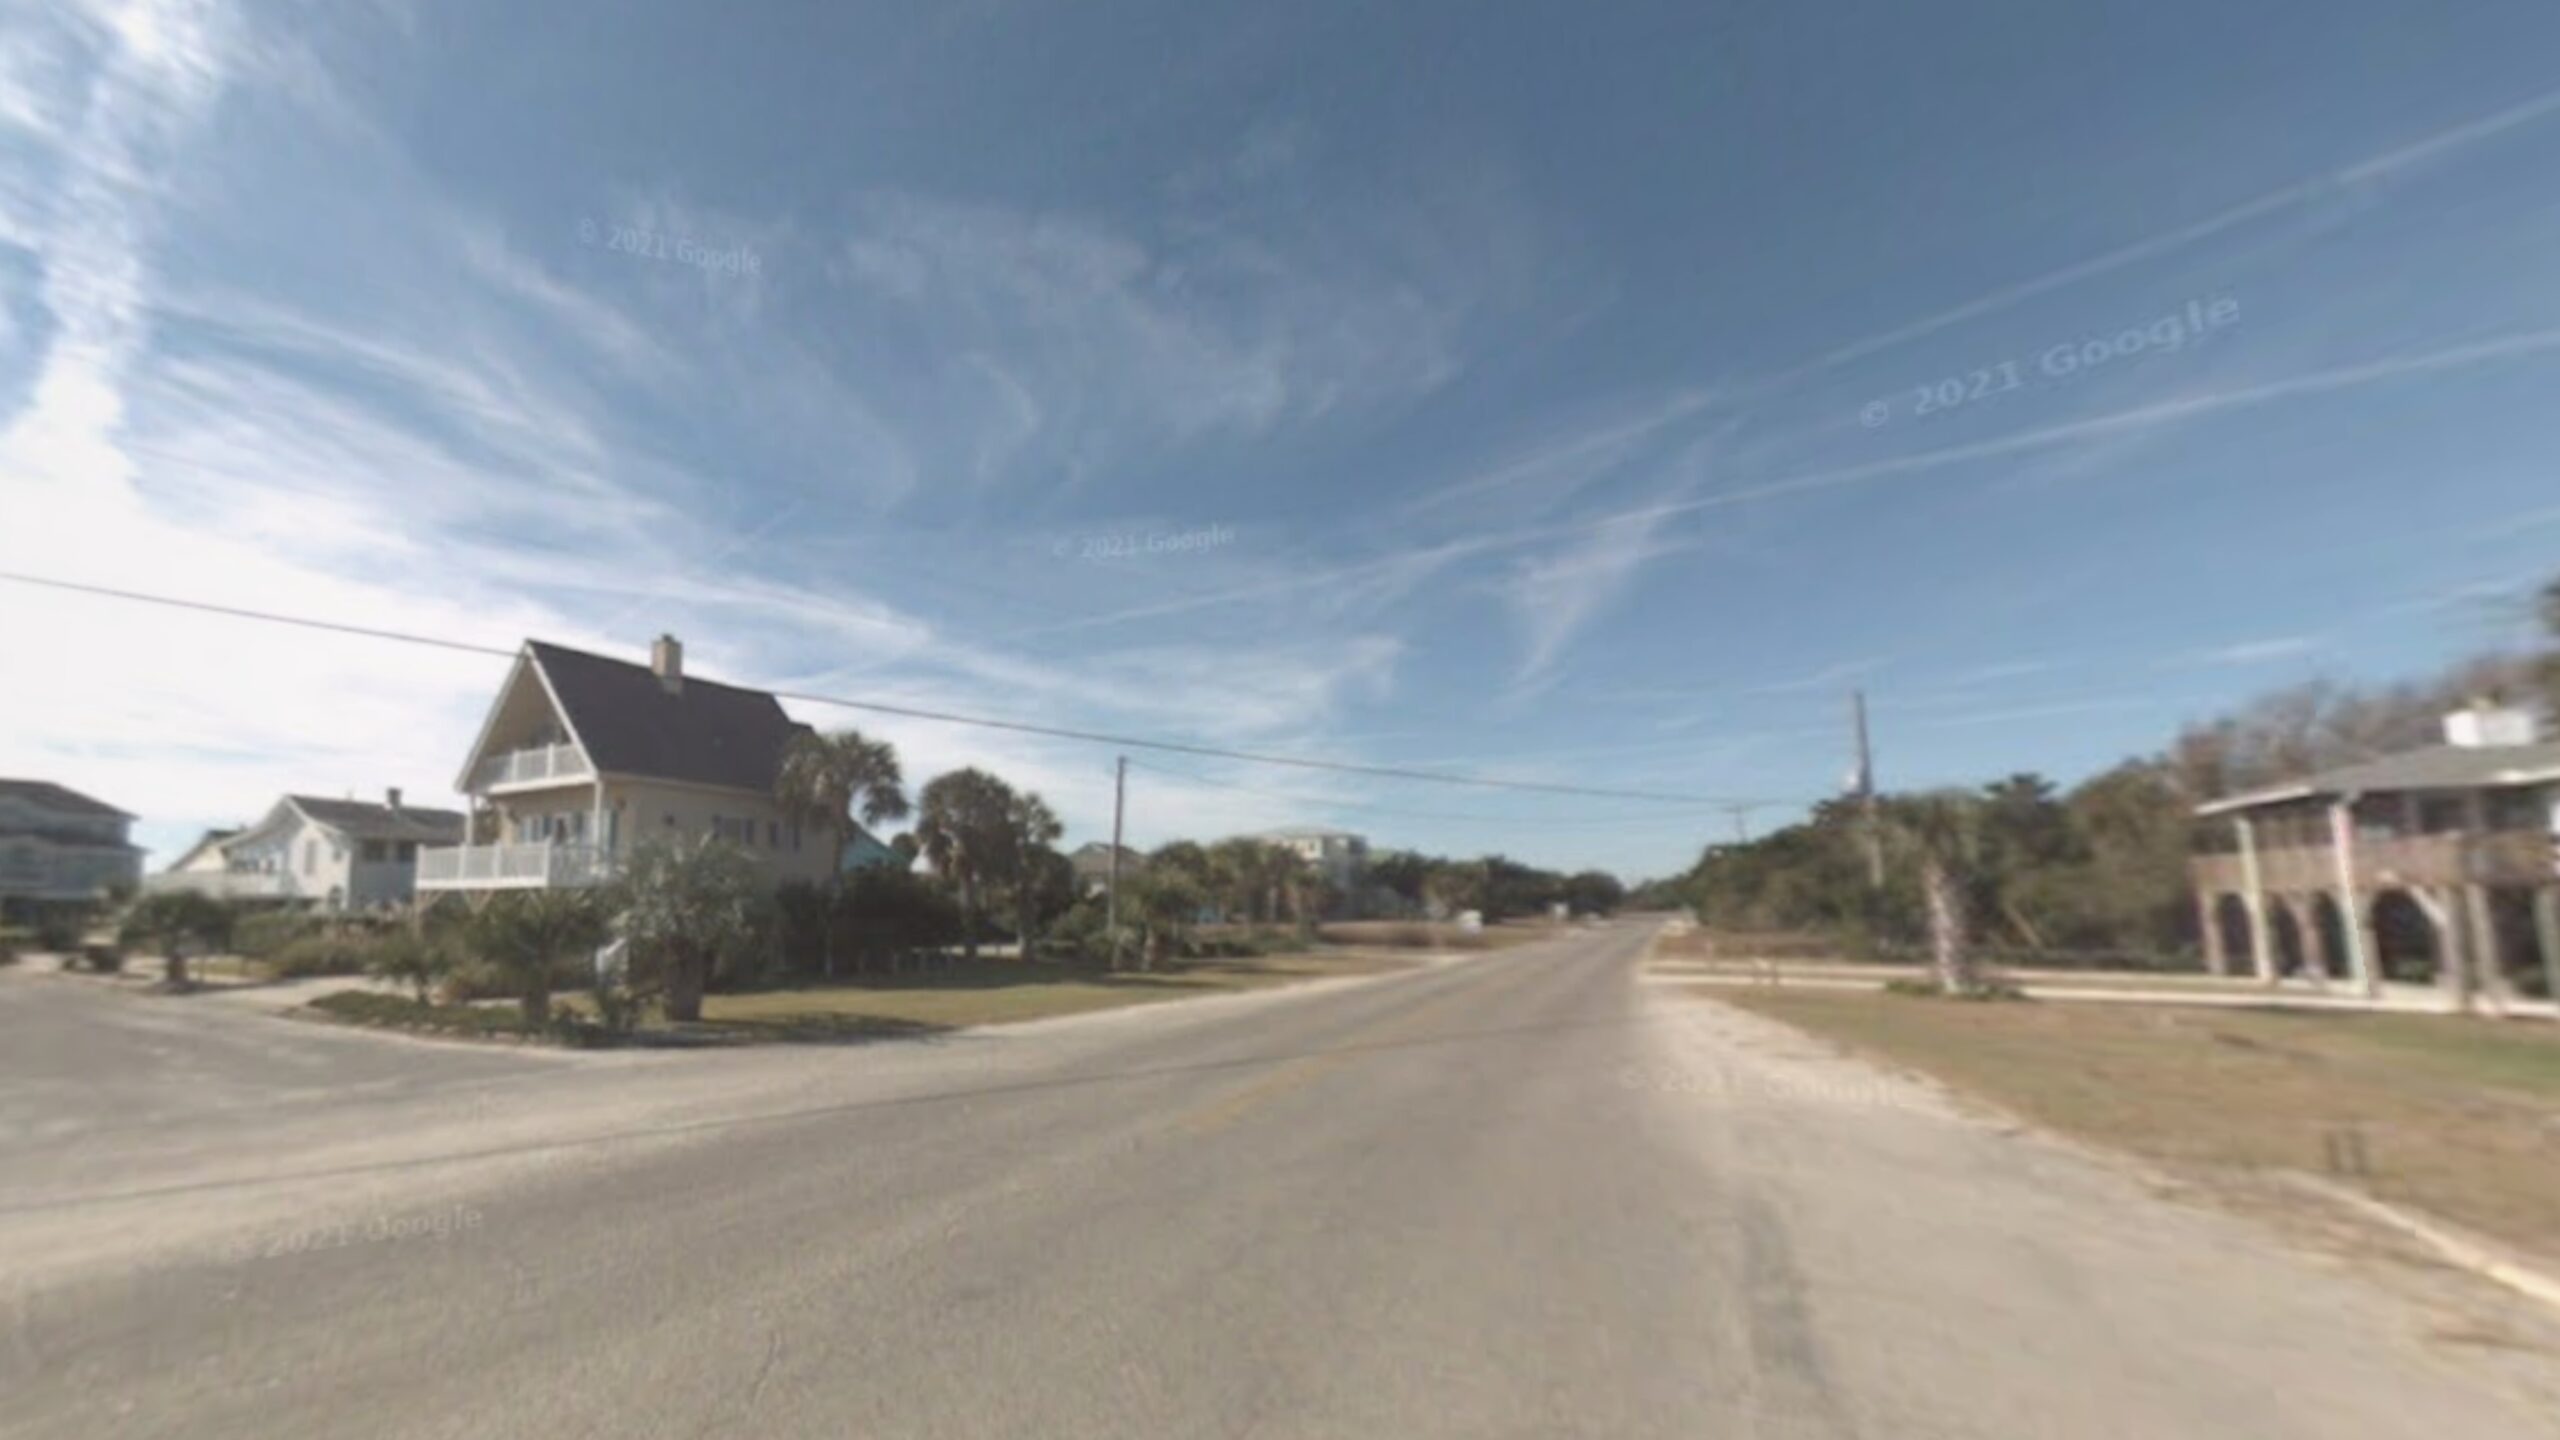
Edisto Beach, on the southern end of Edisto Island, is one of the few South Carolina beaches where commercial development has remained minimal. With no high-rises and a strong preservation ethic, the town has become a haven for vacationers and second-home owners seeking a more relaxed coastal environment.
Despite its small size, the island offers restaurants, golf, and access to the protected Edisto Island State Park. Its limited housing stock and strong demand for vacation homes have pushed prices steadily upward. The market here has been especially active post-2020 as remote work opened the door for more extended stays and permanent moves to beach communities.
10. Hilton Head Island – 99% Home Price Increase Since 2010
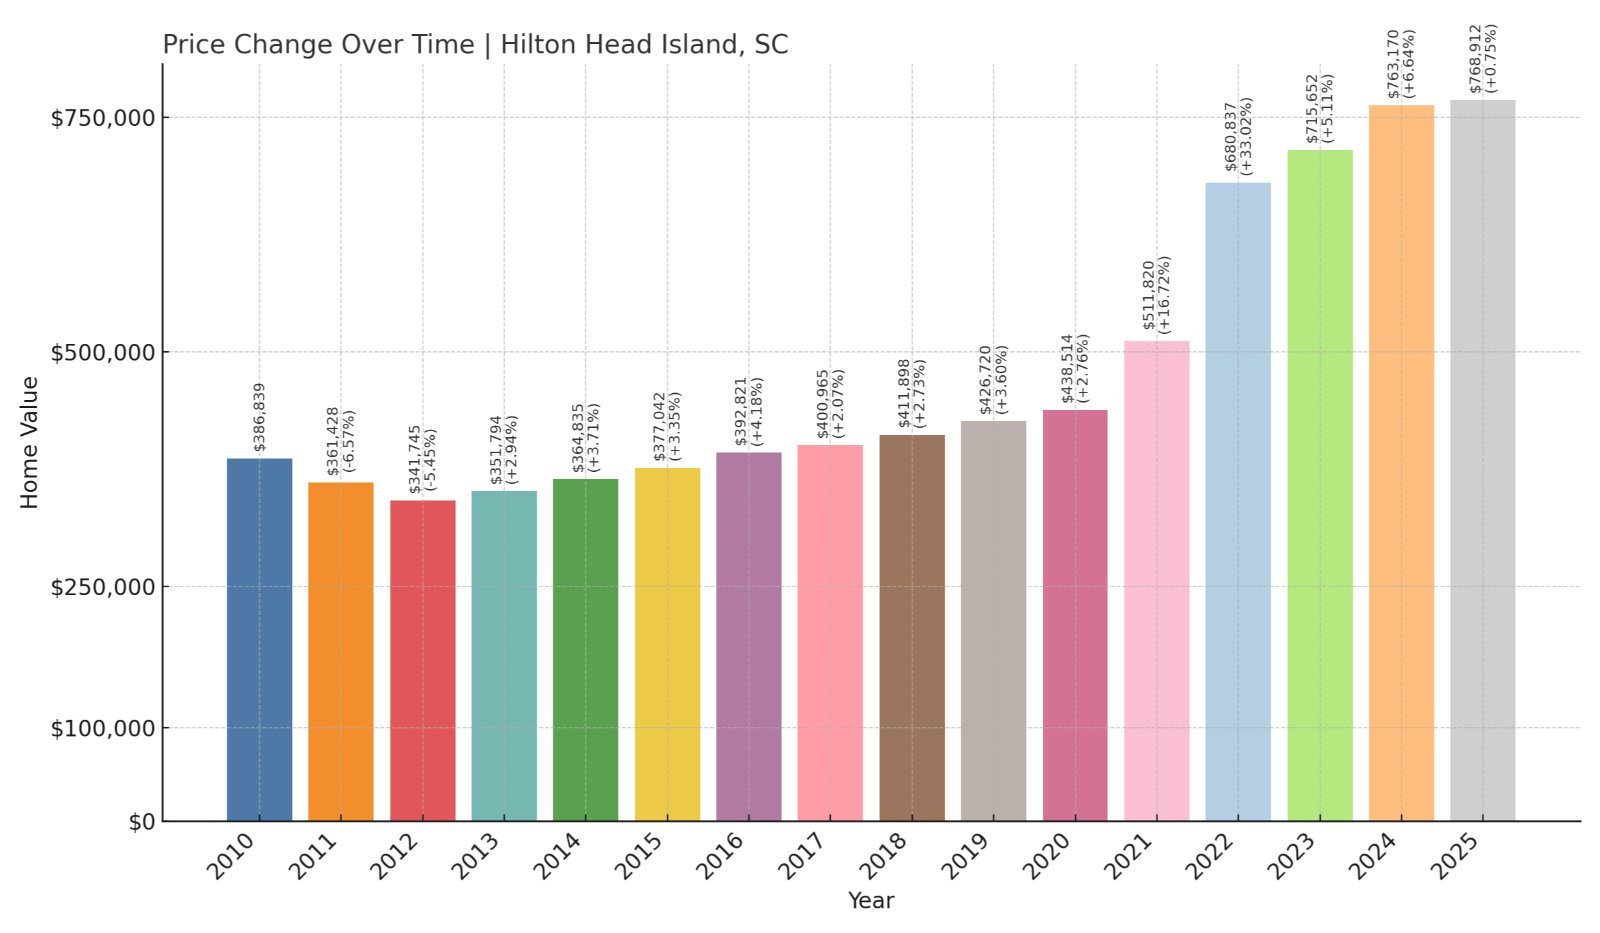
- 2010: $386,839
- 2011: $361,428 (-$25,411, -6.57% from previous year)
- 2012: $341,745 (-$19,682, -5.45% from previous year)
- 2013: $351,794 (+$10,049, +2.94% from previous year)
- 2014: $364,835 (+$13,041, +3.71% from previous year)
- 2015: $377,042 (+$12,207, +3.35% from previous year)
- 2016: $392,821 (+$15,779, +4.19% from previous year)
- 2017: $400,965 (+$8,144, +2.07% from previous year)
- 2018: $411,898 (+$10,933, +2.73% from previous year)
- 2019: $426,720 (+$14,823, +3.60% from previous year)
- 2020: $438,514 (+$11,793, +2.76% from previous year)
- 2021: $511,820 (+$73,306, +16.72% from previous year)
- 2022: $680,837 (+$169,017, +33.02% from previous year)
- 2023: $715,652 (+$34,815, +5.11% from previous year)
- 2024: $763,170 (+$47,517, +6.64% from previous year)
- 2025: $768,912 (+$5,743, +0.75% from previous year)
Home prices in Hilton Head Island have grown by 99% since 2010. Though growth was modest for the first decade, values exploded between 2020 and 2022, pushing the average price to over $768,000 in 2025.
Hilton Head Island – Resort Living with Staying Power
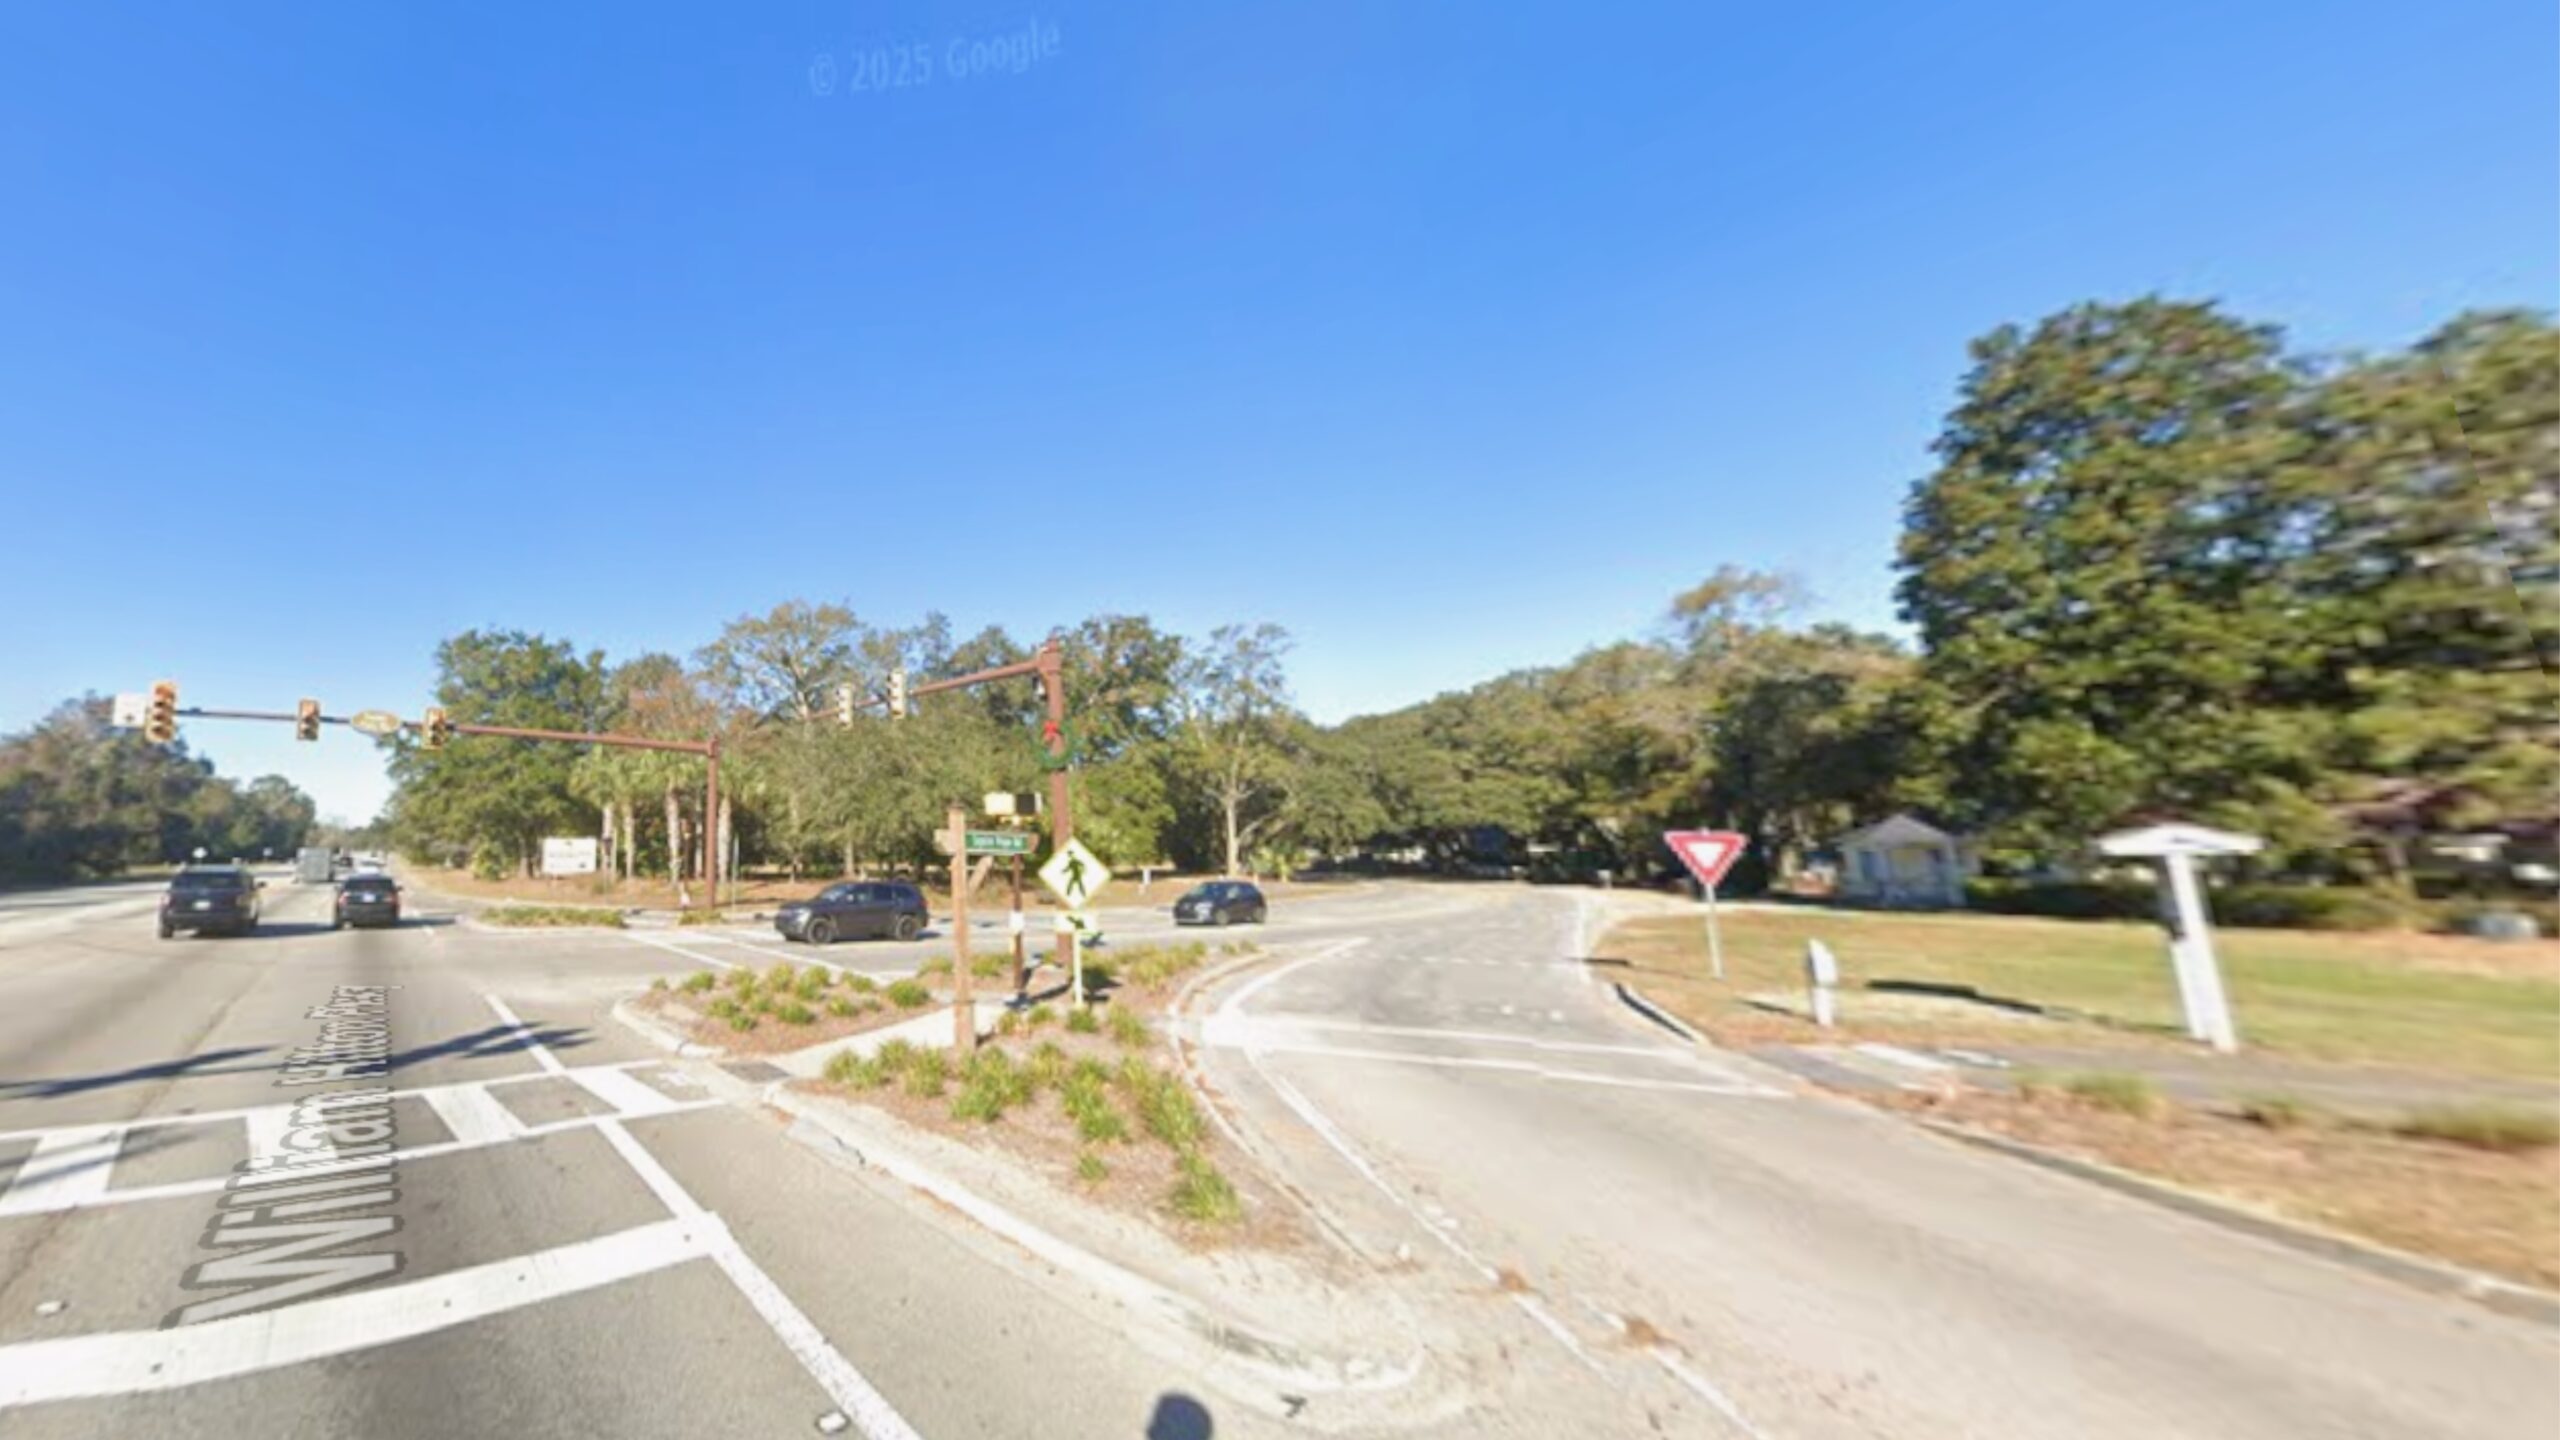
Hilton Head Island is South Carolina’s premier resort destination, known for its golf courses, beaches, and high-end gated communities. With more than 12 miles of shoreline and a wide range of dining and recreation, it attracts retirees, investors, and second-home buyers from around the country.
Though price appreciation has slowed in the last year, the island’s desirability remains high. Developments like Sea Pines, Palmetto Dunes, and Harbour Town continue to draw luxury buyers. The island’s strong brand recognition, excellent infrastructure, and mature tourism economy make it one of the state’s most stable high-value markets.
9. Awendaw – 182% Home Price Increase Since 2010
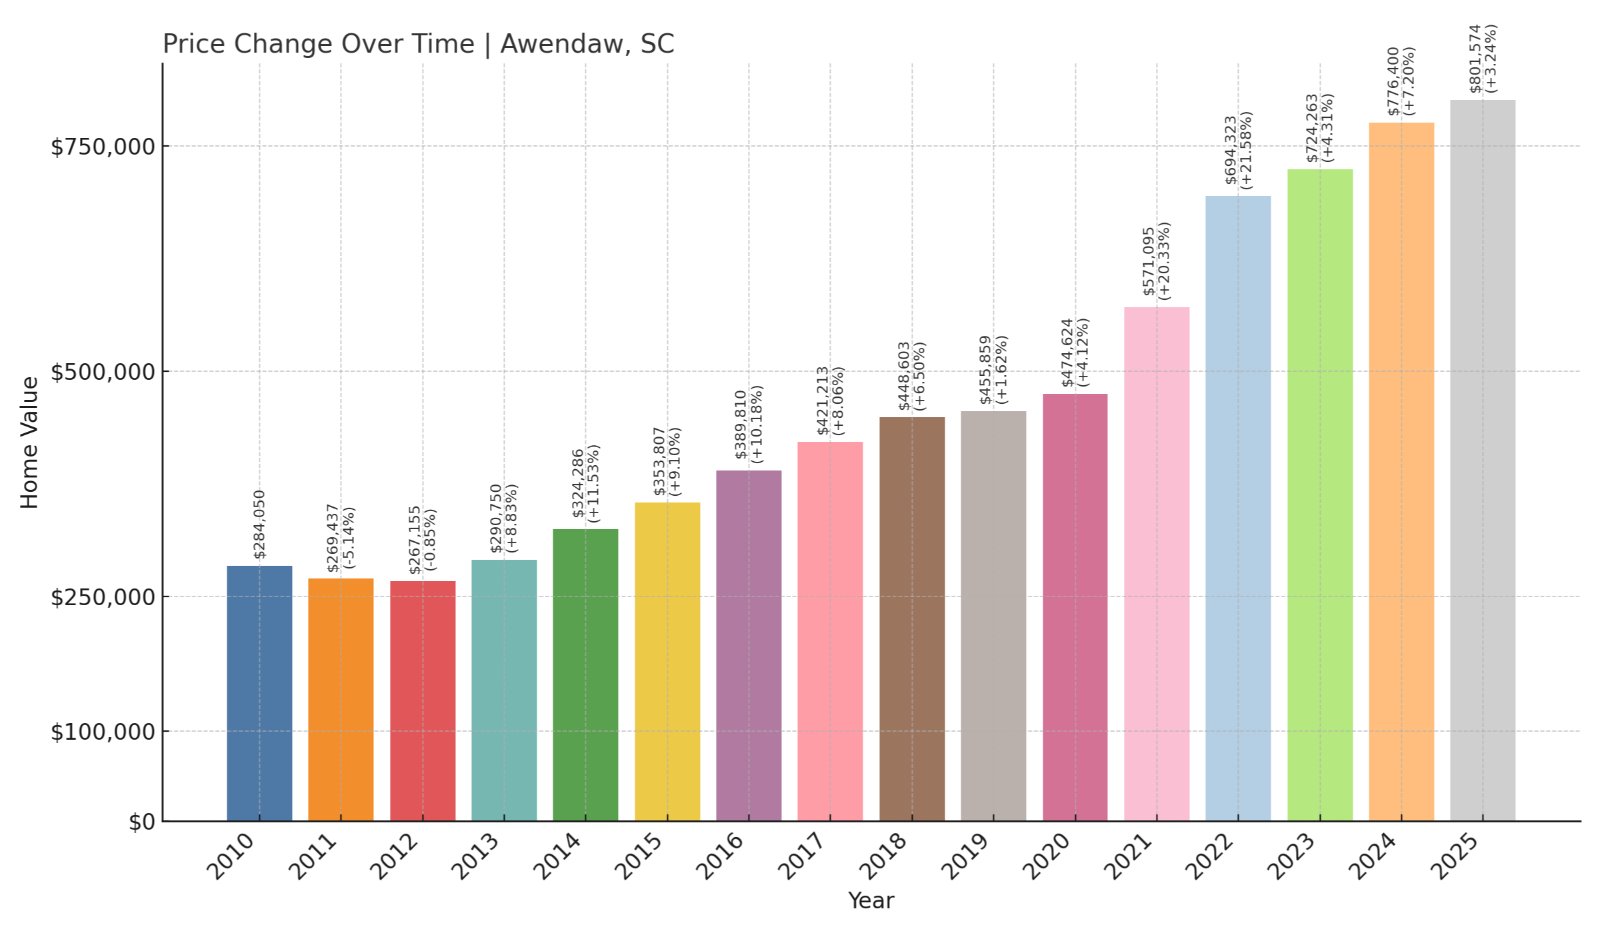
- 2010: $284,050
- 2011: $269,437 (-$14,613, -5.14% from previous year)
- 2012: $267,155 (-$2,282, -0.85% from previous year)
- 2013: $290,750 (+$23,595, +8.83% from previous year)
- 2014: $324,286 (+$33,536, +11.53% from previous year)
- 2015: $353,807 (+$29,521, +9.10% from previous year)
- 2016: $389,810 (+$36,002, +10.18% from previous year)
- 2017: $421,213 (+$31,403, +8.06% from previous year)
- 2018: $448,603 (+$27,390, +6.50% from previous year)
- 2019: $455,859 (+$7,256, +1.62% from previous year)
- 2020: $474,624 (+$18,765, +4.12% from previous year)
- 2021: $571,095 (+$96,471, +20.33% from previous year)
- 2022: $694,323 (+$123,229, +21.58% from previous year)
- 2023: $724,263 (+$29,940, +4.31% from previous year)
- 2024: $776,400 (+$52,137, +7.20% from previous year)
- 2025: $801,574 (+$25,174, +3.24% from previous year)
Home values in Awendaw have nearly tripled since 2010, rising by 182%. Its strong appreciation in the past decade reflects increasing interest in rural-semi-coastal living with room to grow and build.
Awendaw – Space to Build, Close to Charleston
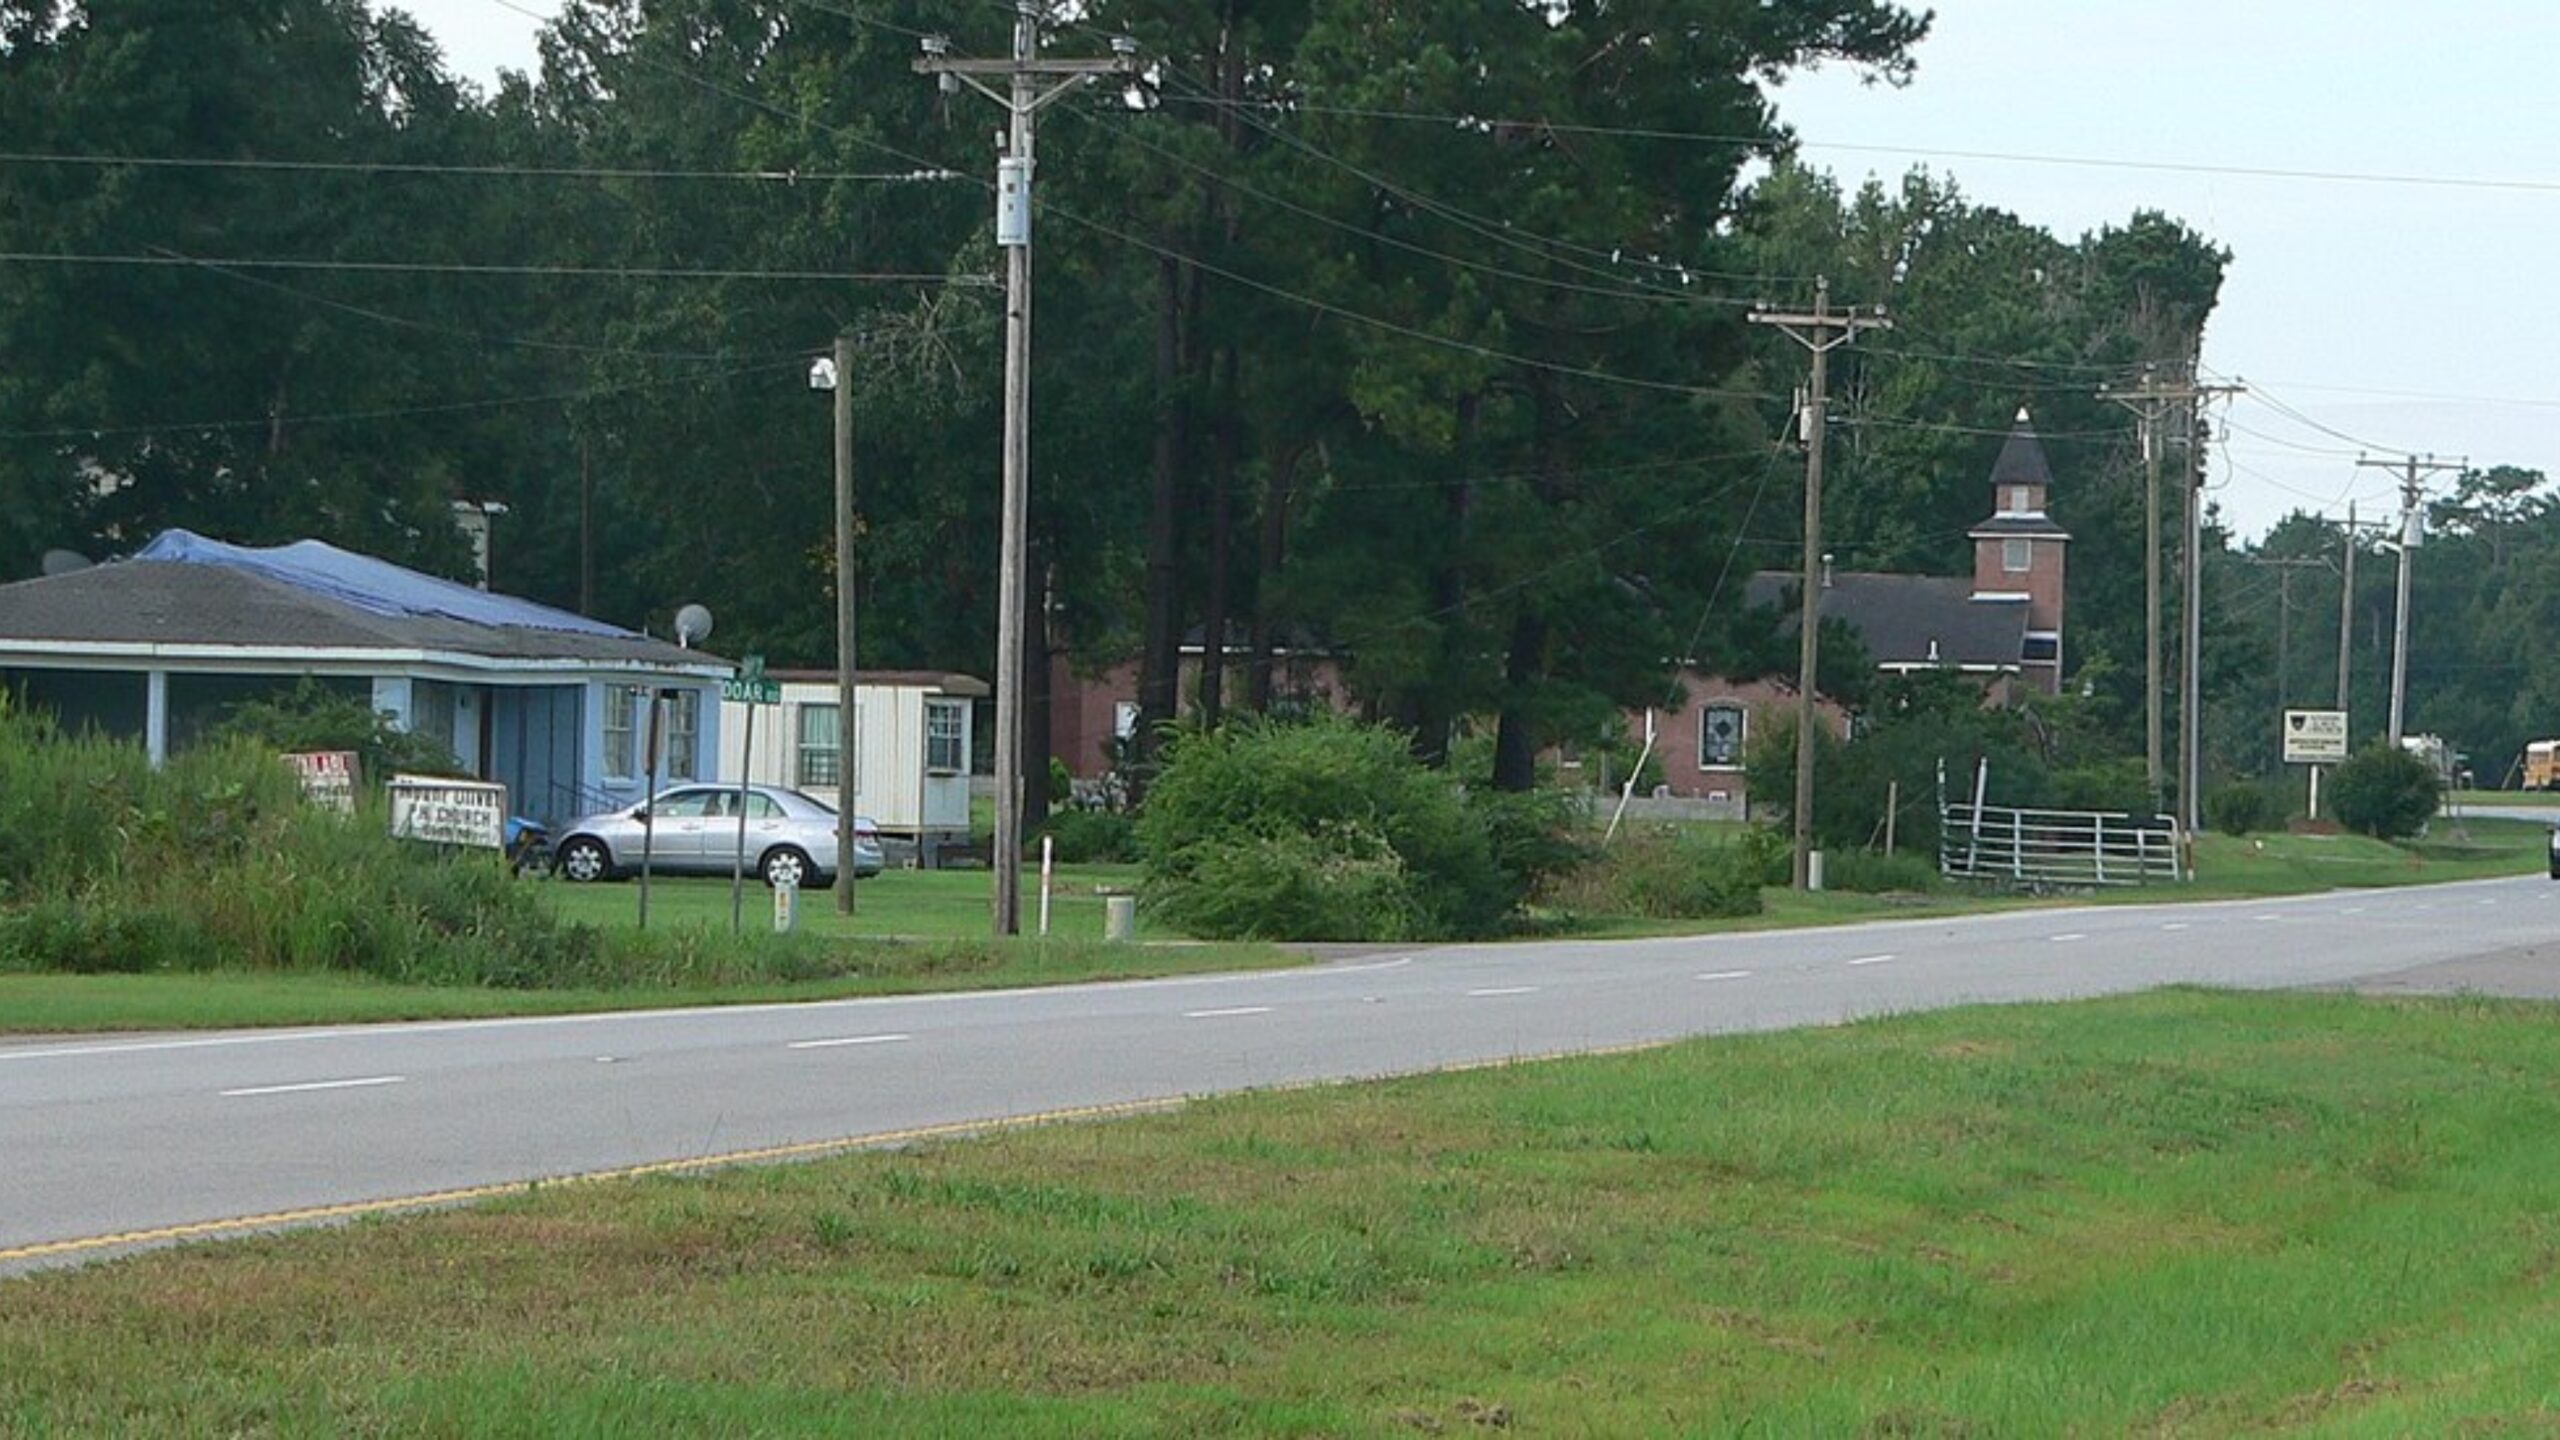
Located just north of Mount Pleasant, Awendaw is a spacious, semi-rural town surrounded by the Francis Marion National Forest and the Intracoastal Waterway. It offers larger parcels of land, newer homes, and a slower pace that appeals to those wanting more space near Charleston’s metro area.
Awendaw’s explosive growth is partly due to its development potential. As nearby areas have filled in, buyers and developers have increasingly looked northward. The town’s proximity to outdoor activities, nature preserves, and Highway 17 has made it a compelling location for high-end new builds and large custom homes.
8. Mount Pleasant – 183% Home Price Increase Since 2010
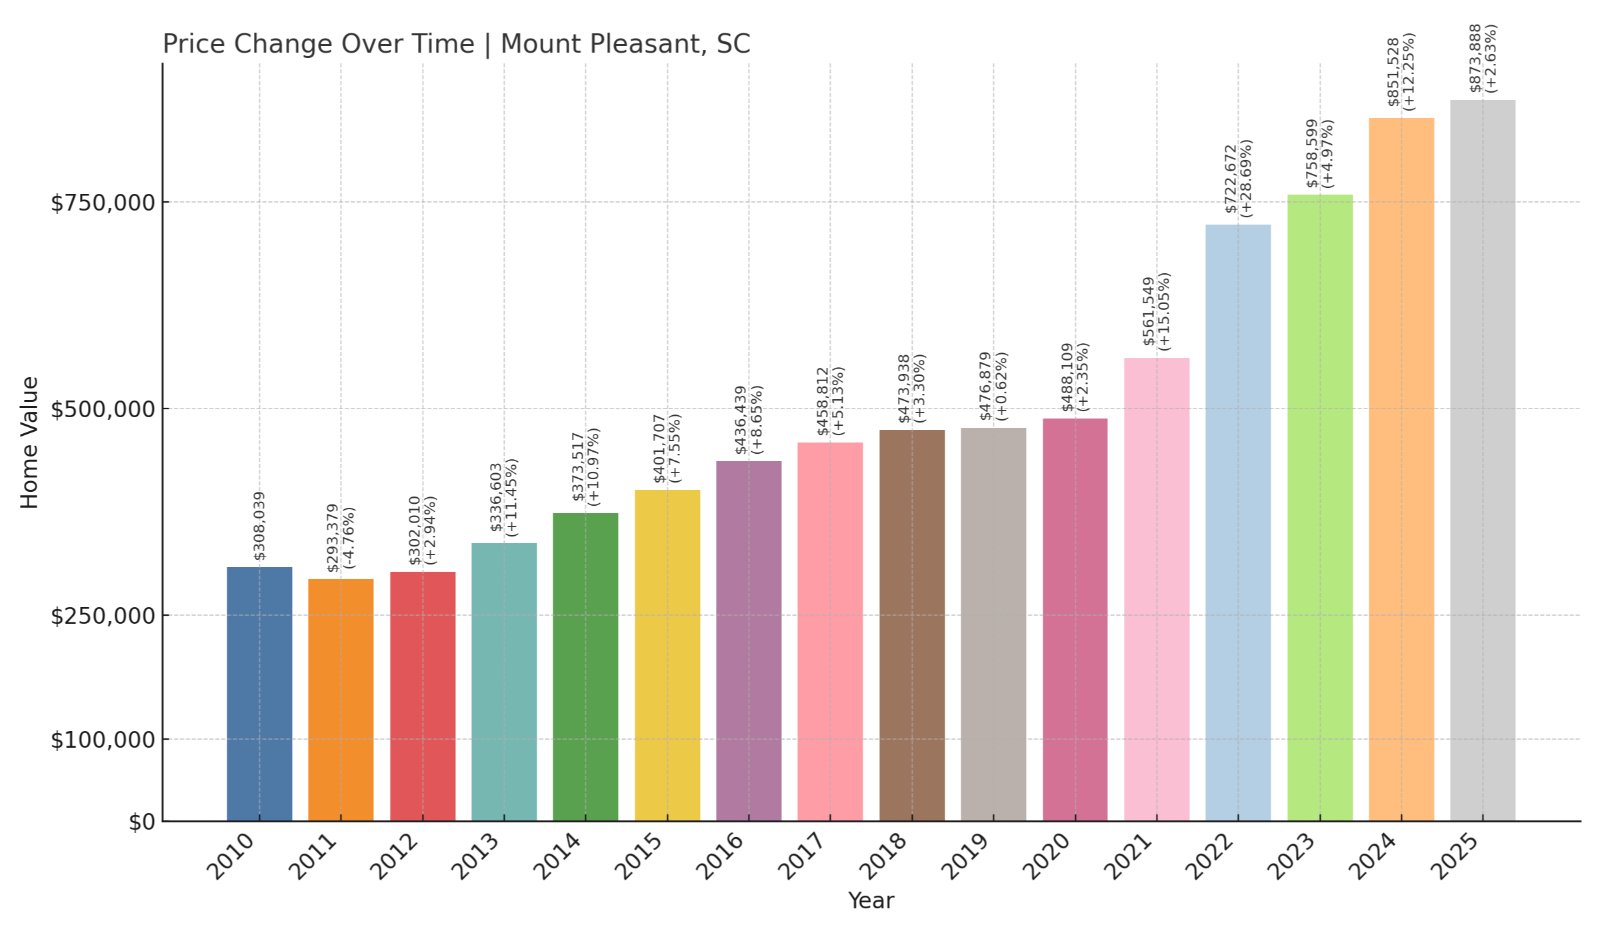
- 2010: $308,039
- 2011: $293,379 (-$14,660, -4.76% from previous year)
- 2012: $302,010 (+$8,631, +2.94% from previous year)
- 2013: $336,603 (+$34,593, +11.45% from previous year)
- 2014: $373,517 (+$36,914, +10.97% from previous year)
- 2015: $401,707 (+$28,190, +7.55% from previous year)
- 2016: $436,439 (+$34,732, +8.65% from previous year)
- 2017: $458,812 (+$22,374, +5.13% from previous year)
- 2018: $473,938 (+$15,126, +3.30% from previous year)
- 2019: $476,879 (+$2,941, +0.62% from previous year)
- 2020: $488,109 (+$11,230, +2.35% from previous year)
- 2021: $561,549 (+$73,440, +15.05% from previous year)
- 2022: $722,672 (+$161,123, +28.69% from previous year)
- 2023: $758,599 (+$35,927, +4.97% from previous year)
- 2024: $851,528 (+$92,928, +12.25% from previous year)
- 2025: $873,888 (+$22,360, +2.63% from previous year)
Mount Pleasant has seen home values jump by 183% since 2010, driven by population growth, expanding infrastructure, and its popularity as a Charleston suburb. Its steady price gains have positioned it as one of South Carolina’s most competitive markets.
Mount Pleasant – Charleston’s Premier Suburb

Mount Pleasant, located just across the Cooper River from Charleston, offers a balance of suburban comfort and coastal charm. With access to top schools, well-planned neighborhoods, and amenities like the Waterfront Park and Shem Creek dining district, it’s long been one of the most desirable towns in the state.
The surge in prices reflects high demand and limited space for new development. Buyers are drawn to its proximity to downtown Charleston, beaches like Isle of Palms and Sullivan’s Island, and a family-friendly atmosphere. The town has continued to grow despite higher prices, and in 2025, home values exceed $870,000 on average.
7. Seabrook Island – 108% Home Price Increase Since 2010
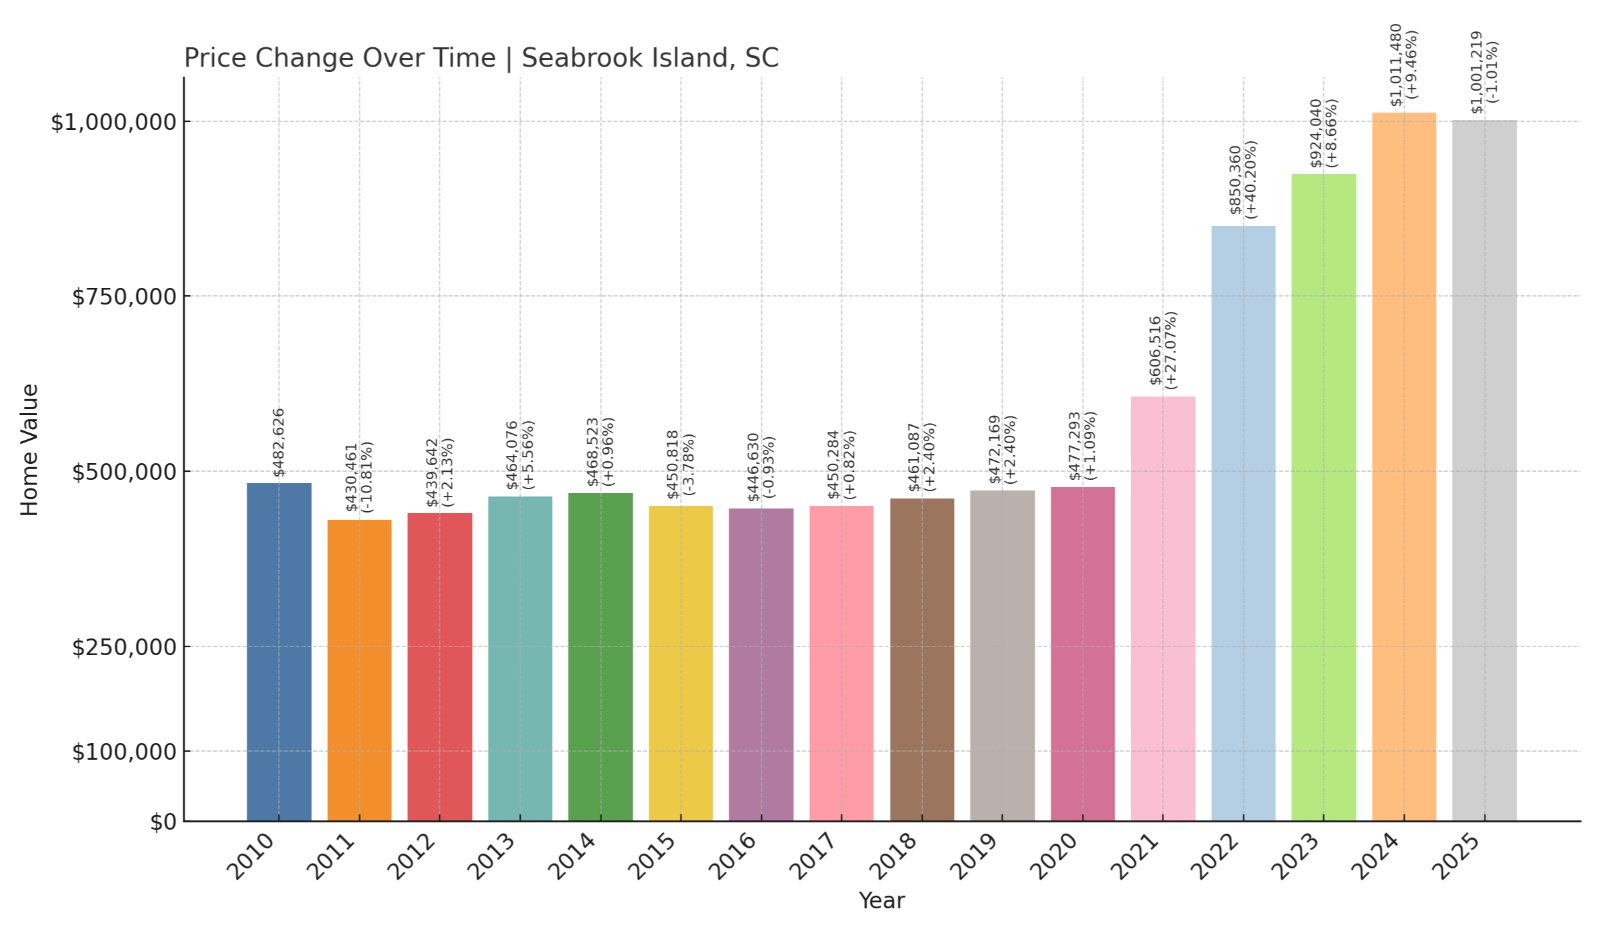
- 2010: $482,626
- 2011: $430,461 (-$52,165, -10.81% from previous year)
- 2012: $439,642 (+$9,181, +2.13% from previous year)
- 2013: $464,076 (+$24,433, +5.56% from previous year)
- 2014: $468,523 (+$4,448, +0.96% from previous year)
- 2015: $450,818 (-$17,706, -3.78% from previous year)
- 2016: $446,630 (-$4,187, -0.93% from previous year)
- 2017: $450,284 (+$3,654, +0.82% from previous year)
- 2018: $461,087 (+$10,802, +2.40% from previous year)
- 2019: $472,169 (+$11,082, +2.40% from previous year)
- 2020: $477,293 (+$5,124, +1.09% from previous year)
- 2021: $606,516 (+$129,223, +27.07% from previous year)
- 2022: $850,360 (+$243,845, +40.20% from previous year)
- 2023: $924,040 (+$73,680, +8.66% from previous year)
- 2024: $1,011,480 (+$87,440, +9.46% from previous year)
- 2025: $1,001,219 (-$10,261, -1.01% from previous year)
Home values in Seabrook Island have risen 108% since 2010, with a dramatic upswing between 2020 and 2022. Though 2025 shows a slight pullback, the market remains elevated compared to a decade ago.
Seabrook Island – Private Island Living at a Premium
Seabrook Island is a gated residential island located southwest of Kiawah, known for its quiet beaches, equestrian center, golf courses, and luxurious homes. Unlike some more commercialized beach destinations, Seabrook caters to a full-time and part-time community looking for a slower pace and high-end amenities.
The island’s home values skyrocketed during the pandemic as affluent buyers sought private, coastal escapes. Prices have stabilized in recent months, but Seabrook remains among the most expensive zip codes in South Carolina. In 2025, home values still hover around $1 million, reflecting sustained demand and limited inventory.
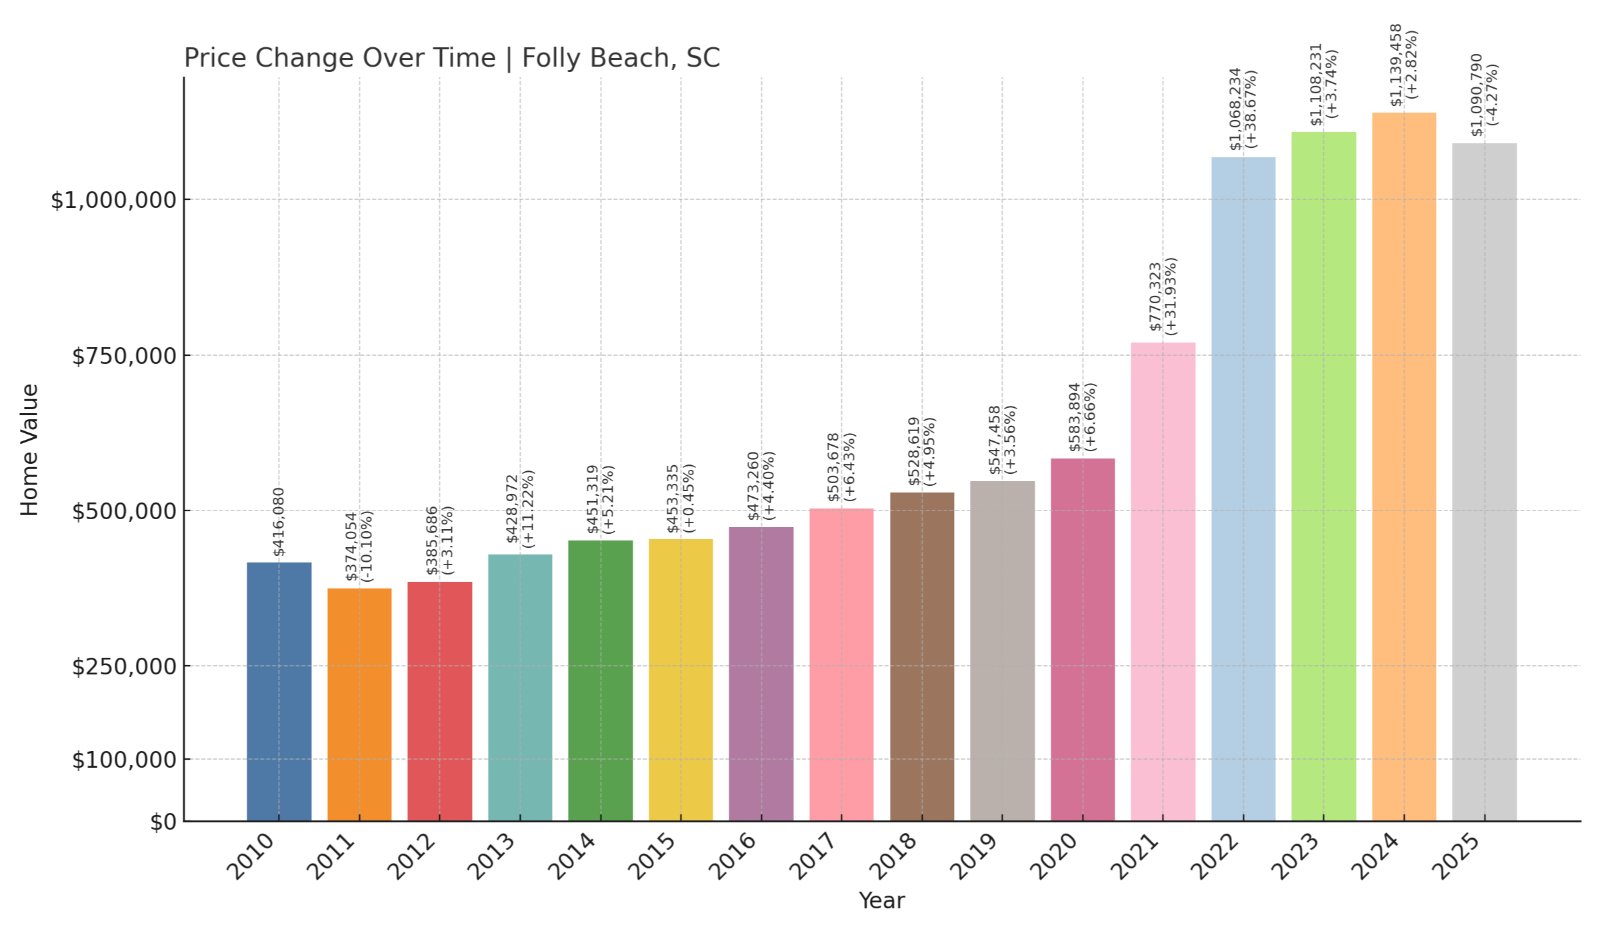
6. Folly Beach – 162% Home Price Increase Since 2010
🔥 Would you like to save this?
- 2010: $416,080
- 2011: $374,054 (-$42,027, -10.10% from previous year)
- 2012: $385,686 (+$11,632, +3.11% from previous year)
- 2013: $428,972 (+$43,286, +11.22% from previous year)
- 2014: $451,319 (+$22,346, +5.21% from previous year)
- 2015: $453,335 (+$2,017, +0.45% from previous year)
- 2016: $473,260 (+$19,925, +4.40% from previous year)
- 2017: $503,678 (+$30,418, +6.43% from previous year)
- 2018: $528,619 (+$24,941, +4.95% from previous year)
- 2019: $547,458 (+$18,839, +3.56% from previous year)
- 2020: $583,894 (+$36,436, +6.66% from previous year)
- 2021: $770,323 (+$186,429, +31.93% from previous year)
- 2022: $1,068,234 (+$297,911, +38.67% from previous year)
- 2023: $1,108,231 (+$39,997, +3.74% from previous year)
- 2024: $1,139,458 (+$31,227, +2.82% from previous year)
- 2025: $1,090,790 (-$48,668, -4.27% from previous year)
Folly Beach home values rose 162% since 2010, peaking in 2022. Prices have dipped slightly in 2025, but the island remains one of the state’s most coveted beachfront markets.
Folly Beach – Laid-Back Vibe Meets Luxury Market
Known as “The Edge of America,” Folly Beach has a unique blend of surf culture and high-end real estate. Located just 11 miles south of downtown Charleston, it draws a mix of vacationers, investors, and year-round residents who value the town’s walkability, beach access, and eclectic character.
Real estate values soared during the pandemic, driven by out-of-state buyers and the area’s popularity on short-term rental platforms. While 2025 saw a slight correction, homes still average around $1.09 million, making Folly one of South Carolina’s most expensive coastal markets.
5. Sunset – 159% Home Price Increase Since 2010
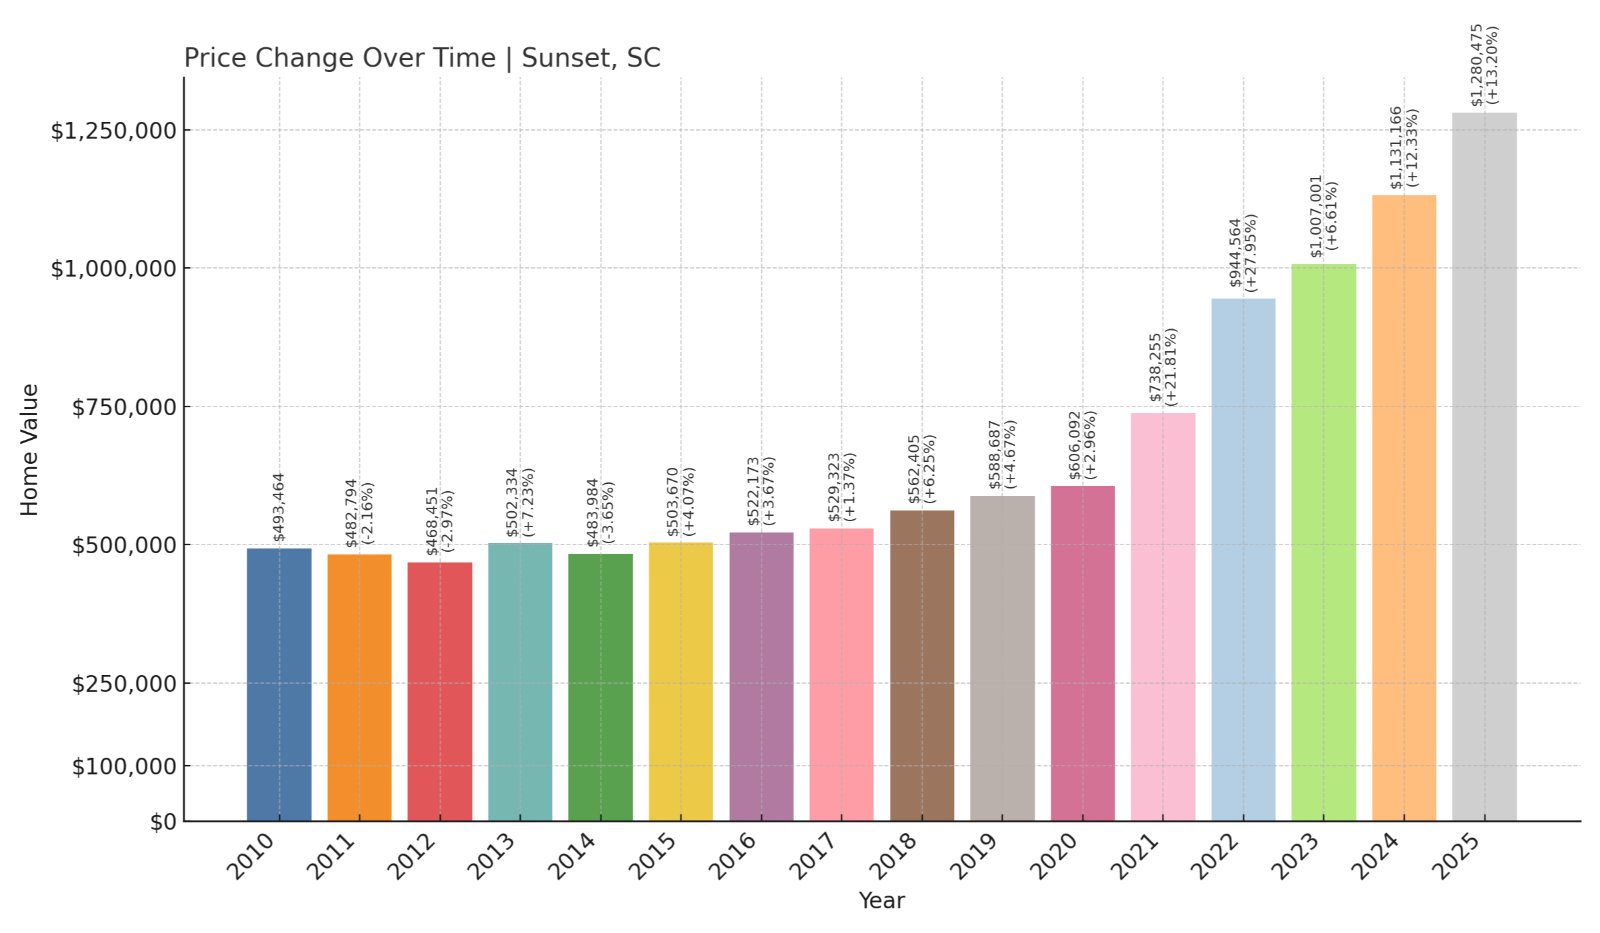
- 2010: $493,464
- 2011: $482,794 (-$10,670, -2.16% from previous year)
- 2012: $468,451 (-$14,343, -2.97% from previous year)
- 2013: $502,334 (+$33,883, +7.23% from previous year)
- 2014: $483,984 (-$18,349, -3.65% from previous year)
- 2015: $503,670 (+$19,686, +4.07% from previous year)
- 2016: $522,173 (+$18,503, +3.67% from previous year)
- 2017: $529,323 (+$7,150, +1.37% from previous year)
- 2018: $562,405 (+$33,081, +6.25% from previous year)
- 2019: $588,687 (+$26,283, +4.67% from previous year)
- 2020: $606,092 (+$17,405, +2.96% from previous year)
- 2021: $738,255 (+$132,163, +21.81% from previous year)
- 2022: $944,564 (+$206,309, +27.95% from previous year)
- 2023: $1,007,001 (+$62,437, +6.61% from previous year)
- 2024: $1,131,166 (+$124,165, +12.33% from previous year)
- 2025: $1,280,475 (+$149,309, +13.20% from previous year)
Sunset’s home values have risen 159% since 2010, with the steepest climbs taking place after 2020. Prices remain on a steep upward trajectory, reaching an average of $1.28 million in 2025.
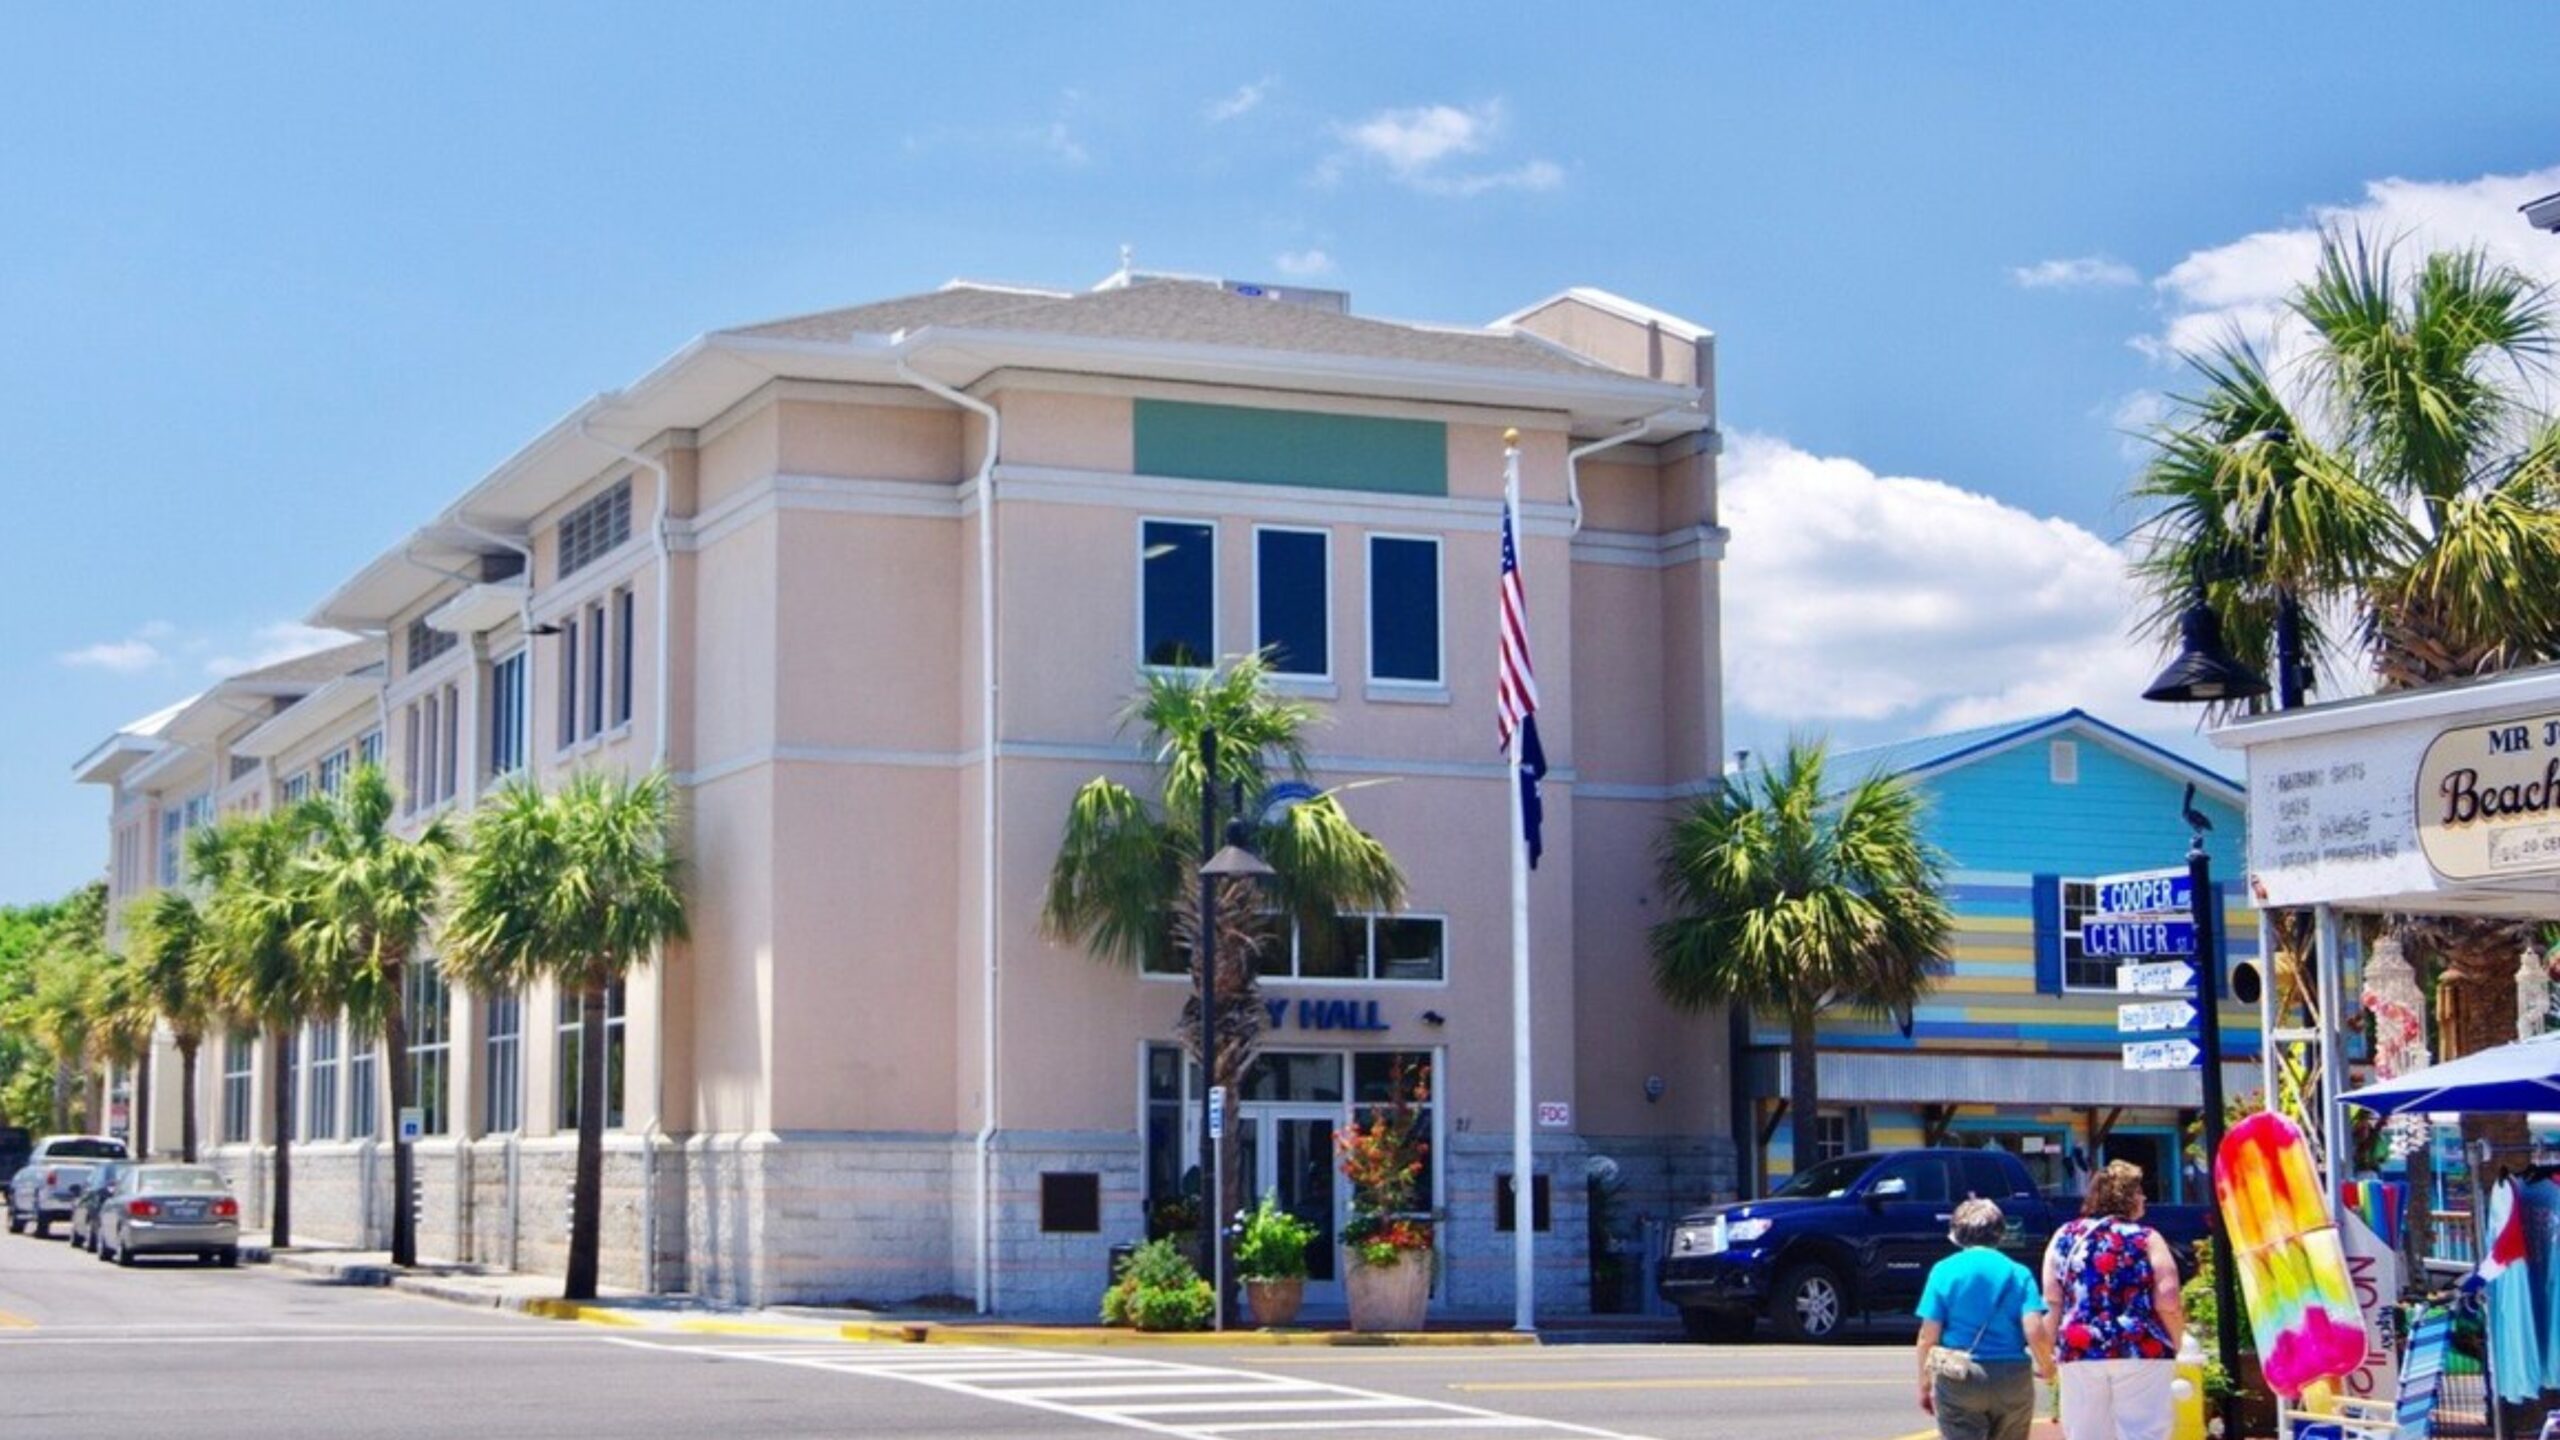
Sunset – Scenic Luxury in the Upstate
Located in the northwest corner of South Carolina near Lake Keowee and the Blue Ridge Mountains, Sunset is known for its luxury gated communities like The Cliffs at Keowee Vineyards. With private golf courses, marina access, and scenic views, the town caters to affluent buyers seeking retreat-style living.
The area’s real estate market has benefitted from its reputation as a premier retirement and second-home destination. Sunset’s high-end appeal continues to attract both regional and out-of-state interest, and with new construction still underway in private enclaves, home values show no sign of cooling.
4. Isle of Palms – 164% Home Price Increase Since 2010
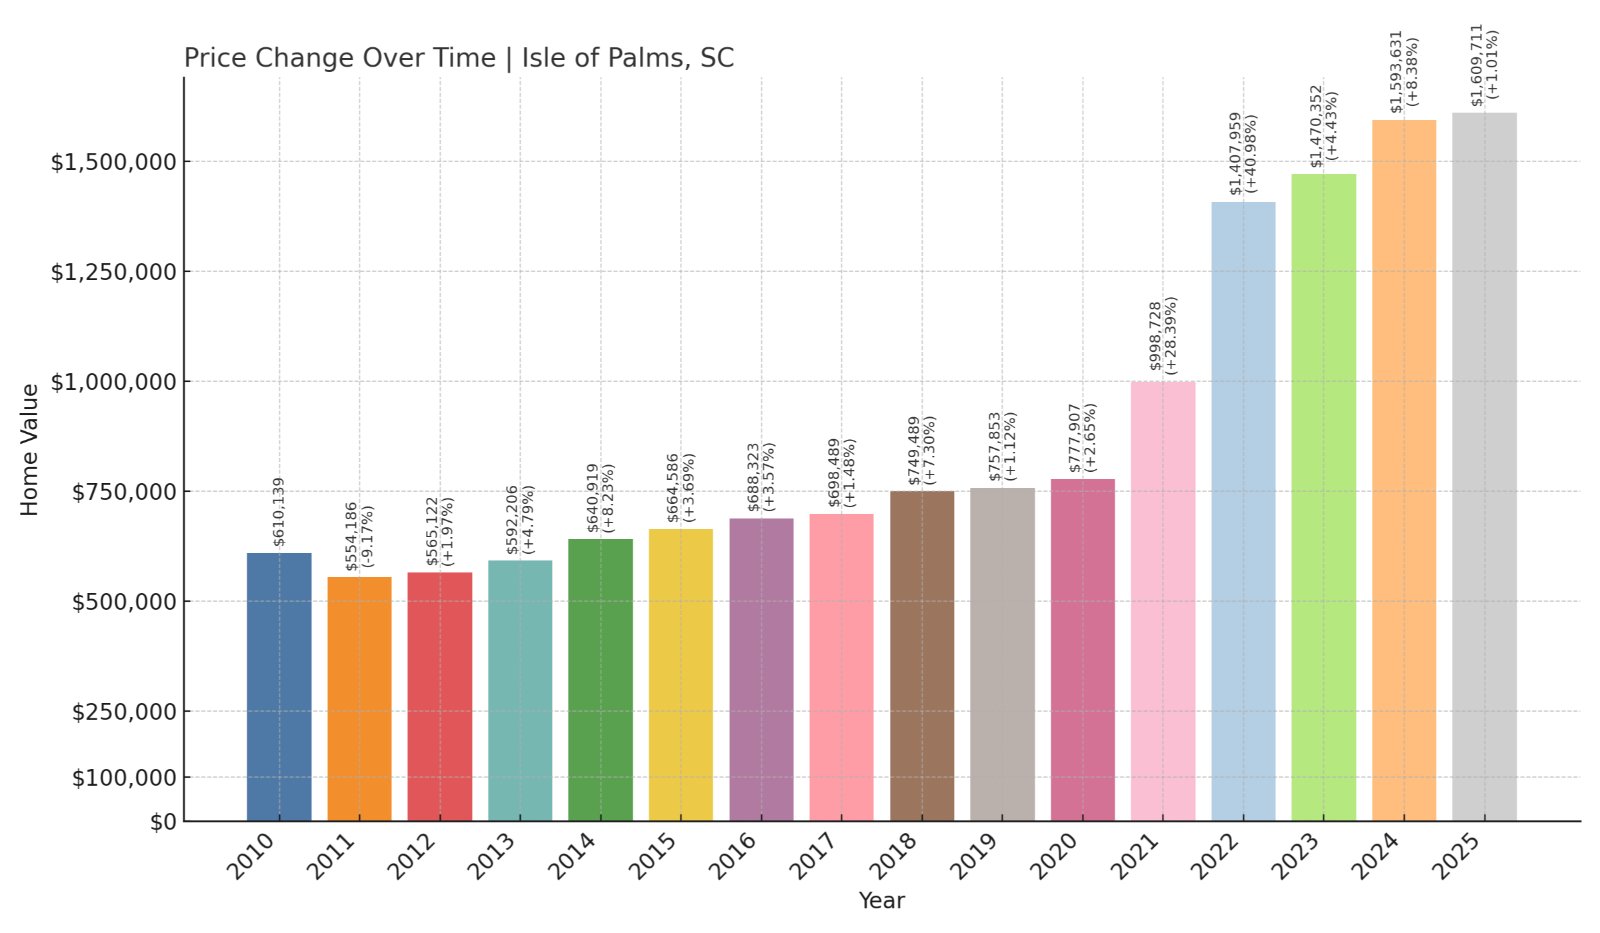
- 2010: $610,139
- 2011: $554,186 (-$55,954, -9.17% from previous year)
- 2012: $565,122 (+$10,936, +1.97% from previous year)
- 2013: $592,206 (+$27,084, +4.79% from previous year)
- 2014: $640,919 (+$48,713, +8.23% from previous year)
- 2015: $664,586 (+$23,667, +3.69% from previous year)
- 2016: $688,323 (+$23,736, +3.57% from previous year)
- 2017: $698,489 (+$10,166, +1.48% from previous year)
- 2018: $749,489 (+$51,000, +7.30% from previous year)
- 2019: $757,853 (+$8,364, +1.12% from previous year)
- 2020: $777,907 (+$20,053, +2.65% from previous year)
- 2021: $998,728 (+$220,822, +28.39% from previous year)
- 2022: $1,407,959 (+$409,231, +40.98% from previous year)
- 2023: $1,470,352 (+$62,393, +4.43% from previous year)
- 2024: $1,593,631 (+$123,279, +8.38% from previous year)
- 2025: $1,609,711 (+$16,080, +1.01% from previous year)
Isle of Palms has experienced a 164% increase in home values since 2010, with a huge acceleration between 2020 and 2022. Although growth has tapered in 2025, the market remains one of the most expensive in the state, with average home values exceeding $1.6 million.
Isle of Palms – High-End Beachfront Community
Located just northeast of Charleston, Isle of Palms is one of South Carolina’s most exclusive beach destinations. Known for its wide beaches, resort amenities, and proximity to Mount Pleasant, the island features a mix of luxury homes, vacation rentals, and resort-style living.
Home values soared as buyers prioritized coastal properties with outdoor space and privacy. The Wild Dunes Resort has remained a significant draw for buyers, offering gated access, golf, and tennis. In 2025, the island’s real estate market remains competitive and premium-priced, attracting both primary residents and investors looking for long-term value.
3. Kiawah Island – 127% Home Price Increase Since 2010
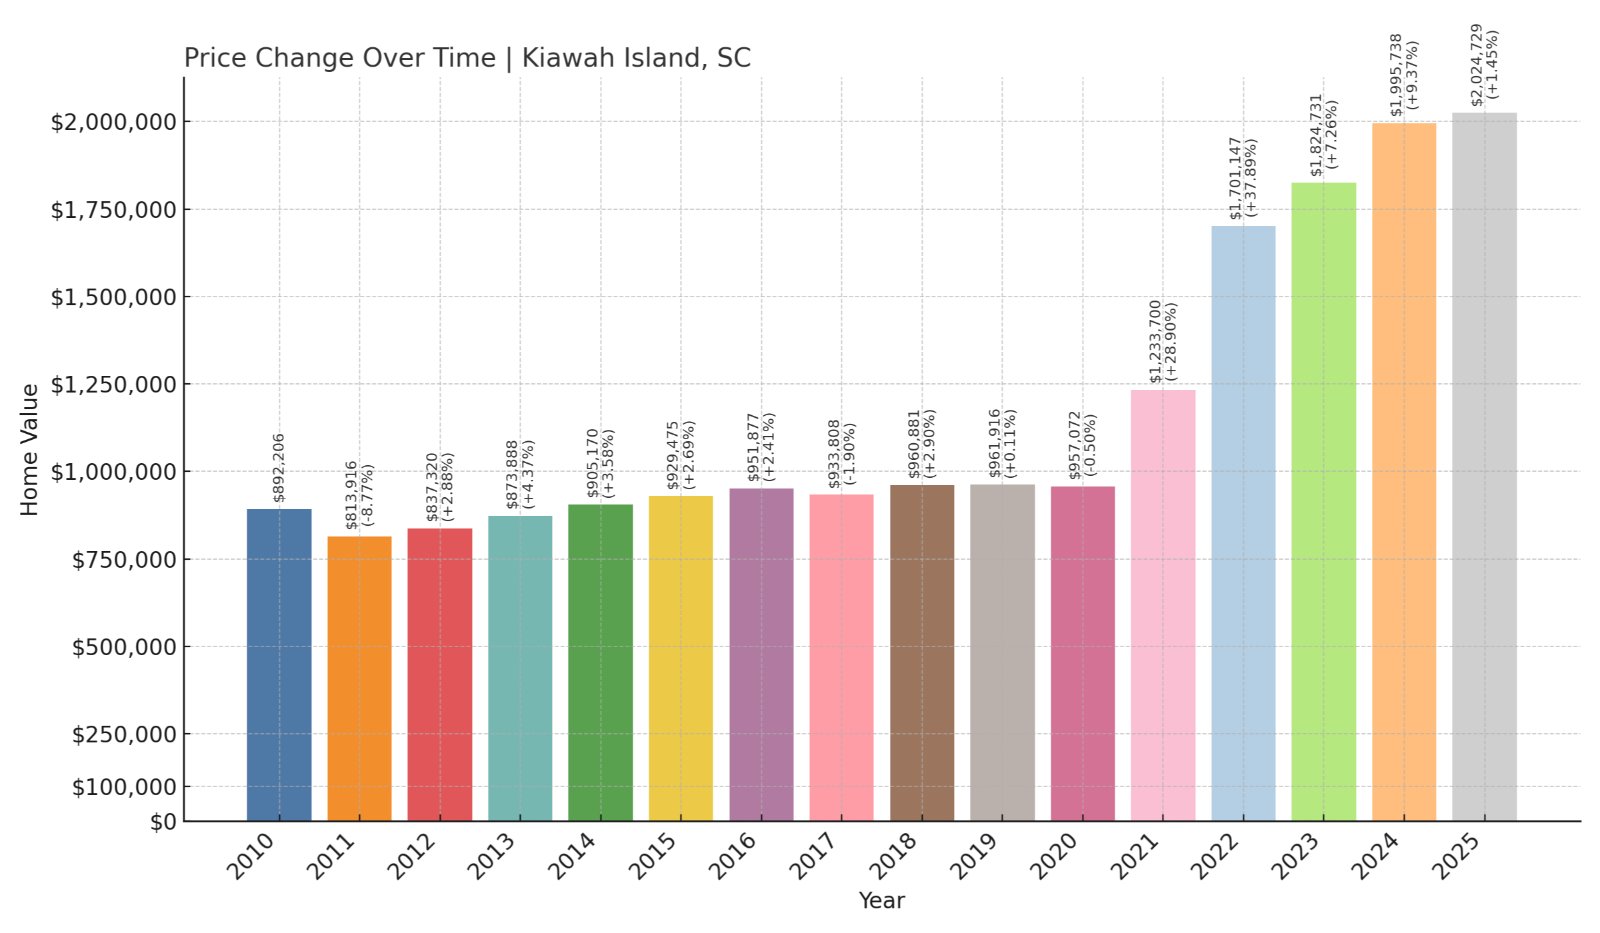
- 2010: $892,206
- 2011: $813,916 (-$78,290, -8.77% from previous year)
- 2012: $837,320 (+$23,403, +2.88% from previous year)
- 2013: $873,888 (+$36,568, +4.37% from previous year)
- 2014: $905,170 (+$31,282, +3.58% from previous year)
- 2015: $929,475 (+$24,305, +2.69% from previous year)
- 2016: $951,877 (+$22,402, +2.41% from previous year)
- 2017: $933,808 (-$18,069, -1.90% from previous year)
- 2018: $960,881 (+$27,073, +2.90% from previous year)
- 2019: $961,916 (+$1,035, +0.11% from previous year)
- 2020: $957,072 (-$4,844, -0.50% from previous year)
- 2021: $1,233,700 (+$276,628, +28.90% from previous year)
- 2022: $1,701,147 (+$467,446, +37.89% from previous year)
- 2023: $1,824,731 (+$123,584, +7.26% from previous year)
- 2024: $1,995,738 (+$171,007, +9.37% from previous year)
- 2025: $2,024,729 (+$28,991, +1.45% from previous year)
Kiawah Island home values have surged by 127% since 2010, passing the $2 million mark in 2025. After explosive growth from 2020 to 2022, prices have continued to rise, albeit at a slower pace.
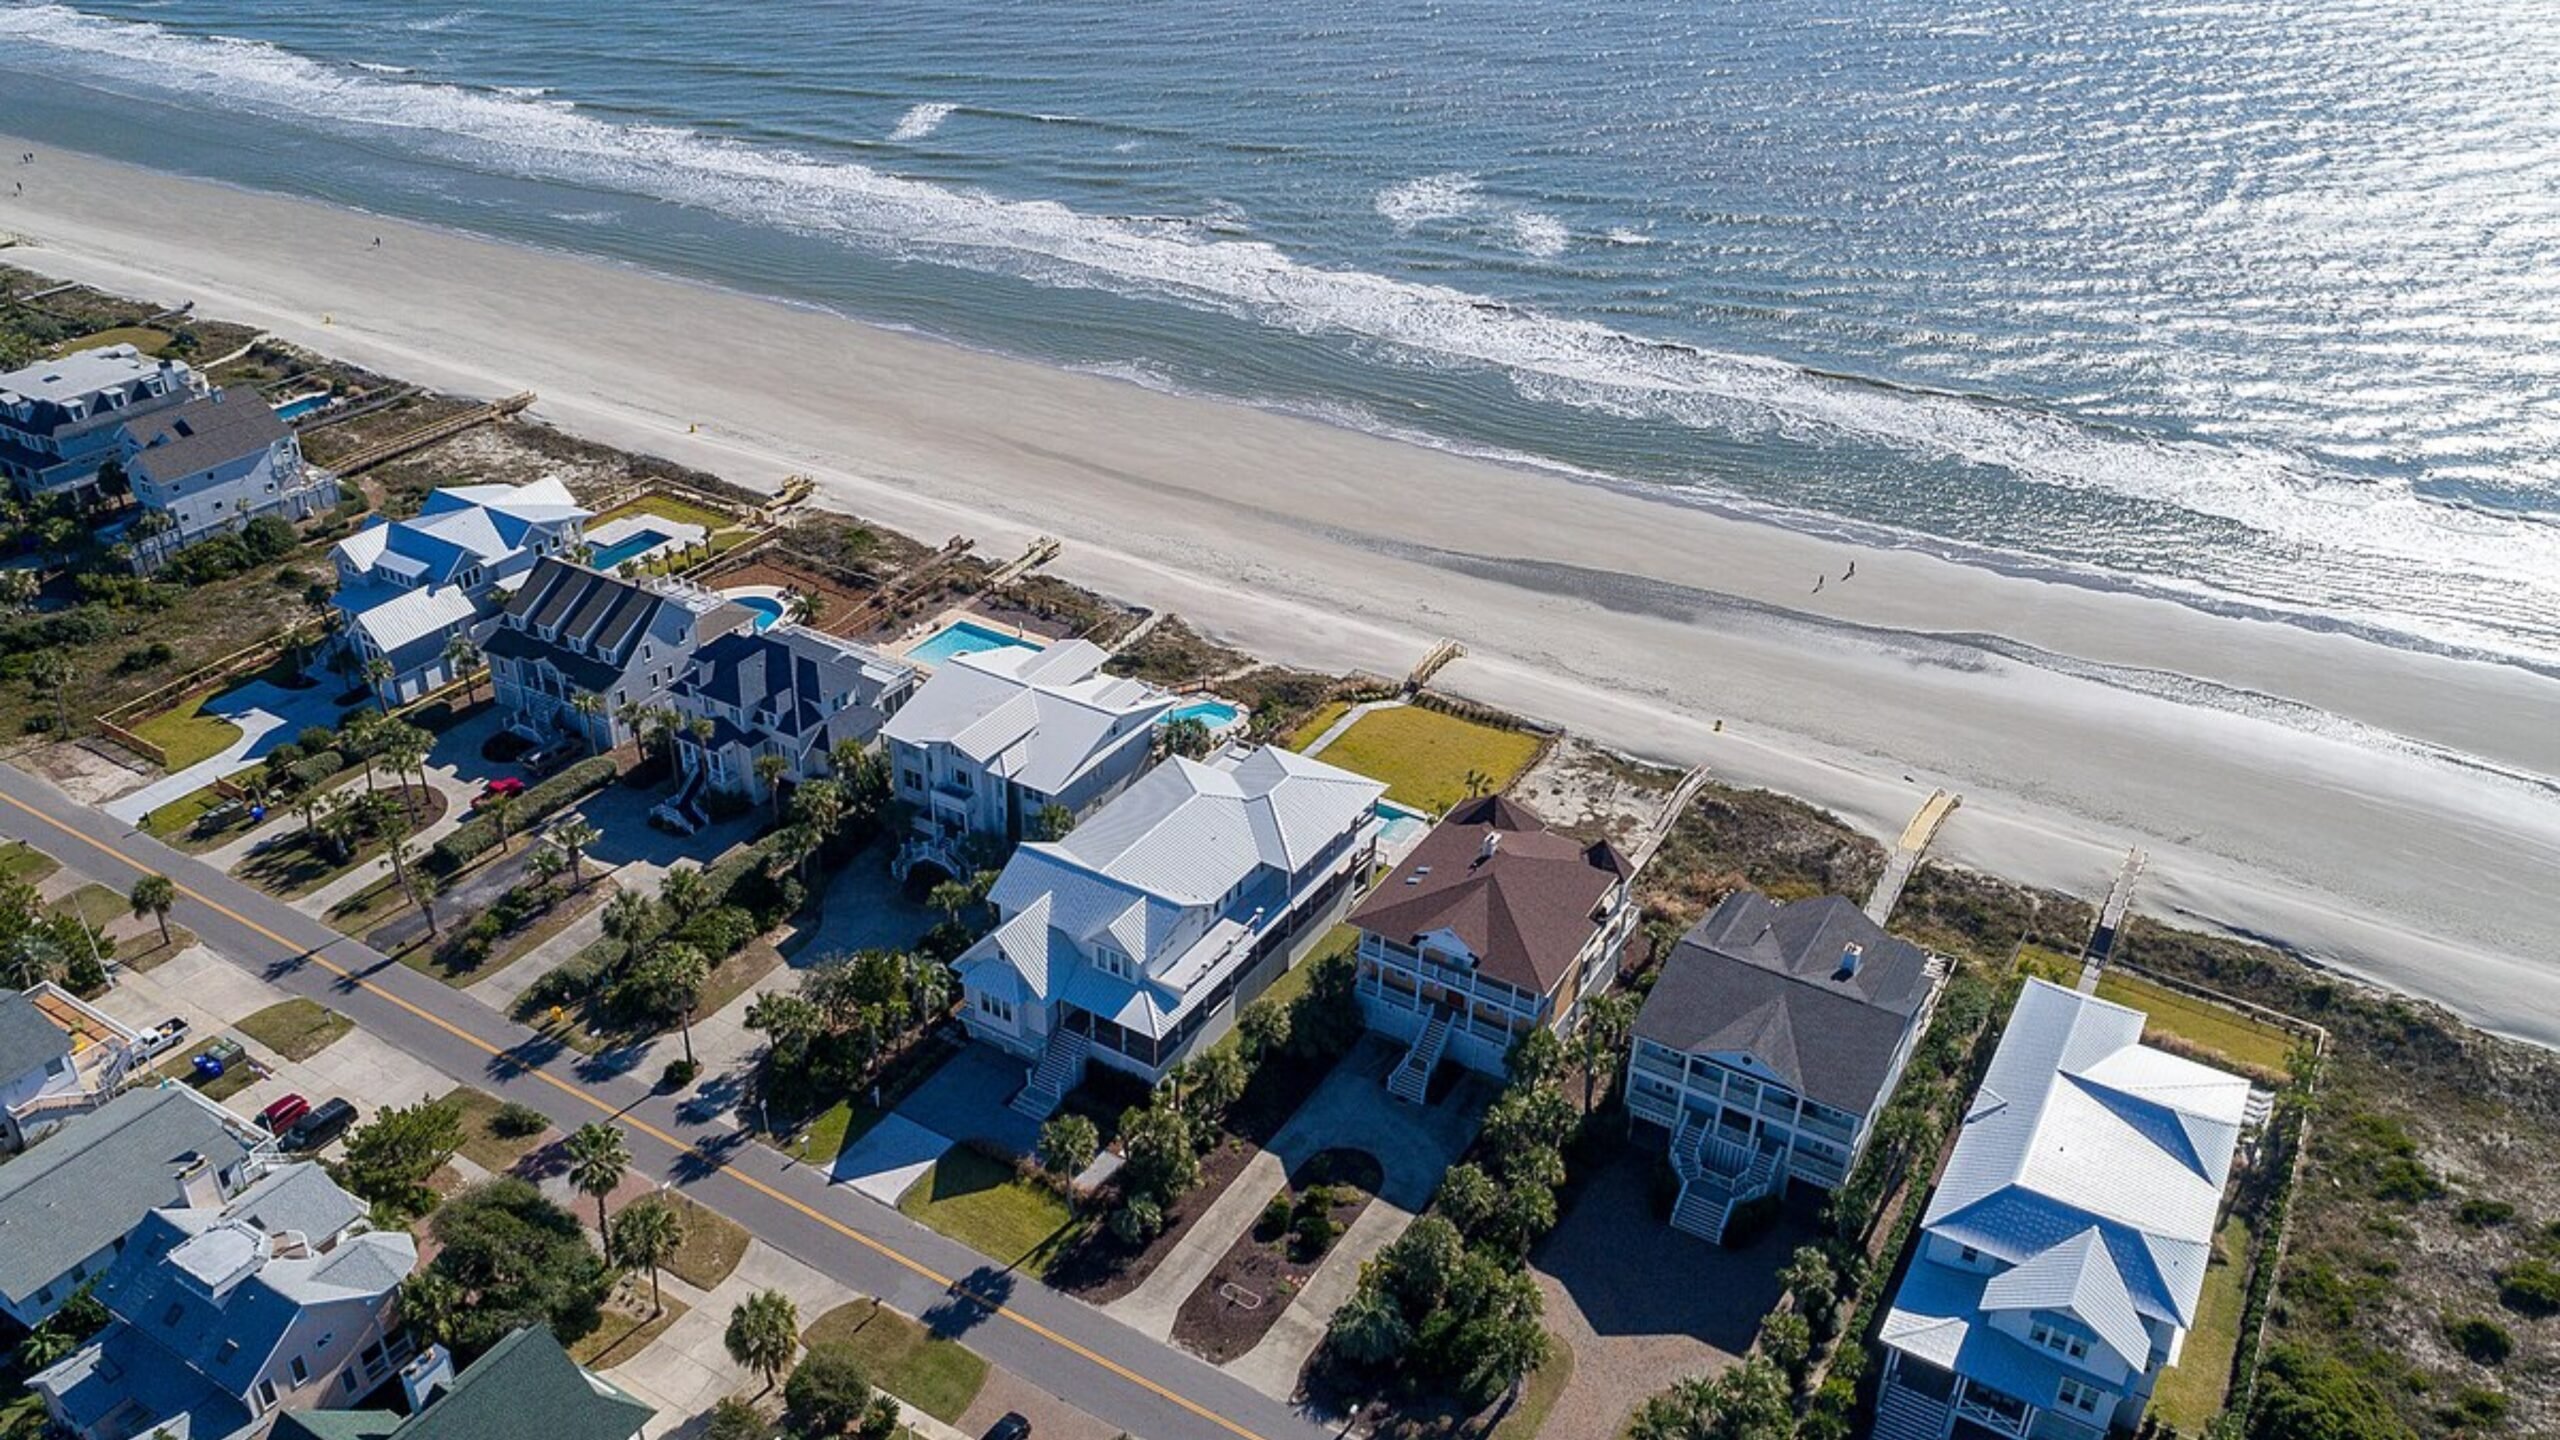
Kiawah Island – South Carolina’s Ultra-Luxury Market
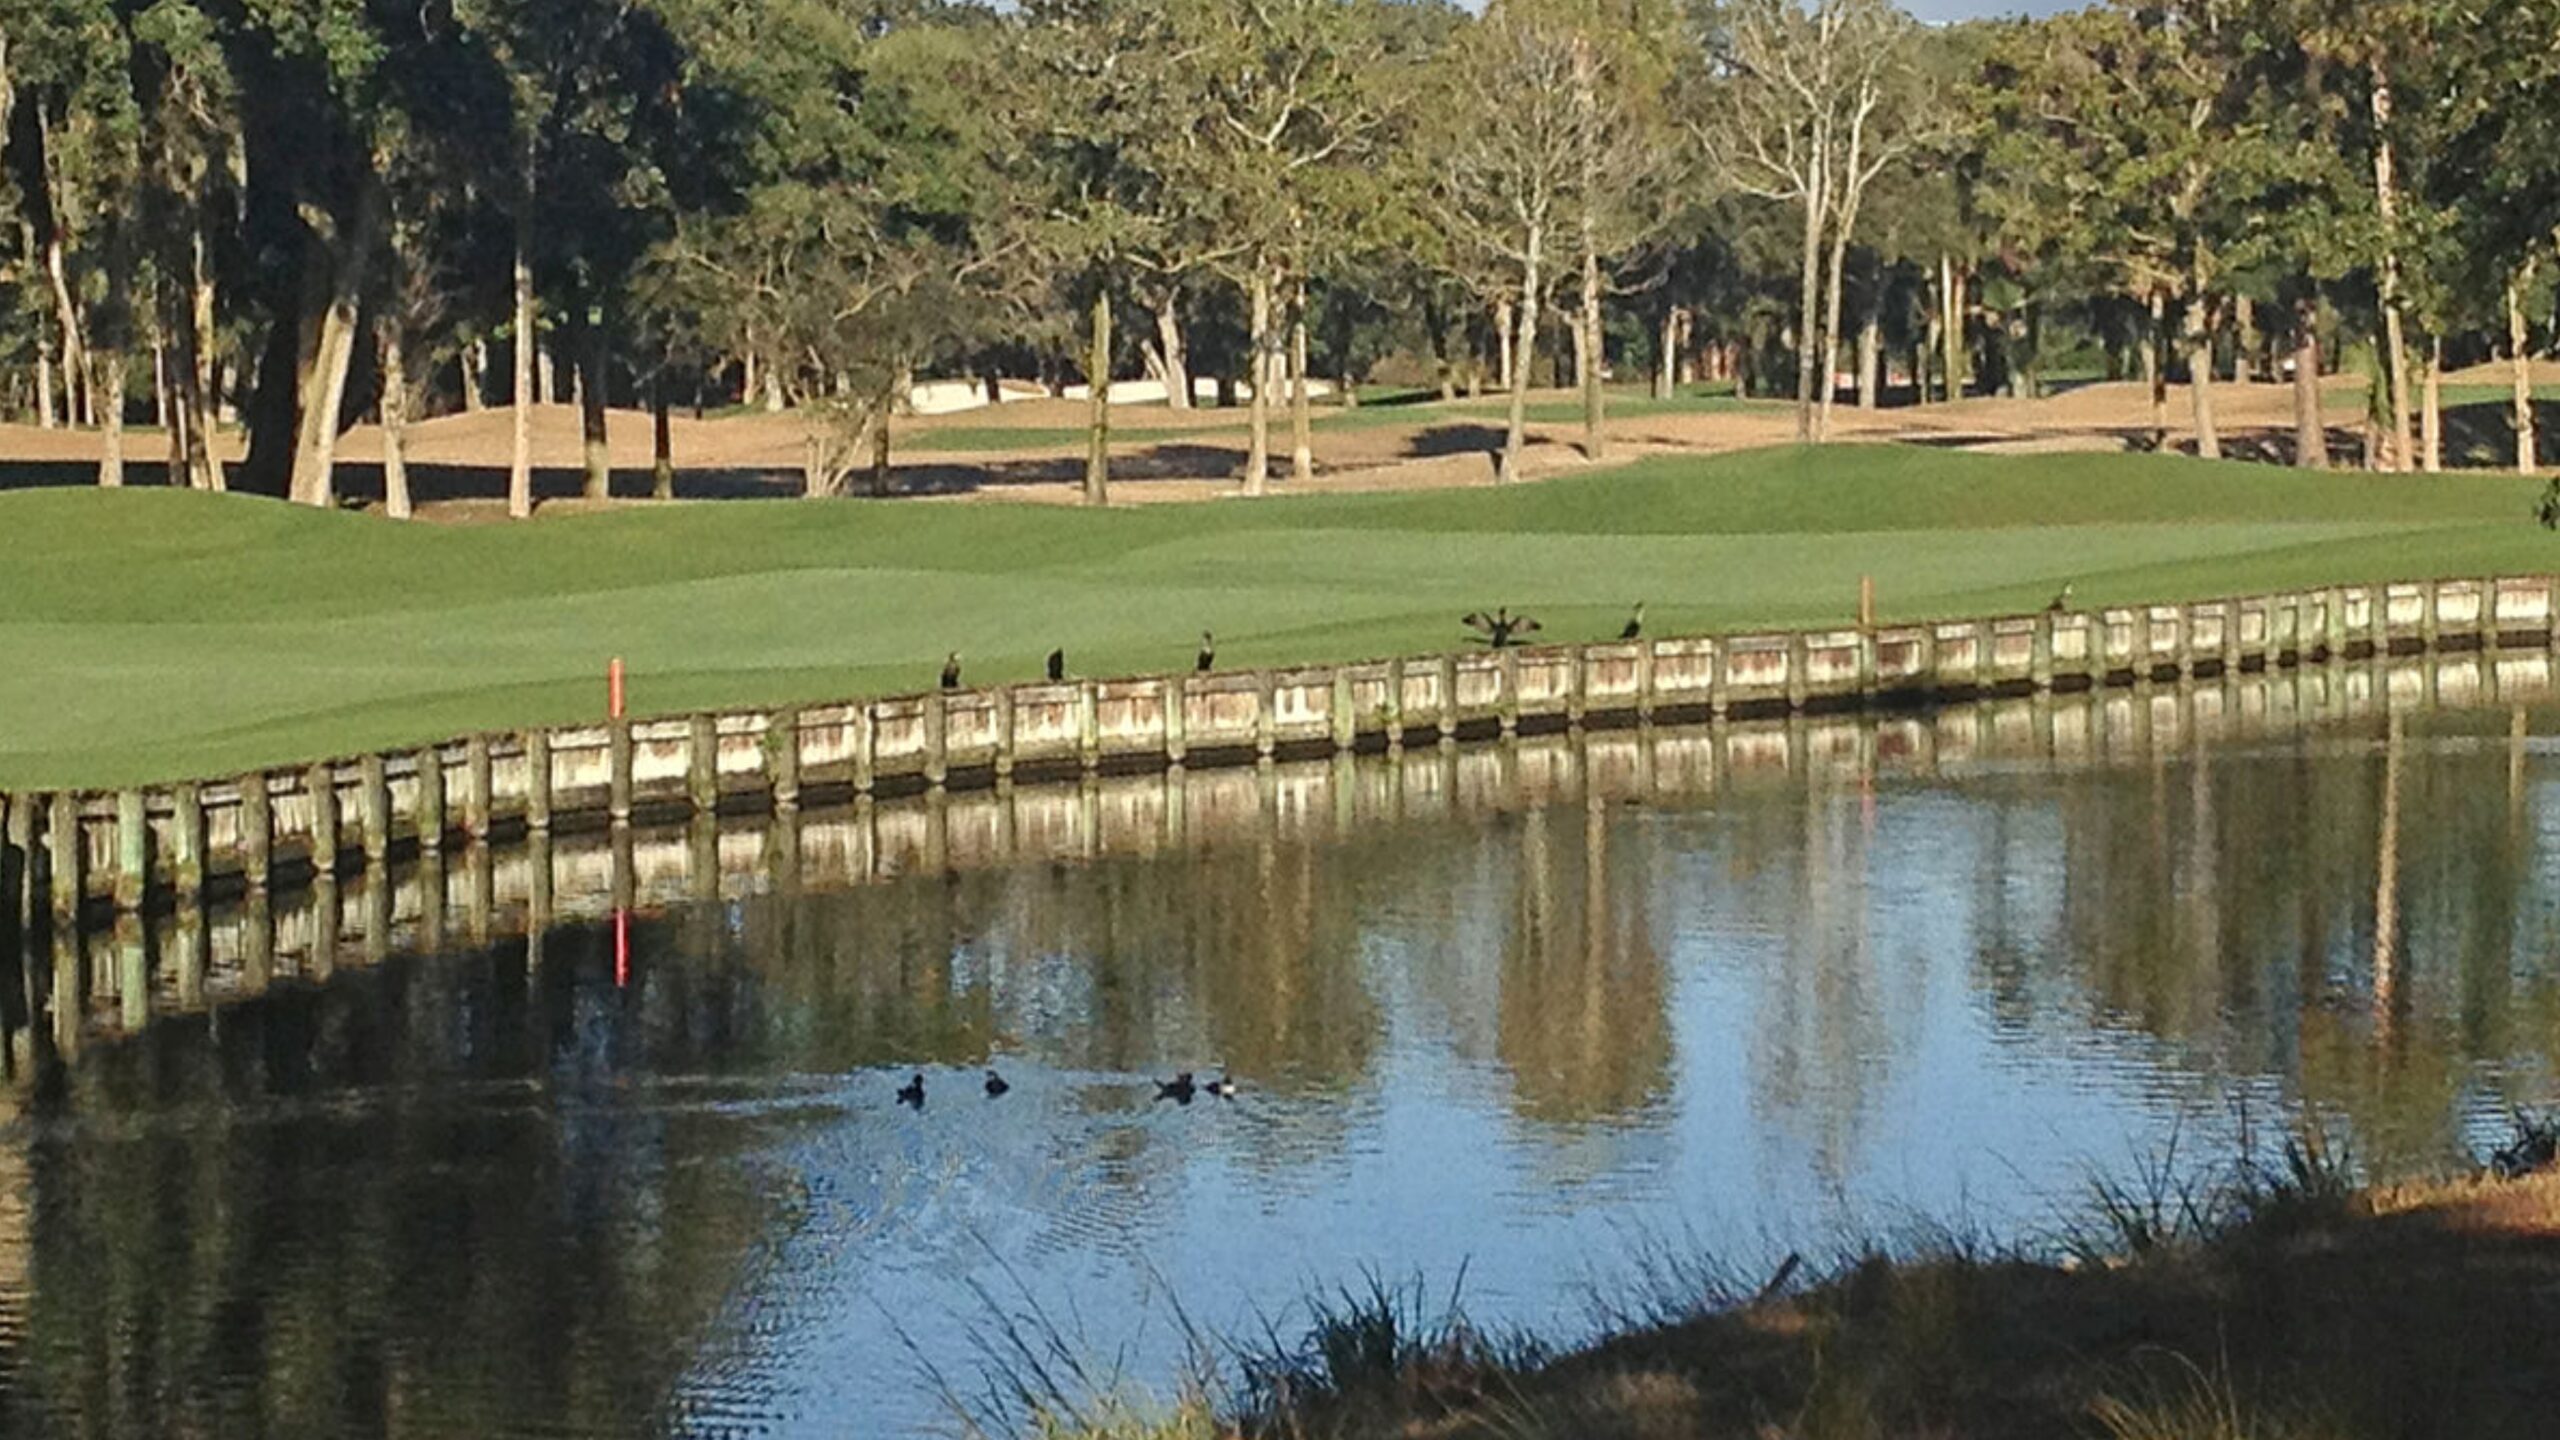
Kiawah Island is synonymous with luxury. A private, gated community about 25 miles from Charleston, it offers pristine beaches, five-star amenities, and world-class golf courses—including the famed Ocean Course. The island is known for environmental preservation and exclusive homes, many of which are custom estates with ocean, marsh, or golf views.
The pandemic-era demand for high-end, secluded properties caused a sharp rise in prices, and while that boom has softened, demand remains high. With limited inventory and tight development controls, Kiawah continues to hold its position as one of the most valuable real estate markets in the Southeast.
2. Sheldon – 54% Home Price Increase Since 2018
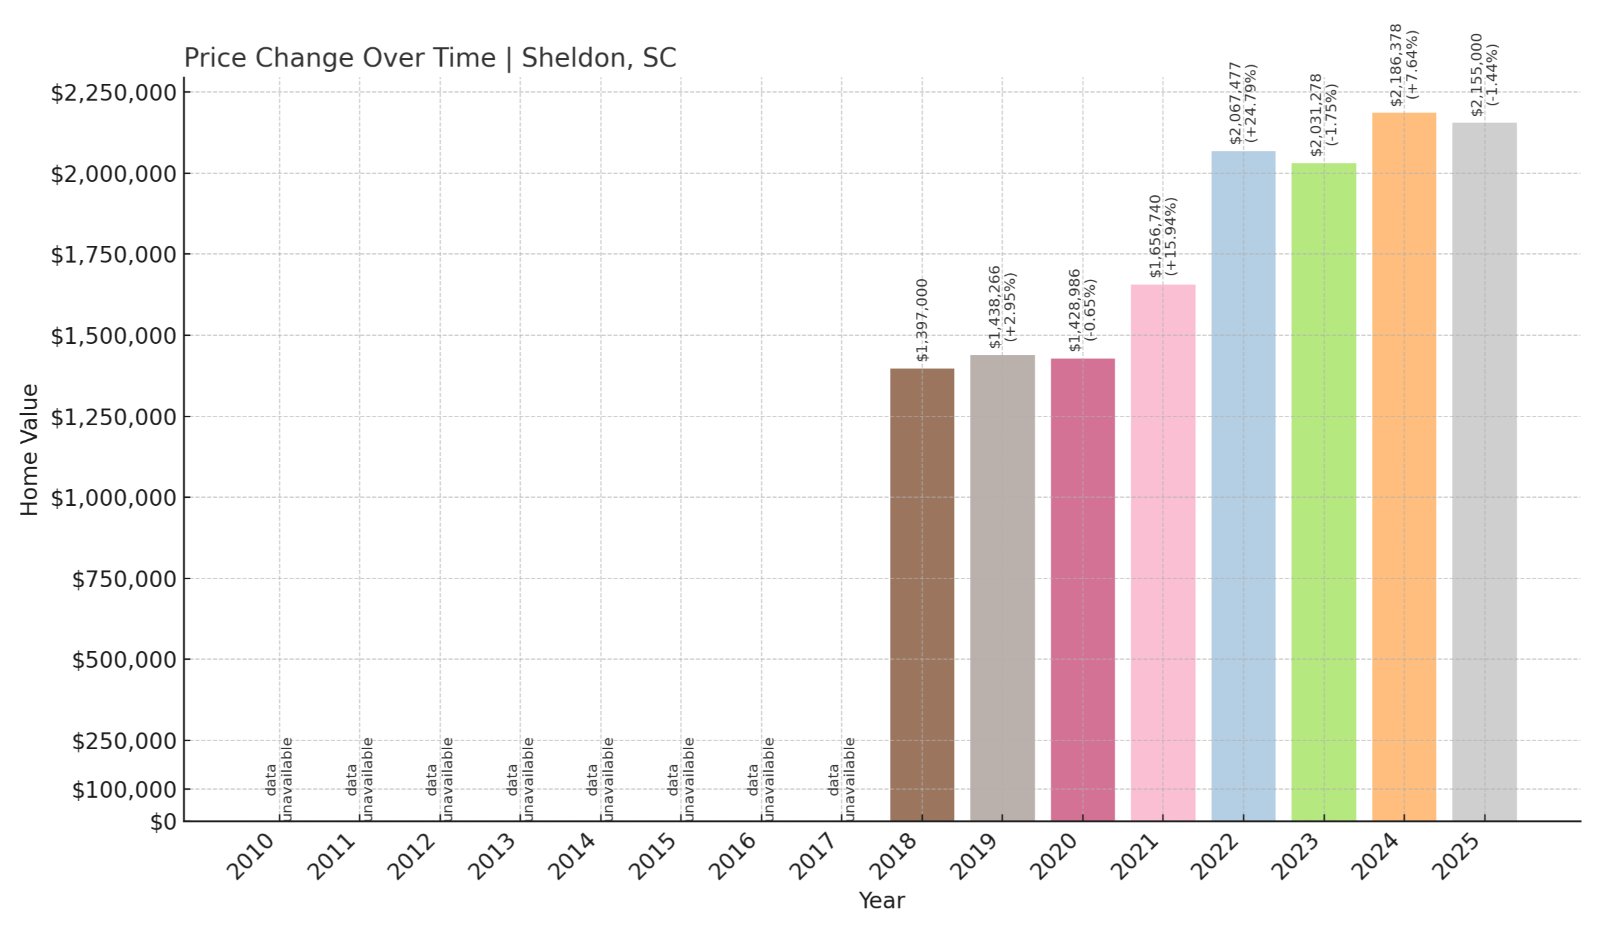
- 2018: $1,397,000
- 2019: $1,438,266 (+$41,266, +2.95% from previous year)
- 2020: $1,428,986 (-$9,280, -0.65% from previous year)
- 2021: $1,656,740 (+$227,754, +15.94% from previous year)
- 2022: $2,067,477 (+$410,738, +24.79% from previous year)
- 2023: $2,031,278 (-$36,200, -1.75% from previous year)
- 2024: $2,186,378 (+$155,100, +7.64% from previous year)
- 2025: $2,155,000 (-$31,377, -1.44% from previous year)
Sheldon’s home prices have increased 54% since 2018, with major gains occurring between 2020 and 2022. Prices dipped slightly in 2023 and 2025 but remain among the highest in the state, averaging over $2.15 million this year.
Sheldon – Private Estates in the Lowcountry
🔥 Would you like to save this?
Located in Beaufort County between Yemassee and Beaufort, Sheldon is a quiet, rural community known for its historic ruins and expansive estate properties. With vast tracts of private land and gated riverfront developments, Sheldon offers a level of seclusion and exclusivity that appeals to affluent buyers.
While not a traditional tourist destination, Sheldon’s natural beauty and privacy have made it increasingly attractive for buyers seeking second homes, hunting retreats, or custom builds. Its high average price reflects a small but elite pool of transactions, often for sprawling properties with unique features.
1. Sullivans Island – 240% Home Price Increase Since 2010
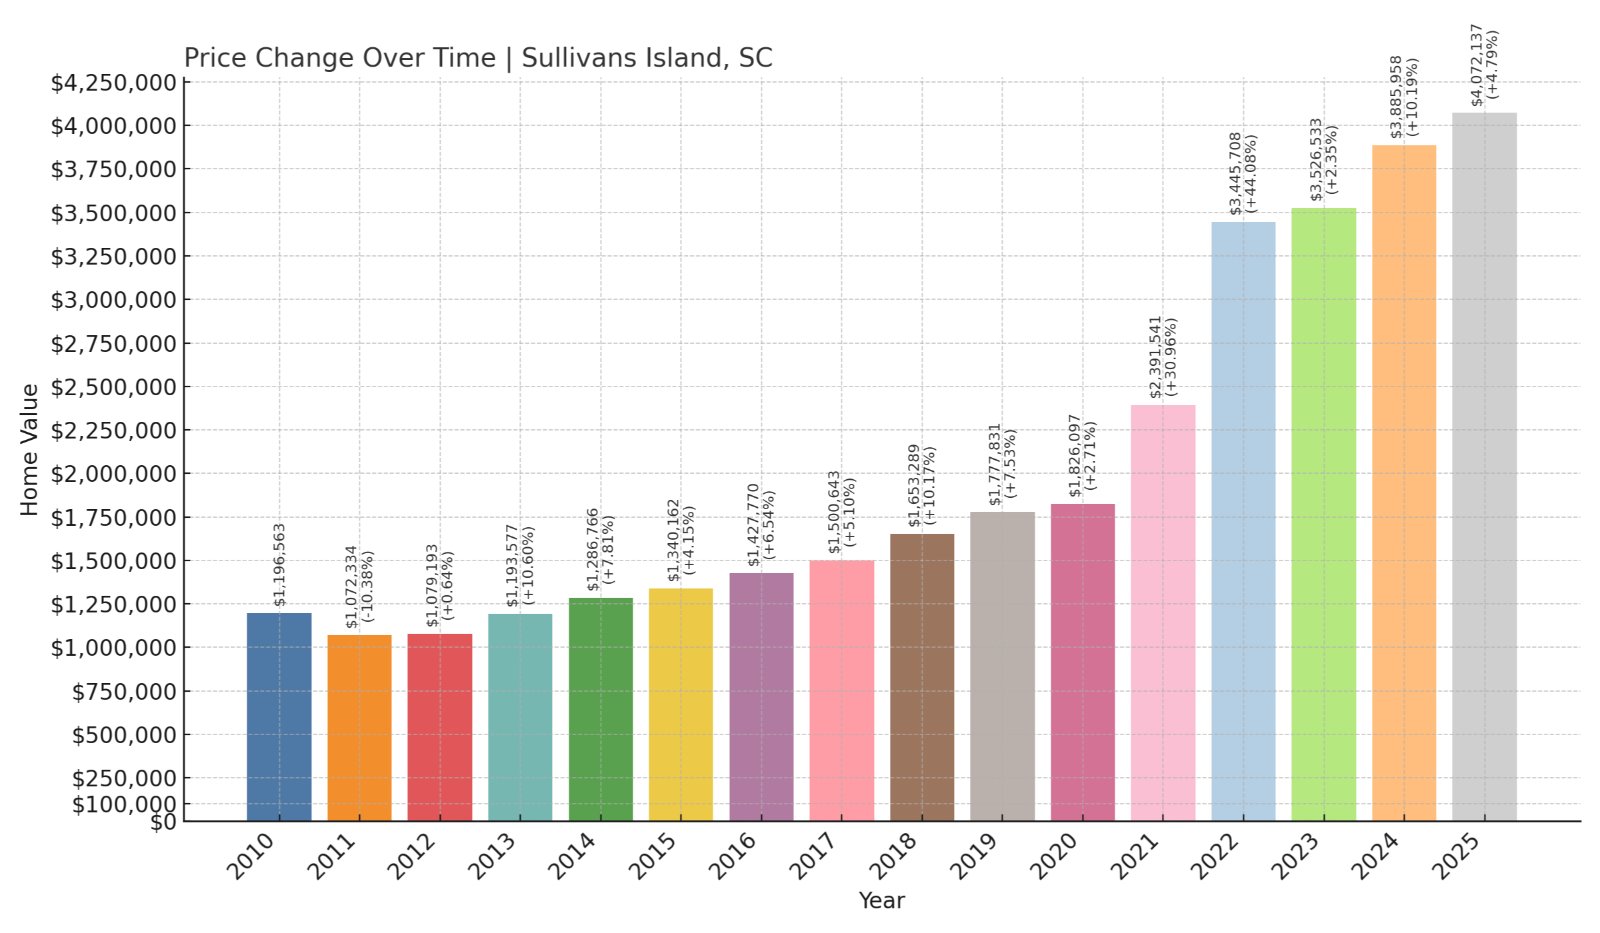
- 2010: $1,196,563
- 2011: $1,072,334 (-$124,229, -10.38% from previous year)
- 2012: $1,079,193 (+$6,859, +0.64% from previous year)
- 2013: $1,193,577 (+$114,384, +10.60% from previous year)
- 2014: $1,286,766 (+$93,188, +7.81% from previous year)
- 2015: $1,340,162 (+$53,397, +4.15% from previous year)
- 2016: $1,427,770 (+$87,608, +6.54% from previous year)
- 2017: $1,500,643 (+$72,873, +5.10% from previous year)
- 2018: $1,653,289 (+$152,646, +10.17% from previous year)
- 2019: $1,777,831 (+$124,542, +7.53% from previous year)
- 2020: $1,826,097 (+$48,267, +2.71% from previous year)
- 2021: $2,391,541 (+$565,444, +30.96% from previous year)
- 2022: $3,445,708 (+$1,054,167, +44.08% from previous year)
- 2023: $3,526,533 (+$80,825, +2.35% from previous year)
- 2024: $3,885,958 (+$359,425, +10.19% from previous year)
- 2025: $4,072,137 (+$186,179, +4.79% from previous year)
Home prices on Sullivans Island have skyrocketed 240% since 2010. In 2025, the average value tops $4 million, making it the most expensive housing market in South Carolina by a wide margin.
Sullivans Island – Prestige and Privacy by the Sea
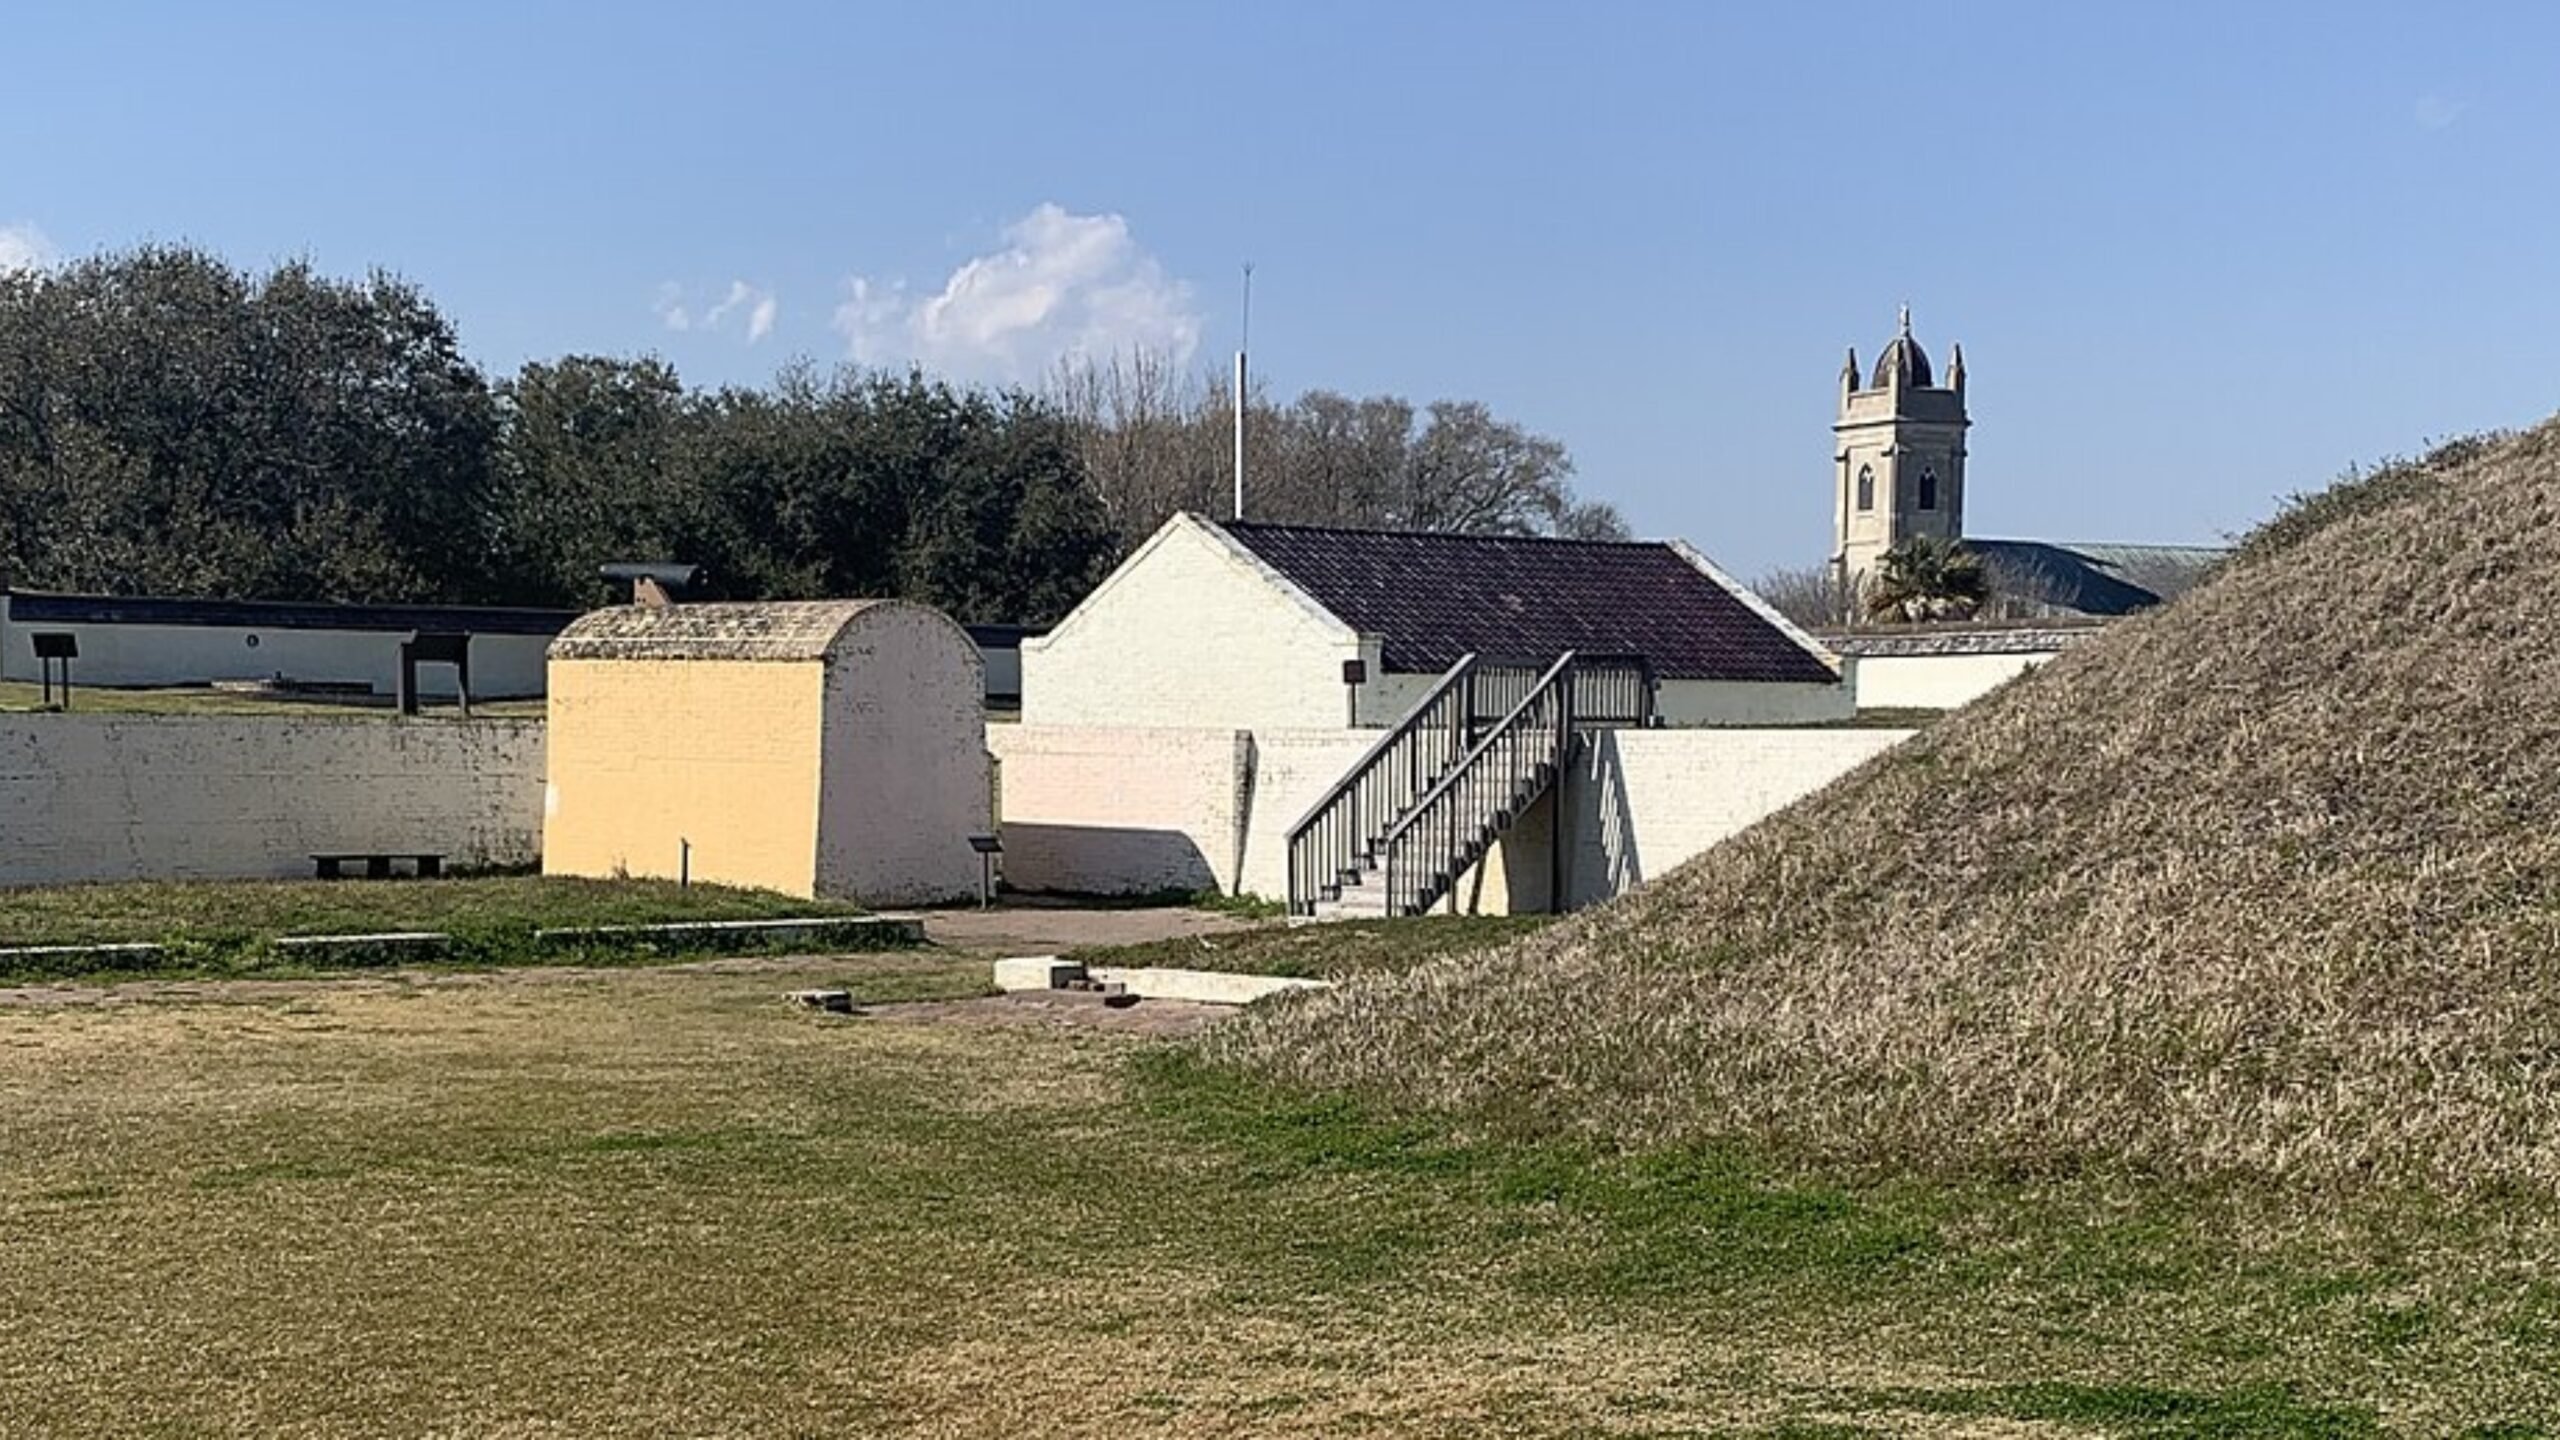
Sullivans Island is a small barrier island northeast of Charleston known for its low density, high property values, and strong local preservation laws. There are no hotels or high-rises here—just historic homes, beachfront mansions, and quiet streets shaded by oaks and palmettos.
The island’s strict zoning laws limit development and preserve character, which in turn keeps inventory extremely tight. Combined with its pristine beaches, walkable layout, and views of Charleston Harbor, Sullivans Island attracts wealthy buyers looking for an exclusive oceanfront enclave. With home prices crossing $4 million in 2025, it leads the state in luxury value growth.


