Would you like to save this?
Zillow’s Home Value Index for June 2025 reveals where luxury living in New York truly comes with a price. These 25 towns lead the state in home values, reflecting decades of demand, location prestige, and dramatic market shifts. From old-money elegance on Long Island to rebounding hotspots in the Hudson Valley and the Hamptons, each place has carved out its own version of high-end living. While some soared steadily, others rode a rollercoaster to the top—but all now sit at the summit of New York real estate.
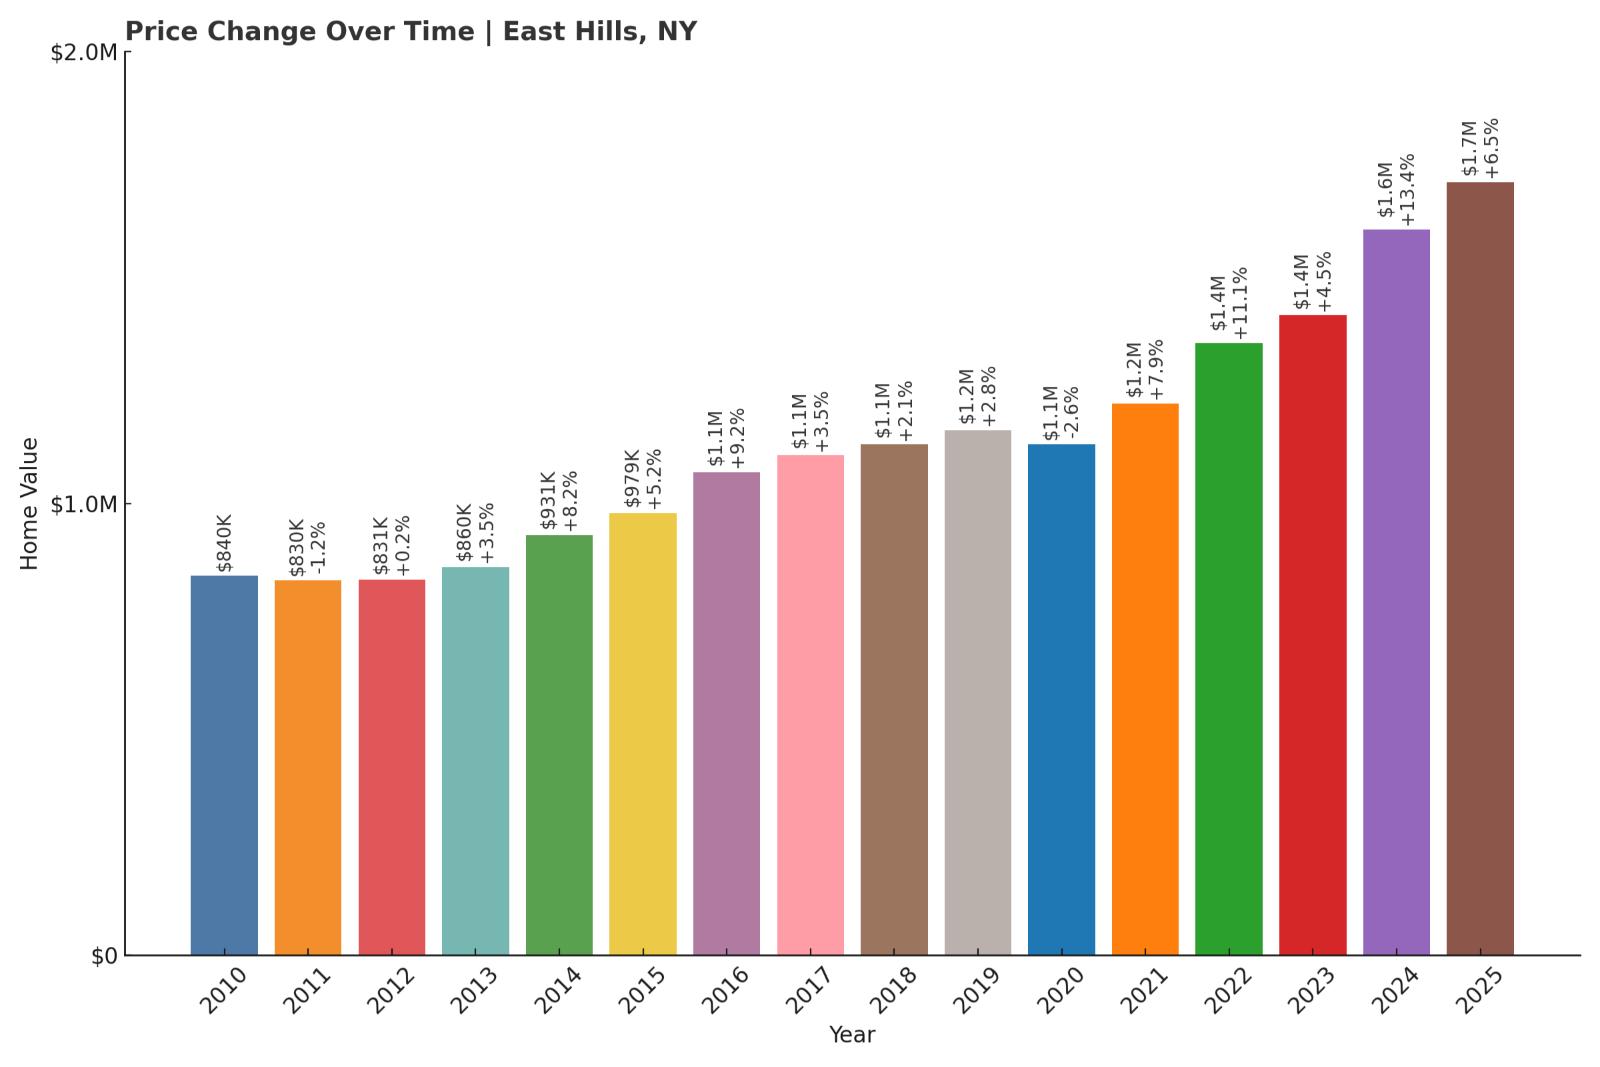
25. East Hills – 104% Home Price Increase Since 2010
- 2010: $839,855
- 2011: $829,669 (-$10,186, -1.21% from previous year)
- 2012: $830,932 (+$1,263, +0.15% from previous year)
- 2013: $859,650 (+$28,718, +3.46% from previous year)
- 2014: $930,516 (+$70,866, +8.24% from previous year)
- 2015: $979,161 (+$48,645, +5.23% from previous year)
- 2016: $1,068,813 (+$89,652, +9.16% from previous year)
- 2017: $1,106,455 (+$37,641, +3.52% from previous year)
- 2018: $1,130,182 (+$23,727, +2.14% from previous year)
- 2019: $1,161,461 (+$31,279, +2.77% from previous year)
- 2020: $1,131,204 (-$30,257, -2.61% from previous year)
- 2021: $1,220,470 (+$89,266, +7.89% from previous year)
- 2022: $1,355,601 (+$135,131, +11.07% from previous year)
- 2023: $1,416,312 (+$60,711, +4.48% from previous year)
- 2024: $1,606,315 (+$190,002, +13.42% from previous year)
- 2025: $1,710,995 (+$104,680, +6.52% from previous year)
Home prices in East Hills have more than doubled since 2010, with values climbing from around $840K to over $1.7 million in 2025. Growth was steady for most of the last decade, punctuated by an especially strong surge from 2021 through 2024. Even a brief dip in 2020 didn’t stop its long-term upward march, signaling consistent demand in this Nassau County village.
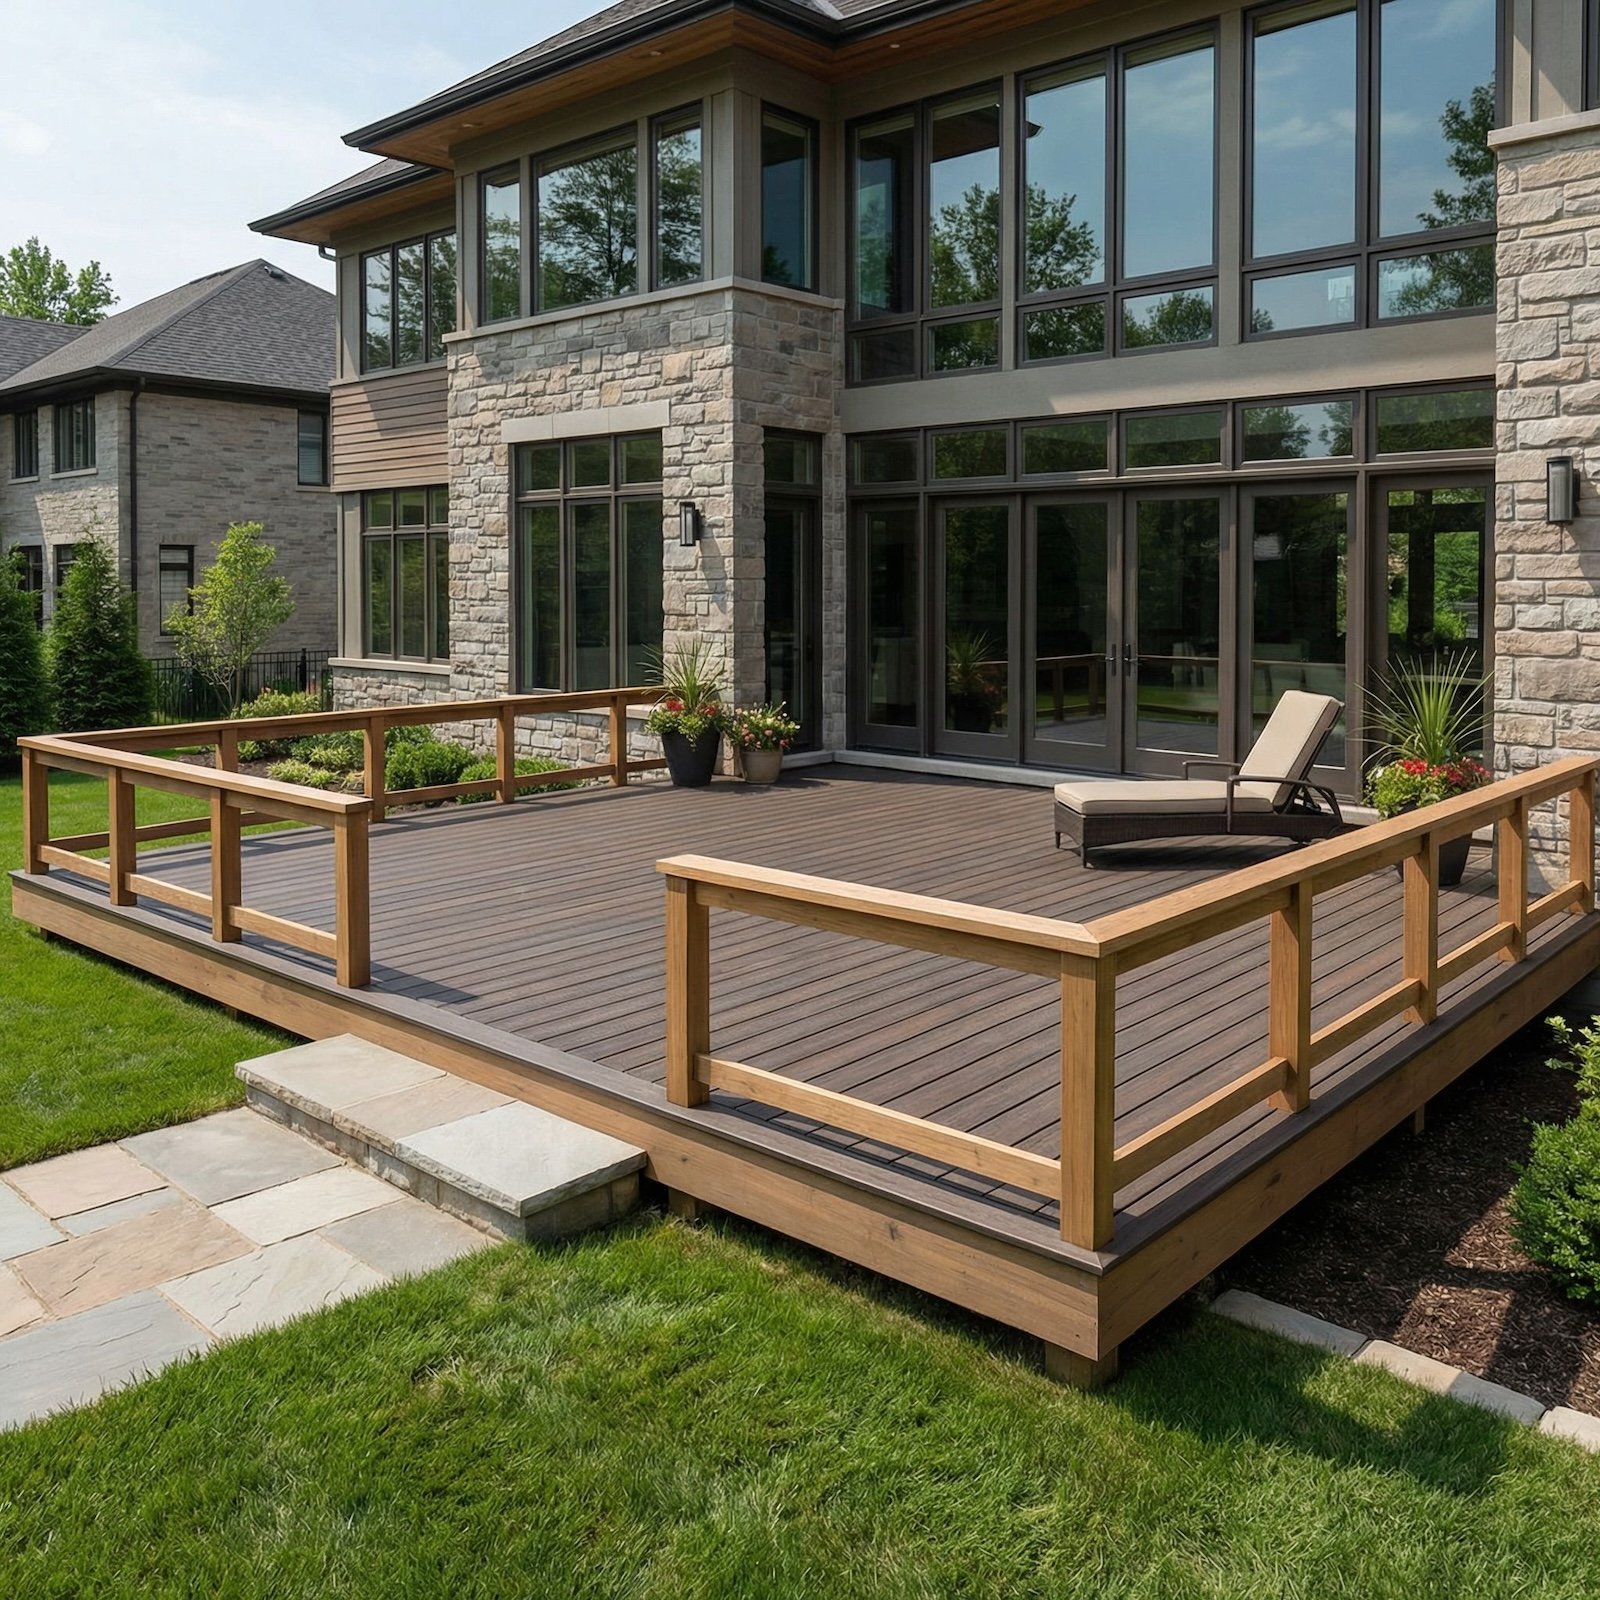
East Hills – Suburban Prestige on Long Island’s North Shore
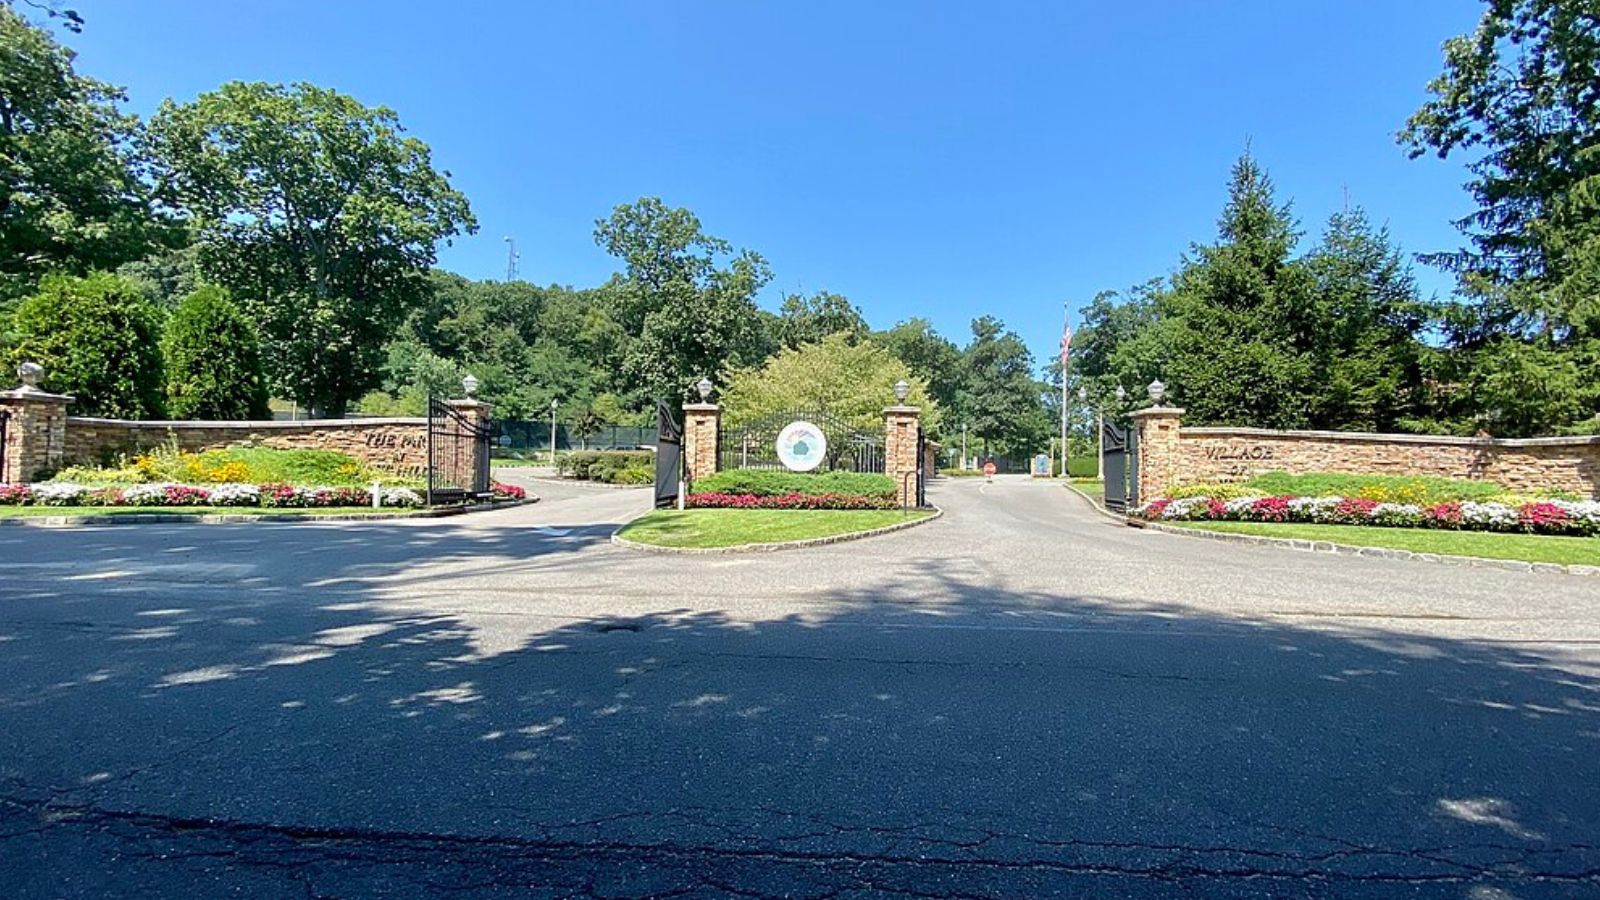
East Hills is a well-established village nestled within the Town of North Hempstead, just about 25 miles from Manhattan. Known for its spacious properties, tree-lined streets, and private parks, the area offers a blend of prestige and suburban comfort. The East Hills Park, exclusive to residents, is a standout amenity that enhances local quality of life.
Its location near major highways, the LIRR, and top-rated public schools—like those in the Roslyn Union Free School District—has long made it a magnet for professionals and families. The surge in home prices in recent years reflects this continued desirability, particularly as more New Yorkers seek space and privacy without sacrificing proximity to the city.
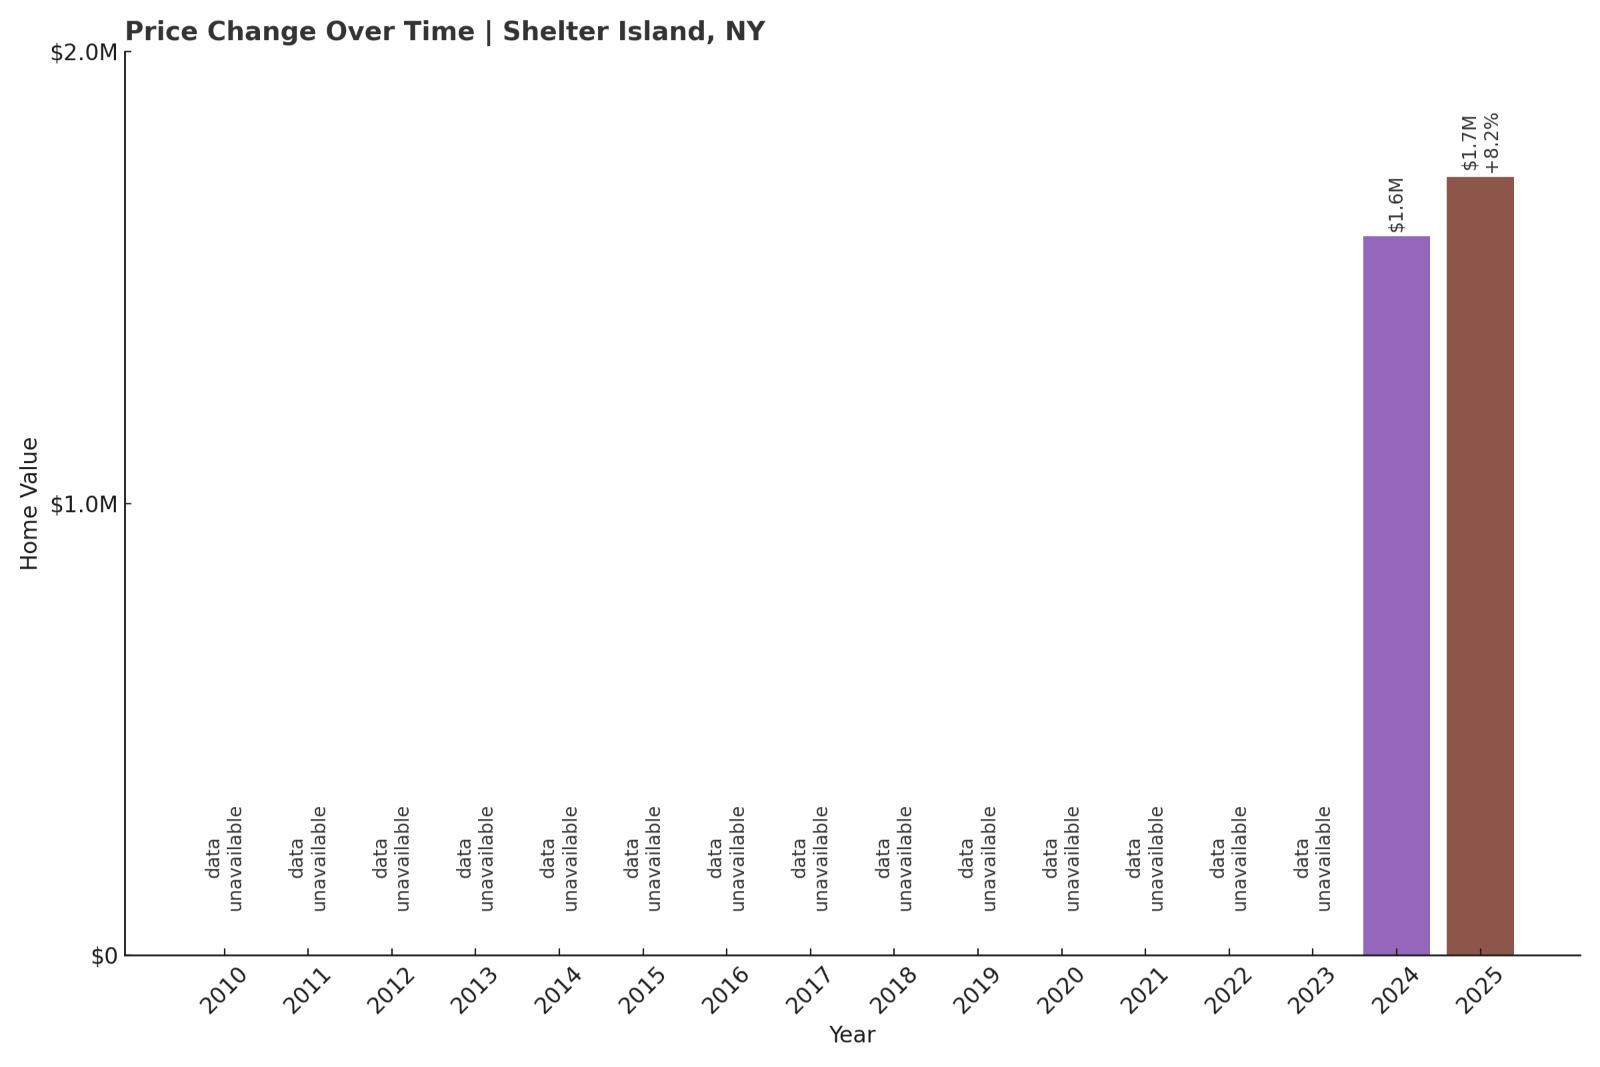
24. Shelter Island – 8.25% Home Price Increase Since 2024
- 2010: N/A
- 2011: N/A
- 2012: N/A
- 2013: N/A
- 2014: N/A
- 2015: N/A
- 2016: N/A
- 2017: N/A
- 2018: N/A
- 2019: N/A
- 2020: N/A
- 2021: N/A
- 2022: N/A
- 2023: N/A
- 2024: $1,590,680
- 2025: $1,721,907 (+$131,227, +8.25% from previous year)
Data for Shelter Island only becomes available in 2024, but the single-year jump is notable: an 8.25% gain in just 12 months. With 2025 home values topping $1.72 million, the island appears to be experiencing an intensifying luxury market push—likely an extension of the East End’s broader price momentum.
Shelter Island – A Remote Luxury Refuge Between Forks
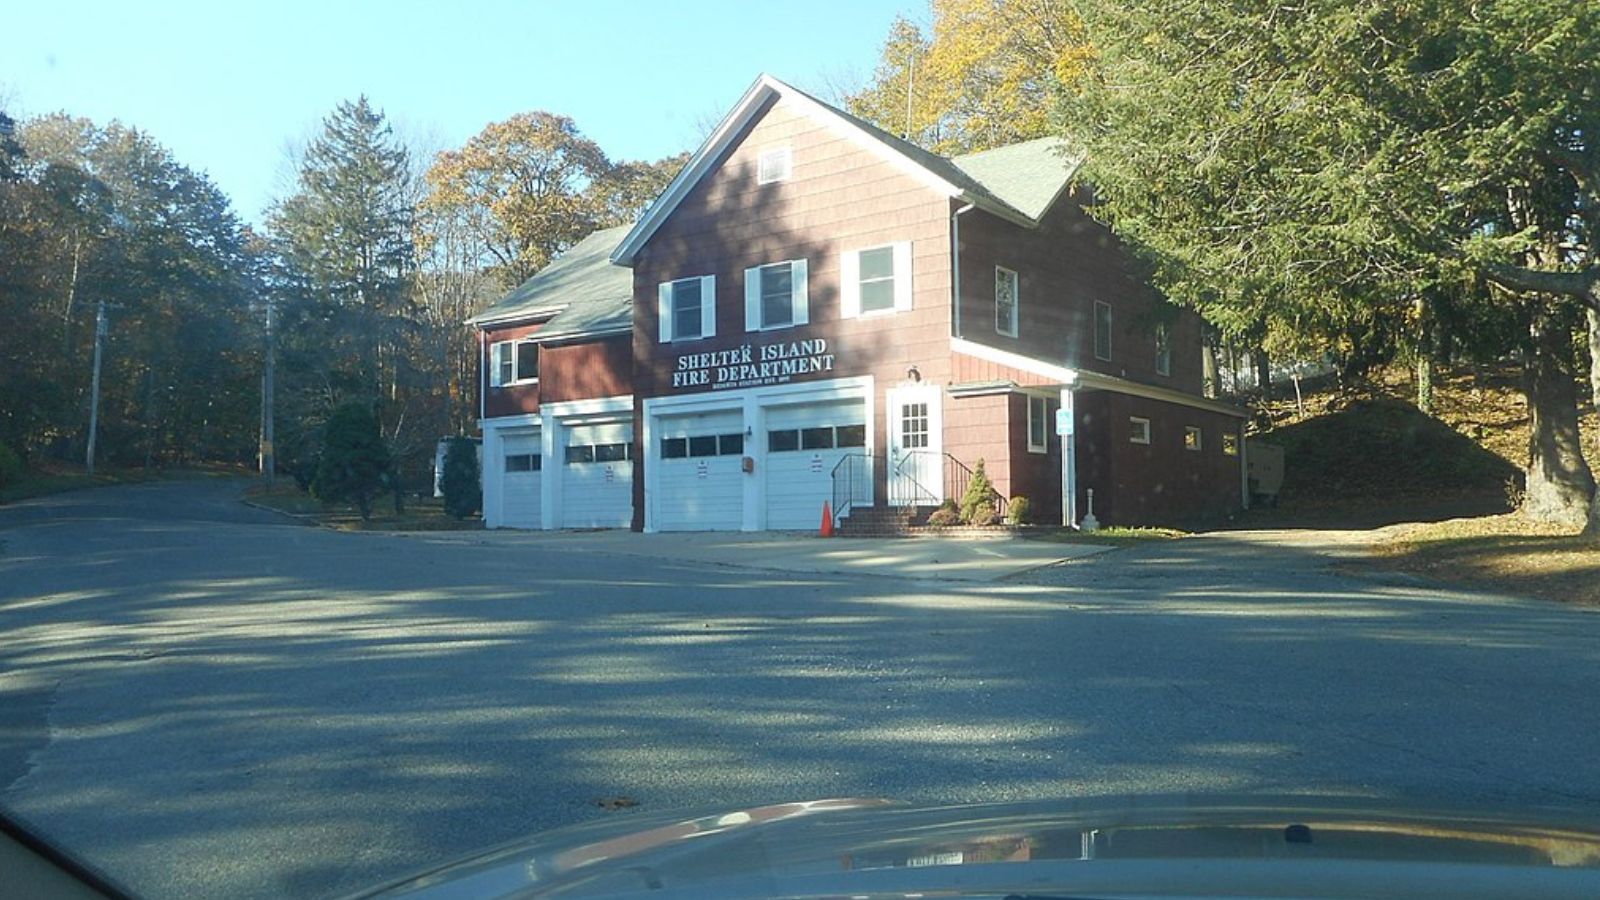
Shelter Island is uniquely situated between the North and South Forks of Long Island, accessible only by ferry. Its secluded vibe, pristine beaches, and tight building regulations have helped preserve its appeal for well-heeled buyers seeking peace and exclusivity.
Unlike busier Hamptons villages, Shelter Island maintains a slower pace, dotted with historic inns, nature preserves, and low-density development. That isolation—once seen as a trade-off—has only boosted demand in recent years as remote work and high-income migration shifted more attention to quiet, luxurious locations like this one.
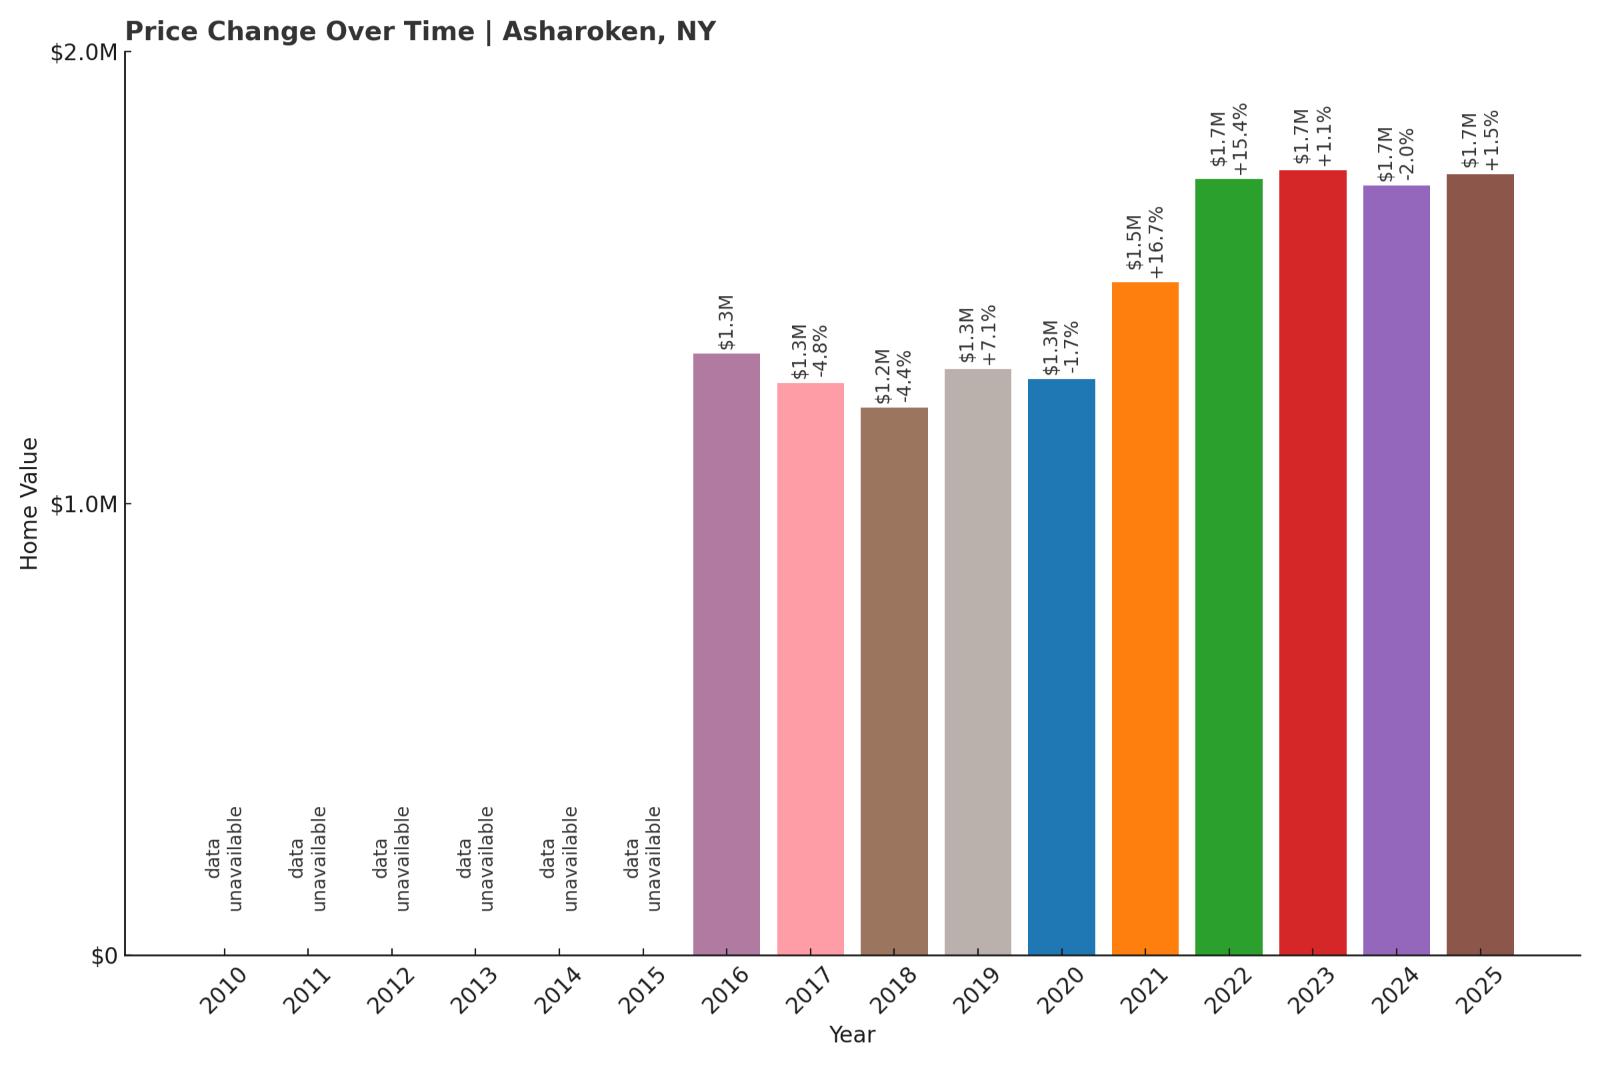
23. Asharoken – 29.8% Home Price Increase Since 2016
- 2010: N/A
- 2011: N/A
- 2012: N/A
- 2013: N/A
- 2014: N/A
- 2015: N/A
- 2016: $1,331,317
- 2017: $1,267,025 (-$64,292, -4.83% from previous year)
- 2018: $1,211,664 (-$55,361, -4.37% from previous year)
- 2019: $1,297,582 (+$85,918, +7.09% from previous year)
- 2020: $1,275,845 (-$21,736, -1.68% from previous year)
- 2021: $1,488,939 (+$213,093, +16.70% from previous year)
- 2022: $1,718,039 (+$229,101, +15.39% from previous year)
- 2023: $1,736,592 (+$18,553, +1.08% from previous year)
- 2024: $1,702,723 (-$33,870, -1.95% from previous year)
- 2025: $1,728,074 (+$25,351, +1.49% from previous year)
Home values in Asharoken rose nearly 30% since 2016, though the growth path has been bumpy. After early declines in the late 2010s, the village saw a dramatic spike in 2021 and 2022 before leveling off. Prices in 2025 sit around $1.73 million, reflecting high interest with some volatility.
Asharoken – Waterfront Exclusivity in Suffolk County
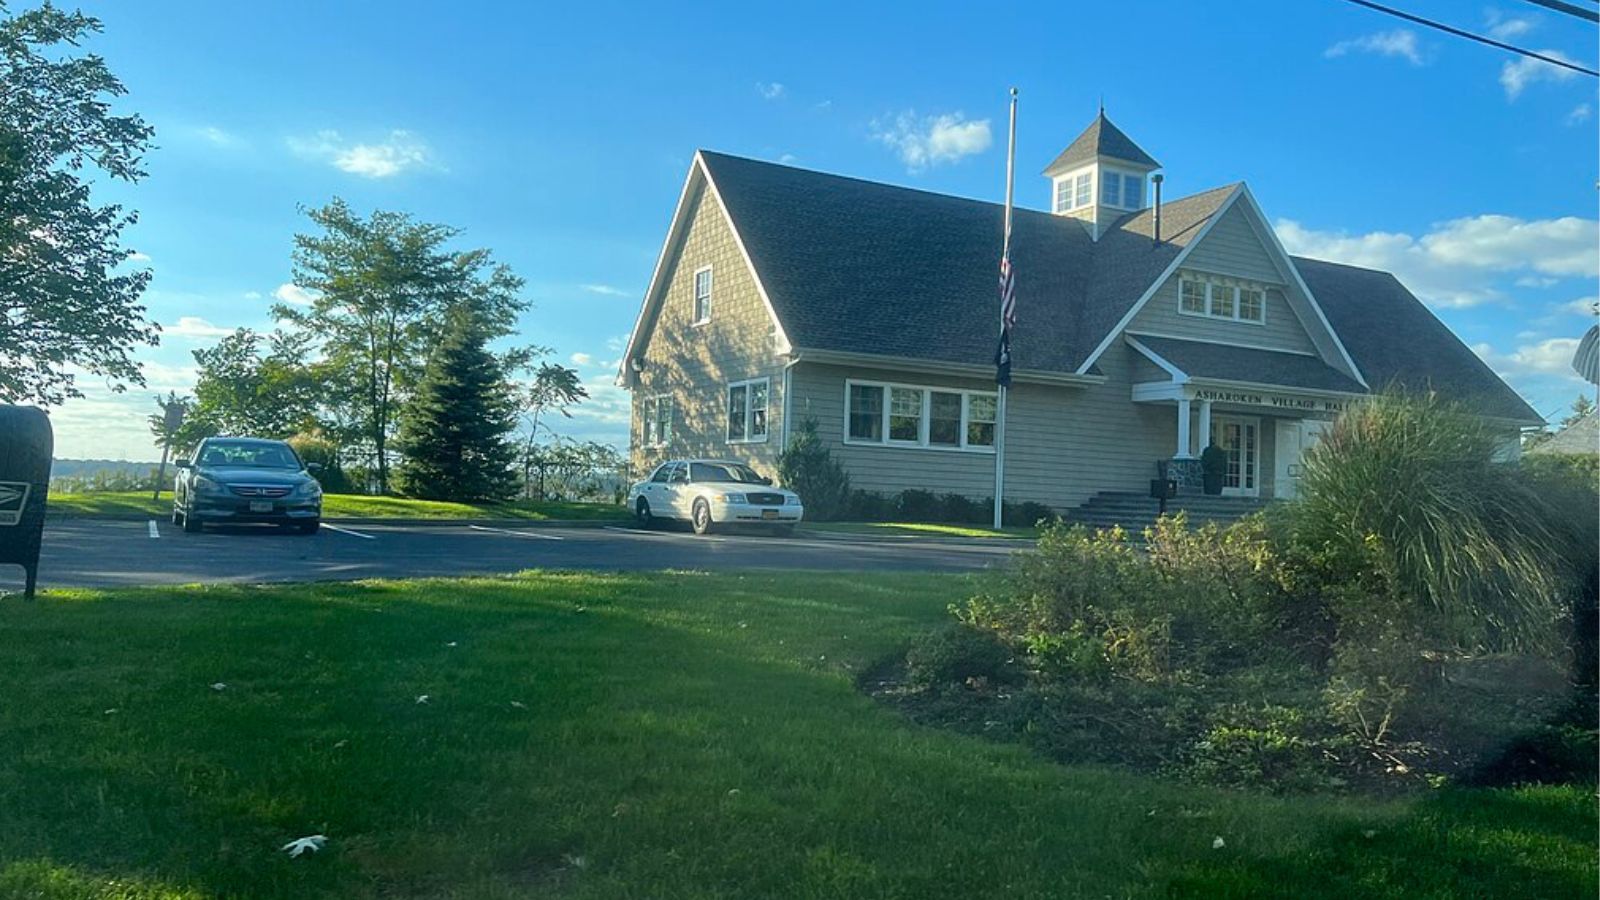
A narrow village on a peninsula jutting into Long Island Sound, Asharoken is known for its spectacular water views and beachfront properties. With limited housing stock and nearly all properties situated on the coastline, the area offers exclusivity by default.
It’s part of the Town of Huntington and boasts a tranquil setting with little commercial development. That appeal surged during the pandemic-era flight to waterfront property, helping drive the dramatic rise in prices between 2020 and 2022. Though growth has cooled since then, Asharoken remains one of Long Island’s premier coastal addresses.
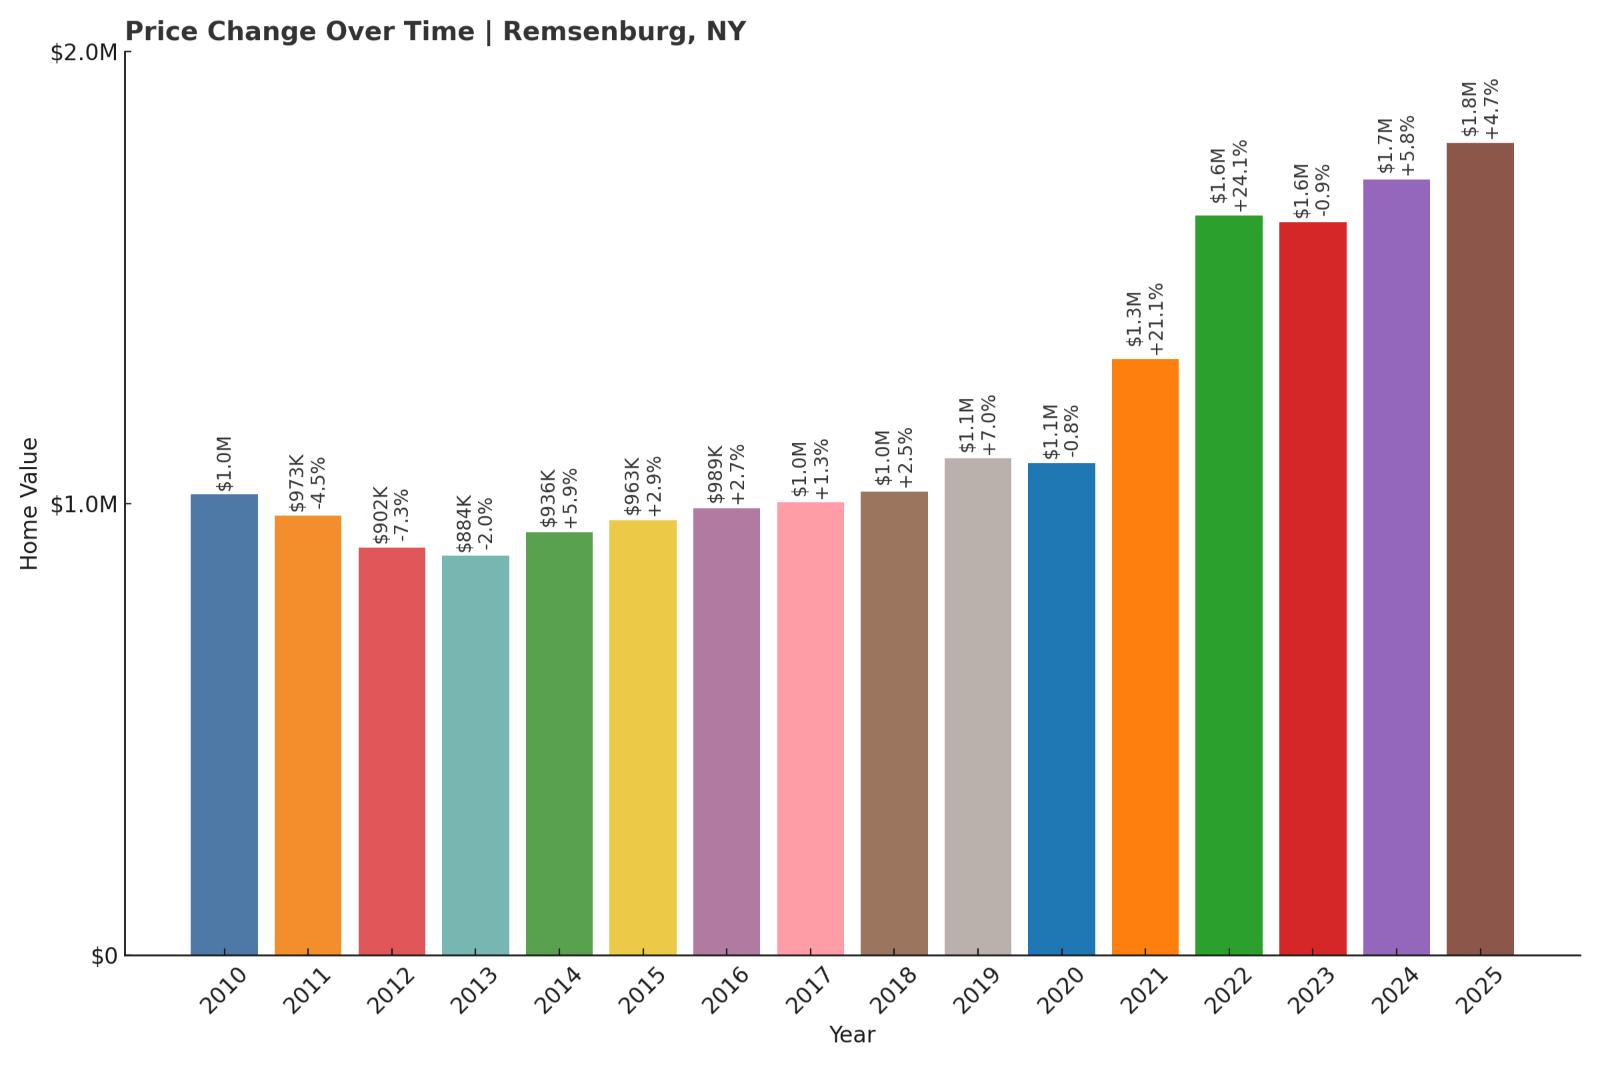
22. Remsenburg – 76% Home Price Increase Since 2010
- 2010: $1,019,580
- 2011: $973,355 (-$46,225, -4.53% from previous year)
- 2012: $902,026 (-$71,329, -7.33% from previous year)
- 2013: $883,609 (-$18,417, -2.04% from previous year)
- 2014: $935,963 (+$52,355, +5.93% from previous year)
- 2015: $962,642 (+$26,678, +2.85% from previous year)
- 2016: $989,045 (+$26,403, +2.74% from previous year)
- 2017: $1,001,648 (+$12,604, +1.27% from previous year)
- 2018: $1,026,647 (+$24,999, +2.50% from previous year)
- 2019: $1,098,944 (+$72,297, +7.04% from previous year)
- 2020: $1,089,874 (-$9,070, -0.83% from previous year)
- 2021: $1,319,445 (+$229,571, +21.06% from previous year)
- 2022: $1,637,333 (+$317,887, +24.09% from previous year)
- 2023: $1,622,544 (-$14,789, -0.90% from previous year)
- 2024: $1,716,941 (+$94,398, +5.82% from previous year)
- 2025: $1,797,215 (+$80,274, +4.68% from previous year)
Remsenburg’s home values have increased by over $777,000 since 2010, or roughly 76%. Much of the growth came during the boom years of 2021 and 2022, which brought massive double-digit gains. The market has since cooled but remains high at nearly $1.8 million in 2025.
Remsenburg – Quiet Sophistication Near the Hamptons
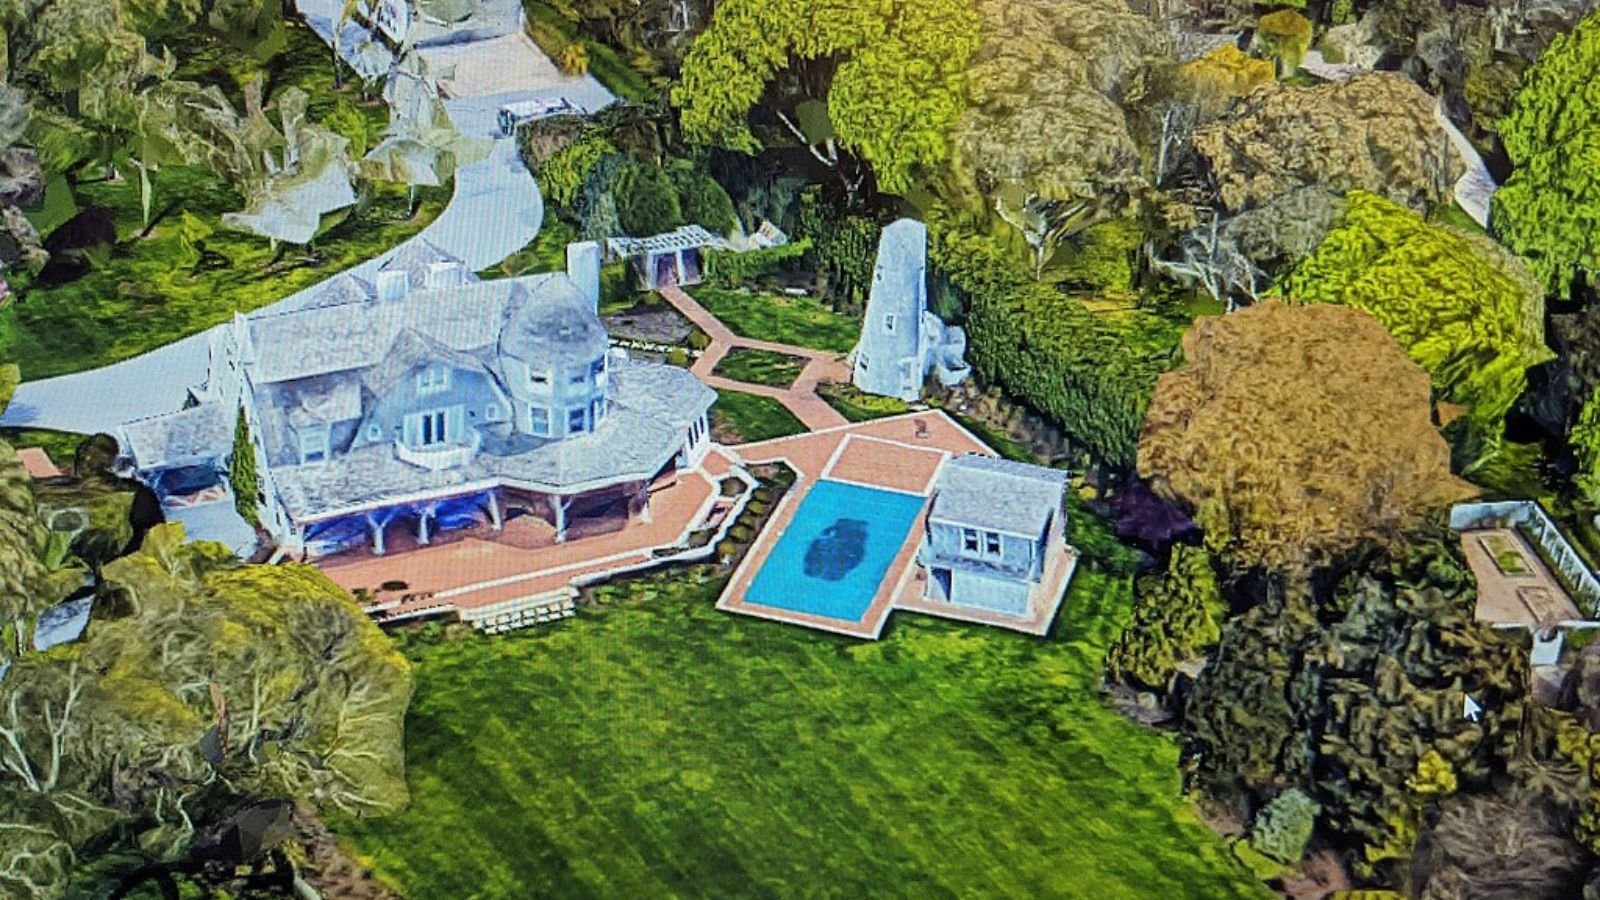
Located just west of Westhampton, Remsenburg offers proximity to the Hamptons without quite the same buzz or density. It’s an attractive spot for those seeking a low-key second home near the water with large lots, quiet roads, and a historic rural feel.
Because it’s not overrun with commercial development or short-term rentals, Remsenburg has maintained a level of charm and stability that appeals to long-term owners. That stability helped fuel consistent gains—even in years when other markets stumbled.
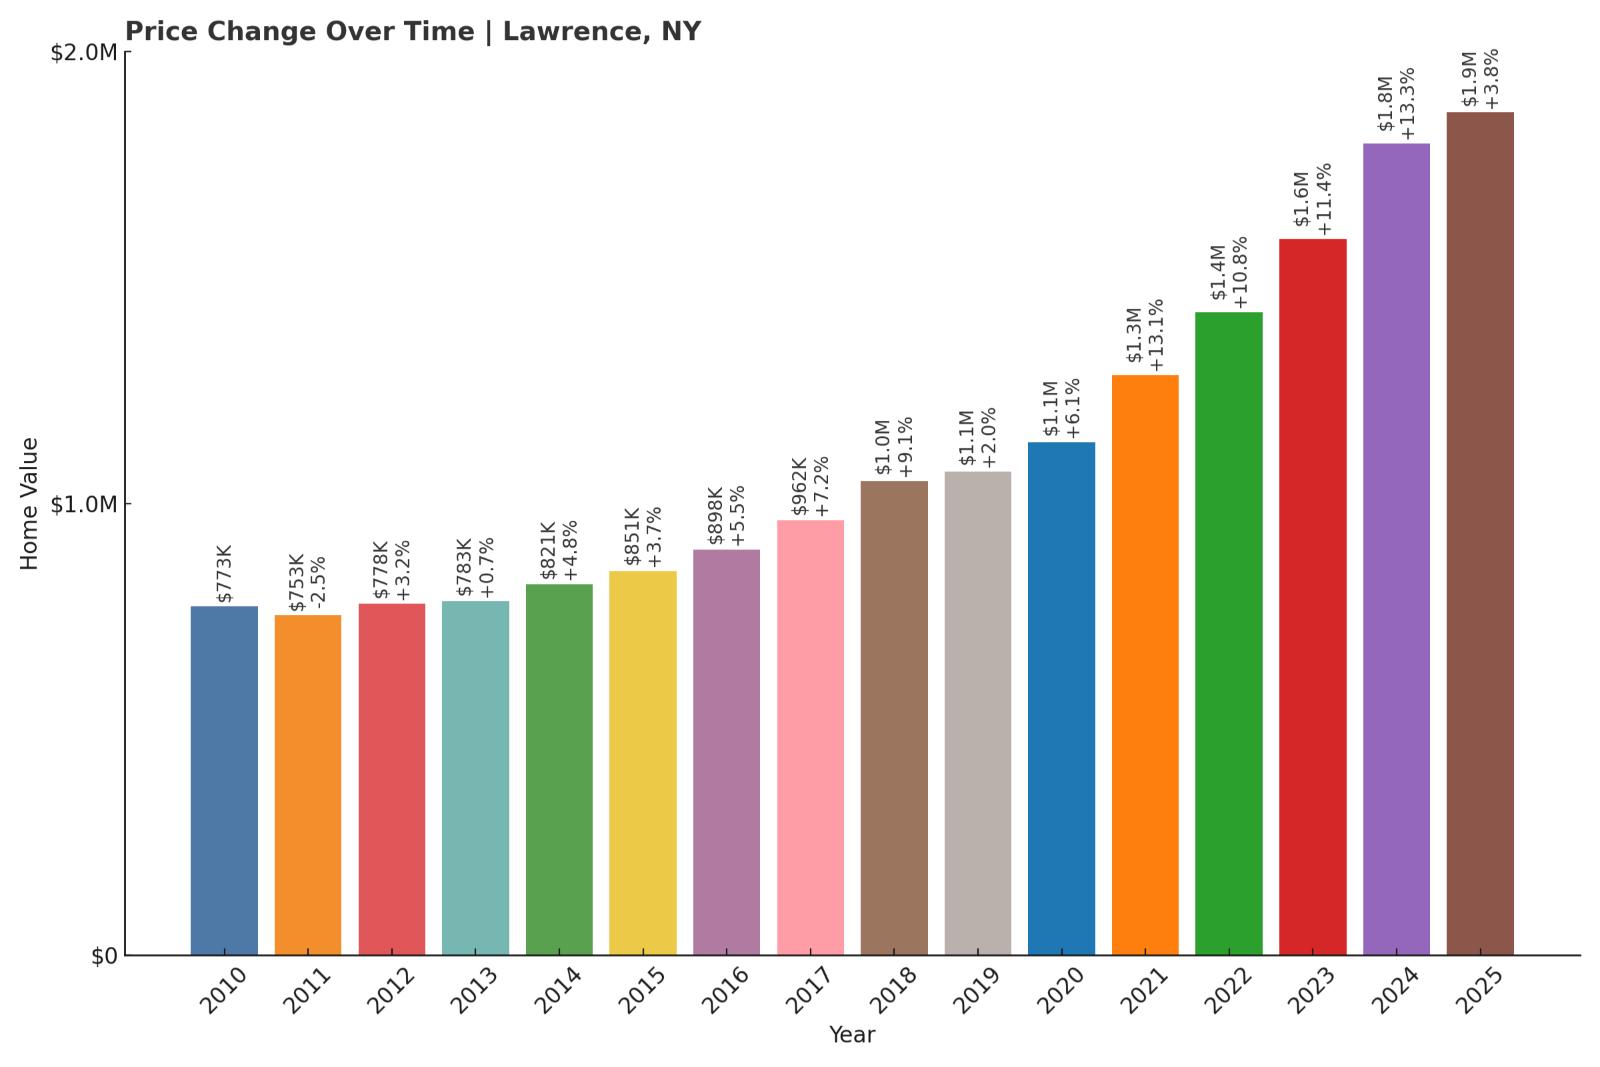
21. Lawrence – 141% Home Price Increase Since 2010
- 2010: $772,585
- 2011: $753,110 (-$19,476, -2.52% from previous year)
- 2012: $777,523 (+$24,413, +3.24% from previous year)
- 2013: $783,306 (+$5,783, +0.74% from previous year)
- 2014: $820,978 (+$37,672, +4.81% from previous year)
- 2015: $850,998 (+$30,021, +3.66% from previous year)
- 2016: $897,854 (+$46,856, +5.51% from previous year)
- 2017: $962,298 (+$64,443, +7.18% from previous year)
- 2018: $1,049,612 (+$87,315, +9.07% from previous year)
- 2019: $1,070,651 (+$21,039, +2.00% from previous year)
- 2020: $1,135,668 (+$65,017, +6.07% from previous year)
- 2021: $1,284,248 (+$148,580, +13.08% from previous year)
- 2022: $1,422,567 (+$138,319, +10.77% from previous year)
- 2023: $1,585,128 (+$162,561, +11.43% from previous year)
- 2024: $1,796,038 (+$210,910, +13.31% from previous year)
- 2025: $1,864,648 (+$68,610, +3.82% from previous year)
Lawrence’s home values have soared from just over $770K in 2010 to nearly $1.87 million in 2025—a 141% rise. The increases have accelerated significantly since 2020, with double-digit growth in three of the last four years.
Lawrence – Historic Elegance with Urban Access
Situated in Nassau County’s Five Towns area, Lawrence combines proximity to Queens with a reputation for quiet affluence. It’s one of the wealthiest communities on Long Island and features stately homes, tree-lined streets, and easy access to Manhattan via the LIRR.
Home values have risen in part due to strong demand from families and professionals looking to stay within commuting distance of NYC while enjoying private schools, golf clubs, and a strong sense of community. Its real estate market has seen a notable resurgence in the post-2020 years, reflecting this blend of convenience and exclusivity.
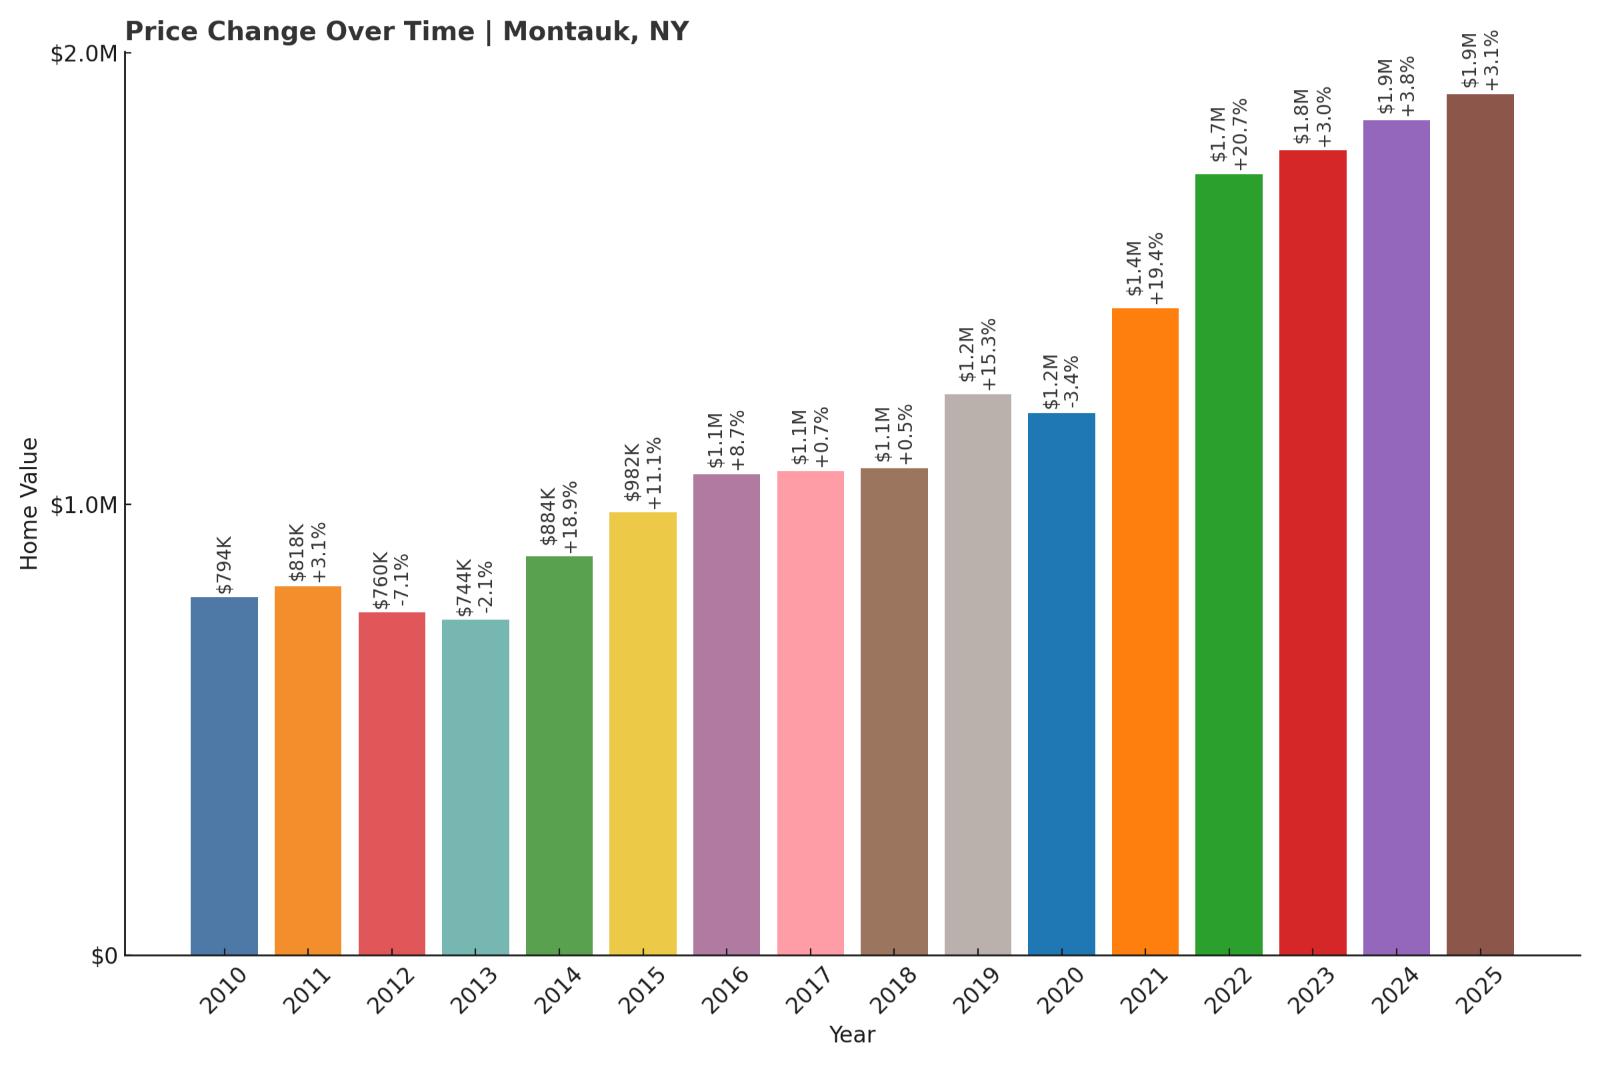
20. Montauk – 140% Home Price Increase Since 2010
- 2010: $793,688
- 2011: $818,011 (+$24,323, +3.06% from previous year)
- 2012: $759,766 (-$58,245, -7.12% from previous year)
- 2013: $743,611 (-$16,155, -2.13% from previous year)
- 2014: $884,033 (+$140,421, +18.88% from previous year)
- 2015: $981,733 (+$97,700, +11.05% from previous year)
- 2016: $1,066,753 (+$85,020, +8.66% from previous year)
- 2017: $1,073,902 (+$7,149, +0.67% from previous year)
- 2018: $1,079,568 (+$5,666, +0.53% from previous year)
- 2019: $1,244,384 (+$164,815, +15.27% from previous year)
- 2020: $1,202,229 (-$42,155, -3.39% from previous year)
- 2021: $1,434,931 (+$232,702, +19.36% from previous year)
- 2022: $1,732,169 (+$297,238, +20.71% from previous year)
- 2023: $1,784,183 (+$52,014, +3.00% from previous year)
- 2024: $1,851,681 (+$67,498, +3.78% from previous year)
- 2025: $1,908,562 (+$56,881, +3.07% from previous year)
Montauk’s home values have jumped from just under $800K in 2010 to over $1.9 million in 2025—a dramatic 140% rise. The strongest gains occurred during the real estate surge of 2021 and 2022, when prices increased by over $500K in just two years.
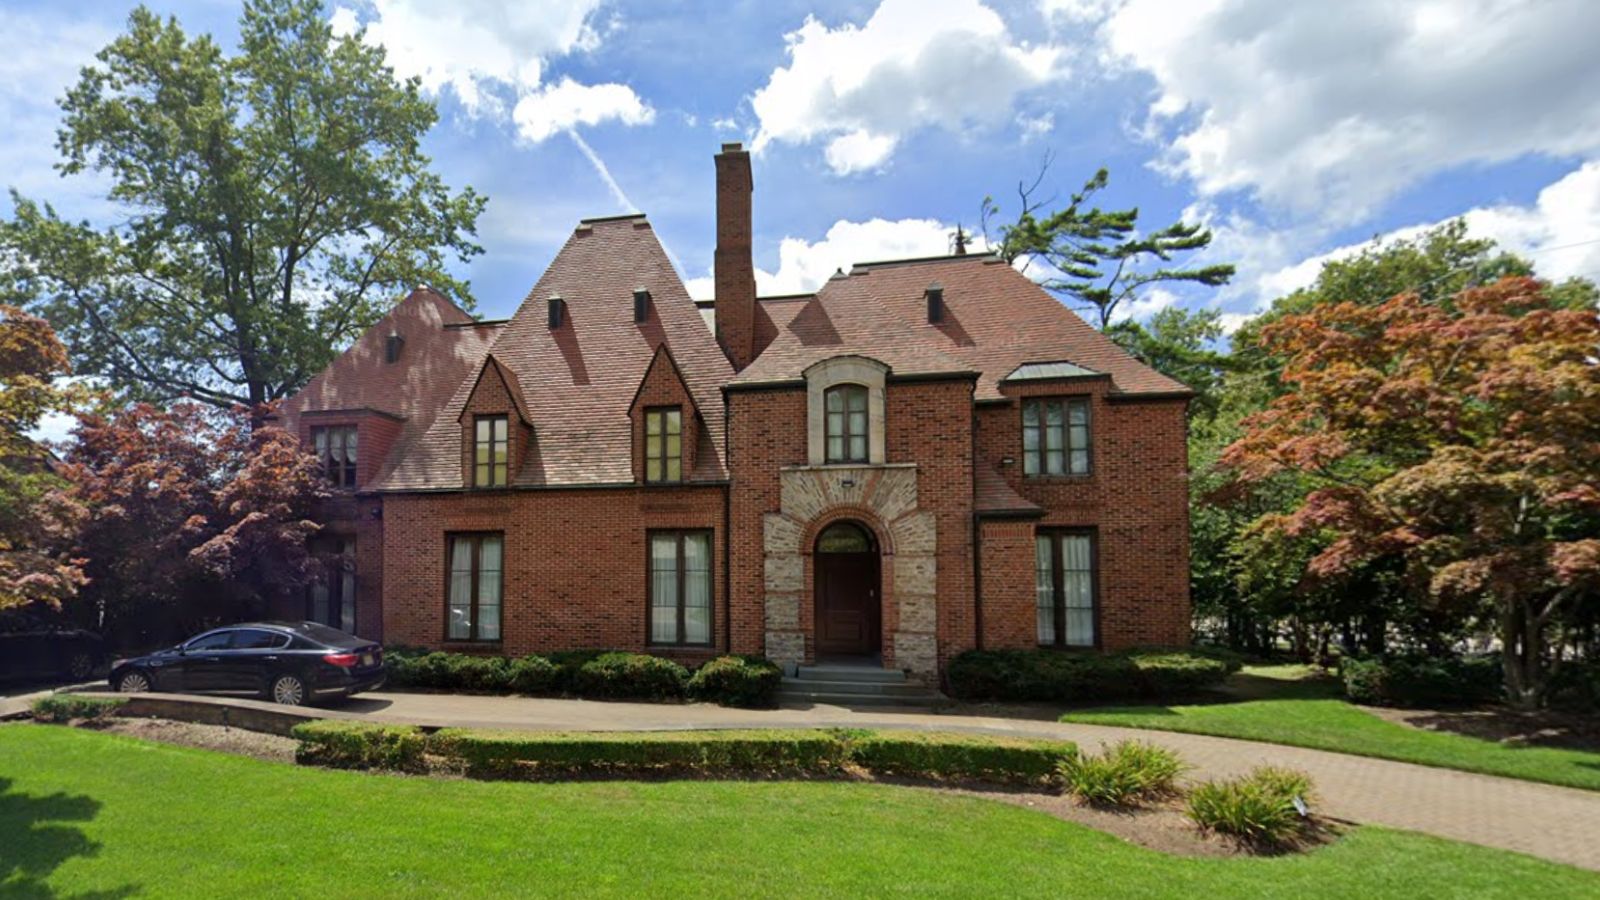
Montauk – The Edge of the Hamptons, Reinvented

Once a laid-back fishing village, Montauk has transformed into a high-end destination that blends surf culture with luxury. Located at the easternmost tip of Long Island, it’s long been considered more rugged than its Hamptons neighbors, but that appeal has shifted sharply in the past decade.
Its rising popularity among New Yorkers and out-of-state buyers—especially during the pandemic years—drove intense interest in local real estate. Oceanfront properties, boutique hotels, and a booming seasonal scene have turned Montauk into a powerhouse market with prices to match.
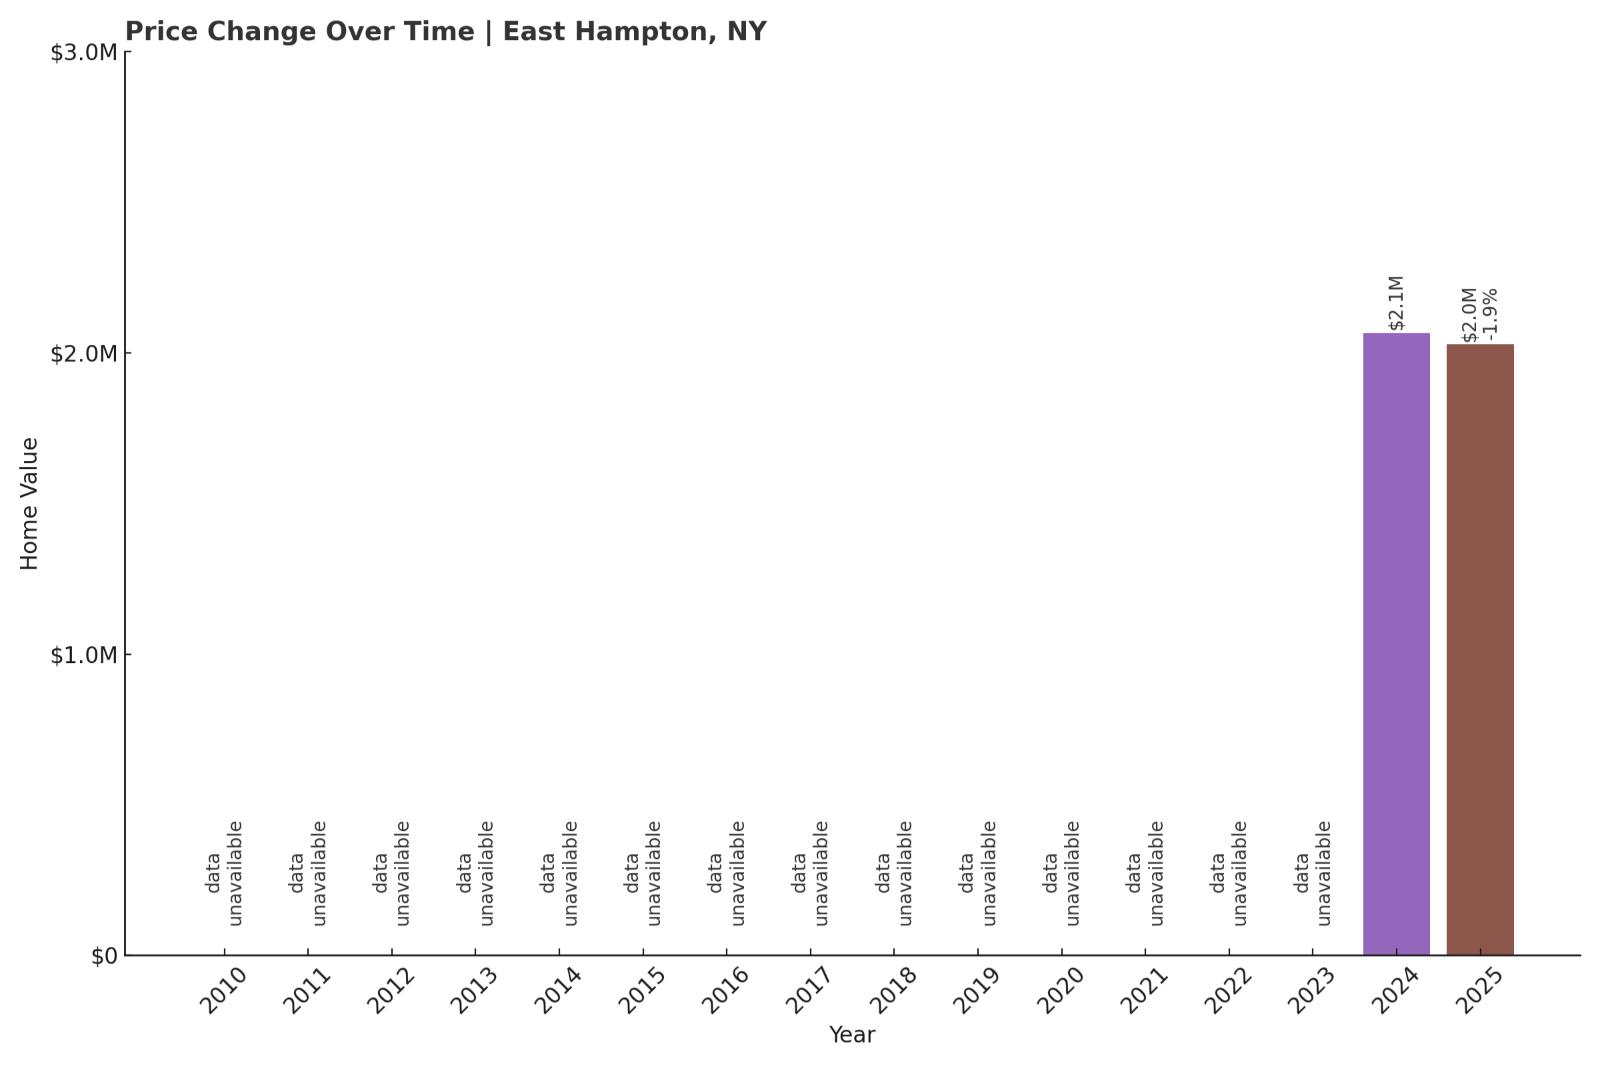
19. East Hampton – 1.92% Home Price Decrease Since 2024
Would you like to save this?
- 2010: N/A
- 2011: N/A
- 2012: N/A
- 2013: N/A
- 2014: N/A
- 2015: N/A
- 2016: N/A
- 2017: N/A
- 2018: N/A
- 2019: N/A
- 2020: N/A
- 2021: N/A
- 2022: N/A
- 2023: N/A
- 2024: $2,066,567
- 2025: $2,026,933 (-$39,634, -1.92% from previous year)
Though East Hampton’s full price history isn’t available, the most recent data shows a modest drop of 1.92% from 2024 to 2025. Still, with a home value over $2 million, it remains one of the state’s priciest markets—and one with significant long-term investment appeal.
East Hampton – Iconic Luxury with Staying Power
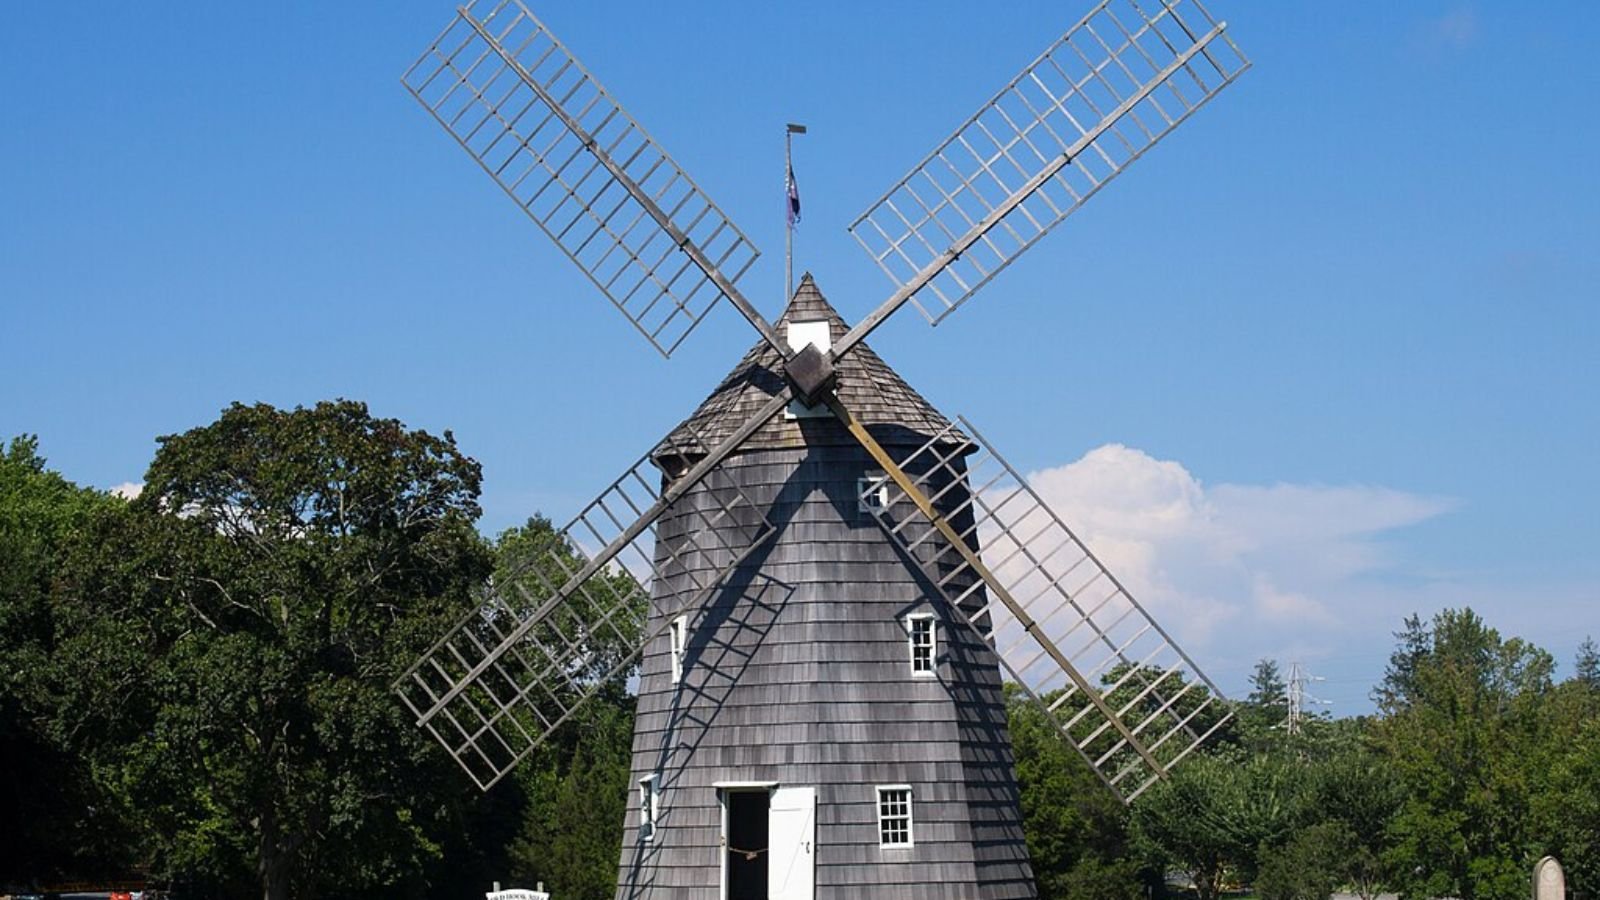
East Hampton is synonymous with elite Hamptons living. Grand estates, historic homes, and beachfront properties define this world-famous town, which continues to attract the ultra-wealthy year after year.
Even with a slight dip in price this past year, East Hampton’s reputation and constrained inventory help keep home values high. It’s not just a summer destination—it’s a long-term investment in exclusivity, location, and prestige. That stability helps explain why values have remained well above the $2 million mark.
18. Manhasset – 90% Home Price Increase Since 2010
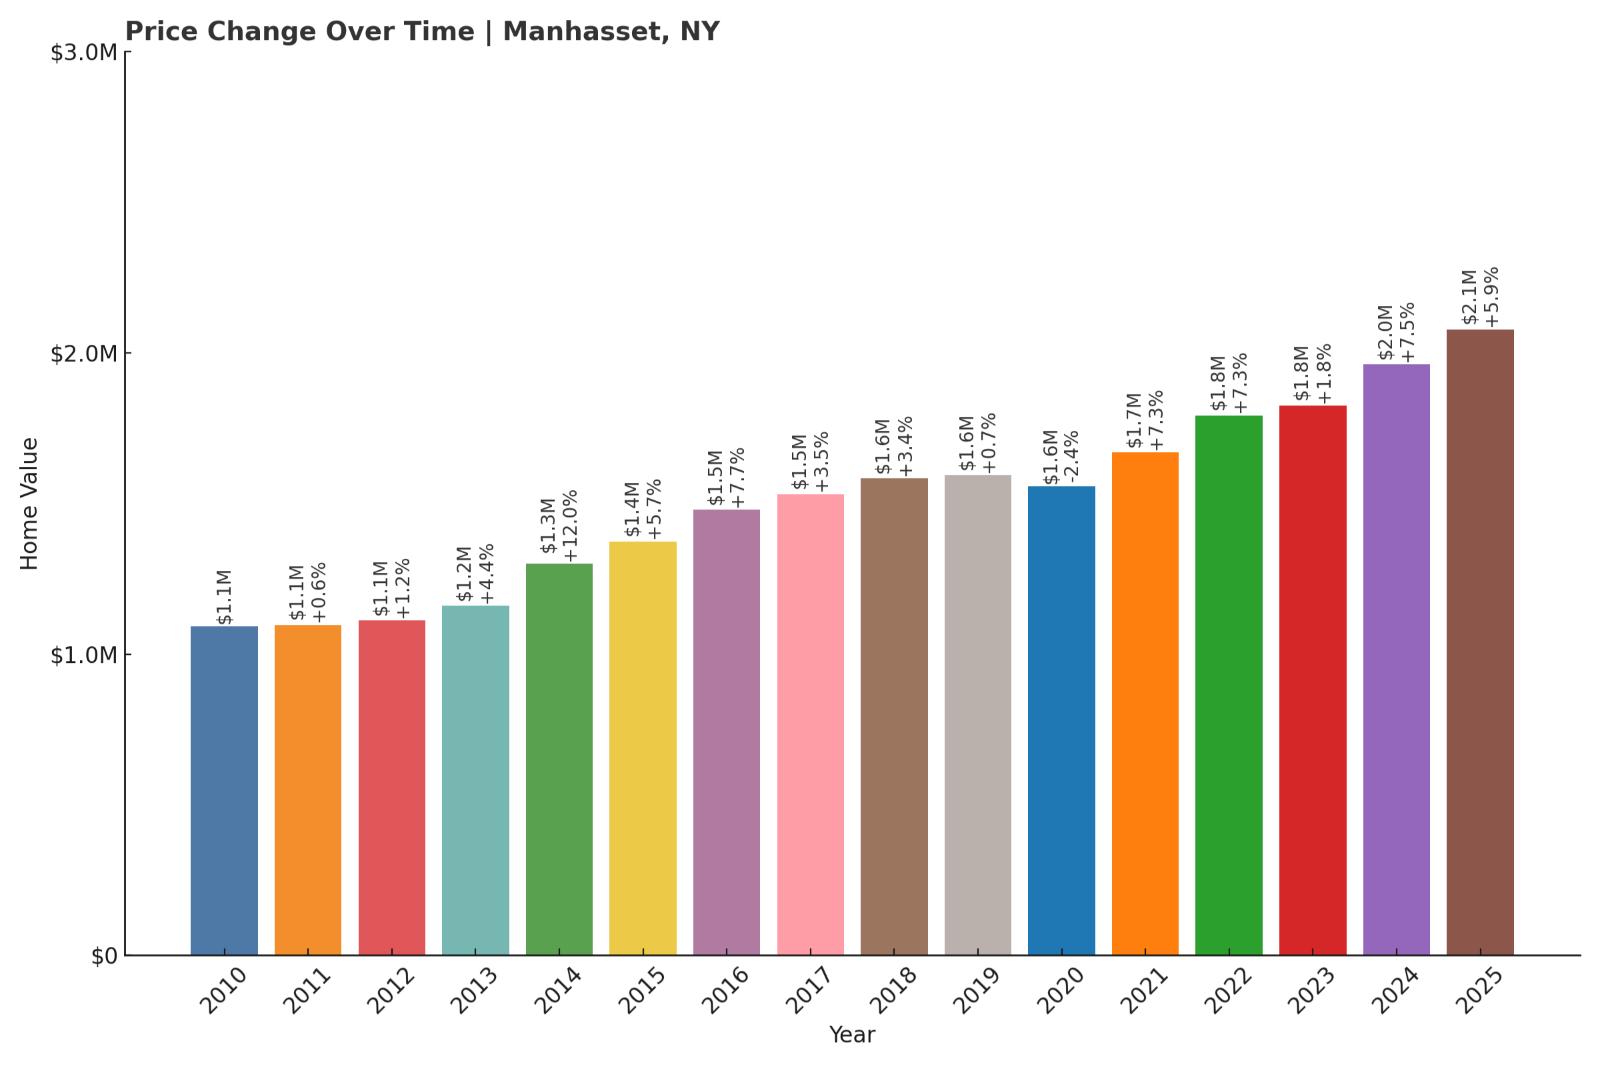
- 2010: $1,090,991
- 2011: $1,097,168 (+$6,177, +0.57% from previous year)
- 2012: $1,110,768 (+$13,600, +1.24% from previous year)
- 2013: $1,159,566 (+$48,798, +4.39% from previous year)
- 2014: $1,298,834 (+$139,268, +12.01% from previous year)
- 2015: $1,373,233 (+$74,399, +5.73% from previous year)
- 2016: $1,478,306 (+$105,073, +7.65% from previous year)
- 2017: $1,530,503 (+$52,197, +3.53% from previous year)
- 2018: $1,582,718 (+$52,215, +3.41% from previous year)
- 2019: $1,593,683 (+$10,965, +0.69% from previous year)
- 2020: $1,555,887 (-$37,796, -2.37% from previous year)
- 2021: $1,668,824 (+$112,938, +7.26% from previous year)
- 2022: $1,791,287 (+$122,463, +7.34% from previous year)
- 2023: $1,824,162 (+$32,875, +1.84% from previous year)
- 2024: $1,961,190 (+$137,029, +7.51% from previous year)
- 2025: $2,077,151 (+$115,961, +5.91% from previous year)
Home values in Manhasset rose nearly 90% from 2010 to 2025, increasing by almost $1 million. While some fluctuations occurred around 2020, the long-term trend has been upward, with a recent series of strong gains pushing the median value past $2 million.
Manhasset – High Demand and Proximity to NYC
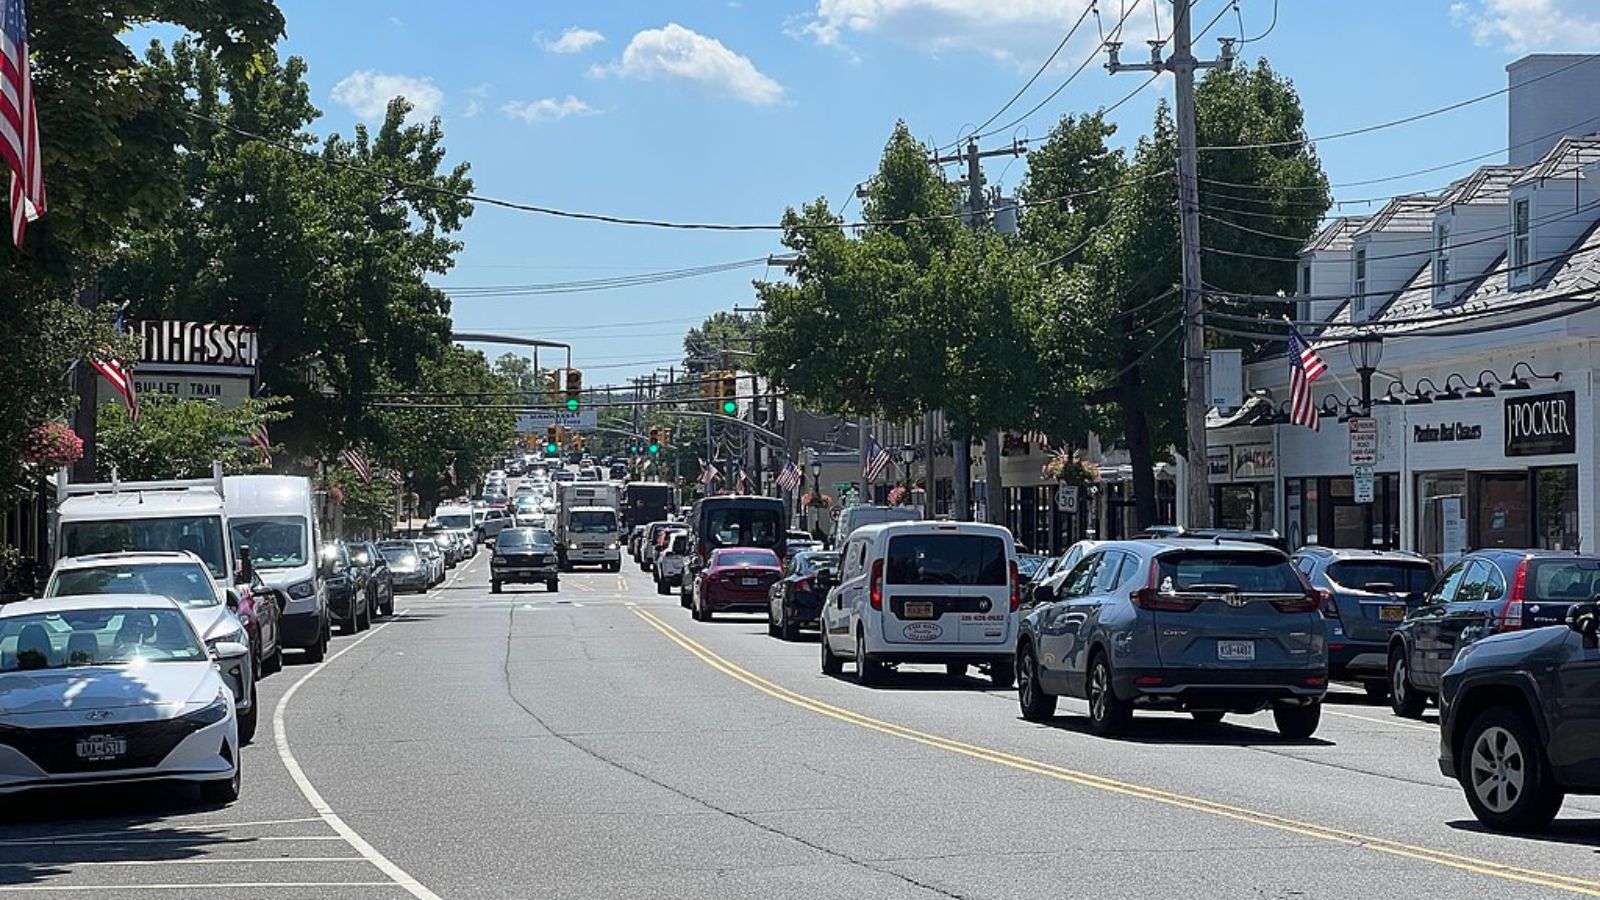
Located in Nassau County’s Town of North Hempstead, Manhasset offers an ideal blend of commuter convenience and suburban refinement. The town’s access to the LIRR makes it a popular choice for high-earning professionals working in Manhattan.
Its upscale shopping, highly ranked schools, and charming neighborhoods like Munsey Park and Plandome contribute to sustained buyer interest. Manhasset’s steady appreciation reflects its role as one of Long Island’s most desirable year-round communities.
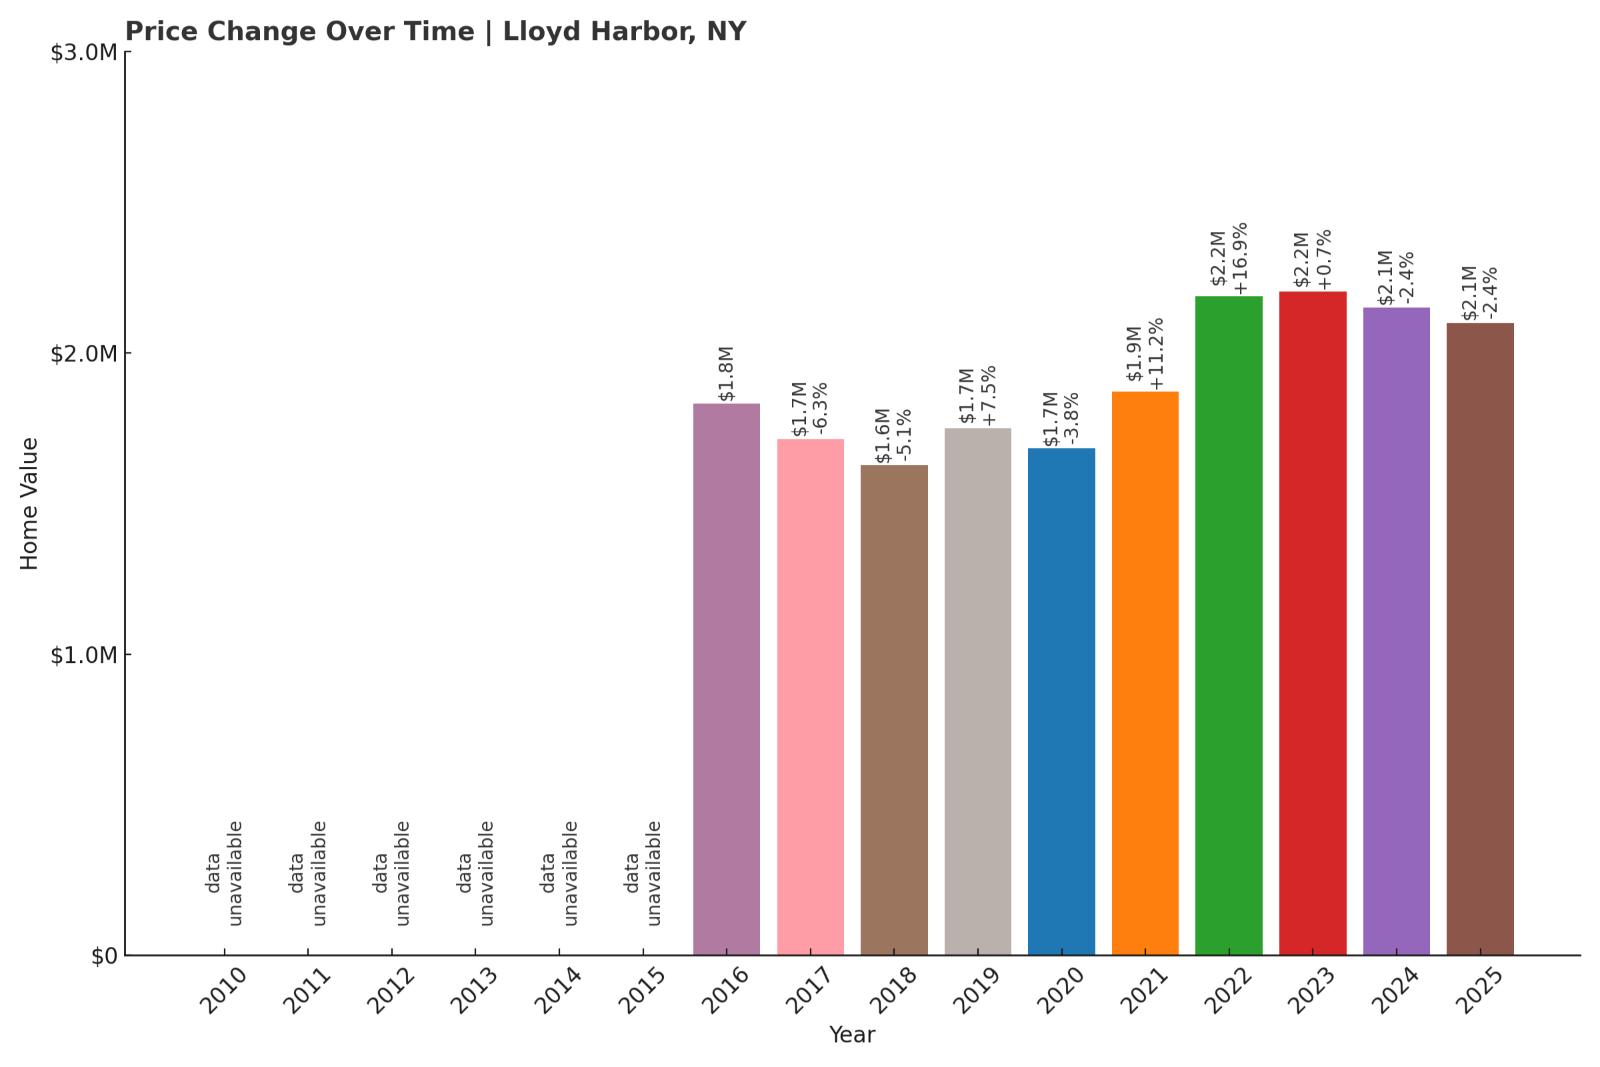
17. Lloyd Harbor – 14.6% Home Price Increase Since 2016
- 2010: N/A
- 2011: N/A
- 2012: N/A
- 2013: N/A
- 2014: N/A
- 2015: N/A
- 2016: $1,830,909
- 2017: $1,714,728 (-$116,180, -6.35% from previous year)
- 2018: $1,627,312 (-$87,417, -5.10% from previous year)
- 2019: $1,749,047 (+$121,735, +7.48% from previous year)
- 2020: $1,682,167 (-$66,880, -3.82% from previous year)
- 2021: $1,870,116 (+$187,950, +11.17% from previous year)
- 2022: $2,186,574 (+$316,457, +16.92% from previous year)
- 2023: $2,202,140 (+$15,566, +0.71% from previous year)
- 2024: $2,149,542 (-$52,598, -2.39% from previous year)
- 2025: $2,099,019 (-$50,523, -2.35% from previous year)
Since 2016, home prices in Lloyd Harbor have risen by nearly $270K—or about 14.6%. However, the past two years show some softening, with small year-over-year declines suggesting a potential price ceiling or market correction in the ultra-luxury segment.
Lloyd Harbor – Estate Living with Natural Seclusion
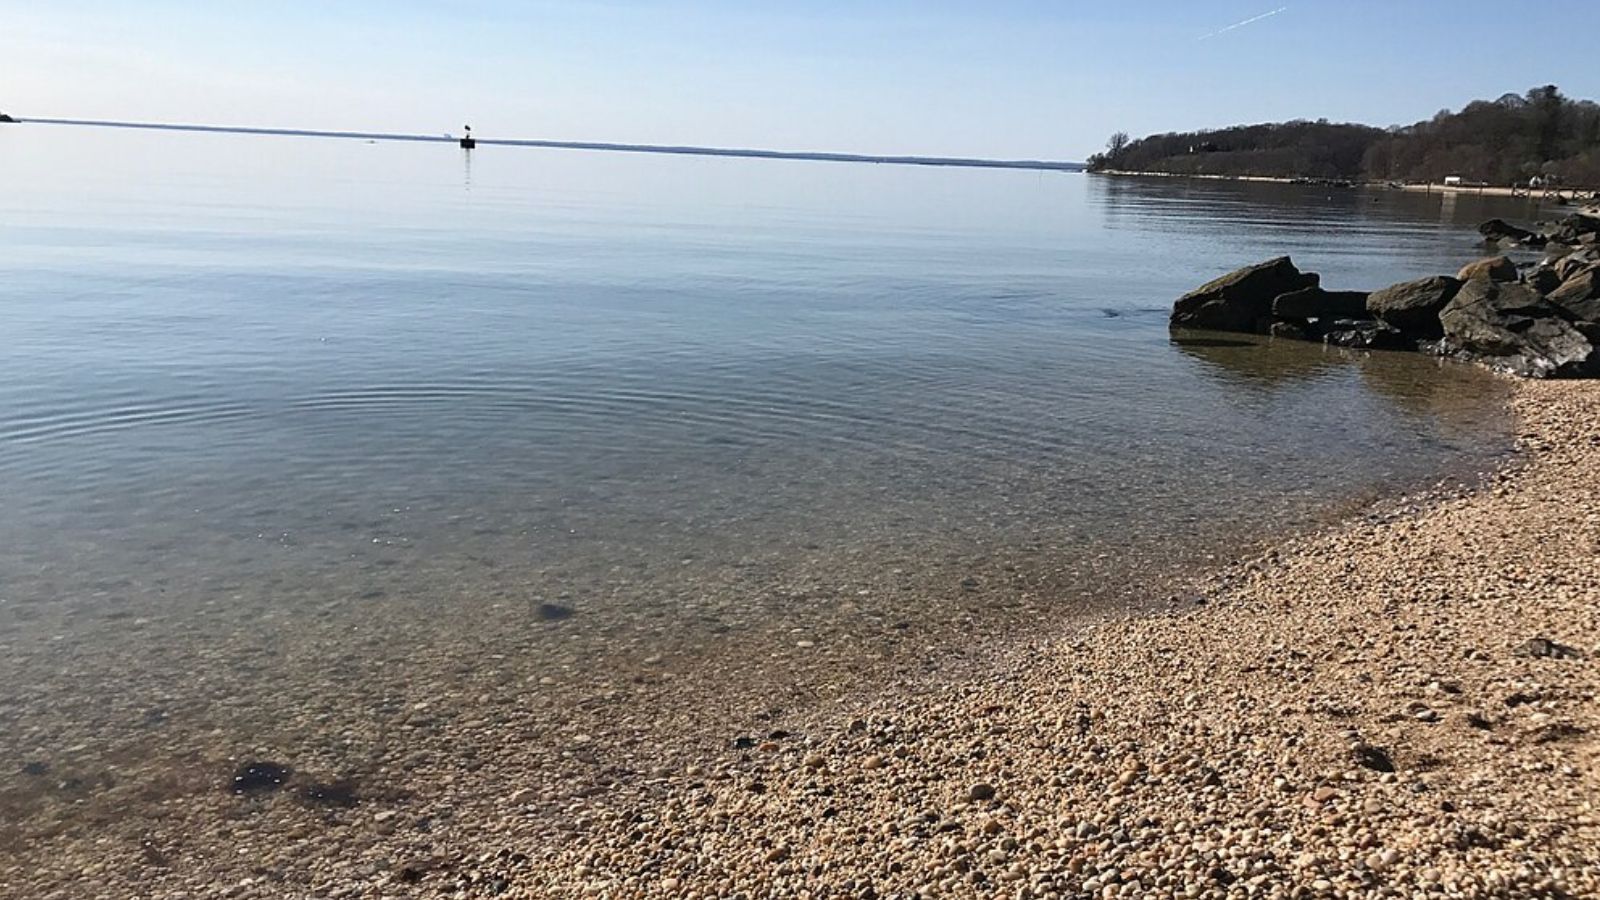
Lloyd Harbor is a secluded village on Long Island’s North Shore, known for its sprawling estates, deep-water docks, and wooded settings. It offers a semi-rural lifestyle just an hour from Manhattan, with a strong local emphasis on land conservation and privacy.


The village’s large lots and restricted development have kept inventory low, sustaining high values even as other luxury markets cooled. Still, recent softening could indicate a shift in buyer expectations or a rebalancing after the explosive growth of 2021–2022.
16. Purchase – 36.5% Home Price Increase Since 2010
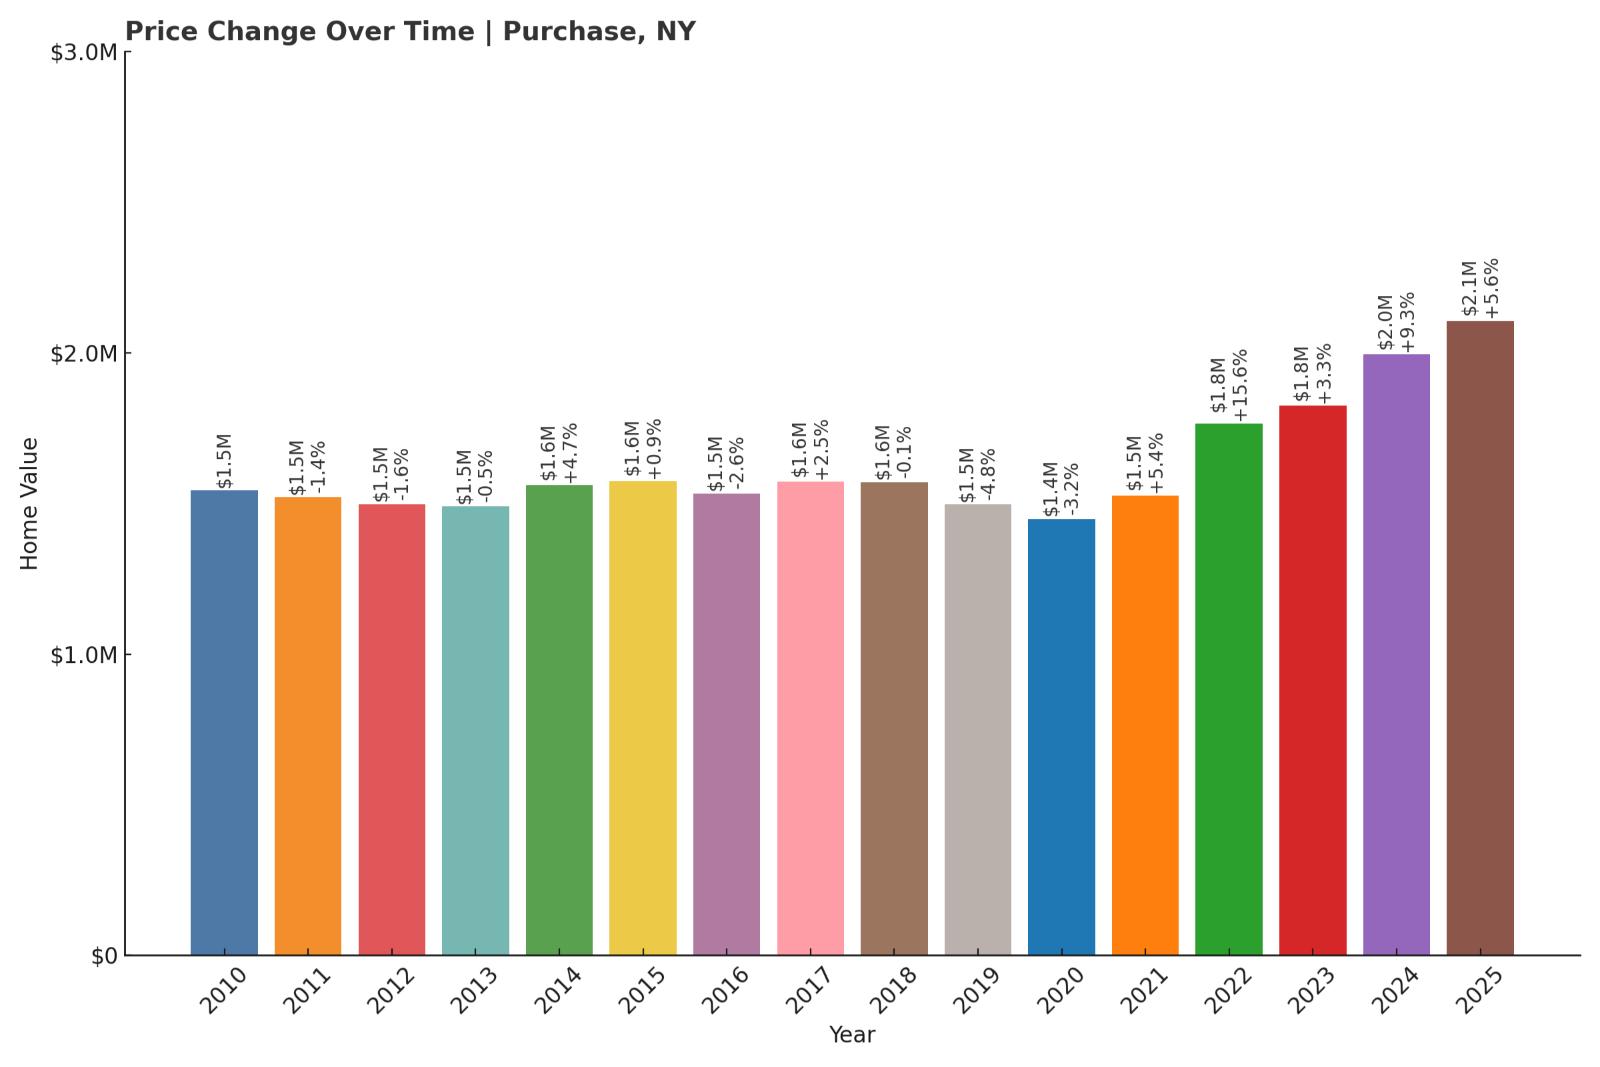
- 2010: $1,542,427
- 2011: $1,520,988 (-$21,439, -1.39% from previous year)
- 2012: $1,497,276 (-$23,713, -1.56% from previous year)
- 2013: $1,490,055 (-$7,220, -0.48% from previous year)
- 2014: $1,560,532 (+$70,477, +4.73% from previous year)
- 2015: $1,574,009 (+$13,477, +0.86% from previous year)
- 2016: $1,533,292 (-$40,717, -2.59% from previous year)
- 2017: $1,571,607 (+$38,315, +2.50% from previous year)
- 2018: $1,570,714 (-$893, -0.06% from previous year)
- 2019: $1,495,732 (-$74,983, -4.77% from previous year)
- 2020: $1,448,418 (-$47,314, -3.16% from previous year)
- 2021: $1,526,383 (+$77,965, +5.38% from previous year)
- 2022: $1,765,081 (+$238,698, +15.64% from previous year)
- 2023: $1,823,553 (+$58,472, +3.31% from previous year)
- 2024: $1,993,929 (+$170,376, +9.34% from previous year)
- 2025: $2,105,411 (+$111,481, +5.59% from previous year)
Home prices in Purchase rose by more than half a million dollars since 2010, reflecting a 36.5% increase over the 15-year span. While values dipped in the late 2010s, they rebounded sharply after 2020, climbing consistently through 2025.
Purchase – Corporate Powerhouse Meets Country Estate
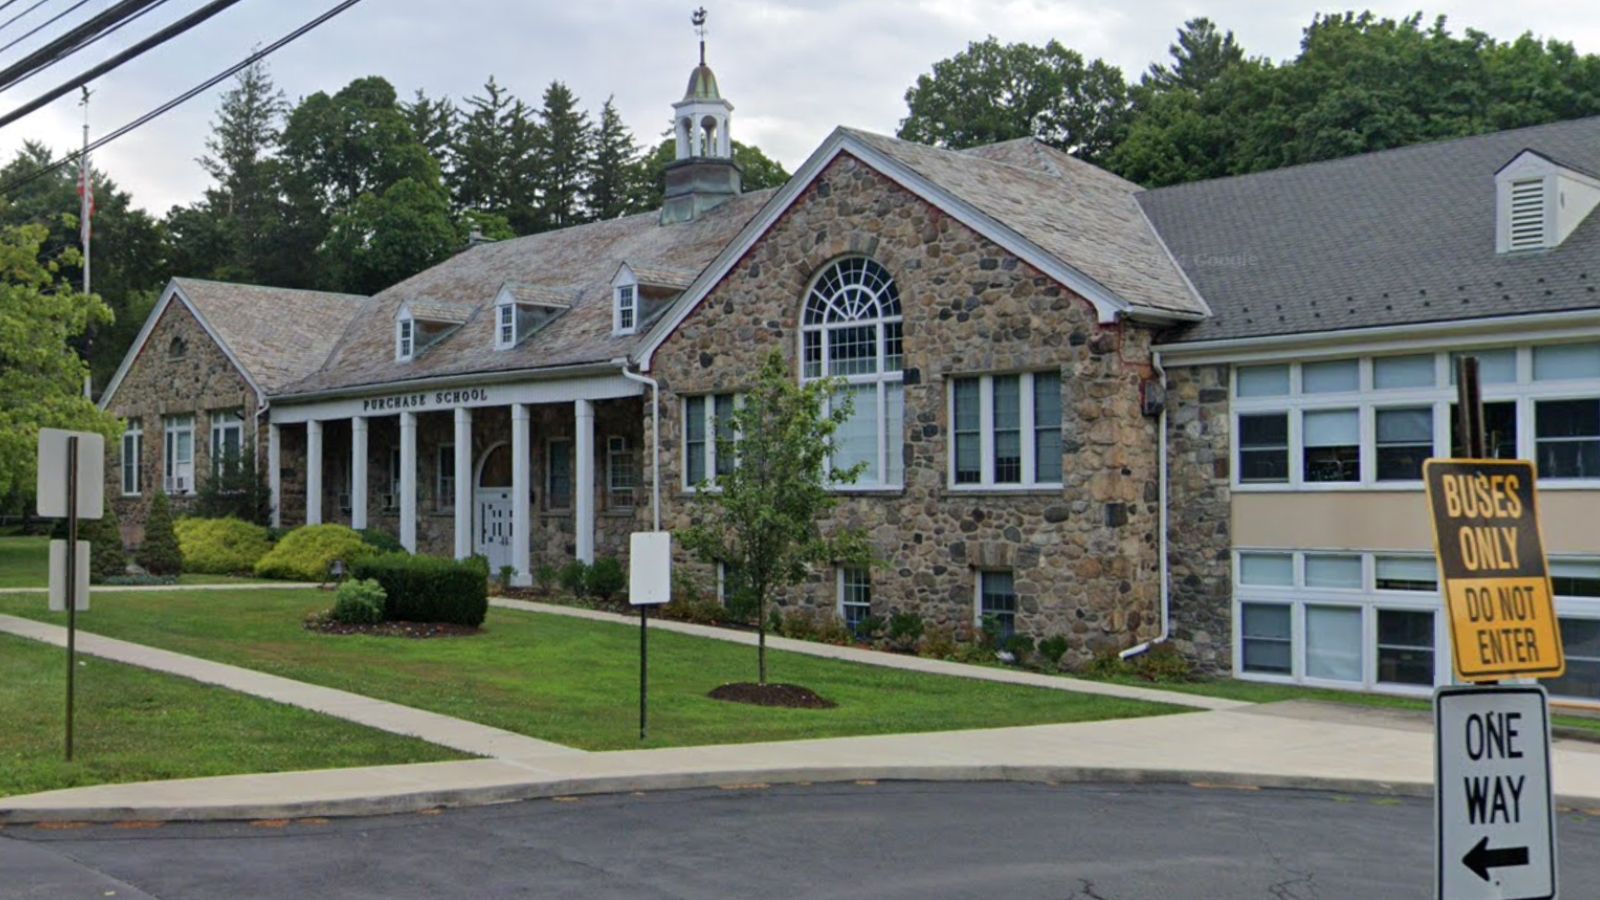
Located in Westchester County, Purchase is home to sprawling estates and several Fortune 500 headquarters. It’s known for combining suburban luxury with proximity to major corporate hubs and regional airports, giving it appeal for both executive-level commuters and long-term investors.
Despite several years of price stagnation earlier on, the town has enjoyed robust growth since 2021, spurred by renewed interest in large homes with acreage and high-end amenities. Purchase continues to draw buyers looking for prestige and space in the New York metro area.
15. Laurel Hollow – 48.3% Home Price Increase Since 2010
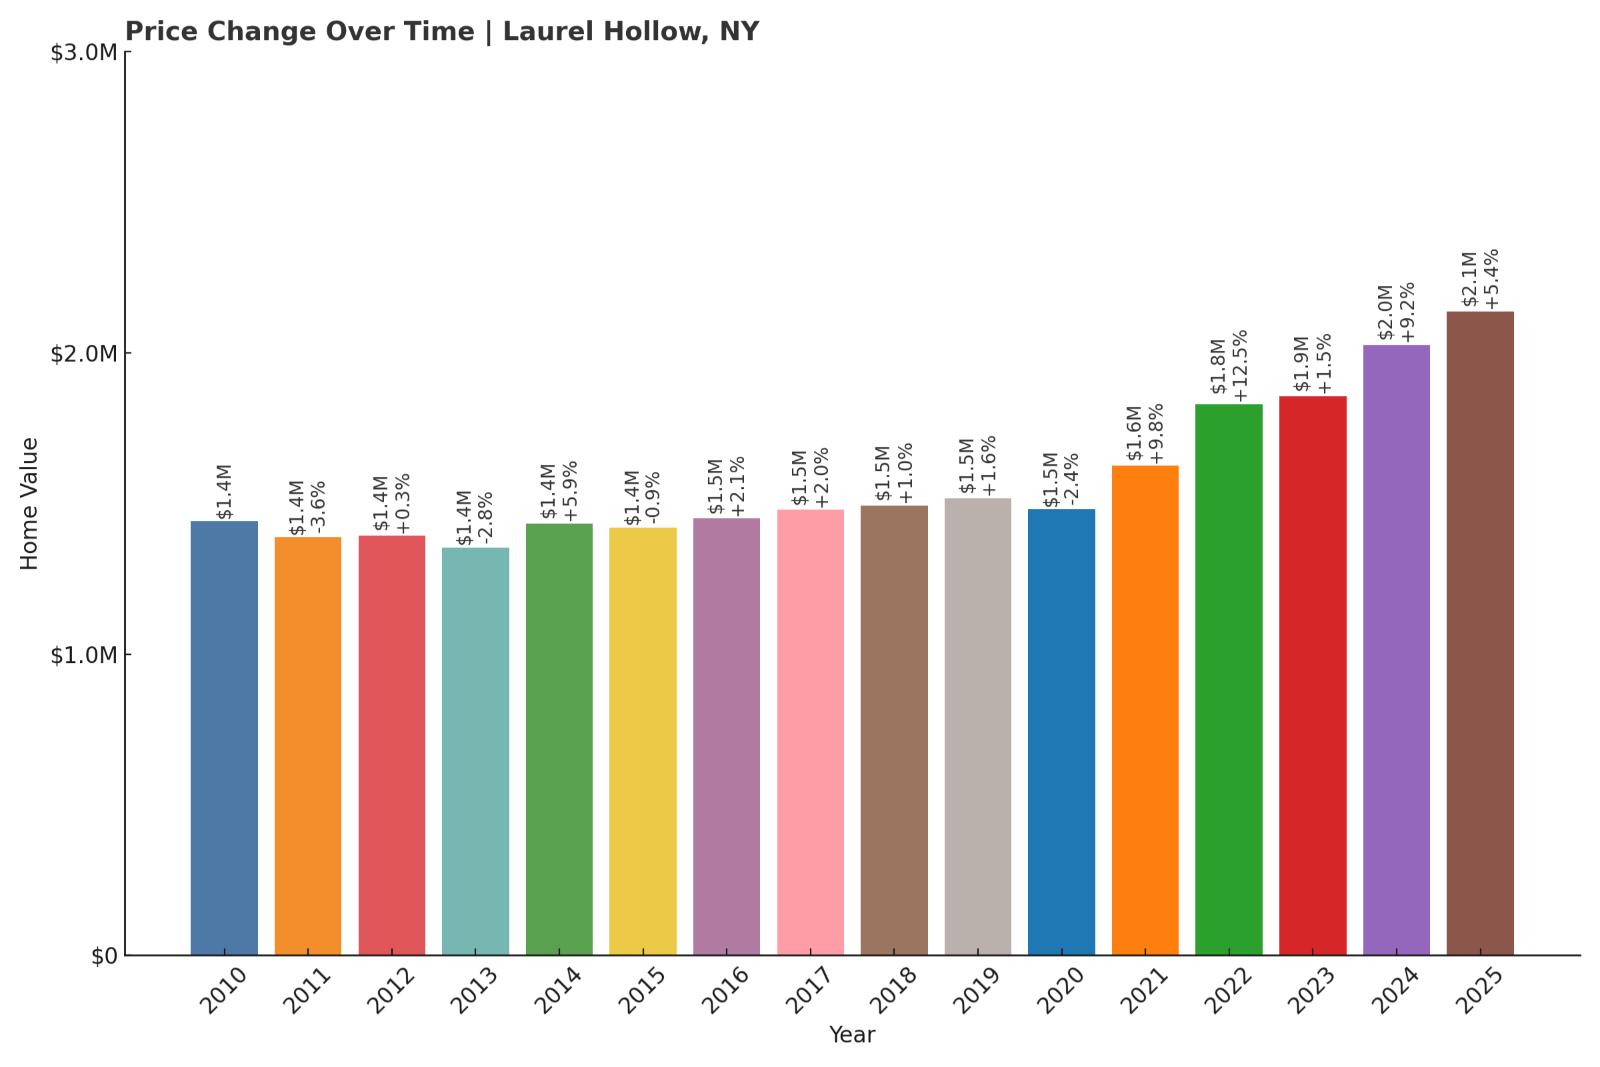
- 2010: $1,440,849
- 2011: $1,388,350 (-$52,499, -3.64% from previous year)
- 2012: $1,392,416 (+$4,066, +0.29% from previous year)
- 2013: $1,353,507 (-$38,908, -2.79% from previous year)
- 2014: $1,433,593 (+$80,085, +5.92% from previous year)
- 2015: $1,420,061 (-$13,532, -0.94% from previous year)
- 2016: $1,450,081 (+$30,021, +2.11% from previous year)
- 2017: $1,478,670 (+$28,589, +1.97% from previous year)
- 2018: $1,493,211 (+$14,541, +0.98% from previous year)
- 2019: $1,517,386 (+$24,175, +1.62% from previous year)
- 2020: $1,480,292 (-$37,094, -2.44% from previous year)
- 2021: $1,624,968 (+$144,676, +9.77% from previous year)
- 2022: $1,828,775 (+$203,807, +12.54% from previous year)
- 2023: $1,855,477 (+$26,702, +1.46% from previous year)
- 2024: $2,026,719 (+$171,242, +9.23% from previous year)
- 2025: $2,136,413 (+$109,695, +5.41% from previous year)
Laurel Hollow’s home values grew by more than $695K since 2010, an increase of just over 48%. While early years showed fluctuations, the market picked up considerable speed after 2020, especially during the double-digit gains of 2021 and 2022.
Laurel Hollow – Private Luxury on the North Shore
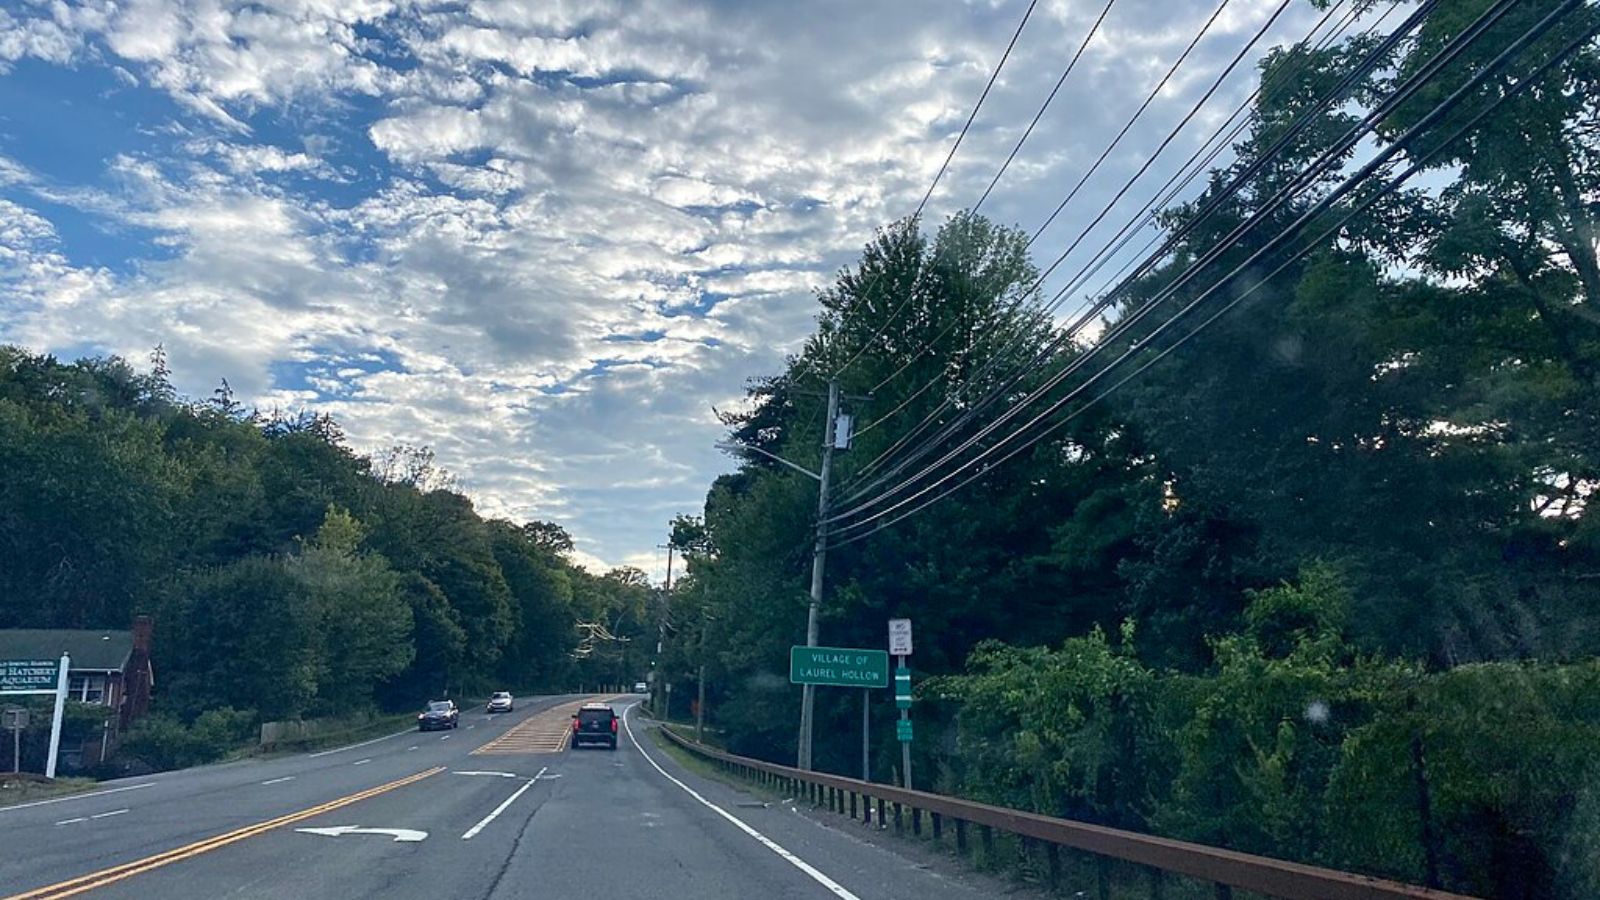
This small village in Nassau County is known for secluded homes, sweeping views of Cold Spring Harbor, and high-profile residents. With limited development and a wooded, hilly landscape, Laurel Hollow has long attracted buyers looking for space, prestige, and privacy.
In recent years, larger suburban properties have surged in popularity, pushing up prices across the board. The town’s strong school district and proximity to Cold Spring Harbor Laboratory only add to its long-term investment appeal.
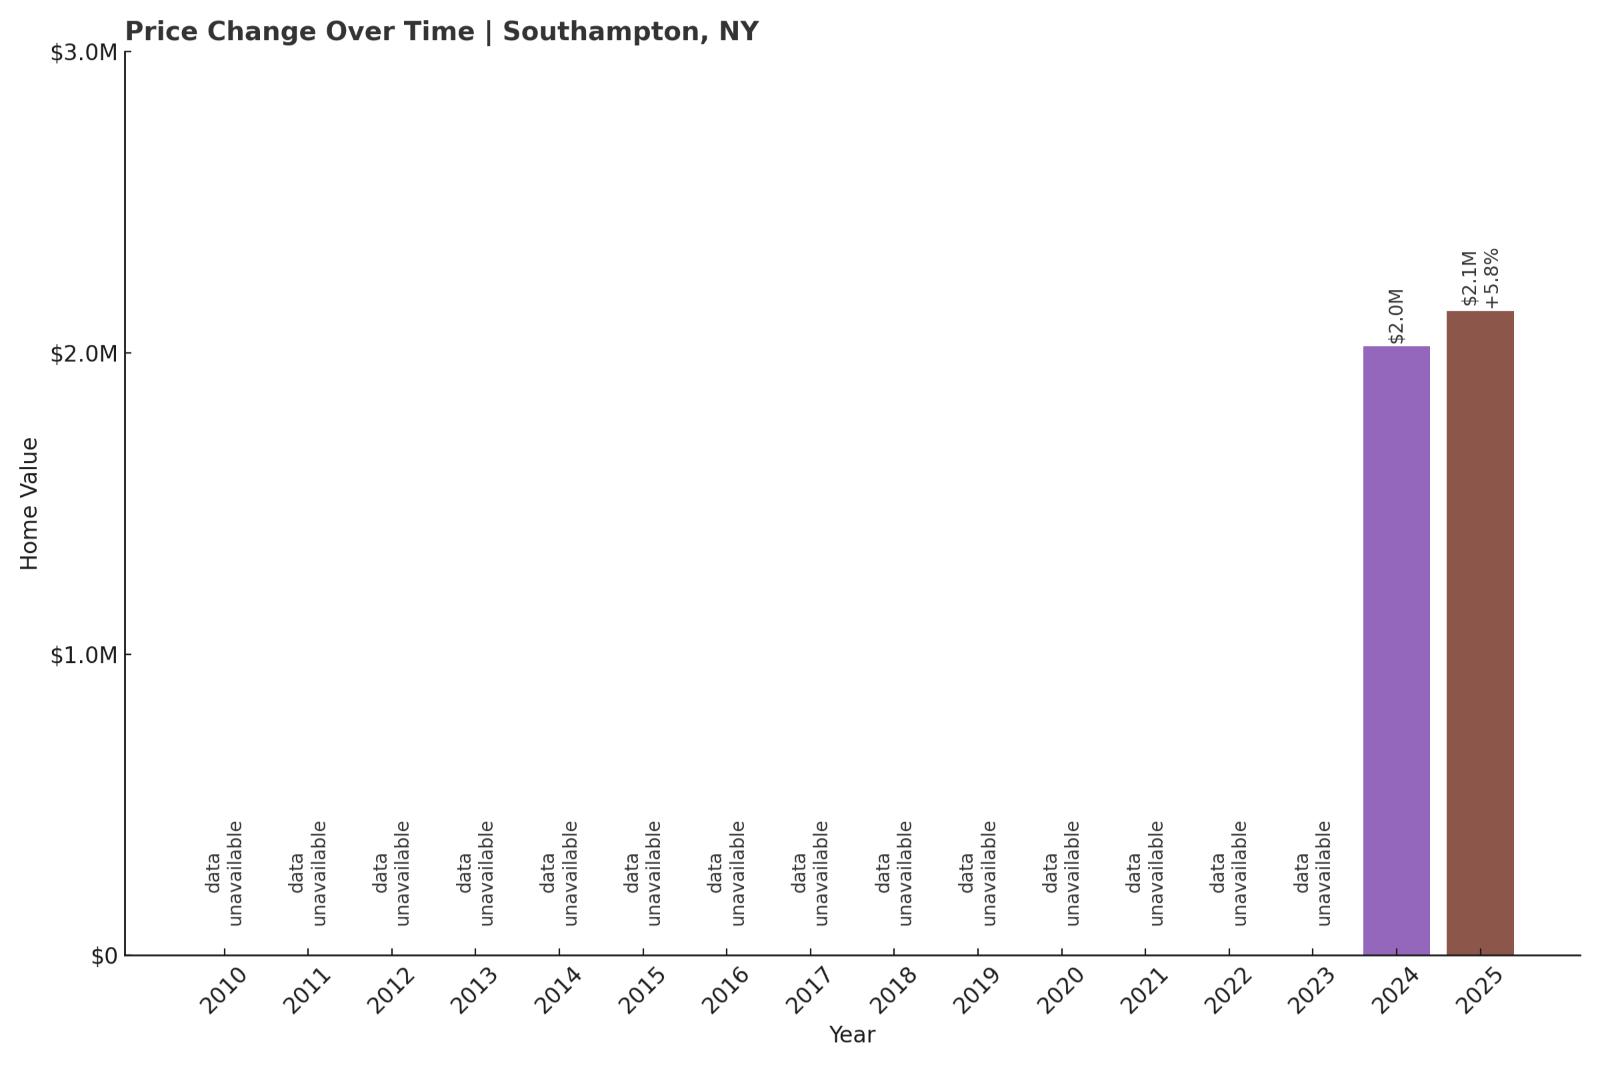
14. Southampton – 5.8% Home Price Increase Since 2024
- 2010: N/A
- 2011: N/A
- 2012: N/A
- 2013: N/A
- 2014: N/A
- 2015: N/A
- 2016: N/A
- 2017: N/A
- 2018: N/A
- 2019: N/A
- 2020: N/A
- 2021: N/A
- 2022: N/A
- 2023: N/A
- 2024: $2,021,925
- 2025: $2,139,251 (+$117,327, +5.80% from previous year)
Southampton only entered Zillow’s dataset in 2024, but prices already exceed $2.1 million. In just one year, home values increased nearly 6%, signaling robust demand and ongoing competition in one of the country’s most iconic seaside destinations.
Southampton – A Hamptons Staple with Global Prestige
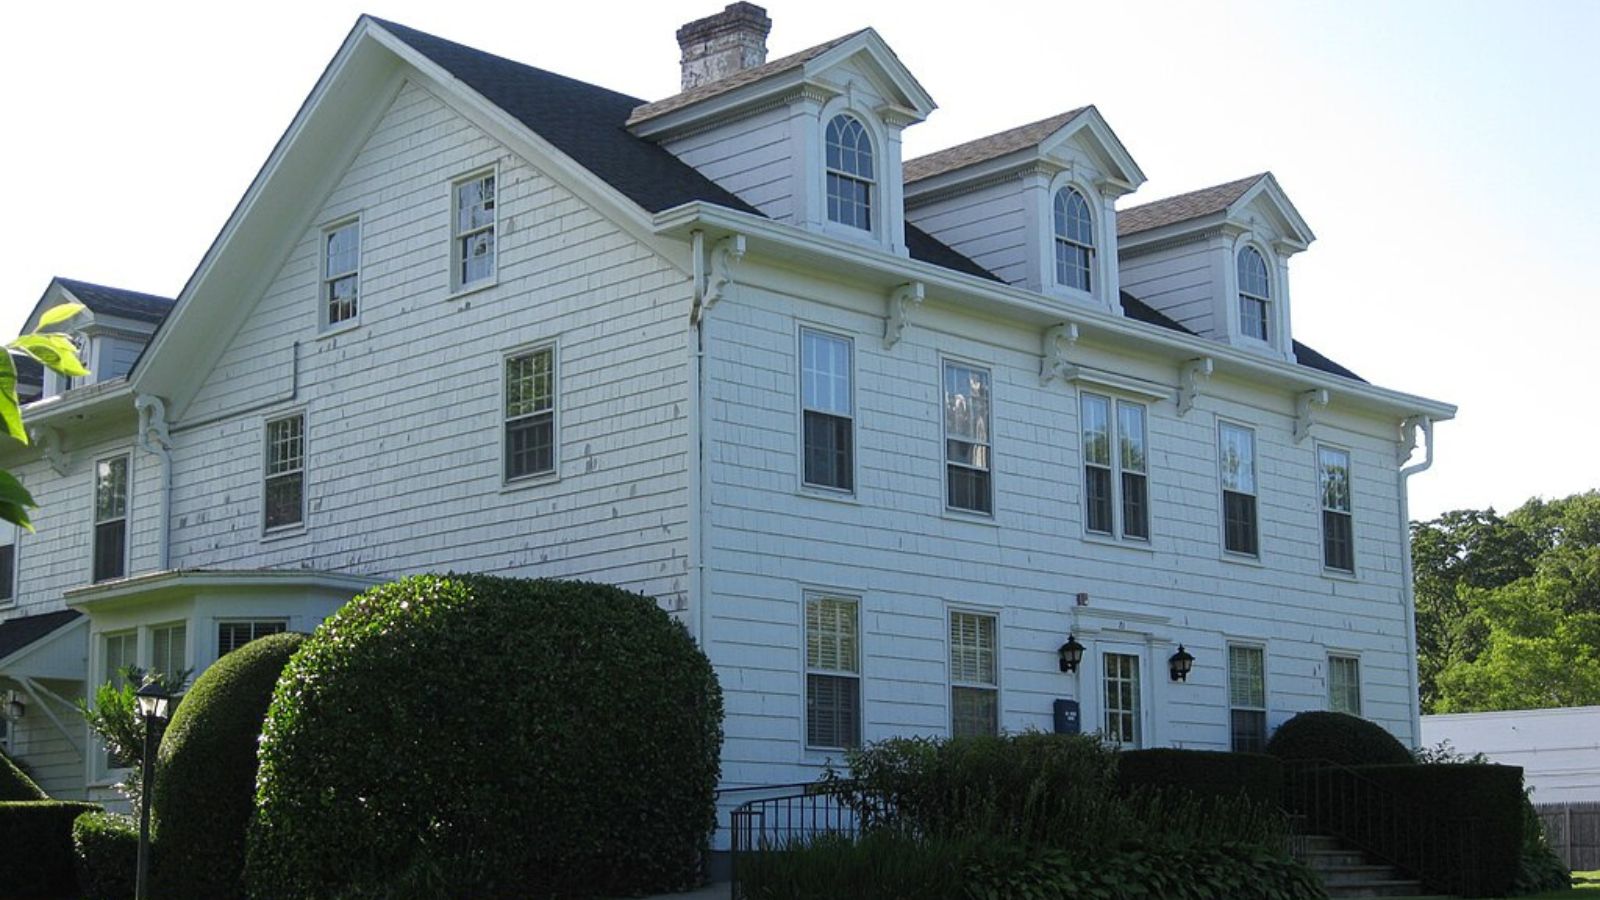
Southampton has long been associated with old-money affluence and manicured estates. It’s one of the oldest English settlements in the state and today serves as a hub for summer mansions, country clubs, and beachfront retreats.
The town benefits from both name recognition and consistent high-end demand, which helps sustain and grow prices. Even with limited historical data, Southampton’s 2025 valuation places it among the most expensive towns in New York without question.
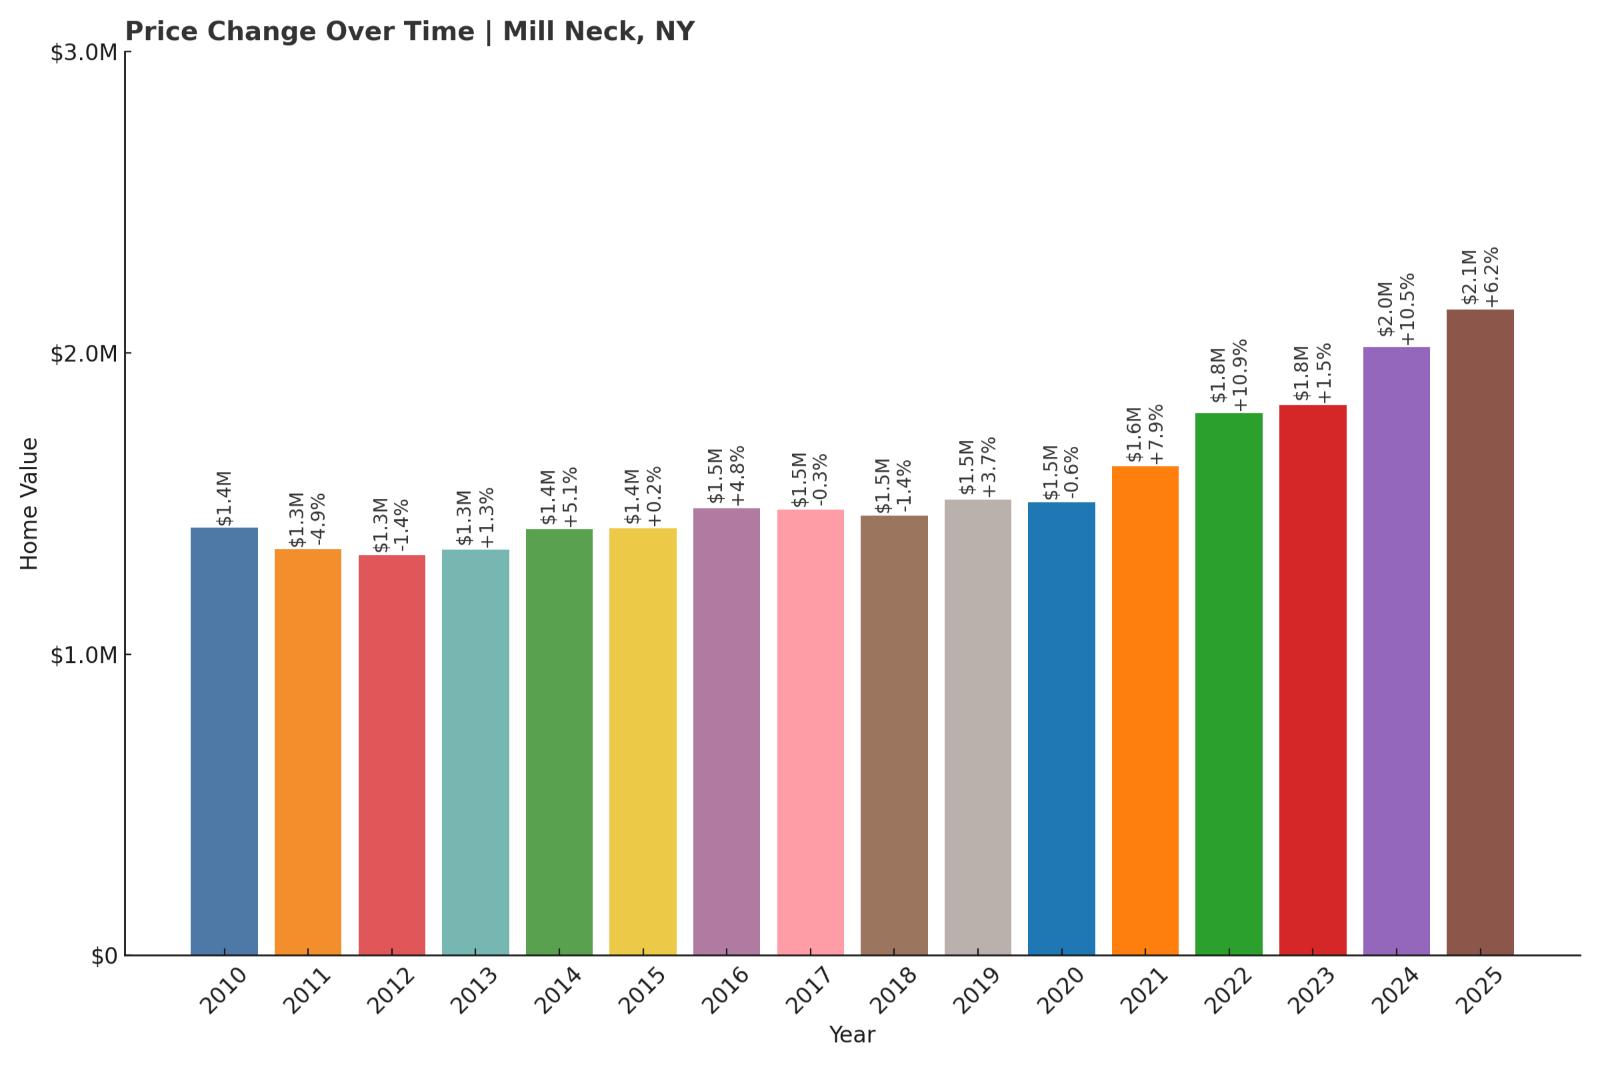
13. Mill Neck – 51% Home Price Increase Since 2010
Would you like to save this?
- 2010: $1,418,613
- 2011: $1,348,507 (-$70,106, -4.94% from previous year)
- 2012: $1,328,983 (-$19,524, -1.45% from previous year)
- 2013: $1,345,884 (+$16,901, +1.27% from previous year)
- 2014: $1,413,969 (+$68,085, +5.06% from previous year)
- 2015: $1,416,303 (+$2,334, +0.17% from previous year)
- 2016: $1,484,604 (+$68,301, +4.82% from previous year)
- 2017: $1,480,081 (-$4,523, -0.30% from previous year)
- 2018: $1,459,874 (-$20,207, -1.37% from previous year)
- 2019: $1,513,188 (+$53,313, +3.65% from previous year)
- 2020: $1,503,894 (-$9,294, -0.61% from previous year)
- 2021: $1,622,489 (+$118,595, +7.89% from previous year)
- 2022: $1,799,347 (+$176,857, +10.90% from previous year)
- 2023: $1,826,235 (+$26,888, +1.49% from previous year)
- 2024: $2,018,819 (+$192,584, +10.55% from previous year)
- 2025: $2,143,226 (+$124,407, +6.16% from previous year)
Mill Neck’s home prices have risen by over $720K since 2010—an increase of 51%. After some mild fluctuations in the 2010s, growth took off in 2021 and has continued steadily ever since, with prices breaking $2.1 million in 2025.
Mill Neck – Gated Estates and Gold Coast History
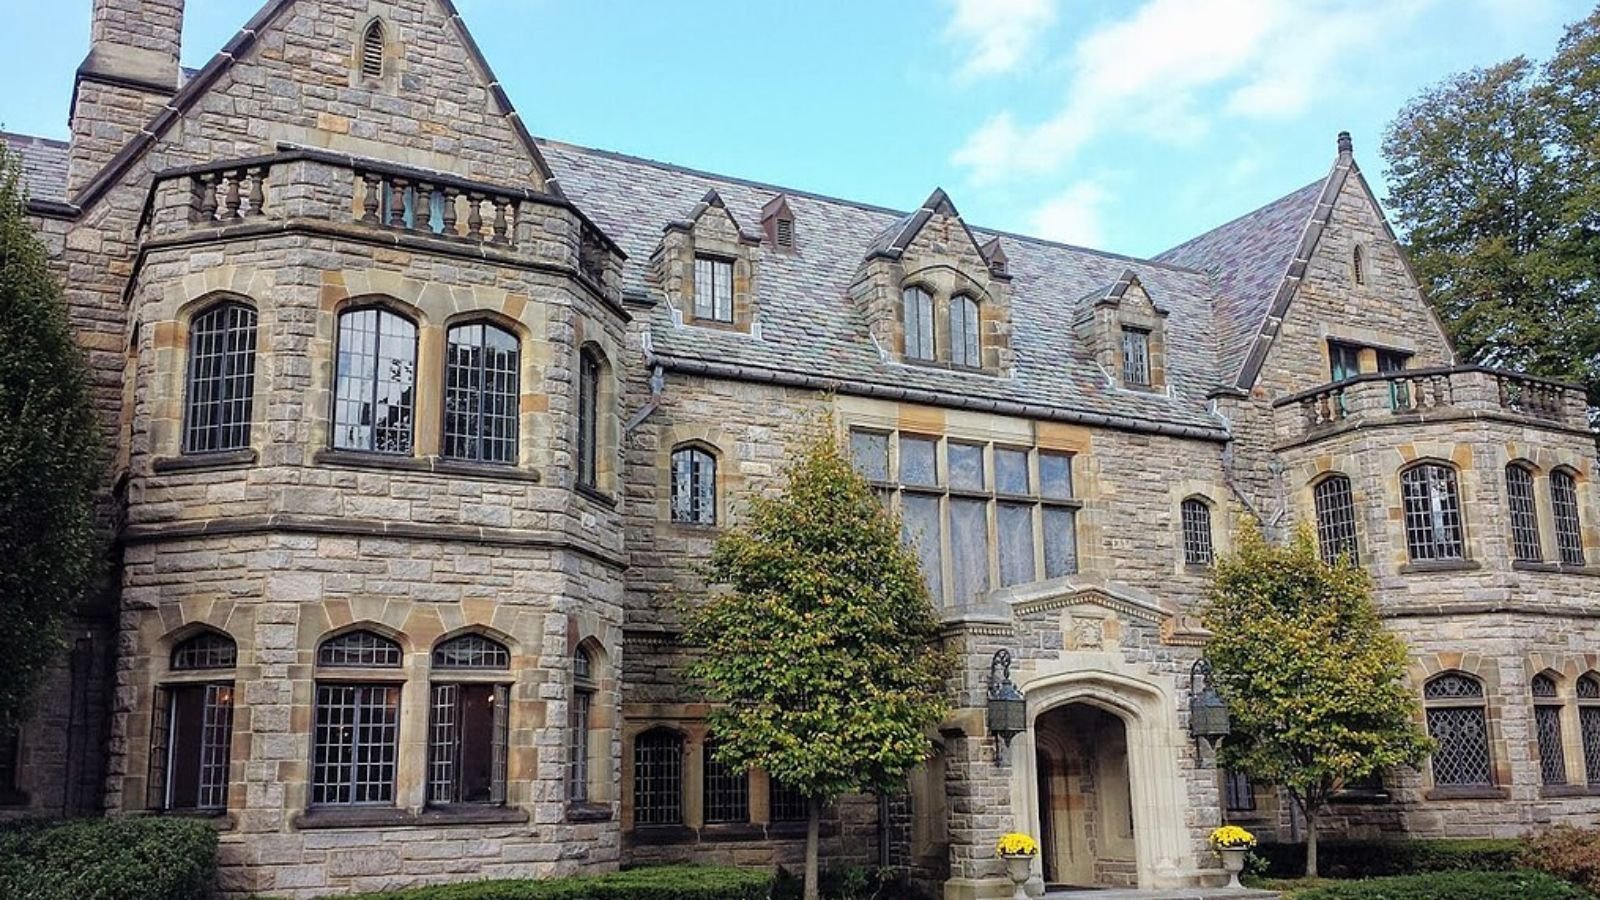
Mill Neck is a quiet, upscale village on the North Shore, part of Long Island’s famed Gold Coast. It’s known for gated compounds, historic mansions, and a rural-feeling layout that prioritizes privacy and seclusion.
With access to both waterfront and wooded estate-style properties, Mill Neck remains a magnet for ultra-high-net-worth buyers. The area’s zoning and limited development contribute to scarcity, helping to explain the sharp uptick in value over the past several years.
12. Sag Harbor – 117% Home Price Increase Since 2010
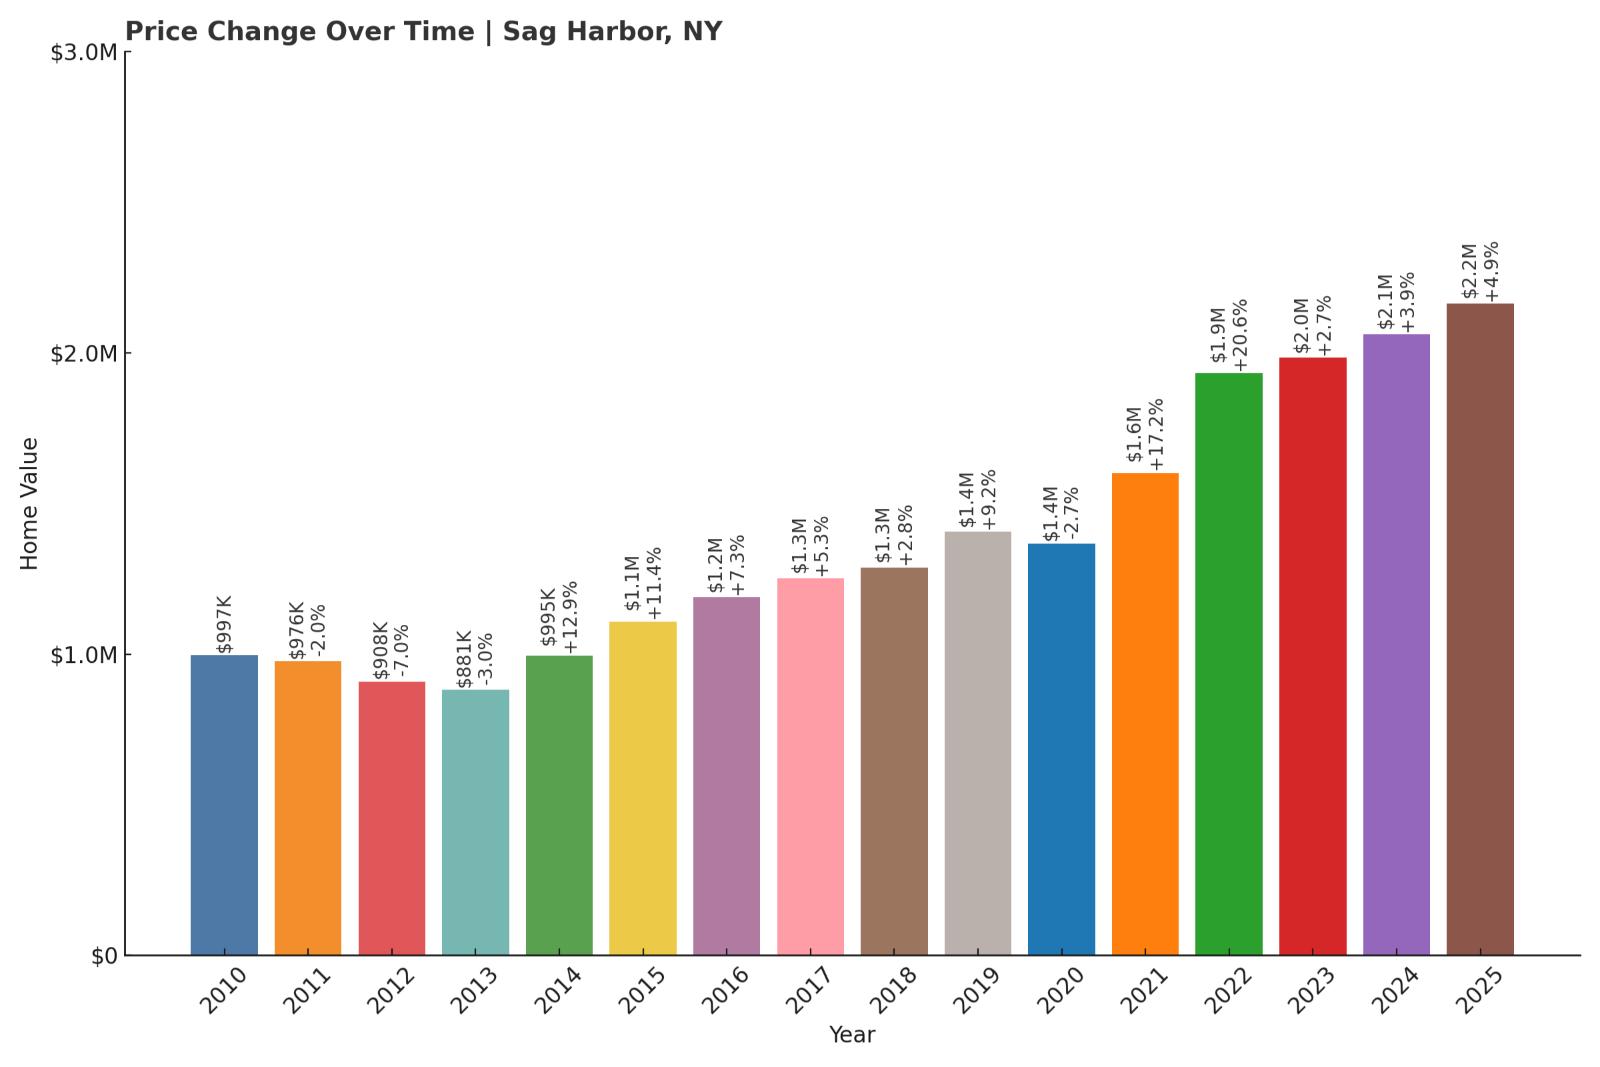
- 2010: $996,672
- 2011: $976,358 (-$20,314, -2.04% from previous year)
- 2012: $908,454 (-$67,903, -6.95% from previous year)
- 2013: $881,408 (-$27,046, -2.98% from previous year)
- 2014: $994,937 (+$113,529, +12.88% from previous year)
- 2015: $1,107,916 (+$112,979, +11.36% from previous year)
- 2016: $1,188,619 (+$80,703, +7.28% from previous year)
- 2017: $1,251,161 (+$62,543, +5.26% from previous year)
- 2018: $1,286,594 (+$35,432, +2.83% from previous year)
- 2019: $1,405,425 (+$118,831, +9.24% from previous year)
- 2020: $1,367,269 (-$38,156, -2.71% from previous year)
- 2021: $1,601,925 (+$234,656, +17.16% from previous year)
- 2022: $1,931,705 (+$329,780, +20.59% from previous year)
- 2023: $1,983,551 (+$51,847, +2.68% from previous year)
- 2024: $2,061,002 (+$77,450, +3.90% from previous year)
- 2025: $2,162,626 (+$101,625, +4.93% from previous year)
Sag Harbor’s home prices have more than doubled since 2010, climbing from just under $1 million to over $2.16 million in 2025. Gains were particularly strong between 2020 and 2022, with the market stabilizing somewhat in recent years while still trending upward.
Sag Harbor – Maritime Charm with Soaring Values
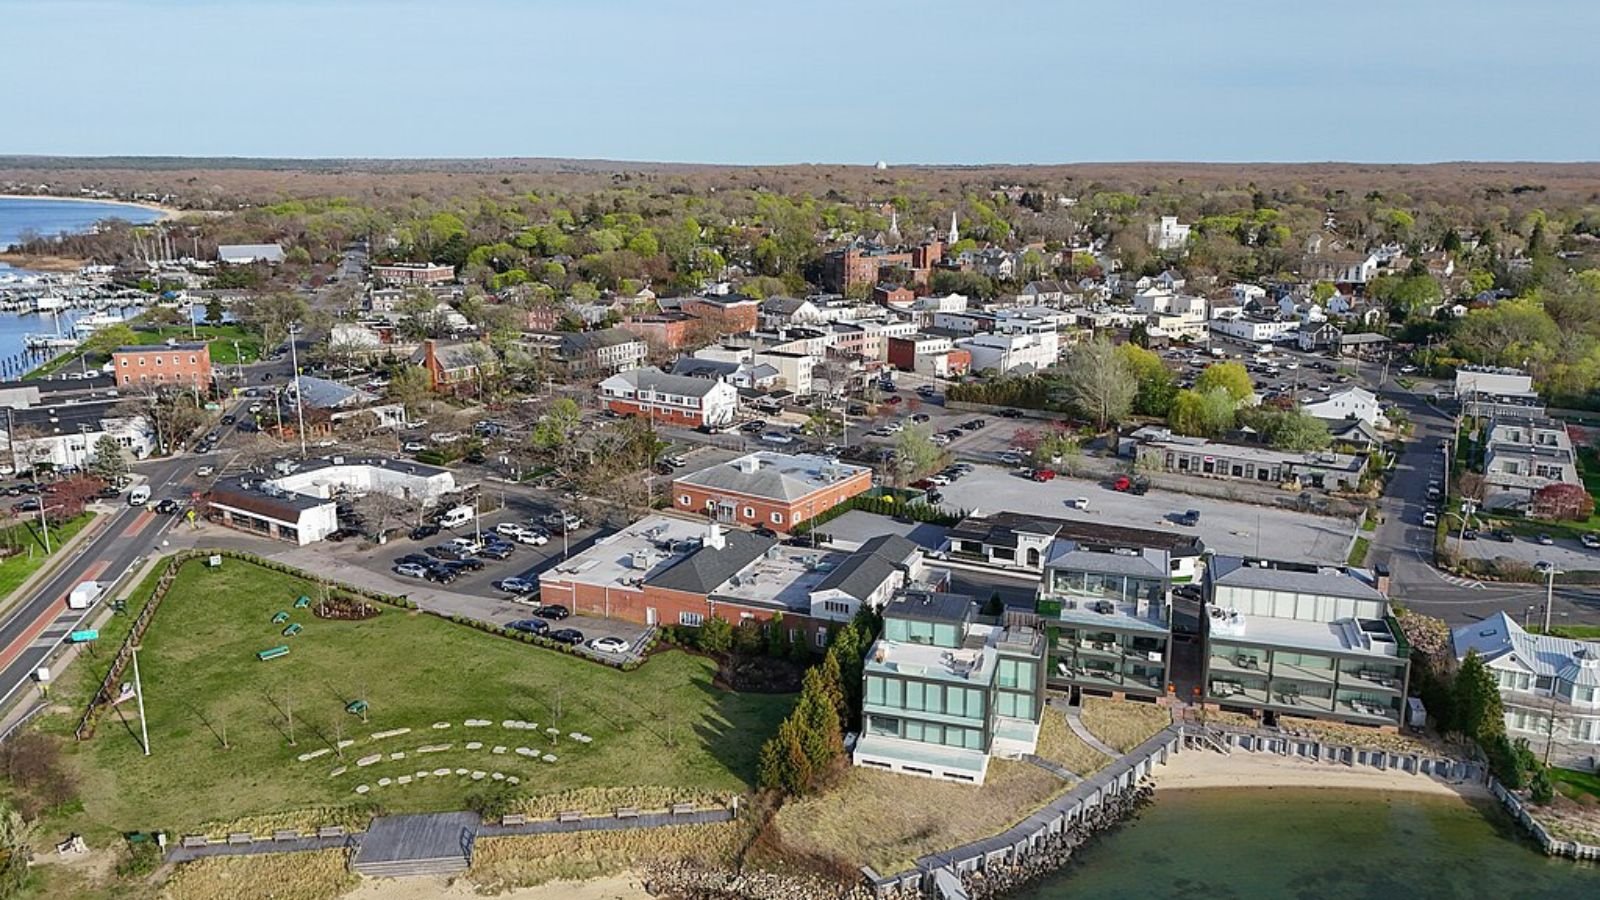
Sag Harbor straddles both Southampton and East Hampton, offering a rich maritime heritage, a walkable downtown, and a strong sense of community. Its mix of preserved 19th-century architecture and luxury amenities makes it one of the most unique and sought-after villages on the East End.
The town’s waterfront appeal and vibrant cultural scene, along with tighter housing inventory, helped drive its massive price increases. While it may not have the beachfront estates of some neighboring towns, its historic charm continues to command top-tier pricing.
11. Muttontown – 45% Home Price Increase Since 2010
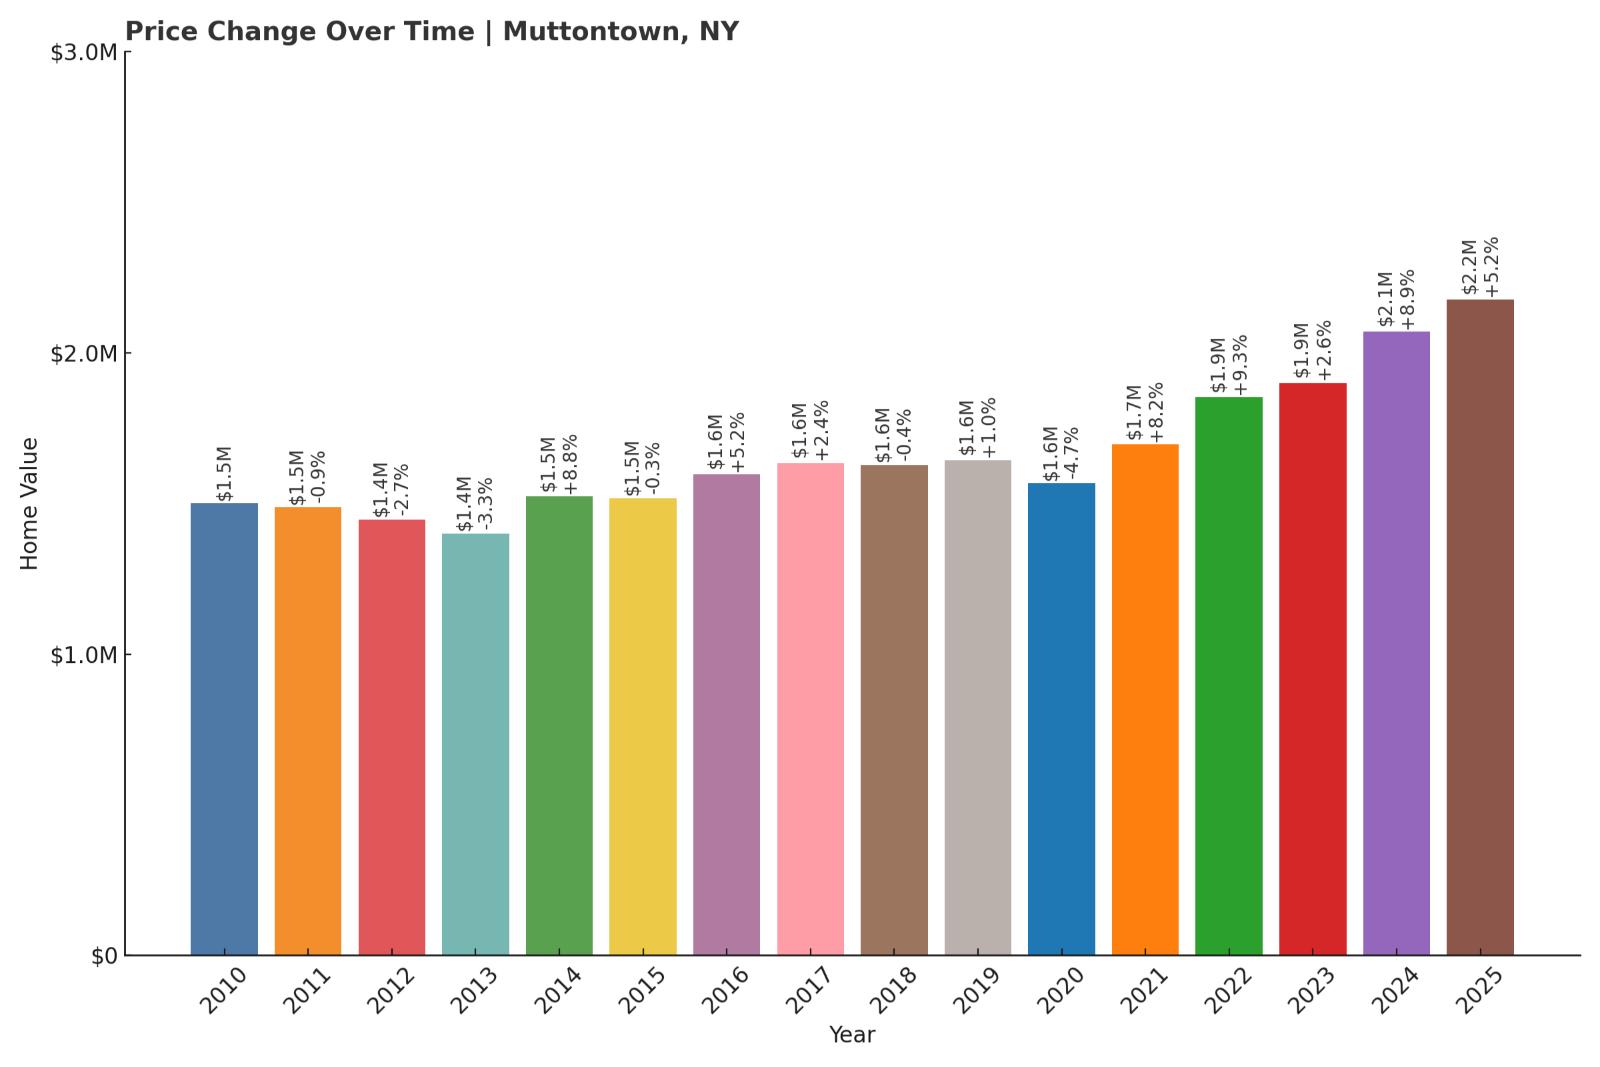
- 2010: $1,501,069
- 2011: $1,487,535 (-$13,534, -0.90% from previous year)
- 2012: $1,446,646 (-$40,889, -2.75% from previous year)
- 2013: $1,399,599 (-$47,048, -3.25% from previous year)
- 2014: $1,522,564 (+$122,965, +8.79% from previous year)
- 2015: $1,517,659 (-$4,905, -0.32% from previous year)
- 2016: $1,596,340 (+$78,681, +5.18% from previous year)
- 2017: $1,634,462 (+$38,123, +2.39% from previous year)
- 2018: $1,627,398 (-$7,064, -0.43% from previous year)
- 2019: $1,643,150 (+$15,752, +0.97% from previous year)
- 2020: $1,566,683 (-$76,467, -4.65% from previous year)
- 2021: $1,695,363 (+$128,680, +8.21% from previous year)
- 2022: $1,852,209 (+$156,847, +9.25% from previous year)
- 2023: $1,900,540 (+$48,330, +2.61% from previous year)
- 2024: $2,069,623 (+$169,084, +8.90% from previous year)
- 2025: $2,176,769 (+$107,146, +5.18% from previous year)
Home prices in Muttontown rose by about $675K over the 15-year period, for an overall increase of 45%. After a slow start and mid-decade declines, prices surged after 2020, with values now exceeding $2.1 million.
Muttontown – Elegant Estates in a Gated Village
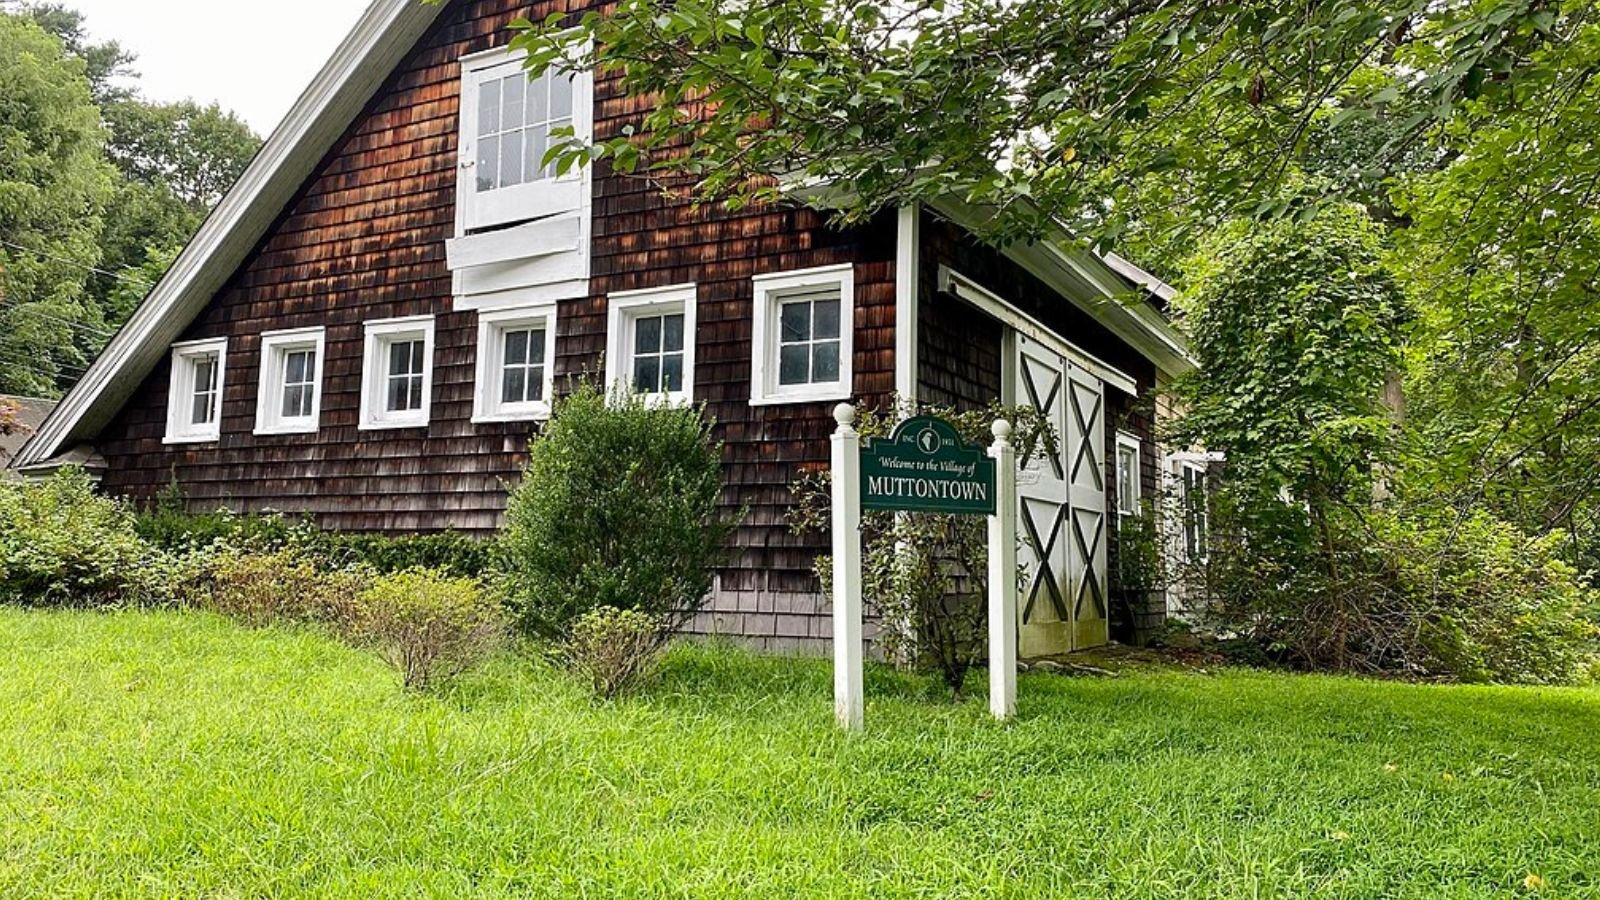
Set within the Town of Oyster Bay, Muttontown is known for its gated compounds, equestrian properties, and historic mansions. It’s part of Long Island’s “Gold Coast,” a stretch once dominated by the Gilded Age’s wealthiest families—and the opulence has endured.
Buyers are drawn to its spacious lots, privacy, and proximity to the Northern State Parkway and LIRR. As demand for luxury homes outside of city centers has climbed, Muttontown has become an increasingly prominent choice for high-net-worth households.
10. Oyster Bay Cove – 52% Home Price Increase Since 2010
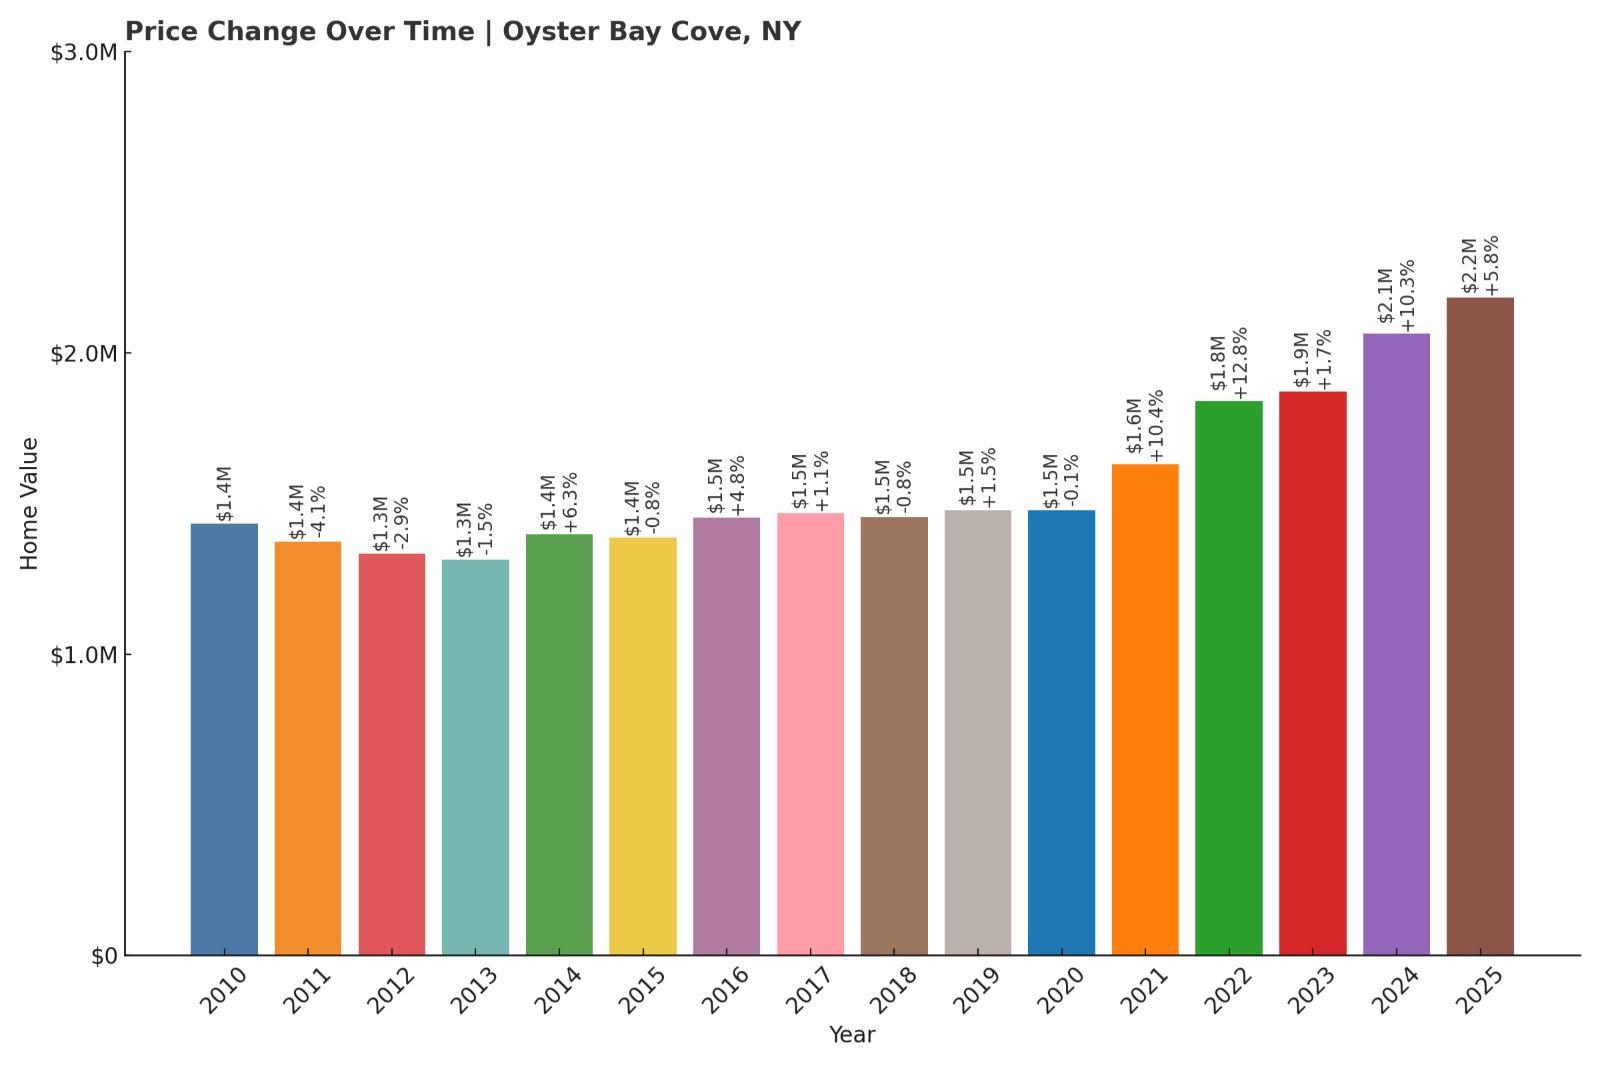
- 2010: $1,432,633
- 2011: $1,373,371 (-$59,261, -4.14% from previous year)
- 2012: $1,334,163 (-$39,208, -2.85% from previous year)
- 2013: $1,313,881 (-$20,282, -1.52% from previous year)
- 2014: $1,396,825 (+$82,944, +6.31% from previous year)
- 2015: $1,385,358 (-$11,467, -0.82% from previous year)
- 2016: $1,451,825 (+$66,467, +4.80% from previous year)
- 2017: $1,467,448 (+$15,623, +1.08% from previous year)
- 2018: $1,455,623 (-$11,825, -0.81% from previous year)
- 2019: $1,476,990 (+$21,367, +1.47% from previous year)
- 2020: $1,476,122 (-$868, -0.06% from previous year)
- 2021: $1,629,935 (+$153,814, +10.42% from previous year)
- 2022: $1,838,694 (+$208,759, +12.81% from previous year)
- 2023: $1,870,260 (+$31,565, +1.72% from previous year)
- 2024: $2,063,011 (+$192,751, +10.31% from previous year)
- 2025: $2,182,216 (+$119,206, +5.78% from previous year)
Oyster Bay Cove has seen home values rise by over $750K since 2010—a 52% increase. While early years showed modest ups and downs, the market accelerated sharply from 2021 onward, crossing the $2 million threshold in 2024 and climbing higher in 2025.
Oyster Bay Cove – Tranquil Wealth on the North Shore
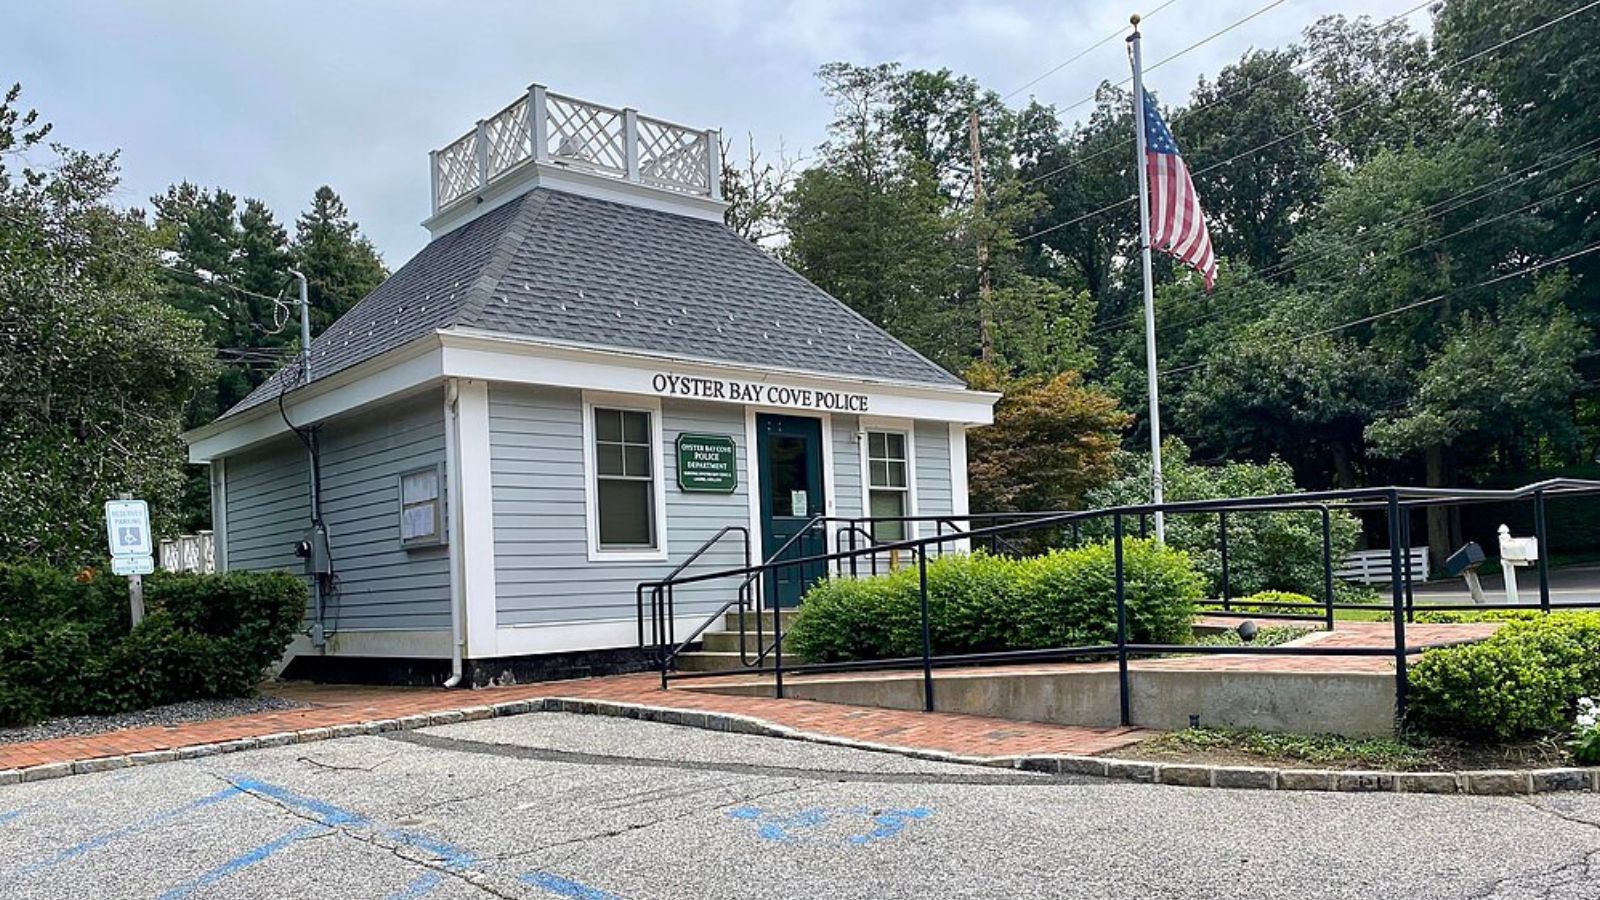
Known for its quiet roads and generous lot sizes, Oyster Bay Cove is a semi-rural enclave on Long Island’s North Shore. With protected woodlands, waterfront homes, and historic architecture, the village offers privacy and prestige just a short drive from Manhattan.
Buyers here include legacy families, executives, and remote workers looking for estate-style properties with space to grow. The area’s highly rated schools and zoning restrictions have helped maintain its exclusivity—and its steadily climbing prices.
9. Upper Brookville – 59.5% Home Price Increase Since 2010
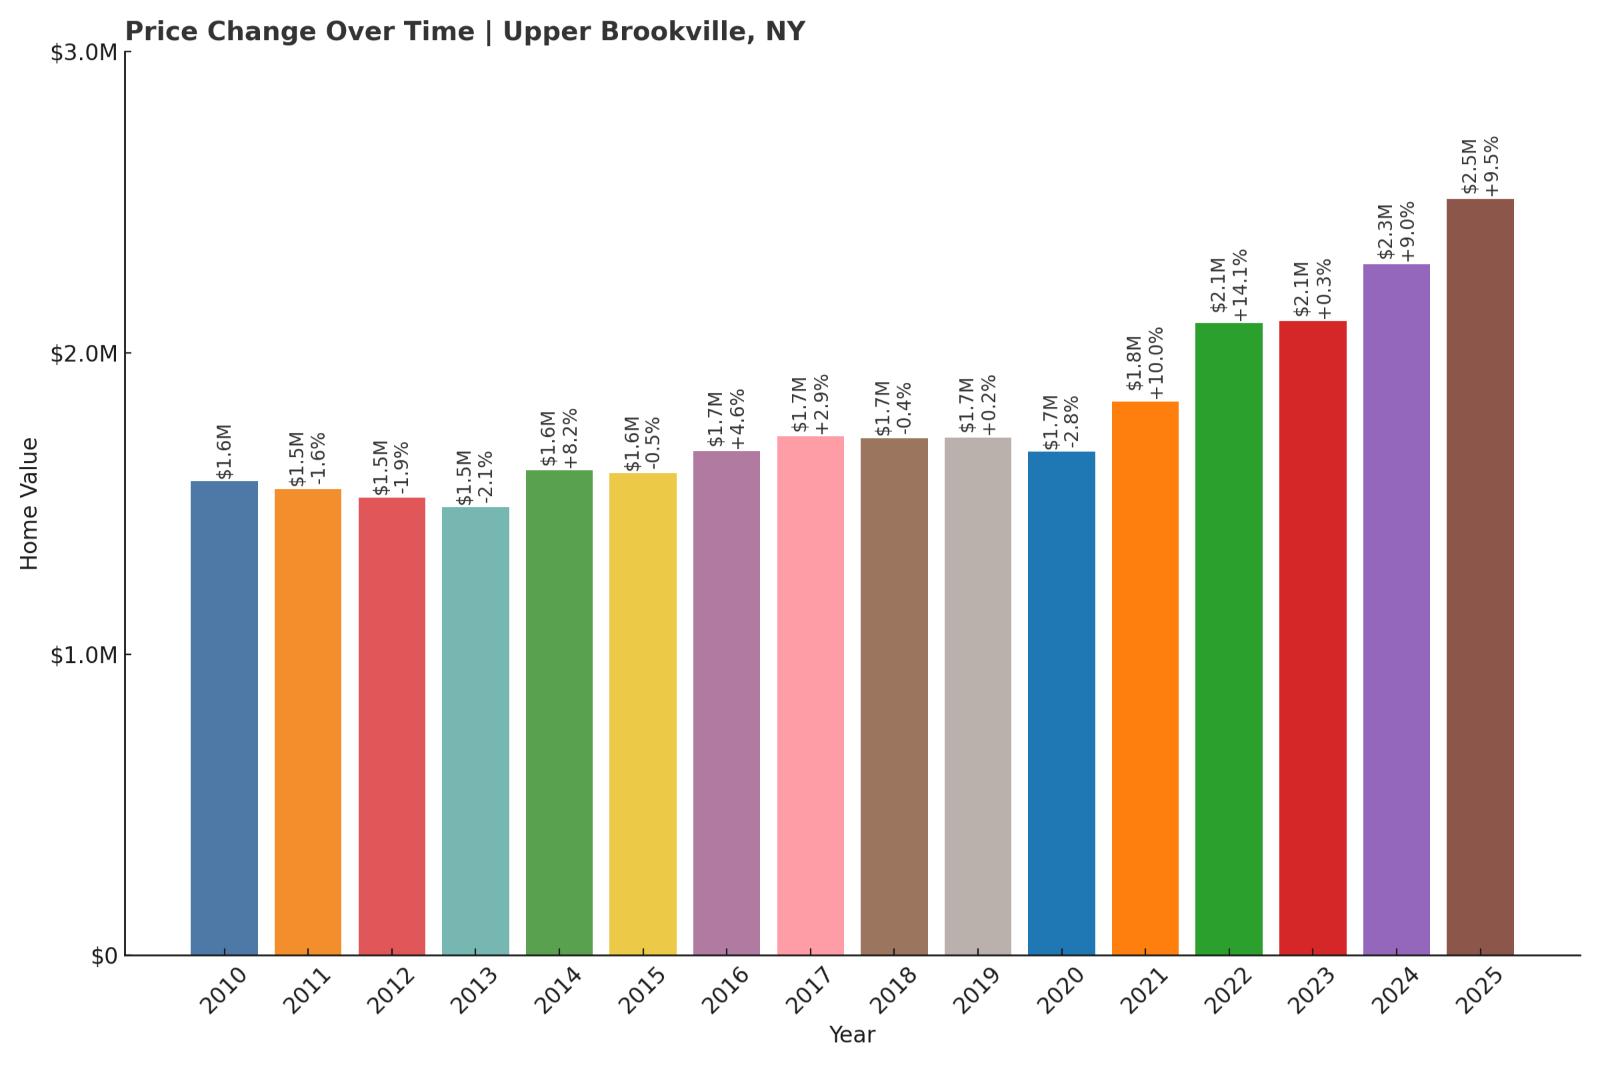
- 2010: $1,574,058
- 2011: $1,548,627 (-$25,431, -1.62% from previous year)
- 2012: $1,518,989 (-$29,638, -1.91% from previous year)
- 2013: $1,486,902 (-$32,087, -2.11% from previous year)
- 2014: $1,608,903 (+$122,001, +8.21% from previous year)
- 2015: $1,600,154 (-$8,749, -0.54% from previous year)
- 2016: $1,673,535 (+$73,381, +4.59% from previous year)
- 2017: $1,722,009 (+$48,474, +2.90% from previous year)
- 2018: $1,715,951 (-$6,058, -0.35% from previous year)
- 2019: $1,718,636 (+$2,685, +0.16% from previous year)
- 2020: $1,670,679 (-$47,956, -2.79% from previous year)
- 2021: $1,838,502 (+$167,822, +10.05% from previous year)
- 2022: $2,097,813 (+$259,311, +14.10% from previous year)
- 2023: $2,104,699 (+$6,886, +0.33% from previous year)
- 2024: $2,293,574 (+$188,875, +8.97% from previous year)
- 2025: $2,510,373 (+$216,799, +9.45% from previous year)
Upper Brookville has gained nearly $940K in home value since 2010, with much of that growth occurring between 2021 and 2025. The current median value exceeds $2.5 million, marking a 59.5% rise over 15 years.
Upper Brookville – Gilded Age Glamour in a Private Setting
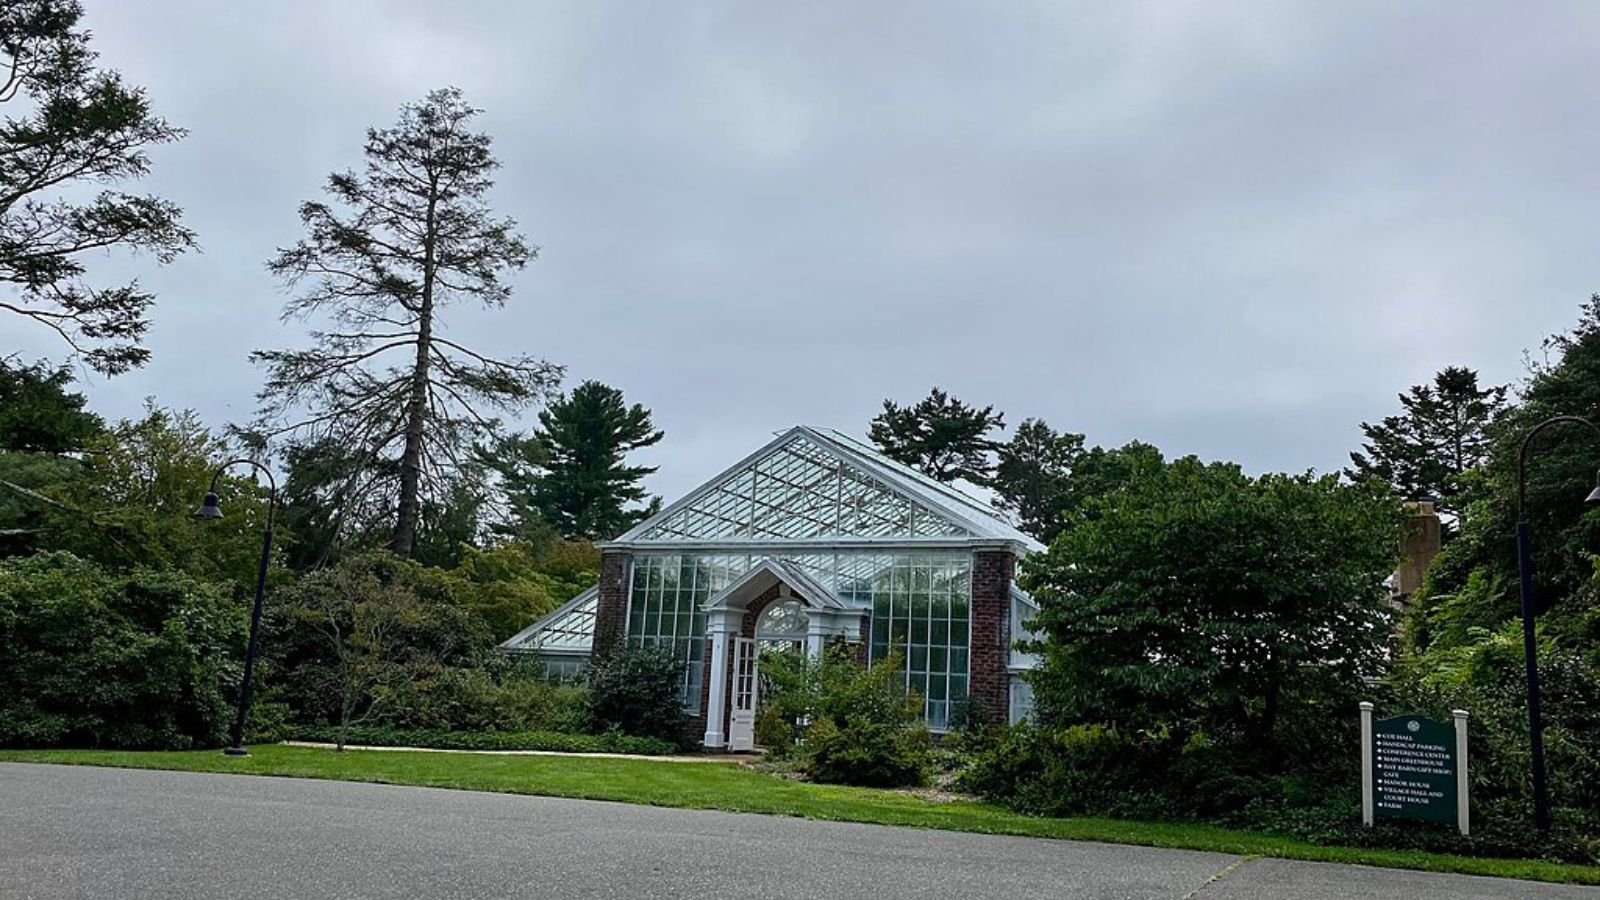
Would you like to save this?
With its long driveways, gated entrances, and massive properties, Upper Brookville feels like a secluded retreat. The village is part of Long Island’s storied Gold Coast, and many of its homes reflect the area’s historic affluence with modern renovations and luxury upgrades.
Upper Brookville has grown in popularity as remote work reshaped buyer priorities, driving interest in large, high-end homes outside of city centers. Its limited supply and exclusivity continue to fuel steady price gains.
8. Old Westbury – 58.6% Home Price Increase Since 2010
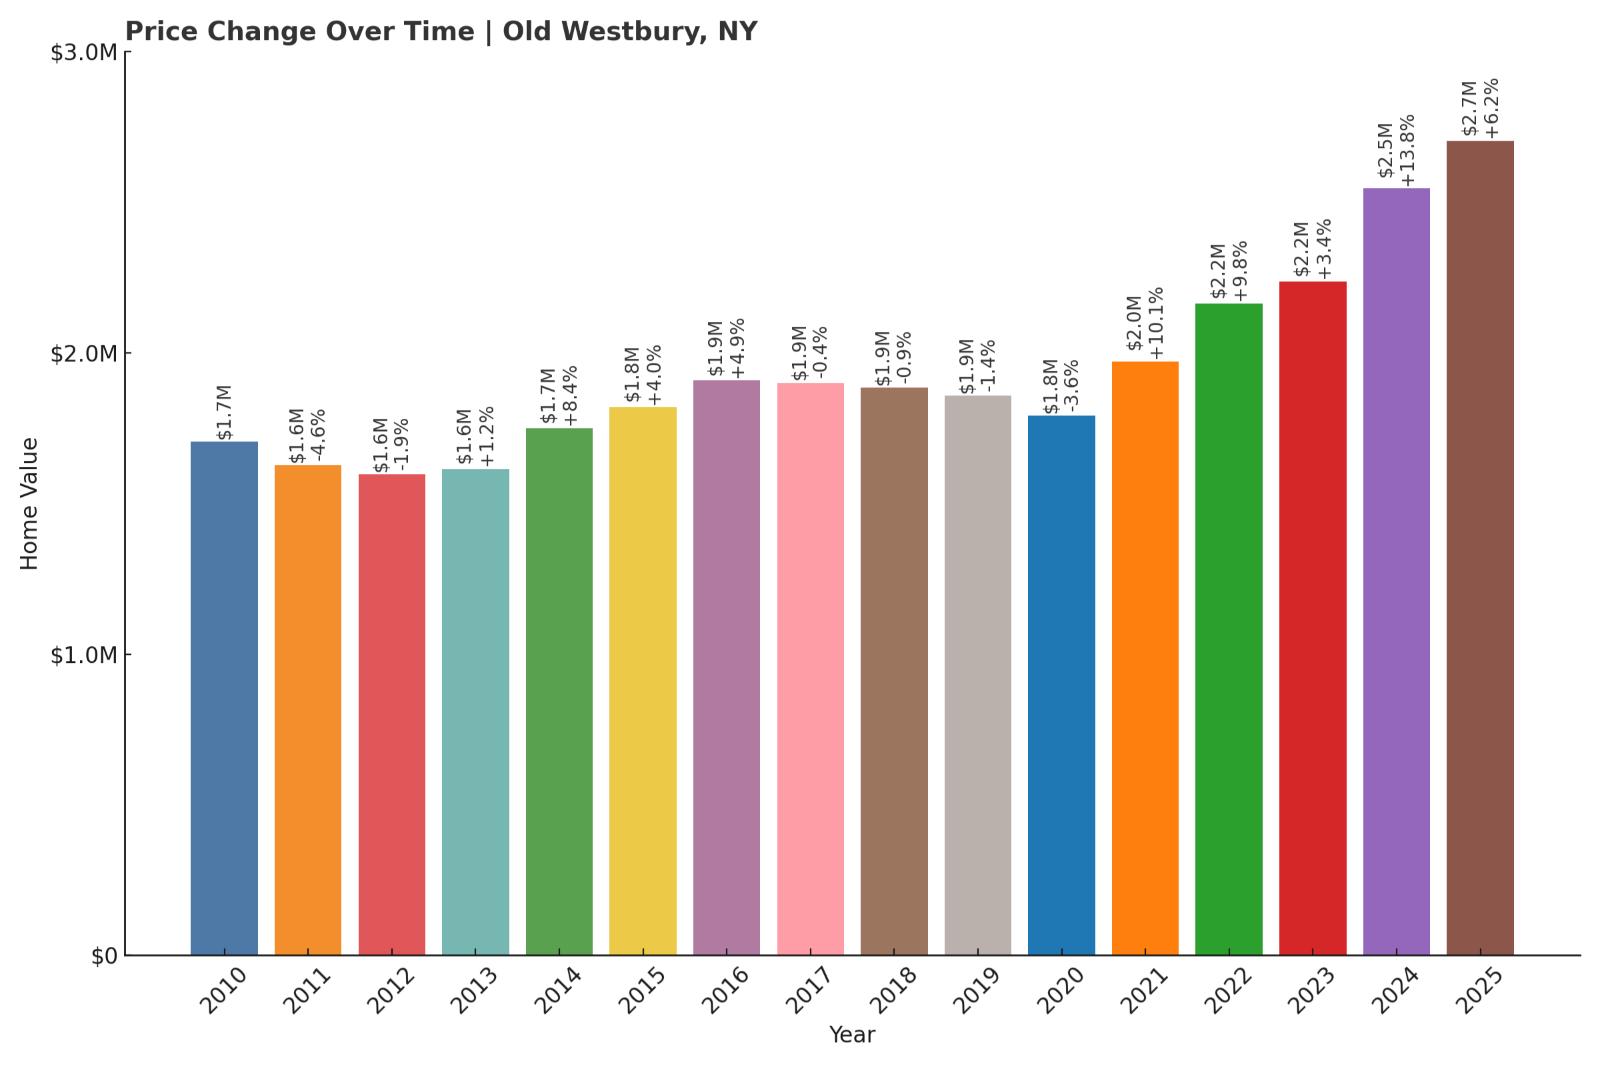
- 2010: $1,704,391
- 2011: $1,626,275 (-$78,116, -4.58% from previous year)
- 2012: $1,595,682 (-$30,593, -1.88% from previous year)
- 2013: $1,614,149 (+$18,467, +1.16% from previous year)
- 2014: $1,749,920 (+$135,771, +8.41% from previous year)
- 2015: $1,819,749 (+$69,829, +3.99% from previous year)
- 2016: $1,908,019 (+$88,270, +4.85% from previous year)
- 2017: $1,900,362 (-$7,657, -0.40% from previous year)
- 2018: $1,883,030 (-$17,331, -0.91% from previous year)
- 2019: $1,856,983 (-$26,048, -1.38% from previous year)
- 2020: $1,790,524 (-$66,459, -3.58% from previous year)
- 2021: $1,970,635 (+$180,111, +10.06% from previous year)
- 2022: $2,163,335 (+$192,701, +9.78% from previous year)
- 2023: $2,236,086 (+$72,751, +3.36% from previous year)
- 2024: $2,544,842 (+$308,756, +13.81% from previous year)
- 2025: $2,703,277 (+$158,434, +6.23% from previous year)
Home prices in Old Westbury have risen from $1.7 million in 2010 to over $2.7 million in 2025—a nearly 59% increase. While the market softened during the late 2010s, it bounced back with sharp gains over the past three years.
Old Westbury – Stately and Serene in the Heart of Nassau
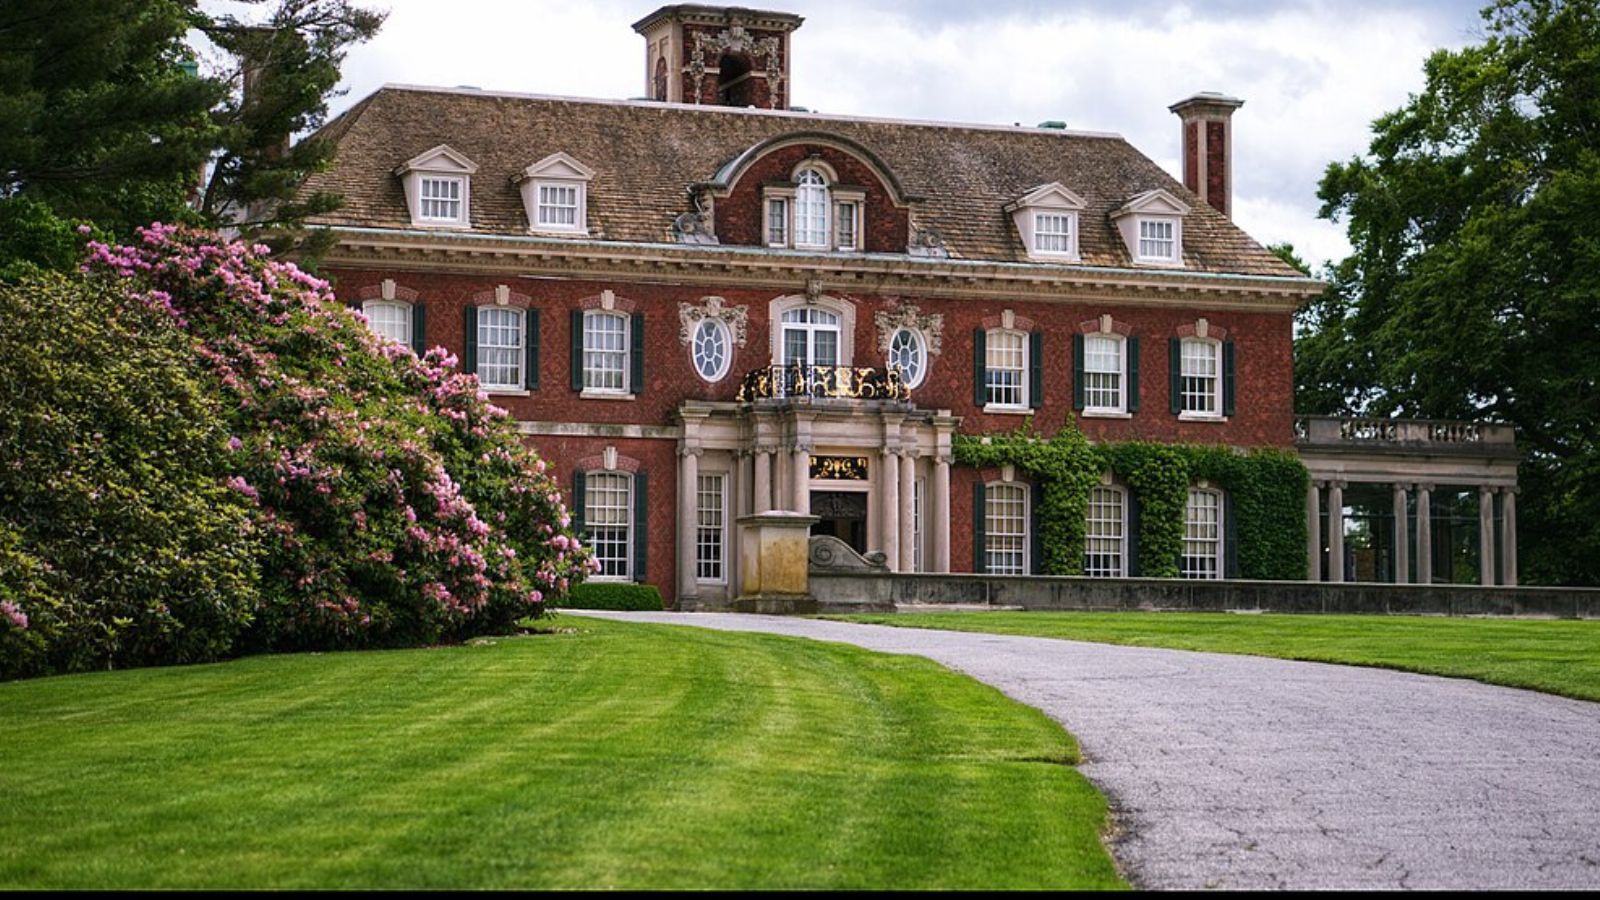
Old Westbury offers an estate lifestyle defined by privacy, prestige, and expansive grounds. The village is home to some of the largest residential parcels on Long Island and is known for its country club culture and grand homes tucked behind long drives.
Easy access to major highways and elite private schools adds to its appeal. As demand for spacious luxury properties has grown, Old Westbury has reasserted its place as one of the premier high-end markets in the state.
7. Quogue – 76.6% Home Price Increase Since 2010
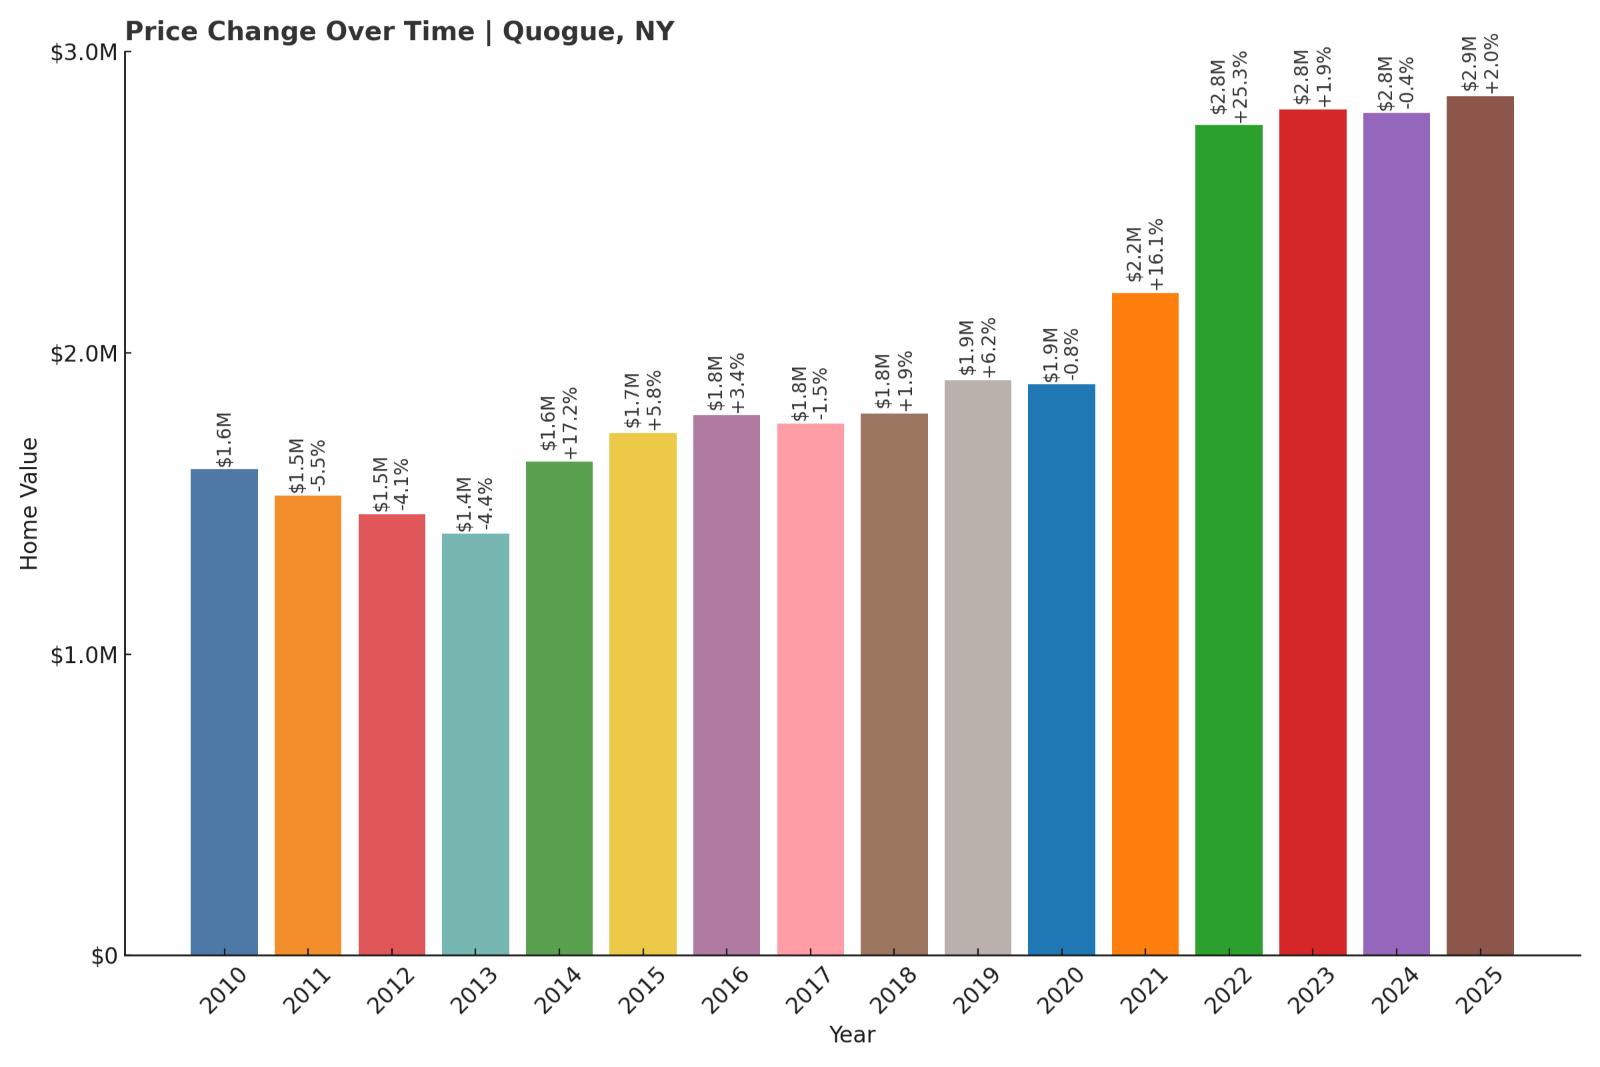
- 2010: $1,613,973
- 2011: $1,525,769 (-$88,204, -5.47% from previous year)
- 2012: $1,463,763 (-$62,006, -4.06% from previous year)
- 2013: $1,399,088 (-$64,675, -4.42% from previous year)
- 2014: $1,639,388 (+$240,300, +17.18% from previous year)
- 2015: $1,734,005 (+$94,618, +5.77% from previous year)
- 2016: $1,792,251 (+$58,246, +3.36% from previous year)
- 2017: $1,764,788 (-$27,463, -1.53% from previous year)
- 2018: $1,797,997 (+$33,209, +1.88% from previous year)
- 2019: $1,909,229 (+$111,232, +6.19% from previous year)
- 2020: $1,894,146 (-$15,083, -0.79% from previous year)
- 2021: $2,198,981 (+$304,835, +16.09% from previous year)
- 2022: $2,755,615 (+$556,634, +25.31% from previous year)
- 2023: $2,807,566 (+$51,950, +1.89% from previous year)
- 2024: $2,795,447 (-$12,119, -0.43% from previous year)
- 2025: $2,851,740 (+$56,293, +2.01% from previous year)
Quogue’s home prices are up 76.6% since 2010, climbing from about $1.6 million to nearly $2.85 million in 2025. After a huge spike from 2020 to 2022, the market has mostly held steady with modest annual growth.
Quogue – Refined and Understated in the Hamptons

Often described as quieter and more private than other Hamptons villages, Quogue has long appealed to second-home buyers seeking calm and class. The area’s beach access, large homes, and strong local preservation rules contribute to its enduring value.
In recent years, Quogue has seen increased demand from luxury buyers turned off by crowds elsewhere. With limited supply and continued buyer interest, it remains one of the most desirable—and most expensive—places in eastern Long Island.
6. Amagansett – 142% Home Price Increase Since 2010
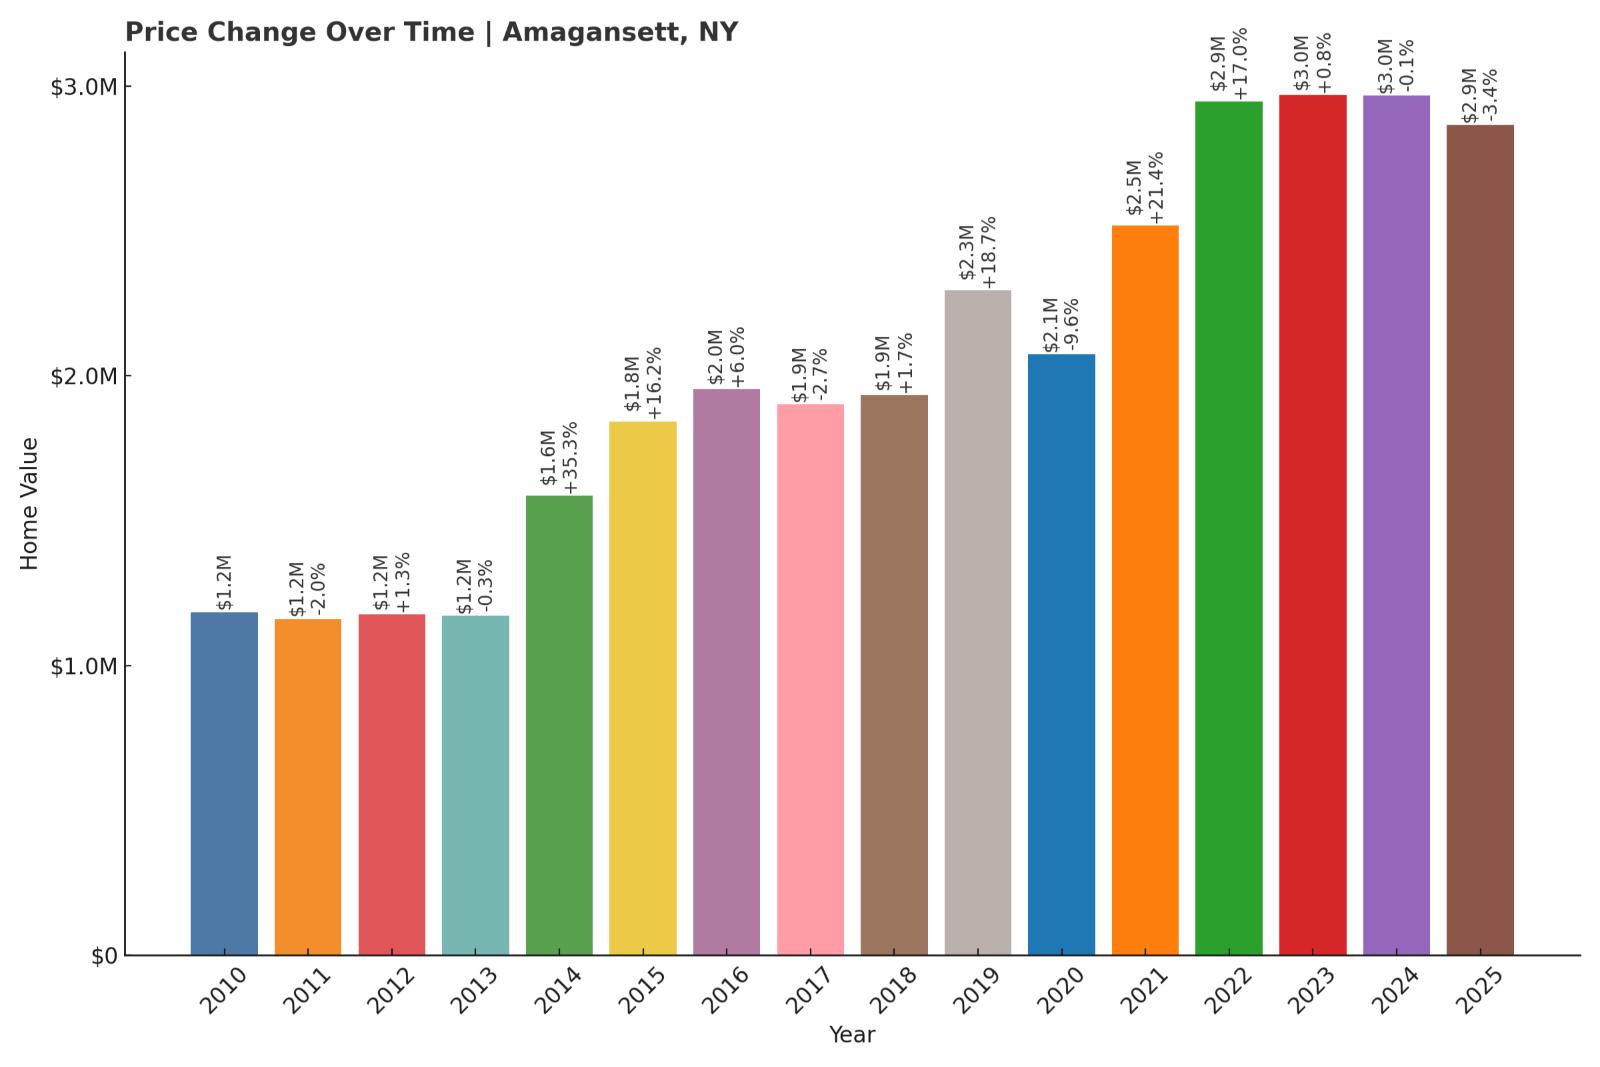
- 2010: $1,185,021
- 2011: $1,161,502 (-$23,519, -1.98% from previous year)
- 2012: $1,176,456 (+$14,954, +1.29% from previous year)
- 2013: $1,172,623 (-$3,832, -0.33% from previous year)
- 2014: $1,586,335 (+$413,712, +35.28% from previous year)
- 2015: $1,842,845 (+$256,510, +16.17% from previous year)
- 2016: $1,953,989 (+$111,144, +6.03% from previous year)
- 2017: $1,901,235 (-$52,754, -2.70% from previous year)
- 2018: $1,934,180 (+$32,945, +1.73% from previous year)
- 2019: $2,295,799 (+$361,619, +18.70% from previous year)
- 2020: $2,074,301 (-$221,498, -9.65% from previous year)
- 2021: $2,517,771 (+$443,470, +21.38% from previous year)
- 2022: $2,946,447 (+$428,677, +17.03% from previous year)
- 2023: $2,969,352 (+$22,905, +0.78% from previous year)
- 2024: $2,967,069 (-$2,283, -0.08% from previous year)
- 2025: $2,866,390 (-$100,680, -3.39% from previous year)
Amagansett’s home values have surged by nearly $1.7 million since 2010—a 142% jump. The most dramatic spikes came between 2014 and 2022, when year after year of double-digit growth pushed the town deep into the multimillion-dollar tier. While the past two years have seen slight softening, the overall increase remains enormous.
Amagansett – High-End Hamptons with Historic Edge
Amagansett blends upscale coastal living with historical roots. It’s quieter than neighboring East Hampton and Montauk, yet just as desirable to high-end buyers looking for beach access, large properties, and low commercial density. The town’s iconic Main Street, old whaling homes, and scenic dunes add to its rare character.
Inventory is tight, and development is strictly limited. That scarcity, combined with sustained demand, explains the massive price escalation over the last decade. Though recent figures show a slight correction, Amagansett remains one of the most elite markets in the state—and the nation.
5. Sands Point – 58.2% Home Price Increase Since 2010
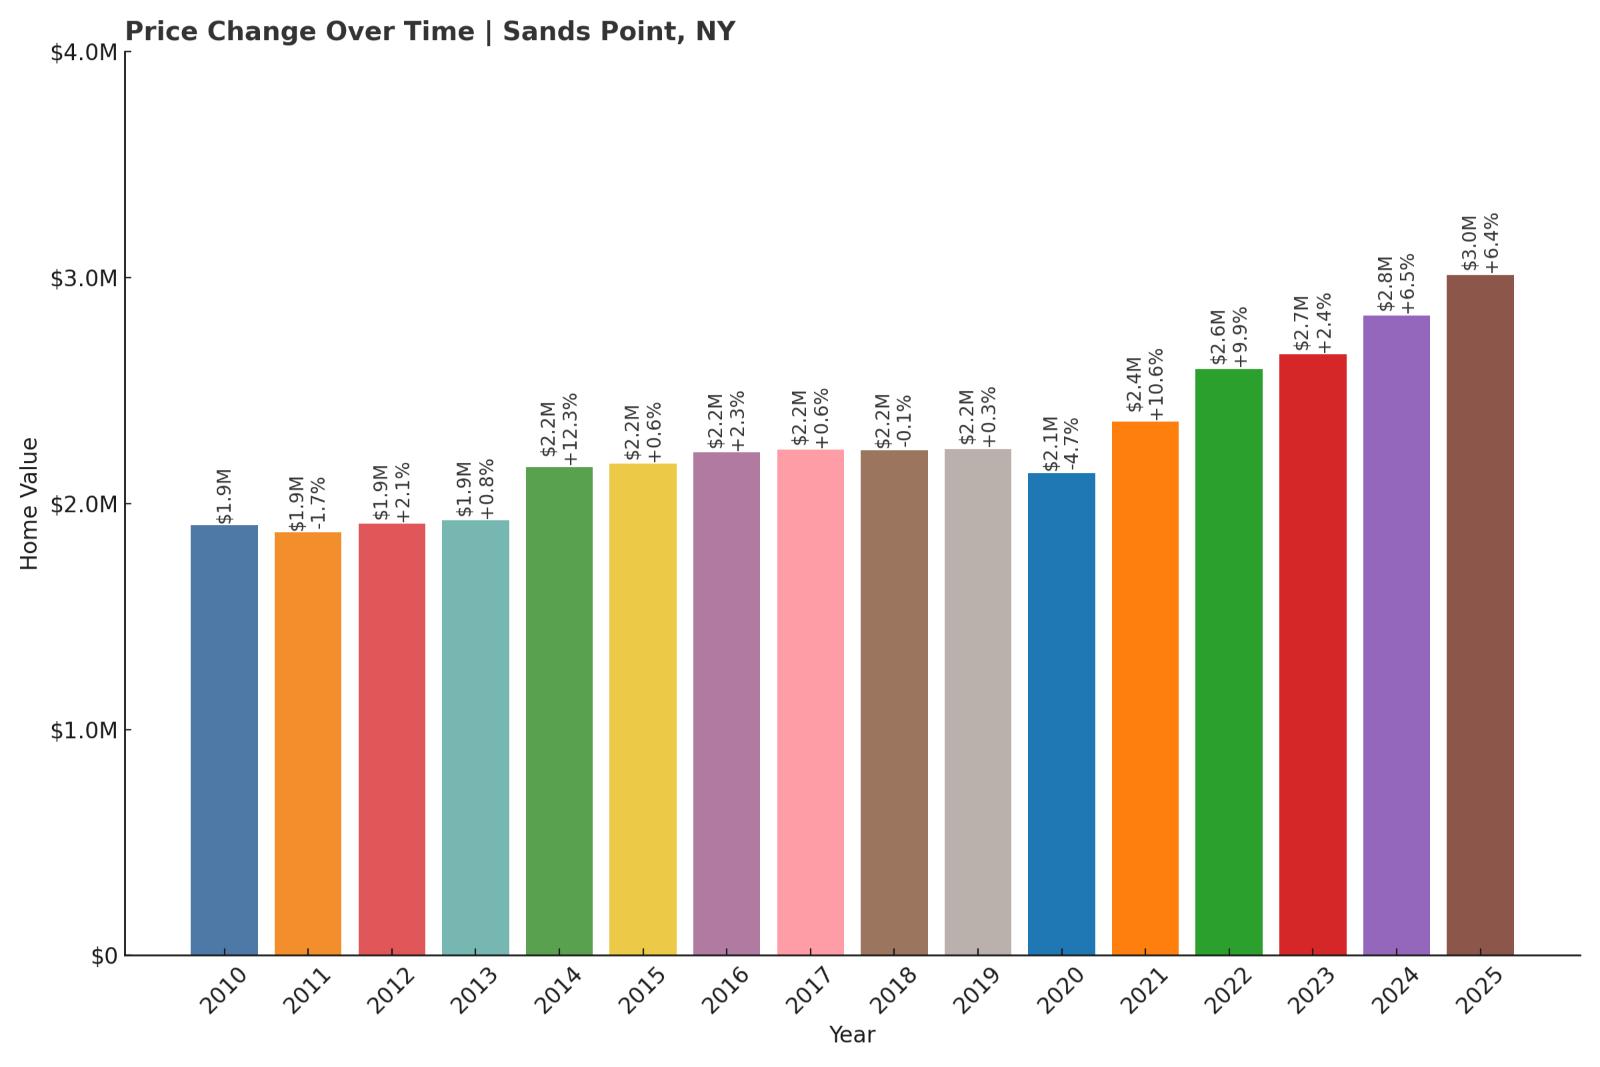
- 2010: $1,903,771
- 2011: $1,871,544 (-$32,226, -1.69% from previous year)
- 2012: $1,910,174 (+$38,629, +2.06% from previous year)
- 2013: $1,924,535 (+$14,362, +0.75% from previous year)
- 2014: $2,161,919 (+$237,384, +12.33% from previous year)
- 2015: $2,174,909 (+$12,989, +0.60% from previous year)
- 2016: $2,225,537 (+$50,628, +2.33% from previous year)
- 2017: $2,238,001 (+$12,464, +0.56% from previous year)
- 2018: $2,235,156 (-$2,845, -0.13% from previous year)
- 2019: $2,241,684 (+$6,528, +0.29% from previous year)
- 2020: $2,135,531 (-$106,153, -4.74% from previous year)
- 2021: $2,361,183 (+$225,652, +10.57% from previous year)
- 2022: $2,595,494 (+$234,310, +9.92% from previous year)
- 2023: $2,658,723 (+$63,230, +2.44% from previous year)
- 2024: $2,831,649 (+$172,925, +6.50% from previous year)
- 2025: $3,011,677 (+$180,028, +6.36% from previous year)
Sands Point has added over $1.1 million in value since 2010, a 58% rise. While the gains have come more gradually than in some East End markets, they’ve been remarkably consistent—especially after 2020, with three consecutive years of strong growth through 2025.
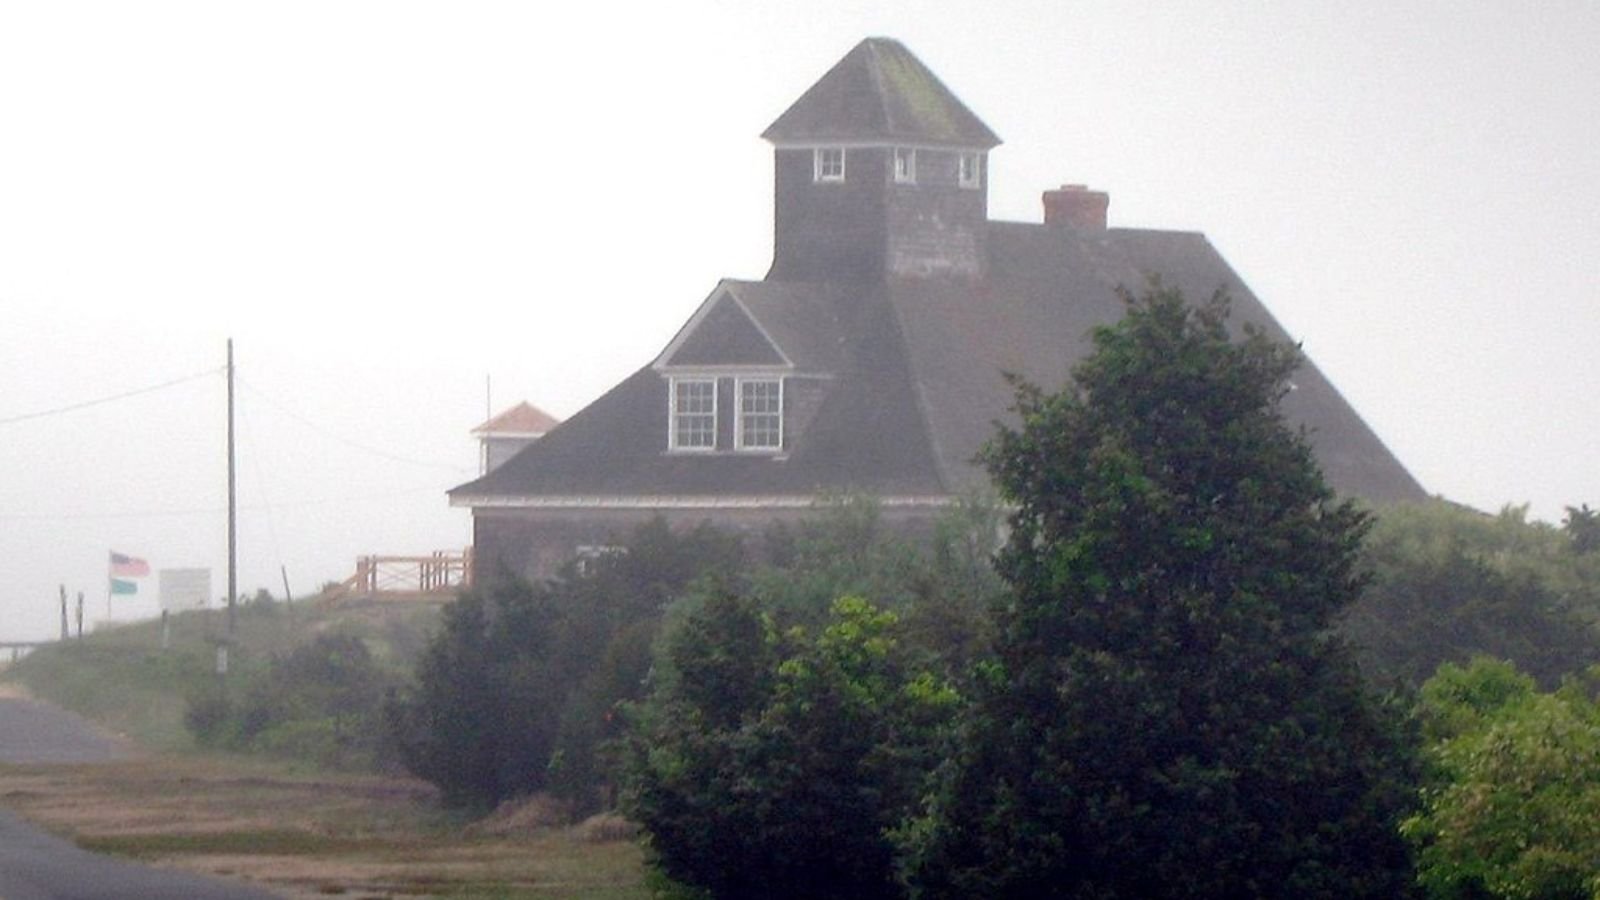
Sands Point – Waterfront Grandeur in Western Long Island
Sitting at the northern tip of the Port Washington peninsula, Sands Point is known for its sprawling estates, private beaches, and historic mansions. With zoning that prohibits commercial development and emphasizes open space, the village has retained a serene, exclusive feel.
The area’s proximity to Manhattan, paired with its coastal elegance, has made it a perennial favorite for wealthy buyers. The sustained rise in values reflects long-term investment confidence in one of Long Island’s most discreet yet powerful luxury markets.
4. Wainscott – 81.5% Home Price Increase Since 2010
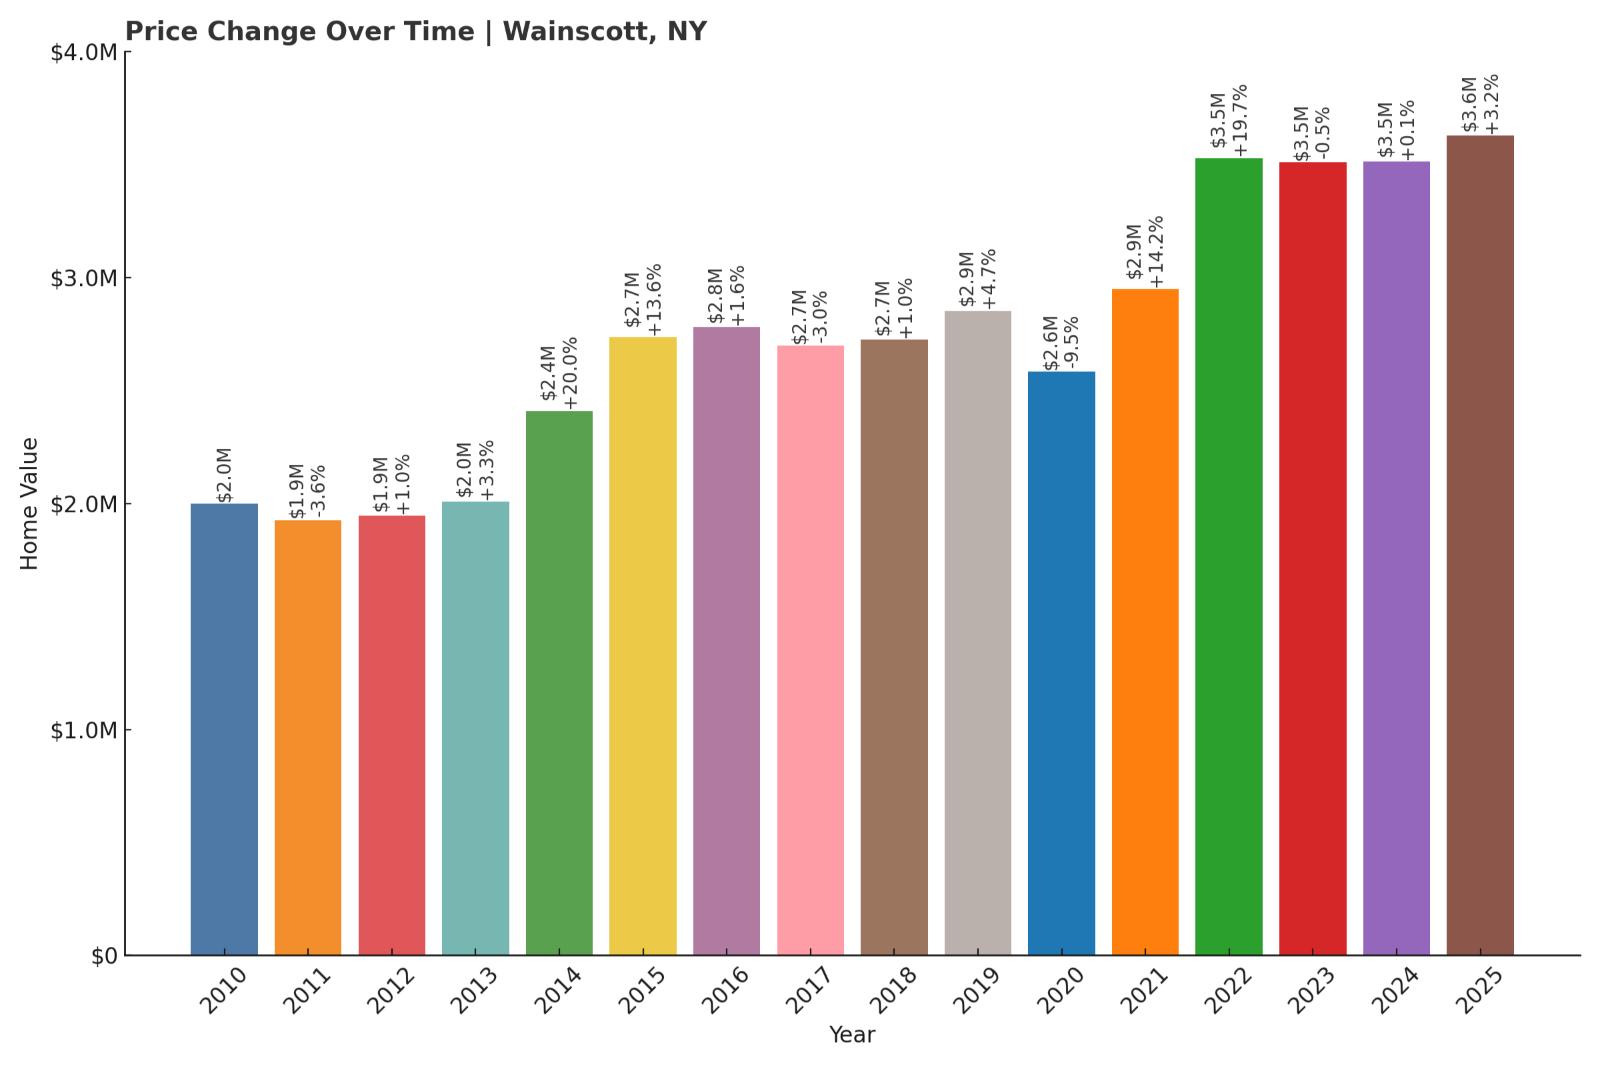
- 2010: $1,997,874
- 2011: $1,925,869 (-$72,005, -3.60% from previous year)
- 2012: $1,944,254 (+$18,386, +0.95% from previous year)
- 2013: $2,007,705 (+$63,451, +3.26% from previous year)
- 2014: $2,409,585 (+$401,880, +20.02% from previous year)
- 2015: $2,736,288 (+$326,702, +13.56% from previous year)
- 2016: $2,779,074 (+$42,786, +1.56% from previous year)
- 2017: $2,696,610 (-$82,464, -2.97% from previous year)
- 2018: $2,723,426 (+$26,816, +0.99% from previous year)
- 2019: $2,852,646 (+$129,221, +4.74% from previous year)
- 2020: $2,581,625 (-$271,021, -9.50% from previous year)
- 2021: $2,947,836 (+$366,211, +14.19% from previous year)
- 2022: $3,527,685 (+$579,849, +19.67% from previous year)
- 2023: $3,509,113 (-$18,572, -0.53% from previous year)
- 2024: $3,512,417 (+$3,303, +0.09% from previous year)
- 2025: $3,626,158 (+$113,741, +3.24% from previous year)
Home values in Wainscott have jumped by over $1.6 million since 2010, marking an 81.5% increase. Although the market showed minor dips in a few years, the overall trend—especially since 2020—has been steeply upward, placing Wainscott among New York’s most elite enclaves.
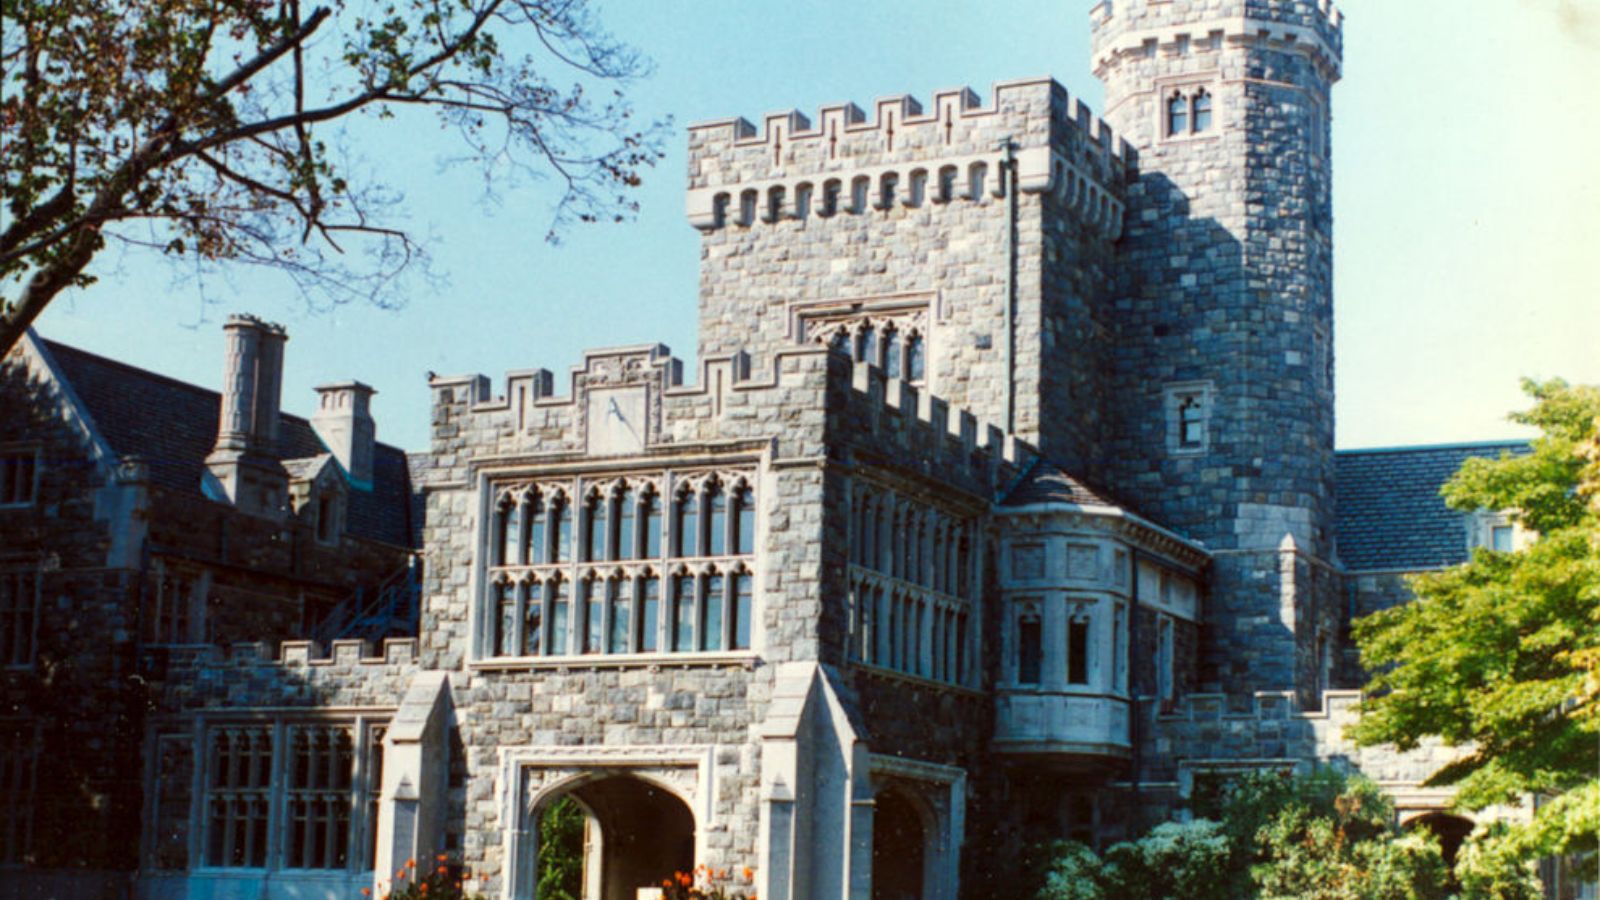
Wainscott – Small Village, Big Price Tag
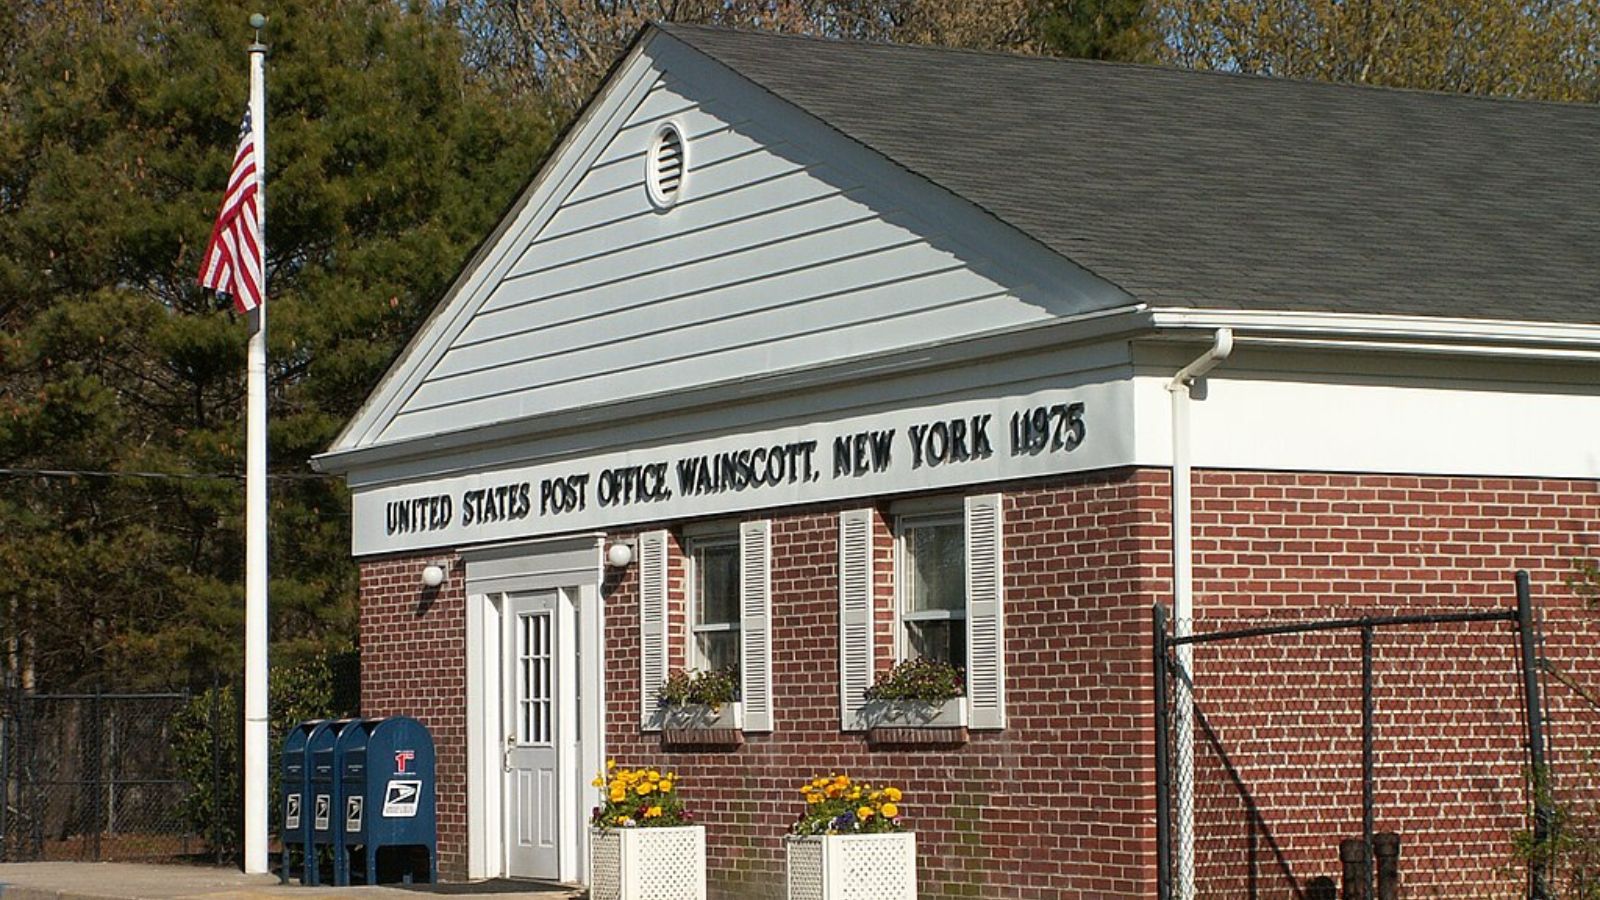
Wainscott is one of the smallest hamlets in the Hamptons, but it commands some of the region’s highest prices. Tucked between East Hampton and Sagaponack, it offers oceanfront estates, rolling farmland, and carefully preserved natural spaces that limit overdevelopment.
Its compact size and low density make Wainscott particularly attractive to buyers seeking privacy. Strong demand, limited inventory, and a near-mythic reputation have made this hamlet a standout—even among Hamptons heavyweights.
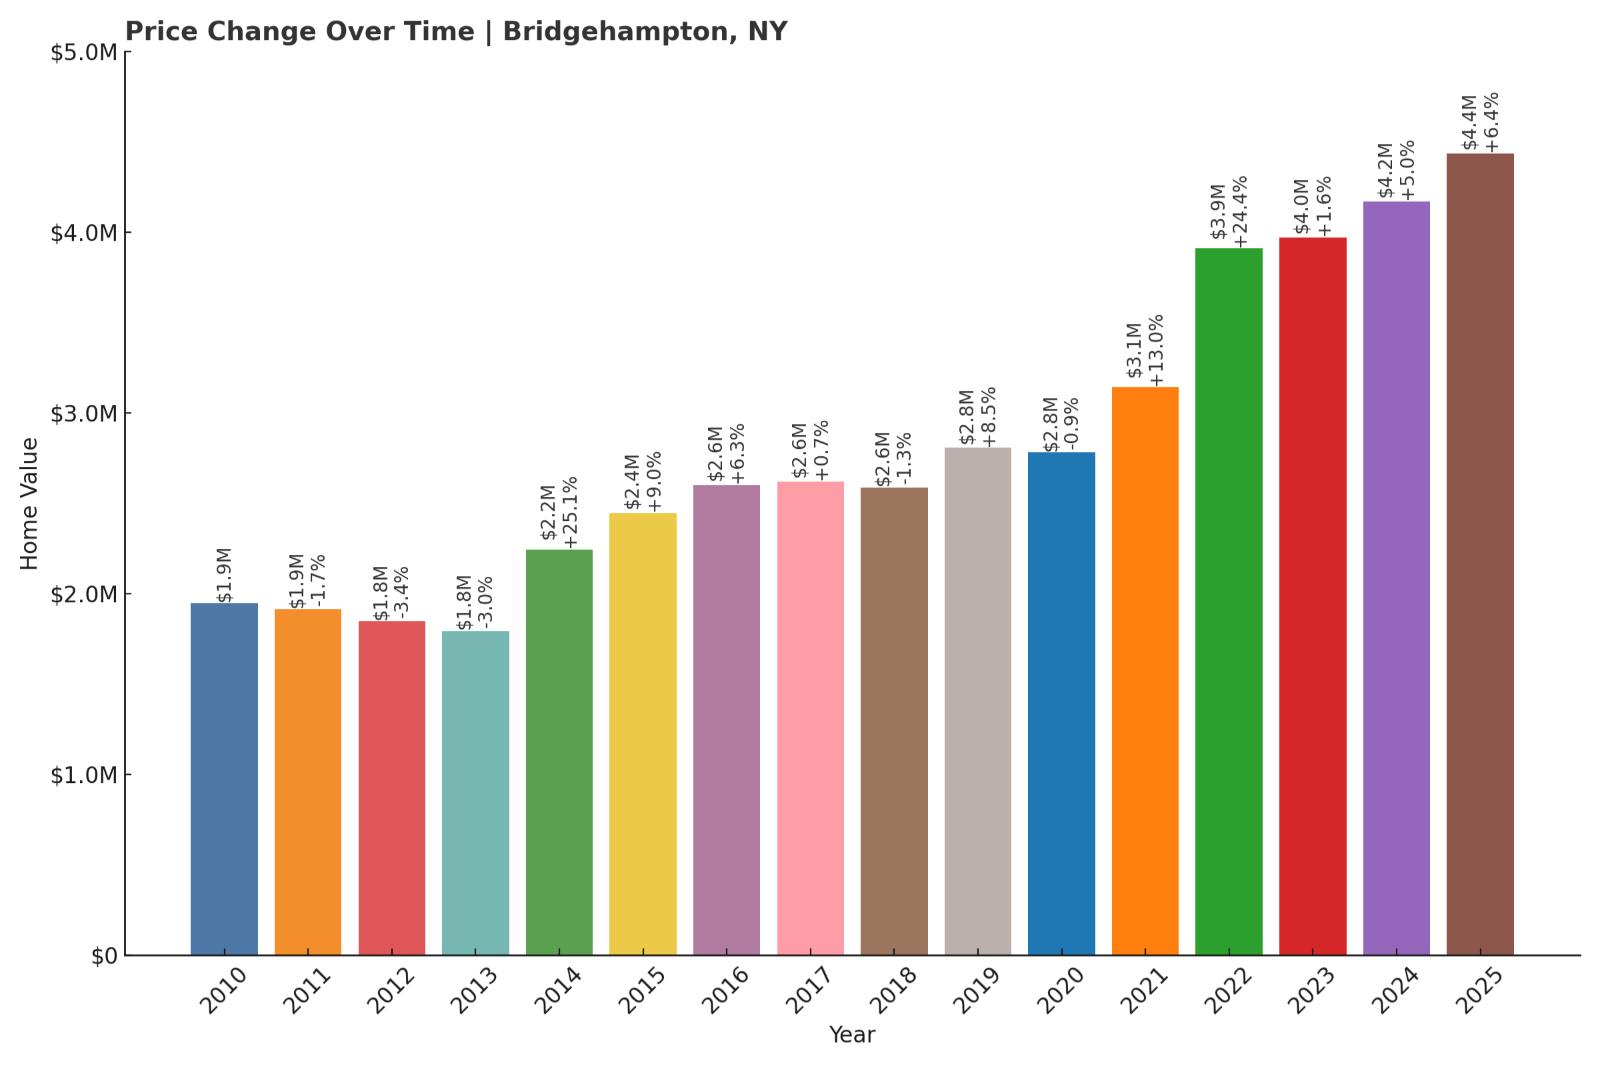
3. Bridgehampton – 127.7% Home Price Increase Since 2010
- 2010: $1,947,667
- 2011: $1,913,887 (-$33,781, -1.73% from previous year)
- 2012: $1,848,335 (-$65,552, -3.43% from previous year)
- 2013: $1,793,280 (-$55,055, -2.98% from previous year)
- 2014: $2,244,227 (+$450,948, +25.15% from previous year)
- 2015: $2,447,205 (+$202,978, +9.04% from previous year)
- 2016: $2,602,016 (+$154,811, +6.33% from previous year)
- 2017: $2,621,127 (+$19,110, +0.73% from previous year)
- 2018: $2,587,749 (-$33,378, -1.27% from previous year)
- 2019: $2,806,726 (+$218,977, +8.46% from previous year)
- 2020: $2,781,005 (-$25,721, -0.92% from previous year)
- 2021: $3,142,723 (+$361,718, +13.01% from previous year)
- 2022: $3,909,085 (+$766,362, +24.39% from previous year)
- 2023: $3,970,364 (+$61,279, +1.57% from previous year)
- 2024: $4,169,775 (+$199,411, +5.02% from previous year)
- 2025: $4,435,364 (+$265,589, +6.37% from previous year)
Bridgehampton home values have climbed from under $2 million in 2010 to over $4.4 million in 2025, marking a 127.7% increase. The sharpest acceleration came after 2020, driven by luxury demand in the Hamptons and a series of double-digit gains culminating in a peak year in 2022.
Bridgehampton – Elegant Estates and Equine Prestige
Bridgehampton offers a unique blend of farmland, proximity to the ocean, and prestige-driven amenities like the Hampton Classic horse show. Its sprawling estates and equestrian properties set it apart from more beach-oriented villages, giving it a distinctly refined character.
Buyers have historically flocked to Bridgehampton for its combination of privacy and accessibility. The town’s performance over the last decade reflects a deep and sustained appetite for luxury housing in the Hamptons’ interior corridors.
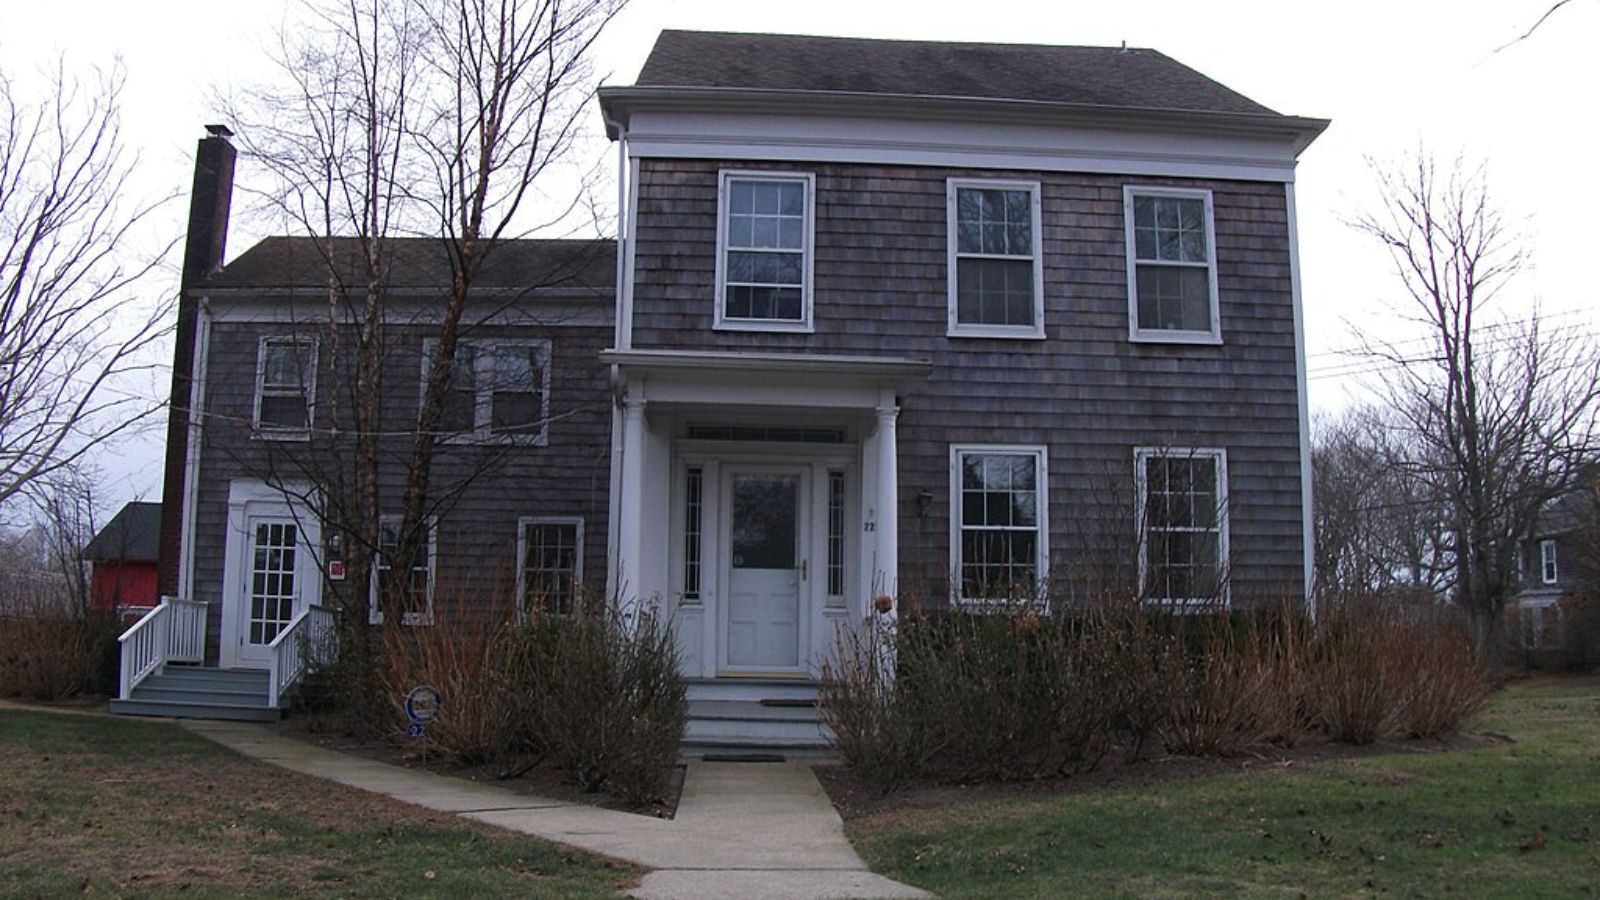
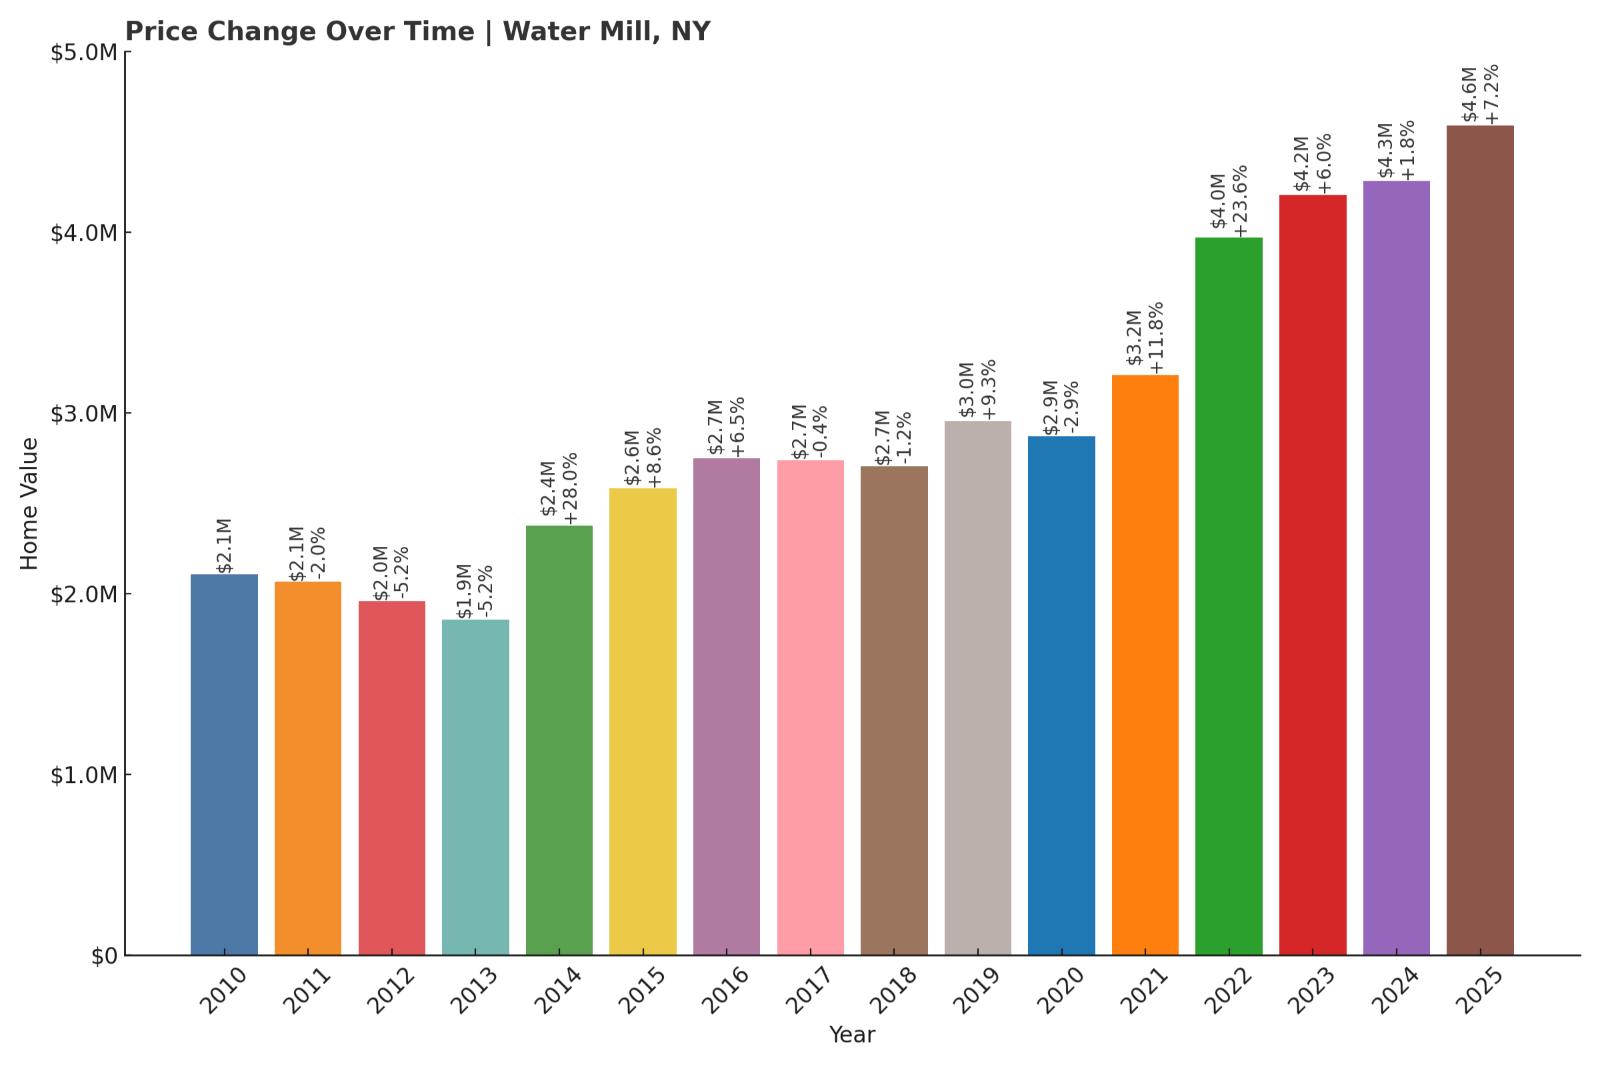
2. Water Mill – 117.8% Home Price Increase Since 2010
- 2010: $2,108,860
- 2011: $2,065,987 (-$42,873, -2.03% from previous year)
- 2012: $1,958,799 (-$107,189, -5.19% from previous year)
- 2013: $1,856,912 (-$101,887, -5.20% from previous year)
- 2014: $2,377,307 (+$520,395, +28.02% from previous year)
- 2015: $2,581,582 (+$204,276, +8.59% from previous year)
- 2016: $2,748,447 (+$166,865, +6.46% from previous year)
- 2017: $2,738,626 (-$9,821, -0.36% from previous year)
- 2018: $2,705,250 (-$33,377, -1.22% from previous year)
- 2019: $2,956,106 (+$250,856, +9.27% from previous year)
- 2020: $2,871,569 (-$84,537, -2.86% from previous year)
- 2021: $3,210,528 (+$338,959, +11.80% from previous year)
- 2022: $3,968,596 (+$758,069, +23.61% from previous year)
- 2023: $4,205,213 (+$236,616, +5.96% from previous year)
- 2024: $4,282,045 (+$76,832, +1.83% from previous year)
- 2025: $4,590,827 (+$308,783, +7.21% from previous year)
Water Mill prices have more than doubled since 2010, increasing by nearly $2.5 million and finishing at $4.59 million in 2025. The steepest growth happened post-2020, fueled by heightened demand for high-end East End properties.
Water Mill – Art, Farmland, and Premium Prestige
Water Mill sits between Southampton and Bridgehampton, offering panoramic views, sprawling farmland, and modern estates nestled among quiet roads. It appeals to high-end buyers seeking privacy and proximity to both culture and coastline.
With homes often featuring both acreage and access to nearby beaches, Water Mill occupies a unique niche. Its consistent price growth underscores its broad appeal in the luxury real estate world.
1. Sagaponack – 142.2% Home Price Increase Since 2010
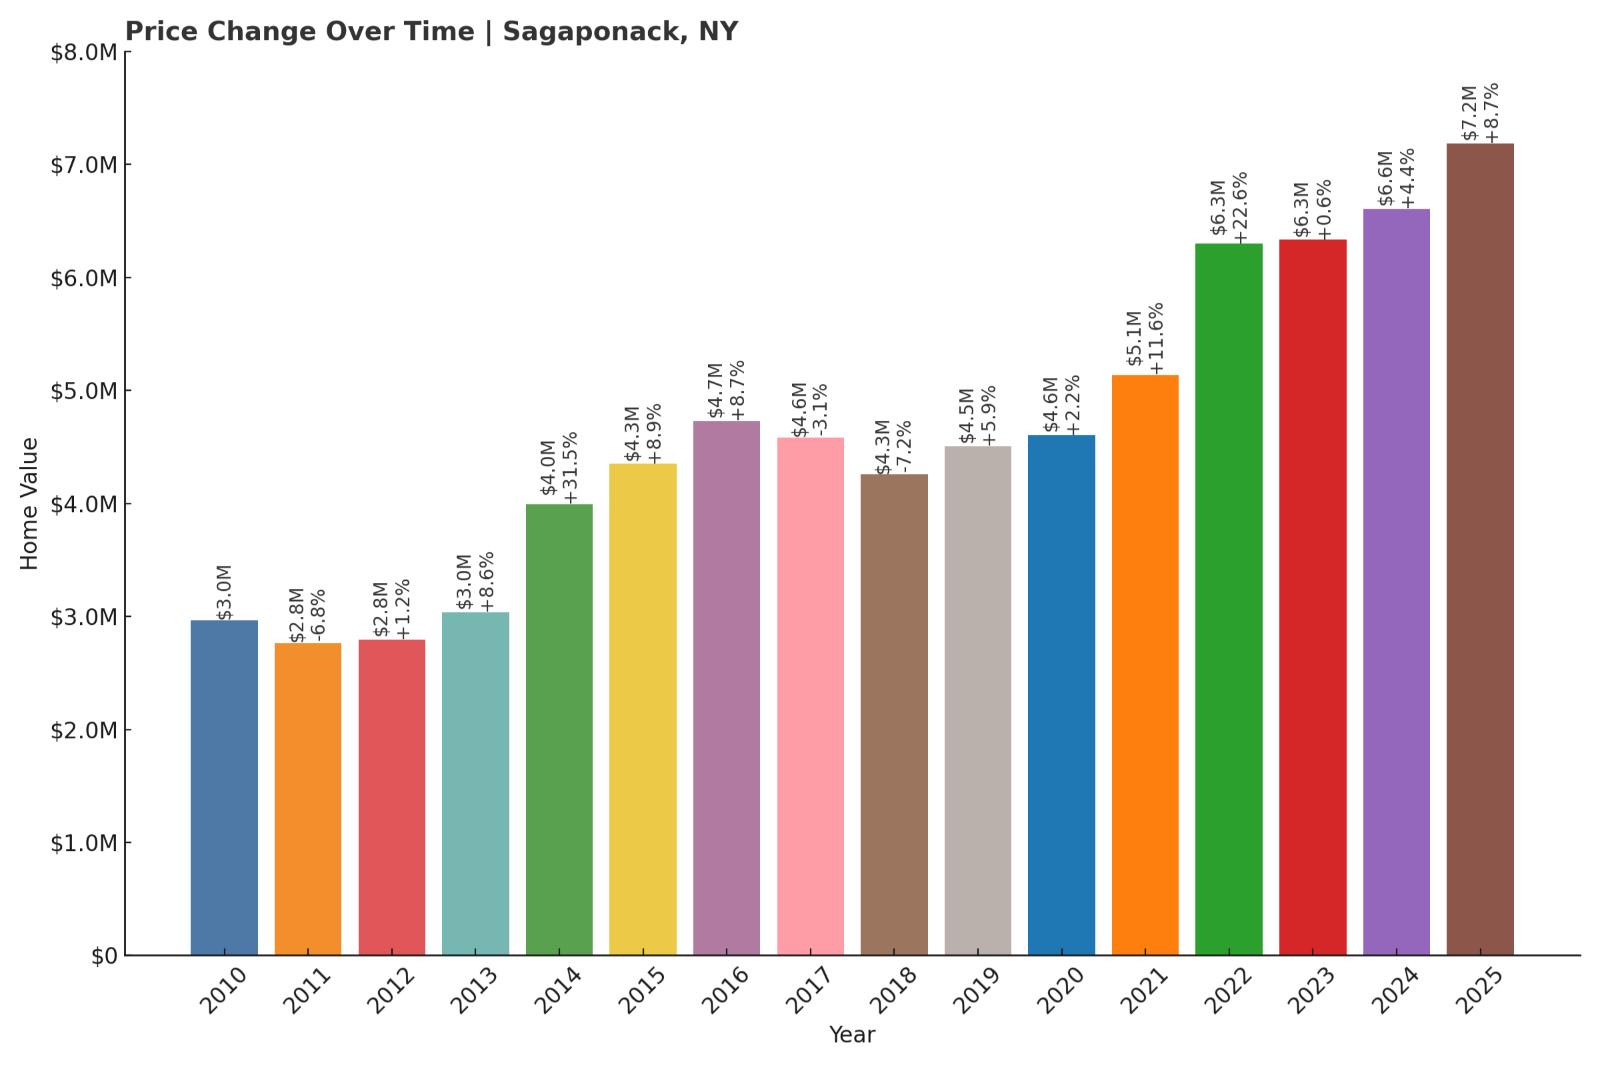
- 2010: $2,964,930
- 2011: $2,763,230 (-$201,700, -6.80% from previous year)
- 2012: $2,796,084 (+$32,854, +1.19% from previous year)
- 2013: $3,035,376 (+$239,292, +8.56% from previous year)
- 2014: $3,993,021 (+$957,645, +31.55% from previous year)
- 2015: $4,348,557 (+$355,536, +8.90% from previous year)
- 2016: $4,728,843 (+$380,286, +8.75% from previous year)
- 2017: $4,582,807 (-$146,035, -3.09% from previous year)
- 2018: $4,254,472 (-$328,336, -7.16% from previous year)
- 2019: $4,506,616 (+$252,144, +5.93% from previous year)
- 2020: $4,603,903 (+$97,287, +2.16% from previous year)
- 2021: $5,137,294 (+$533,391, +11.59% from previous year)
- 2022: $6,296,979 (+$1,159,684, +22.57% from previous year)
- 2023: $6,332,207 (+$35,228, +0.56% from previous year)
- 2024: $6,607,878 (+$275,671, +4.35% from previous year)
- 2025: $7,182,753 (+$574,875, +8.70% from previous year)
Sagaponack leads the state with a 142.2% rise in home prices since 2010, with values climbing from $2.96 million to over $7.18 million in 2025. Its growth has been especially explosive since 2021, including a record-breaking surge in 2022.
Sagaponack – New York’s Most Expensive Housing Market
Sagaponack has long been the pinnacle of luxury in the Hamptons. With sprawling oceanfront estates, strict development limits, and global name recognition, it’s consistently ranked among the most expensive zip codes in the U.S.
Buyers come for the prestige, but stay for the space, privacy, and unmatched coastal views. The post-pandemic boom only accelerated what was already a trajectory of elite growth—cementing Sagaponack as New York’s ultimate high-end enclave.