🔥 Would you like to save this?
New Hampshire’s priciest housing markets are no longer limited to the coast. According to the latest data from the Zillow Home Value Index, 22 towns across the state are now pushing well past the median, with prices driven by everything from lakefront luxury to Boston-bound buyers. Once-quiet mill towns are turning into fast-moving commuter hubs, and even rural retreats are seeing serious bidding wars. Whether it’s tight inventory, postcard views, or surging demand, these towns have one thing in common: they’re not cheap—and they’re not slowing down.
22. Pelham – 143% Home Price Increase Since 2010
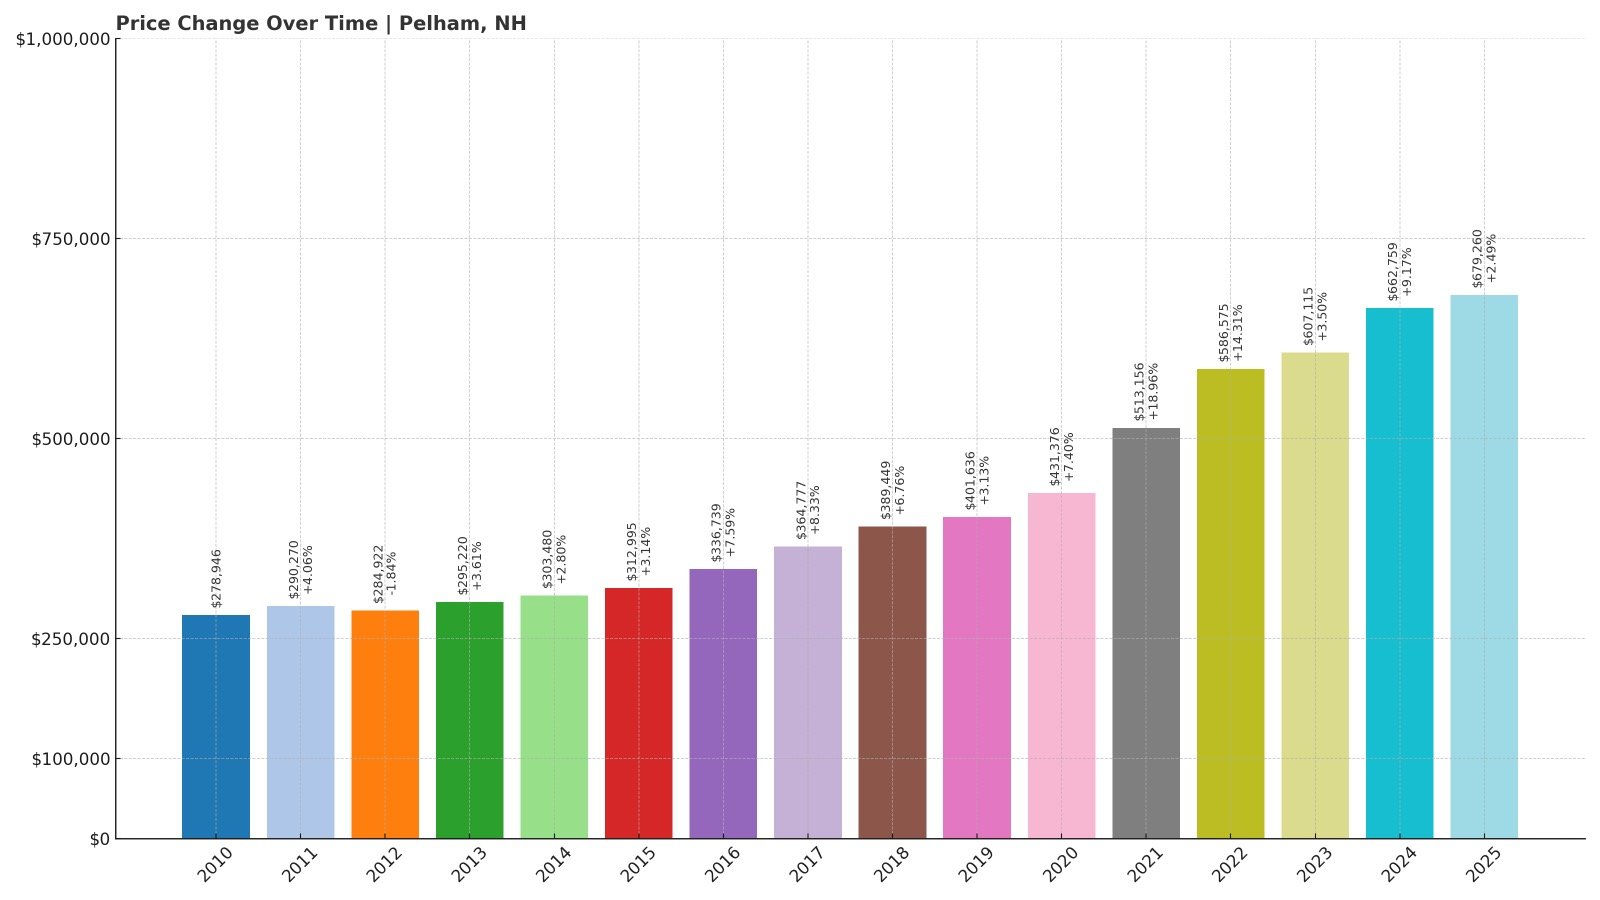
- 2010: $278,946
- 2011: $290,270 (+$11,324, +4.06% from previous year)
- 2012: $284,922 (-$5,347, -1.84% from previous year)
- 2013: $295,220 (+$10,297, +3.61% from previous year)
- 2014: $303,480 (+$8,260, +2.80% from previous year)
- 2015: $312,995 (+$9,515, +3.14% from previous year)
- 2016: $336,739 (+$23,744, +7.59% from previous year)
- 2017: $364,777 (+$28,038, +8.33% from previous year)
- 2018: $389,449 (+$24,673, +6.76% from previous year)
- 2019: $401,636 (+$12,187, +3.13% from previous year)
- 2020: $431,376 (+$29,740, +7.40% from previous year)
- 2021: $513,156 (+$81,780, +18.96% from previous year)
- 2022: $586,575 (+$73,419, +14.31% from previous year)
- 2023: $607,115 (+$20,540, +3.50% from previous year)
- 2024: $662,759 (+$55,644, +9.17% from previous year)
- 2025: $679,260 (+$16,501, +2.49% from previous year)
Pelham’s home values have climbed steadily over the last decade and a half, rising from just under $279K in 2010 to nearly $680K by mid-2025. The most dramatic spike came in 2021, when prices surged nearly 19% in a single year. Since then, growth has remained strong but moderated, with healthy gains each year. Compared to many other towns on this list, Pelham’s increases have been more evenly spread out.
In order to come up with the very specific design ideas, we create most designs with the assistance of state-of-the-art AI interior design software. Also, assume links that take you off the site are affiliate links such as links to Amazon. this means we may earn a commission if you buy something.
Pelham – Growth Fueled by Location and Value
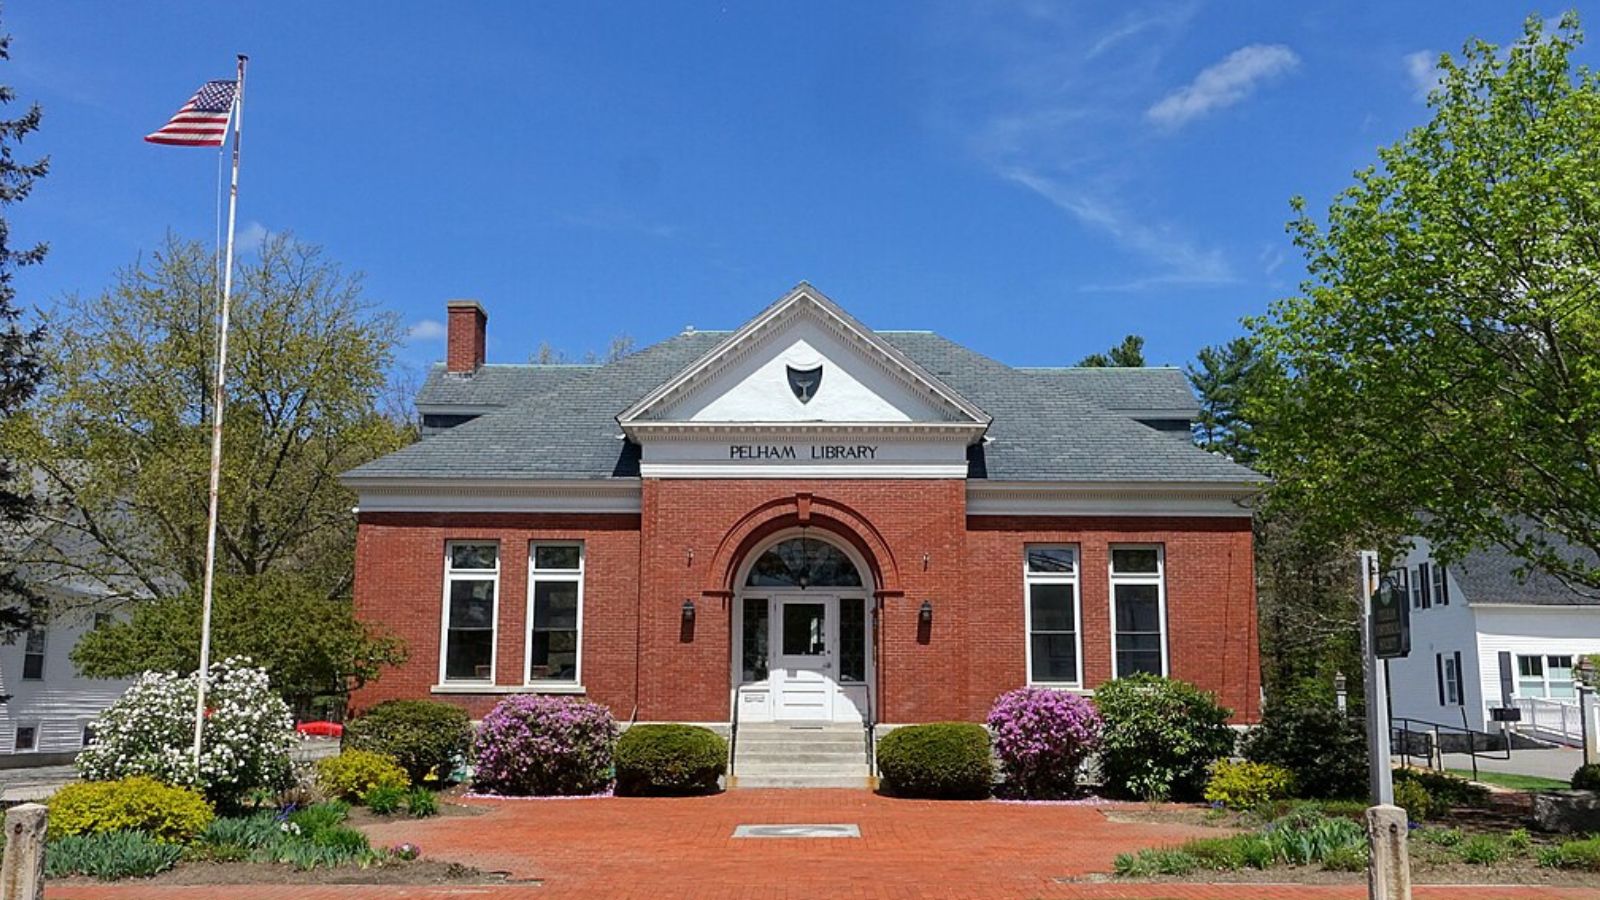
Located right on the Massachusetts border, Pelham benefits from being a commuter-friendly town with easy access to Lowell, Nashua, and the greater Boston area. Buyers priced out of Massachusetts often look north for larger homes on bigger lots, and Pelham has delivered. The town has a suburban feel with a strong school system and recreational options like Muldoon Park and the Peabody Town Forest.
In recent years, new construction and upgrades to local infrastructure have made the area more appealing to families. Though not as flashy as the Seacoast towns, Pelham’s relatively affordable prices (by southern New Hampshire standards) and consistent upward trend have made it a reliable bet for long-term growth.
21. Center Harbor – 112% Home Price Increase Since 2010
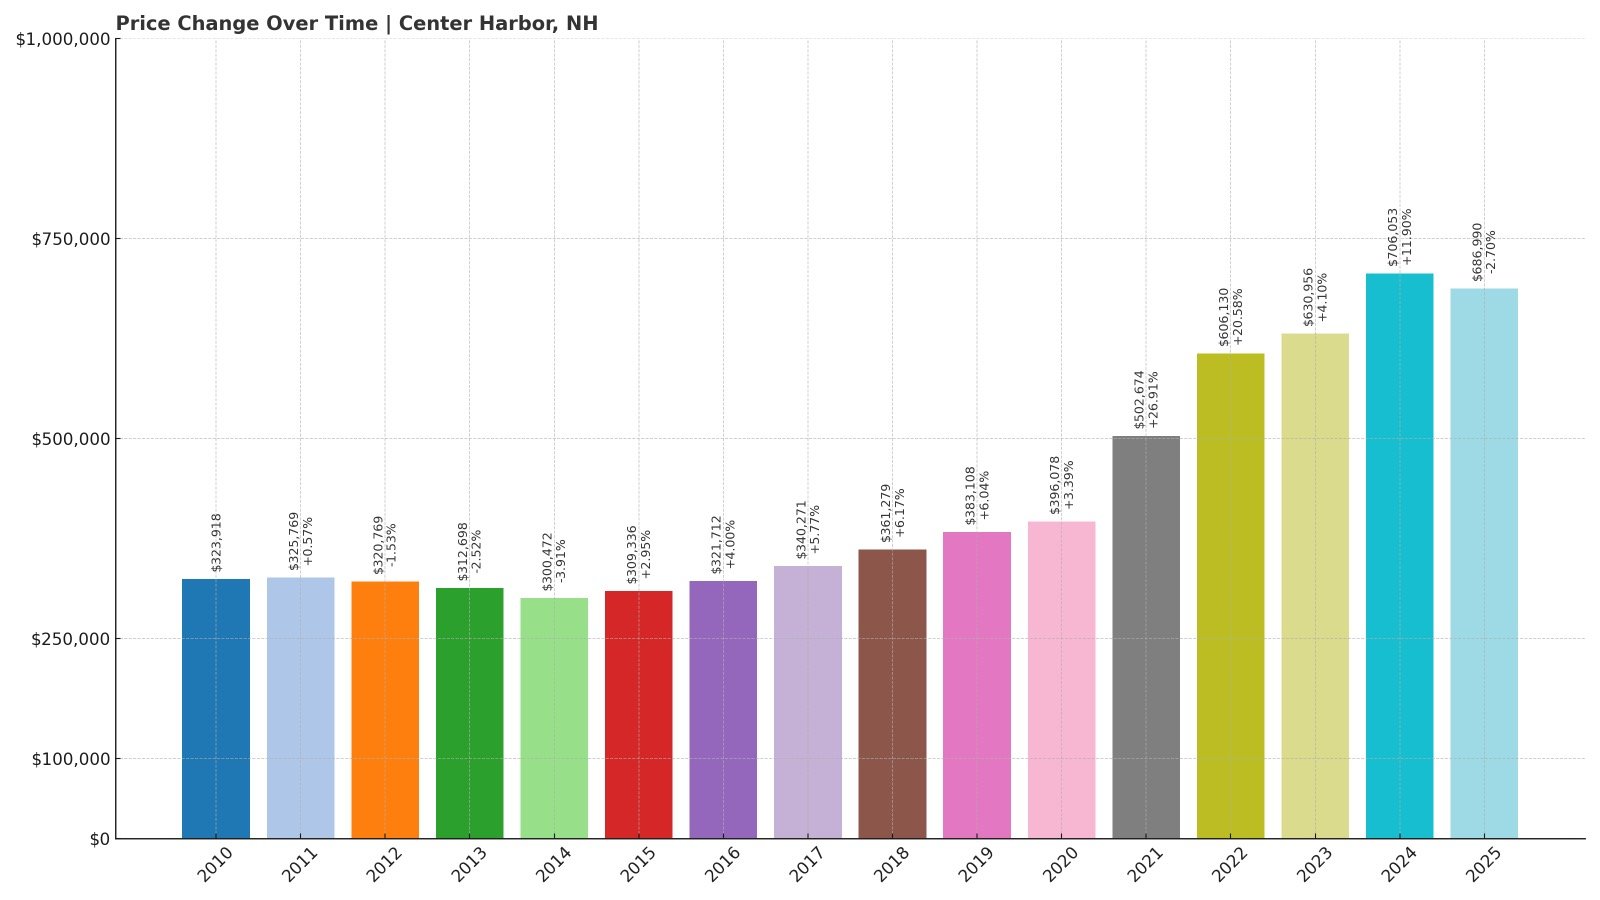
- 2010: $323,918
- 2011: $325,769 (+$1,851, +0.57% from previous year)
- 2012: $320,769 (-$5,000, -1.53% from previous year)
- 2013: $312,698 (-$8,071, -2.52% from previous year)
- 2014: $300,472 (-$12,226, -3.91% from previous year)
- 2015: $309,336 (+$8,865, +2.95% from previous year)
- 2016: $321,712 (+$12,375, +4.00% from previous year)
- 2017: $340,271 (+$18,560, +5.77% from previous year)
- 2018: $361,279 (+$21,008, +6.17% from previous year)
- 2019: $383,108 (+$21,829, +6.04% from previous year)
- 2020: $396,078 (+$12,969, +3.39% from previous year)
- 2021: $502,674 (+$106,596, +26.91% from previous year)
- 2022: $606,130 (+$103,456, +20.58% from previous year)
- 2023: $630,956 (+$24,827, +4.10% from previous year)
- 2024: $706,053 (+$75,097, +11.90% from previous year)
- 2025: $686,990 (-$19,063, -2.70% from previous year)
Center Harbor saw modest declines in home prices between 2012 and 2014 but recovered quickly and dramatically. From 2020 to 2022 alone, prices jumped by more than $200,000, including a 27% surge in 2021. A slight dip in 2025 brings its average price to $686,990, still more than double what it was in 2010.
Center Harbor – Lakeside Living with Seasonal Appeal
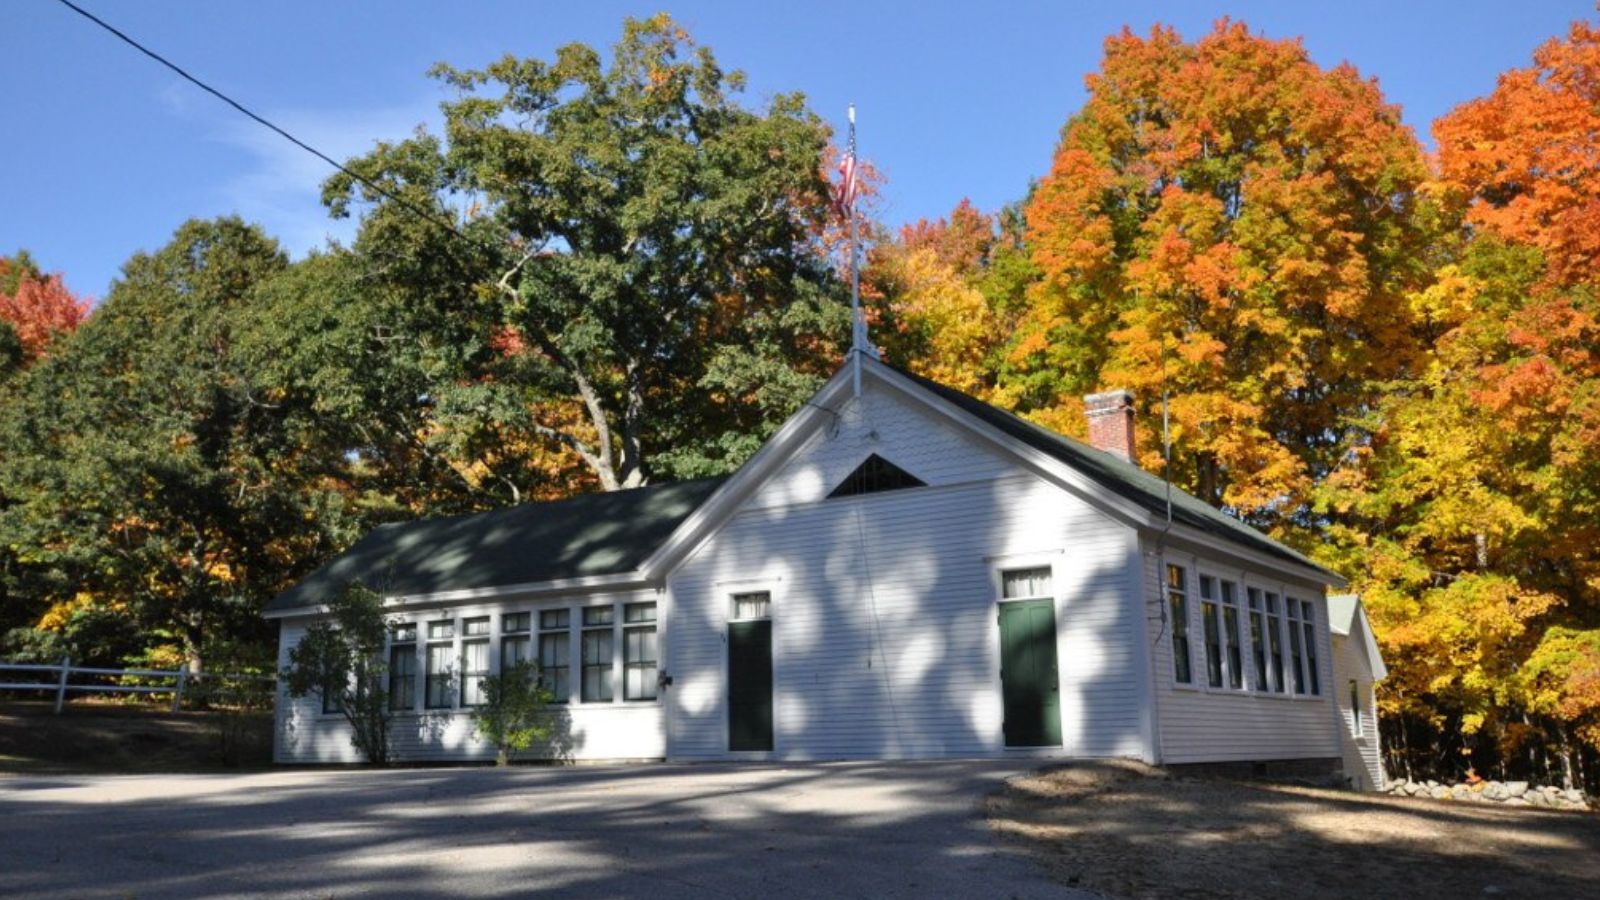
Perched on the northwestern corner of Lake Winnipesaukee, Center Harbor is known for its picturesque views and small-town charm. As a seasonal destination, the town’s real estate market is heavily influenced by summer demand, with vacation homes and waterfront properties commanding a premium. The town’s quaint downtown and marina give it a postcard feel.
Recent price jumps suggest growing interest from second-home buyers, especially in the pandemic era, when urban dwellers sought rural retreats. However, the decline in 2025 may signal a brief correction following years of rapid appreciation. Still, Center Harbor remains one of the state’s most scenic—and expensive—lakefront communities.
20. Durham – 133% Home Price Increase Since 2010
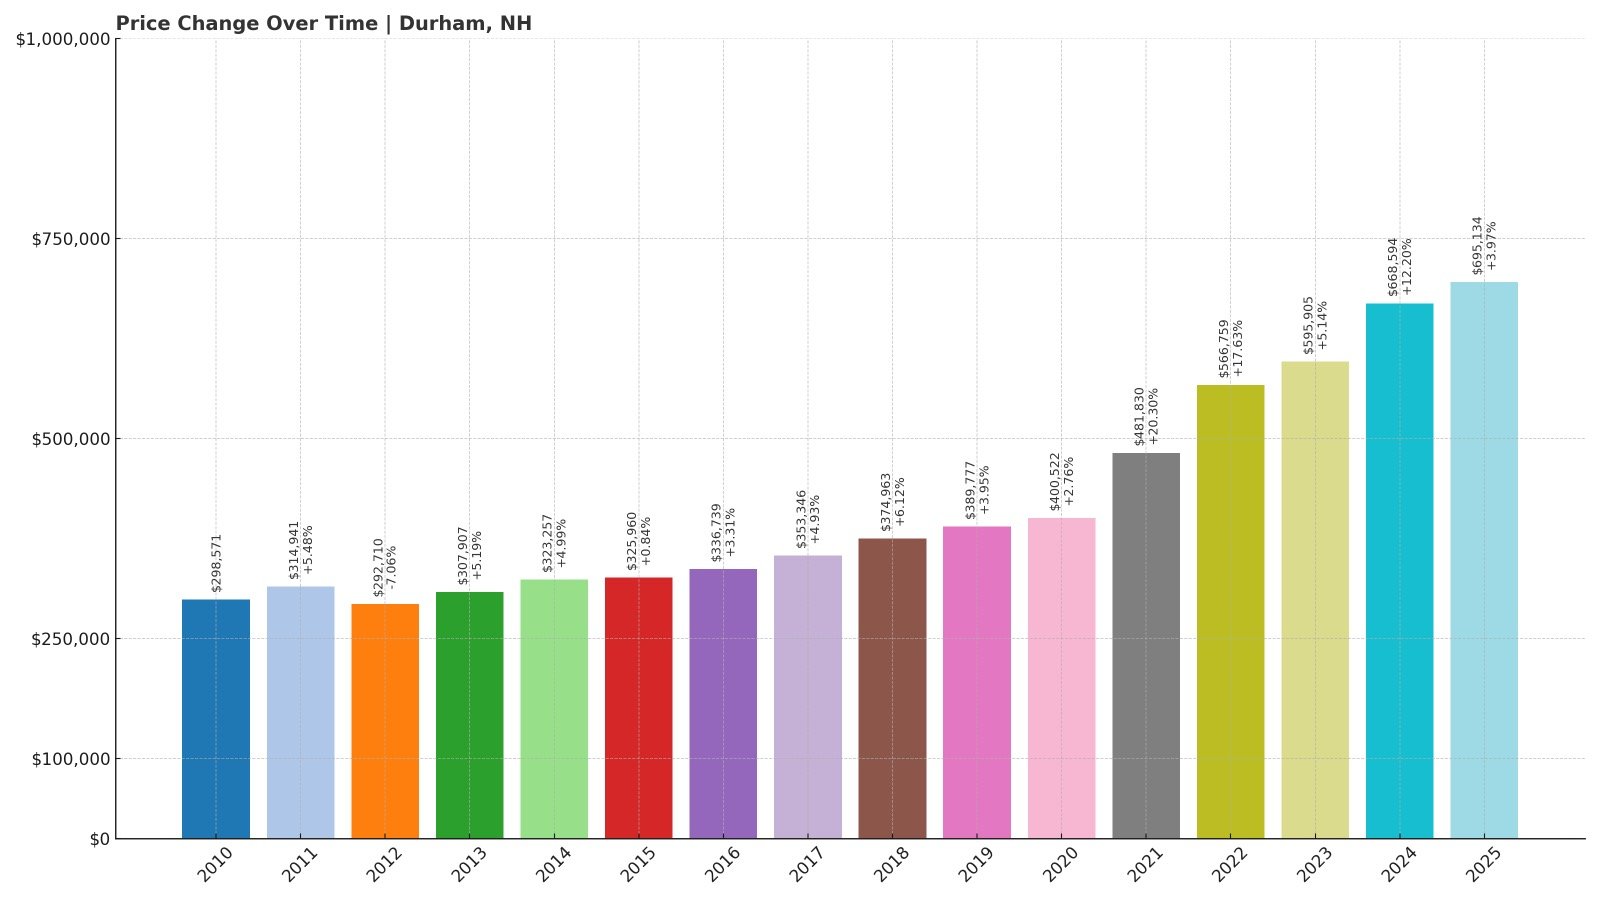
- 2010: $298,571
- 2011: $314,941 (+$16,370, +5.48% from previous year)
- 2012: $292,710 (-$22,231, -7.06% from previous year)
- 2013: $307,907 (+$15,197, +5.19% from previous year)
- 2014: $323,257 (+$15,350, +4.99% from previous year)
- 2015: $325,960 (+$2,703, +0.84% from previous year)
- 2016: $336,739 (+$10,778, +3.31% from previous year)
- 2017: $353,346 (+$16,607, +4.93% from previous year)
- 2018: $374,963 (+$21,617, +6.12% from previous year)
- 2019: $389,777 (+$14,814, +3.95% from previous year)
- 2020: $400,522 (+$10,745, +2.76% from previous year)
- 2021: $481,830 (+$81,308, +20.30% from previous year)
- 2022: $566,759 (+$84,929, +17.63% from previous year)
- 2023: $595,905 (+$29,146, +5.14% from previous year)
- 2024: $668,594 (+$72,689, +12.20% from previous year)
- 2025: $695,134 (+$26,539, +3.97% from previous year)
Durham home prices have more than doubled since 2010, with the biggest jumps occurring in 2021 and 2022. Prices have continued to grow in recent years, reaching $695,134 in 2025, despite a small lull in early 2010s performance.
Durham – Driven by Education and Steady Demand
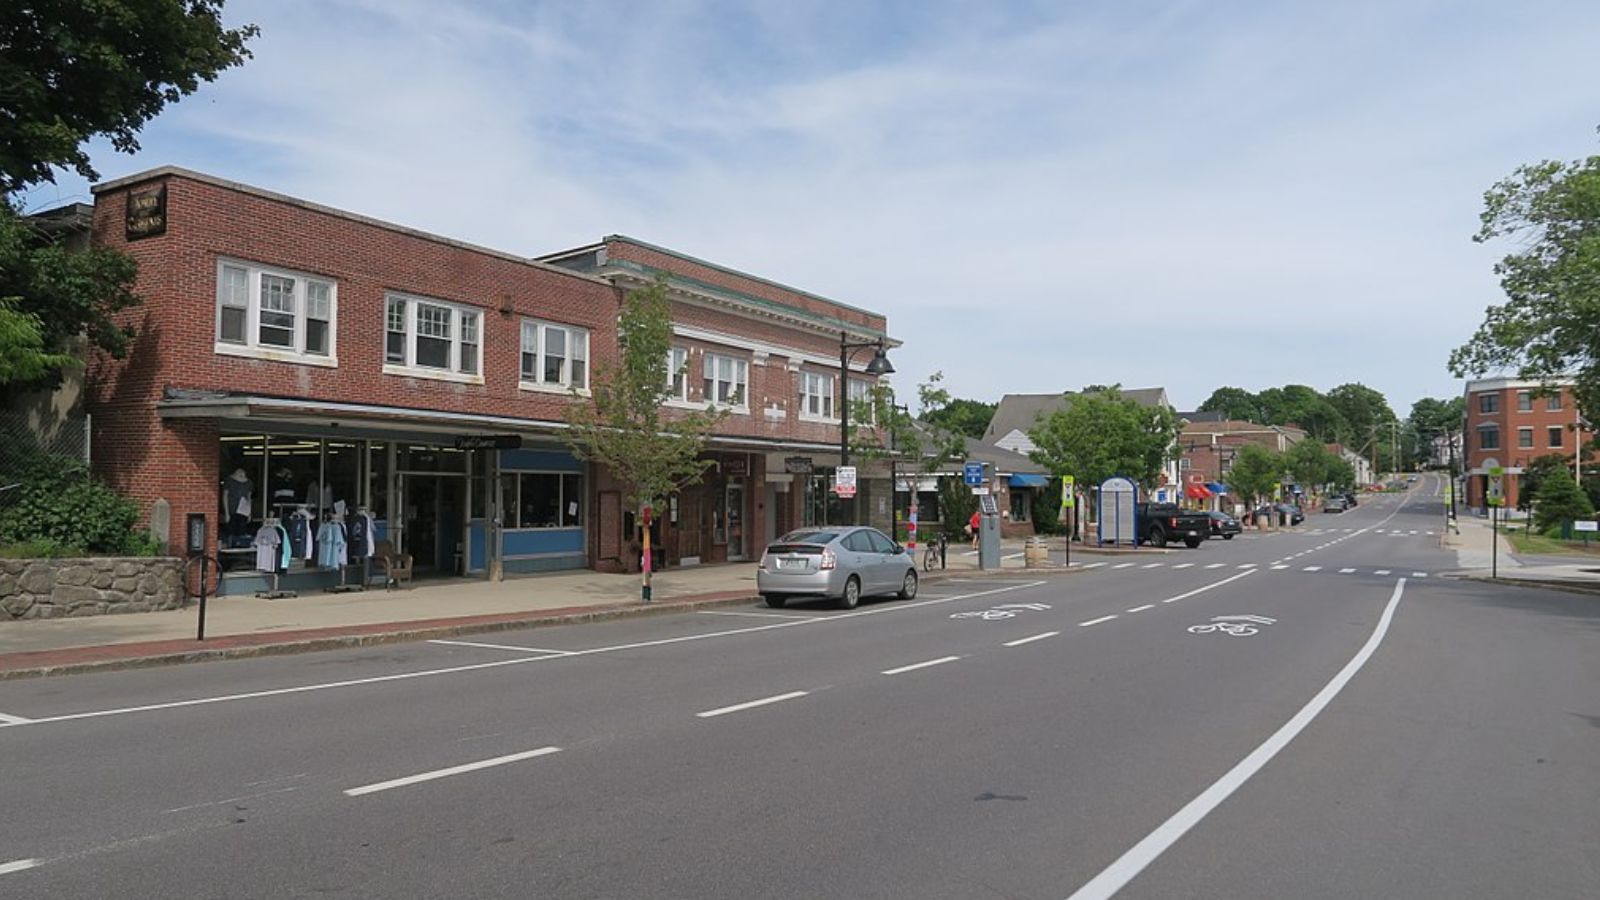
Home to the University of New Hampshire, Durham is a vibrant college town that balances academic life with residential appeal. Its stable economy and consistent demand from faculty, staff, and investors have helped keep home values on the rise. The town also benefits from strong public schools and a walkable downtown area anchored by UNH’s campus.
Because much of the town’s housing stock is owner-occupied or student rental, inventory is tight. That scarcity, coupled with Durham’s desirable location in the Seacoast region, has led to significant appreciation—especially during the recent housing boom.
19. Moultonborough – 136% Home Price Increase Since 2010
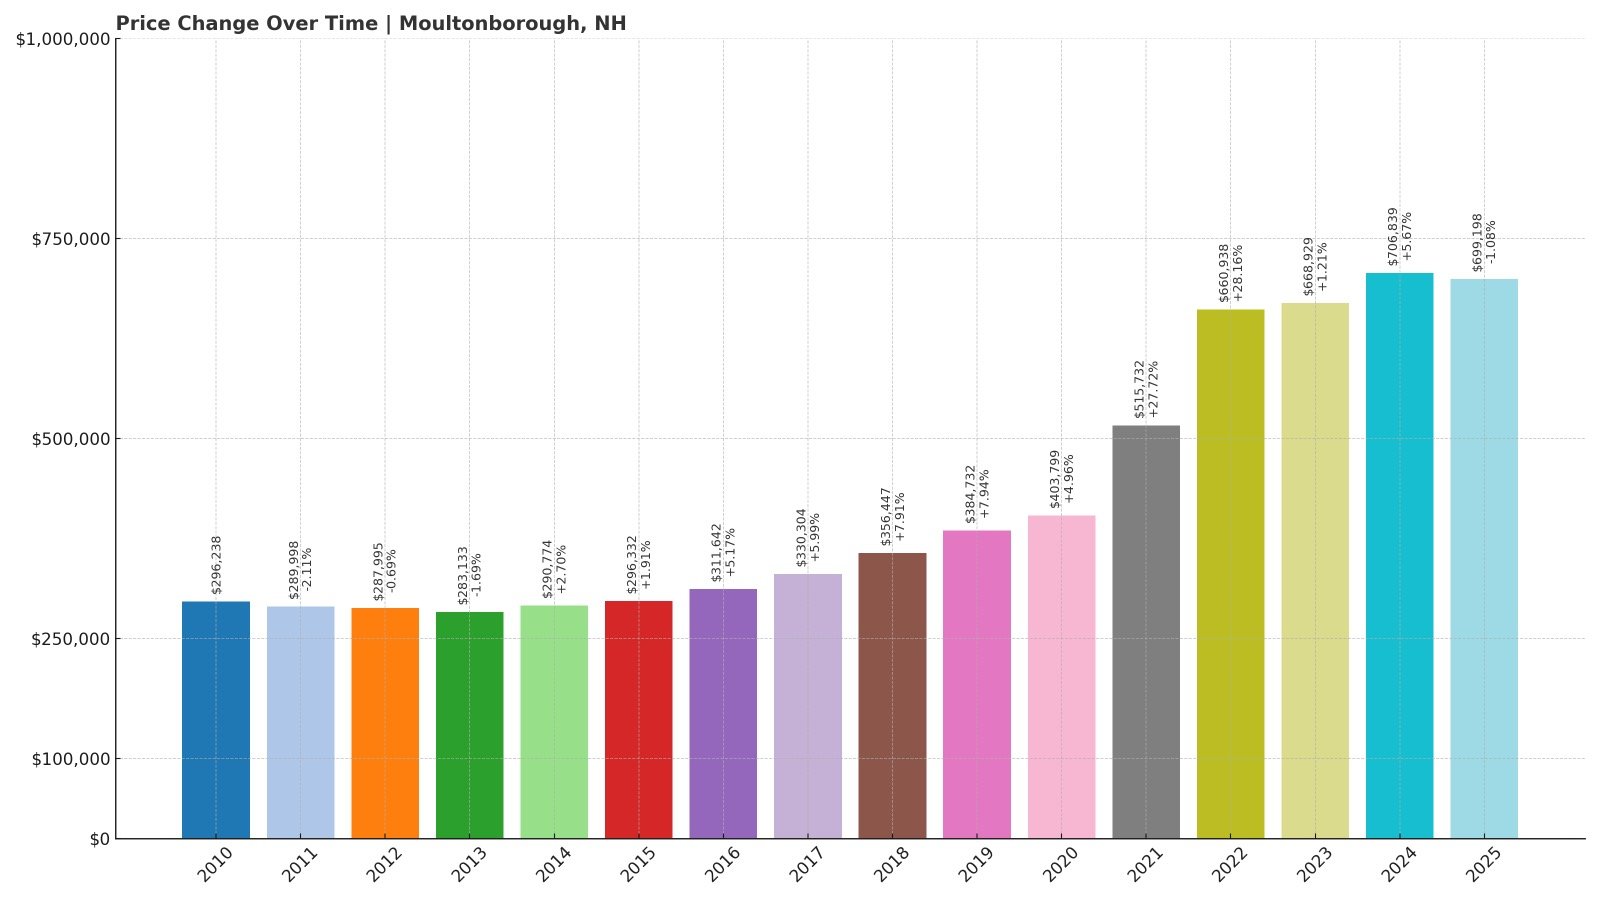
- 2010: $296,238
- 2011: $289,998 (-$6,241, -2.11% from previous year)
- 2012: $287,995 (-$2,003, -0.69% from previous year)
- 2013: $283,133 (-$4,863, -1.69% from previous year)
- 2014: $290,774 (+$7,641, +2.70% from previous year)
- 2015: $296,332 (+$5,558, +1.91% from previous year)
- 2016: $311,642 (+$15,311, +5.17% from previous year)
- 2017: $330,304 (+$18,661, +5.99% from previous year)
- 2018: $356,447 (+$26,143, +7.91% from previous year)
- 2019: $384,732 (+$28,285, +7.94% from previous year)
- 2020: $403,799 (+$19,067, +4.96% from previous year)
- 2021: $515,732 (+$111,933, +27.72% from previous year)
- 2022: $660,938 (+$145,206, +28.16% from previous year)
- 2023: $668,929 (+$7,991, +1.21% from previous year)
- 2024: $706,839 (+$37,910, +5.67% from previous year)
- 2025: $699,198 (-$7,641, -1.08% from previous year)
Moultonborough’s housing market remained relatively flat for much of the early 2010s but experienced explosive growth starting in 2020. Prices rose nearly 50% between 2020 and 2022 alone. The slight decline in 2025 is the first in over a decade but follows a period of outsized gains.
Moultonborough – Lakes Region Boomtown
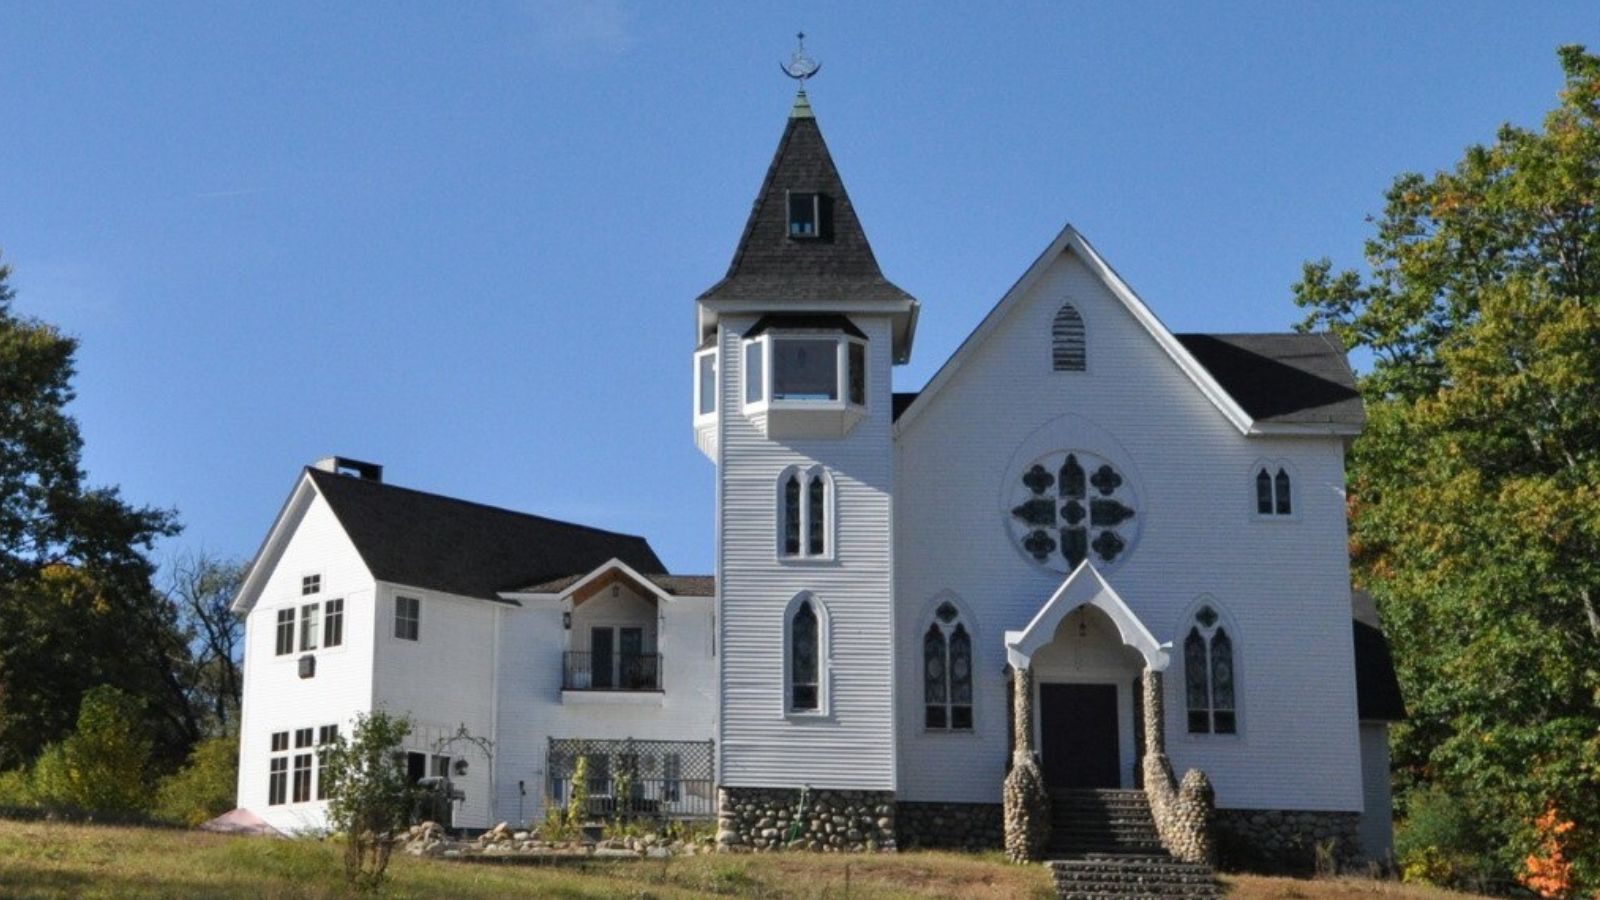
Set along the northern edge of Lake Winnipesaukee, Moultonborough offers a rural setting with luxury lakefront homes and secluded properties. Its appeal lies in its scenic beauty, privacy, and proximity to water recreation, which surged in popularity during the pandemic years.
Out-of-state buyers looking for vacation homes or permanent escapes from urban life flocked to the Lakes Region in recent years. That demand, coupled with limited buildable land along the waterfront, pushed prices up dramatically. Even with a small dip in 2025, Moultonborough remains a premier destination for upscale buyers in central New Hampshire.
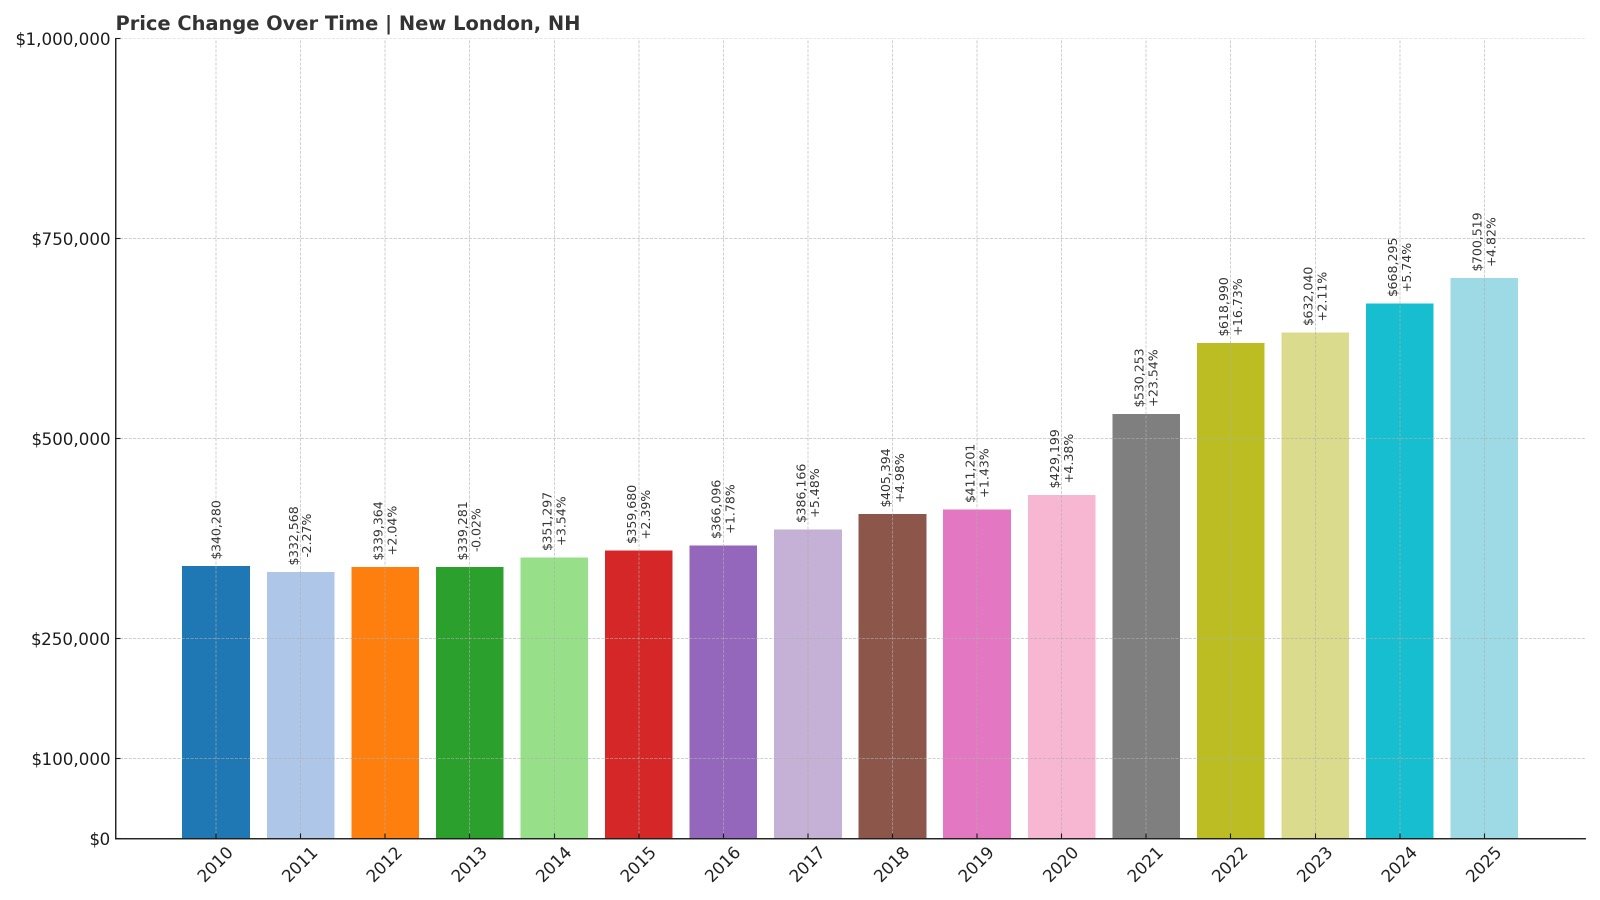
18. New London – 106% Home Price Increase Since 2010
- 2010: $340,280
- 2011: $332,568 (-$7,712, -2.27% from previous year)
- 2012: $339,364 (+$6,796, +2.04% from previous year)
- 2013: $339,281 (-$83, -0.02% from previous year)
- 2014: $351,297 (+$12,016, +3.54% from previous year)
- 2015: $359,680 (+$8,383, +2.39% from previous year)
- 2016: $366,096 (+$6,416, +1.78% from previous year)
- 2017: $386,166 (+$20,070, +5.48% from previous year)
- 2018: $405,394 (+$19,228, +4.98% from previous year)
- 2019: $411,201 (+$5,808, +1.43% from previous year)
- 2020: $429,199 (+$17,997, +4.38% from previous year)
- 2021: $530,253 (+$101,054, +23.54% from previous year)
- 2022: $618,990 (+$88,737, +16.73% from previous year)
- 2023: $632,040 (+$13,050, +2.11% from previous year)
- 2024: $668,295 (+$36,255, +5.74% from previous year)
- 2025: $700,519 (+$32,224, +4.82% from previous year)
New London’s housing market has grown steadily over the years, with notable jumps between 2020 and 2022. Home values have risen 106% since 2010, reaching over $700K in 2025, marking this lakeside college town as one of the most expensive in the state.
New London – Collegiate Charm and Lakeside Prestige
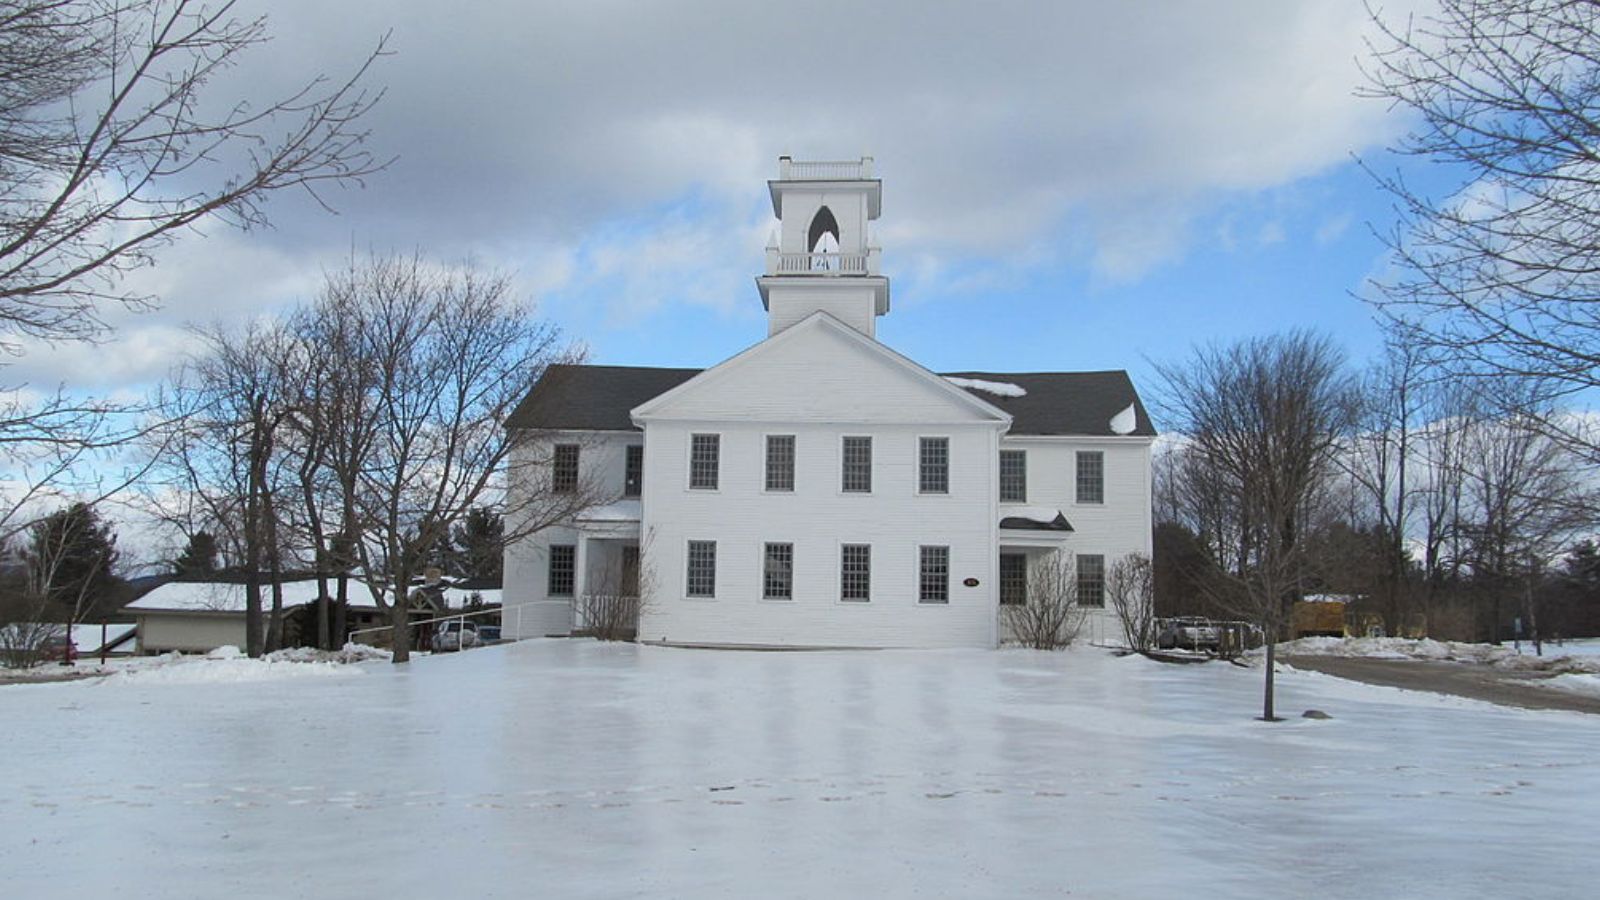
Home to Colby-Sawyer College and perched near Lake Sunapee, New London blends academic charm with natural beauty. The town’s appeal is rooted in its strong community feel, outdoor recreation opportunities, and well-maintained historic homes. It’s a popular destination for retirees and second-home buyers alike.
Its housing market is tight, with limited new development and high demand keeping prices elevated. The area’s strong performance in recent years reflects both regional interest in the Sunapee area and long-standing desirability among wealthier buyers looking for tranquility and scenic surroundings.
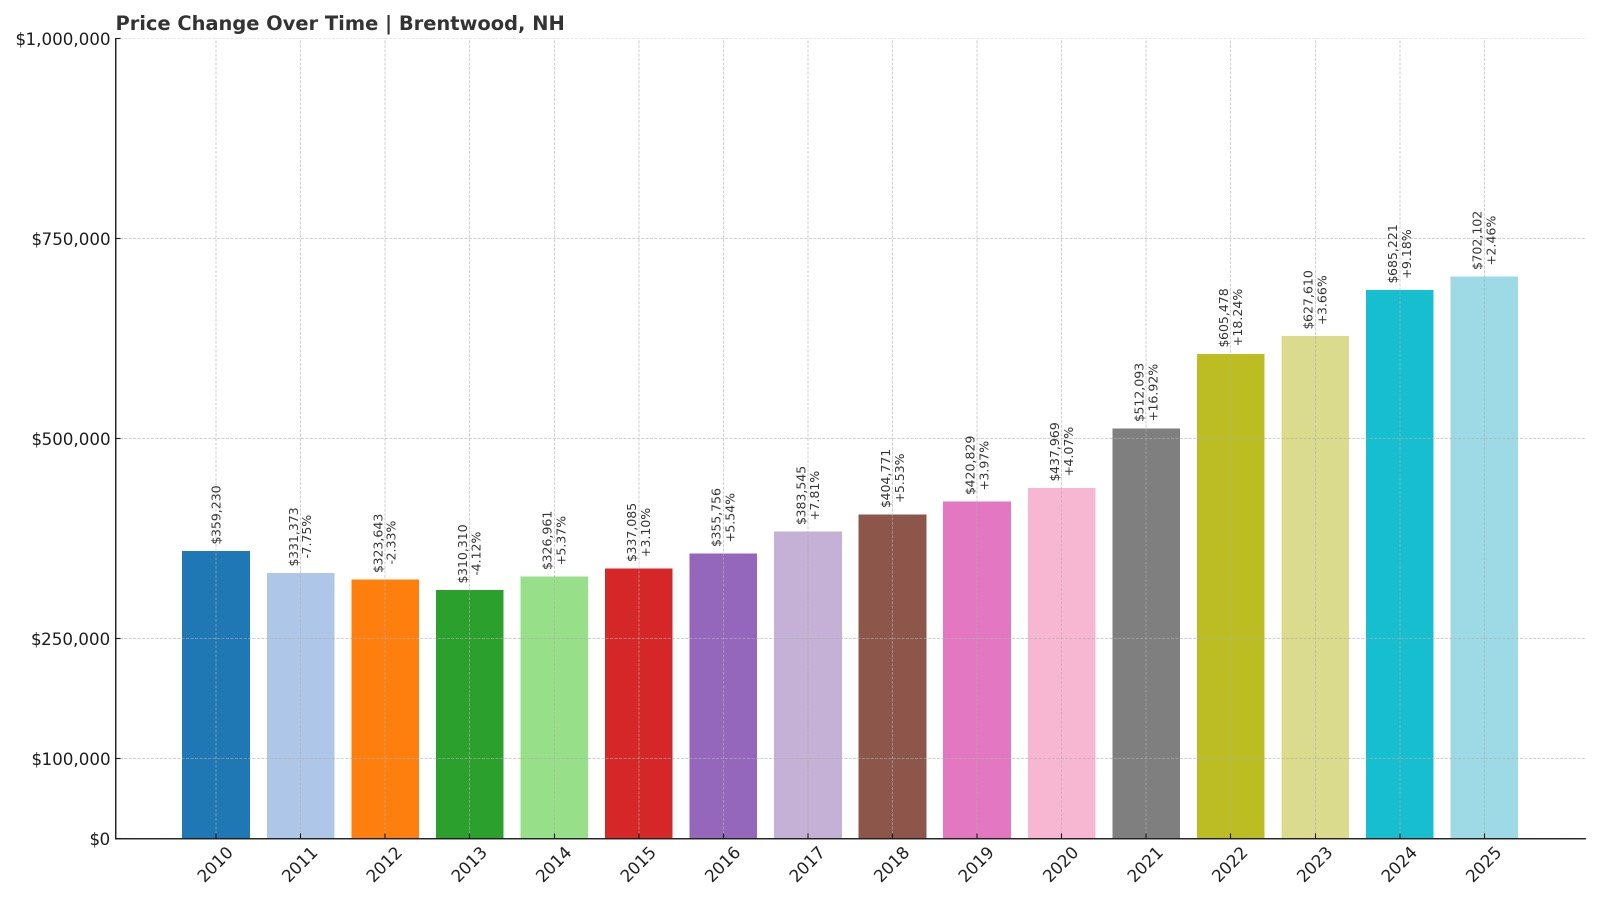
17. Brentwood – 96% Home Price Increase Since 2010
- 2010: $359,230
- 2011: $331,373 (-$27,857, -7.75% from previous year)
- 2012: $323,643 (-$7,731, -2.33% from previous year)
- 2013: $310,310 (-$13,333, -4.12% from previous year)
- 2014: $326,961 (+$16,651, +5.37% from previous year)
- 2015: $337,085 (+$10,124, +3.10% from previous year)
- 2016: $355,756 (+$18,672, +5.54% from previous year)
- 2017: $383,545 (+$27,788, +7.81% from previous year)
- 2018: $404,771 (+$21,226, +5.53% from previous year)
- 2019: $420,829 (+$16,058, +3.97% from previous year)
- 2020: $437,969 (+$17,139, +4.07% from previous year)
- 2021: $512,093 (+$74,124, +16.92% from previous year)
- 2022: $605,478 (+$93,385, +18.24% from previous year)
- 2023: $627,610 (+$22,132, +3.66% from previous year)
- 2024: $685,221 (+$57,610, +9.18% from previous year)
- 2025: $702,102 (+$16,881, +2.46% from previous year)
Brentwood’s housing market initially dipped in the early 2010s before recovering and accelerating dramatically in the last five years. Since 2020, the town has gained more than $260,000 in average home value, landing at just over $702K in 2025—a 96% increase since 2010.
Brentwood – From Rural Roots to Rising Demand
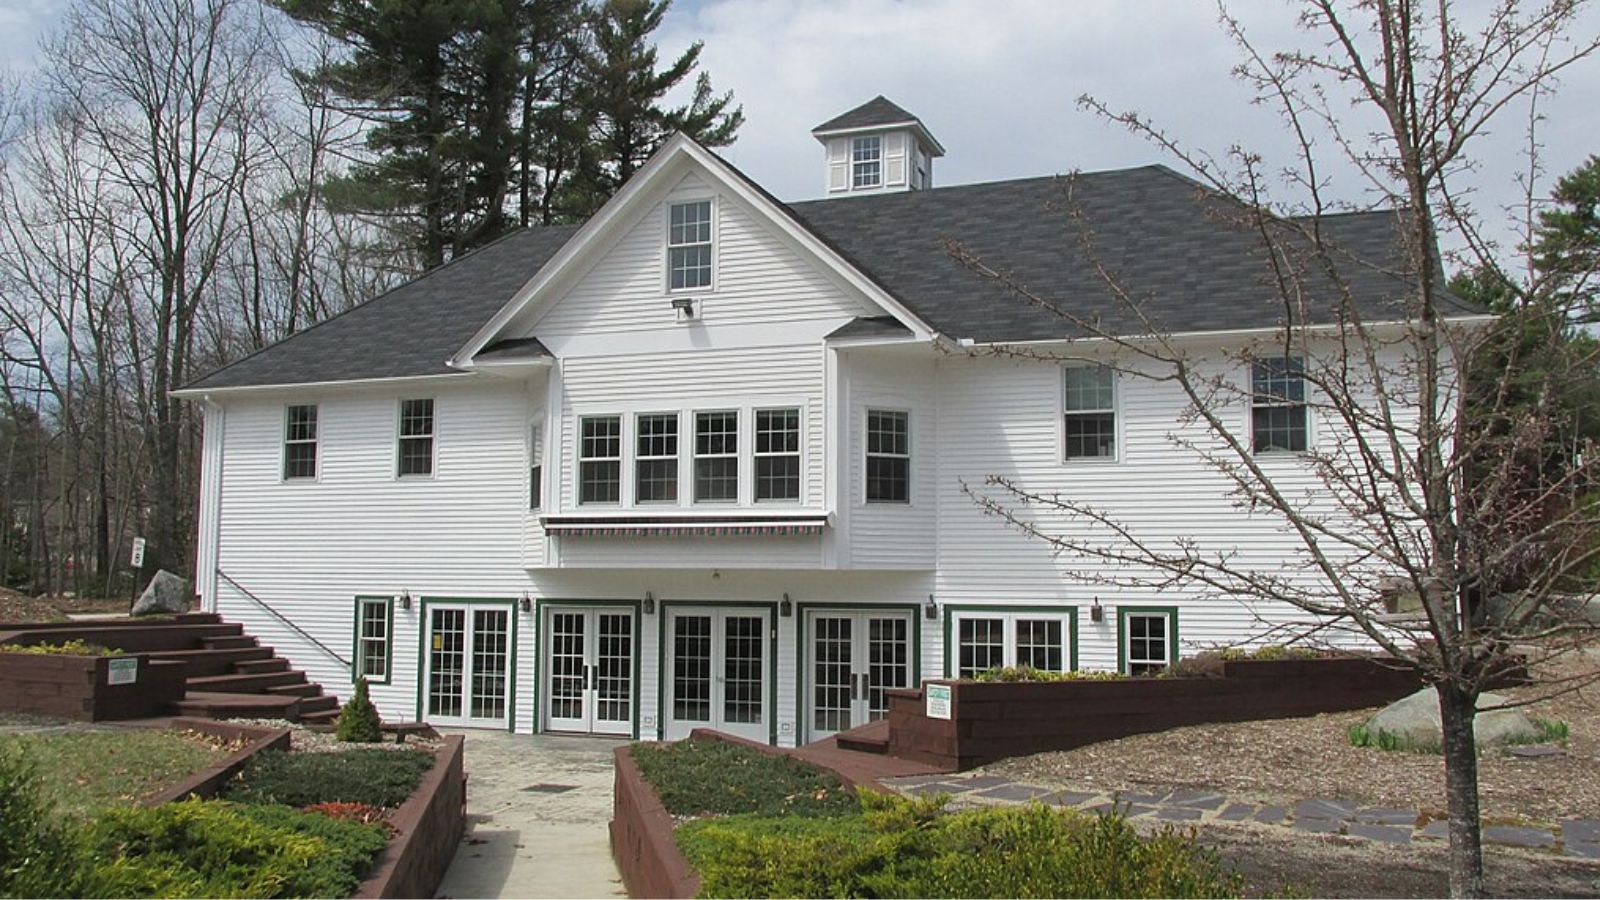
Located in Rockingham County, Brentwood has transitioned from a primarily rural town into one of New Hampshire’s more desirable suburban areas. With its proximity to Exeter and easy access to Route 101, it appeals to professionals commuting toward the Seacoast or Manchester while still enjoying a quieter, small-town lifestyle.
Brentwood’s growth has been shaped by limited inventory, attractive zoning, and high-performing schools. A flurry of buyer activity between 2020 and 2022 pushed home values upward rapidly. That momentum has held steady, with only modest gains in 2025, suggesting the market may be settling after a period of intense appreciation.
16. Auburn – 135% Home Price Increase Since 2010

🔥 Would you like to save this?
- 2010: $300,194
- 2011: $290,567 (-$9,627, -3.21% from previous year)
- 2012: $278,732 (-$11,834, -4.07% from previous year)
- 2013: $290,194 (+$11,462, +4.11% from previous year)
- 2014: $307,490 (+$17,296, +5.96% from previous year)
- 2015: $316,592 (+$9,101, +2.96% from previous year)
- 2016: $334,747 (+$18,156, +5.73% from previous year)
- 2017: $355,737 (+$20,990, +6.27% from previous year)
- 2018: $377,902 (+$22,165, +6.23% from previous year)
- 2019: $409,808 (+$31,906, +8.44% from previous year)
- 2020: $427,337 (+$17,529, +4.28% from previous year)
- 2021: $508,798 (+$81,461, +19.06% from previous year)
- 2022: $583,433 (+$74,635, +14.67% from previous year)
- 2023: $605,861 (+$22,428, +3.84% from previous year)
- 2024: $657,013 (+$51,152, +8.44% from previous year)
- 2025: $703,893 (+$46,880, +7.14% from previous year)
Home prices in Auburn have surged from just $300K in 2010 to more than $703K in 2025—a 135% rise. The biggest increases happened between 2020 and 2022, when home values jumped by more than $150,000 in just two years. Even after that, prices have continued to climb at a healthy pace.
Auburn – Natural Beauty Meets Growth
Situated near Lake Massabesic and just east of Manchester, Auburn offers both natural beauty and commuter convenience. The town’s quiet neighborhoods, wooded landscapes, and access to trails make it attractive to buyers seeking space and serenity within reach of city jobs.
With few commercial developments and a focus on preserving its rural character, Auburn has limited housing supply. That scarcity, paired with increasing demand for homes in quieter suburbs post-2020, explains the sharp price gains. Auburn has become a go-to option for buyers who want the best of both worlds: scenic living and access to the state’s economic hubs.
15. Stratham – 136% Home Price Increase Since 2010
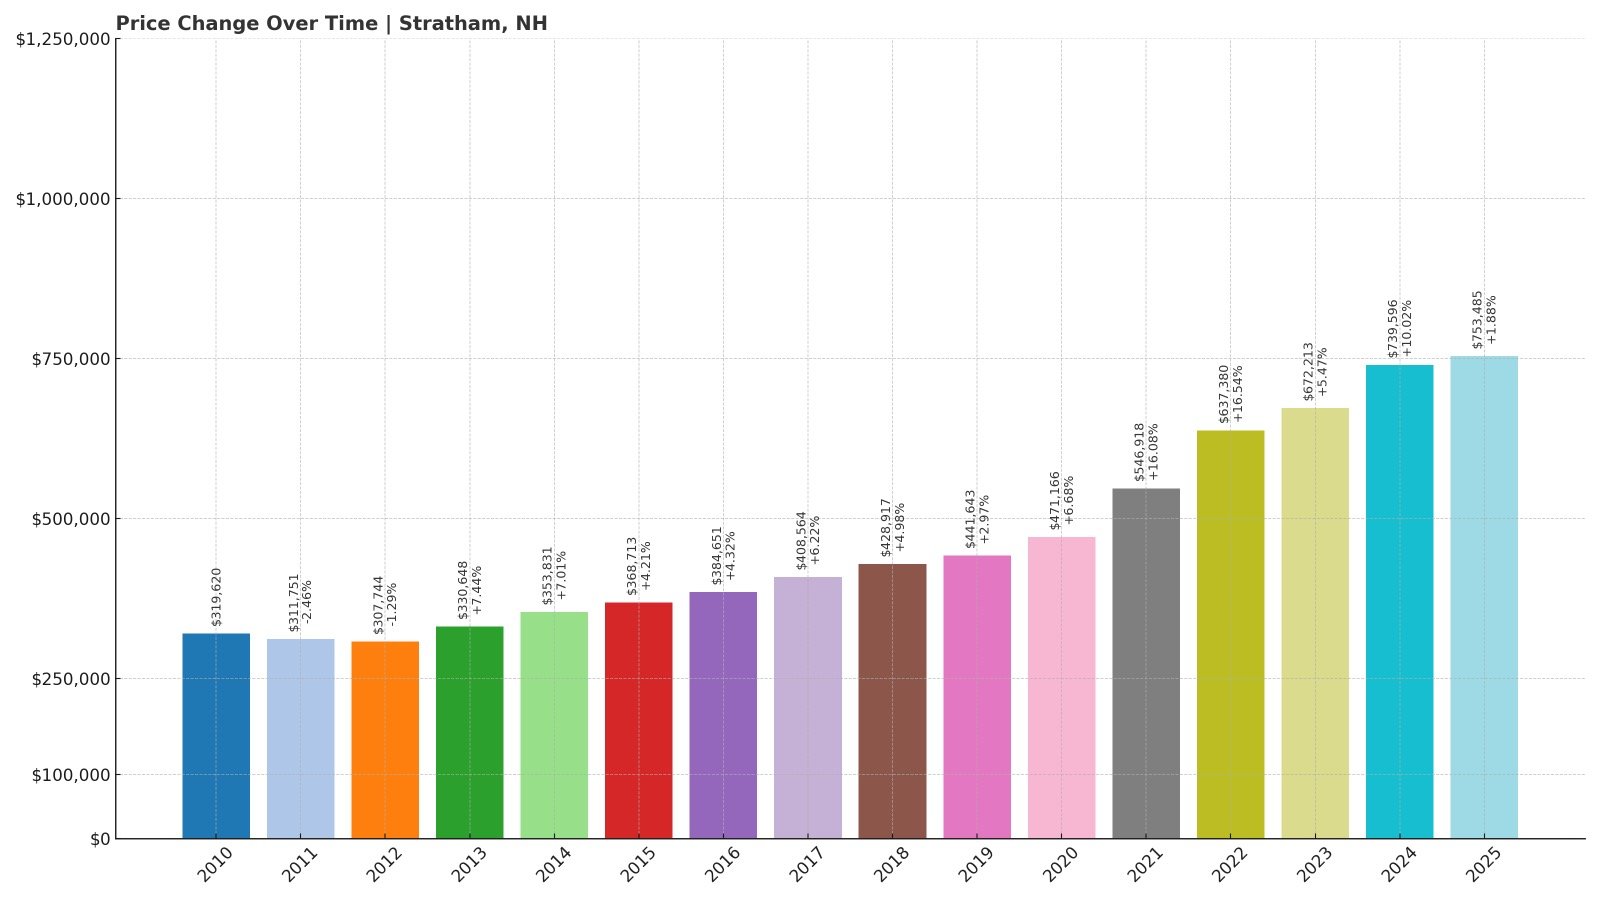
- 2010: $319,620
- 2011: $311,751 (-$7,869, -2.46% from previous year)
- 2012: $307,744 (-$4,007, -1.29% from previous year)
- 2013: $330,648 (+$22,904, +7.44% from previous year)
- 2014: $353,831 (+$23,183, +7.01% from previous year)
- 2015: $368,713 (+$14,882, +4.21% from previous year)
- 2016: $384,651 (+$15,938, +4.32% from previous year)
- 2017: $408,564 (+$23,913, +6.22% from previous year)
- 2018: $428,917 (+$20,353, +4.98% from previous year)
- 2019: $441,643 (+$12,725, +2.97% from previous year)
- 2020: $471,166 (+$29,523, +6.68% from previous year)
- 2021: $546,918 (+$75,753, +16.08% from previous year)
- 2022: $637,380 (+$90,462, +16.54% from previous year)
- 2023: $672,213 (+$34,833, +5.47% from previous year)
- 2024: $739,596 (+$67,383, +10.02% from previous year)
- 2025: $753,485 (+$13,889, +1.88% from previous year)
Stratham’s home prices have risen from about $320K in 2010 to over $753K in 2025, marking a 136% increase. The growth has been steady with noticeable acceleration after 2020, including double-digit gains in 2021, 2022, and 2024.
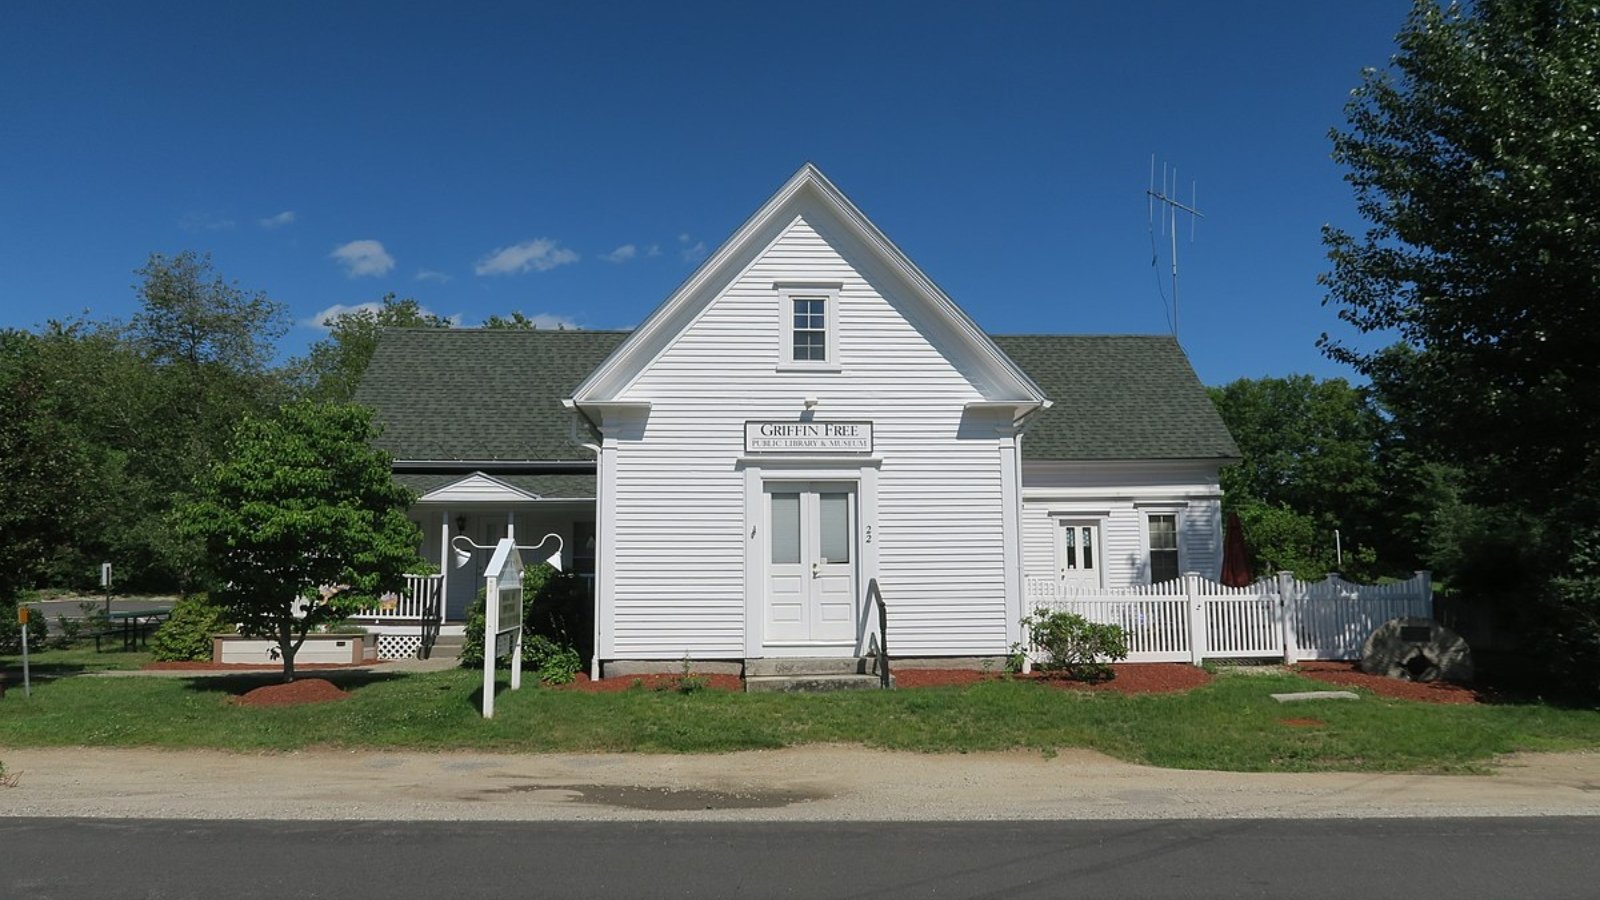
Stratham – Seacoast Convenience with a Suburban Feel
Just a short drive from Portsmouth and Exeter, Stratham offers an upscale suburban lifestyle with easy access to New Hampshire’s Seacoast. It’s a popular location for professionals and families who want to be close to the coast without the density or price tags of oceanfront towns.
The town’s strong schools, open spaces, and newer housing stock have kept it on buyers’ radar for years. Its steady price appreciation reflects both its enduring appeal and the broader boom in southern New Hampshire real estate. Even as the pace of growth has slowed slightly in 2025, Stratham remains one of the region’s most consistently desirable places to live.
14. Bedford – 111% Home Price Increase Since 2010
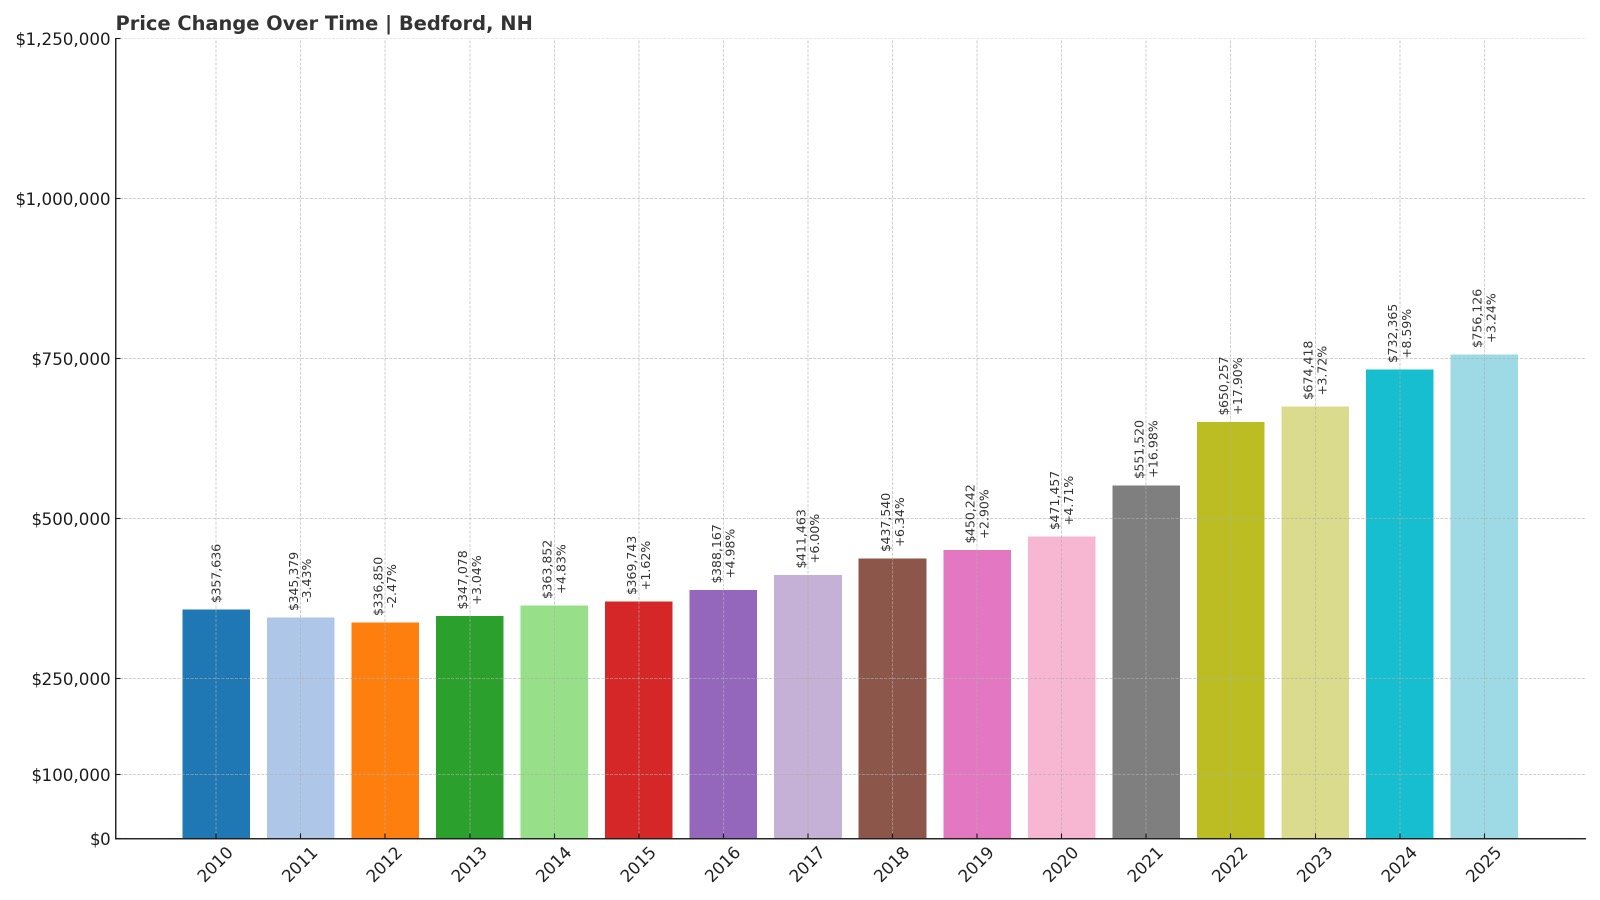
- 2010: $357,636
- 2011: $345,379 (-$12,257, -3.43% from previous year)
- 2012: $336,850 (-$8,529, -2.47% from previous year)
- 2013: $347,078 (+$10,229, +3.04% from previous year)
- 2014: $363,852 (+$16,774, +4.83% from previous year)
- 2015: $369,743 (+$5,891, +1.62% from previous year)
- 2016: $388,167 (+$18,425, +4.98% from previous year)
- 2017: $411,463 (+$23,295, +6.00% from previous year)
- 2018: $437,540 (+$26,077, +6.34% from previous year)
- 2019: $450,242 (+$12,702, +2.90% from previous year)
- 2020: $471,457 (+$21,216, +4.71% from previous year)
- 2021: $551,520 (+$80,062, +16.98% from previous year)
- 2022: $650,257 (+$98,737, +17.90% from previous year)
- 2023: $674,418 (+$24,161, +3.72% from previous year)
- 2024: $732,365 (+$57,947, +8.59% from previous year)
- 2025: $756,126 (+$23,761, +3.24% from previous year)
Bedford’s home prices have risen steadily since 2010, with particularly sharp increases in the early 2020s. The town’s average home value now exceeds $756K—more than double its 2010 level.
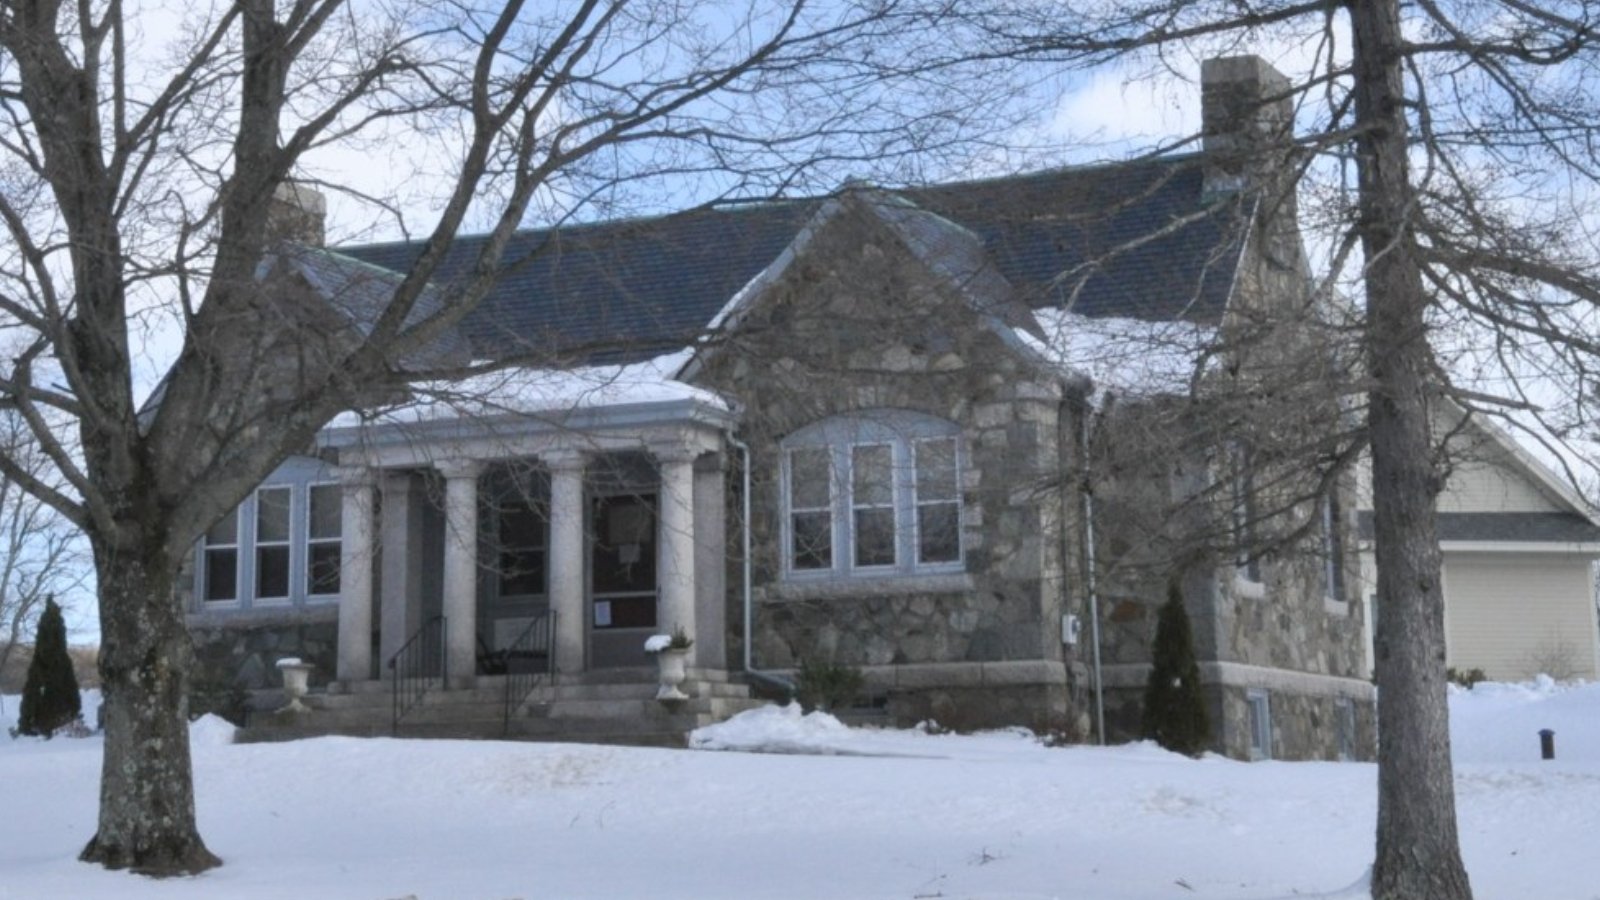
Bedford – A Suburban Stronghold Near Manchester
Bedford sits just west of Manchester and serves as one of the region’s most desirable commuter towns. Known for its large, modern homes and top-ranked school district, it has long attracted families seeking more space and amenities.
The town saw explosive growth between 2020 and 2022, with prices rising nearly $180,000 in just two years. While the pace of gains has slowed slightly, the town’s reputation for livability and its well-developed infrastructure keep it at the top of many buyers’ lists in southern New Hampshire.
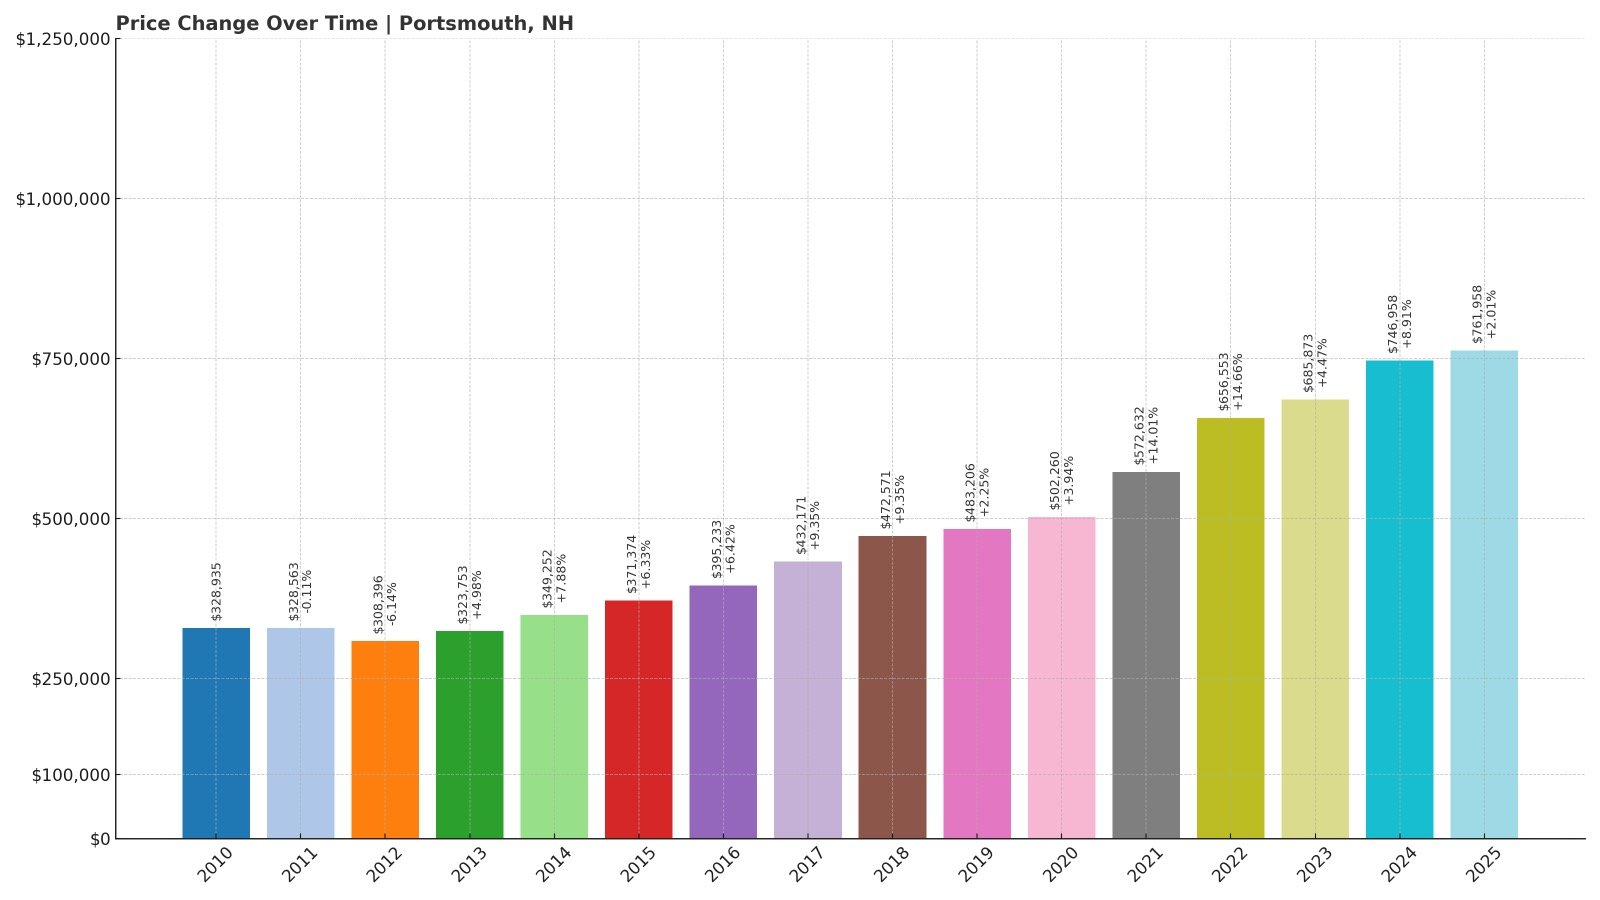
13. Portsmouth – 132% Home Price Increase Since 2010
- 2010: $328,935
- 2011: $328,563 (-$372, -0.11% from previous year)
- 2012: $308,396 (-$20,167, -6.14% from previous year)
- 2013: $323,753 (+$15,357, +4.98% from previous year)
- 2014: $349,252 (+$25,499, +7.88% from previous year)
- 2015: $371,374 (+$22,122, +6.33% from previous year)
- 2016: $395,233 (+$23,859, +6.42% from previous year)
- 2017: $432,171 (+$36,938, +9.35% from previous year)
- 2018: $472,571 (+$40,400, +9.35% from previous year)
- 2019: $483,206 (+$10,635, +2.25% from previous year)
- 2020: $502,260 (+$19,054, +3.94% from previous year)
- 2021: $572,632 (+$70,372, +14.01% from previous year)
- 2022: $656,553 (+$83,920, +14.66% from previous year)
- 2023: $685,873 (+$29,320, +4.47% from previous year)
- 2024: $746,958 (+$61,085, +8.91% from previous year)
- 2025: $761,958 (+$15,001, +2.01% from previous year)
Portsmouth’s housing market has exploded over the last decade and a half, with prices more than doubling since 2010. The town’s average home now costs nearly $762,000, with rapid appreciation between 2020 and 2022.
Portsmouth – Coastal Hub with Historic Appeal
As a bustling coastal city with deep historical roots, Portsmouth is one of New Hampshire’s most vibrant and expensive places to live. Its walkable downtown, thriving restaurant scene, and proximity to the ocean draw residents from across the region and beyond.
Demand for housing in Portsmouth has remained high despite rising prices, in part because it serves both as a cultural hub and a key employment center. With limited space for expansion, housing supply is tight, keeping upward pressure on home values. Even modest gains in 2025 reflect strong ongoing interest in this iconic Seacoast town.
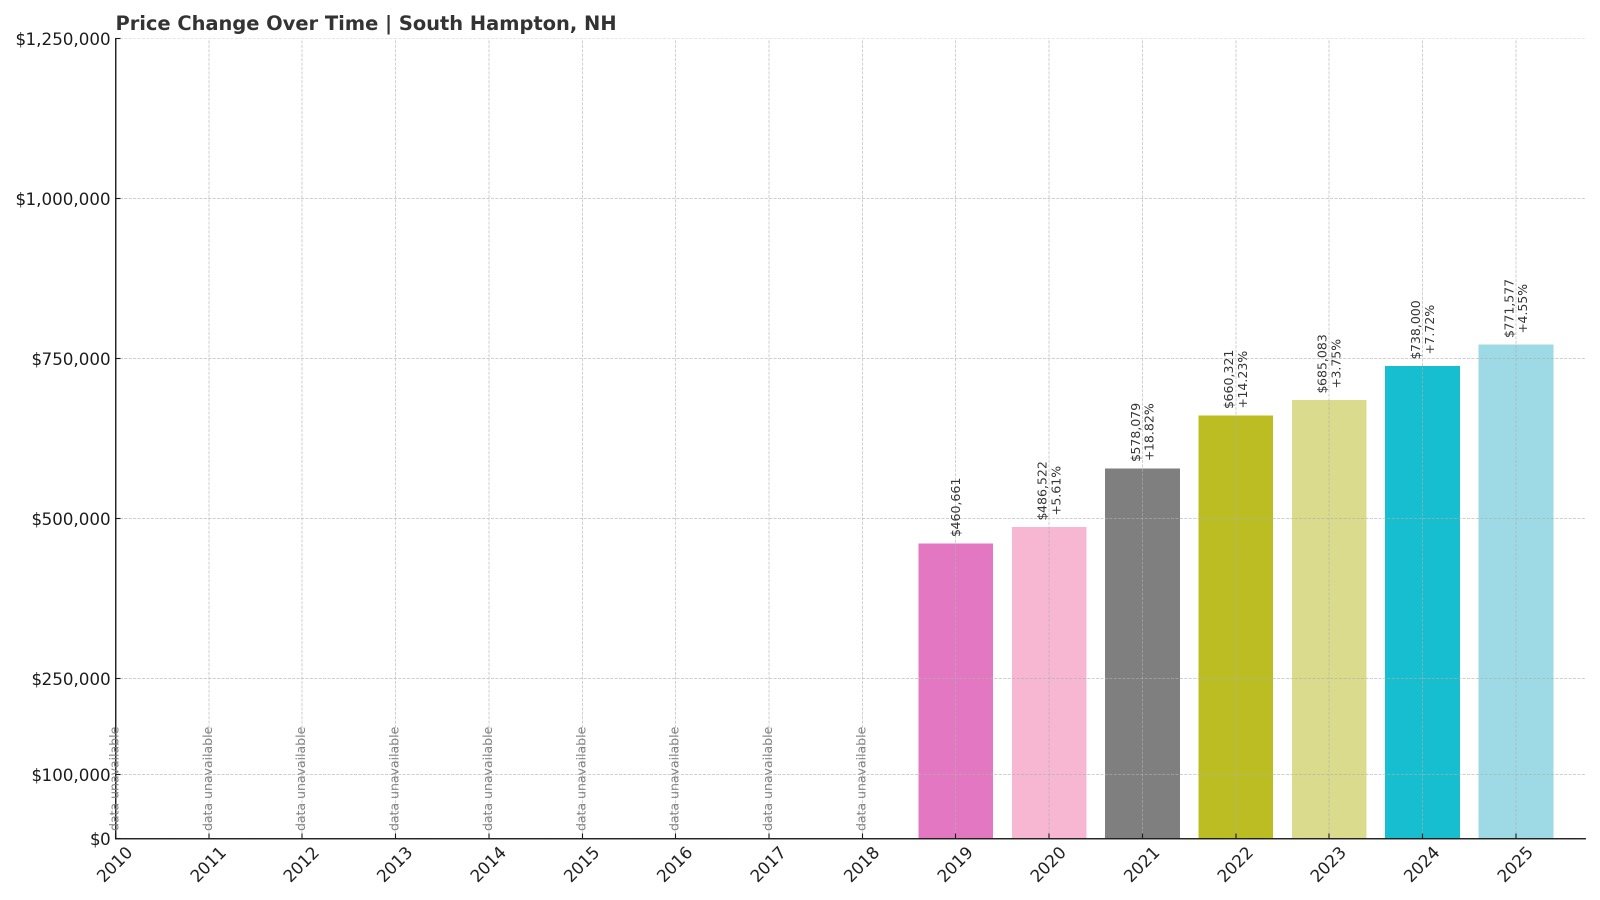
12. South Hampton – 68% Home Price Increase Since 2019
- 2010: N/A
- 2011: N/A
- 2012: N/A
- 2013: N/A
- 2014: N/A
- 2015: N/A
- 2016: N/A
- 2017: N/A
- 2018: N/A
- 2019: $460,661
- 2020: $486,522 (+$25,860, +5.61% from previous year)
- 2021: $578,079 (+$91,558, +18.82% from previous year)
- 2022: $660,321 (+$82,241, +14.23% from previous year)
- 2023: $685,083 (+$24,762, +3.75% from previous year)
- 2024: $738,000 (+$52,917, +7.72% from previous year)
- 2025: $771,577 (+$33,577, +4.55% from previous year)
With Zillow data starting in 2019, South Hampton has seen home values rise from $460,661 to $771,577 in just six years—a 68% increase. The most dramatic gains occurred in 2021 and 2022, when values jumped by more than $170,000 combined.
South Hampton – Quiet Country Setting, Serious Growth
South Hampton lies on the southeastern border of the state, just north of Amesbury, Massachusetts. Despite its small size and rural feel, it’s become an appealing spot for buyers looking for quiet surroundings and large properties near the coast and Massachusetts border.
Limited housing stock and proximity to Route 95 contribute to South Hampton’s value. As other nearby towns have grown more expensive, demand has trickled into this quiet corner of New Hampshire. With consistent gains year after year, South Hampton has quietly become one of the state’s most expensive markets.
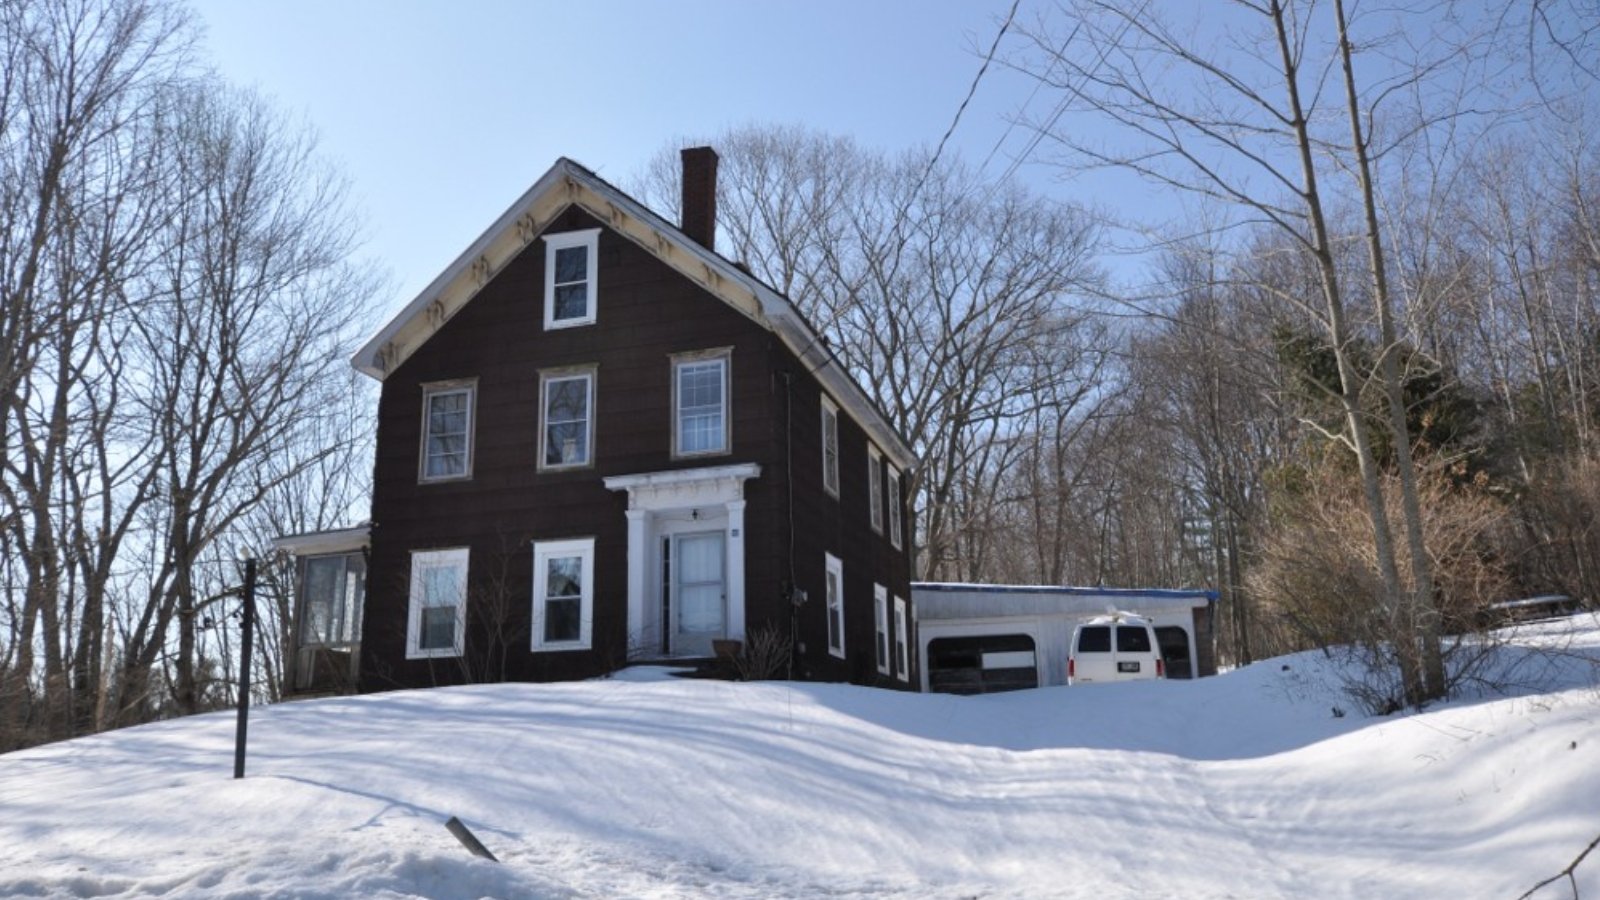
11. Kensington – 112% Home Price Increase Since 2010
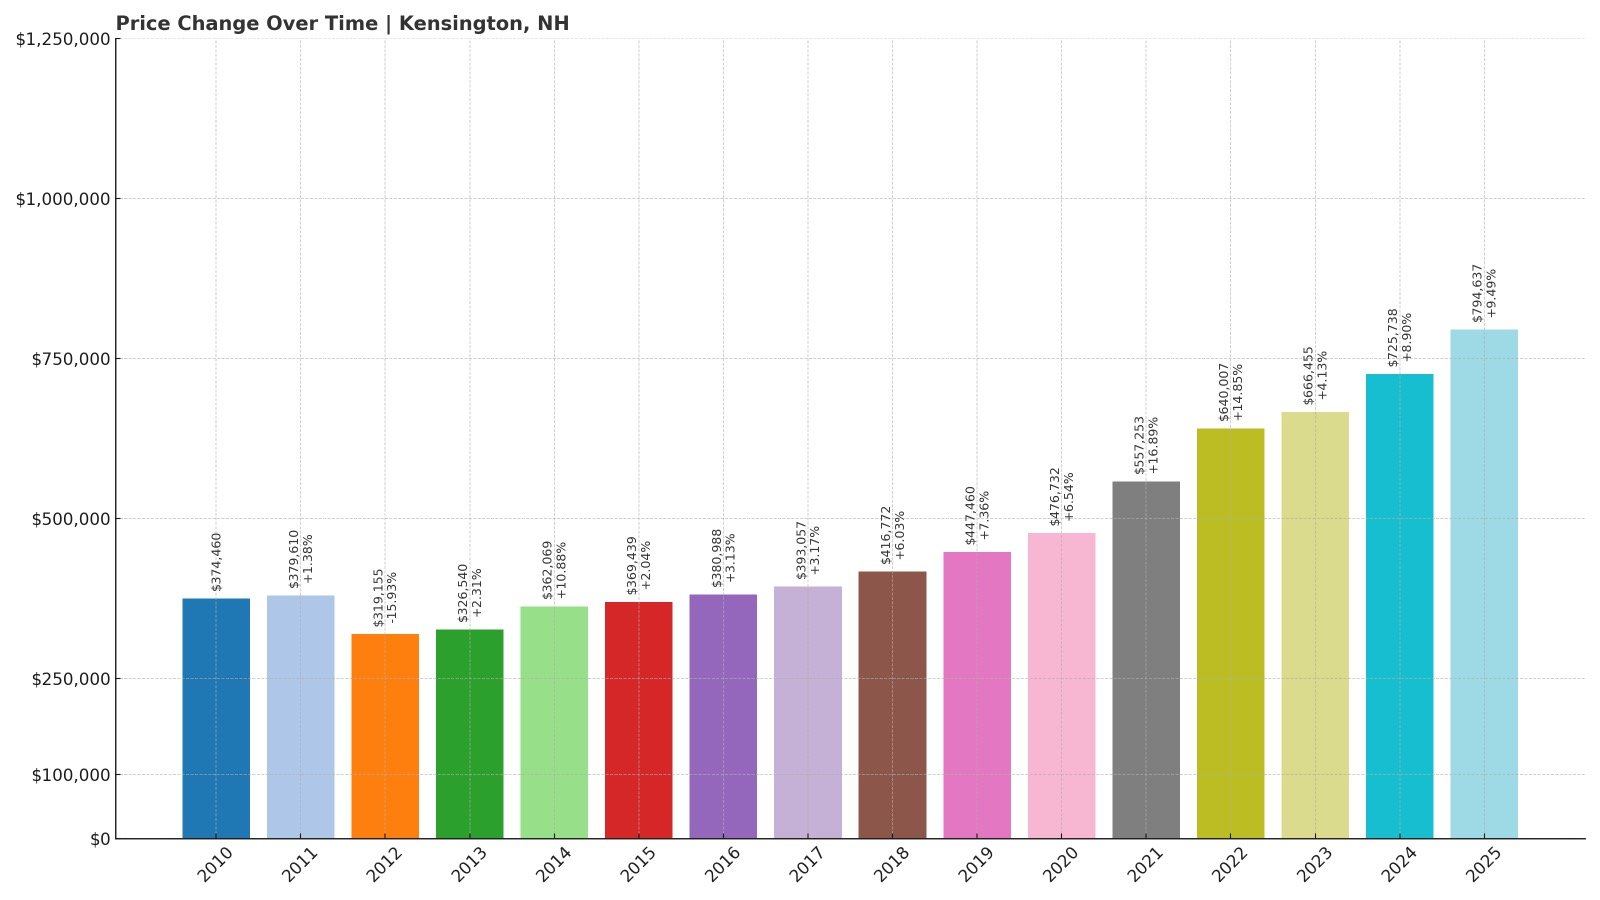
- 2010: $374,460
- 2011: $379,610 (+$5,150, +1.38% from previous year)
- 2012: $319,155 (-$60,455, -15.93% from previous year)
- 2013: $326,540 (+$7,385, +2.31% from previous year)
- 2014: $362,069 (+$35,530, +10.88% from previous year)
- 2015: $369,439 (+$7,369, +2.04% from previous year)
- 2016: $380,988 (+$11,549, +3.13% from previous year)
- 2017: $393,057 (+$12,069, +3.17% from previous year)
- 2018: $416,772 (+$23,715, +6.03% from previous year)
- 2019: $447,460 (+$30,688, +7.36% from previous year)
- 2020: $476,732 (+$29,272, +6.54% from previous year)
- 2021: $557,253 (+$80,521, +16.89% from previous year)
- 2022: $640,007 (+$82,754, +14.85% from previous year)
- 2023: $666,455 (+$26,448, +4.13% from previous year)
- 2024: $725,738 (+$59,283, +8.90% from previous year)
- 2025: $794,637 (+$68,899, +9.49% from previous year)
Kensington’s market experienced a significant correction in 2012, but since then, it has rebounded with impressive strength. Home prices have more than doubled, from $374K in 2010 to nearly $795K in 2025. The last five years alone have brought rapid and sustained growth.
Kensington – A Small Town with Big Price Jumps
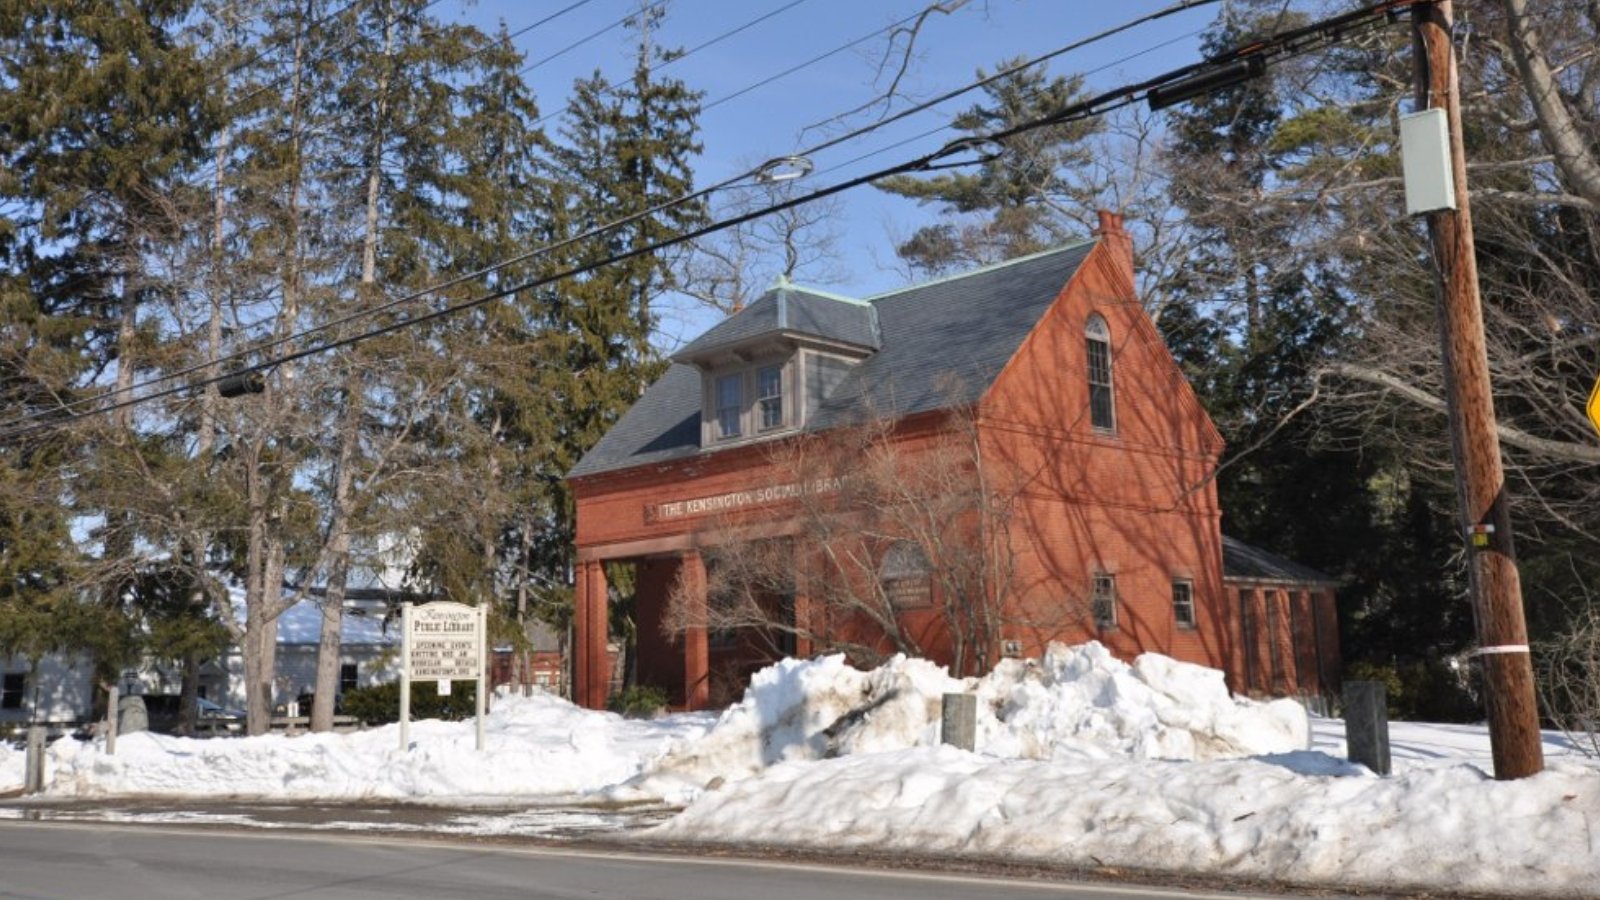
Situated near Exeter and less than 10 miles from the Massachusetts line, Kensington is a rural town with a strong residential character. It’s known for its farmland, open space, and well-preserved colonial charm, making it attractive to buyers seeking privacy and charm over density and development.
Despite its small population, Kensington has seen consistent demand from higher-income buyers who value space and proximity to both the coast and Boston-area employment. Limited turnover and large lot sizes add to its exclusivity, and recent price increases suggest demand remains high.
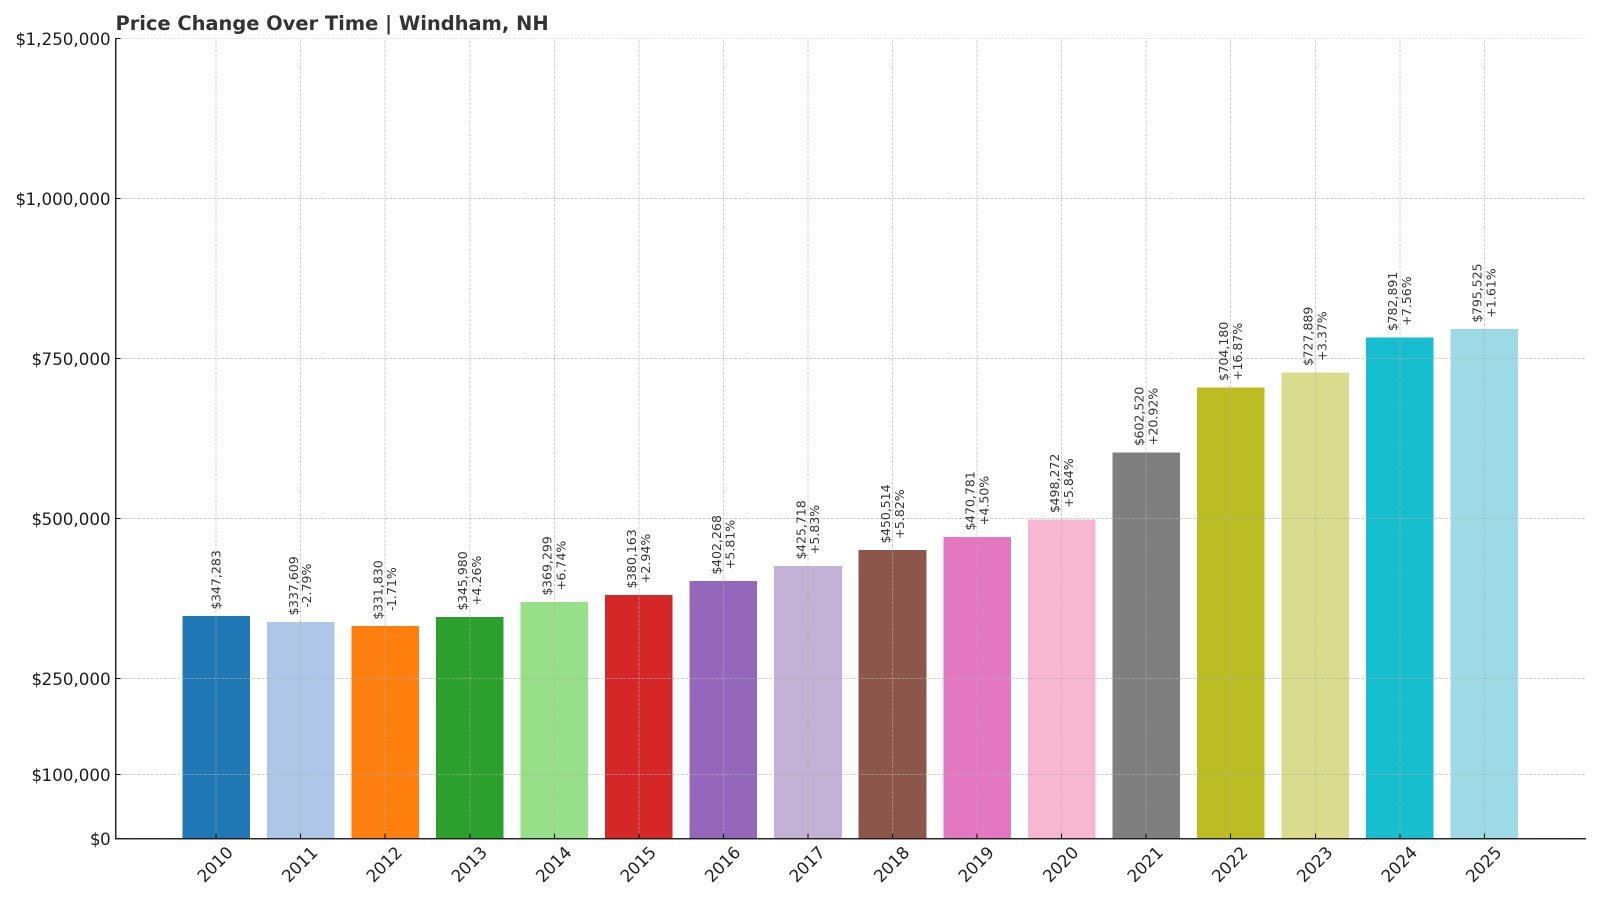
10. Windham – 129% Home Price Increase Since 2010
🔥 Would you like to save this?
- 2010: $347,283
- 2011: $337,609 (-$9,675, -2.79% from previous year)
- 2012: $331,830 (-$5,779, -1.71% from previous year)
- 2013: $345,980 (+$14,150, +4.26% from previous year)
- 2014: $369,299 (+$23,319, +6.74% from previous year)
- 2015: $380,163 (+$10,864, +2.94% from previous year)
- 2016: $402,268 (+$22,104, +5.81% from previous year)
- 2017: $425,718 (+$23,451, +5.83% from previous year)
- 2018: $450,514 (+$24,795, +5.82% from previous year)
- 2019: $470,781 (+$20,268, +4.50% from previous year)
- 2020: $498,272 (+$27,491, +5.84% from previous year)
- 2021: $602,520 (+$104,248, +20.92% from previous year)
- 2022: $704,180 (+$101,660, +16.87% from previous year)
- 2023: $727,889 (+$23,709, +3.37% from previous year)
- 2024: $782,891 (+$55,002, +7.56% from previous year)
- 2025: $795,525 (+$12,634, +1.61% from previous year)
Windham’s housing market has been one of the most consistent in southern New Hampshire, with nearly every year posting gains. Prices have increased 129% since 2010, and the town now averages nearly $796,000 per home. The biggest spikes occurred in 2021 and 2022, as pandemic-fueled demand surged.
Windham – Consistent Climber Near the Massachusetts Line
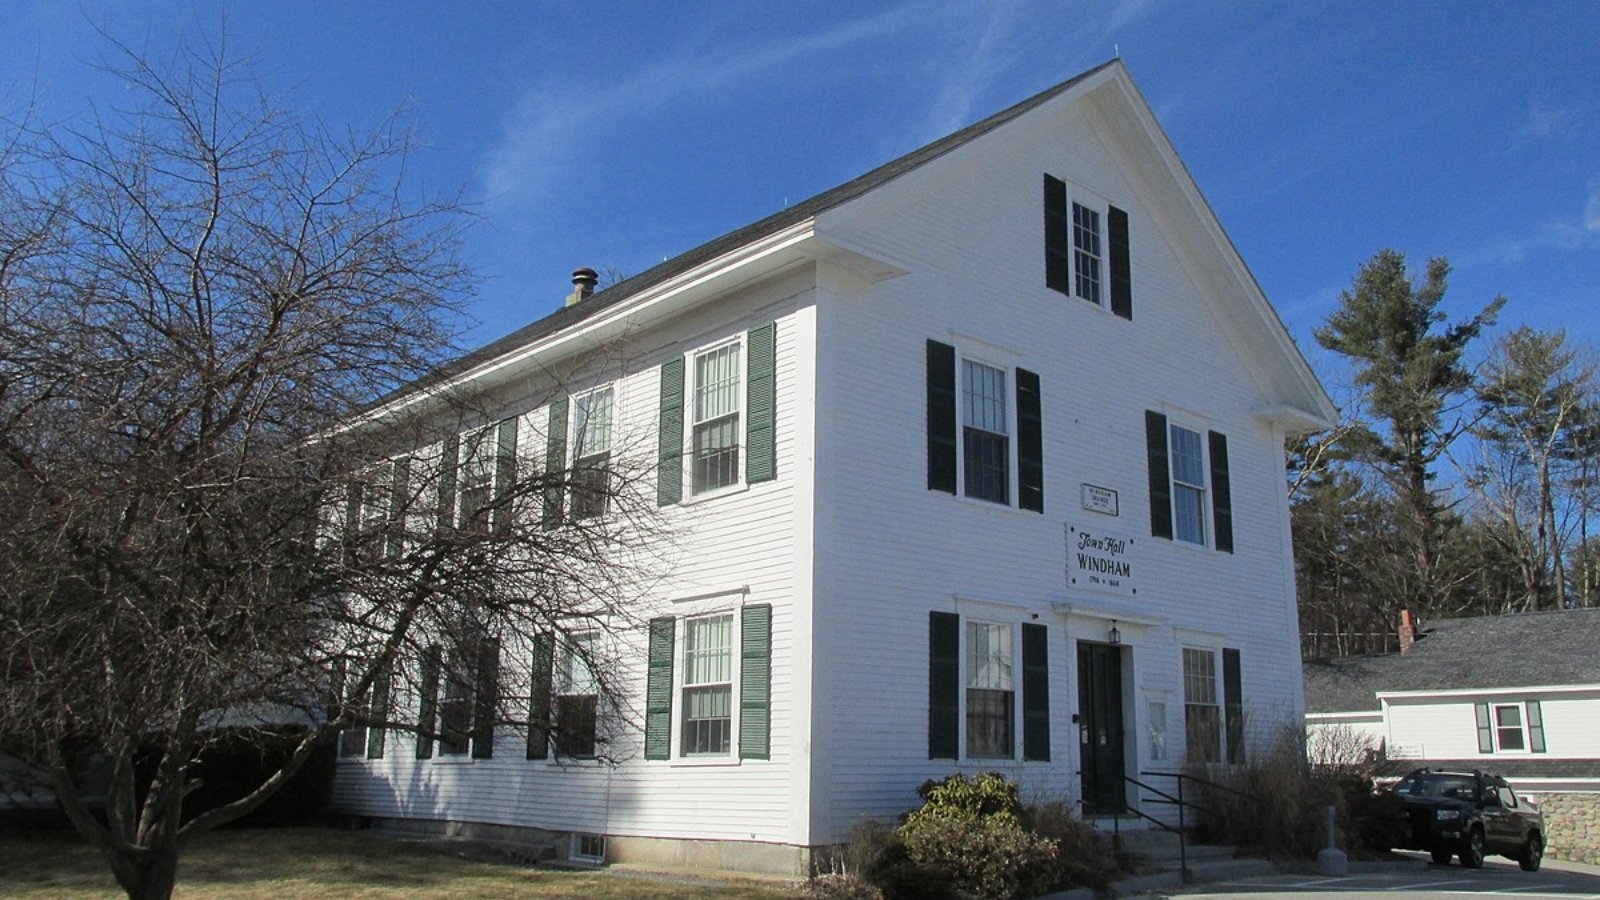
Located just north of Salem, Windham has long been a favorite for commuters who work in Massachusetts but prefer New Hampshire’s tax advantages and suburban quality of life. The town features modern subdivisions, high-rated schools, and quick access to I-93.
Recent years have seen demand spike due to its strategic location and limited inventory. Newer construction and amenities like Griffin Park and the Windham Rail Trail make the area attractive for families, while its proximity to Boston ensures continued pressure on housing prices.
9. Hollis – 57% Home Price Increase Since 2010
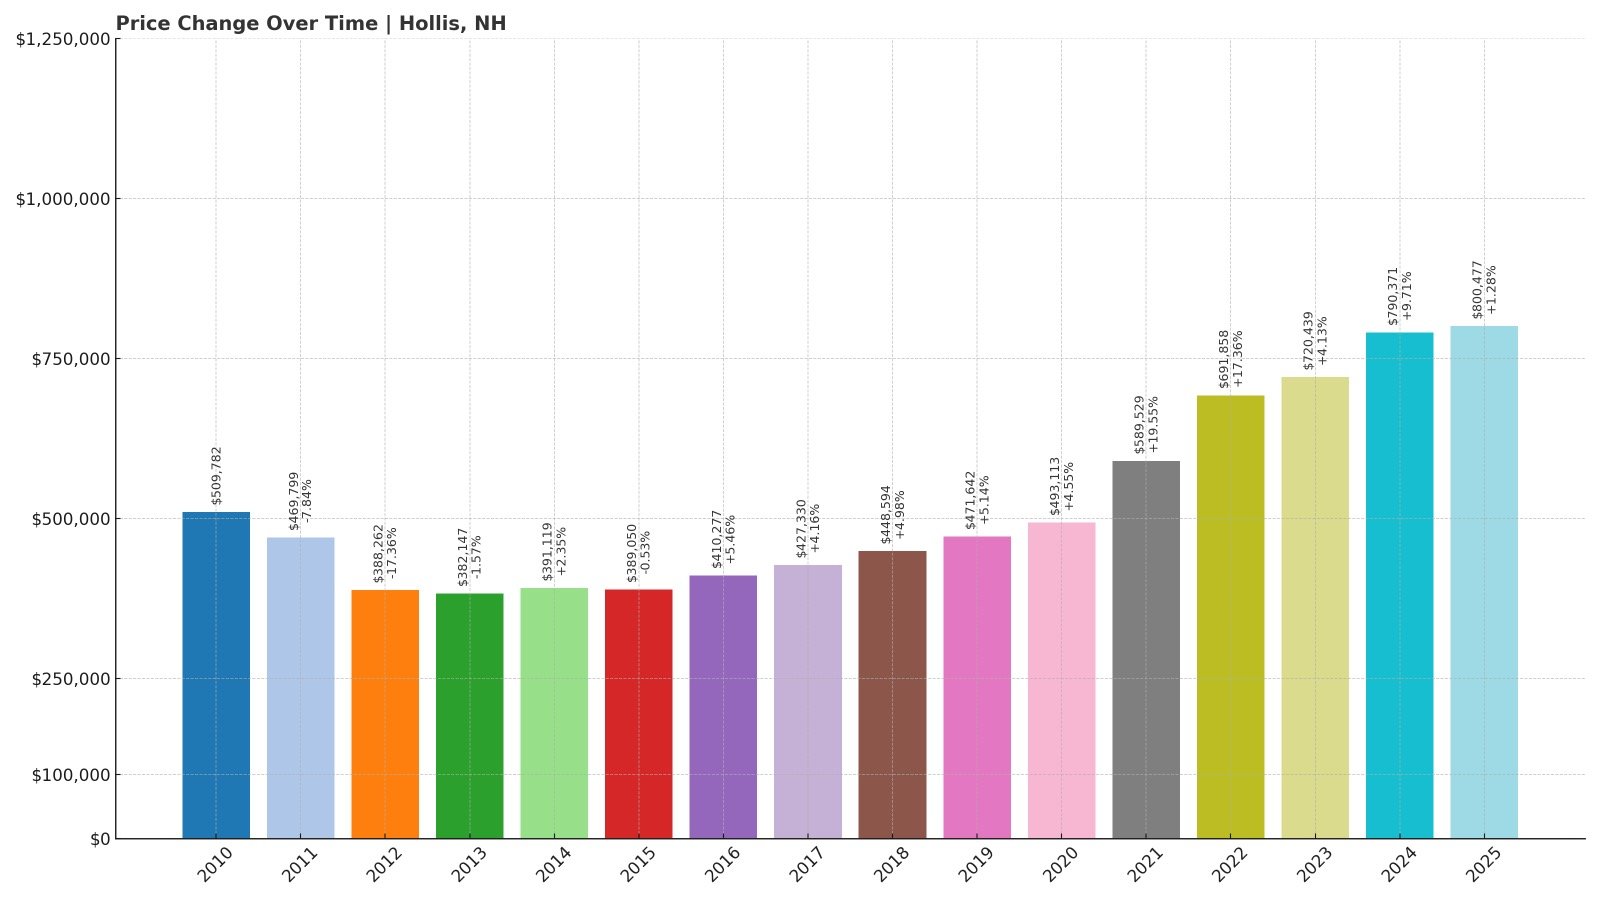
- 2010: $509,782
- 2011: $469,799 (-$39,983, -7.84% from previous year)
- 2012: $388,262 (-$81,537, -17.36% from previous year)
- 2013: $382,147 (-$6,114, -1.57% from previous year)
- 2014: $391,119 (+$8,971, +2.35% from previous year)
- 2015: $389,050 (-$2,069, -0.53% from previous year)
- 2016: $410,277 (+$21,227, +5.46% from previous year)
- 2017: $427,330 (+$17,053, +4.16% from previous year)
- 2018: $448,594 (+$21,264, +4.98% from previous year)
- 2019: $471,642 (+$23,049, +5.14% from previous year)
- 2020: $493,113 (+$21,471, +4.55% from previous year)
- 2021: $589,529 (+$96,416, +19.55% from previous year)
- 2022: $691,858 (+$102,329, +17.36% from previous year)
- 2023: $720,439 (+$28,581, +4.13% from previous year)
- 2024: $790,371 (+$69,933, +9.71% from previous year)
- 2025: $800,477 (+$10,106, +1.28% from previous year)
Hollis saw steep declines from 2010 to 2013, with home values falling by over 25%. But since then, it’s been on a strong upward trajectory. With a current average price above $800K, Hollis is now one of New Hampshire’s most expensive towns—up 57% since 2010 despite the rocky start.
Hollis – Resurgence in a Classic New England Town
Hollis is known for its preserved farmland, strong public schools, and classic New England atmosphere. Located west of Nashua and near the Massachusetts border, the town appeals to buyers looking for both elegance and elbow room.
The turnaround in home values reflects rising interest in small-town living with access to major metro areas. Hollis has become increasingly sought-after by Boston-area professionals and remote workers who appreciate its charm, space, and relative seclusion.
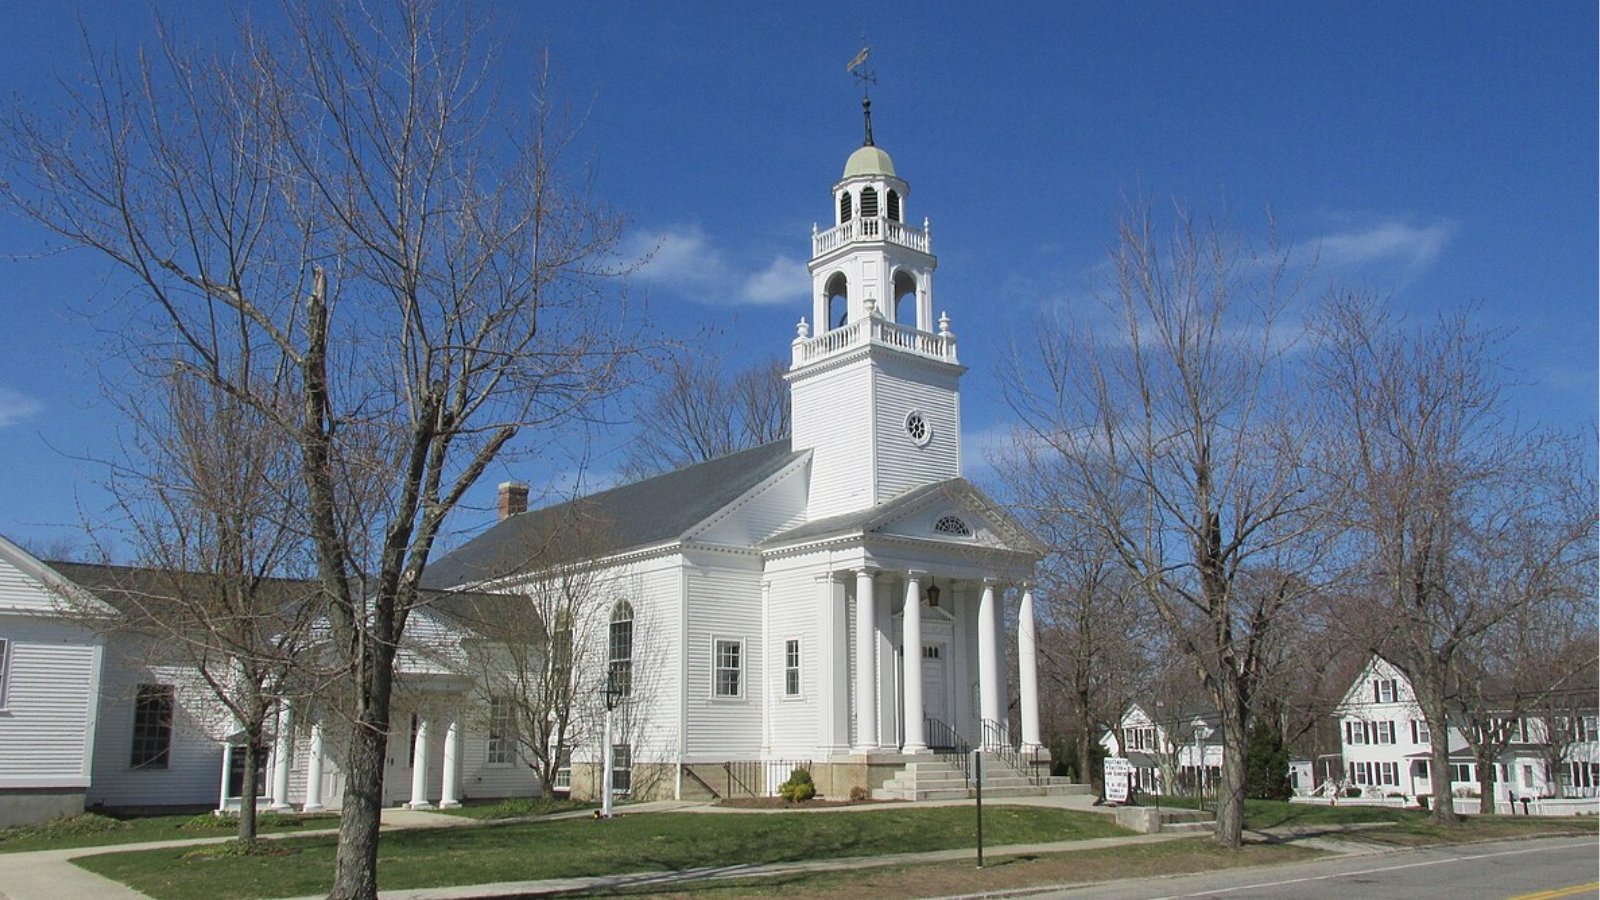
8. Greenland – 137% Home Price Increase Since 2010
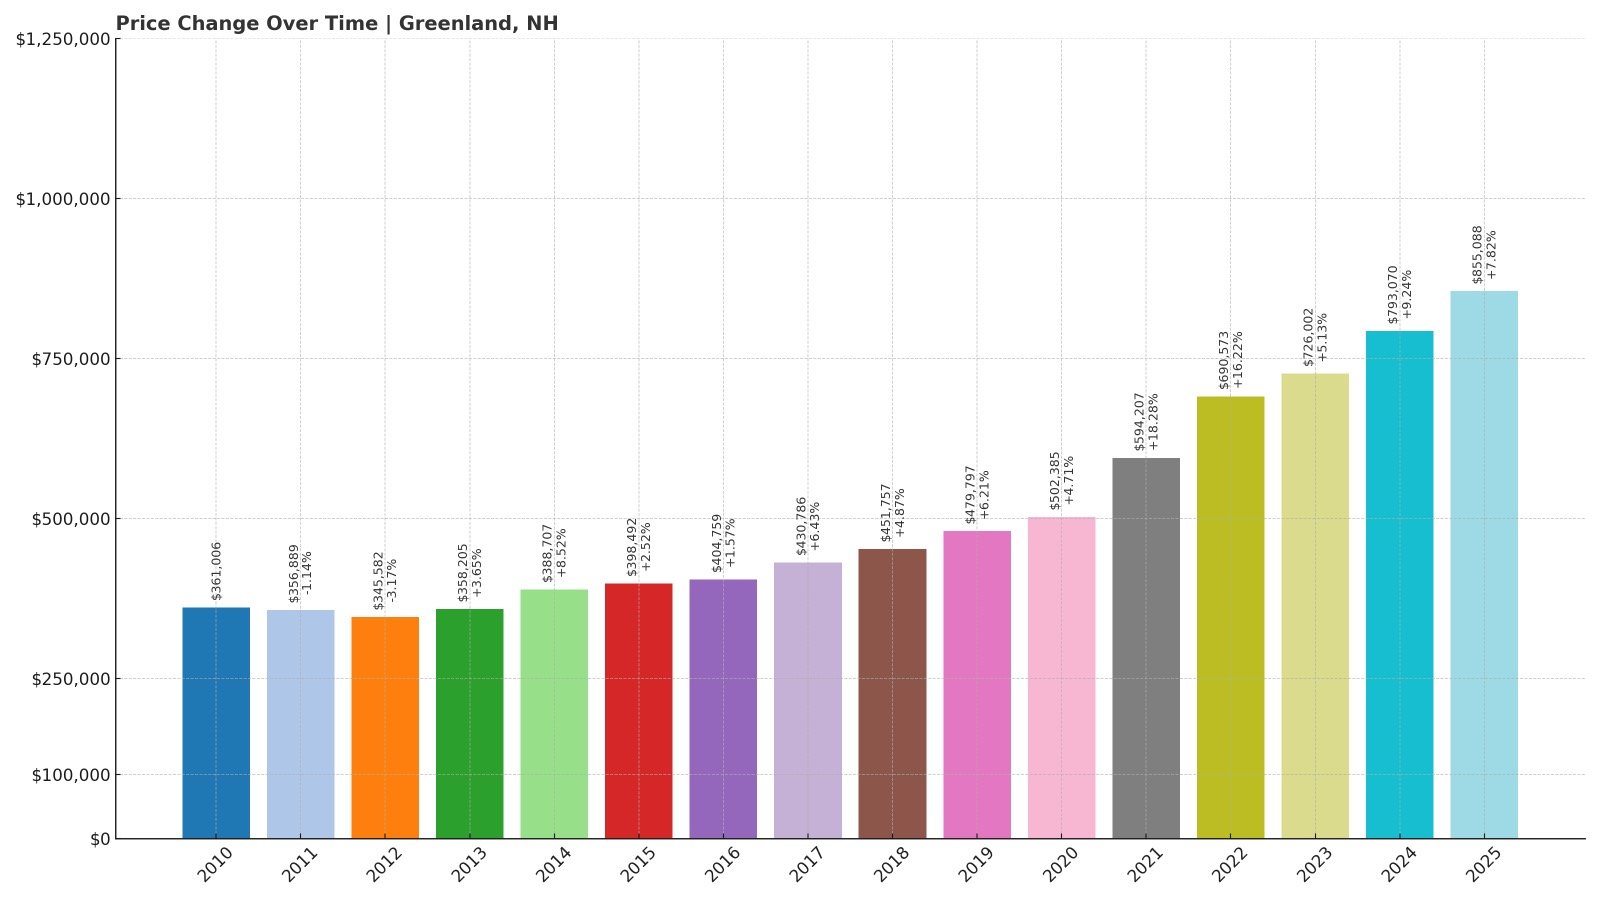
- 2010: $361,006
- 2011: $356,889 (-$4,117, -1.14% from previous year)
- 2012: $345,582 (-$11,306, -3.17% from previous year)
- 2013: $358,205 (+$12,622, +3.65% from previous year)
- 2014: $388,707 (+$30,503, +8.52% from previous year)
- 2015: $398,492 (+$9,785, +2.52% from previous year)
- 2016: $404,759 (+$6,267, +1.57% from previous year)
- 2017: $430,786 (+$26,026, +6.43% from previous year)
- 2018: $451,757 (+$20,971, +4.87% from previous year)
- 2019: $479,797 (+$28,040, +6.21% from previous year)
- 2020: $502,385 (+$22,588, +4.71% from previous year)
- 2021: $594,207 (+$91,822, +18.28% from previous year)
- 2022: $690,573 (+$96,366, +16.22% from previous year)
- 2023: $726,002 (+$35,429, +5.13% from previous year)
- 2024: $793,070 (+$67,068, +9.24% from previous year)
- 2025: $855,088 (+$62,018, +7.82% from previous year)
Greenland’s home values have more than doubled since 2010, climbing from $361K to over $855K in 2025. While early gains were steady, the last five years have seen explosive growth, including back-to-back double-digit jumps in 2021 and 2022.
Greenland – Quiet Elegance on the Seacoast
Just a few miles inland from Portsmouth, Greenland offers the charm of Seacoast living without the bustle of the city. It’s a small, residential town with a high quality of life and proximity to the ocean, golf courses, and Route 95. The Portsmouth Country Club and Great Bay National Wildlife Refuge are nearby draws that enhance its appeal.
Greenland’s housing market has surged as buyers seek access to the Seacoast’s amenities in a more tranquil setting. With limited land for development and growing demand from out-of-state buyers, home values have climbed fast—especially since the pandemic made remote work more viable for coastal commuters.
7. Newfields – 52% Home Price Increase Since 2010
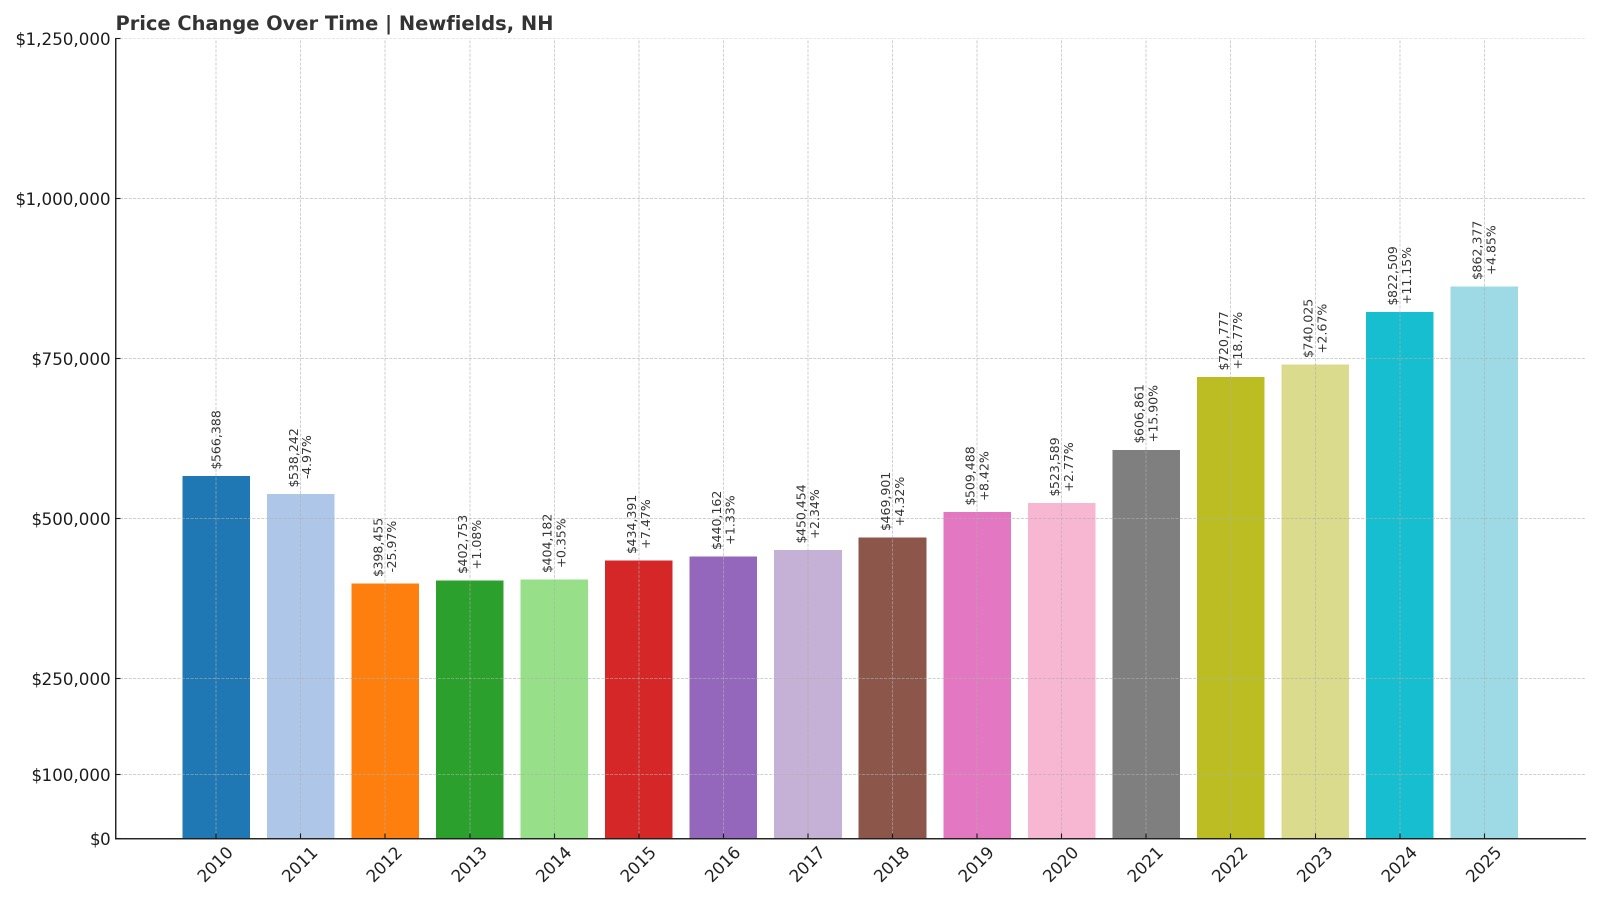
- 2010: $566,388
- 2011: $538,242 (-$28,146, -4.97% from previous year)
- 2012: $398,455 (-$139,787, -25.97% from previous year)
- 2013: $402,753 (+$4,298, +1.08% from previous year)
- 2014: $404,182 (+$1,428, +0.35% from previous year)
- 2015: $434,391 (+$30,209, +7.47% from previous year)
- 2016: $440,162 (+$5,771, +1.33% from previous year)
- 2017: $450,454 (+$10,292, +2.34% from previous year)
- 2018: $469,901 (+$19,447, +4.32% from previous year)
- 2019: $509,488 (+$39,587, +8.42% from previous year)
- 2020: $523,589 (+$14,101, +2.77% from previous year)
- 2021: $606,861 (+$83,273, +15.90% from previous year)
- 2022: $720,777 (+$113,916, +18.77% from previous year)
- 2023: $740,025 (+$19,248, +2.67% from previous year)
- 2024: $822,509 (+$82,484, +11.15% from previous year)
- 2025: $862,377 (+$39,869, +4.85% from previous year)
Newfields experienced a dramatic drop in home values in 2012 but rebounded steadily and powerfully in the years that followed. From a low point of under $400K, prices have soared to more than $862K in 2025—marking a 52% increase since 2010, despite early setbacks.
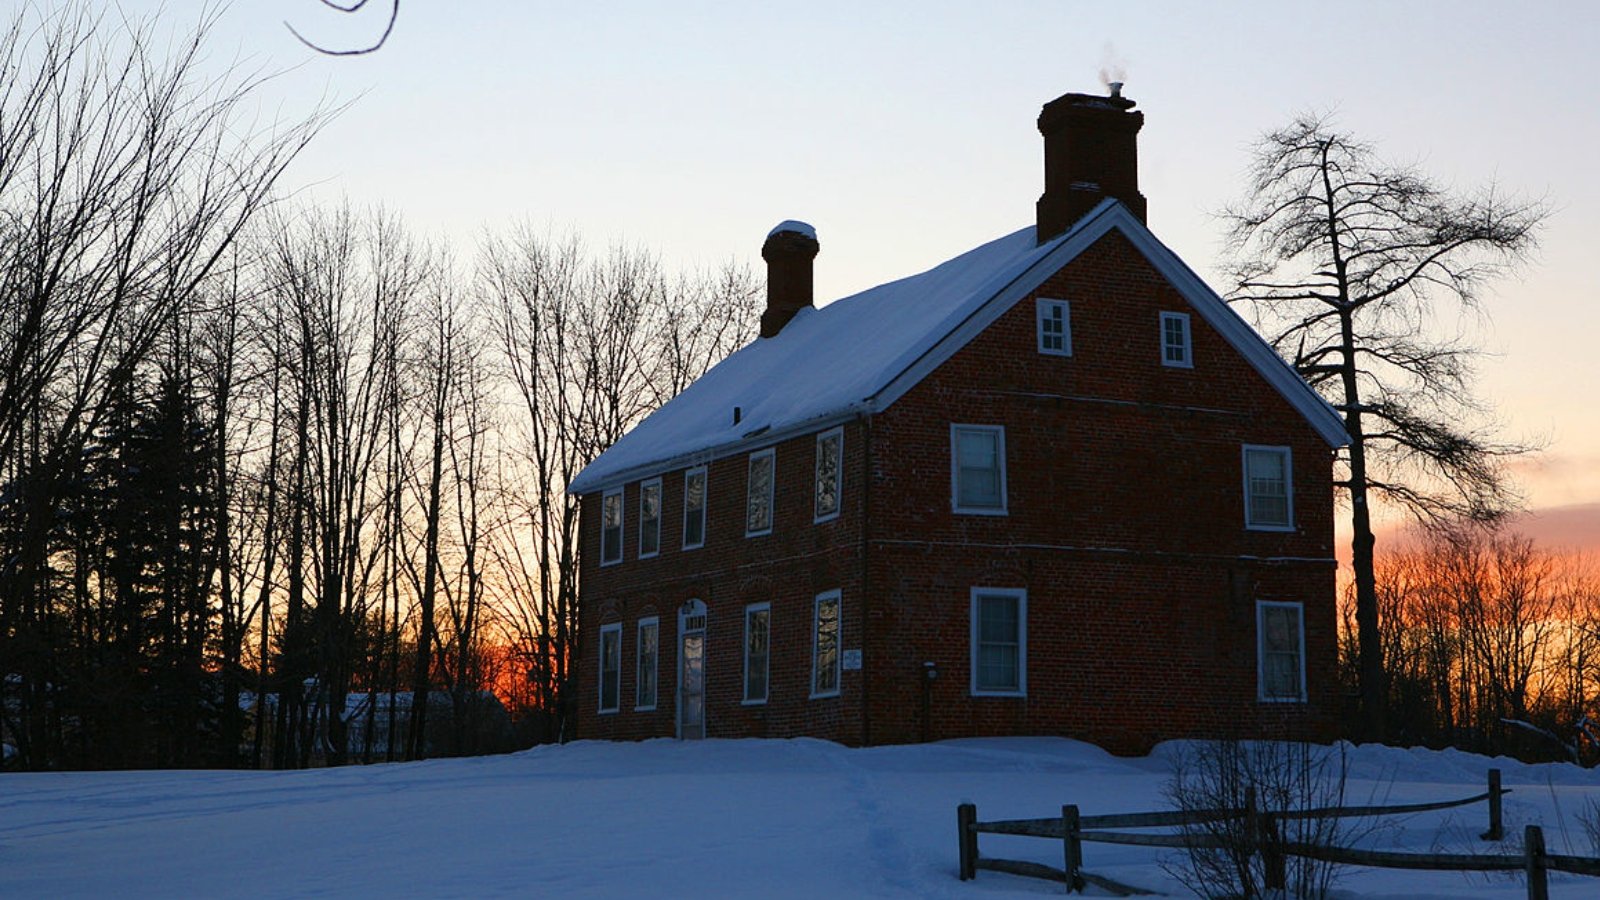
Newfields – A Comeback Fueled by Prestige and Position
This small, affluent town tucked between Exeter and Durham has become one of the most expensive places in New Hampshire, prized for its privacy, high-end homes, and rural charm. Though the housing market stumbled following the 2008 crash, it’s recovered with vigor, especially since 2020.
Buyers are drawn to Newfields for its quiet roads, large properties, and its location within reach of both the Seacoast and the University of New Hampshire. As wealthier buyers spread out beyond traditional hot spots like Portsmouth, Newfields has emerged as a premium alternative.
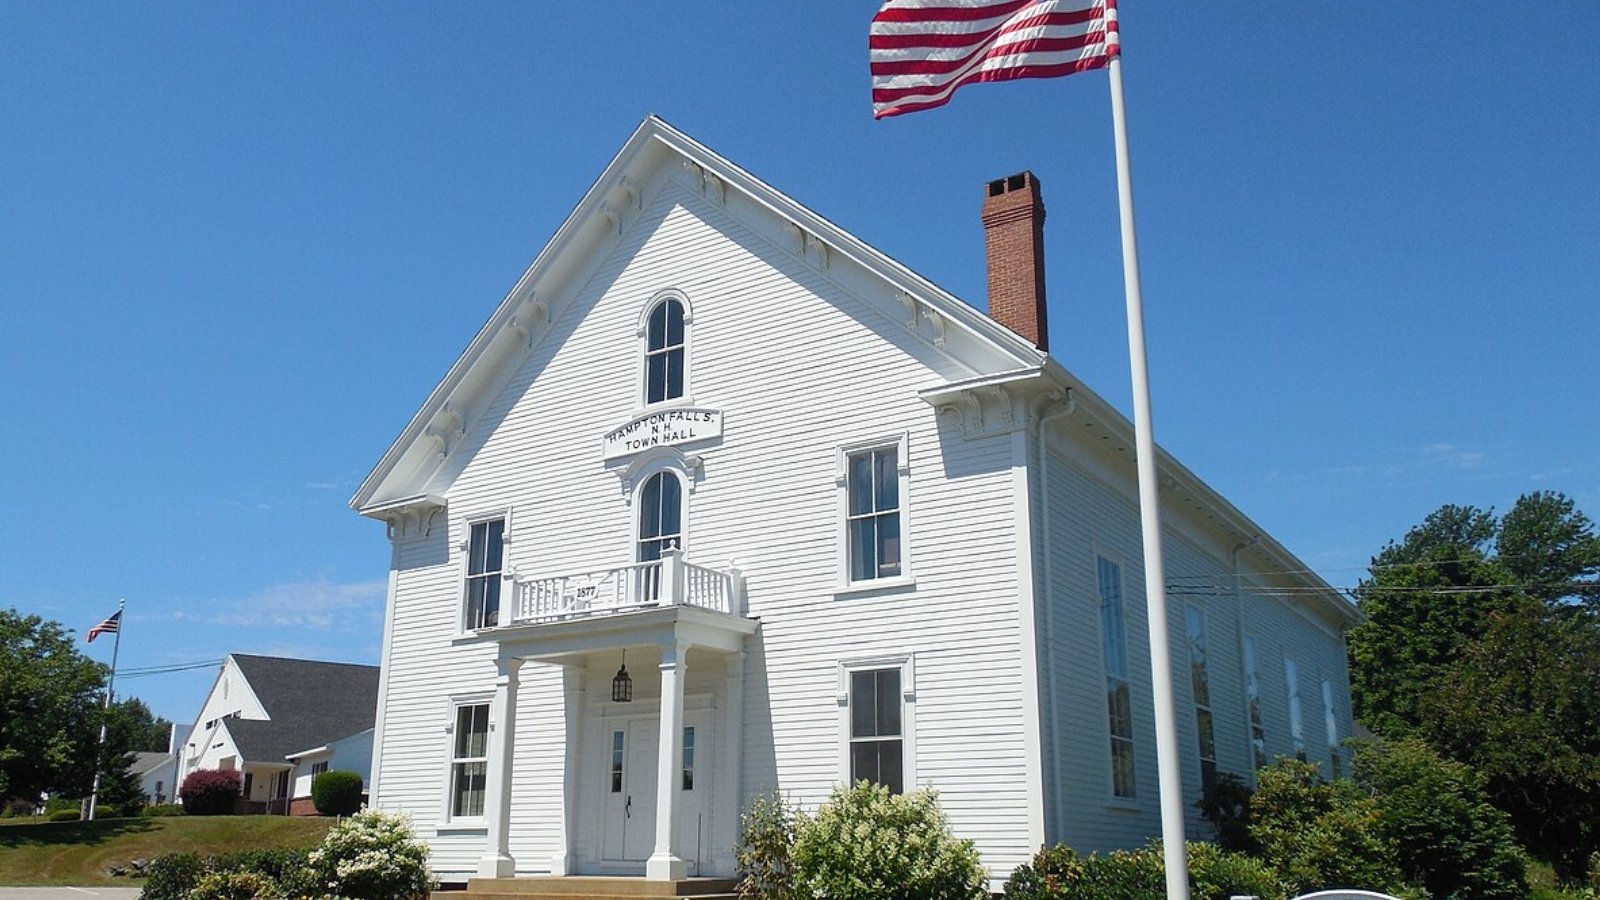
6. Hampton Falls – 165% Home Price Increase Since 2010
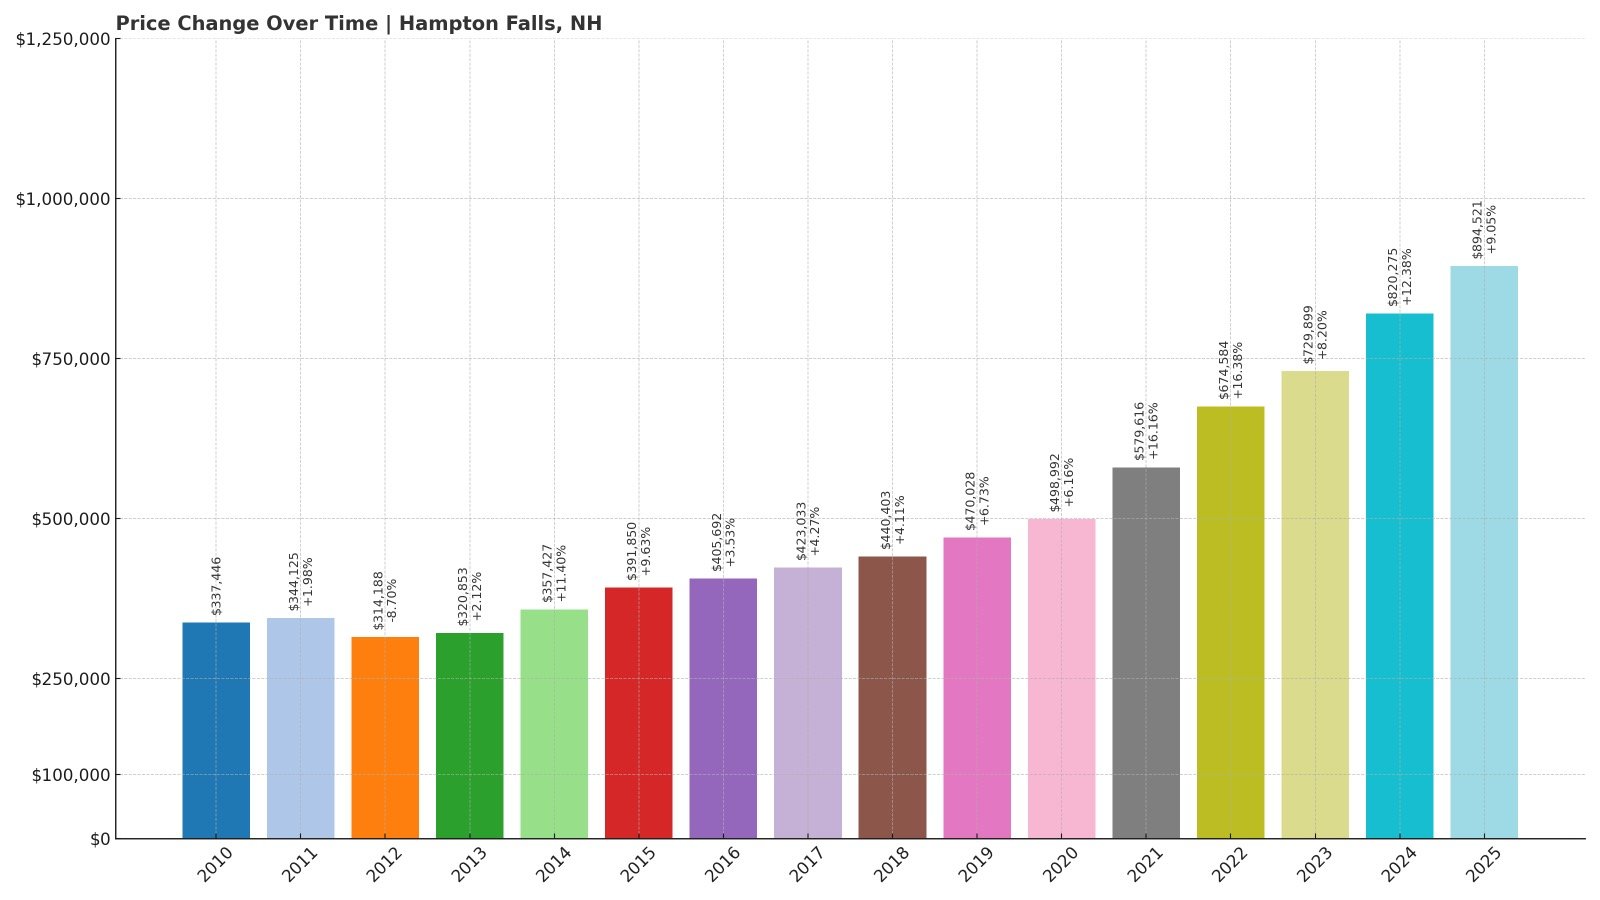
- 2010: $337,446
- 2011: $344,125 (+$6,678, +1.98% from previous year)
- 2012: $314,188 (-$29,937, -8.70% from previous year)
- 2013: $320,853 (+$6,665, +2.12% from previous year)
- 2014: $357,427 (+$36,574, +11.40% from previous year)
- 2015: $391,850 (+$34,423, +9.63% from previous year)
- 2016: $405,692 (+$13,842, +3.53% from previous year)
- 2017: $423,033 (+$17,341, +4.27% from previous year)
- 2018: $440,403 (+$17,370, +4.11% from previous year)
- 2019: $470,028 (+$29,625, +6.73% from previous year)
- 2020: $498,992 (+$28,963, +6.16% from previous year)
- 2021: $579,616 (+$80,624, +16.16% from previous year)
- 2022: $674,584 (+$94,968, +16.38% from previous year)
- 2023: $729,899 (+$55,315, +8.20% from previous year)
- 2024: $820,275 (+$90,375, +12.38% from previous year)
- 2025: $894,521 (+$74,247, +9.05% from previous year)
Hampton Falls has seen a remarkable 165% increase in home prices since 2010, surging from $337K to nearly $895K in 2025. This small coastal town saw especially large gains between 2020 and 2022, and that growth has continued at a steady clip through 2025.
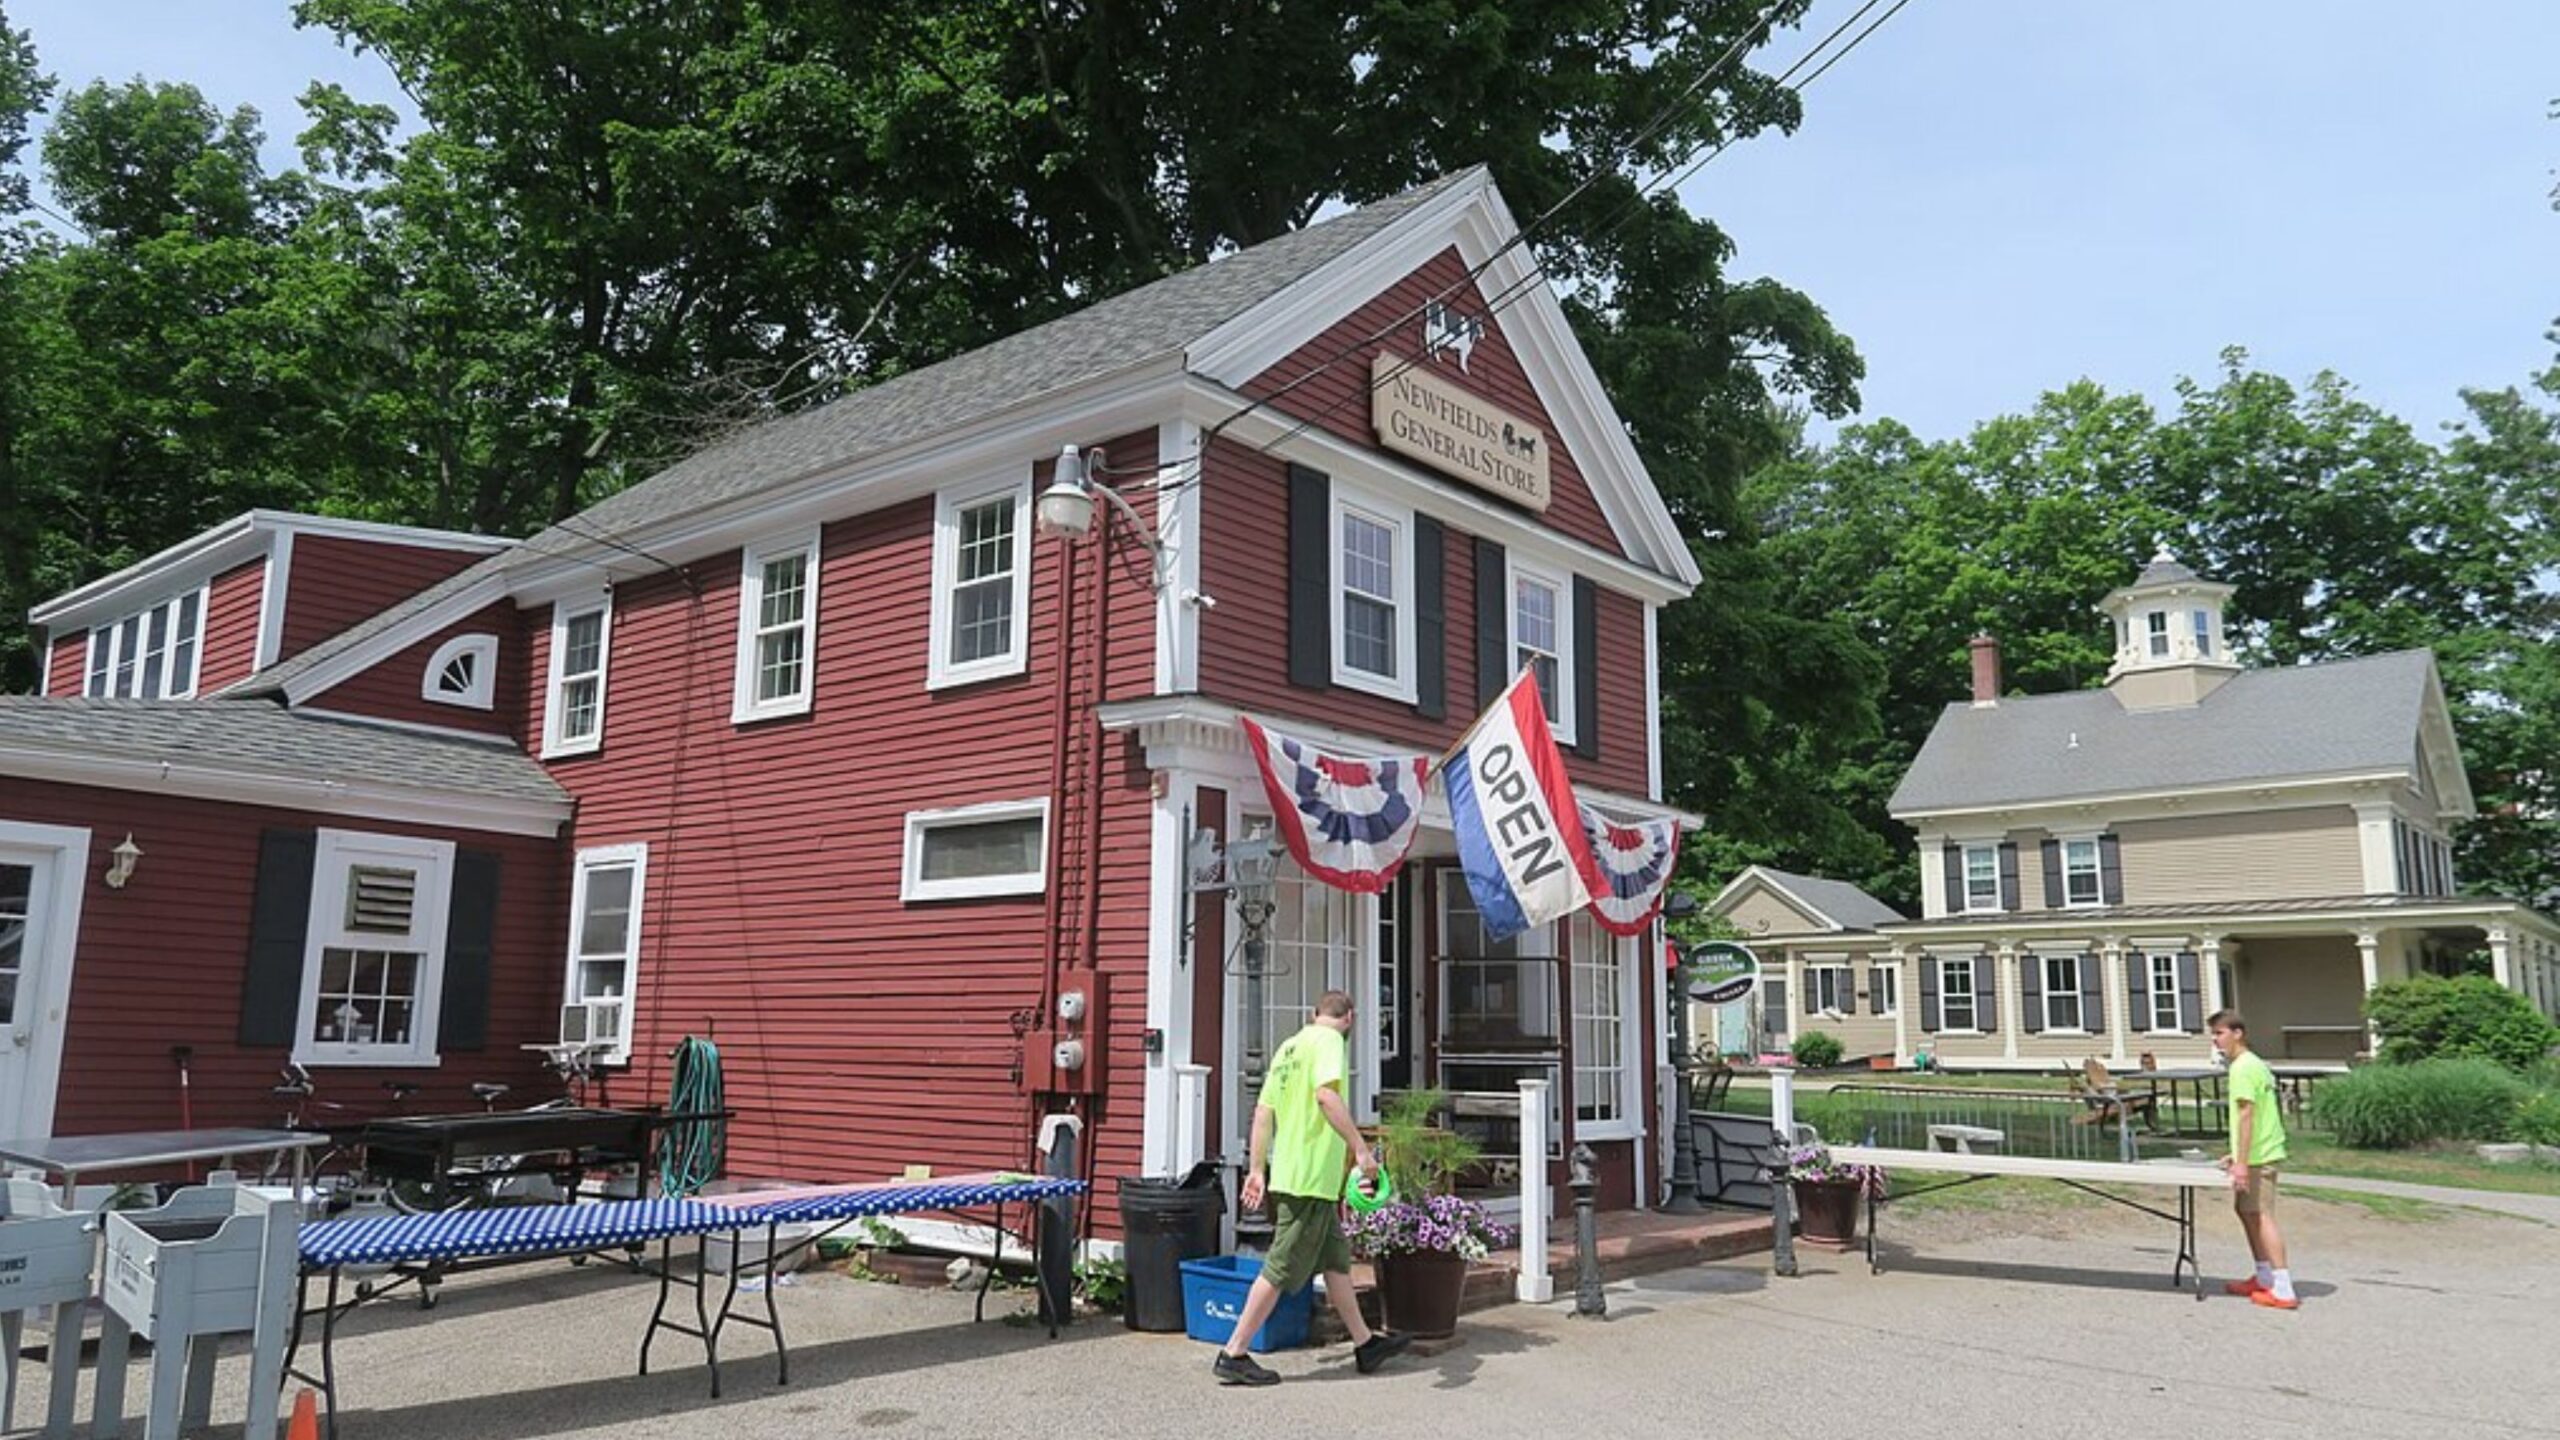
Hampton Falls – High-End Coastal Living Without the Crowds
🔥 Would you like to save this?
Bordered by marshes and farmland, Hampton Falls offers a peaceful alternative to busier Seacoast towns. Its historic homes, country roads, and lack of commercial sprawl make it especially appealing to buyers seeking a more refined and rural atmosphere near the ocean.
The town’s scarcity of new housing, along with strong buyer demand, has helped push values higher each year. With its coastal location, access to Route 1, and affluent housing stock, Hampton Falls has quietly become one of New Hampshire’s most sought-after luxury markets.
5. North Hampton – 153% Home Price Increase Since 2010
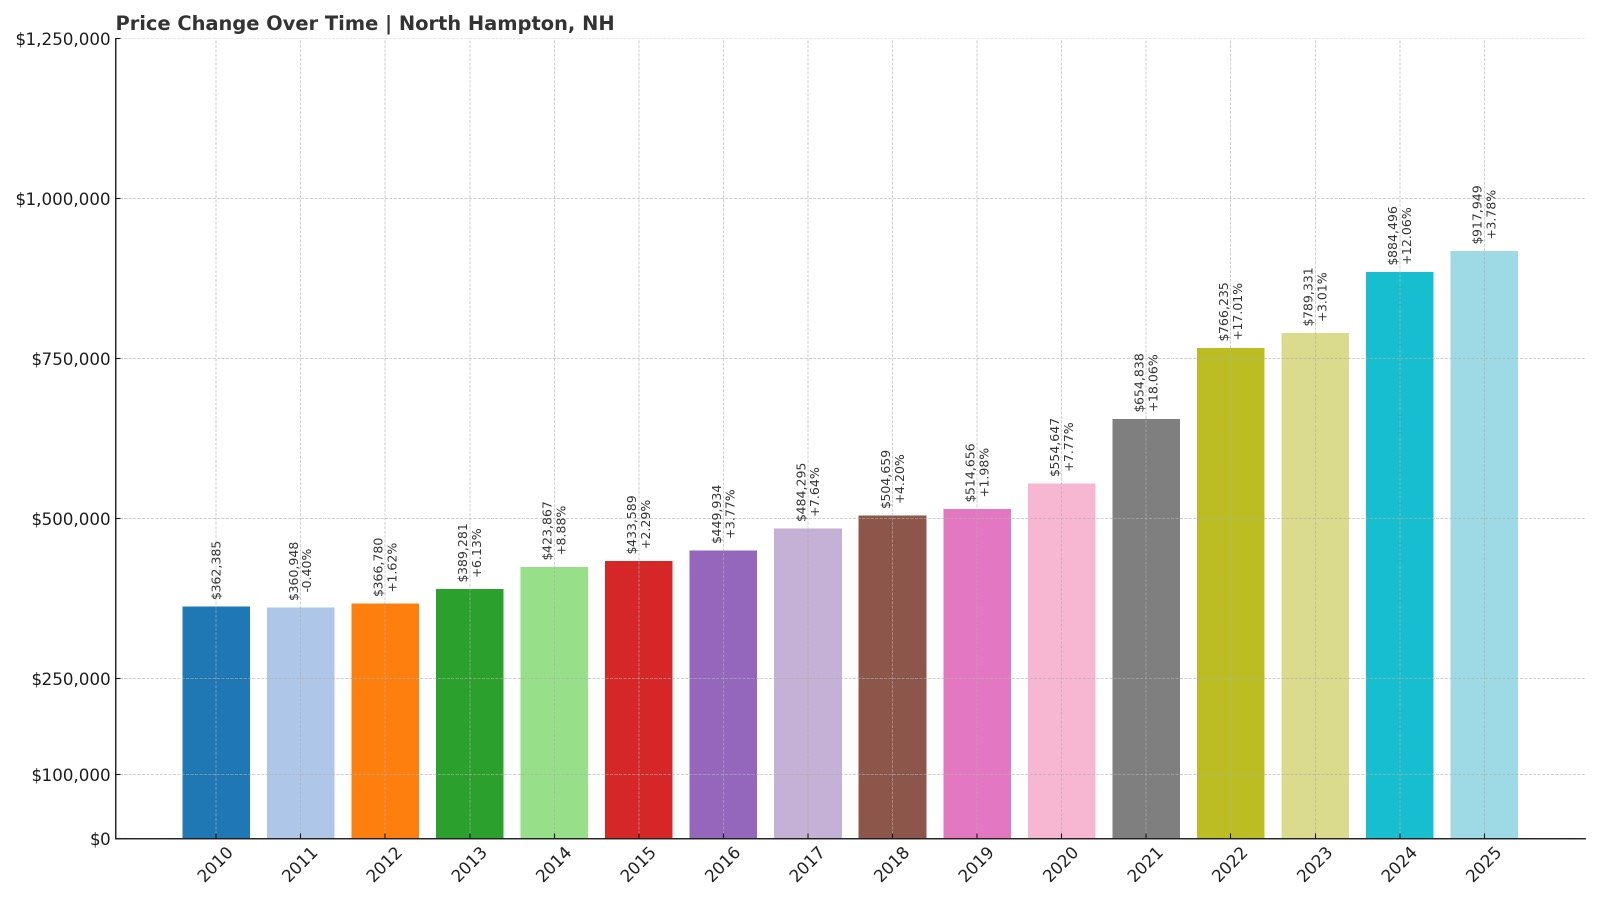
- 2010: $362,385
- 2011: $360,948 (-$1,437, -0.40% from previous year)
- 2012: $366,780 (+$5,831, +1.62% from previous year)
- 2013: $389,281 (+$22,501, +6.13% from previous year)
- 2014: $423,867 (+$34,586, +8.88% from previous year)
- 2015: $433,589 (+$9,722, +2.29% from previous year)
- 2016: $449,934 (+$16,345, +3.77% from previous year)
- 2017: $484,295 (+$34,361, +7.64% from previous year)
- 2018: $504,659 (+$20,364, +4.20% from previous year)
- 2019: $514,656 (+$9,997, +1.98% from previous year)
- 2020: $554,647 (+$39,991, +7.77% from previous year)
- 2021: $654,838 (+$100,190, +18.06% from previous year)
- 2022: $766,235 (+$111,397, +17.01% from previous year)
- 2023: $789,331 (+$23,096, +3.01% from previous year)
- 2024: $884,496 (+$95,166, +12.06% from previous year)
- 2025: $917,949 (+$33,453, +3.78% from previous year)
North Hampton has seen home values skyrocket by over 150% since 2010. Prices jumped particularly fast in the early 2020s, with back-to-back annual increases of over 17% in 2021 and 2022. By 2025, the average home is valued at nearly $918K.
North Hampton – Coastal Affluence with Timeless Appeal
North Hampton offers a mix of sprawling estates, historic homes, and newer luxury builds along the coast and inland. With both Route 1 and Route 101 nearby, it balances convenience with seclusion. The small town is bordered by Rye and Hampton and boasts access to some of New Hampshire’s only oceanfront properties.
The combination of exclusivity, natural beauty, and low supply continues to drive demand—and prices. Even with higher interest rates slowing some markets in 2025, North Hampton remains a favorite among high-income buyers and retirees looking for coastal elegance.
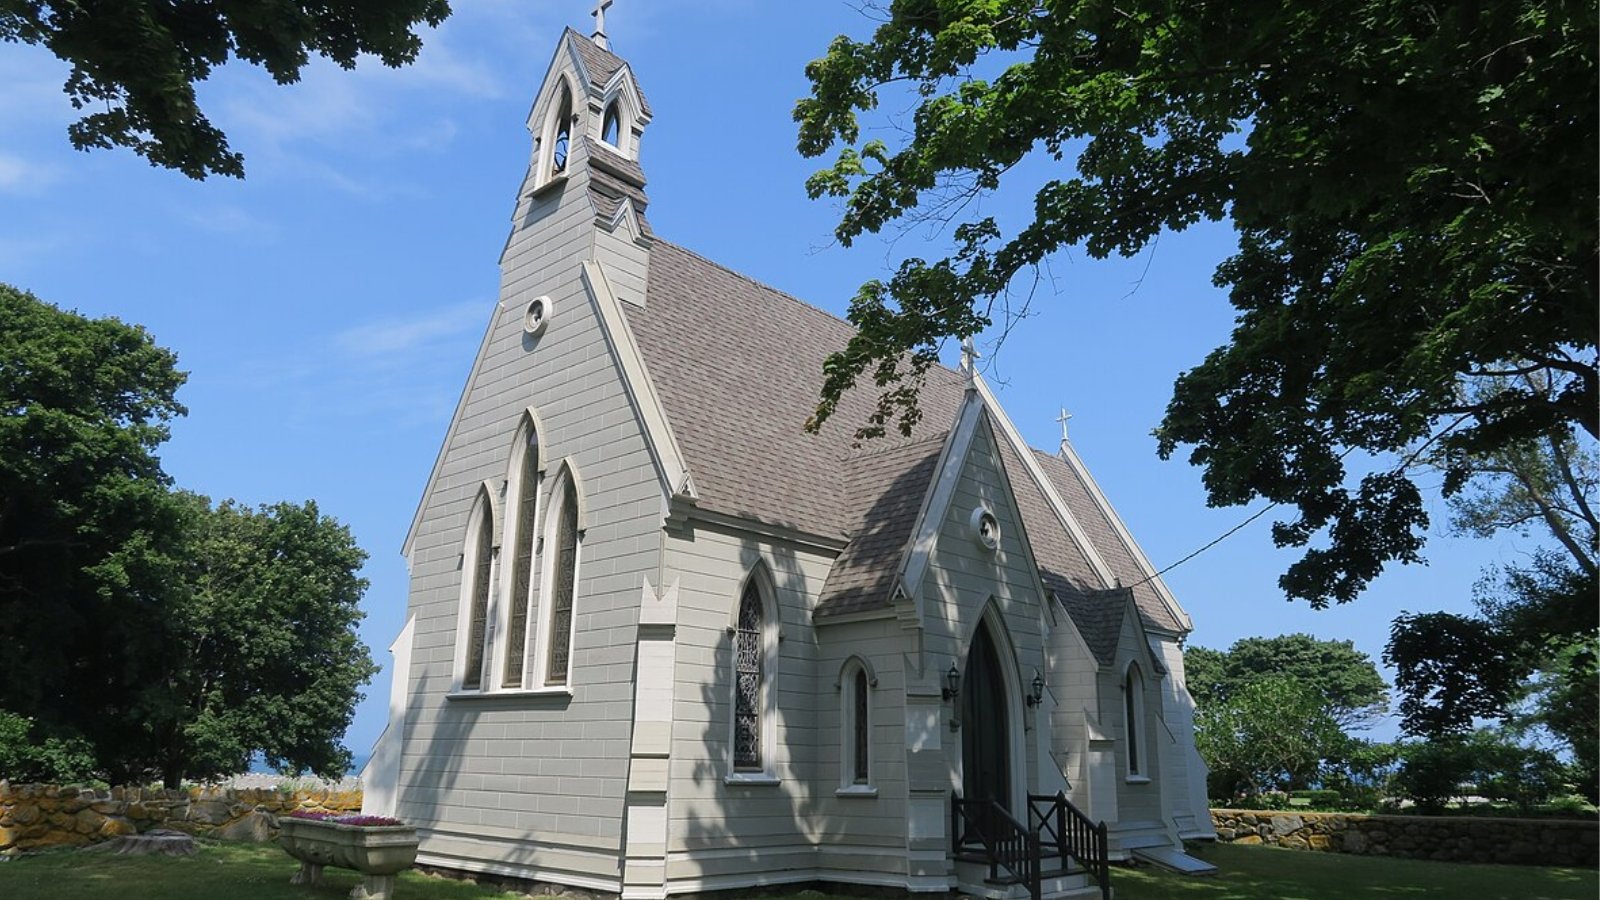
4. Hanover – 125% Home Price Increase Since 2010
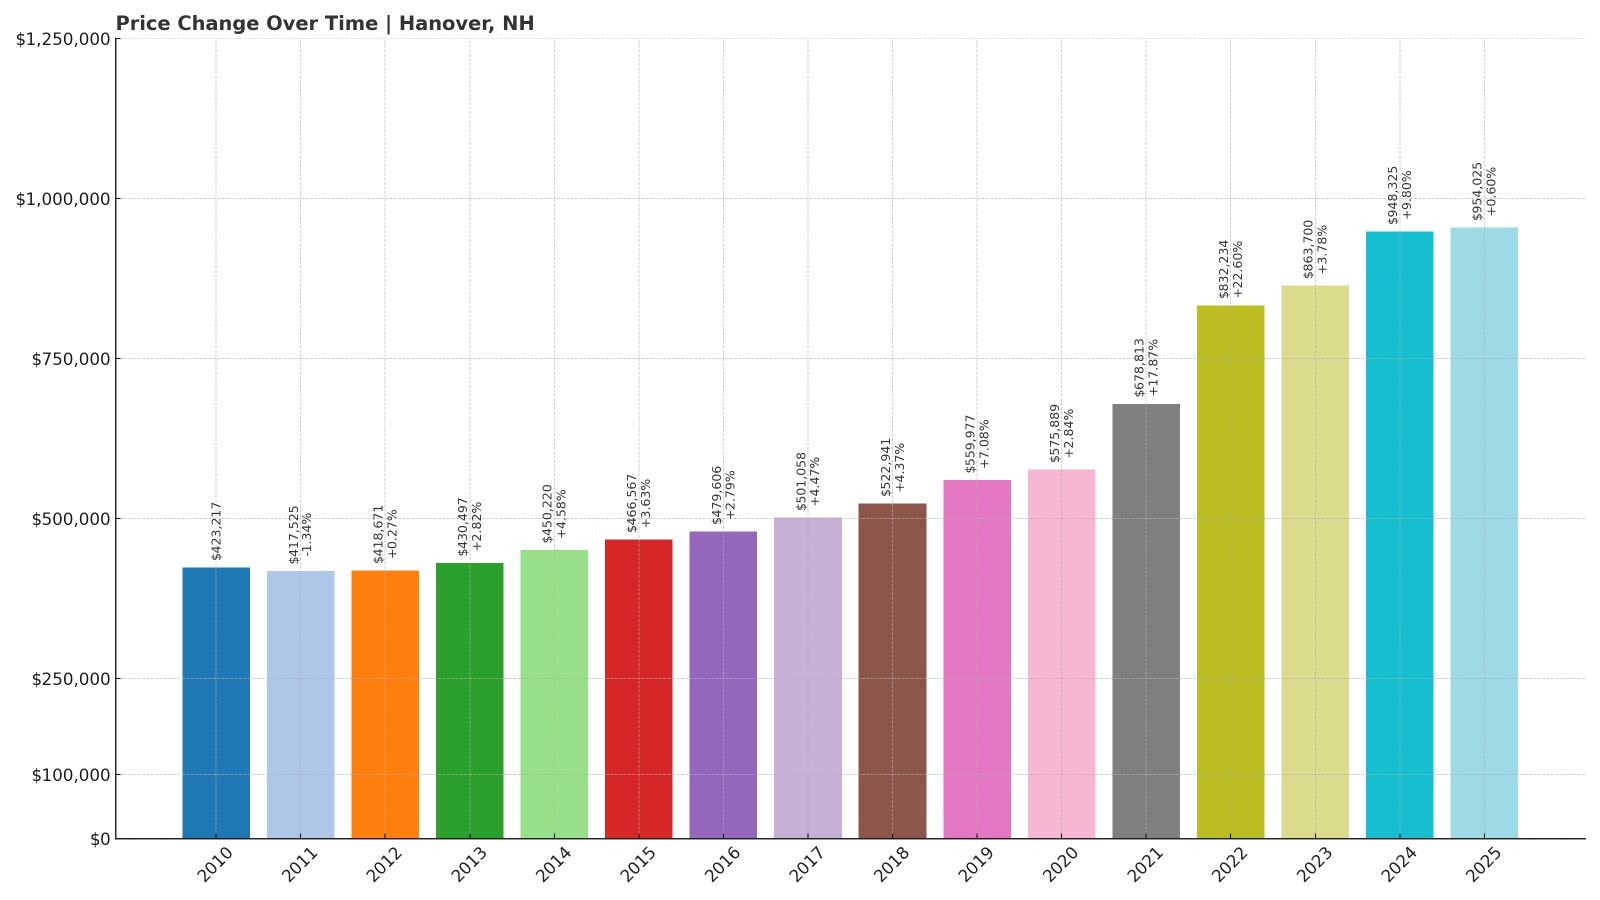
- 2010: $423,217
- 2011: $417,525 (-$5,692, -1.34% from previous year)
- 2012: $418,671 (+$1,145, +0.27% from previous year)
- 2013: $430,497 (+$11,826, +2.82% from previous year)
- 2014: $450,220 (+$19,724, +4.58% from previous year)
- 2015: $466,567 (+$16,346, +3.63% from previous year)
- 2016: $479,606 (+$13,040, +2.79% from previous year)
- 2017: $501,058 (+$21,452, +4.47% from previous year)
- 2018: $522,941 (+$21,883, +4.37% from previous year)
- 2019: $559,977 (+$37,035, +7.08% from previous year)
- 2020: $575,889 (+$15,913, +2.84% from previous year)
- 2021: $678,813 (+$102,923, +17.87% from previous year)
- 2022: $832,234 (+$153,421, +22.60% from previous year)
- 2023: $863,700 (+$31,466, +3.78% from previous year)
- 2024: $948,325 (+$84,625, +9.80% from previous year)
- 2025: $954,025 (+$5,701, +0.60% from previous year)
Hanover has added more than half a million dollars to its average home price since 2010. With consistent growth and a dramatic leap in 2022, the town now averages over $950K. Its academic prestige and limited supply keep demand strong even in slower markets.
Hanover – Ivy League Prestige Meets Mountain Living
Home to Dartmouth College and situated near the Connecticut River and White Mountains, Hanover combines elite academia with rural beauty. It’s regularly ranked among the best small towns in the country, and its housing market reflects that appeal.
High-income faculty, medical professionals, and out-of-state buyers have helped fuel consistent demand. With few new developments and strong zoning protections, inventory remains tight—pushing prices steadily upward year after year.
3. Newington – 136% Home Price Increase Since 2010
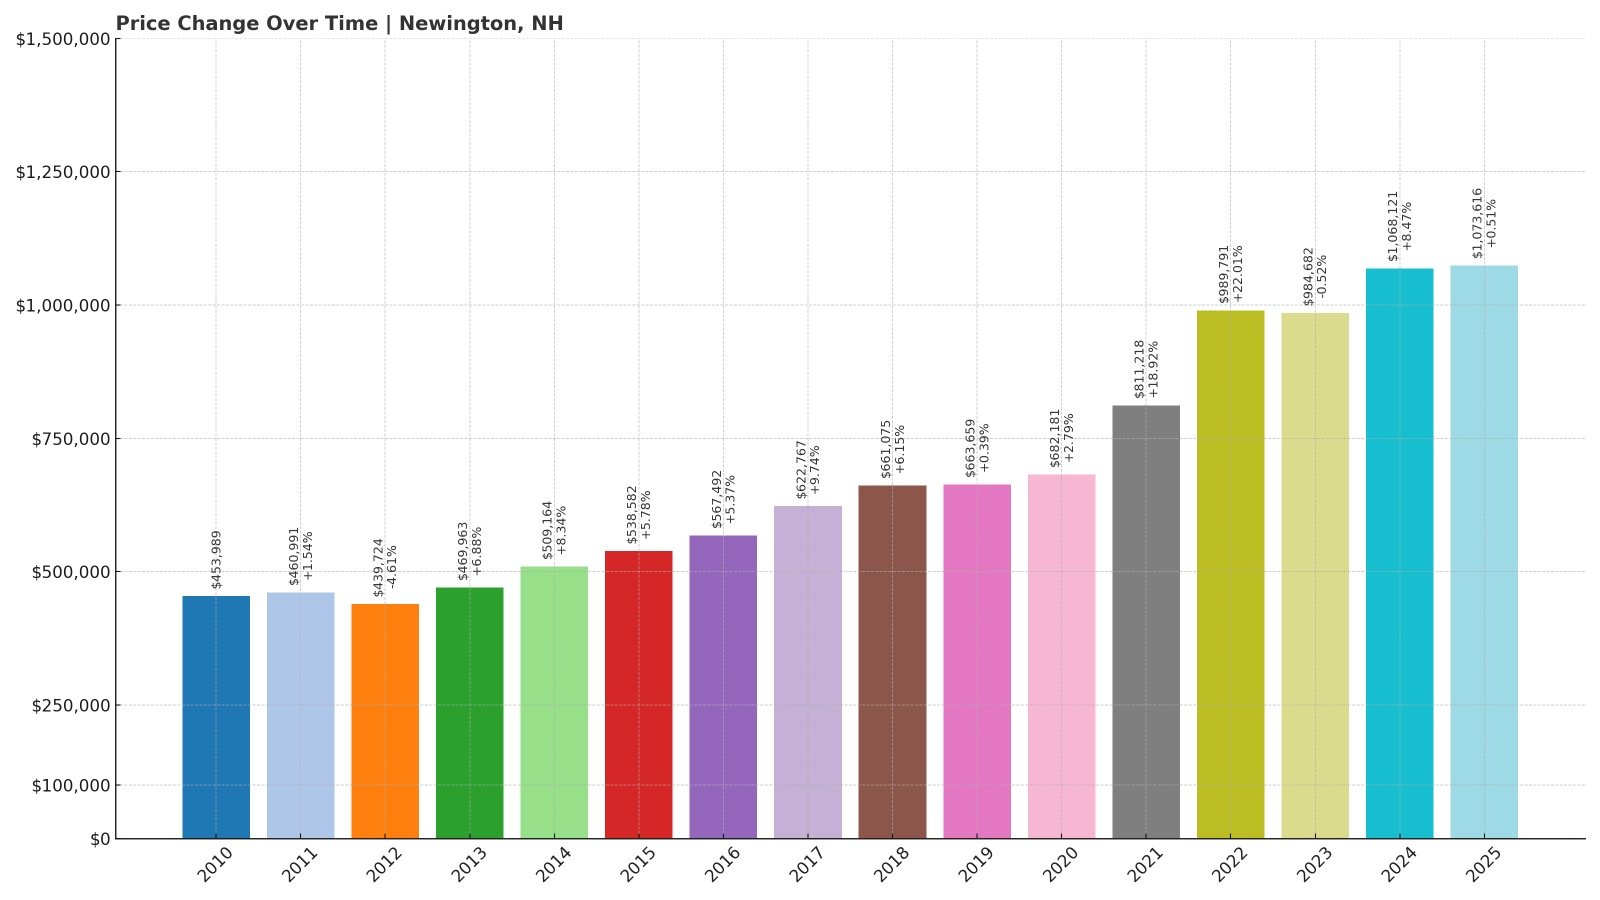
- 2010: $453,989
- 2011: $460,991 (+$7,002, +1.54% from previous year)
- 2012: $439,724 (-$21,267, -4.61% from previous year)
- 2013: $469,963 (+$30,239, +6.88% from previous year)
- 2014: $509,164 (+$39,201, +8.34% from previous year)
- 2015: $538,582 (+$29,418, +5.78% from previous year)
- 2016: $567,492 (+$28,910, +5.37% from previous year)
- 2017: $622,767 (+$55,274, +9.74% from previous year)
- 2018: $661,075 (+$38,308, +6.15% from previous year)
- 2019: $663,659 (+$2,584, +0.39% from previous year)
- 2020: $682,181 (+$18,522, +2.79% from previous year)
- 2021: $811,218 (+$129,037, +18.92% from previous year)
- 2022: $989,791 (+$178,573, +22.01% from previous year)
- 2023: $984,682 (-$5,108, -0.52% from previous year)
- 2024: $1,068,121 (+$83,439, +8.47% from previous year)
- 2025: $1,073,616 (+$5,495, +0.51% from previous year)
Newington home prices have jumped from $454K in 2010 to over $1.07 million in 2025, a 136% increase. The town’s sharpest growth occurred between 2020 and 2022, with values rising by more than $300K in just two years.
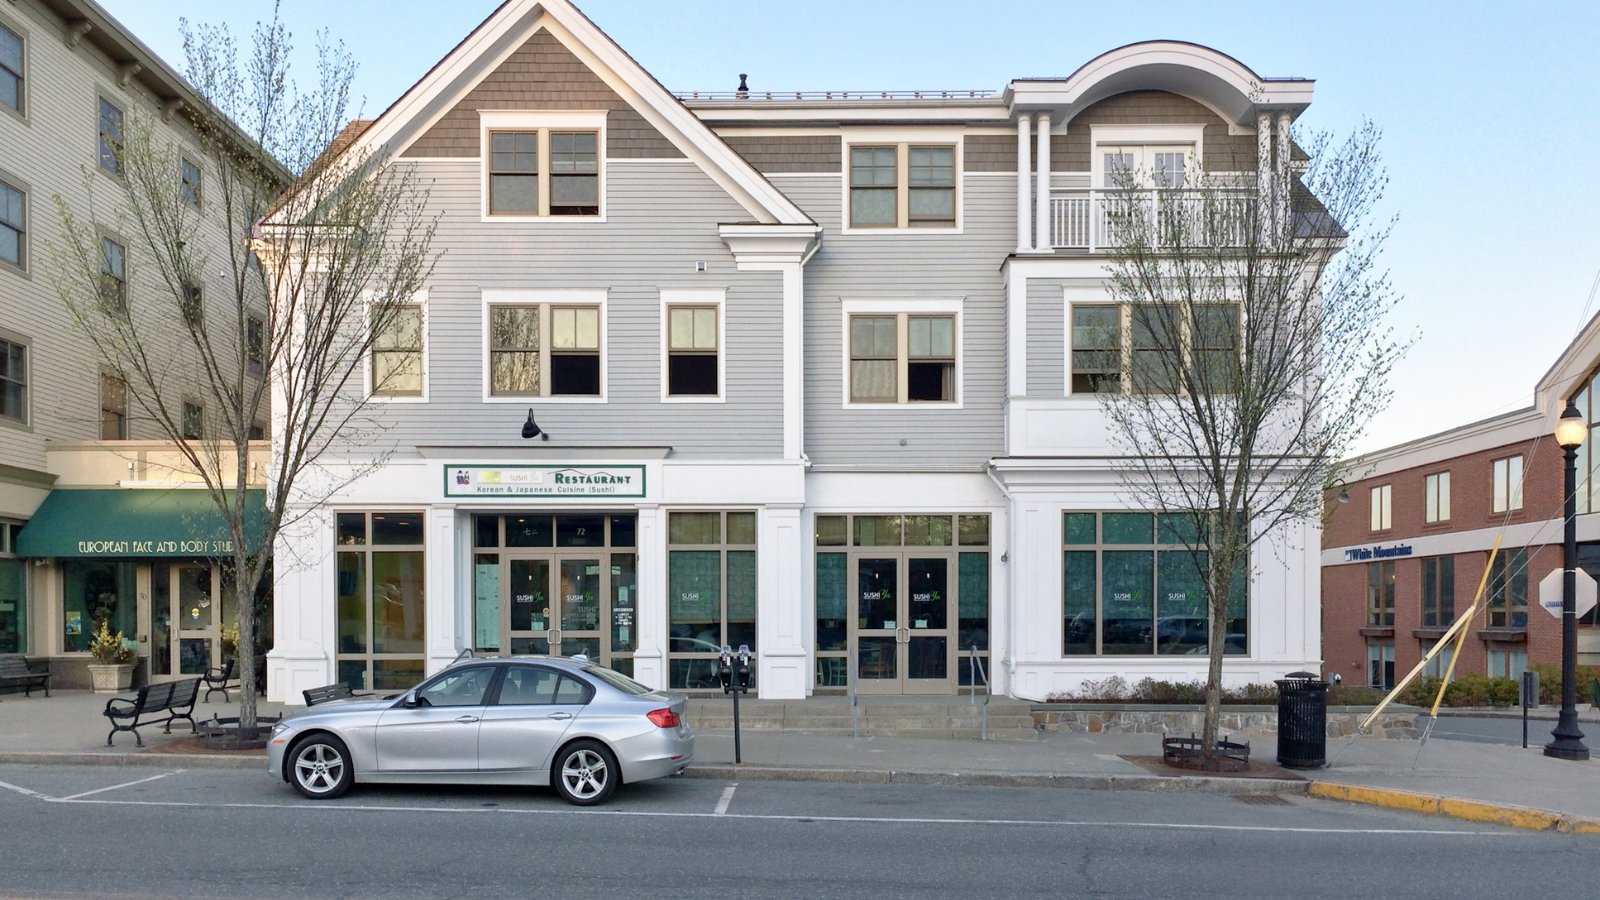
Newington – Small Town, Big Numbers
Newington may be one of New Hampshire’s smallest towns by population, but its real estate market is anything but small. Located on Great Bay and adjacent to Portsmouth, Newington offers waterfront properties, large estates, and extremely limited housing turnover, which has fueled demand and driven prices skyward.
Newington’s unique mix of rural landscapes and commercial tax base (thanks to the Pease International Tradeport and nearby retail centers) keeps property taxes relatively low. That makes it even more attractive to high-income buyers. Despite its tiny size, Newington has carved out a place among the most elite housing markets in the state.
2. Rye – 154% Home Price Increase Since 2010
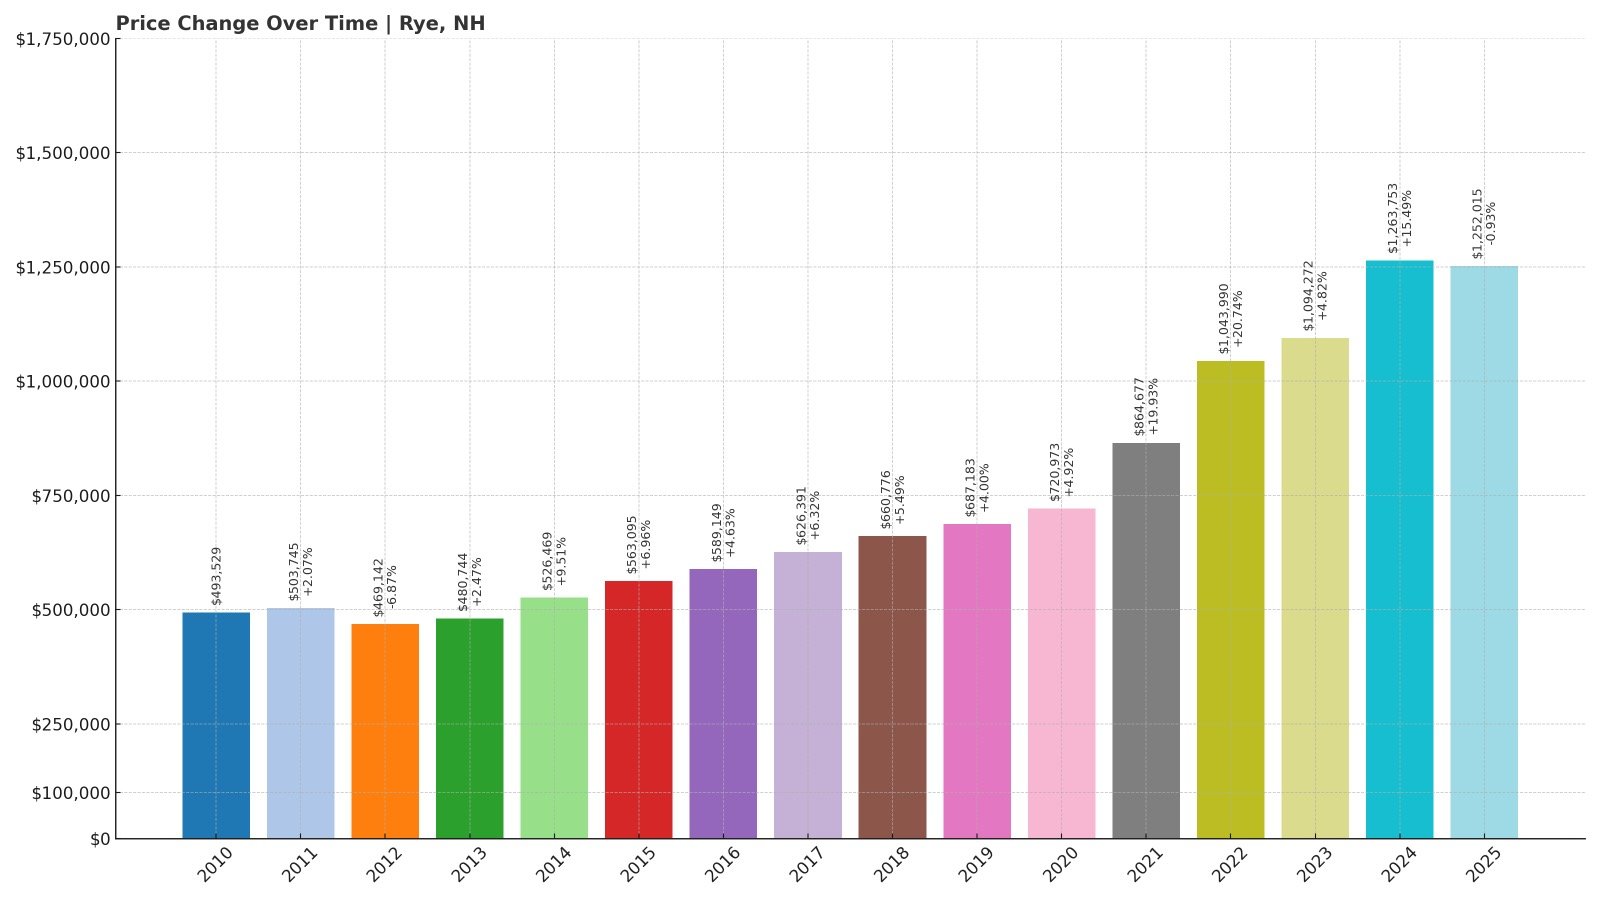
- 2010: $493,529
- 2011: $503,745 (+$10,216, +2.07% from previous year)
- 2012: $469,142 (-$34,603, -6.87% from previous year)
- 2013: $480,744 (+$11,602, +2.47% from previous year)
- 2014: $526,469 (+$45,725, +9.51% from previous year)
- 2015: $563,095 (+$36,626, +6.96% from previous year)
- 2016: $589,149 (+$26,054, +4.63% from previous year)
- 2017: $626,391 (+$37,242, +6.32% from previous year)
- 2018: $660,776 (+$34,386, +5.49% from previous year)
- 2019: $687,183 (+$26,407, +4.00% from previous year)
- 2020: $720,973 (+$33,790, +4.92% from previous year)
- 2021: $864,677 (+$143,704, +19.93% from previous year)
- 2022: $1,043,990 (+$179,312, +20.74% from previous year)
- 2023: $1,094,272 (+$50,282, +4.82% from previous year)
- 2024: $1,263,753 (+$169,480, +15.49% from previous year)
- 2025: $1,252,015 (-$11,738, -0.93% from previous year)
Home values in Rye have more than doubled since 2010, soaring to $1.25 million in 2025. Though prices dipped slightly this year, the long-term trend is unmistakable. Rye remains one of the most coveted—and expensive—places to live in all of New England.
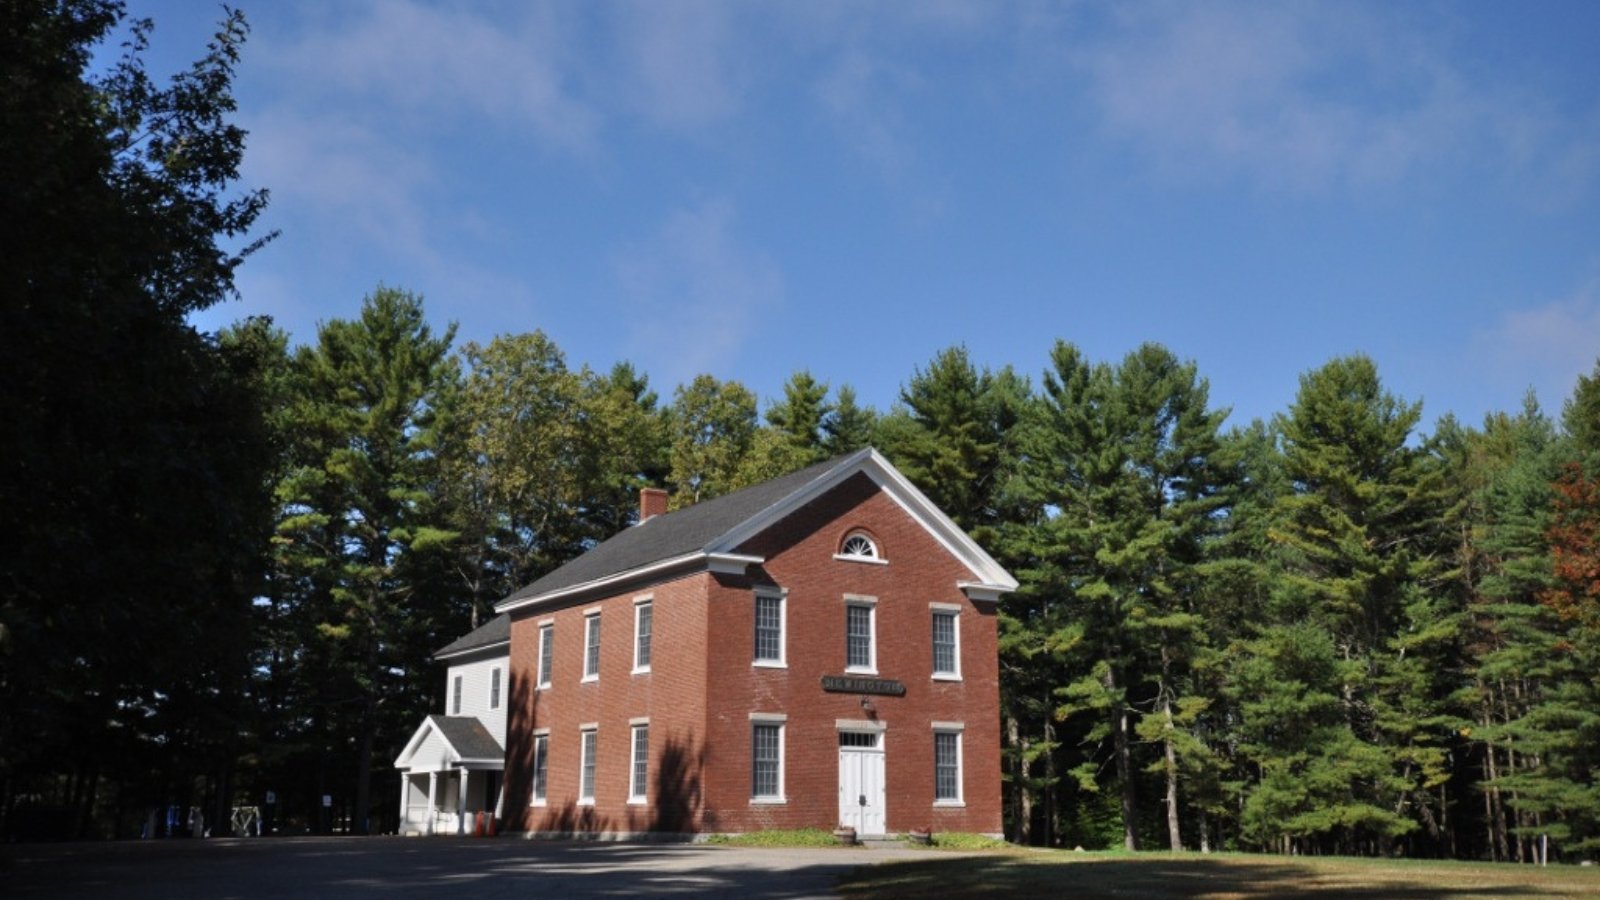
Rye – Ocean Views and Exceptional Demand
Rye’s allure is simple: it has the most oceanfront property of any town in New Hampshire. Its beaches, cliffs, and coastal neighborhoods are in constant demand, but supply remains extremely limited. That imbalance has propelled home values to new heights year after year.
Though some of the recent growth may have been fueled by pandemic-era buyers seeking a change of pace, Rye’s fundamentals remain strong. Its proximity to Portsmouth, rural setting, and exclusive real estate keep it firmly in the upper echelon of the state’s housing market.
1. New Castle – 147% Home Price Increase Since 2010
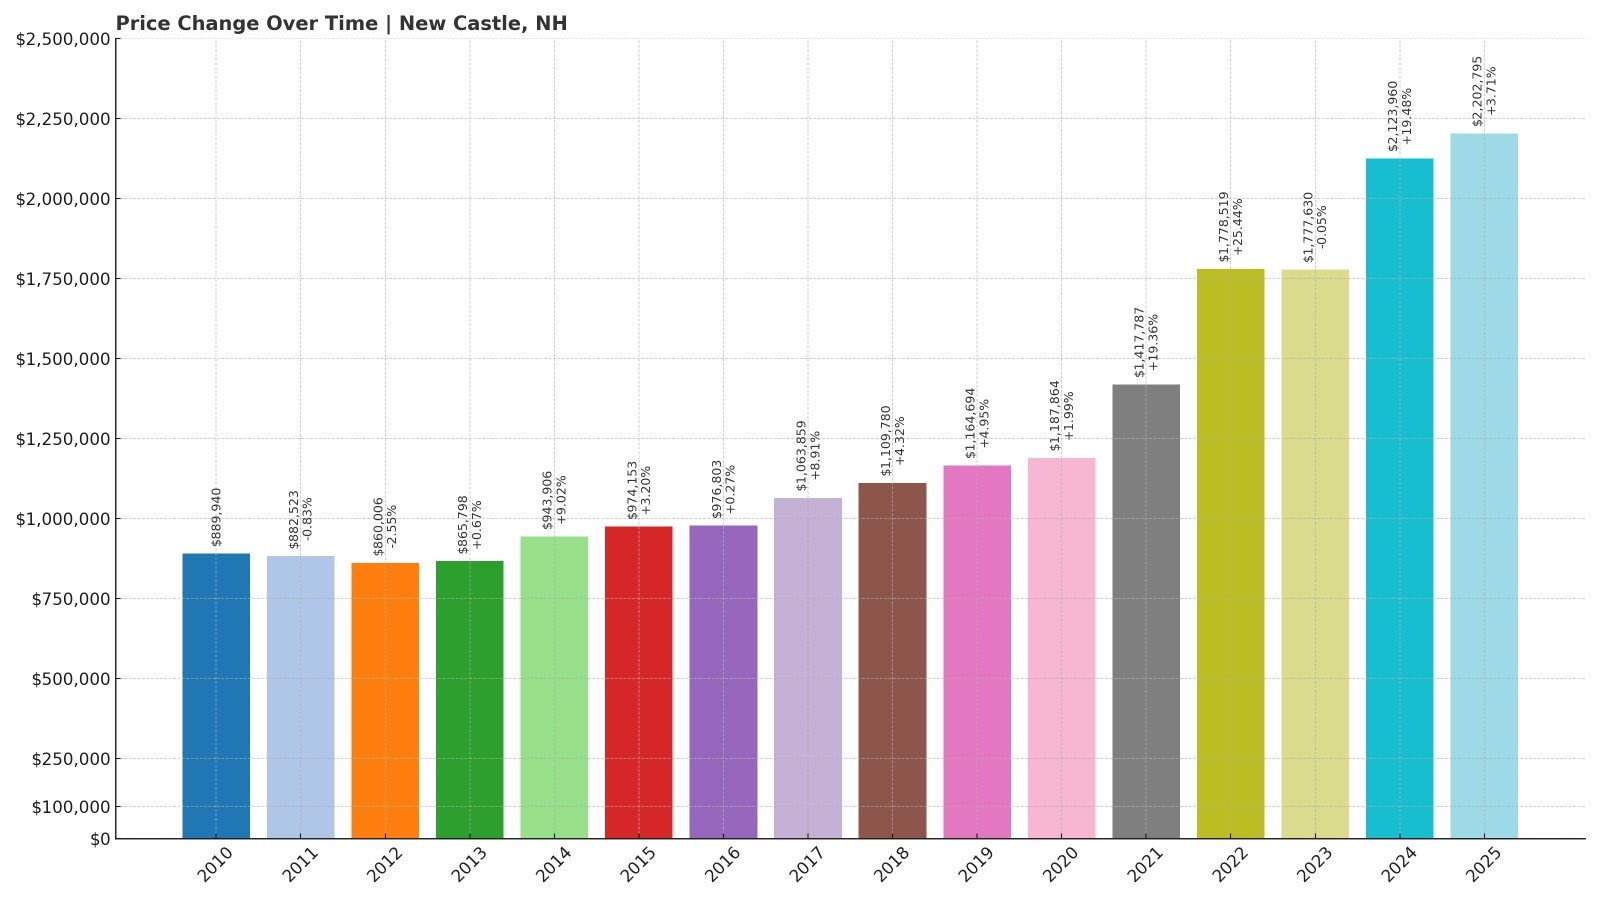
- 2010: $889,940
- 2011: $882,523 (-$7,416, -0.83% from previous year)
- 2012: $860,006 (-$22,517, -2.55% from previous year)
- 2013: $865,798 (+$5,792, +0.67% from previous year)
- 2014: $943,906 (+$78,108, +9.02% from previous year)
- 2015: $974,153 (+$30,247, +3.20% from previous year)
- 2016: $976,803 (+$2,650, +0.27% from previous year)
- 2017: $1,063,859 (+$87,056, +8.91% from previous year)
- 2018: $1,109,780 (+$45,921, +4.32% from previous year)
- 2019: $1,164,694 (+$54,913, +4.95% from previous year)
- 2020: $1,187,864 (+$23,170, +1.99% from previous year)
- 2021: $1,417,787 (+$229,923, +19.36% from previous year)
- 2022: $1,778,519 (+$360,732, +25.44% from previous year)
- 2023: $1,777,630 (-$889, -0.05% from previous year)
- 2024: $2,123,960 (+$346,330, +19.48% from previous year)
- 2025: $2,202,795 (+$78,835, +3.71% from previous year)
New Castle tops the list with a staggering average home value of $2.2 million in 2025. Home prices have surged 147% since 2010, and recent years have brought eye-popping increases—including a $346,000 jump in 2024 alone.
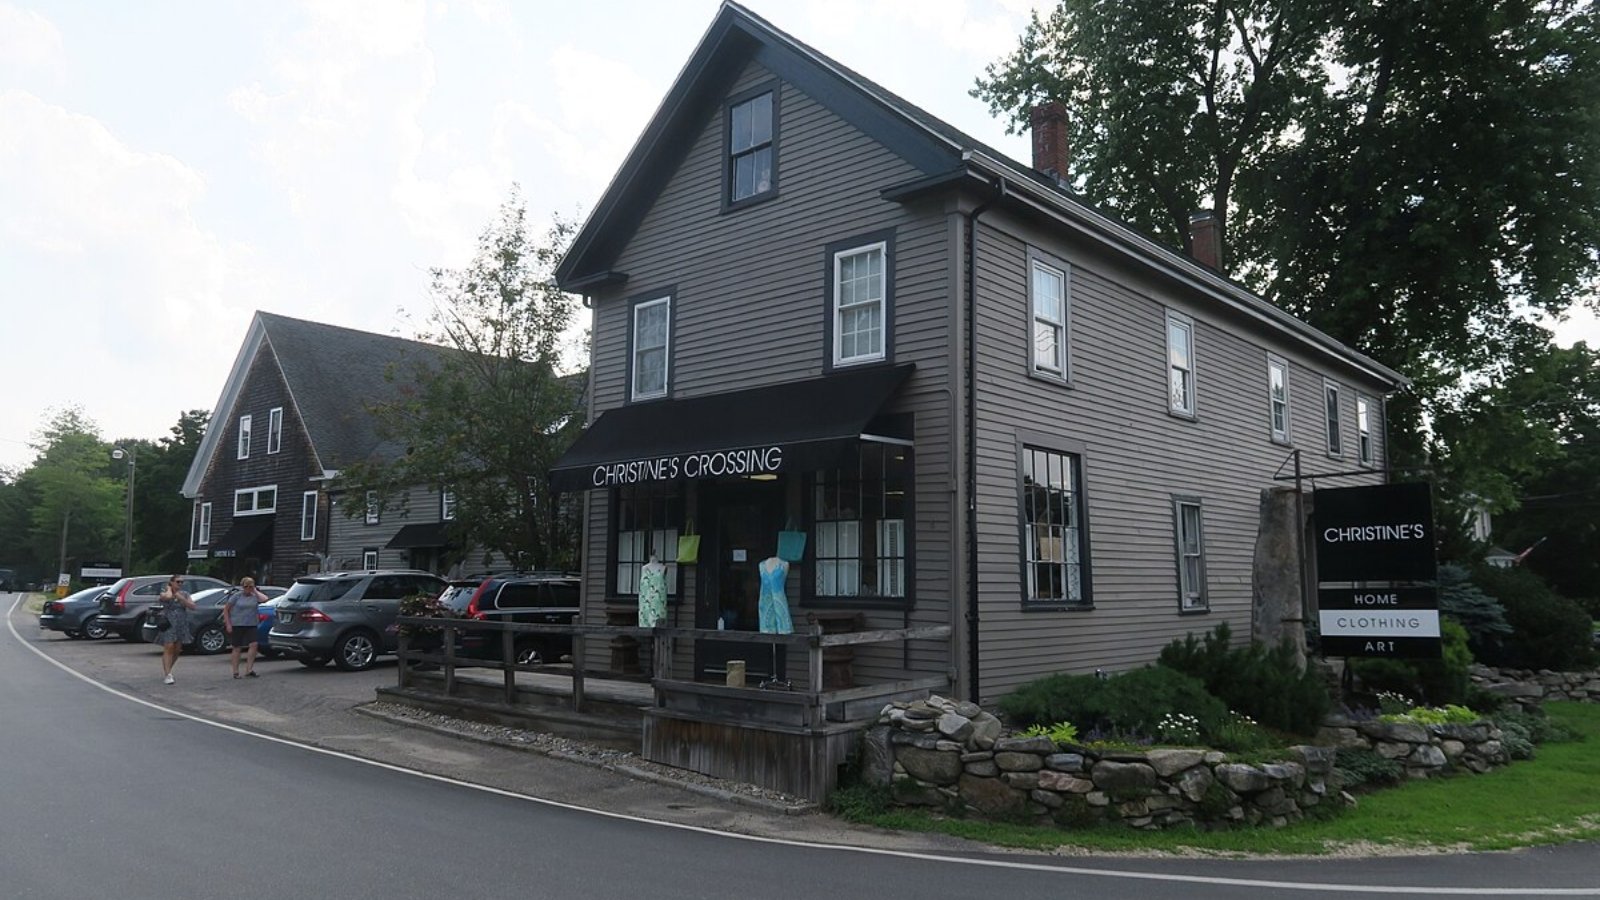
New Castle – New Hampshire’s Crown Jewel
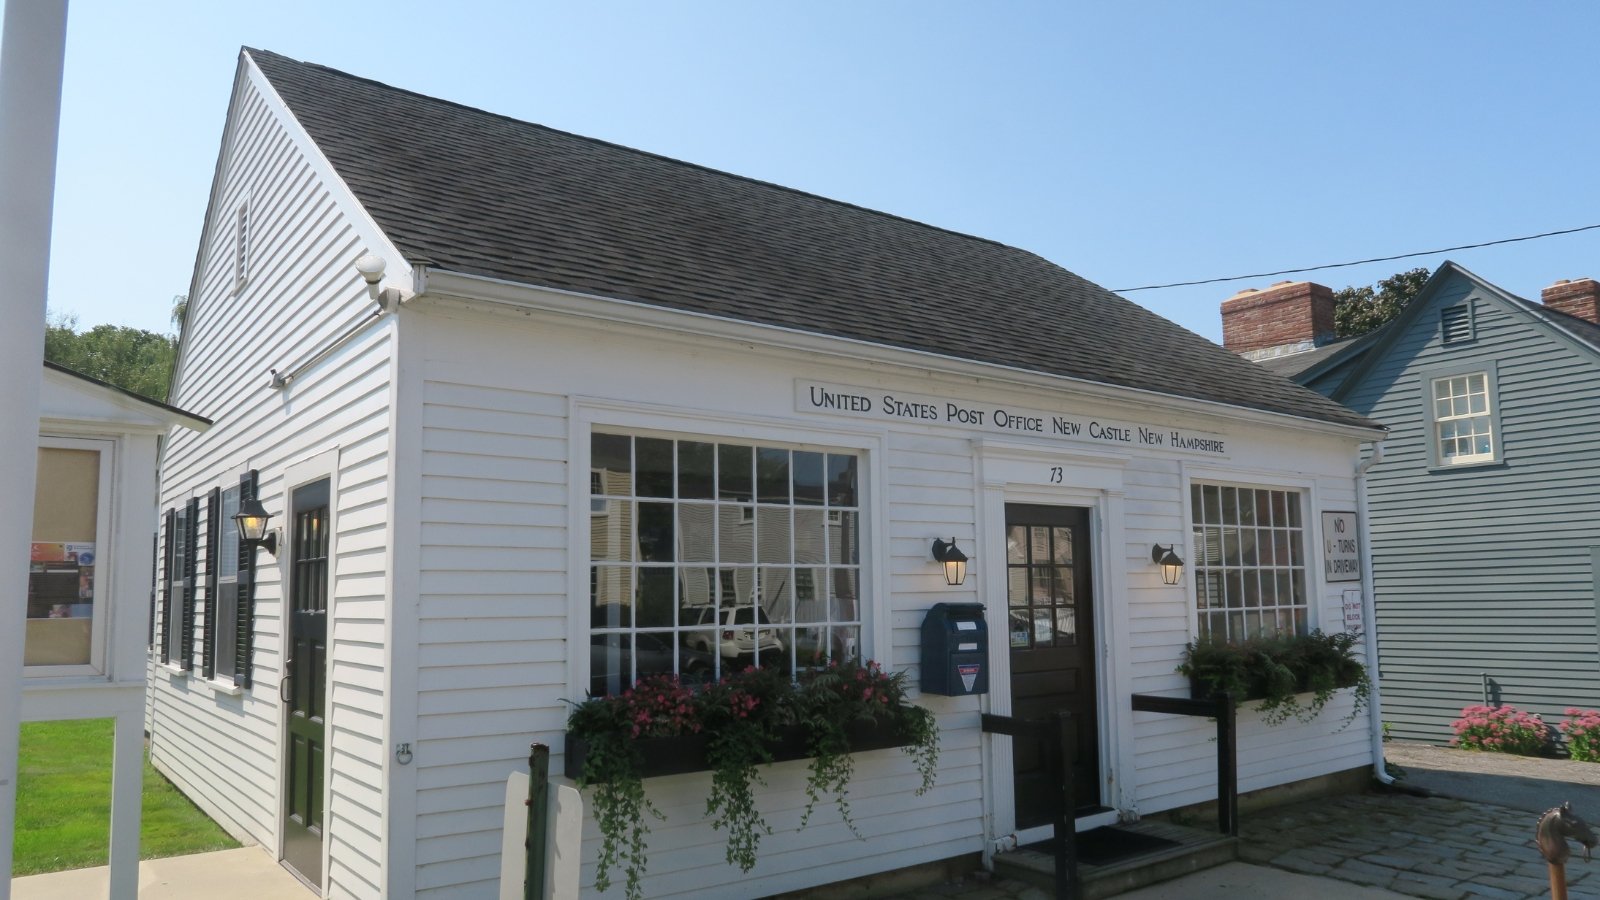
This tiny island town just east of Portsmouth is the most expensive place to live in the Granite State. Surrounded by the Atlantic and the Piscataqua River, New Castle combines history, prestige, and some of the best coastal views in New England.
With extremely limited inventory and zoning that preserves its historic character, home values here have climbed rapidly. The town’s exclusivity, combined with its unbeatable location, ensures New Castle will likely remain at the top of New Hampshire’s housing market for years to come.