Would you like to save this?
Forget the horse farms—Kentucky’s priciest towns are all about sky-high property prices these days. The Zillow Home Value Index shows just how far home prices have climbed, from Louisville suburbs to fast-growing towns near Cincinnati. In many places, even modest houses now carry price tags that would’ve seemed impossible a decade ago. Whether you’re buying, selling, or just wondering where all the money’s going, these 33 towns reveal where Kentucky’s real estate market is anything but cheap.
33. Westport – 61% Home Price Increase Since 2017
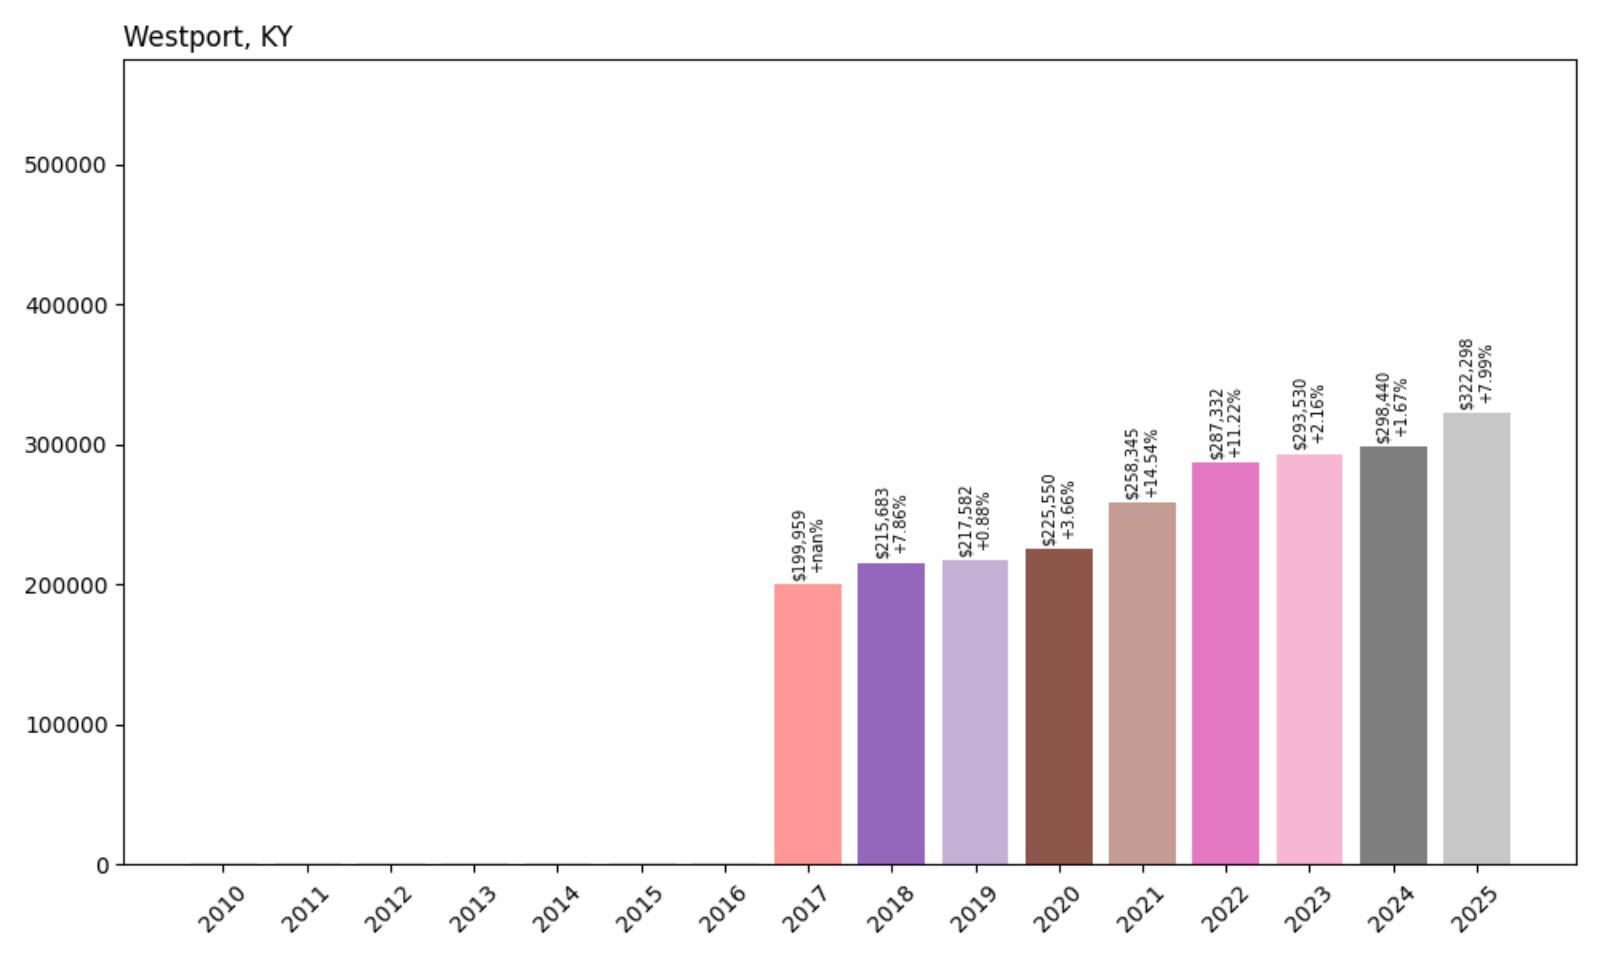
- 2017: $199,959
- 2018: $215,683 (+$15,724, +7.86% from previous year)
- 2019: $217,582 (+$1,899, +0.88% from previous year)
- 2020: $225,550 (+$7,968, +3.66% from previous year)
- 2021: $258,345 (+$32,795, +14.54% from previous year)
- 2022: $287,332 (+$28,987, +11.22% from previous year)
- 2023: $293,530 (+$6,199, +2.16% from previous year)
- 2024: $298,440 (+$4,910, +1.67% from previous year)
- 2025: $322,298 (+$23,858, +7.99% from previous year)
Westport’s housing market has climbed by 61% since 2017, with the average home value reaching $322,298 in July 2025. Much of the increase has come in the last five years, with particularly strong gains in 2021 and 2022 when year-over-year jumps exceeded 14% and 11%, respectively. After a brief cooling period, the market surged again in 2025, pointing to renewed interest and possible undersupply.
Westport – Scenic Riverfront Living Keeps Demand Steady
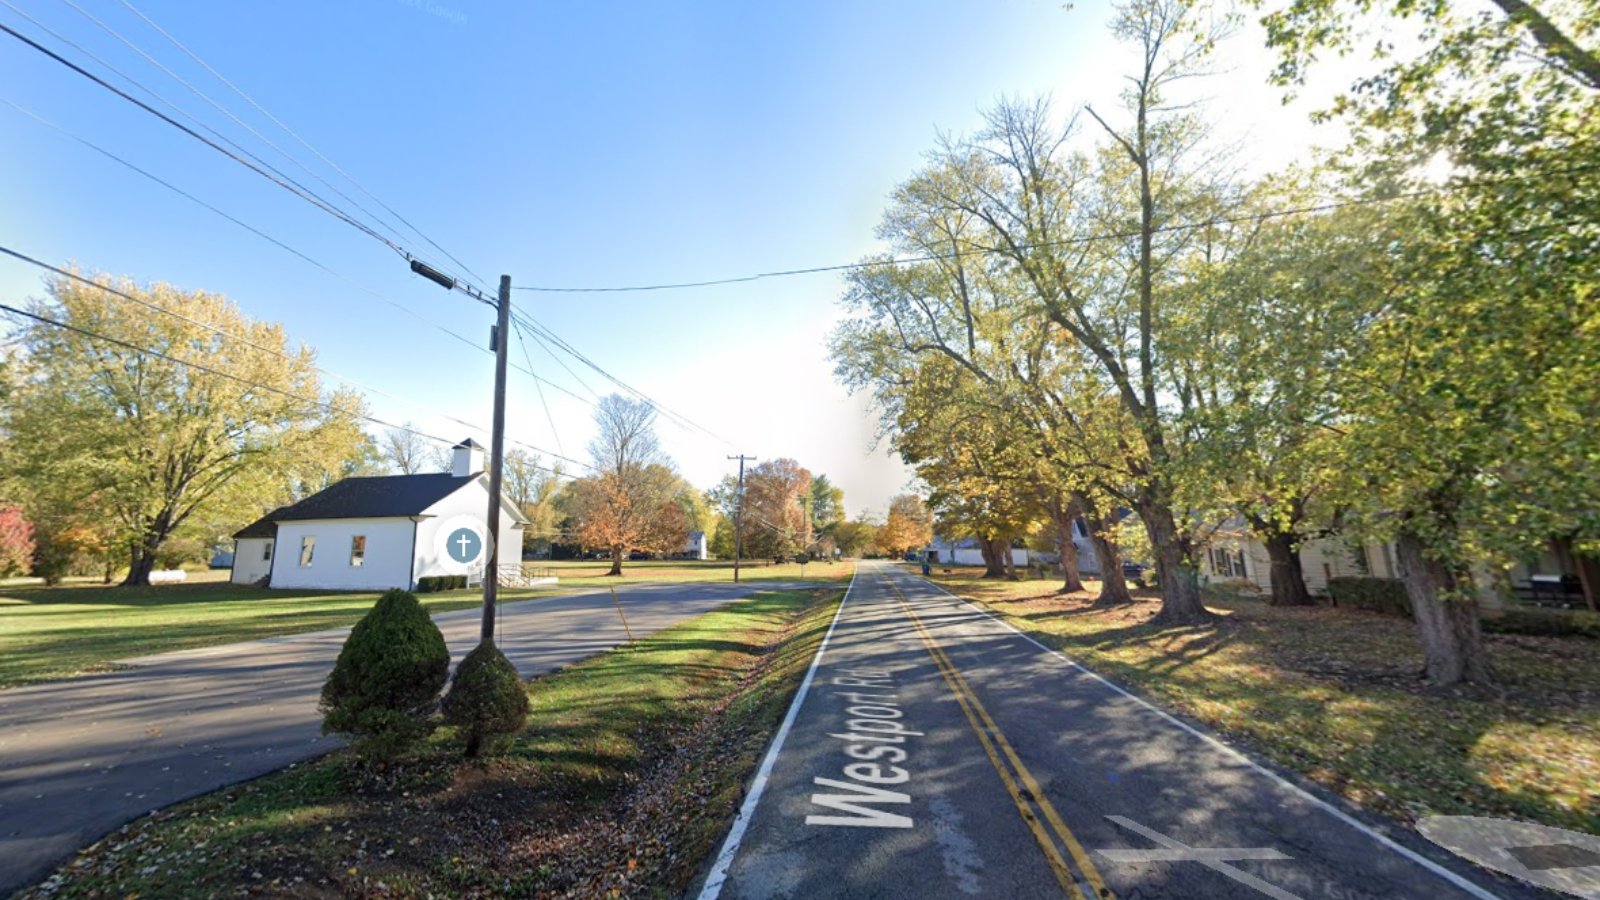
Located along the Ohio River in Oldham County, Westport offers a small-town vibe with close proximity to Louisville. It’s known for its peaceful surroundings and rural charm, which appeals to retirees and families looking for open space and scenic views. Its limited housing inventory has helped support prices in recent years, even during slower market cycles. Despite being one of the lesser-known high-value areas, its riverside properties and access to outdoor recreation have driven consistent demand.
Westport’s real estate market shows clear signs of being responsive to broader economic trends—while prices softened slightly in 2023, the rebound in 2025 suggests either renewed buyer confidence or very low supply. With its mix of affordability relative to neighboring towns and its natural appeal, Westport remains a contender for buyers seeking space, tranquility, and long-term investment potential.
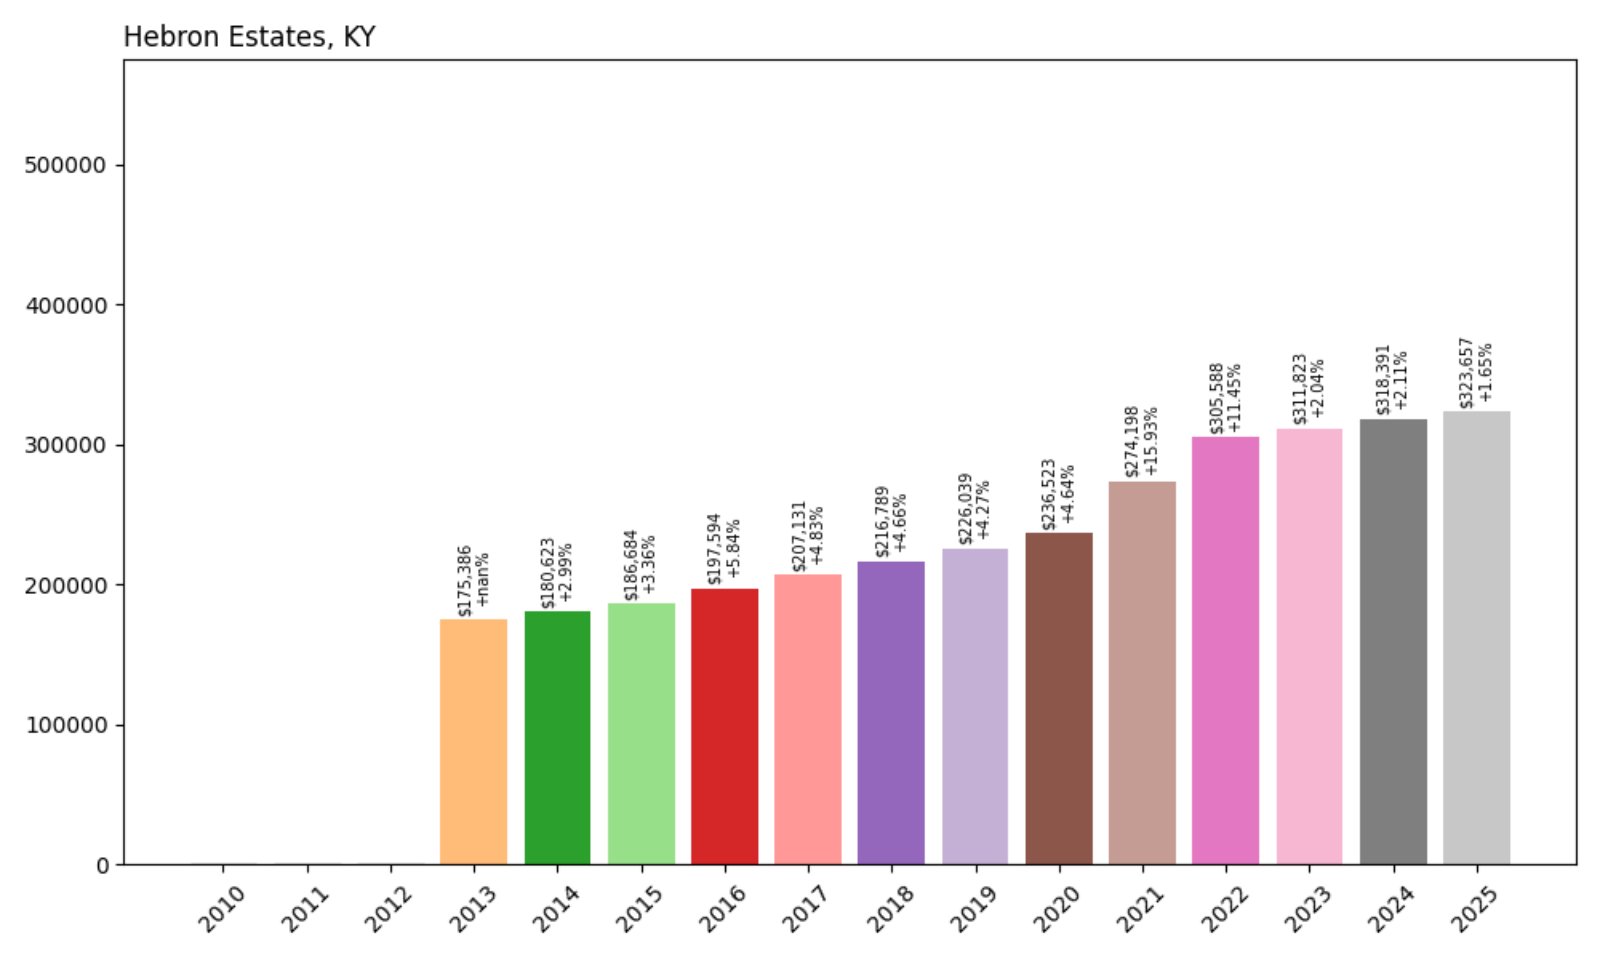
32. Hebron Estates – 85% Home Price Increase Since 2013
- 2013: $175,386
- 2014: $180,623 (+$5,238, +2.99% from previous year)
- 2015: $186,684 (+$6,060, +3.36% from previous year)
- 2016: $197,594 (+$10,911, +5.84% from previous year)
- 2017: $207,131 (+$9,537, +4.83% from previous year)
- 2018: $216,789 (+$9,658, +4.66% from previous year)
- 2019: $226,039 (+$9,250, +4.27% from previous year)
- 2020: $236,523 (+$10,484, +4.64% from previous year)
- 2021: $274,198 (+$37,674, +15.93% from previous year)
- 2022: $305,588 (+$31,390, +11.45% from previous year)
- 2023: $311,823 (+$6,235, +2.04% from previous year)
- 2024: $318,391 (+$6,568, +2.11% from previous year)
- 2025: $323,657 (+$5,266, +1.65% from previous year)
Hebron Estates has seen a sharp 85% increase in home values since 2013. While the rate of growth has slowed since its 2021–2022 peak, the steady climb in the following years suggests long-term stability. The current home value sits at $323,657, placing it among Kentucky’s higher-end markets despite its modest size.
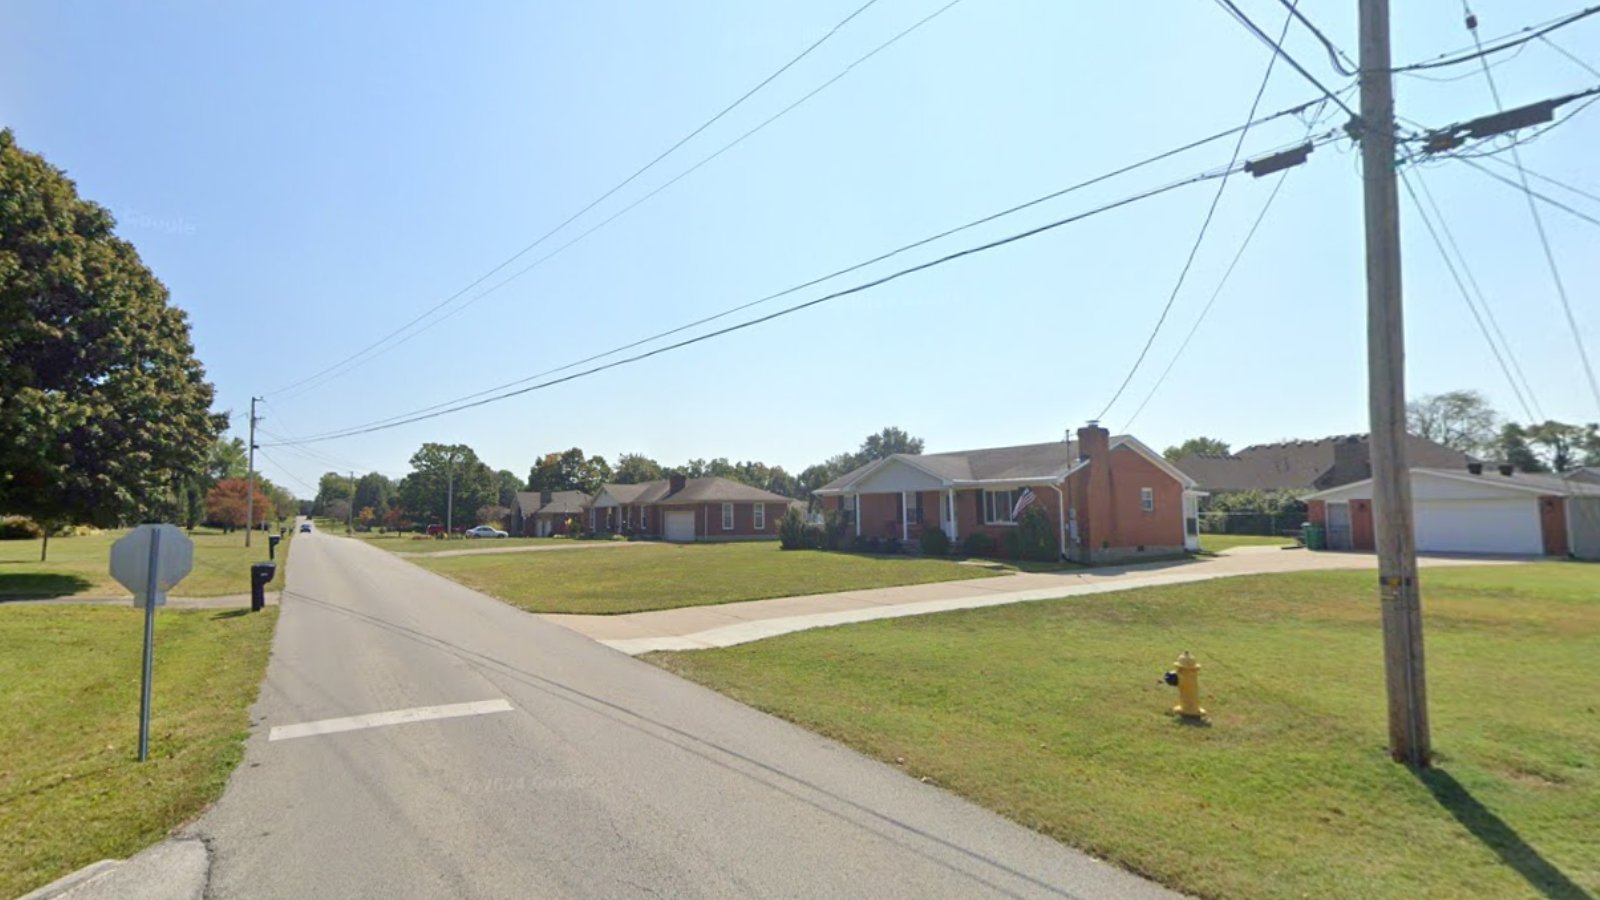
Hebron Estates – Steady Growth in a Quiet Residential Hub
Kitchen Style?
Part of Bullitt County, Hebron Estates offers residents a quiet, residential lifestyle within commuting distance of Louisville. The area has benefited from regional economic stability and infrastructure improvements that have made it increasingly accessible. The housing stock, largely composed of single-family homes, appeals to upwardly mobile families and professionals.
With housing affordability issues pushing buyers away from Louisville’s core, towns like Hebron Estates have absorbed that demand. The big leaps in 2021 and 2022 reflect that trend. Even as year-over-year growth cooled to under 2% in the latest years, its price level remains high—signaling that demand is still outpacing supply, albeit more slowly than during the recent housing boom.
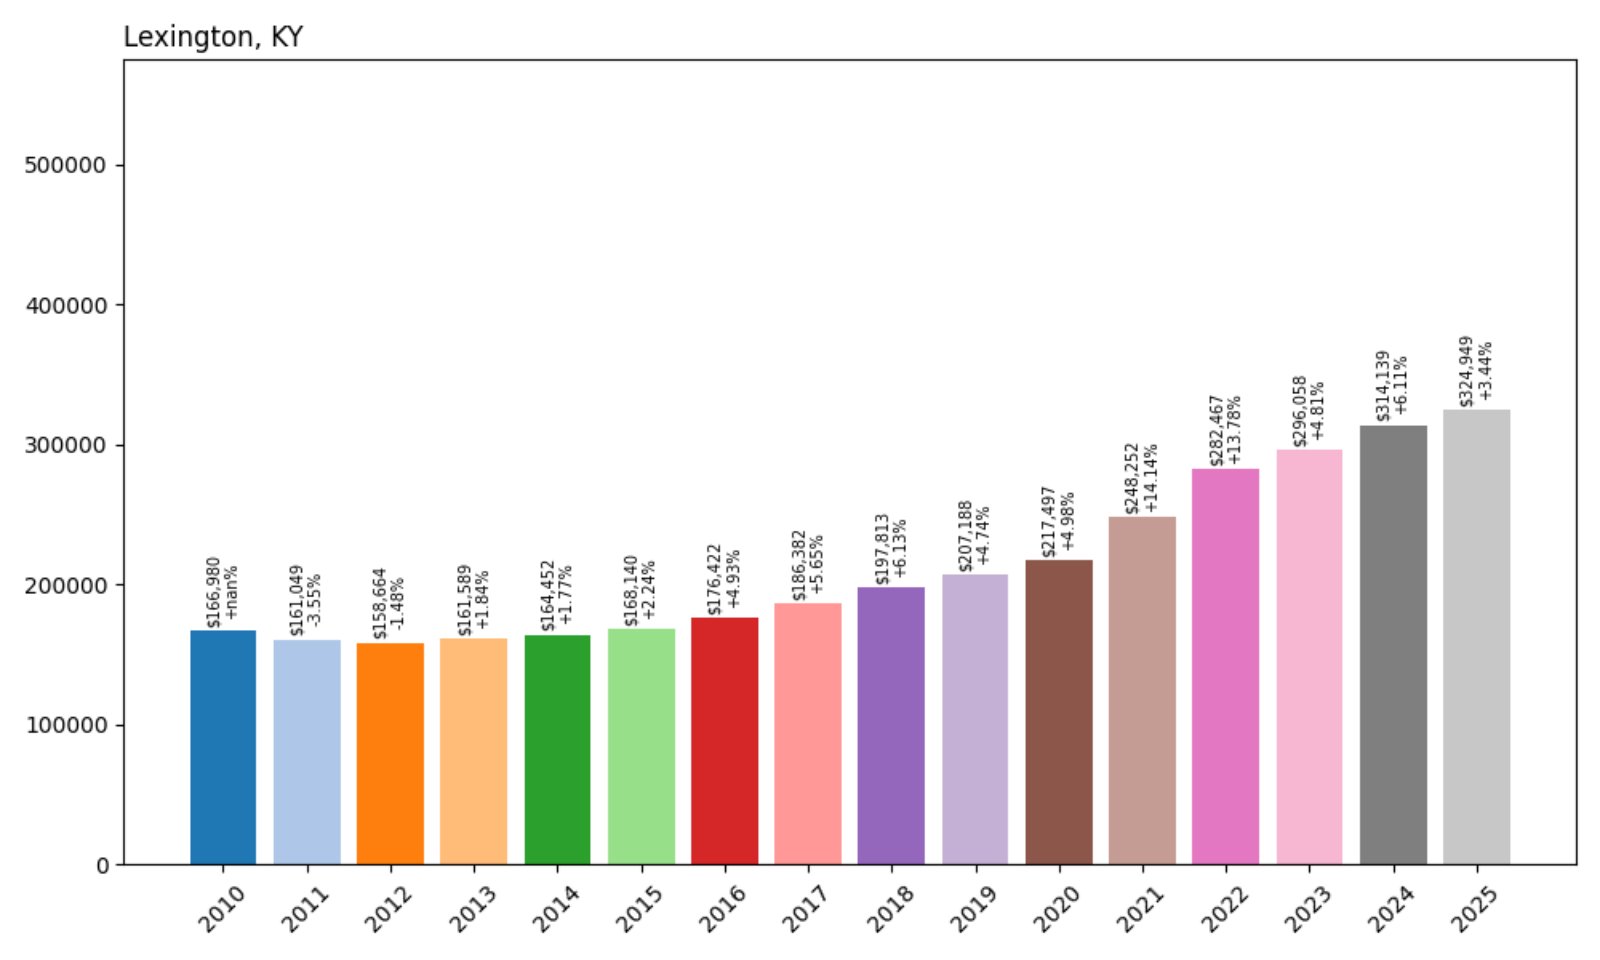
31. Lexington – 95% Home Price Increase Since 2010
- 2010: $166,980
- 2011: $161,049 (−$5,931, −3.55% from previous year)
- 2012: $158,664 (−$2,385, −1.48% from previous year)
- 2013: $161,589 (+$2,924, +1.84% from previous year)
- 2014: $164,452 (+$2,863, +1.77% from previous year)
- 2015: $168,140 (+$3,688, +2.24% from previous year)
- 2016: $176,422 (+$8,282, +4.93% from previous year)
- 2017: $186,382 (+$9,960, +5.65% from previous year)
- 2018: $197,813 (+$11,430, +6.13% from previous year)
- 2019: $207,188 (+$9,375, +4.74% from previous year)
- 2020: $217,497 (+$10,309, +4.98% from previous year)
- 2021: $248,252 (+$30,755, +14.14% from previous year)
- 2022: $282,467 (+$34,215, +13.78% from previous year)
- 2023: $296,058 (+$13,591, +4.81% from previous year)
- 2024: $314,139 (+$18,081, +6.11% from previous year)
- 2025: $324,949 (+$10,810, +3.44% from previous year)
Lexington has nearly doubled its average home value since 2010, now sitting at $324,949 in 2025. Price increases were modest through the 2010s before accelerating sharply during the 2021–2022 housing surge. The continued growth since then reflects robust local demand, especially given Lexington’s position as a key urban and economic center in Kentucky.
Lexington – Bluegrass Hub with Big City Appeal
Lexington stands out not just for its home values but for its cultural and economic role in Kentucky. As the second-largest city in the state, it’s home to the University of Kentucky, a major healthcare sector, and a growing tech and equine economy. With a strong job market and consistent in-migration, housing demand has been resilient even during cooling periods.
While not as explosive as some rural towns, Lexington’s price trajectory has been dependable. Its broad mix of housing—from urban condos to historic neighborhoods—ensures accessibility for a range of buyers. Continued infrastructure development, including public transit and downtown revitalization, suggests that Lexington will remain a high-demand market for the foreseeable future.
30. Georgetown – 90% Home Price Increase Since 2010

Home Stratosphere Guide
Your Personality Already Knows
How Your Home Should Feel
113 pages of room-by-room design guidance built around your actual brain, your actual habits, and the way you actually live.
You might be an ISFJ or INFP designer…
You design through feeling — your spaces are personal, comforting, and full of meaning. The guide covers your exact color palettes, room layouts, and the one mistake your type always makes.
The full guide maps all 16 types to specific rooms, palettes & furniture picks ↓
You might be an ISTJ or INTJ designer…
You crave order, function, and visual calm. The guide shows you how to create spaces that feel both serene and intentional — without ending up sterile.
The full guide maps all 16 types to specific rooms, palettes & furniture picks ↓
You might be an ENFP or ESTP designer…
You design by instinct and energy. Your home should feel alive. The guide shows you how to channel that into rooms that feel curated, not chaotic.
The full guide maps all 16 types to specific rooms, palettes & furniture picks ↓
You might be an ENTJ or ESTJ designer…
You value quality, structure, and things done right. The guide gives you the framework to build rooms that feel polished without overthinking every detail.
The full guide maps all 16 types to specific rooms, palettes & furniture picks ↓
- 2010: $171,331
- 2011: $168,312 (−$3,019, −1.76% from previous year)
- 2012: $158,084 (−$10,228, −6.08% from previous year)
- 2013: $161,446 (+$3,362, +2.13% from previous year)
- 2014: $164,949 (+$3,502, +2.17% from previous year)
- 2015: $169,180 (+$4,232, +2.57% from previous year)
- 2016: $178,453 (+$9,272, +5.48% from previous year)
- 2017: $187,778 (+$9,326, +5.23% from previous year)
- 2018: $200,189 (+$12,411, +6.61% from previous year)
- 2019: $207,825 (+$7,636, +3.81% from previous year)
- 2020: $218,063 (+$10,238, +4.93% from previous year)
- 2021: $249,542 (+$31,479, +14.44% from previous year)
- 2022: $284,583 (+$35,042, +14.04% from previous year)
- 2023: $297,988 (+$13,405, +4.71% from previous year)
- 2024: $316,029 (+$18,042, +6.05% from previous year)
- 2025: $325,764 (+$9,735, +3.08% from previous year)
Georgetown’s home values have surged by 90% since 2010. Growth was steady in the 2010s, with dramatic acceleration from 2020 through 2022, when prices jumped over $60,000 in just two years. Even as the pace slowed, the town’s position in Kentucky’s top 30 most expensive markets has remained firm.
Georgetown – Growth Fueled by Industry and Proximity
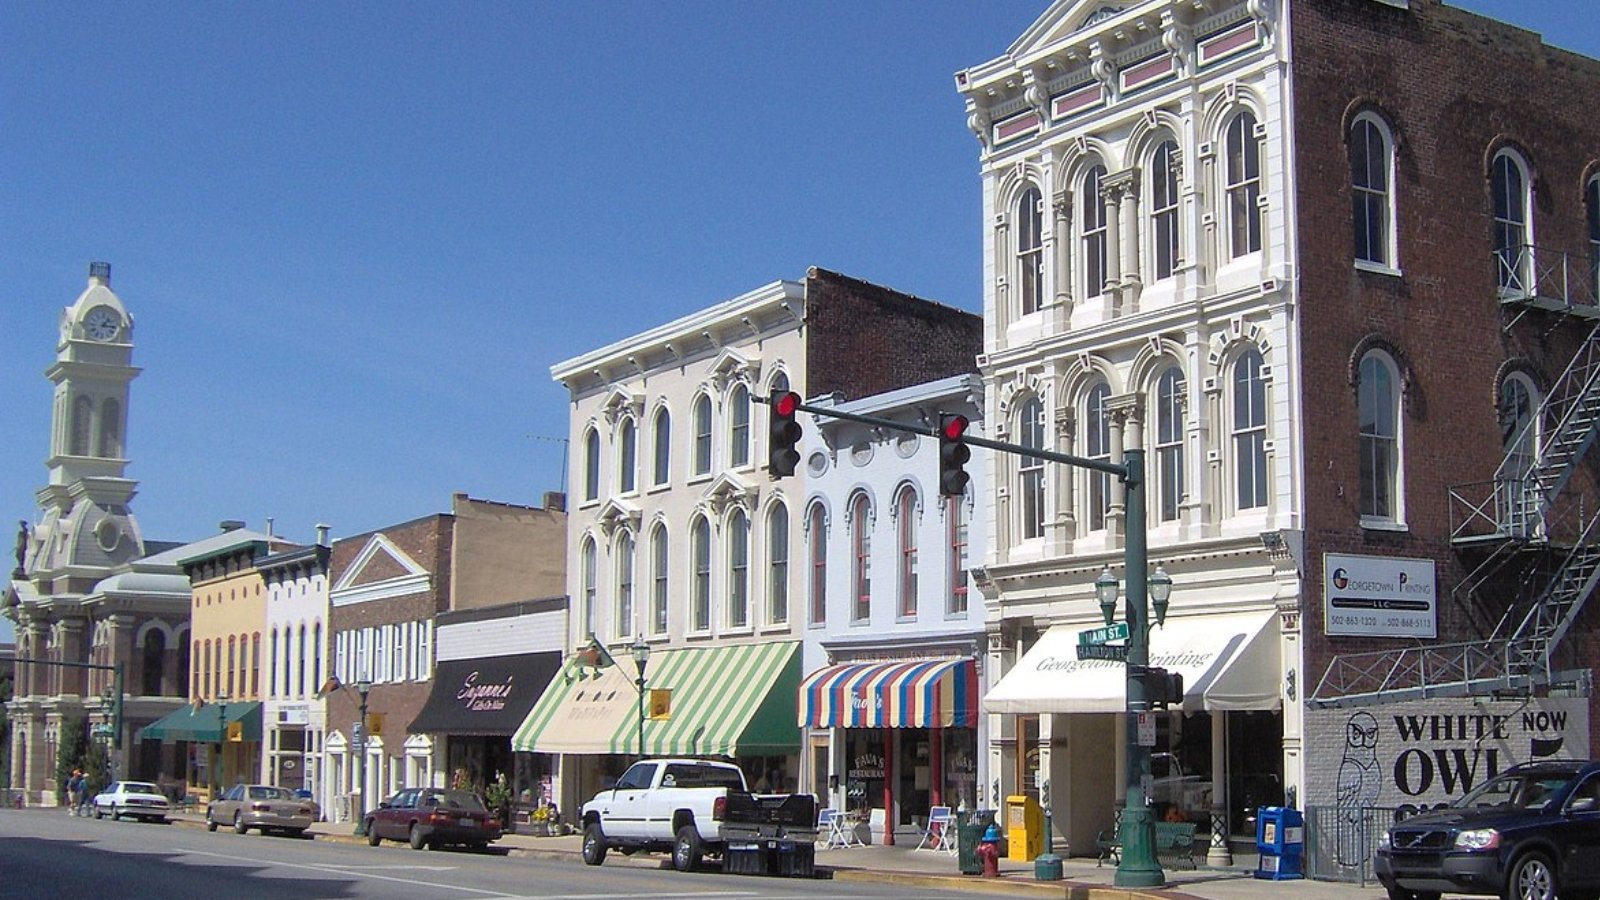
Located just north of Lexington, Georgetown has become a hotspot for commuters and industry workers. Toyota’s massive manufacturing presence has provided a stable economic base, driving sustained interest in the area. The town has responded with new development, improved schools, and better transportation links.
With a balance of suburban ease and industrial opportunity, Georgetown offers one of the best combinations of affordability and value growth in the state. Its continued price appreciation suggests it remains attractive to buyers priced out of Lexington, yet still wanting access to Central Kentucky’s amenities.
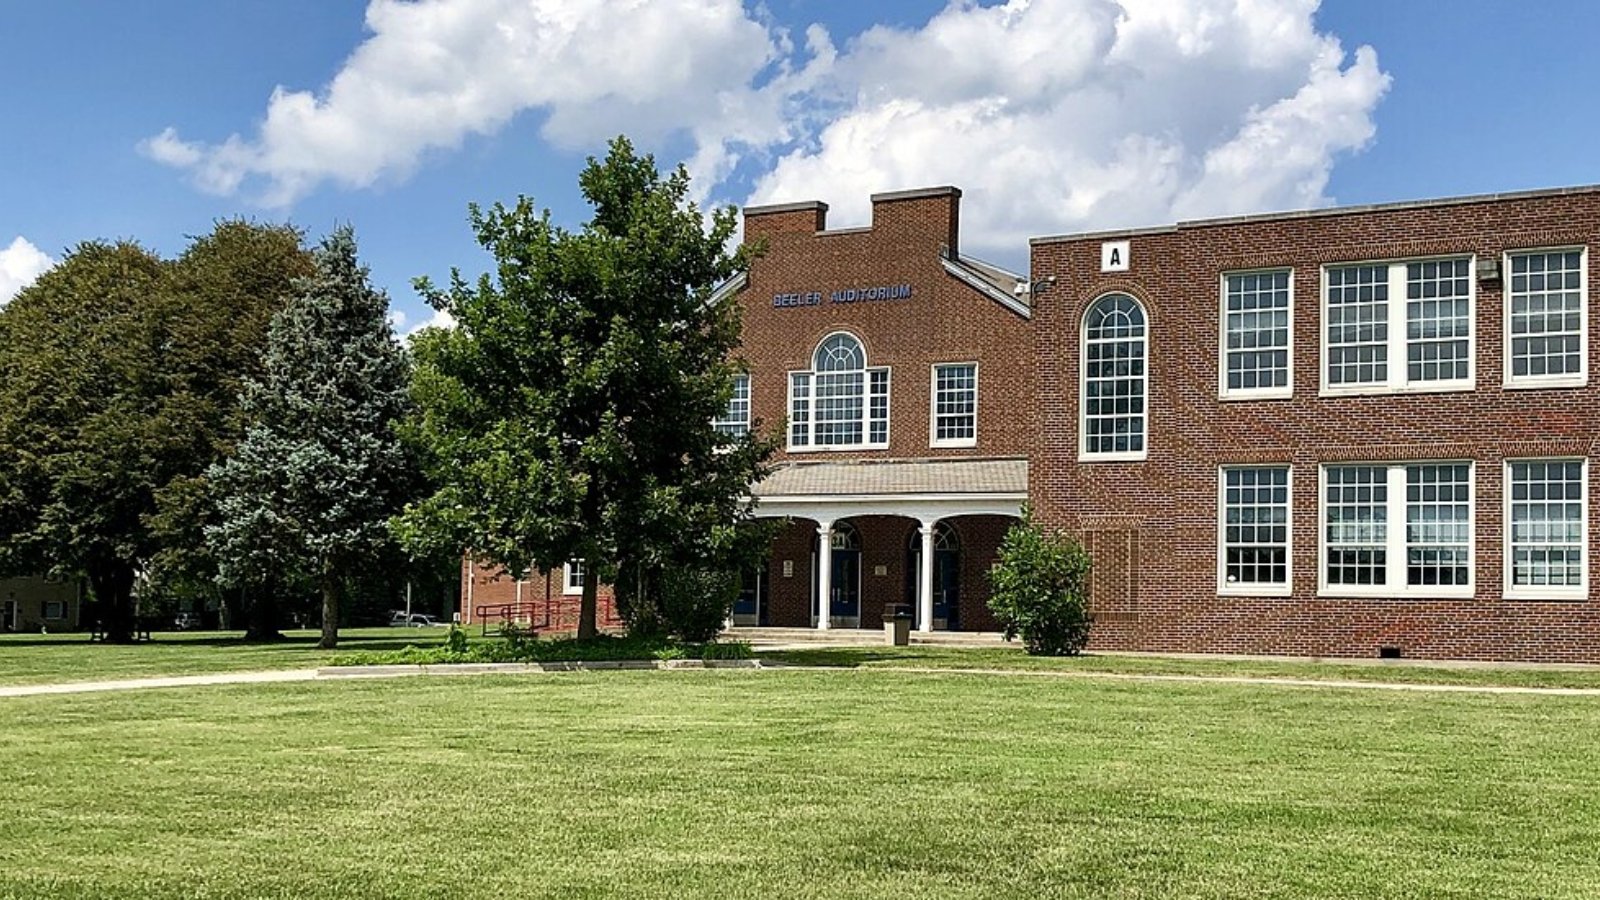
29. Pendleton – 98% Home Price Increase Since 2010
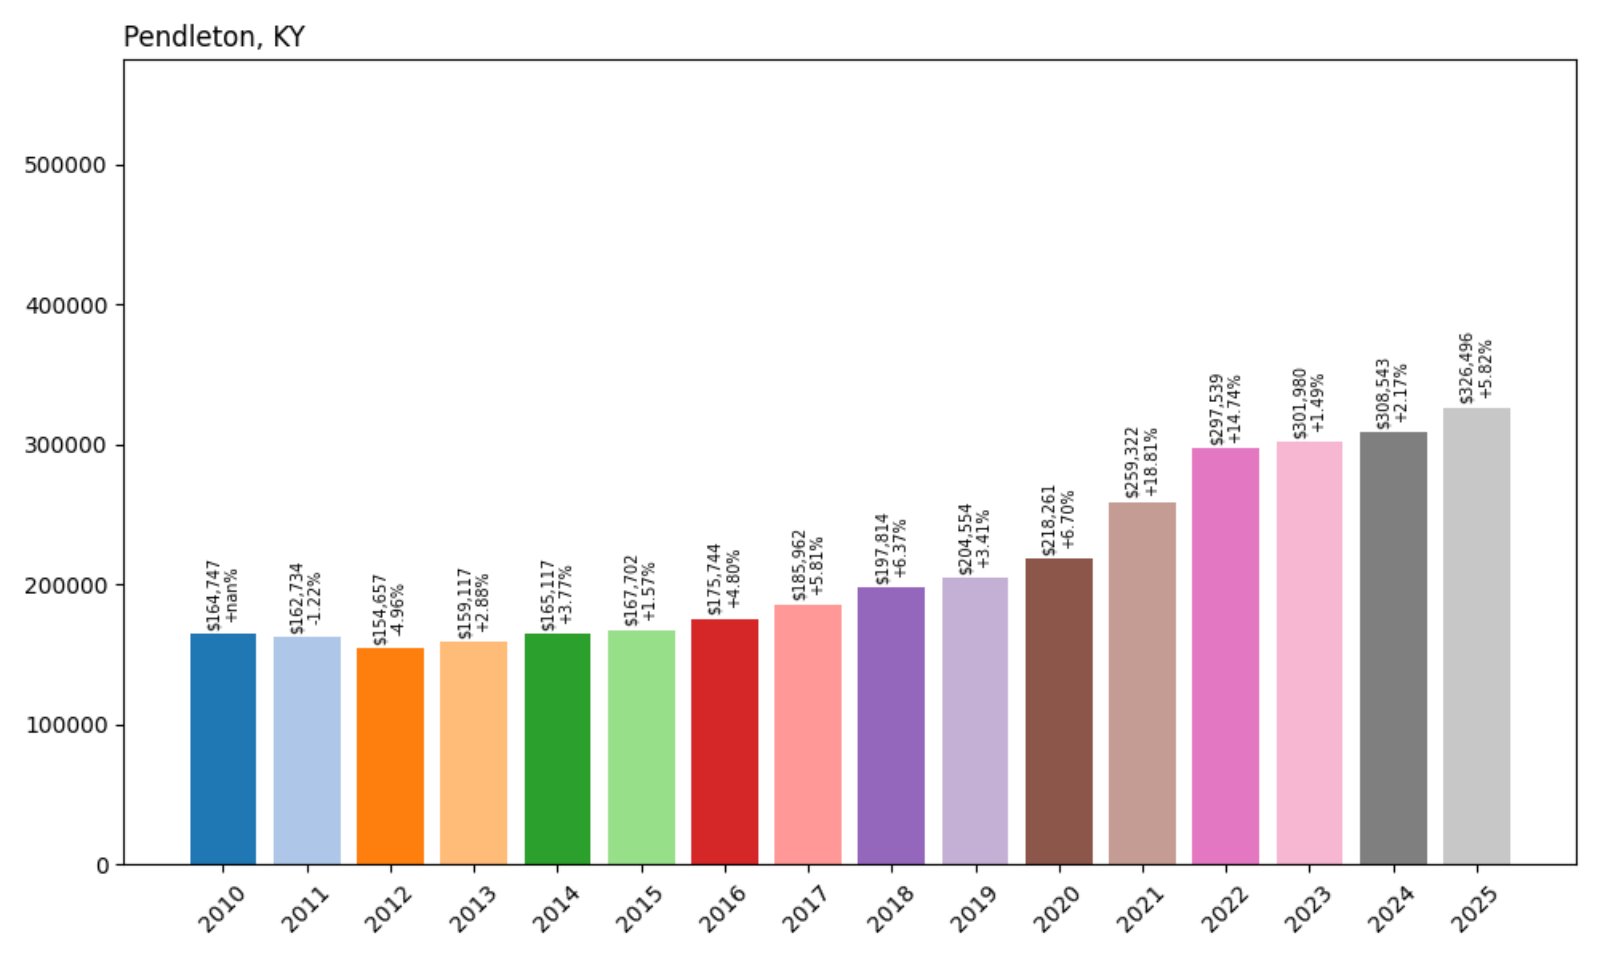
- 2010: $164,747
- 2011: $162,734 (−$2,013, −1.22% from previous year)
- 2012: $154,657 (−$8,077, −4.96% from previous year)
- 2013: $159,117 (+$4,460, +2.88% from previous year)
- 2014: $165,117 (+$6,000, +3.77% from previous year)
- 2015: $167,702 (+$2,585, +1.57% from previous year)
- 2016: $175,744 (+$8,042, +4.80% from previous year)
- 2017: $185,962 (+$10,219, +5.81% from previous year)
- 2018: $197,814 (+$11,851, +6.37% from previous year)
- 2019: $204,554 (+$6,741, +3.41% from previous year)
- 2020: $218,261 (+$13,706, +6.70% from previous year)
- 2021: $259,322 (+$41,061, +18.81% from previous year)
- 2022: $297,539 (+$38,217, +14.74% from previous year)
- 2023: $301,980 (+$4,441, +1.49% from previous year)
- 2024: $308,543 (+$6,563, +2.17% from previous year)
- 2025: $326,496 (+$17,953, +5.82% from previous year)
Pendleton’s nearly doubled home value over the past 15 years signals its emergence as one of Kentucky’s more competitive housing markets. The largest spikes occurred during the 2021–2022 surge, but even in recent years, growth has remained steady.
Pendleton – Quiet Growth with High ROI
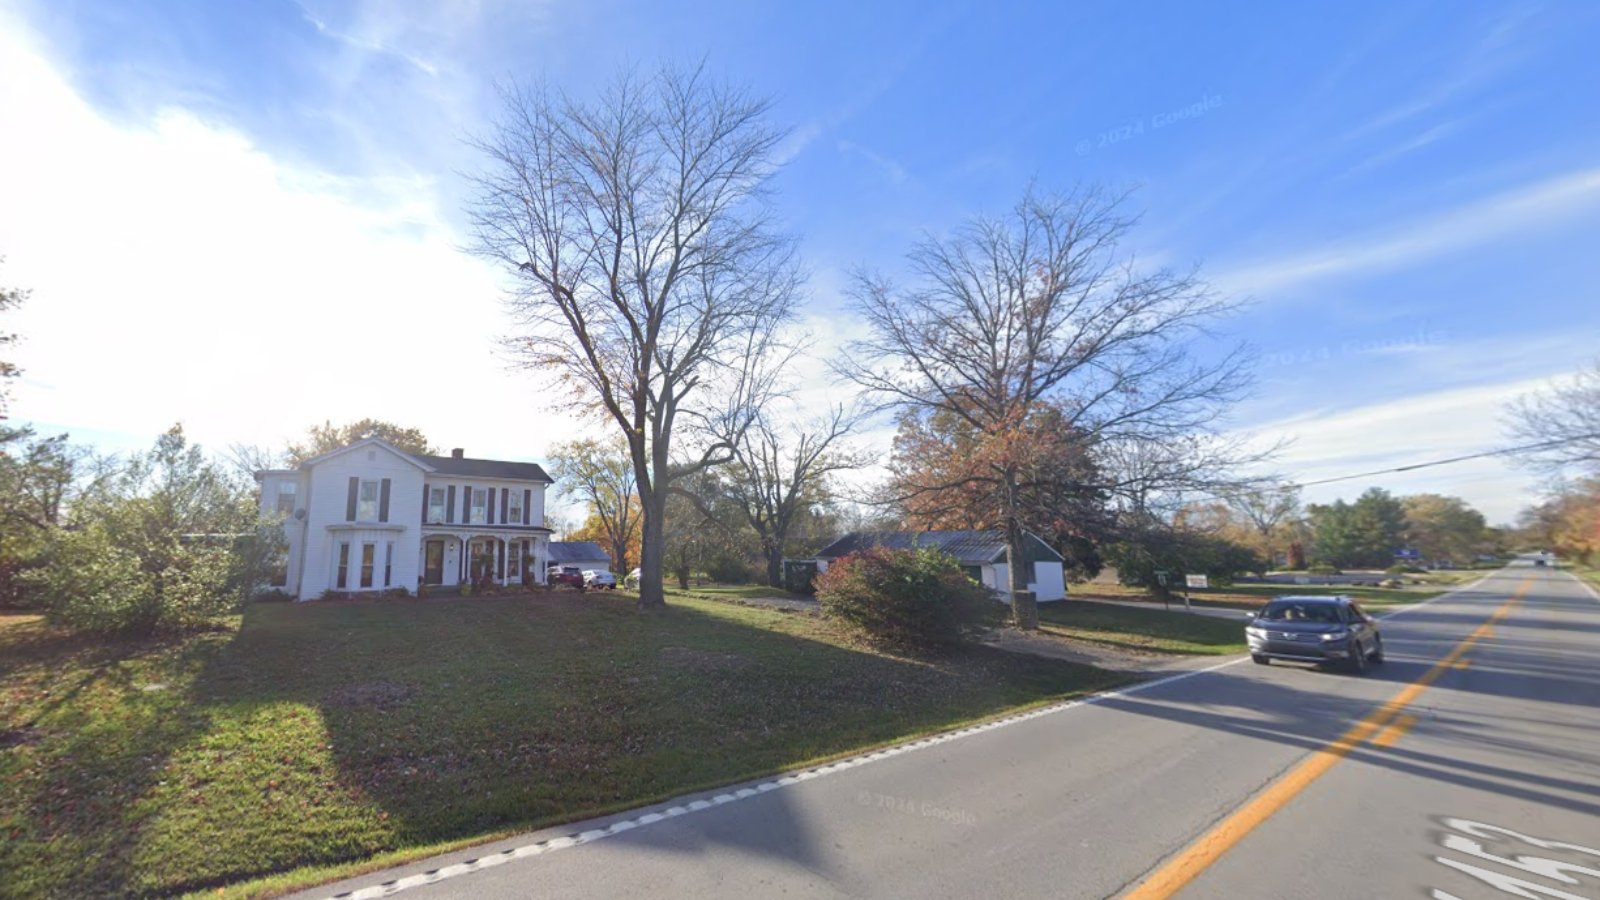
Situated in Henry County, Pendleton offers a quieter rural setting within reach of larger job markets like Louisville and Frankfort. That balance has made it increasingly attractive to homebuyers seeking more land and lower property taxes while still investing in an appreciating asset.
The 2025 average of $326,496 reflects both its increased popularity and rising construction costs. With fewer new developments than more urban towns, scarcity likely plays a key role in sustaining demand here. Pendleton’s rise in the rankings shows that even smaller towns can outperform expectations in the housing market.
28. Verona – 87% Home Price Increase Since 2010

- 2010: $176,866
- 2011: $167,930 (−$8,936, −5.05% from previous year)
- 2012: $175,607 (+$7,677, +4.57% from previous year)
- 2013: $184,342 (+$8,736, +4.97% from previous year)
- 2014: $184,981 (+$639, +0.35% from previous year)
- 2015: $193,208 (+$8,227, +4.45% from previous year)
- 2016: $190,706 (−$2,502, −1.29% from previous year)
- 2017: $195,268 (+$4,562, +2.39% from previous year)
- 2018: $224,882 (+$29,614, +15.17% from previous year)
- 2019: $238,114 (+$13,232, +5.88% from previous year)
- 2020: $248,842 (+$10,728, +4.51% from previous year)
- 2021: $279,625 (+$30,783, +12.37% from previous year)
- 2022: $308,664 (+$29,039, +10.38% from previous year)
- 2023: $312,031 (+$3,368, +1.09% from previous year)
- 2024: $315,508 (+$3,477, +1.11% from previous year)
- 2025: $330,305 (+$14,797, +4.69% from previous year)
Verona’s home prices have climbed from $176,866 in 2010 to $330,305 in 2025—a total increase of 87%. While early years saw moderate growth, the biggest jumps came between 2018 and 2022, when the area attracted new residents and development surged. More recently, price growth has settled to a steadier pace.
Verona – Affordable Countryside Appeal Near Northern Kentucky Cities
Verona is a Boone County community nestled between rural farmland and growing suburbs. While it has remained less densely developed than other parts of Northern Kentucky, its proximity to Florence, Burlington, and Cincinnati makes it an appealing option for commuters seeking a more peaceful home base.
The strong double-digit gains during the pandemic-era housing boom coincided with a wave of demand for more space and lower density living. In the years since, Verona’s appreciation has cooled but stayed positive, suggesting long-term confidence in the local housing stock. New construction, school investment, and location continue to make it a reliable—and still relatively affordable—investment compared to its urban neighbors.
27. Fort Wright – 92% Home Price Increase Since 2010

- 2010: $173,390
- 2011: $175,970 (+$2,580, +1.49% from previous year)
- 2012: $170,436 (−$5,534, −3.14% from previous year)
- 2013: $174,158 (+$3,722, +2.18% from previous year)
- 2014: $182,644 (+$8,487, +4.87% from previous year)
- 2015: $188,811 (+$6,167, +3.38% from previous year)
- 2016: $191,739 (+$2,927, +1.55% from previous year)
- 2017: $207,587 (+$15,848, +8.27% from previous year)
- 2018: $217,146 (+$9,559, +4.60% from previous year)
- 2019: $229,877 (+$12,732, +5.86% from previous year)
- 2020: $242,232 (+$12,354, +5.37% from previous year)
- 2021: $280,258 (+$38,026, +15.70% from previous year)
- 2022: $302,522 (+$22,264, +7.94% from previous year)
- 2023: $307,497 (+$4,975, +1.64% from previous year)
- 2024: $320,998 (+$13,501, +4.39% from previous year)
- 2025: $332,928 (+$11,930, +3.72% from previous year)
Fort Wright’s real estate market has nearly doubled since 2010, rising from $173K to nearly $333K today. Much of that value appreciation came during the 2020–2022 boom, but year-over-year increases have remained steady since, suggesting a mature but still strong housing market.
Fort Wright – Suburban Living With Quick Access to Cincinnati
Just across the river from downtown Cincinnati, Fort Wright benefits from prime location and access to major interstates. It’s one of the preferred Northern Kentucky suburbs for professionals working in the city who want more space, privacy, and access to good schools.
Its elevated prices reflect not just geography, but long-term investment in infrastructure and residential planning. Fort Wright has maintained its appeal through periods of economic uncertainty, and the moderate but consistent growth in recent years suggests that demand remains high—especially among families and commuters seeking value outside the Cincinnati metro core.
26. Crestview Hills – 81% Home Price Increase Since 2010

- 2010: $184,306
- 2011: $177,005 (−$7,301, −3.96% from previous year)
- 2012: $176,237 (−$768, −0.43% from previous year)
- 2013: $181,623 (+$5,386, +3.06% from previous year)
- 2014: $185,249 (+$3,626, +2.00% from previous year)
- 2015: $190,440 (+$5,191, +2.80% from previous year)
- 2016: $201,550 (+$11,110, +5.83% from previous year)
- 2017: $211,975 (+$10,425, +5.17% from previous year)
- 2018: $216,920 (+$4,945, +2.33% from previous year)
- 2019: $231,983 (+$15,064, +6.94% from previous year)
- 2020: $243,071 (+$11,087, +4.78% from previous year)
- 2021: $282,667 (+$39,596, +16.29% from previous year)
- 2022: $304,299 (+$21,633, +7.65% from previous year)
- 2023: $312,049 (+$7,749, +2.55% from previous year)
- 2024: $321,754 (+$9,705, +3.11% from previous year)
- 2025: $332,939 (+$11,185, +3.48% from previous year)
Crestview Hills has enjoyed steady long-term price growth, with values climbing 81% since 2010. Sharp increases in 2021 and 2022 led to a stabilization phase in the following years, but prices have continued ticking upward year after year.
Crestview Hills – Stable Upscale Suburb With Retail and Medical Anchors
Located in Kenton County, Crestview Hills is home to several medical centers and Thomas More University. This small but high-demand suburb is known for its convenient location near I-275, well-maintained neighborhoods, and access to Crestview Hills Town Center, one of the region’s busiest shopping districts.
Increased demand during the COVID-19 housing surge significantly boosted property values here, but ongoing growth shows the town wasn’t just riding a temporary wave. With a blend of higher-end condos and single-family homes, Crestview Hills remains a stronghold of real estate value in Northern Kentucky.
25. Midway – 50% Home Price Increase Since 2010
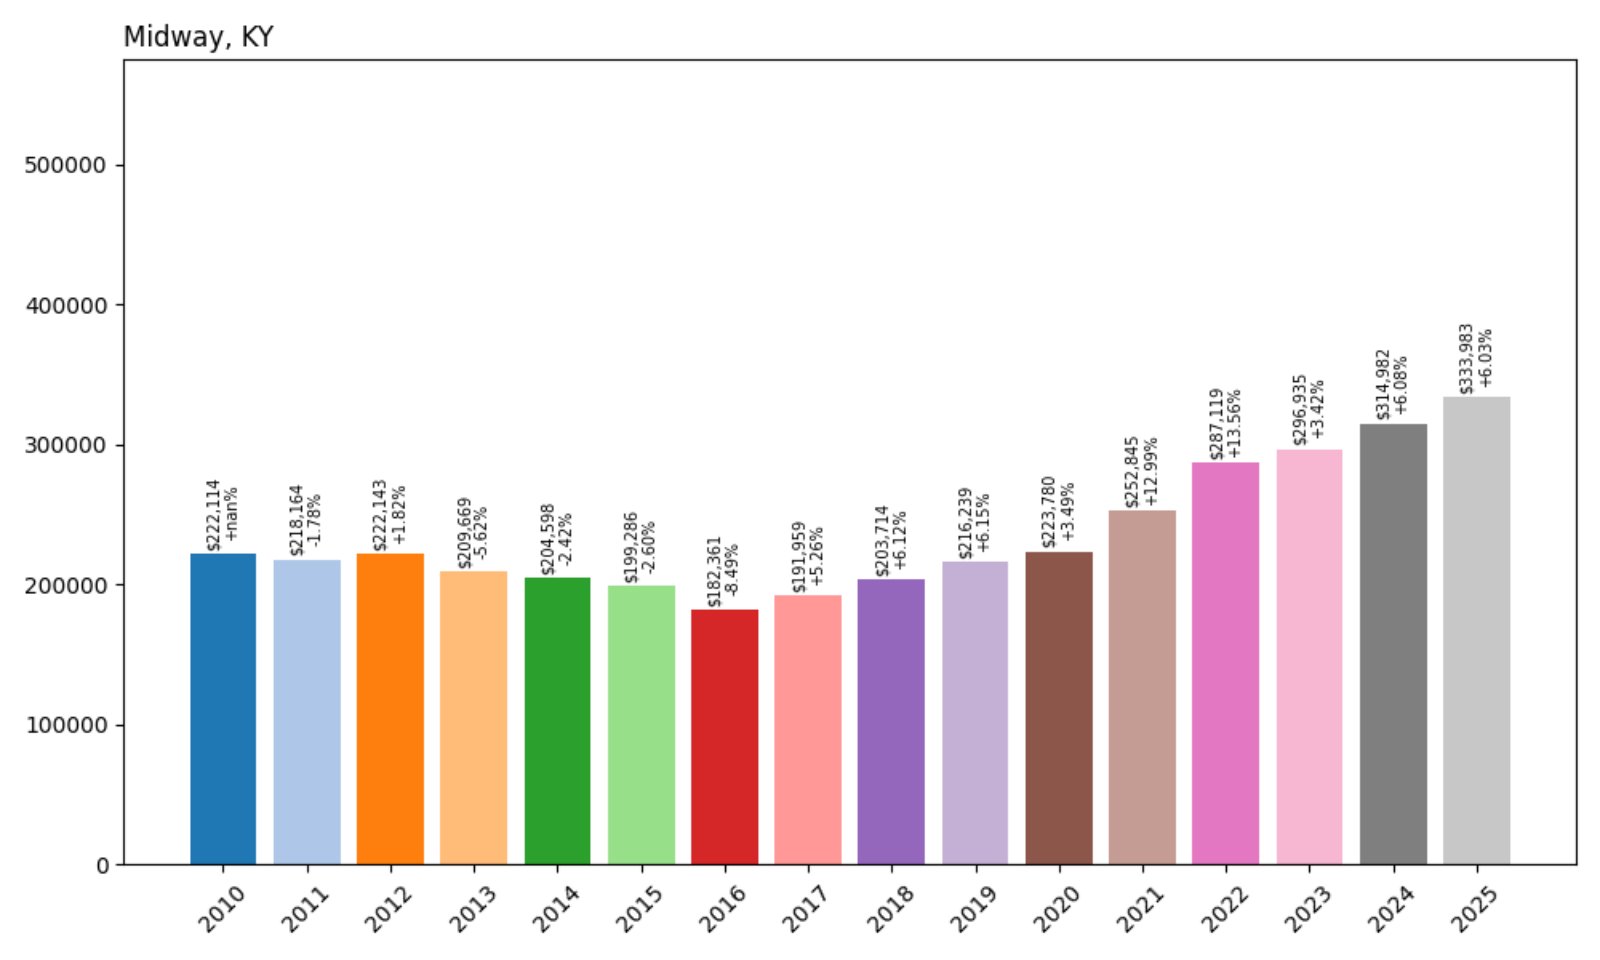
- 2010: $222,114
- 2011: $218,164 (−$3,949, −1.78% from previous year)
- 2012: $222,143 (+$3,978, +1.82% from previous year)
- 2013: $209,669 (−$12,474, −5.62% from previous year)
- 2014: $204,598 (−$5,071, −2.42% from previous year)
- 2015: $199,286 (−$5,312, −2.60% from previous year)
- 2016: $182,361 (−$16,925, −8.49% from previous year)
- 2017: $191,959 (+$9,598, +5.26% from previous year)
- 2018: $203,714 (+$11,755, +6.12% from previous year)
- 2019: $216,239 (+$12,525, +6.15% from previous year)
- 2020: $223,780 (+$7,541, +3.49% from previous year)
- 2021: $252,845 (+$29,064, +12.99% from previous year)
- 2022: $287,119 (+$34,274, +13.56% from previous year)
- 2023: $296,935 (+$9,816, +3.42% from previous year)
- 2024: $314,982 (+$18,047, +6.08% from previous year)
- 2025: $333,983 (+$19,002, +6.03% from previous year)
Midway’s housing market has seen a complex trajectory—marked by declines in the early 2010s followed by a dramatic rebound. From a low of $182K in 2016, values have nearly doubled, reaching $333,983 in 2025.
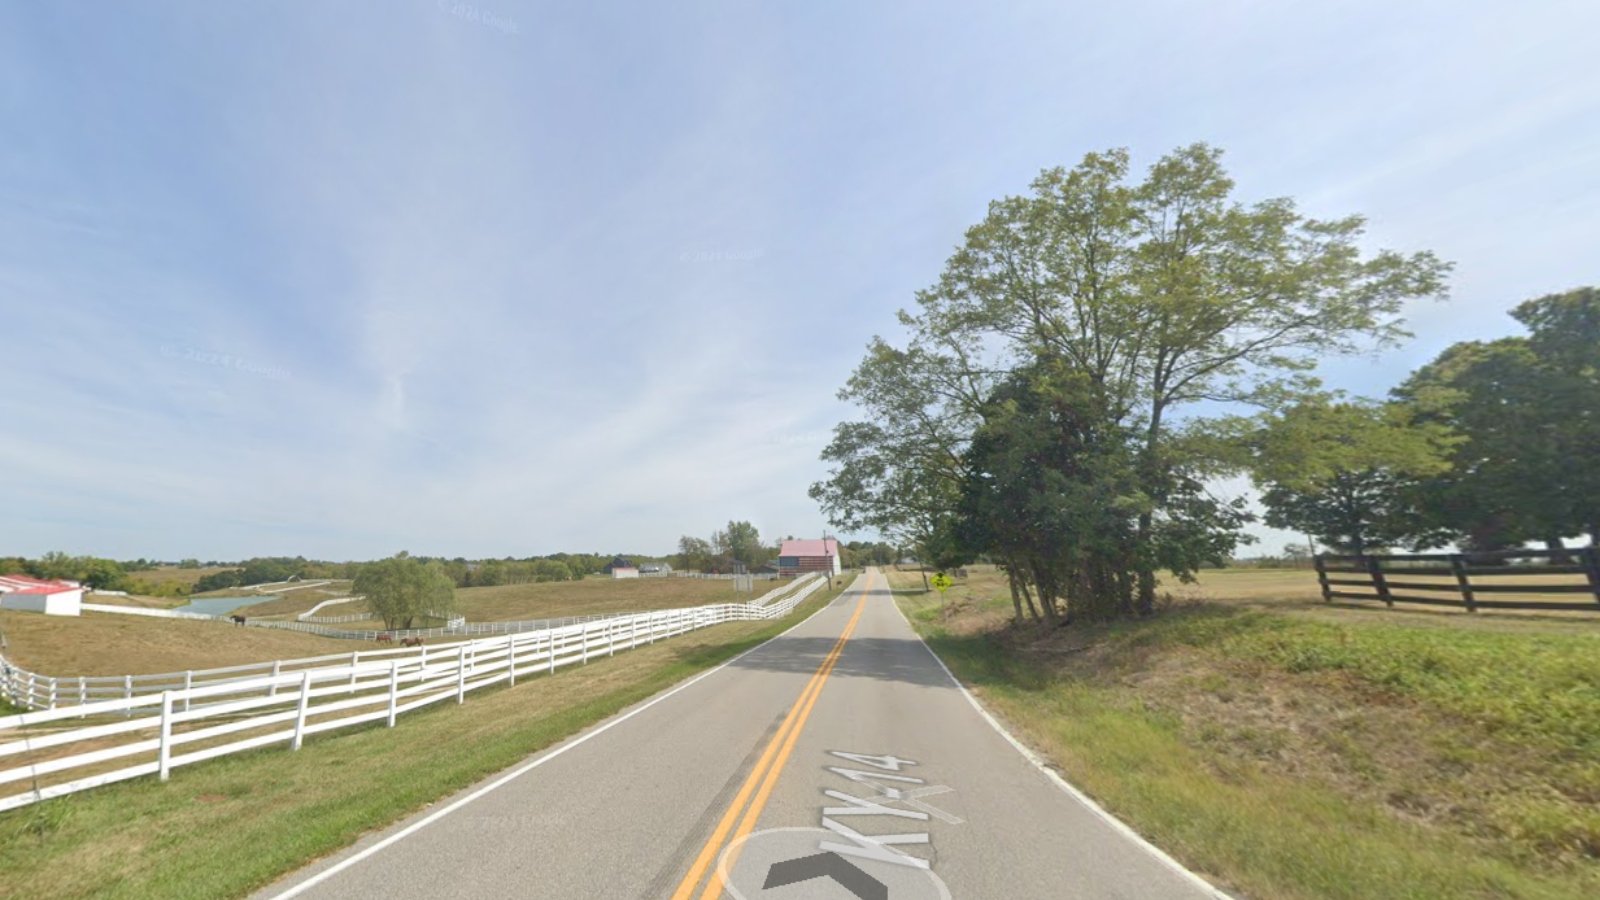
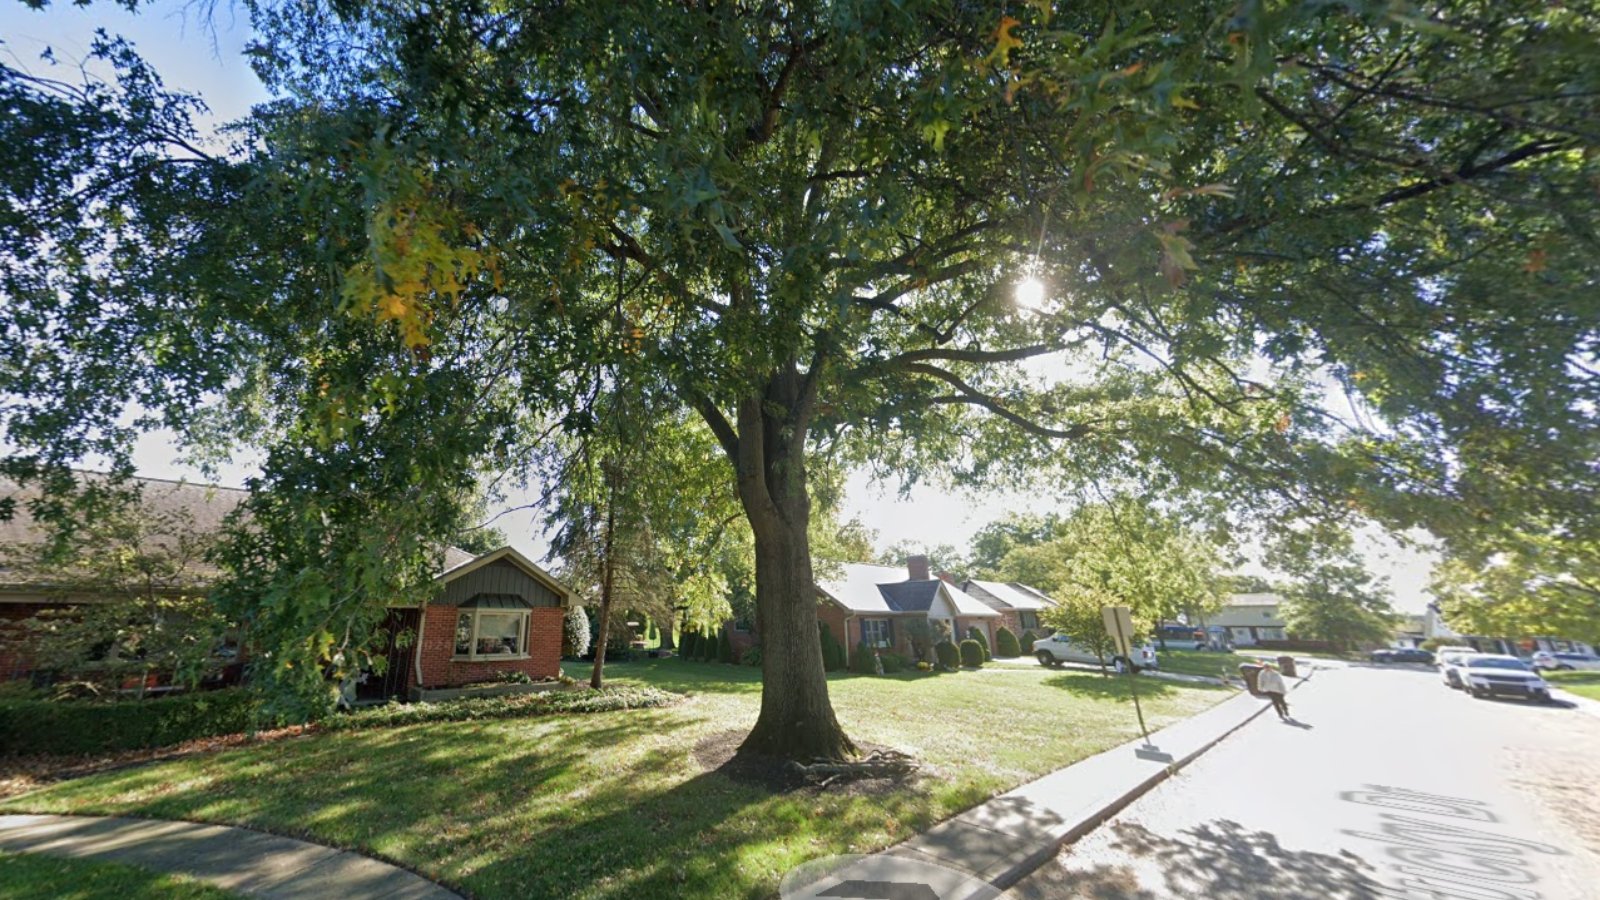
Midway – Charming College Town With Historic Roots
Midway, located in Woodford County, is best known for its historic downtown and Midway University. It offers a unique blend of small-town charm, walkability, and equestrian heritage, all while being situated between Lexington and Frankfort.
The early dips in home prices may have reflected limited growth and underinvestment, but recent years tell a different story. Spurred by demand for authentic communities and tourism traffic, Midway has seen steady revitalization. The dramatic uptick in values since 2021 suggests a growing recognition of the town’s livability, making it one of the state’s more surprising real estate success stories.
24. Walton – 100% Home Price Increase Since 2010

Would you like to save this?
- 2010: $169,354
- 2011: $165,993 (−$3,361, −1.98% from previous year)
- 2012: $164,687 (−$1,306, −0.79% from previous year)
- 2013: $170,767 (+$6,080, +3.69% from previous year)
- 2014: $179,046 (+$8,280, +4.85% from previous year)
- 2015: $186,521 (+$7,474, +4.17% from previous year)
- 2016: $190,291 (+$3,770, +2.02% from previous year)
- 2017: $199,188 (+$8,897, +4.68% from previous year)
- 2018: $210,728 (+$11,540, +5.79% from previous year)
- 2019: $223,261 (+$12,533, +5.95% from previous year)
- 2020: $236,637 (+$13,377, +5.99% from previous year)
- 2021: $272,718 (+$36,080, +15.25% from previous year)
- 2022: $315,036 (+$42,318, +15.52% from previous year)
- 2023: $319,802 (+$4,766, +1.51% from previous year)
- 2024: $324,784 (+$4,982, +1.56% from previous year)
- 2025: $339,324 (+$14,540, +4.48% from previous year)
Home prices in Walton have doubled since 2010, reaching $339,324 by 2025. The town experienced its most explosive growth between 2020 and 2022, followed by a more moderate climb. Nonetheless, prices have never dropped, signaling steady demand and market confidence.
Walton – Booming Northern Kentucky Gateway
Walton lies at the intersection of I-75 and I-71, making it a key access point for commuters traveling between Cincinnati and Lexington. Its strategic location has helped it evolve from a quiet community to a bustling residential hub. New housing developments, school investment, and highway access all fuel its growth.
Walton’s affordability compared to neighboring Florence and Union has also helped it attract young families and first-time buyers. As suburban migration continues and infrastructure expands southward, Walton is expected to maintain its growth trajectory—both in population and property values.
23. Lakeside Park – 83% Home Price Increase Since 2010
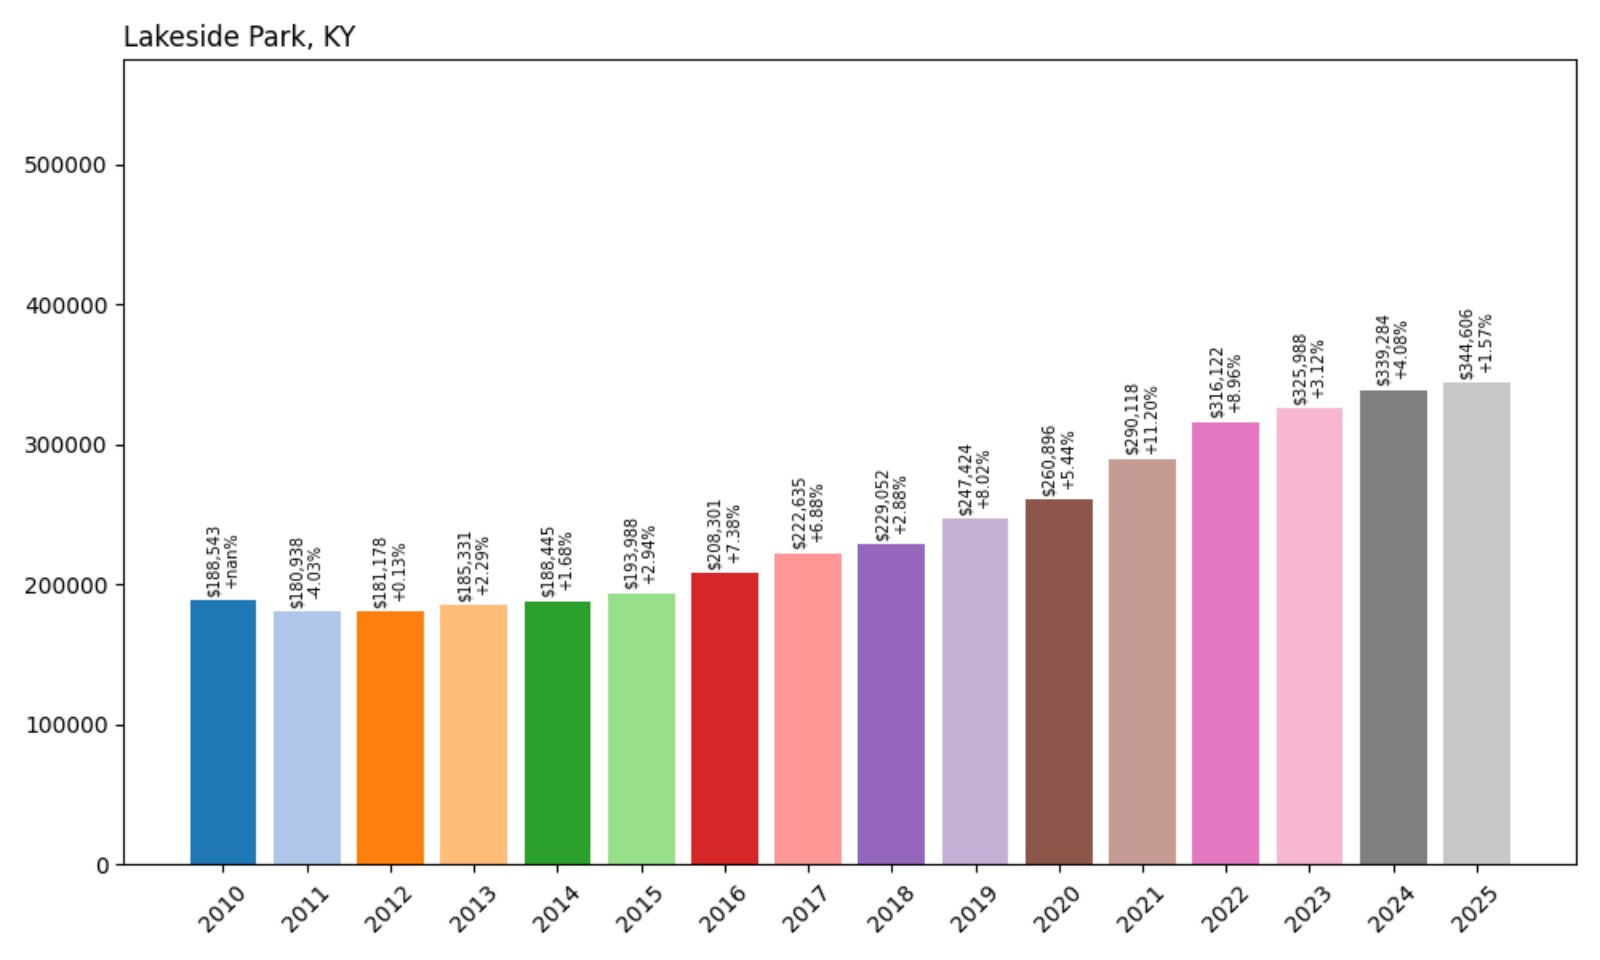
- 2010: $188,543
- 2011: $180,938 (−$7,605, −4.03% from previous year)
- 2012: $181,178 (+$240, +0.13% from previous year)
- 2013: $185,331 (+$4,152, +2.29% from previous year)
- 2014: $188,445 (+$3,114, +1.68% from previous year)
- 2015: $193,988 (+$5,543, +2.94% from previous year)
- 2016: $208,301 (+$14,313, +7.38% from previous year)
- 2017: $222,635 (+$14,334, +6.88% from previous year)
- 2018: $229,052 (+$6,417, +2.88% from previous year)
- 2019: $247,424 (+$18,372, +8.02% from previous year)
- 2020: $260,896 (+$13,472, +5.44% from previous year)
- 2021: $290,118 (+$29,221, +11.20% from previous year)
- 2022: $316,122 (+$26,004, +8.96% from previous year)
- 2023: $325,988 (+$9,866, +3.12% from previous year)
- 2024: $339,284 (+$13,297, +4.08% from previous year)
- 2025: $344,606 (+$5,322, +1.57% from previous year)
Lakeside Park home values have climbed 83% since 2010, currently averaging $344,606. The largest leaps occurred between 2020 and 2022, though prices have continued to inch up steadily each year, showing resilience and strong buyer interest.
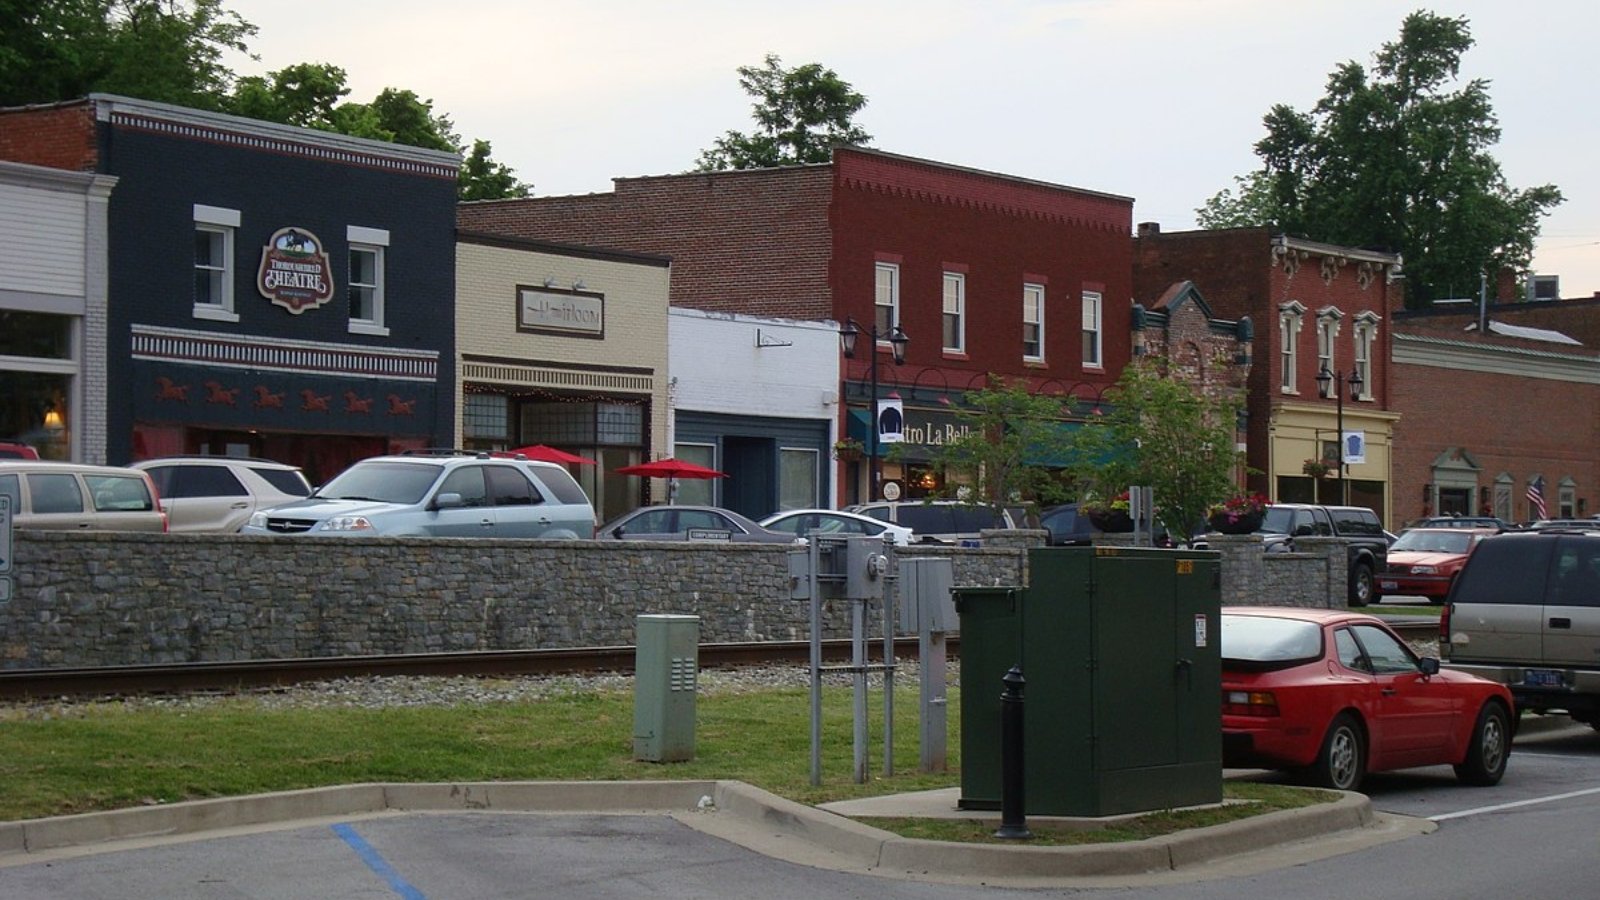
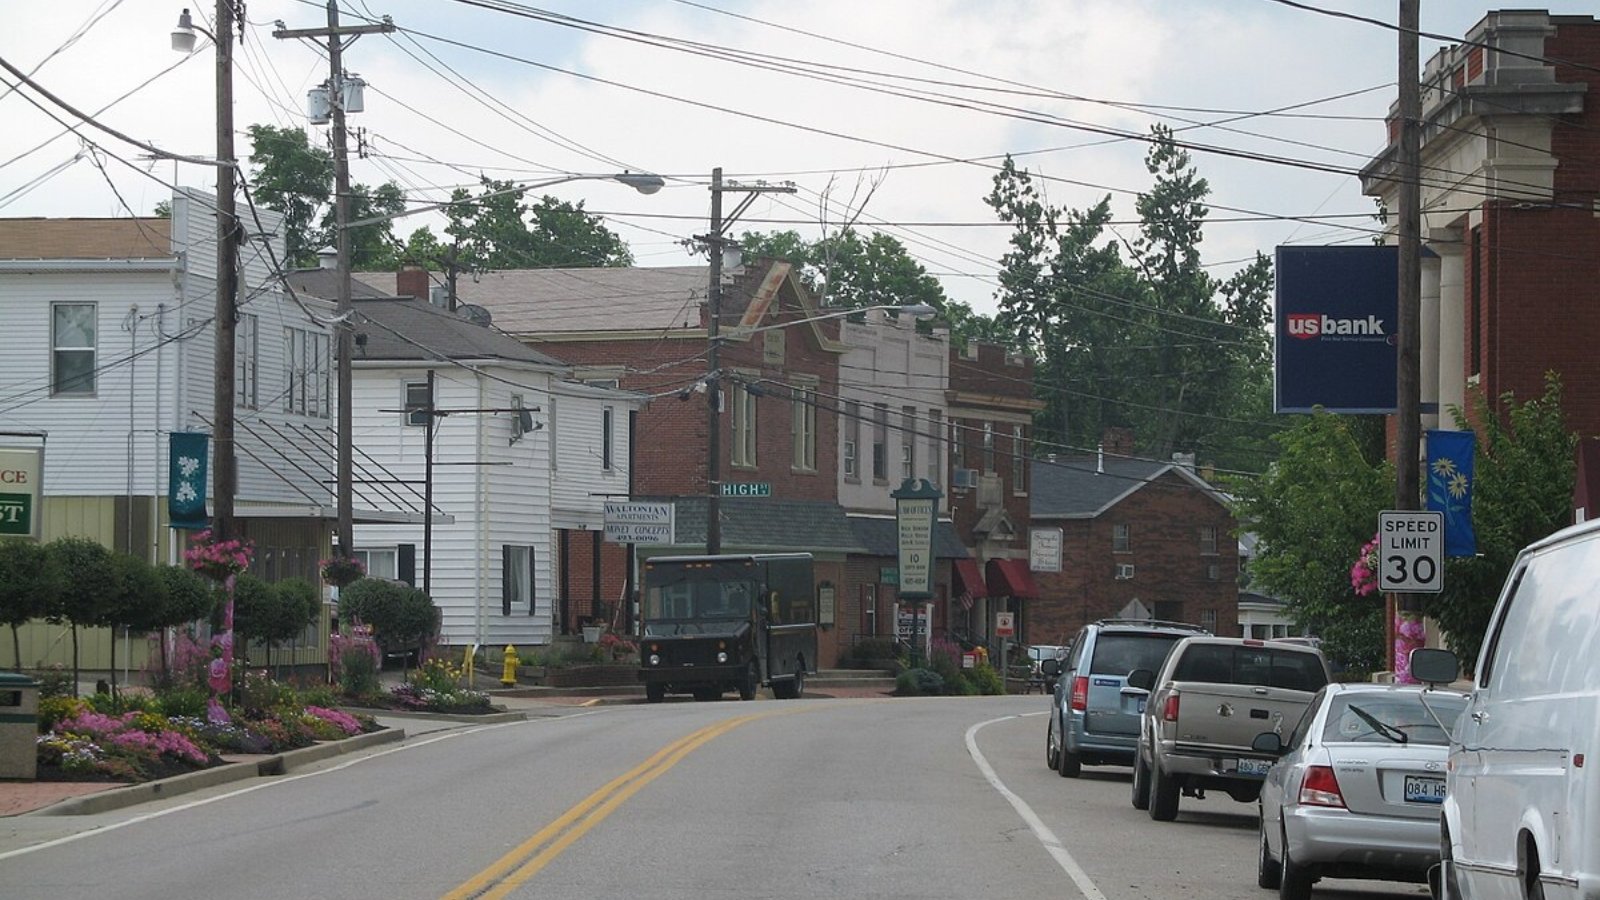
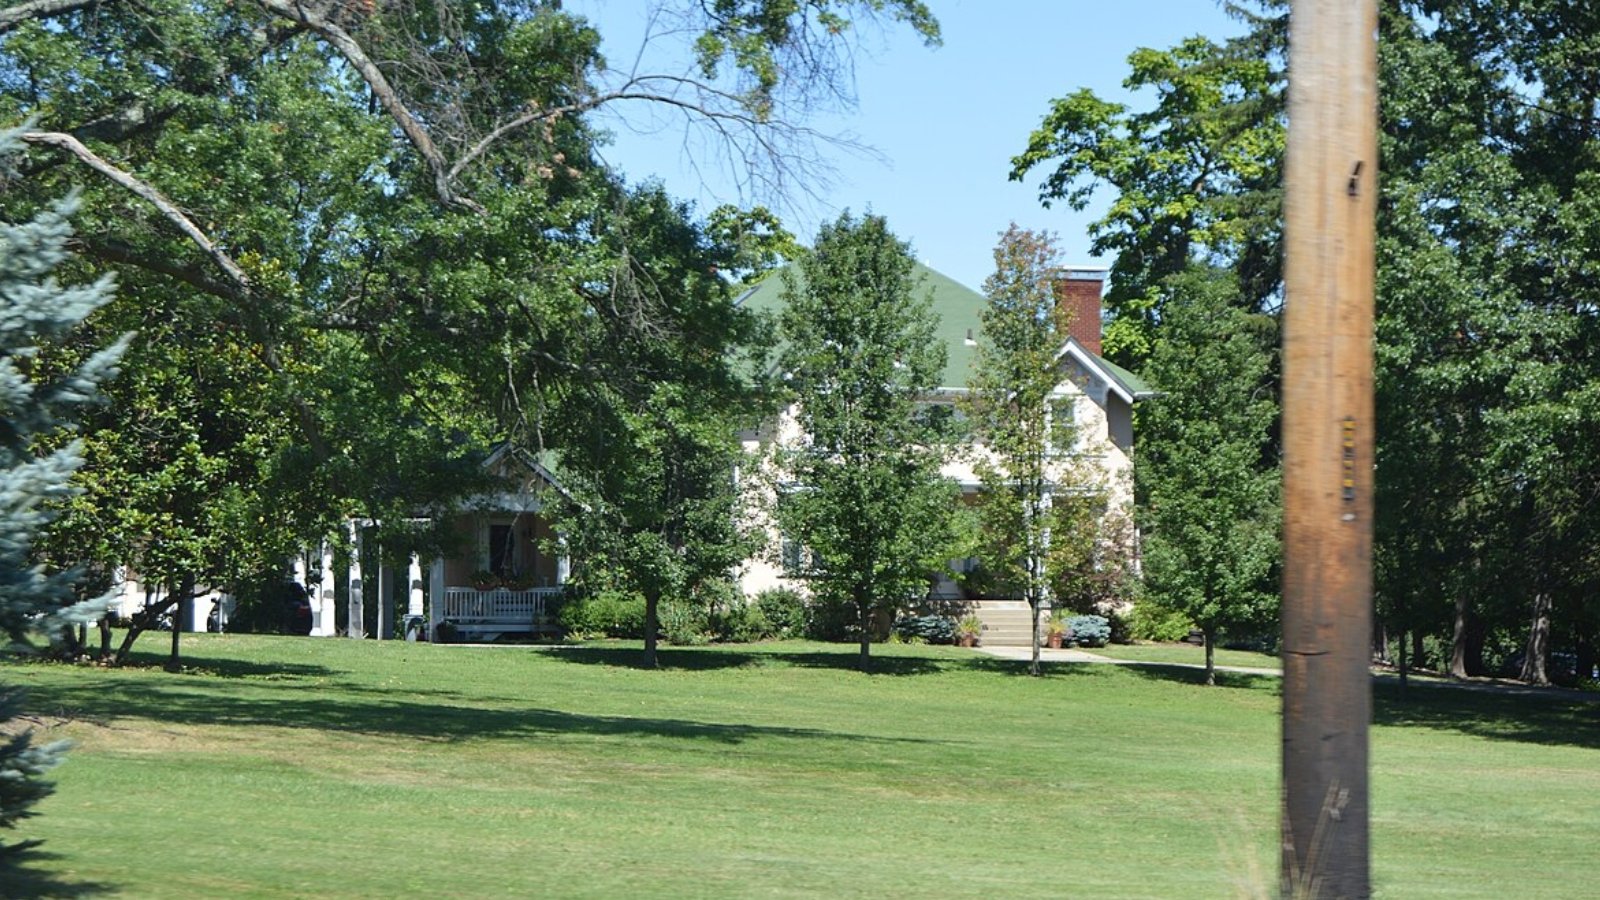
Lakeside Park – Classic Charm Near the City
Were You Meant
to Live In?
Part of Kenton County, Lakeside Park combines classic suburban charm with easy access to Cincinnati. The town is known for its tree-lined streets, mid-century homes, and a well-established community feel. With quick access to major highways and nearby retail, it’s long been a desirable pocket in Northern Kentucky.
While it doesn’t see the explosive growth of newer developments, its historic appeal and convenient location help hold prices high. Lakeside Park is a textbook example of a stable, high-value suburb—offering predictability for buyers looking for long-term value without major risk.
22. Versailles – 114% Home Price Increase Since 2010
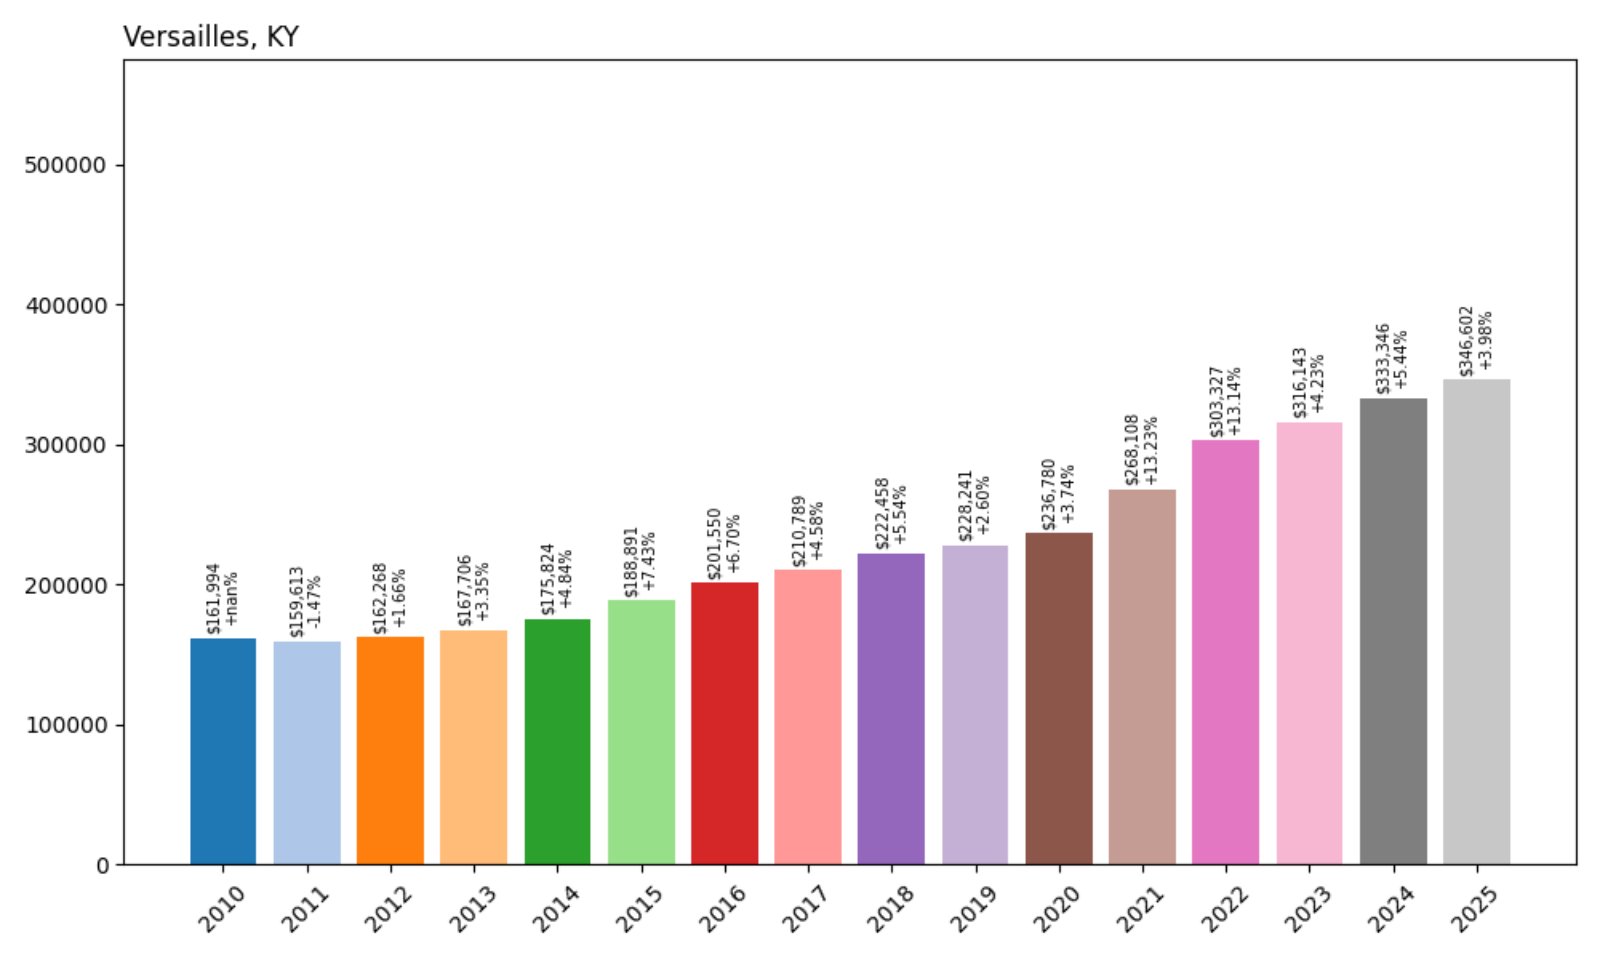
- 2010: $161,994
- 2011: $159,613 (−$2,381, −1.47% from previous year)
- 2012: $162,268 (+$2,655, +1.66% from previous year)
- 2013: $167,706 (+$5,438, +3.35% from previous year)
- 2014: $175,824 (+$8,118, +4.84% from previous year)
- 2015: $188,891 (+$13,067, +7.43% from previous year)
- 2016: $201,550 (+$12,659, +6.70% from previous year)
- 2017: $210,789 (+$9,239, +4.58% from previous year)
- 2018: $222,458 (+$11,669, +5.54% from previous year)
- 2019: $228,241 (+$5,783, +2.60% from previous year)
- 2020: $236,780 (+$8,539, +3.74% from previous year)
- 2021: $268,108 (+$31,328, +13.23% from previous year)
- 2022: $303,327 (+$35,219, +13.14% from previous year)
- 2023: $316,143 (+$12,816, +4.23% from previous year)
- 2024: $333,346 (+$17,203, +5.44% from previous year)
- 2025: $346,602 (+$13,256, +3.98% from previous year)
Versailles has more than doubled its home values since 2010, growing 114% over 15 years. That climb has been steady and consistent, with notable growth spurts in 2021 and 2022 reflecting pandemic-era migration and buyer competition.
Versailles – Equine Elegance Meets Small-Town Growth
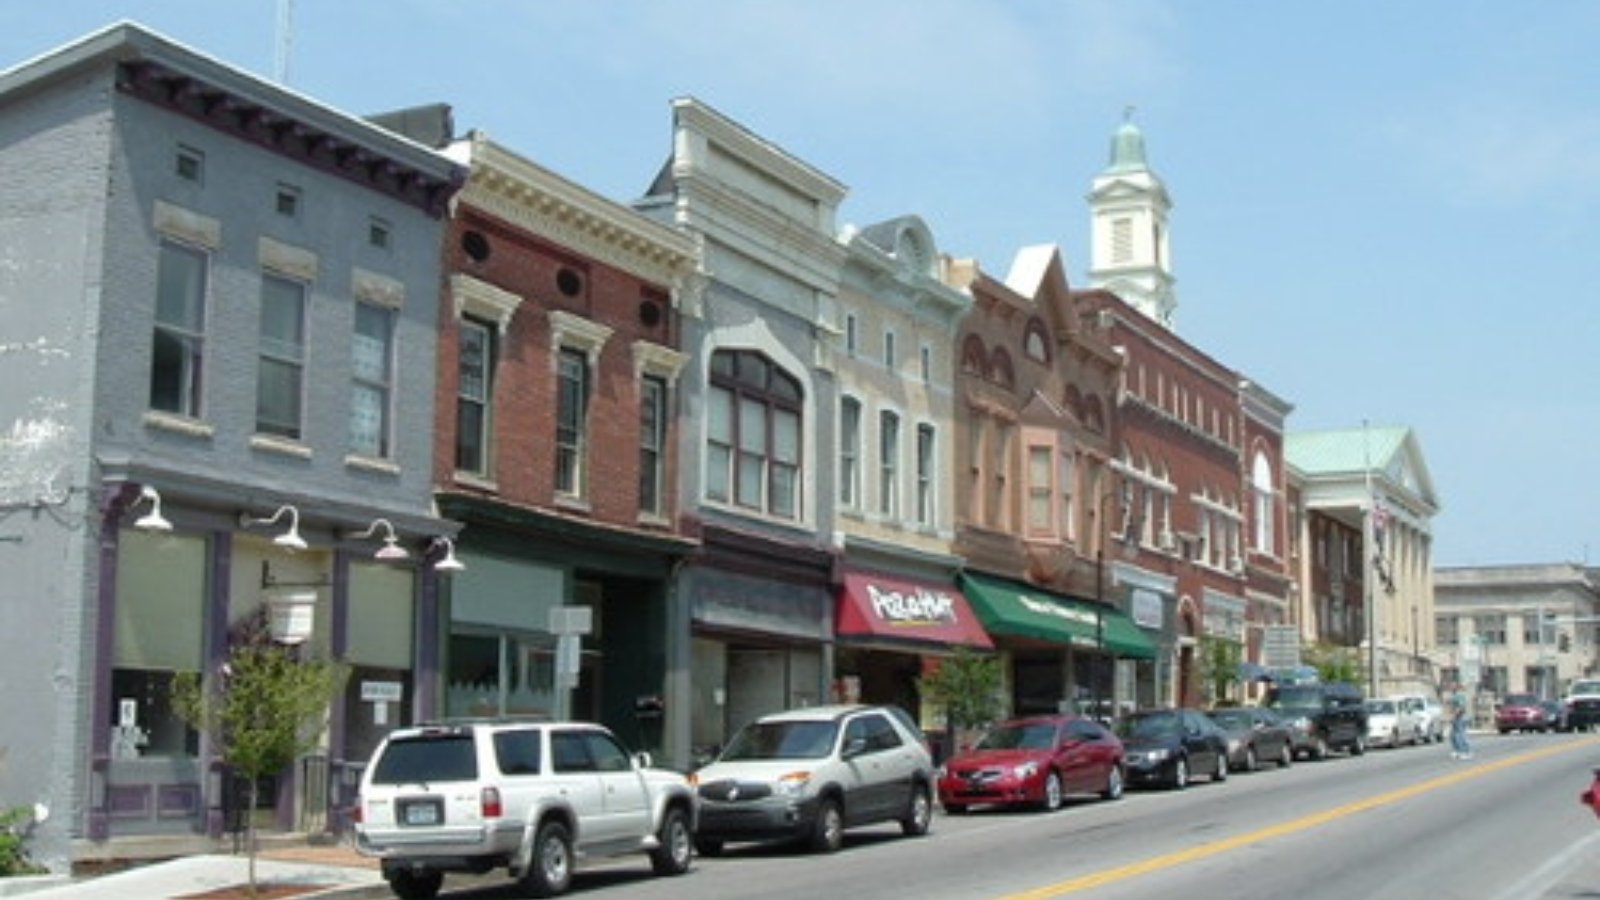
Located just west of Lexington in Woodford County, Versailles is known for its rolling hills, bourbon distilleries, and horse farms. Its name (pronounced “ver-SALES”) often catches outsiders off guard—but the town’s beauty is universally admired.
With proximity to major employers and easy access to regional highways, Versailles appeals to both rural-minded residents and Lexington-area professionals. Its blend of new developments and historic homes offers something for every buyer segment, driving sustained demand and upward pressure on prices.
21. Fort Thomas – 70% Home Price Increase Since 2010
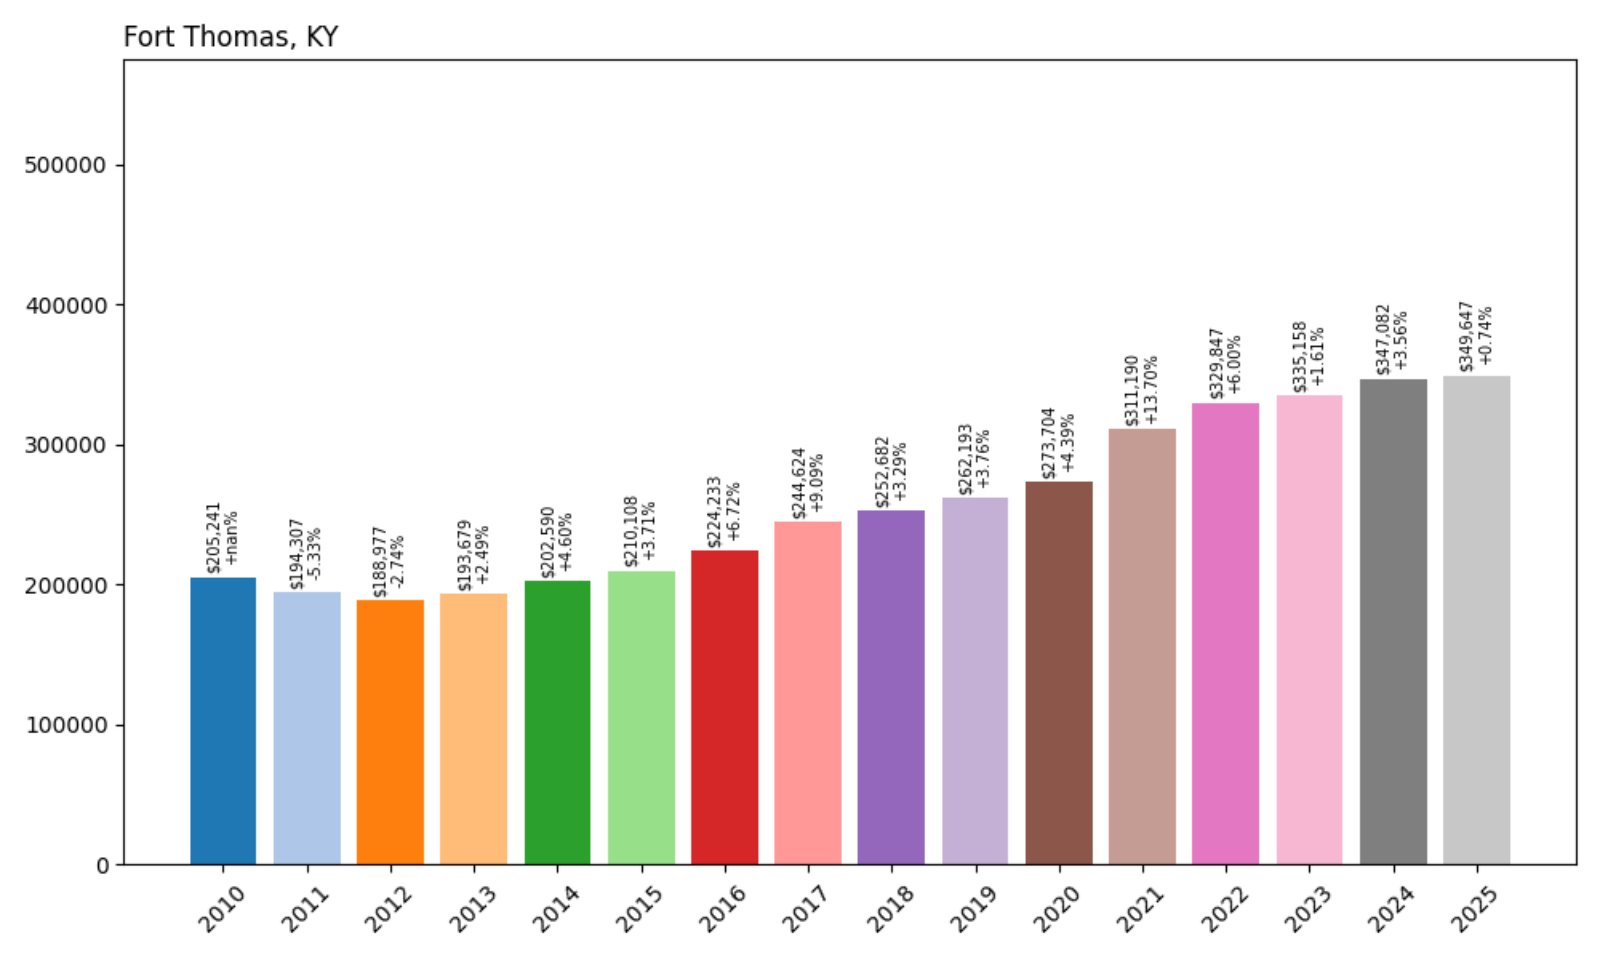
- 2010: $205,241
- 2011: $194,307 (−$10,935, −5.33% from previous year)
- 2012: $188,977 (−$5,330, −2.74% from previous year)
- 2013: $193,679 (+$4,702, +2.49% from previous year)
- 2014: $202,590 (+$8,911, +4.60% from previous year)
- 2015: $210,108 (+$7,517, +3.71% from previous year)
- 2016: $224,233 (+$14,126, +6.72% from previous year)
- 2017: $244,624 (+$20,391, +9.09% from previous year)
- 2018: $252,682 (+$8,058, +3.29% from previous year)
- 2019: $262,193 (+$9,511, +3.76% from previous year)
- 2020: $273,704 (+$11,511, +4.39% from previous year)
- 2021: $311,190 (+$37,486, +13.70% from previous year)
- 2022: $329,847 (+$18,657, +6.00% from previous year)
- 2023: $335,158 (+$5,311, +1.61% from previous year)
- 2024: $347,082 (+$11,924, +3.56% from previous year)
- 2025: $349,647 (+$2,565, +0.74% from previous year)
Fort Thomas has gained nearly $145,000 in average home value since 2010—a 70% increase. After strong gains in 2021 and 2022, growth has slowed but remained positive through 2025, reflecting stable demand and tight supply.
Fort Thomas – Top Schools and Timeless Demand
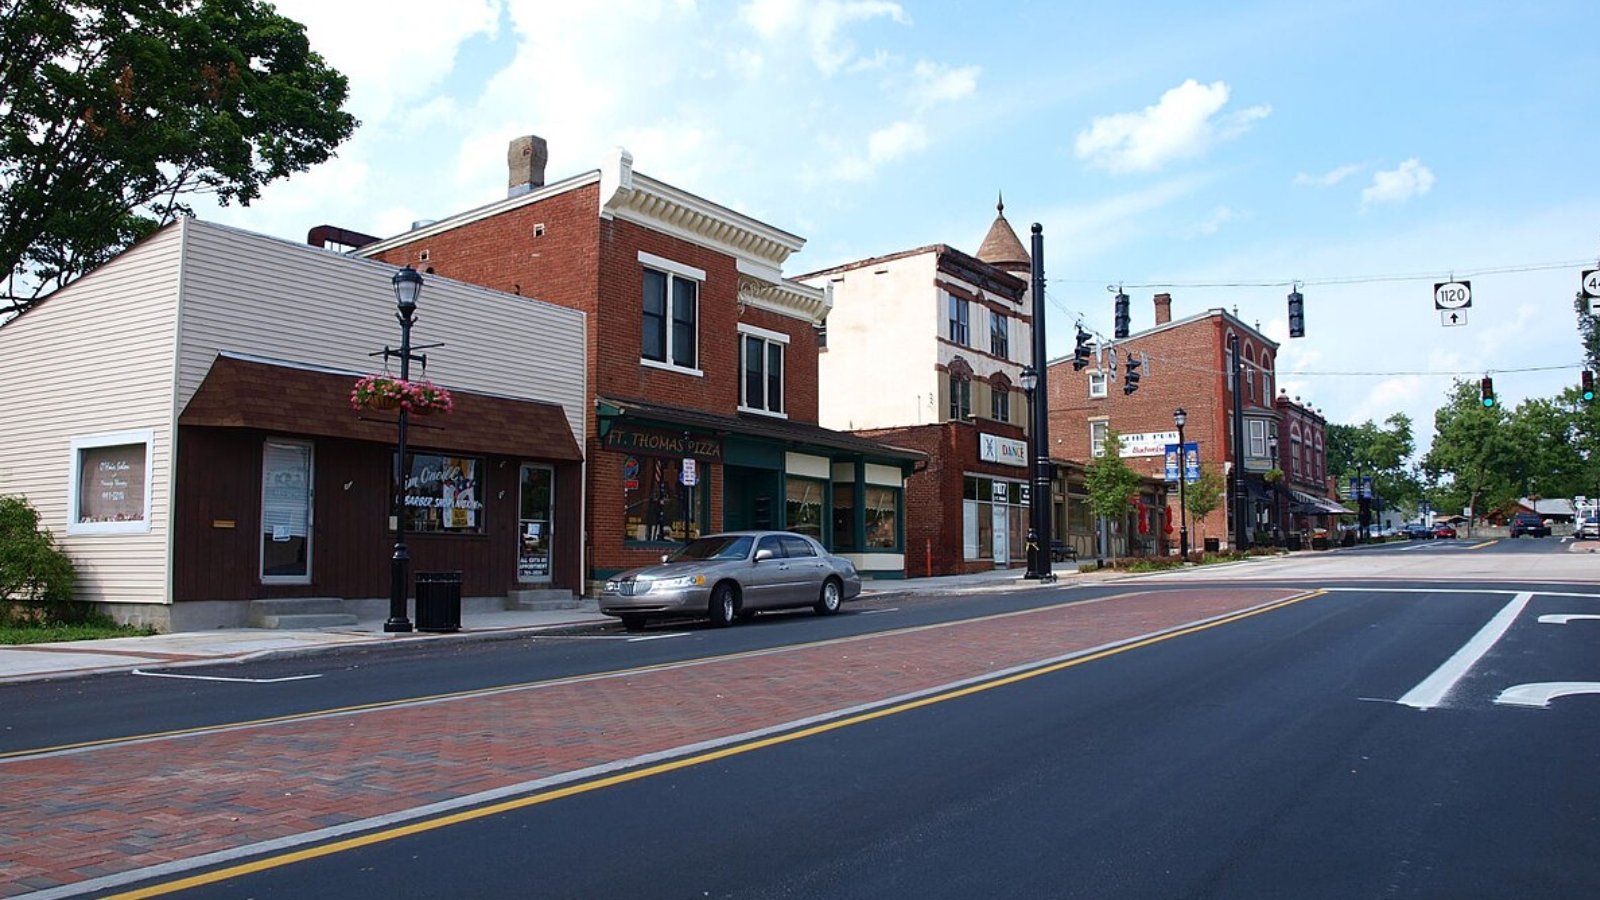
Located in Campbell County, Fort Thomas is often rated among Kentucky’s best places to live—thanks largely to its excellent public schools, walkable neighborhoods, and vibrant civic life. Its historic homes and proximity to Cincinnati make it a perennial favorite for professionals and families alike.
The recent plateau in home price growth suggests the town has reached a mature pricing level. However, its high livability, low crime, and proximity to top amenities mean that demand remains solid—and long-term outlooks are strong.
20. Smithfield – 113% Home Price Increase Since 2010
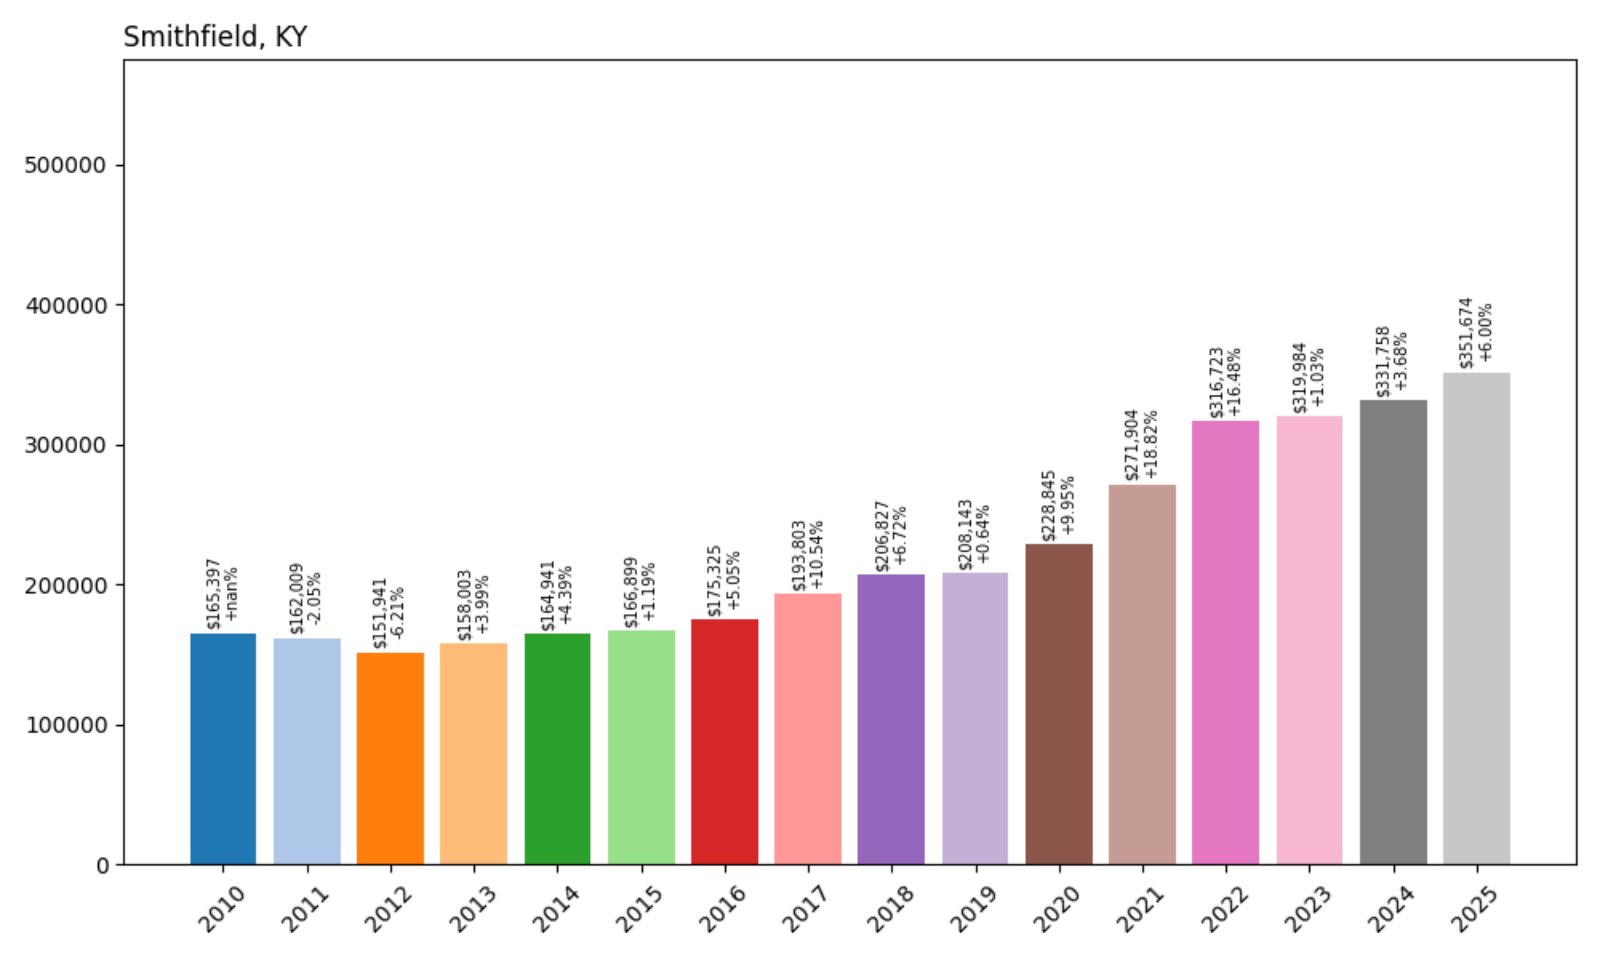
- 2010: $165,397
- 2011: $162,009 (−$3,388, −2.05% from previous year)
- 2012: $151,941 (−$10,068, −6.21% from previous year)
- 2013: $158,003 (+$6,063, +3.99% from previous year)
- 2014: $164,941 (+$6,938, +4.39% from previous year)
- 2015: $166,899 (+$1,958, +1.19% from previous year)
- 2016: $175,325 (+$8,426, +5.05% from previous year)
- 2017: $193,803 (+$18,478, +10.54% from previous year)
- 2018: $206,827 (+$13,024, +6.72% from previous year)
- 2019: $208,143 (+$1,317, +0.64% from previous year)
- 2020: $228,845 (+$20,702, +9.95% from previous year)
- 2021: $271,904 (+$43,059, +18.82% from previous year)
- 2022: $316,723 (+$44,819, +16.48% from previous year)
- 2023: $319,984 (+$3,261, +1.03% from previous year)
- 2024: $331,758 (+$11,774, +3.68% from previous year)
- 2025: $351,674 (+$19,916, +6.00% from previous year)
Smithfield’s average home value has jumped from $165,397 in 2010 to $351,674 in 2025—a 113% increase. The town saw its largest growth surge between 2020 and 2022, with double-digit gains each year, followed by a return to steadier growth in the most recent years.
Smithfield – Quiet Country Living With Rising Prices
Located in Henry County, Smithfield offers rural charm just a short drive from Louisville and Shelbyville. Known for its rolling hills, farmland, and peaceful neighborhoods, the town has become increasingly popular among buyers looking to escape metro prices without sacrificing accessibility.
The explosive price growth in the early 2020s likely reflects a pandemic-driven shift toward rural areas and remote work. Now, with steady appreciation and limited inventory, Smithfield continues to be a desirable option for families and retirees alike. Its strong 2025 numbers suggest confidence in long-term value.
19. Hebron – 85% Home Price Increase Since 2010
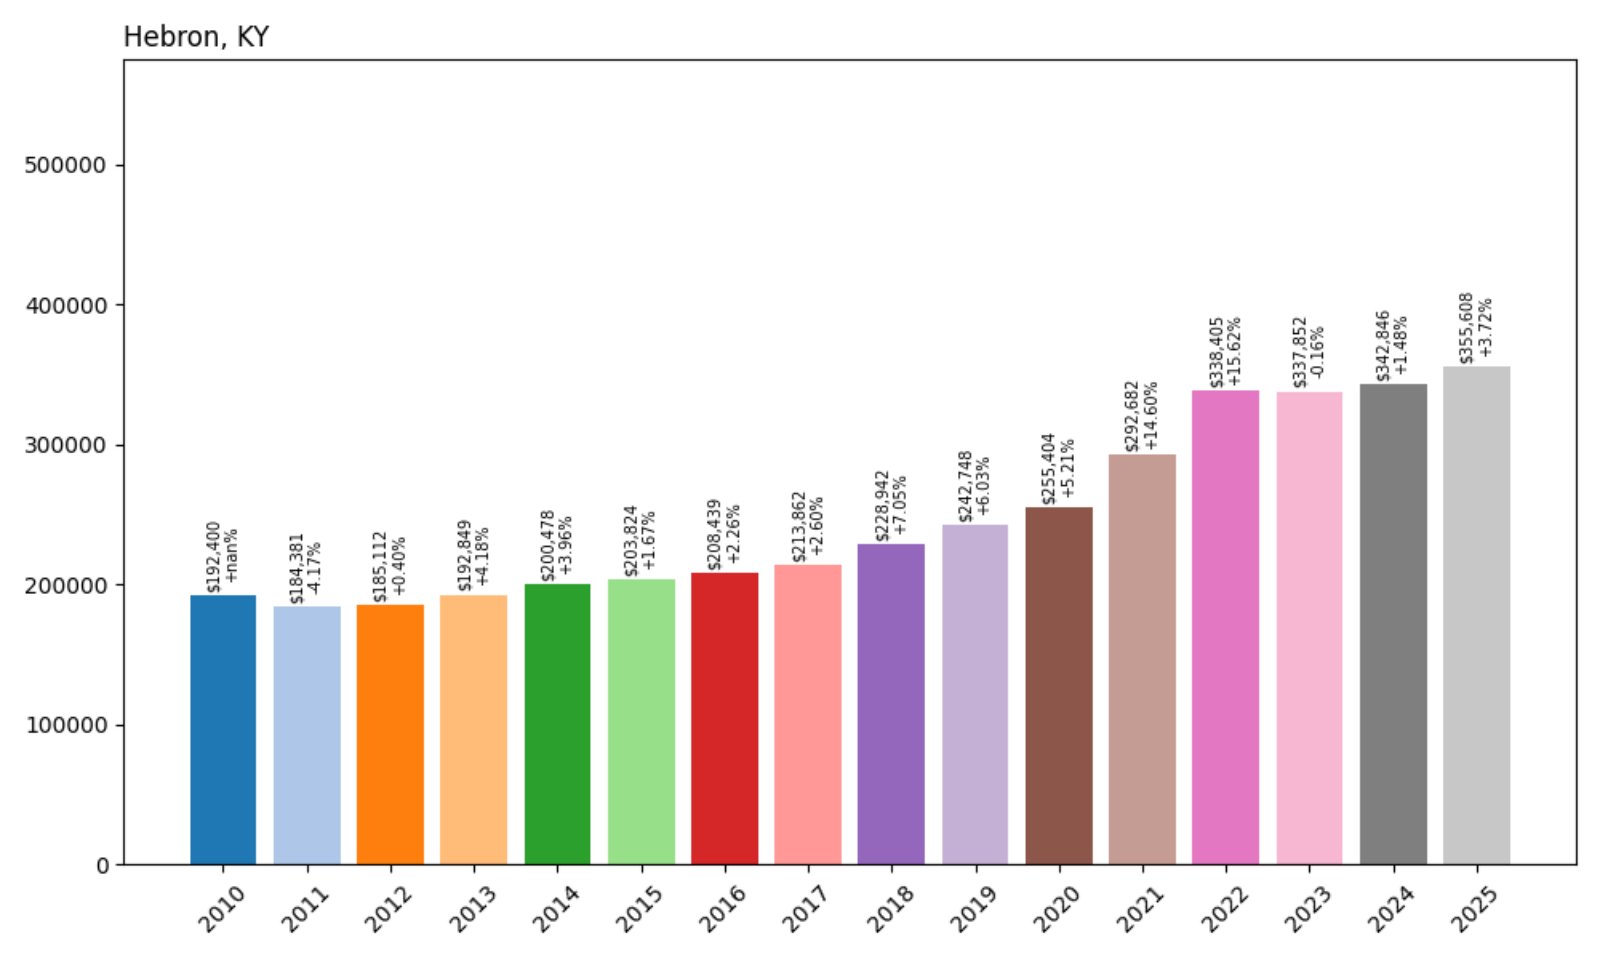
- 2010: $192,400
- 2011: $184,381 (−$8,020, −4.17% from previous year)
- 2012: $185,112 (+$732, +0.40% from previous year)
- 2013: $192,849 (+$7,737, +4.18% from previous year)
- 2014: $200,478 (+$7,628, +3.96% from previous year)
- 2015: $203,824 (+$3,346, +1.67% from previous year)
- 2016: $208,439 (+$4,614, +2.26% from previous year)
- 2017: $213,862 (+$5,423, +2.60% from previous year)
- 2018: $228,942 (+$15,080, +7.05% from previous year)
- 2019: $242,748 (+$13,806, +6.03% from previous year)
- 2020: $255,404 (+$12,657, +5.21% from previous year)
- 2021: $292,682 (+$37,278, +14.60% from previous year)
- 2022: $338,405 (+$45,722, +15.62% from previous year)
- 2023: $337,852 (−$553, −0.16% from previous year)
- 2024: $342,846 (+$4,994, +1.48% from previous year)
- 2025: $355,608 (+$12,762, +3.72% from previous year)
Hebron’s average home value has increased by 85% since 2010, with a 2025 average of $355,608. Price growth was especially strong between 2020 and 2022, though values have continued to rise moderately since then after a brief dip in 2023.
Hebron – Growth Fueled by Proximity to Cincinnati Airport
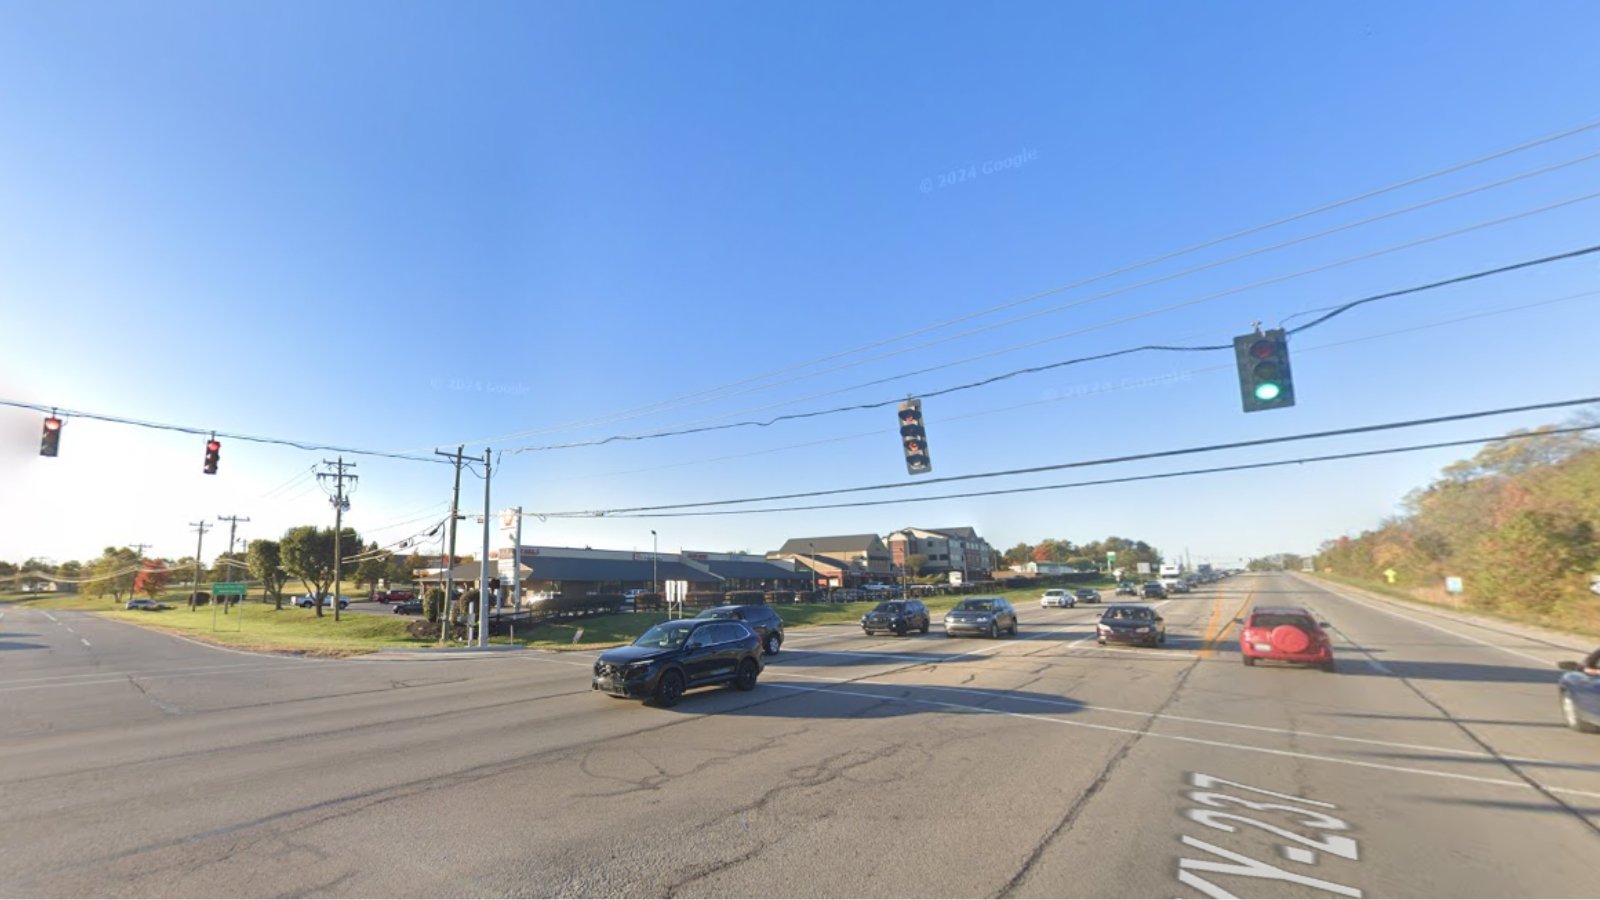
Located in Boone County, Hebron is home to the Cincinnati/Northern Kentucky International Airport (CVG), which anchors the local economy and drives infrastructure development. The town offers a mix of new construction subdivisions and older, established neighborhoods, making it attractive to a variety of buyers.
Despite a slight pullback in 2023, prices have rebounded in 2024 and 2025. With its convenient location, rising population, and regional job centers, Hebron continues to attract investment and hold its place among Kentucky’s higher-priced towns.
18. Edgewood – 81% Home Price Increase Since 2010
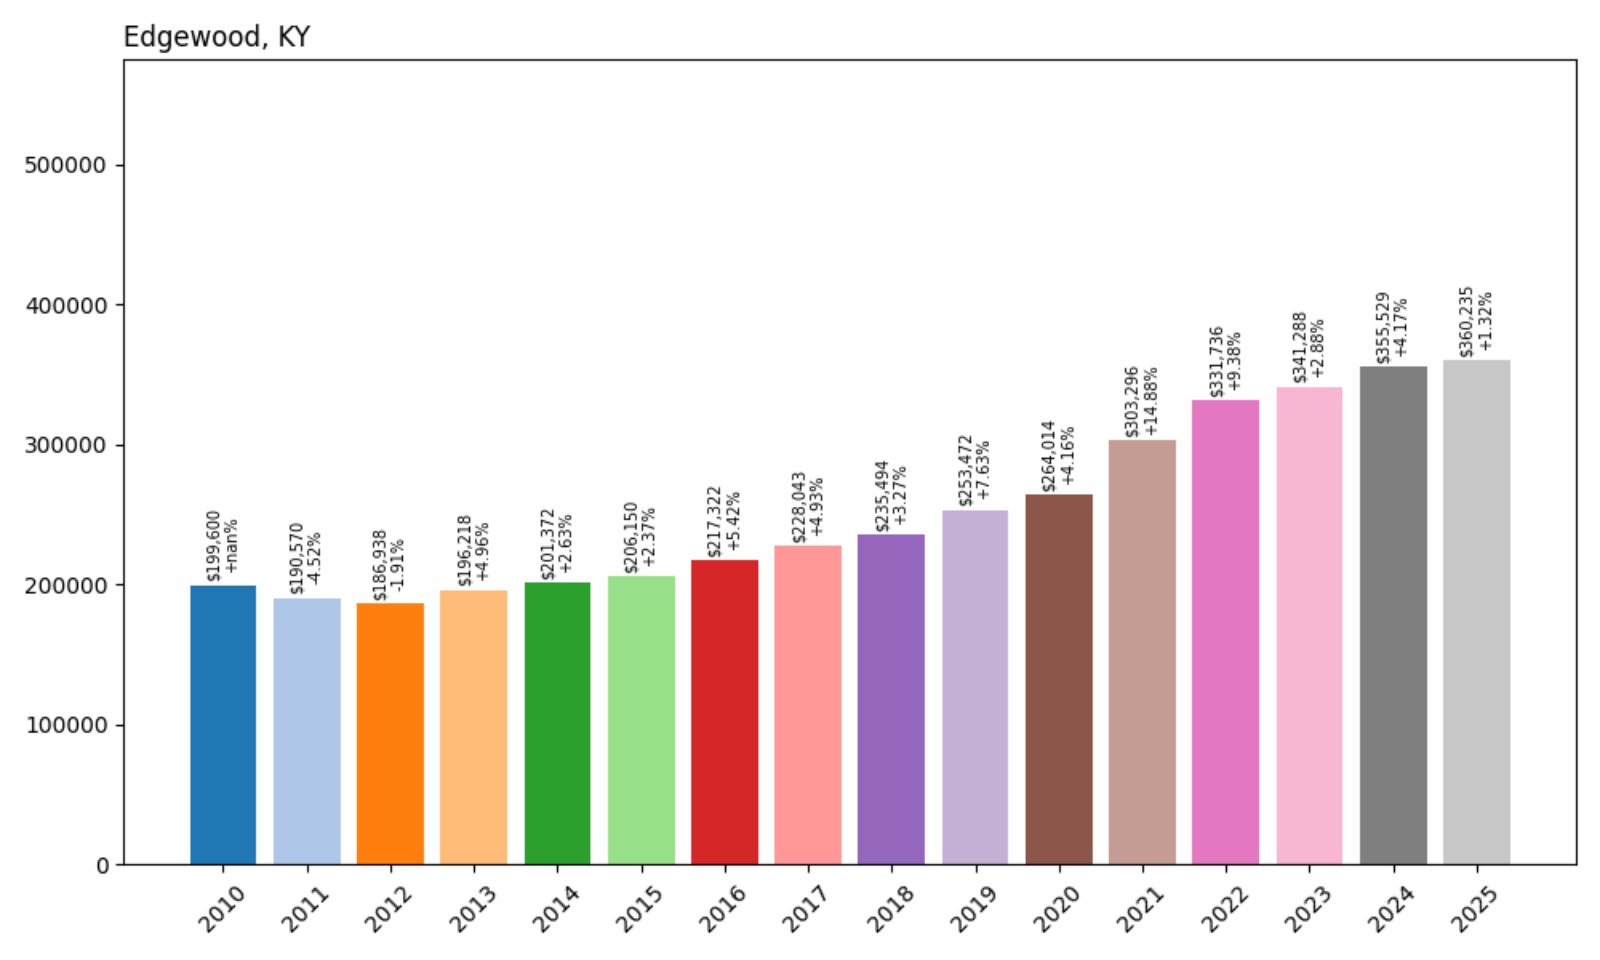
- 2010: $199,600
- 2011: $190,570 (−$9,029, −4.52% from previous year)
- 2012: $186,938 (−$3,633, −1.91% from previous year)
- 2013: $196,218 (+$9,280, +4.96% from previous year)
- 2014: $201,372 (+$5,154, +2.63% from previous year)
- 2015: $206,150 (+$4,778, +2.37% from previous year)
- 2016: $217,322 (+$11,171, +5.42% from previous year)
- 2017: $228,043 (+$10,722, +4.93% from previous year)
- 2018: $235,494 (+$7,450, +3.27% from previous year)
- 2019: $253,472 (+$17,979, +7.63% from previous year)
- 2020: $264,014 (+$10,542, +4.16% from previous year)
- 2021: $303,296 (+$39,282, +14.88% from previous year)
- 2022: $331,736 (+$28,440, +9.38% from previous year)
- 2023: $341,288 (+$9,552, +2.88% from previous year)
- 2024: $355,529 (+$14,241, +4.17% from previous year)
- 2025: $360,235 (+$4,707, +1.32% from previous year)
Edgewood’s home values have risen from $199,600 in 2010 to $360,235 in 2025—an 81% increase. The sharpest increases came between 2019 and 2022, with recent years showing modest but steady gains.
Edgewood – Consistent Demand in a Top-Ranked Community
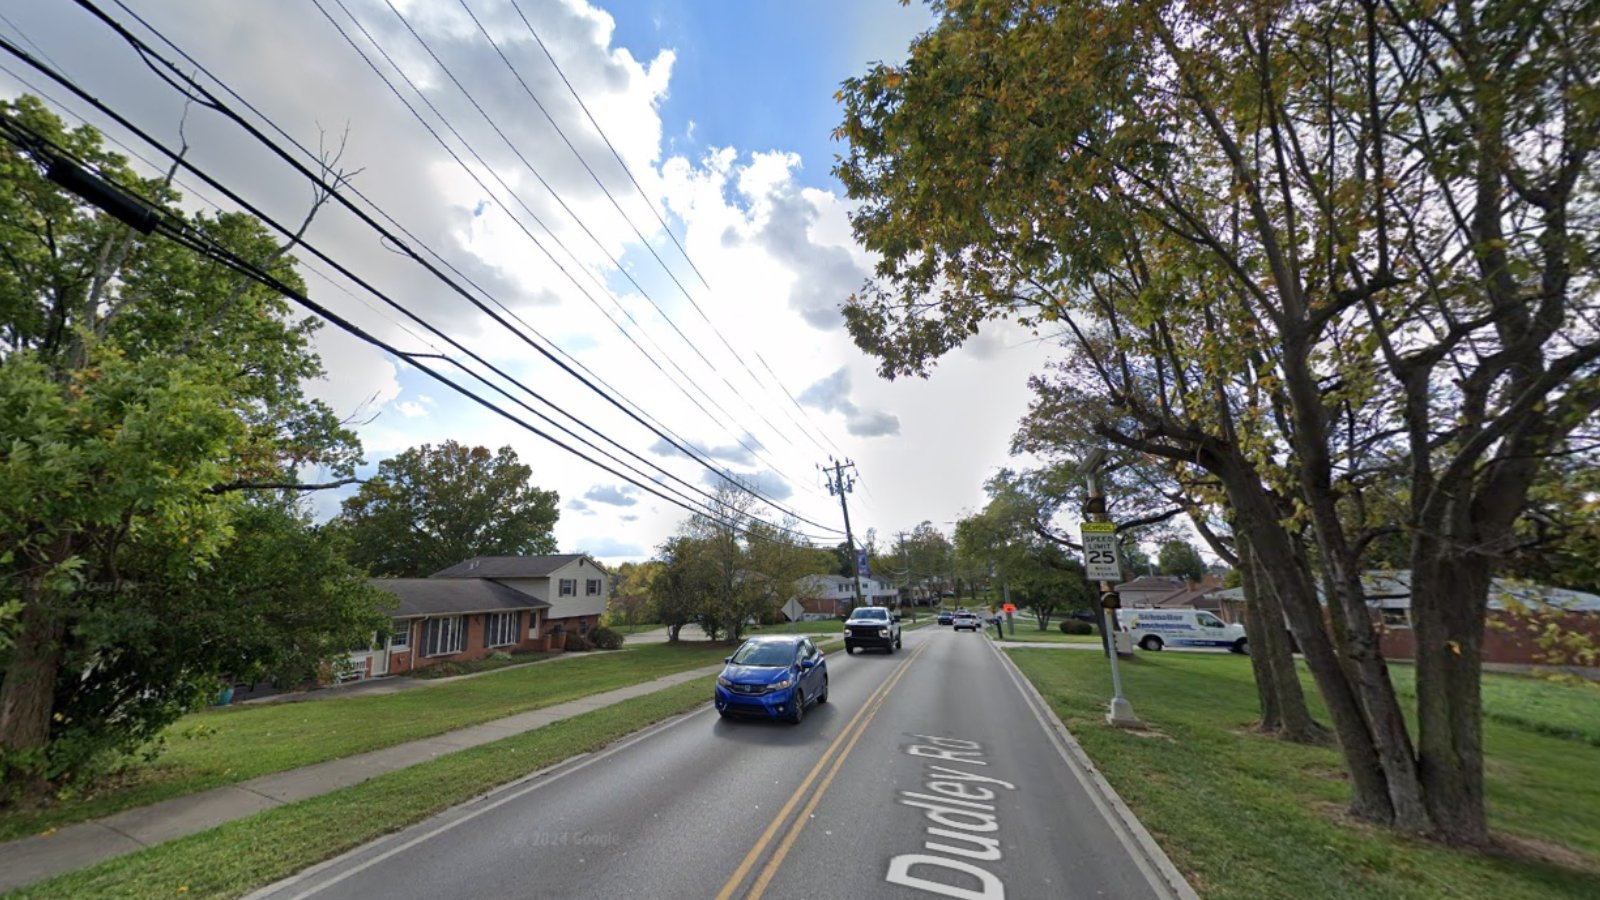
Located in Kenton County, Edgewood regularly earns recognition for its high quality of life, including excellent schools and low crime rates. The town blends suburban comfort with access to healthcare jobs, including the nearby St. Elizabeth Medical Center.
The strong market performance during the pandemic housing boom was followed by continued, stable appreciation. With a reputation as one of Northern Kentucky’s most livable communities, Edgewood remains a desirable destination for families and long-term residents.
17. Pewee Valley – 96% Home Price Increase Since 2010

- 2010: $183,687
- 2011: $182,148 (−$1,539, −0.84% from previous year)
- 2012: $184,170 (+$2,023, +1.11% from previous year)
- 2013: $190,871 (+$6,701, +3.64% from previous year)
- 2014: $197,771 (+$6,900, +3.61% from previous year)
- 2015: $205,367 (+$7,597, +3.84% from previous year)
- 2016: $214,757 (+$9,389, +4.57% from previous year)
- 2017: $229,324 (+$14,567, +6.78% from previous year)
- 2018: $245,743 (+$16,420, +7.16% from previous year)
- 2019: $253,333 (+$7,589, +3.09% from previous year)
- 2020: $264,286 (+$10,953, +4.32% from previous year)
- 2021: $297,426 (+$33,140, +12.54% from previous year)
- 2022: $332,623 (+$35,197, +11.83% from previous year)
- 2023: $339,925 (+$7,302, +2.20% from previous year)
- 2024: $346,571 (+$6,646, +1.96% from previous year)
- 2025: $360,524 (+$13,953, +4.03% from previous year)
Pewee Valley’s home values have grown 96% since 2010, now averaging $360,524. A relatively quiet market for years, the town’s home prices accelerated sharply during 2020–2022 and have continued on an upward trend since.
Pewee Valley – History and High Value Near Louisville
Located in Oldham County, Pewee Valley is one of Kentucky’s most historic and picturesque small towns. With its tree-lined streets, historic architecture, and excellent school district, the area has become a magnet for families seeking charm and convenience near Louisville.
Recent housing demand in the area has helped boost values significantly, especially for buyers prioritizing top-tier schools and spacious lots. Pewee Valley’s combination of elegance, privacy, and proximity to the city keeps its real estate values near the top statewide.
16. Taylorsville – 110% Home Price Increase Since 2010

- 2010: $173,057
- 2011: $161,577 (−$11,480, −6.63% from previous year)
- 2012: $165,214 (+$3,637, +2.25% from previous year)
- 2013: $172,458 (+$7,244, +4.38% from previous year)
- 2014: $180,695 (+$8,238, +4.78% from previous year)
- 2015: $189,689 (+$8,993, +4.98% from previous year)
- 2016: $205,507 (+$15,818, +8.34% from previous year)
- 2017: $219,478 (+$13,971, +6.80% from previous year)
- 2018: $232,132 (+$12,653, +5.77% from previous year)
- 2019: $244,559 (+$12,428, +5.35% from previous year)
- 2020: $254,905 (+$10,346, +4.23% from previous year)
- 2021: $299,385 (+$44,481, +17.45% from previous year)
- 2022: $335,639 (+$36,253, +12.11% from previous year)
- 2023: $339,310 (+$3,671, +1.09% from previous year)
- 2024: $348,390 (+$9,080, +2.68% from previous year)
- 2025: $363,162 (+$14,772, +4.24% from previous year)
Taylorsville has more than doubled its average home value since 2010, now reaching $363,162. The years 2020 to 2022 delivered some of the fastest gains, but even recent years have continued a solid upward trajectory.
Taylorsville – Lakefront Homes and Rural Peace
Situated in Spencer County, Taylorsville is known for Taylorsville Lake State Park and its appealing blend of outdoor recreation and relaxed country living. It’s a popular destination for retirees, second-home buyers, and families seeking acreage.
Access to Louisville via KY-155 and ongoing residential development have pushed up demand. With its natural beauty and growth potential, Taylorsville remains a highly sought-after market for those willing to commute in exchange for space and serenity.
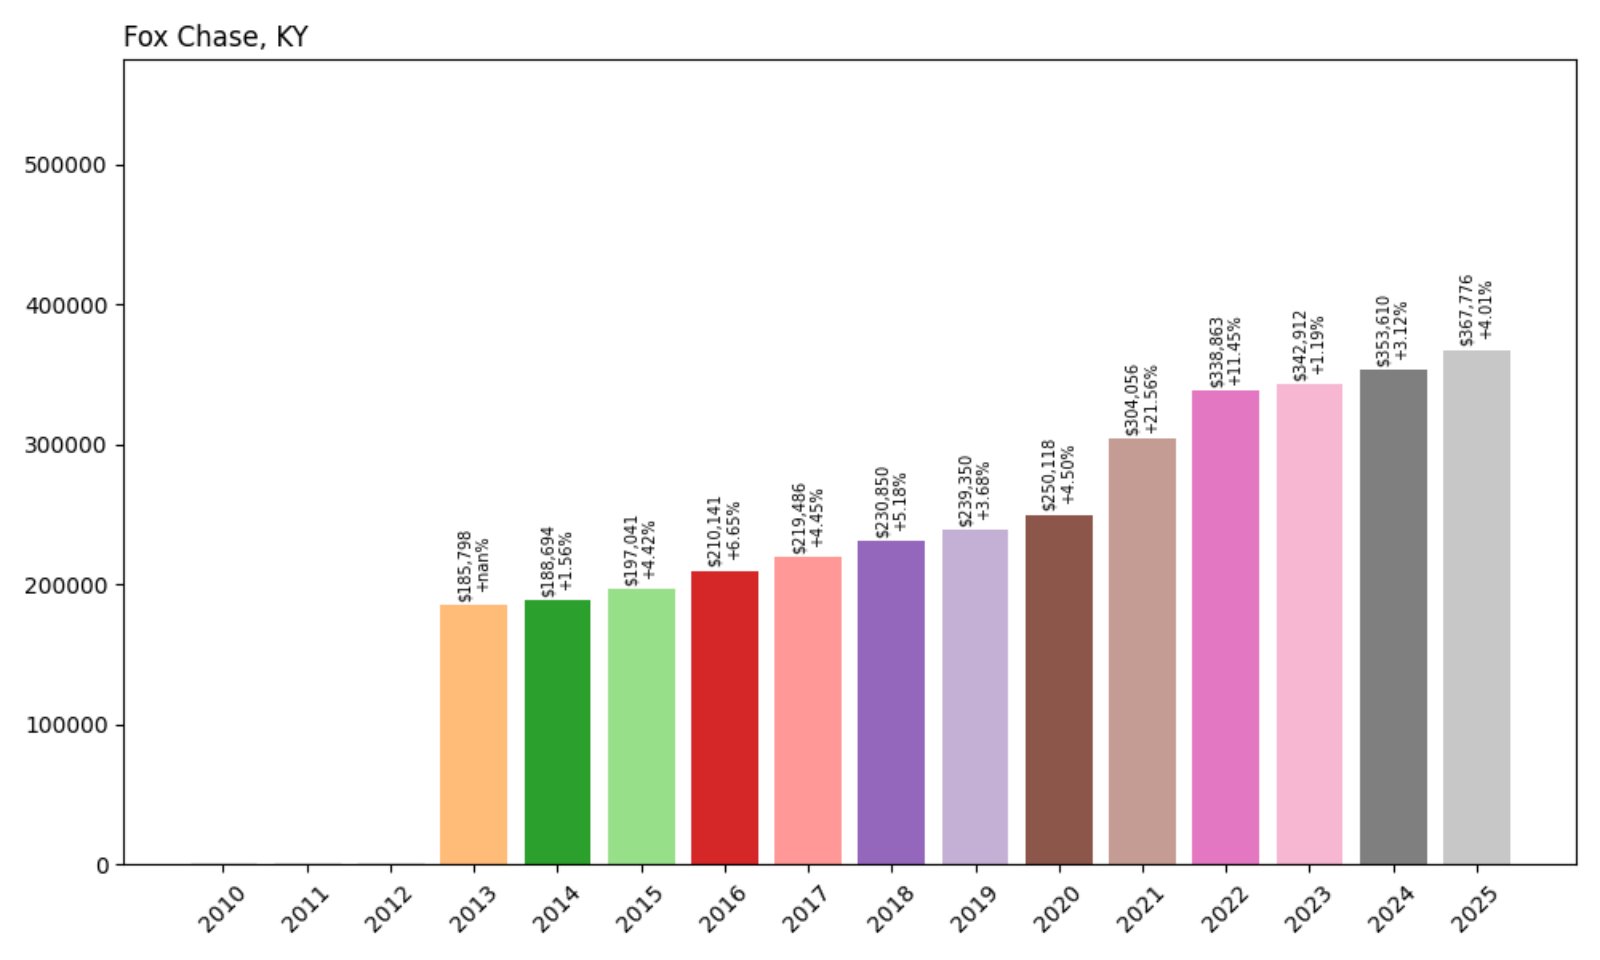
15. Fox Chase – 98% Home Price Increase Since 2013
Would you like to save this?
- 2013: $185,798
- 2014: $188,694 (+$2,897, +1.56% from previous year)
- 2015: $197,041 (+$8,347, +4.42% from previous year)
- 2016: $210,141 (+$13,100, +6.65% from previous year)
- 2017: $219,486 (+$9,345, +4.45% from previous year)
- 2018: $230,850 (+$11,364, +5.18% from previous year)
- 2019: $239,350 (+$8,500, +3.68% from previous year)
- 2020: $250,118 (+$10,768, +4.50% from previous year)
- 2021: $304,056 (+$53,938, +21.56% from previous year)
- 2022: $338,863 (+$34,807, +11.45% from previous year)
- 2023: $342,912 (+$4,048, +1.19% from previous year)
- 2024: $353,610 (+$10,698, +3.12% from previous year)
- 2025: $367,776 (+$14,167, +4.01% from previous year)
Fox Chase home values have surged by 98% since 2013, reaching $367,776 in 2025. The most significant spike came in 2021, with a massive 21.5% gain, and while appreciation has since moderated, the trend remains upward and steady.
Fox Chase – Quiet Residential Growth in Bullitt County
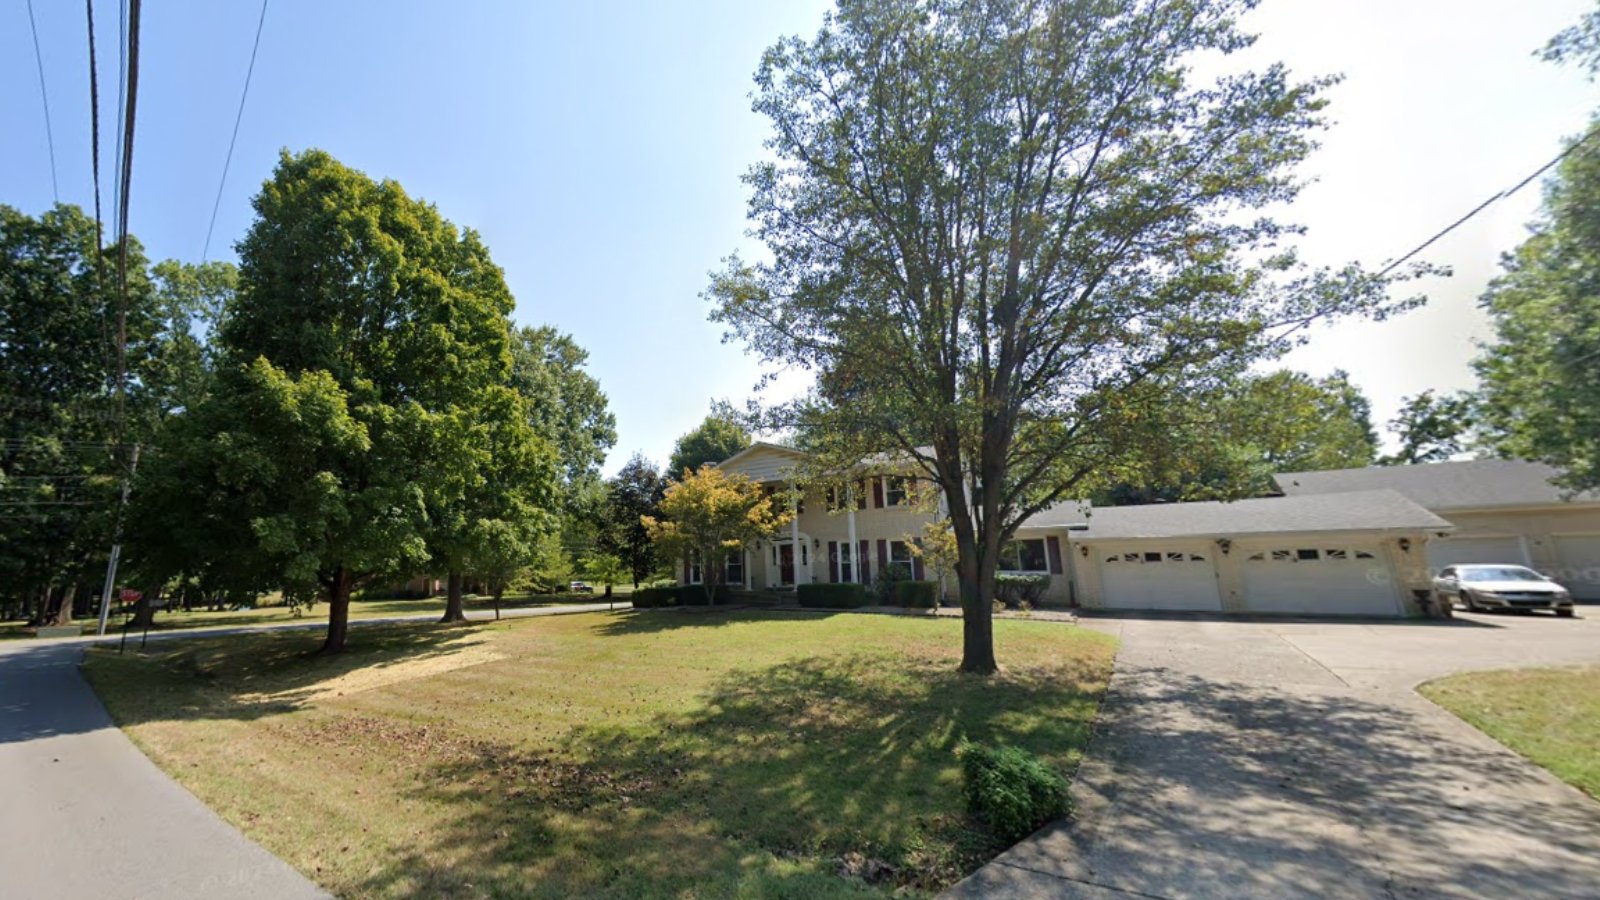
Fox Chase is a compact residential town in Bullitt County, known for its peaceful, low-density neighborhoods and close proximity to Shepherdsville and Louisville. It attracts homeowners seeking quiet living with convenient highway access and nearby retail amenities.
The town’s dramatic jump in values during 2021 reflects a broader demand shift toward outer-ring suburbs. With limited commercial development and a strong base of single-family homes, Fox Chase remains a popular choice for buyers looking for value retention and suburban stability.
14. Park Hills – 79% Home Price Increase Since 2010

- 2010: $209,266
- 2011: $208,134 (−$1,132, −0.54% from previous year)
- 2012: $197,009 (−$11,125, −5.34% from previous year)
- 2013: $198,696 (+$1,686, +0.86% from previous year)
- 2014: $201,606 (+$2,910, +1.46% from previous year)
- 2015: $209,957 (+$8,351, +4.14% from previous year)
- 2016: $219,373 (+$9,416, +4.48% from previous year)
- 2017: $228,978 (+$9,605, +4.38% from previous year)
- 2018: $239,252 (+$10,275, +4.49% from previous year)
- 2019: $249,928 (+$10,676, +4.46% from previous year)
- 2020: $266,640 (+$16,712, +6.69% from previous year)
- 2021: $306,870 (+$40,230, +15.09% from previous year)
- 2022: $339,911 (+$33,041, +10.77% from previous year)
- 2023: $345,774 (+$5,863, +1.72% from previous year)
- 2024: $362,797 (+$17,022, +4.92% from previous year)
- 2025: $375,859 (+$13,062, +3.60% from previous year)
Home values in Park Hills have risen nearly 80% since 2010, now reaching $375,859. Growth was especially strong during 2020–2022, and although recent appreciation has cooled, prices continue to edge upward year over year.
Park Hills – Historic Charm With Urban Access
Situated in Kenton County just across the river from Cincinnati, Park Hills is a walkable, hilly enclave prized for its historic homes and tree-lined streets. It’s known for being both picturesque and commuter-friendly, with I-71 and I-75 just minutes away.
The surge in prices reflects its growing popularity among young professionals and families alike. As surrounding suburbs densify, Park Hills remains a premium choice for those looking for unique architecture, close-knit community, and quick city access.
13. Villa Hills – 80% Home Price Increase Since 2010
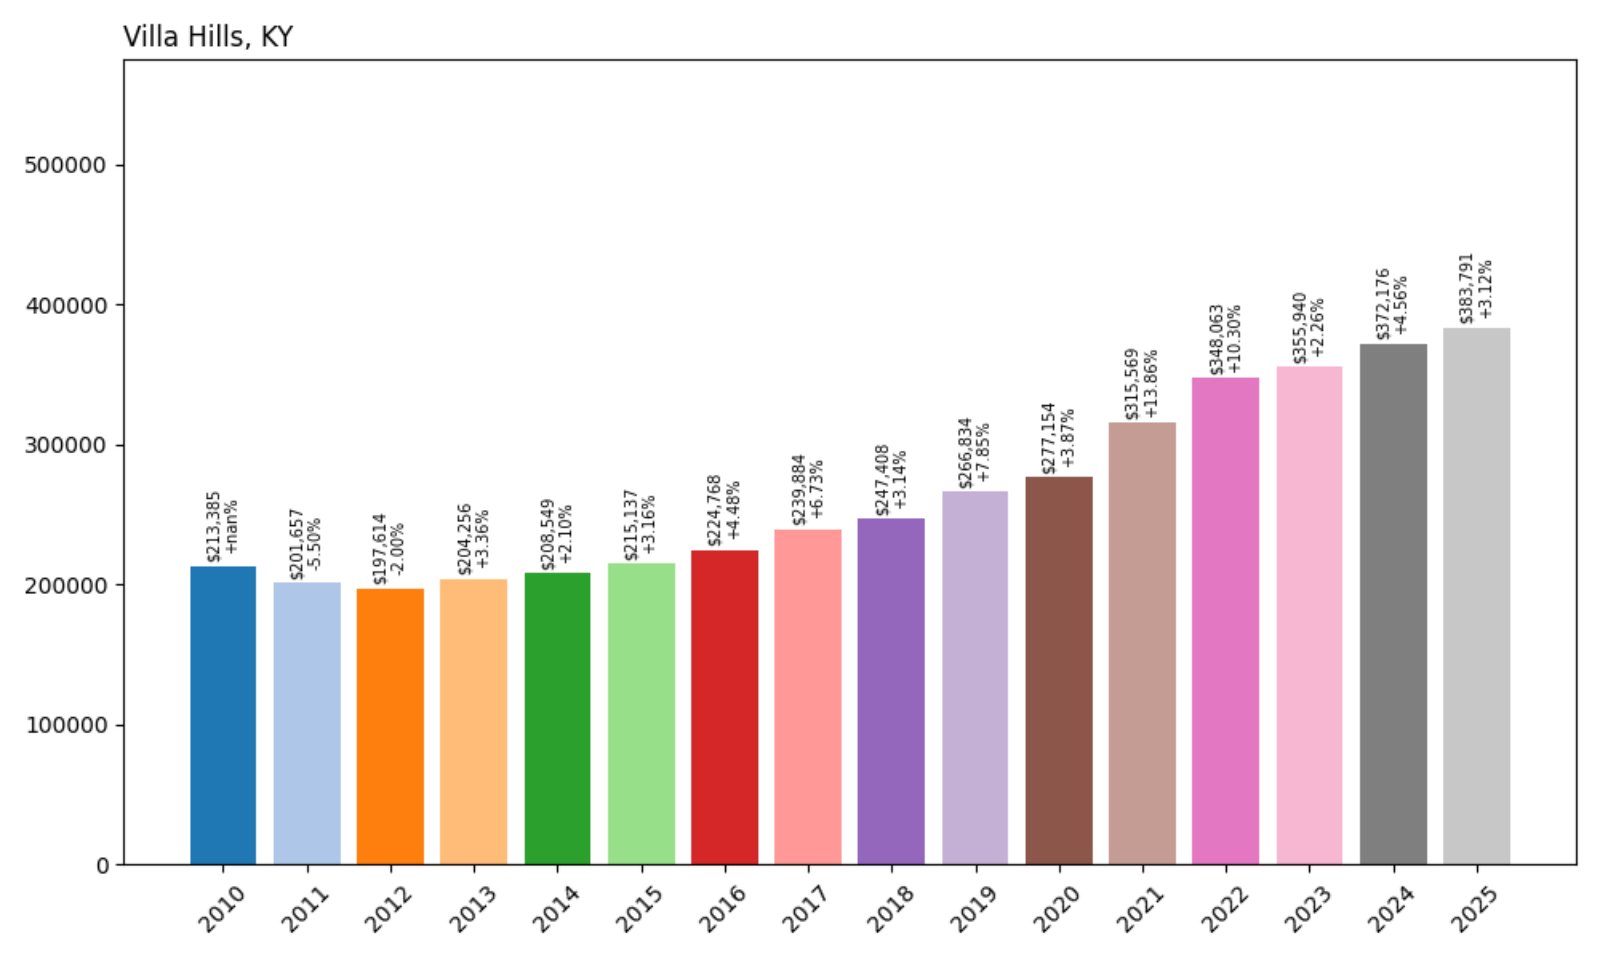
- 2010: $213,385
- 2011: $201,657 (−$11,728, −5.50% from previous year)
- 2012: $197,614 (−$4,043, −2.00% from previous year)
- 2013: $204,256 (+$6,642, +3.36% from previous year)
- 2014: $208,549 (+$4,293, +2.10% from previous year)
- 2015: $215,137 (+$6,588, +3.16% from previous year)
- 2016: $224,768 (+$9,631, +4.48% from previous year)
- 2017: $239,884 (+$15,116, +6.73% from previous year)
- 2018: $247,408 (+$7,523, +3.14% from previous year)
- 2019: $266,834 (+$19,427, +7.85% from previous year)
- 2020: $277,154 (+$10,319, +3.87% from previous year)
- 2021: $315,569 (+$38,416, +13.86% from previous year)
- 2022: $348,063 (+$32,494, +10.30% from previous year)
- 2023: $355,940 (+$7,877, +2.26% from previous year)
- 2024: $372,176 (+$16,235, +4.56% from previous year)
- 2025: $383,791 (+$11,615, +3.12% from previous year)
Villa Hills has seen home values climb 80% since 2010, now averaging $383,791. With consistent growth and standout gains in 2021–2022, it continues to be one of the top-performing suburban markets in the Northern Kentucky region.
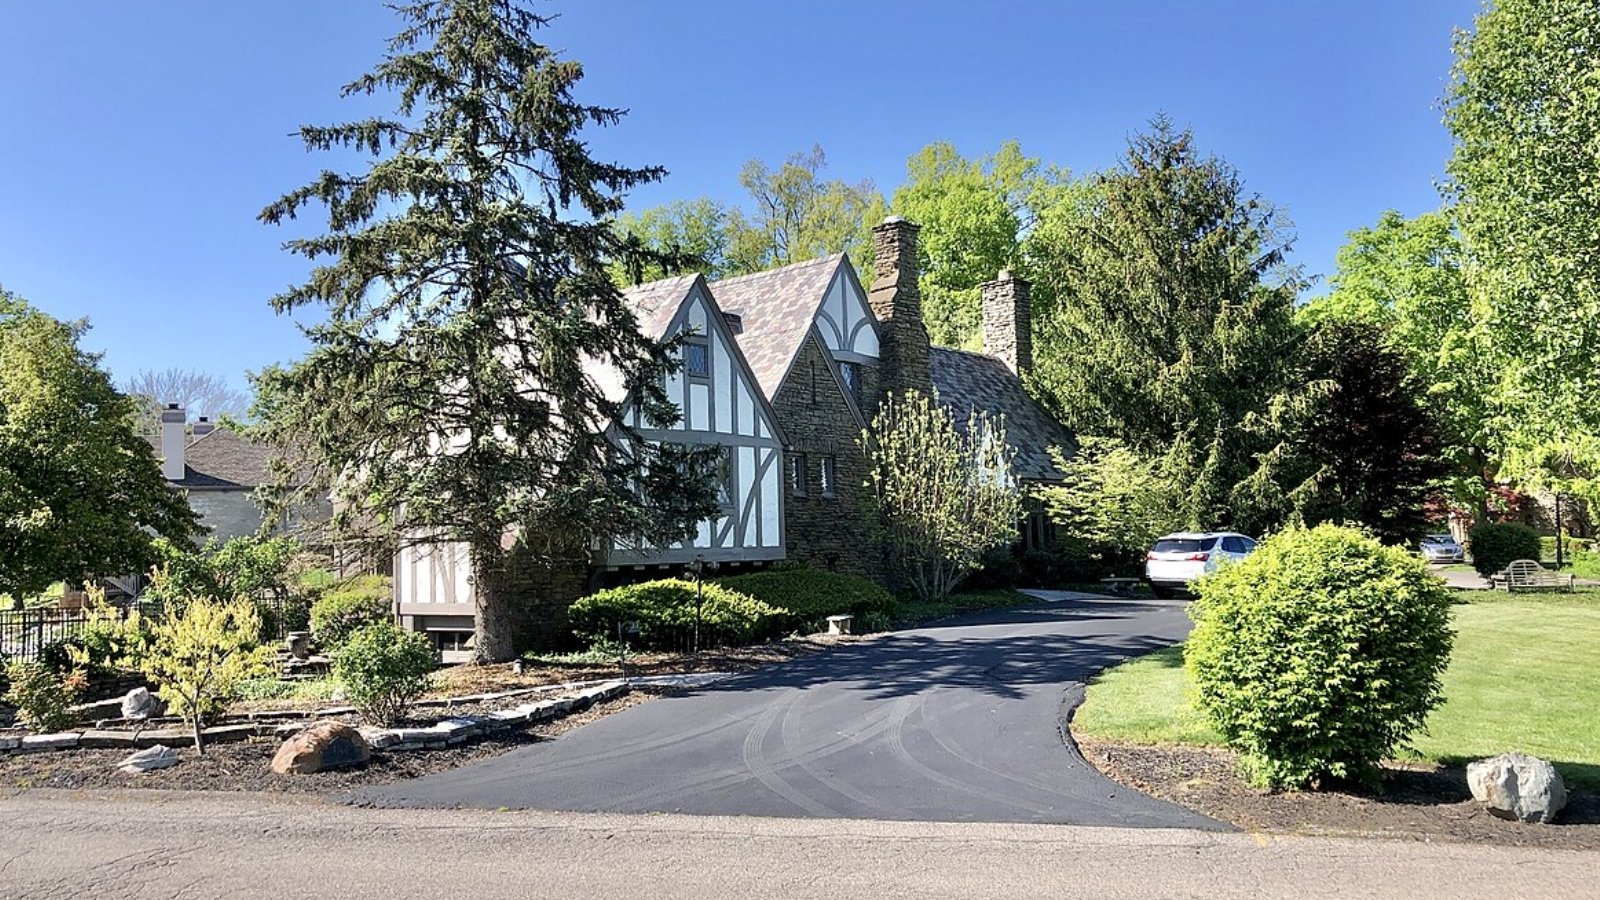
Villa Hills – Upscale and Established in Boone County
Villa Hills is an affluent community near the Ohio River, offering scenic views, established neighborhoods, and an enviable location close to Cincinnati. It’s part of Kenton County and is known for its strong schools, family-friendly vibe, and access to the airport.
With limited room for new development, much of the value growth has come from increased demand for existing homes. This tight inventory, paired with premium location and local amenities, keeps prices on the rise—even in cooling housing cycles.
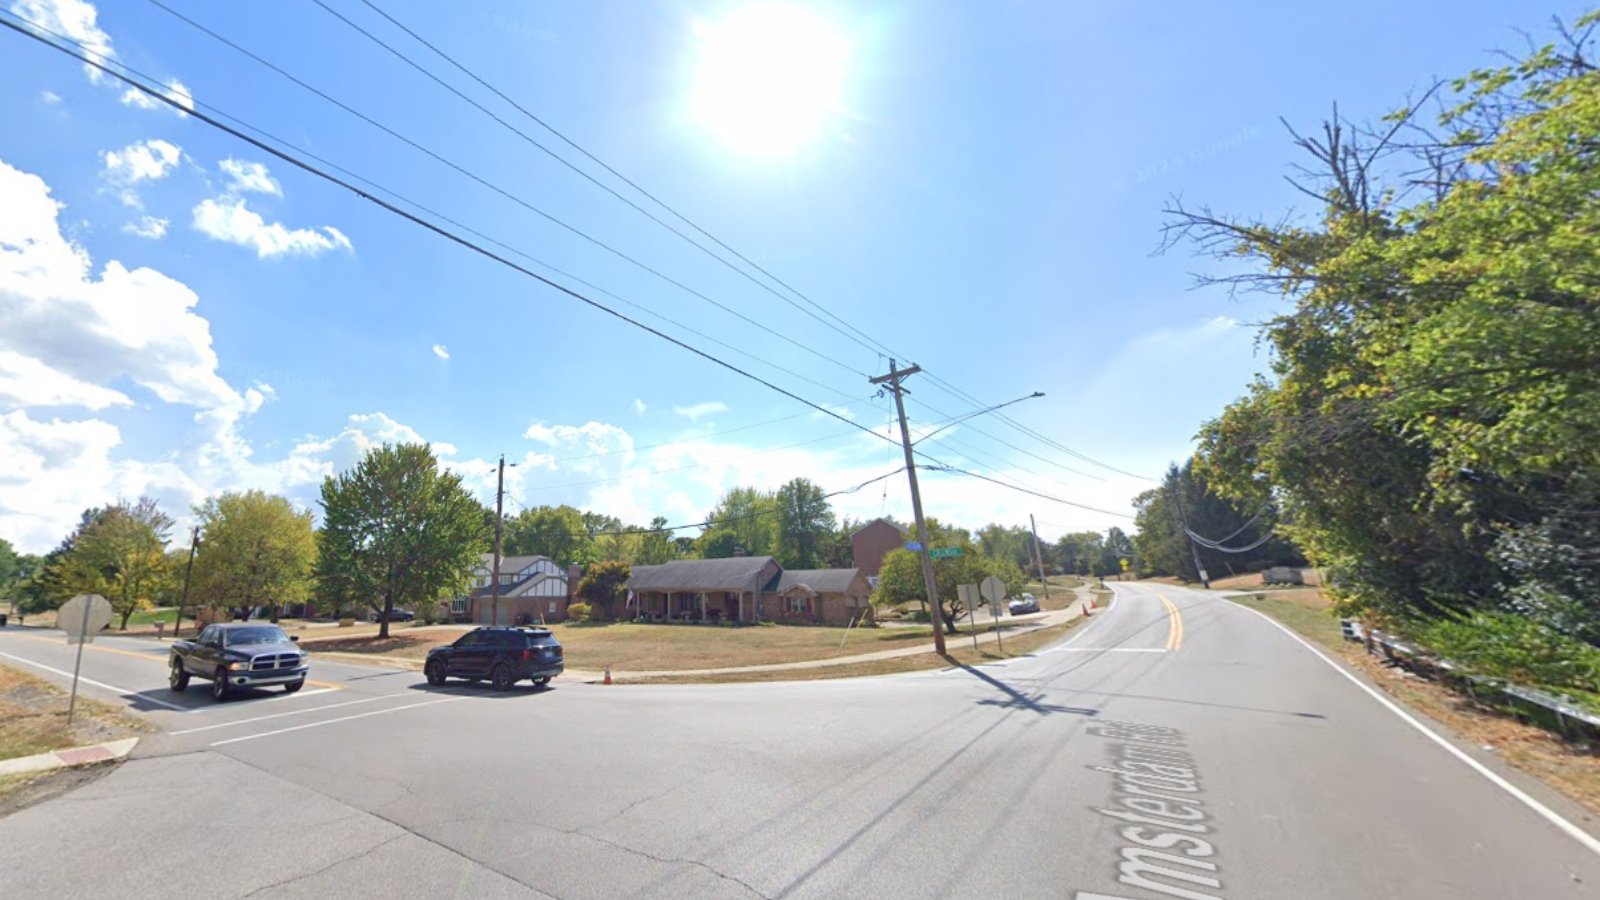
12. La Grange – 95% Home Price Increase Since 2010
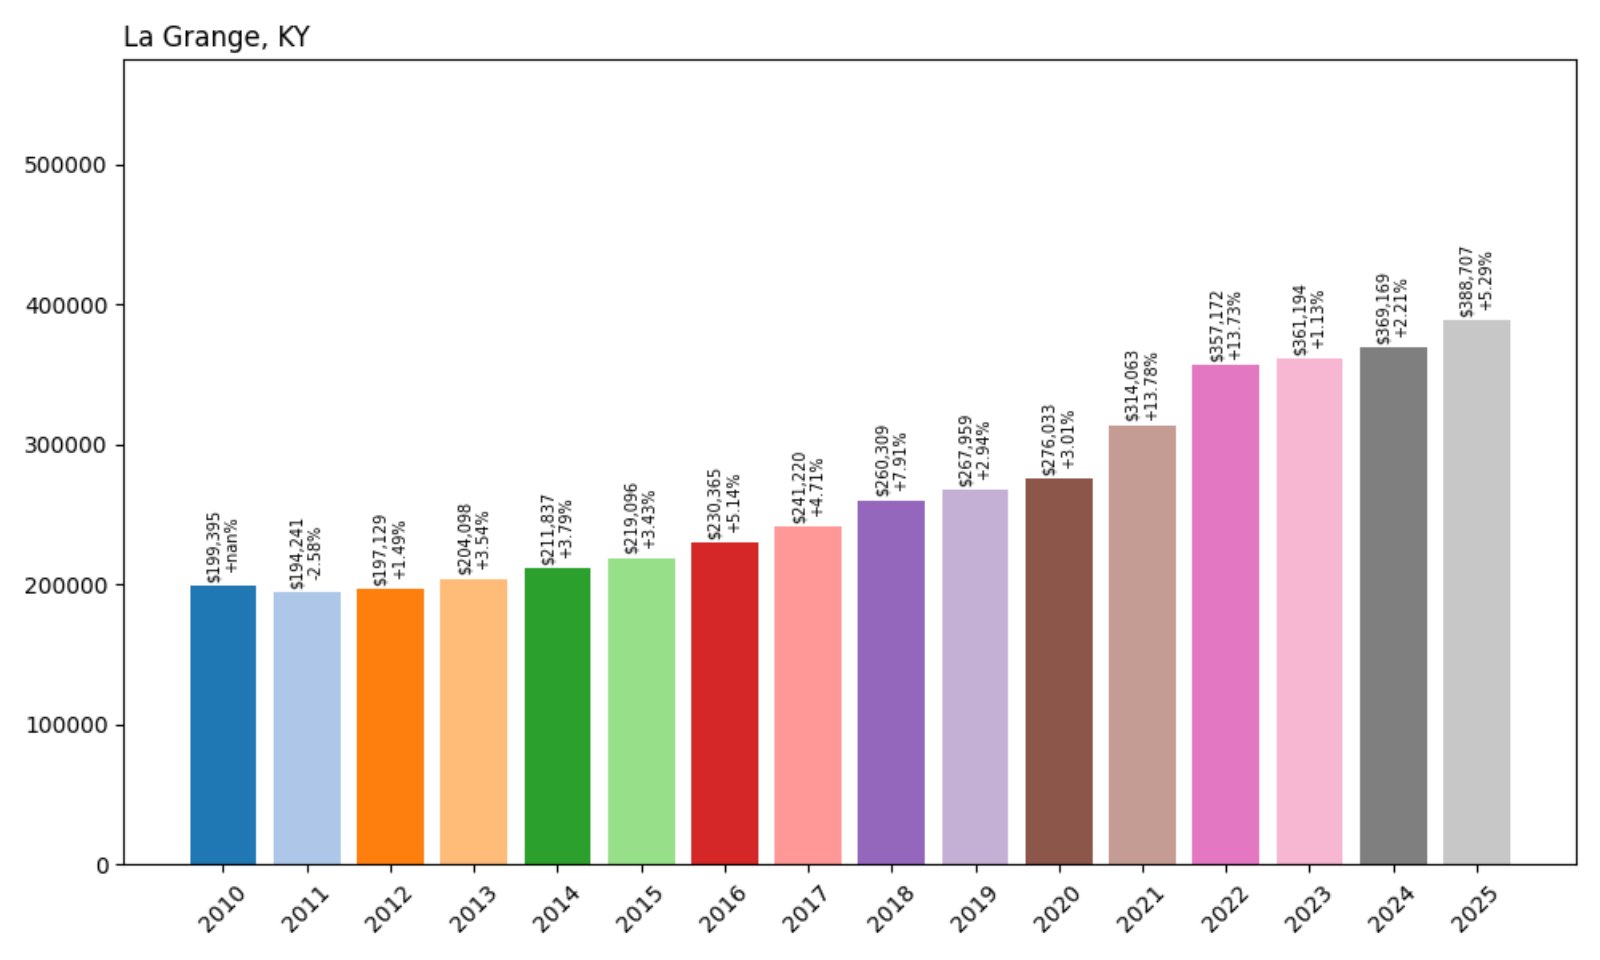
- 2010: $199,395
- 2011: $194,241 (−$5,154, −2.58% from previous year)
- 2012: $197,129 (+$2,887, +1.49% from previous year)
- 2013: $204,098 (+$6,969, +3.54% from previous year)
- 2014: $211,837 (+$7,739, +3.79% from previous year)
- 2015: $219,096 (+$7,259, +3.43% from previous year)
- 2016: $230,365 (+$11,269, +5.14% from previous year)
- 2017: $241,220 (+$10,854, +4.71% from previous year)
- 2018: $260,309 (+$19,089, +7.91% from previous year)
- 2019: $267,959 (+$7,650, +2.94% from previous year)
- 2020: $276,033 (+$8,074, +3.01% from previous year)
- 2021: $314,063 (+$38,030, +13.78% from previous year)
- 2022: $357,172 (+$43,109, +13.73% from previous year)
- 2023: $361,194 (+$4,023, +1.13% from previous year)
- 2024: $369,169 (+$7,975, +2.21% from previous year)
- 2025: $388,707 (+$19,538, +5.29% from previous year)
La Grange has nearly doubled its average home value since 2010, now reaching $388,707. Though 2023 showed modest movement, the overall growth remains impressive, bolstered by strong performances in the 2020–2022 window.
La Grange – Historic Downtown With Modern Appeal
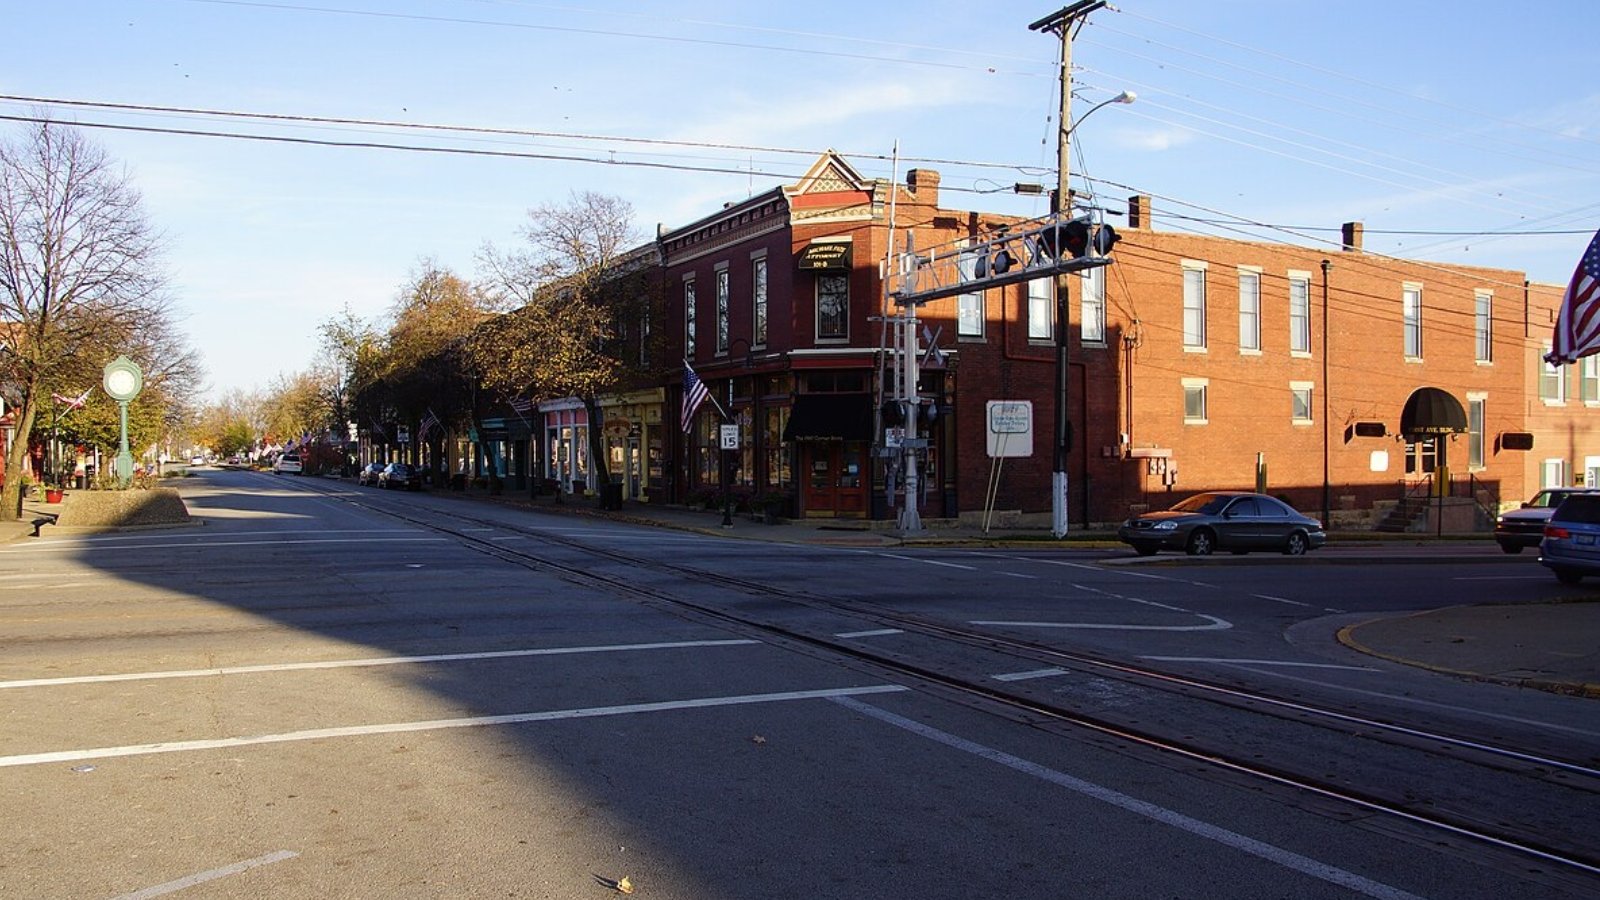
Located in Oldham County, La Grange is famous for its picturesque downtown where trains run down the middle of Main Street. The town blends small-town charm with top-rated schools, new developments, and proximity to Louisville.
Thanks to its mix of affordability, local culture, and strong school district, La Grange has become a top choice for families. The 2025 data shows that demand has continued to push prices upward, reinforcing its reputation as one of Kentucky’s most balanced and desirable communities.
11. Fort Mitchell – 83% Home Price Increase Since 2010

- 2010: $214,093
- 2011: $206,944 (−$7,149, −3.34% from previous year)
- 2012: $201,893 (−$5,050, −2.44% from previous year)
- 2013: $212,366 (+$10,472, +5.19% from previous year)
- 2014: $221,226 (+$8,860, +4.17% from previous year)
- 2015: $234,451 (+$13,225, +5.98% from previous year)
- 2016: $242,511 (+$8,060, +3.44% from previous year)
- 2017: $260,283 (+$17,772, +7.33% from previous year)
- 2018: $264,810 (+$4,526, +1.74% from previous year)
- 2019: $288,363 (+$23,553, +8.89% from previous year)
- 2020: $301,875 (+$13,512, +4.69% from previous year)
- 2021: $331,133 (+$29,259, +9.69% from previous year)
- 2022: $362,356 (+$31,222, +9.43% from previous year)
- 2023: $366,959 (+$4,603, +1.27% from previous year)
- 2024: $384,900 (+$17,942, +4.89% from previous year)
- 2025: $392,100 (+$7,199, +1.87% from previous year)
Fort Mitchell’s home values have grown 83% since 2010. Despite slower movement in recent years, the town continues to command some of the highest prices in Northern Kentucky, with the average home now priced at $392,100.
Fort Mitchell – Top Schools and Community Appeal
Fort Mitchell is one of the most sought-after towns in Kenton County, thanks to its award-winning Beechwood Independent School District and strong sense of community. Its convenient location, historic homes, and leafy neighborhoods add to its appeal.
The housing market here shows strong fundamentals. Even as price appreciation has cooled slightly, Fort Mitchell remains one of Kentucky’s most expensive and stable towns—underscoring its long-standing reputation for excellence in both education and quality of life.
10. Simpsonville – 106% Home Price Increase Since 2010
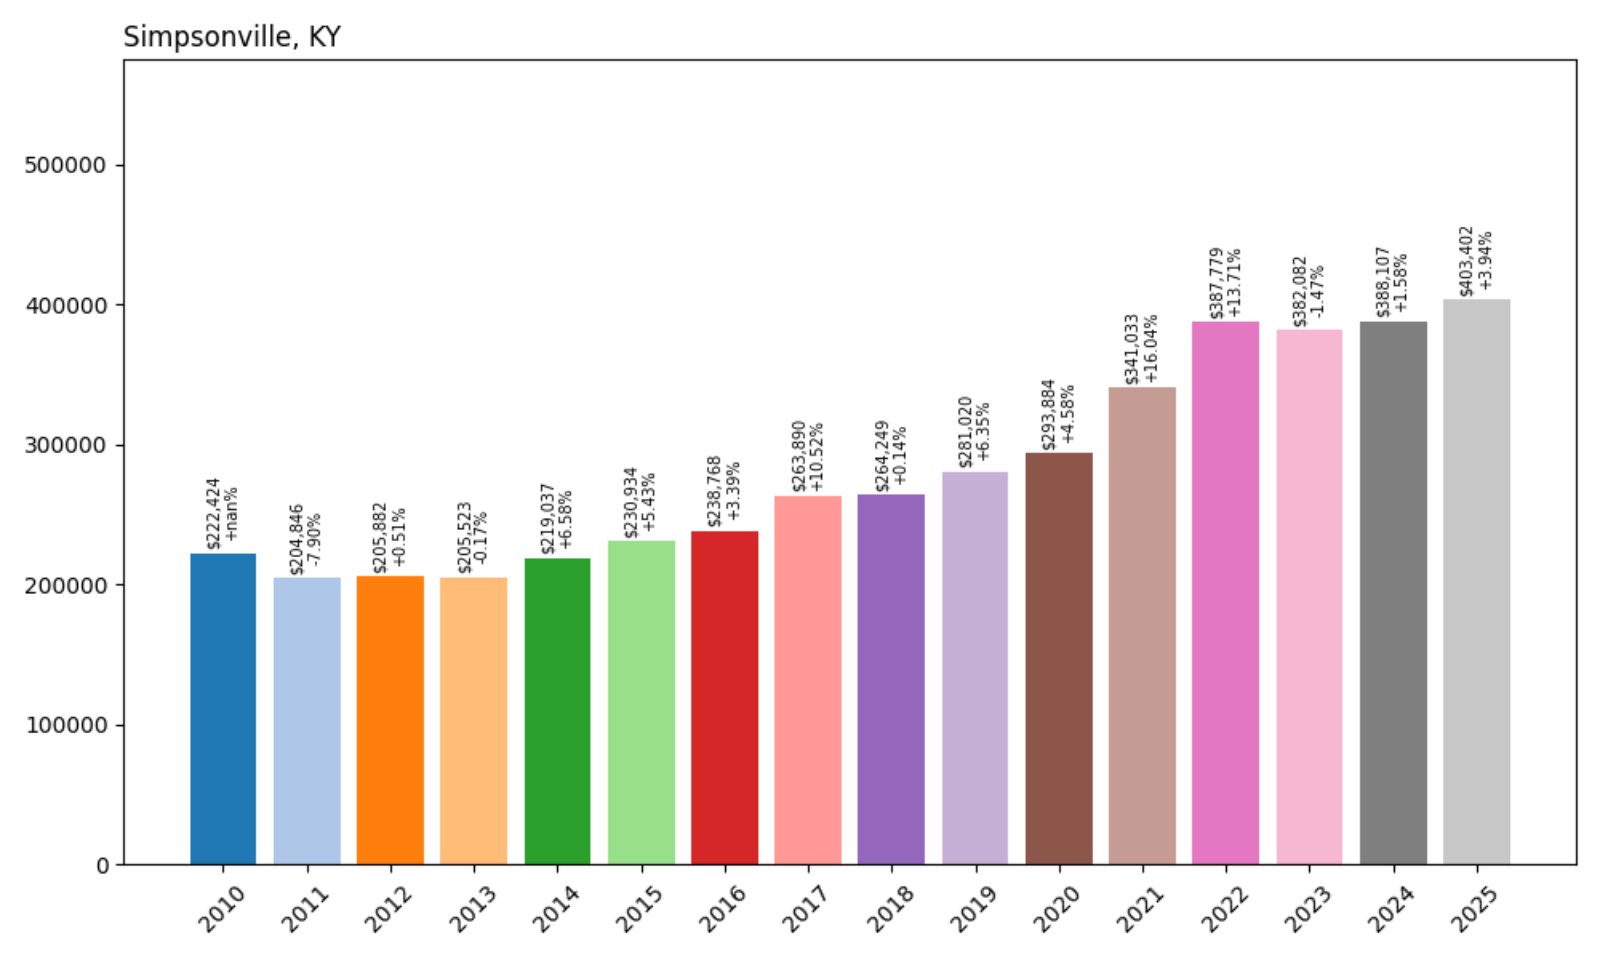
- 2010: $195,604
- 2011: $186,870 (−$8,734, −4.46% from previous year)
- 2012: $186,541 (−$328, −0.18% from previous year)
- 2013: $191,628 (+$5,087, +2.73% from previous year)
- 2014: $199,103 (+$7,475, +3.90% from previous year)
- 2015: $207,416 (+$8,313, +4.17% from previous year)
- 2016: $220,066 (+$12,650, +6.10% from previous year)
- 2017: $242,462 (+$22,396, +10.18% from previous year)
- 2018: $249,439 (+$6,977, +2.88% from previous year)
- 2019: $271,163 (+$21,724, +8.71% from previous year)
- 2020: $285,109 (+$13,946, +5.14% from previous year)
- 2021: $319,784 (+$34,675, +12.16% from previous year)
- 2022: $372,553 (+$52,769, +16.50% from previous year)
- 2023: $382,225 (+$9,672, +2.60% from previous year)
- 2024: $391,190 (+$8,965, +2.35% from previous year)
- 2025: $403,402 (+$12,212, +3.12% from previous year)
Simpsonville home prices have more than doubled since 2010, rising from $195,604 to $403,402. Price growth ramped up during the pandemic years and has continued at a steady, sustainable pace in recent years, with 2025 showing another solid increase.
Simpsonville – A Premium Pick Near Louisville and Shelbyville
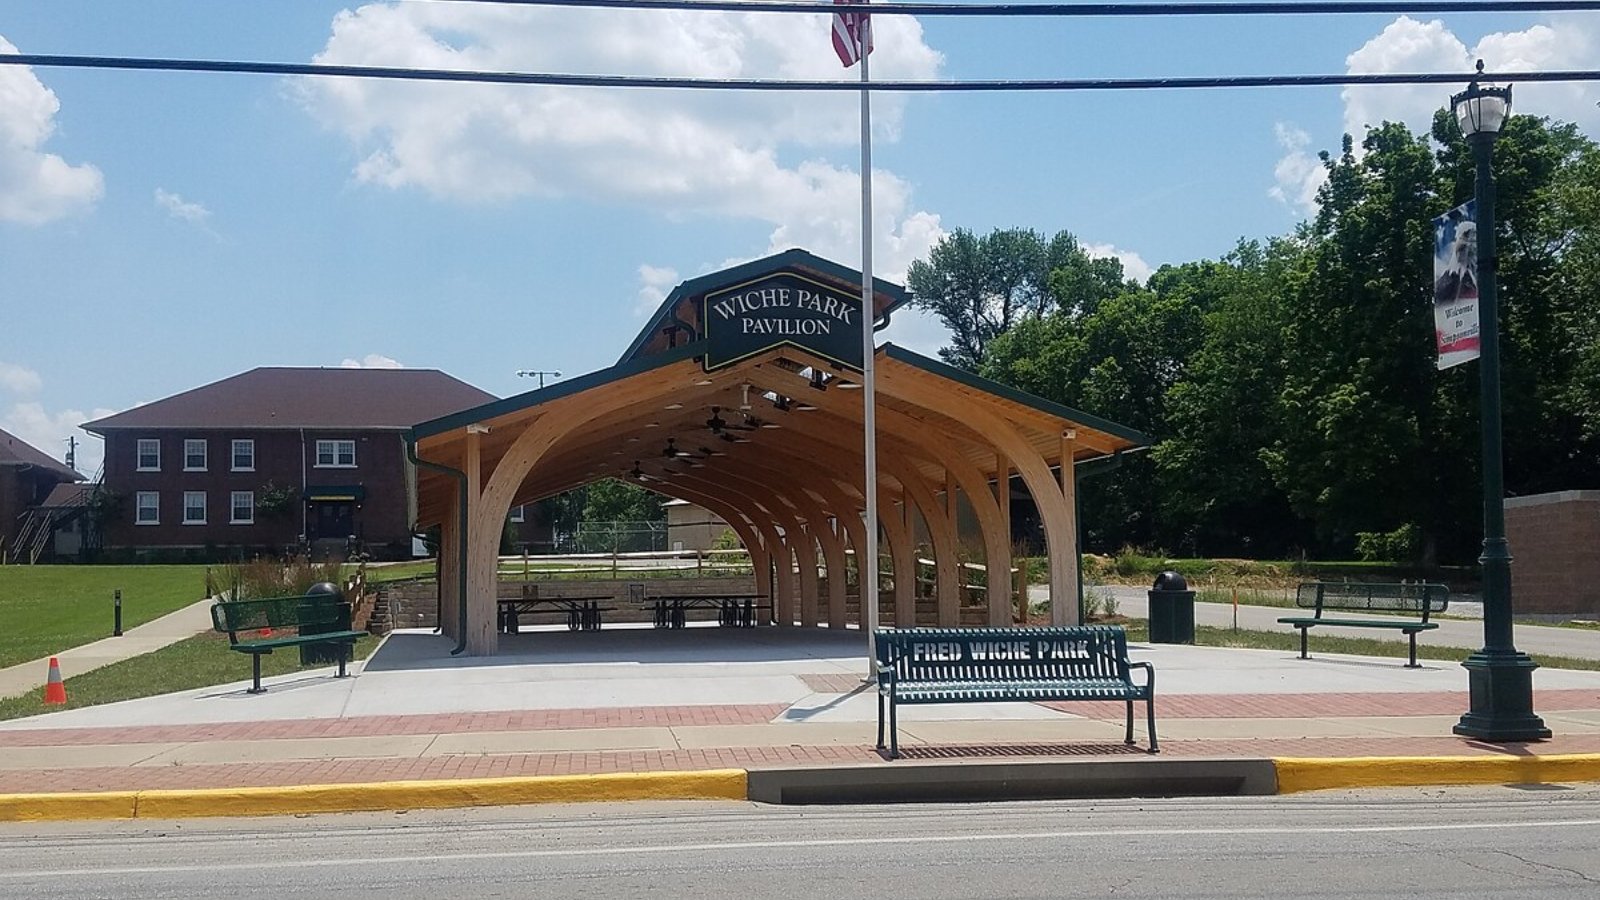
Simpsonville sits on the border between Jefferson and Shelby counties, offering small-town living just minutes from Louisville’s eastern edge. It’s known as the “American Saddlebred Capital of the World” and is home to horse farms, rolling countryside, and the popular Outlet Shoppes of the Bluegrass.
The combination of upscale development, proximity to major cities, and pastoral beauty has kept Simpsonville in high demand. With limited housing supply and robust amenities, property values continue to reflect buyers’ willingness to pay for convenience and quality.
9. Alvaton – 133% Home Price Increase Since 2010
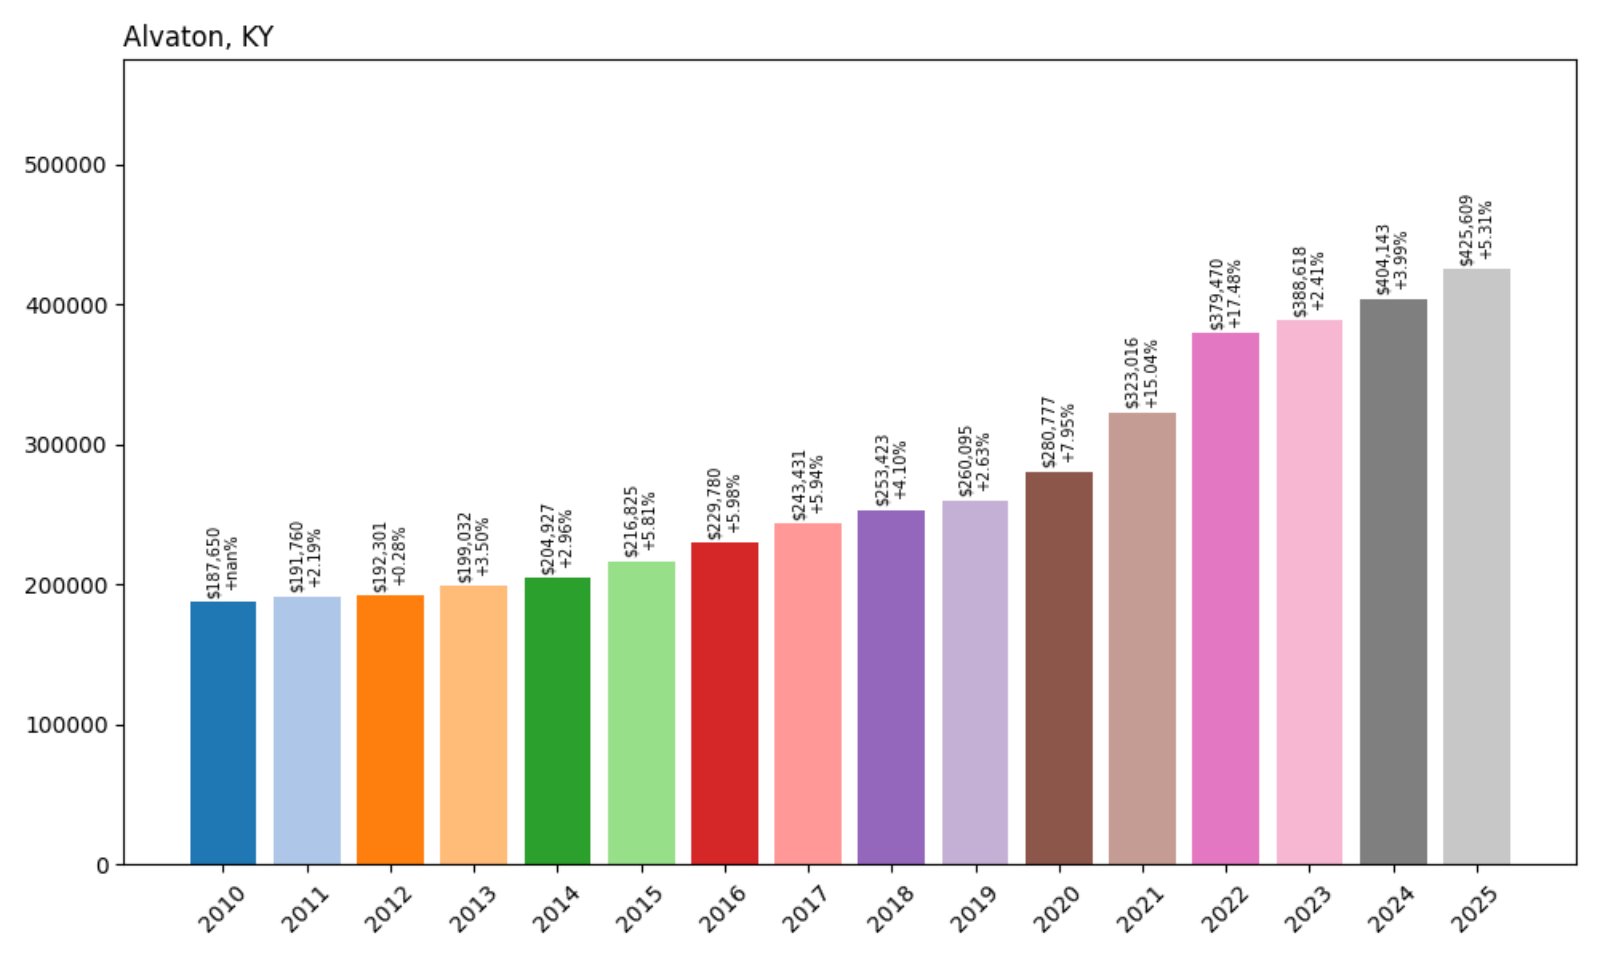
- 2010: $182,681
- 2011: $179,466 (−$3,215, −1.76% from previous year)
- 2012: $178,645 (−$821, −0.46% from previous year)
- 2013: $184,631 (+$5,985, +3.35% from previous year)
- 2014: $193,551 (+$8,920, +4.83% from previous year)
- 2015: $208,396 (+$14,845, +7.67% from previous year)
- 2016: $218,053 (+$9,657, +4.63% from previous year)
- 2017: $240,068 (+$22,015, +10.10% from previous year)
- 2018: $256,492 (+$16,424, +6.84% from previous year)
- 2019: $268,509 (+$12,017, +4.69% from previous year)
- 2020: $286,870 (+$18,361, +6.84% from previous year)
- 2021: $339,027 (+$52,157, +18.18% from previous year)
- 2022: $394,116 (+$55,089, +16.25% from previous year)
- 2023: $409,535 (+$15,419, +3.91% from previous year)
- 2024: $418,354 (+$8,819, +2.15% from previous year)
- 2025: $425,609 (+$7,255, +1.73% from previous year)
Alvaton’s housing market has surged 133% in value since 2010, with homes now averaging $425,609. The most dramatic increases came in the 2020–2022 period, reflecting Alvaton’s rapid growth as a residential choice for Bowling Green professionals.
Alvaton – Upscale Growth Near Bowling Green
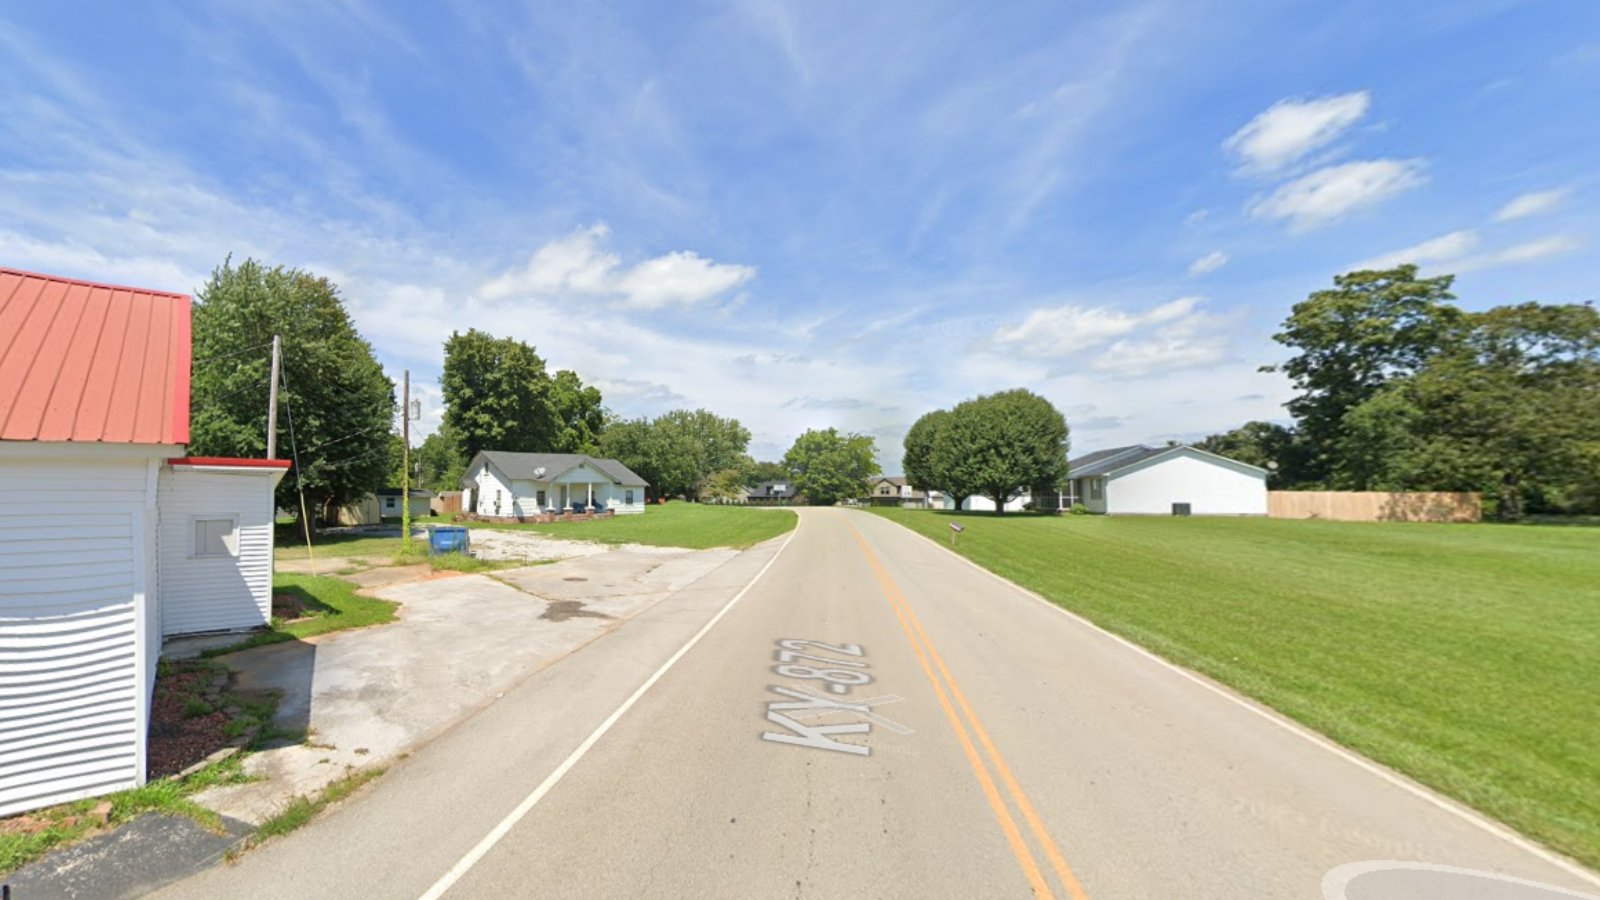
Located just southeast of Bowling Green in Warren County, Alvaton is becoming one of the most desirable suburban areas in southern Kentucky. Known for its large homesites, newer construction, and access to top schools, the town draws upwardly mobile families seeking space and amenities.
The post-pandemic migration away from urban centers helped amplify Alvaton’s popularity. As Warren County continues to grow economically, Alvaton stands out as a high-end residential enclave, explaining its consistent rise in home prices.
8. Wilsonville – 130% Home Price Increase Since 2010
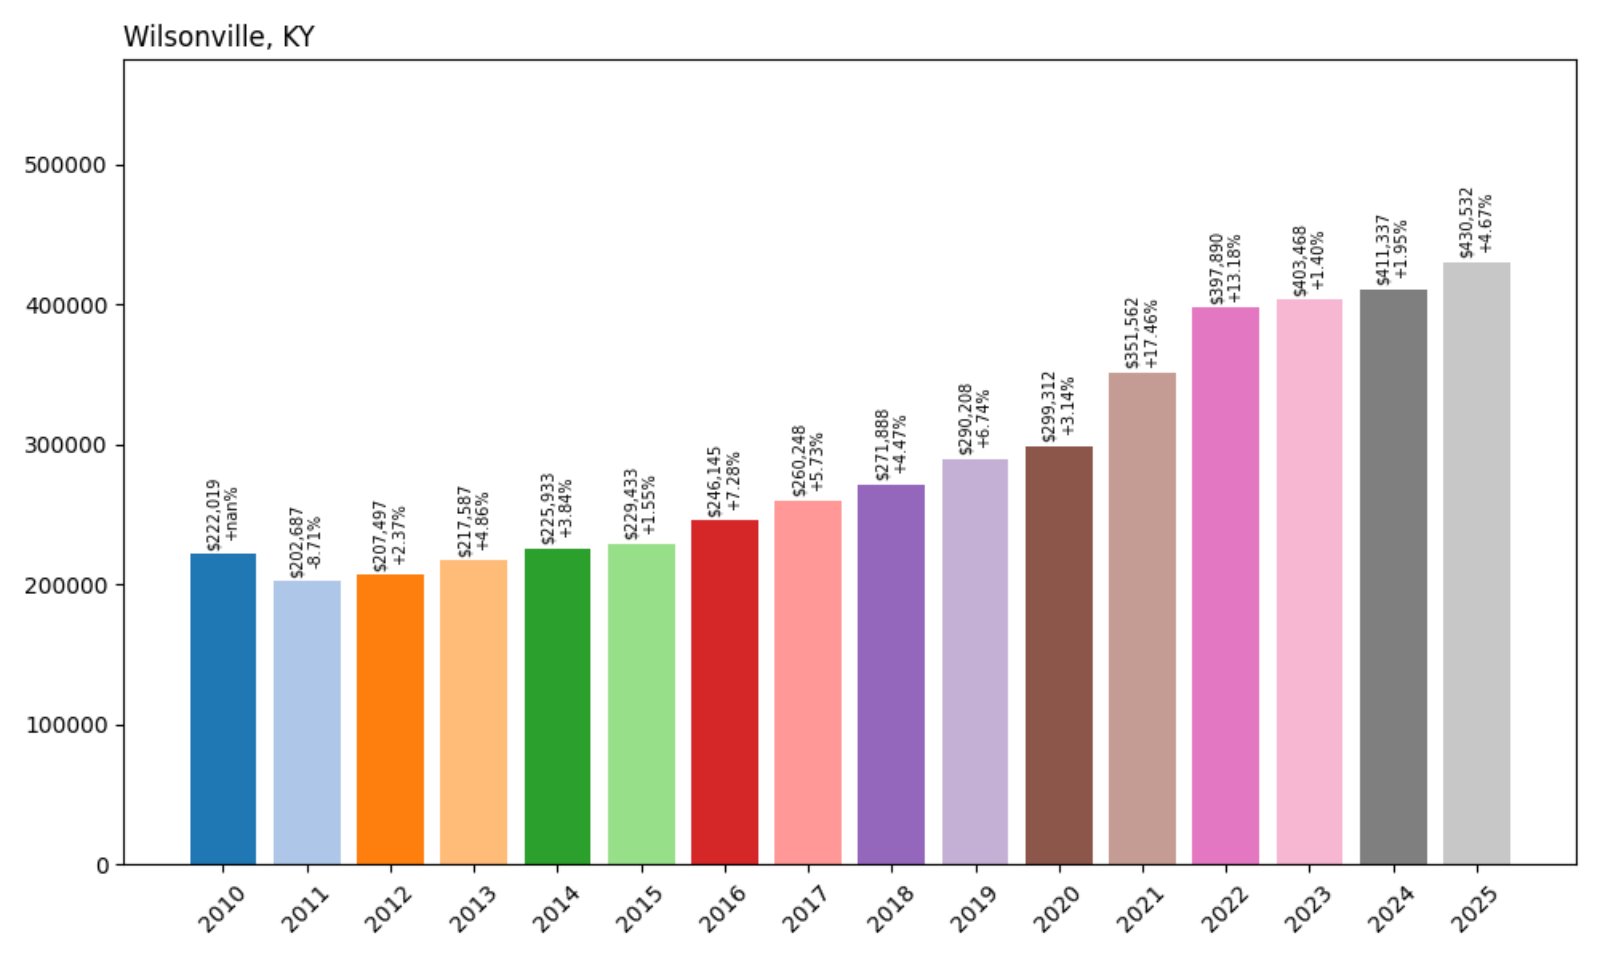
- 2010: $187,058
- 2011: $182,136 (−$4,922, −2.63% from previous year)
- 2012: $180,405 (−$1,731, −0.95% from previous year)
- 2013: $187,862 (+$7,457, +4.13% from previous year)
- 2014: $194,358 (+$6,496, +3.46% from previous year)
- 2015: $209,853 (+$15,495, +7.97% from previous year)
- 2016: $215,340 (+$5,487, +2.61% from previous year)
- 2017: $228,876 (+$13,536, +6.28% from previous year)
- 2018: $249,468 (+$20,592, +8.99% from previous year)
- 2019: $260,312 (+$10,844, +4.35% from previous year)
- 2020: $271,439 (+$11,127, +4.28% from previous year)
- 2021: $328,648 (+$57,209, +21.07% from previous year)
- 2022: $388,714 (+$60,066, +18.28% from previous year)
- 2023: $405,326 (+$16,612, +4.27% from previous year)
- 2024: $418,450 (+$13,124, +3.24% from previous year)
- 2025: $430,532 (+$12,082, +2.89% from previous year)
Wilsonville has experienced a 130% increase in average home prices since 2010, with a 2025 value of $430,532. The surge in demand during 2021 and 2022 drove dramatic year-over-year gains, with sustained appreciation since.
Wilsonville – Exclusive Rural Living in Shelby County
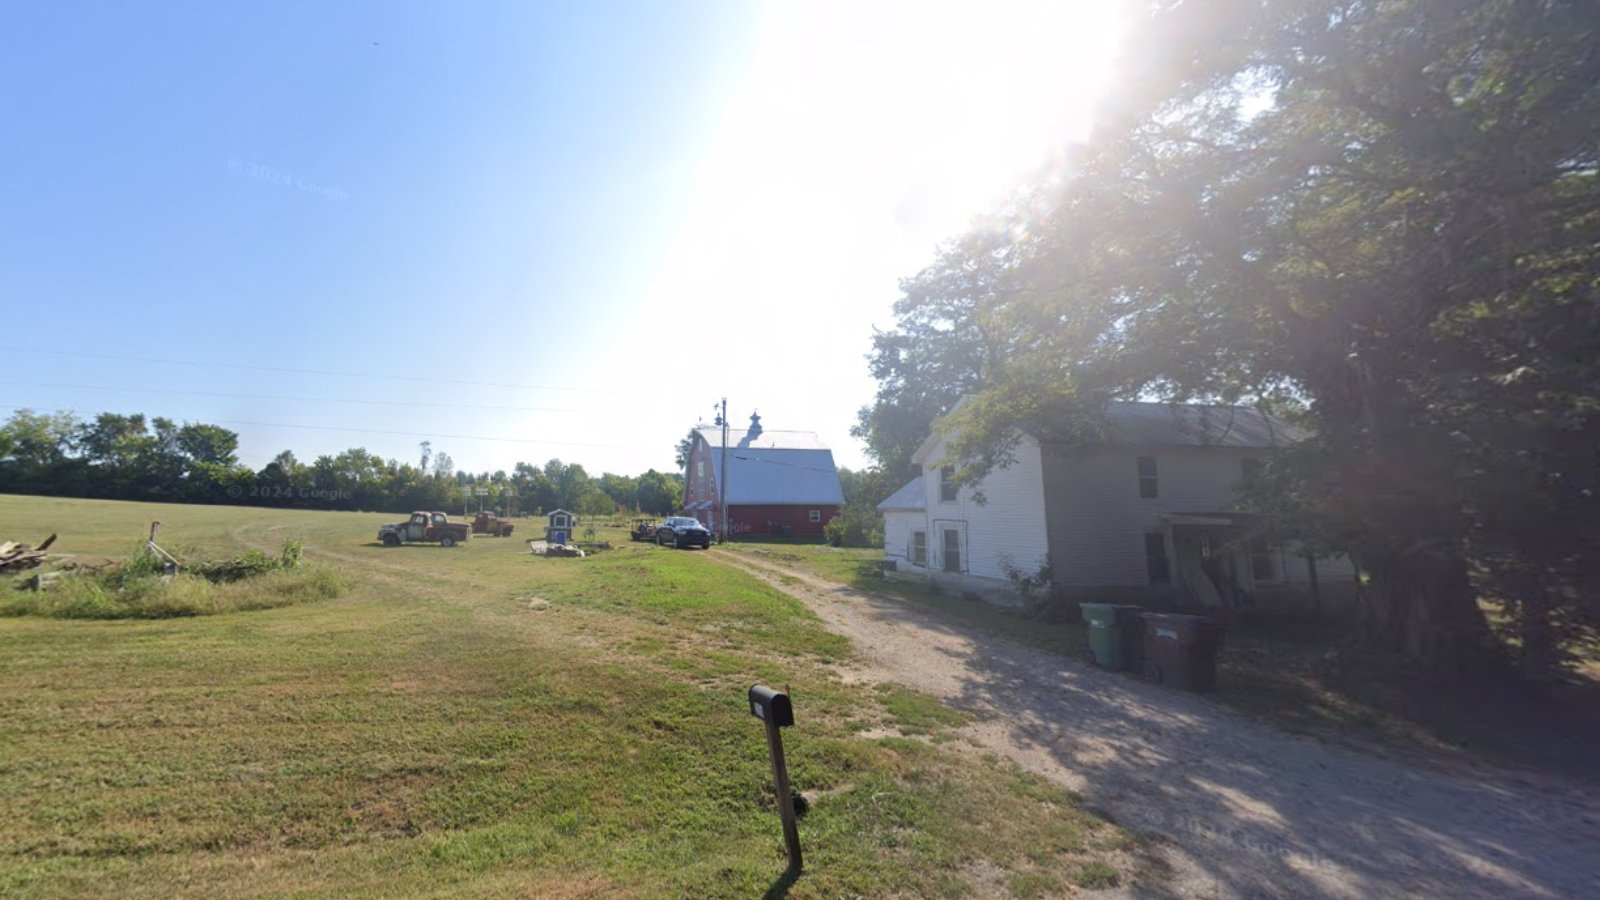
Wilsonville is a small, rural community in Shelby County that has become known for spacious properties, equestrian estates, and high-end residential development. Though relatively quiet, the area benefits from proximity to both Louisville and Shelbyville, making it ideal for buyers seeking country elegance without isolation.
Low inventory and high-end custom builds have helped drive values higher. With interest from affluent buyers and limited supply, Wilsonville remains one of Kentucky’s most exclusive places to own property.
7. Buckner – 106% Home Price Increase Since 2010
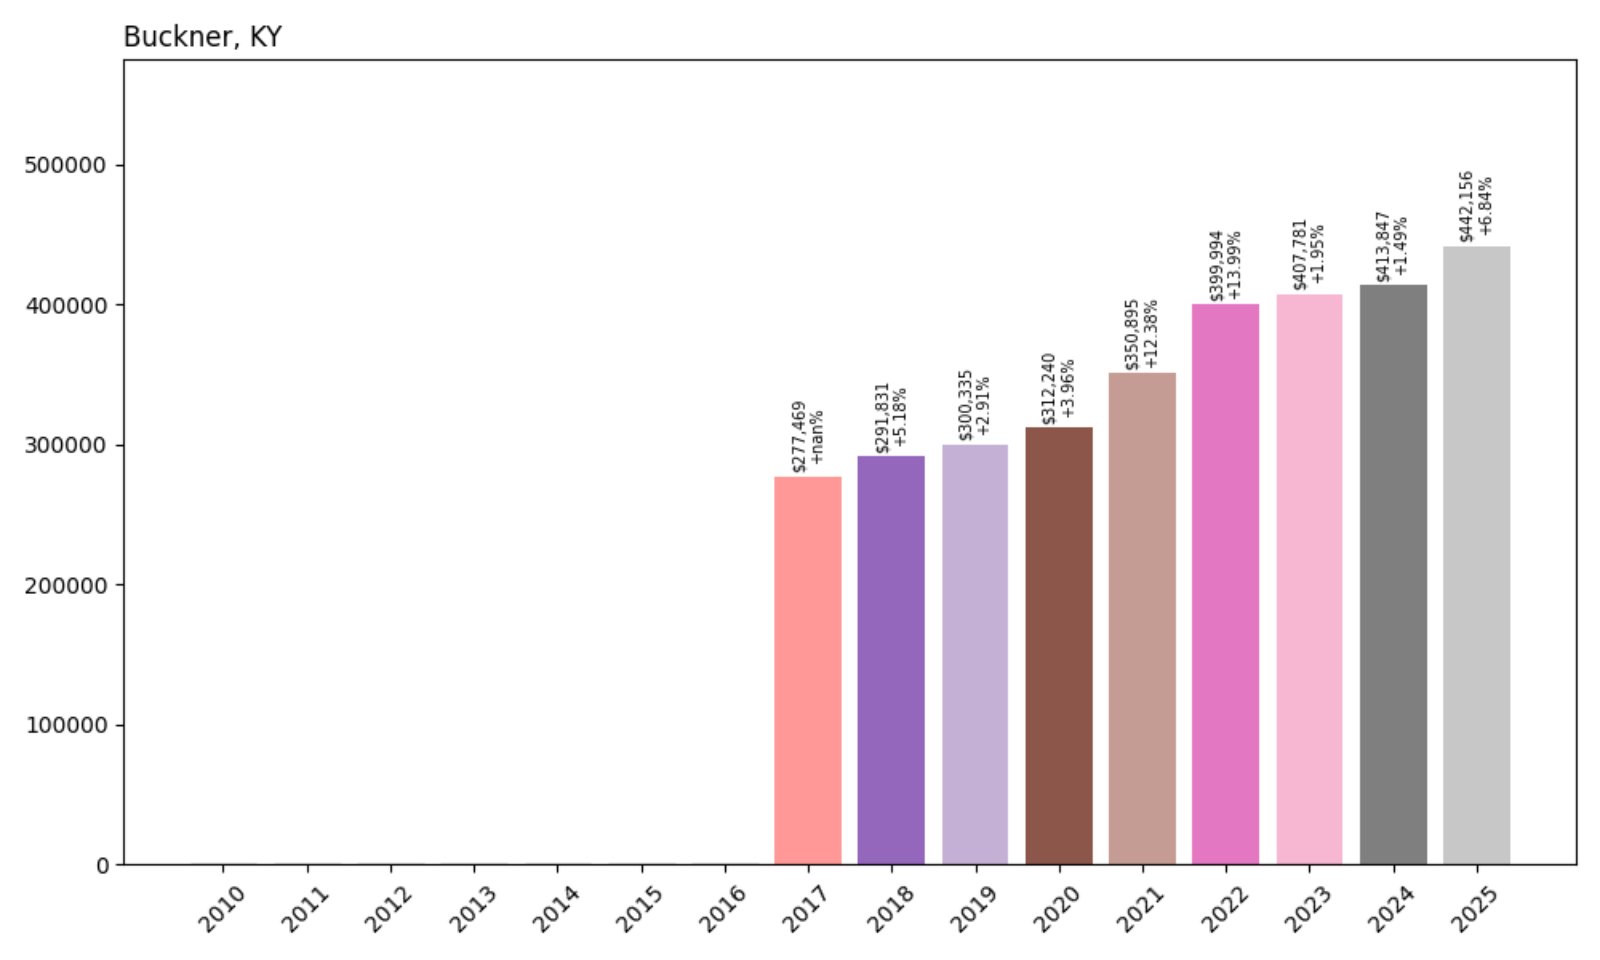
- 2010: $214,437
- 2011: $212,679 (−$1,758, −0.82% from previous year)
- 2012: $210,362 (−$2,317, −1.09% from previous year)
- 2013: $215,260 (+$4,898, +2.33% from previous year)
- 2014: $226,467 (+$11,207, +5.21% from previous year)
- 2015: $232,711 (+$6,244, +2.76% from previous year)
- 2016: $244,642 (+$11,931, +5.13% from previous year)
- 2017: $260,482 (+$15,840, +6.48% from previous year)
- 2018: $278,957 (+$18,475, +7.09% from previous year)
- 2019: $287,505 (+$8,548, +3.06% from previous year)
- 2020: $297,219 (+$9,714, +3.38% from previous year)
- 2021: $344,615 (+$47,396, +15.95% from previous year)
- 2022: $395,167 (+$50,552, +14.67% from previous year)
- 2023: $400,648 (+$5,481, +1.39% from previous year)
- 2024: $421,692 (+$21,043, +5.25% from previous year)
- 2025: $442,156 (+$20,464, +4.85% from previous year)
Buckner has seen home prices climb 106% since 2010. With strong increases during the pandemic housing rush and continued gains afterward, average home values have reached $442,156 in 2025.
Buckner – High-End Suburban Comfort in Oldham County
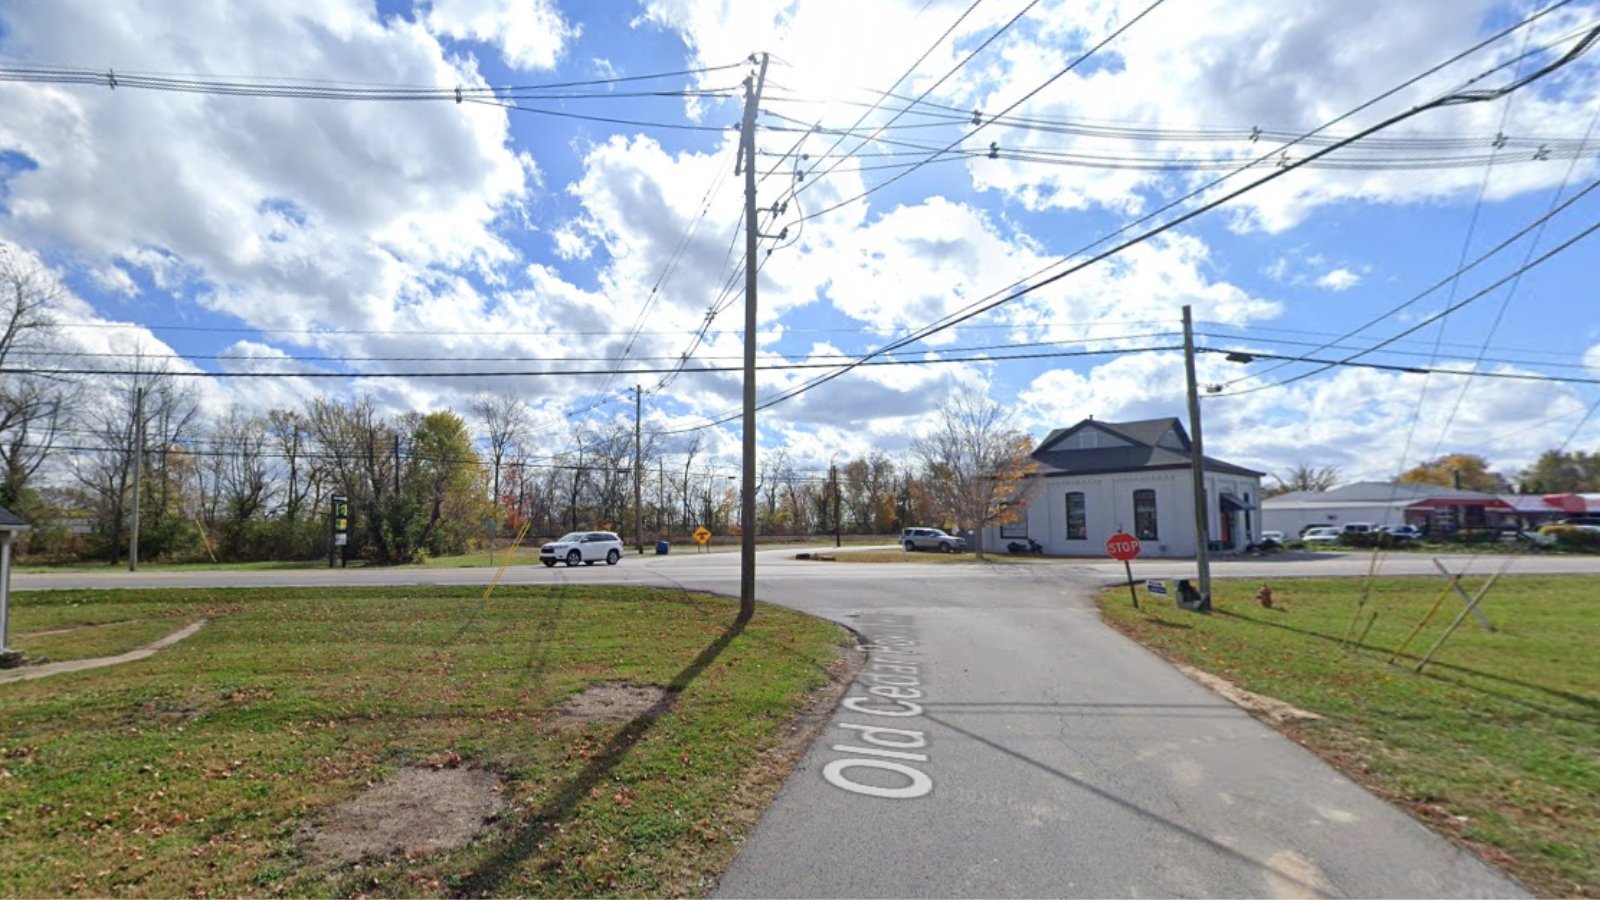
Buckner is a premier suburban destination located in Oldham County. Known for its excellent school system and safe, family-friendly neighborhoods, it consistently ranks among Kentucky’s best places to live for those prioritizing education and community quality.
Strong schools and limited land for development have helped drive long-term appreciation. Buckner’s stable growth and proximity to Louisville ensure it stays among the top-tier housing markets in the state.
6. Union – 106% Home Price Increase Since 2010
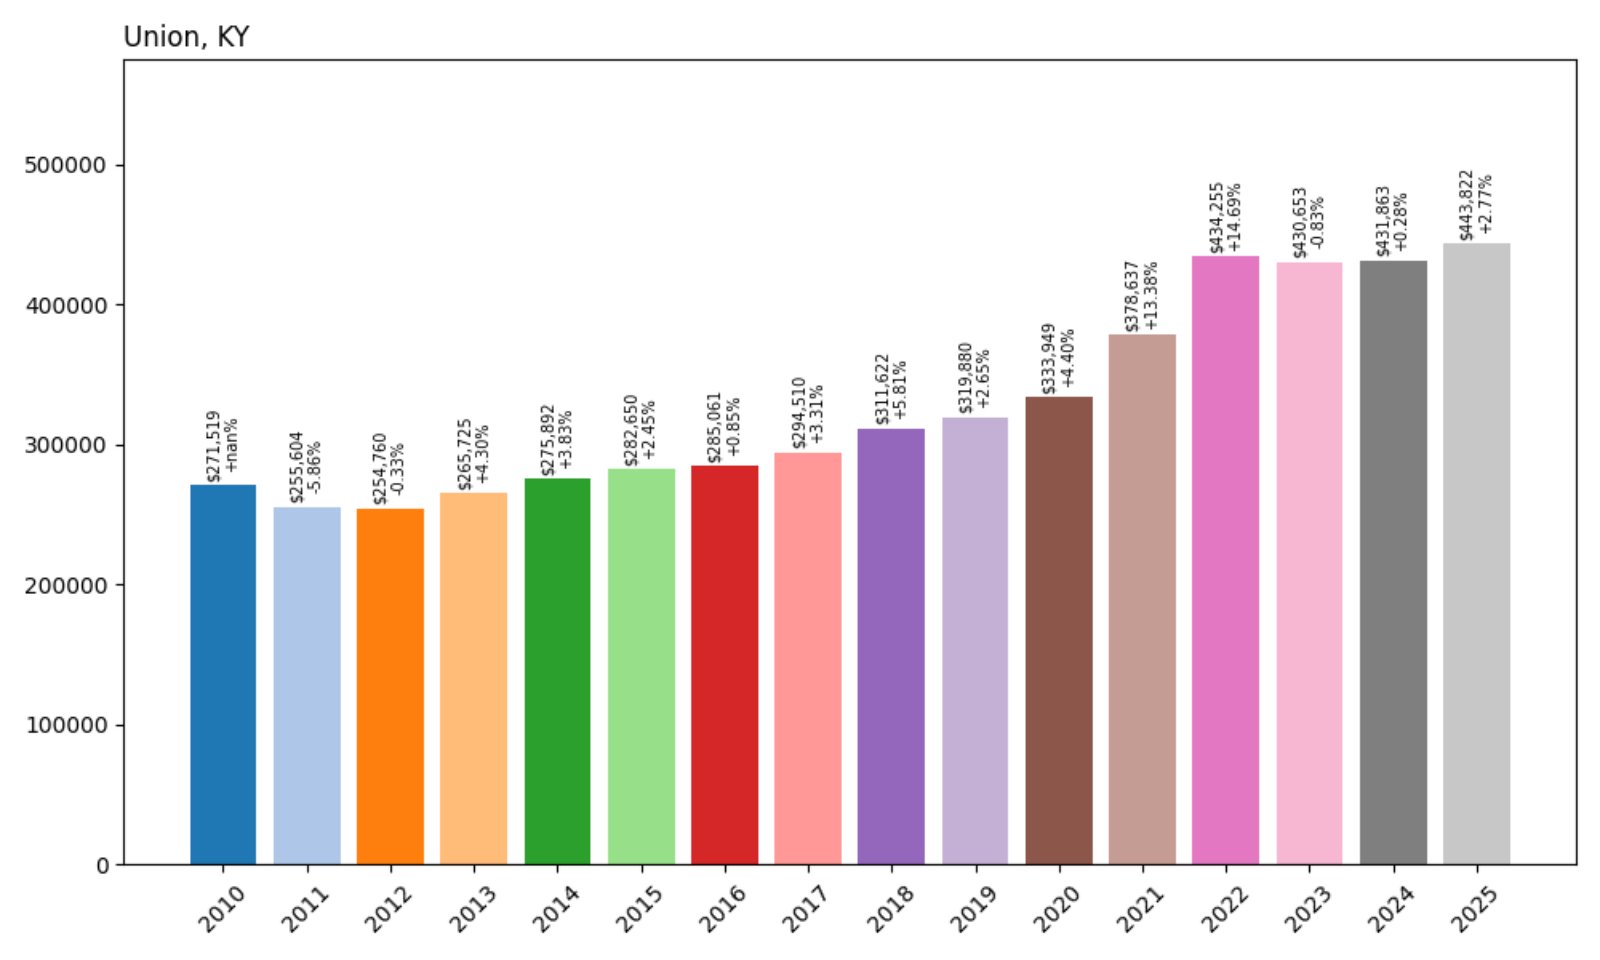
- 2010: $215,266
- 2011: $210,228 (−$5,038, −2.34% from previous year)
- 2012: $207,258 (−$2,969, −1.41% from previous year)
- 2013: $212,908 (+$5,650, +2.73% from previous year)
- 2014: $221,657 (+$8,749, +4.11% from previous year)
- 2015: $227,073 (+$5,416, +2.44% from previous year)
- 2016: $235,226 (+$8,152, +3.59% from previous year)
- 2017: $252,867 (+$17,640, +7.50% from previous year)
- 2018: $274,698 (+$21,831, +8.63% from previous year)
- 2019: $280,407 (+$5,709, +2.08% from previous year)
- 2020: $293,302 (+$12,895, +4.60% from previous year)
- 2021: $349,474 (+$56,172, +19.15% from previous year)
- 2022: $405,349 (+$55,875, +15.99% from previous year)
- 2023: $413,850 (+$8,501, +2.10% from previous year)
- 2024: $430,700 (+$16,850, +4.07% from previous year)
- 2025: $443,822 (+$13,122, +3.05% from previous year)
Union’s average home prices have more than doubled since 2010, with 2025 values reaching $443,822. Price gains have been strong and consistent, particularly in the last five years, marking Union as a standout market in Northern Kentucky.
Union – Suburban Sophistication Meets Rural Charm
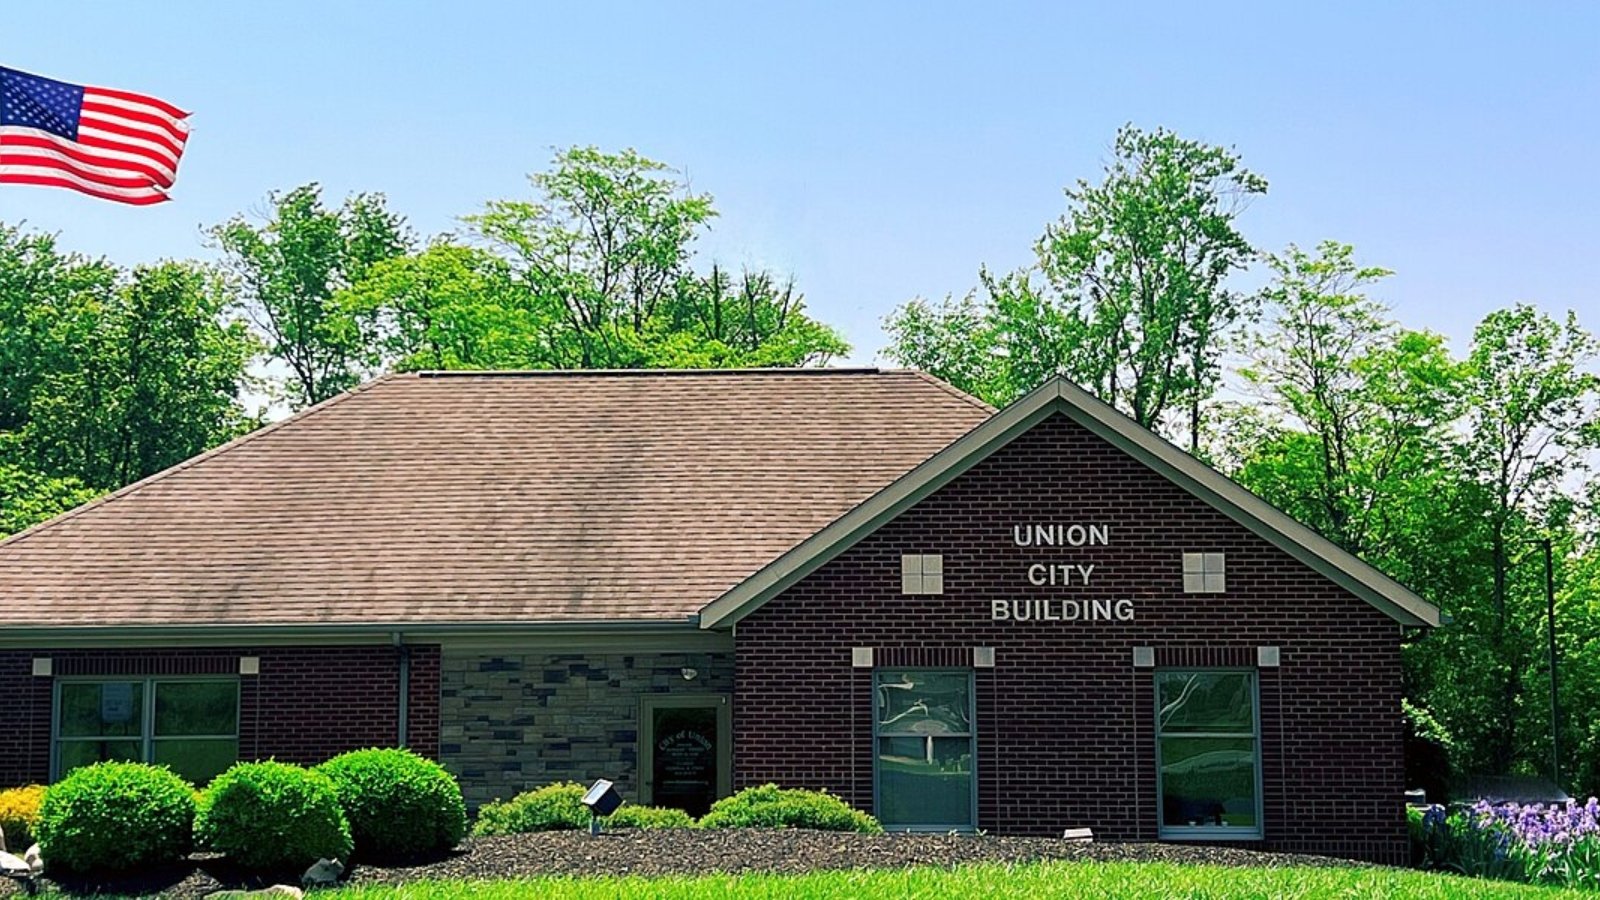
Located in Boone County, Union is one of the fastest-growing suburbs of the Cincinnati metro area. It blends spacious new housing developments with horse farms and green spaces, offering both modern convenience and scenic living.
Its explosive growth during the pandemic and continued strong performance stem from an influx of relocating families, excellent schools, and a well-maintained housing stock. Union’s high values reflect its reputation as a premier place to live in Northern Kentucky.
5. Finchville – 101% Home Price Increase Since 2010
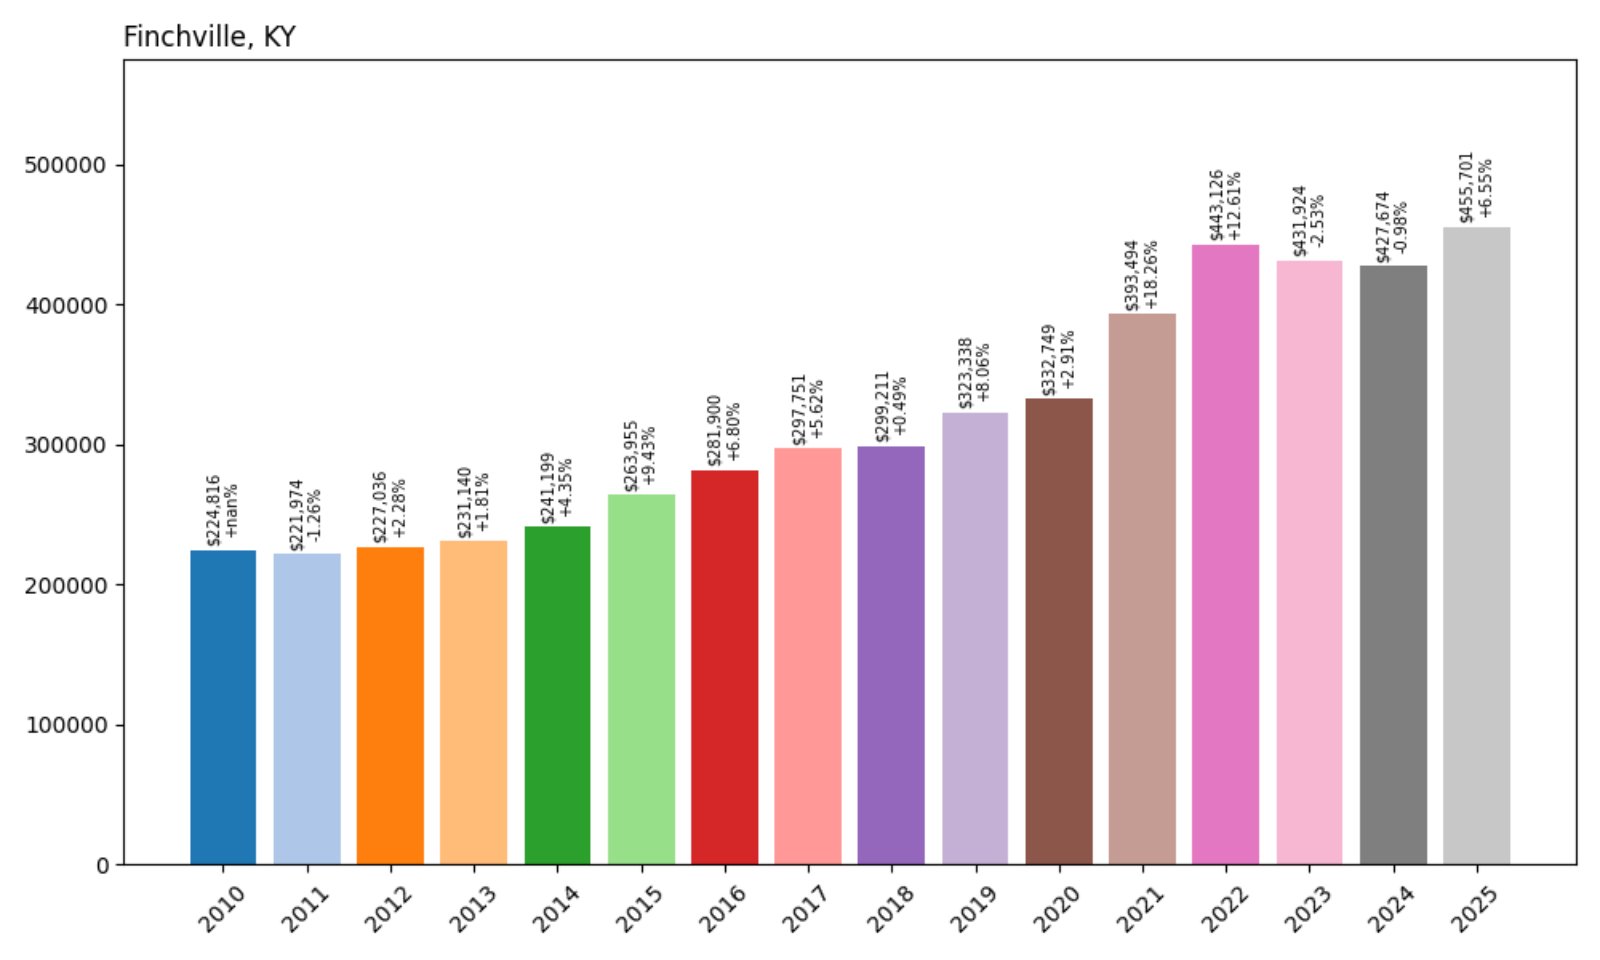
- 2010: $224,816
- 2011: $221,974 (−$2,842, −1.26%)
- 2012: $227,036 (+$5,062, +2.28%)
- 2013: $231,140 (+$4,104, +1.81%)
- 2014: $241,199 (+$10,059, +4.35%)
- 2015: $252,869 (+$11,670, +4.84%)
- 2016: $256,479 (+$3,610, +1.43%)
- 2017: $273,999 (+$17,520, +6.83%)
- 2018: $284,828 (+$10,829, +3.95%)
- 2019: $306,214 (+$21,386, +7.51%)
- 2020: $324,796 (+$18,582, +6.07%)
- 2021: $370,351 (+$45,555, +14.02%)
- 2022: $427,700 (+$57,349, +15.48%)
- 2023: $440,004 (+$12,304, +2.88%)
- 2024: $454,392 (+$14,388, +3.27%)
- 2025: $451,701 (−$2,691, −0.59%)
Finchville’s home values have more than doubled since 2010, driven largely by post-2020 demand for rural living. The town saw double-digit annual increases in 2021 and 2022 before tapering off to steadier gains.
Finchville – Equestrian Beauty With a Luxury Edge
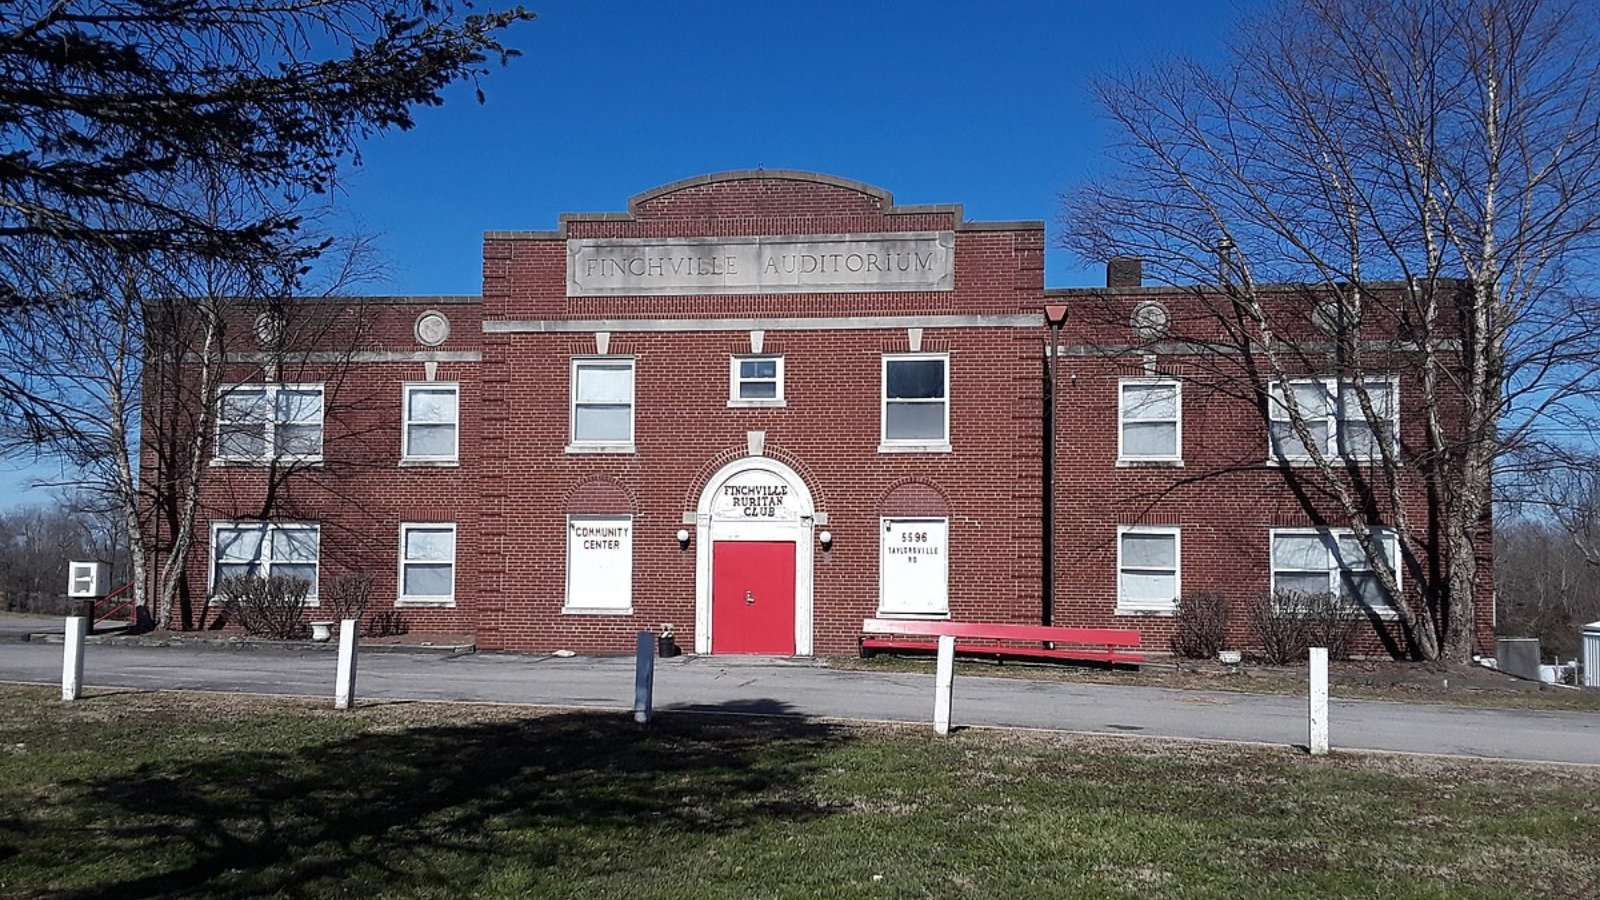
Located in Shelby County, Finchville combines Kentucky horse country charm with an emerging luxury market. Large-lot homes, peaceful surroundings, and easy access to Shelbyville and Louisville make it a magnet for high-end buyers.
With major appreciation during the pandemic boom, Finchville has become one of Kentucky’s most desirable addresses for those seeking space, privacy, and elegant rural living.
4. River Bluff – 62% Home Price Increase Since 2017
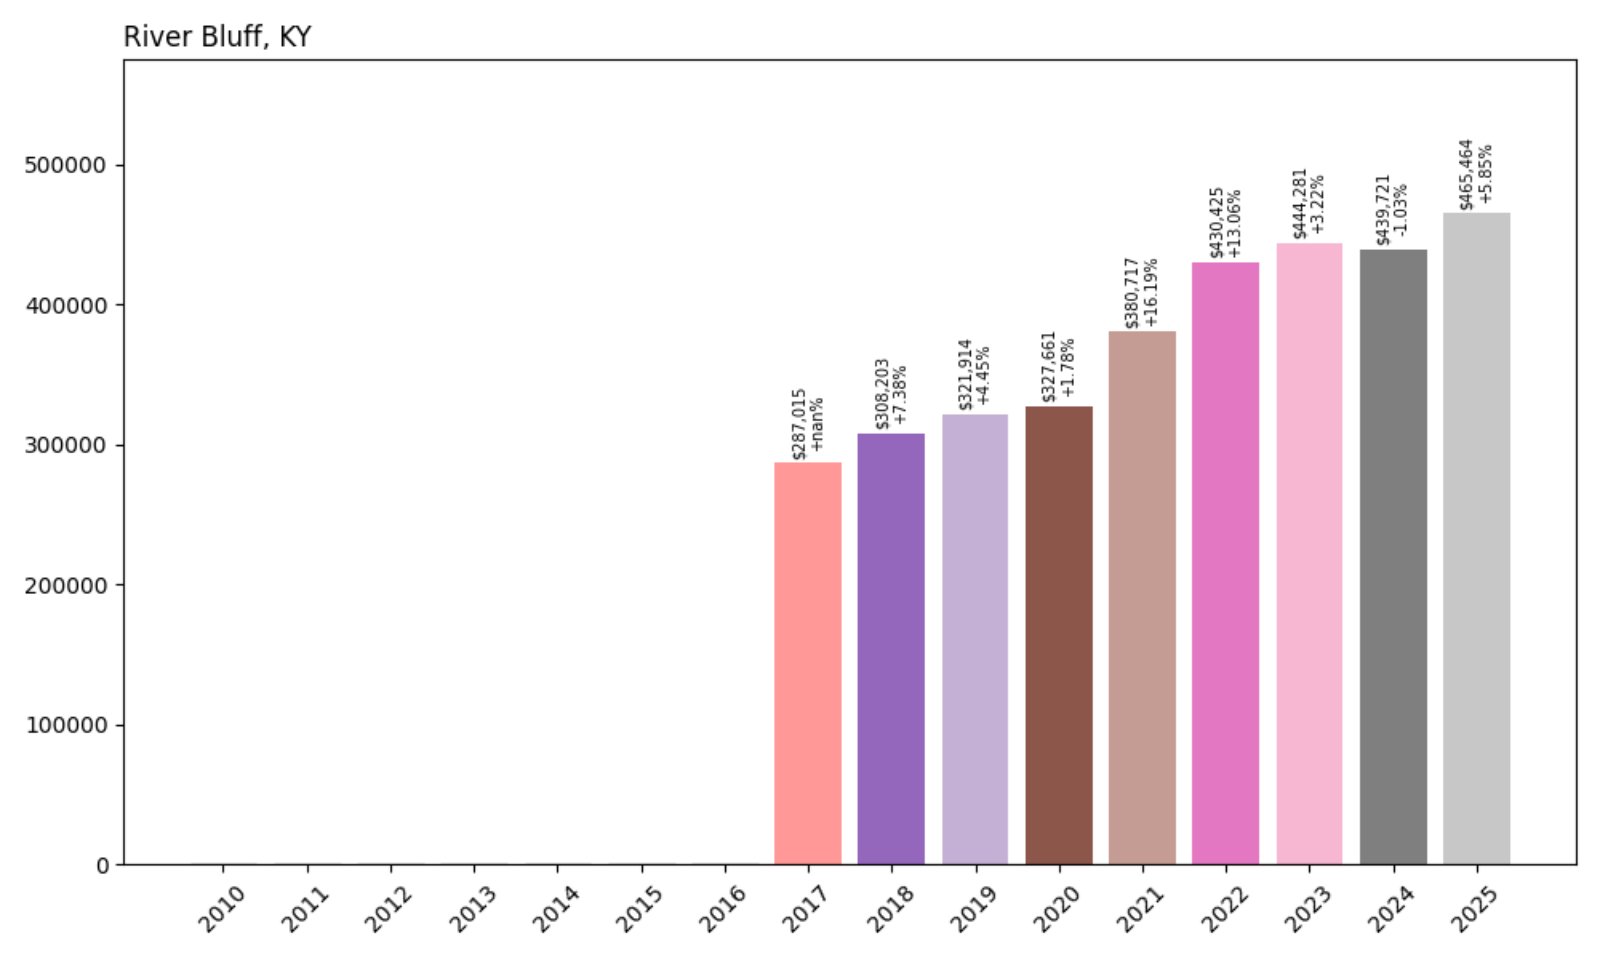
- 2017: $287,015
- 2018: $308,203 (+$21,188, +7.38%)
- 2019: $321,914 (+$13,711, +4.45%)
- 2020: $327,661 (+$5,747, +1.78%)
- 2021: $380,717 (+$53,056, +16.20%)
- 2022: $430,425 (+$49,708, +13.06%)
- 2023: $444,281 (+$13,856, +3.22%)
- 2024: $439,721 (−$4,560, −1.03%)
- 2025: $465,464 (+$25,743, +5.85%)
River Bluff has seen home values increase by 62% since 2017, driven by high-end demand and tight supply. After cooling slightly in 2024, the market rebounded in 2025 with a nearly 6% price gain.
River Bluff – Prestigious Riverside Living
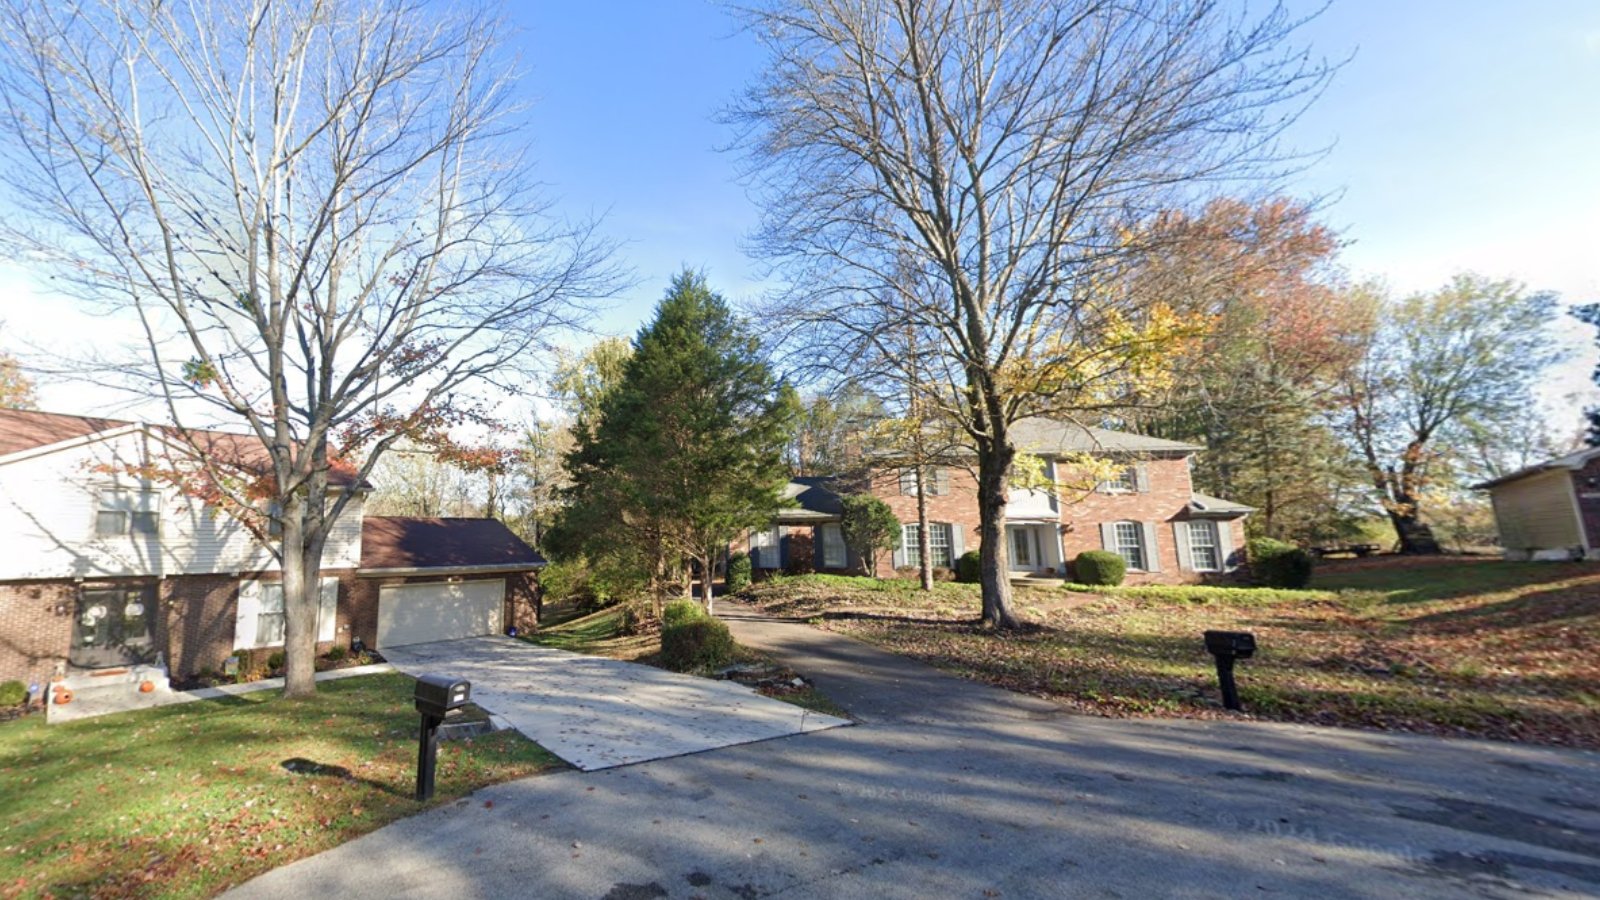
This small, exclusive town in Oldham County hugs the Ohio River just northeast of Louisville. Known for gated homes, manicured estates, and riverfront properties, River Bluff appeals to affluent buyers looking for quiet prestige.
Its limited housing stock and top-tier location have kept prices high, with recent data showing renewed momentum in 2025. River Bluff’s enduring appeal makes it one of the priciest addresses in Kentucky.
3. Crestwood – 95% Home Price Increase Since 2010
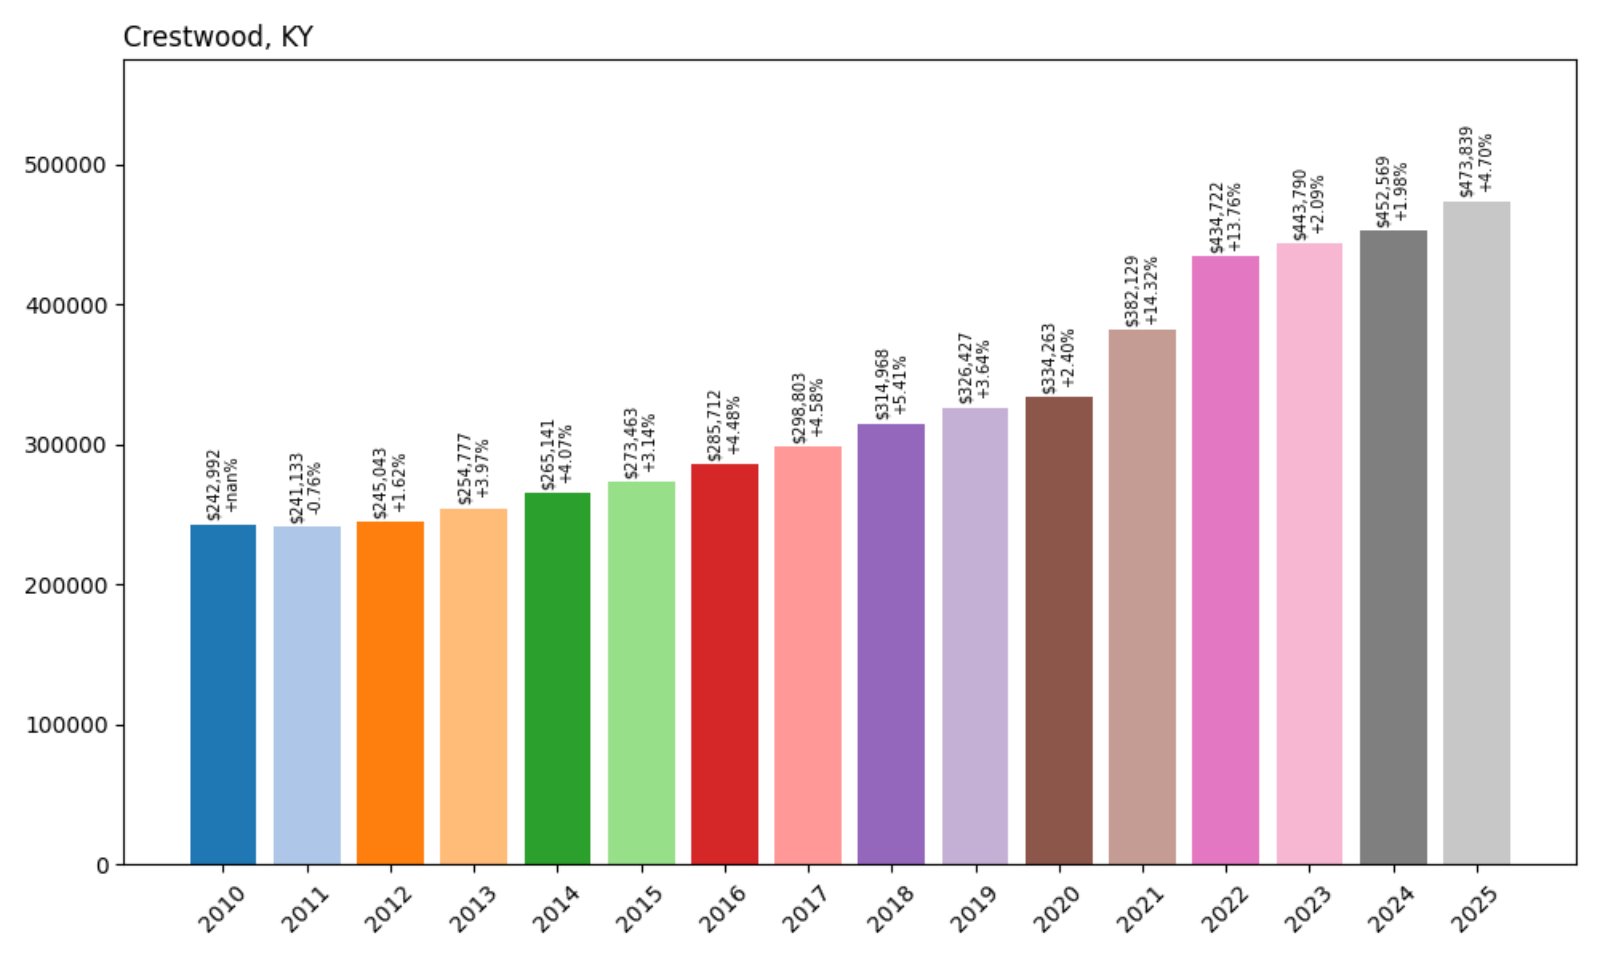
- 2010: $242,992
- 2011: $241,133 (−$1,859, −0.77%)
- 2012: $245,043 (+$3,910, +1.62%)
- 2013: $254,777 (+$9,734, +3.97%)
- 2014: $265,141 (+$10,364, +4.07%)
- 2015: $278,254 (+$13,113, +4.95%)
- 2016: $285,819 (+$7,565, +2.72%)
- 2017: $305,399 (+$19,580, +6.85%)
- 2018: $318,582 (+$13,183, +4.32%)
- 2019: $334,132 (+$15,550, +4.88%)
- 2020: $350,194 (+$16,062, +4.81%)
- 2021: $408,377 (+$58,183, +16.62%)
- 2022: $465,072 (+$56,695, +13.89%)
- 2023: $473,562 (+$8,490, +1.83%)
- 2024: $471,821 (−$1,741, −0.37%)
- 2025: $473,839 (+$2,018, +0.43%)
Crestwood’s average home values nearly doubled over 15 years. After explosive growth from 2020–2022, prices have plateaued at high levels, reflecting long-term demand and market maturity.
Crestwood – Suburban Stability in Oldham County
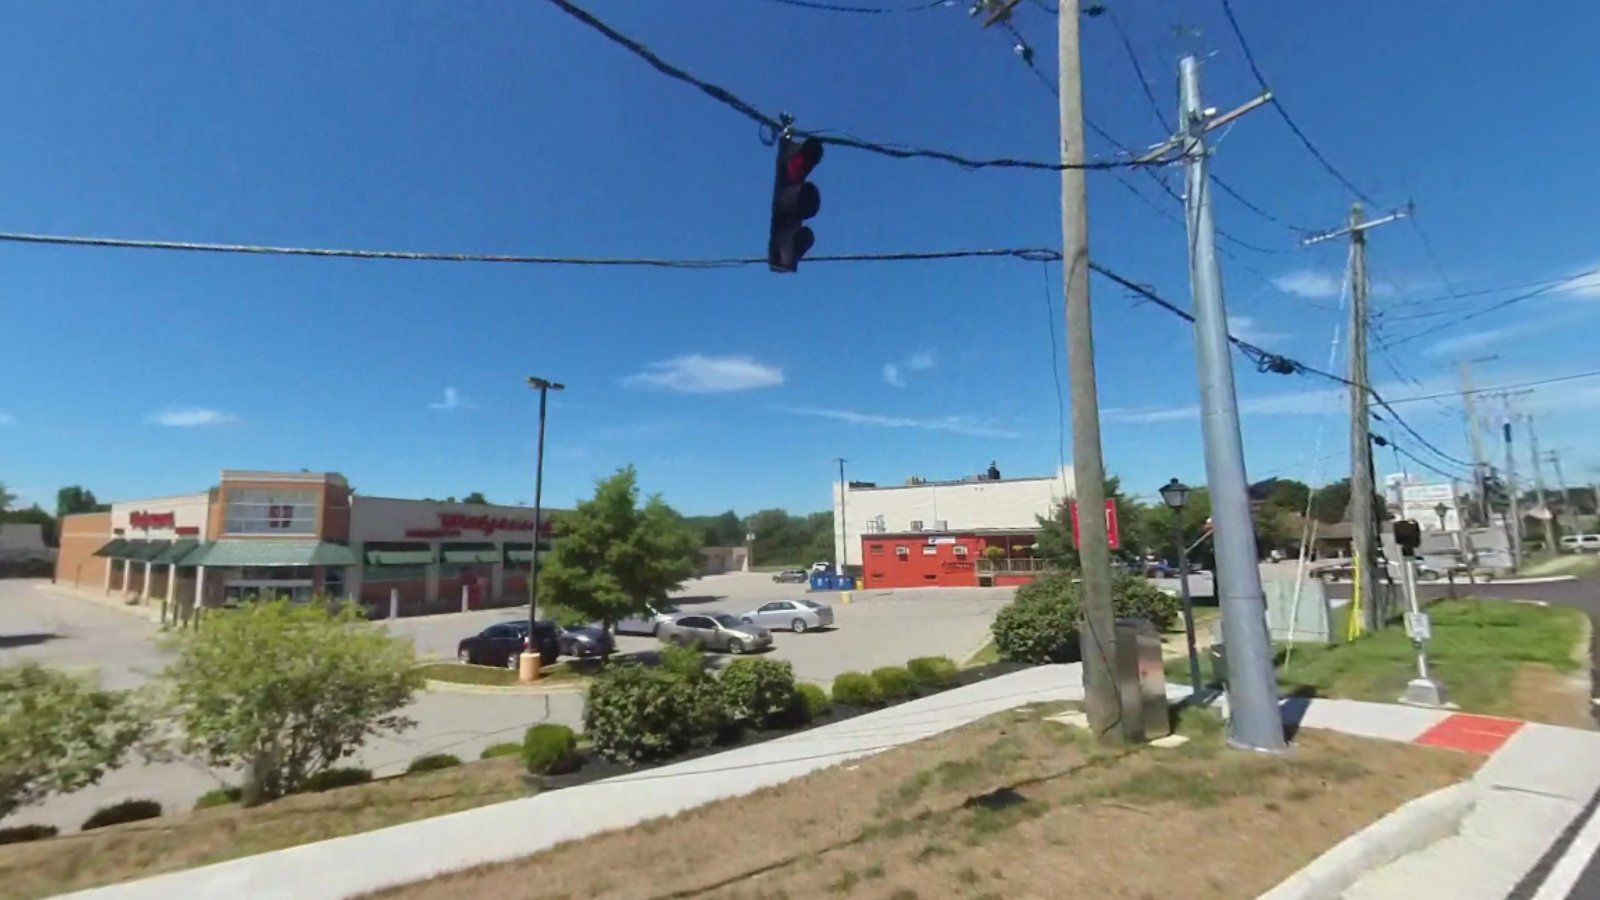
Crestwood is known for excellent schools, strong public services, and family-friendly neighborhoods. Its location just outside Louisville makes it a top choice for commuters wanting suburban peace without giving up access to city life.
Growth has been steady and resilient, driven by both organic demand and larger post-2020 migration trends. Crestwood’s mix of affordability (relative to #1 and #2) and quality living make it a magnet for upper-middle-class families.
2. Goshen – 94% Home Price Increase Since 2010
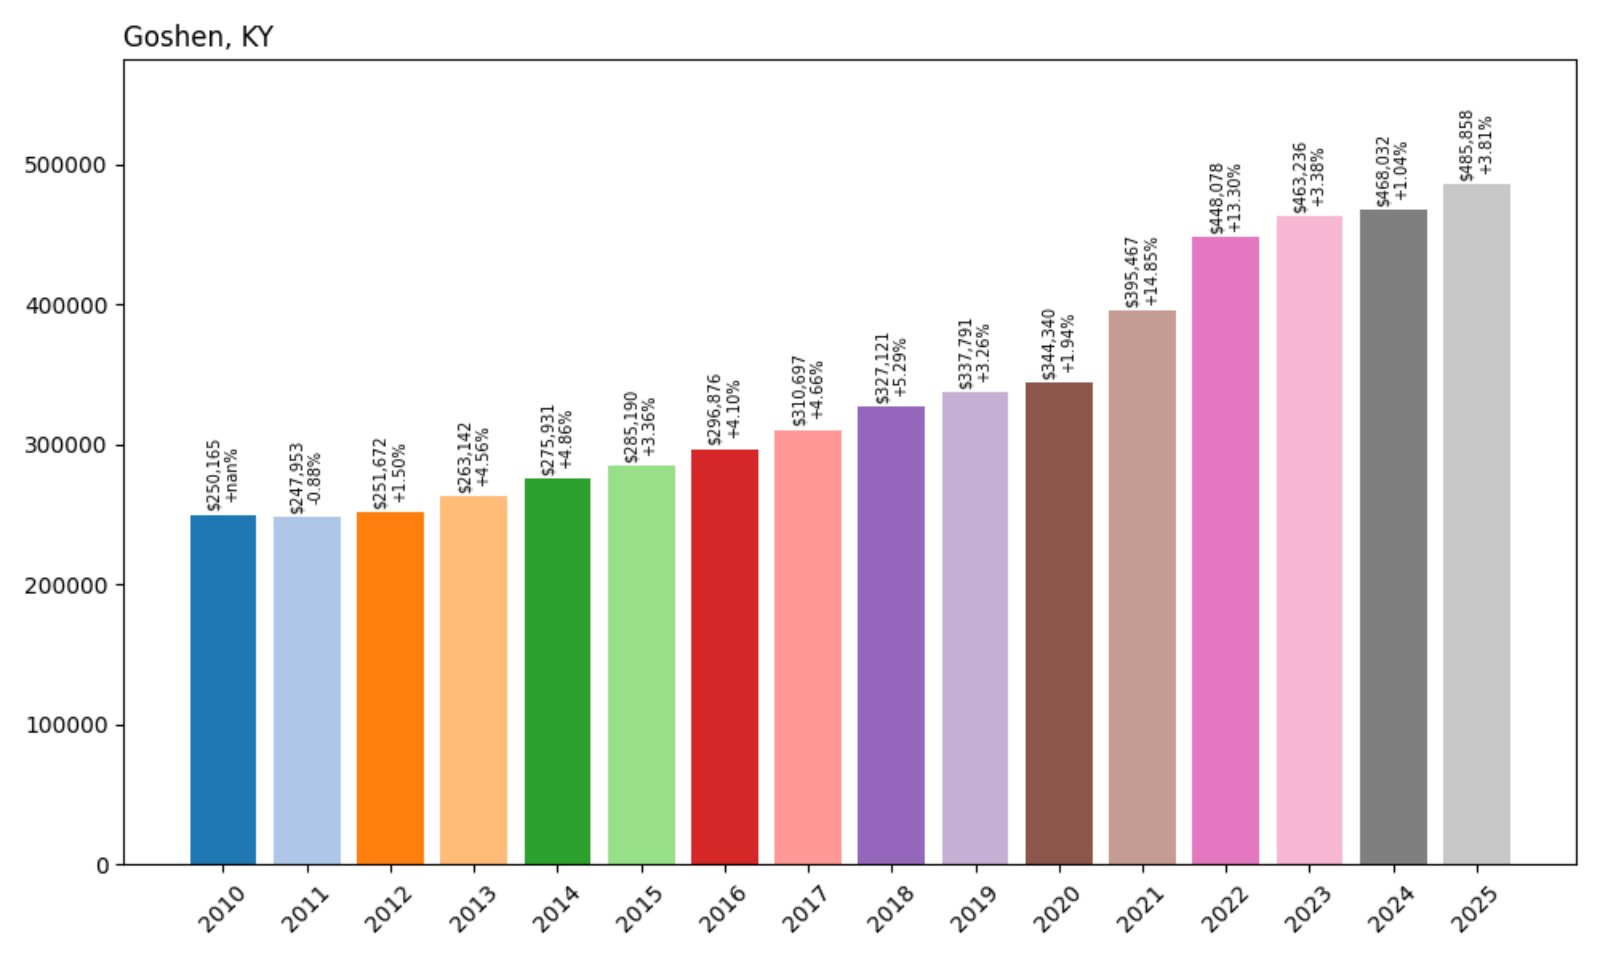
- 2010: $250,165
- 2011: $247,953 (−$2,212, −0.88%)
- 2012: $251,672 (+$3,719, +1.50%)
- 2013: $263,142 (+$11,470, +4.56%)
- 2014: $275,931 (+$12,789, +4.86%)
- 2015: $288,727 (+$12,796, +4.63%)
- 2016: $300,340 (+$11,613, +4.02%)
- 2017: $319,173 (+$18,833, +6.27%)
- 2018: $341,310 (+$22,137, +6.94%)
- 2019: $349,754 (+$8,444, +2.47%)
- 2020: $359,572 (+$9,818, +2.81%)
- 2021: $422,022 (+$62,450, +17.37%)
- 2022: $477,539 (+$55,517, +13.15%)
- 2023: $484,357 (+$6,818, +1.43%)
- 2024: $485,205 (+$848, +0.18%)
- 2025: $485,858 (+$653, +0.13%)
Home values in Goshen have risen steadily for 15 years, now standing at $485,858. With large year-over-year gains in 2021–2022 and a very stable ceiling since then, the town remains one of the most sought-after in the state.
Goshen – Green Acres and Affluent Living
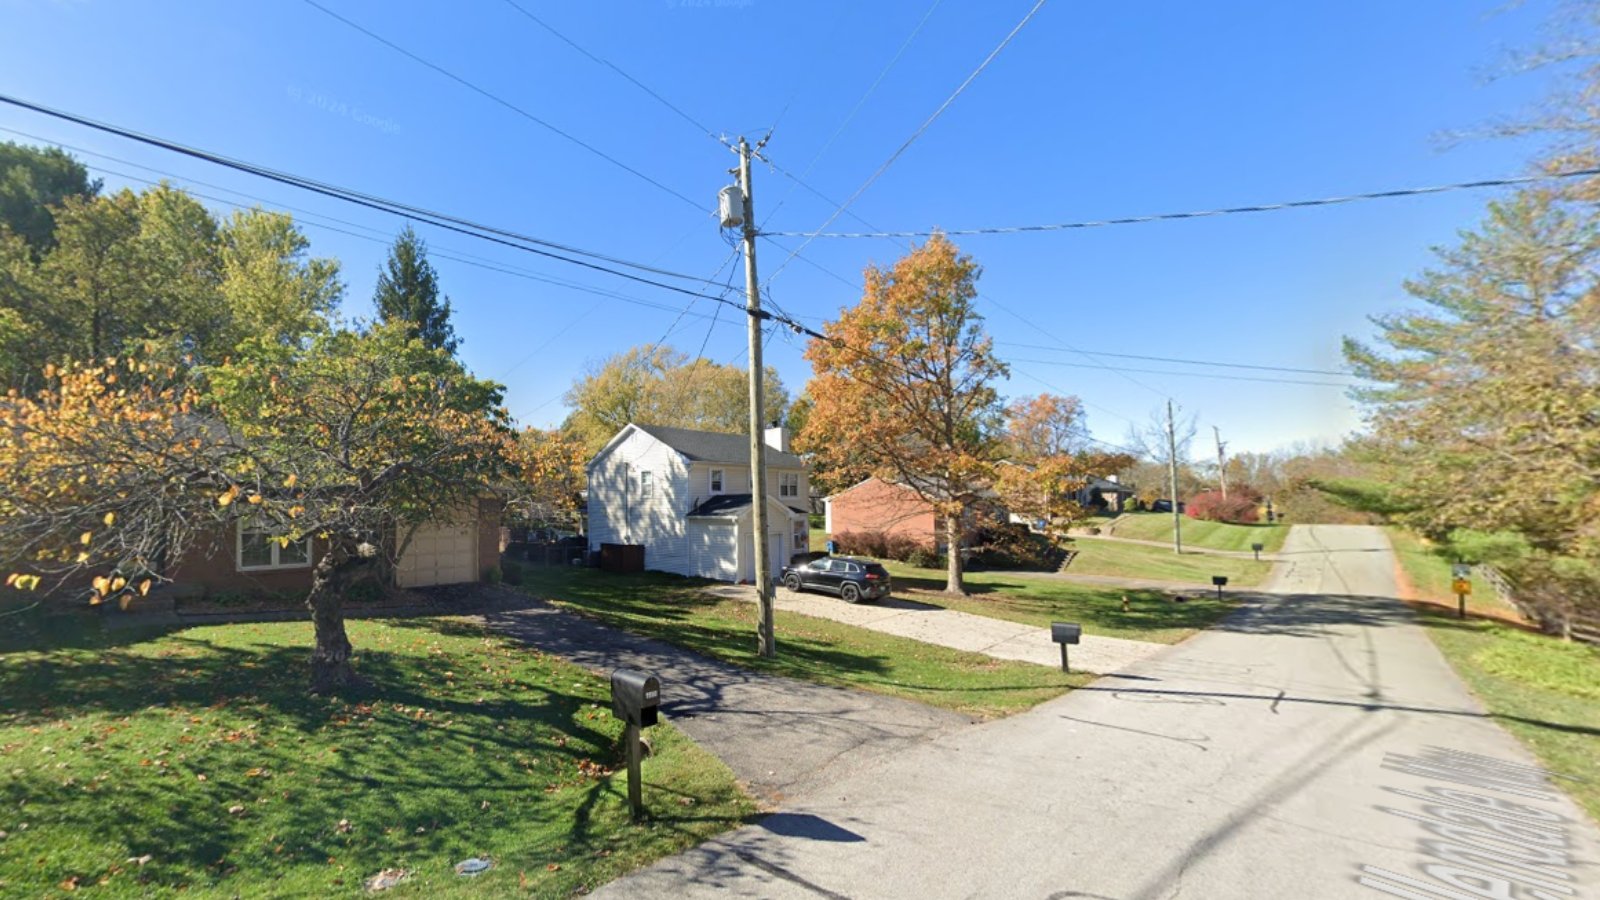
Just north of Crestwood and close to the Ohio River, Goshen offers high-end homes, strong schools, and a serene environment. It’s a favorite for families and professionals alike seeking elegance and space.
Its large lots and low-density zoning limit new supply, which helps prices remain high. Buyers continue to pay a premium for Goshen’s peace, schools, and status.
1. Prospect – 75% Home Price Increase Since 2010
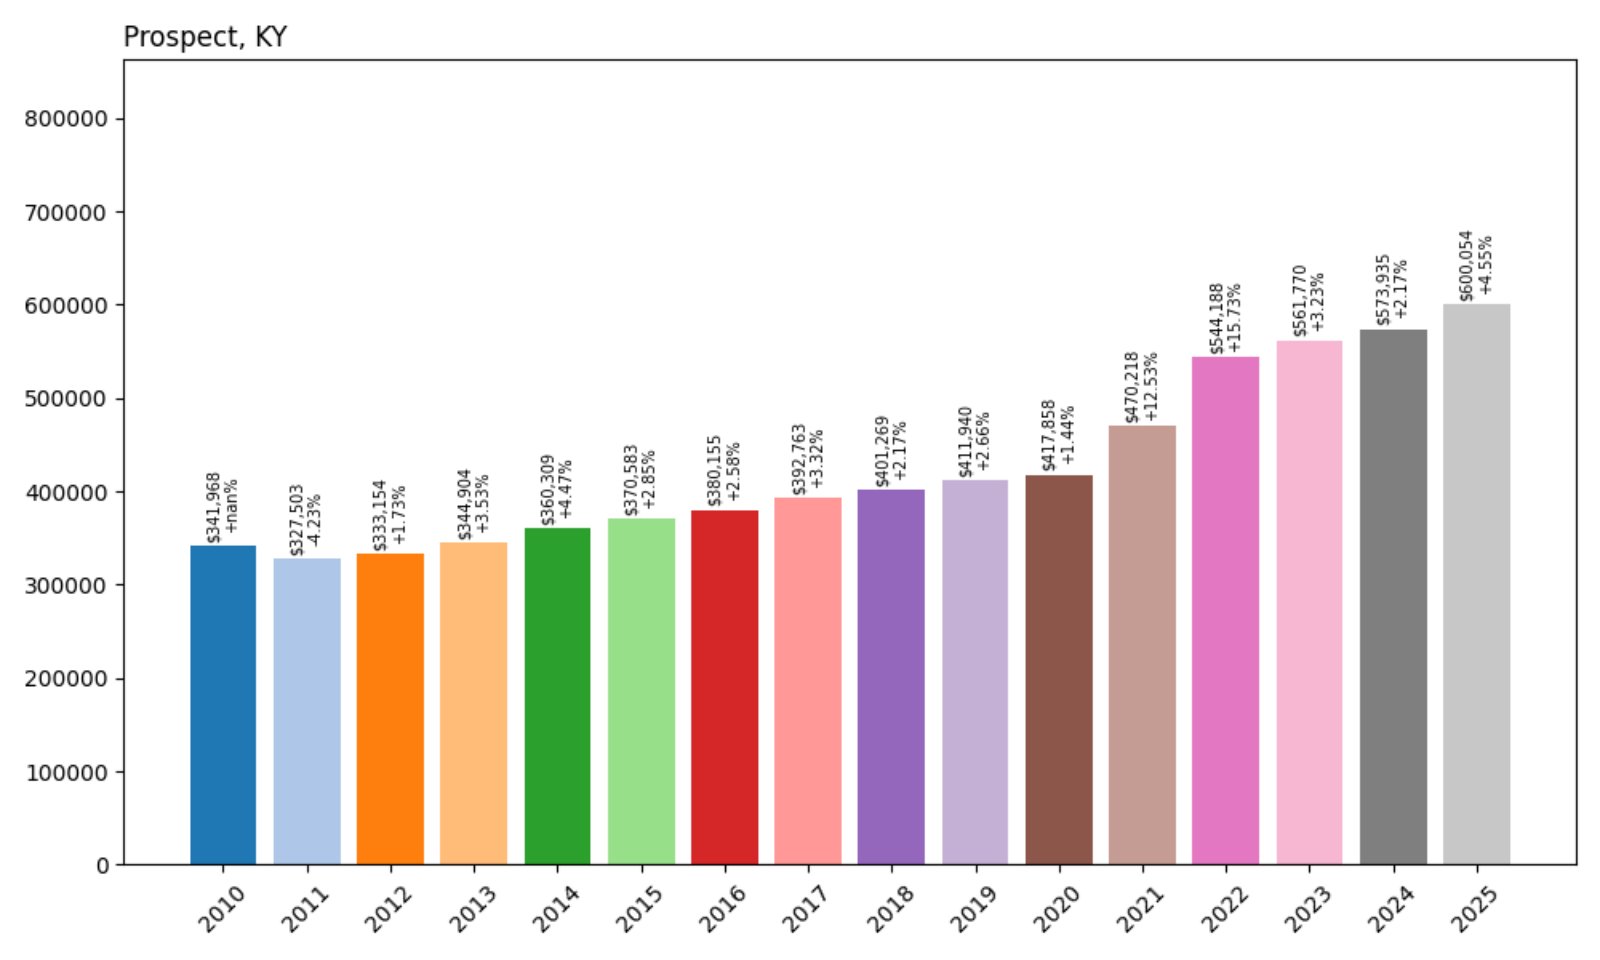
- 2010: $341,968
- 2011: $327,503 (−$14,465, −4.23%)
- 2012: $333,154 (+$5,651, +1.73%)
- 2013: $344,904 (+$11,750, +3.53%)
- 2014: $360,309 (+$15,405, +4.47%)
- 2015: $370,583 (+$10,274, +2.85%)
- 2016: $380,155 (+$9,572, +2.58%)
- 2017: $398,157 (+$17,002, +4.47%)
- 2018: $415,185 (+$17,028, +4.28%)
- 2019: $432,147 (+$16,962, +4.09%)
- 2020: $456,322 (+$24,175, +5.60%)
- 2021: $523,741 (+$67,419, +14.78%)
- 2022: $586,363 (+$62,622, +11.96%)
- 2023: $596,506 (+$10,143, +1.73%)
- 2024: $603,006 (+$6,500, +1.09%)
- 2025: $600,054 (−$2,952, −0.49%)
Prospect tops the list at $600,054 in 2025, even with a slight pullback from 2024. Home values are up 75% since 2010, with the biggest jumps during the 2020–2022 real estate surge.
Prospect – Kentucky’s Most Expensive Address
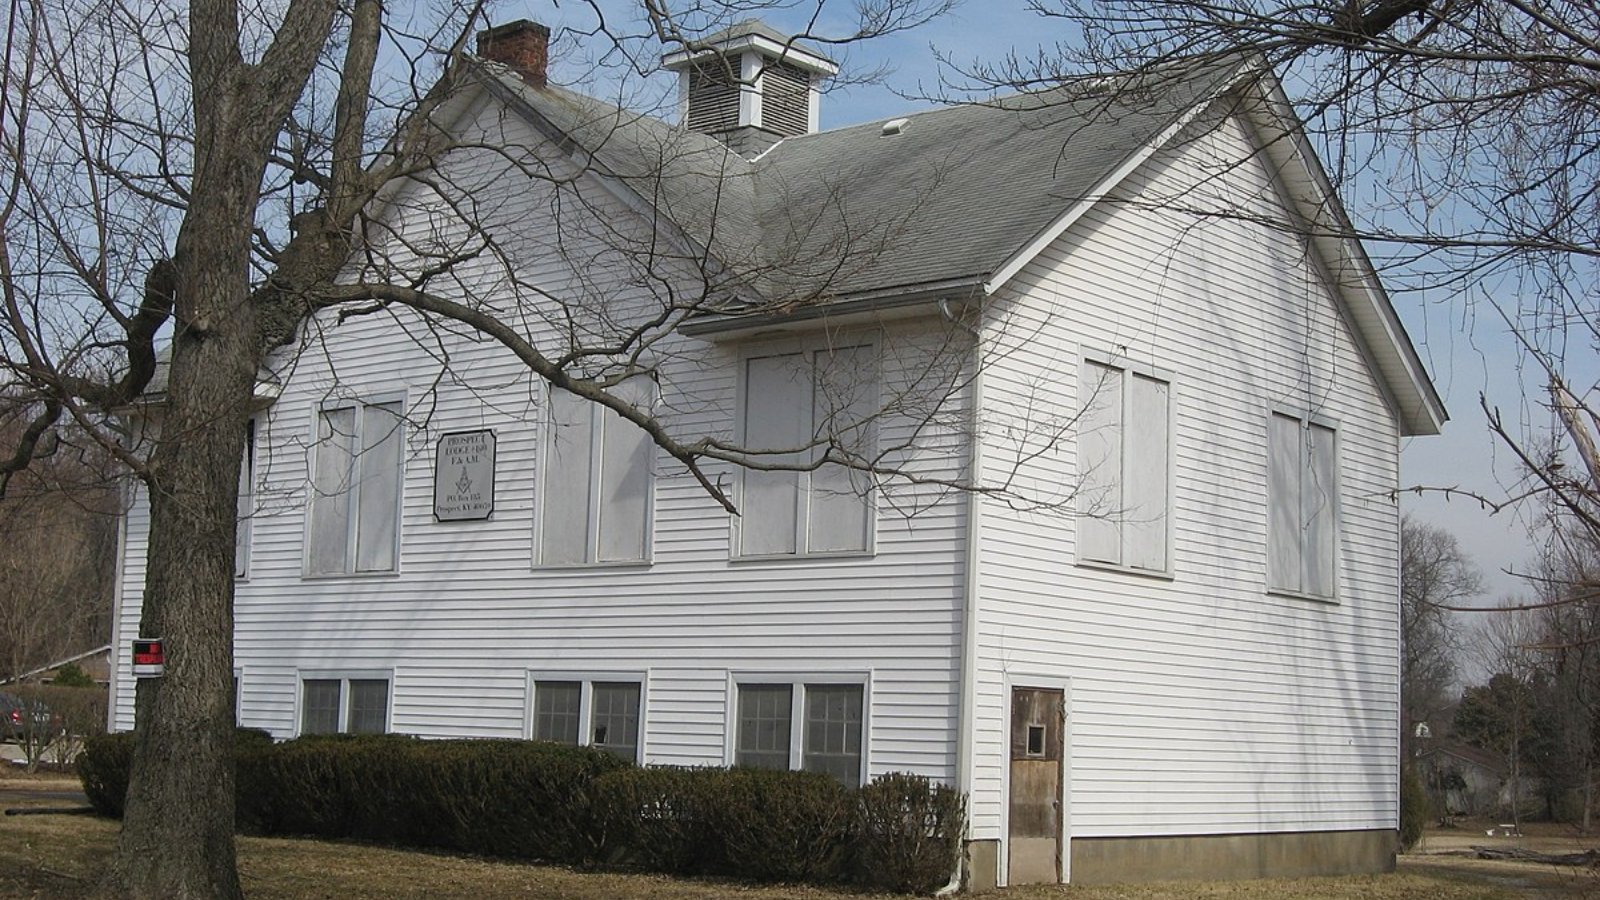
Straddling Jefferson and Oldham counties, Prospect is Louisville’s most prestigious suburb. Riverfront homes, gated communities, and upscale retail give it the polish that wealthy buyers seek.
With top-tier schools, country clubs, and exclusivity, Prospect remains the most expensive place to own property in the Bluegrass State. Even with market cooling, its luxury appeal remains unshaken.