
🔥 Would you like to save this?
Georgia’s home prices are rising fast, and some towns are now firmly in luxury territory. Based on the latest data from the Zillow Home Value Index, these 18 communities have climbed to the top of the state’s housing market, with price tags that rival the nation’s most exclusive zip codes. It’s not just Atlanta’s ritziest suburbs anymore. From historic small towns now packed with upscale renovations to once-quiet enclaves turned prestige playgrounds, these places are redefining what it means to live large in Georgia. Whether you’re buying for status or just browsing with envy, the numbers don’t lie—these towns are where the big money is moving.
18. Isle of Hope – 125% Home Price Increase Since 2011
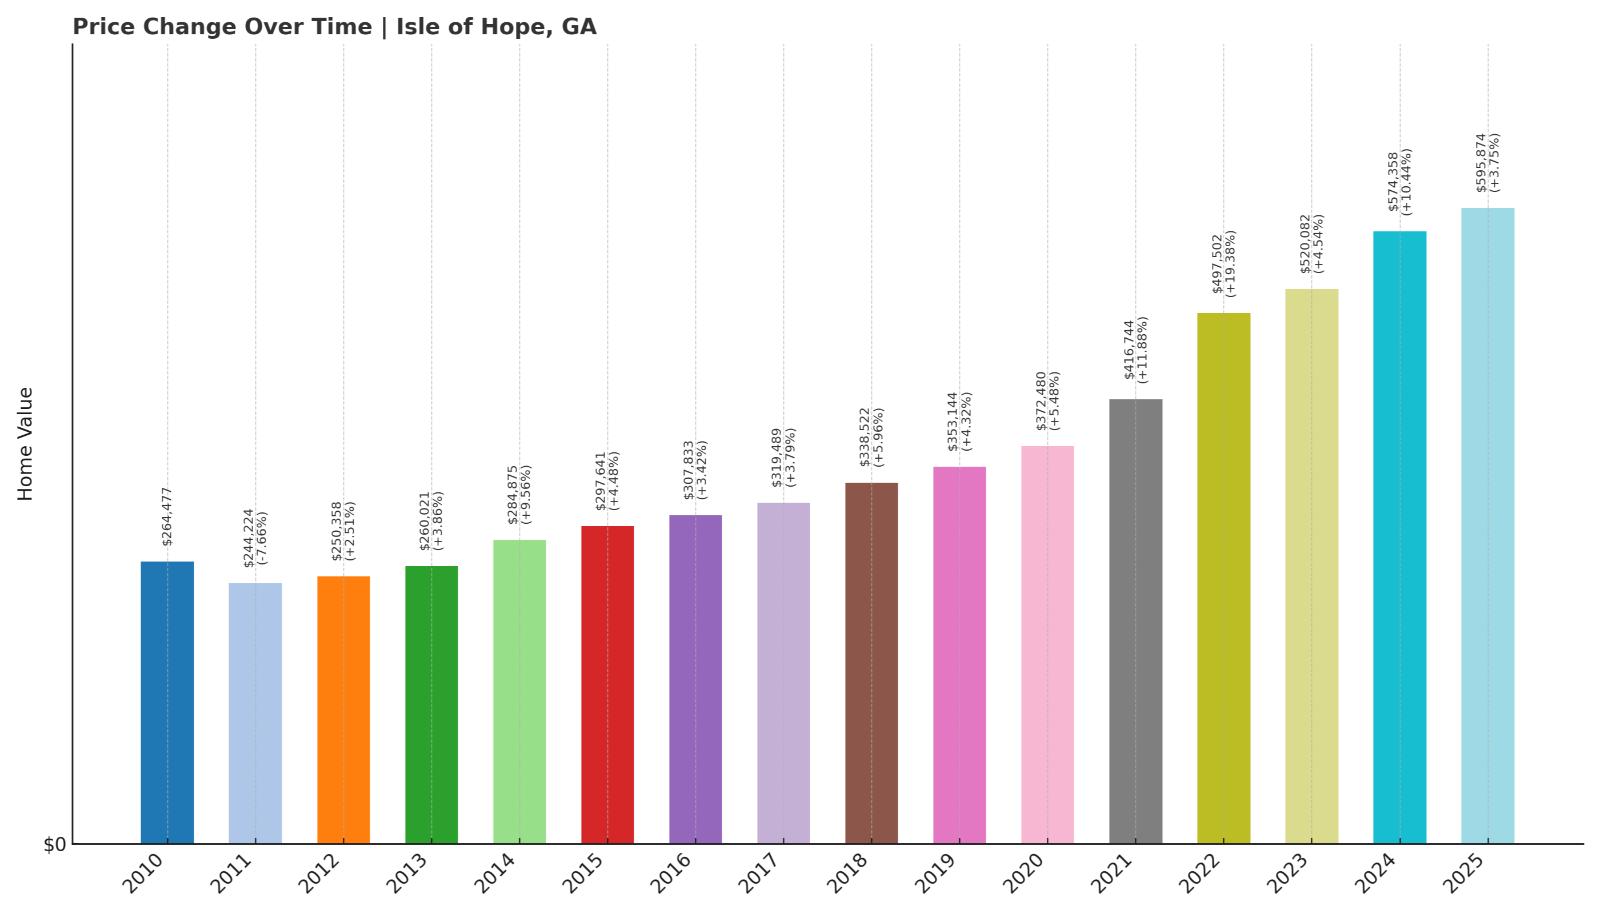
- 2010: $264,477
- 2011: $244,224 (-$20,253, -7.66% from previous year)
- 2012: $250,358 (+$6,134, +2.51% from previous year)
- 2013: $260,021 (+$9,662, +3.86% from previous year)
- 2014: $284,875 (+$24,855, +9.56% from previous year)
- 2015: $297,641 (+$12,766, +4.48% from previous year)
- 2016: $307,833 (+$10,192, +3.42% from previous year)
- 2017: $319,489 (+$11,656, +3.79% from previous year)
- 2018: $338,522 (+$19,033, +5.96% from previous year)
- 2019: $353,144 (+$14,623, +4.32% from previous year)
- 2020: $372,480 (+$19,335, +5.48% from previous year)
- 2021: $416,744 (+$44,264, +11.88% from previous year)
- 2022: $497,502 (+$80,758, +19.38% from previous year)
- 2023: $520,082 (+$22,580, +4.54% from previous year)
- 2024: $574,358 (+$54,275, +10.44% from previous year)
- 2025: $595,874 (+$21,516, +3.75% from previous year)
Since 2011, home prices in Isle of Hope have surged by 125%, climbing from $244,224 to $595,874. After a slight drop in 2011, values rebounded and have shown consistent growth nearly every year. The town saw particularly strong gains in 2022 and 2024, both years of double-digit increases.
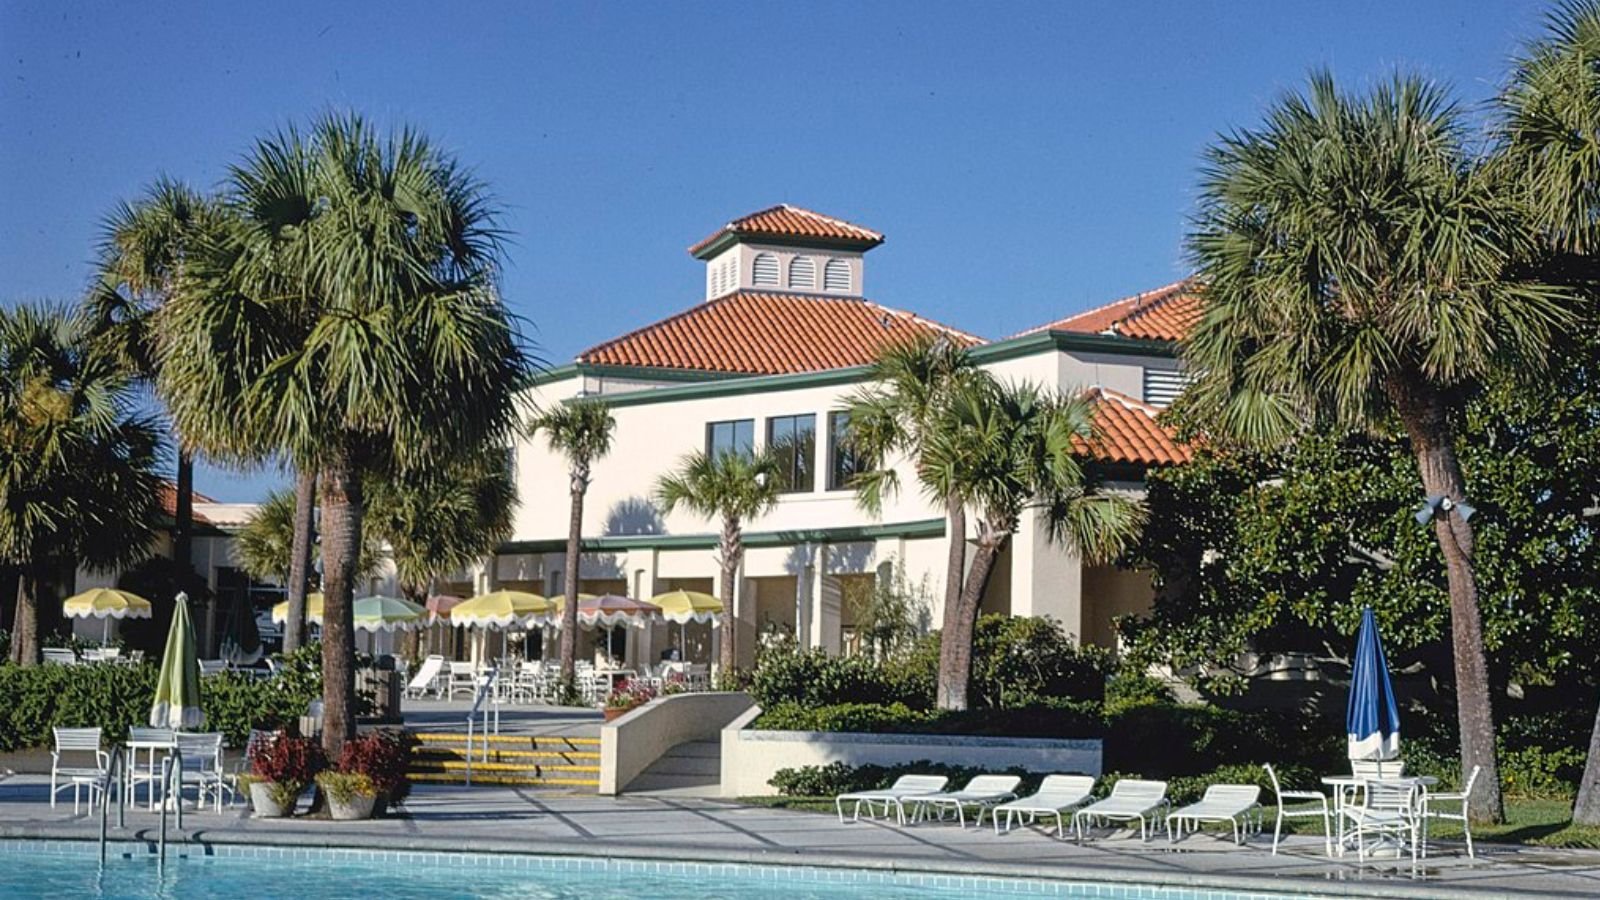
Isle of Hope – Coastal Appeal and Steady Growth
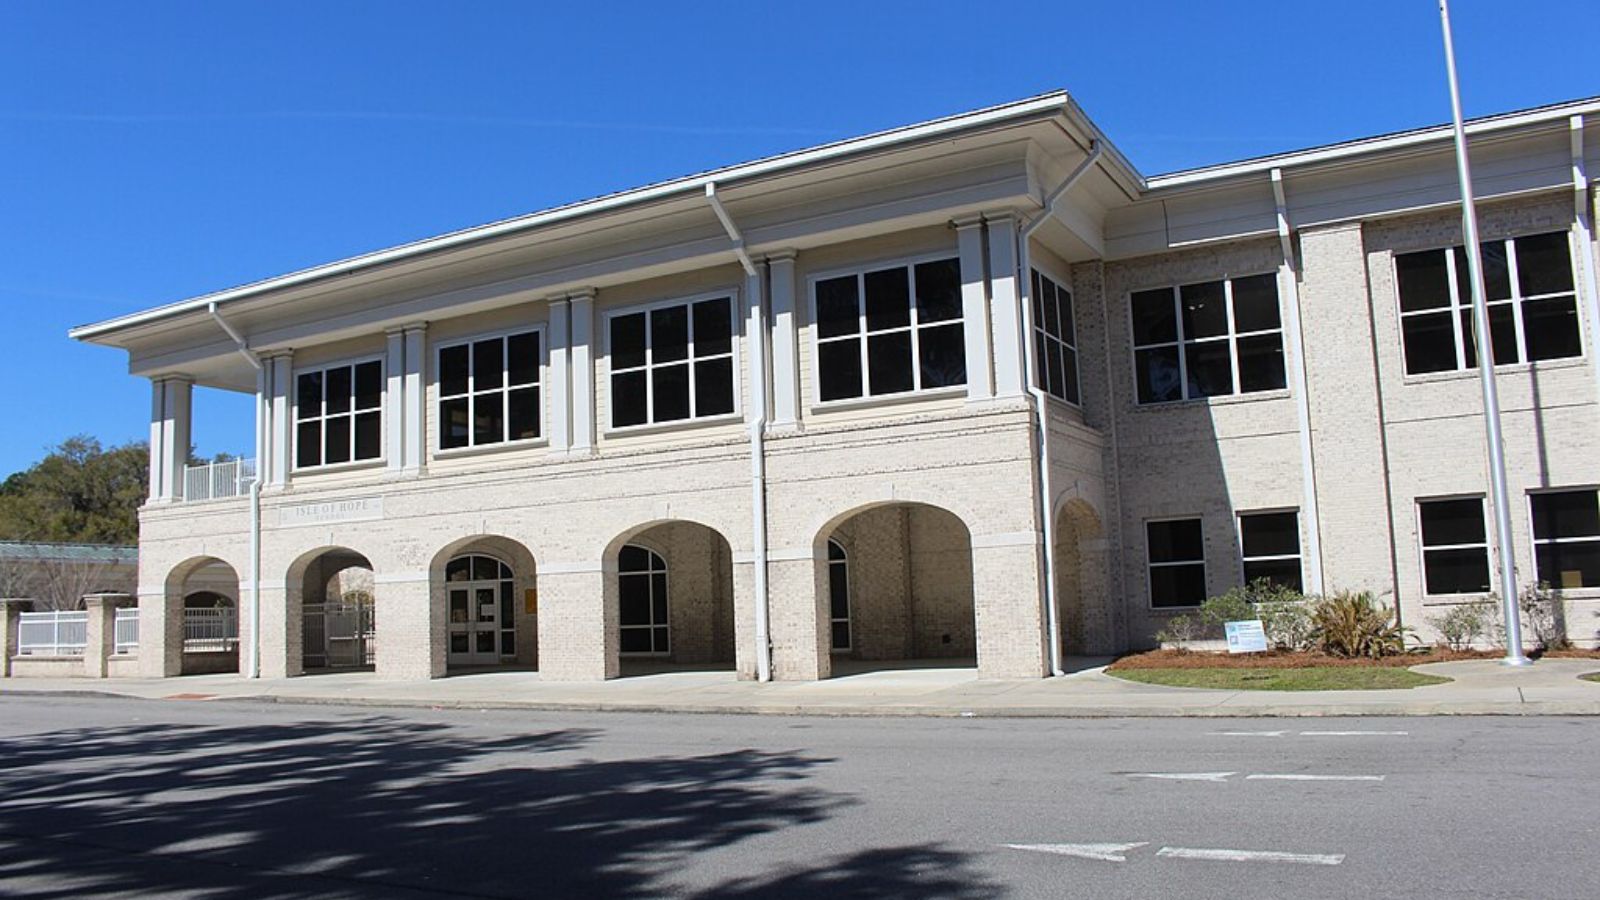
Located just outside Savannah, Isle of Hope is known for its picturesque waterfront, moss-draped oaks, and peaceful residential streets. It’s a favorite among buyers seeking historic charm and river access without being too far from urban conveniences. The area’s proximity to downtown Savannah and its scenic setting on the Skidaway River have made it a consistently desirable—and increasingly expensive—place to live.
While prices have grown gradually over the past decade, the acceleration since 2020 is notable. The area’s popularity among retirees and second-home buyers has helped push values higher, especially during and after the pandemic housing boom. With limited inventory and high demand for waterfront homes, Isle of Hope remains one of Georgia’s priciest zip codes.
17. Cumming – 171% Home Price Increase Since 2011
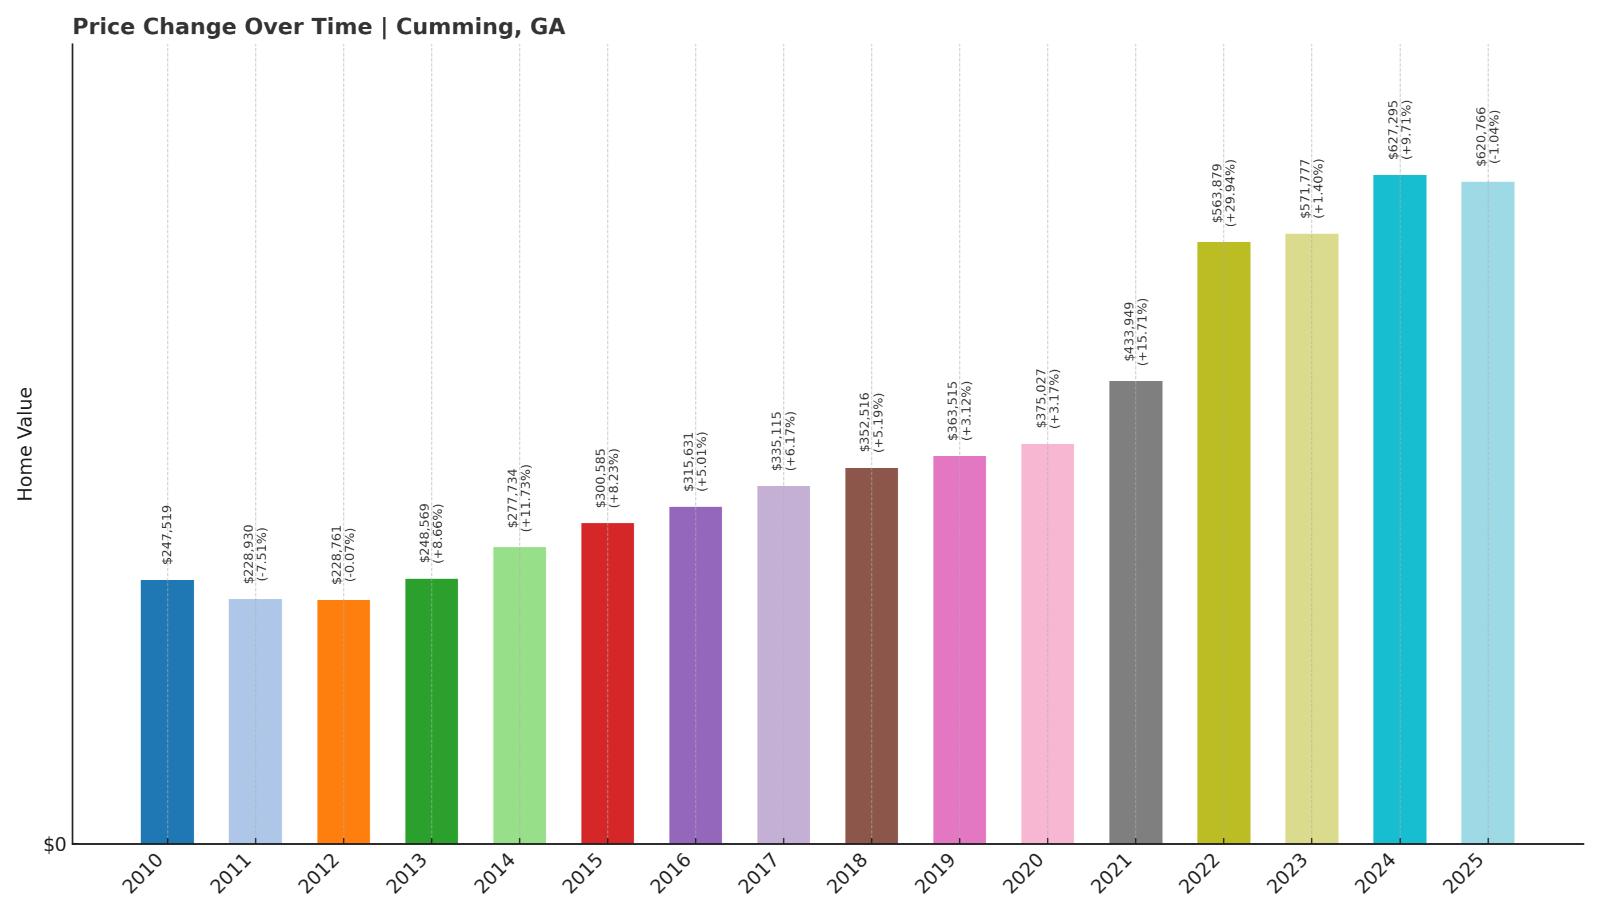
- 2010: $247,519
- 2011: $228,930 (-$18,589, -7.51% from previous year)
- 2012: $228,761 (-$169, -0.07% from previous year)
- 2013: $248,569 (+$19,809, +8.66% from previous year)
- 2014: $277,734 (+$29,165, +11.73% from previous year)
- 2015: $300,585 (+$22,851, +8.23% from previous year)
- 2016: $315,631 (+$15,046, +5.01% from previous year)
- 2017: $335,115 (+$19,483, +6.17% from previous year)
- 2018: $352,516 (+$17,401, +5.19% from previous year)
- 2019: $363,515 (+$10,999, +3.12% from previous year)
- 2020: $375,027 (+$11,513, +3.17% from previous year)
- 2021: $433,949 (+$58,922, +15.71% from previous year)
- 2022: $563,879 (+$129,931, +29.94% from previous year)
- 2023: $571,777 (+$7,898, +1.40% from previous year)
- 2024: $627,295 (+$55,517, +9.71% from previous year)
- 2025: $620,766 (-$6,529, -1.04% from previous year)
Cumming home values have jumped by over 171% since 2011. After remaining flat through the early 2010s, prices picked up sharply from 2013 on. The biggest surge came in 2022, with nearly a 30% increase. Though 2025 showed a slight dip, prices are still more than double what they were a decade ago.
Cumming – Booming Suburb With Skyrocketing Demand

Located in Forsyth County north of Atlanta, Cumming has rapidly transformed from a quiet town to a major suburban hub. Excellent schools, new developments, and access to Lake Lanier have made it especially attractive to families and professionals commuting into the metro area. The area’s explosive growth over the last decade is reflected in the steep rise in home values.
In 2022, values soared by nearly 30%—a sign of how competitive the market became at the height of the buying frenzy. Even with a small correction in 2025, the town remains one of the state’s top-tier suburban markets. Demand continues to stay high thanks to strong infrastructure and lifestyle amenities.
16. Suwanee – 167% Home Price Increase Since 2011

- 2010: $258,177
- 2011: $233,971 (-$24,207, -9.38% from previous year)
- 2012: $228,320 (-$5,651, -2.42% from previous year)
- 2013: $249,380 (+$21,060, +9.22% from previous year)
- 2014: $277,562 (+$28,182, +11.30% from previous year)
- 2015: $297,243 (+$19,681, +7.09% from previous year)
- 2016: $319,413 (+$22,170, +7.46% from previous year)
- 2017: $337,139 (+$17,726, +5.55% from previous year)
- 2018: $353,951 (+$16,812, +4.99% from previous year)
- 2019: $367,058 (+$13,107, +3.70% from previous year)
- 2020: $376,256 (+$9,199, +2.51% from previous year)
- 2021: $427,374 (+$51,117, +13.59% from previous year)
- 2022: $557,577 (+$130,204, +30.47% from previous year)
- 2023: $563,269 (+$5,692, +1.02% from previous year)
- 2024: $618,182 (+$54,913, +9.75% from previous year)
- 2025: $624,182 (+$5,999, +0.97% from previous year)
Suwanee’s home prices have more than doubled since 2011, with a 167% increase. The most dramatic spike came in 2022 when prices jumped over 30%. While annual gains have slowed since then, values have continued ticking up, reaching $624,182 in 2025.
Suwanee – A Family Magnet With Rapid Appreciation

Suwanee, located in Gwinnett County, has earned national recognition for its quality of life and excellent school system. The town’s master-planned developments and active parks system appeal to young families and professionals alike. This consistent desirability has helped drive home values steadily upward.
2022 was a standout year, with prices spiking dramatically—likely fueled by a tight housing supply and continued in-migration from nearby Atlanta. Even with more moderate growth recently, Suwanee remains one of metro Atlanta’s most in-demand and expensive suburbs.
15. Bishop – 134% Home Price Increase Since 2011
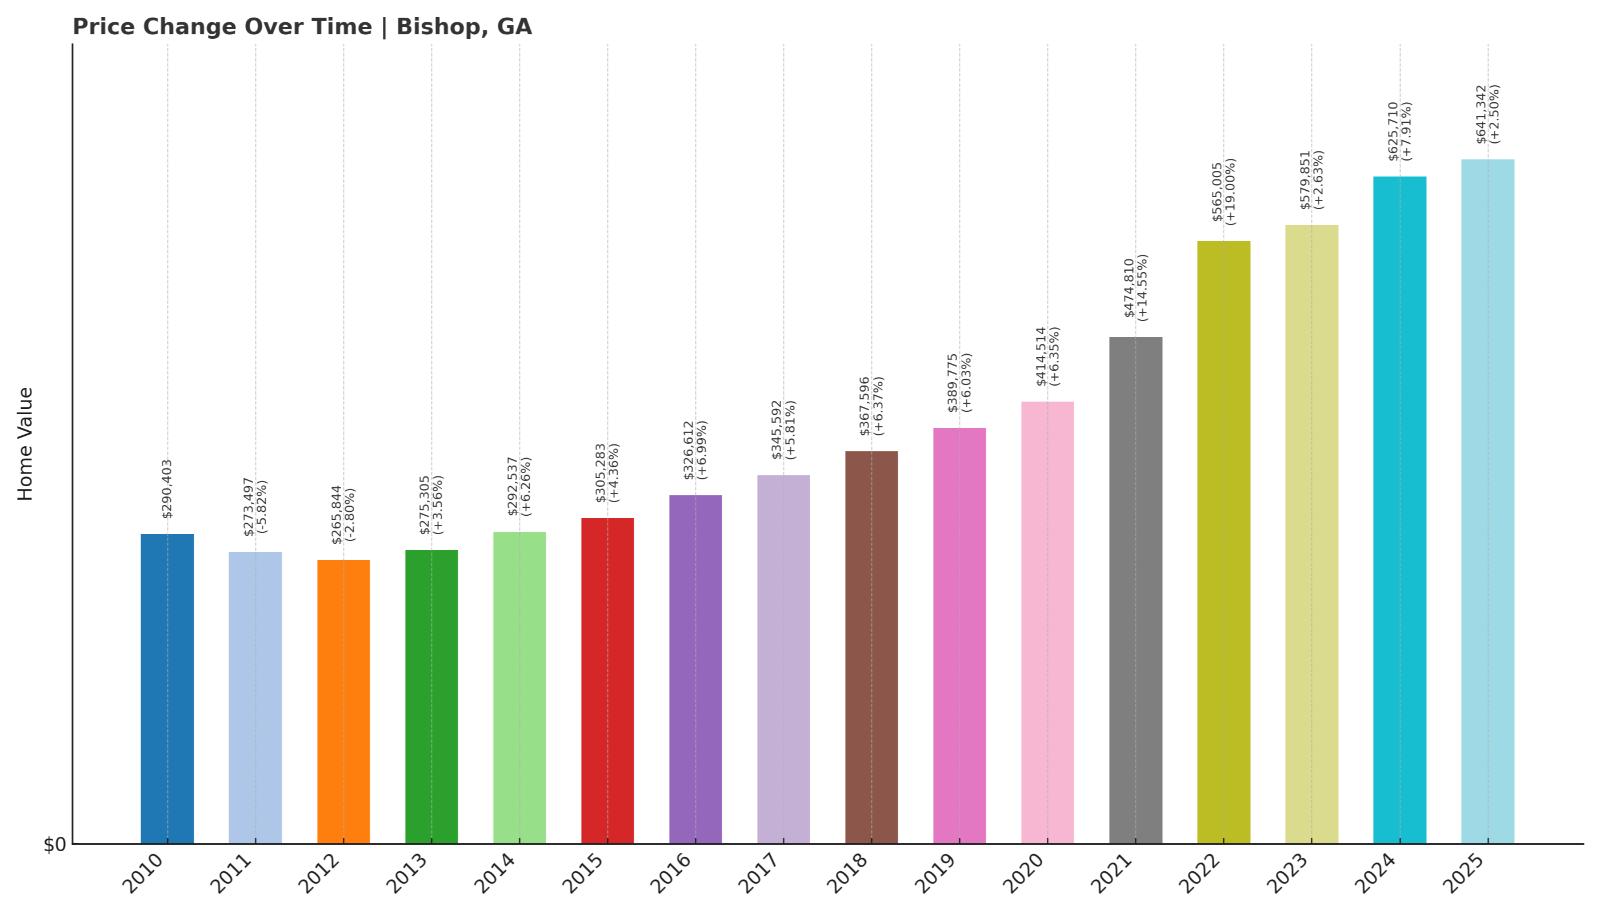
- 2010: $290,403
- 2011: $273,497 (-$16,906, -5.82% from previous year)
- 2012: $265,844 (-$7,653, -2.80% from previous year)
- 2013: $275,305 (+$9,461, +3.56% from previous year)
- 2014: $292,537 (+$17,232, +6.26% from previous year)
- 2015: $305,283 (+$12,746, +4.36% from previous year)
- 2016: $326,612 (+$21,329, +6.99% from previous year)
- 2017: $345,592 (+$18,981, +5.81% from previous year)
- 2018: $367,596 (+$22,003, +6.37% from previous year)
- 2019: $389,775 (+$22,180, +6.03% from previous year)
- 2020: $414,514 (+$24,739, +6.35% from previous year)
- 2021: $474,810 (+$60,296, +14.55% from previous year)
- 2022: $565,005 (+$90,195, +19.00% from previous year)
- 2023: $579,851 (+$14,846, +2.63% from previous year)
- 2024: $625,710 (+$45,860, +7.91% from previous year)
- 2025: $641,342 (+$15,631, +2.50% from previous year)
Home prices in Bishop have grown by 134% since 2011. After minor declines early in the decade, the town has seen reliable appreciation year after year. Big jumps in 2021 and 2022 pushed the median value over $600K.
Bishop – Quiet Charm, Big Growth
Bishop is a small town in Oconee County, just southwest of Athens. Though rural in character, it has become increasingly popular with buyers seeking space and quiet within reach of city conveniences. Its combination of small-town ambiance and proximity to top schools has made it attractive to upper-income families.
The sharp rise in prices after 2020 reflects growing demand and limited new housing supply. Bishop’s consistent gains suggest it will remain one of northeast Georgia’s most valuable residential areas for years to come.
14. Roswell – 144% Home Price Increase Since 2011
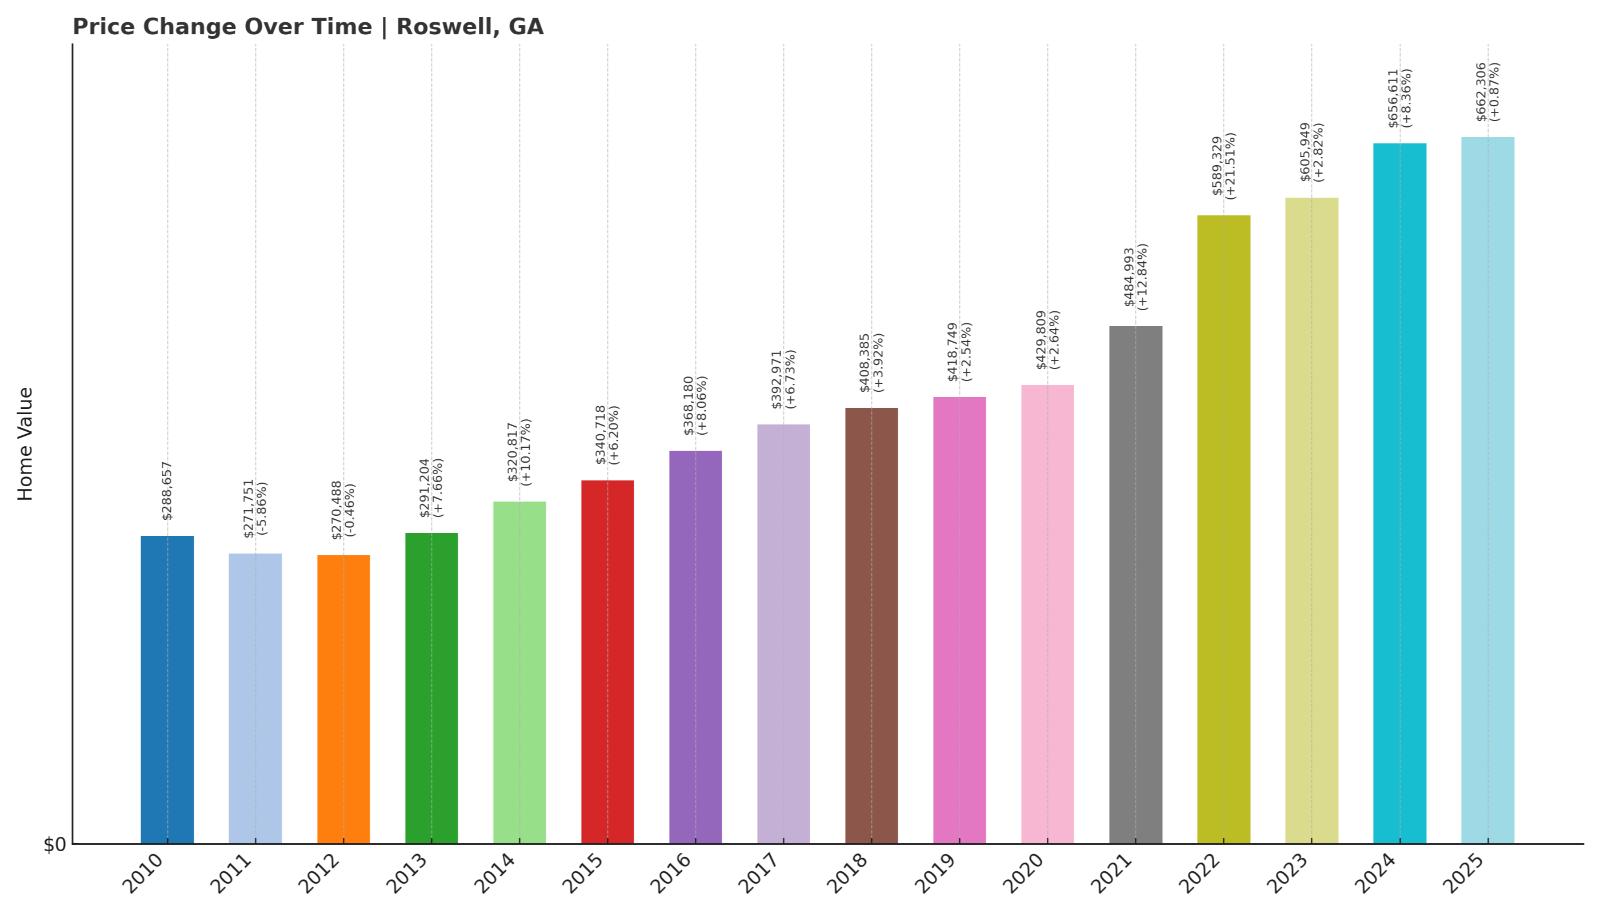
- 2010: $288,657
- 2011: $271,751 (-$16,906, -5.86% from previous year)
- 2012: $270,488 (-$1,263, -0.46% from previous year)
- 2013: $291,204 (+$20,716, +7.66% from previous year)
- 2014: $320,817 (+$29,612, +10.17% from previous year)
- 2015: $340,718 (+$19,902, +6.20% from previous year)
- 2016: $368,180 (+$27,462, +8.06% from previous year)
- 2017: $392,971 (+$24,791, +6.73% from previous year)
- 2018: $408,385 (+$15,414, +3.92% from previous year)
- 2019: $418,749 (+$10,364, +2.54% from previous year)
- 2020: $429,809 (+$11,060, +2.64% from previous year)
- 2021: $484,993 (+$55,184, +12.84% from previous year)
- 2022: $589,329 (+$104,336, +21.51% from previous year)
- 2023: $605,949 (+$16,620, +2.82% from previous year)
- 2024: $656,611 (+$50,662, +8.36% from previous year)
- 2025: $662,306 (+$5,695, +0.87% from previous year)
Roswell has seen a 144% increase in home prices since 2011. The city experienced steady growth in the mid-2010s, with larger jumps in 2021 and 2022. Prices have continued to climb, reaching $662,306 in 2025.
Roswell – History, Green Space, and Consistent Demand

Roswell combines historic charm with modern living, making it a perennial favorite among Atlanta’s northern suburbs. Its walkable downtown, highly-rated schools, and parks like the Chattahoochee Nature Center help sustain long-term buyer demand. The steady pace of growth shows Roswell isn’t a market built on hype—it’s built on fundamentals.
Home prices have accelerated in recent years, especially during the post-pandemic rush. With a strong housing stock and limited land for new development, Roswell’s high desirability continues to drive values upward.
13. Dunwoody – 124% Home Price Increase Since 2011
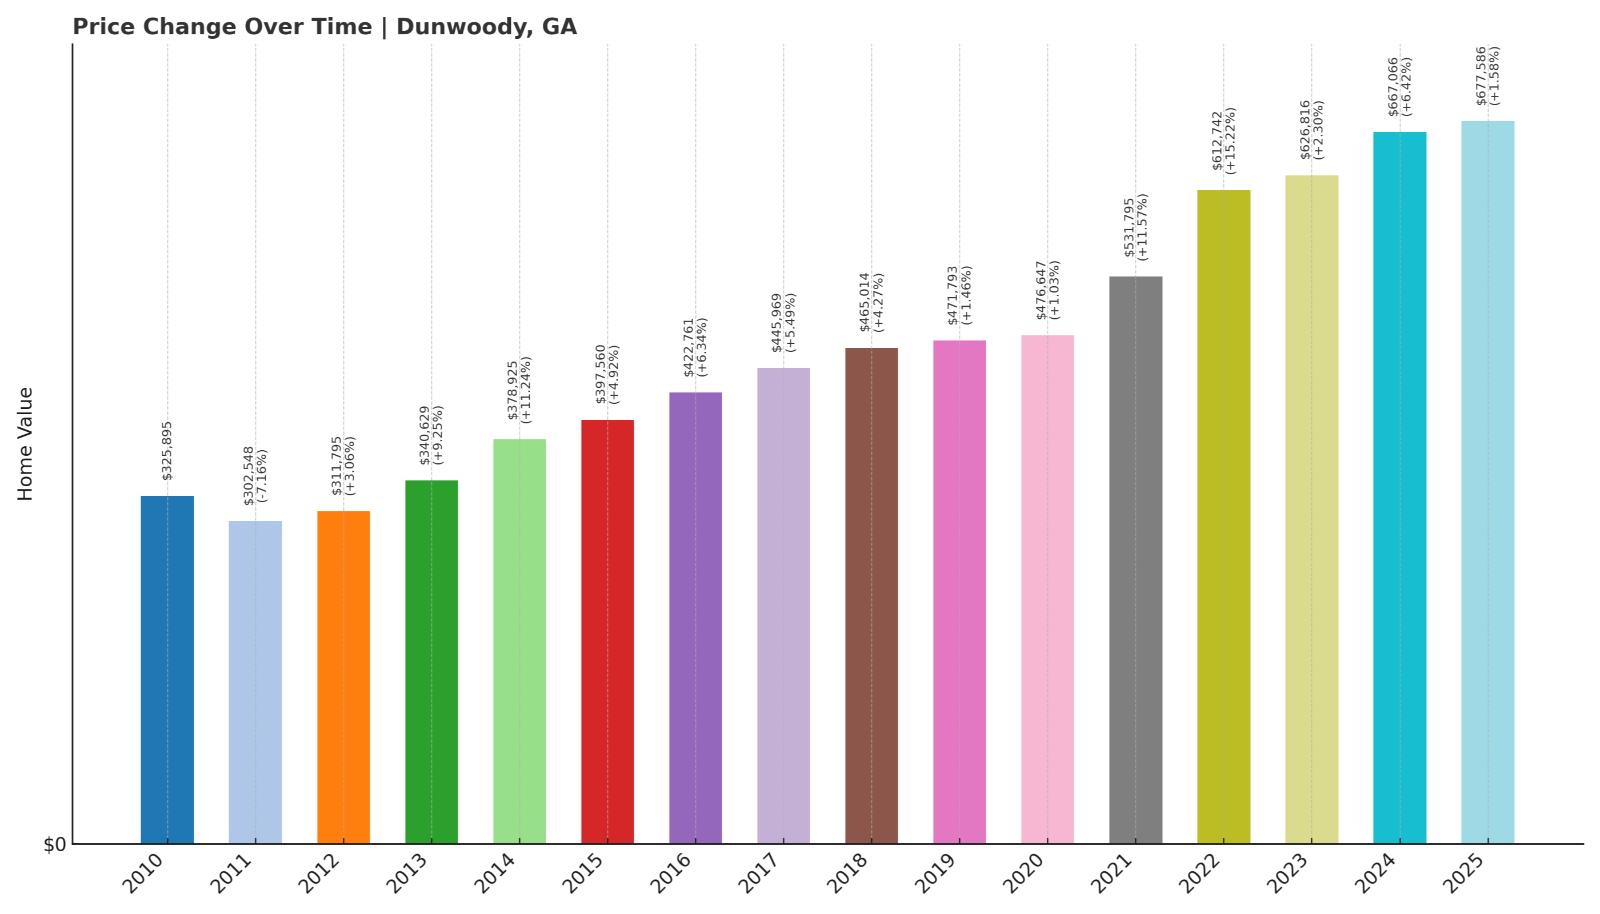
- 2010: $325,895
- 2011: $302,548 (-$23,347, -7.16% from previous year)
- 2012: $311,795 (+$9,247, +3.06% from previous year)
- 2013: $340,629 (+$28,834, +9.25% from previous year)
- 2014: $378,925 (+$38,296, +11.24% from previous year)
- 2015: $397,560 (+$18,636, +4.92% from previous year)
- 2016: $422,761 (+$25,200, +6.34% from previous year)
- 2017: $445,969 (+$23,209, +5.49% from previous year)
- 2018: $465,014 (+$19,045, +4.27% from previous year)
- 2019: $471,793 (+$6,779, +1.46% from previous year)
- 2020: $476,647 (+$4,854, +1.03% from previous year)
- 2021: $531,795 (+$55,148, +11.57% from previous year)
- 2022: $612,742 (+$80,947, +15.22% from previous year)
- 2023: $626,816 (+$14,073, +2.30% from previous year)
- 2024: $667,066 (+$40,251, +6.42% from previous year)
- 2025: $677,586 (+$10,520, +1.58% from previous year)
Dunwoody home values have climbed from $302,548 in 2011 to $677,586 in 2025, a 124% increase. Growth was steady throughout the 2010s, with major boosts in 2021 and 2022, when prices jumped more than $136,000 combined. The pace has slowed slightly since, but values remain strong.
Dunwoody – High-End Suburban Living With Staying Power

Dunwoody, in DeKalb County, is a sought-after suburb with a thriving commercial district and quick access to Atlanta. It’s known for its shopping centers, job opportunities in Perimeter Center, and established neighborhoods with large lots. These advantages have kept the area in demand for over a decade.
The large home price gains in 2021 and 2022 reflect a wave of buyers moving into high-income suburbs during the housing boom. Even with softer gains more recently, Dunwoody’s strong fundamentals continue to support its ranking among Georgia’s most expensive towns.
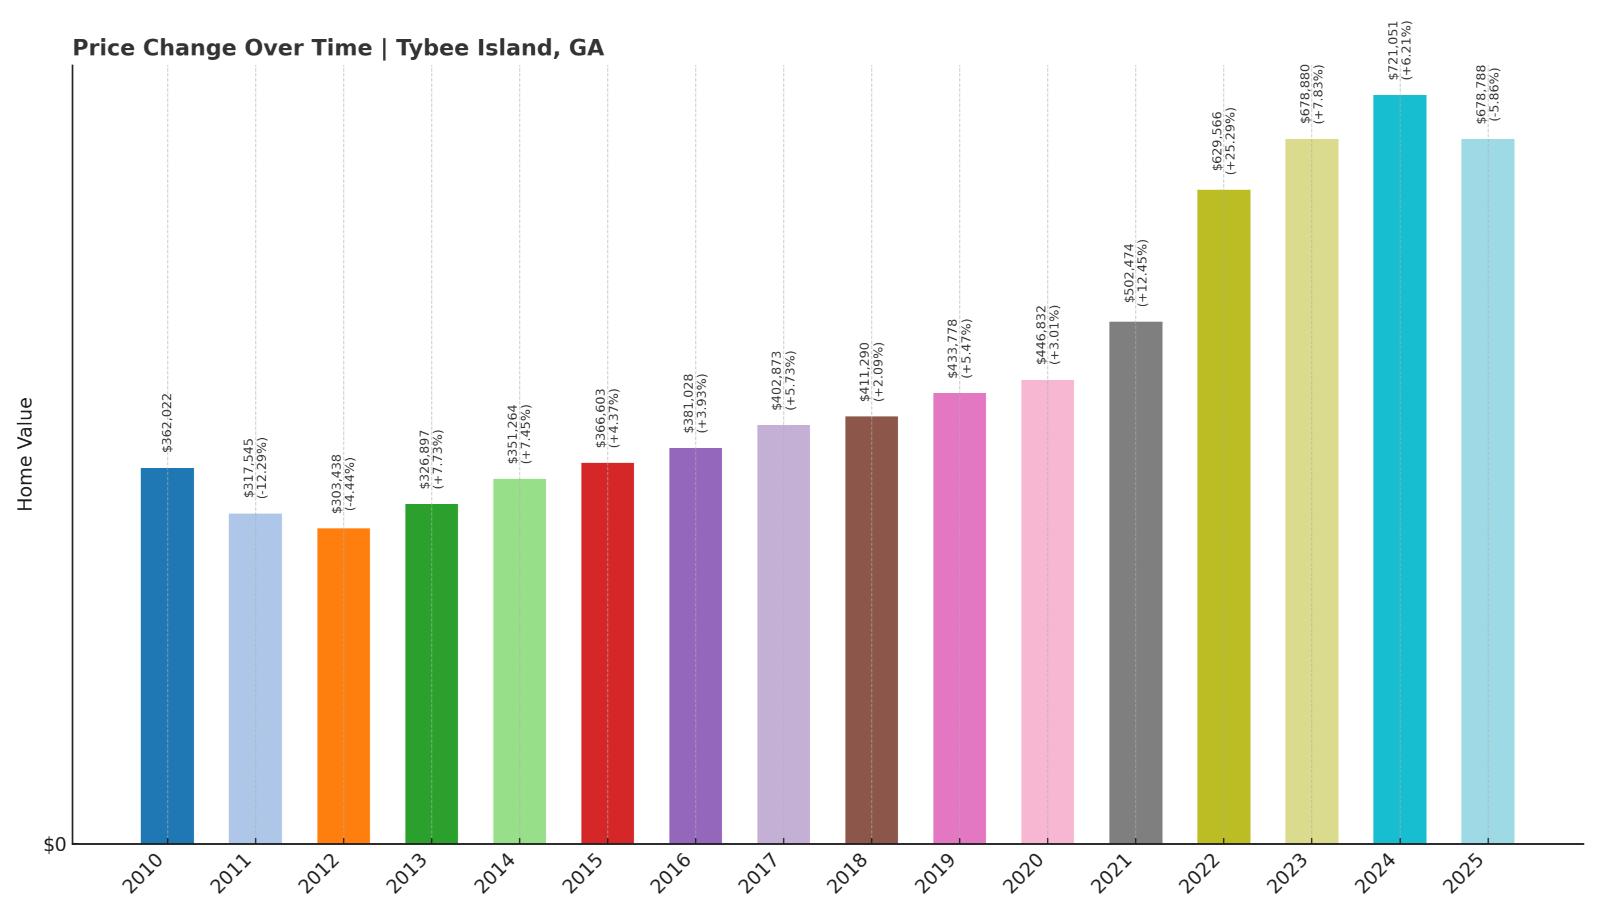
12. Tybee Island – 114% Home Price Increase Since 2011
🔥 Would you like to save this?
- 2010: $362,022
- 2011: $317,545 (-$44,477, -12.29% from previous year)
- 2012: $303,438 (-$14,107, -4.44% from previous year)
- 2013: $326,897 (+$23,459, +7.73% from previous year)
- 2014: $351,264 (+$24,368, +7.45% from previous year)
- 2015: $366,603 (+$15,339, +4.37% from previous year)
- 2016: $381,028 (+$14,425, +3.93% from previous year)
- 2017: $402,873 (+$21,844, +5.73% from previous year)
- 2018: $411,290 (+$8,417, +2.09% from previous year)
- 2019: $433,778 (+$22,488, +5.47% from previous year)
- 2020: $446,832 (+$13,054, +3.01% from previous year)
- 2021: $502,474 (+$55,642, +12.45% from previous year)
- 2022: $629,566 (+$127,092, +25.29% from previous year)
- 2023: $678,880 (+$49,315, +7.83% from previous year)
- 2024: $721,051 (+$42,170, +6.21% from previous year)
- 2025: $678,788 (-$42,262, -5.86% from previous year)
Tybee Island home prices have risen 114% since 2011, despite a small dip in 2025. The biggest jump came in 2022 with a 25% increase. Prices peaked in 2024 before correcting slightly the next year—likely reflecting a cooling in the vacation property market.
Tybee Island – Georgia’s Favorite Beach Retreat

Just 20 minutes from Savannah, Tybee Island is known for its beaches, lighthouse, and relaxed coastal vibe. The island’s limited space and consistent tourist appeal have made it a hotspot for second homes and short-term rentals. These factors have helped fuel long-term growth in property values.
The surge in 2022 suggests intensified demand for vacation homes during the pandemic era. The 2025 decline may signal normalization after years of rapid gains. Still, with a median price near $679K, Tybee remains among Georgia’s most premium housing markets.
11. Sandy Springs – 122% Home Price Increase Since 2011
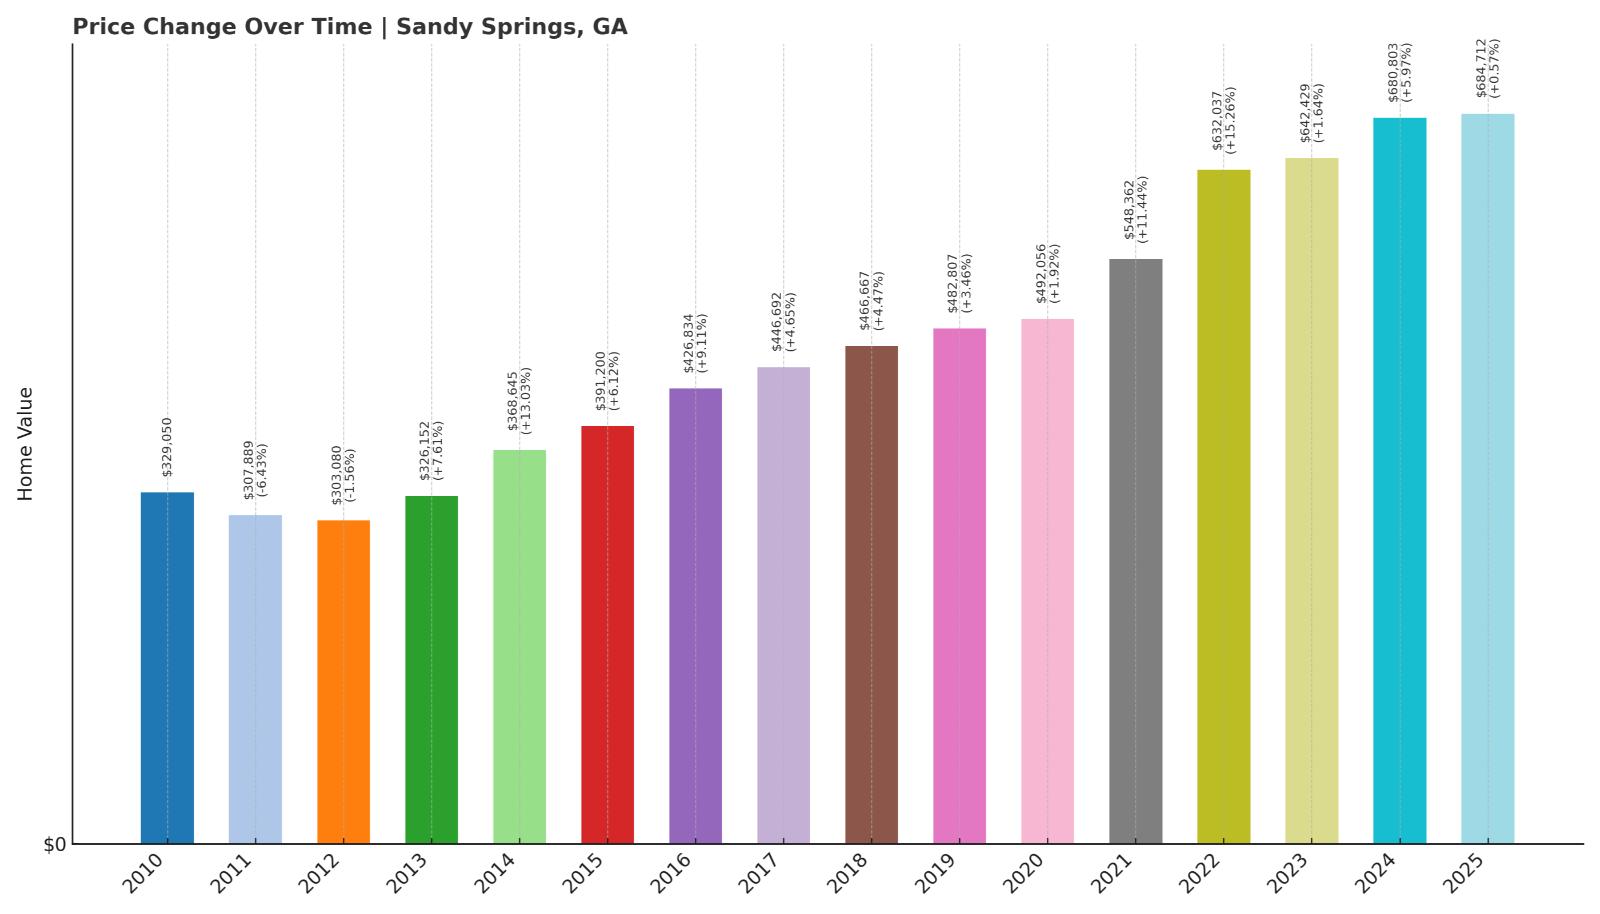
- 2010: $329,050
- 2011: $307,889 (-$21,161, -6.43% from previous year)
- 2012: $303,080 (-$4,809, -1.56% from previous year)
- 2013: $326,152 (+$23,072, +7.61% from previous year)
- 2014: $368,645 (+$42,494, +13.03% from previous year)
- 2015: $391,200 (+$22,554, +6.12% from previous year)
- 2016: $426,834 (+$35,634, +9.11% from previous year)
- 2017: $446,692 (+$19,858, +4.65% from previous year)
- 2018: $466,667 (+$19,975, +4.47% from previous year)
- 2019: $482,807 (+$16,140, +3.46% from previous year)
- 2020: $492,056 (+$9,249, +1.92% from previous year)
- 2021: $548,362 (+$56,306, +11.44% from previous year)
- 2022: $632,037 (+$83,675, +15.26% from previous year)
- 2023: $642,429 (+$10,391, +1.64% from previous year)
- 2024: $680,803 (+$38,375, +5.97% from previous year)
- 2025: $684,712 (+$3,908, +0.57% from previous year)
Sandy Springs has seen a 122% price increase since 2011, with prices moving from just under $308K to nearly $685K. The largest gains came in 2021 and 2022, when values jumped by nearly $140K across two years. Price increases have moderated recently.
Sandy Springs – Urban Convenience, Suburban Comfort

Sandy Springs is one of metro Atlanta’s most dynamic cities, blending dense commercial corridors with residential neighborhoods. With major employers, access to MARTA, and proximity to Buckhead and Midtown, it remains a prime destination for high-income buyers.
The post-pandemic housing surge pushed prices dramatically higher, and while 2025 shows slowing growth, overall values remain elevated. Strong demand and limited space for new development suggest Sandy Springs will continue to rank among Georgia’s priciest markets.
10. Saint Simons Island – 133% Home Price Increase Since 2011
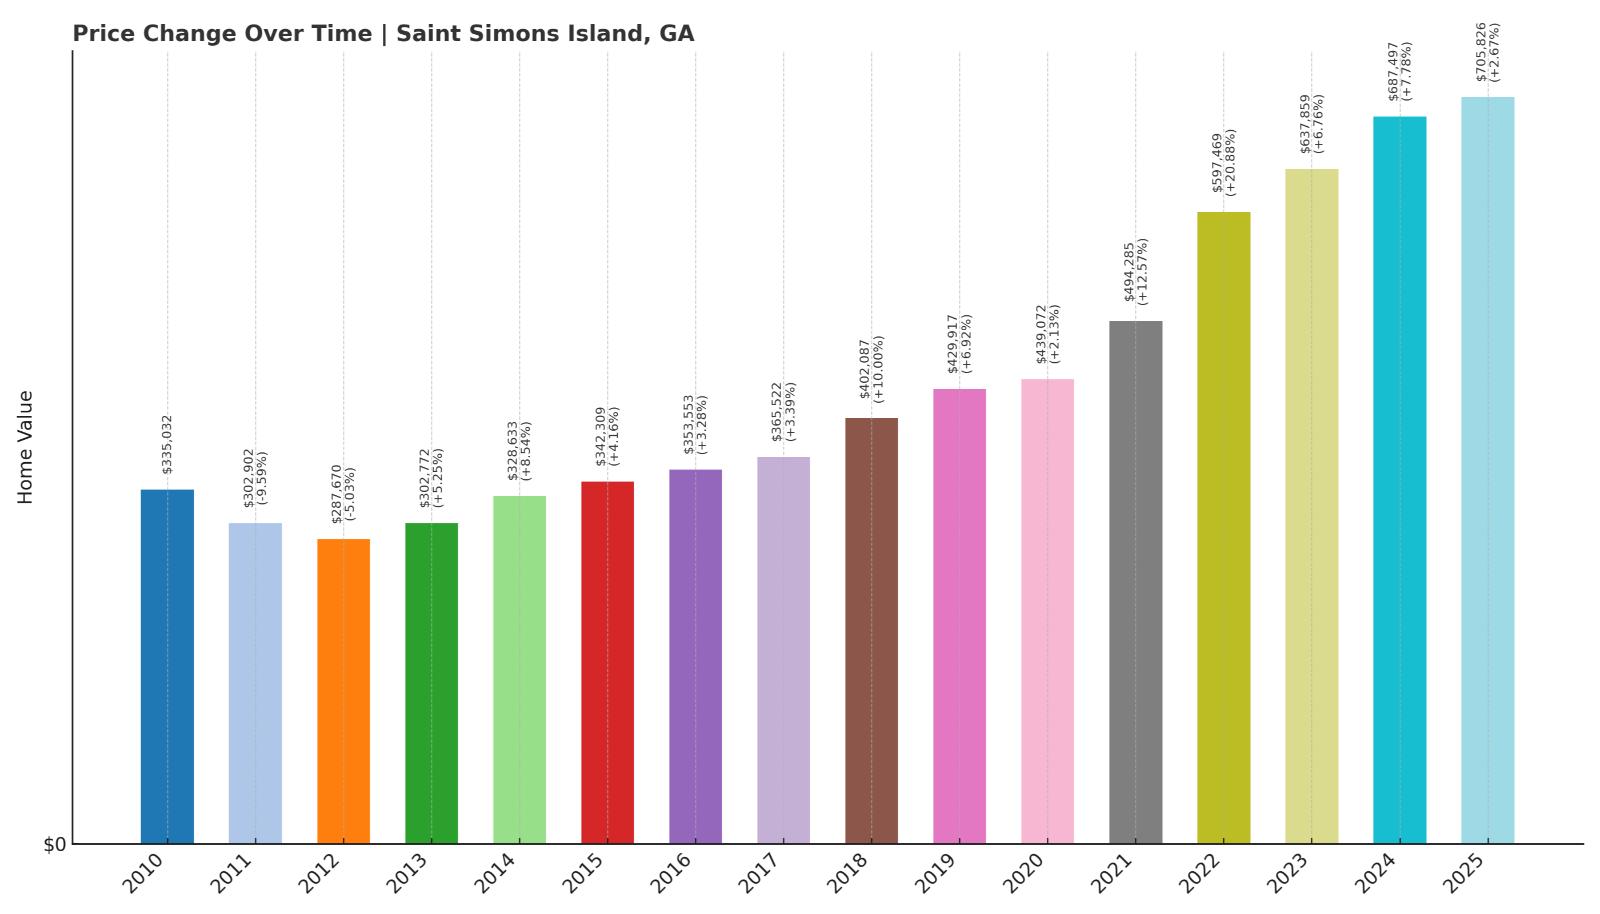
- 2010: $335,032
- 2011: $302,902 (-$32,130, -9.59% from previous year)
- 2012: $287,670 (-$15,232, -5.03% from previous year)
- 2013: $302,772 (+$15,103, +5.25% from previous year)
- 2014: $328,633 (+$25,861, +8.54% from previous year)
- 2015: $342,309 (+$13,676, +4.16% from previous year)
- 2016: $353,553 (+$11,244, +3.28% from previous year)
- 2017: $365,522 (+$11,969, +3.39% from previous year)
- 2018: $402,087 (+$36,564, +10.00% from previous year)
- 2019: $429,917 (+$27,830, +6.92% from previous year)
- 2020: $439,072 (+$9,156, +2.13% from previous year)
- 2021: $494,285 (+$55,213, +12.57% from previous year)
- 2022: $597,469 (+$103,184, +20.88% from previous year)
- 2023: $637,859 (+$40,390, +6.76% from previous year)
- 2024: $687,497 (+$49,637, +7.78% from previous year)
- 2025: $705,826 (+$18,330, +2.67% from previous year)
Home values on Saint Simons Island have grown 133% since 2011. After early declines, prices rebounded strongly, with the most dramatic increases in 2021 and 2022. By 2025, the median price reached over $705K.
Saint Simons Island – Classic Island Living With Rising Prices
Saint Simons Island, part of Georgia’s Golden Isles, is a coastal community known for its beaches, golf, and laid-back vibe. It attracts both retirees and vacation-home buyers, with a strong appeal for year-round living as well. Limited land and high demand have fueled a long-term rise in home values.
The double-digit gains in 2021 and 2022 pushed prices to new heights, and the upward trend has continued at a slower pace since. Its enduring popularity and exclusive island setting continue to make it one of Georgia’s most expensive housing markets.
9. Johns Creek – 134% Home Price Increase Since 2011
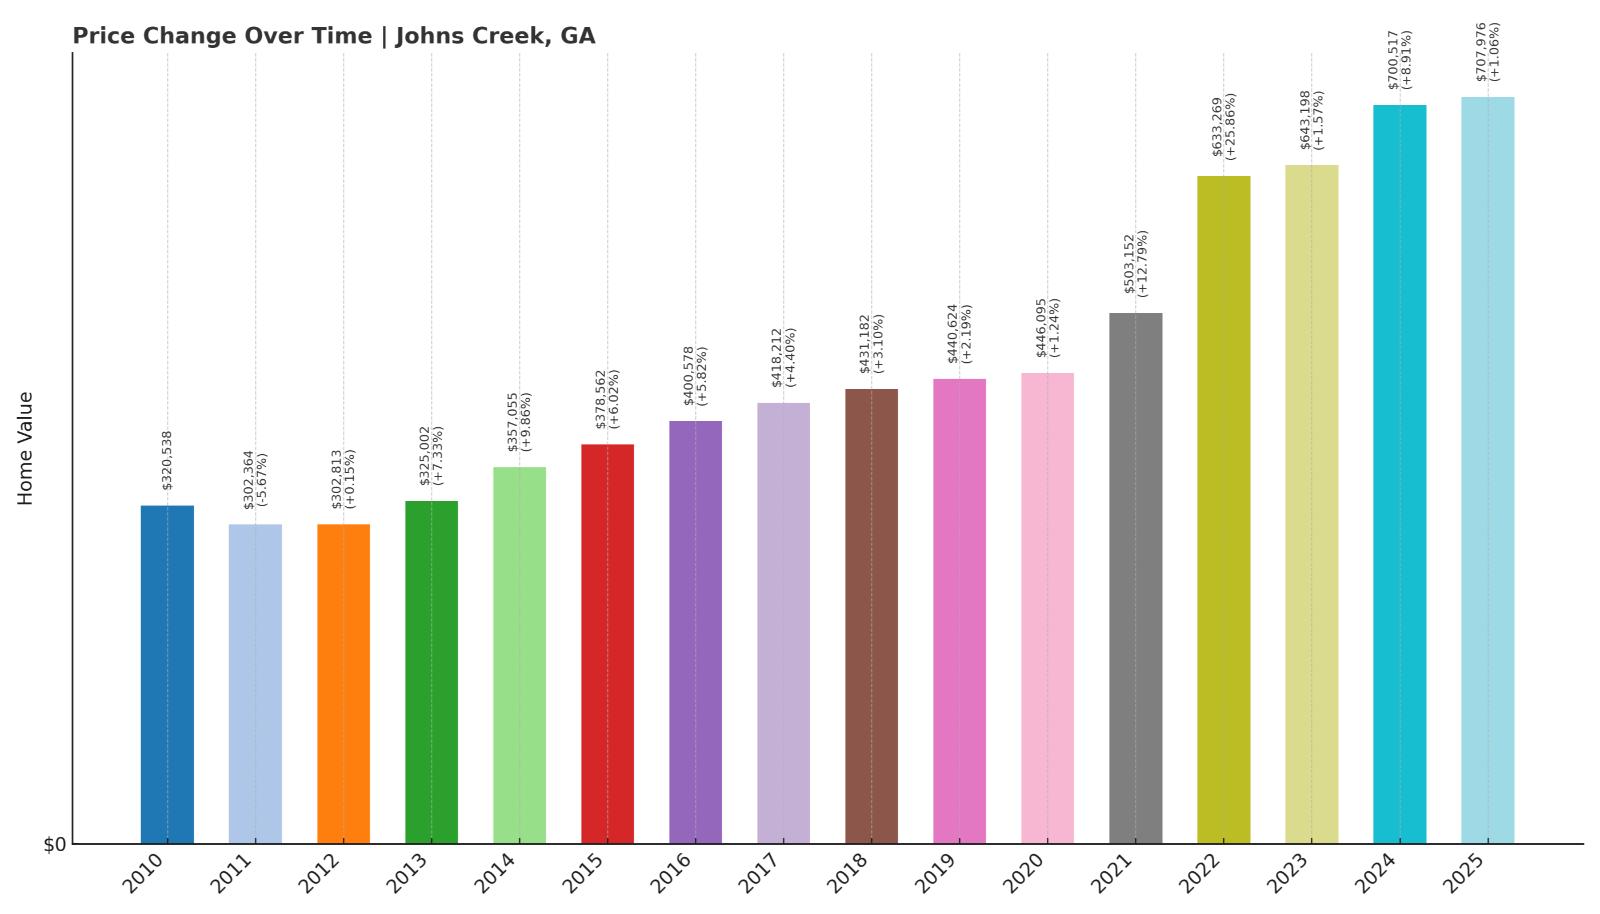
- 2010: $320,538
- 2011: $302,364 (-$18,174, -5.67% from previous year)
- 2012: $302,813 (+$449, +0.15% from previous year)
- 2013: $325,002 (+$22,189, +7.33% from previous year)
- 2014: $357,055 (+$32,053, +9.86% from previous year)
- 2015: $378,562 (+$21,508, +6.02% from previous year)
- 2016: $400,578 (+$22,016, +5.82% from previous year)
- 2017: $418,212 (+$17,634, +4.40% from previous year)
- 2018: $431,182 (+$12,970, +3.10% from previous year)
- 2019: $440,624 (+$9,442, +2.19% from previous year)
- 2020: $446,095 (+$5,471, +1.24% from previous year)
- 2021: $503,152 (+$57,058, +12.79% from previous year)
- 2022: $633,269 (+$130,116, +25.86% from previous year)
- 2023: $643,198 (+$9,929, +1.57% from previous year)
- 2024: $700,517 (+$57,320, +8.91% from previous year)
- 2025: $707,976 (+$7,459, +1.06% from previous year)
Home prices in Johns Creek have grown by 134% since 2011, climbing from $302,364 to $707,976. While early growth was steady, the biggest price leap came in 2022 with a nearly 26% surge. Prices have continued rising since, albeit at a slower pace.
Johns Creek – Top Schools and Tech-Driven Growth

Johns Creek consistently ranks among Georgia’s most desirable suburbs, known for its top-rated schools, safe neighborhoods, and high quality of life. Located in Fulton County, it’s also home to a growing number of corporate offices and high-tech employers. These factors have made the area attractive to well-paid professionals and families looking for long-term value.
The steep appreciation in 2022 reflects strong post-pandemic demand and limited inventory. Even with tempered growth in 2023–2025, Johns Creek remains one of the priciest places to buy a home in Georgia, especially for buyers prioritizing school districts and amenities.
8. Greensboro – 93% Home Price Increase Since 2011
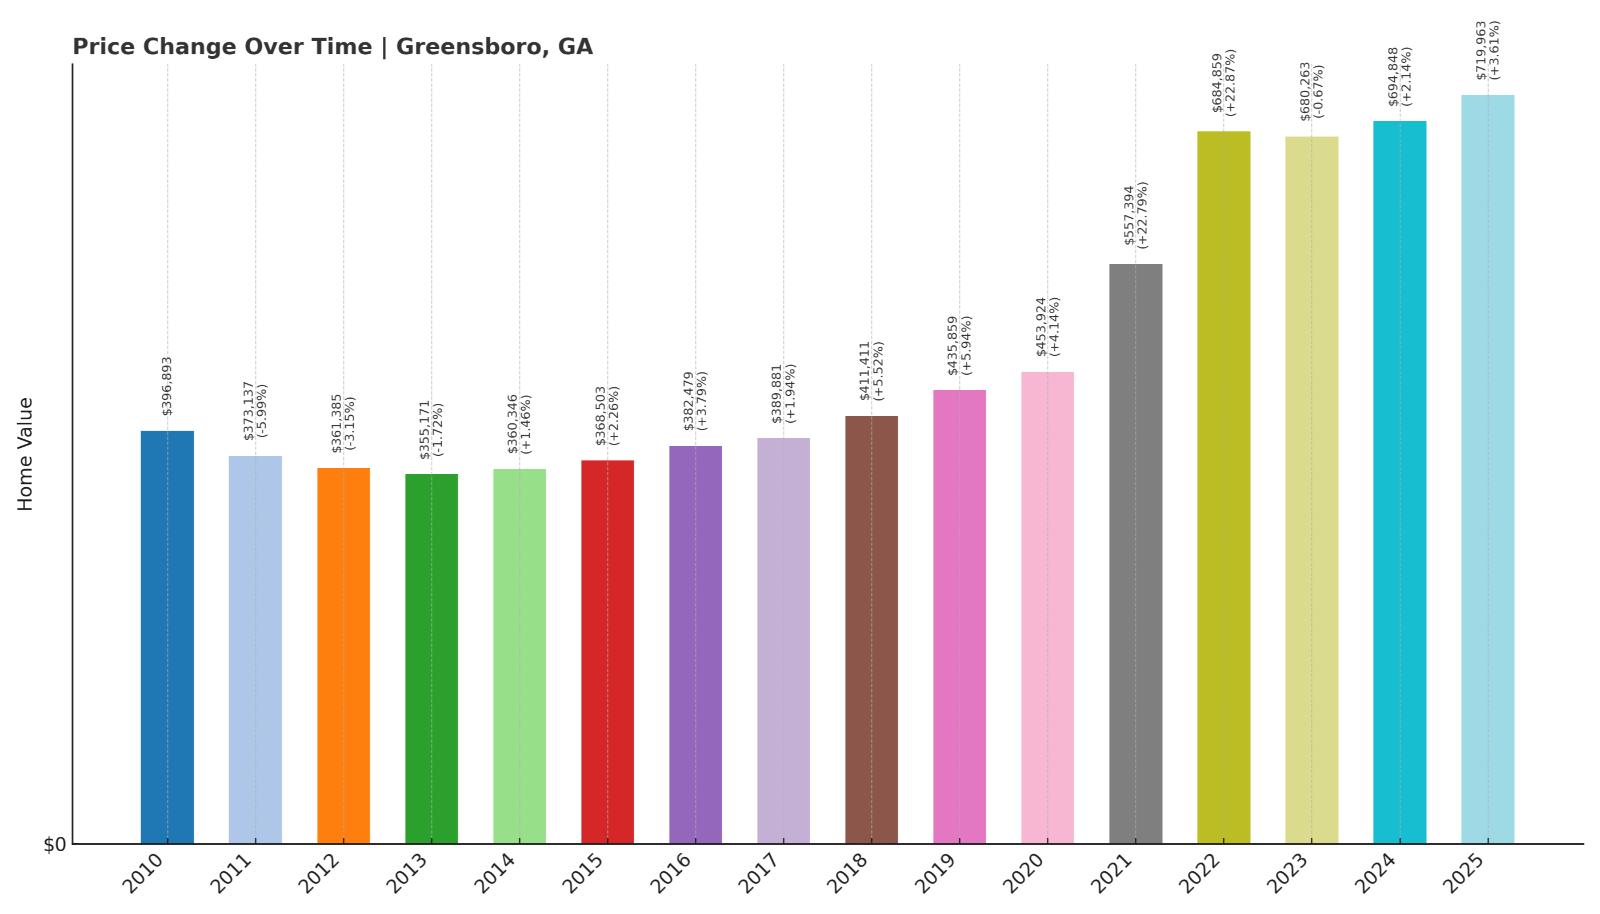
- 2010: $396,893
- 2011: $373,137 (-$23,755, -5.99% from previous year)
- 2012: $361,385 (-$11,752, -3.15% from previous year)
- 2013: $355,171 (-$6,214, -1.72% from previous year)
- 2014: $360,346 (+$5,175, +1.46% from previous year)
- 2015: $368,503 (+$8,157, +2.26% from previous year)
- 2016: $382,479 (+$13,976, +3.79% from previous year)
- 2017: $389,881 (+$7,401, +1.94% from previous year)
- 2018: $411,411 (+$21,531, +5.52% from previous year)
- 2019: $435,859 (+$24,448, +5.94% from previous year)
- 2020: $453,924 (+$18,065, +4.14% from previous year)
- 2021: $557,394 (+$103,470, +22.79% from previous year)
- 2022: $684,859 (+$127,465, +22.87% from previous year)
- 2023: $680,263 (-$4,595, -0.67% from previous year)
- 2024: $694,848 (+$14,585, +2.14% from previous year)
- 2025: $719,963 (+$25,114, +3.61% from previous year)
Greensboro home prices rose by 93% since 2011, climbing from $373,137 to nearly $720,000 in 2025. Most of the appreciation came in just two years—2021 and 2022—when values spiked by over $230,000. Prices have since stabilized and resumed moderate growth.
Greensboro – Luxury Lakefront and Golf Communities

Greensboro, located near Lake Oconee, has become a luxury destination for buyers seeking resort-style living. The area is home to high-end communities like Reynolds Lake Oconee, featuring world-class golf, lake access, and upscale amenities. These exclusive developments have fueled much of Greensboro’s home price gains.
The dramatic growth in 2021 and 2022 mirrors broader trends in affluent second-home markets. While price growth has slowed, Greensboro continues to attract high-net-worth buyers looking for privacy, recreation, and luxury real estate in central Georgia.
7. Brookhaven – 137% Home Price Increase Since 2011
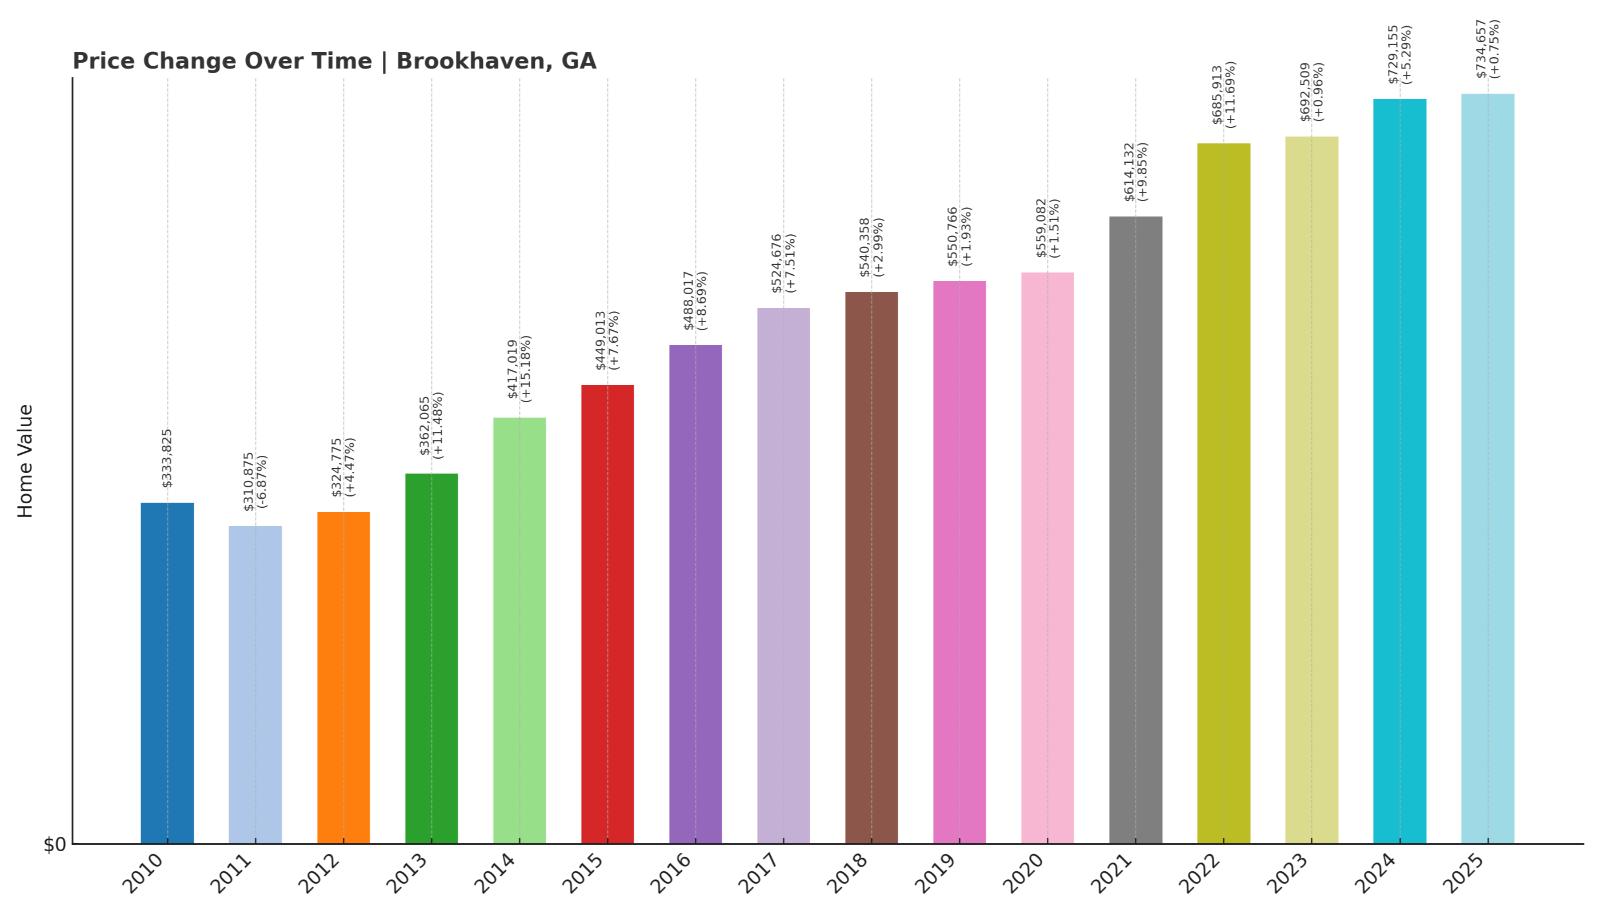
- 2010: $333,825
- 2011: $310,875 (-$22,950, -6.87% from previous year)
- 2012: $324,775 (+$13,900, +4.47% from previous year)
- 2013: $362,065 (+$37,290, +11.48% from previous year)
- 2014: $417,019 (+$54,954, +15.18% from previous year)
- 2015: $449,013 (+$31,994, +7.67% from previous year)
- 2016: $488,017 (+$39,004, +8.69% from previous year)
- 2017: $524,676 (+$36,659, +7.51% from previous year)
- 2018: $540,358 (+$15,682, +2.99% from previous year)
- 2019: $550,766 (+$10,408, +1.93% from previous year)
- 2020: $559,082 (+$8,315, +1.51% from previous year)
- 2021: $614,132 (+$55,051, +9.85% from previous year)
- 2022: $685,913 (+$71,781, +11.69% from previous year)
- 2023: $692,509 (+$6,596, +0.96% from previous year)
- 2024: $729,155 (+$36,646, +5.29% from previous year)
- 2025: $734,657 (+$5,503, +0.75% from previous year)
Brookhaven home prices rose by 137% since 2011, reaching $734,657 in 2025. The town saw sharp appreciation between 2013 and 2017 and again in 2021 and 2022. Since then, growth has been slower but steady.
Brookhaven – High Demand and Prime Location

Brookhaven is one of Atlanta’s most coveted in-town suburbs, prized for its upscale neighborhoods, walkable villages, and access to Buckhead. Since incorporating in 2012, the city has invested heavily in parks and infrastructure, helping drive demand and home values higher.
The strongest appreciation came during the early years of cityhood and again during the pandemic-era housing boom. With new development slowing and demand holding steady, Brookhaven continues to command some of the state’s highest prices per square foot.
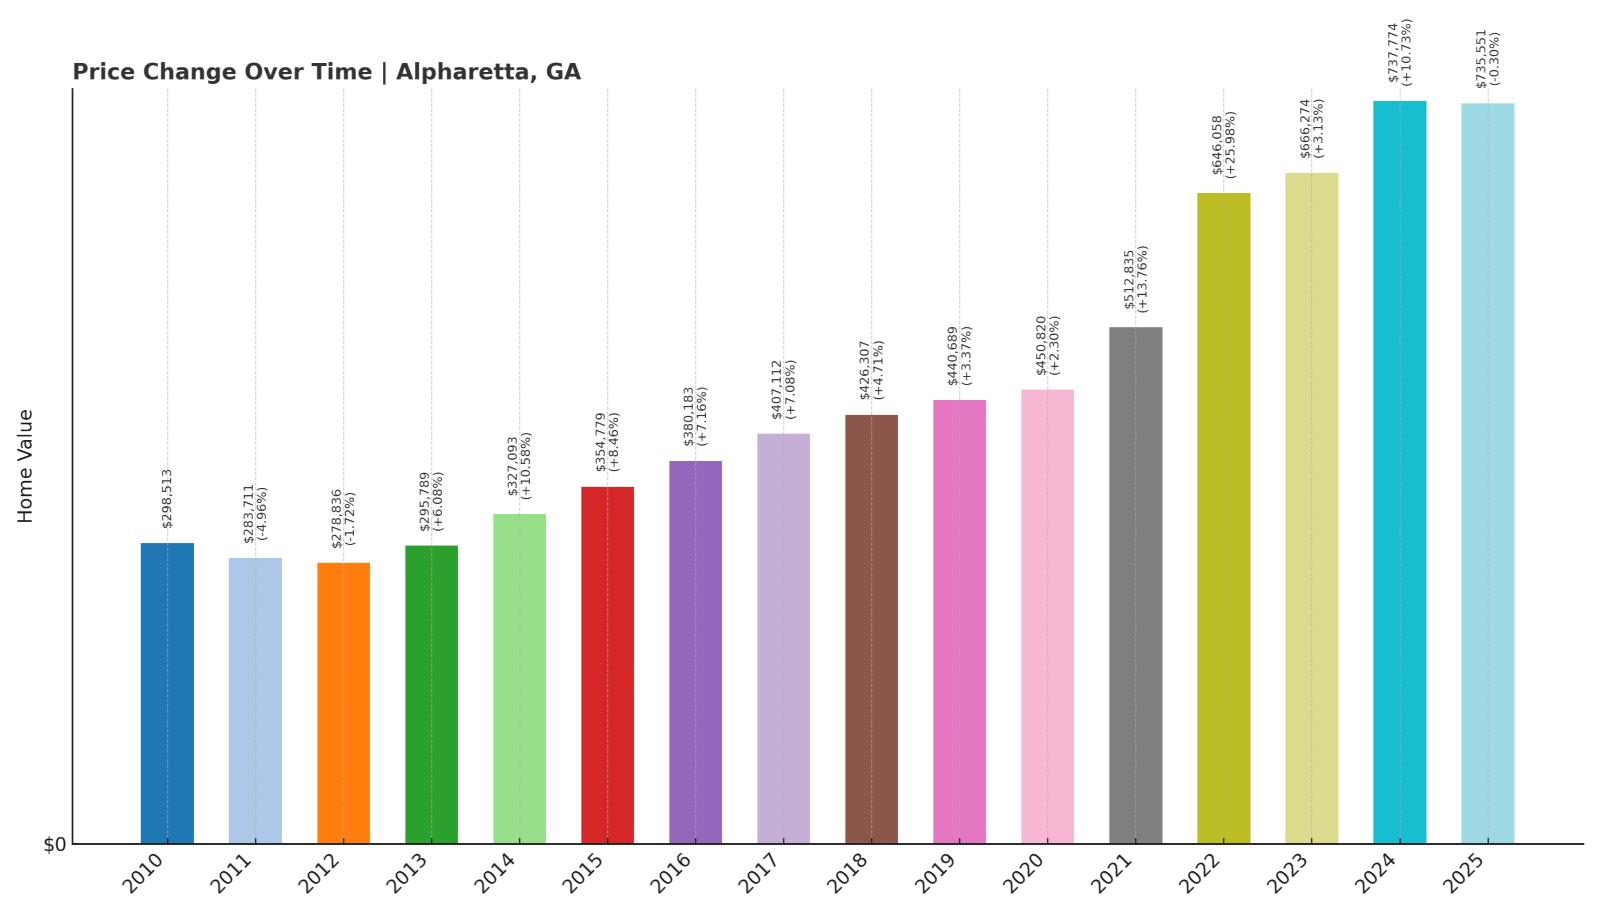
6. Alpharetta – 132% Home Price Increase Since 2011
🔥 Would you like to save this?
- 2010: $298,513
- 2011: $283,711 (-$14,802, -4.96% from previous year)
- 2012: $278,836 (-$4,876, -1.72% from previous year)
- 2013: $295,789 (+$16,954, +6.08% from previous year)
- 2014: $327,093 (+$31,304, +10.58% from previous year)
- 2015: $354,779 (+$27,686, +8.46% from previous year)
- 2016: $380,183 (+$25,403, +7.16% from previous year)
- 2017: $407,112 (+$26,929, +7.08% from previous year)
- 2018: $426,307 (+$19,195, +4.71% from previous year)
- 2019: $440,689 (+$14,382, +3.37% from previous year)
- 2020: $450,820 (+$10,131, +2.30% from previous year)
- 2021: $512,835 (+$62,015, +13.76% from previous year)
- 2022: $646,058 (+$133,223, +25.98% from previous year)
- 2023: $666,274 (+$20,215, +3.13% from previous year)
- 2024: $737,774 (+$71,500, +10.73% from previous year)
- 2025: $735,551 (-$2,222, -0.30% from previous year)
Alpharetta has experienced a 132% increase in home prices since 2011. The city saw a major price surge in 2022, followed by another big jump in 2024. Although 2025 shows a slight decline, values remain near their all-time high.
Alpharetta – Tech Hub and Family Favorite

Alpharetta is a thriving northern suburb of Atlanta, often ranked among the best places to live in Georgia. Its booming tech corridor, top-tier schools, and vibrant downtown have fueled steady population growth and rising home prices.
Massive demand during the pandemic years pushed prices sharply higher, particularly in 2022. Even with a small dip in 2025, Alpharetta continues to attract high-earning professionals and families looking for a blend of employment, lifestyle, and convenience.
5. Marble Hill – 113% Home Price Increase Since 2011
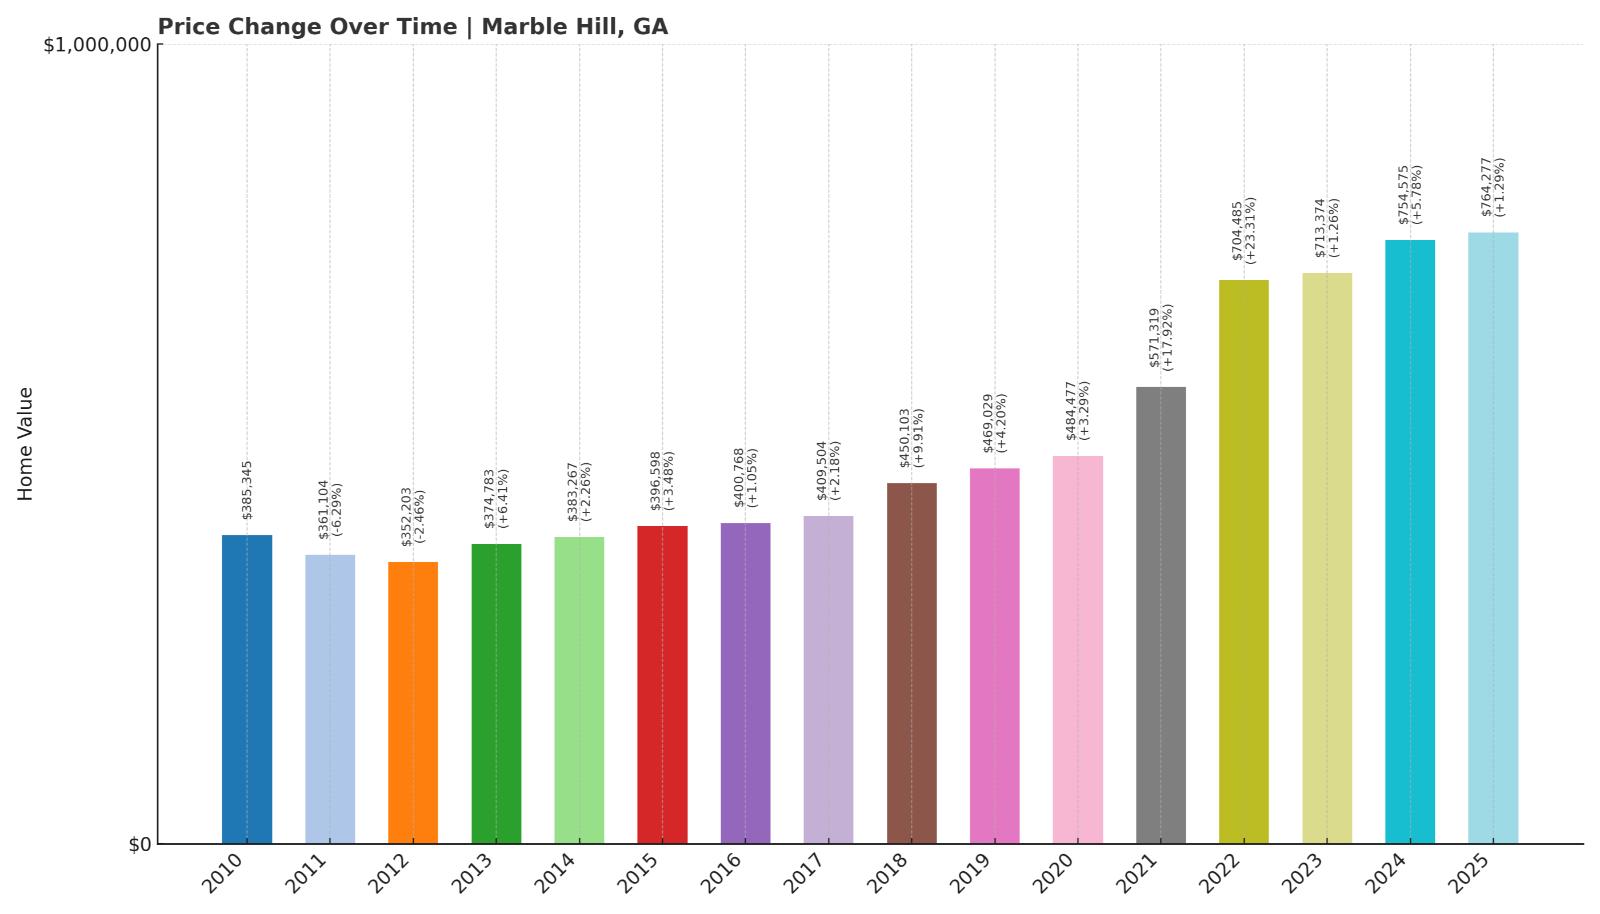
- 2010: $385,345
- 2011: $361,104 (-$24,241, -6.29% from previous year)
- 2012: $352,203 (-$8,901, -2.46% from previous year)
- 2013: $374,783 (+$22,580, +6.41% from previous year)
- 2014: $383,267 (+$8,484, +2.26% from previous year)
- 2015: $396,598 (+$13,331, +3.48% from previous year)
- 2016: $400,768 (+$4,170, +1.05% from previous year)
- 2017: $409,504 (+$8,736, +2.18% from previous year)
- 2018: $450,103 (+$40,599, +9.91% from previous year)
- 2019: $469,029 (+$18,926, +4.20% from previous year)
- 2020: $484,477 (+$15,448, +3.29% from previous year)
- 2021: $571,319 (+$86,842, +17.92% from previous year)
- 2022: $704,485 (+$133,165, +23.31% from previous year)
- 2023: $713,374 (+$8,889, +1.26% from previous year)
- 2024: $754,575 (+$41,201, +5.78% from previous year)
- 2025: $764,277 (+$9,702, +1.29% from previous year)
Marble Hill has seen a 113% increase in home prices since 2011. The most significant appreciation came during 2021 and 2022, when prices jumped over $220,000 combined. Since then, growth has steadied but remains positive.
Marble Hill – Quiet Luxury in the Foothills
Marble Hill, nestled in the North Georgia mountains near Jasper, offers scenic views, low density, and upscale homes that appeal to buyers looking for privacy and natural beauty. While it doesn’t get the same attention as some metro Atlanta suburbs, its appeal to retirees and high-income remote workers has fueled demand.
The post-2020 surge in home values corresponds with rising interest in rural and semi-rural luxury living. With a 2025 median home value of $764,277, Marble Hill has firmly established itself as a high-end outpost in the northern part of the state.
4. Berkeley Lake – 140% Home Price Increase Since 2011

- 2010: $373,975
- 2011: $335,311 (-$38,665, -10.34% from previous year)
- 2012: $313,744 (-$21,567, -6.43% from previous year)
- 2013: $338,004 (+$24,260, +7.73% from previous year)
- 2014: $366,257 (+$28,253, +8.36% from previous year)
- 2015: $392,886 (+$26,628, +7.27% from previous year)
- 2016: $423,274 (+$30,388, +7.73% from previous year)
- 2017: $446,660 (+$23,386, +5.52% from previous year)
- 2018: $474,247 (+$27,587, +6.18% from previous year)
- 2019: $484,320 (+$10,073, +2.12% from previous year)
- 2020: $497,887 (+$13,566, +2.80% from previous year)
- 2021: $574,100 (+$76,213, +15.31% from previous year)
- 2022: $708,826 (+$134,727, +23.47% from previous year)
- 2023: $732,681 (+$23,855, +3.37% from previous year)
- 2024: $773,051 (+$40,369, +5.51% from previous year)
- 2025: $805,519 (+$32,468, +4.20% from previous year)
Home prices in Berkeley Lake have more than doubled since 2011, rising by 140% overall. Appreciation was strongest in 2021 and 2022, but even in recent years, prices have grown steadily to a median of over $800K in 2025.
Berkeley Lake – Lakeside Living With Metro Access

Berkeley Lake is a small, affluent community in Gwinnett County centered around a private lake. With its limited number of homes and protected green space, it’s one of the more exclusive places to live near Atlanta. The appeal lies in its tranquil setting combined with close proximity to city amenities.
Home values surged during the housing boom of the early 2020s, and while the pace has slowed, demand remains strong. With prices surpassing $800,000, Berkeley Lake continues to command a premium for buyers looking for nature and privacy without sacrificing location.
3. Skidaway Island – 204% Home Price Increase Since 2011
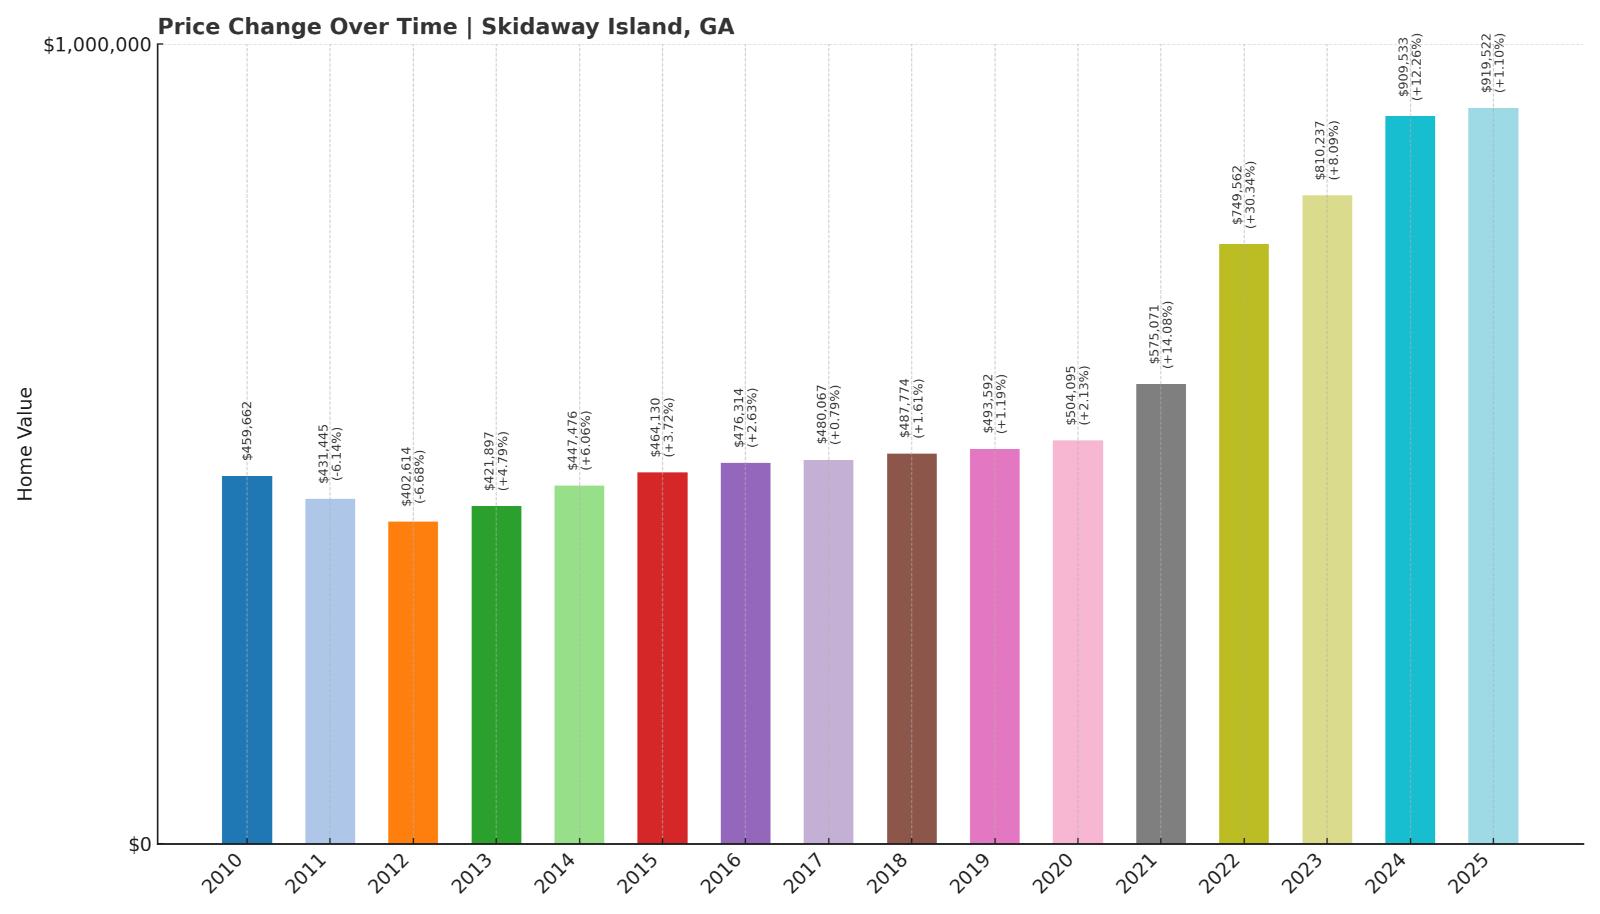
- 2010: $459,662
- 2011: $431,445 (-$28,216, -6.14% from previous year)
- 2012: $402,614 (-$28,831, -6.68% from previous year)
- 2013: $421,897 (+$19,283, +4.79% from previous year)
- 2014: $447,476 (+$25,578, +6.06% from previous year)
- 2015: $464,130 (+$16,654, +3.72% from previous year)
- 2016: $476,314 (+$12,184, +2.63% from previous year)
- 2017: $480,067 (+$3,753, +0.79% from previous year)
- 2018: $487,774 (+$7,707, +1.61% from previous year)
- 2019: $493,592 (+$5,818, +1.19% from previous year)
- 2020: $504,095 (+$10,503, +2.13% from previous year)
- 2021: $575,071 (+$70,977, +14.08% from previous year)
- 2022: $749,562 (+$174,490, +30.34% from previous year)
- 2023: $810,237 (+$60,676, +8.09% from previous year)
- 2024: $909,533 (+$99,296, +12.26% from previous year)
- 2025: $919,522 (+$9,988, +1.10% from previous year)
Skidaway Island saw a 204% increase in home values since 2011. The largest jumps occurred in 2022 and 2024, each year adding over $90K in value. By 2025, the median price had risen to just over $919,000.
Skidaway Island – Gated Luxury Near the Coast

Located southeast of Savannah, Skidaway Island is home to The Landings, a gated, master-planned community that offers golf, marinas, and nature preserves. Its appeal to affluent retirees and second-home buyers has only grown, especially during the post-2020 real estate surge.
With limited housing and high demand, especially from out-of-state buyers, Skidaway has established itself as one of Georgia’s most elite housing markets. The 2022 and 2024 price spikes solidified its ranking among the top three most expensive towns in the state.
2. Milton – 135% Home Price Increase Since 2011
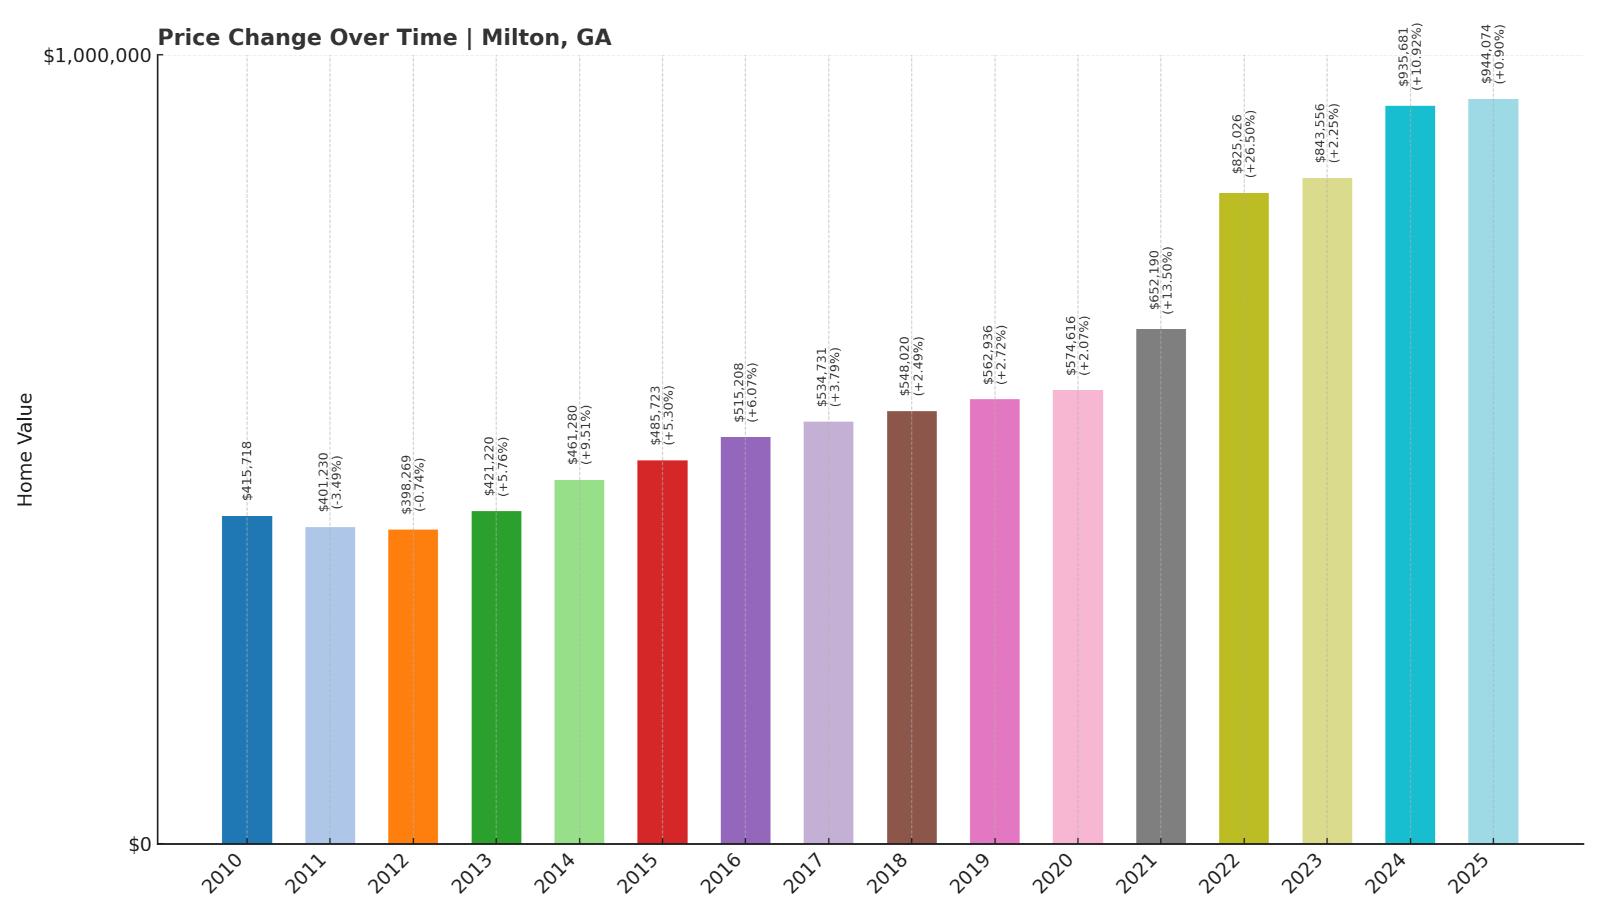
- 2010: $415,718
- 2011: $401,230 (-$14,488, -3.49% from previous year)
- 2012: $398,269 (-$2,961, -0.74% from previous year)
- 2013: $421,220 (+$22,951, +5.76% from previous year)
- 2014: $461,280 (+$40,060, +9.51% from previous year)
- 2015: $485,723 (+$24,443, +5.30% from previous year)
- 2016: $515,208 (+$29,485, +6.07% from previous year)
- 2017: $534,731 (+$19,523, +3.79% from previous year)
- 2018: $548,020 (+$13,289, +2.49% from previous year)
- 2019: $562,936 (+$14,916, +2.72% from previous year)
- 2020: $574,616 (+$11,679, +2.07% from previous year)
- 2021: $652,190 (+$77,575, +13.50% from previous year)
- 2022: $825,026 (+$172,835, +26.50% from previous year)
- 2023: $843,556 (+$18,531, +2.25% from previous year)
- 2024: $935,681 (+$92,124, +10.92% from previous year)
- 2025: $944,074 (+$8,393, +0.90% from previous year)
Milton’s home prices have increased by 135% since 2011. Values rose steadily throughout the 2010s, then spiked sharply in 2022 and again in 2024. The median price reached $944,074 in 2025.
Milton – Equestrian Estates and Executive Living

🔥 Would you like to save this?
Milton, located in north Fulton County, is known for its spacious lots, rolling hills, and luxury estates. It’s one of Georgia’s wealthiest cities, attracting executives, professionals, and equestrian enthusiasts. Top schools and rural charm help sustain high demand.
The massive 2022 increase in home values coincided with a wave of affluent buyers seeking space and exclusivity. Milton remains a standout among suburban markets, thanks to its blend of privacy and prestige.
1. Sea Island – 131% Home Price Increase Since 2011
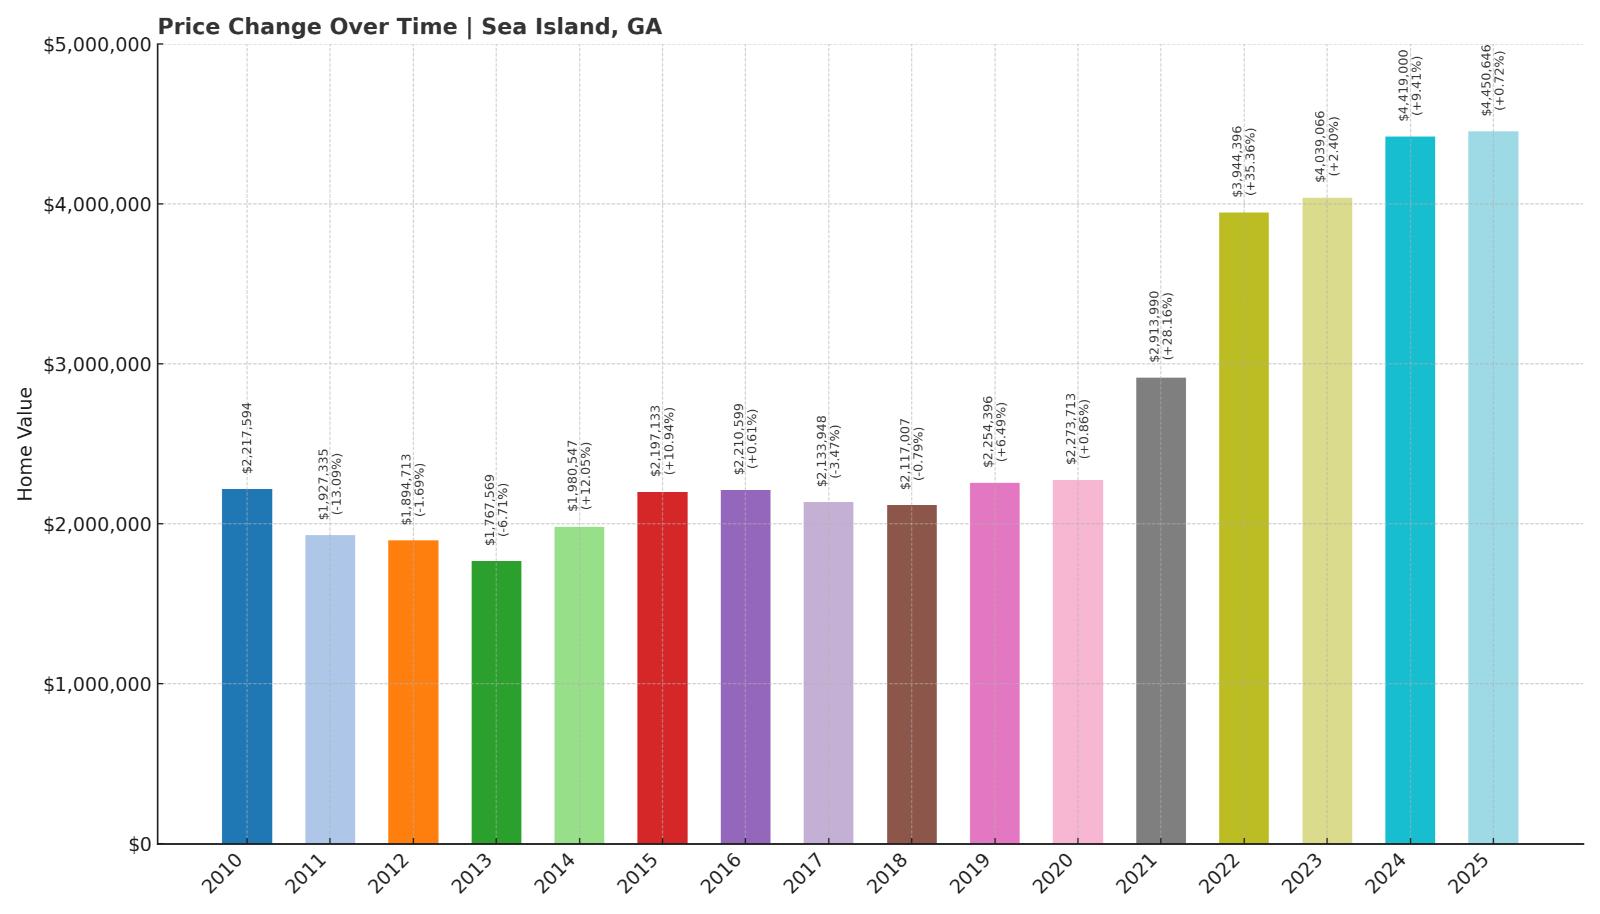
- 2010: $2,217,594
- 2011: $1,927,335 (-$290,260, -13.09% from previous year)
- 2012: $1,894,713 (-$32,622, -1.69% from previous year)
- 2013: $1,767,569 (-$127,144, -6.71% from previous year)
- 2014: $1,980,547 (+$212,978, +12.05% from previous year)
- 2015: $2,197,133 (+$216,586, +10.94% from previous year)
- 2016: $2,210,599 (+$13,466, +0.61% from previous year)
- 2017: $2,133,948 (-$76,651, -3.47% from previous year)
- 2018: $2,117,007 (-$16,940, -0.79% from previous year)
- 2019: $2,254,396 (+$137,389, +6.49% from previous year)
- 2020: $2,273,713 (+$19,316, +0.86% from previous year)
- 2021: $2,913,990 (+$640,277, +28.16% from previous year)
- 2022: $3,944,396 (+$1,030,406, +35.36% from previous year)
- 2023: $4,039,066 (+$94,670, +2.40% from previous year)
- 2024: $4,419,000 (+$379,934, +9.41% from previous year)
- 2025: $4,450,646 (+$31,646, +0.72% from previous year)
Sea Island’s median home value has climbed from $1.93 million in 2011 to $4.45 million in 2025—a 131% increase. The most striking gains came in 2021 and 2022, when values soared by more than $1.6 million in just two years.
Sea Island – Georgia’s Pinnacle of Luxury Real Estate
Sea Island is a private resort island on the Georgia coast, home to some of the most exclusive—and expensive—real estate in the Southeast. Gated access, world-class golf, and 5-star amenities like The Cloister make it a preferred destination for billionaires and business elite.
Price growth exploded during the pandemic boom as luxury buyers sought privacy and security. With values holding above $4.4 million in 2025, Sea Island remains unmatched in exclusivity and price within the state of Georgia.