
Would you like to save this?
The Zillow Home Value Index tells a rare story in 2025: in these 20 Mississippi towns, it’s still a buyer’s market. While much of the country has been dealing with high prices and tight supply, these spots are bucking the trend—offering homes well below state and national averages.
Some boomed during the pandemic and then cooled fast. Others never heated up at all. From quiet Delta towns to rural outposts holding steady, these are the places where affordability still lives—and where real estate feels like a price time capsule.
20. Prentiss – 26% Home Price Increase Since 2012
- 2010: N/A
- 2011: N/A
- 2012: $66,724
- 2013: $63,431 (-$3,294, -4.94% from previous year)
- 2014: $68,697 (+$5,266, +8.30% from previous year)
- 2015: $72,147 (+$3,450, +5.02% from previous year)
- 2016: $78,496 (+$6,349, +8.80% from previous year)
- 2017: $80,886 (+$2,390, +3.04% from previous year)
- 2018: $82,709 (+$1,823, +2.25% from previous year)
- 2019: $78,522 (-$4,186, -5.06% from previous year)
- 2020: N/A
- 2021: $91,362
- 2022: $99,355 (+$7,993, +8.75% from previous year)
- 2023: $87,256 (-$12,099, -12.18% from previous year)
- 2024: $80,367 (-$6,890, -7.90% from previous year)
- 2025: $84,295 (+$3,928, +4.89% from previous year)
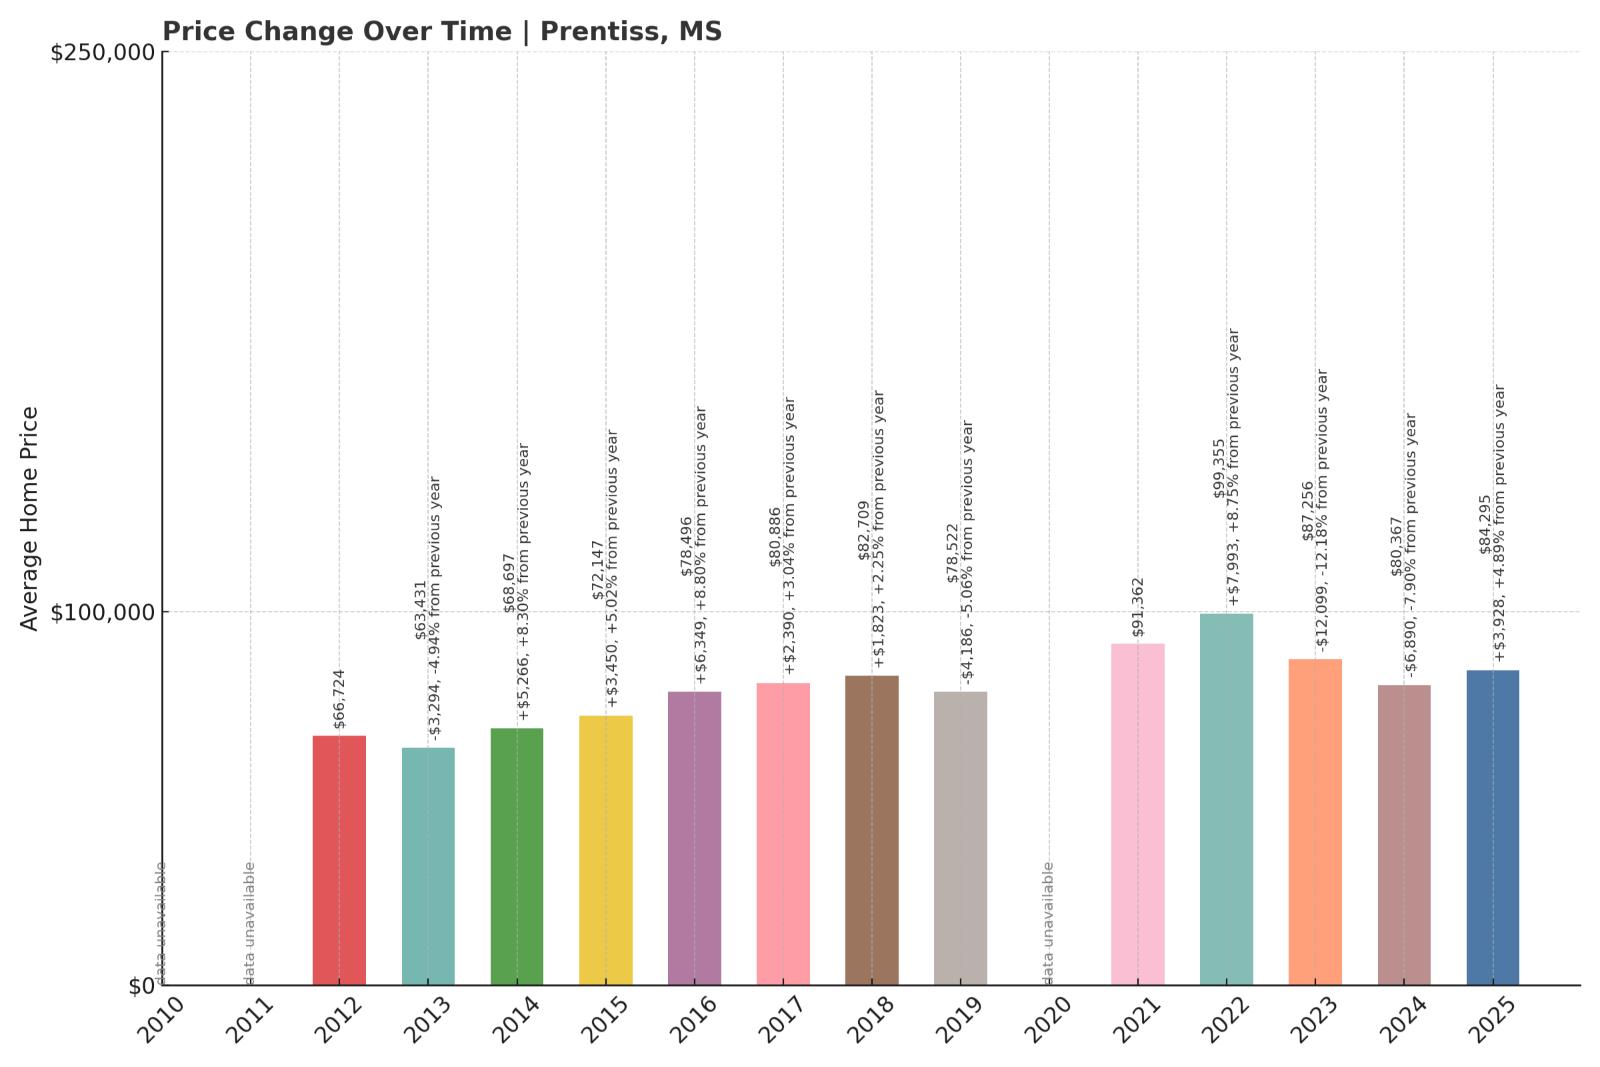
Home values in Prentiss have risen from $66,724 in 2012 to $84,295 in 2025—a 26% increase over 13 years. The town has experienced a mix of growth and volatility, with major gains between 2014 and 2022, followed by a sharp drop in 2023 and modest recovery since. The last year brought a slight bounce back with prices increasing by nearly 5%.
Prentiss – Small-Town Stability with Economic Fluctuations
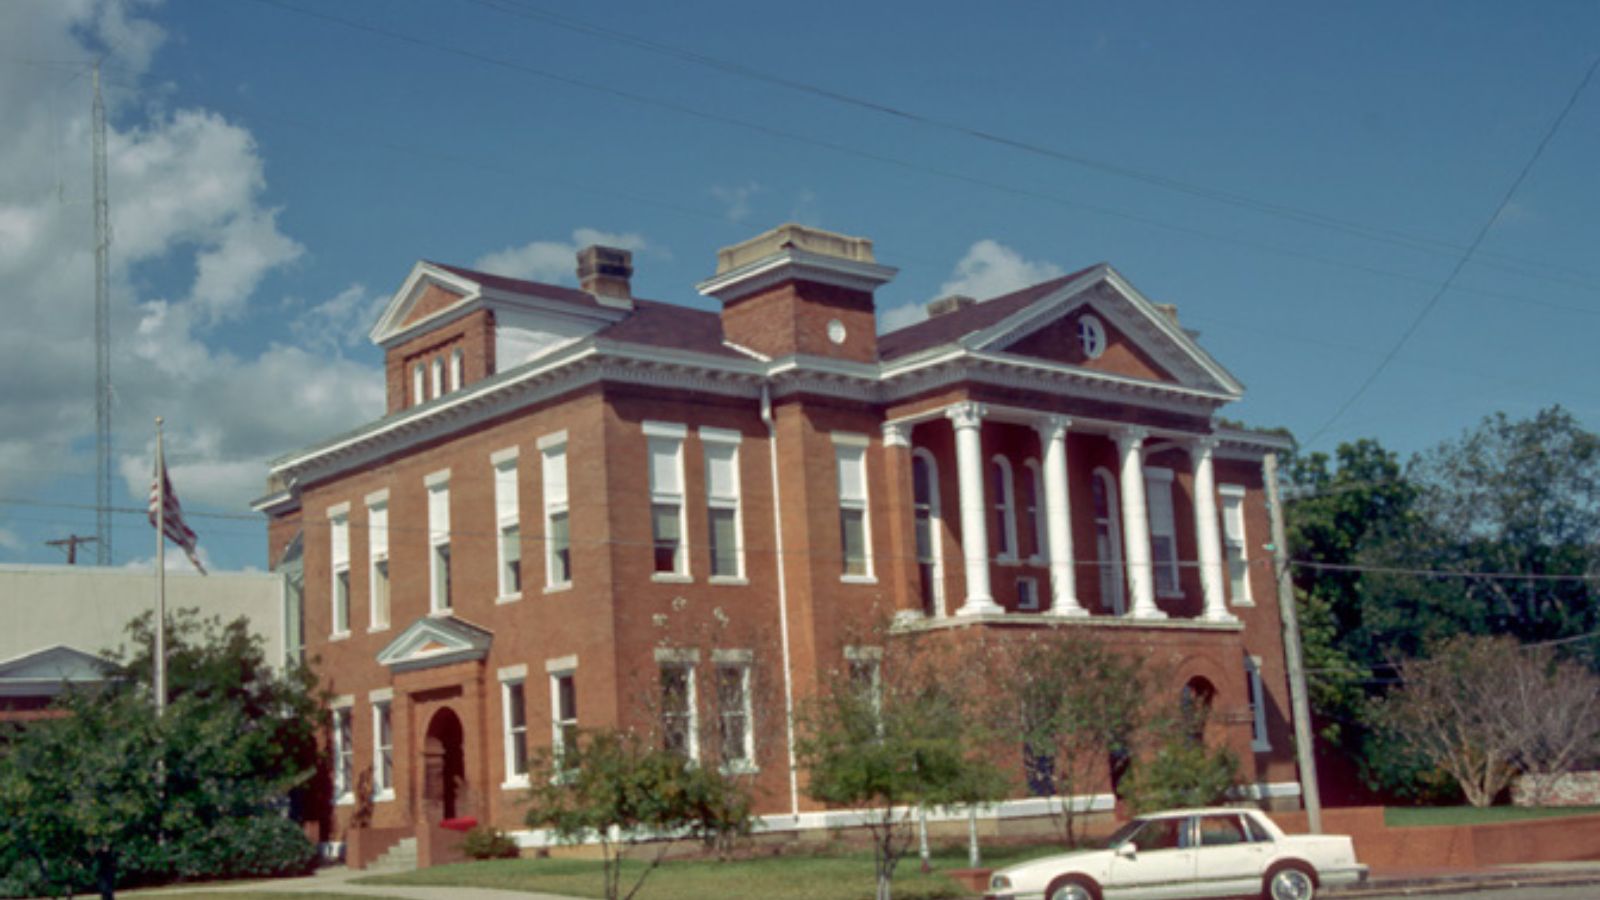
Prentiss is a modest town located in Jefferson Davis County in south-central Mississippi. Despite its small population, the town saw a period of solid housing appreciation during the 2010s, especially from 2014 to 2018. That said, recent years have brought some price instability, with 2023 marking a double-digit price drop followed by a slight rebound in 2025. The current median value is just over $84,000, making it one of the more affordable markets in the state.
This variability could reflect shifting economic conditions and demand patterns in rural Mississippi. With a historic downtown, proximity to the Longleaf Trace trail, and a quiet pace of life, Prentiss continues to appeal to buyers seeking value and a slower pace. However, its small size means it’s more vulnerable to swings in local employment and regional migration trends.
19. Greenwood – 45% Home Price Increase Since 2012

- 2010: N/A
- 2011: N/A
- 2012: $57,589
- 2013: $53,519 (-$4,070, -7.07% from previous year)
- 2014: $47,227 (-$6,291, -11.76% from previous year)
- 2015: $50,967 (+$3,740, +7.92% from previous year)
- 2016: $58,116 (+$7,149, +14.03% from previous year)
- 2017: $59,713 (+$1,596, +2.75% from previous year)
- 2018: $61,159 (+$1,446, +2.42% from previous year)
- 2019: $71,829 (+$10,670, +17.45% from previous year)
- 2020: N/A
- 2021: $92,823
- 2022: $99,552 (+$6,728, +7.25% from previous year)
- 2023: $98,215 (-$1,336, -1.34% from previous year)
- 2024: $84,606 (-$13,610, -13.86% from previous year)
- 2025: $83,396 (-$1,209, -1.43% from previous year)
Greenwood home prices have climbed from $57,589 in 2012 to $83,396 in 2025, a 45% overall increase. After a rough start with double-digit drops in 2013 and 2014, the market recovered steadily through the late 2010s and into the early 2020s. Prices peaked in 2022 and have declined since, with two consecutive years of small losses.
Greenwood – Highs and Lows in the Delta Market

Located in the Mississippi Delta, Greenwood has a deep history and a distinct cultural legacy. Known for blues music and agriculture, the town’s housing market has been shaped by both economic opportunity and challenge. After bottoming out in 2014, home prices surged over the next decade, particularly between 2015 and 2021, reflecting renewed demand or local investment.
Greenwood’s recent decline in home values from the 2022 high point suggests cooling demand or shifting buyer preferences, though it still holds a solid gain over the long term. The town’s mix of historic charm and affordability may continue to attract residents, but recent dips may warrant caution for short-term investors.
18. Isola – 11.5% Home Price Increase Since 2016

- 2010: N/A
- 2011: N/A
- 2012: N/A
- 2013: N/A
- 2014: N/A
- 2015: N/A
- 2016: $72,967
- 2017: $71,998 (-$969, -1.33% from previous year)
- 2018: $72,957 (+$959, +1.33% from previous year)
- 2019: $70,446 (-$2,511, -3.44% from previous year)
- 2020: N/A
- 2021: $82,519
- 2022: $90,806 (+$8,287, +10.04% from previous year)
- 2023: $86,670 (-$4,136, -4.55% from previous year)
- 2024: $79,816 (-$6,854, -7.91% from previous year)
- 2025: $81,351 (+$1,535, +1.92% from previous year)
Home prices in Isola have grown modestly since 2016, rising from $72,967 to $81,351 in 2025—a total increase of 11.5%. Prices peaked in 2022 before declining in the two years that followed, with a small uptick in the most recent year.
Isola – Modest Growth in a Quiet Delta Town

Would you like to save this?
Isola is a tiny community in Humphreys County, nestled in the heart of the Mississippi Delta. The town saw a quiet rise in home values over the past decade, with its sharpest increases arriving during the COVID-19 housing surge. Like many rural towns, values peaked in 2022 before gradually declining.
With a current average home value just over $81,000, Isola remains among the more affordable towns in the state. The area’s small size, agricultural ties, and isolation have kept appreciation steady but limited. Still, even modest growth like this stands out in regions where many towns are seeing prices contract.
17. Morton – 2.4% Home Price Increase Since 2021
- 2010: N/A
- 2011: N/A
- 2012: N/A
- 2013: N/A
- 2014: N/A
- 2015: N/A
- 2016: N/A
- 2017: N/A
- 2018: N/A
- 2019: N/A
- 2020: N/A
- 2021: $79,170
- 2022: $90,257 (+$11,087, +14.00% from previous year)
- 2023: $77,389 (-$12,868, -14.26% from previous year)
- 2024: $77,599 (+$211, +0.27% from previous year)
- 2025: $81,107 (+$3,508, +4.52% from previous year)
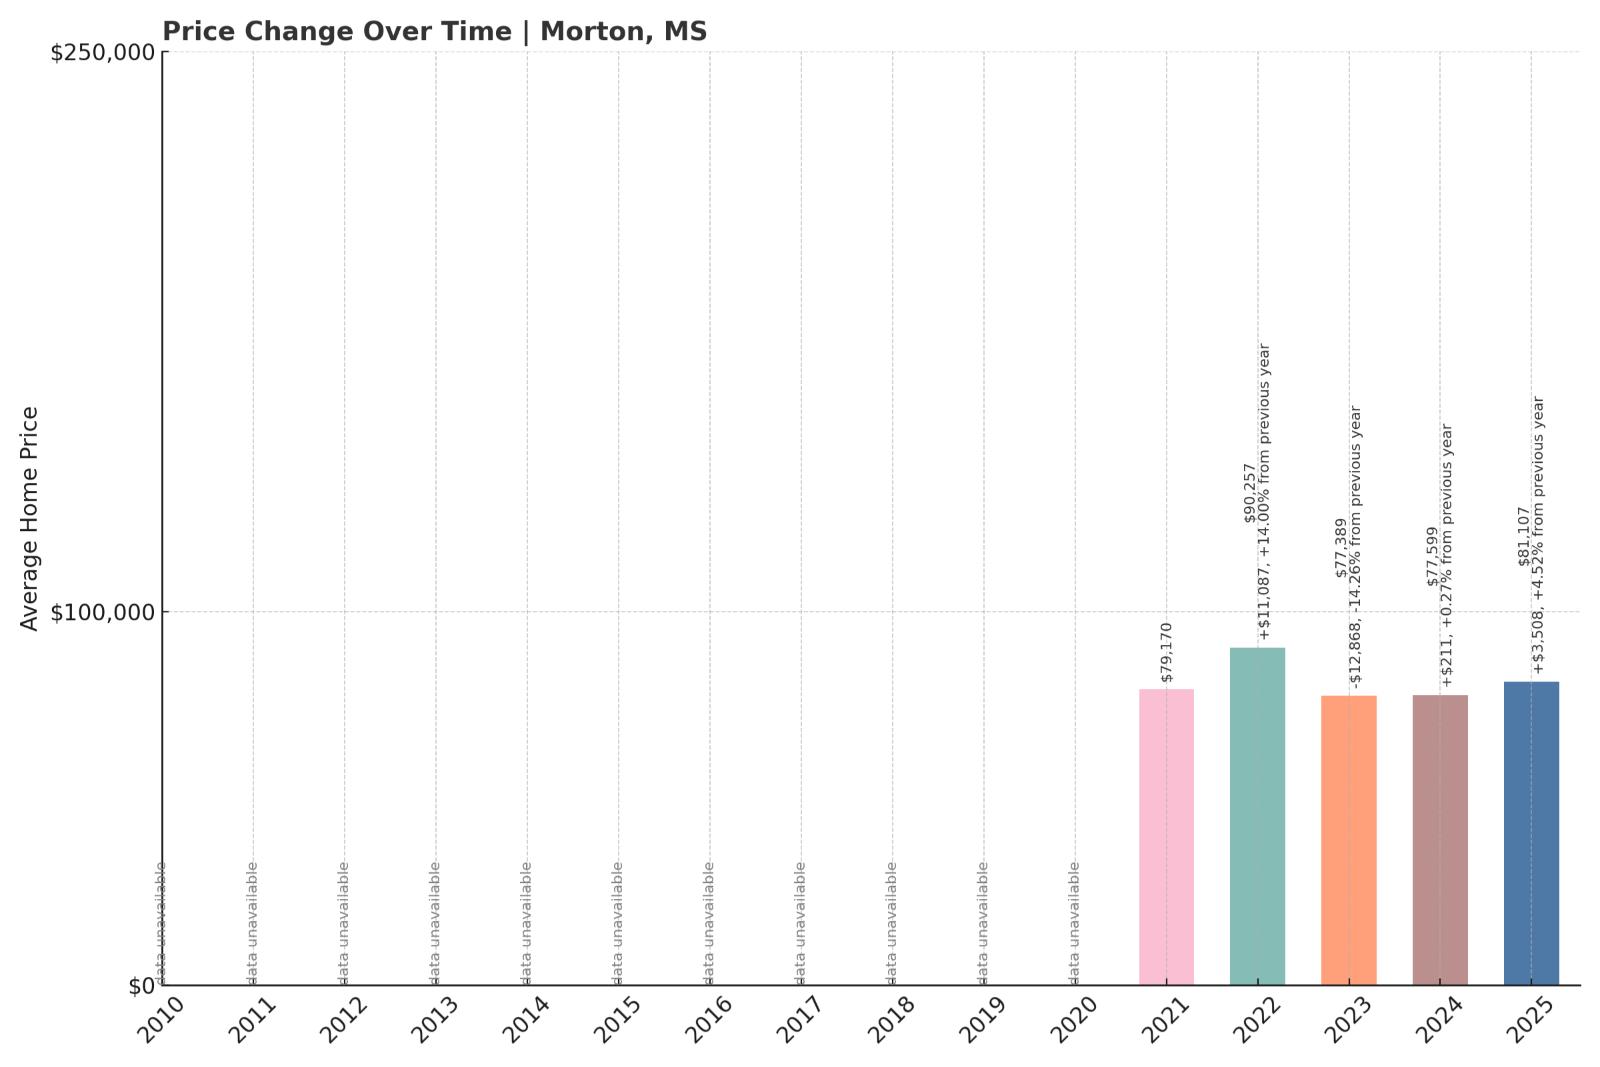
Since 2021, Morton’s home prices have inched upward by just 2.4%, climbing from $79,170 to $81,107. A large spike in 2022 was quickly erased in 2023, followed by two years of mild positive movement.
Morton – A Stable Market with Brief Spikes
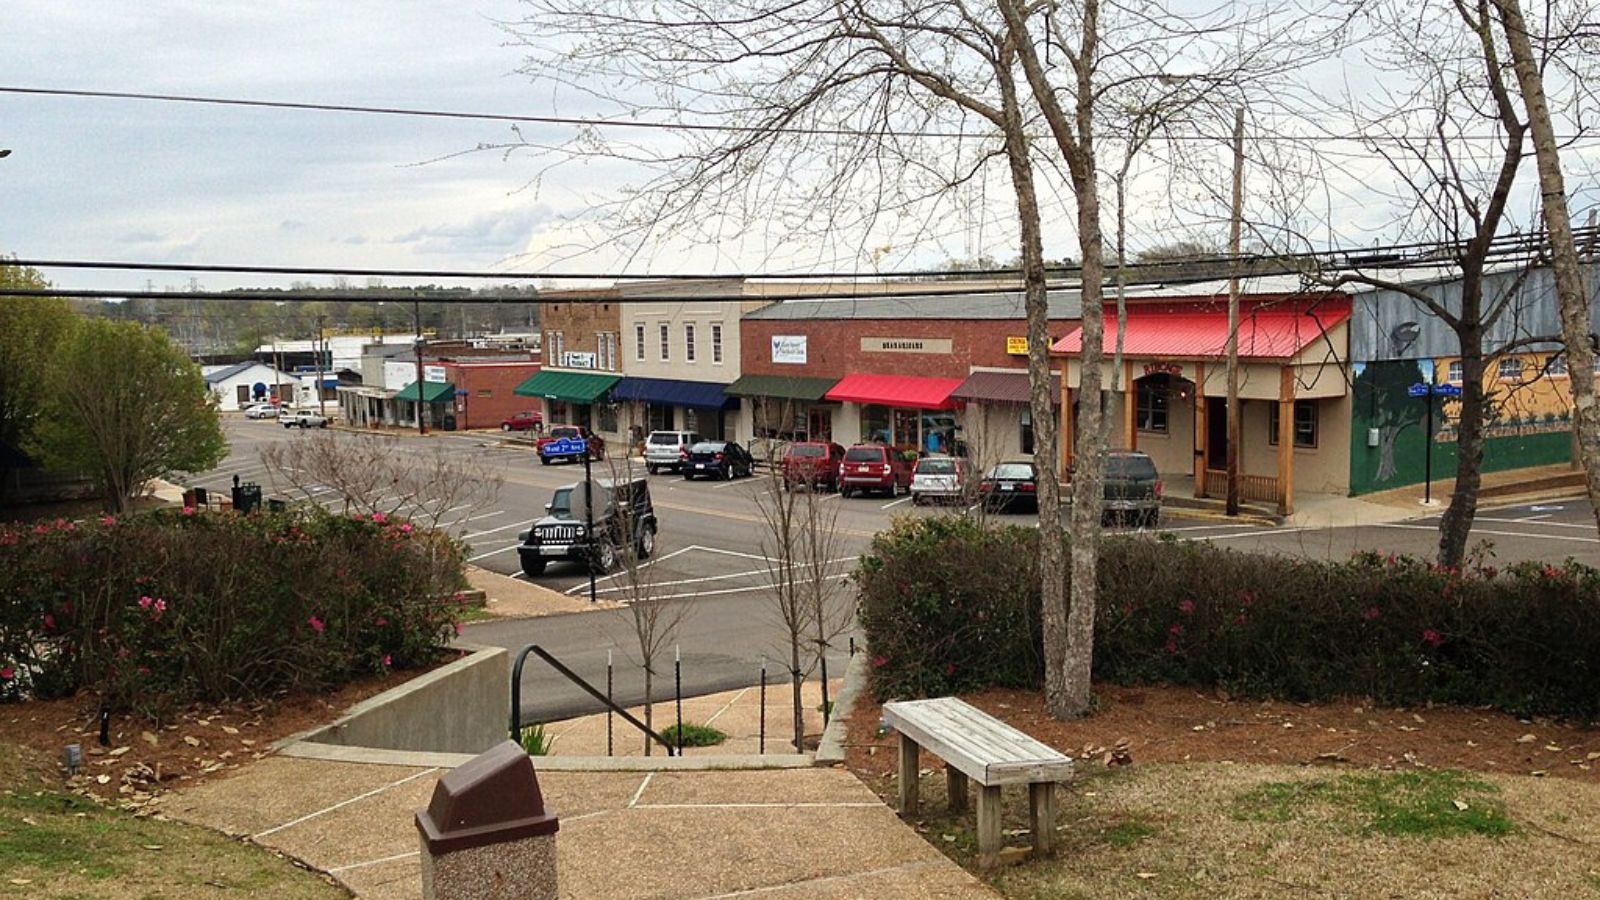
Morton is located in Scott County in central Mississippi, about 35 miles east of Jackson. It’s known for its poultry industry and proximity to Bienville National Forest. The town’s real estate prices spiked dramatically in 2022 before dropping nearly as quickly the next year. Since then, values have stayed relatively flat.
At $81,107 in 2025, the town’s average home value reflects a market that’s neither surging nor sliding significantly. Its stability may appeal to residents seeking predictable costs and access to both nature and nearby job centers in the Jackson metro area.
16. Louise – 32% Home Price Increase Since 2016

- 2010: N/A
- 2011: N/A
- 2012: N/A
- 2013: N/A
- 2014: N/A
- 2015: N/A
- 2016: $61,209
- 2017: $62,173 (+$964, +1.57% from previous year)
- 2018: $64,658 (+$2,485, +4.00% from previous year)
- 2019: $62,744 (-$1,913, -2.96% from previous year)
- 2020: N/A
- 2021: $74,543
- 2022: $80,422 (+$5,879, +7.89% from previous year)
- 2023: $76,228 (-$4,193, -5.21% from previous year)
- 2024: $79,397 (+$3,169, +4.16% from previous year)
- 2025: $80,892 (+$1,496, +1.88% from previous year)
From 2016 to 2025, Louise’s home values have climbed from $61,209 to $80,892—an increase of 32%. The market saw its most consistent growth between 2016 and 2022, with some minor corrections afterward.
Louise – Gradual Growth with Steady Demand
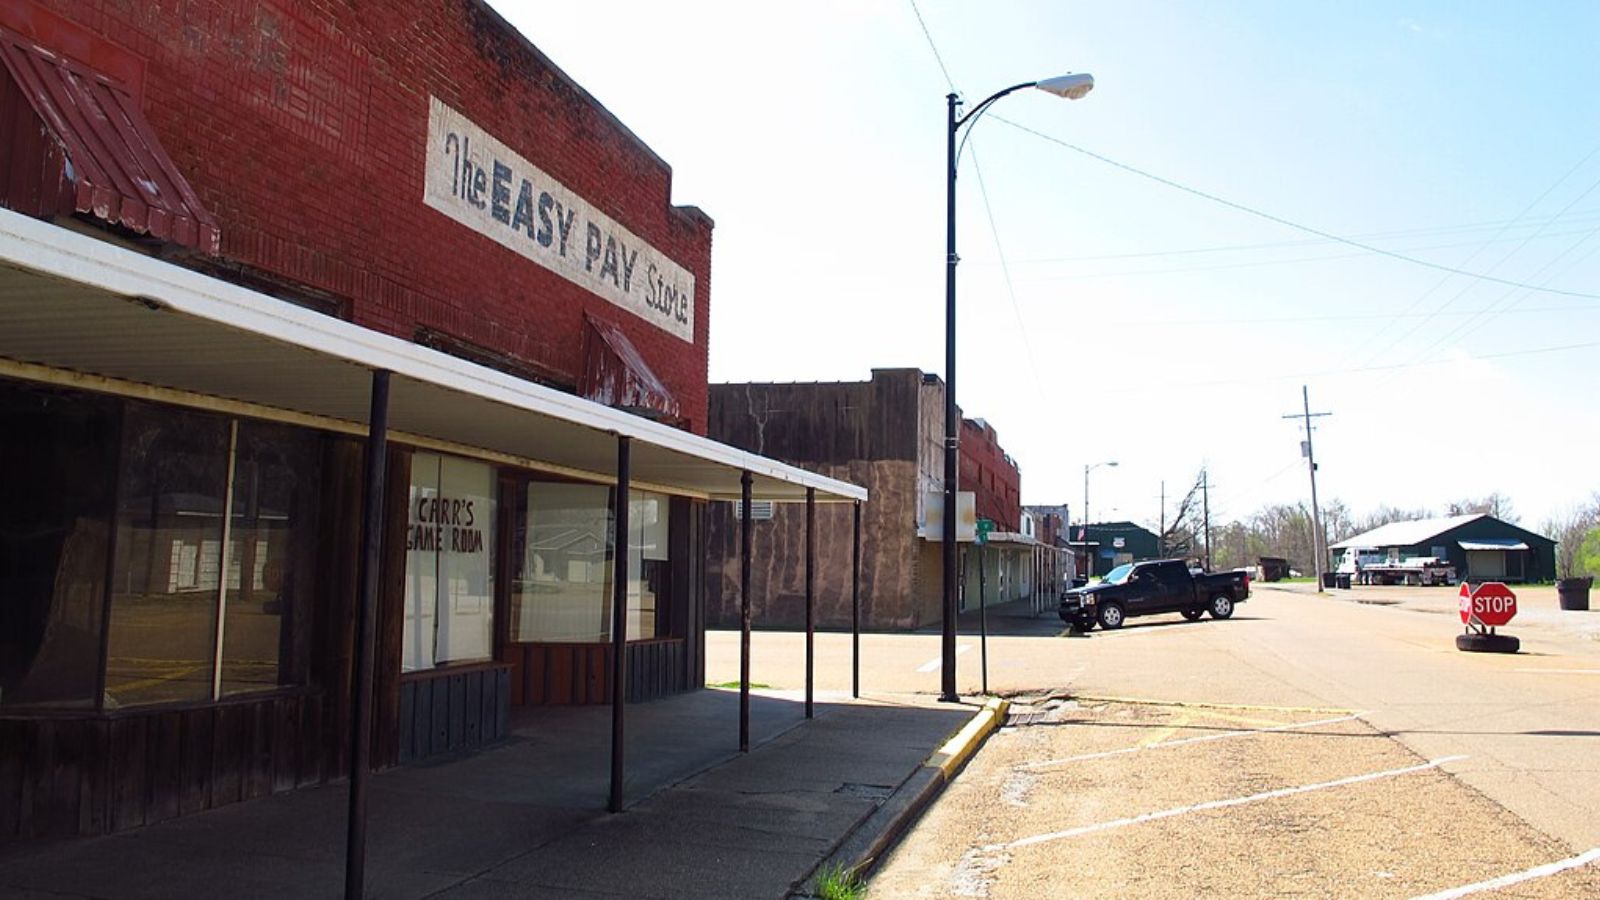
Louise, a rural town in Humphreys County, has maintained a low but stable profile in Mississippi’s real estate picture. Despite its small population, the town’s home prices have posted reliable growth over the years. Louise’s largest jump came in 2021, in line with broader post-pandemic price escalations seen across the state.
Though there was a brief downturn in 2023, prices rebounded in the following two years. With a 2025 average home value just under $81,000, Louise is a case study in small-town Mississippi stability—quiet, consistent, and relatively resilient to market volatility.
15. Jackson – 34% Home Price Increase Since 2010
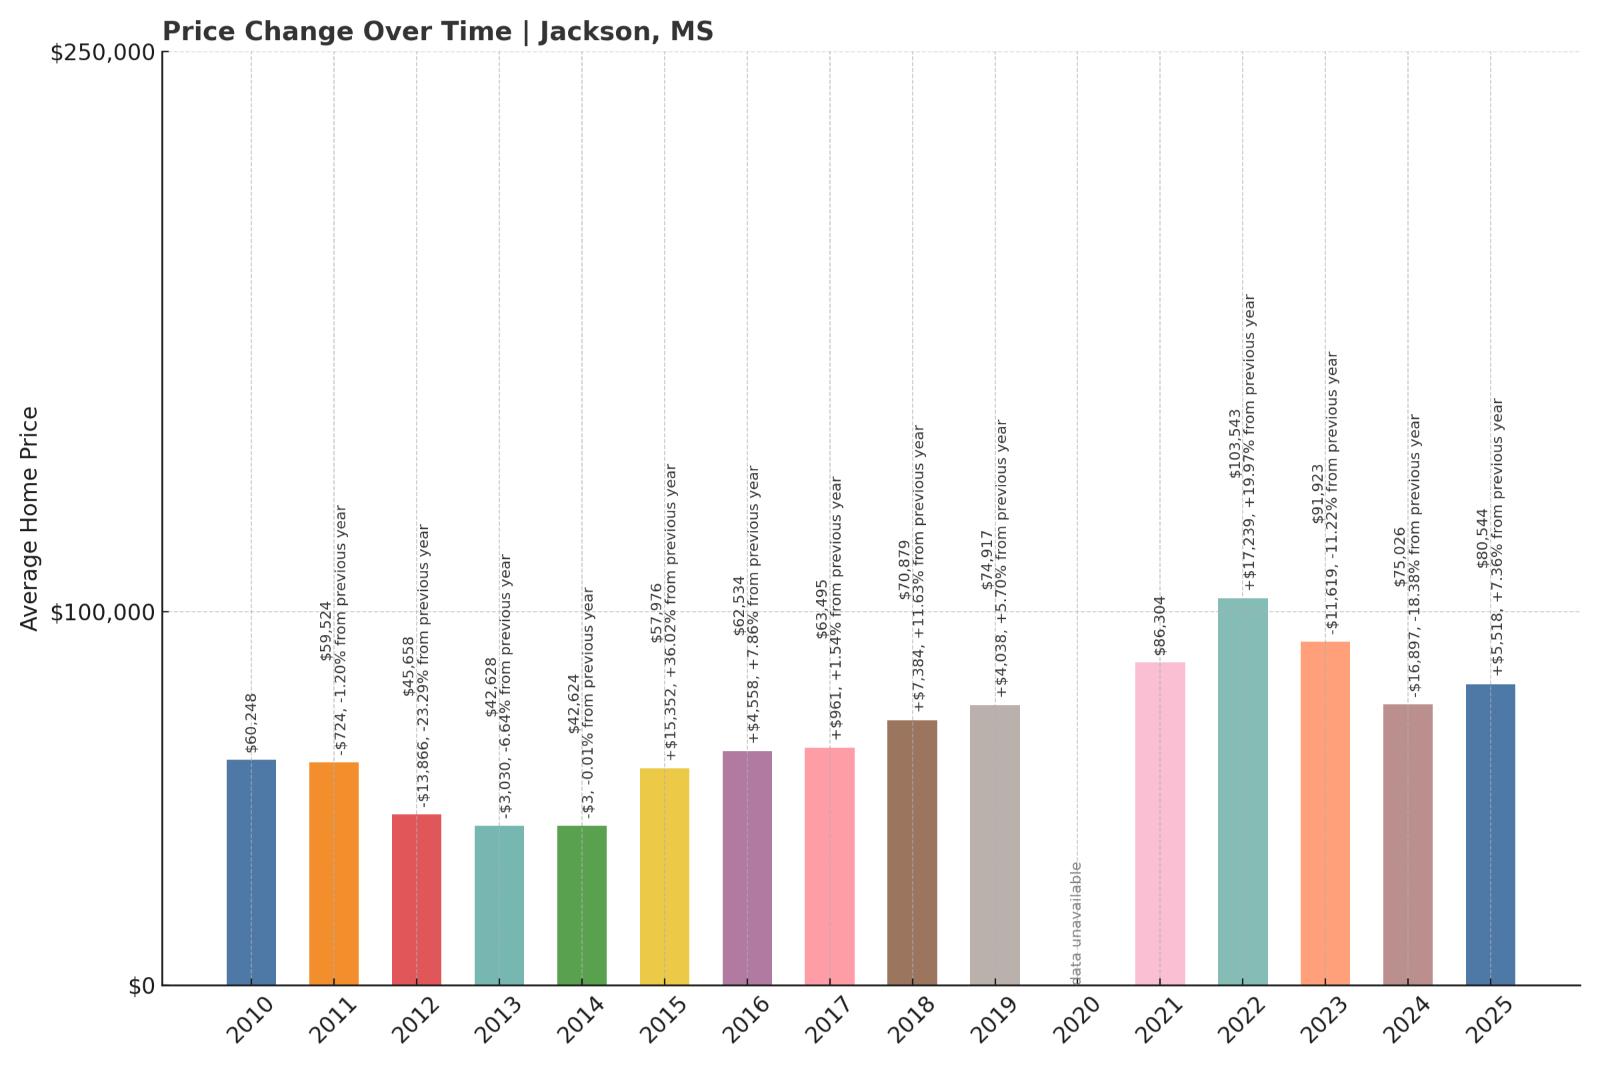
- 2010: $60,248
- 2011: $59,524 (-$724, -1.20% from previous year)
- 2012: $45,658 (-$13,866, -23.29% from previous year)
- 2013: $42,628 (-$3,030, -6.64% from previous year)
- 2014: $42,624 (-$3, -0.01% from previous year)
- 2015: $57,976 (+$15,352, +36.02% from previous year)
- 2016: $62,534 (+$4,558, +7.86% from previous year)
- 2017: $63,495 (+$961, +1.54% from previous year)
- 2018: $70,879 (+$7,384, +11.63% from previous year)
- 2019: $74,917 (+$4,038, +5.70% from previous year)
- 2020: N/A
- 2021: $86,304
- 2022: $103,543 (+$17,239, +19.97% from previous year)
- 2023: $91,923 (-$11,619, -11.22% from previous year)
- 2024: $75,026 (-$16,897, -18.38% from previous year)
- 2025: $80,544 (+$5,518, +7.36% from previous year)
Home values in Jackson rose from $60,248 in 2010 to $80,544 in 2025—a 34% gain. The market took a steep dive from 2011 to 2014, but rebounded sharply by 2015 and kept climbing until peaking in 2022. The last few years saw significant corrections, though 2025 showed some recovery.
Jackson – Big Swings in the Capital City Market
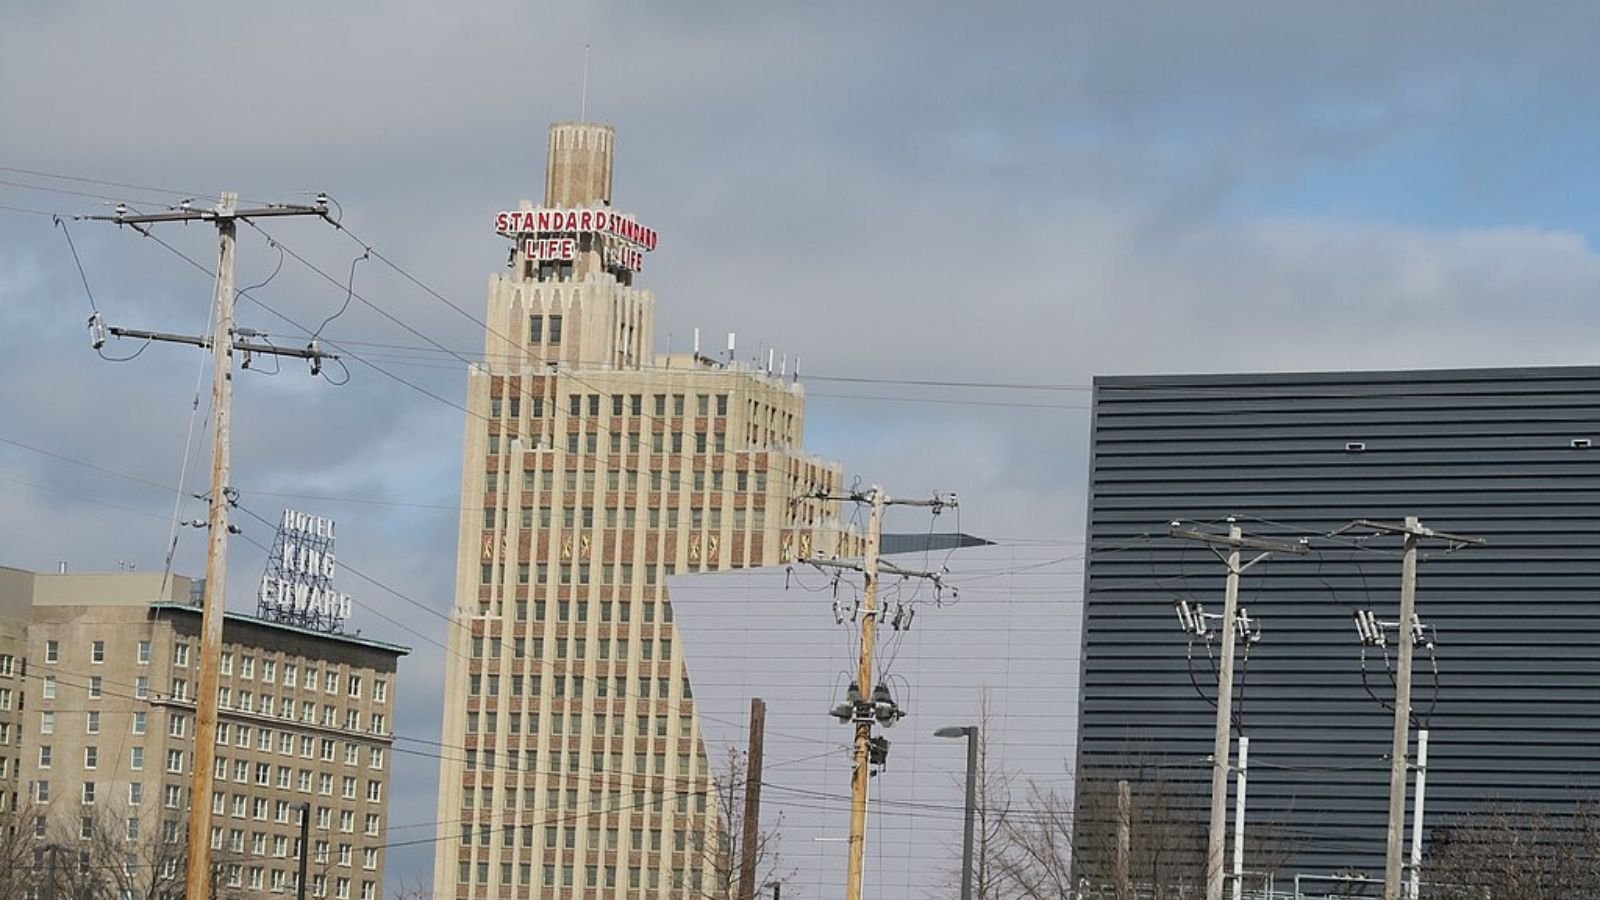
As the capital and largest city in Mississippi, Jackson has a complex housing market influenced by politics, education, and economic transitions. Home prices fell sharply after 2010 but surged again in the late 2010s, especially during the pandemic-fueled housing boom. The city reached a peak in 2022 before dropping nearly 28% across the next two years.
In 2025, Jackson’s average home price is around $80,000. That’s still a gain over the decade, but well below its 2022 high. Jackson’s urban status gives it more volatility than rural towns, with higher peaks and deeper troughs. Factors like aging infrastructure and population shifts have likely played a role in the recent price instability.
14. Goodman – 42% Home Price Increase Since 2021
- 2010: N/A
- 2011: N/A
- 2012: N/A
- 2013: N/A
- 2014: N/A
- 2015: N/A
- 2016: N/A
- 2017: N/A
- 2018: N/A
- 2019: N/A
- 2020: N/A
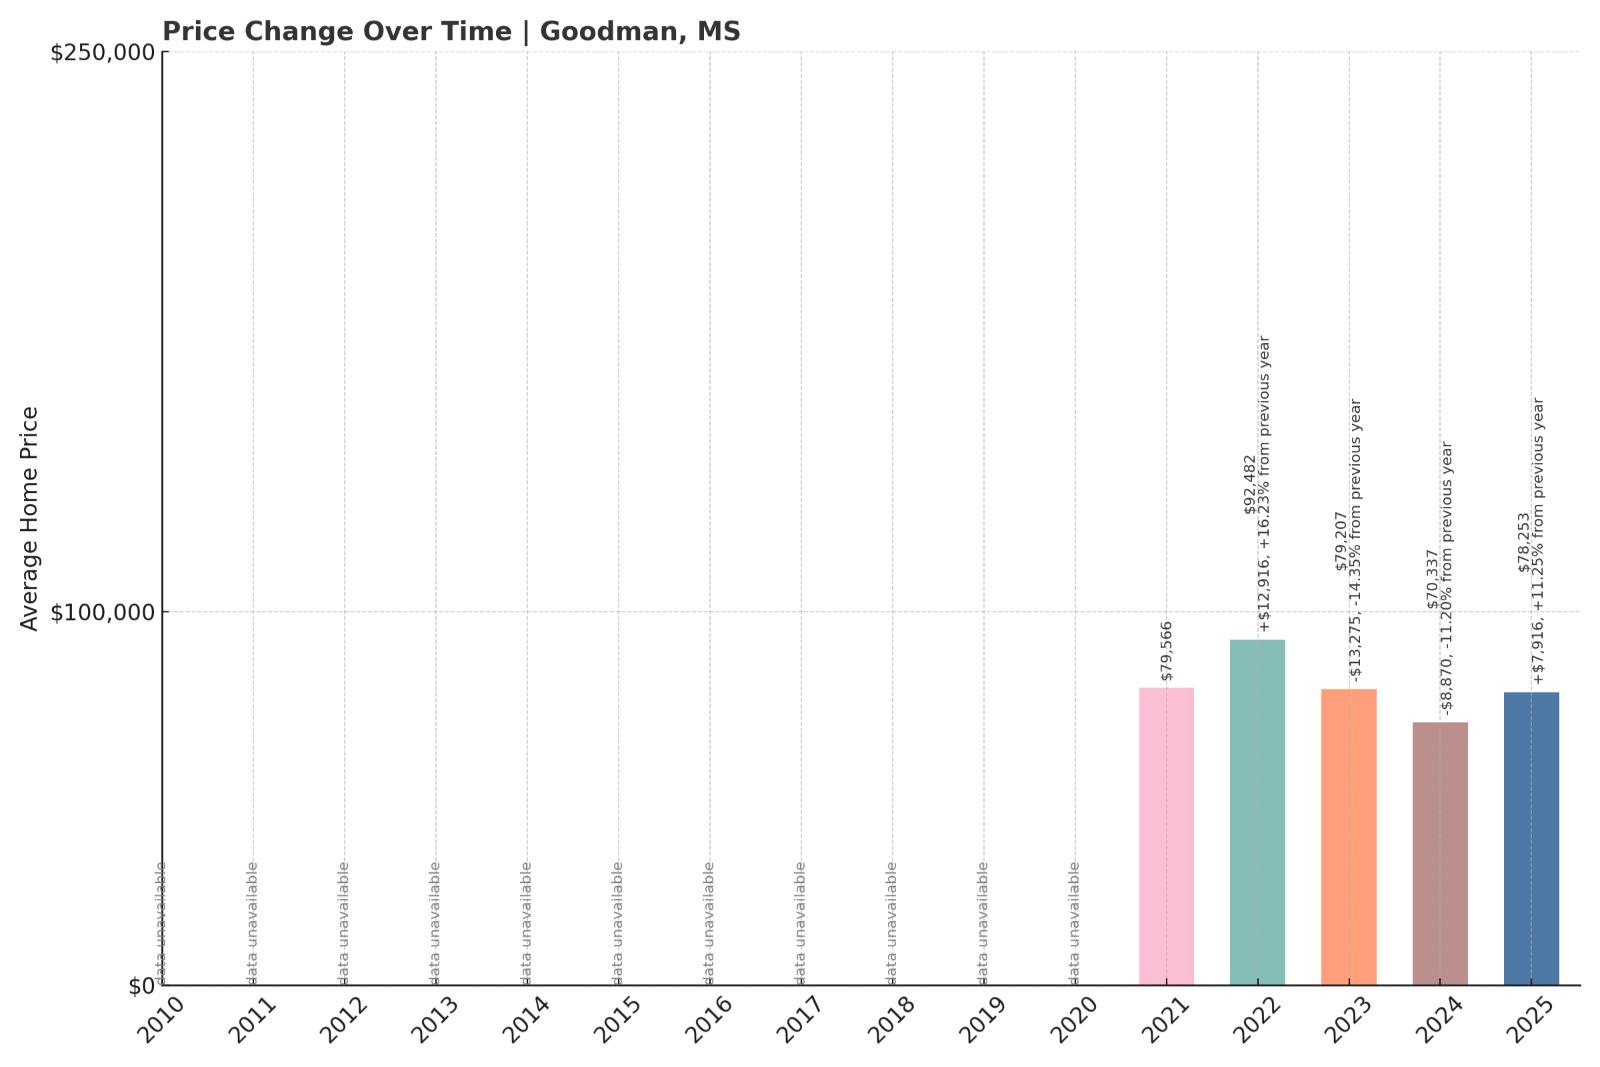
- 2021: $79,566
- 2022: $92,482 (+$12,916, +16.23% from previous year)
- 2023: $79,207 (-$13,275, -14.35% from previous year)
- 2024: $70,337 (-$8,870, -11.20% from previous year)
- 2025: $78,253 (+$7,916, +11.25% from previous year)
Goodman’s home values have increased from $79,566 in 2021 to $78,253 in 2025, with some ups and downs in between. The biggest jump came in 2022, but subsequent years saw two rounds of decline before a healthy rebound in 2025.
Goodman – A Short-Term Rollercoaster
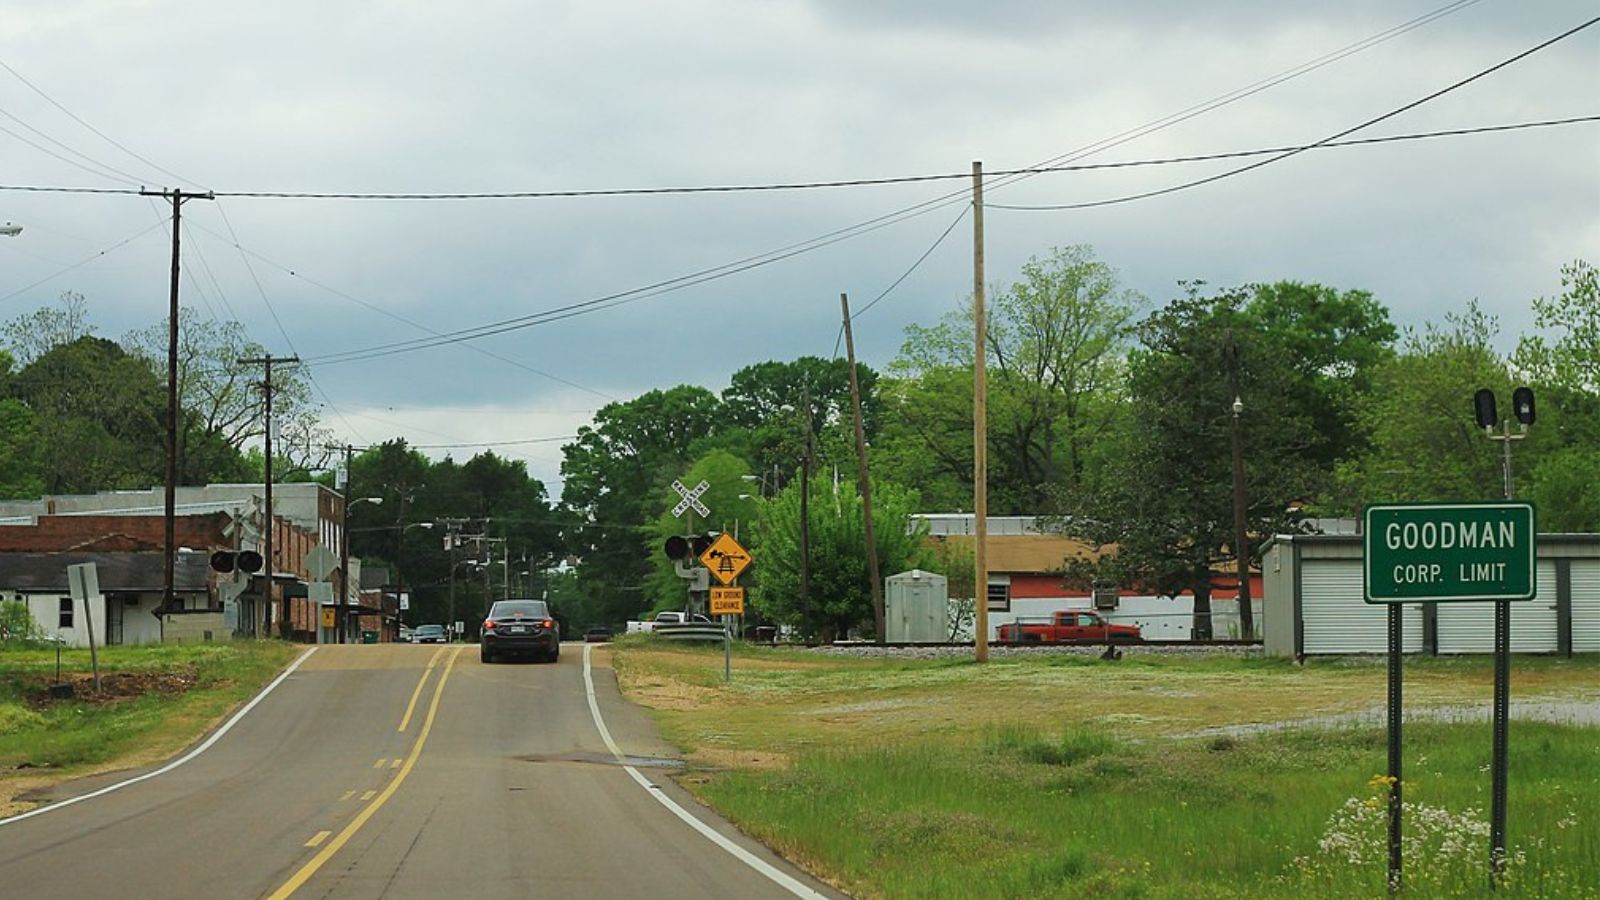
Located in Holmes County, Goodman is a small town best known as the home of Holmes Community College. Its housing market has gone through noticeable turbulence over just a few years. A surge in 2022 was followed by significant losses in 2023 and 2024, likely reflecting volatility in demand or investor shifts.
Despite the drops, 2025 brought an 11% year-over-year increase, lifting average home values back near their 2021 level. The market’s quick turns may appeal to opportunistic buyers or investors, but residents may see the fluctuation as a sign of uncertainty in long-term value retention.
13. Tutwiler – -1.1% Home Price Decline Since 2021

- 2010: N/A
- 2011: N/A
- 2012: N/A
- 2013: N/A
- 2014: N/A
- 2015: N/A
- 2016: N/A
- 2017: N/A
- 2018: N/A
- 2019: N/A
- 2020: N/A
- 2021: $78,514
- 2022: $88,185 (+$9,672, +12.32% from previous year)
- 2023: $76,246 (-$11,939, -13.54% from previous year)
- 2024: $67,223 (-$9,023, -11.83% from previous year)
- 2025: $77,647 (+$10,424, +15.51% from previous year)
From 2021 to 2025, home values in Tutwiler fell slightly overall, dropping by just over 1%. Prices peaked in 2022 before back-to-back double-digit drops, but a strong bounce in 2025 brought values close to their earlier levels.
Tutwiler – Rebounding After Two Rough Years

Thomas R Machnitzki (thomas@machnitzki.com), CC BY 3.0, via Wikimedia Commons
Tutwiler is a small town in Tallahatchie County with deep cultural roots in Delta blues history. Its housing market saw a sharp increase in 2022, typical of many towns during the pandemic boom. However, steep losses in the next two years nearly erased that gain before a 15.5% rebound in 2025 lifted prices back above $77,000.
While the net change since 2021 is slightly negative, the strong growth in the latest year may suggest renewed interest or recovery in the local market. Like many Delta towns, Tutwiler’s small size makes its real estate prices more sensitive to local economic changes.
12. Sunflower – 7.5% Home Price Increase Since 2024
- 2010: N/A
- 2011: N/A
- 2012: N/A
- 2013: N/A
- 2014: N/A
- 2015: N/A
- 2016: N/A
- 2017: N/A
- 2018: N/A
- 2019: N/A
- 2020: N/A
- 2021: N/A
- 2022: N/A
- 2023: N/A
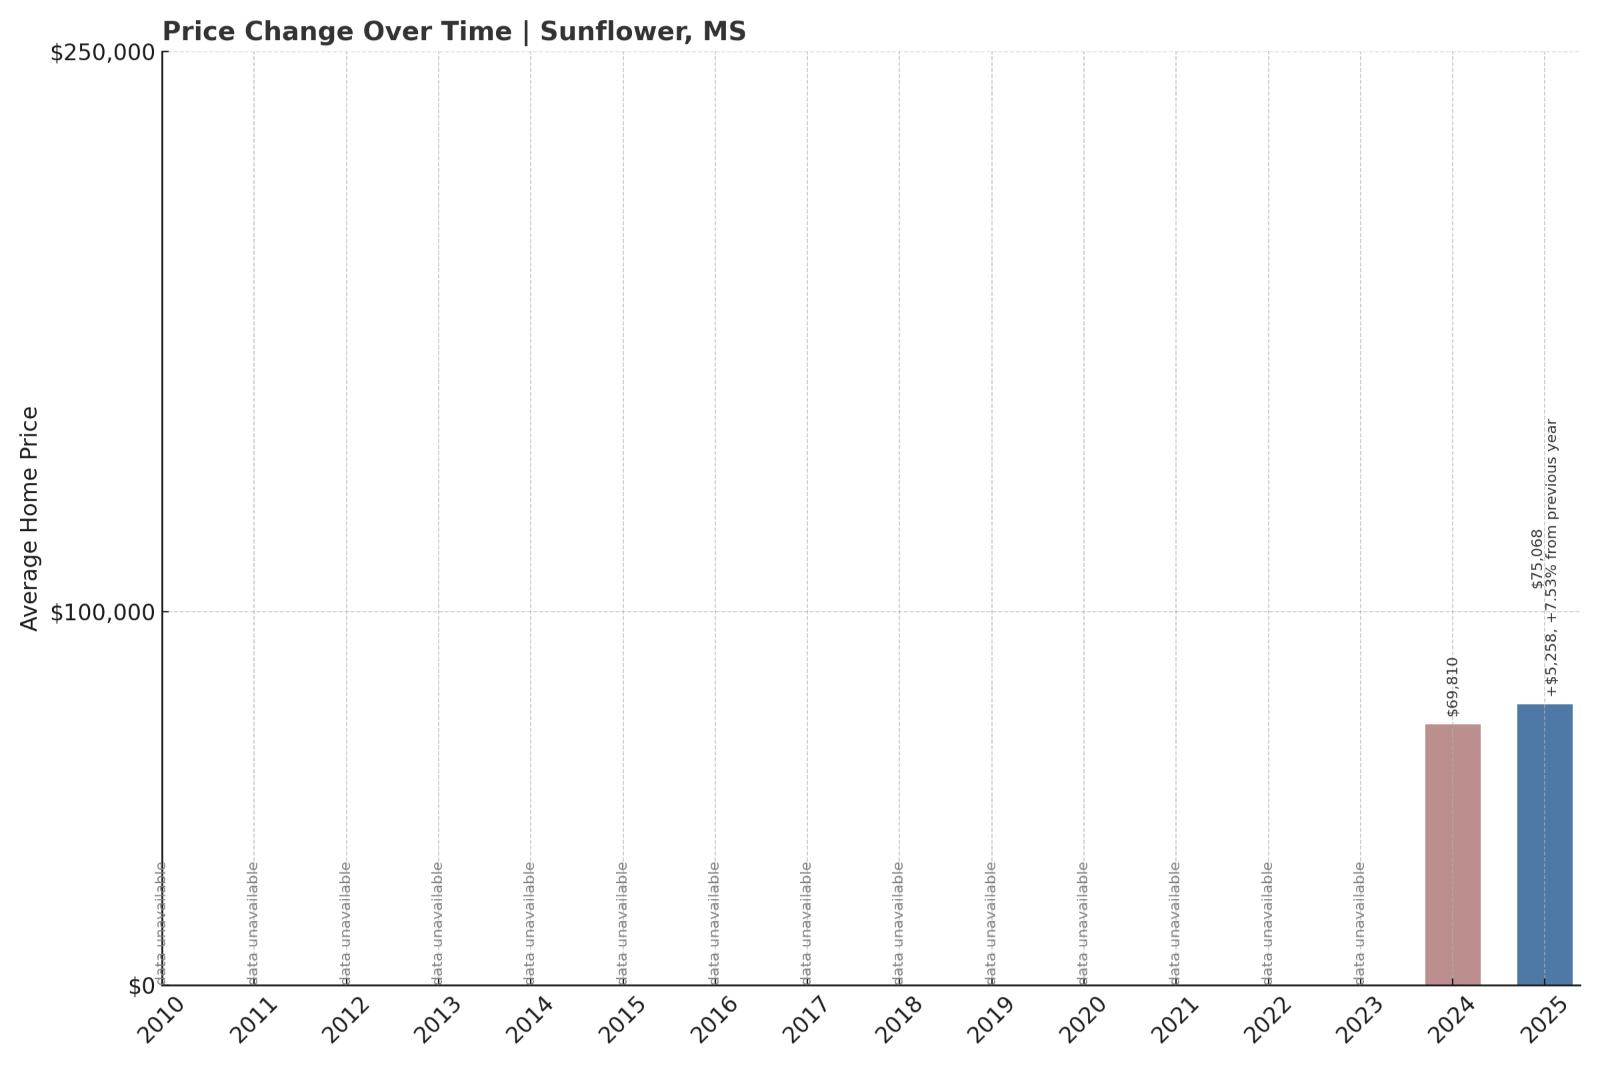
- 2024: $69,810
- 2025: $75,068 (+$5,258, +7.53% from previous year)
With data available only from 2024 onward, Sunflower’s home values increased by 7.5% in a single year, moving from $69,810 to $75,068. That makes it one of the few towns in Mississippi with recent price momentum.
Sunflower – A Promising Start to Price Growth

Sunflower, a Delta town in Sunflower County, has limited recent home price data available, but what’s there points to a healthy upward trend. In just one year, the town added over $5,000 in value to its average home. That kind of short-term gain stands out in a region where many towns have seen stagnation or decline.
Whether this growth continues remains to be seen, but it could reflect renewed buyer interest in affordable Delta communities. Its modest pricing and regional ties to agriculture and education may provide a stable foundation for future increases.
11. Hollandale – -35% Home Price Decline Since 2021
Would you like to save this?
- 2010: N/A
- 2011: N/A
- 2012: N/A
- 2013: N/A
- 2014: N/A
- 2015: N/A
- 2016: N/A
- 2017: N/A
- 2018: N/A
- 2019: N/A
- 2020: N/A
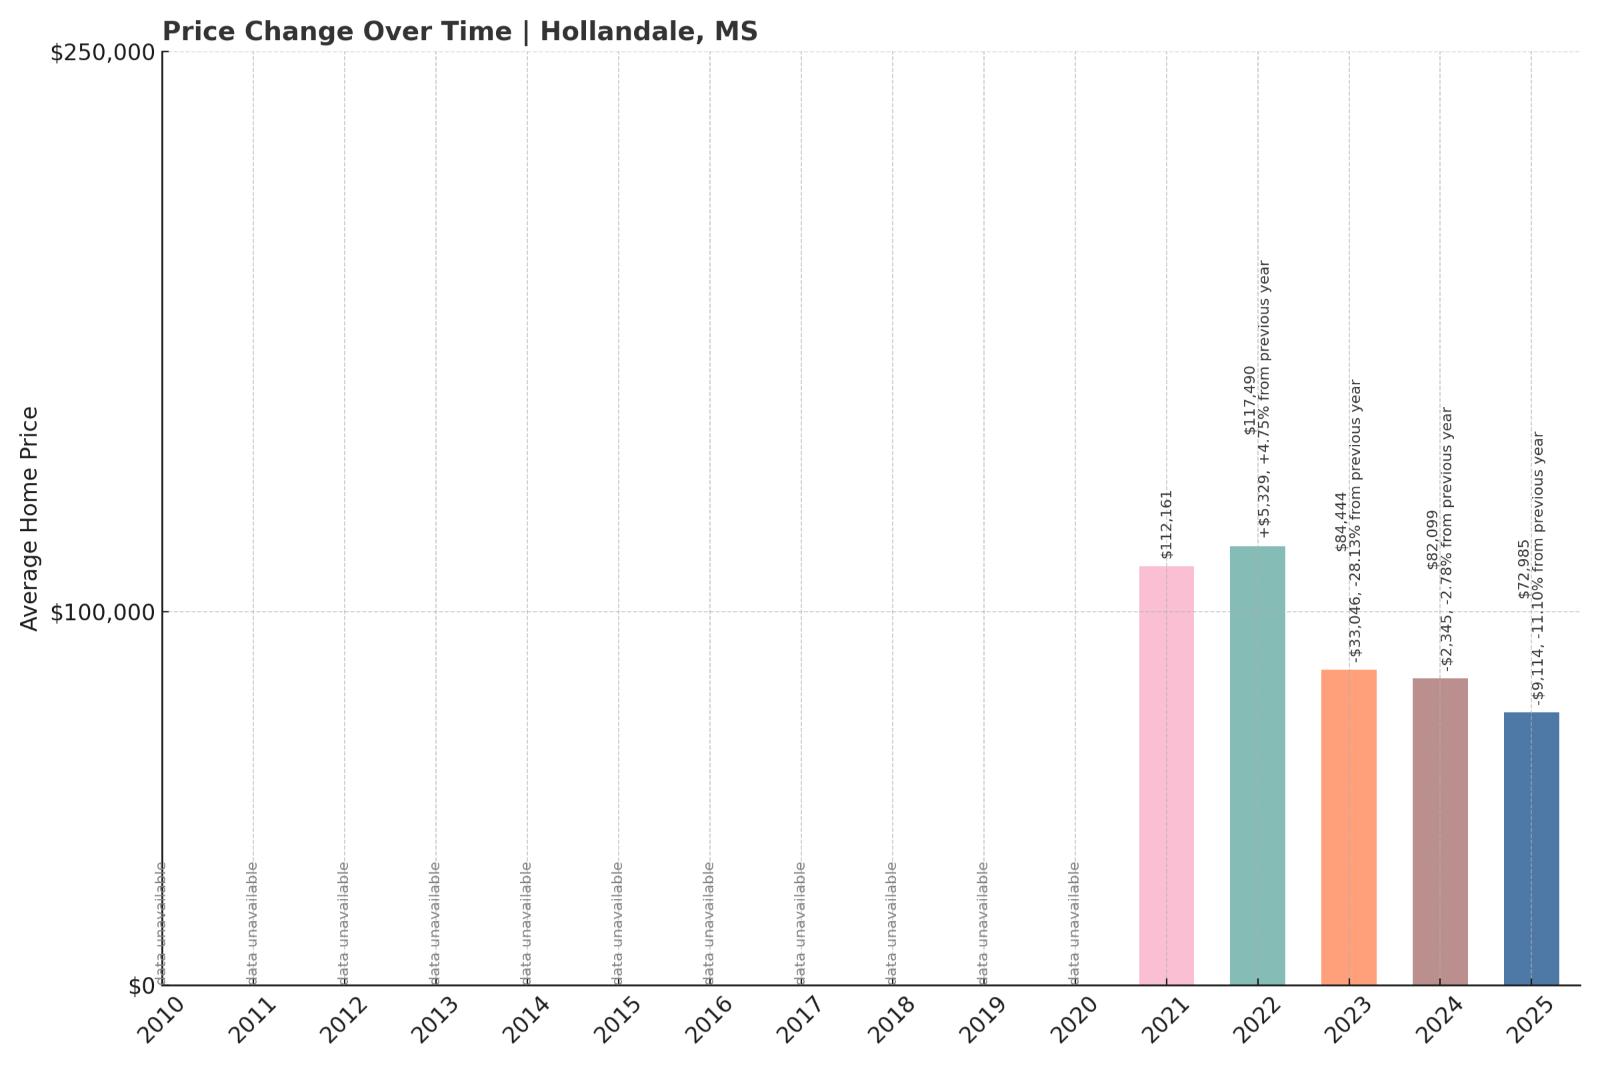
- 2021: $112,161
- 2022: $117,490 (+$5,329, +4.75% from previous year)
- 2023: $84,444 (-$33,046, -28.13% from previous year)
- 2024: $82,099 (-$2,345, -2.78% from previous year)
- 2025: $72,985 (-$9,114, -11.10% from previous year)
Since 2021, Hollandale home prices have dropped dramatically—from $112,161 to $72,985, a decline of more than 35%. Most of that loss occurred in 2023, when prices plunged by over 28% in a single year.
Hollandale – Sharp Decline After Early Gains

Hollandale is another Delta town that saw early post-pandemic price increases before facing steep corrections. After a peak in 2022, prices in Hollandale tumbled hard in 2023 and continued downward since. By 2025, the town’s average home value had lost over a third of its worth in just four years.
This level of decline is among the most severe in Mississippi. It may reflect economic strain in the region or a reversal of pandemic-era demand. Whether this represents a temporary dip or a longer-term trend will be worth watching in the years ahead.
10. Leland – -34% Home Price Decline Since 2021
- 2010: N/A
- 2011: N/A
- 2012: N/A
- 2013: N/A
- 2014: N/A
- 2015: N/A
- 2016: N/A
- 2017: N/A
- 2018: N/A
- 2019: N/A
- 2020: N/A
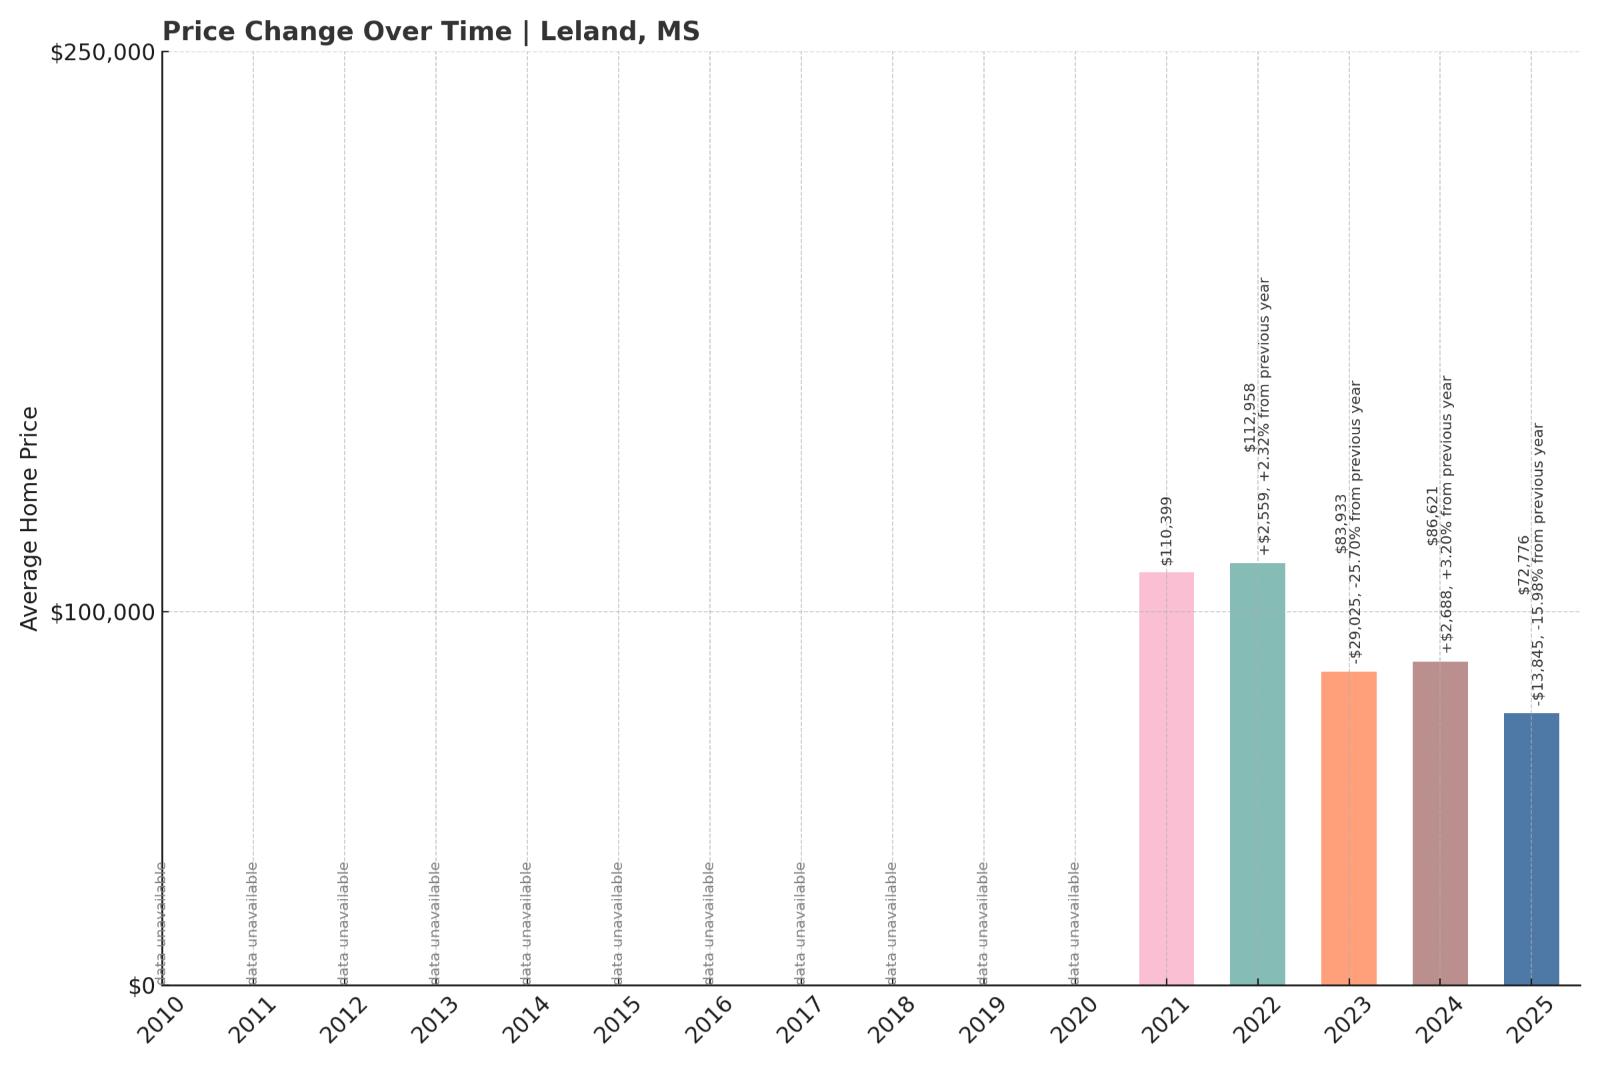
- 2021: $110,399
- 2022: $112,958 (+$2,559, +2.32% from previous year)
- 2023: $83,933 (-$29,025, -25.70% from previous year)
- 2024: $86,621 (+$2,688, +3.20% from previous year)
- 2025: $72,776 (-$13,845, -15.98% from previous year)
Leland’s home values have taken a steep dive since 2021, dropping by 34% from a high of $110,399 to $72,776 in 2025. While the town saw a slight recovery in 2024, prices fell sharply again the following year, erasing most of that gain.
Leland – A Market in Retreat Despite Brief Rebound

Leland is located in Washington County and is known for its strong connections to the blues and the legendary Jim Henson. Its housing market enjoyed a slight increase in 2022 before plunging by more than a quarter in 2023. A modest gain in 2024 offered hope, but the trend reversed again with a nearly 16% drop in 2025.
Now valued at under $73,000 on average, homes in Leland have become markedly more affordable. The overall trend, however, shows a community struggling to maintain the housing momentum seen earlier in the decade. Factors like economic shifts or reduced demand may be contributing to the sharp declines.
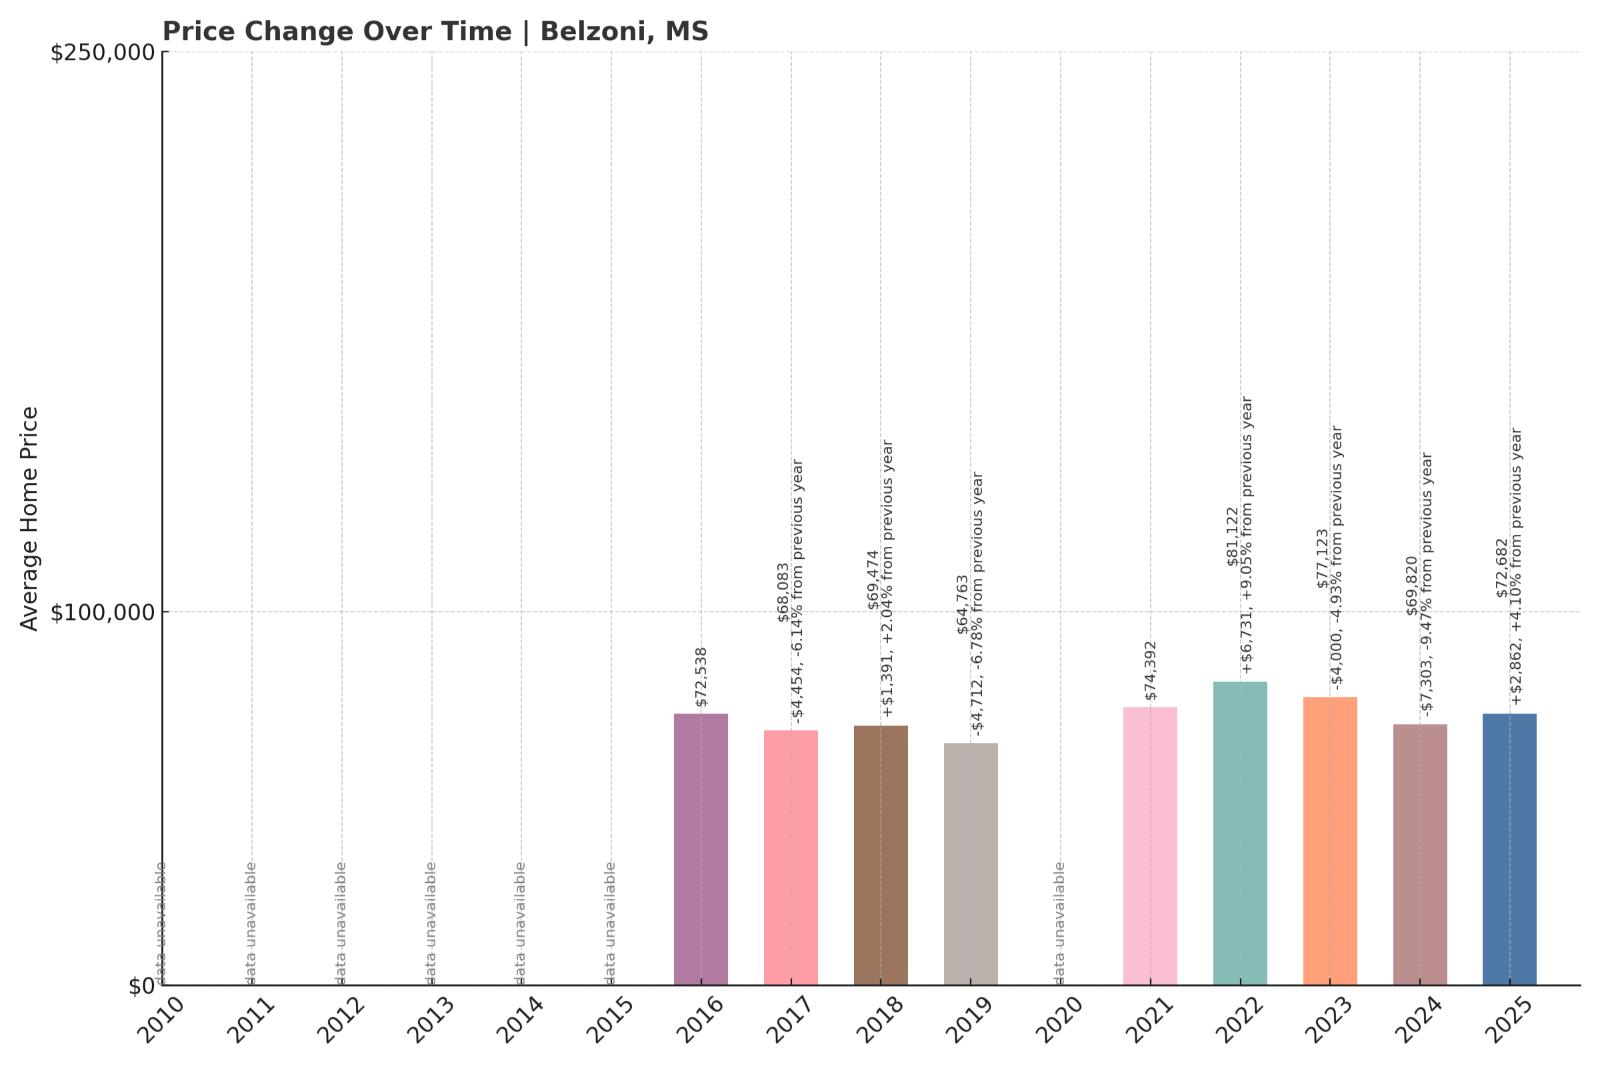
9. Belzoni – 0.2% Home Price Increase Since 2016
- 2010: N/A
- 2011: N/A
- 2012: N/A
- 2013: N/A
- 2014: N/A
- 2015: N/A
- 2016: $72,538
- 2017: $68,083 (-$4,454, -6.14% from previous year)
- 2018: $69,474 (+$1,391, +2.04% from previous year)
- 2019: $64,763 (-$4,712, -6.78% from previous year)
- 2020: N/A
- 2021: $74,392
- 2022: $81,122 (+$6,731, +9.05% from previous year)
- 2023: $77,123 (-$4,000, -4.93% from previous year)
- 2024: $69,820 (-$7,303, -9.47% from previous year)
- 2025: $72,682 (+$2,862, +4.10% from previous year)
Belzoni’s home prices have shown little overall change since 2016, rising just 0.2% from $72,538 to $72,682. The market has bounced up and down over the years, with growth during the pandemic period followed by steep losses, then a modest recovery in 2025.
Belzoni – Holding Steady After Years of Swings
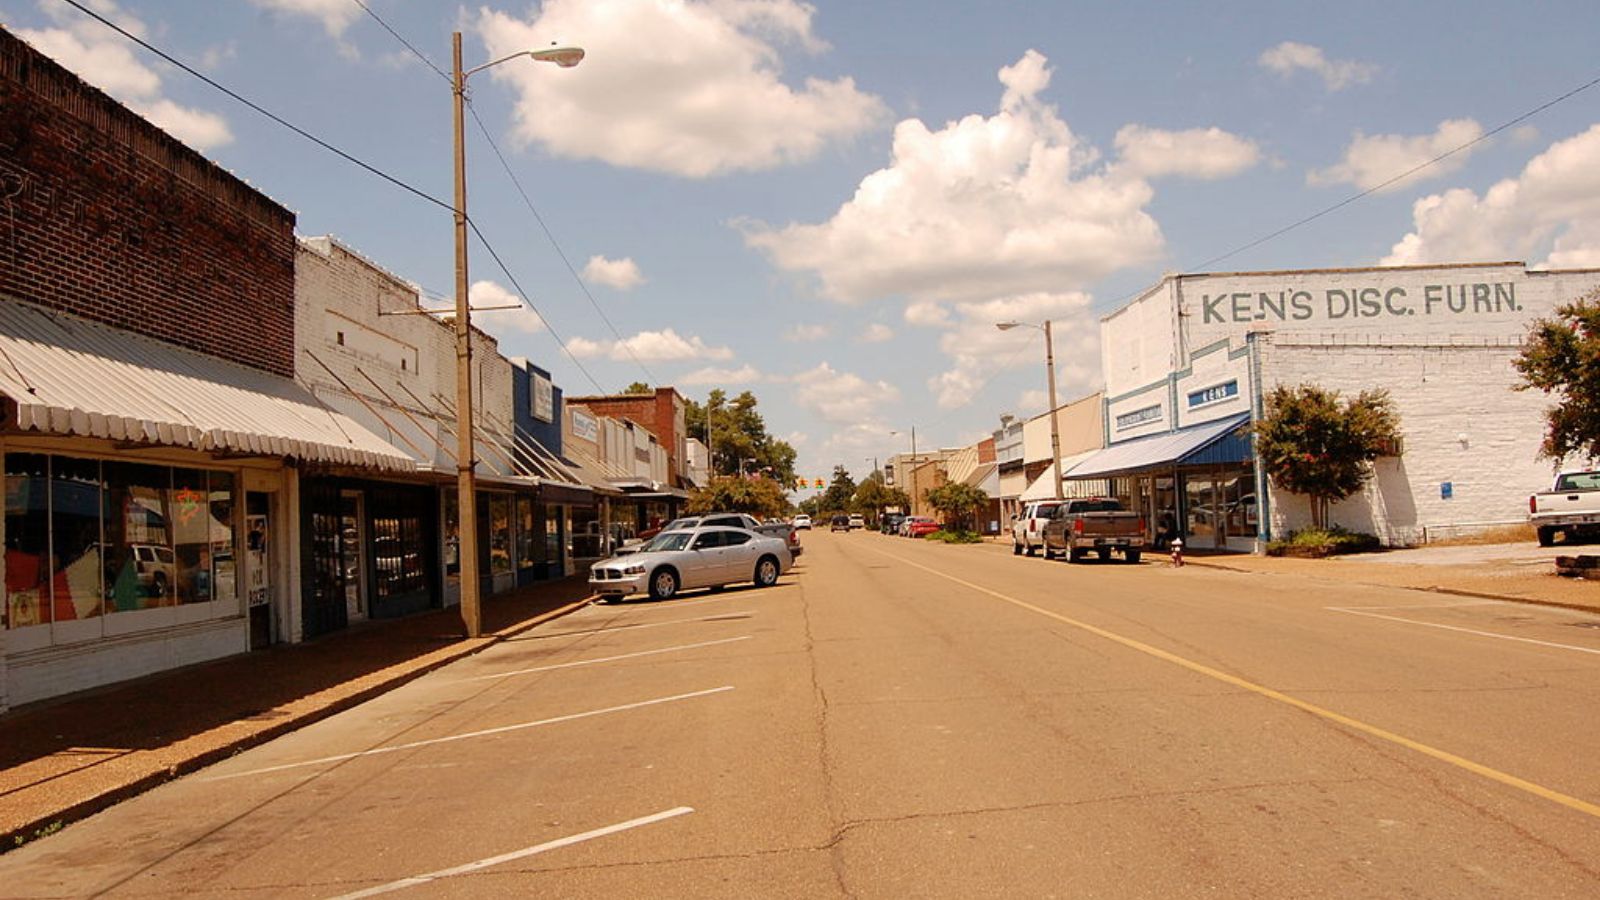
Belzoni, often called the “Catfish Capital of the World,” sits in Humphreys County and serves as a hub for aquaculture and agriculture. Its housing prices reflect a pattern of small gains and occasional drops. A notable boost occurred in 2022, when prices jumped over 9%, but subsequent years saw prices fall back down before a small rebound in 2025.
While Belzoni hasn’t experienced dramatic long-term growth, it also hasn’t collapsed. Current prices are essentially flat compared to nine years ago. That kind of slow but stable behavior is typical of many rural Delta towns, where markets move at a different pace than urban areas.
8. Yazoo City – 7.2% Home Price Increase Since 2011

- 2010: N/A
- 2011: $67,143
- 2012: $64,050 (-$3,093, -4.61% from previous year)
- 2013: $62,963 (-$1,086, -1.70% from previous year)
- 2014: $69,132 (+$6,168, +9.80% from previous year)
- 2015: $74,104 (+$4,972, +7.19% from previous year)
- 2016: $82,027 (+$7,923, +10.69% from previous year)
- 2017: $76,936 (-$5,091, -6.21% from previous year)
- 2018: $71,592 (-$5,344, -6.95% from previous year)
- 2019: $82,778 (+$11,186, +15.62% from previous year)
- 2020: N/A
- 2021: $68,592
- 2022: $77,650 (+$9,058, +13.20% from previous year)
- 2023: $63,970 (-$13,680, -17.62% from previous year)
- 2024: $67,327 (+$3,357, +5.25% from previous year)
- 2025: $71,942 (+$4,615, +6.85% from previous year)
Since 2011, home prices in Yazoo City have gone up by 7.2%, from $67,143 to $71,942 in 2025. That growth, while modest, reflects a turbulent path with steep declines and sharp gains over the years.
Yazoo City – Long-Term Growth Despite Big Dips
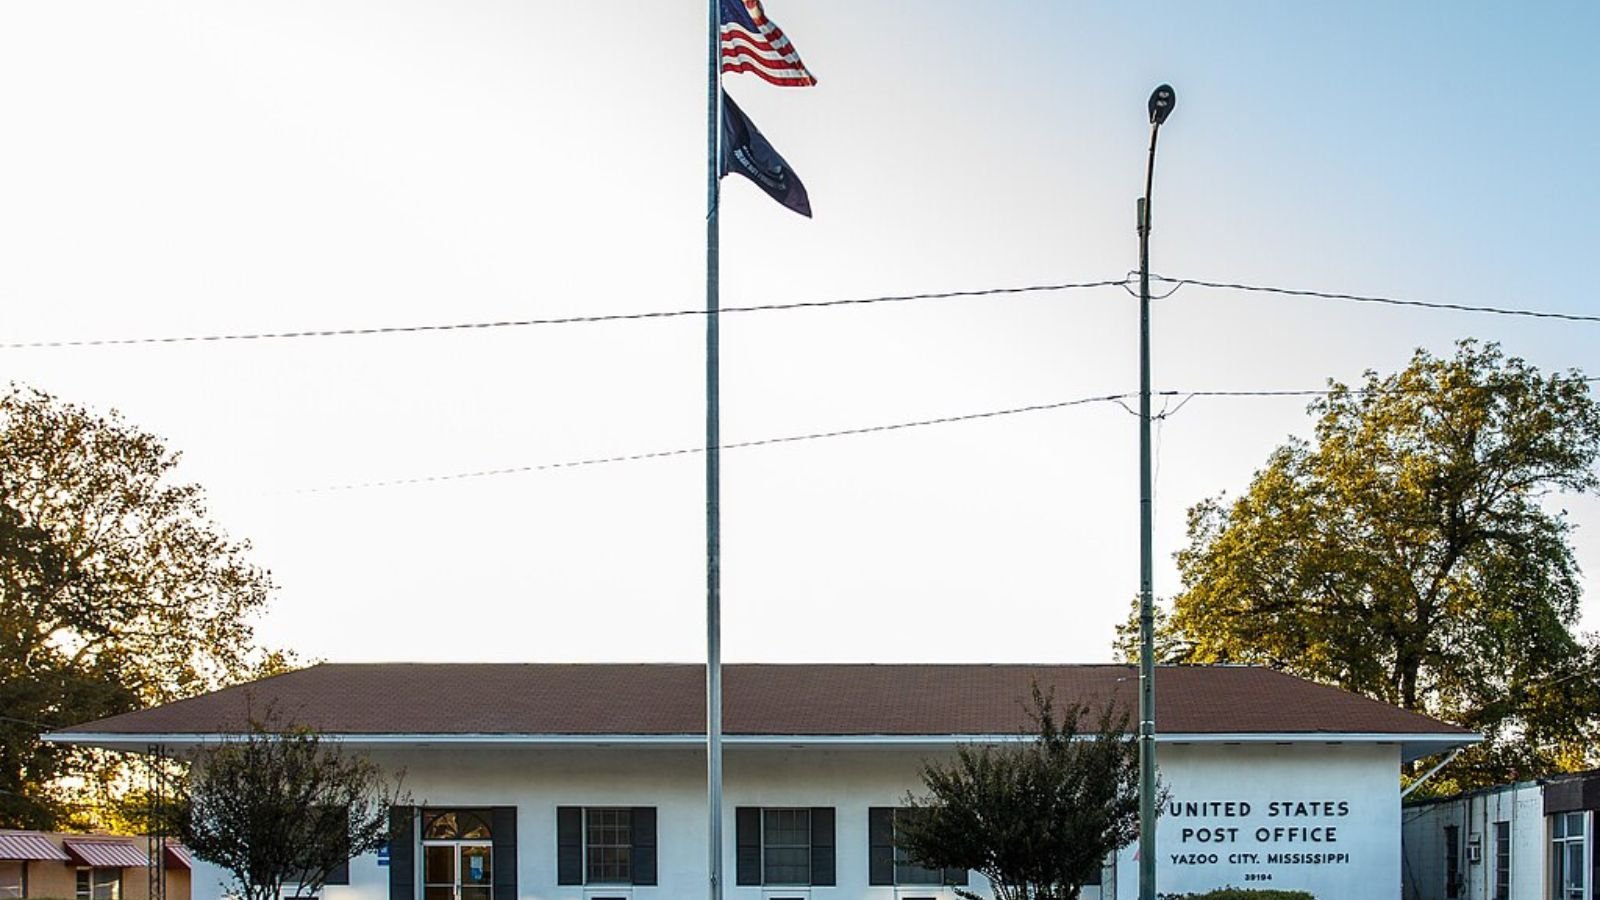
Yazoo City lies at the edge of the Mississippi Delta and is known for its history, antebellum architecture, and colorful folklore. Home values have been anything but steady. The mid-2010s saw strong appreciation, followed by notable losses in the late 2010s and a sharp drop in 2023. However, the last two years have brought healthy gains, bringing values close to their earlier highs.
At just under $72,000 in 2025, Yazoo City’s housing market may appeal to buyers seeking affordability with some potential for future upside. The volatility, though, suggests the town’s market is sensitive to regional shifts and broader economic pressures.
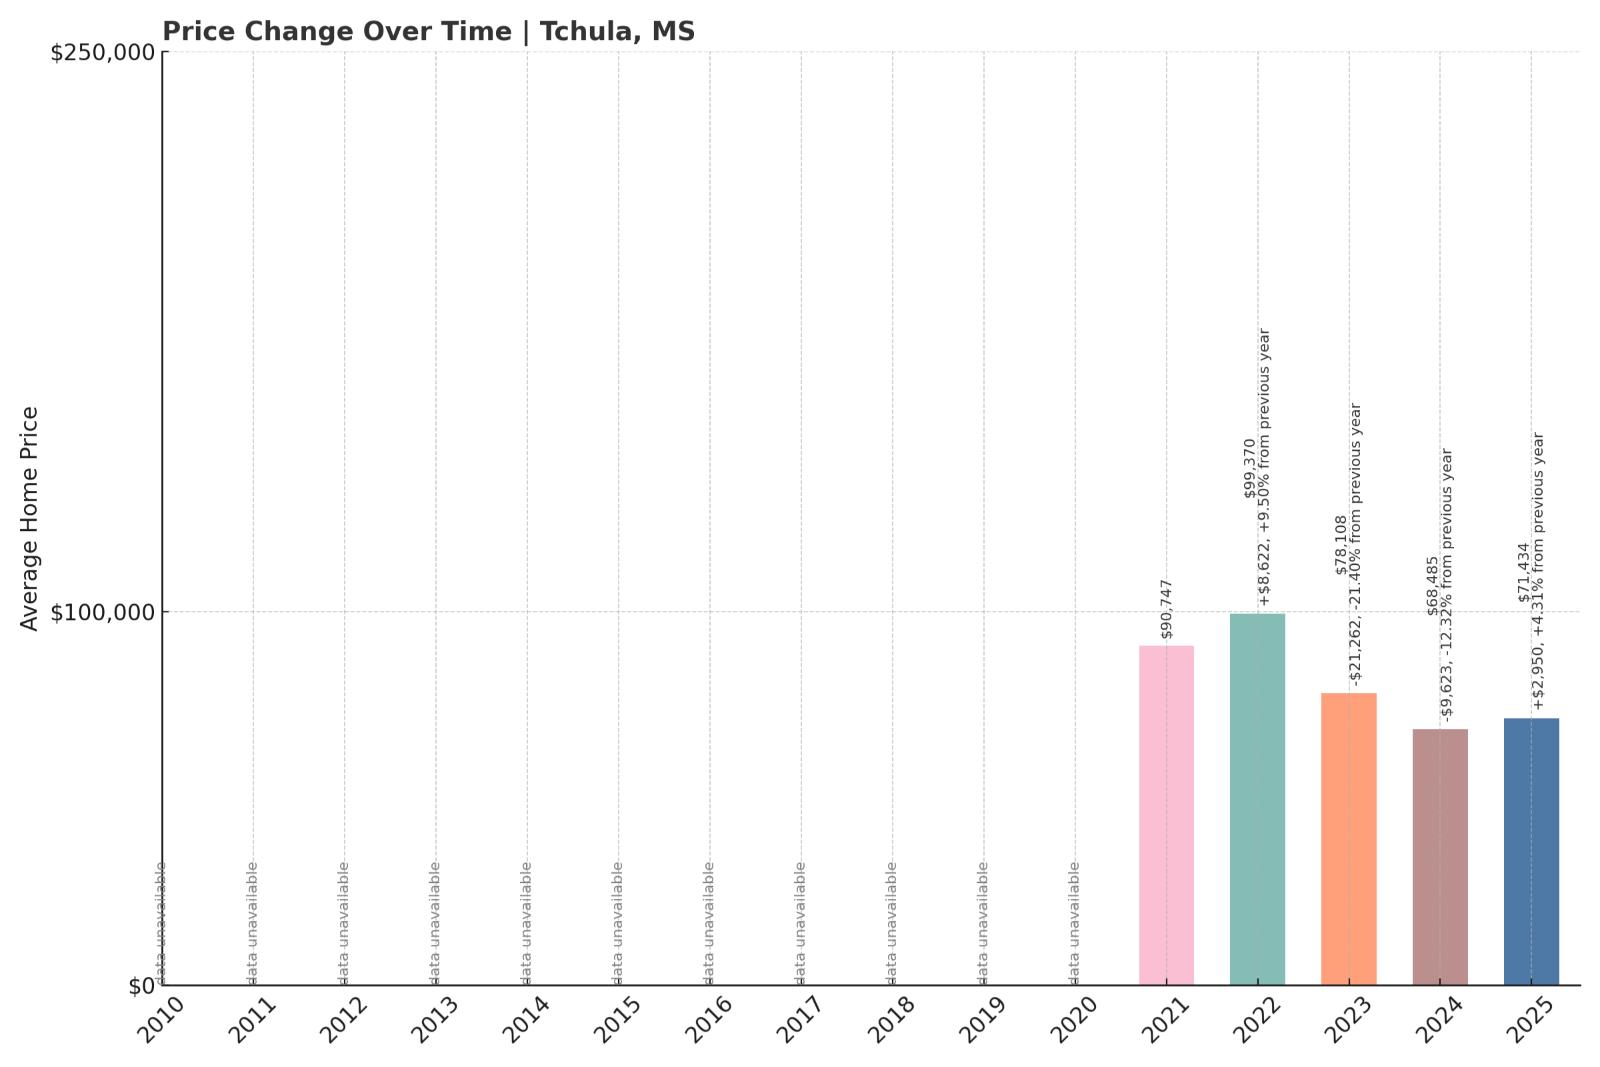
7. Tchula – -21% Home Price Decline Since 2021
- 2010: N/A
- 2011: N/A
- 2012: N/A
- 2013: N/A
- 2014: N/A
- 2015: N/A
- 2016: N/A
- 2017: N/A
- 2018: N/A
- 2019: N/A
- 2020: N/A
- 2021: $90,747
- 2022: $99,370 (+$8,622, +9.50% from previous year)
- 2023: $78,108 (-$21,262, -21.40% from previous year)
- 2024: $68,485 (-$9,623, -12.32% from previous year)
- 2025: $71,434 (+$2,950, +4.31% from previous year)
Since 2021, home values in Tchula have fallen by 21%, dropping from $90,747 to $71,434. After reaching a high in 2022, prices plunged for two years straight before a modest recovery in 2025.
Tchula – Steep Drop After Short-Lived Peak

Tchula is a small town in Holmes County, surrounded by agricultural land and deeply rooted in Delta farming history. Home prices surged in 2022 to nearly $100,000 before experiencing one of the sharpest two-year declines in the region. The 2025 value of $71,434 is a significant drop from that high but shows a small sign of stabilization.
While its market has cooled considerably, Tchula’s extremely low prices may attract bargain hunters or long-term investors looking for entry-level opportunities. The town’s future housing outlook will likely depend on shifts in employment and local infrastructure investment.
6. Drew – -2.7% Home Price Decline Since 2024

- 2010: N/A
- 2011: N/A
- 2012: N/A
- 2013: N/A
- 2014: N/A
- 2015: N/A
- 2016: N/A
- 2017: N/A
- 2018: N/A
- 2019: N/A
- 2020: N/A
- 2021: N/A
- 2022: N/A
- 2023: N/A
- 2024: $69,468
- 2025: $67,624 (-$1,844, -2.66% from previous year)
Drew’s home prices dipped slightly from $69,468 in 2024 to $67,624 in 2025, a decline of 2.7%. With no earlier data, it’s hard to determine long-term trends, but this recent downturn may signal early market weakness.
Drew – A New Entry Showing Early Signs of Decline
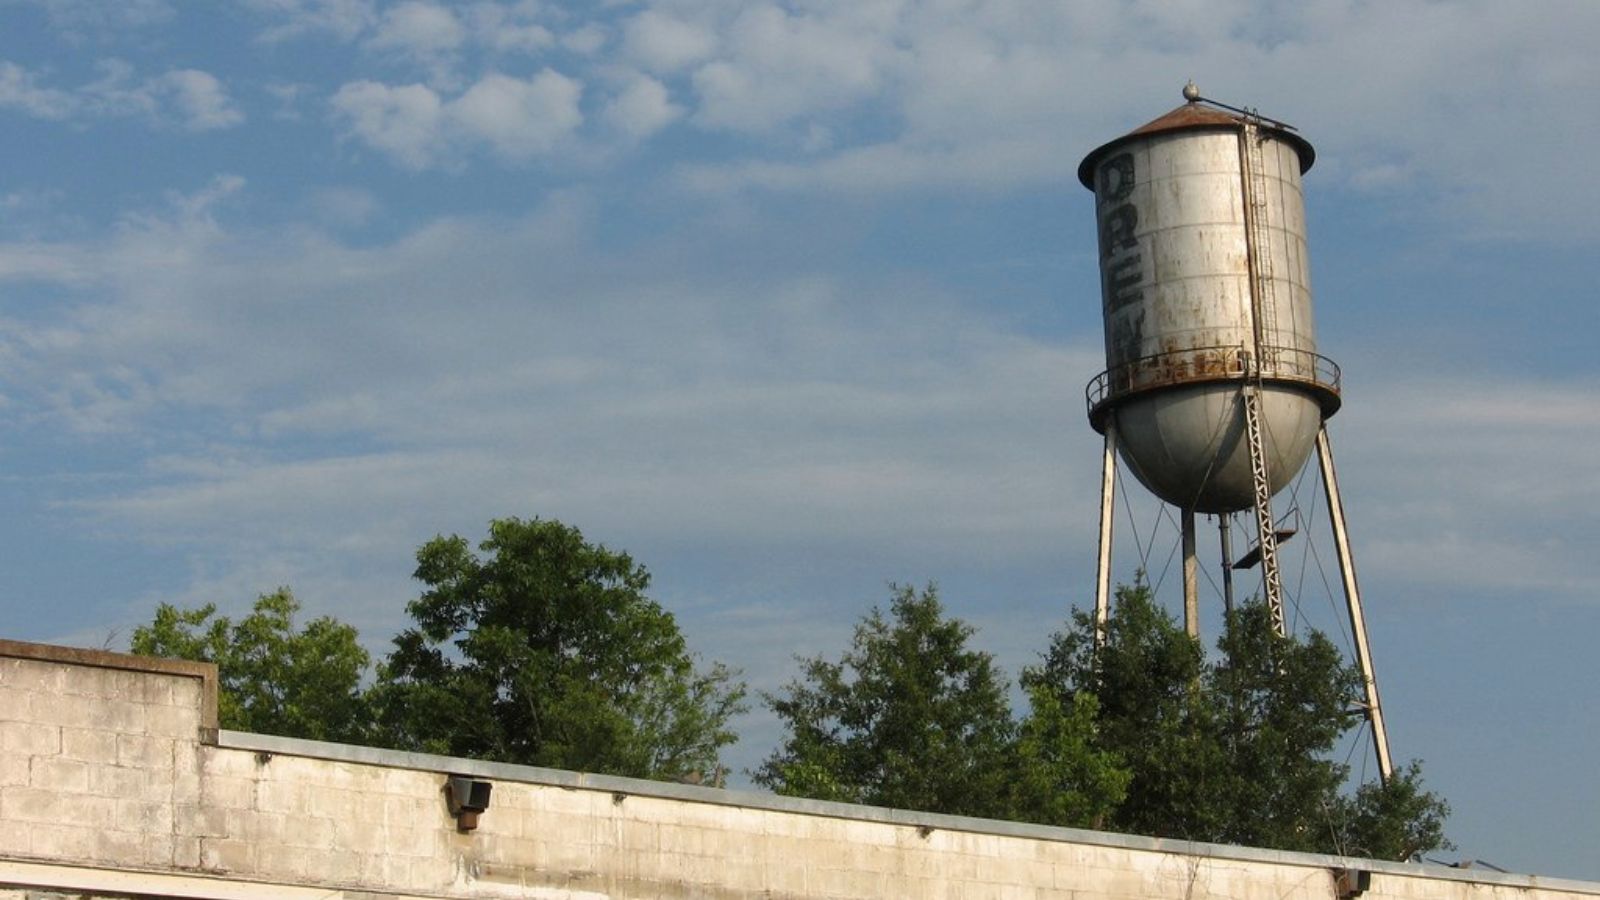
Drew is another small Delta town located in Sunflower County. With limited data available, the 2024 and 2025 figures suggest a slight retreat in home values. It’s too early to say whether this dip is the beginning of a broader trend or just short-term variability.
At under $68,000, homes in Drew remain extremely affordable. If prices stabilize or rise again, this could become a market to watch for buyers seeking low-cost entry into Mississippi real estate. But for now, its movement is modestly negative.
5. Stonewall – 3.2% Home Price Increase Since 2021

- 2010: N/A
- 2011: N/A
- 2012: N/A
- 2013: N/A
- 2014: N/A
- 2015: N/A
- 2016: N/A
- 2017: N/A
- 2018: N/A
- 2019: N/A
- 2020: N/A
- 2021: $63,291
- 2022: $68,535 (+$5,244, +8.29% from previous year)
- 2023: $61,869 (-$6,666, -9.73% from previous year)
- 2024: $66,193 (+$4,324, +6.99% from previous year)
- 2025: $65,318 (-$875, -1.32% from previous year)
Stonewall’s home prices have risen modestly by 3.2% since 2021, growing from $63,291 to $65,318. The market saw notable swings—rising sharply in 2022, falling the next year, then stabilizing through 2024 and 2025.
Stonewall – Small Increases After a Volatile Start
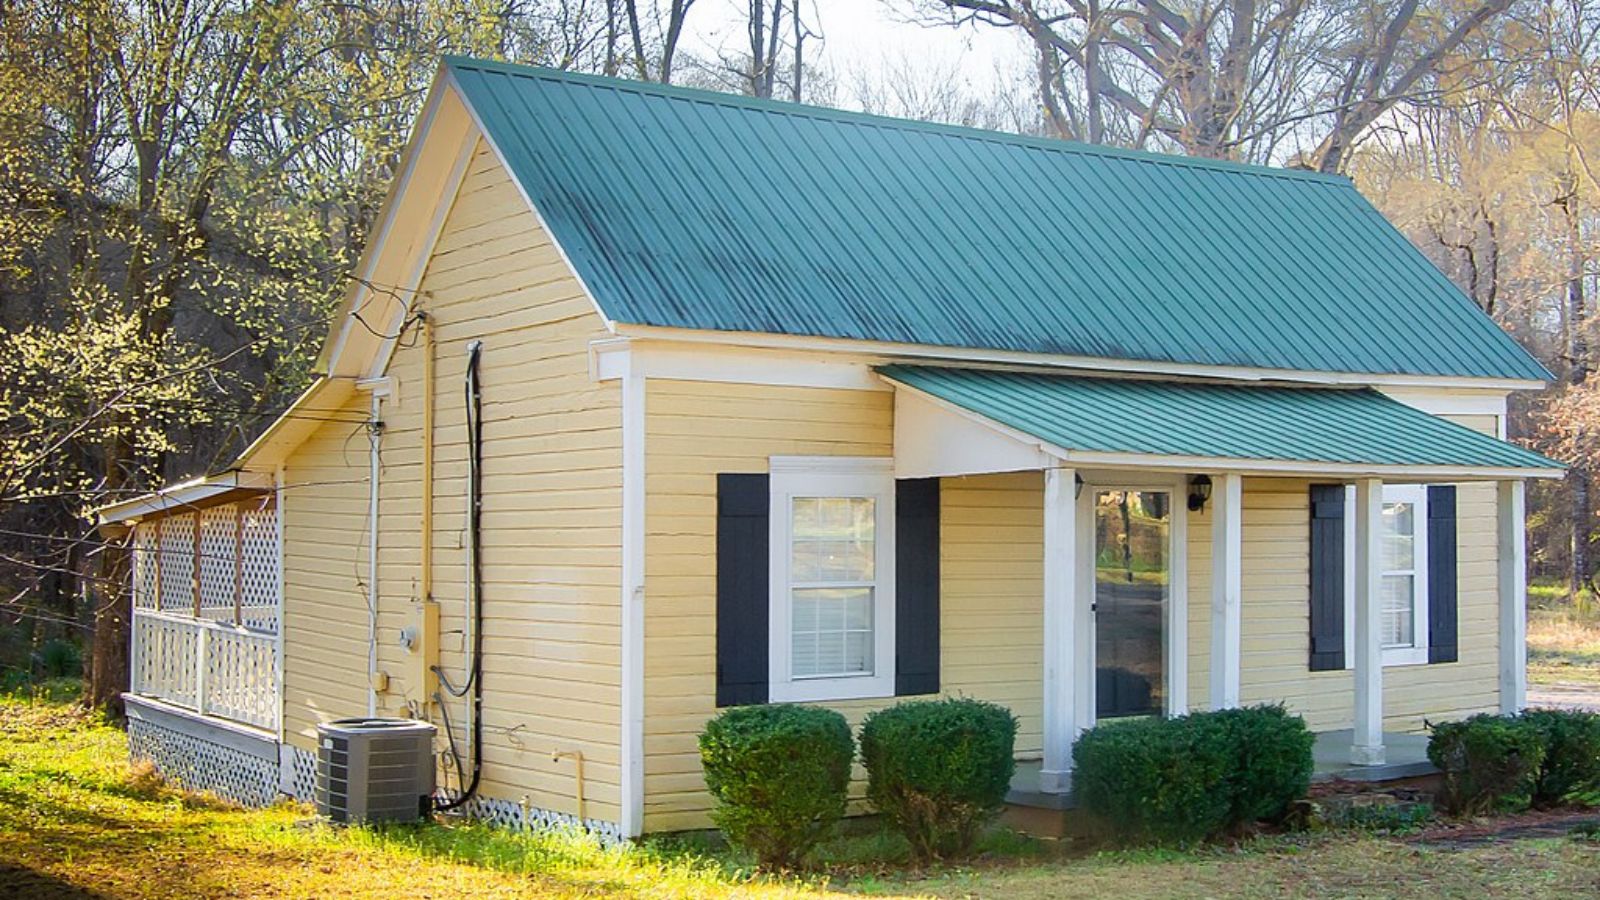
Stonewall, located in Clarke County, is a small town with limited market activity but some price movement in recent years. After a strong 2022 gain, prices fell nearly 10% in 2023 before inching back up. The slight drop in 2025 kept values essentially flat over the long term.
With an average home value just above $65,000, Stonewall remains deeply affordable. The mild overall growth could reflect balanced demand, while its price shifts hint at sensitivity to local changes in employment or infrastructure conditions.
4. Durant – -6.2% Home Price Decline Since 2021
- 2010: N/A
- 2011: N/A
- 2012: N/A
- 2013: N/A
- 2014: N/A
- 2015: N/A
- 2016: N/A
- 2017: N/A
- 2018: N/A
- 2019: N/A
- 2020: N/A
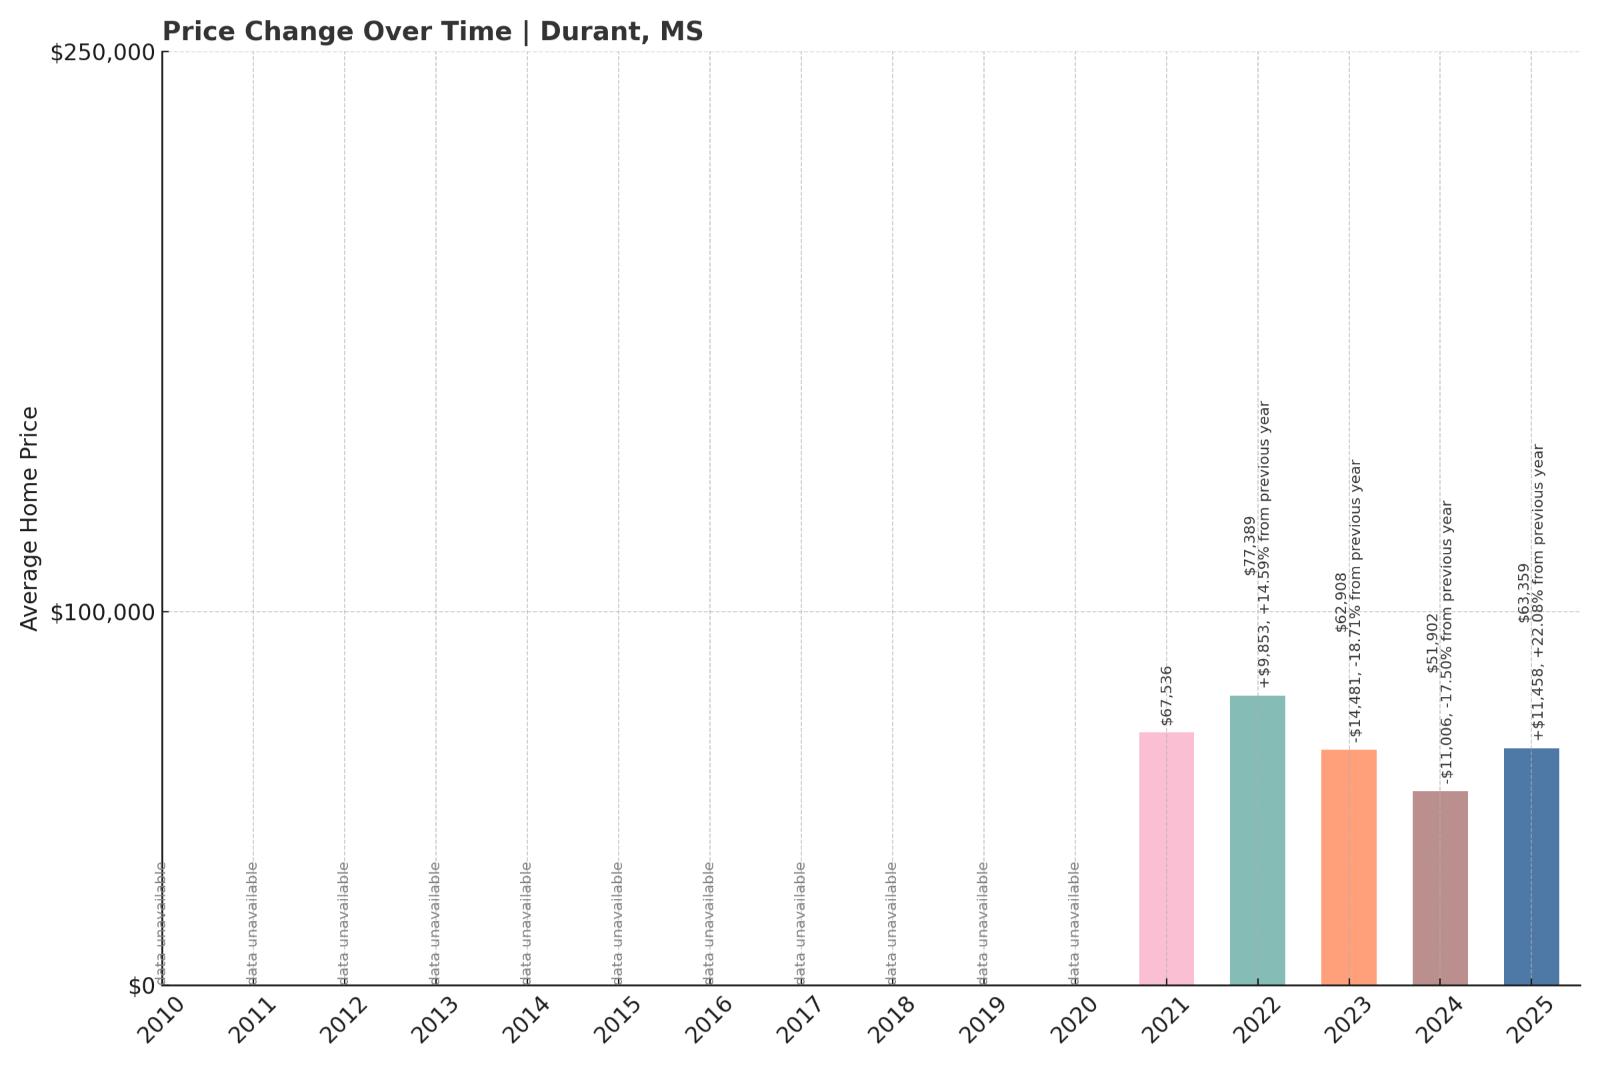
- 2021: $67,536
- 2022: $77,389 (+$9,853, +14.59% from previous year)
- 2023: $62,908 (-$14,481, -18.71% from previous year)
- 2024: $51,902 (-$11,006, -17.50% from previous year)
- 2025: $63,359 (+$11,458, +22.08% from previous year)
Durant’s home prices have dropped by 6.2% overall since 2021, despite a strong comeback in 2025. The town saw a huge gain in 2022 followed by back-to-back double-digit losses, then rebounded with a 22% jump in the most recent year.
Durant – Dramatic Swings with a Late Comeback
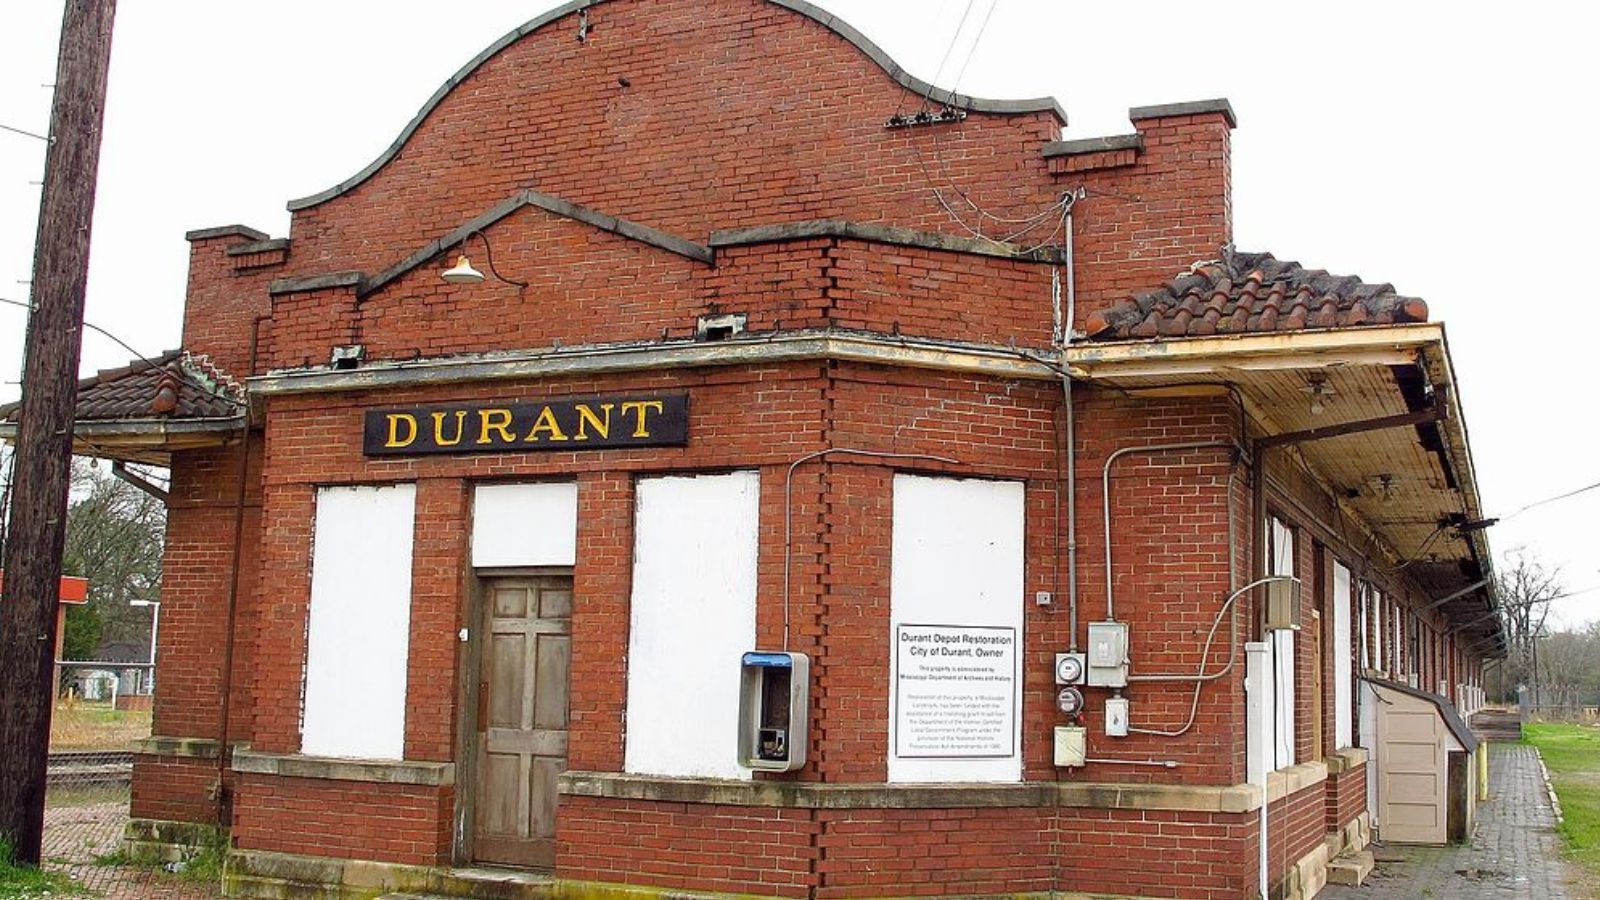
Located in Holmes County, Durant has seen one of the more dramatic market rides among Mississippi towns. Prices surged in 2022, only to collapse over the following two years. The 2025 rebound suggests new activity or recovery, with values returning to a level close to where they began in 2021.
With a 2025 average of $63,359, Durant’s homes remain inexpensive but volatile. These fluctuations could reflect shifts in investor interest, regional migration, or limited supply meeting variable demand in a small market.
3. Greenville – -32% Home Price Decline Since 2021

- 2010: N/A
- 2011: N/A
- 2012: N/A
- 2013: N/A
- 2014: N/A
- 2015: N/A
- 2016: N/A
- 2017: N/A
- 2018: N/A
- 2019: N/A
- 2020: N/A
- 2021: $80,433
- 2022: $82,435 (+$2,002, +2.49% from previous year)
- 2023: $61,728 (-$20,707, -25.12% from previous year)
- 2024: $67,765 (+$6,037, +9.78% from previous year)
- 2025: $54,467 (-$13,298, -19.62% from previous year)
Home values in Greenville have declined sharply by 32% since 2021, falling from $80,433 to $54,467 in just four years. The largest drop occurred in 2023, followed by a brief recovery and another sharp decline in 2025.
Greenville – Major Decline Despite Short-Term Recovery

Greenville, one of the largest towns in the Mississippi Delta, has seen its housing market drop steeply since peaking in 2021. While prices held steady in 2022, they collapsed the next year, and another large drop came in 2025 after a modest bounce.
The current average price of $54,467 represents one of the biggest losses in the state. Factors likely include population decline, limited job growth, and broader economic challenges across the Delta region. Despite these declines, Greenville remains a regional hub and could present long-term opportunities if conditions stabilize.
2. Clarksdale – 51% Home Price Increase Since 2012
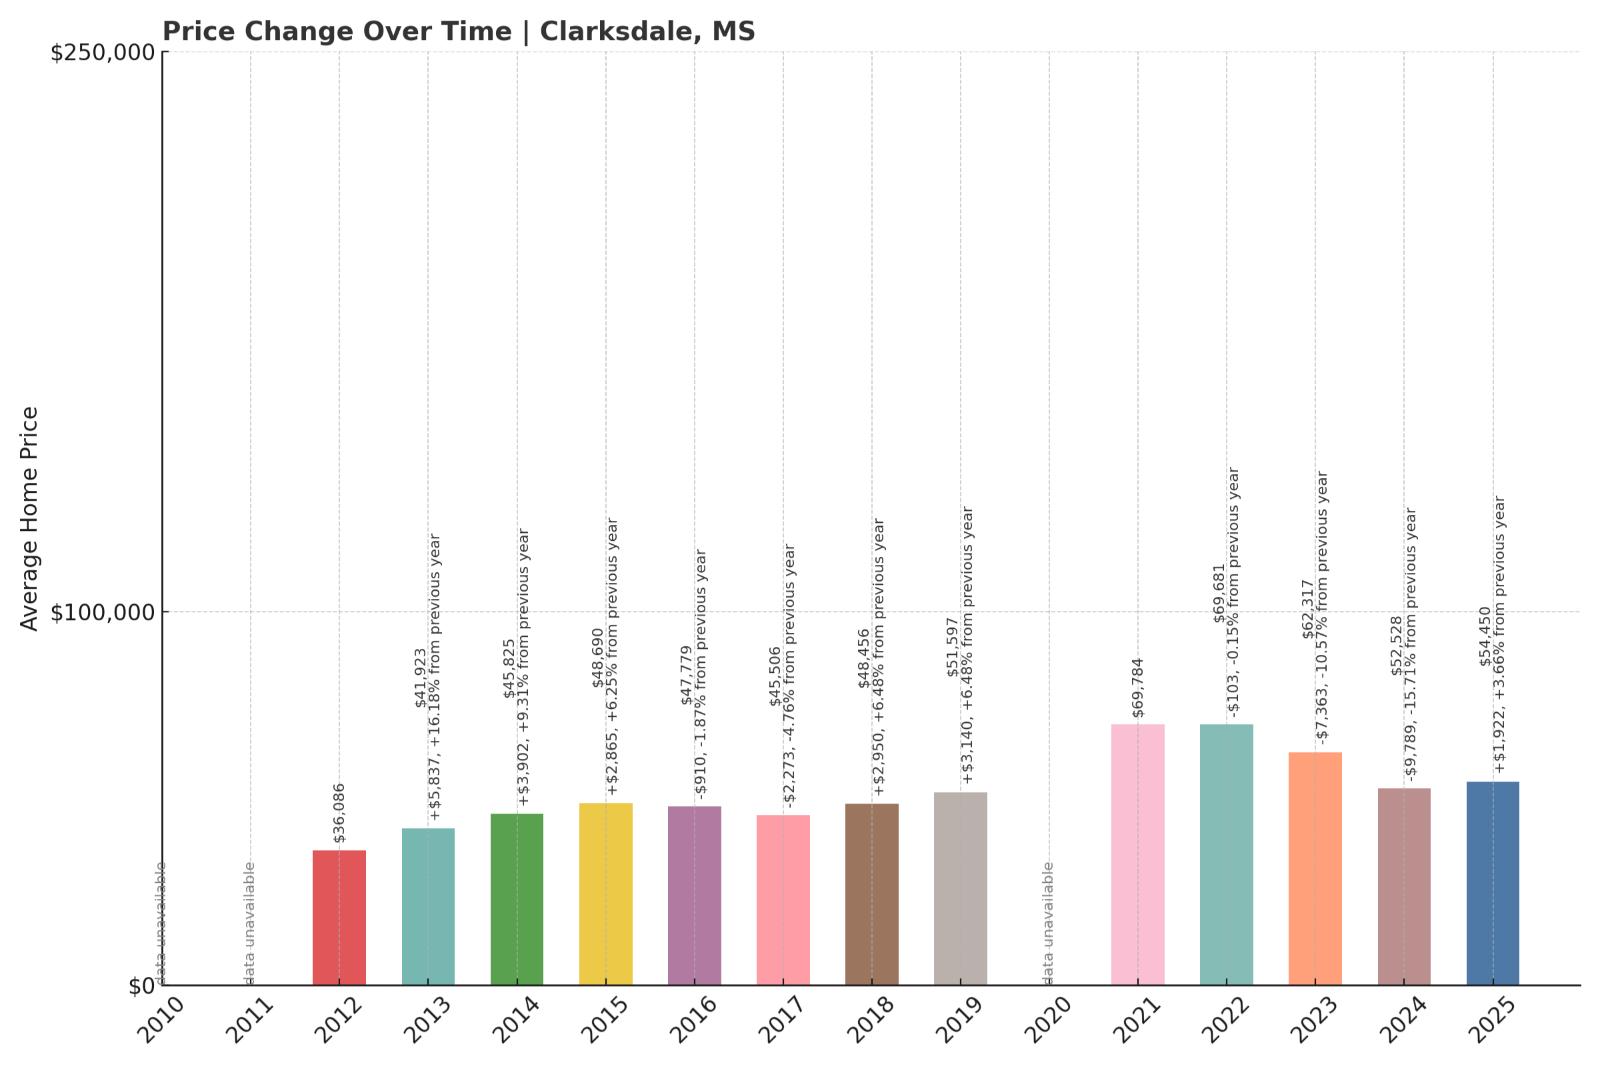
- 2010: N/A
- 2011: N/A
- 2012: $36,086
- 2013: $41,923 (+$5,837, +16.18% from previous year)
- 2014: $45,825 (+$3,902, +9.31% from previous year)
- 2015: $48,690 (+$2,865, +6.25% from previous year)
- 2016: $47,779 (-$910, -1.87% from previous year)
- 2017: $45,506 (-$2,273, -4.76% from previous year)
- 2018: $48,456 (+$2,950, +6.48% from previous year)
- 2019: $51,597 (+$3,140, +6.48% from previous year)
- 2020: N/A
- 2021: $69,784
- 2022: $69,681 (-$103, -0.15% from previous year)
- 2023: $62,317 (-$7,363, -10.57% from previous year)
- 2024: $52,528 (-$9,789, -15.71% from previous year)
- 2025: $54,450 (+$1,922, +3.66% from previous year)
Since 2012, home prices in Clarksdale have risen by 51%, moving from $36,086 to $54,450. After peaking in 2021, the town saw a multi-year decline before a modest uptick in 2025.
Clarksdale – Long-Term Growth Despite Recent Slips

Clarksdale, the heart of blues music in Mississippi, has seen a remarkable long-term gain in home prices, even as recent years brought steady declines. The sharpest losses came between 2022 and 2024, totaling over 24%, before a mild recovery arrived in 2025.
The current price is far above where the town stood a decade ago, suggesting that despite recent dips, Clarksdale remains a community with appeal. Cultural tourism, low-cost housing, and regional development efforts could all play roles in future stability.
1. Itta Bena – -12% Home Price Decline Since 2024

- 2010: N/A
- 2011: N/A
- 2012: N/A
- 2013: N/A
- 2014: N/A
- 2015: N/A
- 2016: N/A
- 2017: N/A
- 2018: N/A
- 2019: N/A
- 2020: N/A
- 2021: N/A
- 2022: N/A
- 2023: N/A
- 2024: $54,842
- 2025: $48,279 (-$6,563, -11.97% from previous year)
Itta Bena experienced a nearly 12% home price drop from 2024 to 2025, with values falling from $54,842 to $48,279 in just one year. With limited data before that, it’s unclear whether this is part of a longer-term pattern.
Itta Bena – Steep Short-Term Drop With Limited History

Itta Bena is a small town in Leflore County, home to Mississippi Valley State University. Though its role in regional education is significant, its real estate market shows signs of recent stress. The lone year-over-year data point shows a sharp price decline.
At just over $48,000, Itta Bena ranks among the most affordable markets in the state. With little prior data, it’s too soon to tell whether this marks the start of a trend or a temporary dip in a small and likely thin housing market.


