Would you like to save this?
Zillow’s Home Value Index shows just how far Minnesota’s most in-demand towns have pulled ahead in 2025. In these 18 places, home prices aren’t just high—they’ve soared past statewide averages and kept climbing. Whether it’s lakeside living, commuter convenience near the Twin Cities, or sheer exclusivity, these towns are commanding serious cash. We’ve tracked their price growth over time, highlighting where values have surged and what’s driving demand behind Minnesota’s most expensive markets.
18. Afton – 83% Home Price Increase Since 2012
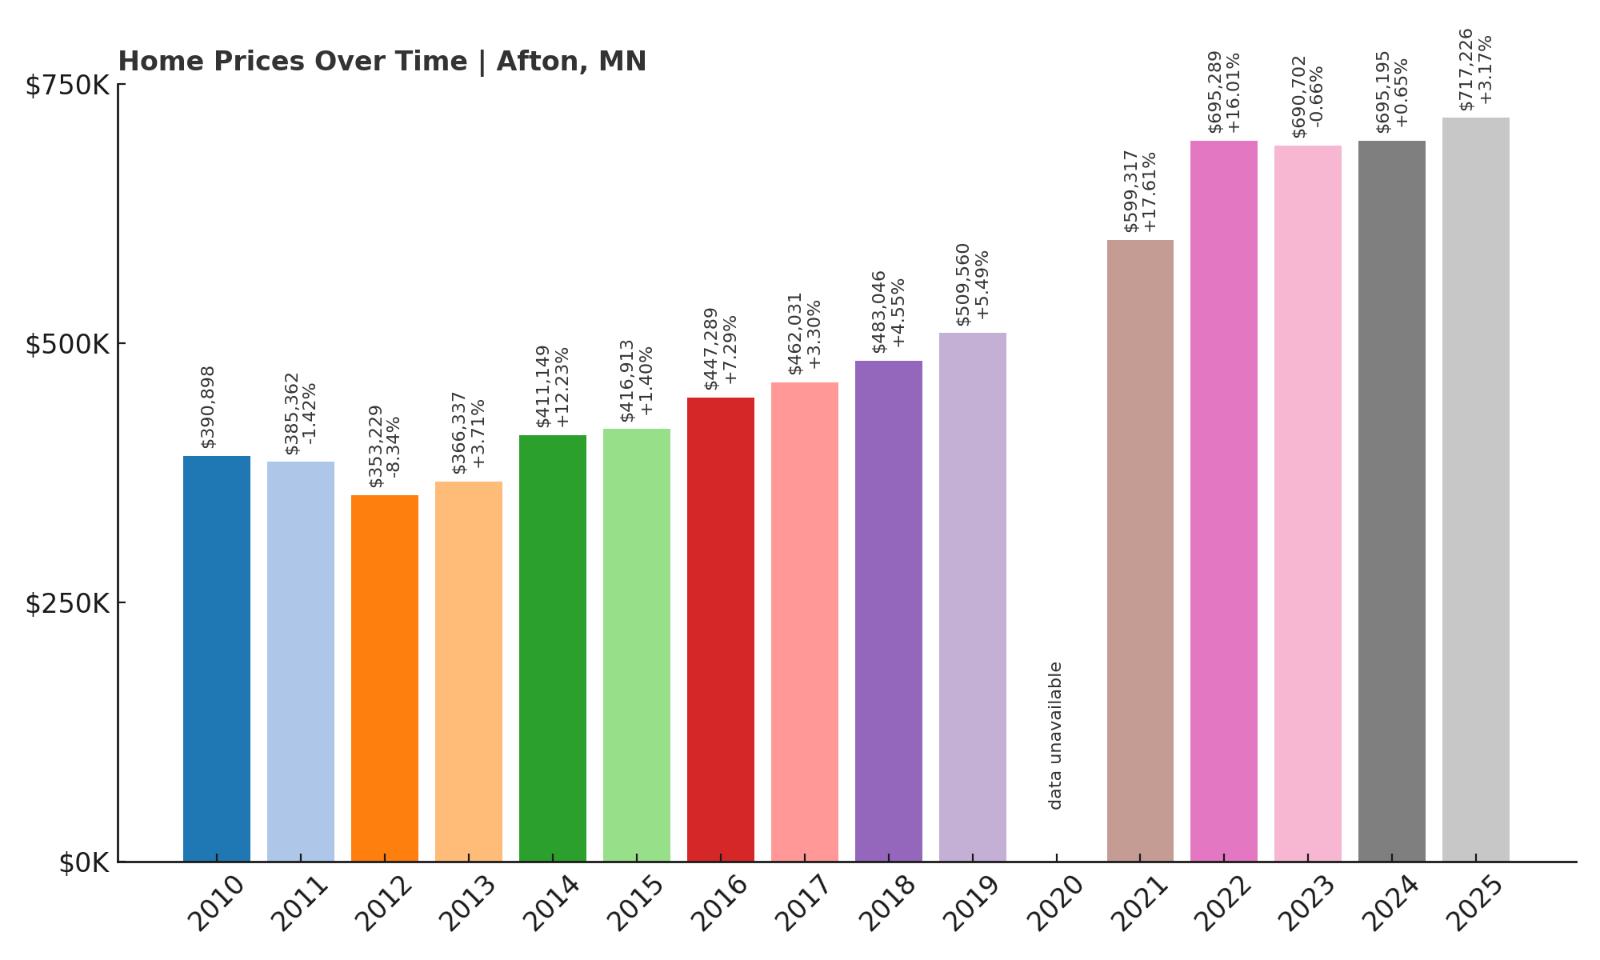
- 2010: $390,898
- 2011: $385,362 ($-5,536, -1.42% from previous year)
- 2012: $353,229 ($-32,133, -8.34% from previous year)
- 2013: $366,337 (+$13,108, +3.71% from previous year)
- 2014: $411,149 (+$44,811, +12.23% from previous year)
- 2015: $416,913 (+$5,765, +1.40% from previous year)
- 2016: $447,289 (+$30,376, +7.29% from previous year)
- 2017: $462,031 (+$14,742, +3.30% from previous year)
- 2018: $483,046 (+$21,015, +4.55% from previous year)
- 2019: $509,560 (+$26,514, +5.49% from previous year)
- 2020: N/A
- 2021: $599,317 (+$89,757, +17.61% from previous year)
- 2022: $695,289 (+$95,972, +16.01% from previous year)
- 2023: $690,702 ($-4,587, -0.66% from previous year)
- 2024: $695,195 (+$4,493, +0.65% from previous year)
- 2025: $717,226 (+$22,032, +3.17% from previous year)
Afton’s housing market has surged by 83% since 2012, with steady appreciation and a big leap during the post-2020 years. The town saw notable gains in 2021 and 2022, with increases of over 16% each year. Even with a minor dip in 2023, prices bounced back quickly, signaling sustained demand. The 2025 median value now exceeds $717,000, up from just $353,229 in 2012.
Afton – Scenic Living with Rising Demand
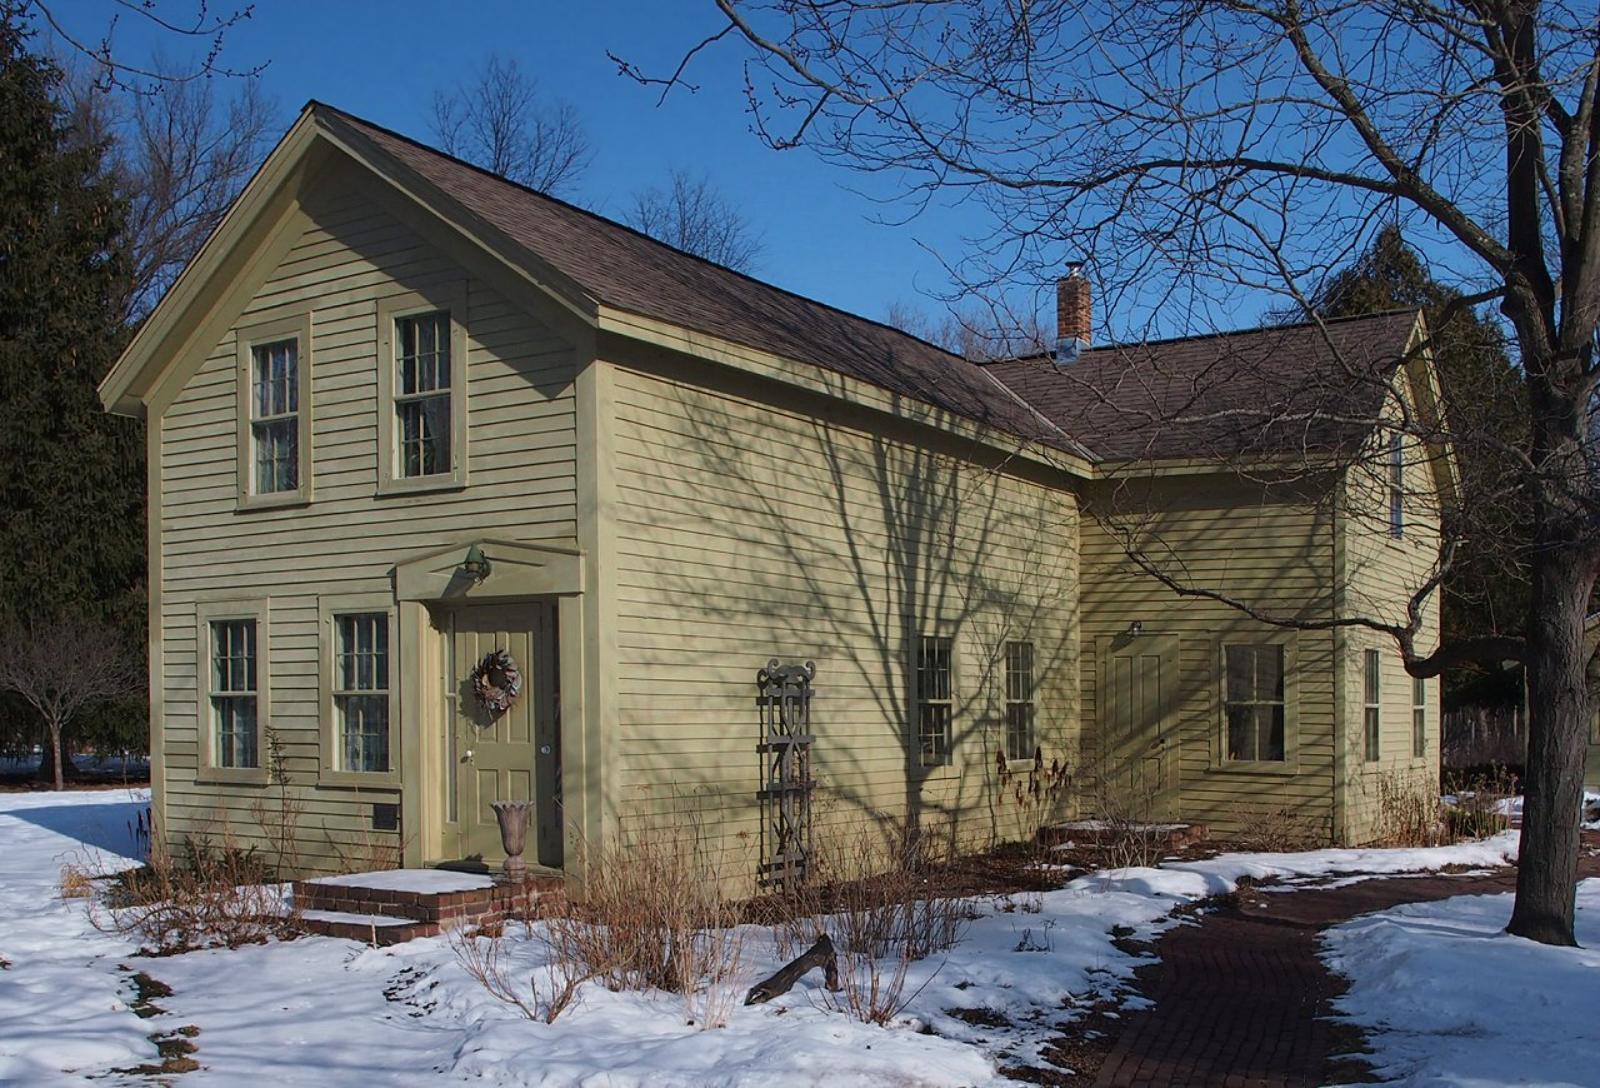
Located along the St. Croix River near the eastern edge of the Twin Cities metro, Afton is known for its pastoral beauty, riverfront trails, and ski hill. It’s a sought-after destination for those wanting space and nature within commuting distance of St. Paul. The housing stock includes upscale homes on large wooded lots, many with sweeping valley or water views. As Twin Cities residents look for high-quality homes with access to nature, Afton has seen rising interest, especially post-pandemic. Limited housing inventory, along with its desirability as a lifestyle town, has driven home prices sharply upward in recent years. High demand and relatively low development pressure continue to shape Afton’s place among Minnesota’s elite housing markets.
17. Grant – 100% Home Price Increase Since 2012
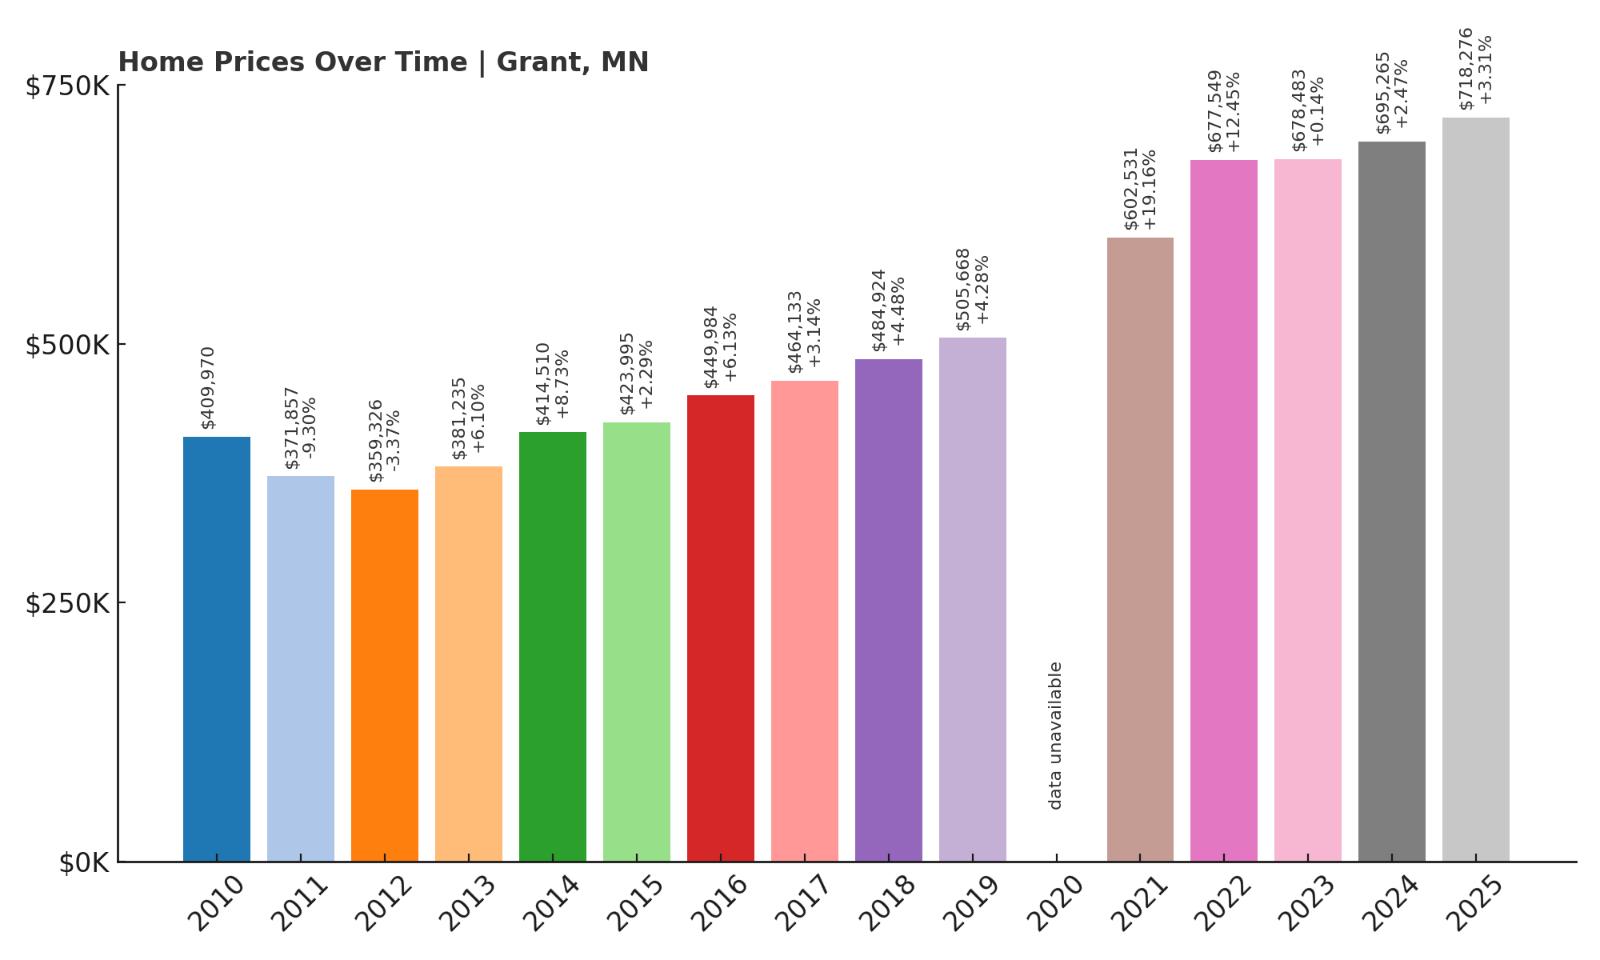
- 2010: $409,970
- 2011: $371,857 ($-38,113, -9.30% from previous year)
- 2012: $359,326 ($-12,531, -3.37% from previous year)
- 2013: $381,235 (+$21,909, +6.10% from previous year)
- 2014: $414,510 (+$33,276, +8.73% from previous year)
- 2015: $423,995 (+$9,484, +2.29% from previous year)
- 2016: $449,984 (+$25,989, +6.13% from previous year)
- 2017: $464,133 (+$14,149, +3.14% from previous year)
- 2018: $484,924 (+$20,792, +4.48% from previous year)
- 2019: $505,668 (+$20,744, +4.28% from previous year)
- 2020: N/A
- 2021: $602,531 (+$96,863, +19.16% from previous year)
- 2022: $677,549 (+$75,018, +12.45% from previous year)
- 2023: $678,483 (+$934, +0.14% from previous year)
- 2024: $695,265 (+$16,782, +2.47% from previous year)
- 2025: $718,276 (+$23,011, +3.31% from previous year)
Grant has experienced a full doubling of home values since 2012, growing from $359,326 to $718,276 by 2025. Strong gains in 2021 and 2022—nearly 20% and 12% respectively—highlighted its pandemic-era boom. While 2023 remained mostly flat, recent increases suggest the market remains resilient. The consistency in growth over the last decade has solidified its status as a premier destination for luxury homebuyers.
Grant – Quiet Rural Charm Meets Metro Proximity
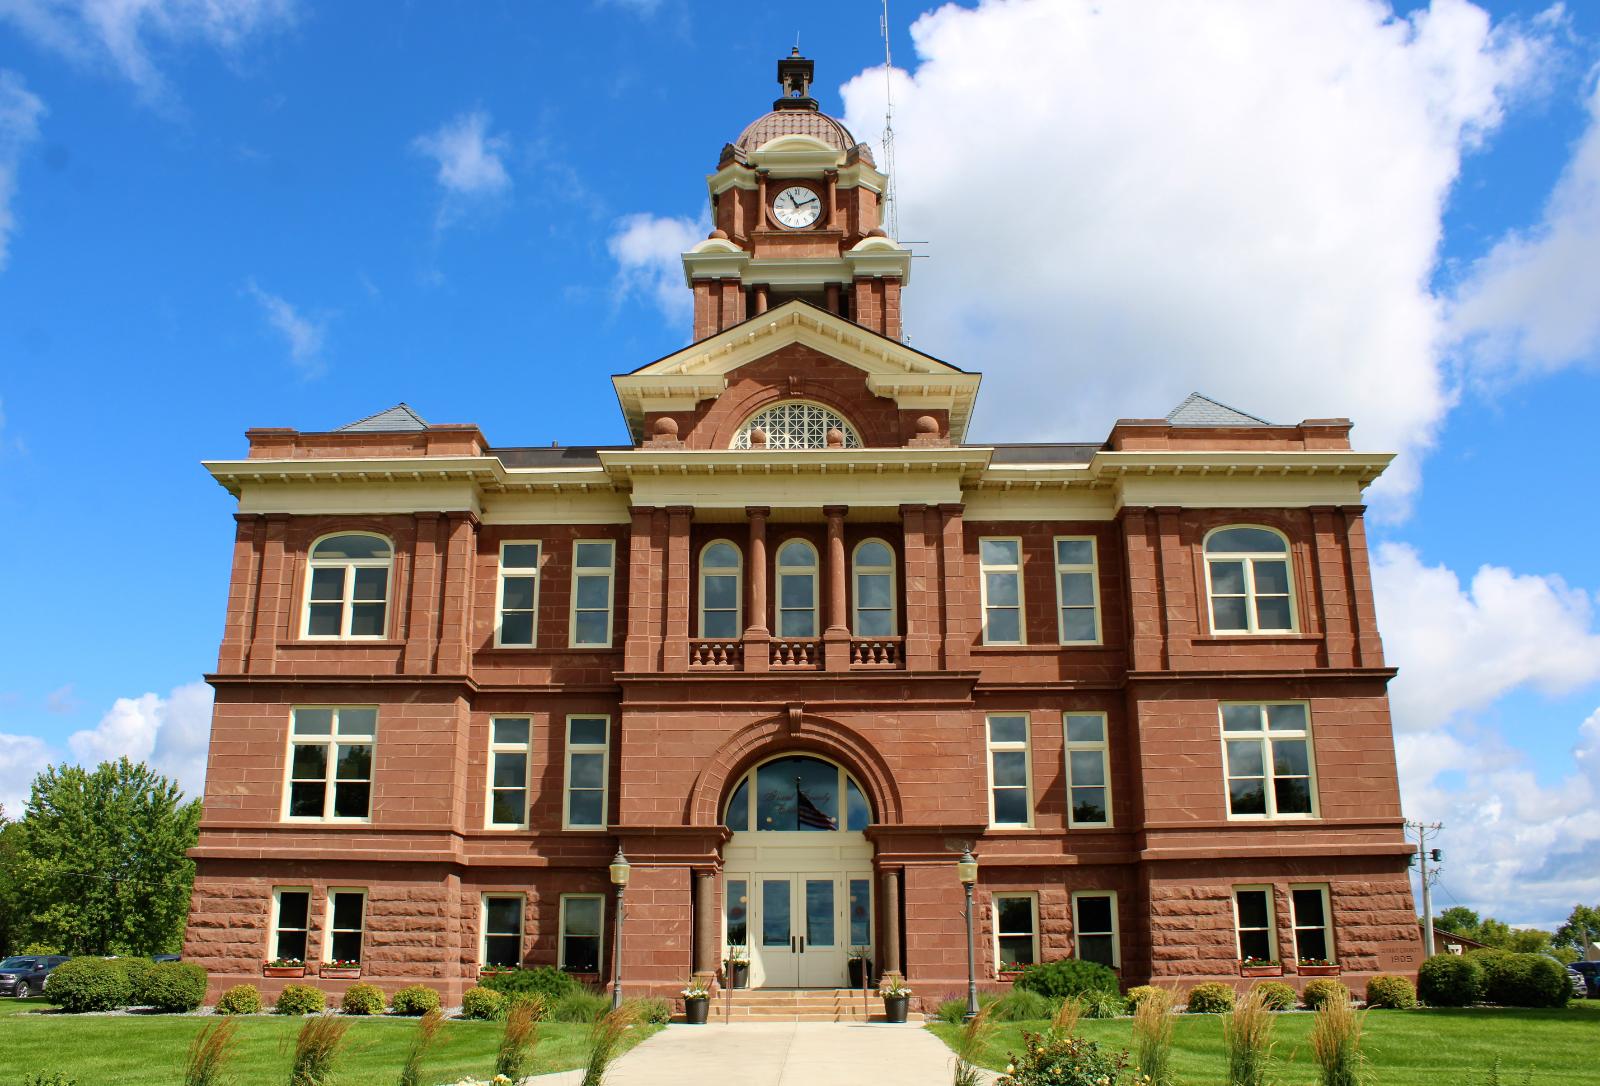
Tucked just northeast of the Twin Cities, Grant offers expansive rural lots with upscale custom homes and hobby farms. It’s the kind of place where residents enjoy both elbow room and access to amenities in nearby Stillwater or White Bear Lake. This unique combination has made it a favorite for affluent buyers seeking country living without sacrificing urban convenience. The price surge since 2012 reflects growing interest in low-density living, especially among remote workers and families. Zoning policies that limit dense development have helped preserve its appeal, keeping inventory tight and values high. Grant continues to be one of Minnesota’s strongest high-end markets for those valuing space, privacy, and prestige.
16. Lake Shore – 129% Home Price Increase Since 2012
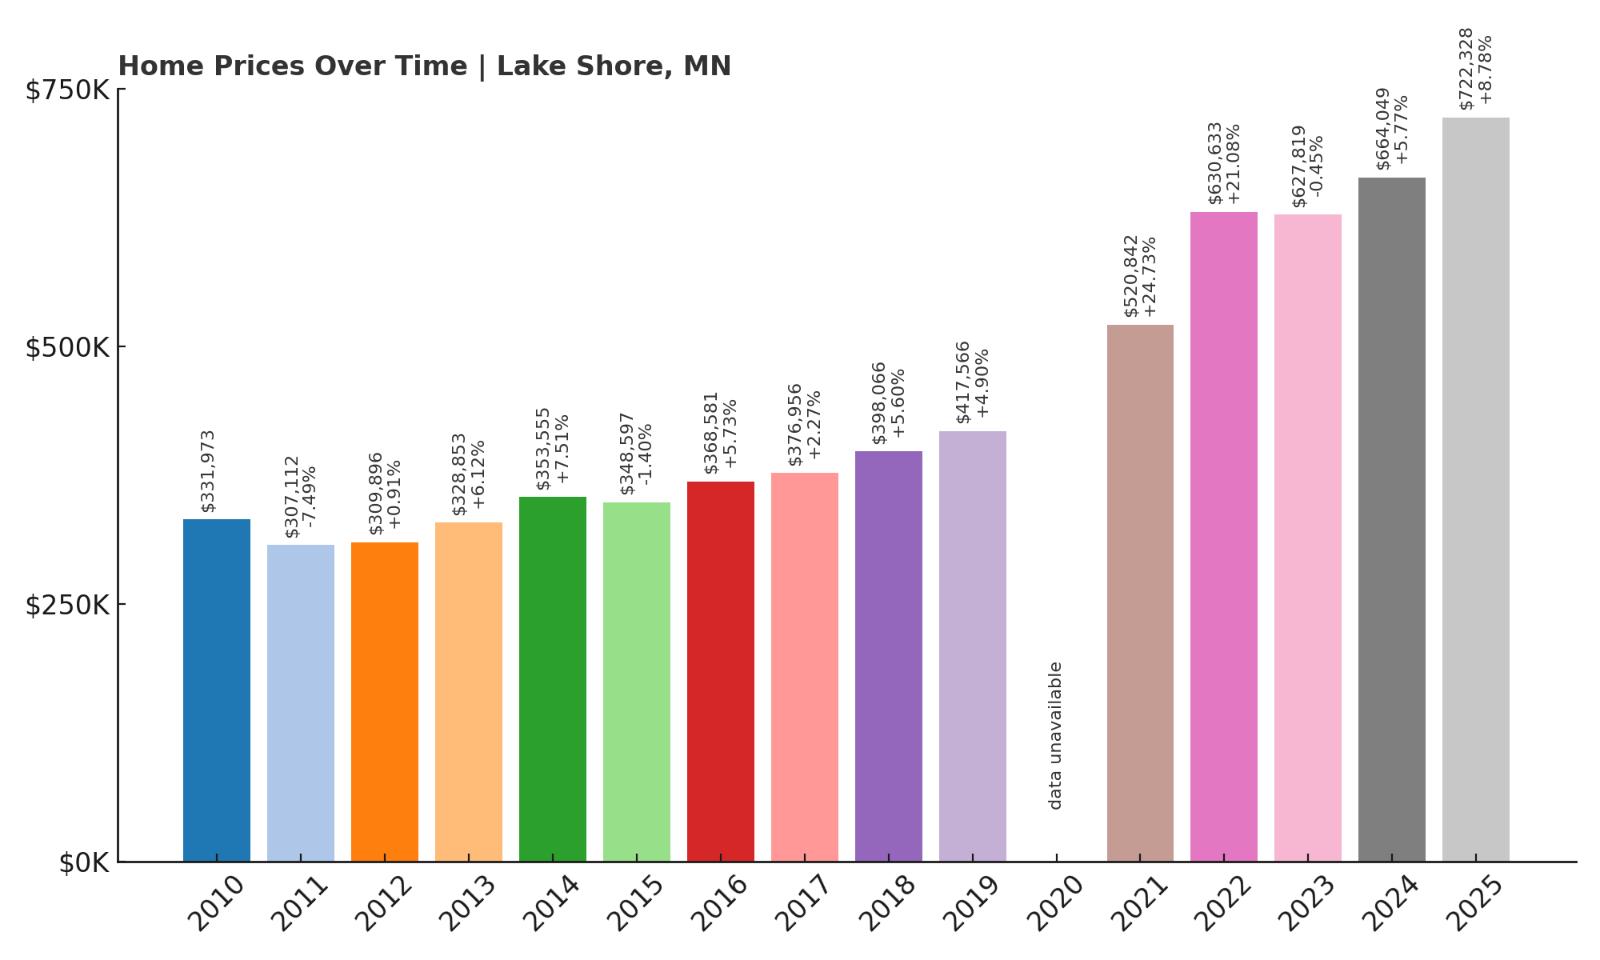
- 2010: $331,973
- 2011: $307,112 ($-24,861, -7.49% from previous year)
- 2012: $309,896 (+$2,784, +0.91% from previous year)
- 2013: $328,853 (+$18,957, +6.12% from previous year)
- 2014: $353,555 (+$24,701, +7.51% from previous year)
- 2015: $348,597 ($-4,958, -1.40% from previous year)
- 2016: $368,581 (+$19,984, +5.73% from previous year)
- 2017: $376,956 (+$8,375, +2.27% from previous year)
- 2018: $398,066 (+$21,110, +5.60% from previous year)
- 2019: $417,566 (+$19,500, +4.90% from previous year)
- 2020: N/A
- 2021: $520,842 (+$103,276, +24.73% from previous year)
- 2022: $630,633 (+$109,791, +21.08% from previous year)
- 2023: $627,819 ($-2,814, -0.45% from previous year)
- 2024: $664,049 (+$36,230, +5.77% from previous year)
- 2025: $722,328 (+$58,279, +8.78% from previous year)
Lake Shore’s prices have more than doubled since 2012, rising from just over $309K to $722K by 2025. Big surges in 2021 and 2022 pushed prices into luxury territory. Despite a slight decline in 2023, the market rebounded sharply, continuing its upward trend into 2025. The town’s lakeside location and recreational appeal likely contribute to its impressive appreciation.
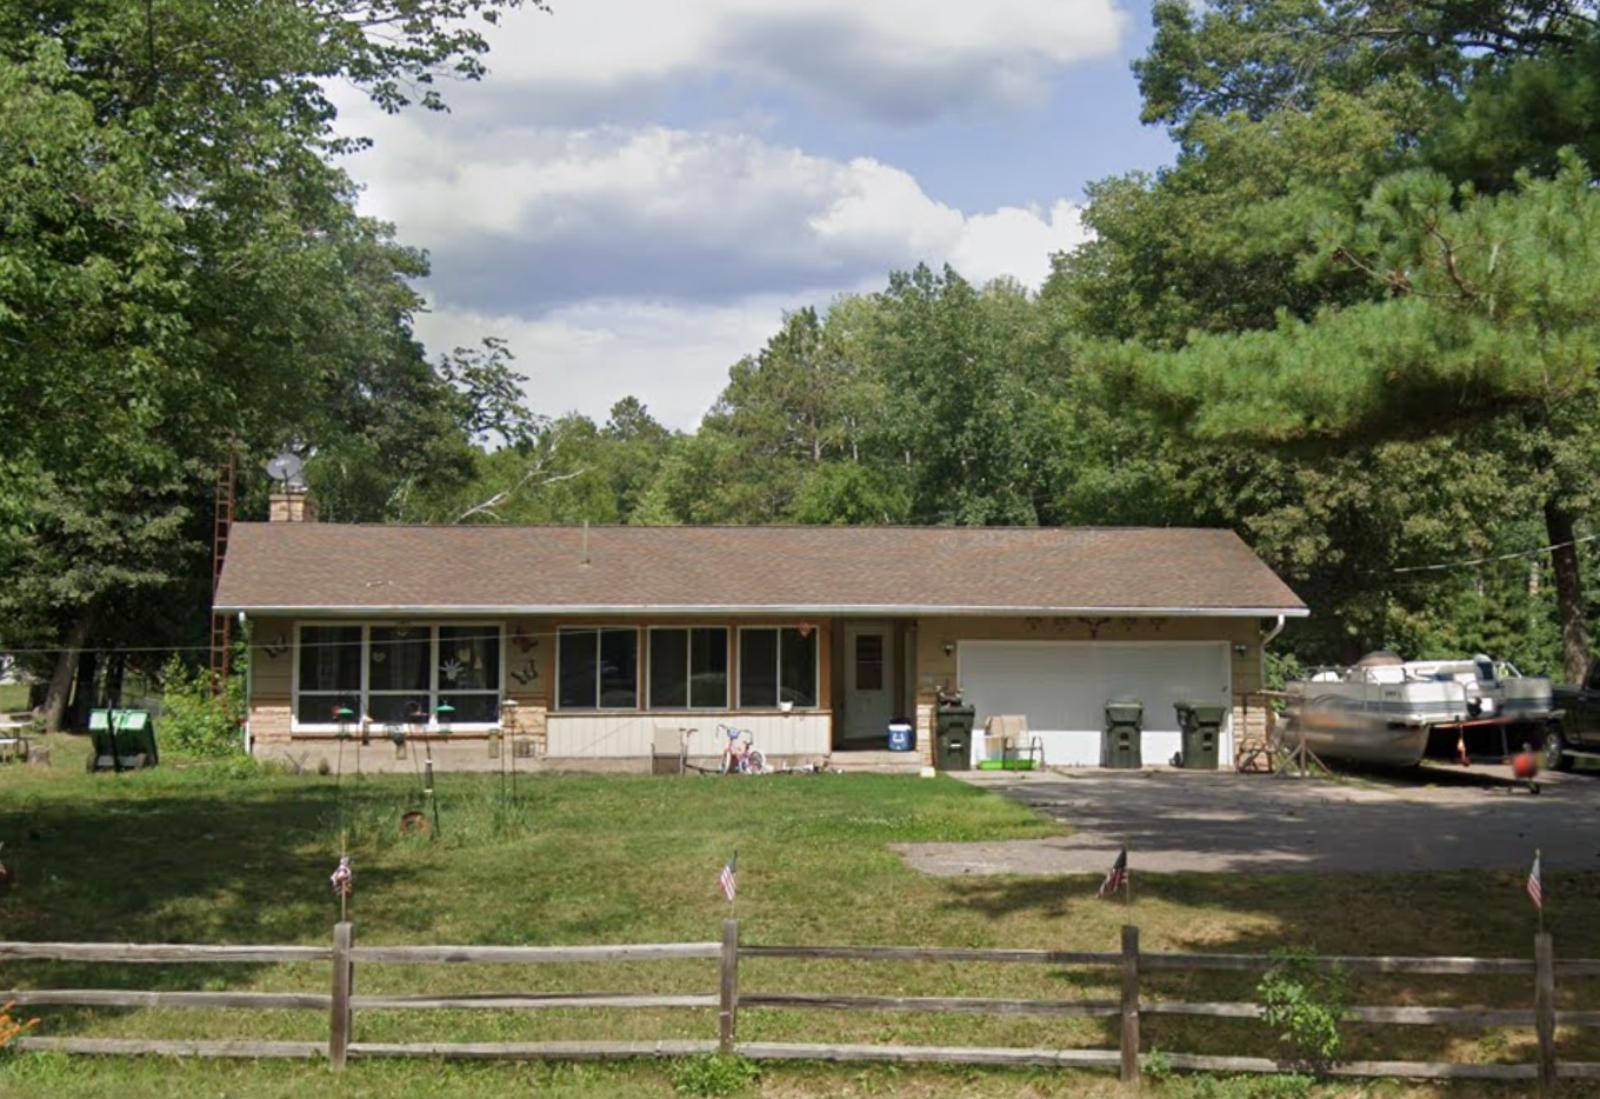
Lake Shore – Lakeside Appeal Driving High Values
Would you like to save this?
Positioned near Gull Lake in central Minnesota, Lake Shore has long been a favorite among second-home buyers and retirees. With water access, scenic vistas, and proximity to Brainerd, the town blends recreation with high-end living. As lake homes become more desirable, especially post-COVID, Lake Shore has benefited from a wave of buyers seeking relaxation and remote work-friendly properties. The limited number of available homes along the lake has created intense competition, pushing values upward. It’s not uncommon for well-situated properties to receive multiple offers. These dynamics make Lake Shore one of Minnesota’s most valuable and competitive housing markets outside the Twin Cities region.
15. Independence – 105% Home Price Increase Since 2012
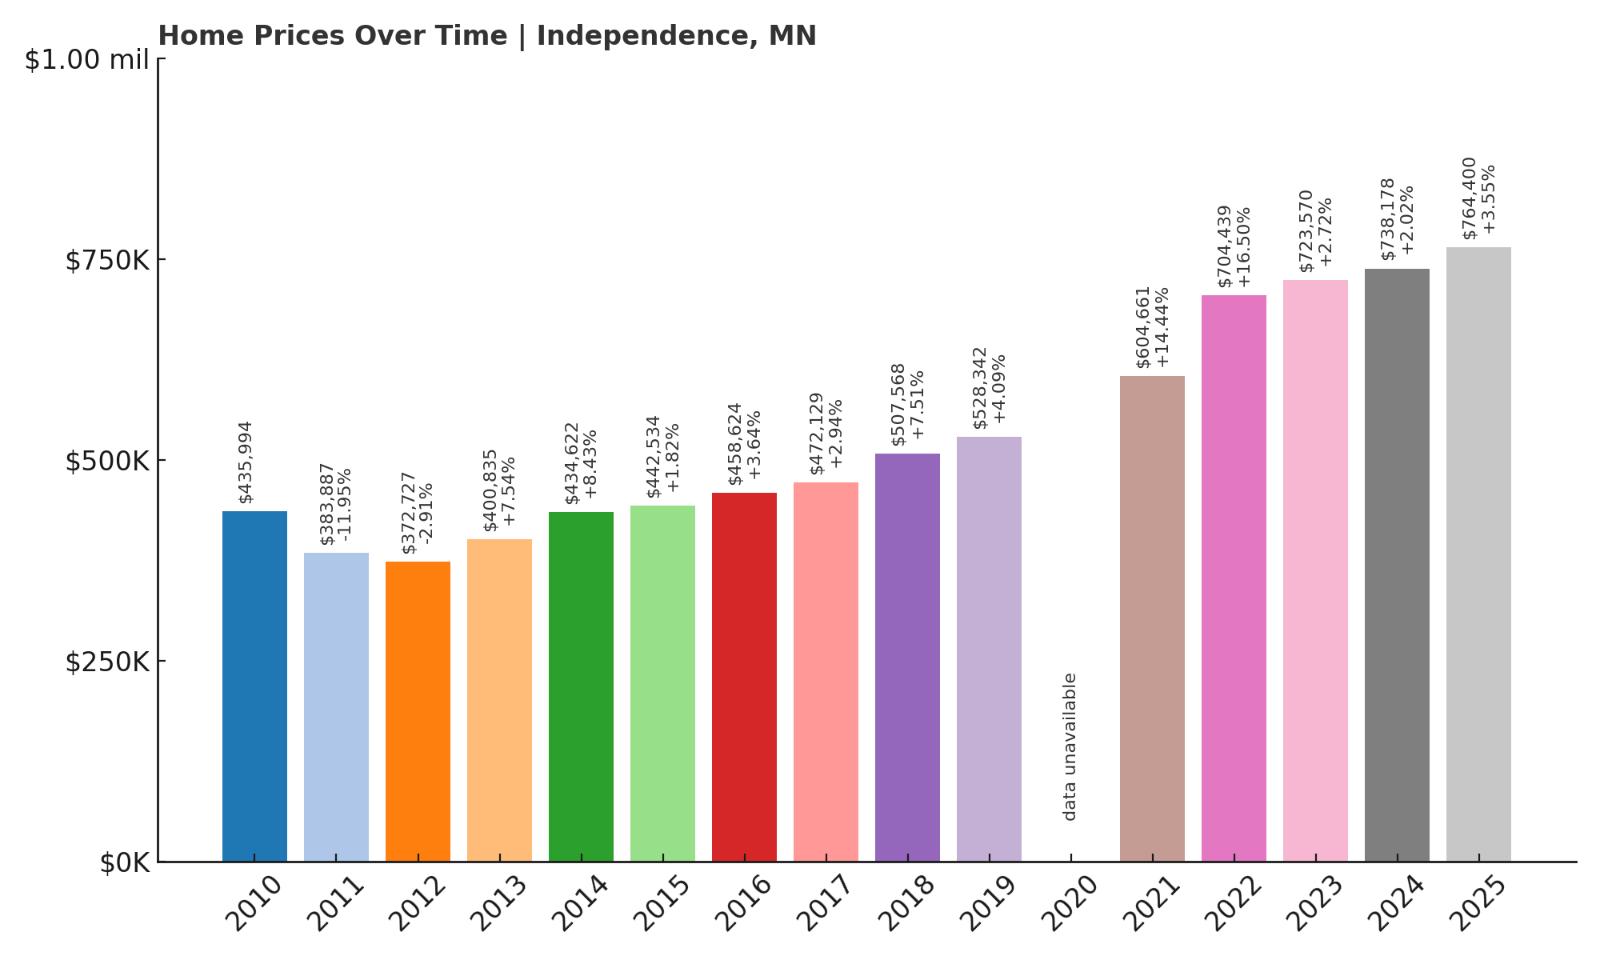
- 2010: $435,994
- 2011: $383,887 ($-52,107, -11.95% from previous year)
- 2012: $372,727 ($-11,161, -2.91% from previous year)
- 2013: $400,835 (+$28,109, +7.54% from previous year)
- 2014: $434,622 (+$33,787, +8.43% from previous year)
- 2015: $442,534 (+$7,912, +1.82% from previous year)
- 2016: $458,624 (+$16,089, +3.64% from previous year)
- 2017: $472,129 (+$13,505, +2.94% from previous year)
- 2018: $507,568 (+$35,440, +7.51% from previous year)
- 2019: $528,342 (+$20,773, +4.09% from previous year)
- 2020: N/A
- 2021: $604,661 (+$76,319, +14.44% from previous year)
- 2022: $704,439 (+$99,779, +16.50% from previous year)
- 2023: $723,570 (+$19,131, +2.72% from previous year)
- 2024: $738,178 (+$14,608, +2.02% from previous year)
- 2025: $764,400 (+$26,222, +3.55% from previous year)
Since 2012, home prices in Independence have more than doubled, climbing from $372,727 to $764,400 by 2025. The town’s market showed consistent gains throughout the last decade, particularly during the 2021–2022 period when values soared by over 30% in just two years. This spike aligned with broader national trends, but Independence’s rural appeal likely played a big role. Even outside of the pandemic boom, annual gains of 2–7% were the norm. While growth slowed slightly after 2022, values still moved upward each year, signaling a market that remains stable and in-demand. Buyers who got in early have seen strong returns, and current prices now place the town well into luxury territory. The town’s price performance stands out for its steady climb without dramatic drops. It’s a good example of how steady demand and limited supply can work together to drive sustained appreciation over time.
Independence – Country Living with Twin Cities Access
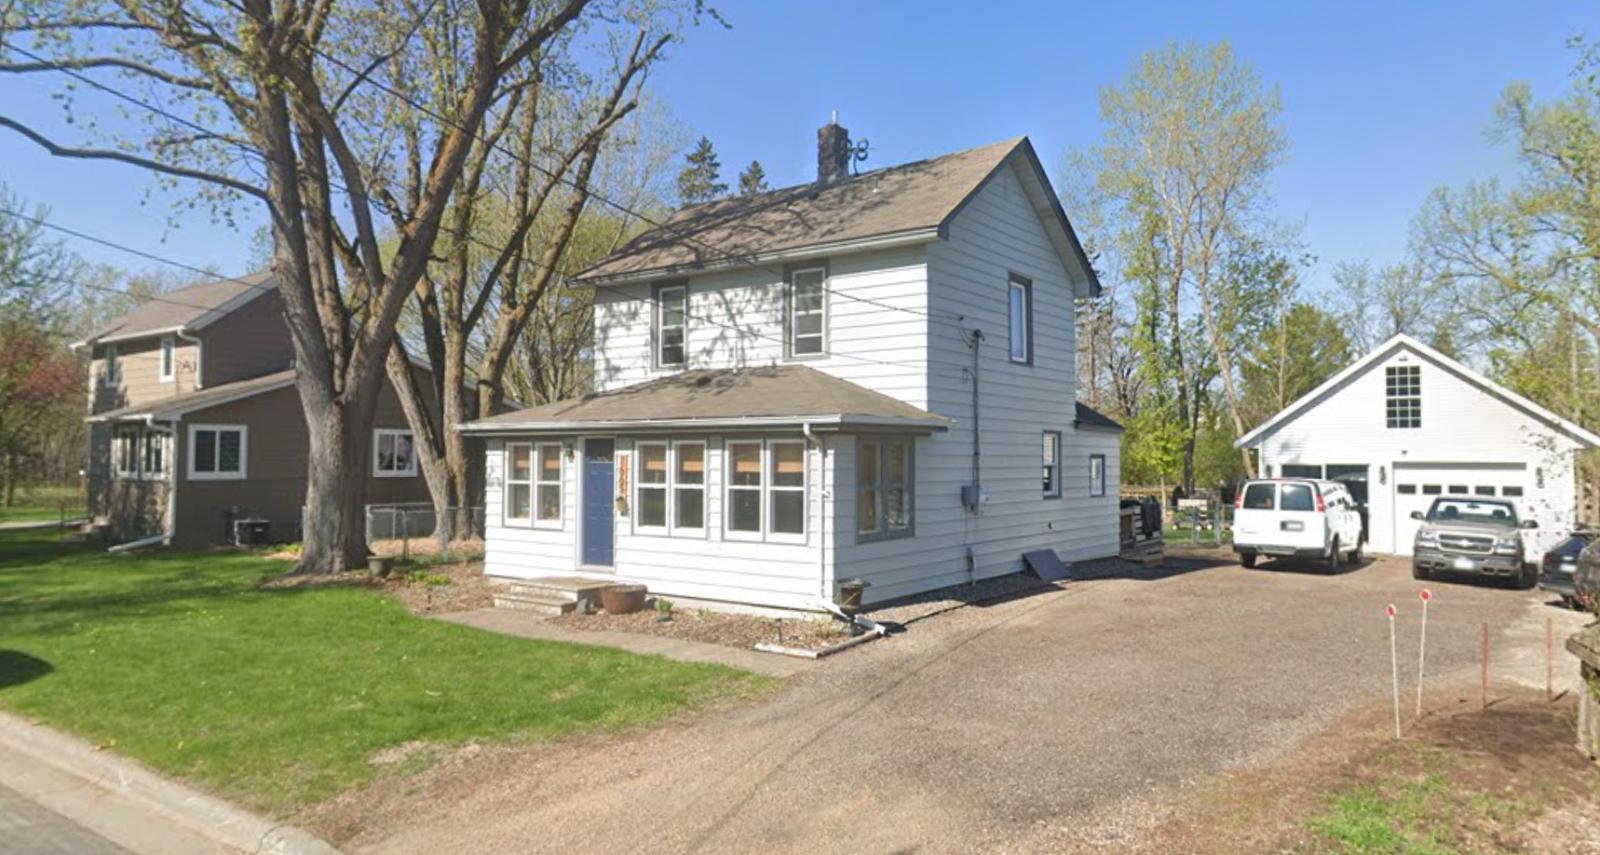
Independence offers a rare blend of wide-open landscapes and accessibility to the Minneapolis metro. Located about 25 miles west of downtown Minneapolis, it’s popular with homeowners looking for acreage, equestrian properties, or just a bit more privacy. Large lots and upscale homes dot the countryside, and the town’s zoning encourages spacious living rather than suburban sprawl. Independence also borders several lakes and wooded areas, making it attractive to outdoor enthusiasts and retirees. Its proximity to I-394 and Highway 12 means residents can enjoy rural peace without sacrificing city access. As work-from-home lifestyles have become more common, towns like Independence are increasingly appealing to buyers who don’t need to be downtown every day. That shift in buyer behavior has helped push prices steadily upward. The town’s long-term value growth shows no signs of slowing, especially as inventory remains tight and demand remains strong.
14. Shorewood – 94% Home Price Increase Since 2012
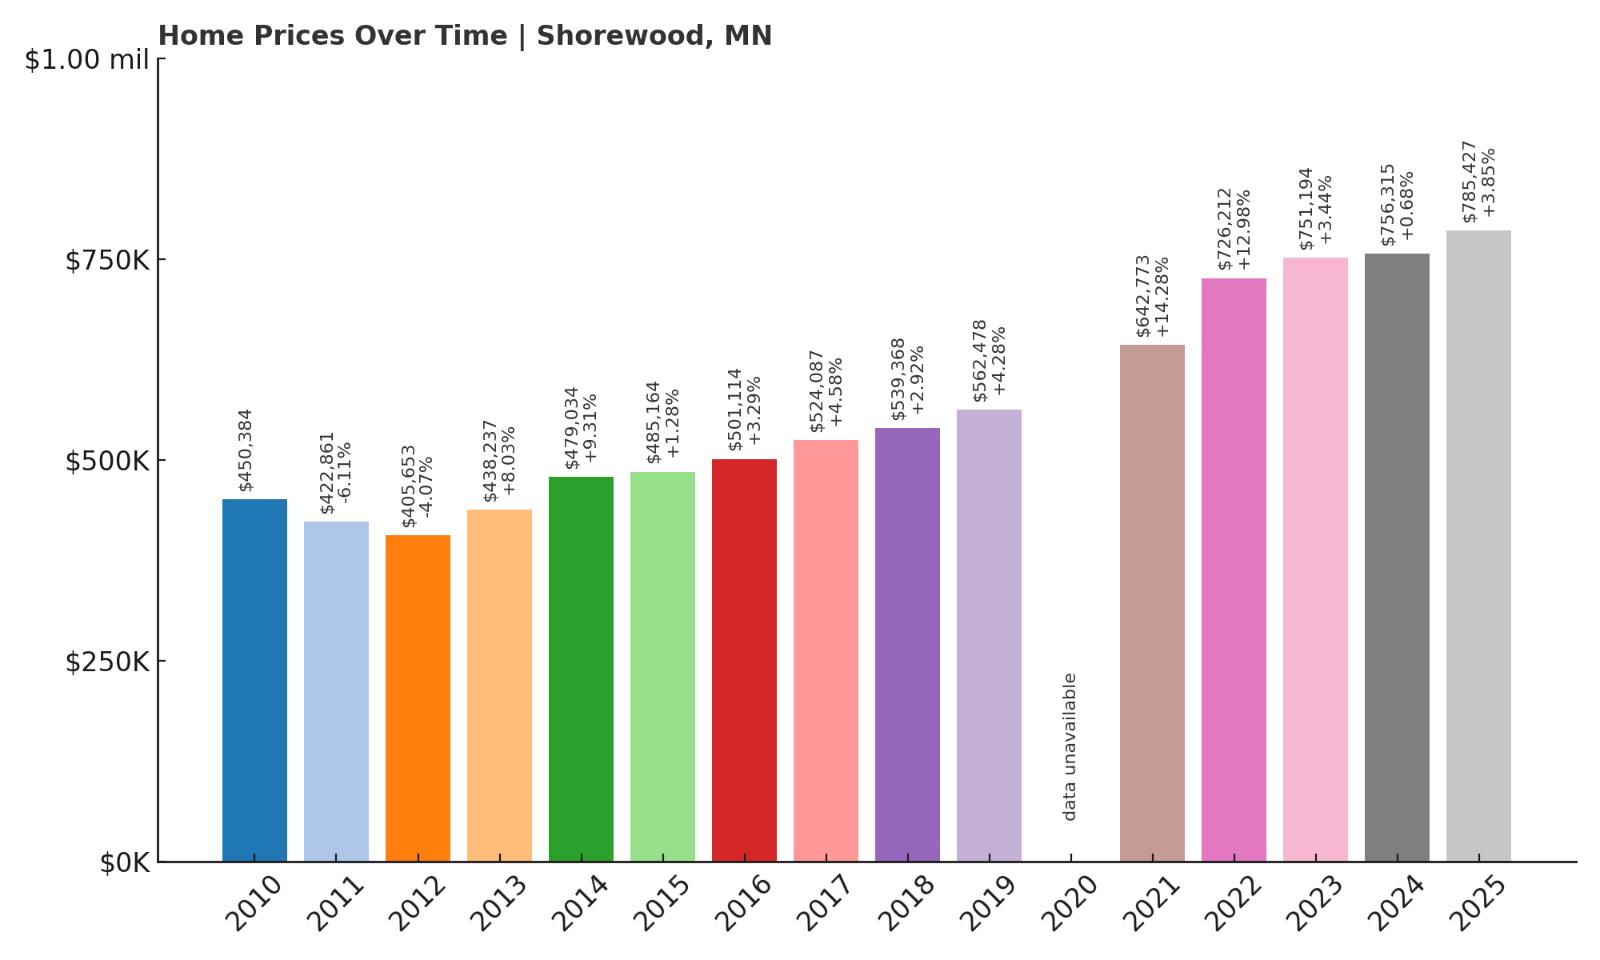
- 2010: $450,384
- 2011: $422,861 ($-27,522, -6.11% from previous year)
- 2012: $405,653 ($-17,209, -4.07% from previous year)
- 2013: $438,237 (+$32,584, +8.03% from previous year)
- 2014: $479,034 (+$40,796, +9.31% from previous year)
- 2015: $485,164 (+$6,130, +1.28% from previous year)
- 2016: $501,114 (+$15,950, +3.29% from previous year)
- 2017: $524,087 (+$22,973, +4.58% from previous year)
- 2018: $539,368 (+$15,282, +2.92% from previous year)
- 2019: $562,478 (+$23,109, +4.28% from previous year)
- 2020: N/A
- 2021: $642,773 (+$80,295, +14.28% from previous year)
- 2022: $726,212 (+$83,439, +12.98% from previous year)
- 2023: $751,194 (+$24,981, +3.44% from previous year)
- 2024: $756,315 (+$5,121, +0.68% from previous year)
- 2025: $785,427 (+$29,113, +3.85% from previous year)
Shorewood’s home prices have surged by nearly 94% since 2012, landing at a median of $785,427 in 2025. The town’s market was already strong before the pandemic, but it truly accelerated starting in 2021, with two consecutive double-digit annual gains. In recent years, the pace of growth has cooled slightly, but prices continue to edge upward each year. Even small year-over-year increases help push the long-term average higher. Shorewood has not seen any sharp price declines over the last decade, suggesting steady demand and a desirable location. The town’s upward trend seems more like a marathon than a sprint, with gradual growth adding up to major gains. This consistency makes Shorewood stand out in a region where volatility can sometimes be the norm. It’s now among the most expensive housing markets in Minnesota, and its stable price trajectory supports that reputation.
Shorewood – Lakeside Comfort Near Minneapolis
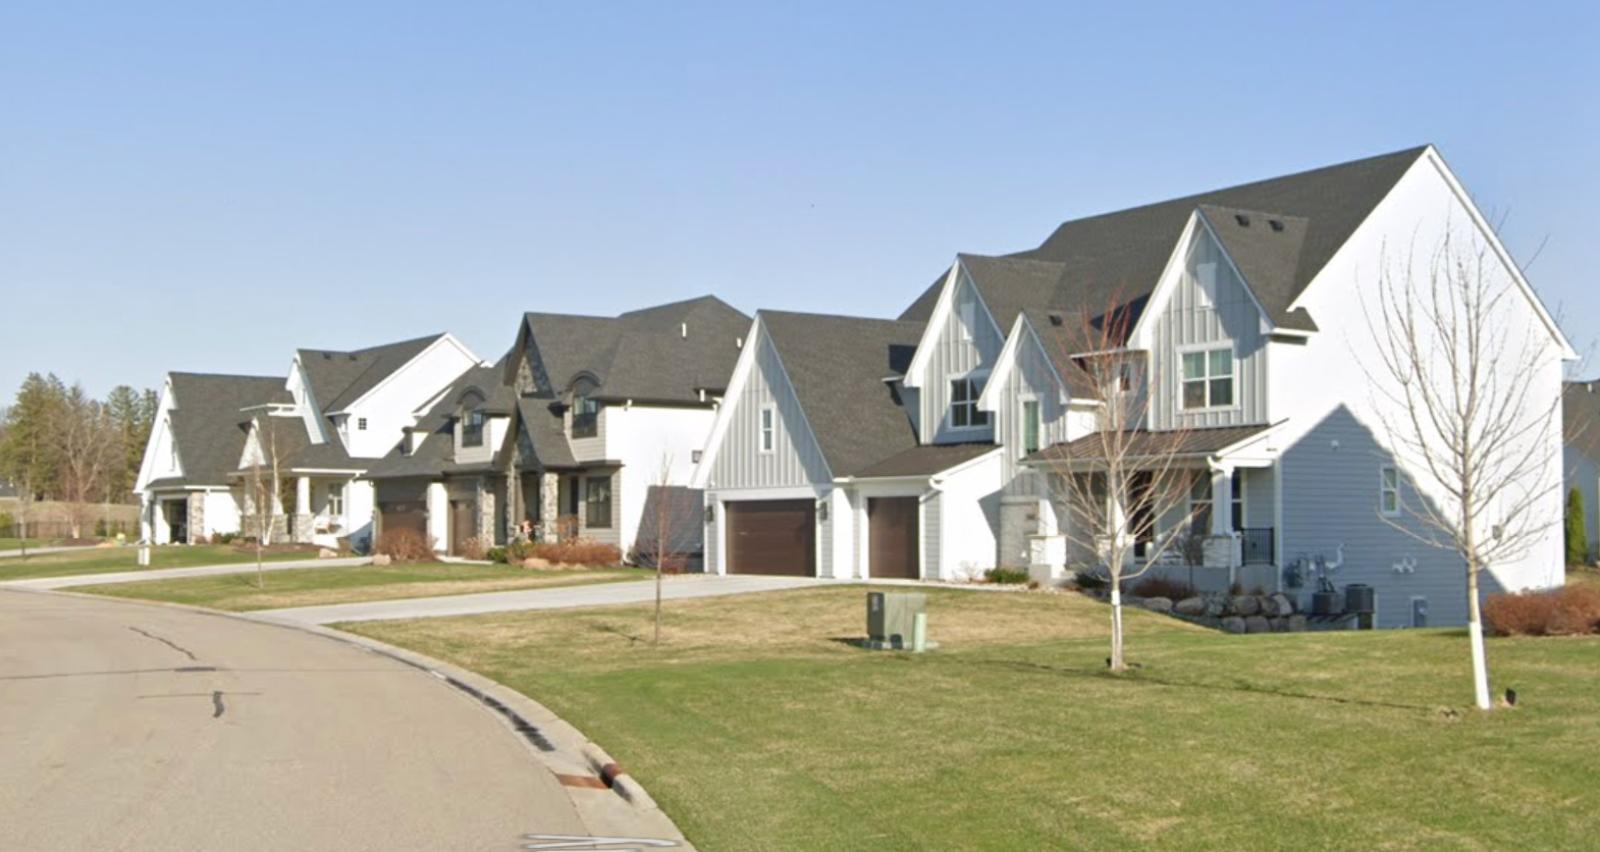
Located on the western shore of Lake Minnetonka, Shorewood is an established and affluent community with strong appeal for luxury buyers. Its homes range from elegant lakefront estates to large suburban properties tucked among the trees. Residents enjoy close proximity to Excelsior, a walkable and historic town center filled with cafes, shops, and waterfront dining. Shorewood also benefits from the Minnetonka School District, often rated among the top in the state. This combination of natural beauty, top-tier schools, and quality housing stock has kept demand high. Many residents are professionals who work in the metro but choose Shorewood for its quiet atmosphere and lake access. These lifestyle benefits have helped maintain steady price growth, even in slower markets. With limited space for new development, housing inventory remains low—putting upward pressure on prices for the long term.
13. Excelsior – 126% Home Price Increase Since 2012
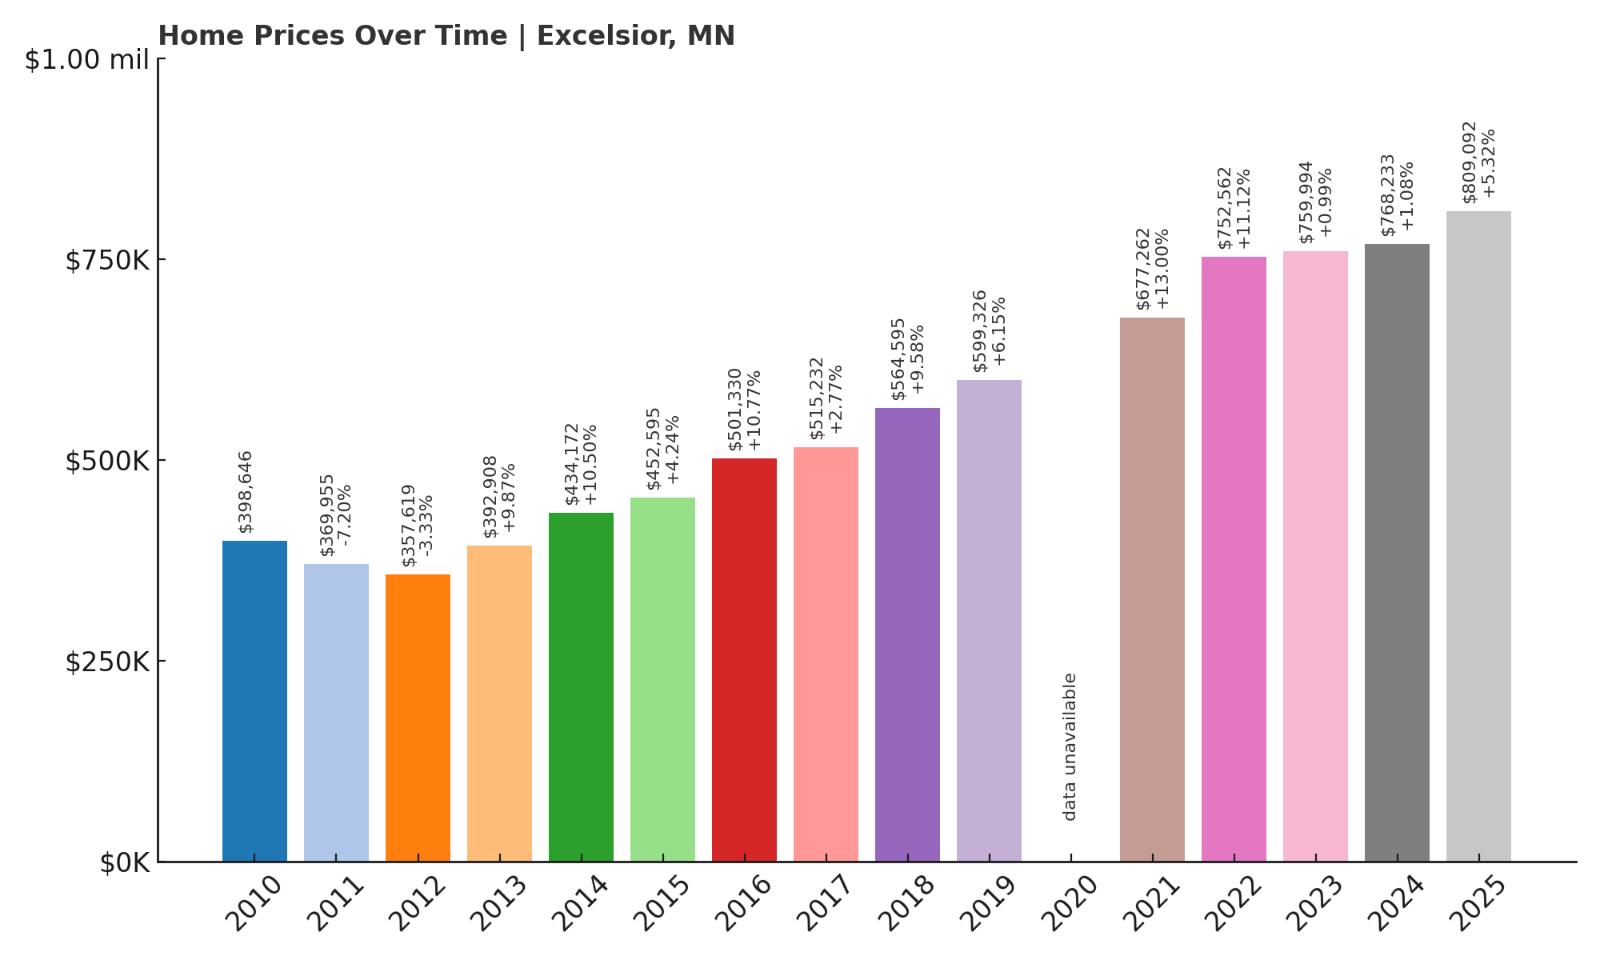
- 2010: $398,646
- 2011: $369,955 ($-28,691, -7.20% from previous year)
- 2012: $357,619 ($-12,336, -3.33% from previous year)
- 2013: $392,908 (+$35,288, +9.87% from previous year)
- 2014: $434,172 (+$41,265, +10.50% from previous year)
- 2015: $452,595 (+$18,423, +4.24% from previous year)
- 2016: $501,330 (+$48,735, +10.77% from previous year)
- 2017: $515,232 (+$13,902, +2.77% from previous year)
- 2018: $564,595 (+$49,363, +9.58% from previous year)
- 2019: $599,326 (+$34,731, +6.15% from previous year)
- 2020: N/A
- 2021: $677,262 (+$77,936, +13.00% from previous year)
- 2022: $752,562 (+$75,300, +11.12% from previous year)
- 2023: $759,994 (+$7,432, +0.99% from previous year)
- 2024: $768,233 (+$8,239, +1.08% from previous year)
- 2025: $809,092 (+$40,859, +5.32% from previous year)
Excelsior’s home values have soared by 126% since 2012, with steady increases that show no sign of reversing. The most dramatic growth occurred during the years following 2020, as values jumped by over 24% in just two years. Prices have since stabilized, but continue to rise incrementally. In 2025, the median home value hit over $800,000 — a significant milestone for a town of its size. The data reveals a market that remains competitive but not chaotic. While appreciation has slowed since 2022, the lack of any meaningful decline suggests strong underlying demand. Excelsior’s property values appear to be supported by both local appeal and broader market trends. Overall, it’s one of the clearest examples of consistent, long-term growth in Minnesota’s luxury housing segment.
Excelsior – Historic Downtown, Big-Time Appeal
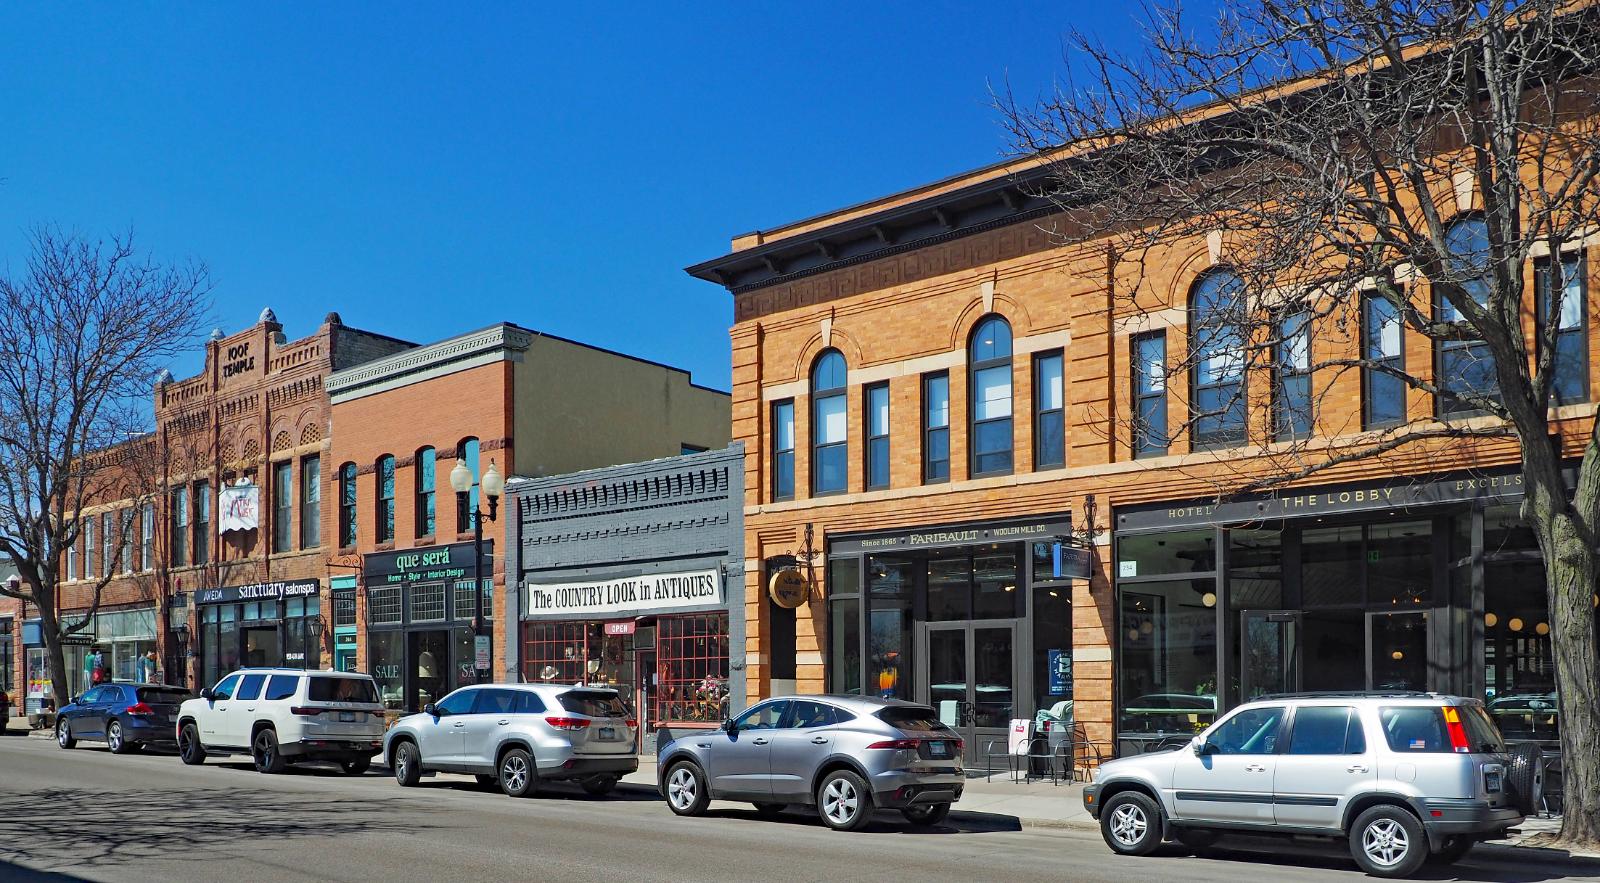
Nestled along the southern edge of Lake Minnetonka, Excelsior blends small-town charm with high-end appeal. Its historic main street features boutique shopping, restaurants, and seasonal events that bring both locals and visitors into town year-round. Homes in Excelsior include both classic bungalows and lakefront properties that regularly command premium prices. As demand has increased, so too has the pressure on available inventory — pushing values steadily upward. The town is walkable, highly livable, and boasts one of the best locations on the lake. Residents enjoy access to boating, trails, and top-rated schools, making it popular among families and retirees alike. Despite its compact size, Excelsior punches above its weight in both amenities and pricing power. The combination of charm, convenience, and quality has helped drive home prices higher every year.
12. Medina – 83% Home Price Increase Since 2012
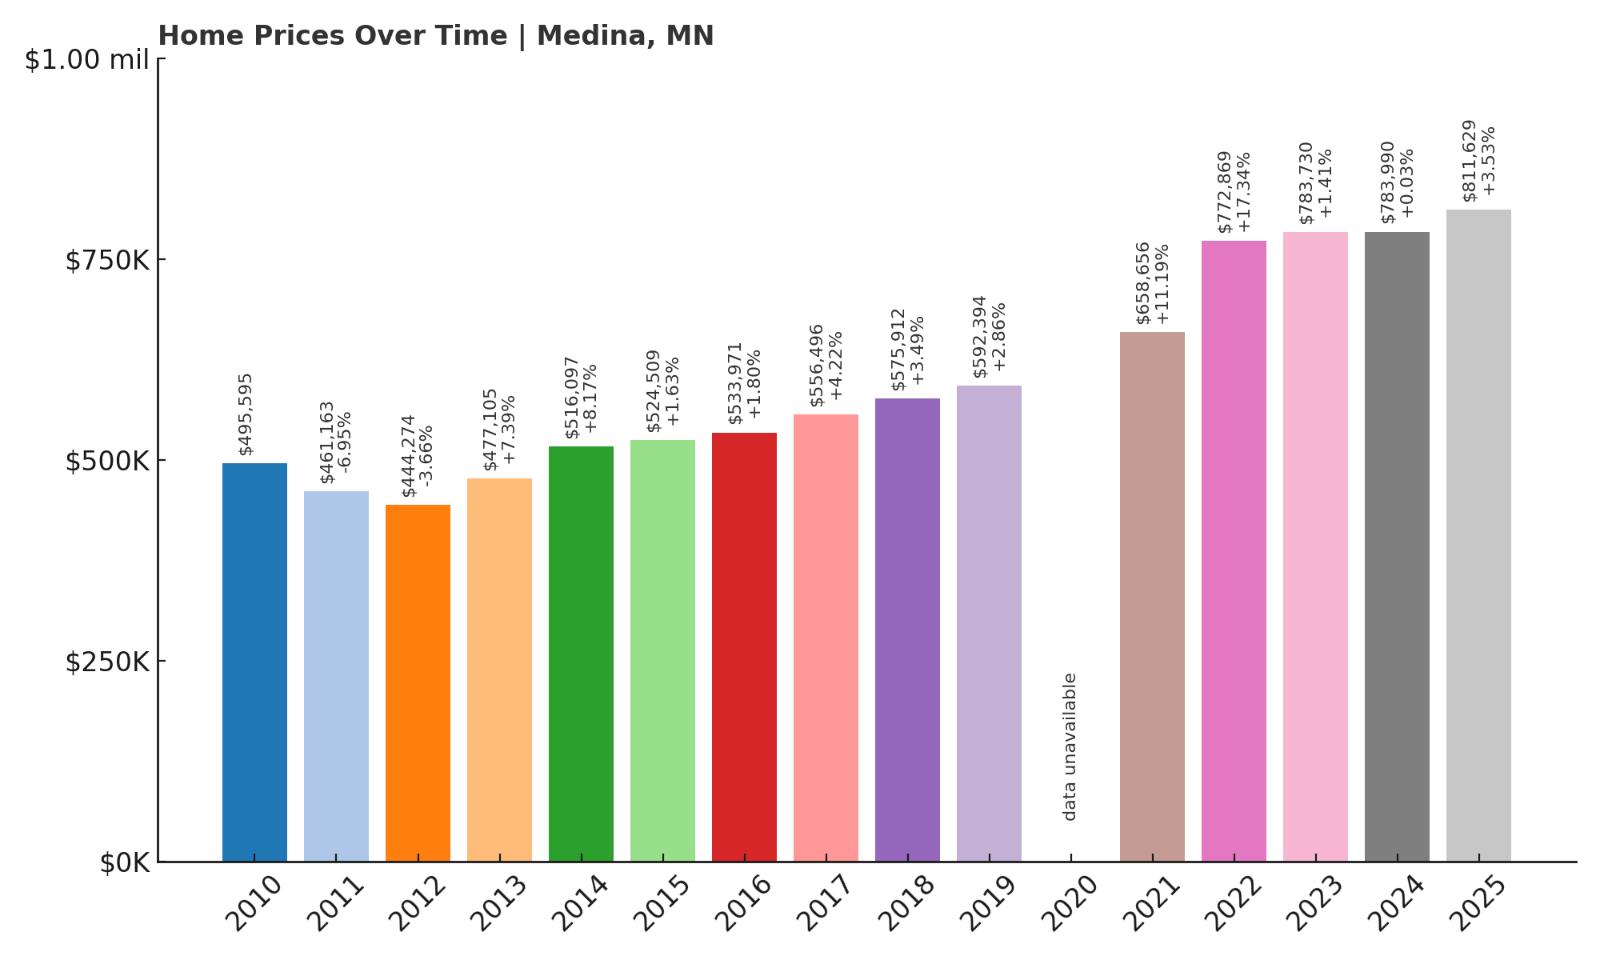
- 2010: $495,595
- 2011: $461,163 ($-34,432, -6.95% from previous year)
- 2012: $444,274 ($-16,889, -3.66% from previous year)
- 2013: $477,105 (+$32,830, +7.39% from previous year)
- 2014: $516,097 (+$38,993, +8.17% from previous year)
- 2015: $524,509 (+$8,412, +1.63% from previous year)
- 2016: $533,971 (+$9,461, +1.80% from previous year)
- 2017: $556,496 (+$22,525, +4.22% from previous year)
- 2018: $575,912 (+$19,416, +3.49% from previous year)
- 2019: $592,394 (+$16,482, +2.86% from previous year)
- 2020: N/A
- 2021: $658,656 (+$66,262, +11.19% from previous year)
- 2022: $772,869 (+$114,213, +17.34% from previous year)
- 2023: $783,730 (+$10,861, +1.41% from previous year)
- 2024: $783,990 (+$260, +0.03% from previous year)
- 2025: $811,629 (+$27,639, +3.53% from previous year)
Medina’s home prices have grown 83% since 2012, jumping from $444,274 to $811,629 in 2025. The town’s price curve reflects a long-term upward trend with only minor fluctuations, even during turbulent housing cycles. The biggest leaps came in 2021 and 2022, when values rose by nearly 30% combined. Recent years show modest but steady growth, a sign that prices are stabilizing at a high level rather than cooling off completely. Medina’s consistency makes it stand out, especially when compared to more volatile markets nearby. There’s been no major price crash or decline in the data, which suggests that buyer demand is resilient. With each year, Medina has reinforced its status as a high-value housing market. The trajectory reflects a community that’s matured into one of the state’s most stable premium areas.
Medina – Executive Homes and High-End Growth
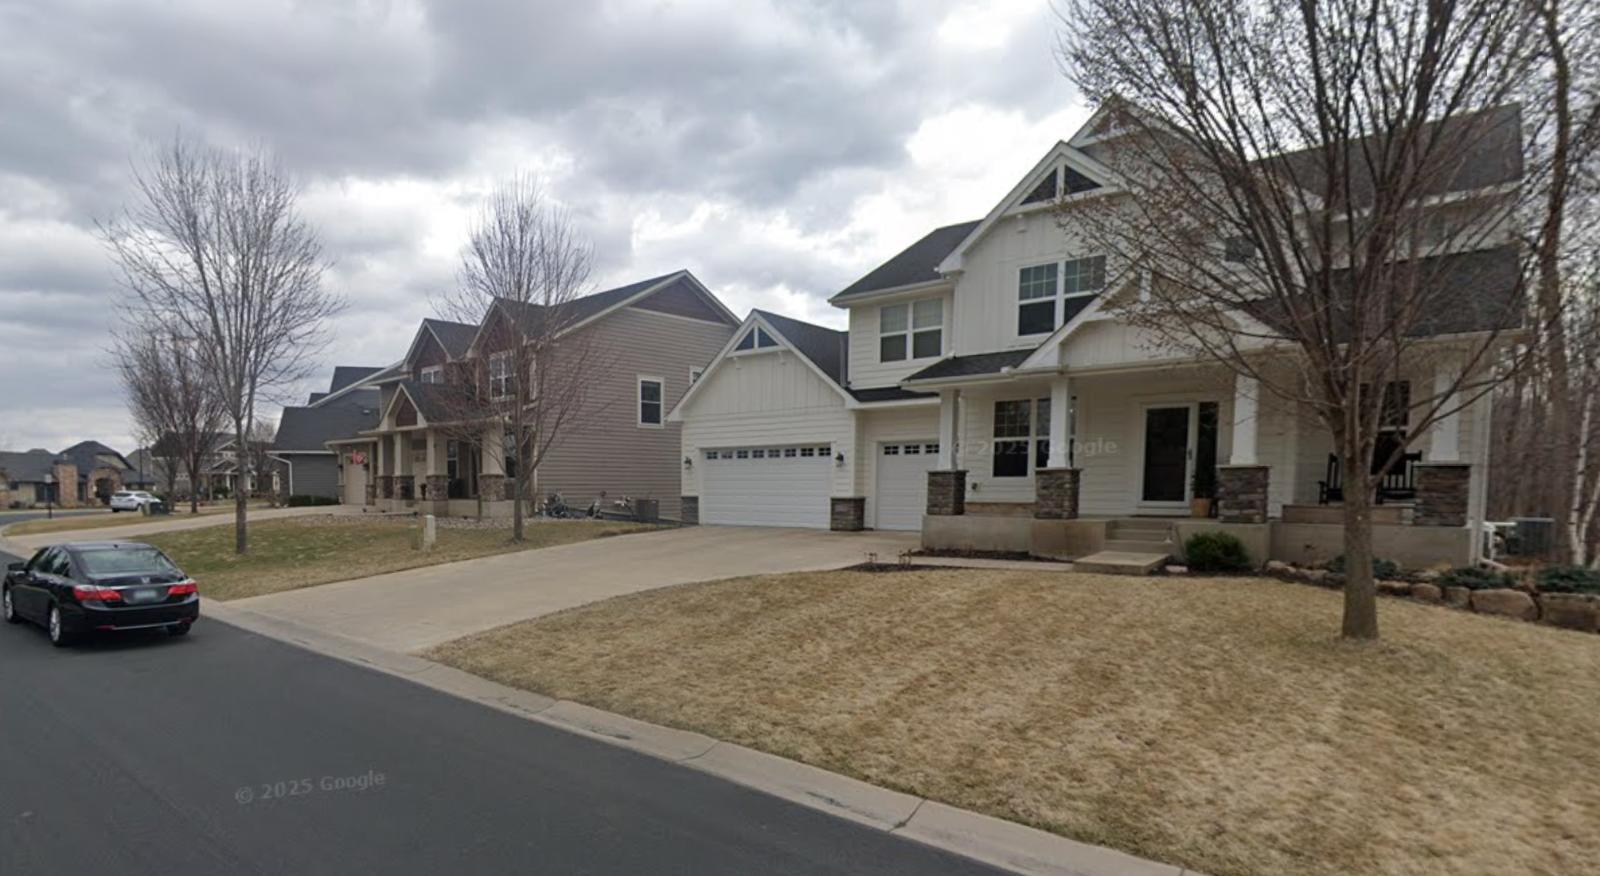
Located northwest of Minneapolis, Medina is an upscale suburb known for its rolling landscapes, luxury housing, and equestrian estates. It’s home to the Medina Golf & Country Club and sits within the award-winning Orono and Wayzata school districts, two big draws for affluent families. The area offers generous lot sizes and a mix of newer developments and custom homes, many featuring modern amenities and high-end finishes. With fewer commercial developments and a strong emphasis on residential space, the town appeals to buyers looking for tranquility and privacy. Its location just off Highway 55 offers convenient access to major job centers, making it ideal for executives. Medina also maintains strict development standards, preserving both natural character and property values. These factors have created sustained interest in the local real estate market, especially as remote work broadens the scope of desirable locations. Prices reflect both quality and exclusivity — a pattern likely to continue as the area grows in reputation.
11. Wayzata – 99% Home Price Increase Since 2012
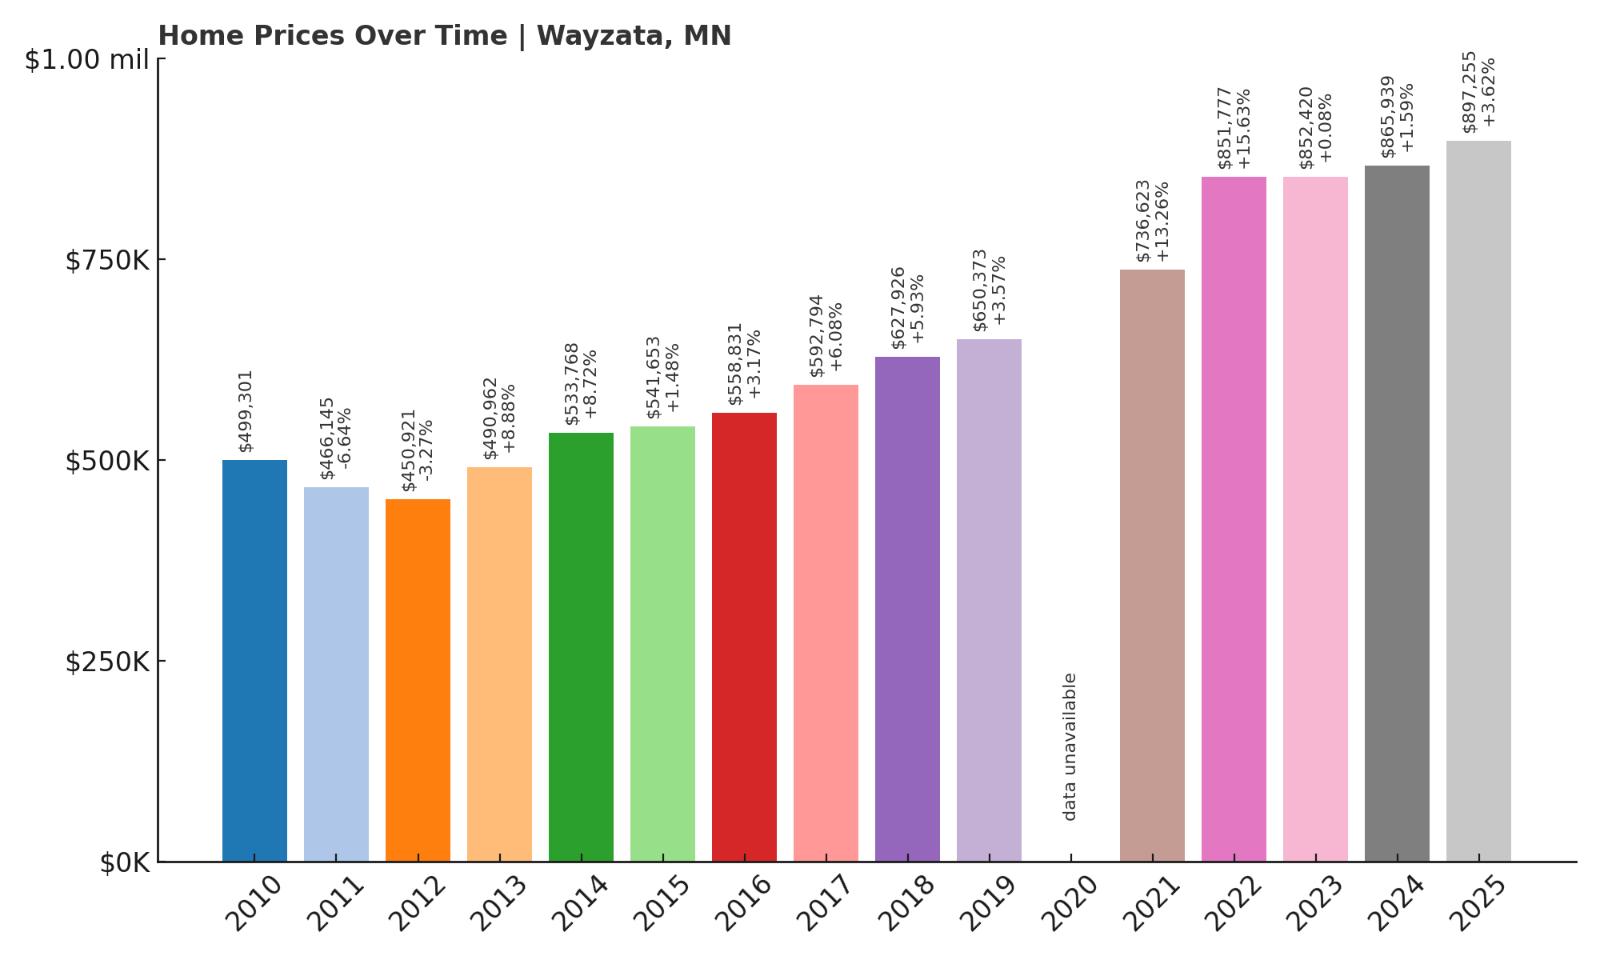

- 2010: $499,301
- 2011: $466,145 ($-33,157, -6.64% from previous year)
- 2012: $450,921 ($-15,224, -3.27% from previous year)
- 2013: $490,962 (+$40,042, +8.88% from previous year)
- 2014: $533,768 (+$42,806, +8.72% from previous year)
- 2015: $541,653 (+$7,885, +1.48% from previous year)
- 2016: $558,831 (+$17,177, +3.17% from previous year)
- 2017: $592,794 (+$33,963, +6.08% from previous year)
- 2018: $627,926 (+$35,132, +5.93% from previous year)
- 2019: $650,373 (+$22,448, +3.57% from previous year)
- 2020: N/A
- 2021: $736,623 (+$86,250, +13.26% from previous year)
- 2022: $851,777 (+$115,153, +15.63% from previous year)
- 2023: $852,420 (+$644, +0.08% from previous year)
- 2024: $865,939 (+$13,519, +1.59% from previous year)
- 2025: $897,255 (+$31,316, +3.62% from previous year)
Wayzata has nearly doubled in value since 2012, climbing from $450,921 to $897,255 by 2025. The city’s price growth has been both steady and strong, peaking with two major increases in 2021 and 2022. Even in slower years like 2023, prices didn’t drop — they simply plateaued before rising again. That signals a resilient and highly desirable market, one that buyers view as a long-term investment. Wayzata’s prime lakeside location plays a key role in its pricing strength, but so does its small-town feel and quality of life. With such a consistent pattern of appreciation, it’s no wonder the town frequently ranks among Minnesota’s most expensive markets. Notably, there were no years of sharp declines post-2012, further underscoring its market reliability. At nearly $900K in 2025, Wayzata represents a high bar for suburban living in the Twin Cities metro.
Wayzata – Lake Minnetonka’s Crown Jewel
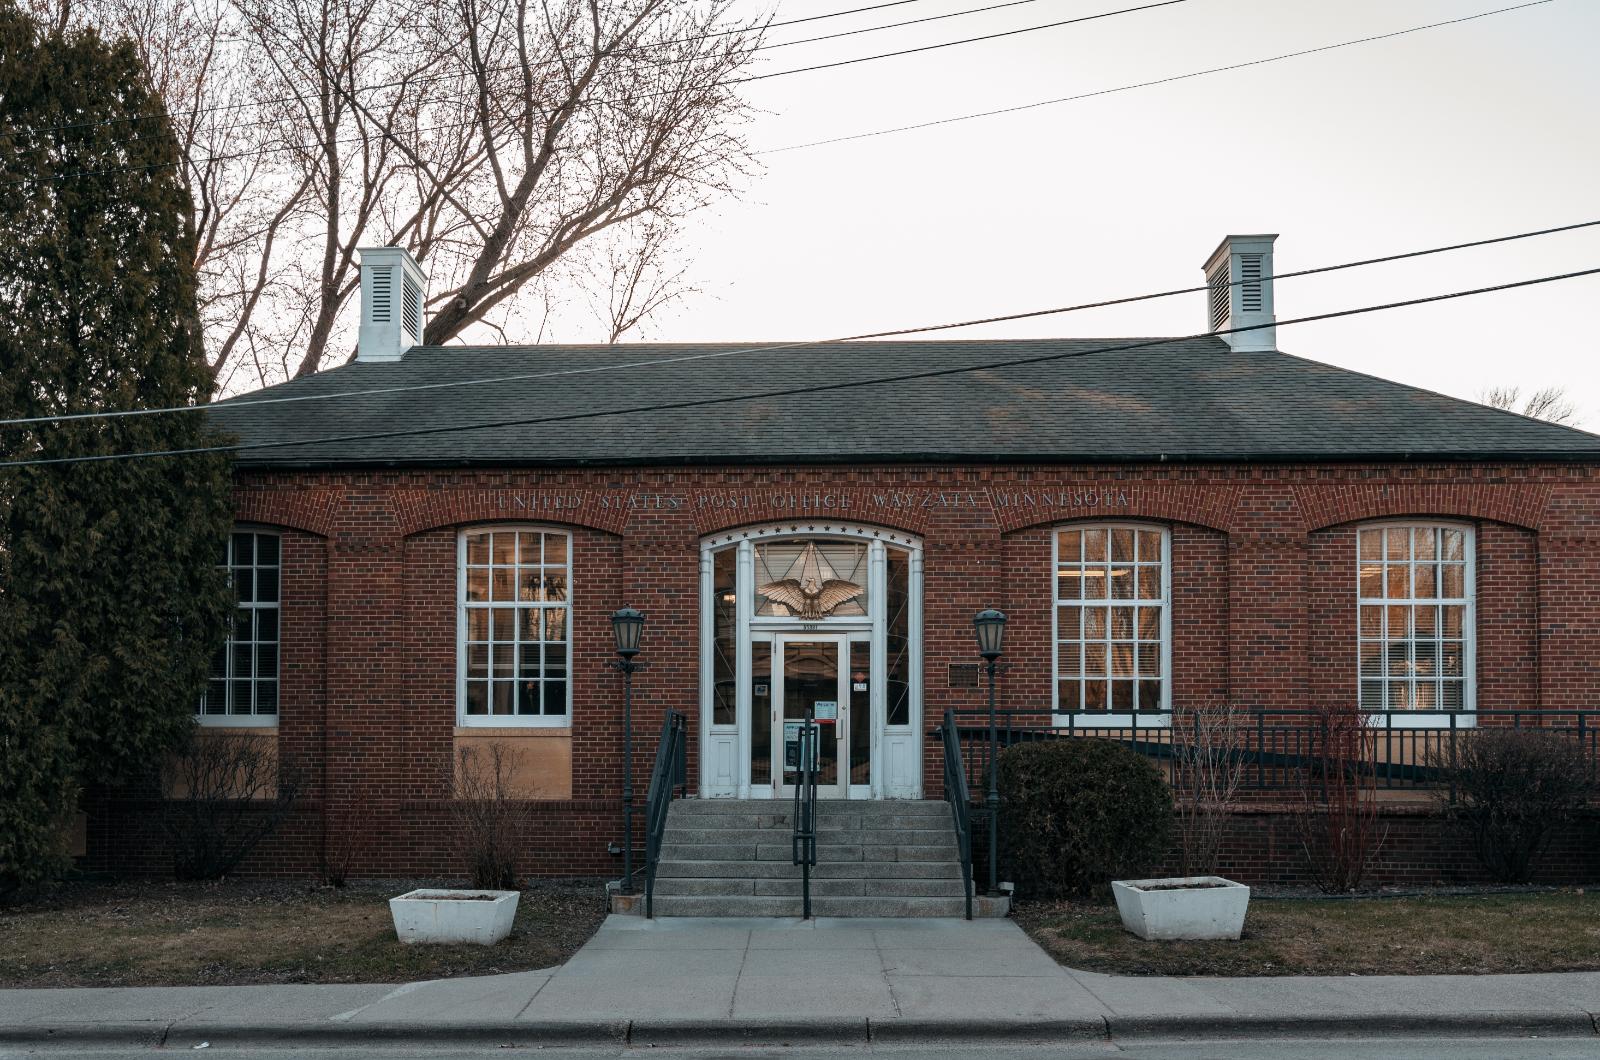
Wayzata is a waterfront town with big appeal, known for its walkable downtown, scenic views, and access to Lake Minnetonka. It offers a blend of old-world charm and modern luxury, with upscale boutiques, gourmet restaurants, and lakefront condos all within blocks of each other. The town’s marina and beaches attract residents and tourists alike, especially during Minnesota’s warmer months. Homes here range from well-kept historic properties to multi-million dollar new builds perched right on the lake. It also enjoys a reputation for excellent schools, civic pride, and community involvement. Wayzata’s location along Highway 12 makes it a favored home base for professionals working in Minneapolis. The demand for housing continues to outpace supply, especially for premium properties with water views. That persistent demand is a key reason Wayzata continues to lead the pack in home value appreciation.
10. Dellwood – 106% Home Price Increase Since 2012
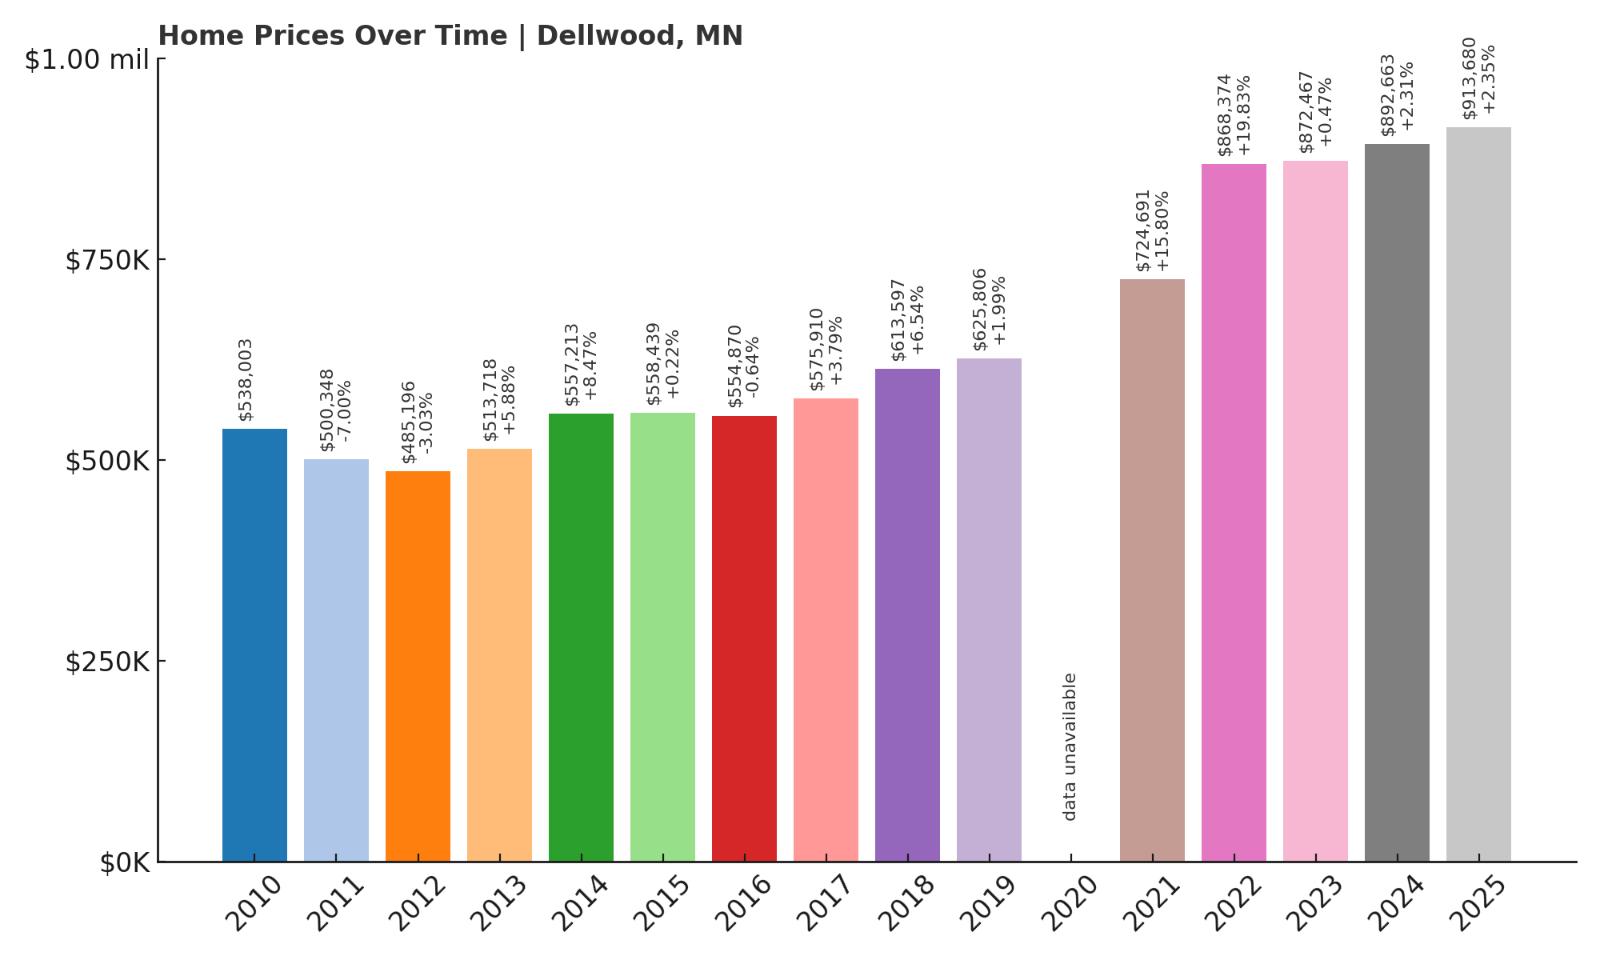
- 2010: $538,003
- 2011: $500,348 ($-37,655, -7.00% from previous year)
- 2012: $485,196 ($-15,152, -3.03% from previous year)
- 2013: $513,718 (+$28,523, +5.88% from previous year)
- 2014: $557,213 (+$43,495, +8.47% from previous year)
- 2015: $558,439 (+$1,226, +0.22% from previous year)
- 2016: $554,870 ($-3,568, -0.64% from previous year)
- 2017: $575,910 (+$21,039, +3.79% from previous year)
- 2018: $613,597 (+$37,687, +6.54% from previous year)
- 2019: $625,806 (+$12,210, +1.99% from previous year)
- 2020: N/A
- 2021: $724,691 (+$98,884, +15.80% from previous year)
- 2022: $868,374 (+$143,683, +19.83% from previous year)
- 2023: $872,467 (+$4,093, +0.47% from previous year)
- 2024: $892,663 (+$20,196, +2.31% from previous year)
- 2025: $913,680 (+$21,017, +2.35% from previous year)
Dellwood’s home prices have climbed 106% since 2012, making it one of the most expensive small towns in Minnesota by 2025. After a modest early decade, the post-2020 period brought substantial price hikes, especially in 2021 and 2022 when values jumped by more than 35% combined. The growth has since moderated, but continues to trend upward at a healthy pace. There have been no significant declines, which speaks to Dellwood’s enduring appeal among high-end buyers. Its price consistency suggests strong underlying fundamentals like desirable location, limited housing stock, and long-standing demand. Each year has either held steady or delivered moderate growth, helping to establish a reliable track record. The current median price of over $913K puts it in the state’s luxury bracket, but without the volatility often seen in similarly priced areas. Buyers looking for long-term value have found Dellwood a safe and appreciating investment.
Dellwood – Prestige in the Northeast Metro
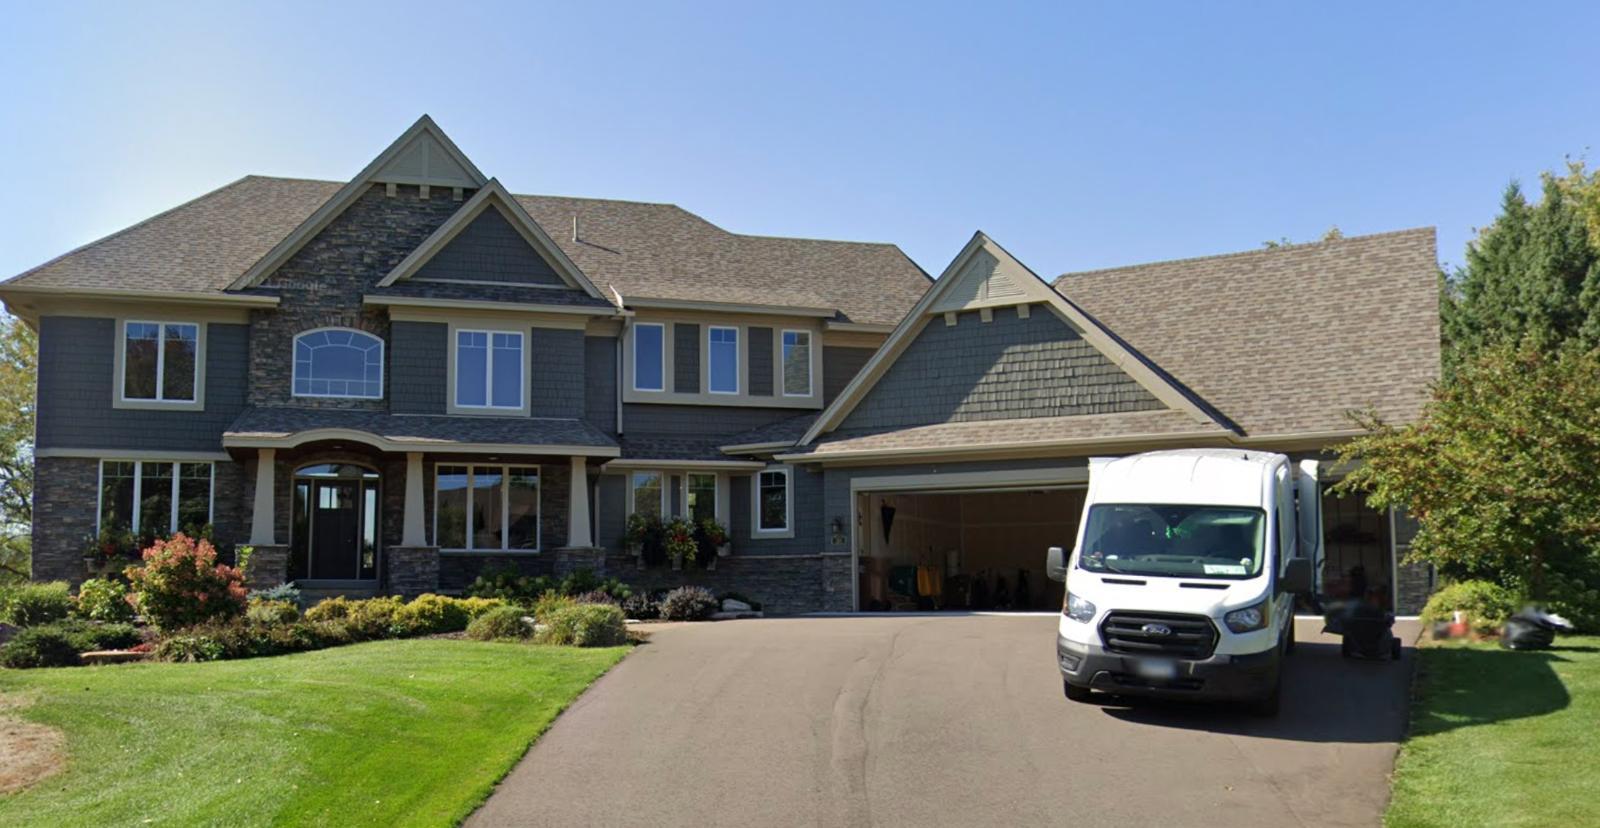
Tucked near White Bear Lake in the northeastern Twin Cities suburbs, Dellwood is a quiet, affluent enclave known for privacy and exclusivity. The town features sprawling estates, tree-lined roads, and minimal commercial development. It’s a favorite among executives, athletes, and long-time Minnesotans seeking upscale living close to the metro. Dellwood has some of the highest median incomes in the state and is home to the private Dellwood Country Club. Despite its elite reputation, the town maintains a peaceful, low-profile feel that appeals to residents looking for discretion. Limited lot turnover keeps inventory tight, further driving price pressure when properties do hit the market. Its blend of old-money charm and newer high-end builds ensures strong buyer interest. With continued upward momentum in home values, Dellwood remains firmly positioned in Minnesota’s luxury real estate tier.
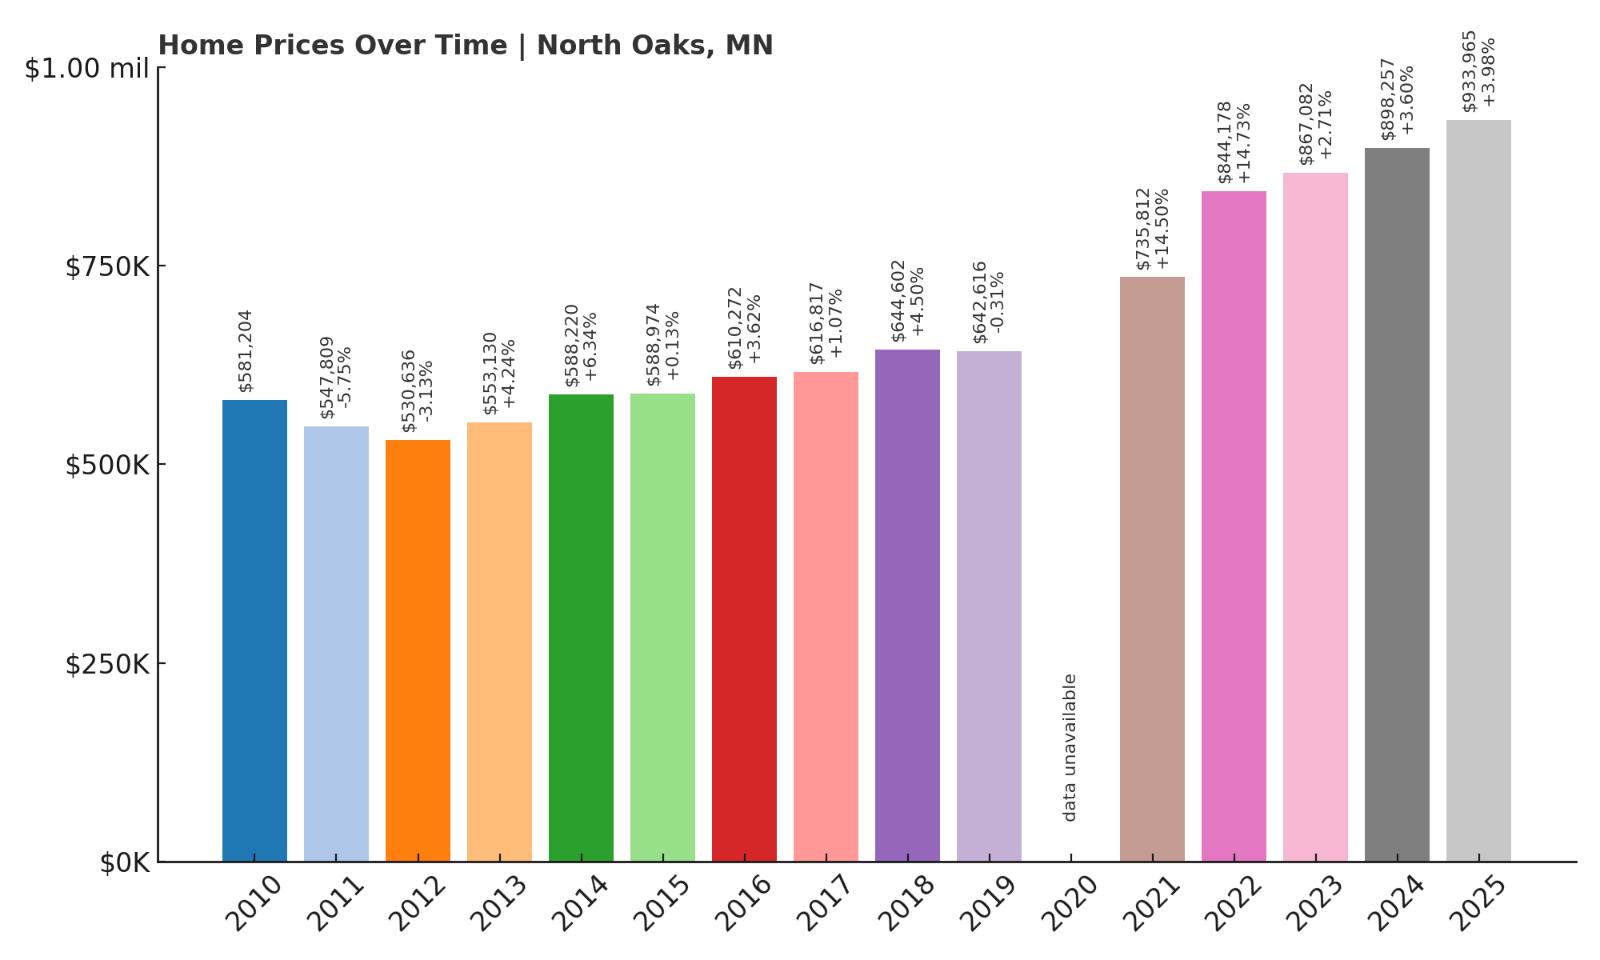
9. North Oaks – 76% Home Price Increase Since 2012
Would you like to save this?
- 2010: $581,204
- 2011: $547,809 ($-33,395, -5.75% from previous year)
- 2012: $530,636 ($-17,173, -3.13% from previous year)
- 2013: $553,130 (+$22,495, +4.24% from previous year)
- 2014: $588,220 (+$35,090, +6.34% from previous year)
- 2015: $588,974 (+$755, +0.13% from previous year)
- 2016: $610,272 (+$21,297, +3.62% from previous year)
- 2017: $616,817 (+$6,545, +1.07% from previous year)
- 2018: $644,602 (+$27,785, +4.50% from previous year)
- 2019: $642,616 ($-1,986, -0.31% from previous year)
- 2020: N/A
- 2021: $735,812 (+$93,196, +14.50% from previous year)
- 2022: $844,178 (+$108,367, +14.73% from previous year)
- 2023: $867,082 (+$22,903, +2.71% from previous year)
- 2024: $898,257 (+$31,175, +3.60% from previous year)
- 2025: $933,965 (+$35,708, +3.98% from previous year)
North Oaks has seen a 76% increase in home values since 2012, rising from $530,636 to $933,965 in 2025. While the growth was relatively modest in the early years, things picked up dramatically during the 2021 and 2022 housing boom. During those two years alone, prices increased by more than $200,000. The post-pandemic years have continued that upward trend, with steady year-over-year increases around 3–4%. This consistency signals a robust market supported by enduring demand and high-income buyers. North Oaks avoided any severe dips, with just one minor decline in 2019 that was quickly reversed. Since 2013, nearly every year has added value, indicating sustained strength. As of 2025, the town sits just under the million-dollar mark — but its trend suggests it could soon surpass it.
North Oaks – A Private, Master-Planned Community
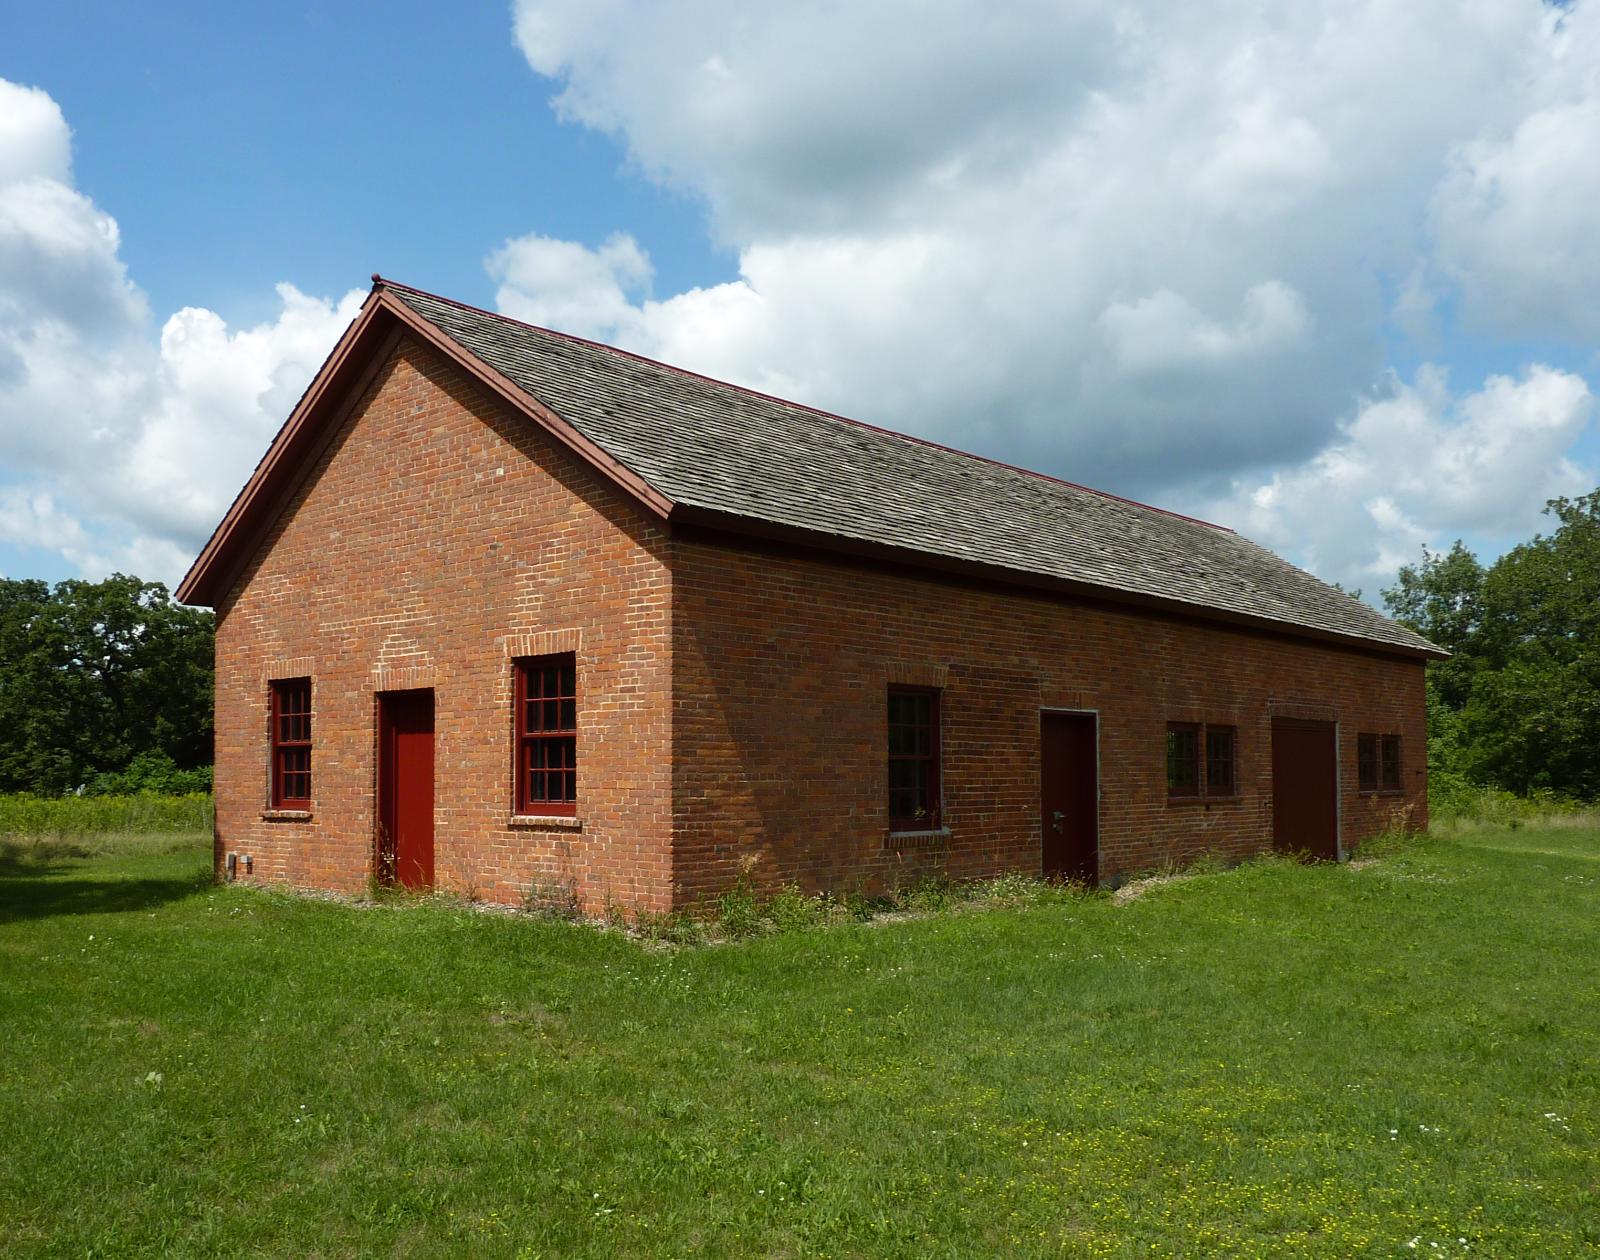
North Oaks is one of Minnesota’s most unique towns: it’s privately owned and accessible only to residents and invited guests. Located just northeast of St. Paul, the community was originally developed by the Hill family and still operates under strict preservation agreements and community covenants. Roads are privately maintained, and public access is limited, which helps preserve its quiet, residential nature. The town offers large homes, private lakes, and miles of walking trails through woods and wetlands. There are no commercial zones, which means no stores, restaurants, or businesses within the town’s limits. That level of exclusivity, combined with proximity to the Twin Cities, continues to make North Oaks one of the metro’s most desirable addresses.
Homeowners are drawn to North Oaks not just for its privacy, but for its planning and land stewardship. The town’s land use policies have prevented overdevelopment and maintained low density. Many properties sit on multi-acre wooded lots, and the architectural styles favor upscale, custom-built homes. That low turnover and large footprint help explain why prices keep rising year after year. It’s a place where residents stay for decades, contributing to stable pricing and strong resale value. As demand grows for peace and space near major metros, North Oaks remains one of the few places offering both — and buyers are willing to pay a premium for that privilege.
8. Deephaven – 118% Home Price Increase Since 2012
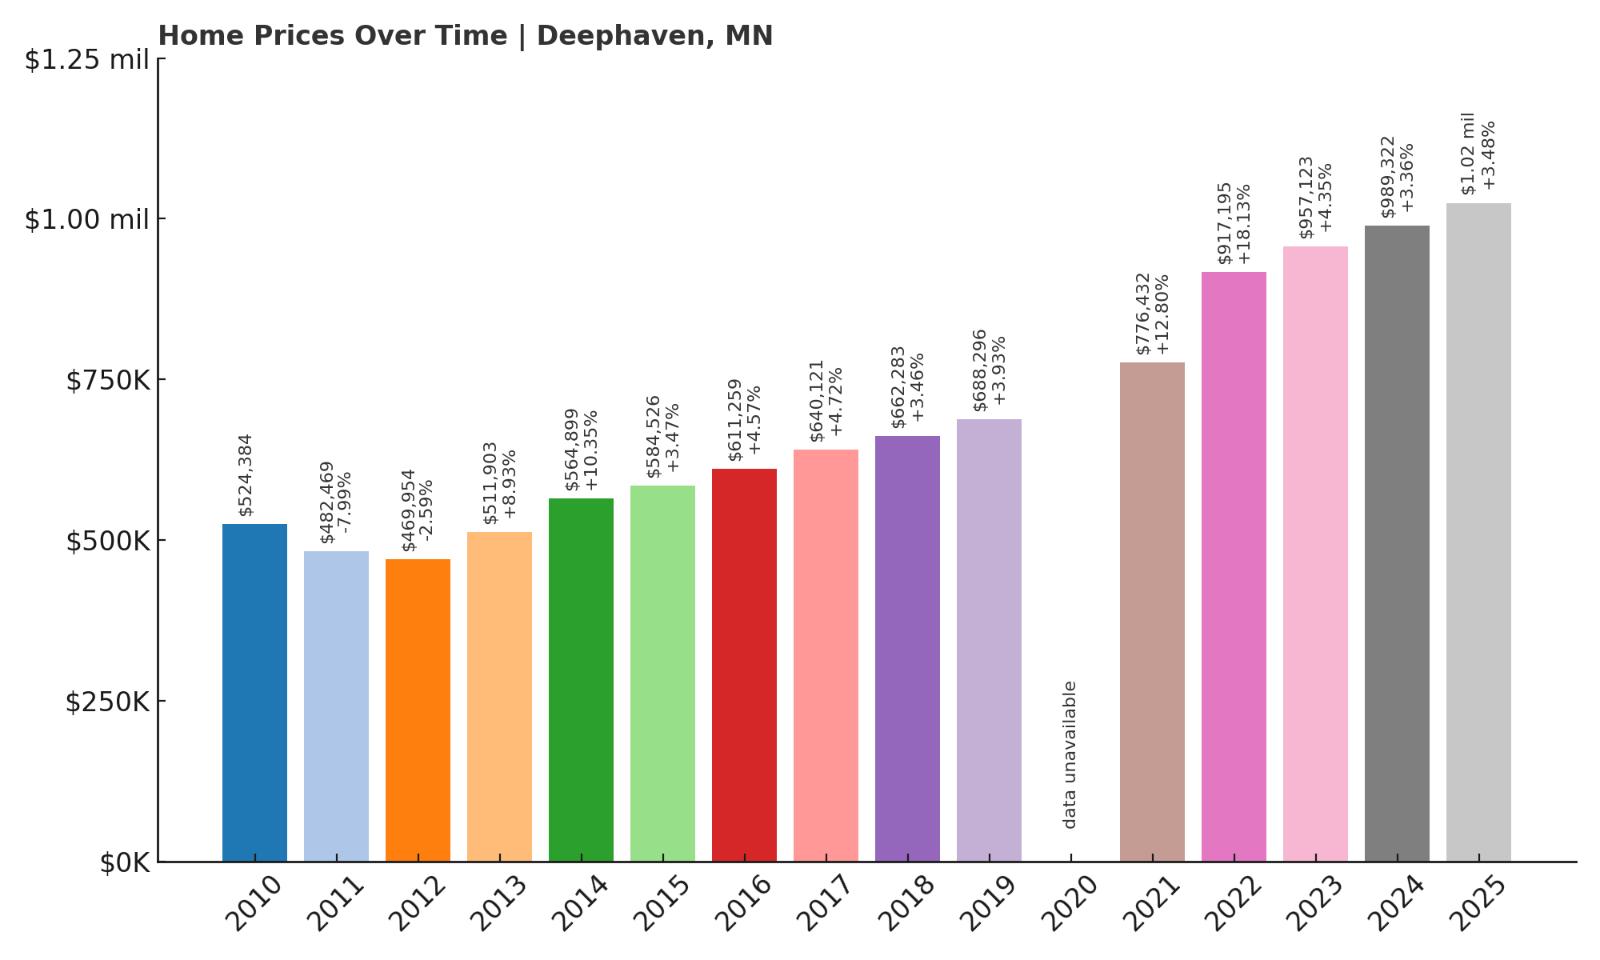
- 2010: $524,384
- 2011: $482,469 ($-41,915, -7.99% from previous year)
- 2012: $469,954 ($-12,515, -2.59% from previous year)
- 2013: $511,903 (+$41,950, +8.93% from previous year)
- 2014: $564,899 (+$52,995, +10.35% from previous year)
- 2015: $584,526 (+$19,627, +3.47% from previous year)
- 2016: $611,259 (+$26,734, +4.57% from previous year)
- 2017: $640,121 (+$28,862, +4.72% from previous year)
- 2018: $662,283 (+$22,162, +3.46% from previous year)
- 2019: $688,296 (+$26,013, +3.93% from previous year)
- 2020: N/A
- 2021: $776,432 (+$88,136, +12.80% from previous year)
- 2022: $917,195 (+$140,763, +18.13% from previous year)
- 2023: $957,123 (+$39,928, +4.35% from previous year)
- 2024: $989,322 (+$32,199, +3.36% from previous year)
- 2025: $1,023,762 (+$34,440, +3.48% from previous year)
Deephaven’s home values have surged by 118% since 2012, moving from $469,954 to over $1.02 million in 2025. The biggest leaps happened post-2020, with values jumping nearly $230,000 from 2021 to 2022 alone. But even before that, the town enjoyed steady annual increases of 3% to 5%, underscoring its long-term strength. Growth has continued in the 3–4% range since 2023, reflecting a stable high-end market. Deephaven crossed the million-dollar threshold in 2025 and remains one of the most attractive luxury communities in the metro. Its data shows almost no volatility — no sharp drops, no price shocks — just a clean upward slope. That makes it one of the most reliable luxury markets in the state. The consistency speaks to the deep demand for high-quality homes near the lake and close to Minneapolis.
Deephaven – Family-Friendly and Lake Minnetonka-Facing
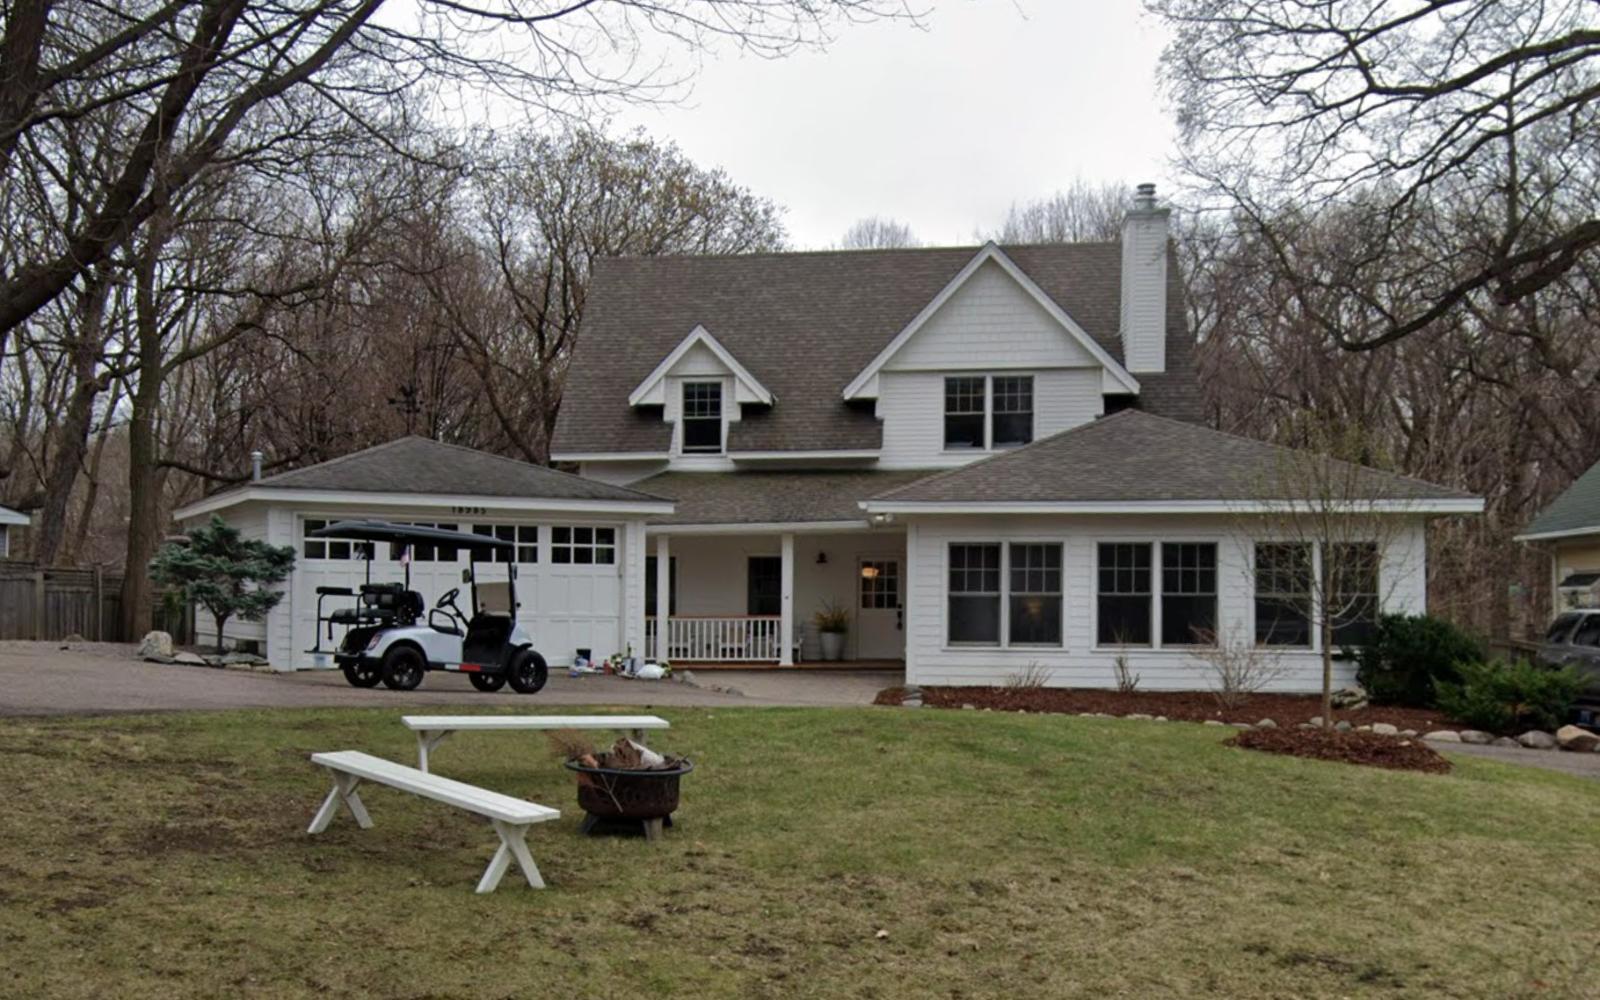
Deephaven is a picturesque residential town along Lake Minnetonka’s southeast edge, known for its leafy neighborhoods and excellent public schools. It’s a favorite among families who want a mix of access to the city and a laid-back lakeside lifestyle. Many homes offer water views or lake access, with wide yards and quiet cul-de-sacs. Residents enjoy proximity to Excelsior and Wayzata, making errands and dining easy without sacrificing tranquility. Parks, beaches, and marinas are part of daily life in Deephaven, and the town has made smart investments in maintaining its trails and green spaces. Unlike more commercial lake towns, Deephaven remains almost entirely residential — and residents love it that way.
With large, well-kept properties and little turnover, homes here tend to be passed down or sold quietly. That keeps inventory low and pricing strong. The neighborhood’s top-rated schools, particularly within the Minnetonka School District, add to its value for families with school-aged children. Deephaven’s appeal also lies in its balance: it offers luxury without flash, seclusion without remoteness. As more buyers seek privacy with convenience, this town continues to check all the right boxes. That’s why prices here have not only climbed but held their ground — and why 2025 saw Deephaven officially join Minnesota’s million-dollar club.
7. Orono – 105% Home Price Increase Since 2012

- 2010: $595,942
- 2011: $551,264 ($-44,677, -7.50% from previous year)
- 2012: $531,720 ($-19,544, -3.55% from previous year)
- 2013: $562,894 (+$31,174, +5.86% from previous year)
- 2014: $608,456 (+$45,561, +8.09% from previous year)
- 2015: $613,220 (+$4,764, +0.78% from previous year)
- 2016: $633,493 (+$20,273, +3.31% from previous year)
- 2017: $666,071 (+$32,578, +5.14% from previous year)
- 2018: $700,907 (+$34,835, +5.23% from previous year)
- 2019: $732,362 (+$31,455, +4.49% from previous year)
- 2020: N/A
- 2021: $815,904 (+$83,542, +11.41% from previous year)
- 2022: $988,975 (+$173,070, +21.21% from previous year)
- 2023: $1,019,593 (+$30,619, +3.10% from previous year)
- 2024: $1,048,755 (+$29,161, +2.86% from previous year)
- 2025: $1,090,718 (+$41,963, +4.00% from previous year)
Orono’s home values have more than doubled since 2012, increasing from $531,720 to over $1.09 million in 2025. The sharpest rise occurred between 2021 and 2022, with a stunning 21% leap in just one year. Despite cooling in recent years, the growth has remained positive and stable. What sets Orono apart is the consistency of its appreciation — no major dips, just a steady climb year after year. In fact, even the modest years saw gains over 2–5%, reinforcing the area’s market strength. The city entered the seven-figure median bracket in 2023 and hasn’t looked back. For homeowners and investors alike, Orono has proven to be a highly rewarding long-term hold. It’s a textbook example of sustained, high-end real estate growth.
Orono – Lakes, Luxury, and Long-Term Demand
Orono is located along the northern shoreline of Lake Minnetonka and is known for its spacious lakefront estates and forested landscapes. The town offers both seclusion and proximity to Minneapolis, making it ideal for high-income commuters and remote workers alike. Orono’s schools consistently rank among the best in Minnesota, adding even more appeal for families looking for a long-term home base. Its large parcels of land and strict zoning laws limit overdevelopment, helping maintain a rural, residential atmosphere despite growing demand. Residents enjoy boating, hiking, and scenic views — all within one of the wealthiest ZIP codes in the state. With limited new construction and high demand, home values here tend to appreciate steadily rather than spike and crash.
The local housing stock leans heavily toward custom homes and lakefront mansions, with few starter homes or condos available. This has made Orono a destination for second-home buyers, executives, and retirees looking for tranquility without sacrificing luxury. In recent years, the appeal has widened as remote work has made it easier to live farther from downtown job hubs. Yet despite this growth in interest, turnover remains low, and listings are quickly snapped up. Many homeowners stay for decades, further limiting supply and helping drive prices even higher. These dynamics continue to support Orono’s status as one of Minnesota’s most exclusive and resilient markets.
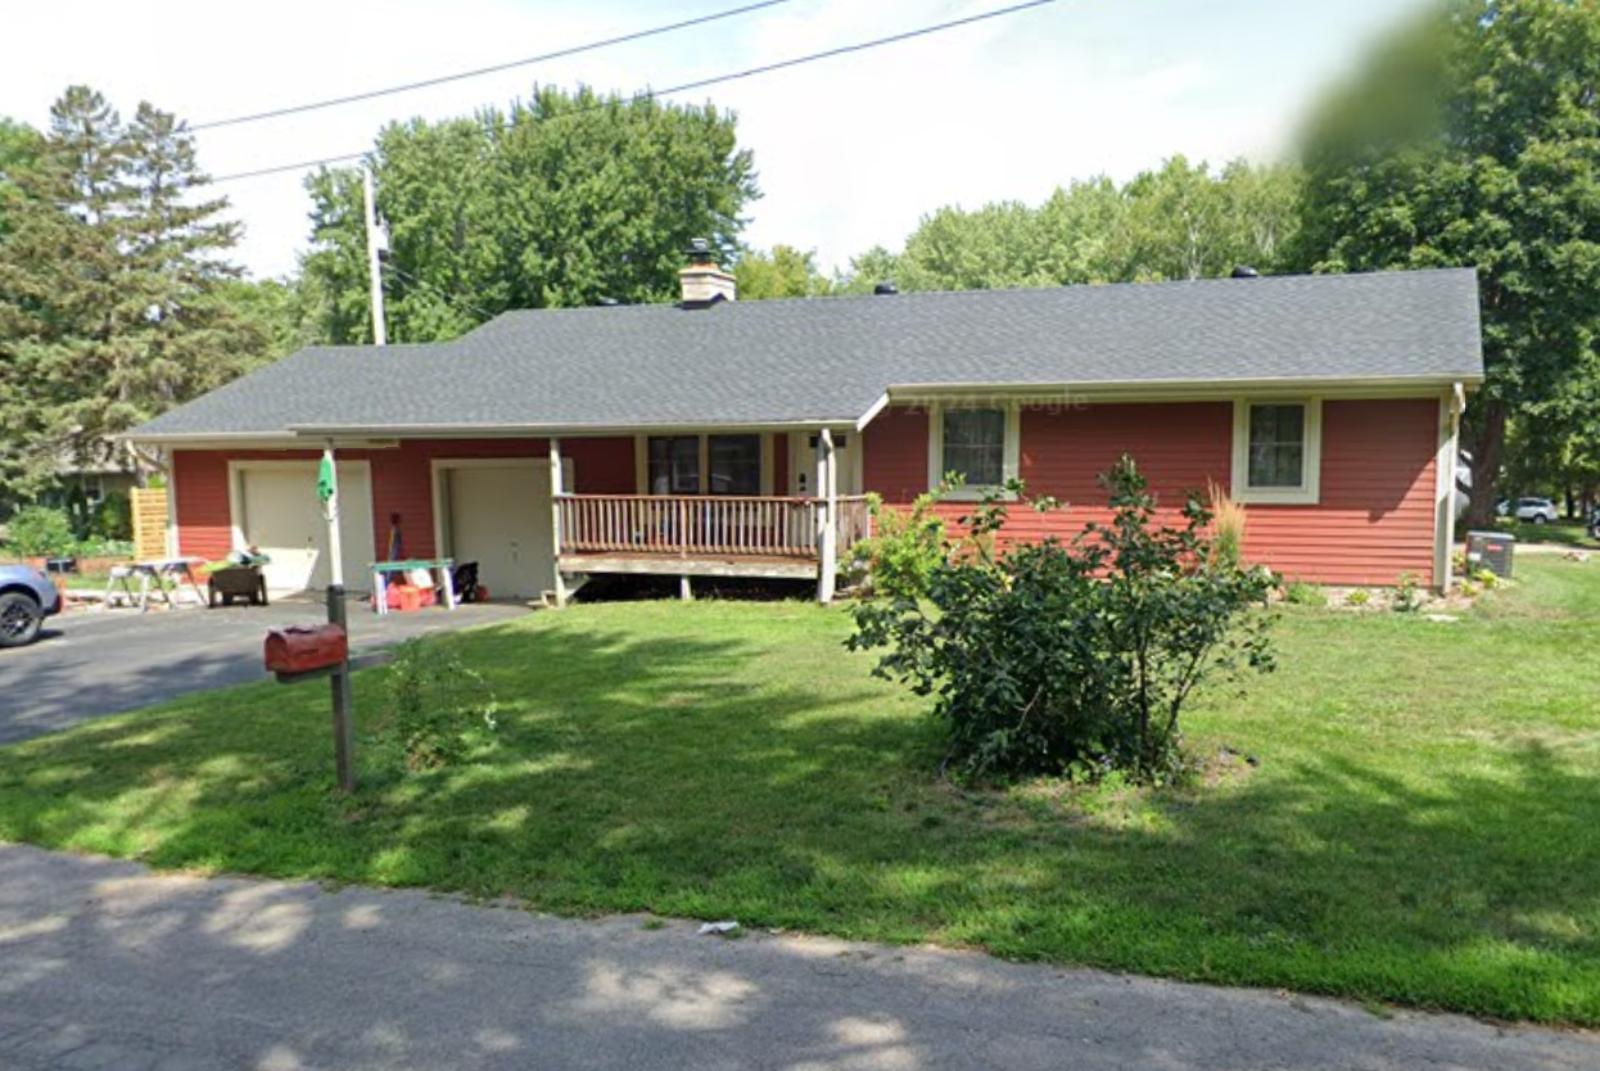
6. Tonka Bay – 116% Home Price Increase Since 2012
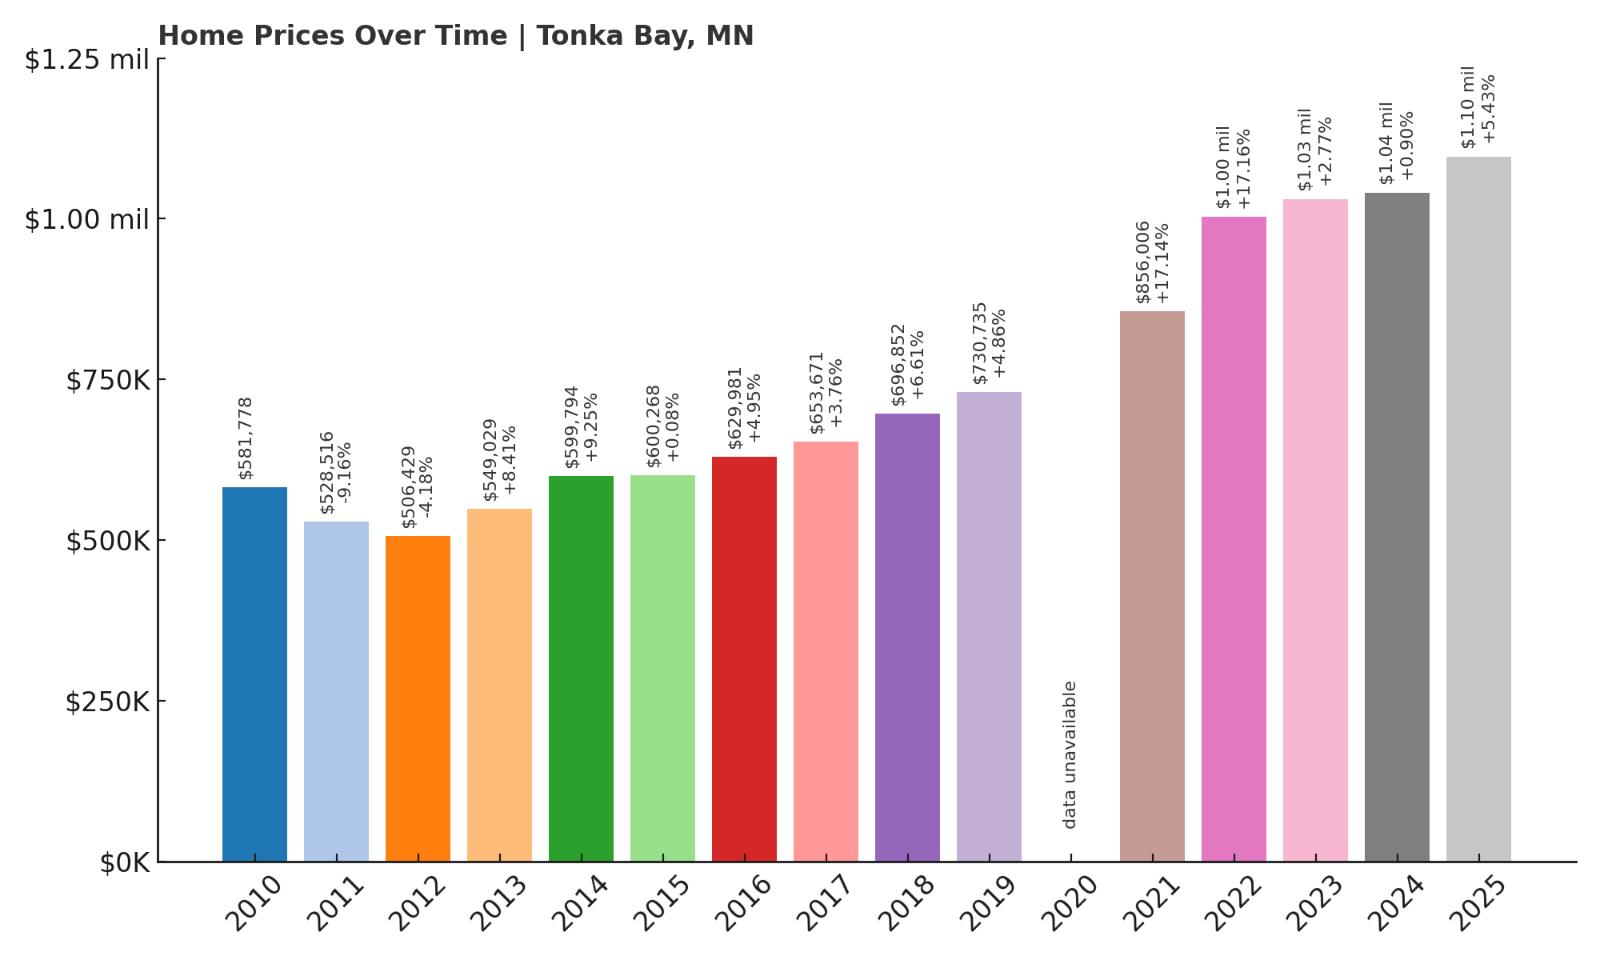
- 2010: $581,778
- 2011: $528,516 ($-53,262, -9.15% from previous year)
- 2012: $506,429 ($-22,088, -4.18% from previous year)
- 2013: $549,029 (+$42,600, +8.41% from previous year)
- 2014: $599,794 (+$50,765, +9.25% from previous year)
- 2015: $600,268 (+$474, +0.08% from previous year)
- 2016: $629,981 (+$29,713, +4.95% from previous year)
- 2017: $653,671 (+$23,691, +3.76% from previous year)
- 2018: $696,852 (+$43,180, +6.61% from previous year)
- 2019: $730,735 (+$33,883, +4.86% from previous year)
- 2020: N/A
- 2021: $856,006 (+$125,272, +17.14% from previous year)
- 2022: $1,002,876 (+$146,870, +17.16% from previous year)
- 2023: $1,030,611 (+$27,735, +2.77% from previous year)
- 2024: $1,039,843 (+$9,232, +0.90% from previous year)
- 2025: $1,096,262 (+$56,419, +5.43% from previous year)
Tonka Bay has seen home values rise by 116% since 2012, breaking the $1 million threshold in 2022 and holding steady above that mark through 2025. The years 2021 and 2022 were transformative, with values soaring by over $270,000 combined. Even after those big jumps, prices have continued to edge upward, reaching $1.09 million in 2025. Unlike markets that saw volatility post-boom, Tonka Bay has maintained a smooth trajectory. Steady annual increases have become the norm, especially since 2016. As one of the smaller communities on Lake Minnetonka, demand regularly exceeds supply. The price gains reflect not only location but exclusivity. Tonka Bay stands out as a premier lakefront market with deep buyer loyalty and little price softness.
Tonka Bay – Small Size, Big Appeal on the Lake
Tonka Bay may be tiny in size, but it’s huge in reputation — especially for those who want direct access to Lake Minnetonka. Nestled between Excelsior and Minnetrista, the town features just a few square miles of land but commands some of the highest prices in the area. Waterfront properties are especially prized, offering dock access, panoramic views, and a private, resort-style feel. The town has worked hard to preserve its quiet, low-density character, and that’s exactly what attracts its affluent residents. Its residential streets are tree-lined and calm, ideal for buyers looking to avoid the busier neighboring communities.
In terms of lifestyle, Tonka Bay offers all the perks of lake living without the foot traffic or tourist volume of more commercial lake towns. It’s close to everything — from boutique shopping in Excelsior to top-rated schools in Minnetonka — yet it remains tucked away. With such limited housing stock and very few new builds, prices have steadily increased over time. Many homeowners here treat their properties as long-term investments or legacy homes. As listings remain scarce, the value of Tonka Bay real estate continues to climb — slowly, steadily, and predictably.
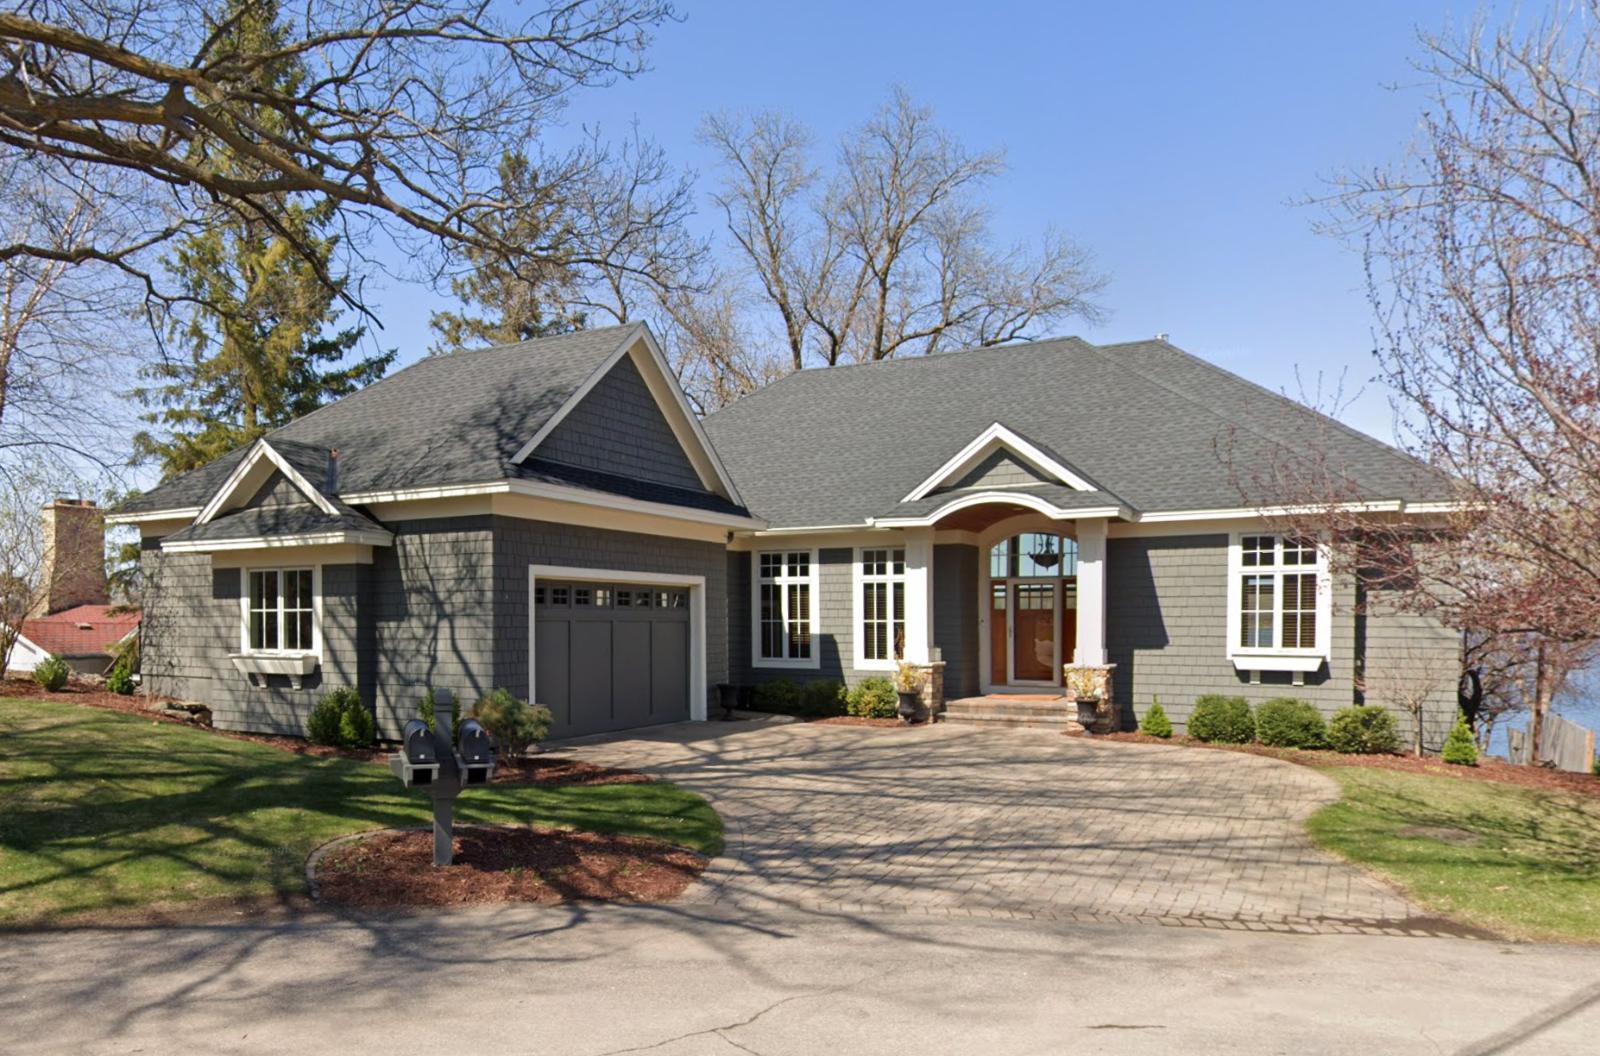
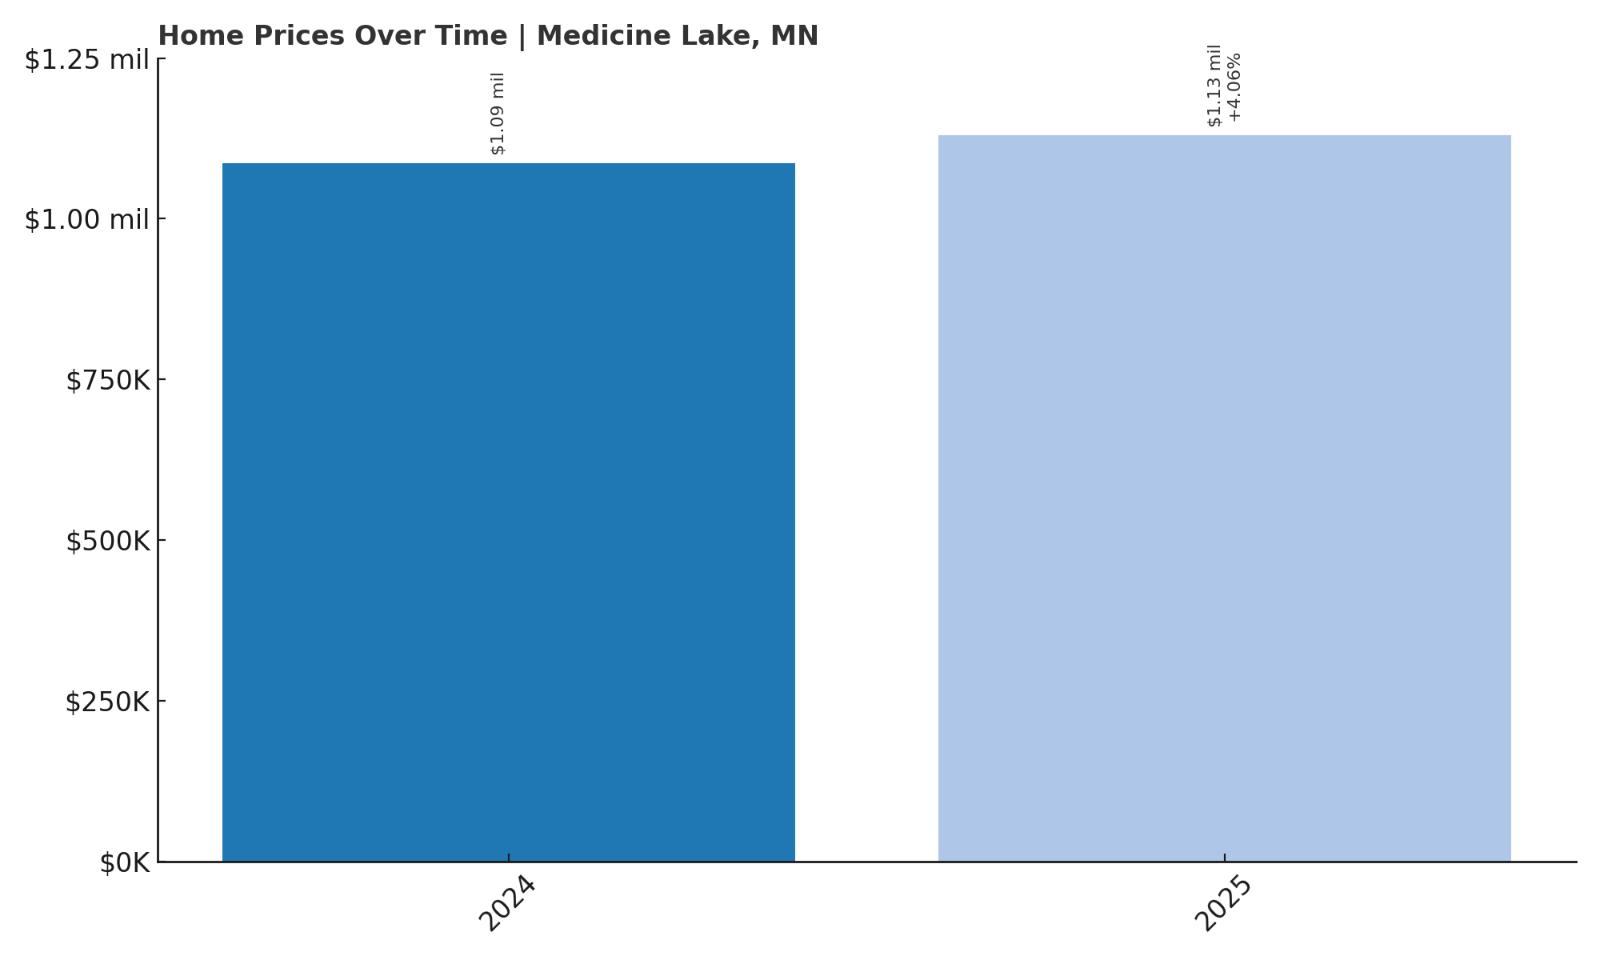
5. Medicine Lake – No Price Data Before 2024
- 2010: N/A
- 2011: N/A
- 2012: N/A
- 2013: N/A
- 2014: N/A
- 2015: N/A
- 2016: N/A
- 2017: N/A
- 2018: N/A
- 2019: N/A
- 2020: N/A
- 2021: N/A
- 2022: N/A
- 2023: N/A
- 2024: $1,085,877
- 2025: $1,130,017 (+$44,139, +4.06% from previous year)
Although long-term data is unavailable, Medicine Lake’s 2025 median home value of $1.13 million places it among Minnesota’s top-tier housing markets. From the available data, we see a year-over-year increase of 4%, signaling healthy demand and solid value retention. The town’s small size and waterfront location contribute to its exclusivity. With only a limited number of homes and no evidence of new subdivisions, prices here are unlikely to drop significantly. It’s one of the rare areas where even modest homes can fetch seven-figure prices. The lack of volatility in the past two years — despite market changes elsewhere — suggests strong buyer confidence. While we can’t calculate long-term growth rates, the current numbers point to a highly valuable, stable market. As more data becomes available, it’s likely Medicine Lake will remain on the state’s luxury radar.
Medicine Lake – Micro Market, Maximum Value
Medicine Lake is one of the smallest incorporated cities in Minnesota, but its real estate prices tell a much bigger story. Located just west of Minneapolis, the town is essentially a peninsula that wraps around its namesake lake. The waterfront dominates the landscape, and nearly every home has some form of lake view or access. With less than a hundred residences and no large-scale commercial development, Medicine Lake offers unmatched privacy. It’s favored by professionals and retirees who want a peaceful escape without leaving the metro area.
Because the housing market here is so small, every listing has outsized influence. Properties are rarely available, and when they do hit the market, they often sell quickly and well above assessed value. The area’s tight geography ensures it can never be overdeveloped, keeping supply extremely low. This structural scarcity is a major reason for the town’s high median home prices. Even with minimal public exposure, Medicine Lake continues to draw serious interest from buyers seeking waterfront living in an ultra-exclusive setting.
4. Sunfish Lake – 87% Home Price Increase Since 2012
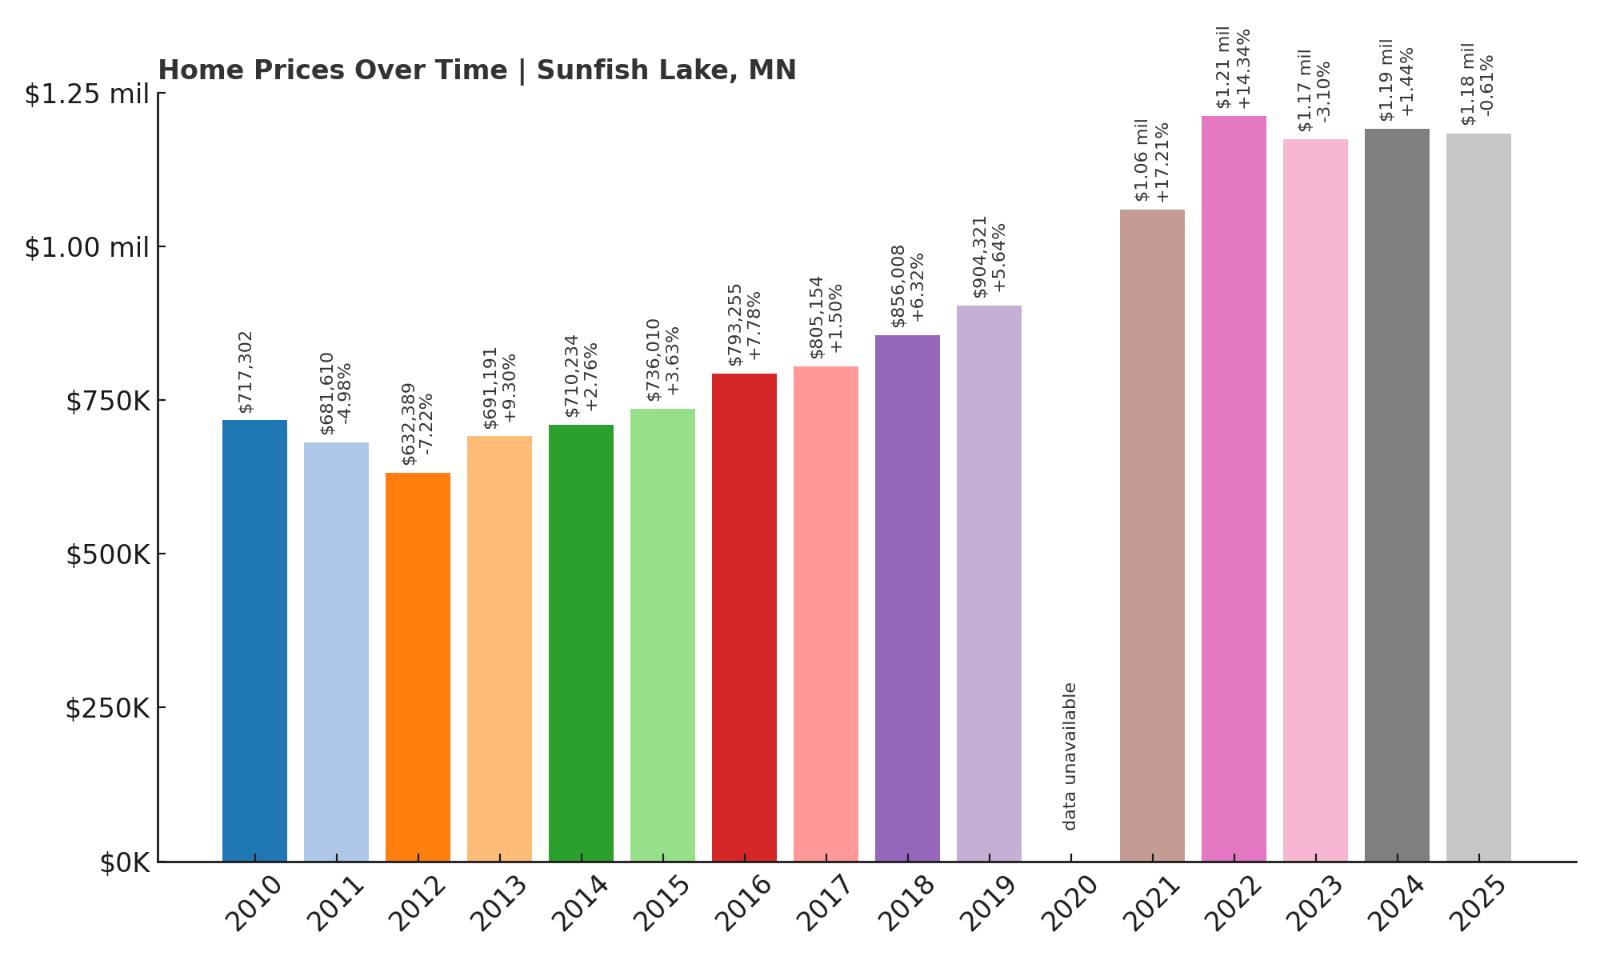
- 2010: $717,302
- 2011: $681,610 ($-35,693, -4.98% from previous year)
- 2012: $632,389 ($-49,221, -7.22% from previous year)
- 2013: $691,191 (+$58,802, +9.30% from previous year)
- 2014: $710,234 (+$19,043, +2.76% from previous year)
- 2015: $736,010 (+$25,776, +3.63% from previous year)
- 2016: $793,255 (+$57,245, +7.78% from previous year)
- 2017: $805,154 (+$11,899, +1.50% from previous year)
- 2018: $856,008 (+$50,854, +6.32% from previous year)
- 2019: $904,321 (+$48,314, +5.64% from previous year)
- 2020: N/A
- 2021: $1,059,935 (+$155,613, +17.21% from previous year)
- 2022: $1,211,940 (+$152,005, +14.34% from previous year)
- 2023: $1,174,326 ($-37,614, -3.10% from previous year)
- 2024: $1,191,207 (+$16,881, +1.44% from previous year)
- 2025: $1,183,899 ($-7,308, -0.61% from previous year)
Sunfish Lake’s home values have increased by 87% since 2012, moving from $632,389 to $1.18 million by 2025. Its strongest growth occurred between 2021 and 2022, with back-to-back gains totaling over $300,000. Although prices slightly declined in 2023 and again in 2025, the overall trend across the decade has remained positive. These minor fluctuations are common in ultra-luxury markets, especially where inventory is limited and home styles vary significantly. The long-term rise in values signals continued demand despite short-term noise. Even small dips haven’t shaken Sunfish Lake’s standing among Minnesota’s priciest towns. The 2025 value still sits near all-time highs. Overall, the town remains a high-demand enclave with million-dollar expectations.
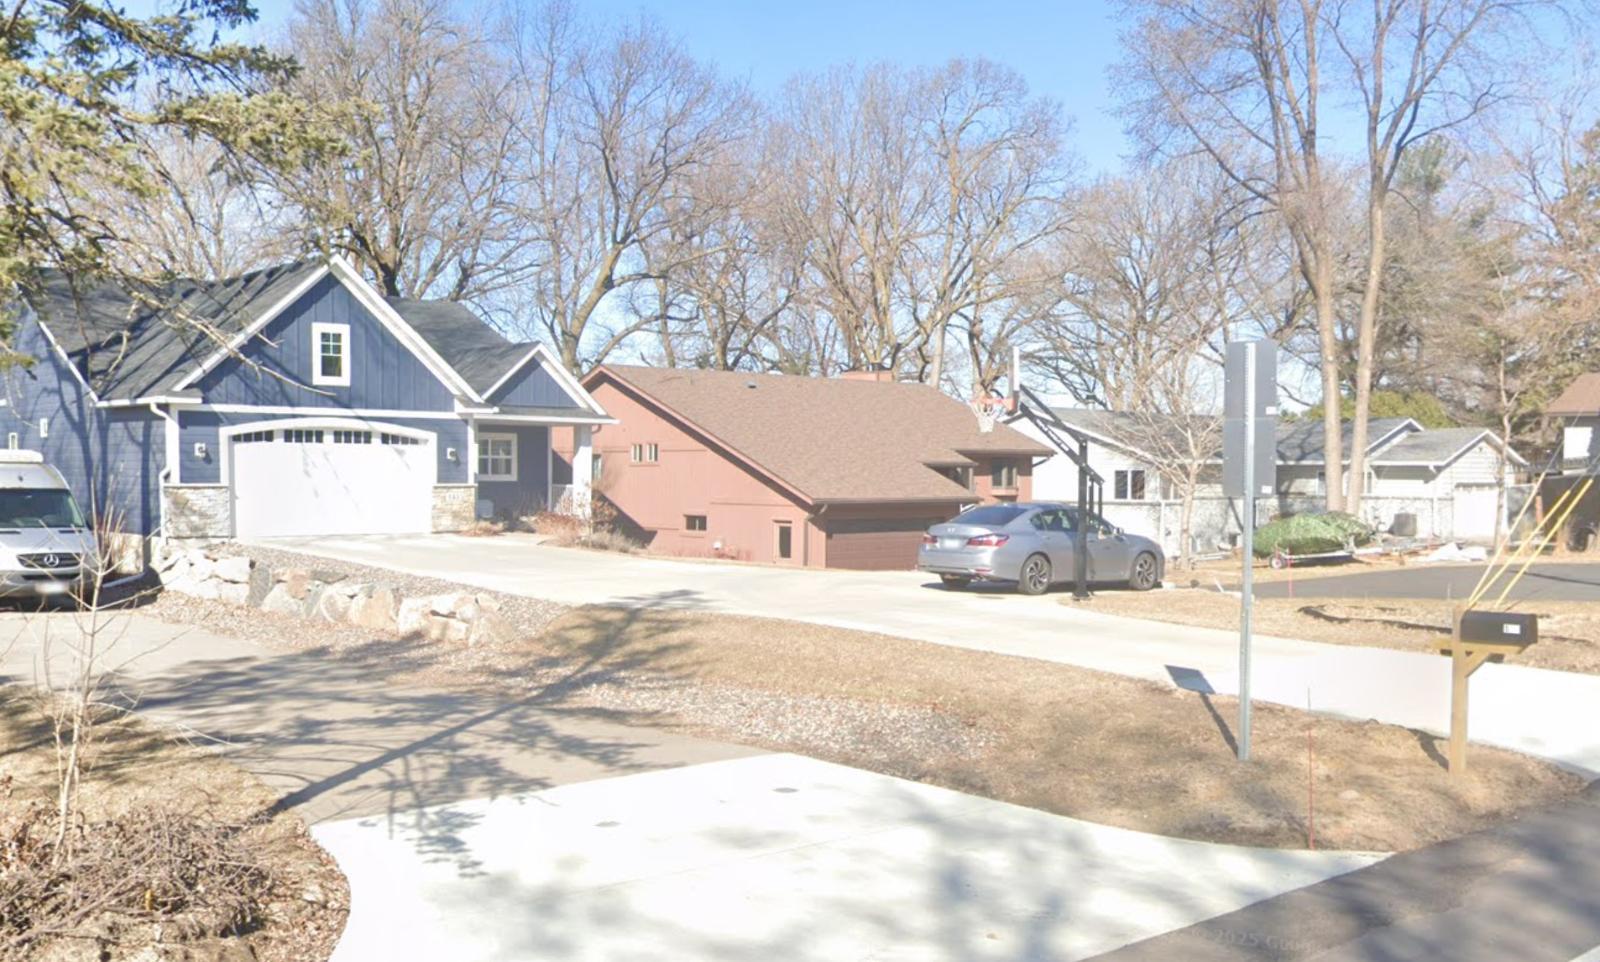
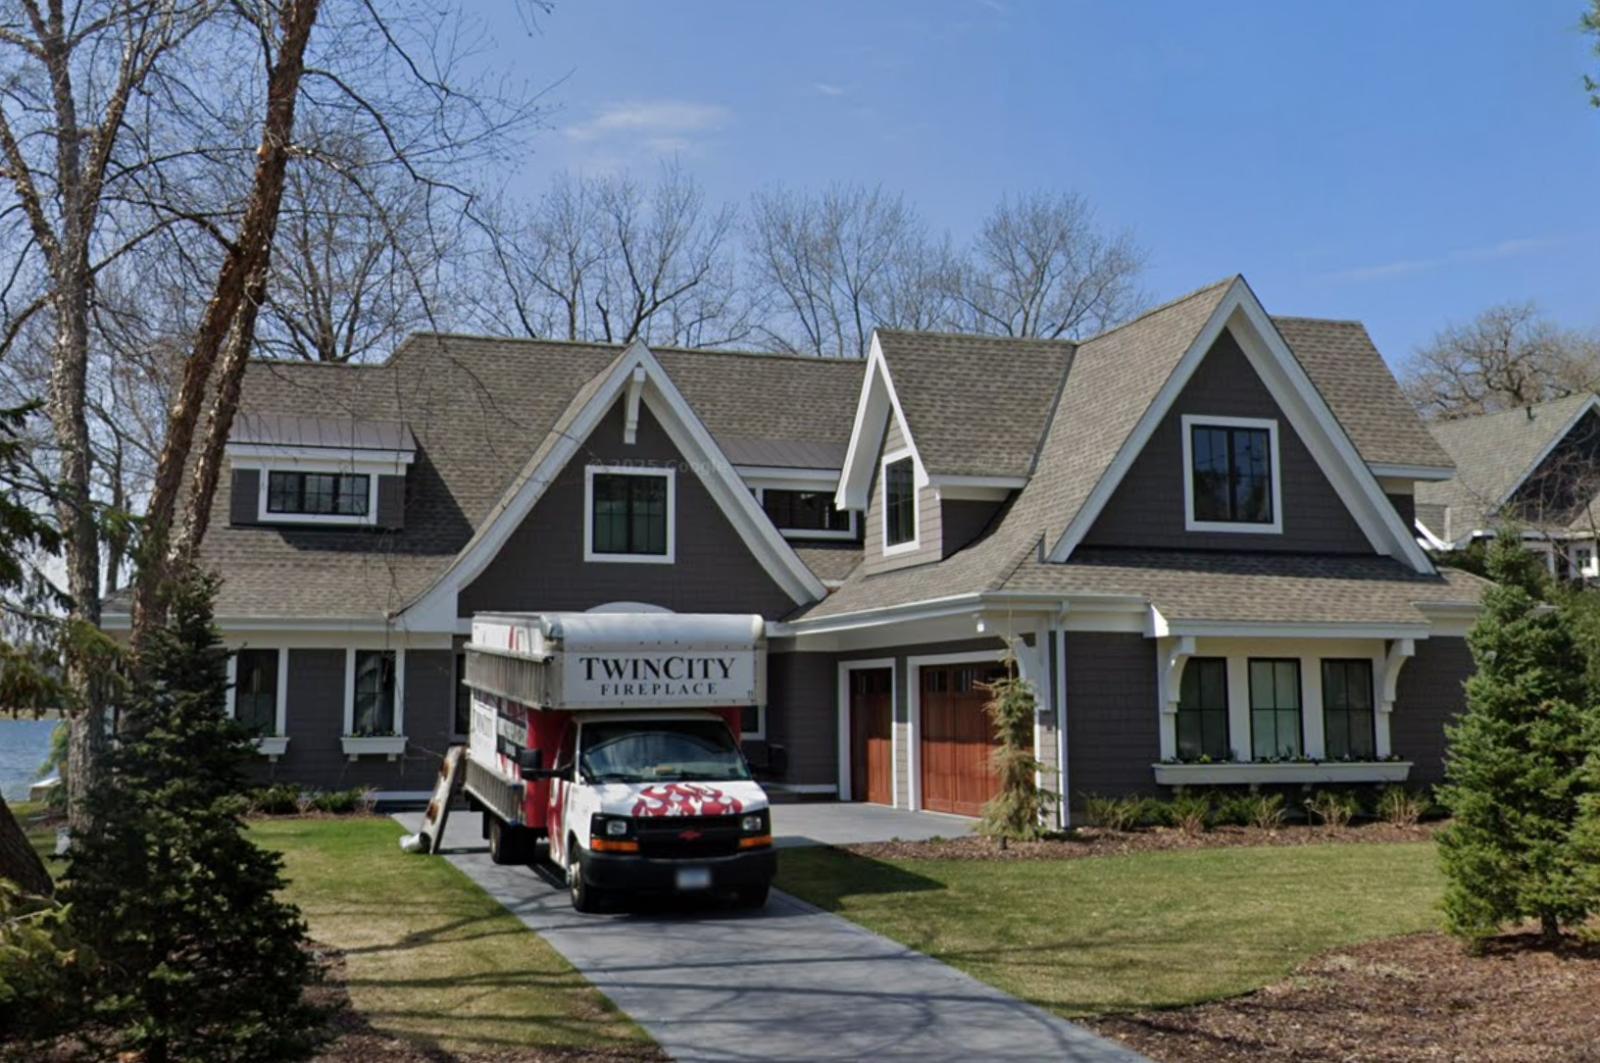
Sunfish Lake – Private Estates in a Forested Retreat
Sunfish Lake sits just south of St. Paul and is one of the most secluded and least densely populated towns in the metro area. It’s famous for its oversized wooded lots, sprawling estates, and total absence of commercial development. Nearly every home here is custom-built and set back from the road, creating a private, gated-community feel even though it isn’t one. Residents enjoy proximity to the Twin Cities while living in what feels like a nature preserve. Local ordinances prioritize preservation and limit subdivisions, helping keep supply low and values high. With strict land use rules and no retail activity, the town has developed a reputation for being peaceful, pristine, and deeply exclusive.
The housing market in Sunfish Lake is incredibly tight, with few homes listed at any given time. This low inventory creates upward price pressure, especially as more buyers prioritize privacy, acreage, and proximity to nature. While occasional price drops occur due to the bespoke nature of properties, the broader market trend remains strong. Buyers here are typically long-term owners, which contributes to the limited market turnover. When homes do sell, they often fetch premiums thanks to lot size, architectural uniqueness, and unmatched location. For many, Sunfish Lake represents the pinnacle of residential seclusion in Minnesota.
3. Greenwood – 109% Home Price Increase Since 2012

- 2010: $823,270
- 2011: $771,565 ($-51,704, -6.28% from previous year)
- 2012: $725,451 ($-46,115, -5.98% from previous year)
- 2013: $774,392 (+$48,942, +6.75% from previous year)
- 2014: $859,001 (+$84,609, +10.93% from previous year)
- 2015: $857,789 ($-1,212, -0.14% from previous year)
- 2016: $914,643 (+$56,853, +6.63% from previous year)
- 2017: $930,582 (+$15,940, +1.74% from previous year)
- 2018: $998,074 (+$67,491, +7.25% from previous year)
- 2019: $1,049,073 (+$50,999, +5.11% from previous year)
- 2020: N/A
- 2021: $1,186,307 (+$137,234, +13.08% from previous year)
- 2022: $1,422,054 (+$235,747, +19.87% from previous year)
- 2023: $1,451,031 (+$28,978, +2.04% from previous year)
- 2024: $1,466,707 (+$15,676, +1.08% from previous year)
- 2025: $1,518,439 (+$51,732, +3.53% from previous year)
Greenwood’s housing market has grown by 109% since 2012, jumping from $725,451 to $1.52 million in 2025. The biggest spikes came in 2021 and 2022, when values leapt by over $370,000 in two years. Though appreciation has moderated since then, the direction remains positive. Annual gains are now more modest — in the 2% to 4% range — but still meaningful at this price level. Greenwood didn’t suffer any major corrections during this period, highlighting its market stability. Even in flat or slow markets, its property values have continued to increase. The consistency of growth suggests strong buyer trust in this community. Its limited size and elite reputation help preserve long-term value.
Greenwood – Lakeside Luxury in a Tiny Package
Greenwood is one of the smallest towns in Hennepin County — but it’s also one of the most valuable. Located on Lake Minnetonka’s southern shore, this residential-only community is composed almost entirely of waterfront homes. There’s no commercial strip, no downtown, and no tourist traffic — just high-end housing and lakeside views. That simplicity and exclusivity are a big part of its appeal. Greenwood’s zoning keeps density low, ensuring every property maintains space, access, and privacy. The town attracts both full-time residents and wealthy second-home buyers looking for serenity without sacrificing amenities.
With such a tiny housing stock, Greenwood rarely sees homes come on the market. When they do, they tend to be large, custom-built, and situated on premium lakefront lots. The town’s reputation for quiet living and scenic beauty has only grown in recent years. As nearby communities expand and densify, Greenwood remains unchanged — and that’s exactly why demand remains so high. The result is one of the highest per-home values in the state and a luxury housing market that continues to perform strongly, year after year.
2. Woodland – 89% Home Price Increase Since 2012
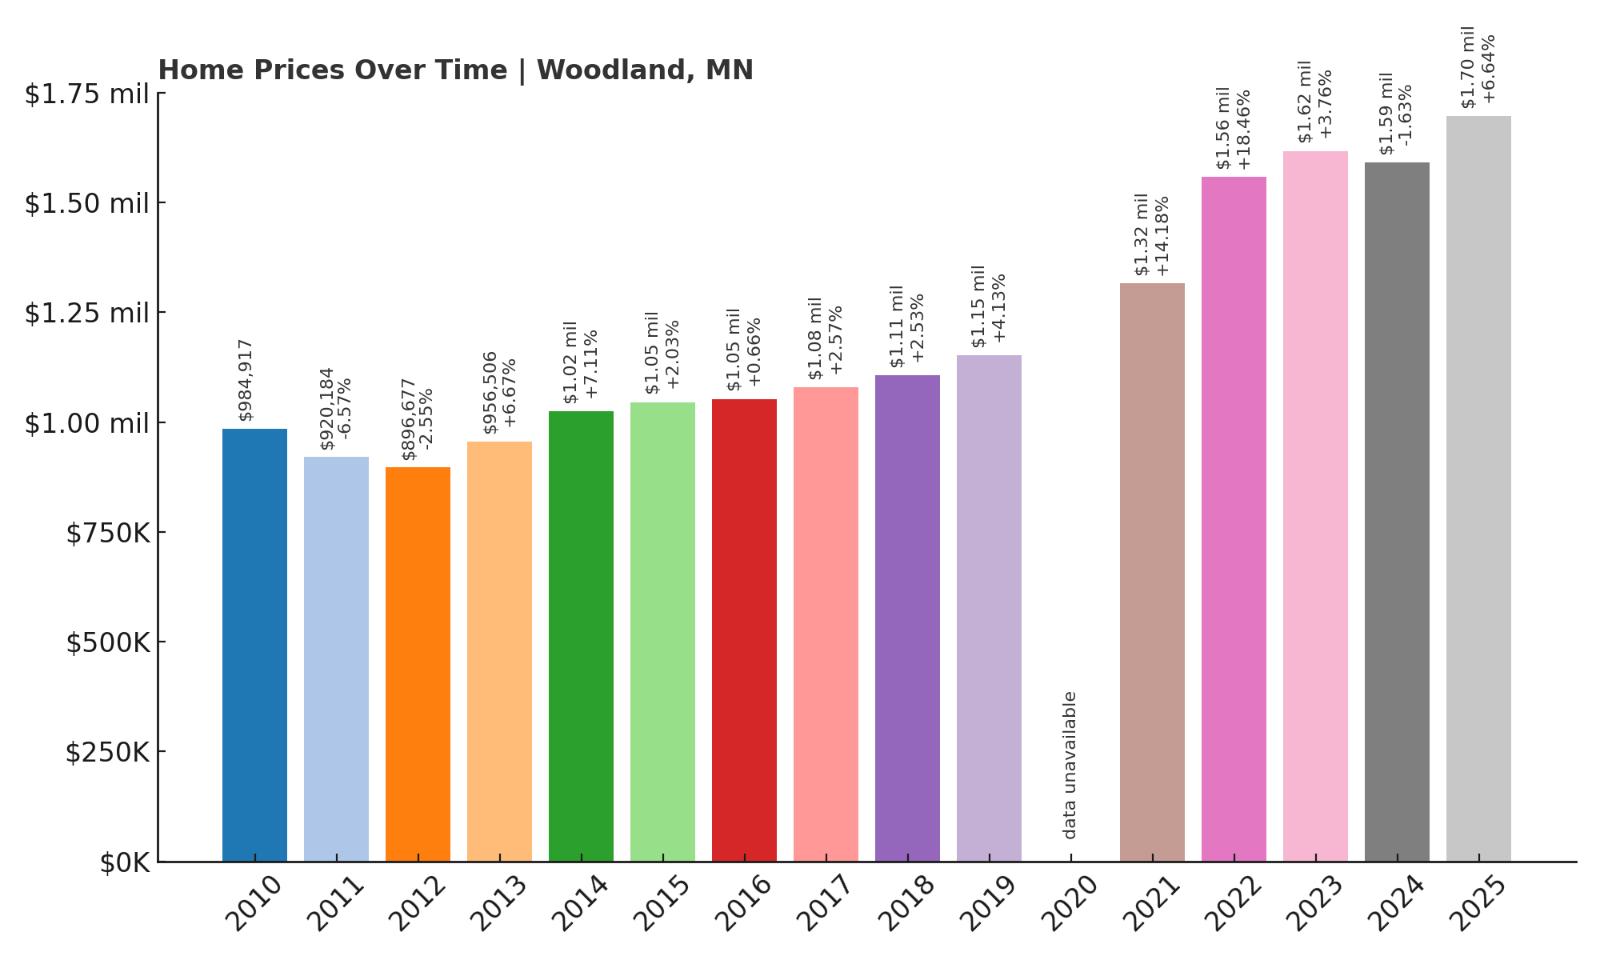
- 2010: $984,917
- 2011: $920,184 ($-64,732, -6.57% from previous year)
- 2012: $896,677 ($-23,507, -2.55% from previous year)
- 2013: $956,506 (+$59,829, +6.67% from previous year)
- 2014: $1,024,506 (+$68,000, +7.11% from previous year)
- 2015: $1,045,256 (+$20,749, +2.03% from previous year)
- 2016: $1,052,172 (+$6,916, +0.66% from previous year)
- 2017: $1,079,264 (+$27,093, +2.57% from previous year)
- 2018: $1,106,521 (+$27,256, +2.53% from previous year)
- 2019: $1,152,222 (+$45,701, +4.13% from previous year)
- 2020: N/A
- 2021: $1,315,583 (+$163,360, +14.18% from previous year)
- 2022: $1,558,495 (+$242,912, +18.46% from previous year)
- 2023: $1,617,116 (+$58,621, +3.76% from previous year)
- 2024: $1,590,826 ($-26,290, -1.63% from previous year)
- 2025: $1,696,501 (+$105,675, +6.64% from previous year)
Woodland’s property values have increased by 89% since 2012, starting at $896,677 and reaching $1.69 million in 2025. The price trend includes a few dips, such as in 2024, but those were quickly recovered with strong rebounds the following year. The biggest jumps occurred during the pandemic boom, where values surged by over $400,000 between 2021 and 2022. While such spikes can be unsustainable in most places, Woodland has held onto its gains. The market here remains among the strongest in Minnesota, especially for buyers seeking estate properties. Price growth has leveled off since 2023, but the town continues to command ultra-premium values. Its status as one of the wealthiest enclaves in the state remains unshaken. As of 2025, it ranks just behind Minnetonka Beach in total home value.
Woodland – Heavily Wooded, Heavily Desired
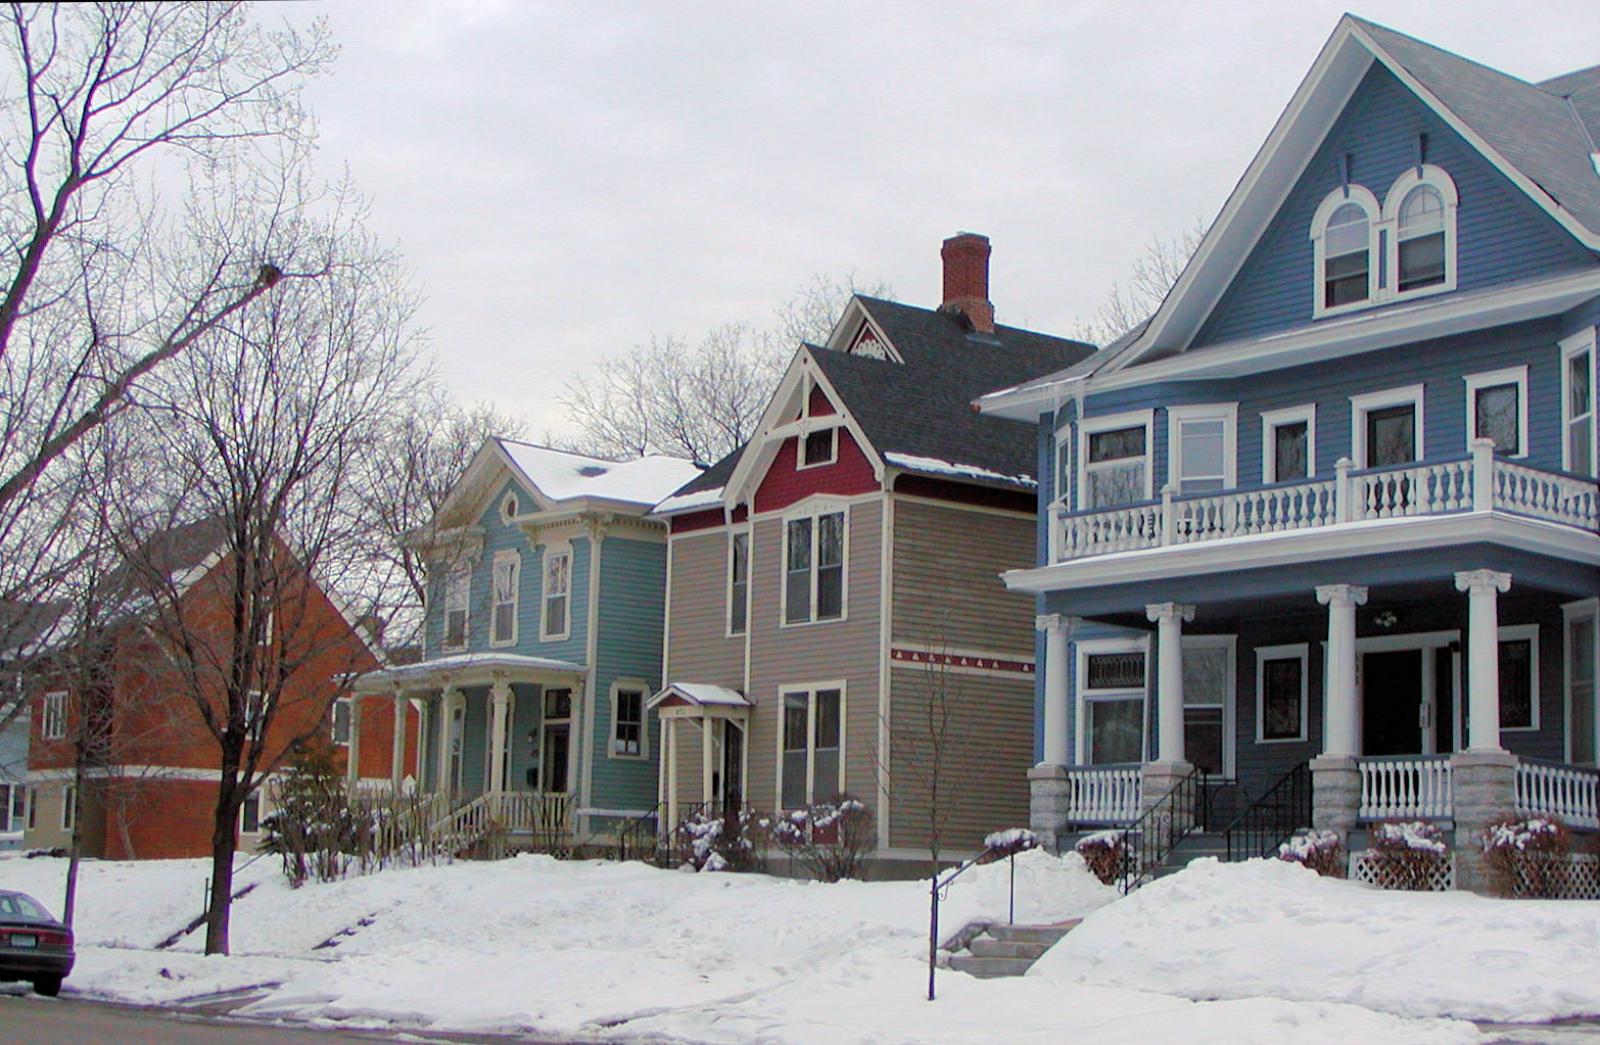
Woodland is a quiet, upscale town on Lake Minnetonka’s north side, known for its winding roads, massive trees, and stunning lakefront estates. With less than 500 residents, it’s one of the smallest communities in the metro — and also one of the most elite. Home sites are large, private, and almost entirely residential. Residents prize the town’s old-growth trees and absence of commercial activity, making it a tranquil retreat just minutes from Wayzata and Minnetonka. The housing stock includes multimillion-dollar mansions and unique architectural designs. There’s very little turnover, and listings typically fetch premium prices when they become available.
Woodland’s appeal lies in its mix of privacy, prestige, and proximity to the lake. Unlike many towns, there’s no through traffic or tourist draw, helping it maintain an exclusive and low-profile character. Buyers here include business leaders, celebrities, and long-time local families. Because development is limited and demand is constant, prices continue to rise — even when neighboring areas flatten. Woodland’s consistency, along with its stunning setting, helps explain why it remains one of the most expensive zip codes in Minnesota.
1. Minnetonka Beach – 148% Home Price Increase Since 2012
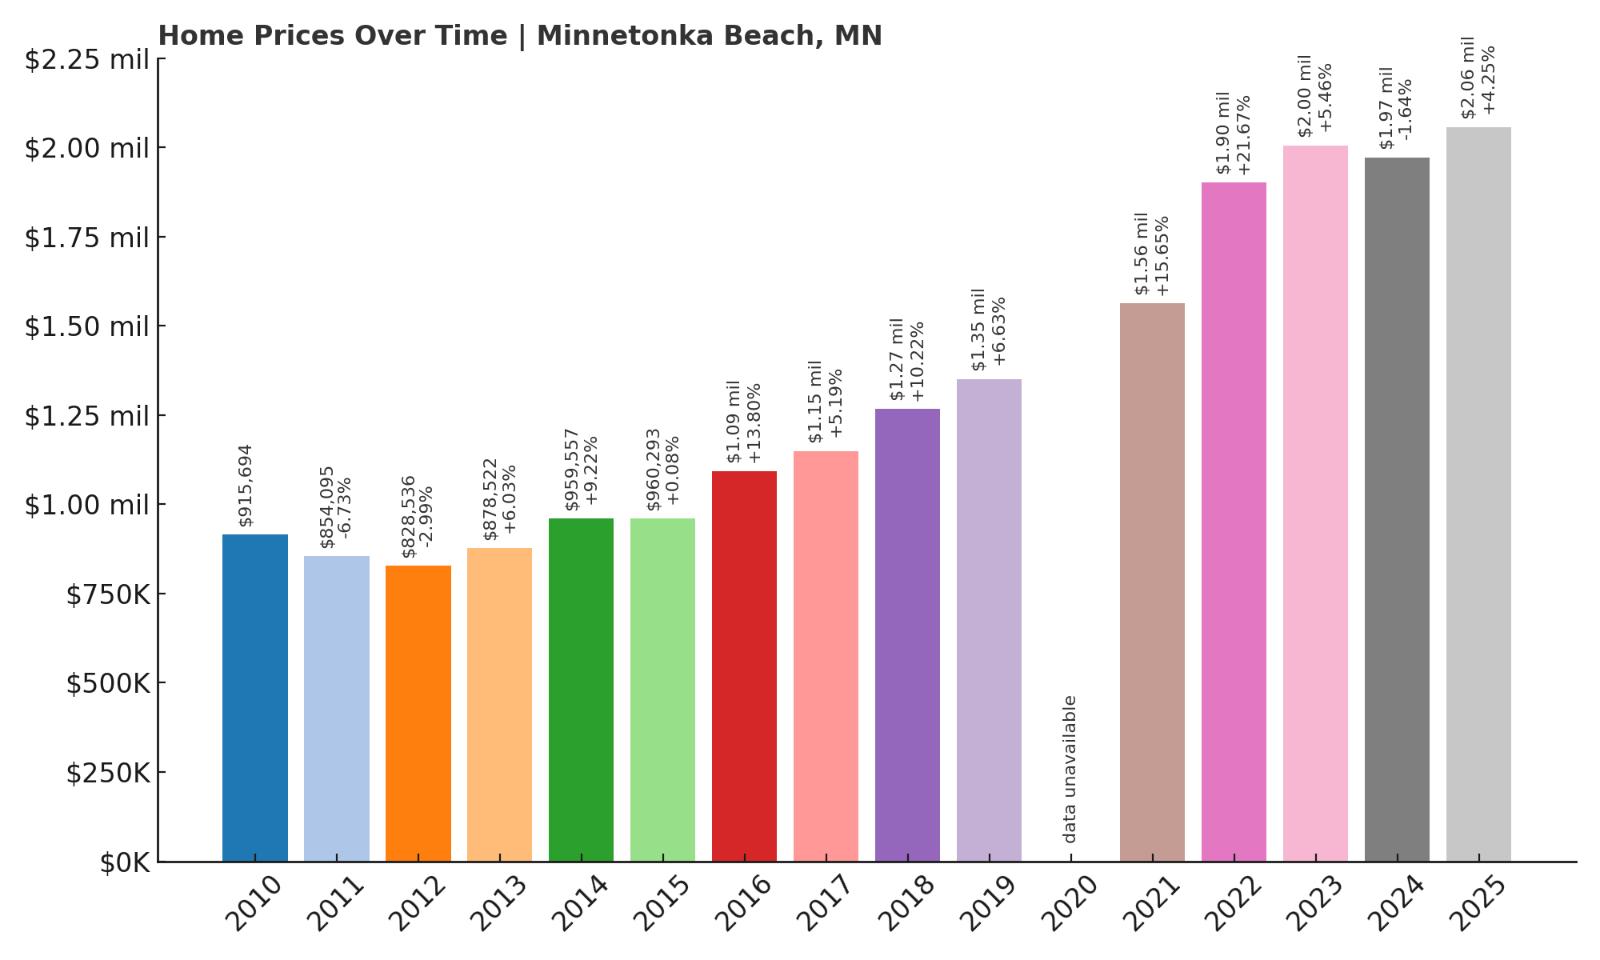
- 2010: $915,694
- 2011: $854,095 ($-61,599, -6.73% from previous year)
- 2012: $828,536 ($-25,559, -2.99% from previous year)
- 2013: $878,522 (+$49,986, +6.03% from previous year)
- 2014: $959,557 (+$81,034, +9.22% from previous year)
- 2015: $960,293 (+$736, +0.08% from previous year)
- 2016: $1,092,783 (+$132,490, +13.80% from previous year)
- 2017: $1,149,526 (+$56,743, +5.19% from previous year)
- 2018: $1,266,977 (+$117,451, +10.22% from previous year)
- 2019: $1,351,006 (+$84,029, +6.63% from previous year)
- 2020: N/A
- 2021: $1,562,374 (+$211,368, +15.65% from previous year)
- 2022: $1,900,913 (+$338,539, +21.67% from previous year)
- 2023: $2,004,712 (+$103,799, +5.46% from previous year)
- 2024: $1,971,870 ($-32,842, -1.64% from previous year)
- 2025: $2,055,664 (+$83,794, +4.25% from previous year)
Minnetonka Beach has experienced an incredible 148% increase in home prices since 2012, rising from $828,536 to $2.05 million in 2025. That growth is unmatched anywhere else in Minnesota. The town’s most dramatic surges came in 2021 and 2022, when values skyrocketed by over half a million dollars in just two years. Though there was a slight dip in 2024, prices quickly rebounded in 2025, showing resilience and continued buyer appetite. Even in slower years, home values have posted consistent increases. Minnetonka Beach now firmly occupies the top position on the state’s real estate ladder. With median prices exceeding $2 million, it’s in a class of its own. The town’s data reflects more than just strong housing — it reveals elite, long-lasting desirability.
Minnetonka Beach – Minnesota’s Most Exclusive Address
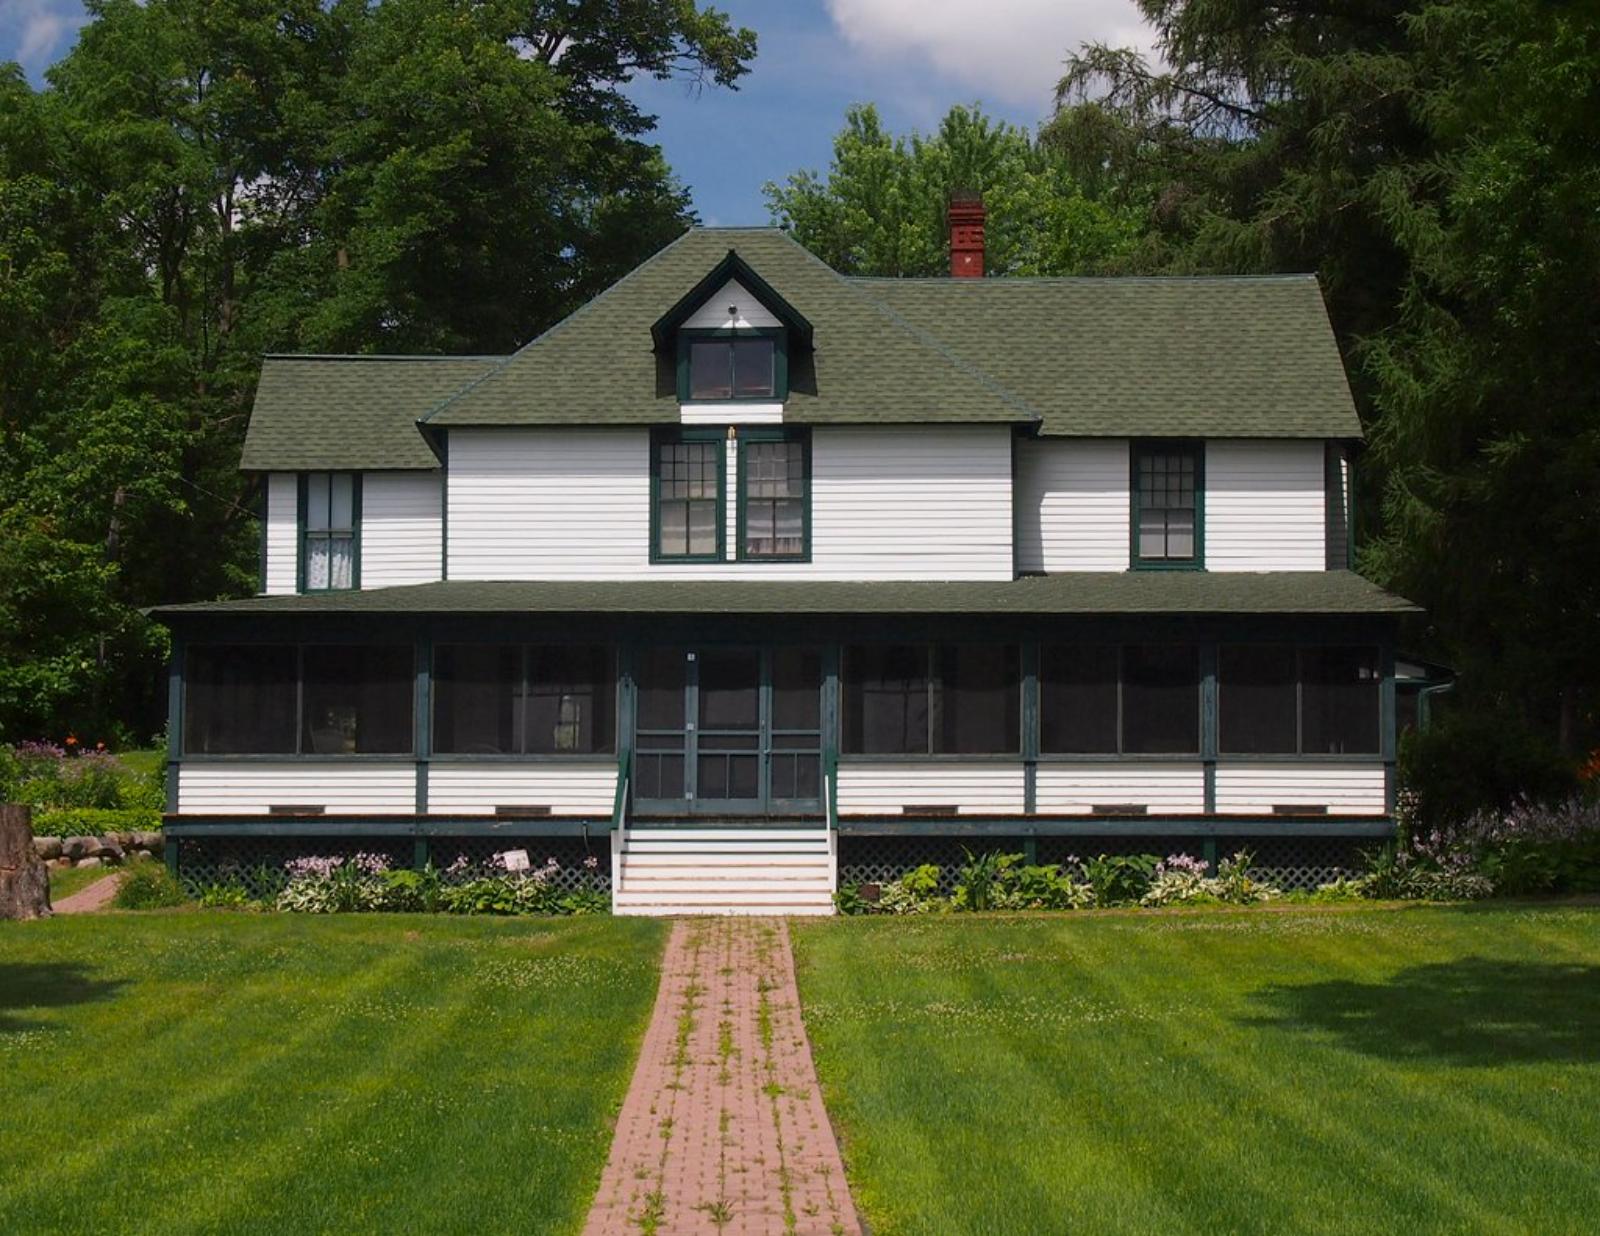
Minnetonka Beach is a small lakeside town with a huge reputation. Located on a peninsula surrounded by Lake Minnetonka, it’s one of the most picturesque and prestigious residential areas in the state. The town features luxurious waterfront estates, private docks, and sweeping views of the lake from nearly every lot. Residents enjoy the rare combination of peaceful lake living and easy access to urban amenities via nearby Wayzata. The town’s layout — mostly narrow roads and quiet cul-de-sacs — limits through traffic and creates a secluded, high-end atmosphere. Public infrastructure is minimal by design, helping maintain privacy and exclusivity.
Because Minnetonka Beach has such limited inventory, homes here rarely come on the market. When they do, bidding wars are common and price tags often exceed list value. The community’s identity is built around water access, generational wealth, and a strong sense of place. Its proximity to top schools and downtown Minneapolis only adds to the appeal. As a result, Minnetonka Beach consistently ranks among the most expensive places to live in the Midwest — not just Minnesota. Its $2 million median home value as of 2025 isn’t just a number; it’s a reflection of decades of demand, scarcity, and prestige.