🔥 Would you like to save this?
Colorado’s luxury housing market continues to rise, with home values climbing steeply in mountain resorts and upscale suburbs alike. Using data from the Zillow Home Value Index, this list highlights 21 towns where buying a home means paying top dollar—driven by tight inventory, scenic settings, and deep-pocketed demand. From the ski slopes of Aspen to the quiet streets of Cherry Hills Village, these places offer a glimpse into the cost of exclusivity in Colorado today.
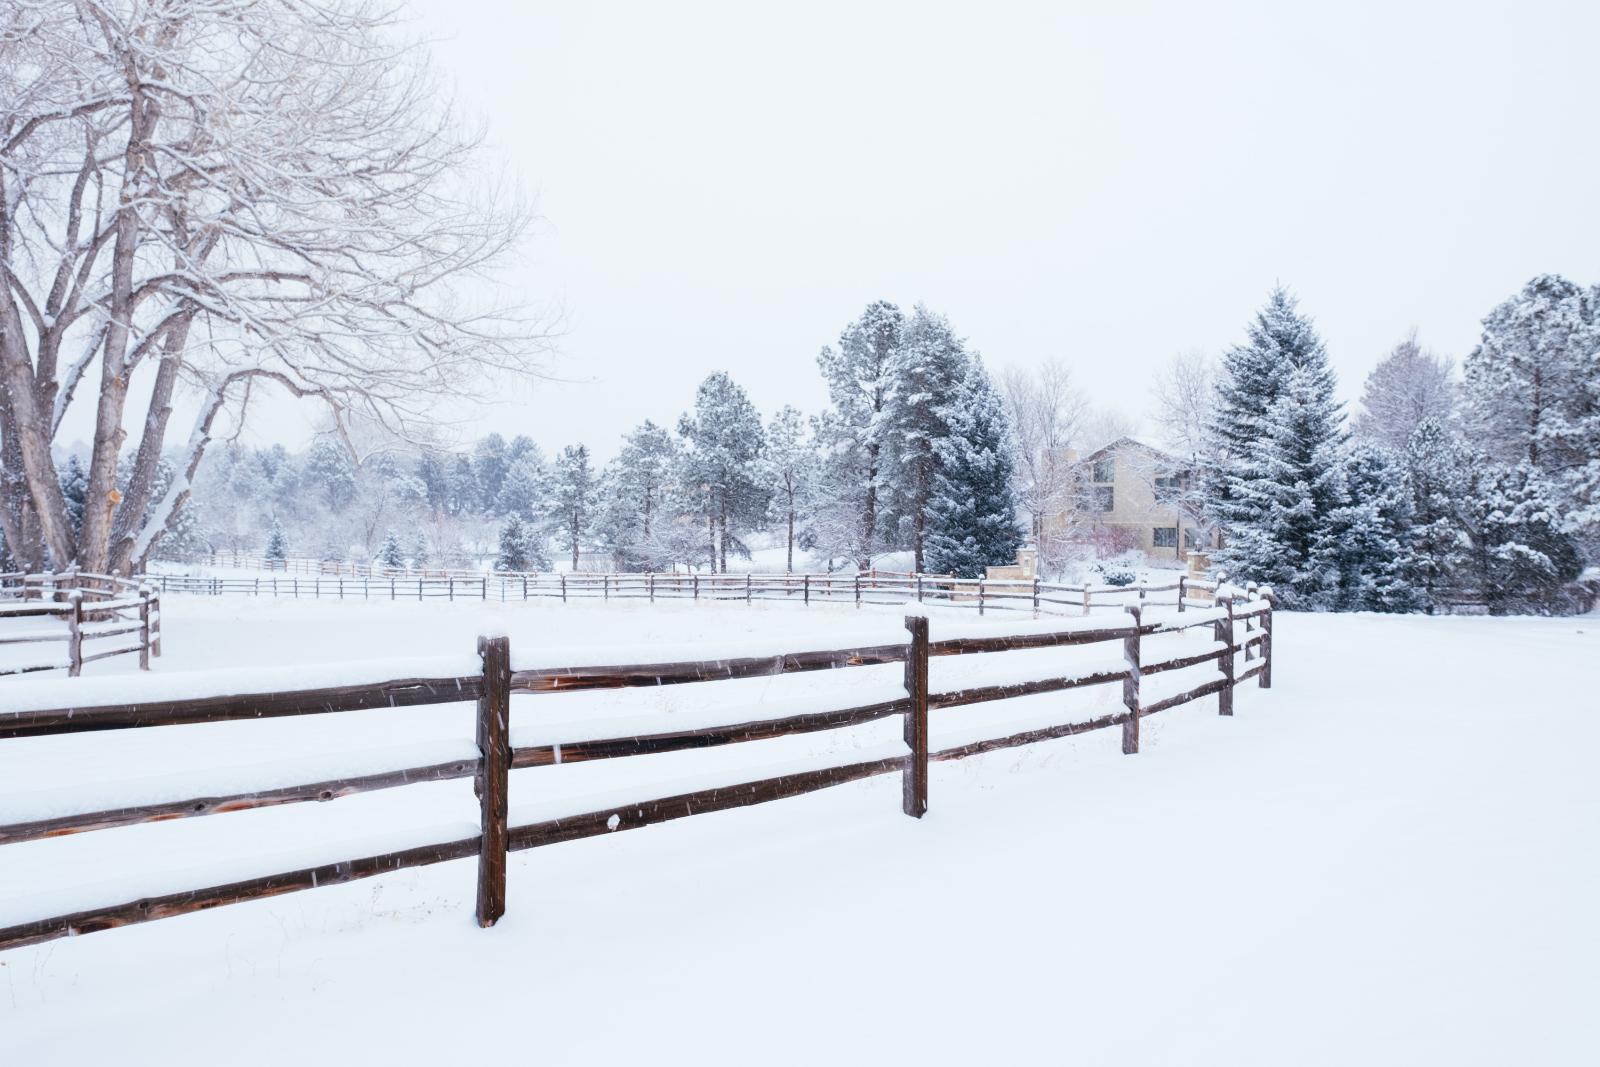
21. Franktown – 161% Home Price Increase Since 2010
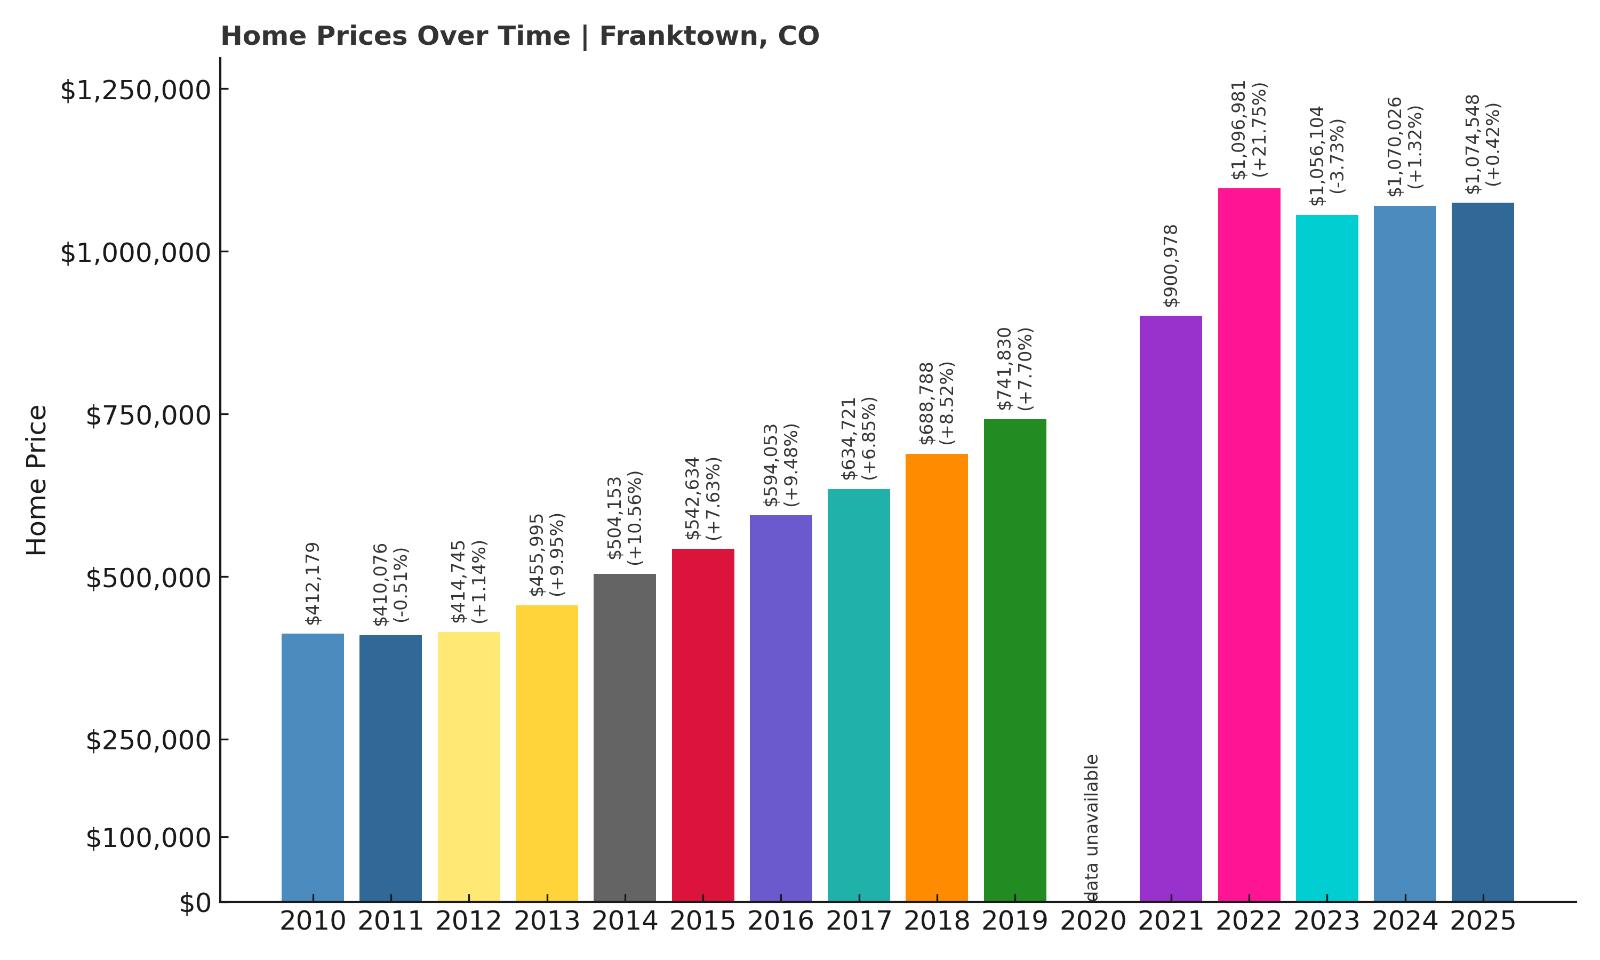
- 2010: $412,179
- 2011: $410,076 (-$2,103, -0.51% from previous year)
- 2012: $414,745 (+$4,669, +1.14% from previous year)
- 2013: $455,995 (+$41,250, +9.95% from previous year)
- 2014: $504,153 (+$48,159, +10.56% from previous year)
- 2015: $542,634 (+$38,481, +7.63% from previous year)
- 2016: $594,053 (+$51,419, +9.48% from previous year)
- 2017: $634,721 (+$40,668, +6.85% from previous year)
- 2018: $688,788 (+$54,068, +8.52% from previous year)
- 2019: $741,830 (+$53,041, +7.70% from previous year)
- 2021: $900,978
- 2022: $1,096,981 (+$196,004, +21.75% from previous year)
- 2023: $1,056,104 (-$40,877, -3.73% from previous year)
- 2024: $1,070,026 (+$13,921, +1.32% from previous year)
- 2025: $1,074,548 (+$4,523, +0.42% from previous year)
Home prices in Franktown have more than doubled since 2010, rising from $412K to over $1.07M in 2025. The biggest single-year surge came in 2022 with a massive 21.75% jump. Although prices cooled slightly afterward, the long-term trajectory still puts Franktown on the high end of Colorado’s real estate spectrum.
In order to come up with the very specific design ideas, we create most designs with the assistance of state-of-the-art AI interior design software. Also, assume links that take you off the site are affiliate links such as links to Amazon. this means we may earn a commission if you buy something.
Franktown – Rural Charm Meets Big Numbers
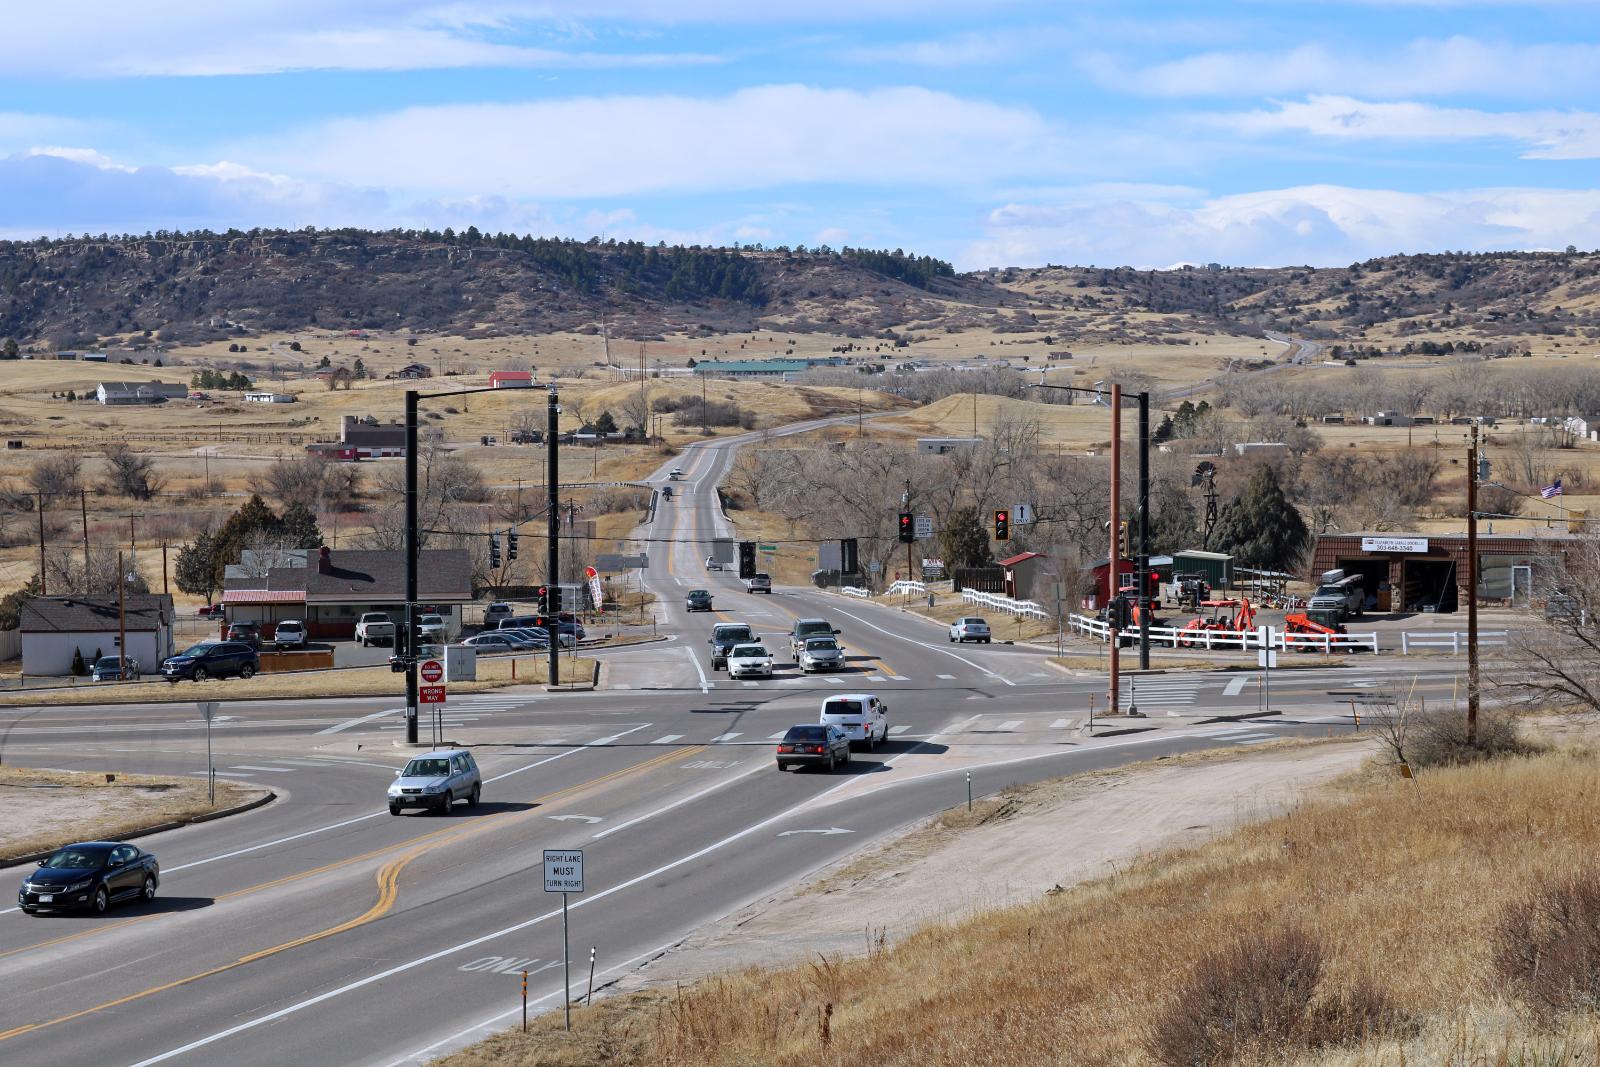
Tucked in Douglas County between Denver and Colorado Springs, Franktown maintains a rural feel with large-acre properties and horse ranches. Despite its low-density layout, prices have soared thanks to its proximity to Castle Rock and Parker—two growing suburban hubs.
With scenic open spaces, excellent access to trails like Castlewood Canyon State Park, and a peaceful lifestyle that attracts affluent buyers seeking land and privacy, Franktown continues to see sustained interest even amid broader market shifts. Its limited inventory of custom homes contributes to the elevated price points.
20. Foxfield – 153% Home Price Increase Since 2010
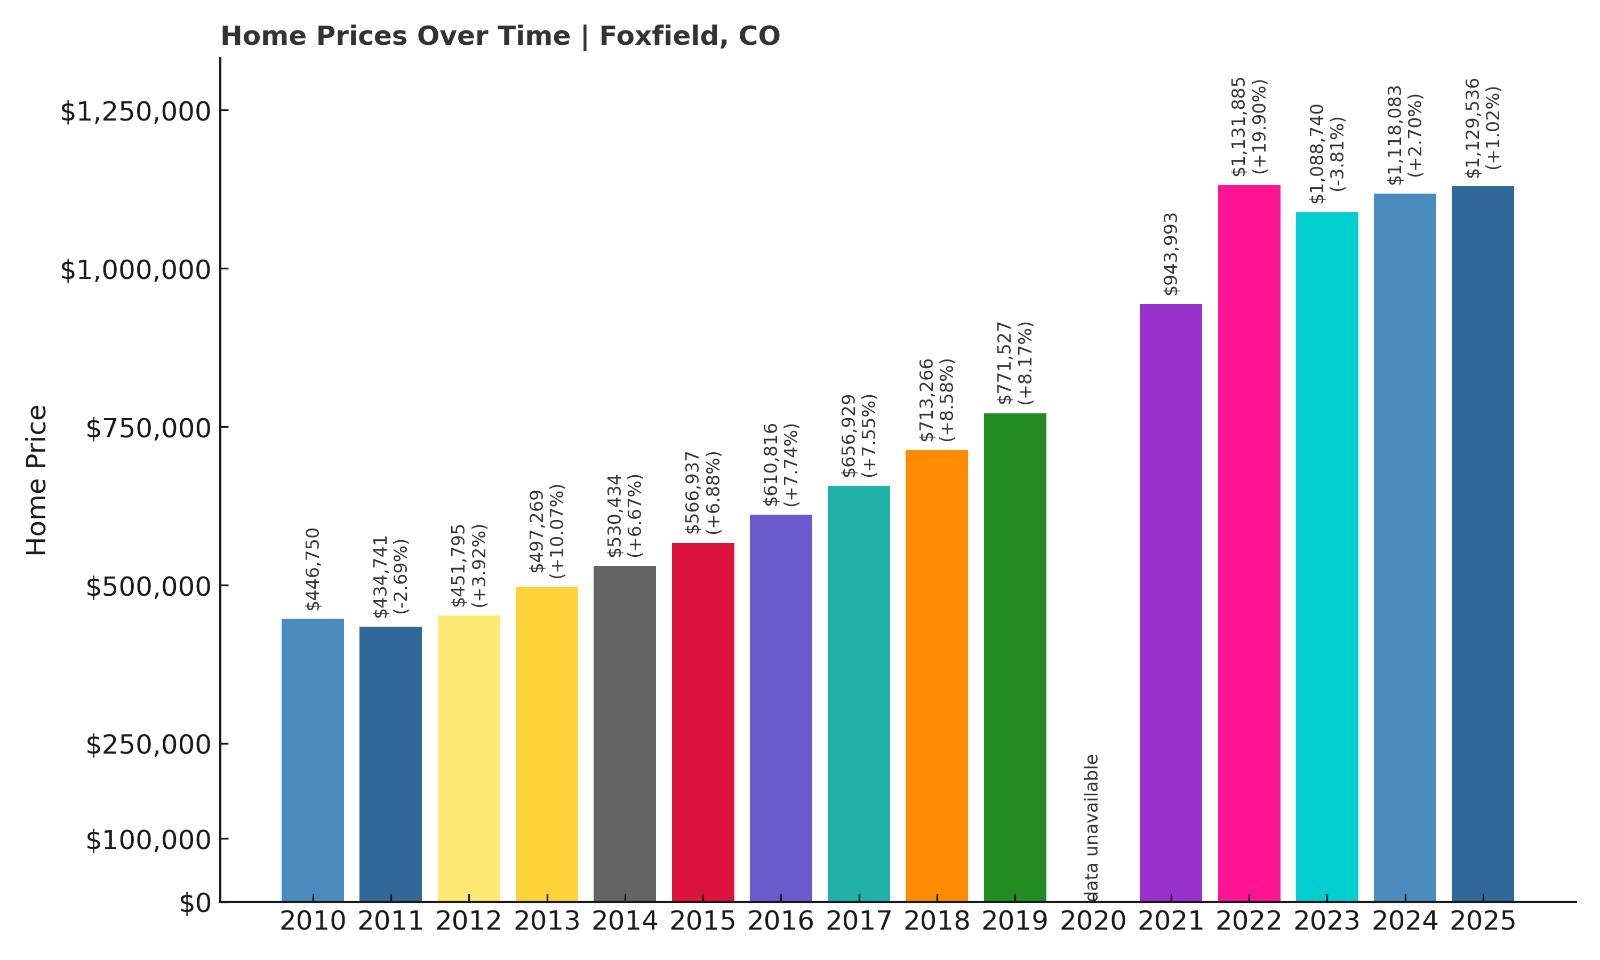
- 2010: $446,750
- 2011: $434,741 (-$12,008, -2.69% from previous year)
- 2012: $451,795 (+$17,054, +3.92% from previous year)
- 2013: $497,269 (+$45,474, +10.07% from previous year)
- 2014: $530,434 (+$33,165, +6.67% from previous year)
- 2015: $566,937 (+$36,503, +6.88% from previous year)
- 2016: $610,816 (+$43,879, +7.74% from previous year)
- 2017: $656,929 (+$46,113, +7.55% from previous year)
- 2018: $713,266 (+$56,336, +8.58% from previous year)
- 2019: $771,527 (+$58,261, +8.17% from previous year)
- 2021: $943,993
- 2022: $1,131,885 (+$187,892, +19.90% from previous year)
- 2023: $1,088,740 (-$43,145, -3.81% from previous year)
- 2024: $1,118,083 (+$29,343, +2.70% from previous year)
- 2025: $1,129,536 (+$11,453, +1.02% from previous year)
Foxfield’s median home values have surged more than 150% since 2010, putting it firmly on Colorado’s most expensive list. After a dramatic jump in 2022, prices dipped slightly but have stabilized above $1.12M in 2025.
Foxfield – Small Town, Big Appeal Near Aurora
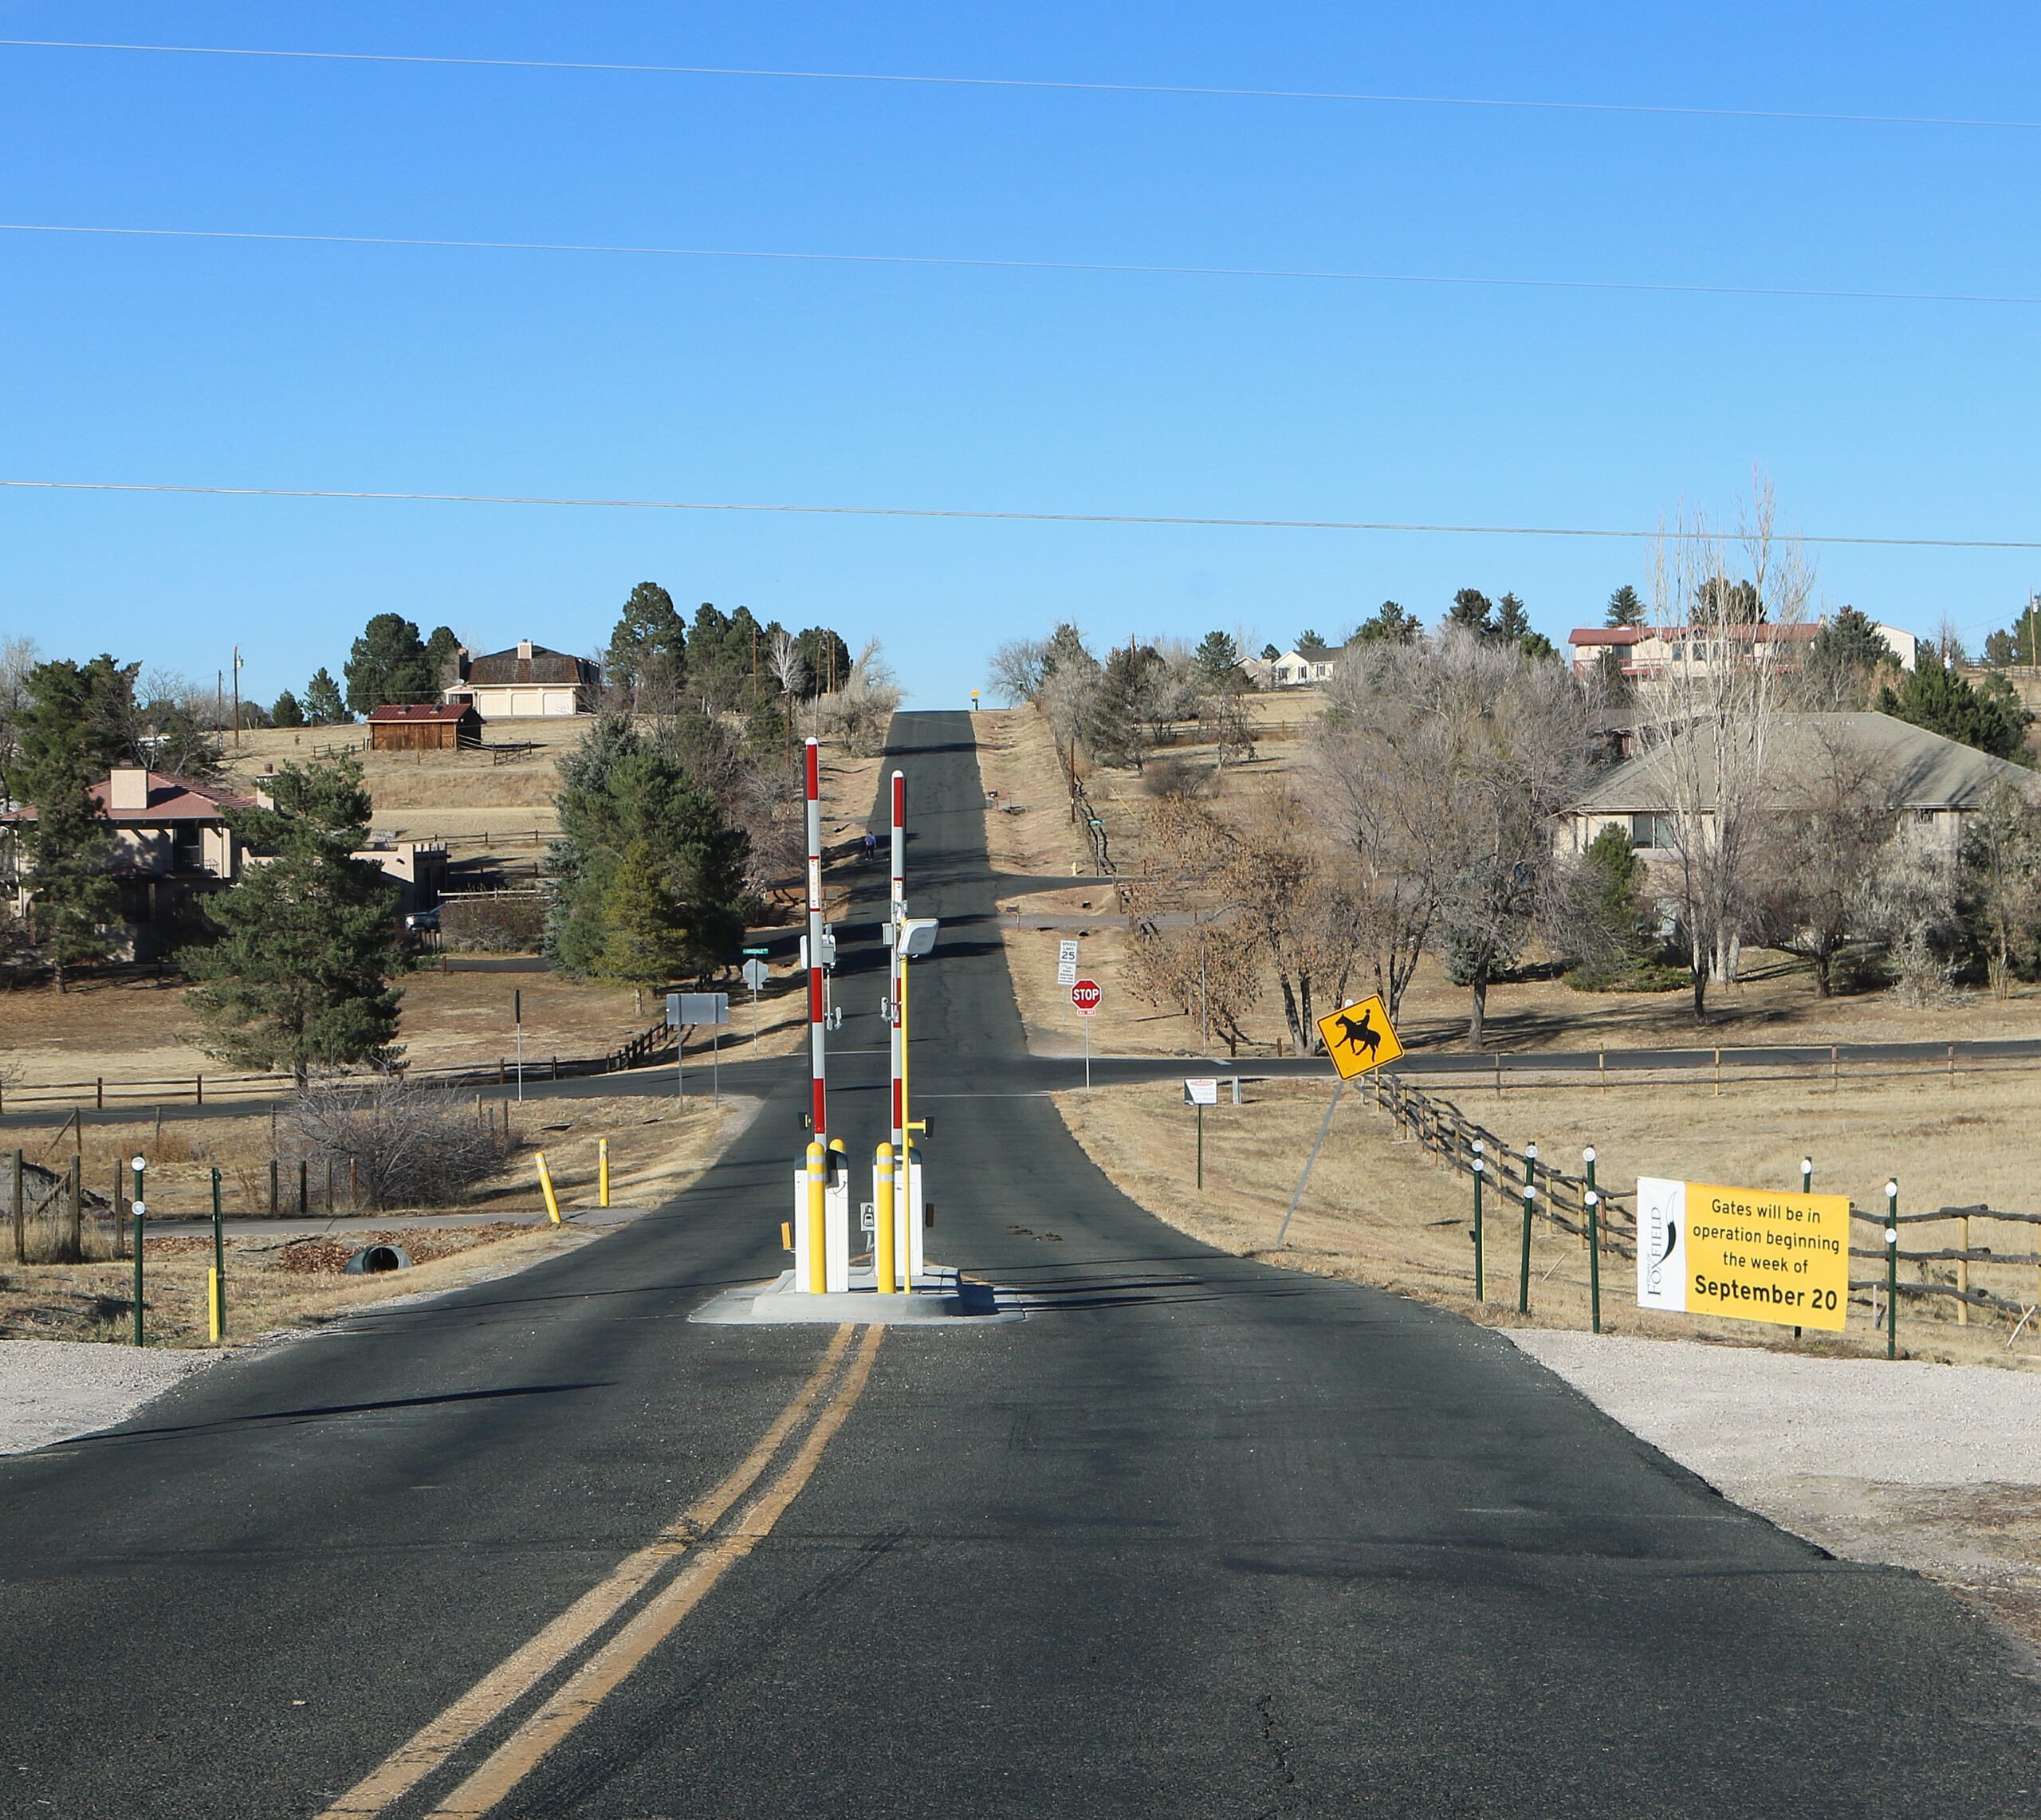
Foxfield is a tiny incorporated town in Arapahoe County surrounded by Aurora, offering large lots and a semi-rural lifestyle. Its unique zoning keeps development limited, preserving privacy and driving up home values over time.
Residents enjoy proximity to both Denver Tech Center and E-470, making it ideal for executives seeking quiet surroundings without giving up accessibility. The blend of exclusivity, location, and low inventory keeps its market tight and expensive.
19. Niwot – 135% Home Price Increase Since 2010
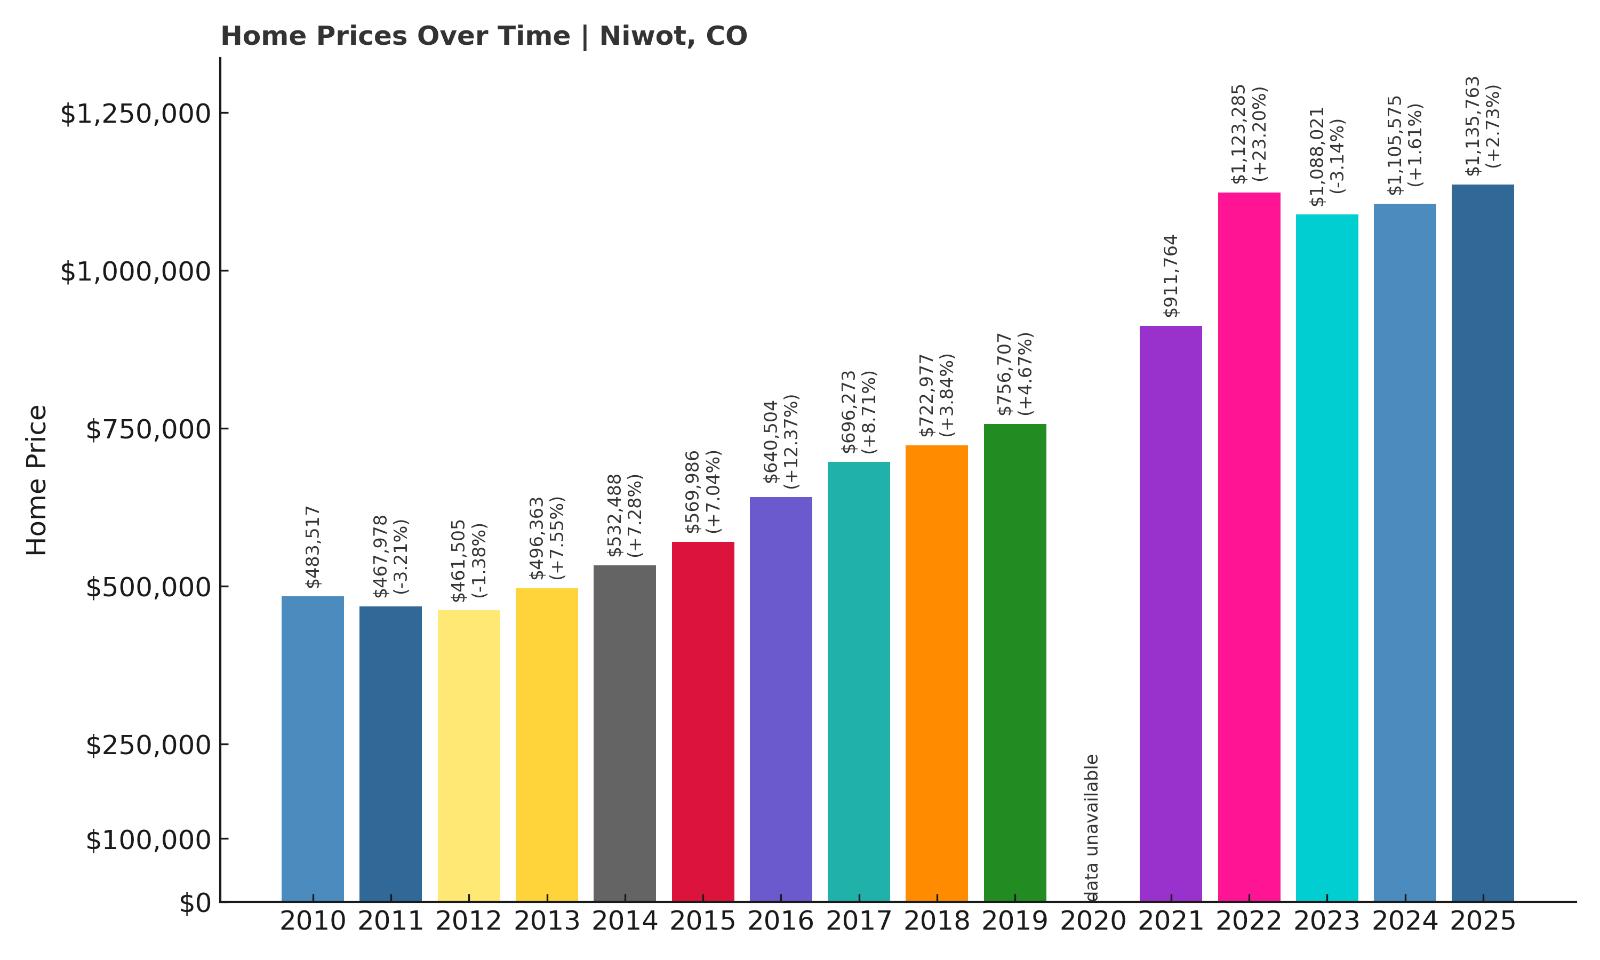
- 2010: $483,517
- 2011: $467,978 (-$15,539, -3.21% from previous year)
- 2012: $461,505 (-$6,472, -1.38% from previous year)
- 2013: $496,363 (+$34,857, +7.55% from previous year)
- 2014: $532,488 (+$36,125, +7.28% from previous year)
- 2015: $569,986 (+$37,498, +7.04% from previous year)
- 2016: $640,504 (+$70,518, +12.37% from previous year)
- 2017: $696,273 (+$55,770, +8.71% from previous year)
- 2018: $722,977 (+$26,703, +3.84% from previous year)
- 2019: $756,707 (+$33,731, +4.67% from previous year)
- 2021: $911,764
- 2022: $1,123,285 (+$211,521, +23.20% from previous year)
- 2023: $1,088,021 (-$35,264, -3.14% from previous year)
- 2024: $1,105,575 (+$17,554, +1.61% from previous year)
- 2025: $1,135,763 (+$30,188, +2.73% from previous year)
Since 2010, Niwot has seen a 135% increase in home prices, with notable spikes post-2021. While prices dipped slightly in 2023, they’ve steadily recovered, reaching $1.14M in 2025.
Niwot – Boulder’s Quiet Luxury Neighbor
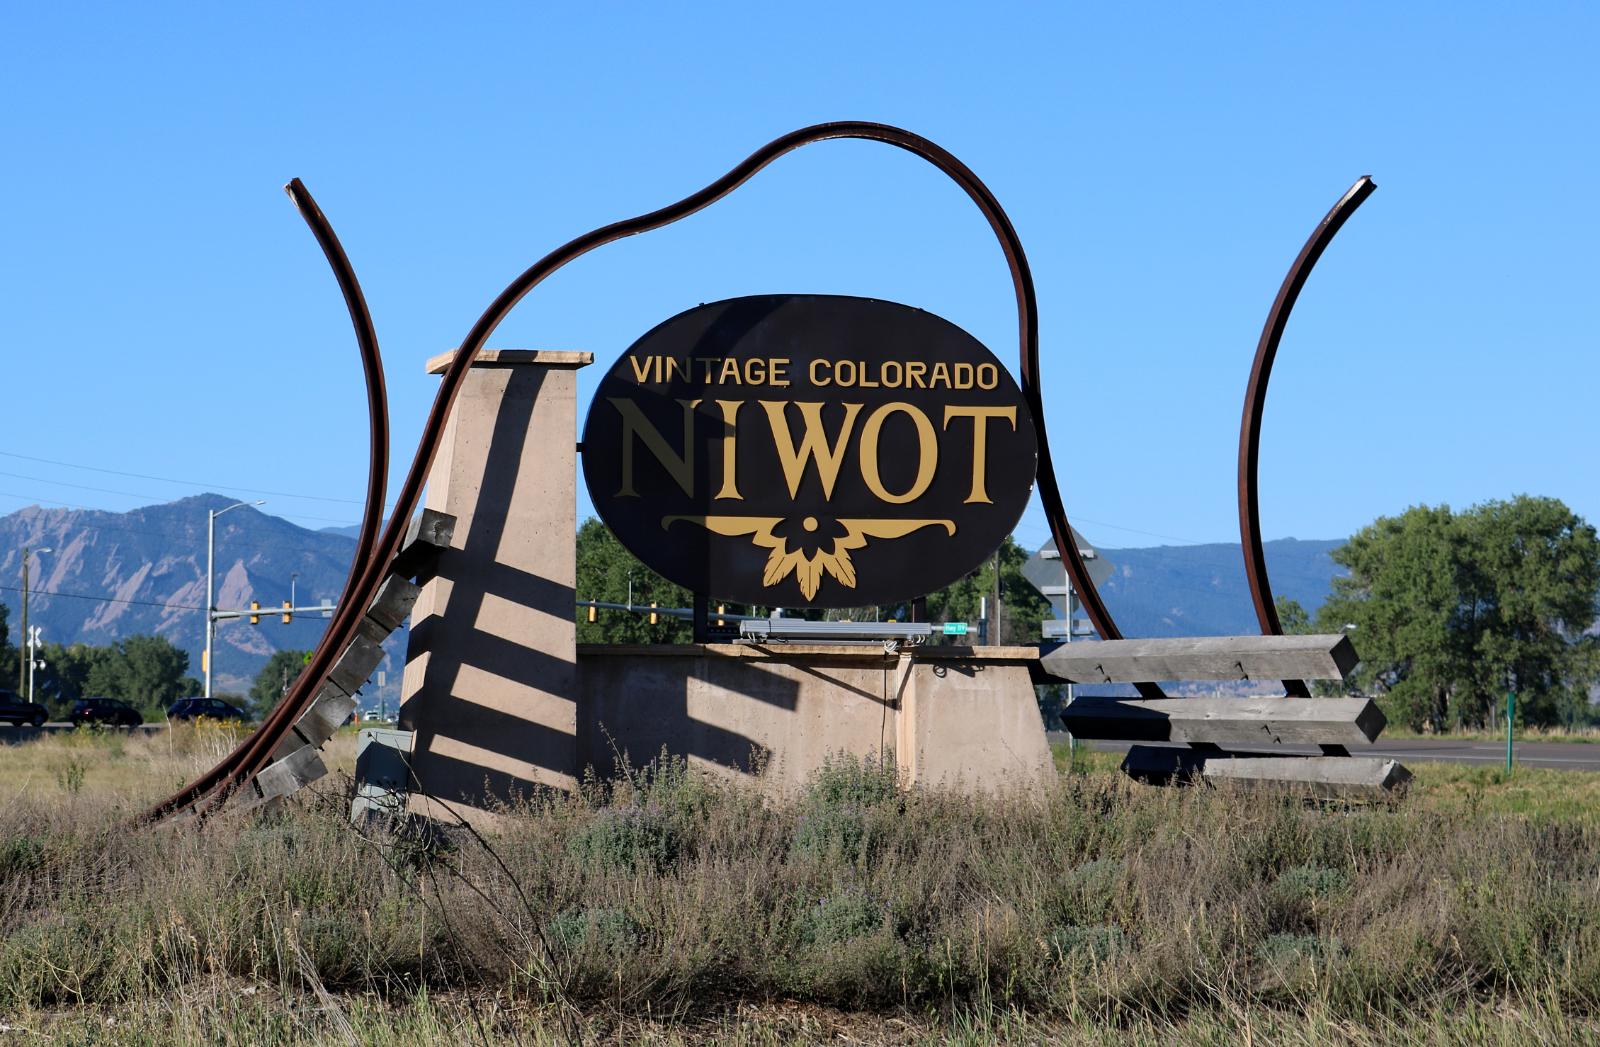
Nestled just northeast of Boulder, Niwot combines small-town charm with access to some of Colorado’s most vibrant tech and academic hubs. The town’s walkable historic district, art galleries, and summer concerts give it an upscale yet unpretentious vibe.
Homebuyers are drawn to Niwot’s larger properties and top-rated St. Vrain Valley schools. Its high desirability and lack of dense development have kept inventory low, pushing prices consistently higher.
18. Genesee – 123% Home Price Increase Since 2010

- 2010: $512,142
- 2011: $489,886 (-$22,255, -4.35% from previous year)
- 2012: $487,115 (-$2,771, -0.57% from previous year)
- 2013: $522,561 (+$35,445, +7.28% from previous year)
- 2014: $555,613 (+$33,052, +6.33% from previous year)
- 2015: $588,585 (+$32,973, +5.93% from previous year)
- 2016: $619,333 (+$30,748, +5.22% from previous year)
- 2017: $661,039 (+$41,706, +6.73% from previous year)
- 2018: $702,471 (+$41,432, +6.27% from previous year)
- 2019: $744,616 (+$42,145, +6.00% from previous year)
- 2021: $918,503
- 2022: $1,132,835 (+$214,332, +23.33% from previous year)
- 2023: $1,086,430 (-$46,405, -4.10% from previous year)
- 2024: $1,131,872 (+$45,442, +4.18% from previous year)
- 2025: $1,145,746 (+$13,873, +1.23% from previous year)
Genesee’s home values have more than doubled in 15 years, despite a few soft years. Its 2022 leap of over 23% reflects renewed luxury demand, now settling at $1.15M in 2025.
Genesee – Gateway to the Rockies
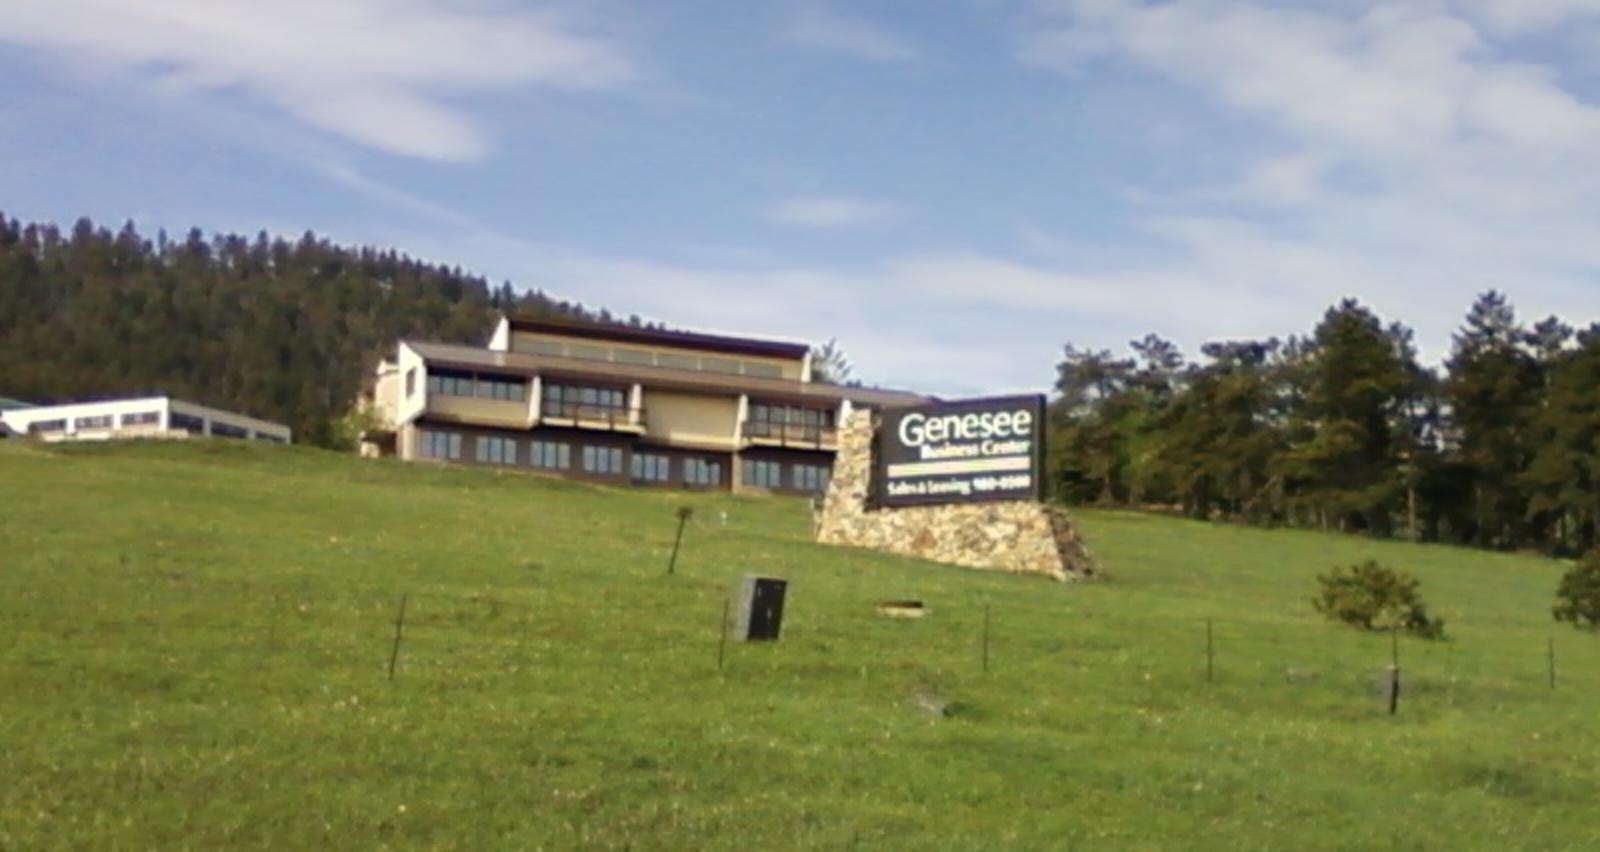
Just off I-70 west of Denver, Genesee offers mountain living with city convenience. It’s a favored spot for professionals who want scenic views, wildlife sightings, and quick ski access—all within commuting distance to downtown.
Its homes are known for custom architecture, expansive lots, and proximity to Genesee Park and Lookout Mountain. With tight restrictions on development and consistent buyer demand, the area remains a stronghold of high-dollar real estate.
17. Breckenridge – 127% Home Price Increase Since 2012
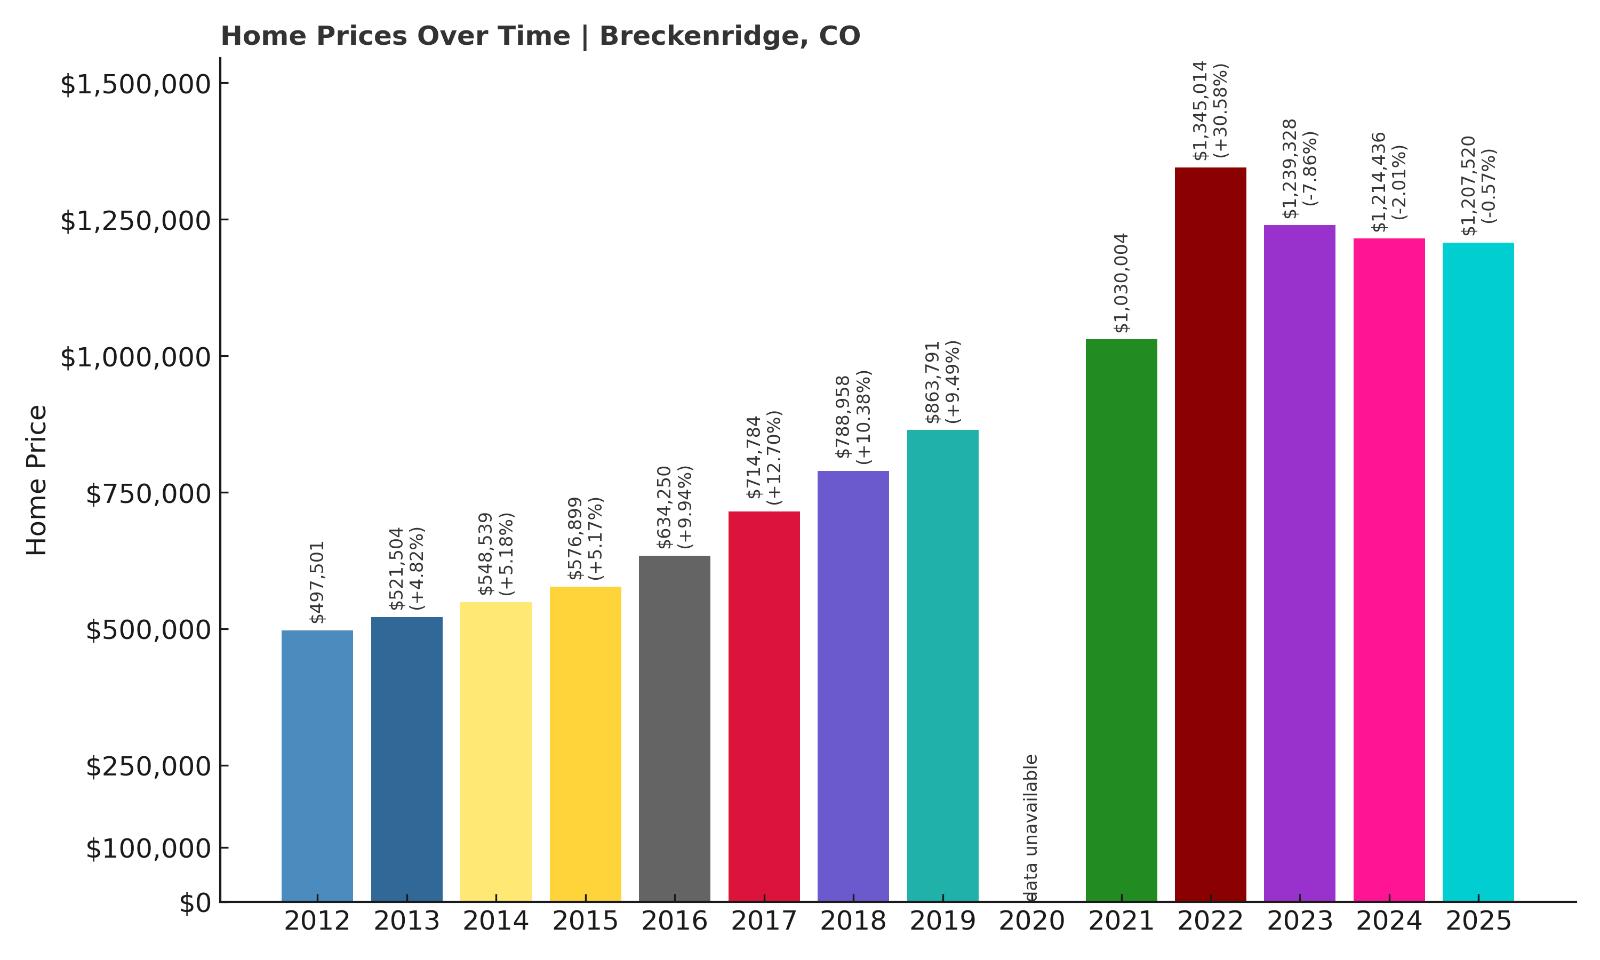
- 2012: $497,501
- 2013: $521,504 (+$24,003, +4.82% from previous year)
- 2014: $548,539 (+$27,035, +5.18% from previous year)
- 2015: $576,899 (+$28,360, +5.17% from previous year)
- 2016: $634,250 (+$57,351, +9.94% from previous year)
- 2017: $714,784 (+$80,534, +12.70% from previous year)
- 2018: $788,958 (+$74,174, +10.38% from previous year)
- 2019: $863,791 (+$74,833, +9.49% from previous year)
- 2021: $1,030,004
- 2022: $1,345,014 (+$315,011, +30.58% from previous year)
- 2023: $1,239,328 (-$105,687, -7.86% from previous year)
- 2024: $1,214,436 (-$24,892, -2.01% from previous year)
- 2025: $1,207,520 (-$6,916, -0.57% from previous year)
Breckenridge home prices more than doubled since 2012, peaking in 2022. A brief correction followed, but values remain sky-high at just over $1.2M in 2025.
Breckenridge – Mountain Luxury with Year-Round Appeal
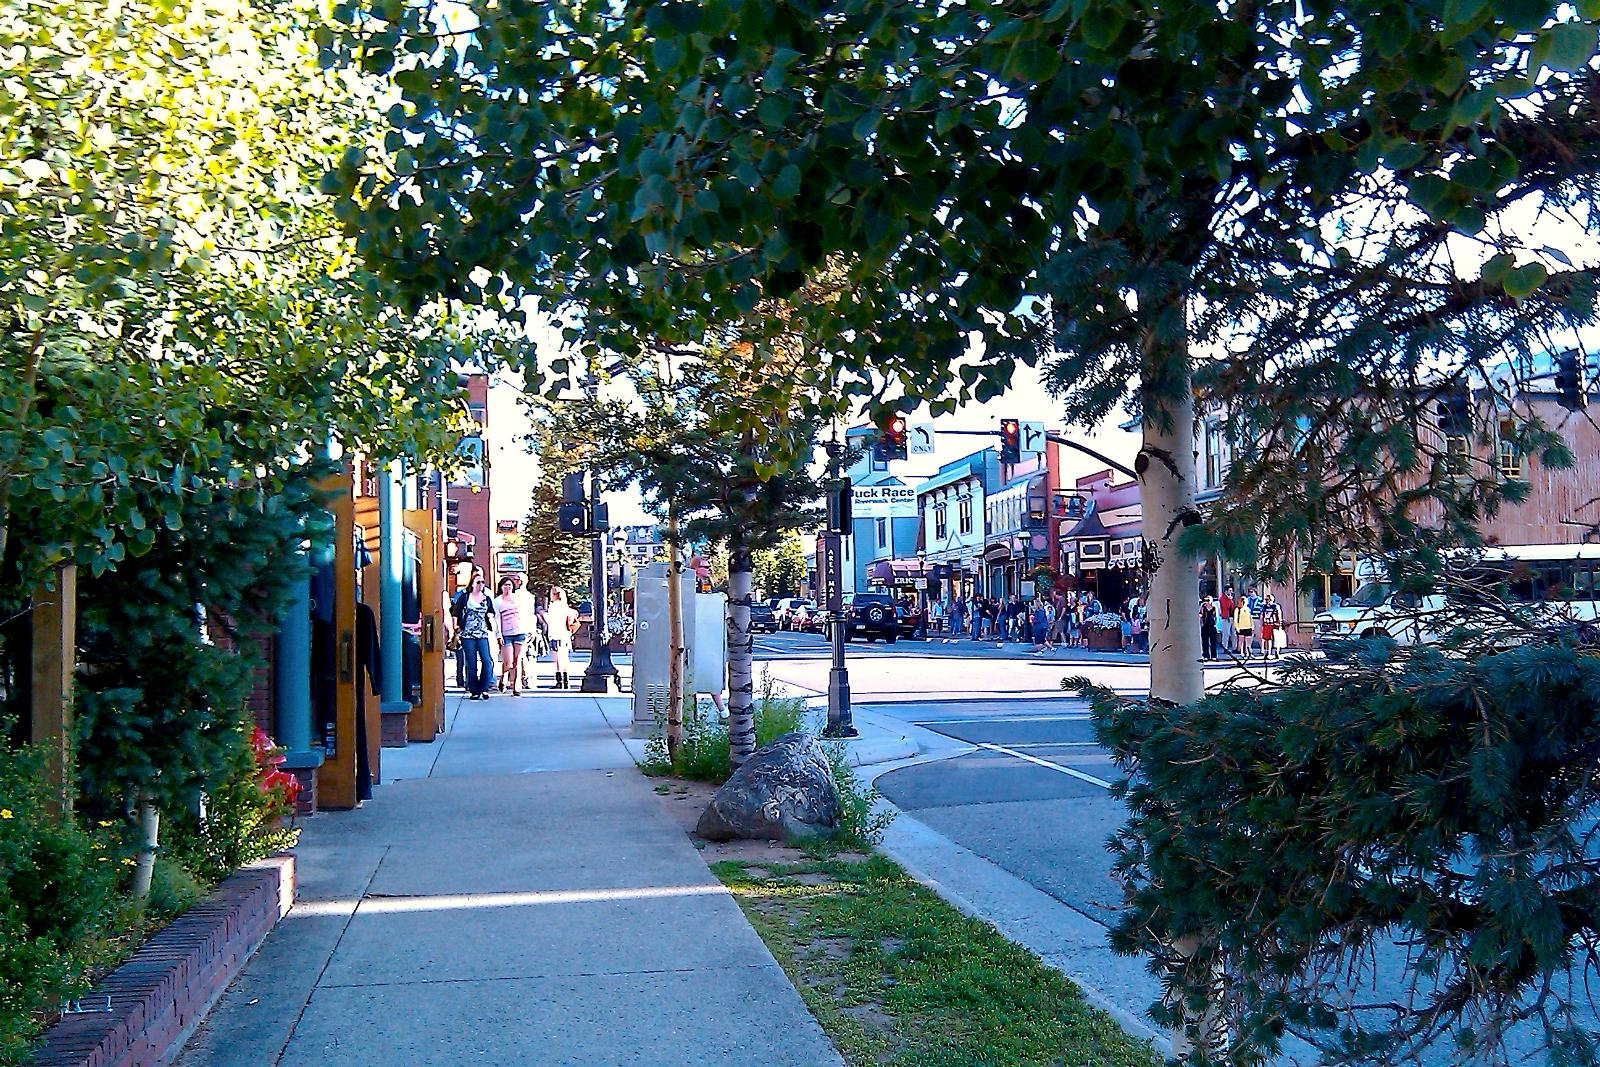
Famous for its world-class ski resort and historic downtown, Breckenridge has long been a magnet for second-home buyers and investors. It’s located in Summit County, about 80 miles west of Denver.
Prices surged during the pandemic as remote work took hold and urban dwellers sought out recreational havens. Although recent years have seen a slight dip, the town’s strong tourism economy and high-end market keep values elevated.
16. Placerville – 80% Home Price Increase Since 2018
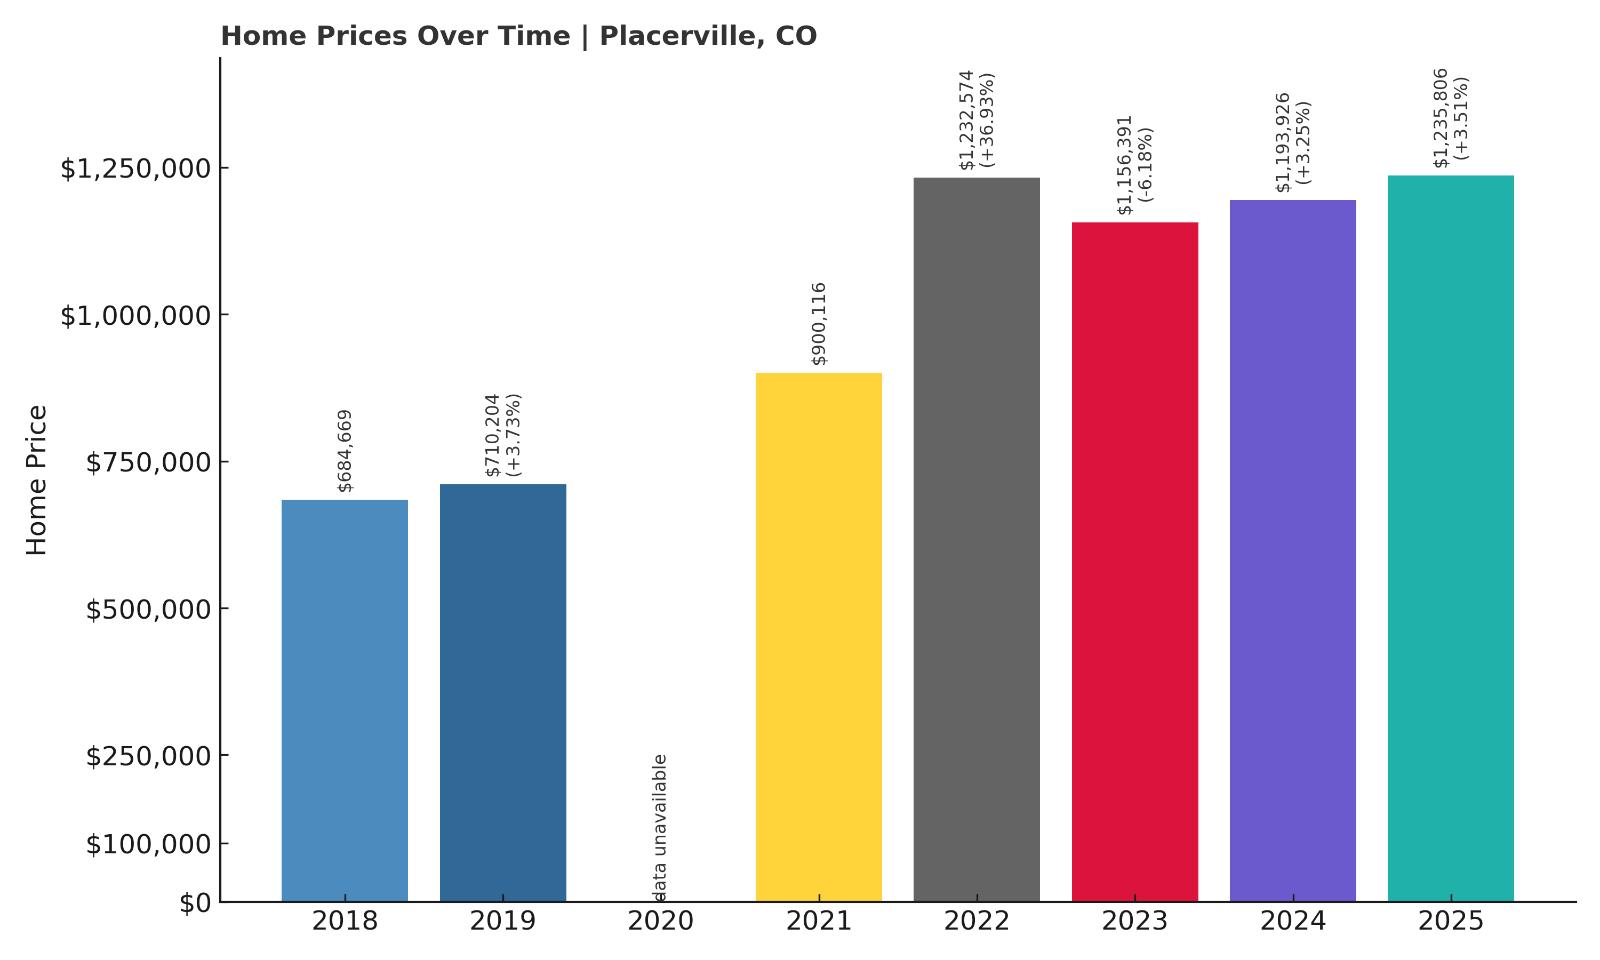
- 2018: $684,669
- 2019: $710,204 (+$25,536, +3.73% from previous year)
- 2021: $900,116
- 2022: $1,232,574 (+$332,458, +36.93% from previous year)
- 2023: $1,156,391 (-$76,183, -6.18% from previous year)
- 2024: $1,193,926 (+$37,535, +3.25% from previous year)
- 2025: $1,235,806 (+$41,881, +3.51% from previous year)
Since 2018, home prices in Placerville have jumped more than 80%, with an especially dramatic spike in 2022. While the market cooled slightly afterward, values have rebounded, reaching over $1.23M in 2025.
Placerville – High Elevation, Higher Prices
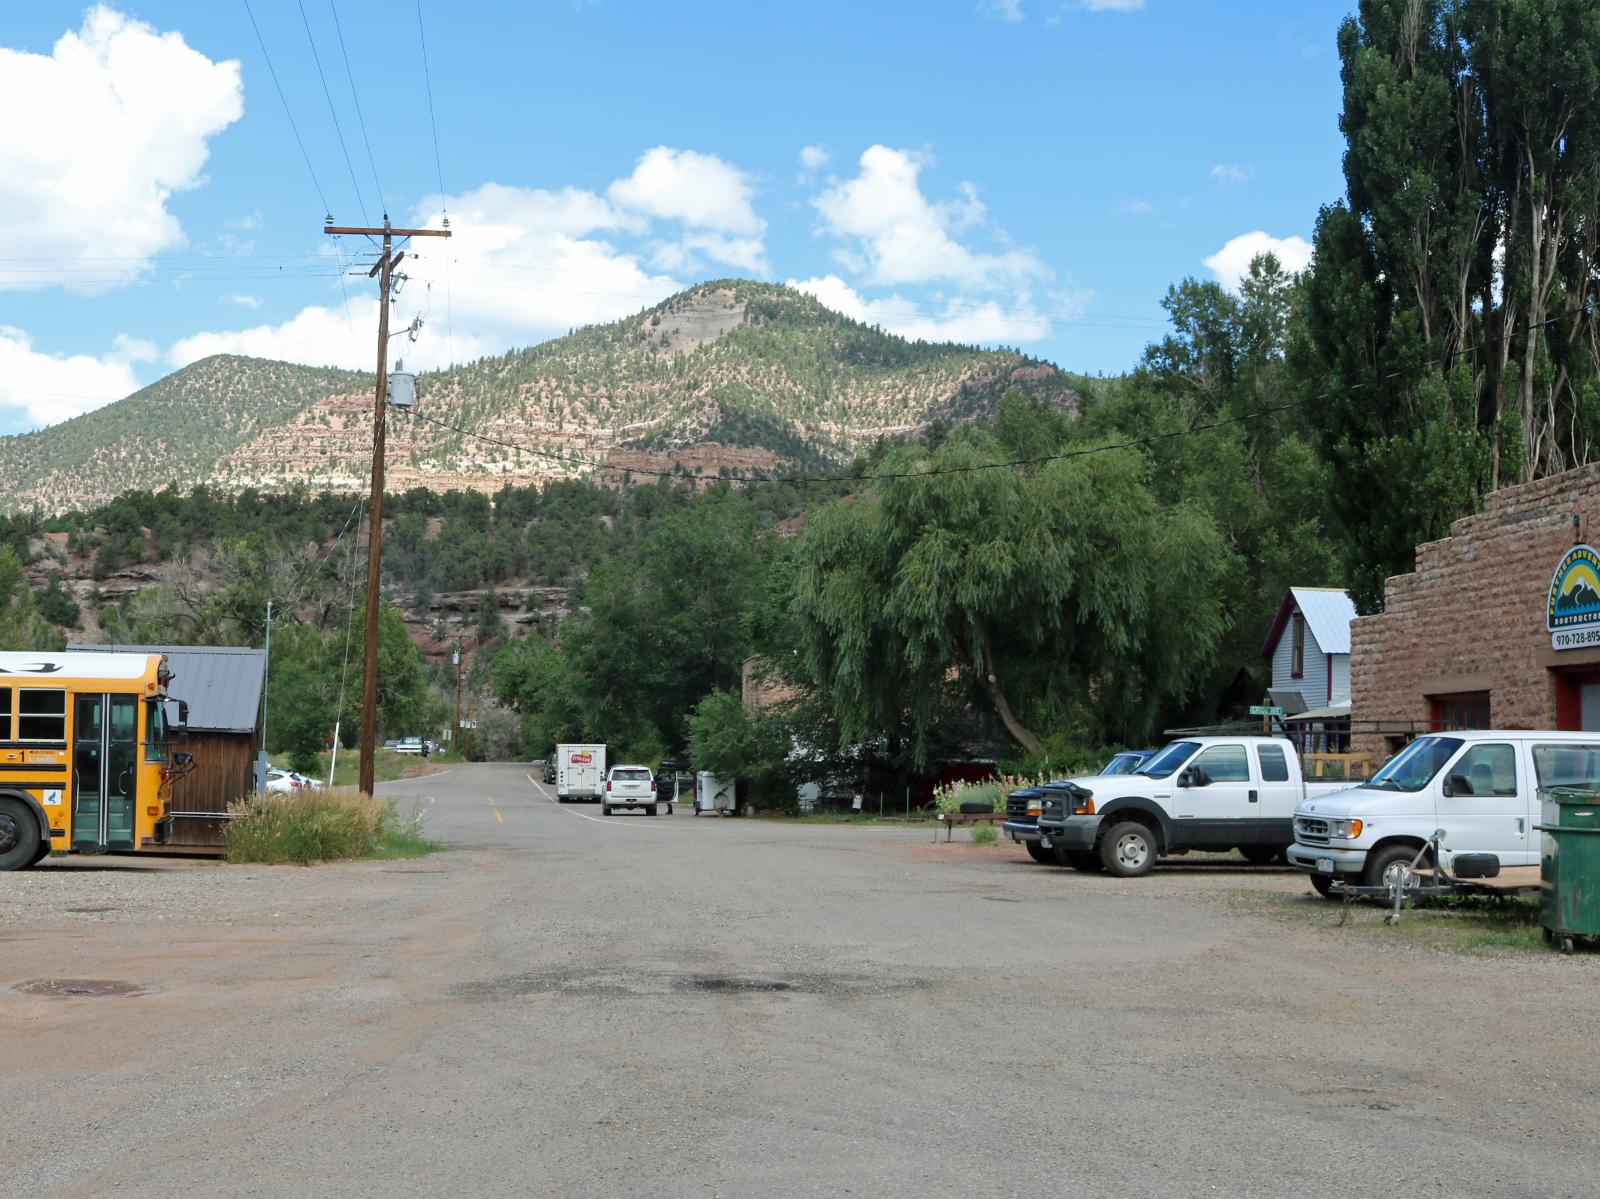
Located in San Miguel County near Telluride, Placerville is a small mountain town that has experienced big price leaps in recent years. The town’s rugged charm and proximity to premier ski destinations have fueled demand for both primary and second homes.
With limited inventory and scenic canyon views along the San Miguel River, Placerville appeals to buyers looking for tranquility just outside the hustle of Telluride. The market may be smaller, but what’s available commands a premium.
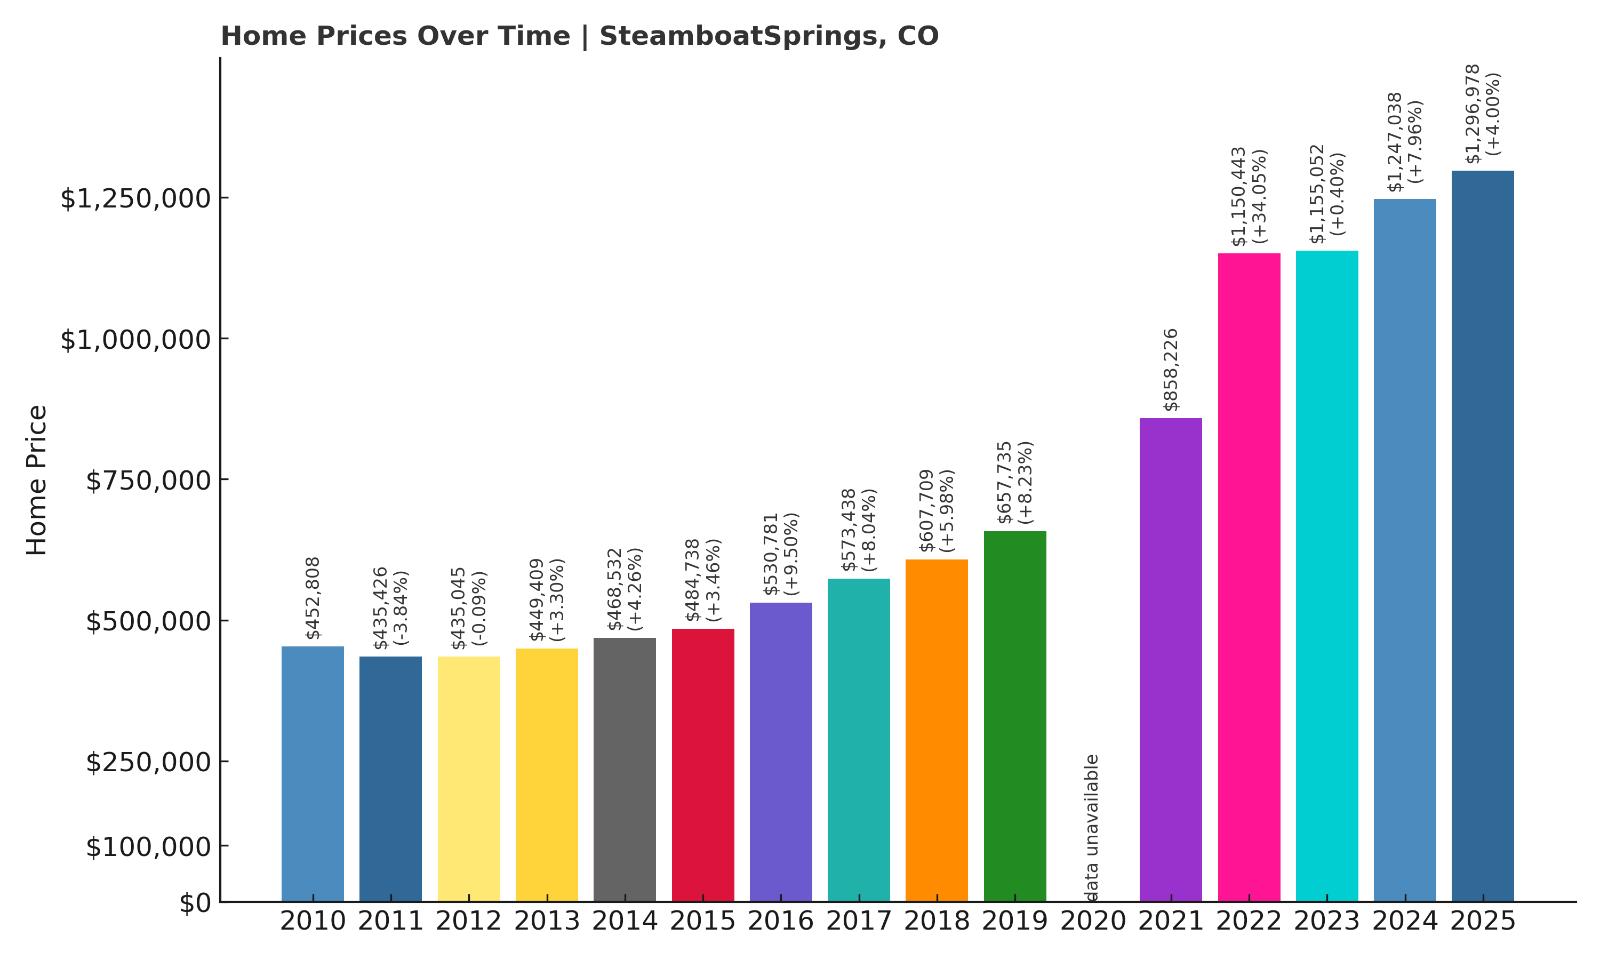
15. Steamboat Springs – 186% Home Price Increase Since 2010
🔥 Would you like to save this?
- 2010: $452,808
- 2011: $435,426 (-$17,382, -3.84% from previous year)
- 2012: $435,045 (-$382, -0.09% from previous year)
- 2013: $449,409 (+$14,364, +3.30% from previous year)
- 2014: $468,532 (+$19,123, +4.26% from previous year)
- 2015: $484,738 (+$16,206, +3.46% from previous year)
- 2016: $530,781 (+$46,043, +9.50% from previous year)
- 2017: $573,438 (+$42,657, +8.04% from previous year)
- 2018: $607,709 (+$34,271, +5.98% from previous year)
- 2019: $657,735 (+$50,026, +8.23% from previous year)
- 2021: $858,226
- 2022: $1,150,443 (+$292,217, +34.05% from previous year)
- 2023: $1,155,052 (+$4,609, +0.40% from previous year)
- 2024: $1,247,038 (+$91,986, +7.96% from previous year)
- 2025: $1,296,978 (+$49,940, +4.00% from previous year)
Steamboat Springs has seen nearly 190% growth in median home values since 2010, climbing steadily year after year. The surge in 2022 was especially sharp, followed by moderate but consistent gains through 2025.
Steamboat Springs – Ski Roots, Year-Round Appeal
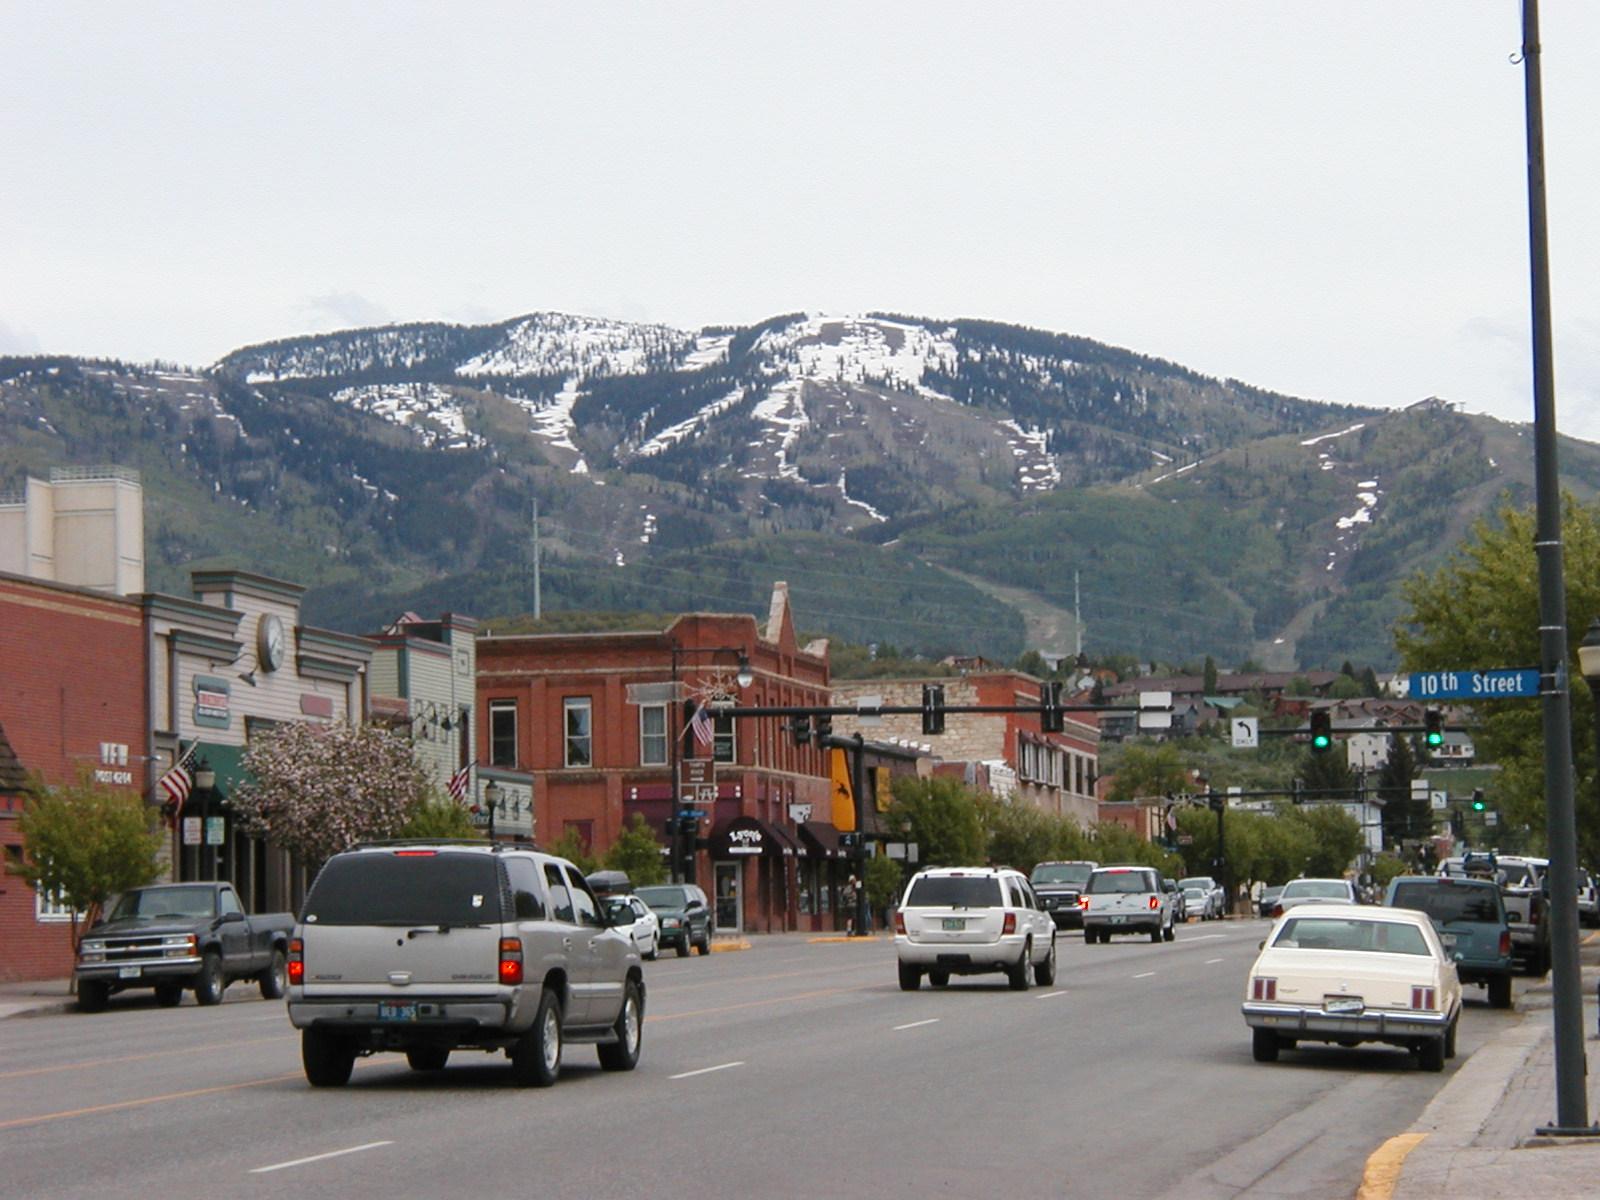
Known for its signature Champagne Powder™ snow, Steamboat Springs is a full-fledged resort town in northwest Colorado. Its mix of high-end real estate, a vibrant tourism economy, and outdoor recreation options make it a hot commodity among second-home buyers and investors.
The town also benefits from Yampa Valley Regional Airport, increasing accessibility for out-of-state buyers. While homes are expensive, steady rental income and lifestyle perks make them highly sought after.
14. Basalt – 161% Home Price Increase Since 2010
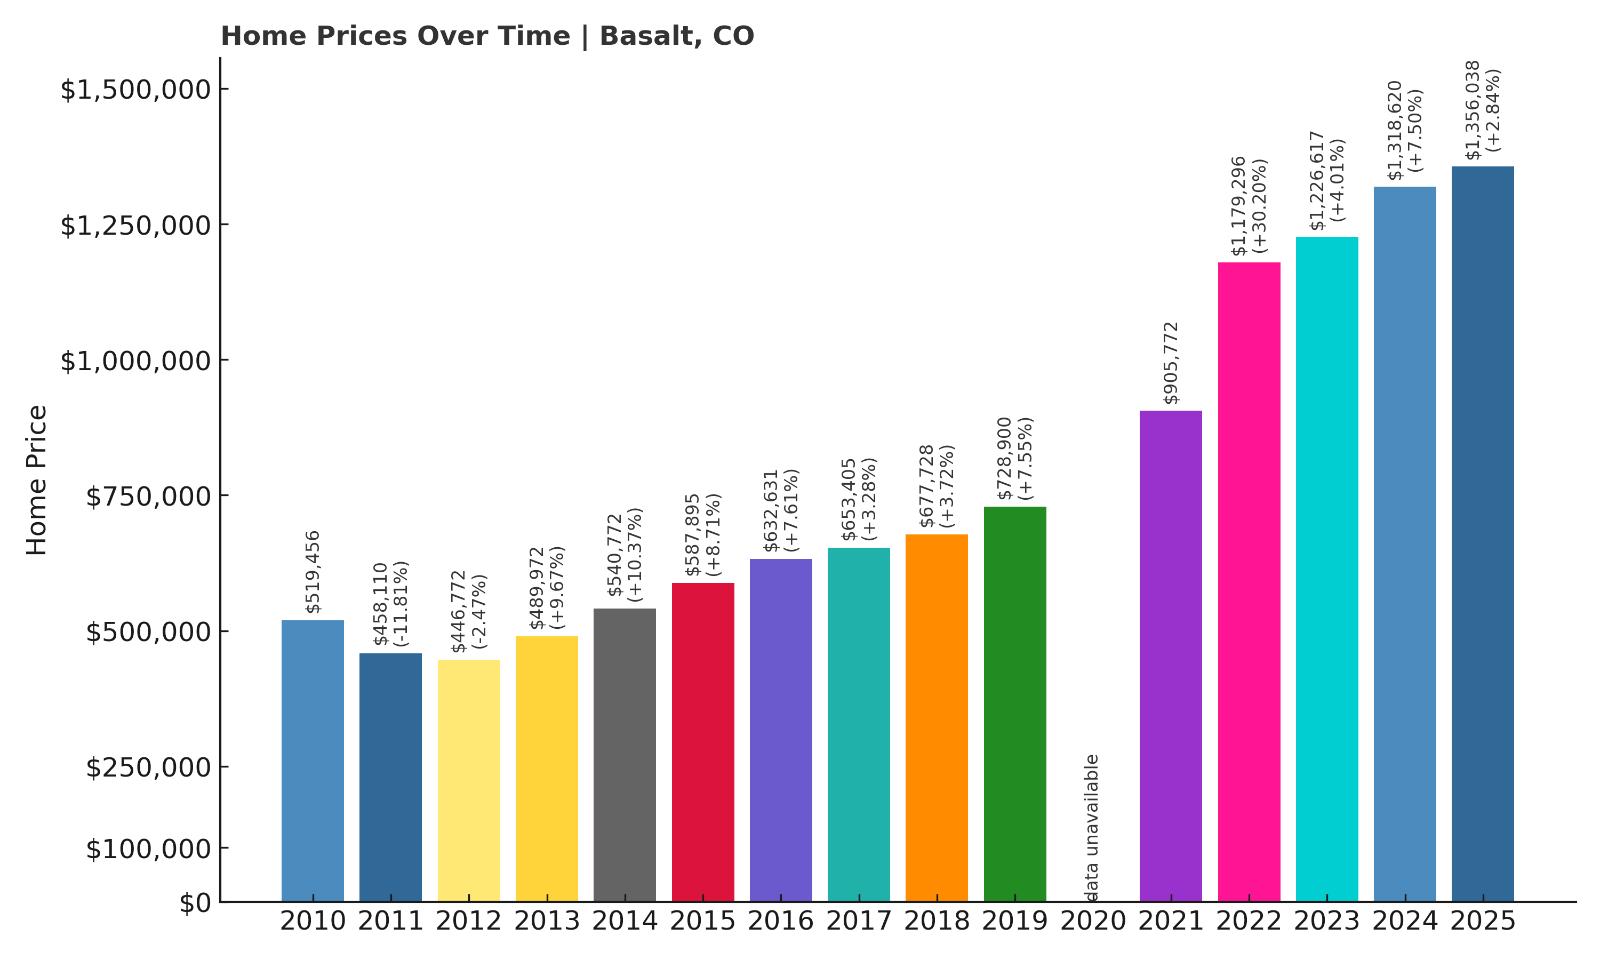
- 2010: $519,456
- 2011: $458,110 (-$61,347, -11.81% from previous year)
- 2012: $446,772 (-$11,337, -2.47% from previous year)
- 2013: $489,972 (+$43,200, +9.67% from previous year)
- 2014: $540,772 (+$50,800, +10.37% from previous year)
- 2015: $587,895 (+$47,122, +8.71% from previous year)
- 2016: $632,631 (+$44,736, +7.61% from previous year)
- 2017: $653,405 (+$20,774, +3.28% from previous year)
- 2018: $677,728 (+$24,323, +3.72% from previous year)
- 2019: $728,900 (+$51,173, +7.55% from previous year)
- 2021: $905,772
- 2022: $1,179,296 (+$273,524, +30.20% from previous year)
- 2023: $1,226,617 (+$47,321, +4.01% from previous year)
- 2024: $1,318,620 (+$92,002, +7.50% from previous year)
- 2025: $1,356,038 (+$37,419, +2.84% from previous year)
Basalt home prices have soared since 2010, nearly tripling with a sharp leap in 2022. Values remain strong in 2025, hovering just above $1.35M.
Basalt – River Views and Resort Proximity
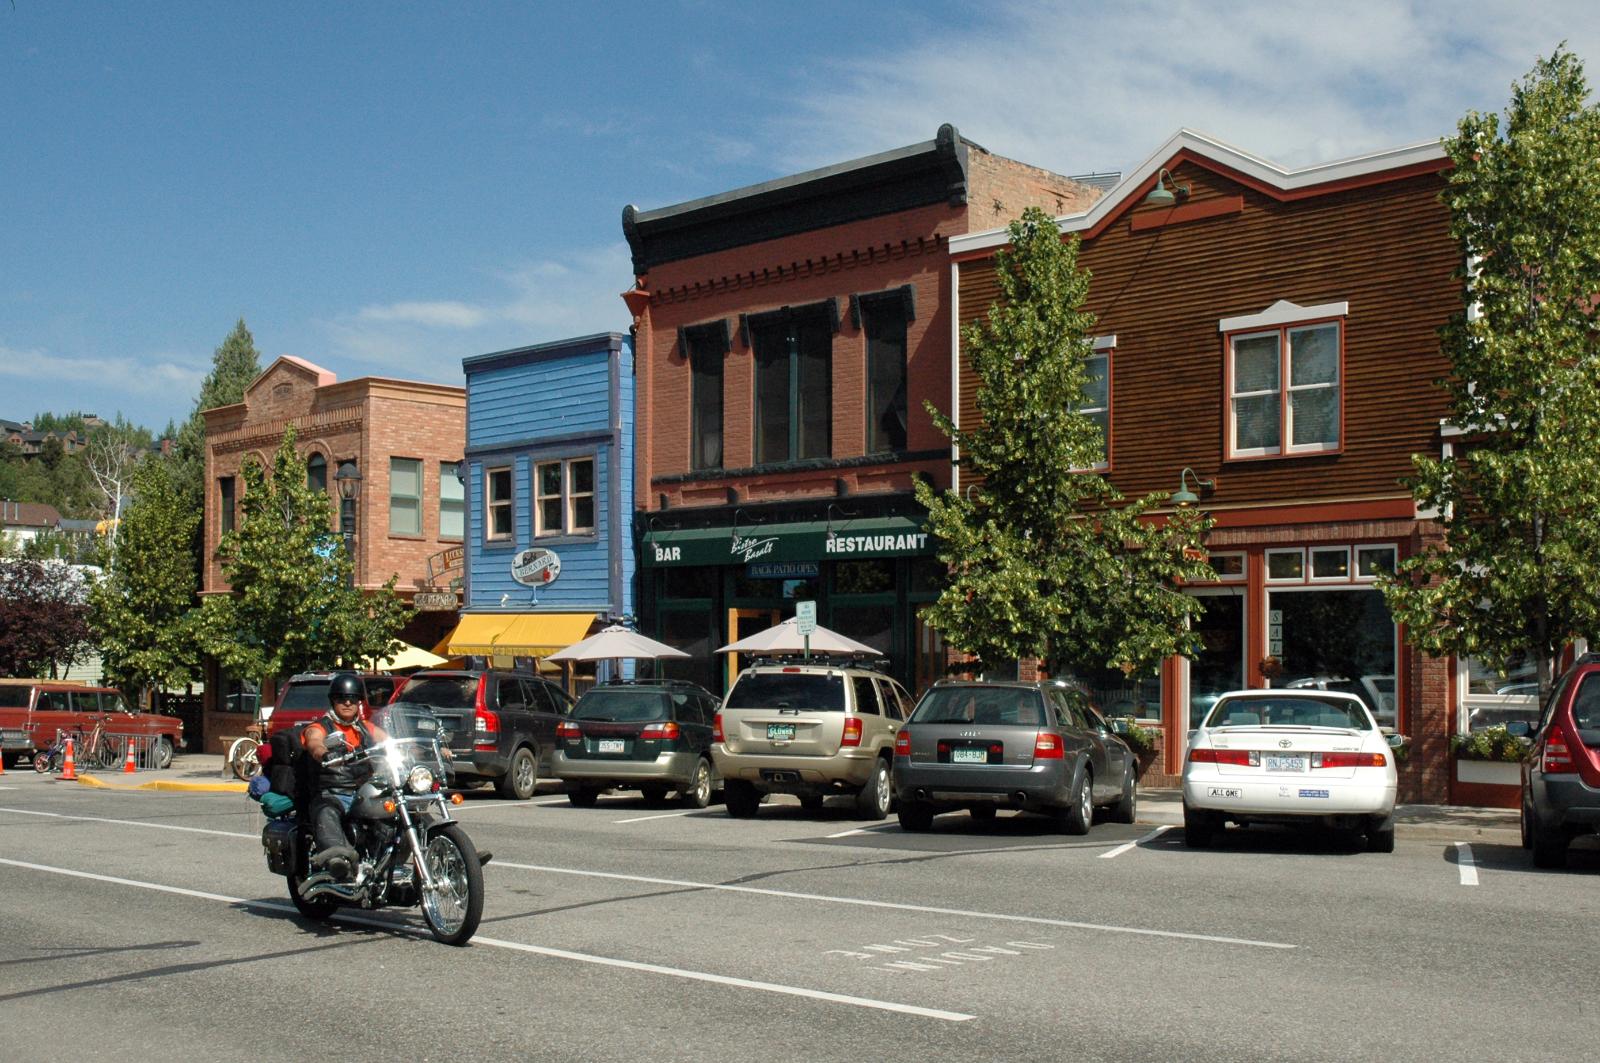
Set at the confluence of the Roaring Fork and Fryingpan Rivers, Basalt offers a unique blend of mountain charm and upscale living. It’s about 20 miles from Aspen, making it a more accessible option for buyers who want proximity to the lifestyle without Aspen’s top-tier prices.
The town’s fly fishing, art galleries, and expanding trail system have helped sustain growth, especially as remote work expands location flexibility. New development remains carefully managed, keeping supply tight.
13. Avon – 152% Home Price Increase Since 2012
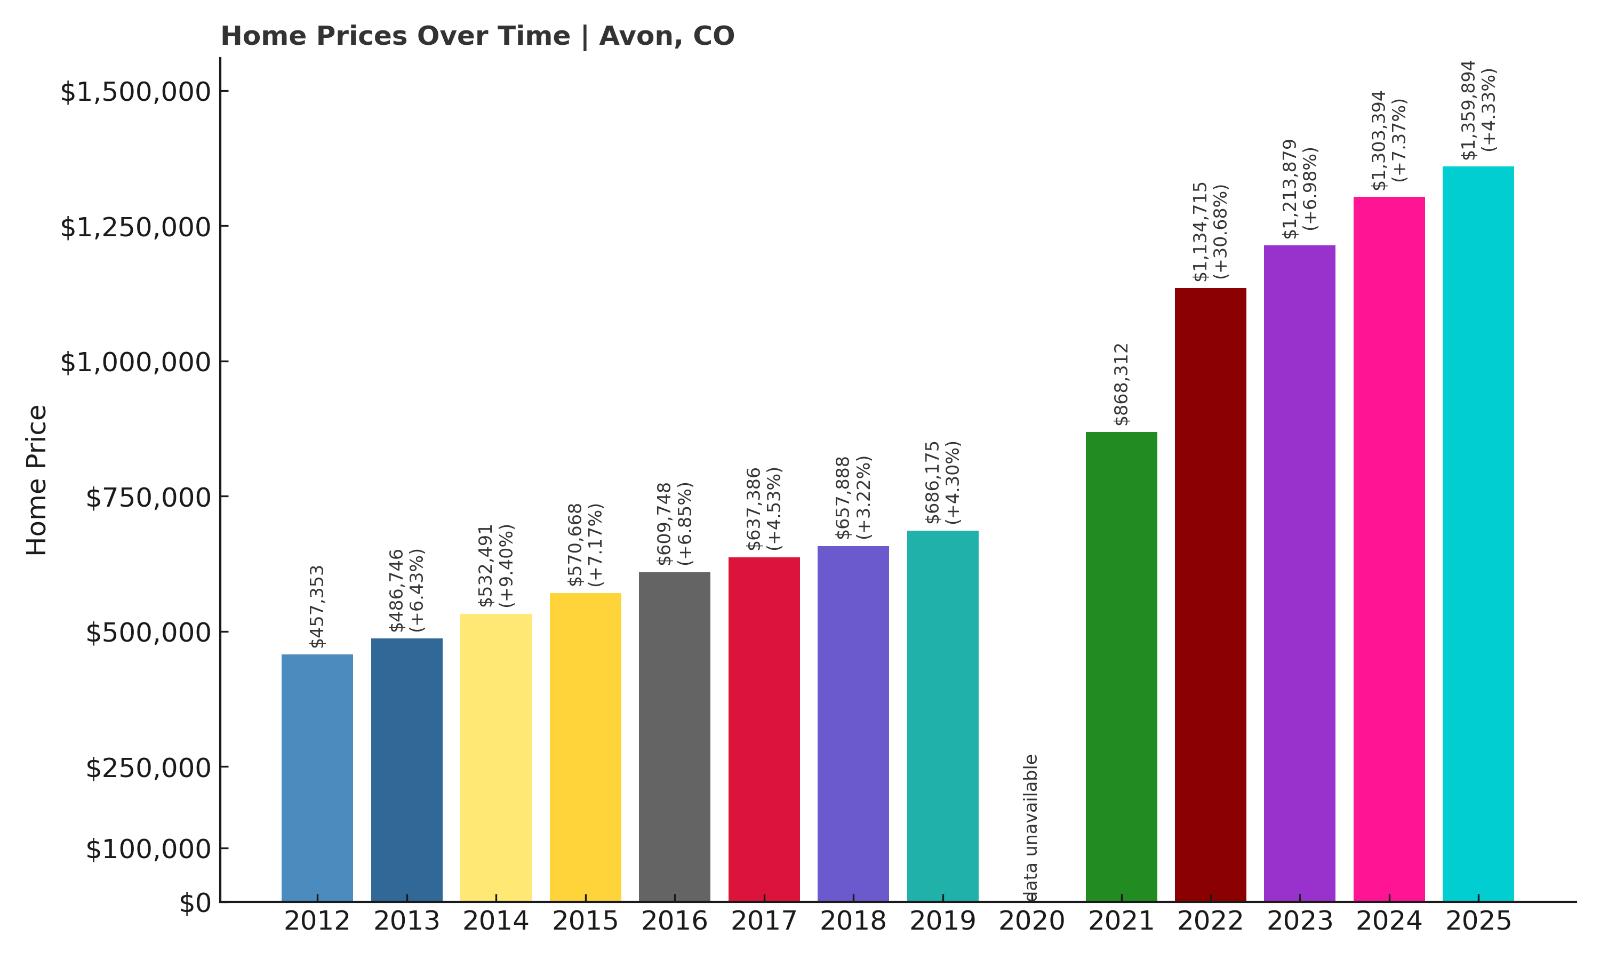
- 2012: $457,353
- 2013: $486,746 (+$29,393, +6.43% from previous year)
- 2014: $532,491 (+$45,745, +9.40% from previous year)
- 2015: $570,668 (+$38,177, +7.17% from previous year)
- 2016: $609,748 (+$39,079, +6.85% from previous year)
- 2017: $637,386 (+$27,639, +4.53% from previous year)
- 2018: $657,888 (+$20,501, +3.22% from previous year)
- 2019: $686,175 (+$28,287, +4.30% from previous year)
- 2021: $868,312
- 2022: $1,134,715 (+$266,403, +30.68% from previous year)
- 2023: $1,213,879 (+$79,164, +6.98% from previous year)
- 2024: $1,303,394 (+$89,515, +7.37% from previous year)
- 2025: $1,359,894 (+$56,500, +4.33% from previous year)
Avon home prices have shot up more than 150% since 2012. Strong annual gains continued even after the 2022 surge, placing the 2025 median at nearly $1.36M.
Avon – The Base of Beaver Creek
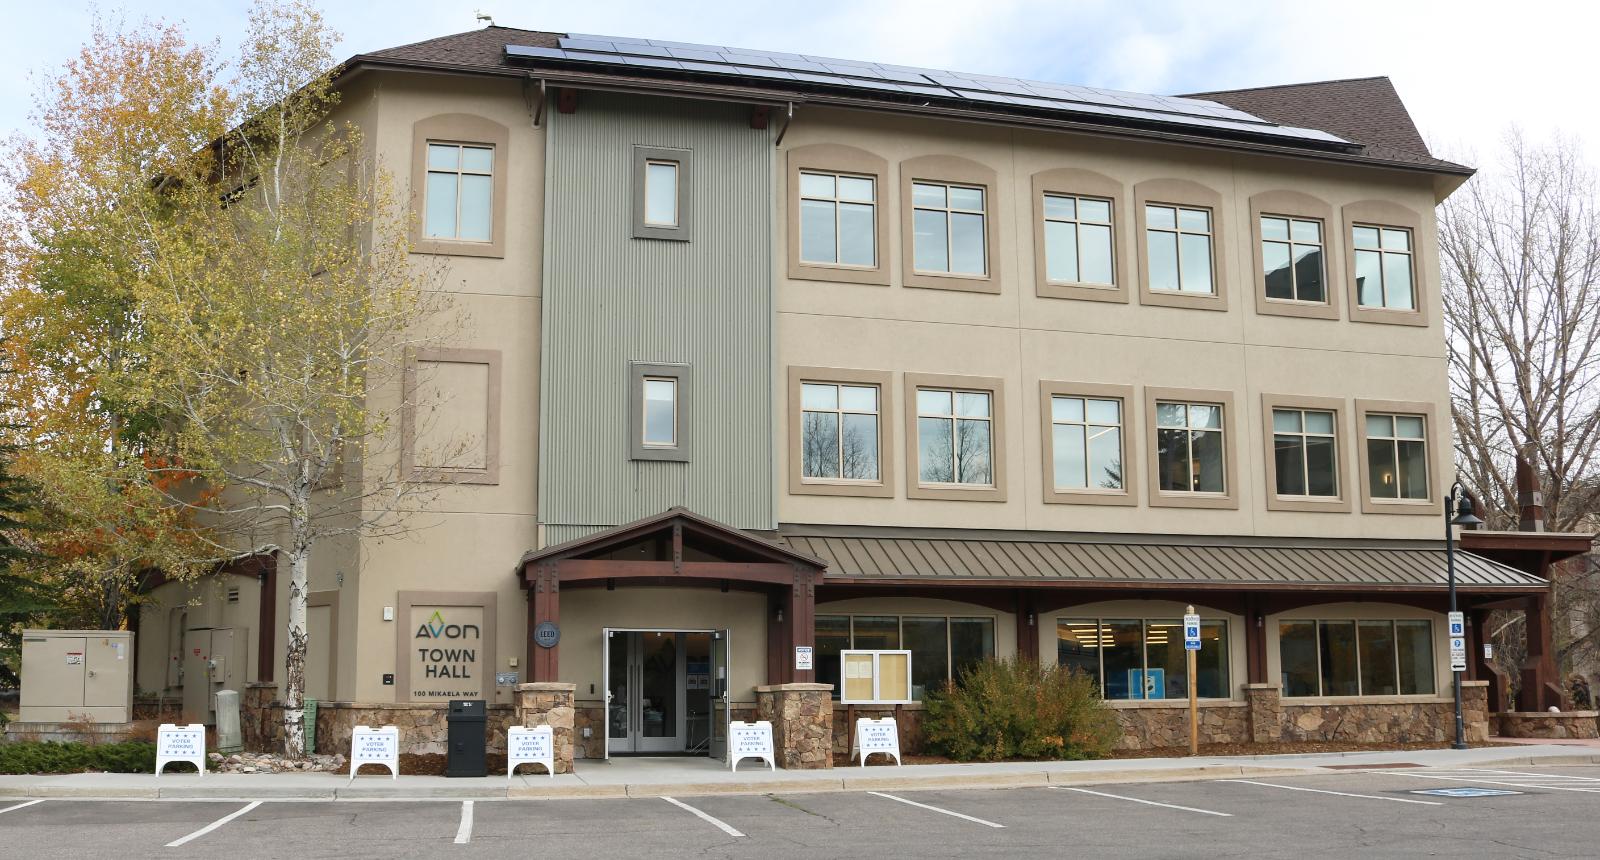
Often called the “Heart of the Valley,” Avon sits at the base of Beaver Creek Resort in Eagle County. It serves as a commercial and residential hub for year-round visitors, especially those priced out of Vail.
With access to skiing, lake recreation, and mountain trails, Avon attracts families and second-home buyers alike. Development near Nottingham Park and expanded transit options have helped support continued demand.
12. Carbondale – 244% Home Price Increase Since 2010
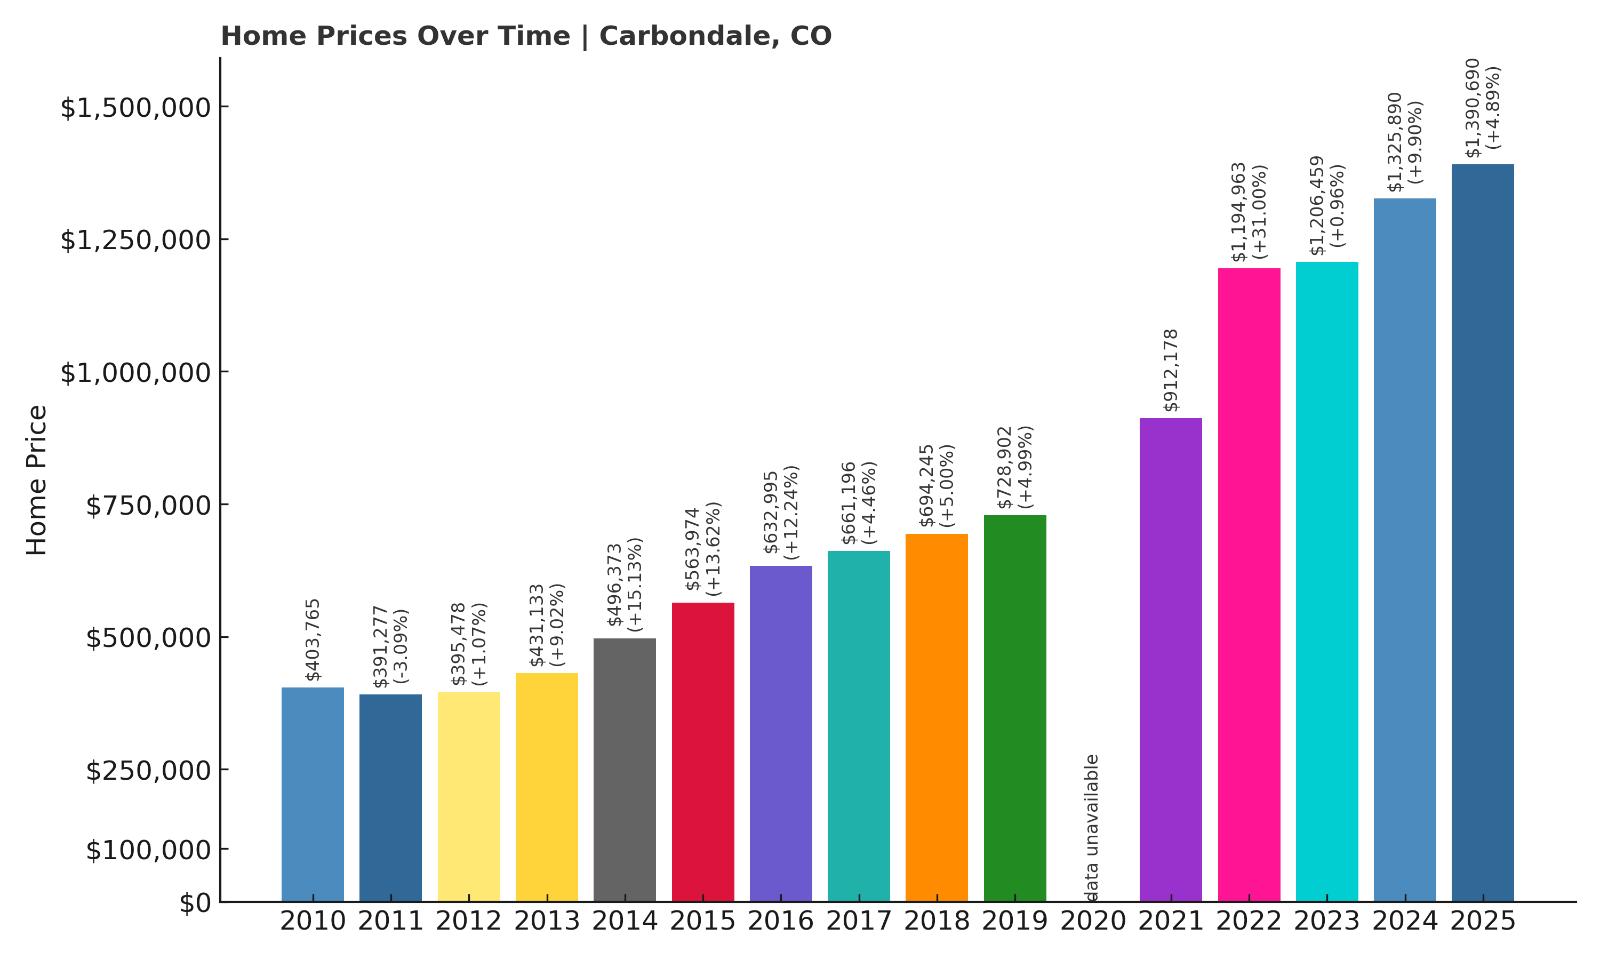
- 2010: $403,765
- 2011: $391,277 (-$12,488, -3.09% from previous year)
- 2012: $395,478 (+$4,201, +1.07% from previous year)
- 2013: $431,133 (+$35,656, +9.02% from previous year)
- 2014: $496,373 (+$65,239, +15.13% from previous year)
- 2015: $563,974 (+$67,601, +13.62% from previous year)
- 2016: $632,995 (+$69,021, +12.24% from previous year)
- 2017: $661,196 (+$28,201, +4.46% from previous year)
- 2018: $694,245 (+$33,049, +5.00% from previous year)
- 2019: $728,902 (+$34,657, +4.99% from previous year)
- 2021: $912,178
- 2022: $1,194,963 (+$282,785, +31.00% from previous year)
- 2023: $1,206,459 (+$11,497, +0.96% from previous year)
- 2024: $1,325,890 (+$119,431, +9.90% from previous year)
- 2025: $1,390,690 (+$64,799, +4.89% from previous year)
Carbondale’s home prices have soared nearly 250% since 2010. Though the sharpest gain came in 2022, steady growth has kept prices climbing, reaching nearly $1.4M in 2025.
Carbondale – Sustainable Living with Stunning Views

Situated in the Roaring Fork Valley near Aspen, Carbondale blends mountain town appeal with a creative, eco-conscious community. It has a reputation for green building, thriving arts, and access to public lands.
Carbondale attracts remote professionals, retirees, and adventure seekers, all of which contribute to rising prices. Proximity to both Glenwood Springs and ski country gives it added appeal without Aspen’s price tag—though that gap has narrowed quickly.
11. Crested Butte – 214% Home Price Increase Since 2011
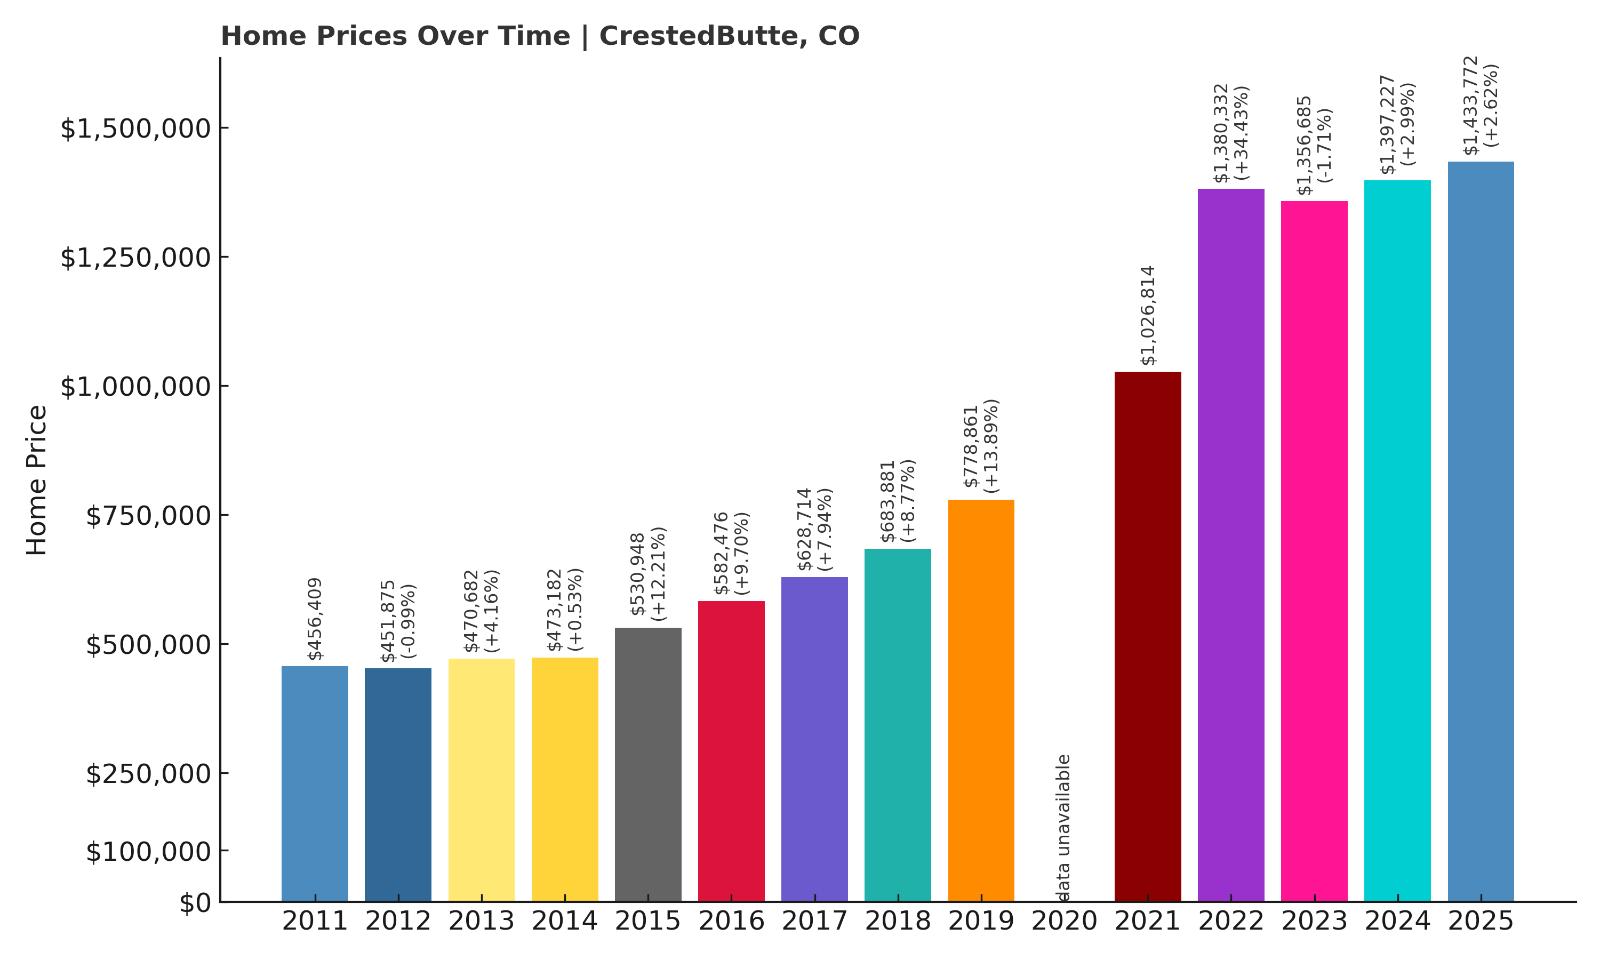
- 2011: $456,409
- 2012: $451,875 (-$4,534, -0.99% from previous year)
- 2013: $470,682 (+$18,807, +4.16% from previous year)
- 2014: $473,182 (+$2,500, +0.53% from previous year)
- 2015: $530,948 (+$57,766, +12.21% from previous year)
- 2016: $582,476 (+$51,528, +9.70% from previous year)
- 2017: $628,714 (+$46,238, +7.94% from previous year)
- 2018: $683,881 (+$55,167, +8.77% from previous year)
- 2019: $778,861 (+$94,980, +13.89% from previous year)
- 2021: $1,026,814
- 2022: $1,380,332 (+$353,519, +34.43% from previous year)
- 2023: $1,356,685 (-$23,647, -1.71% from previous year)
- 2024: $1,397,227 (+$40,542, +2.99% from previous year)
- 2025: $1,433,772 (+$36,545, +2.62% from previous year)
Since 2011, Crested Butte’s home prices have more than doubled. The most dramatic increase occurred in 2022, with continued moderate growth through 2025 despite a brief dip.
Crested Butte – High Elevation, High Demand
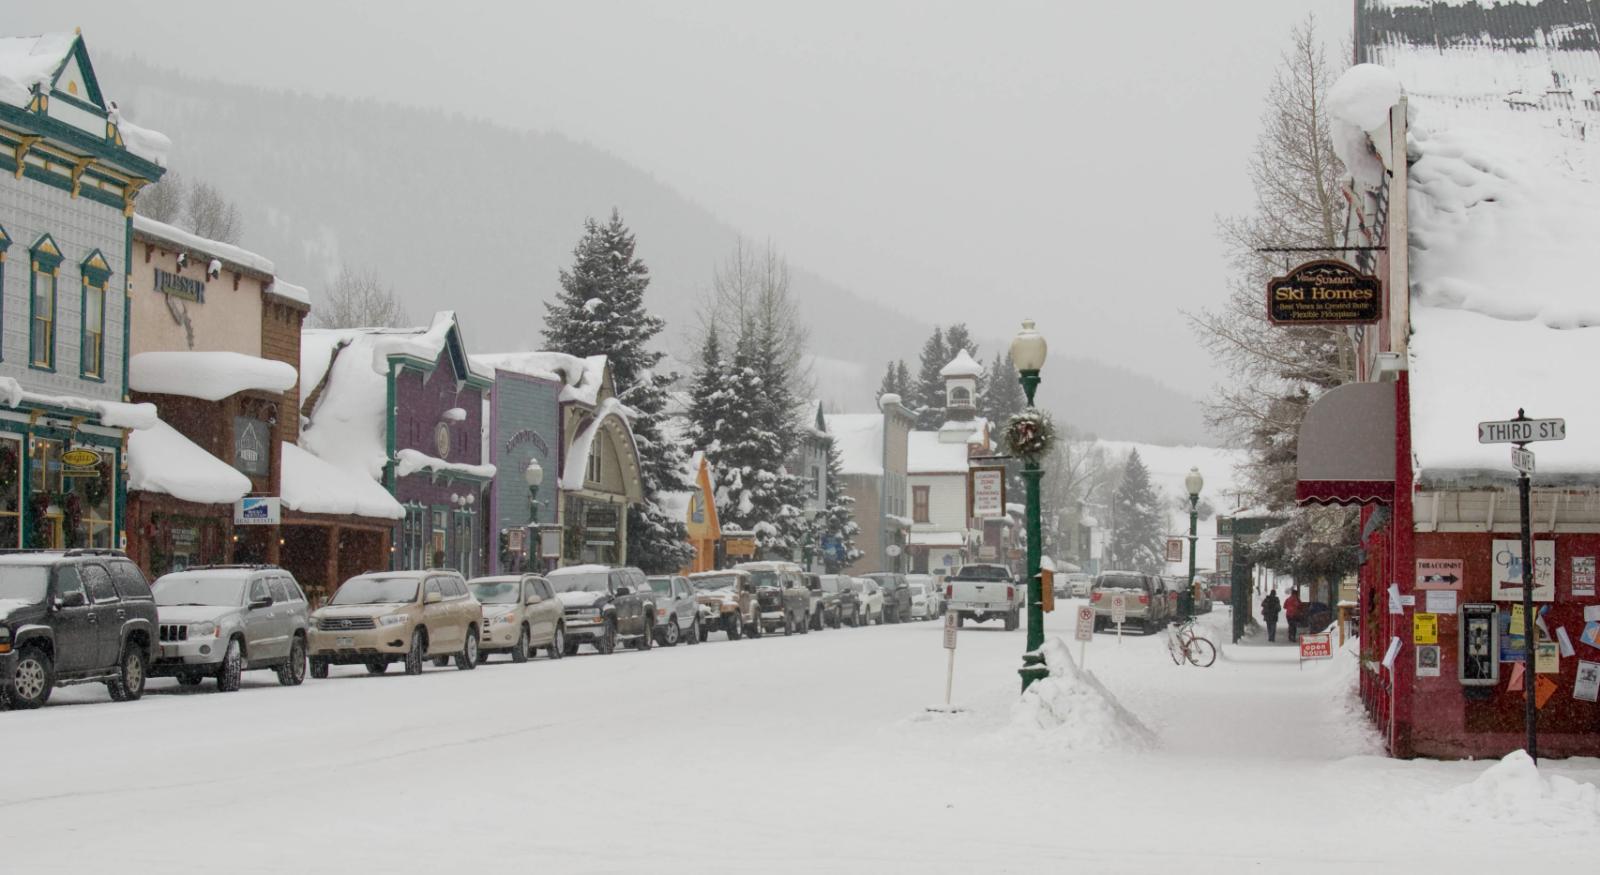
Often called “the last great Colorado ski town,” Crested Butte has carved out a niche for upscale buyers who want adventure and authenticity. It’s a haven for skiers, mountain bikers, and nature lovers who prefer less glitz than Aspen or Vail.
The town’s compact size, tight housing inventory, and seasonal appeal have pushed prices upward. With more remote workers and vacation home seekers entering the market, demand remains strong—and so do the home values.
10. Greenwood Village – 138% Home Price Increase Since 2010
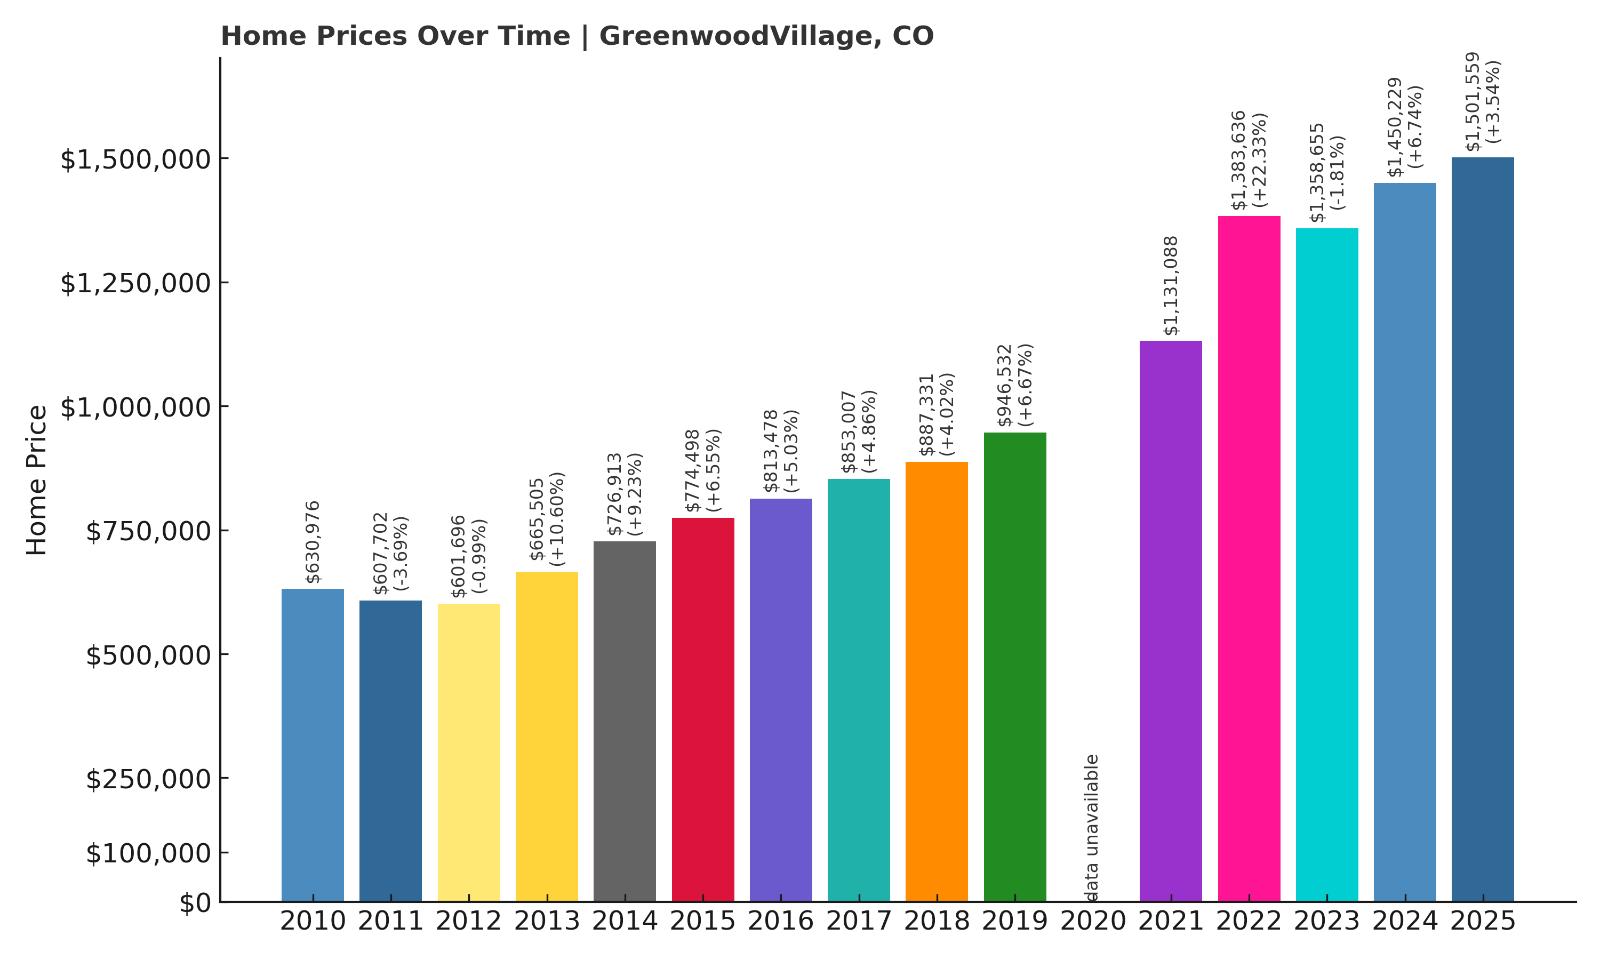
- 2010: $630,976
- 2011: $607,702 (-$23,274, -3.69% from previous year)
- 2012: $601,696 (-$6,006, -0.99% from previous year)
- 2013: $665,505 (+$63,809, +10.60% from previous year)
- 2014: $726,913 (+$61,408, +9.23% from previous year)
- 2015: $774,498 (+$47,586, +6.55% from previous year)
- 2016: $813,478 (+$38,980, +5.03% from previous year)
- 2017: $853,007 (+$39,528, +4.86% from previous year)
- 2018: $887,331 (+$34,325, +4.02% from previous year)
- 2019: $946,532 (+$59,201, +6.67% from previous year)
- 2021: $1,131,088
- 2022: $1,383,636 (+$252,547, +22.33% from previous year)
- 2023: $1,358,655 (-$24,981, -1.81% from previous year)
- 2024: $1,450,229 (+$91,574, +6.74% from previous year)
- 2025: $1,501,559 (+$51,330, +3.54% from previous year)
Greenwood Village home prices climbed from $630K in 2010 to over $1.5M in 2025, with notable gains post-2021. Despite minor corrections, the market has held strong.
Greenwood Village – Executive Suburb with Staying Power
South of Denver, Greenwood Village is a magnet for corporate executives and high-net-worth families. It’s home to the Denver Tech Center and offers luxury properties with sprawling yards and mature landscaping.
The area’s mix of top-rated schools, gated communities, and high-end amenities drives demand. Homebuyers appreciate the blend of privacy and accessibility to downtown, with Cherry Creek State Park nearby for outdoor escapes.
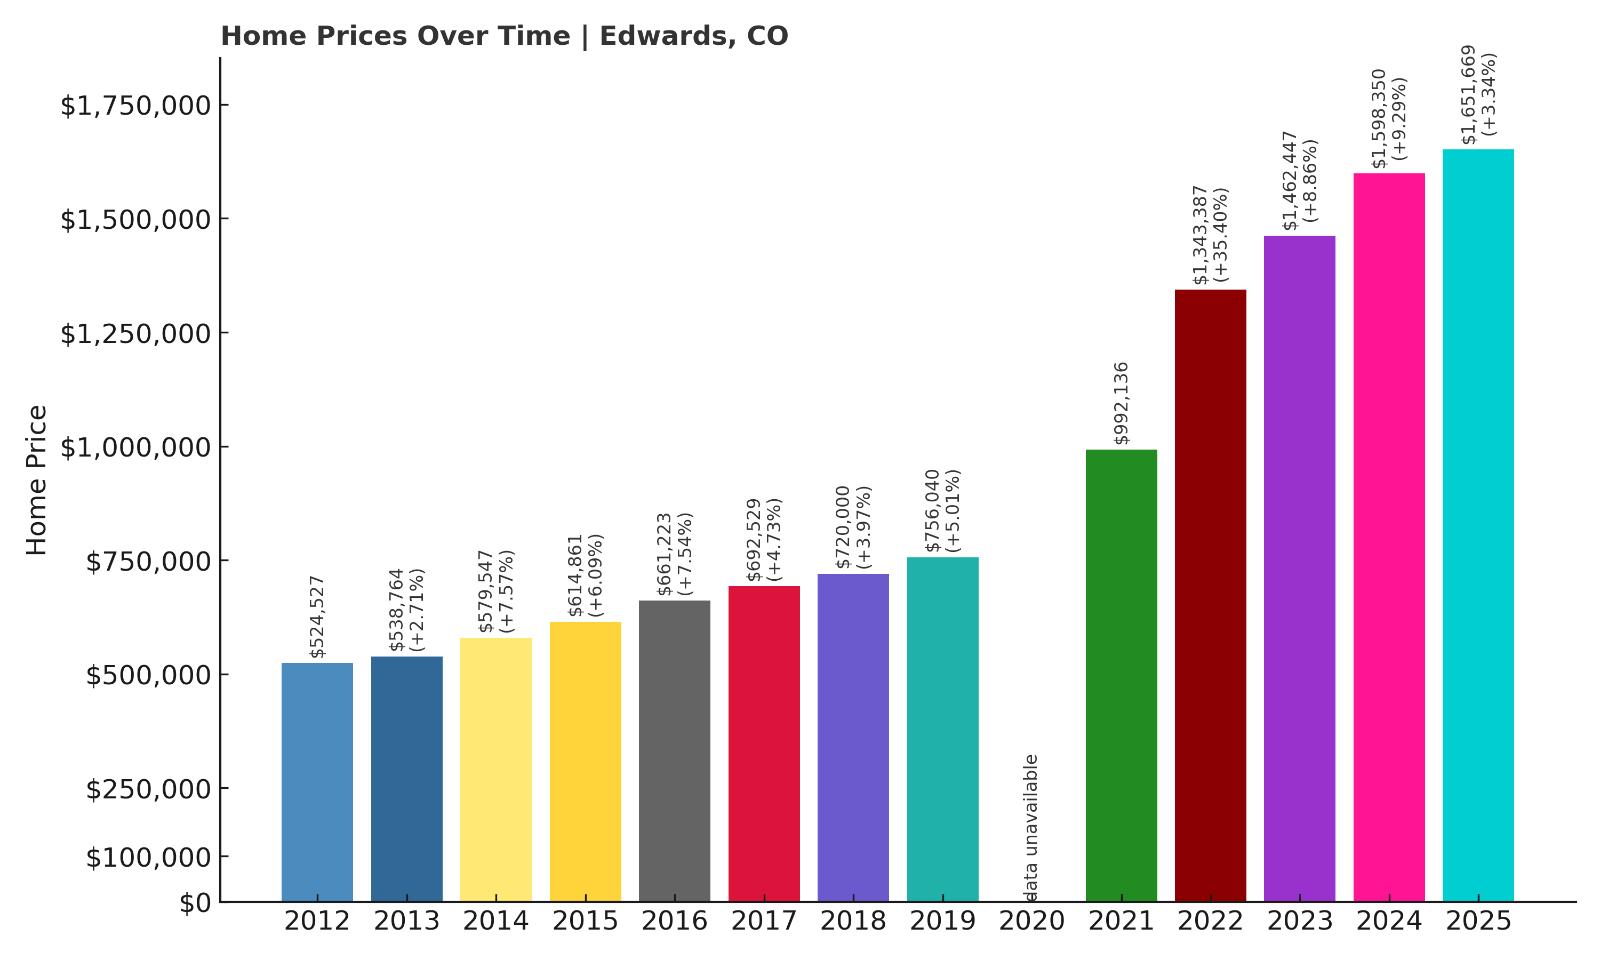
9. Edwards – 163% Home Price Increase Since 2012
🔥 Would you like to save this?
- 2012: $524,527
- 2013: $538,764 (+$14,237, +2.71% from previous year)
- 2014: $579,547 (+$40,783, +7.57% from previous year)
- 2015: $614,861 (+$35,314, +6.09% from previous year)
- 2016: $661,223 (+$46,362, +7.54% from previous year)
- 2017: $692,529 (+$31,306, +4.73% from previous year)
- 2018: $720,000 (+$27,471, +3.97% from previous year)
- 2019: $756,040 (+$36,040, +5.01% from previous year)
- 2021: $992,136
- 2022: $1,343,387 (+$351,252, +35.40% from previous year)
- 2023: $1,462,447 (+$119,060, +8.86% from previous year)
- 2024: $1,598,350 (+$135,903, +9.29% from previous year)
- 2025: $1,651,669 (+$53,320, +3.34% from previous year)
Edwards has more than tripled in price since 2012, climbing from $524K to over $1.65M. Strong double-digit gains post-2021 fueled its rapid rise into Colorado’s luxury tier.
Edwards – Valley Living with Mountain Perks
Edwards sits in Eagle County, just west of Beaver Creek and Vail. Unlike those ski-centric towns, Edwards offers a more local, year-round community with upscale housing and commercial hubs like Riverwalk.
With growing interest from buyers seeking resort-town access without the full price tag, Edwards is increasingly seen as a smart alternative. Top schools, riverside trails, and nearby slopes make it a solid long-term bet.
8. Vail – 131% Home Price Increase Since 2012
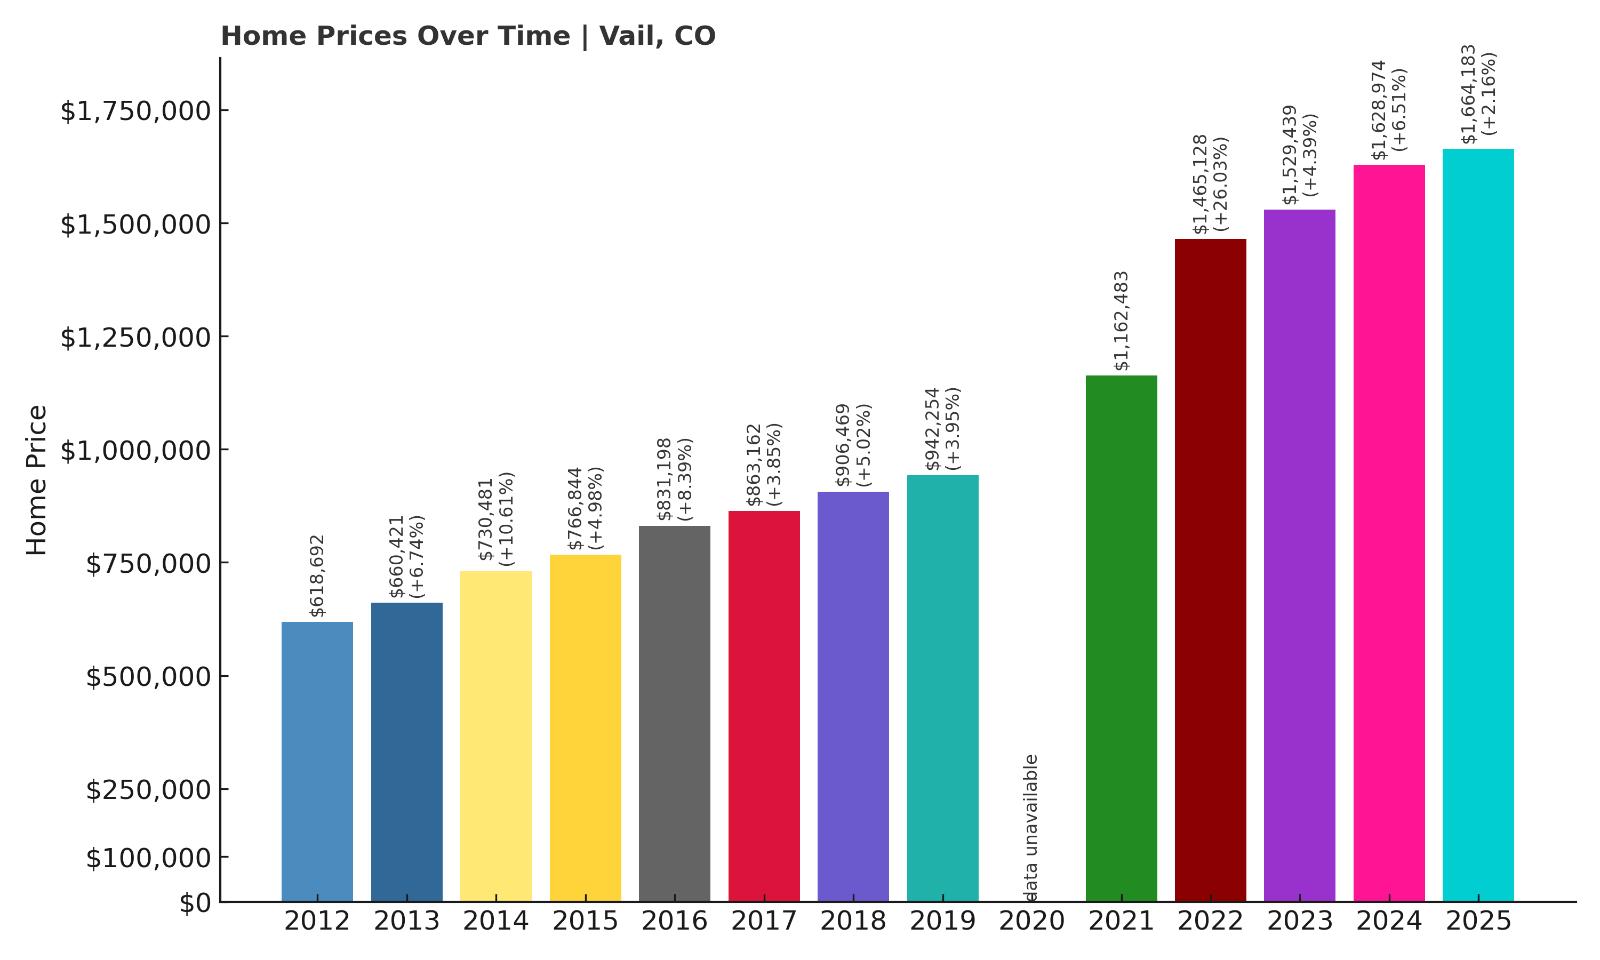
- 2012: $618,692
- 2013: $660,421 (+$41,729, +6.74% from previous year)
- 2014: $730,481 (+$70,059, +10.61% from previous year)
- 2015: $766,844 (+$36,364, +4.98% from previous year)
- 2016: $831,198 (+$64,353, +8.39% from previous year)
- 2017: $863,162 (+$31,965, +3.85% from previous year)
- 2018: $906,469 (+$43,307, +5.02% from previous year)
- 2019: $942,254 (+$35,786, +3.95% from previous year)
- 2021: $1,162,483
- 2022: $1,465,128 (+$302,645, +26.03% from previous year)
- 2023: $1,529,439 (+$64,311, +4.39% from previous year)
- 2024: $1,628,974 (+$99,534, +6.51% from previous year)
- 2025: $1,664,183 (+$35,209, +2.16% from previous year)
Vail home prices are up more than 130% since 2012. Despite some slower years, 2022’s large spike helped push values above $1.66M in 2025.
Vail – Colorado’s Original Luxury Playground
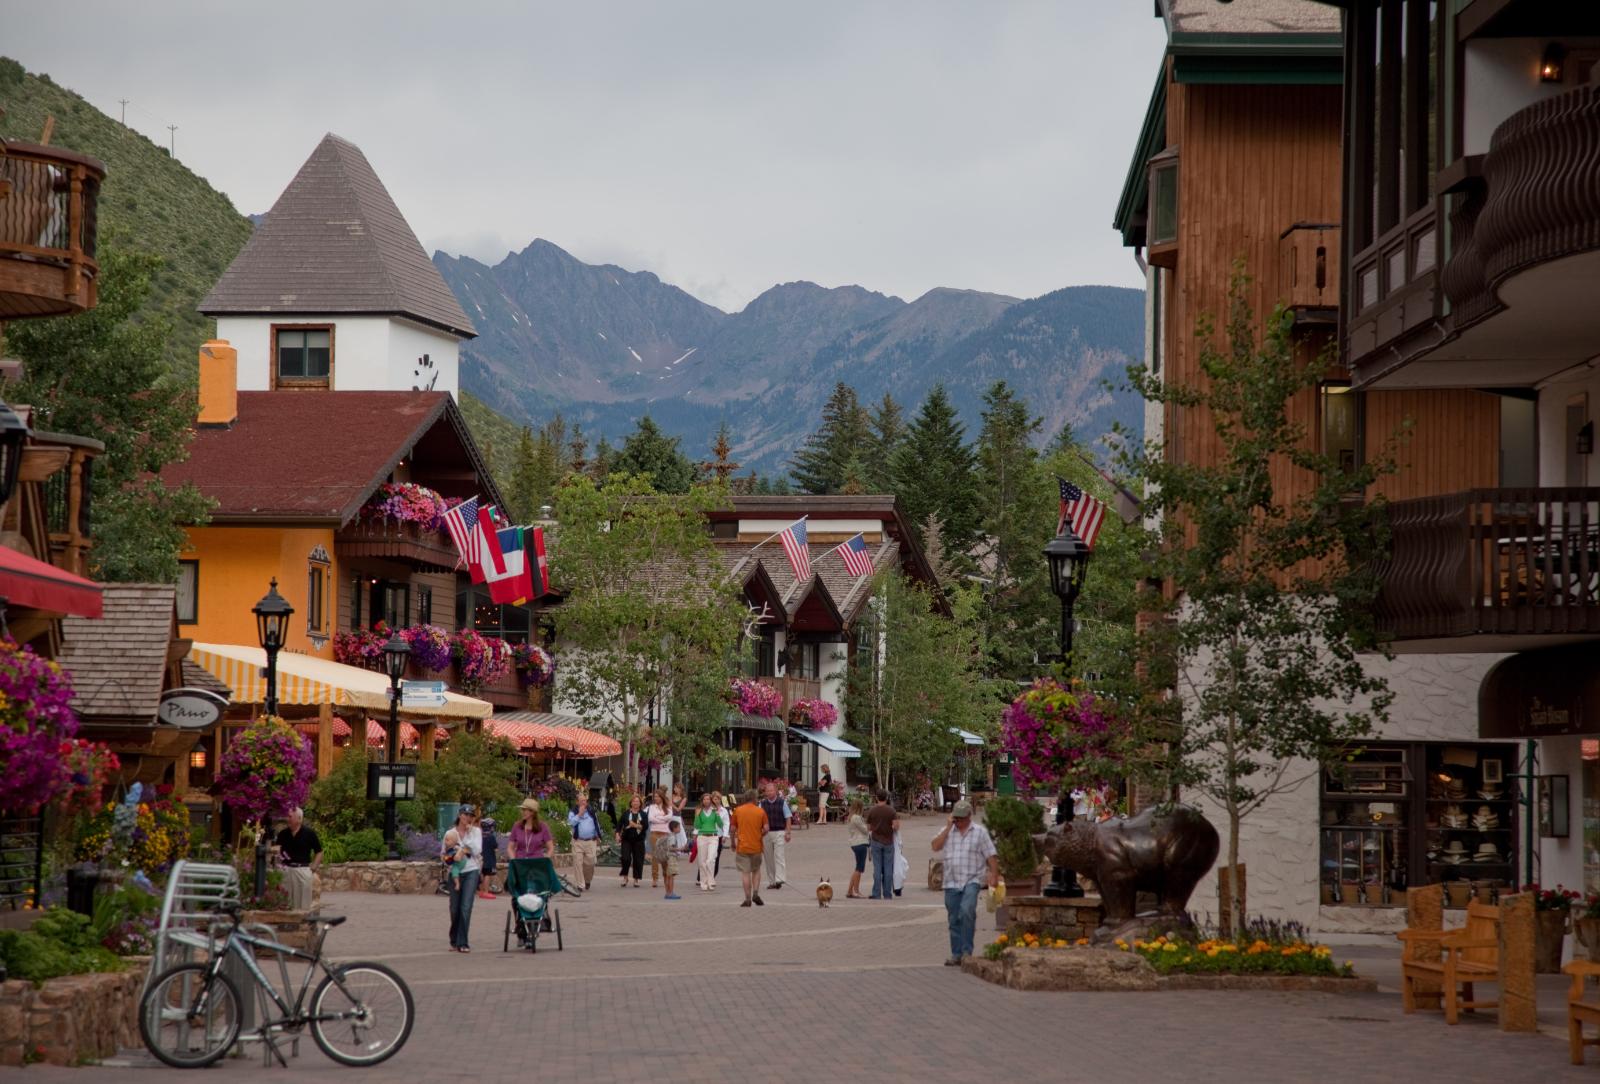
One of the most recognized ski destinations in the world, Vail is synonymous with luxury real estate. The market here thrives on prestige, access to slopes, and proximity to year-round amenities.
International buyers, investors, and long-time second-home owners continue to fuel high demand. With its strict development controls and iconic resort brand, Vail’s home values remain strong and resilient.
7. Columbine Valley – 147% Home Price Increase Since 2012
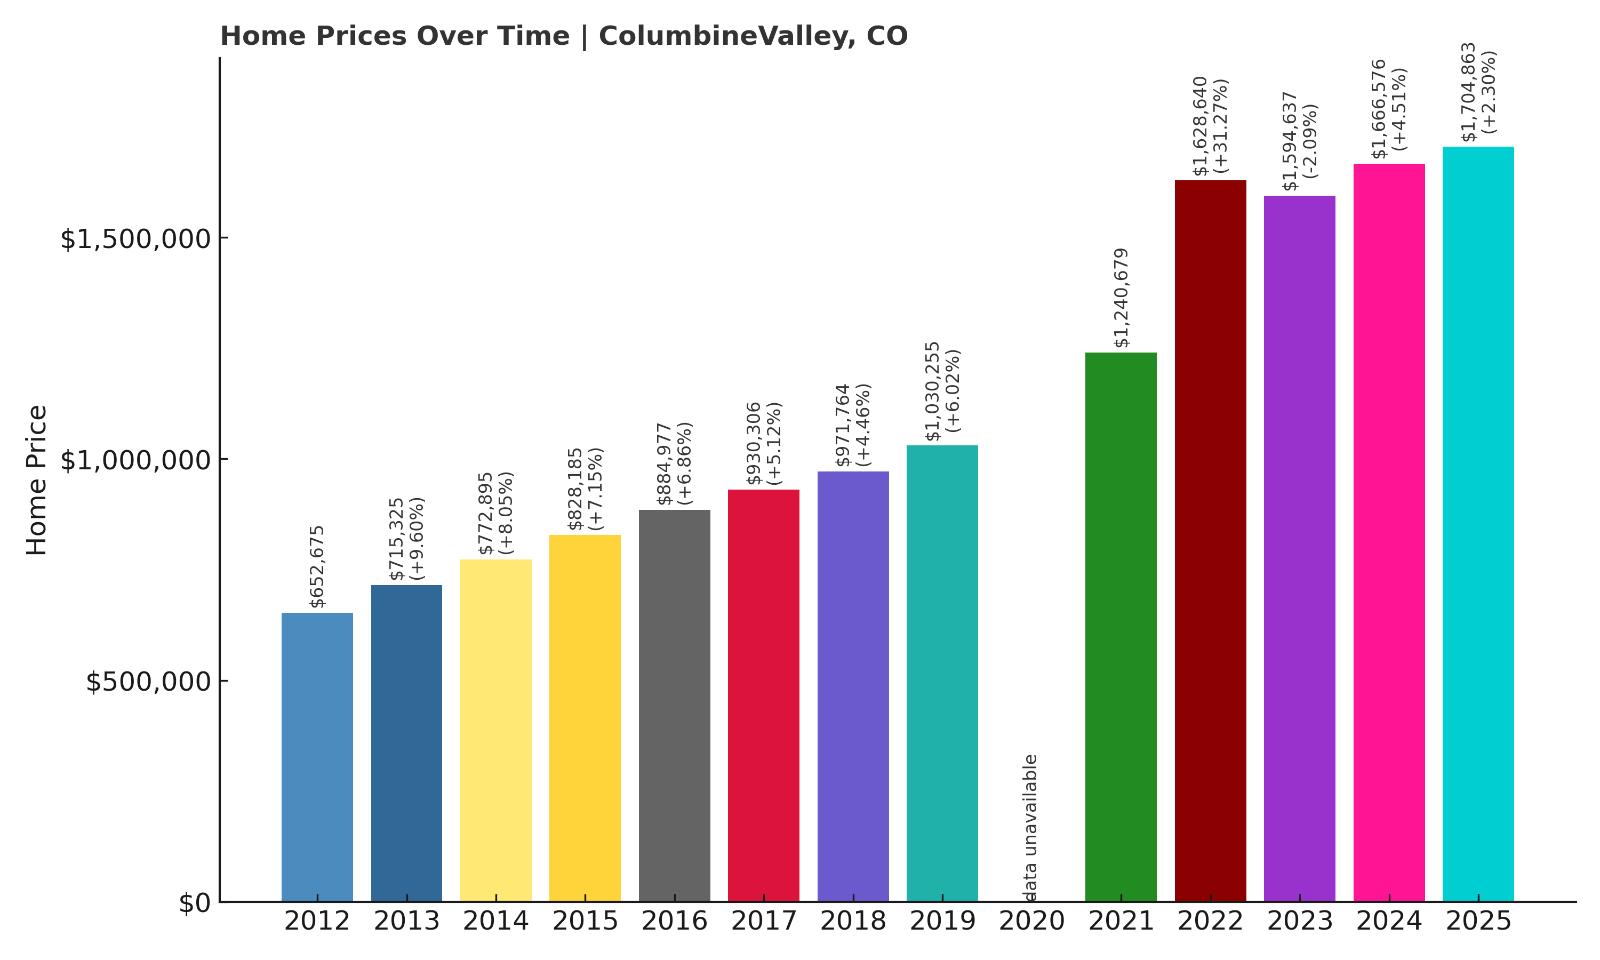
- 2012: $652,675
- 2013: $715,325 (+$62,650, +9.60% from previous year)
- 2014: $772,895 (+$57,569, +8.05% from previous year)
- 2015: $828,185 (+$55,290, +7.15% from previous year)
- 2016: $884,977 (+$56,792, +6.86% from previous year)
- 2017: $930,306 (+$45,329, +5.12% from previous year)
- 2018: $971,764 (+$41,458, +4.46% from previous year)
- 2019: $1,030,255 (+$58,492, +6.02% from previous year)
- 2021: $1,240,679
- 2022: $1,628,640 (+$387,961, +31.27% from previous year)
- 2023: $1,594,637 (-$34,004, -2.09% from previous year)
- 2024: $1,666,576 (+$71,940, +4.51% from previous year)
- 2025: $1,704,863 (+$38,286, +2.30% from previous year)
Columbine Valley has seen prices grow 147% since 2012, with a major leap in 2022. Slight pullbacks have followed, but values remain above $1.7M in 2025.
Columbine Valley – Private Golf, Premier Real Estate
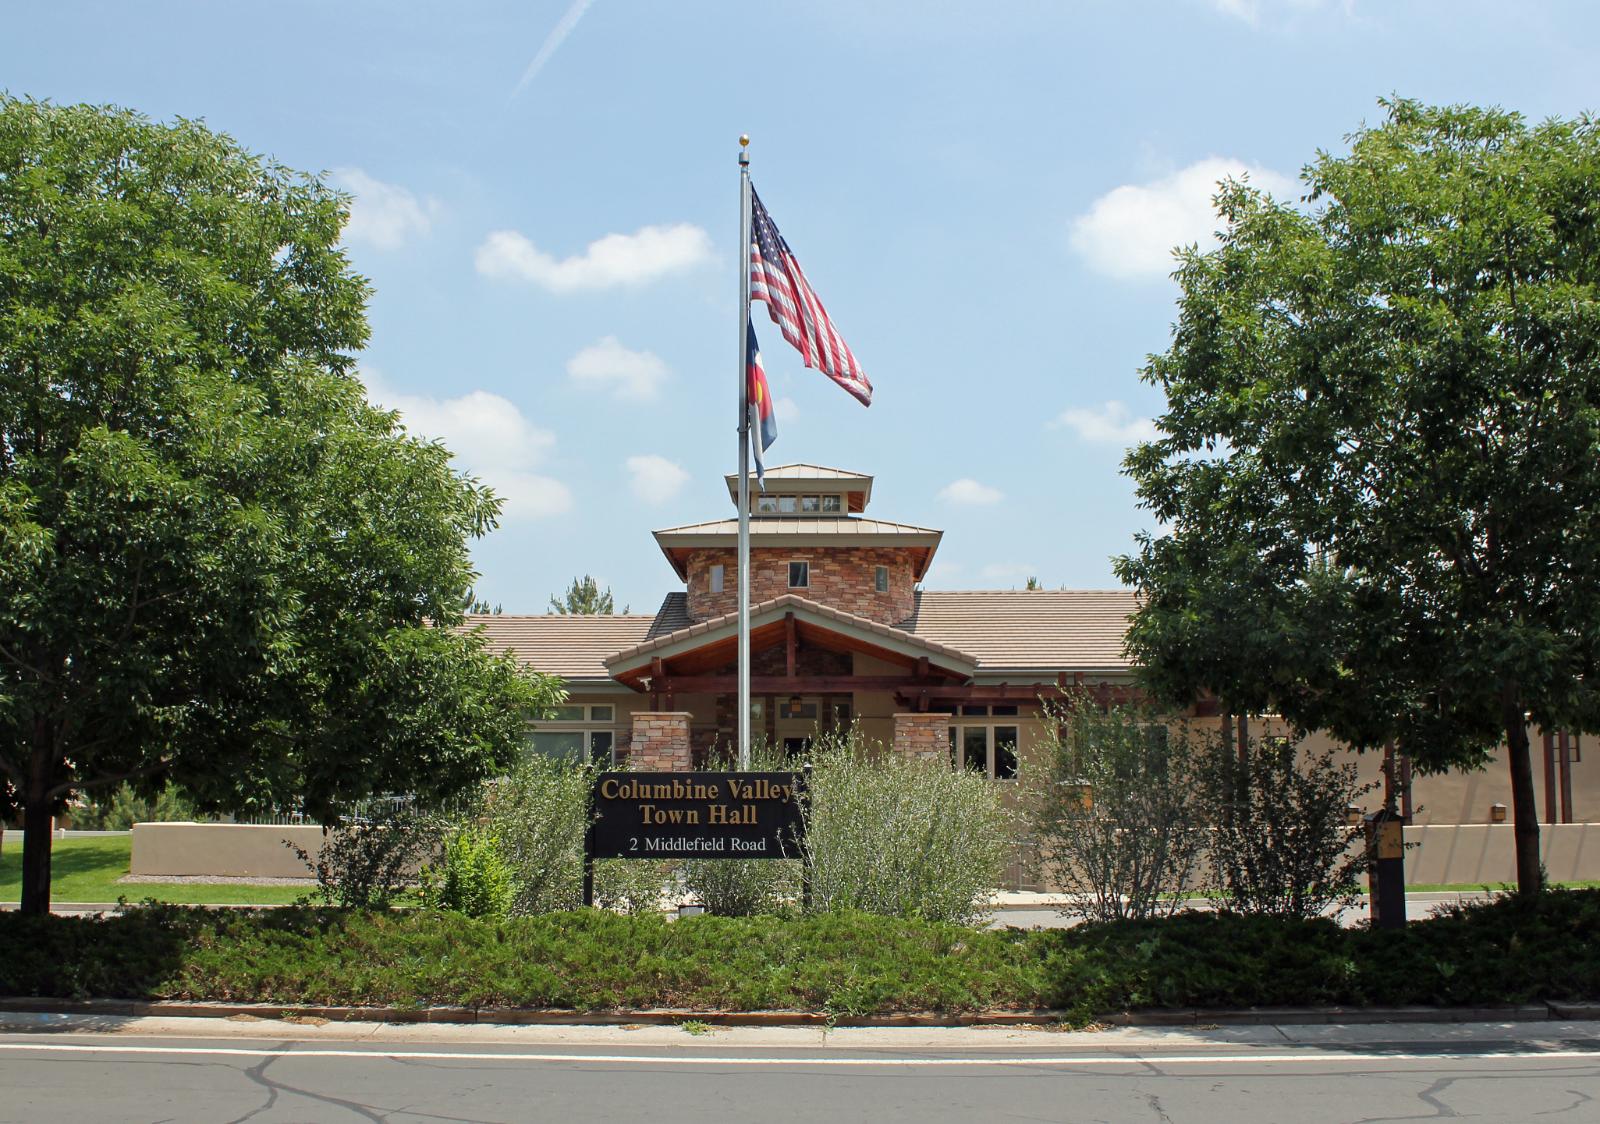
This exclusive suburb southwest of Denver is anchored by the private Columbine Country Club. With its lush landscaping and spacious homes, the town feels more like an upscale enclave than a typical suburb.
The area’s high-end appeal and limited inventory make it a magnet for buyers seeking luxury without urban density. It’s among the metro’s most stable—and expensive—housing markets.
6. Telluride – 271% Home Price Increase Since 2012
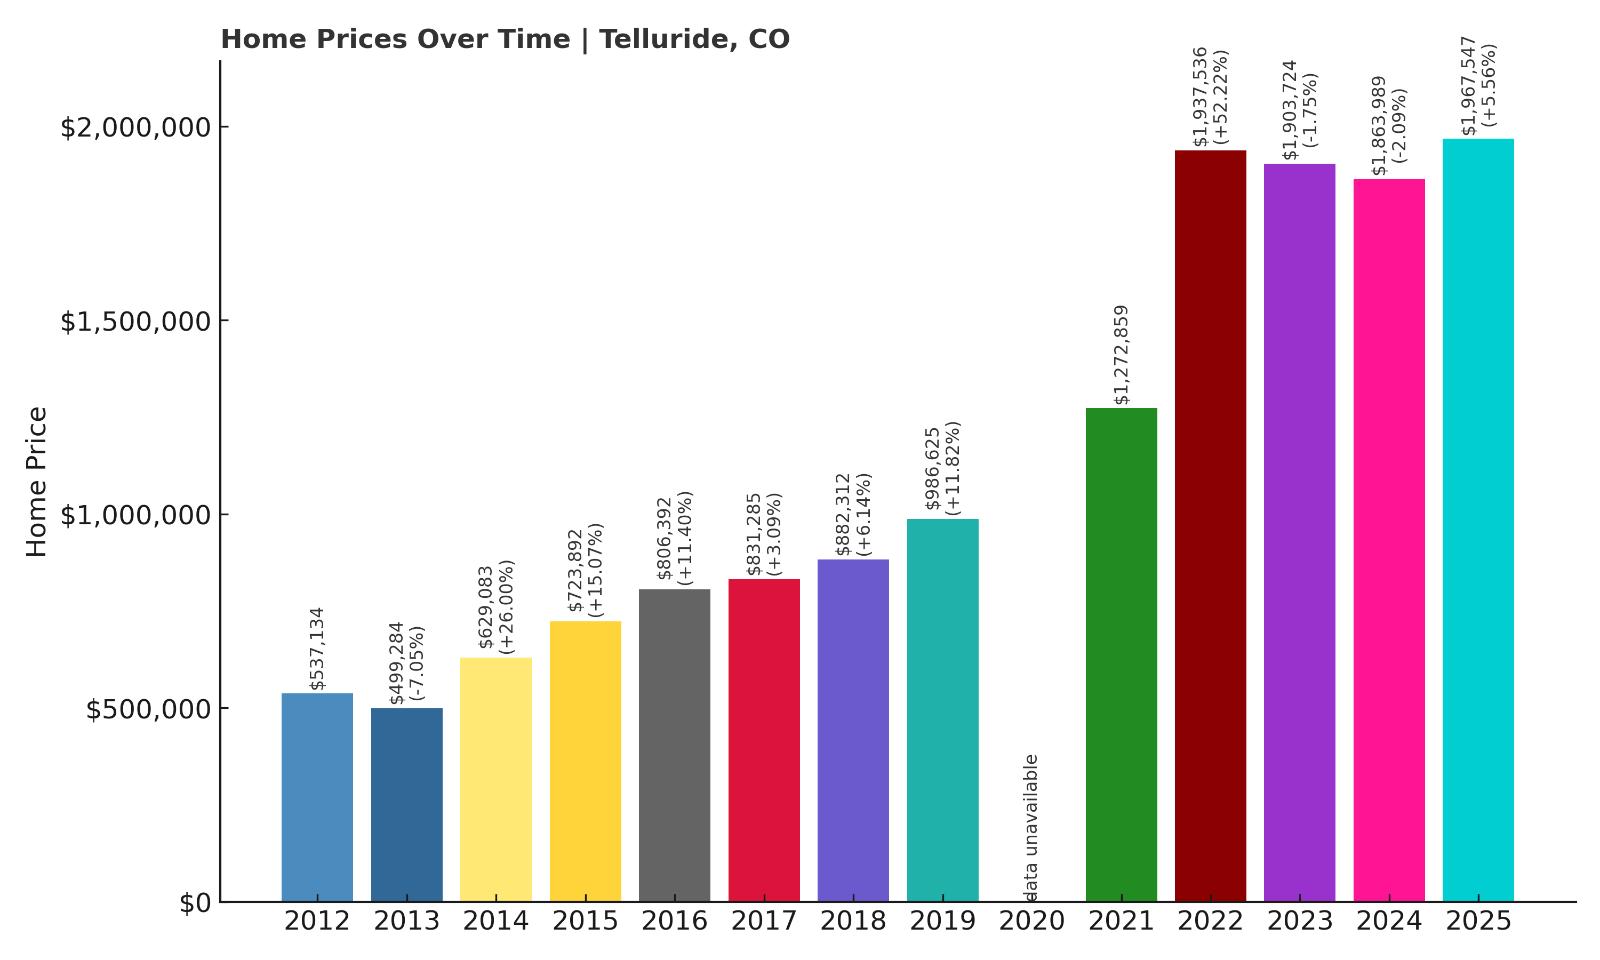
- 2012: $537,134
- 2013: $499,284 (-$37,850, -7.05% from previous year)
- 2014: $629,083 (+$129,799, +26.00% from previous year)
- 2015: $723,892 (+$94,809, +15.07% from previous year)
- 2016: $806,392 (+$82,500, +11.40% from previous year)
- 2017: $831,285 (+$24,892, +3.09% from previous year)
- 2018: $882,312 (+$51,028, +6.14% from previous year)
- 2019: $986,625 (+$104,313, +11.82% from previous year)
- 2021: $1,272,859
- 2022: $1,937,536 (+$664,677, +52.22% from previous year)
- 2023: $1,903,724 (-$33,812, -1.75% from previous year)
- 2024: $1,863,989 (-$39,735, -2.09% from previous year)
- 2025: $1,967,547 (+$103,558, +5.56% from previous year)
Telluride’s home prices have increased more than 270% since 2012, with an explosive leap in 2022. After some volatility, prices stabilized above $1.96M in 2025.
Telluride – Remote, Refined, and Resilient
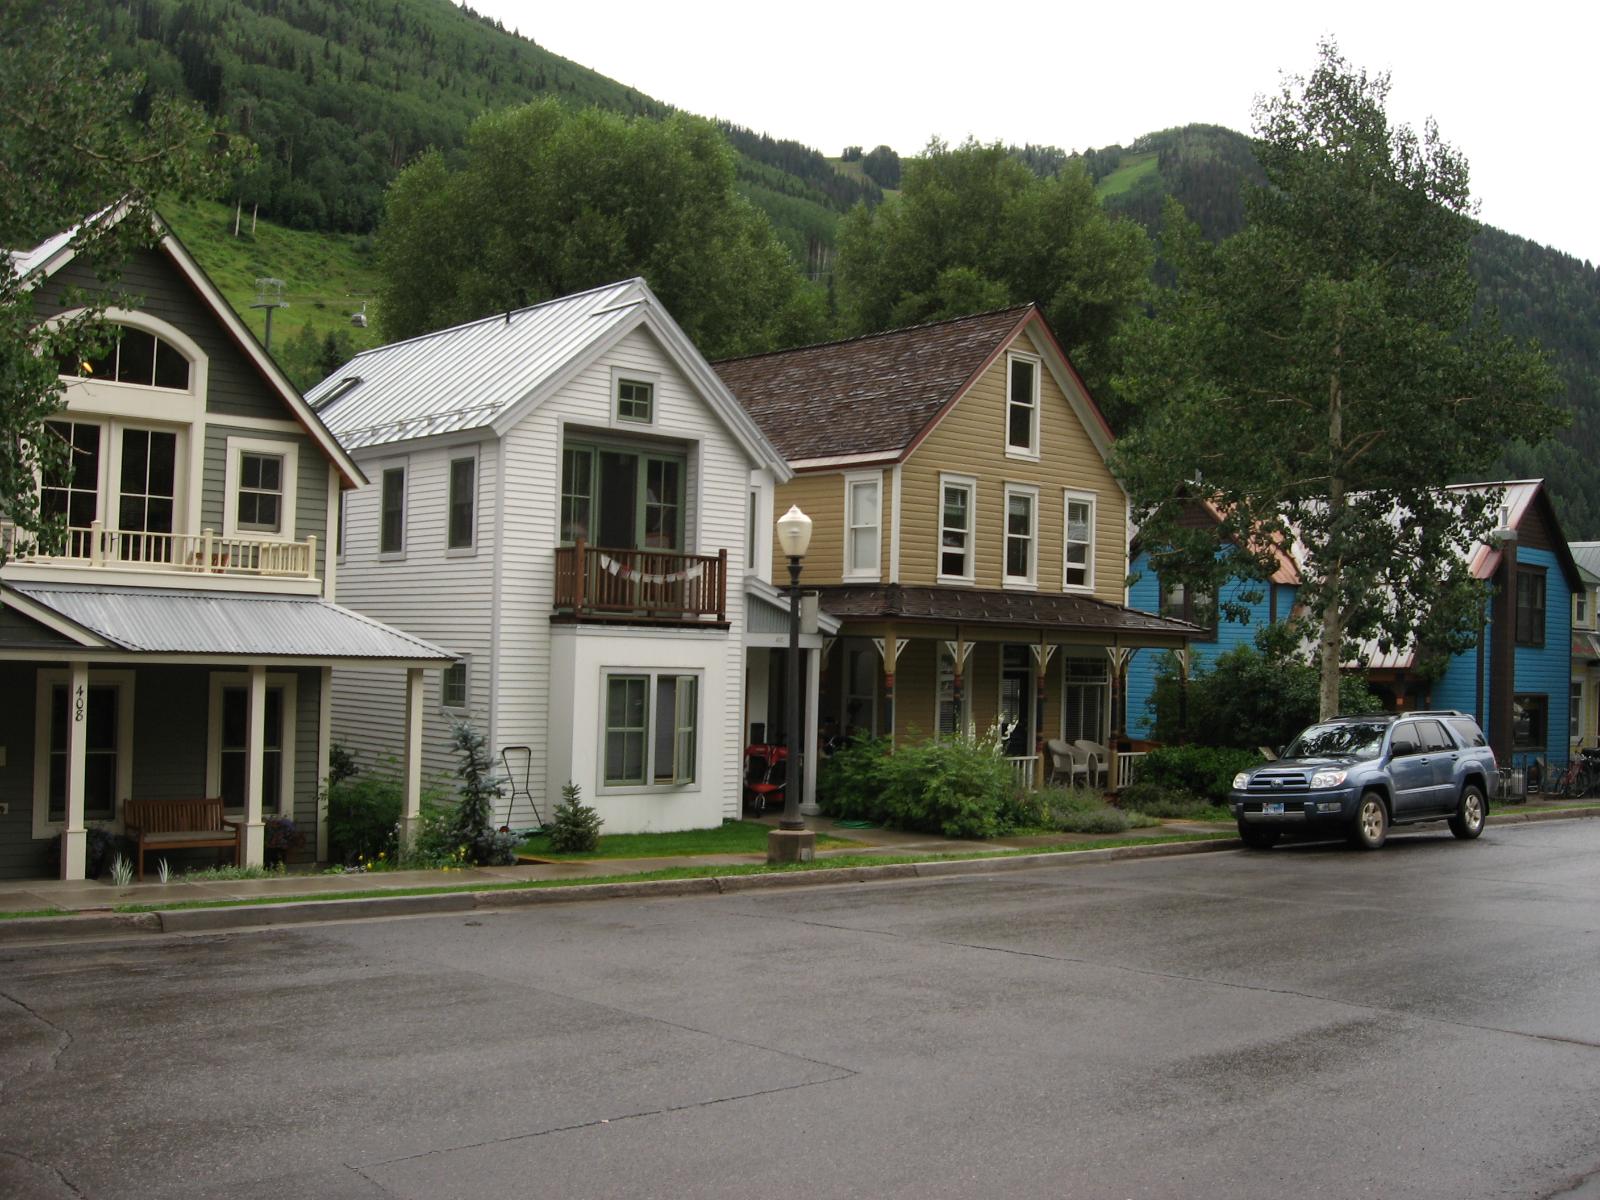
Tucked into a box canyon in southwestern Colorado, Telluride blends historic mining roots with luxury resort living. It’s one of the most picturesque and remote towns on this list, accessible only by scenic mountain roads or regional flights.
The steep rise in home values reflects limited land availability and persistent demand from affluent buyers seeking privacy and world-class skiing. Telluride’s charm and scarcity continue to push values into the ultra-luxury tier.
5. Mountain Village – 217% Home Price Increase Since 2012
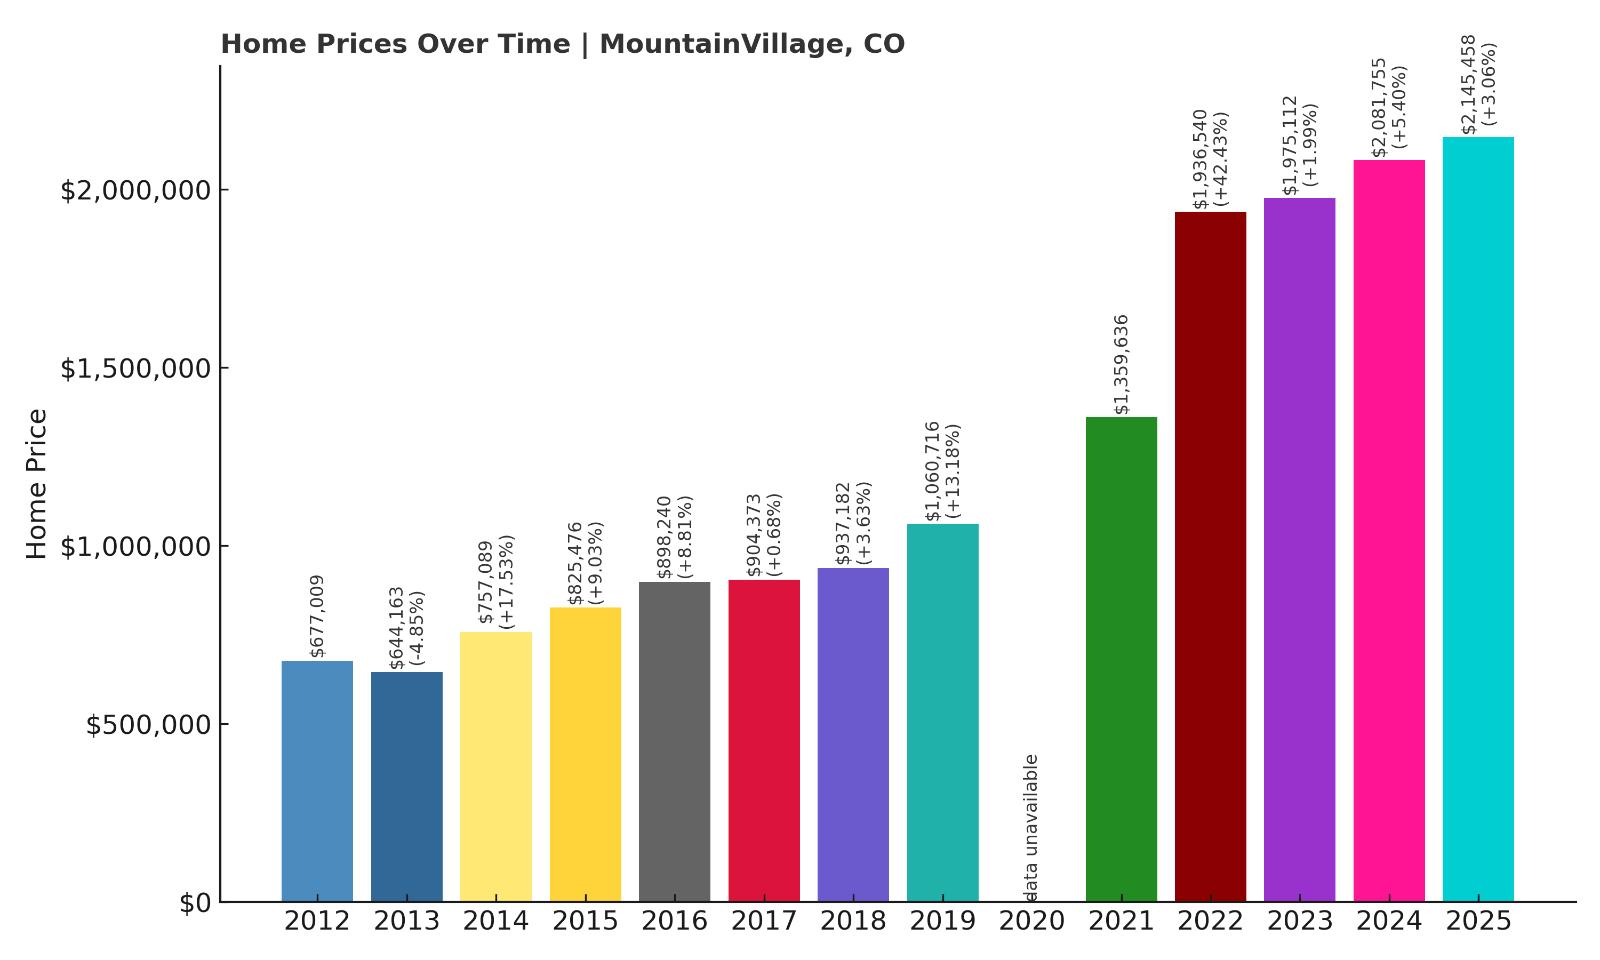
- 2012: $677,009
- 2013: $644,163 (-$32,846, -4.85% from previous year)
- 2014: $757,089 (+$112,926, +17.53% from previous year)
- 2015: $825,476 (+$68,387, +9.03% from previous year)
- 2016: $898,240 (+$72,764, +8.81% from previous year)
- 2017: $904,373 (+$6,133, +0.68% from previous year)
- 2018: $937,182 (+$32,808, +3.63% from previous year)
- 2019: $1,060,716 (+$123,534, +13.18% from previous year)
- 2021: $1,359,636
- 2022: $1,936,540 (+$576,903, +42.43% from previous year)
- 2023: $1,975,112 (+$38,572, +1.99% from previous year)
- 2024: $2,081,755 (+$106,643, +5.40% from previous year)
- 2025: $2,145,458 (+$63,703, +3.06% from previous year)
Since 2012, Mountain Village has seen prices more than triple, peaking in 2022 with a 42% jump. The median home now tops $2.14M in 2025.
Mountain Village – Luxury Lift Access with Altitude

🔥 Would you like to save this?
Linked to Telluride by gondola, Mountain Village is a purpose-built alpine resort community known for ski-in/ski-out access and upscale lodging. Its European-style layout and larger estates cater to high-end buyers.
With consistent demand from both seasonal and full-time residents, and little room for new inventory, values have remained on a strong upward trend. It’s increasingly a top-tier choice for luxury real estate investors.
4. Snowmass Village – 159% Home Price Increase Since 2012
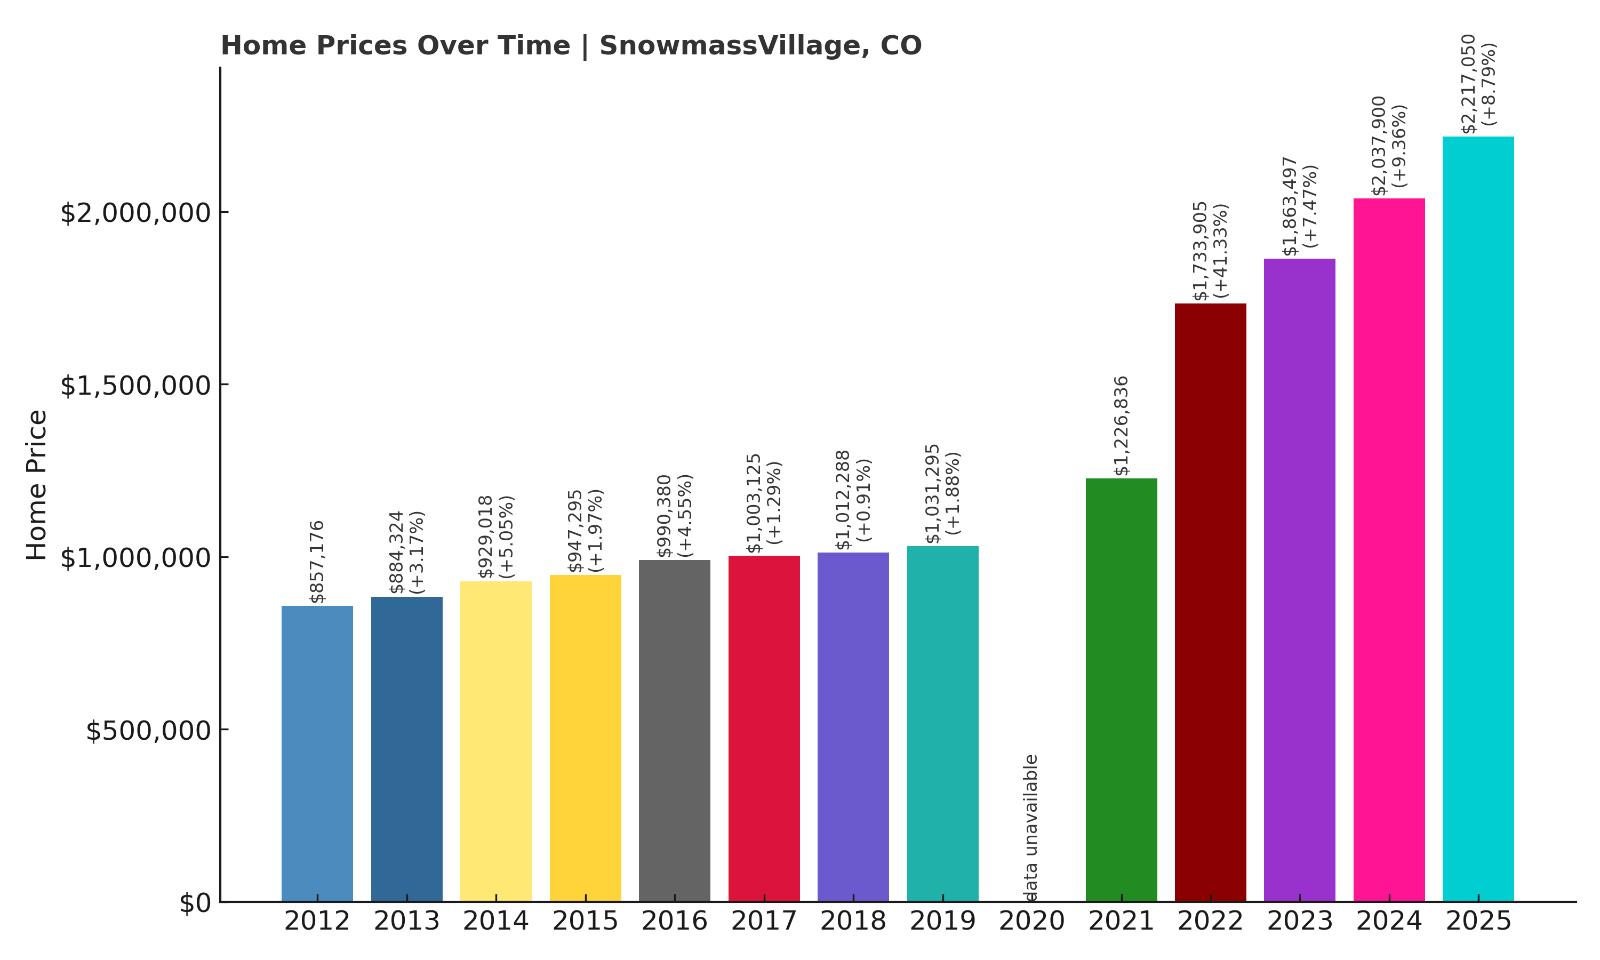
- 2012: $857,176
- 2013: $884,324 (+$27,149, +3.17% from previous year)
- 2014: $929,018 (+$44,694, +5.05% from previous year)
- 2015: $947,295 (+$18,277, +1.97% from previous year)
- 2016: $990,380 (+$43,085, +4.55% from previous year)
- 2017: $1,003,125 (+$12,745, +1.29% from previous year)
- 2018: $1,012,288 (+$9,164, +0.91% from previous year)
- 2019: $1,031,295 (+$19,007, +1.88% from previous year)
- 2021: $1,226,836
- 2022: $1,733,905 (+$507,069, +41.33% from previous year)
- 2023: $1,863,497 (+$129,592, +7.47% from previous year)
- 2024: $2,037,900 (+$174,403, +9.36% from previous year)
- 2025: $2,217,050 (+$179,149, +8.79% from previous year)
Home prices in Snowmass Village have surged 159% since 2012. The 2022 explosion in value pushed prices above $2.2M in 2025, with strong year-over-year gains since.
Snowmass Village – Aspen’s Quieter, Costly Neighbor
Located just minutes from Aspen, Snowmass offers many of the same luxuries with a bit more space and fewer crowds. It’s home to one of the largest ski areas in Colorado and a growing number of year-round residents.
Snowmass has seen major investment in infrastructure and lodging, helping push property values up. Families and retirees alike are drawn to its less hectic feel—though the price tags are anything but modest.
3. Bow Mar – 170% Home Price Increase Since 2012
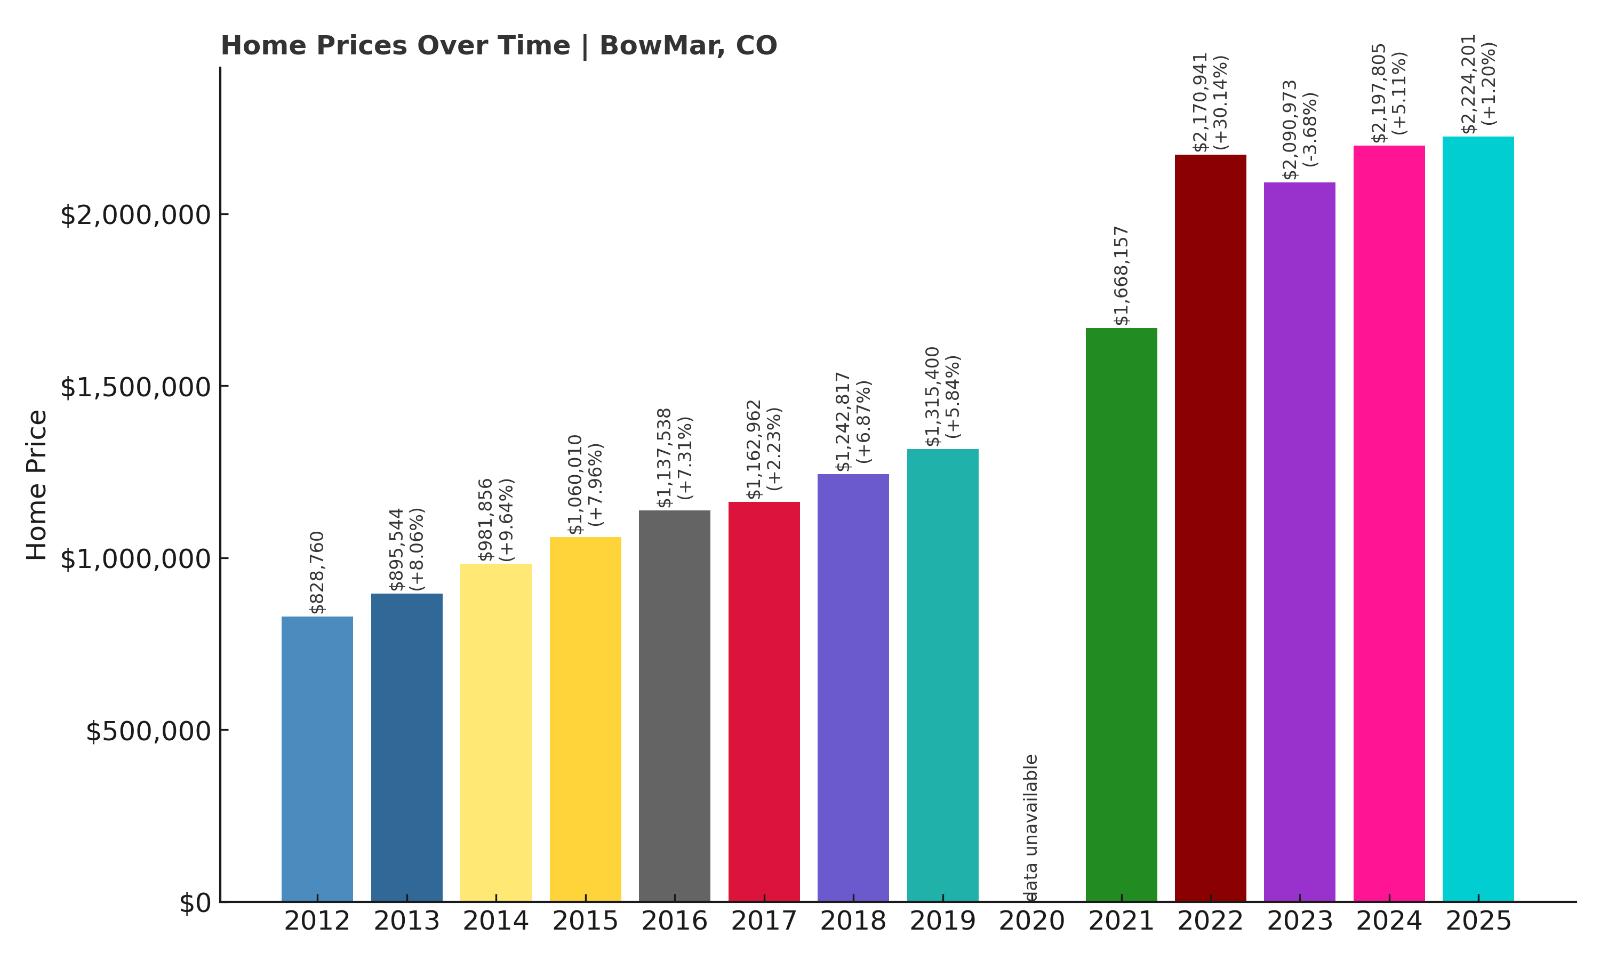
- 2012: $828,760
- 2013: $895,544 (+$66,784, +8.06% from previous year)
- 2014: $981,856 (+$86,311, +9.64% from previous year)
- 2015: $1,060,010 (+$78,154, +7.96% from previous year)
- 2016: $1,137,538 (+$77,528, +7.31% from previous year)
- 2017: $1,162,962 (+$25,424, +2.23% from previous year)
- 2018: $1,242,817 (+$79,855, +6.87% from previous year)
- 2019: $1,315,400 (+$72,582, +5.84% from previous year)
- 2021: $1,668,157
- 2022: $2,170,941 (+$502,784, +30.14% from previous year)
- 2023: $2,090,973 (-$79,968, -3.68% from previous year)
- 2024: $2,197,805 (+$106,832, +5.11% from previous year)
- 2025: $2,224,201 (+$26,396, +1.20% from previous year)
Bow Mar’s median home price has risen 170% since 2012, fueled by consistent demand and a large spike in 2022. Prices now exceed $2.2M.
Bow Mar – Exclusive Enclave with Lake Views
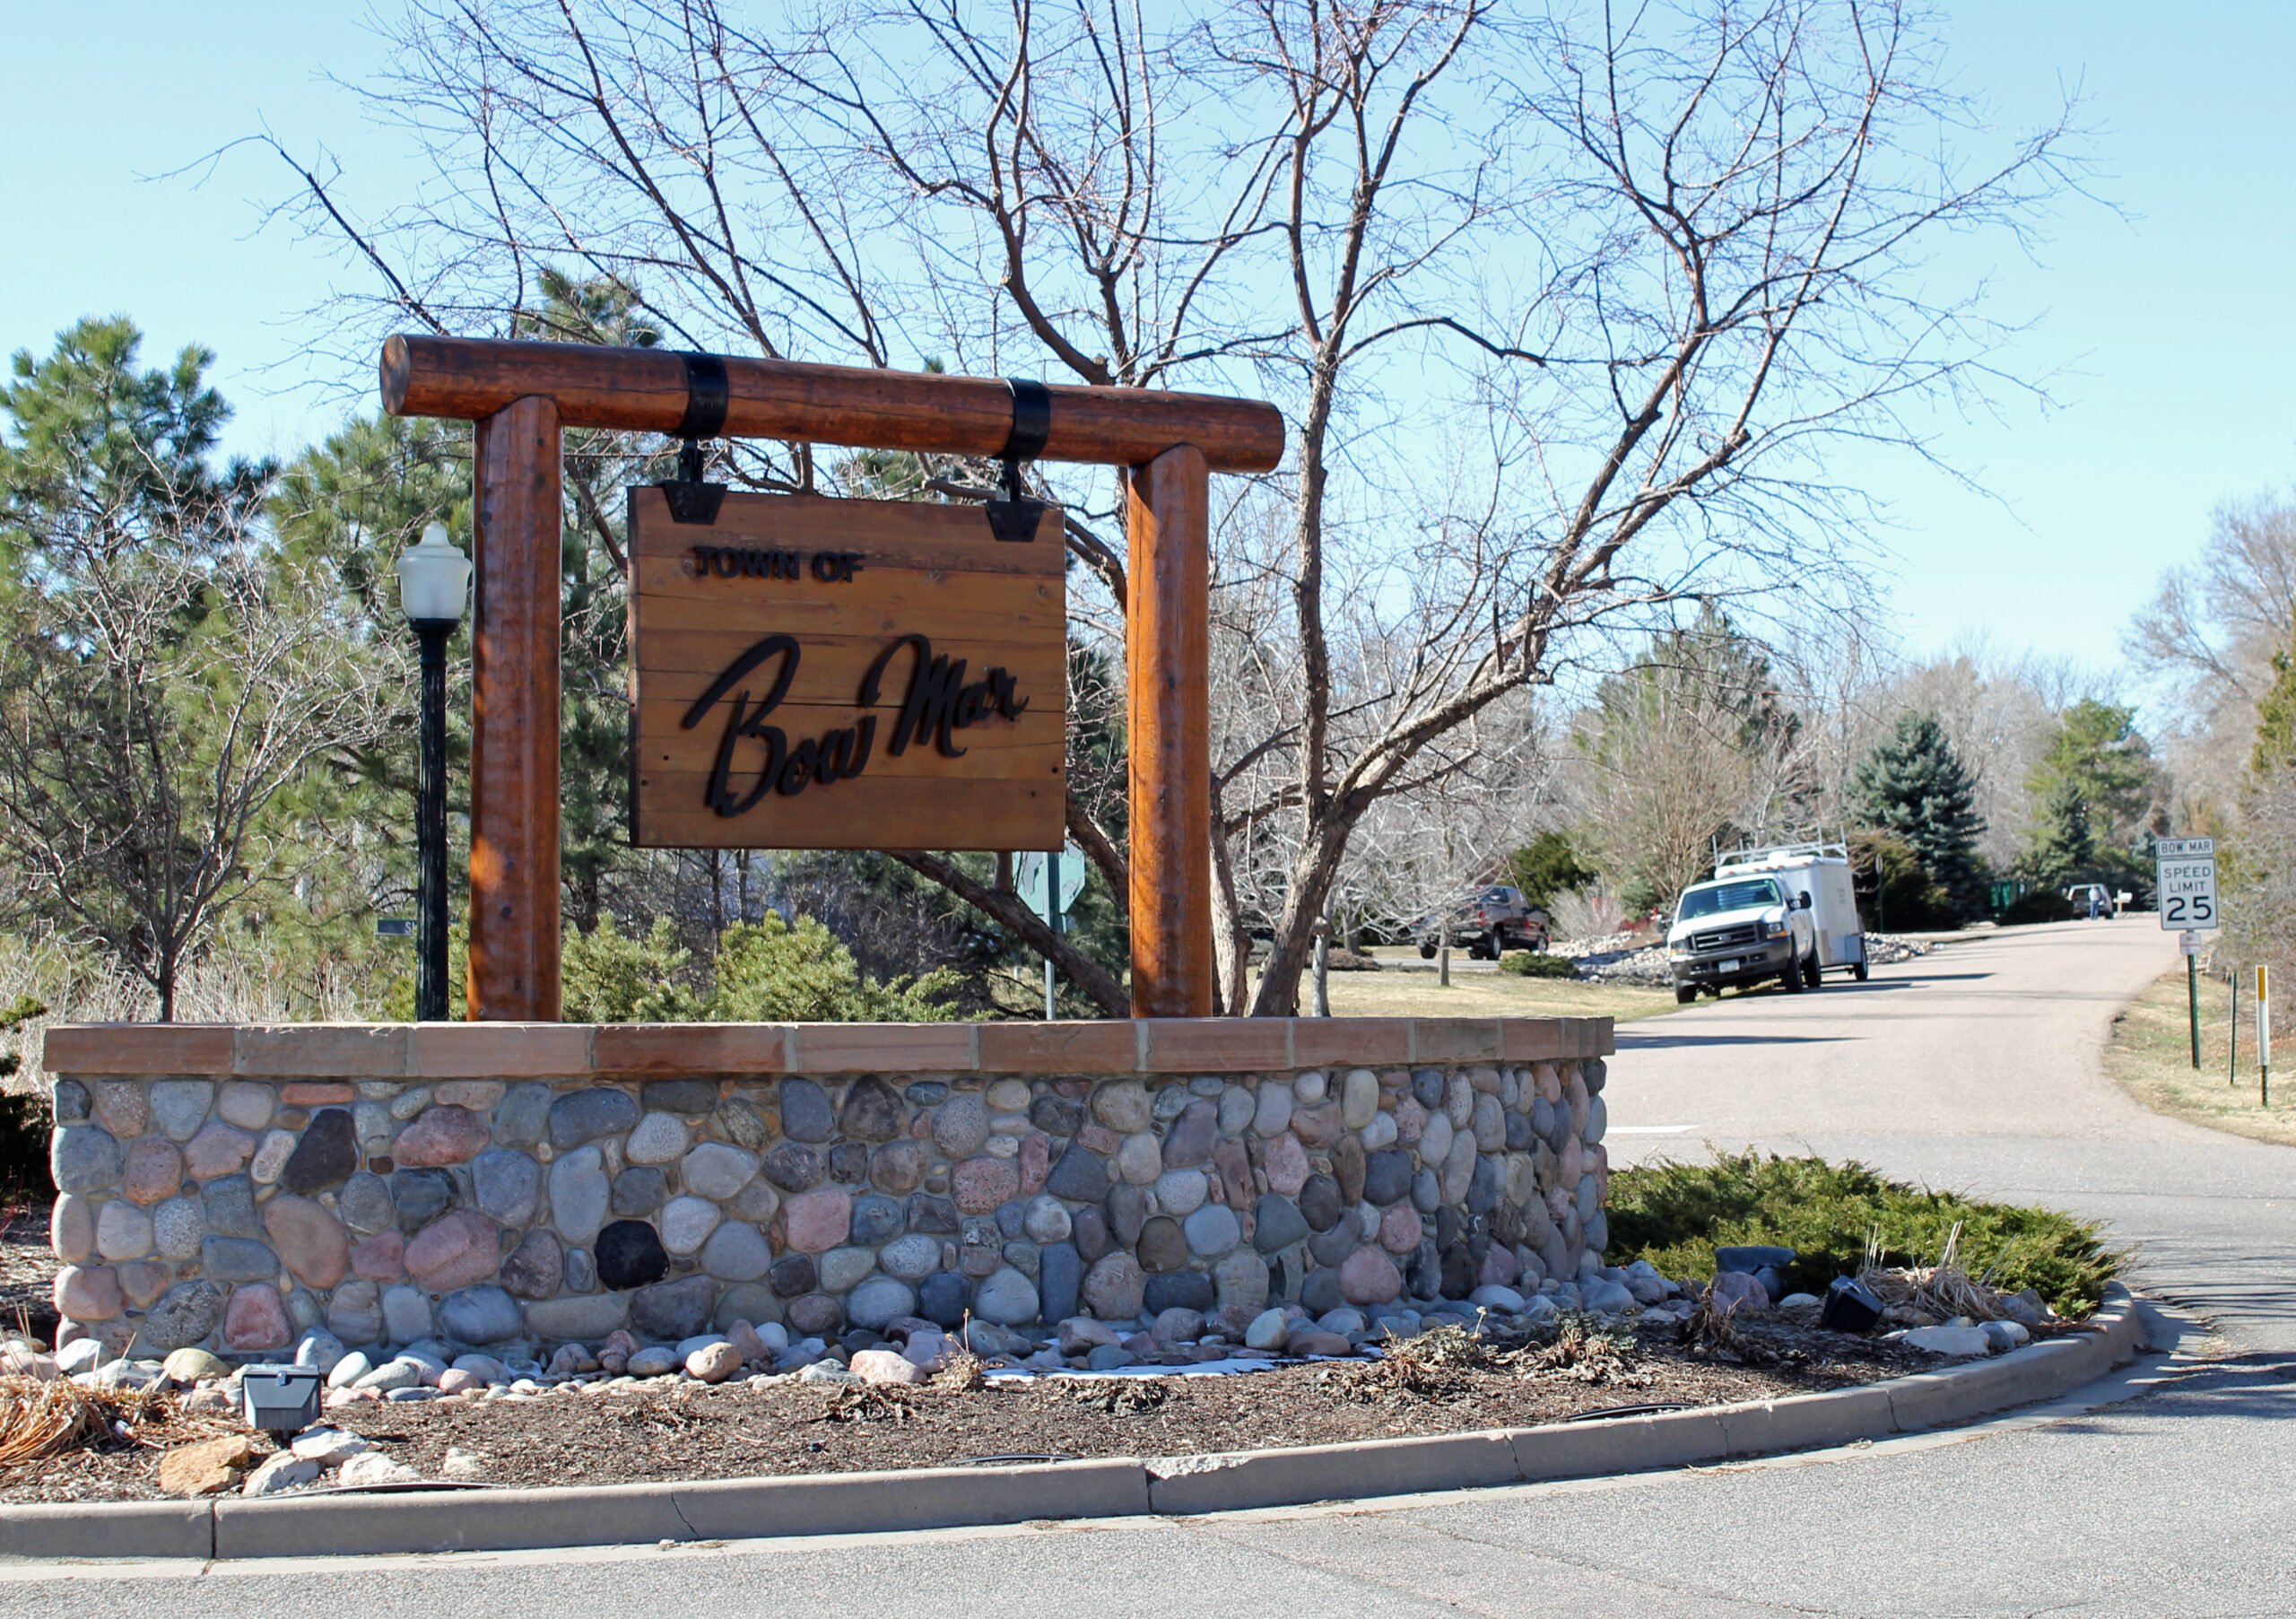
Situated southwest of Denver, Bow Mar is a quiet residential community with private lake access and large, custom-built homes. The town is known for its strong community feel, scenic open spaces, and zero commercial zoning.
Strict building codes and a high bar for entry have created a real estate market that’s both exclusive and expensive. With fewer than 300 homes, competition is stiff and values remain lofty.
2. Cherry Hills Village – 143% Home Price Increase Since 2012
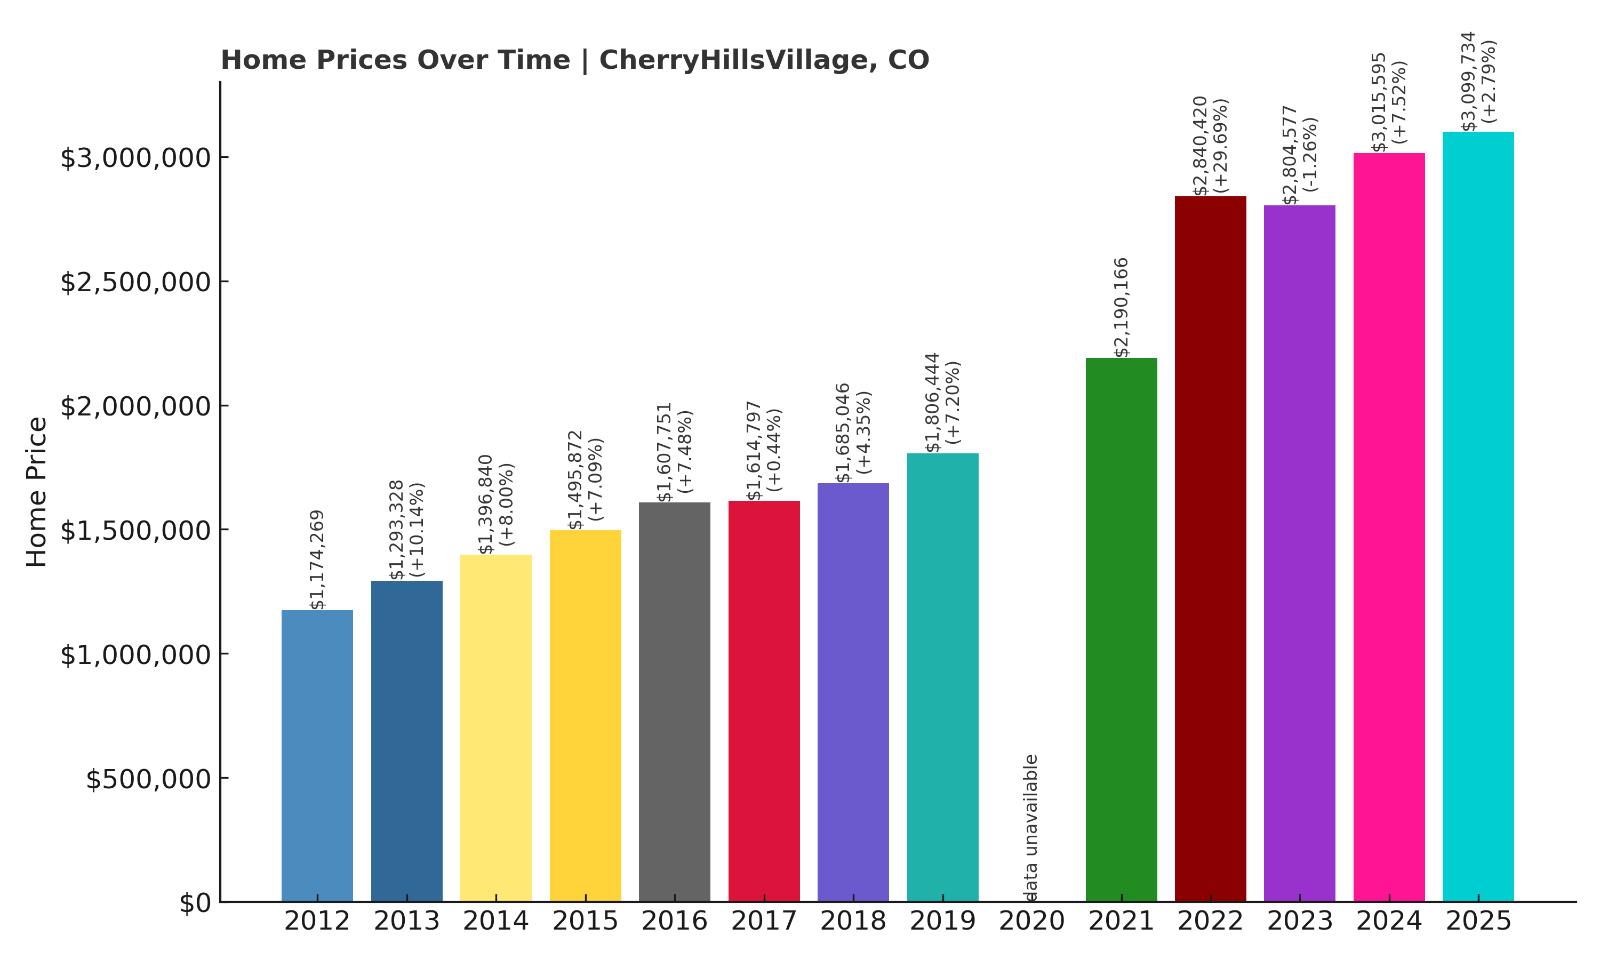
- 2012: $1,174,269
- 2013: $1,293,328 (+$119,059, +10.14% from previous year)
- 2014: $1,396,840 (+$103,512, +8.00% from previous year)
- 2015: $1,495,872 (+$99,032, +7.09% from previous year)
- 2016: $1,607,751 (+$111,878, +7.48% from previous year)
- 2017: $1,614,797 (+$7,047, +0.44% from previous year)
- 2018: $1,685,046 (+$70,249, +4.35% from previous year)
- 2019: $1,806,444 (+$121,398, +7.20% from previous year)
- 2021: $2,190,166
- 2022: $2,840,420 (+$650,254, +29.69% from previous year)
- 2023: $2,804,577 (-$35,844, -1.26% from previous year)
- 2024: $3,015,595 (+$211,018, +7.52% from previous year)
- 2025: $3,099,734 (+$84,139, +2.79% from previous year)
Cherry Hills Village home values have soared from $1.17M in 2012 to over $3M in 2025. The town saw explosive growth in 2022 and has held its position at the top of Colorado’s luxury market.
Cherry Hills Village – Prestige Just Outside Denver
Home to CEOs, athletes, and politicians, Cherry Hills Village offers sprawling estates, private schools, and the prestigious Cherry Hills Country Club. It’s just minutes from downtown Denver yet feels worlds apart.
Strict zoning, large lots, and a lack of commercial development preserve its secluded, estate-style atmosphere. It’s no surprise that this remains one of the most desirable (and priciest) zip codes in Colorado.
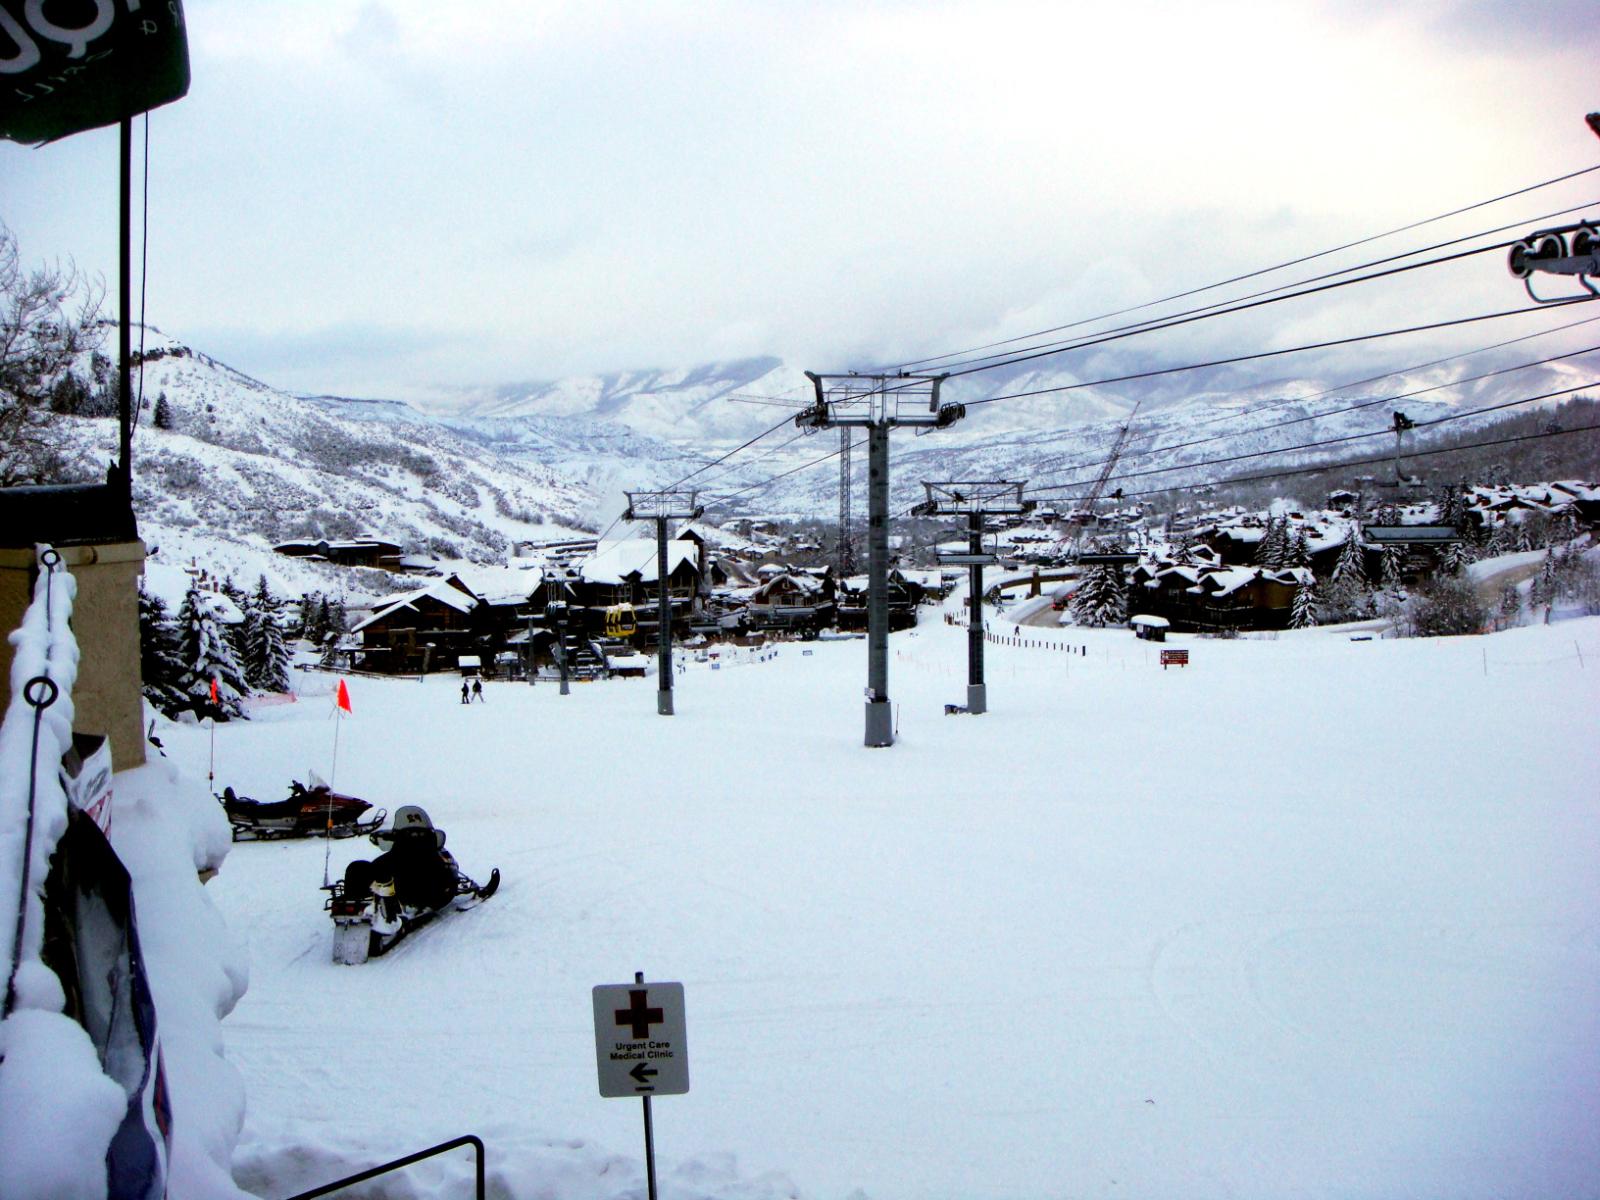
1. Aspen – 171% Home Price Increase Since 2012

- 2012: $1,283,804
- 2013: $1,375,027 (+$91,223, +7.11% from previous year)
- 2014: $1,490,321 (+$115,293, +8.38% from previous year)
- 2015: $1,646,624 (+$156,304, +10.49% from previous year)
- 2016: $1,782,678 (+$136,054, +8.26% from previous year)
- 2017: $1,797,796 (+$15,118, +0.85% from previous year)
- 2018: $1,871,094 (+$73,298, +4.08% from previous year)
- 2019: $1,989,053 (+$117,960, +6.30% from previous year)
- 2021: $2,548,074
- 2022: $3,424,992 (+$876,918, +34.41% from previous year)
- 2023: $3,249,623 (-$175,369, -5.12% from previous year)
- 2024: $3,369,086 (+$119,463, +3.68% from previous year)
- 2025: $3,536,687 (+$167,601, +4.97% from previous year)
Aspen’s home prices have increased by 171% since 2012, firmly cementing it as Colorado’s most expensive town. With median prices now well over $3.5M, it remains in a league of its own.
Aspen – Luxury Without Limits

Aspen is the gold standard for luxury real estate in the Rockies. With its elite ski resort, celebrity residents, and unmatched access to fine dining, culture, and nature, it commands sky-high prices—and then some.
The 2022 price surge made national headlines, and while things have cooled slightly, the long-term trend continues upward. With land scarcity and global prestige, Aspen continues to lead Colorado’s real estate market.