🔥 Would you like to save this?
Colorado may be known for its high-altitude luxury resorts and booming metros, but there are still pockets of the state where homeownership remains surprisingly affordable. Using the latest data from the Zillow Home Value Index, we’ve ranked the 18 towns in Colorado with the lowest home prices as of May 2025. Each has its own story — some have seen steady, modest growth, while others are only now catching attention after years of overlooked potential.
If you’re looking for a budget-friendly place to settle down, invest, or even retire, this list explores where your dollar still stretches the furthest. We’ll count down from #18 to #1, giving you the stats and insights to better understand what’s happening on the ground in each town.
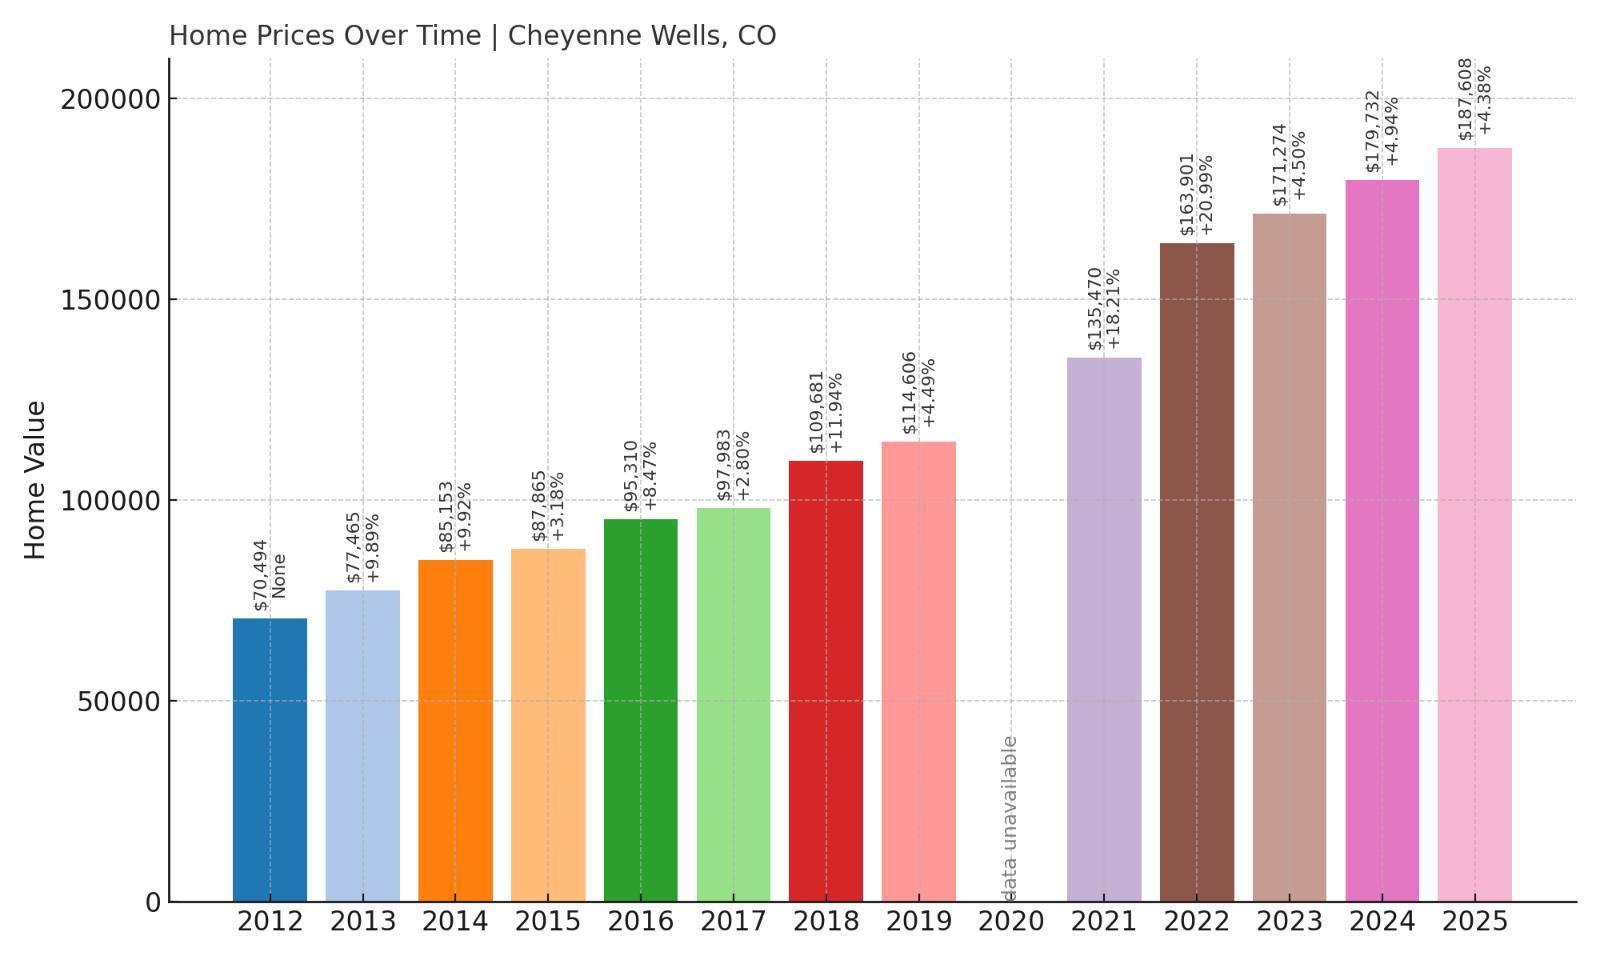
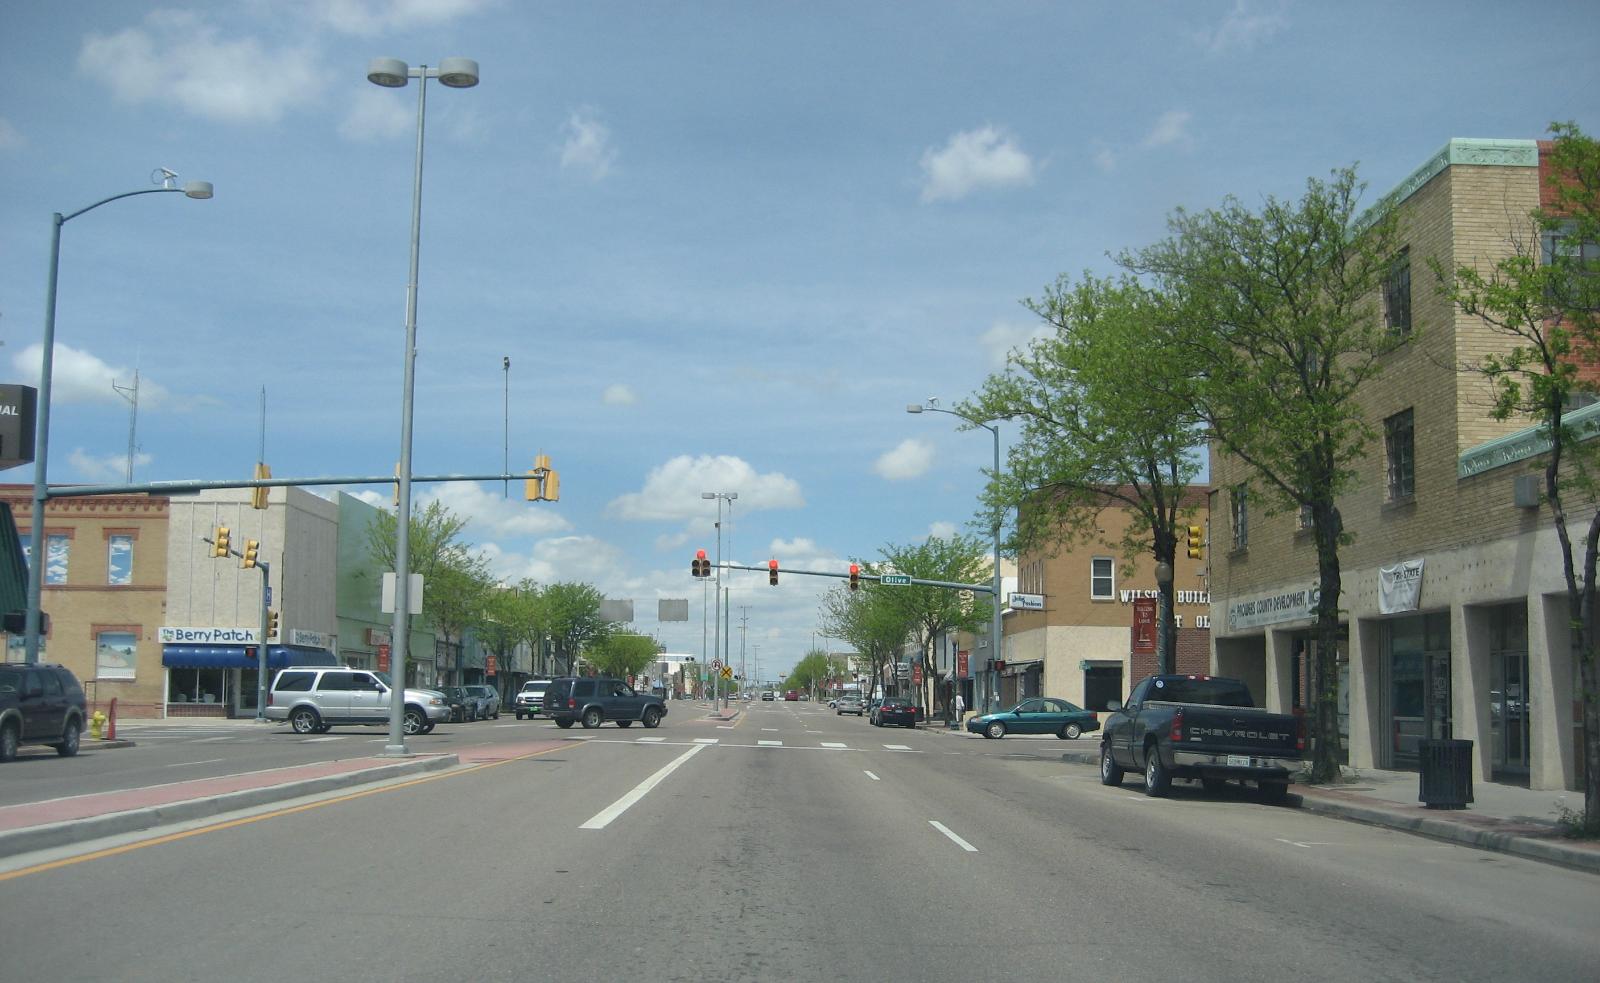
18. Cheyenne Wells – 166% Home Price Increase Since May 2012
- 2010: N/A
- 2011: N/A
- 2012: $70,494
- 2013: $77,465 (+$6,971, +9.89% from previous year)
- 2014: $85,153 (+$7,688, +9.92% from previous year)
- 2015: $87,865 (+$2,712, +3.18% from previous year)
- 2016: $95,310 (+$7,445, +8.47% from previous year)
- 2017: $97,983 (+$2,673, +2.80% from previous year)
- 2018: $109,681 (+$11,698, +11.94% from previous year)
- 2019: $114,606 (+$4,925, +4.49% from previous year)
- 2020: N/A
- 2021: $135,470 (+$20,864, +18.21% from previous year)
- 2022: $163,901 (+$28,431, +20.99% from previous year)
- 2023: $171,274 (+$7,373, +4.50% from previous year)
- 2024: $179,732 (+$8,458, +4.94% from previous year)
- 2025: $187,608 (+$7,876, +4.38% from previous year)
Cheyenne Wells has seen a steady climb in home values since 2012, growing by 166% over 13 years. After a particularly strong surge from 2021 to 2022, the market has continued its upward trend, albeit at a slower pace. With 2025 values reaching just under $188,000, it remains one of Colorado’s most affordable markets despite consistent growth.
Cheyenne Wells – Quiet Growth on the Eastern Plains
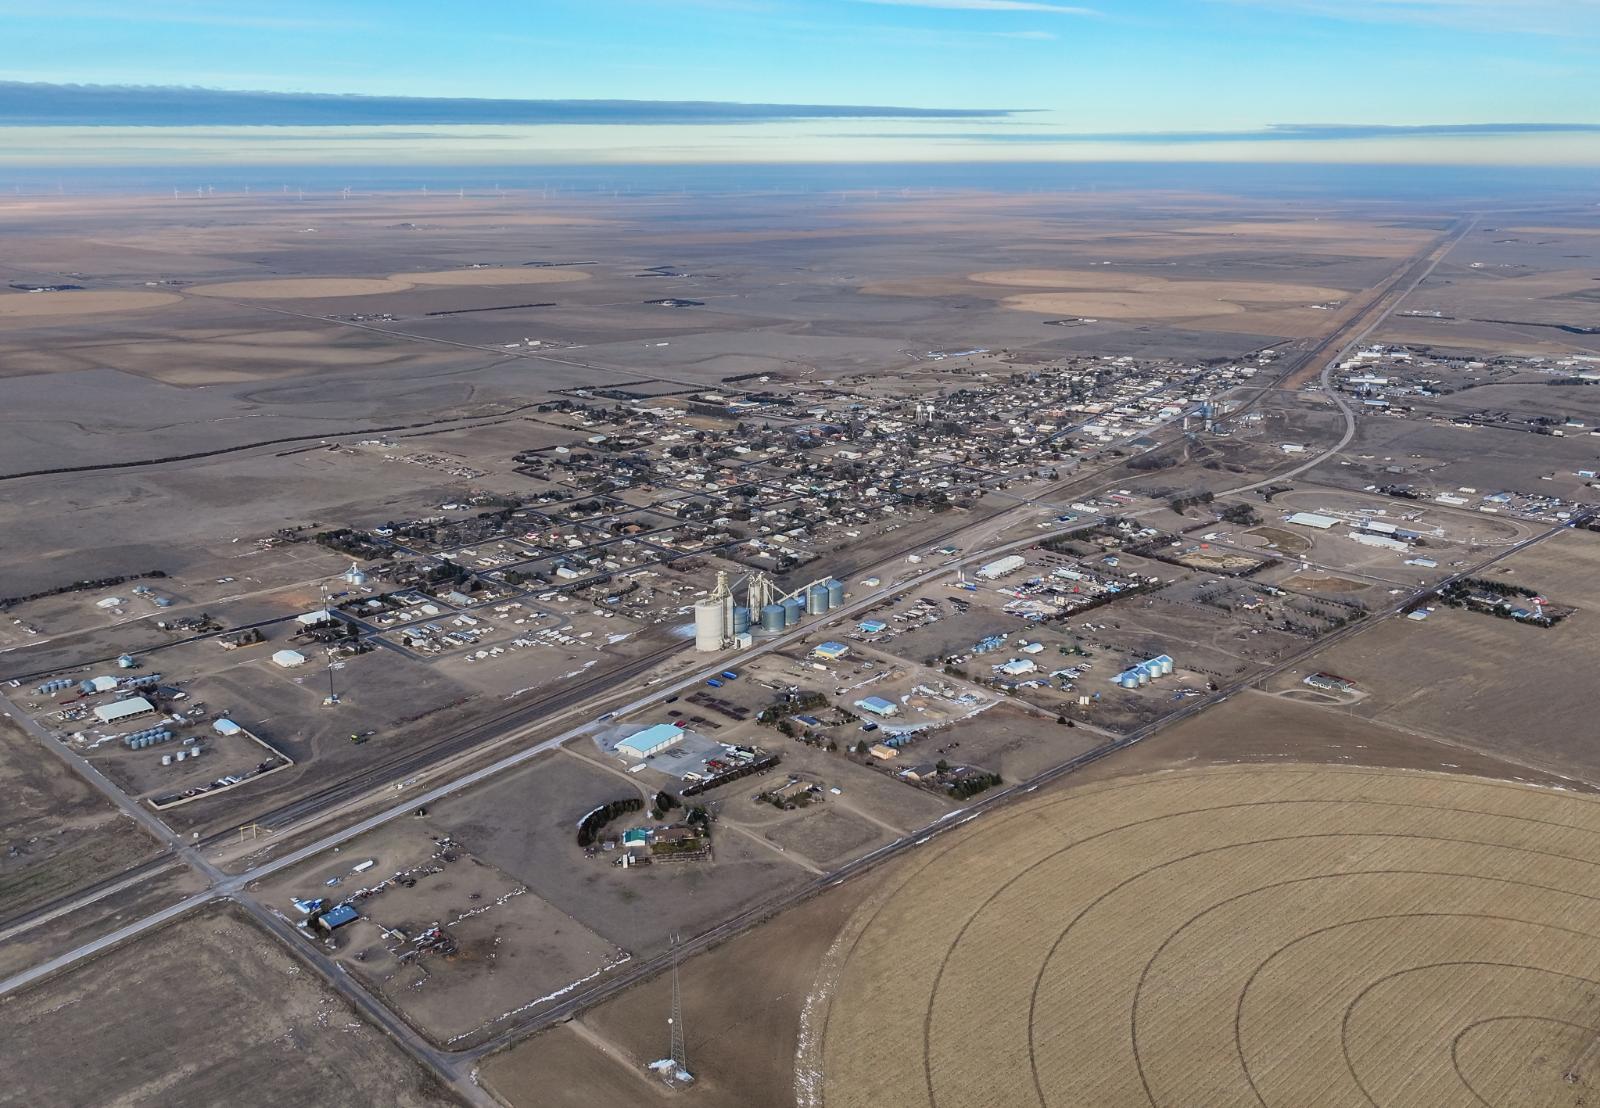
Located in Cheyenne County near the Kansas border, Cheyenne Wells is a small town that has quietly benefitted from modest but consistent price increases. Known for its agricultural roots and calm lifestyle, it offers basic amenities and wide-open space. The relatively low baseline value in 2012 made it an accessible starting point for homeowners, and recent attention has pushed prices higher as buyers look for value in more rural parts of the state.
In order to come up with the very specific design ideas, we create most designs with the assistance of state-of-the-art AI interior design software. Also, assume links that take you off the site are affiliate links such as links to Amazon. this means we may earn a commission if you buy something.
The town hasn’t experienced explosive development, but improvements in infrastructure and a renewed interest in Eastern Plains living have played a role in its appreciation. Its slow-and-steady pace may be ideal for those who want affordability without the volatility of larger markets.
17. Wiley – 155% Home Price Increase Since May 2011

- 2010: N/A
- 2011: $72,405
- 2012: $72,817 (+$412, +0.57% from previous year)
- 2013: $73,884 (+$1,067, +1.47% from previous year)
- 2014: $79,213 (+$5,329, +7.21% from previous year)
- 2015: $82,416 (+$3,203, +4.04% from previous year)
- 2016: $86,227 (+$3,810, +4.62% from previous year)
- 2017: $95,106 (+$8,879, +10.30% from previous year)
- 2018: $103,208 (+$8,102, +8.52% from previous year)
- 2019: $116,035 (+$12,827, +12.43% from previous year)
- 2020: N/A
- 2021: $147,419 (+$31,385, +27.05% from previous year)
- 2022: $176,976 (+$29,557, +20.05% from previous year)
- 2023: $177,394 (+$418, +0.24% from previous year)
- 2024: $183,039 (+$5,646, +3.18% from previous year)
- 2025: $184,993 (+$1,954, +1.07% from previous year)
Wiley has recorded a home value increase of over 155% since 2011, with particularly sharp gains from 2019 to 2022. The market has cooled slightly in recent years, showing minimal growth in 2023 and 2025, but prices remain much higher than a decade ago. It’s a case of slow beginnings followed by an aggressive jump.
Wiley – Steady Rises in a Small Farming Community
Situated in Prowers County, Wiley is a small farming town with deep ties to Colorado’s agricultural backbone. Its affordability has made it a sleeper pick for value-conscious buyers. The sharp increases in the early 2020s reflect both low starting prices and a broader trend of rural migration during the pandemic years.
Wiley’s access to Lamar and other regional centers offers basic connectivity without city congestion. Its recent price plateau may signal stabilization after a growth period, which could appeal to long-term buyers looking for predictability over spikes.
16. Julesburg – 104% Home Price Increase Since May 2017

- 2010: N/A
- 2011: N/A
- 2012: N/A
- 2013: N/A
- 2014: N/A
- 2015: N/A
- 2016: N/A
- 2017: $87,557
- 2018: $97,949 (+$10,392, +11.87% from previous year)
- 2019: $108,350 (+$10,400, +10.62% from previous year)
- 2020: N/A
- 2021: $137,409 (+$29,059, +26.82% from previous year)
- 2022: $152,686 (+$15,277, +11.12% from previous year)
- 2023: $153,981 (+$1,296, +0.85% from previous year)
- 2024: $164,519 (+$10,538, +6.84% from previous year)
- 2025: $179,007 (+$14,488, +8.81% from previous year)
Julesburg has more than doubled its average home value since 2017. Despite a brief pause in 2023, growth has resumed, with nearly 9% appreciation in the past year. At under $180,000, it remains firmly affordable compared to statewide averages, even after a decade of growth.
Julesburg – Gateway to the Northeast
As the county seat of Sedgwick County and the northeasternmost town in Colorado, Julesburg serves as a quiet entry point into the state from Nebraska. Its location on I-76 and US Route 138 gives it some strategic transportation relevance. Still, its appeal lies in the charm of small-town living with minimal development pressure.
The jump in housing values after 2020 likely reflects renewed interest in border towns where land is plentiful and prices are low. While it’s still inexpensive, Julesburg’s rising prices suggest it won’t stay under the radar much longer.
15. Lamar – 155% Home Price Increase Since May 2010

- 2010: $68,739
- 2011: $67,588 (-$1,152, -1.68% from previous year)
- 2012: $68,522 (+$934, +1.38% from previous year)
- 2013: $71,345 (+$2,824, +4.12% from previous year)
- 2014: $73,003 (+$1,658, +2.32% from previous year)
- 2015: $74,288 (+$1,285, +1.76% from previous year)
- 2016: $78,870 (+$4,582, +6.17% from previous year)
- 2017: $81,574 (+$2,705, +3.43% from previous year)
- 2018: $87,913 (+$6,338, +7.77% from previous year)
- 2019: $102,510 (+$14,597, +16.60% from previous year)
- 2020: N/A
- 2021: $130,842 (+$28,332, +27.64% from previous year)
- 2022: $154,470 (+$23,628, +18.06% from previous year)
- 2023: $164,769 (+$10,299, +6.67% from previous year)
- 2024: $170,909 (+$6,141, +3.73% from previous year)
- 2025: $175,572 (+$4,663, +2.73% from previous year)
Since 2010, Lamar’s home prices have gone up by over 155%, fueled by a surge between 2019 and 2022. Though the rate of increase has slowed recently, prices continue to trend upward, with 2025 values approaching $176,000. This is a strong signal of enduring interest in the area.
Lamar – A Regional Anchor With Affordable Appeal
Lamar, the largest city in Prowers County, is a key hub for southeastern Colorado. With schools, healthcare, and retail infrastructure, it’s one of the more developed towns on this list. The area’s price increases are likely tied to its economic resilience and position as a service center for surrounding rural communities.
The rapid price growth during the early 2020s may have been driven by pandemic-era buyers looking beyond urban markets. Today, Lamar remains affordable relative to other parts of the state, but the window for low-cost entry is narrowing.
14. Manzanola – 187% Home Price Increase Since May 2010
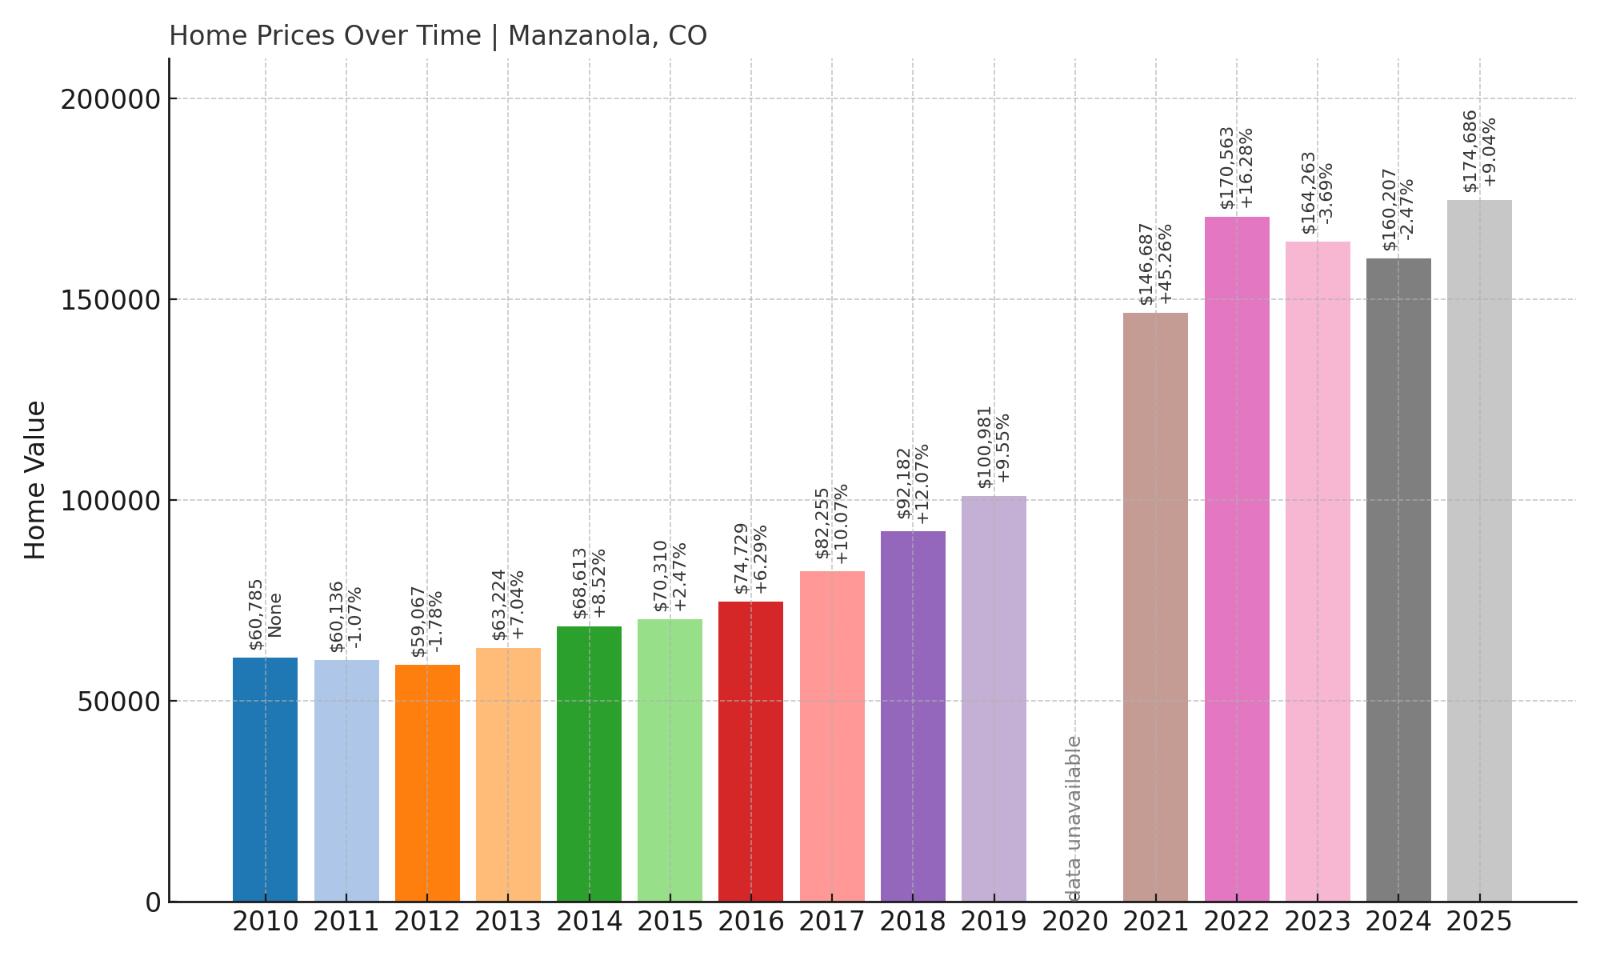
- 2010: $60,785
- 2011: $60,136 (-$649, -1.07% from previous year)
- 2012: $59,067 (-$1,069, -1.78% from previous year)
- 2013: $63,224 (+$4,157, +7.04% from previous year)
- 2014: $68,613 (+$5,389, +8.52% from previous year)
- 2015: $70,310 (+$1,697, +2.47% from previous year)
- 2016: $74,729 (+$4,419, +6.29% from previous year)
- 2017: $82,255 (+$7,525, +10.07% from previous year)
- 2018: $92,182 (+$9,928, +12.07% from previous year)
- 2019: $100,981 (+$8,799, +9.55% from previous year)
- 2020: N/A
- 2021: $146,687 (+$45,706, +45.26% from previous year)
- 2022: $170,563 (+$23,875, +16.28% from previous year)
- 2023: $164,263 (-$6,299, -3.69% from previous year)
- 2024: $160,207 (-$4,056, -2.47% from previous year)
- 2025: $174,686 (+$14,479, +9.04% from previous year)
Home values in Manzanola have surged by 187% since 2010, with a dramatic leap in 2021. While the market dipped slightly in 2023 and 2024, prices are back on the rise in 2025. The town’s low starting point has made these increases more dramatic.
Manzanola – A Tiny Town With Big Price Gains
Located in Otero County, Manzanola is a compact town that has seen outsized home value growth compared to its size. Its appeal lies in its simplicity: small population, quiet streets, and a cost of living that remained low for years before rising attention kicked in.
Accessibility to larger towns like La Junta and regional job centers may be contributing to its growth. The recent rebound in 2025 suggests that Manzanola is still on the radar for buyers seeking affordability with some upside potential.
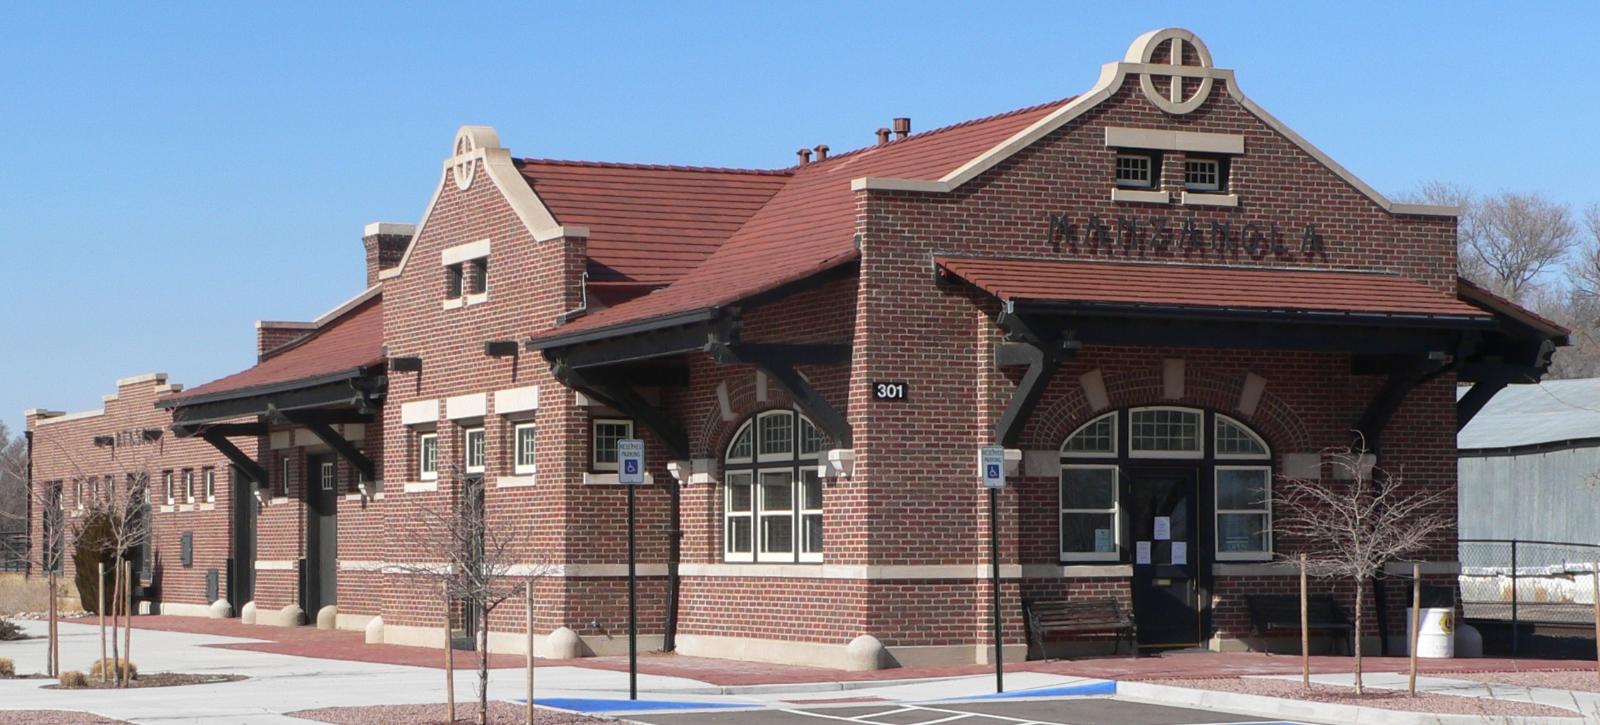
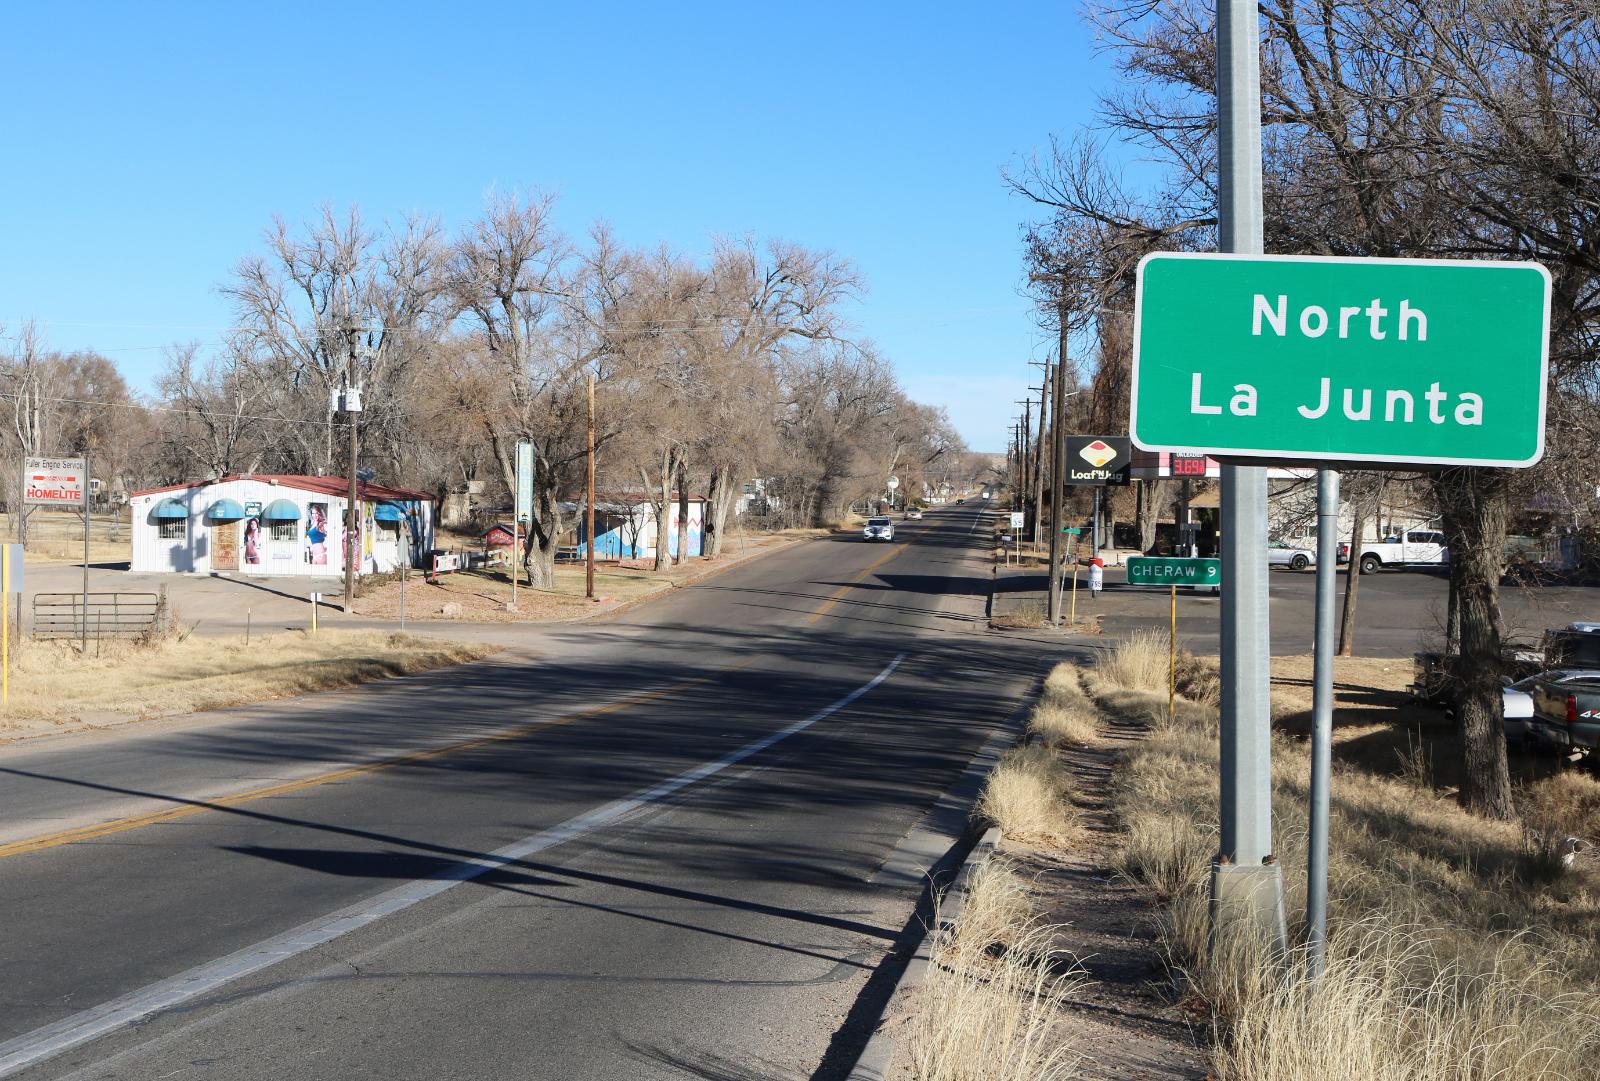
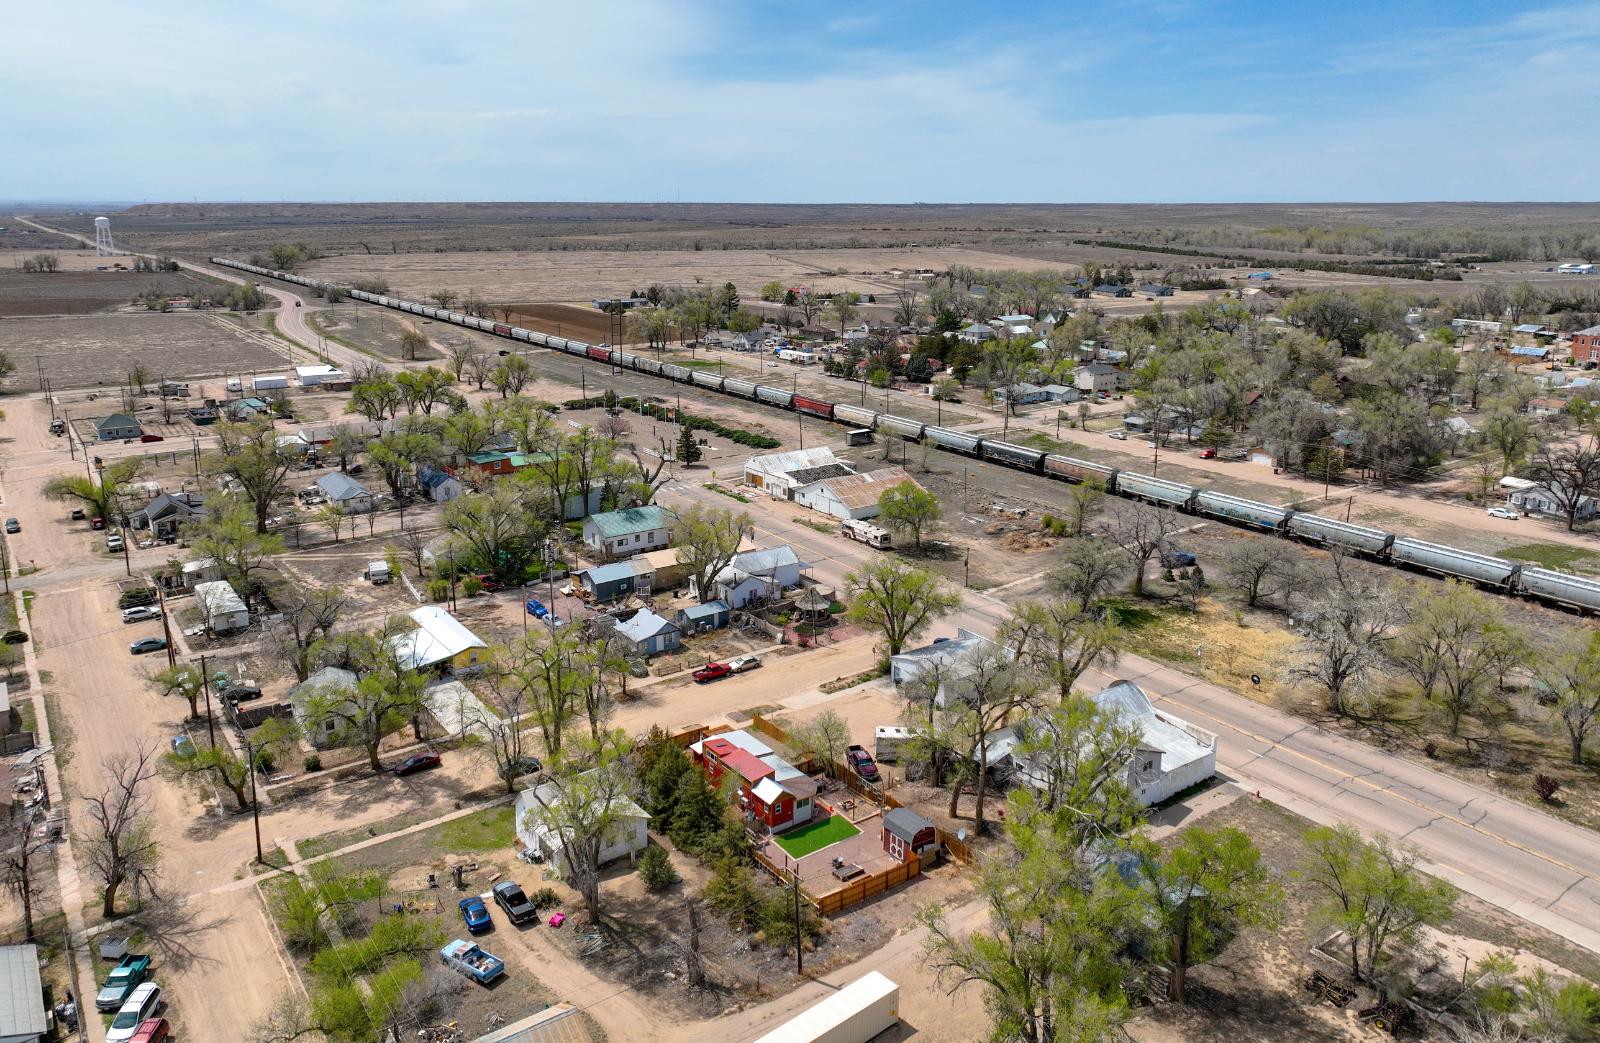
13. La Junta – 164% Home Price Increase Since May 2010
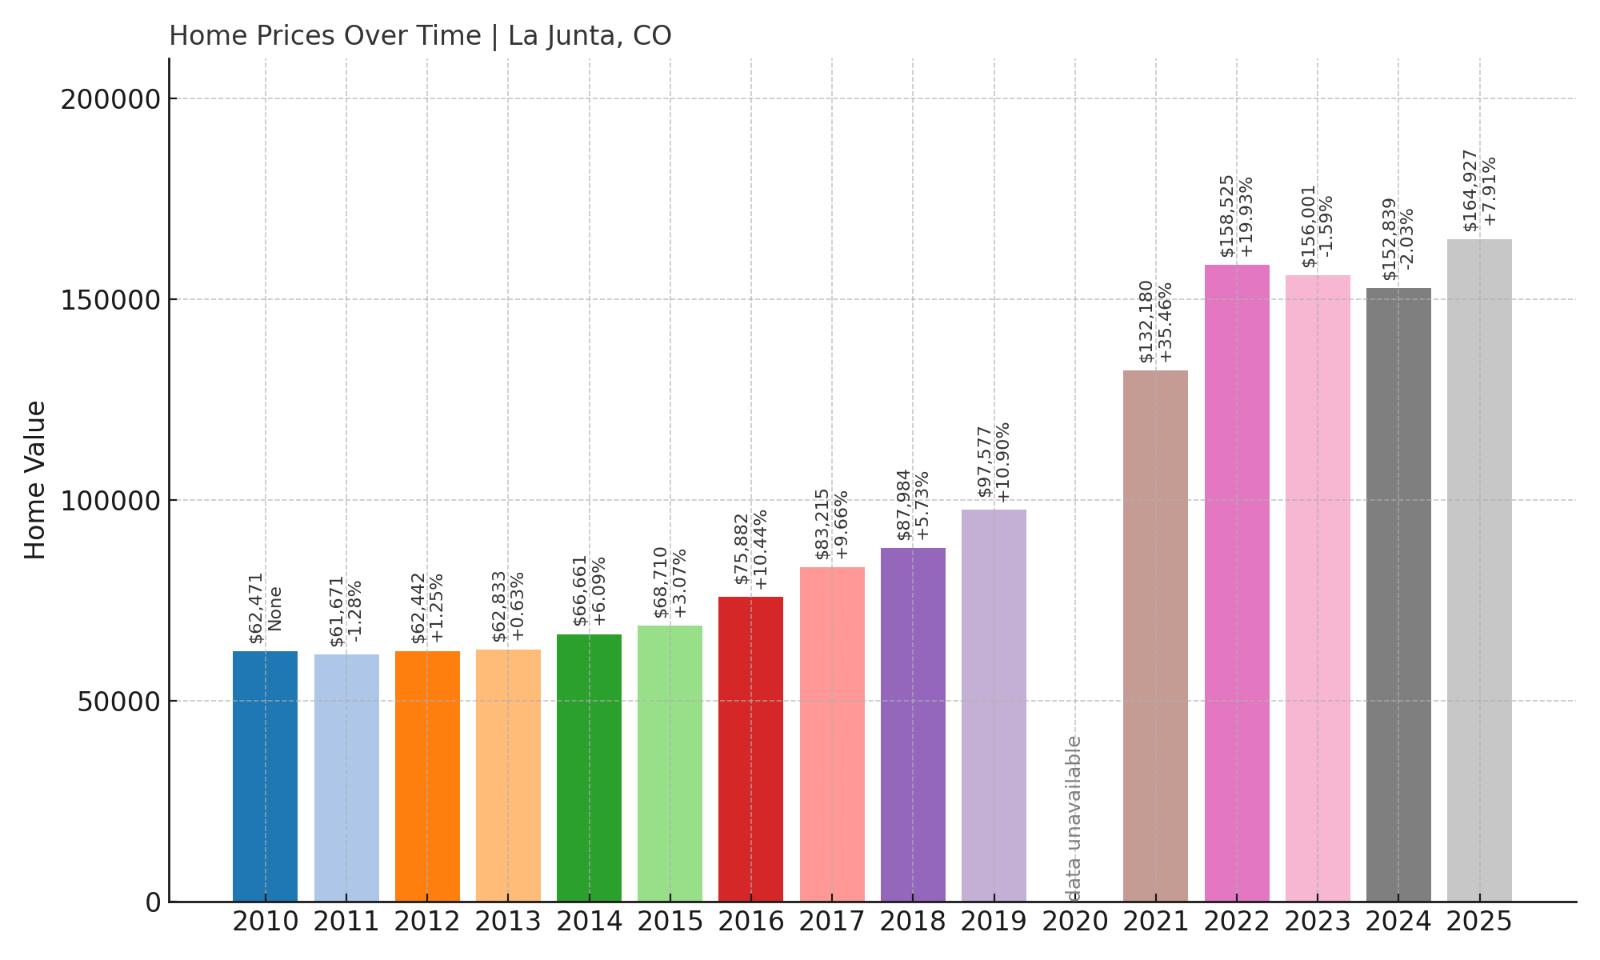
- 2010: $62,471
- 2011: $61,671 (-$800, -1.28% from previous year)
- 2012: $62,442 (+$771, +1.25% from previous year)
- 2013: $62,833 (+$391, +0.63% from previous year)
- 2014: $66,661 (+$3,828, +6.09% from previous year)
- 2015: $68,710 (+$2,049, +3.07% from previous year)
- 2016: $75,882 (+$7,171, +10.44% from previous year)
- 2017: $83,215 (+$7,333, +9.66% from previous year)
- 2018: $87,984 (+$4,769, +5.73% from previous year)
- 2019: $97,577 (+$9,592, +10.90% from previous year)
- 2020: N/A
- 2021: $132,180 (+$34,603, +35.46% from previous year)
- 2022: $158,525 (+$26,345, +19.93% from previous year)
- 2023: $156,001 (-$2,523, -1.59% from previous year)
- 2024: $152,839 (-$3,163, -2.03% from previous year)
- 2025: $164,927 (+$12,089, +7.91% from previous year)
La Junta has seen its home prices rise 164% since 2010. After a significant boom from 2019 to 2022, the market cooled slightly for a couple of years before picking up again in 2025. This combination of sustained growth and relative affordability makes it a key player in southeastern Colorado’s real estate market.
La Junta – A Regional Hub With Rising Appeal
La Junta is one of the largest towns in southeastern Colorado and serves as an important commercial and educational center for the region. With access to Otero College, a regional hospital, and an Amtrak station, it’s more connected than most towns on this list. That connectivity likely played a role in its impressive price increases during the pandemic recovery years.
Despite some price dips, La Junta continues to attract new buyers and investors thanks to its blend of urban conveniences and small-town feel. Its most recent price bump in 2025 could signal renewed interest and a second wave of growth.
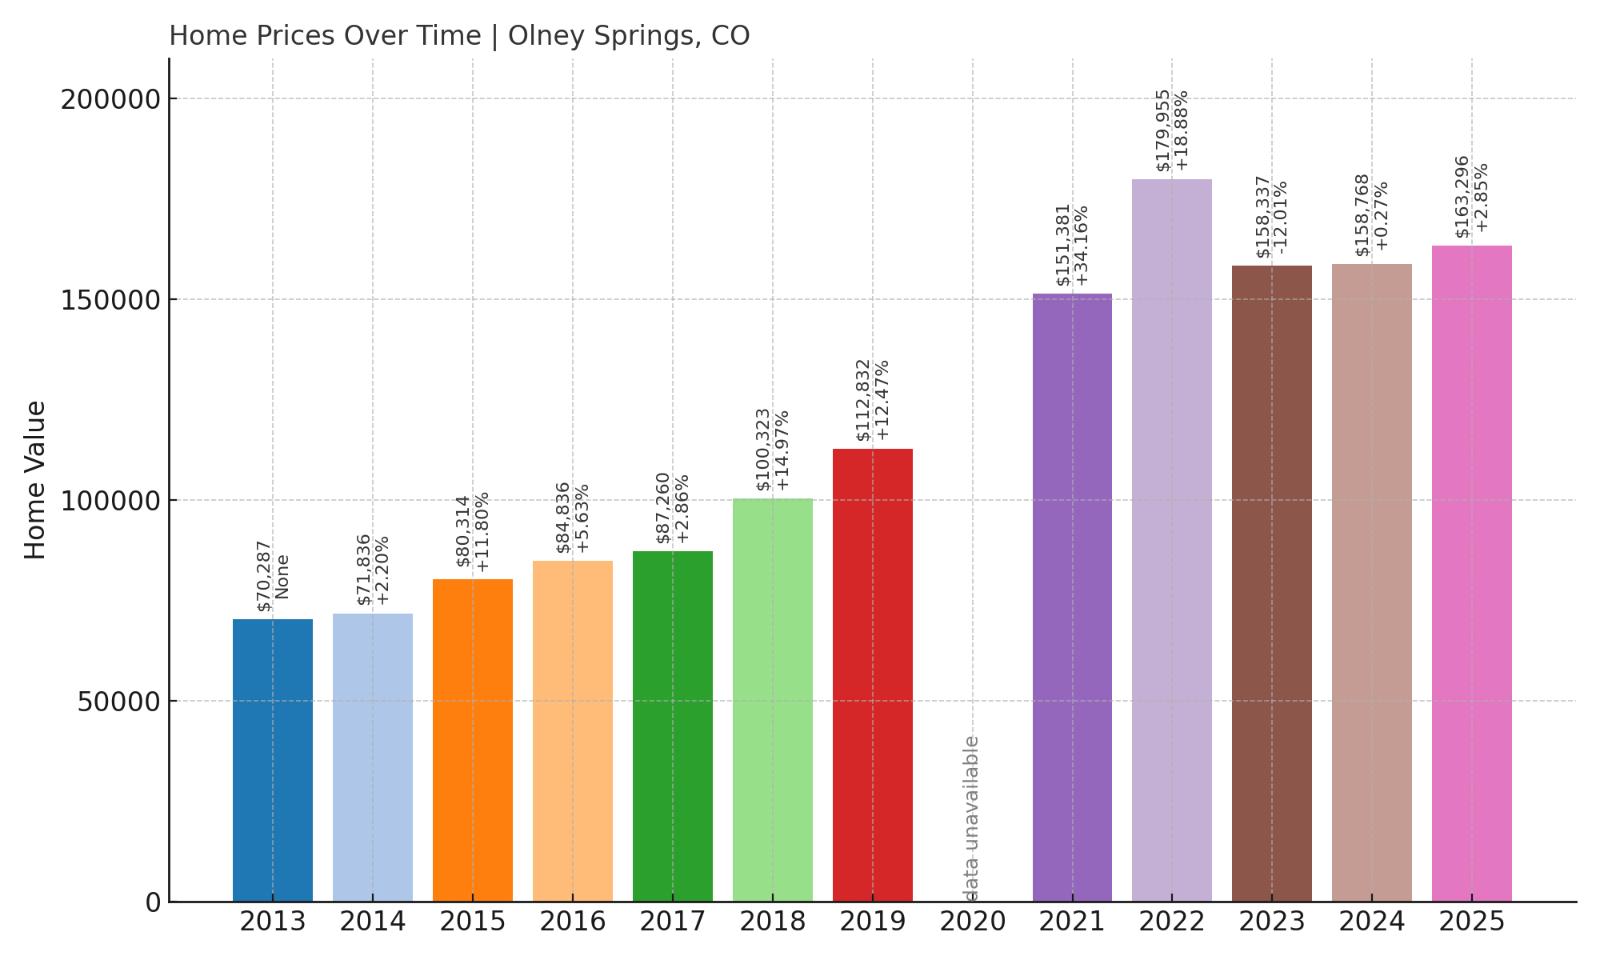
12. Olney Springs – 132% Home Price Increase Since May 2013
🔥 Would you like to save this?
- 2010: N/A
- 2011: N/A
- 2012: N/A
- 2013: $70,287
- 2014: $71,836 (+$1,548, +2.20% from previous year)
- 2015: $80,314 (+$8,479, +11.80% from previous year)
- 2016: $84,836 (+$4,522, +5.63% from previous year)
- 2017: $87,260 (+$2,424, +2.86% from previous year)
- 2018: $100,323 (+$13,063, +14.97% from previous year)
- 2019: $112,832 (+$12,510, +12.47% from previous year)
- 2020: N/A
- 2021: $151,381 (+$38,549, +34.16% from previous year)
- 2022: $179,955 (+$28,574, +18.88% from previous year)
- 2023: $158,337 (-$21,618, -12.01% from previous year)
- 2024: $158,768 (+$431, +0.27% from previous year)
- 2025: $163,296 (+$4,528, +2.85% from previous year)
Since 2013, Olney Springs has more than doubled in value, with a 132% increase in average home prices. While it saw a significant drop in 2023, the market appears to be stabilizing, with small but positive gains in the last two years. It remains well below the state median, attracting price-conscious buyers.
Olney Springs – Bounce Back After a Price Correction
Located in Crowley County, Olney Springs is a small town with a rural vibe and a slow pace of life. The boom from 2020 to 2022 brought attention to this overlooked area, likely driven by buyers looking for more space and lower costs. That rapid price climb may have led to a short-term correction in 2023, but values are now inching upward again.
The town’s proximity to larger cities like Pueblo makes it attractive for commuters who don’t mind a drive. As remote work becomes more normalized, towns like Olney Springs could continue to see renewed interest over the next few years.
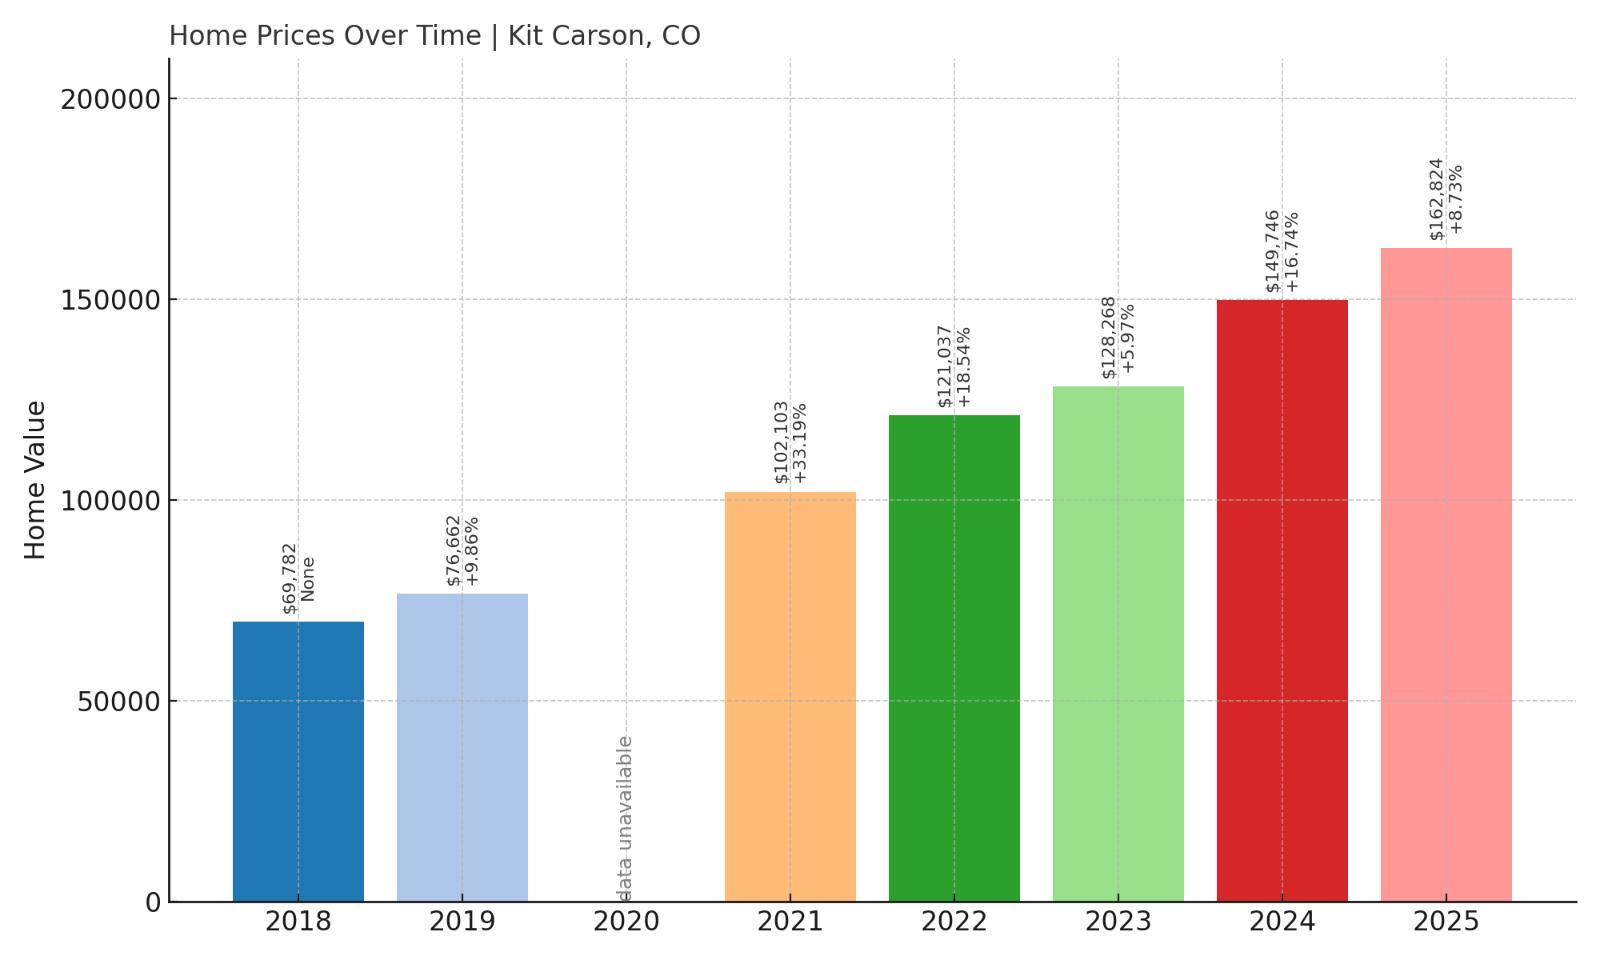
11. Kit Carson – 133% Home Price Increase Since May 2018
- 2010: N/A
- 2011: N/A
- 2012: N/A
- 2013: N/A
- 2014: N/A
- 2015: N/A
- 2016: N/A
- 2017: N/A
- 2018: $69,782
- 2019: $76,662 (+$6,880, +9.86% from previous year)
- 2020: N/A
- 2021: $102,103 (+$25,441, +33.19% from previous year)
- 2022: $121,037 (+$18,934, +18.54% from previous year)
- 2023: $128,268 (+$7,231, +5.97% from previous year)
- 2024: $149,746 (+$21,478, +16.74% from previous year)
- 2025: $162,824 (+$13,078, +8.73% from previous year)
Kit Carson has seen a 133% jump in average home prices since 2018, driven by consistent annual growth. The past few years have shown especially strong appreciation, and 2025 is no exception, with an 8.7% increase over the previous year. Despite that, homes here remain among the cheapest in the state.
Kit Carson – A Market on the Move
Kit Carson, named after the famed frontiersman, is located in Cheyenne County in the Eastern Plains. With limited housing stock and modest development, its price increases have been shaped by scarcity and increased rural demand. The trend seems tied to broader migration patterns away from urban centers toward towns with more space and lower entry costs.
Its small size and distance from major cities haven’t prevented growth, making it a compelling option for long-term buyers who prioritize affordability and simplicity over urban amenities.
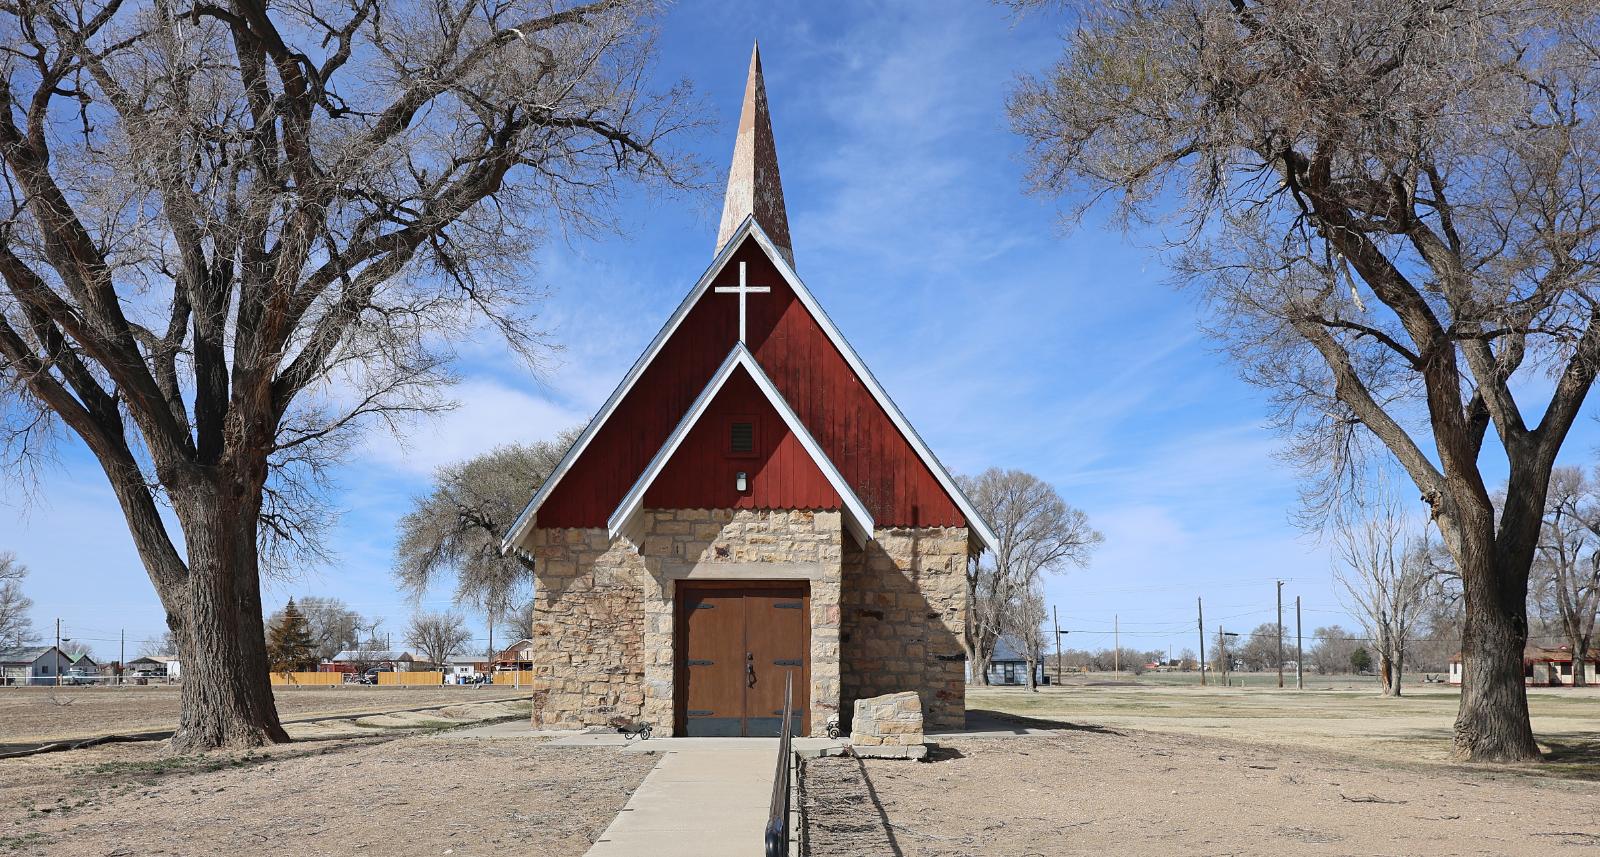
10. Eads – 217% Home Price Increase Since May 2014
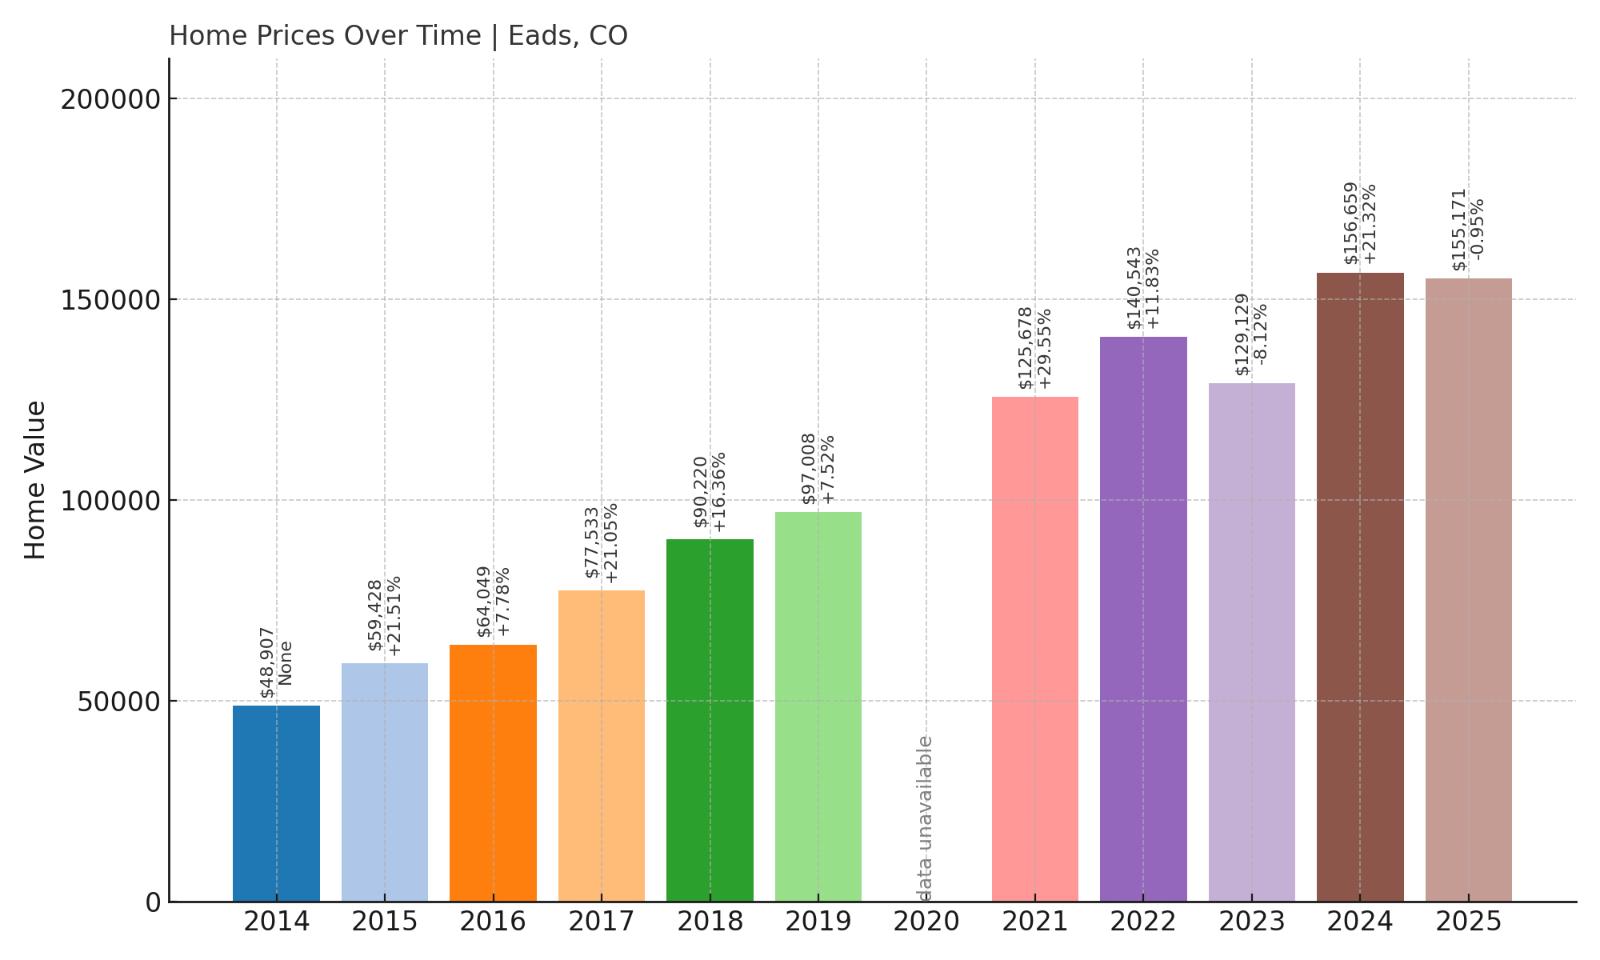
- 2010: N/A
- 2011: N/A
- 2012: N/A
- 2013: N/A
- 2014: $48,907
- 2015: $59,428 (+$10,521, +21.51% from previous year)
- 2016: $64,049 (+$4,621, +7.78% from previous year)
- 2017: $77,533 (+$13,484, +21.05% from previous year)
- 2018: $90,220 (+$12,688, +16.36% from previous year)
- 2019: $97,008 (+$6,788, +7.52% from previous year)
- 2020: N/A
- 2021: $125,678 (+$28,670, +29.55% from previous year)
- 2022: $140,543 (+$14,865, +11.83% from previous year)
- 2023: $129,129 (-$11,414, -8.12% from previous year)
- 2024: $156,659 (+$27,530, +21.32% from previous year)
- 2025: $155,171 (-$1,488, -0.95% from previous year)
Home prices in Eads have increased by over 217% since 2014, one of the sharpest climbs on this list. While 2025 shows a minor dip, this follows a huge spike the previous year. Despite some volatility, the long-term trend remains strongly upward.
Eads – A Standout in the Eastern Plains

As the county seat of Kiowa County, Eads has benefited from increased rural demand and very low starting prices. The town’s solid community infrastructure and position as a regional administrative center have helped it attract new interest over the past decade.
While fluctuations are expected in small markets, Eads’ overall trajectory has been impressive. Even with the slight dip in 2025, it remains one of the most rapidly appreciating small towns in Colorado’s eastern half.
9. Rocky Ford – 136% Home Price Increase Since May 2010
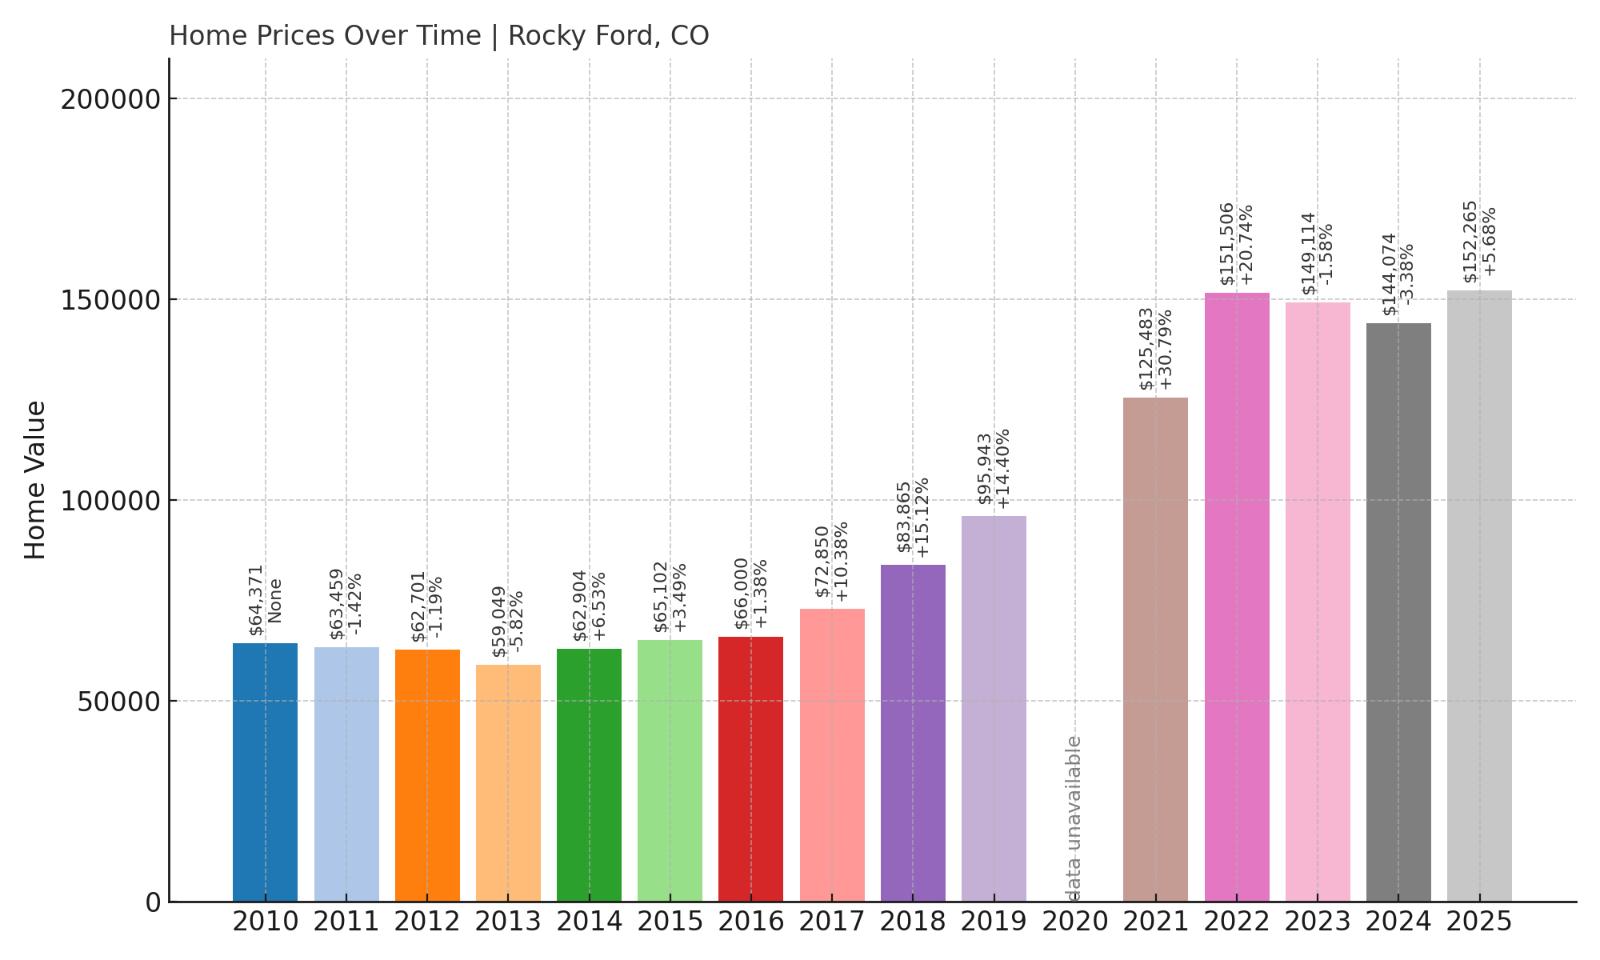
- 2010: $64,371
- 2011: $63,459 (-$912, -1.42% from previous year)
- 2012: $62,701 (-$758, -1.19% from previous year)
- 2013: $59,049 (-$3,652, -5.82% from previous year)
- 2014: $62,904 (+$3,854, +6.53% from previous year)
- 2015: $65,102 (+$2,198, +3.49% from previous year)
- 2016: $66,000 (+$898, +1.38% from previous year)
- 2017: $72,850 (+$6,850, +10.38% from previous year)
- 2018: $83,865 (+$11,015, +15.12% from previous year)
- 2019: $95,943 (+$12,078, +14.40% from previous year)
- 2020: N/A
- 2021: $125,483 (+$29,540, +30.79% from previous year)
- 2022: $151,506 (+$26,024, +20.74% from previous year)
- 2023: $149,114 (-$2,392, -1.58% from previous year)
- 2024: $144,074 (-$5,040, -3.38% from previous year)
- 2025: $152,265 (+$8,191, +5.68% from previous year)
Rocky Ford has seen a 136% increase in home values since 2010. After a steady climb in the 2010s, prices surged from 2019 to 2022. Although the market dipped slightly in 2023 and 2024, it’s rebounded in 2025, signaling renewed buyer interest.
Rocky Ford – A Comeback Fueled by Value

Known for its world-famous melons, Rocky Ford sits in the Arkansas River Valley and has long been an agricultural hub. This Otero County town offers affordable real estate and basic amenities, making it an appealing option for both families and retirees.
The recent volatility may be tied to wider regional economic factors, but its 2025 recovery suggests renewed confidence in the market. Its central location and strong community identity continue to make Rocky Ford a standout for those seeking value east of Pueblo.
8. Ordway – 129% Home Price Increase Since May 2013

- 2010: N/A
- 2011: N/A
- 2012: N/A
- 2013: $65,323
- 2014: $69,225 (+$3,902, +5.97% from previous year)
- 2015: $79,439 (+$10,214, +14.75% from previous year)
- 2016: $78,075 (-$1,364, -1.72% from previous year)
- 2017: $84,892 (+$6,817, +8.73% from previous year)
- 2018: $103,445 (+$18,553, +21.85% from previous year)
- 2019: $106,574 (+$3,130, +3.03% from previous year)
- 2020: N/A
- 2021: $142,608 (+$36,034, +33.81% from previous year)
- 2022: $165,367 (+$22,759, +15.96% from previous year)
- 2023: $150,148 (-$15,220, -9.20% from previous year)
- 2024: $143,759 (-$6,389, -4.26% from previous year)
- 2025: $149,303 (+$5,544, +3.86% from previous year)
Ordway has more than doubled its home prices since 2013, with a 129% gain over 12 years. After a hot streak through 2022, prices corrected in the following two years. The uptick in 2025 suggests a possible new growth phase or stabilization period.
Ordway – A Rural Market Finding Its Balance

Ordway is the seat of Crowley County and sits roughly halfway between Pueblo and La Junta. Its central location and small-town charm have contributed to its price growth, especially during the early 2020s when buyers looked for alternatives to urban centers.
Following a couple of declining years, the recent gain shows that demand hasn’t disappeared—buyers may just be regaining confidence. With amenities like a library, schools, and access to recreational areas, Ordway could remain attractive for buyers looking to settle in southeastern Colorado.
7. San Luis – 53% Home Price Increase Since May 2016

- 2010: N/A
- 2011: N/A
- 2012: N/A
- 2013: N/A
- 2014: N/A
- 2015: N/A
- 2016: $97,535
- 2017: $105,873 (+$8,339, +8.55% from previous year)
- 2018: $113,428 (+$7,554, +7.14% from previous year)
- 2019: $119,984 (+$6,556, +5.78% from previous year)
- 2020: N/A
- 2021: $153,095 (+$33,111, +27.60% from previous year)
- 2022: $177,695 (+$24,600, +16.07% from previous year)
- 2023: $164,582 (-$13,113, -7.38% from previous year)
- 2024: $156,516 (-$8,065, -4.90% from previous year)
- 2025: $148,915 (-$7,601, -4.86% from previous year)
Home prices in San Luis jumped by 53% since 2016. But after peaking in 2022, prices have been falling steadily. The downward trend could offer buying opportunities in Colorado’s oldest town for those willing to wait for a rebound.
San Luis – Colorado’s Oldest Town, Now on Sale
San Luis, founded in 1851, is steeped in history and serves as the cultural heart of Costilla County. It’s home to the famous Stations of the Cross Shrine and offers scenic mountain views. But despite its historic significance, it hasn’t been immune to recent market corrections.
The town’s fall in home prices since 2022 could reflect broader cooling trends in rural Colorado or simply a market correction after several years of steep increases. Still, with prices under $150,000 in 2025, it remains an affordable option for buyers seeking cultural richness and scenic beauty.
6. Moffat – 160% Home Price Increase Since May 2010

🔥 Would you like to save this?
- 2010: $57,105
- 2011: $58,468 (+$1,363, +2.39% from previous year)
- 2012: $56,221 (-$2,246, -3.84% from previous year)
- 2013: $65,056 (+$8,834, +15.71% from previous year)
- 2014: $79,312 (+$14,256, +21.91% from previous year)
- 2015: $74,044 (-$5,268, -6.64% from previous year)
- 2016: $78,441 (+$4,397, +5.94% from previous year)
- 2017: $90,916 (+$12,475, +15.90% from previous year)
- 2018: $93,660 (+$2,745, +3.02% from previous year)
- 2019: $101,157 (+$7,497, +8.00% from previous year)
- 2020: N/A
- 2021: $136,657 (+$35,500, +35.09% from previous year)
- 2022: $163,435 (+$26,778, +19.60% from previous year)
- 2023: $155,532 (-$7,903, -4.84% from previous year)
- 2024: $135,296 (-$20,235, -13.01% from previous year)
- 2025: $148,437 (+$13,141, +9.71% from previous year)
Since 2010, Moffat’s home values have risen by 160%, reflecting dramatic growth punctuated by some recent volatility. After two years of declines, the market is recovering in 2025 with a nearly 10% gain over the previous year.
Moffat – High Peaks and Affordable Prices
Moffat lies in Saguache County at the edge of the San Luis Valley, offering breathtaking mountain views and access to nature. With its proximity to hot springs, hiking trails, and Crestone’s spiritual retreats, the area has seen waves of new residents looking for peace and isolation.
The town’s affordability, combined with lifestyle appeal, fueled rapid price increases through 2022. Although it hit a rough patch in 2023–2024, the 2025 rebound could mark the beginning of a new, more stable growth cycle.
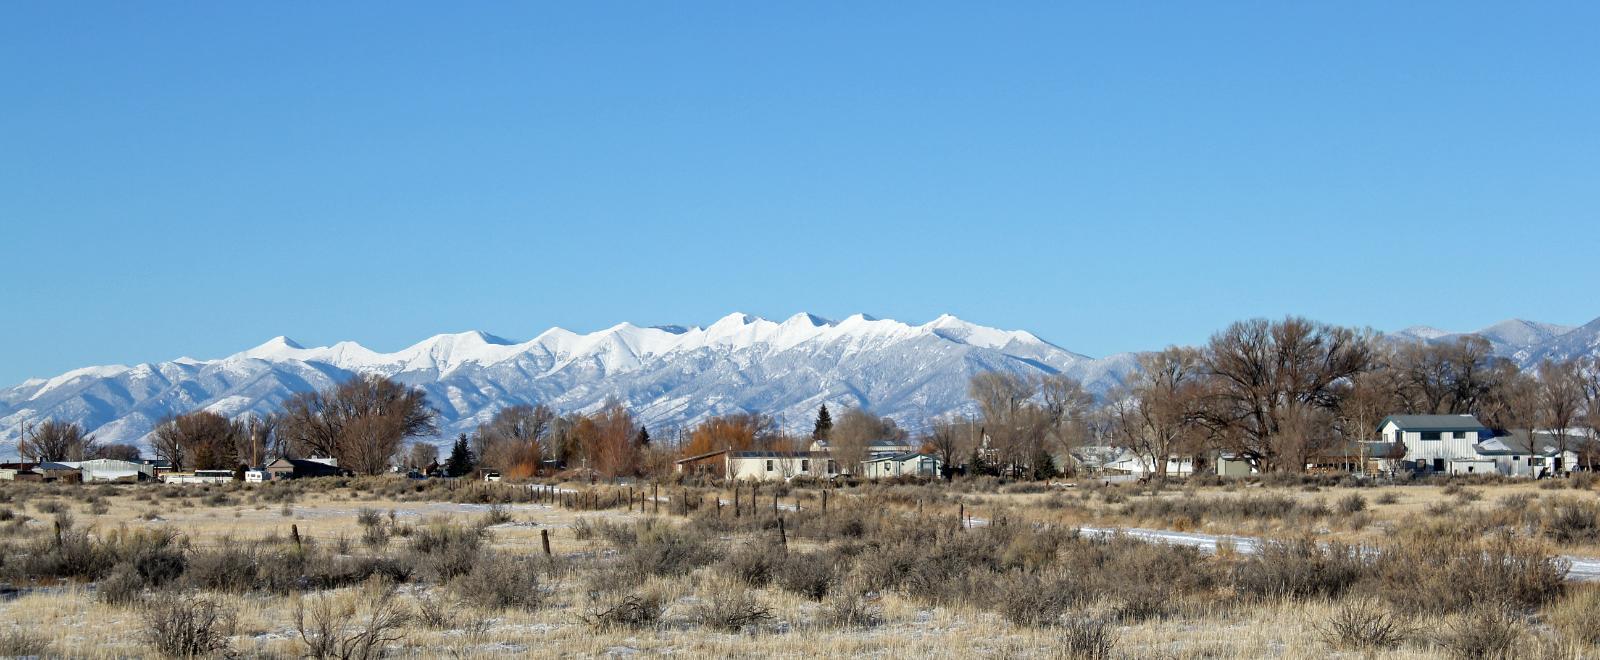
5. Center – 98% Home Price Increase Since May 2010
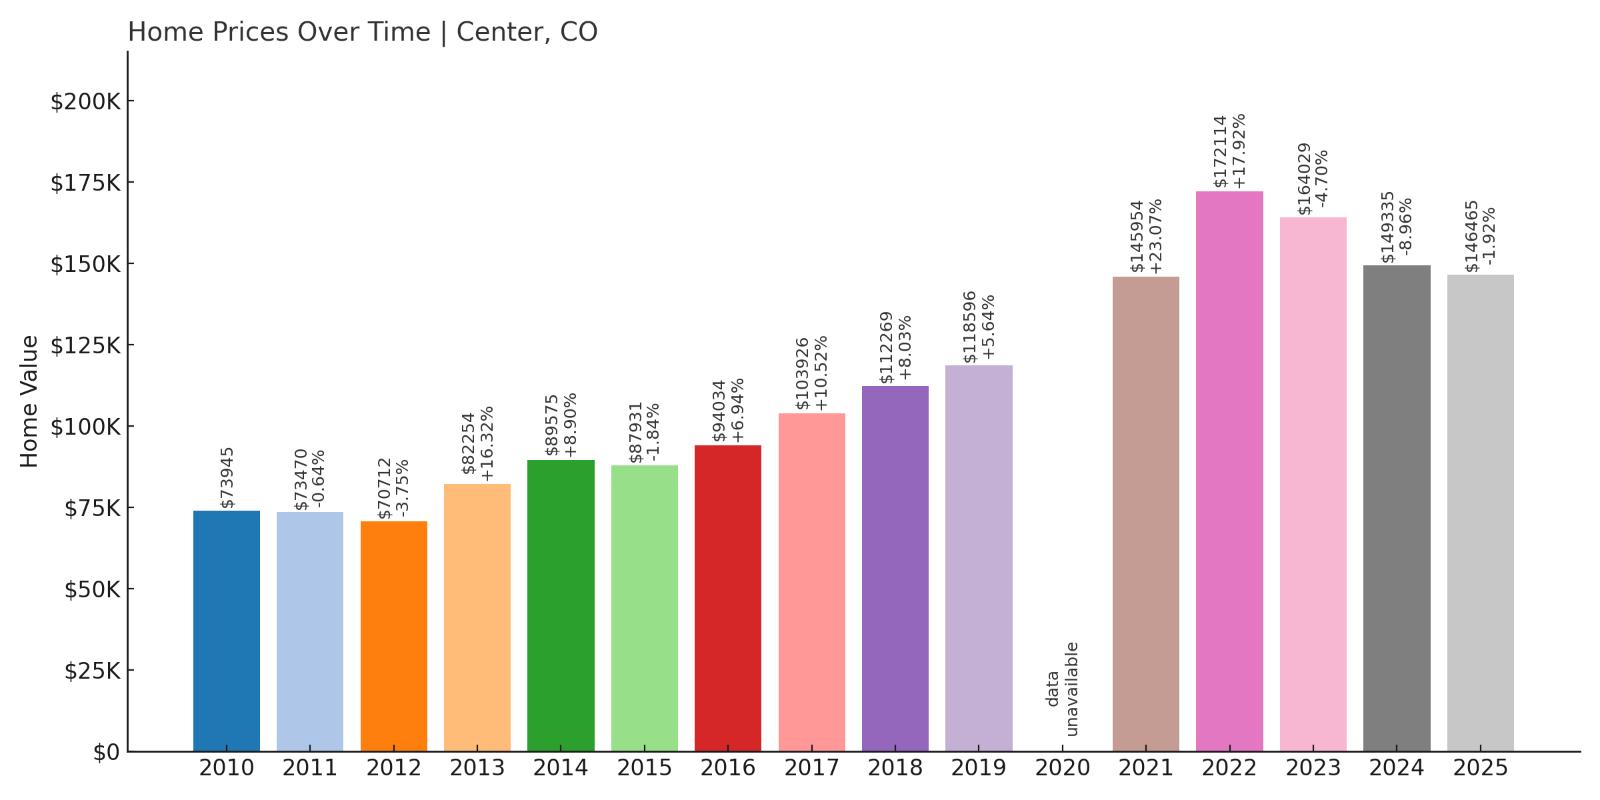
- 2010: $73,945
- 2011: $73,470 (-$475, -0.64% from previous year)
- 2012: $70,712 (-$2,758, -3.75% from previous year)
- 2013: $82,254 (+$11,543, +16.32% from previous year)
- 2014: $89,575 (+$7,321, +8.90% from previous year)
- 2015: $87,931 (-$1,644, -1.84% from previous year)
- 2016: $94,034 (+$6,103, +6.94% from previous year)
- 2017: $103,926 (+$9,892, +10.52% from previous year)
- 2018: $112,269 (+$8,343, +8.03% from previous year)
- 2019: $118,596 (+$6,327, +5.64% from previous year)
- 2020: N/A
- 2021: $145,954 (+$27,358, +23.07% from previous year)
- 2022: $172,114 (+$26,161, +17.92% from previous year)
- 2023: $164,029 (-$8,086, -4.70% from previous year)
- 2024: $149,335 (-$14,693, -8.96% from previous year)
- 2025: $146,465 (-$2,871, -1.92% from previous year)
Home prices in Center have risen by 98% since 2010, with a notable peak in 2022 followed by a gradual decline through 2025. Despite the recent dip, prices remain substantially higher than a decade ago, and the town is still considered highly affordable within Colorado.
Center – Growth Tapering After a Pandemic Boom
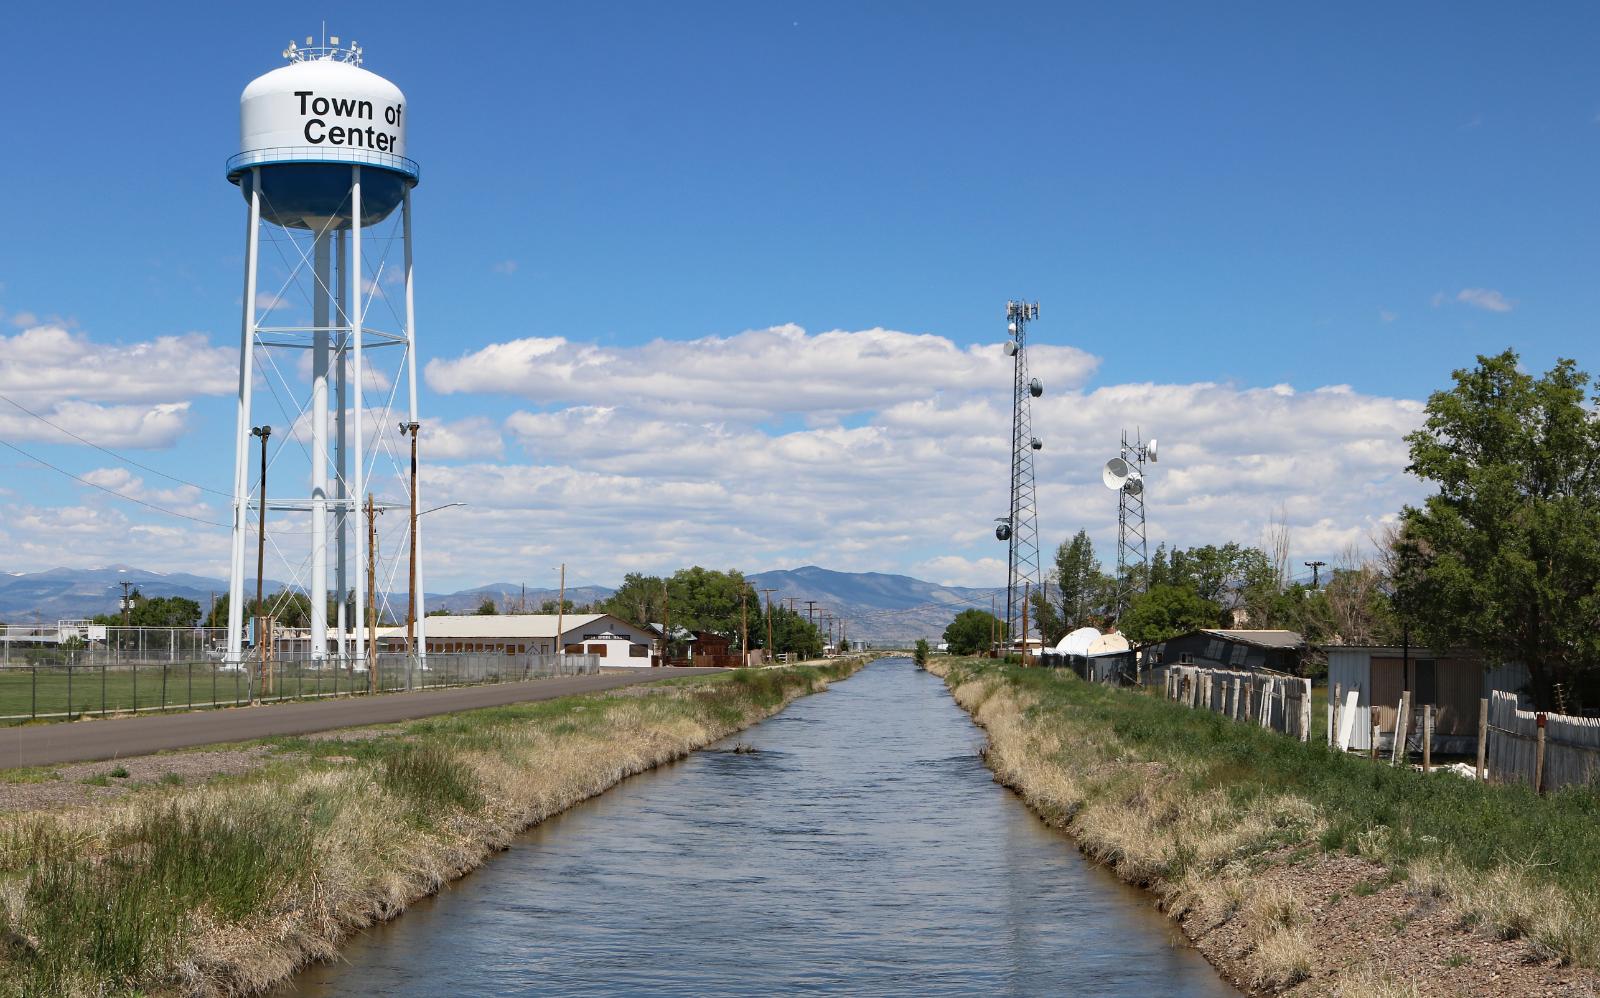
Center is located in the agricultural heartland of the San Luis Valley and spans both Rio Grande and Saguache counties. The town has long relied on farming and food processing, which helped maintain local employment even during economic uncertainty. That stability attracted attention during the pandemic years, pushing prices upward.
Now that the market is cooling, Center’s affordability may again appeal to first-time buyers and workers drawn to its job base. With prices under $150,000, it’s still one of the most accessible real estate markets in southern Colorado.
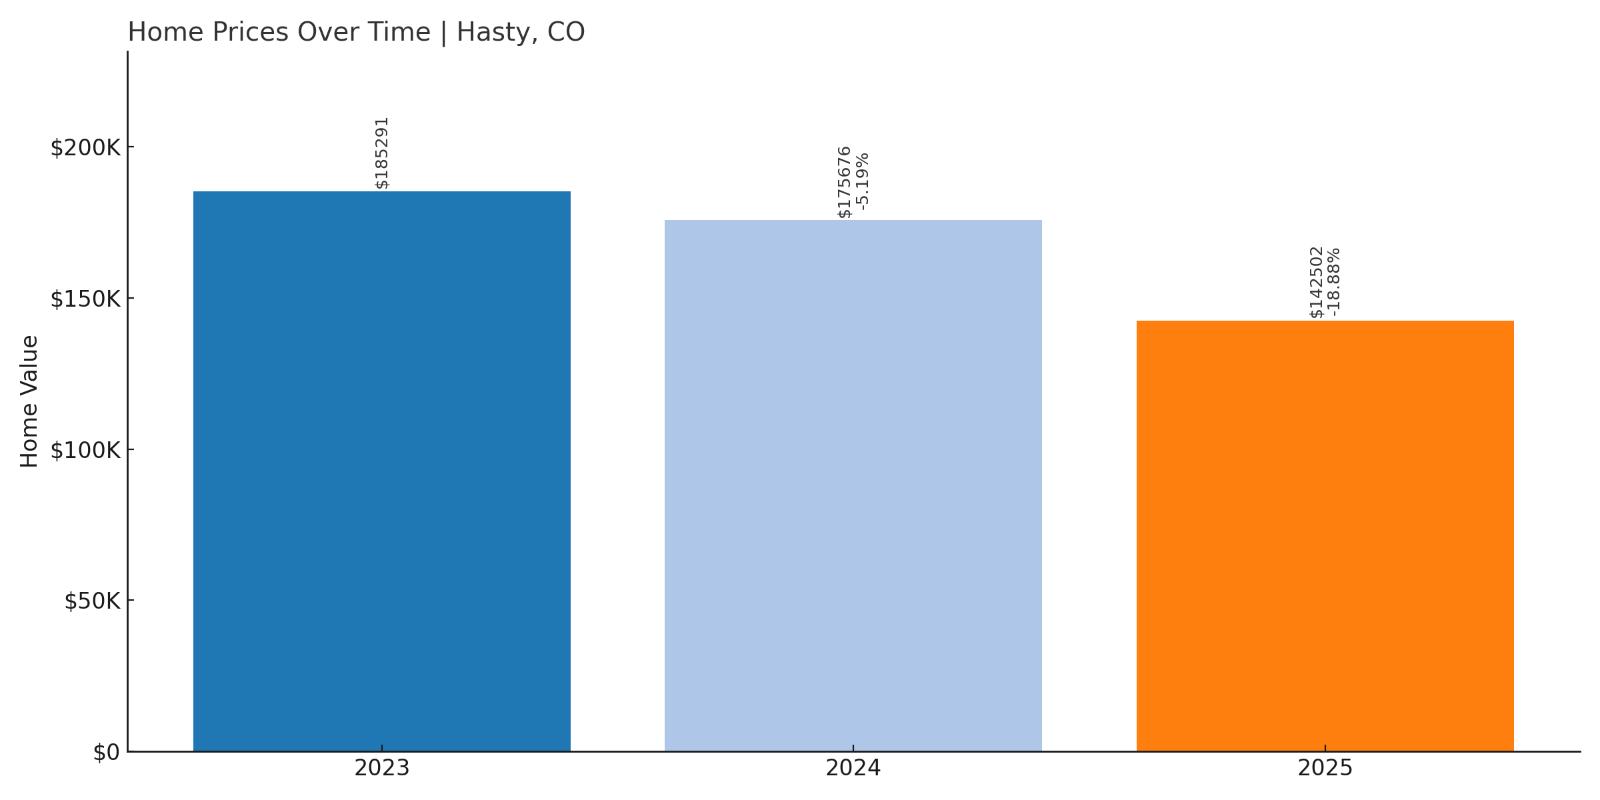
4. Hasty – 23% Home Price Decrease Since May 2023
- 2010: N/A
- 2011: N/A
- 2012: N/A
- 2013: N/A
- 2014: N/A
- 2015: N/A
- 2016: N/A
- 2017: N/A
- 2018: N/A
- 2019: N/A
- 2020: N/A
- 2021: N/A
- 2022: N/A
- 2023: $185,291
- 2024: $175,676 (-$9,615, -5.19% from previous year)
- 2025: $142,502 (-$33,174, -18.88% from previous year)
Hasty stands out as the only town on this list with a sharp decline over the last two years. Prices have dropped by 23% since 2023, with most of that decline occurring in the past year. This could signal a market correction or local shifts in demand.
Hasty – Recent Decline in a Lakeside Community

Hasty is a small community near John Martin Reservoir in Bent County, offering access to outdoor recreation like boating, fishing, and camping. These natural amenities drew buyers during the height of the remote work boom, possibly inflating values temporarily.
Now, as demand cools, Hasty’s sharp price drop may present opportunities for buyers who were previously priced out. Whether this is a short-term dip or a longer correction remains to be seen, but prices have certainly become more attractive again.
3. Sugar City – 114% Home Price Increase Since May 2014
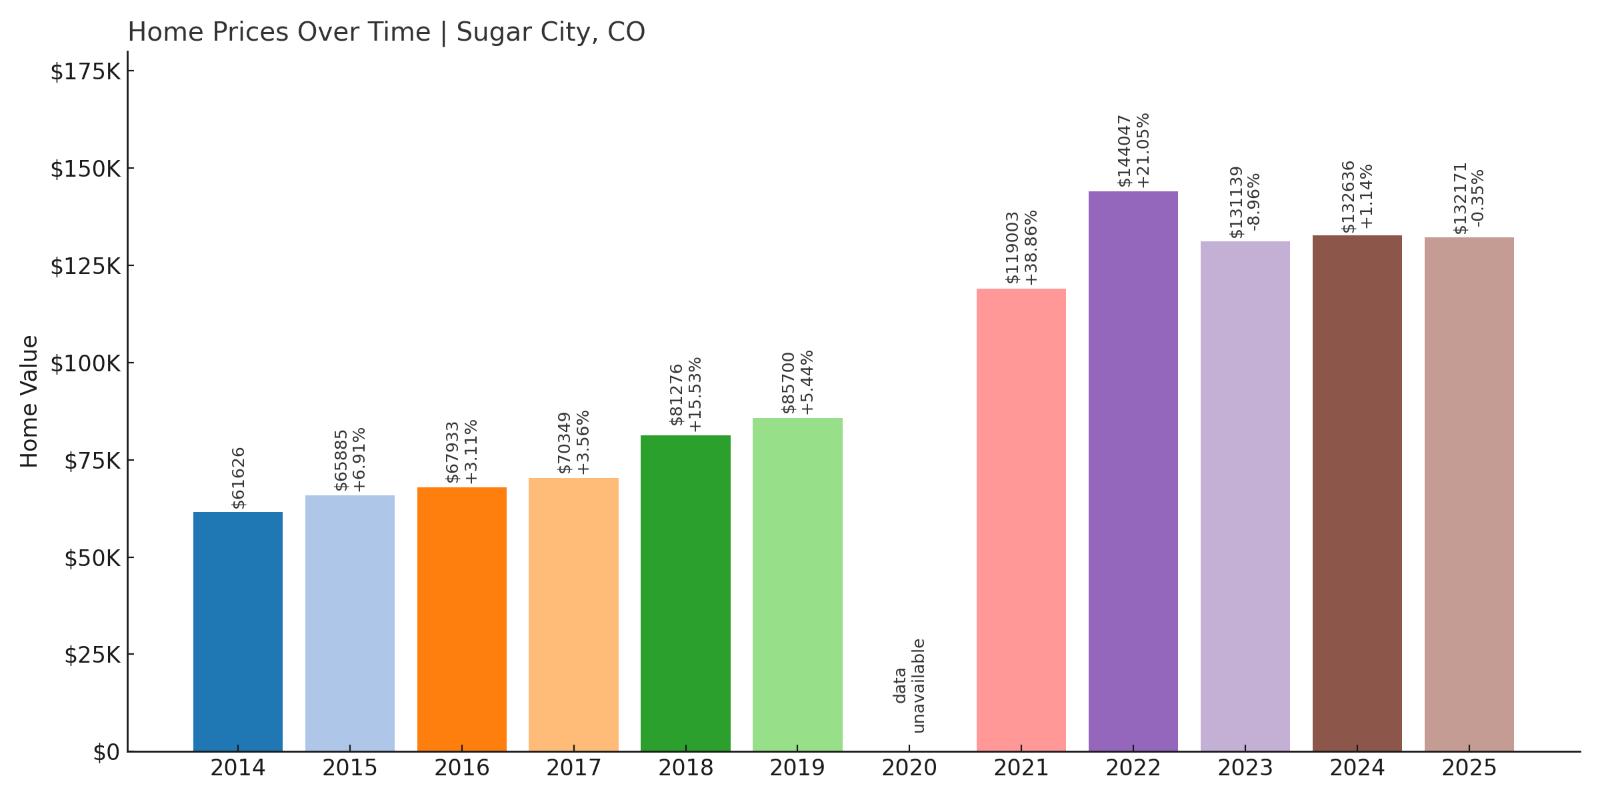
- 2010: N/A
- 2011: N/A
- 2012: N/A
- 2013: N/A
- 2014: $61,626
- 2015: $65,885 (+$4,259, +6.91% from previous year)
- 2016: $67,933 (+$2,048, +3.11% from previous year)
- 2017: $70,349 (+$2,415, +3.56% from previous year)
- 2018: $81,276 (+$10,928, +15.53% from previous year)
- 2019: $85,700 (+$4,424, +5.44% from previous year)
- 2020: N/A
- 2021: $119,003 (+$33,303, +38.86% from previous year)
- 2022: $144,047 (+$25,044, +21.05% from previous year)
- 2023: $131,139 (-$12,908, -8.96% from previous year)
- 2024: $132,636 (+$1,497, +1.14% from previous year)
- 2025: $132,171 (-$466, -0.35% from previous year)
Since 2014, Sugar City’s home prices have risen by 114%. The town experienced a major surge from 2020 to 2022, followed by a decline and stabilization. Home values are still more than double what they were a decade ago, making this a noteworthy case of rural appreciation.
Sugar City – Pandemic-Era Surge Tapers Off
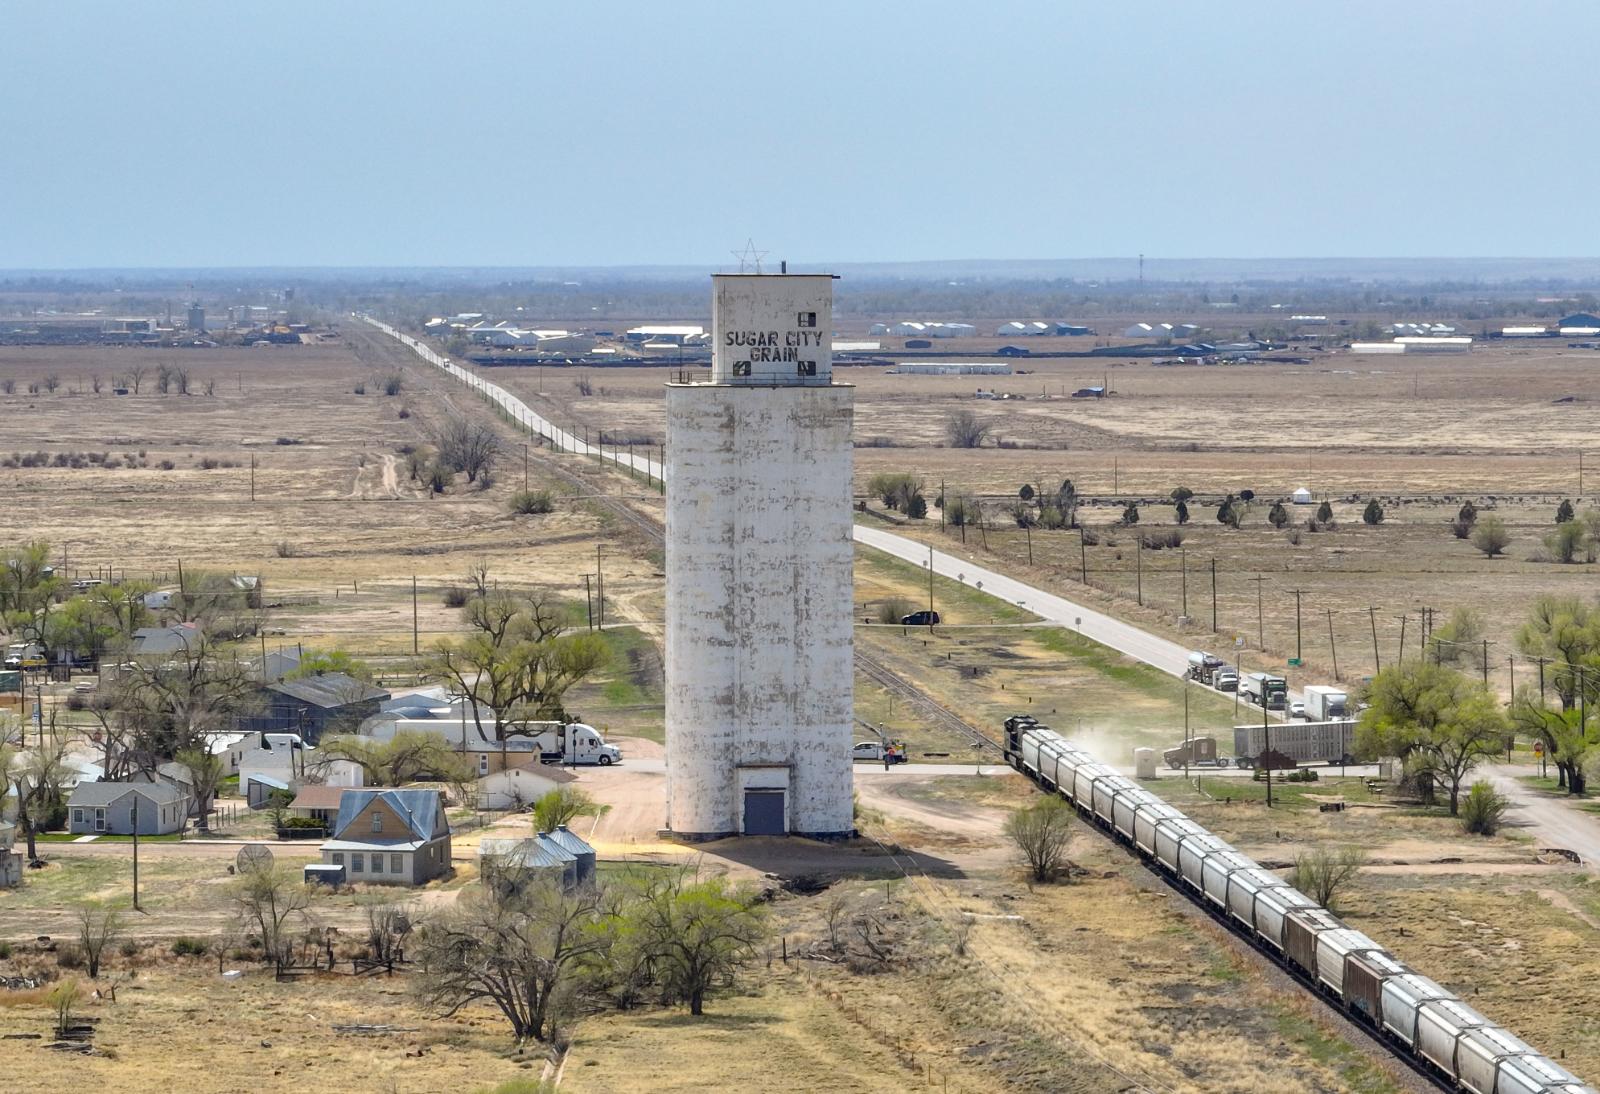
Located in Crowley County, Sugar City was once home to one of Colorado’s major sugar processing plants. While the plant is long gone, the town remains affordable and historically rooted. The spike in prices from 2020 to 2022 likely reflected speculative investment and renewed interest in rural real estate.
In 2023 and 2025, values began to stabilize after initial corrections. Buyers who missed the early rise may find new opportunities now that prices have flattened and the market looks more predictable.
2. Ovid – 53% Home Price Increase Since May 2018

- 2010: N/A
- 2011: N/A
- 2012: N/A
- 2013: N/A
- 2014: N/A
- 2015: N/A
- 2016: N/A
- 2017: N/A
- 2018: $76,880
- 2019: $77,601 (+$721, +0.94% from previous year)
- 2020: N/A
- 2021: $107,996 (+$30,395, +39.17% from previous year)
- 2022: $120,667 (+$12,671, +11.73% from previous year)
- 2023: $117,683 (-$2,983, -2.47% from previous year)
- 2024: $118,527 (+$843, +0.72% from previous year)
- 2025: $117,500 (-$1,026, -0.87% from previous year)
Ovid has seen a 53% increase in home values since 2018. Its price trajectory peaked in 2022, with mild fluctuations in recent years. Despite modest declines, the town remains one of the most affordable in Colorado, with prices under $120,000 in 2025.
Ovid – Flatlining After a Fast Climb
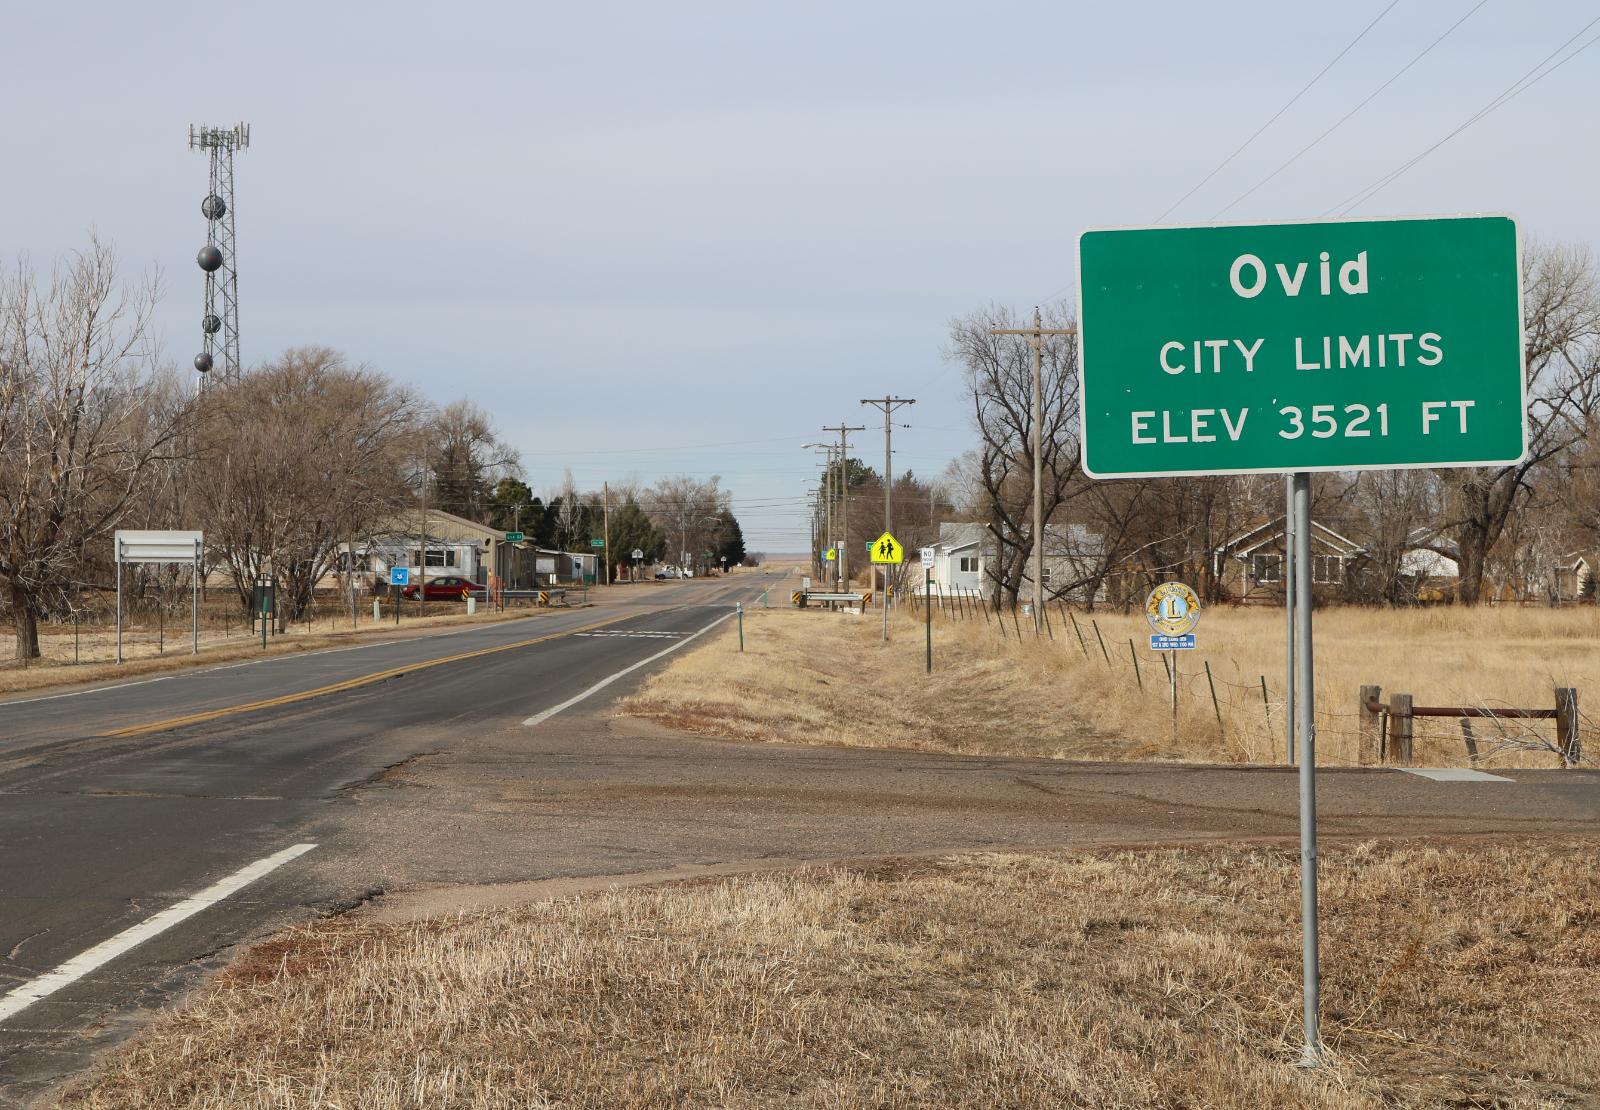
🔥 Would you like to save this?
Ovid is located in Sedgwick County in northeastern Colorado and is one of the smallest communities on this list. Its prices surged in the early 2020s during the rural housing boom, but the market has since stabilized.
The town remains highly affordable, making it an option for buyers seeking a quiet lifestyle without the premium of more well-known areas. With prices holding steady, Ovid offers predictability in a shifting market.
1. Las Animas – 141% Home Price Increase Since May 2010
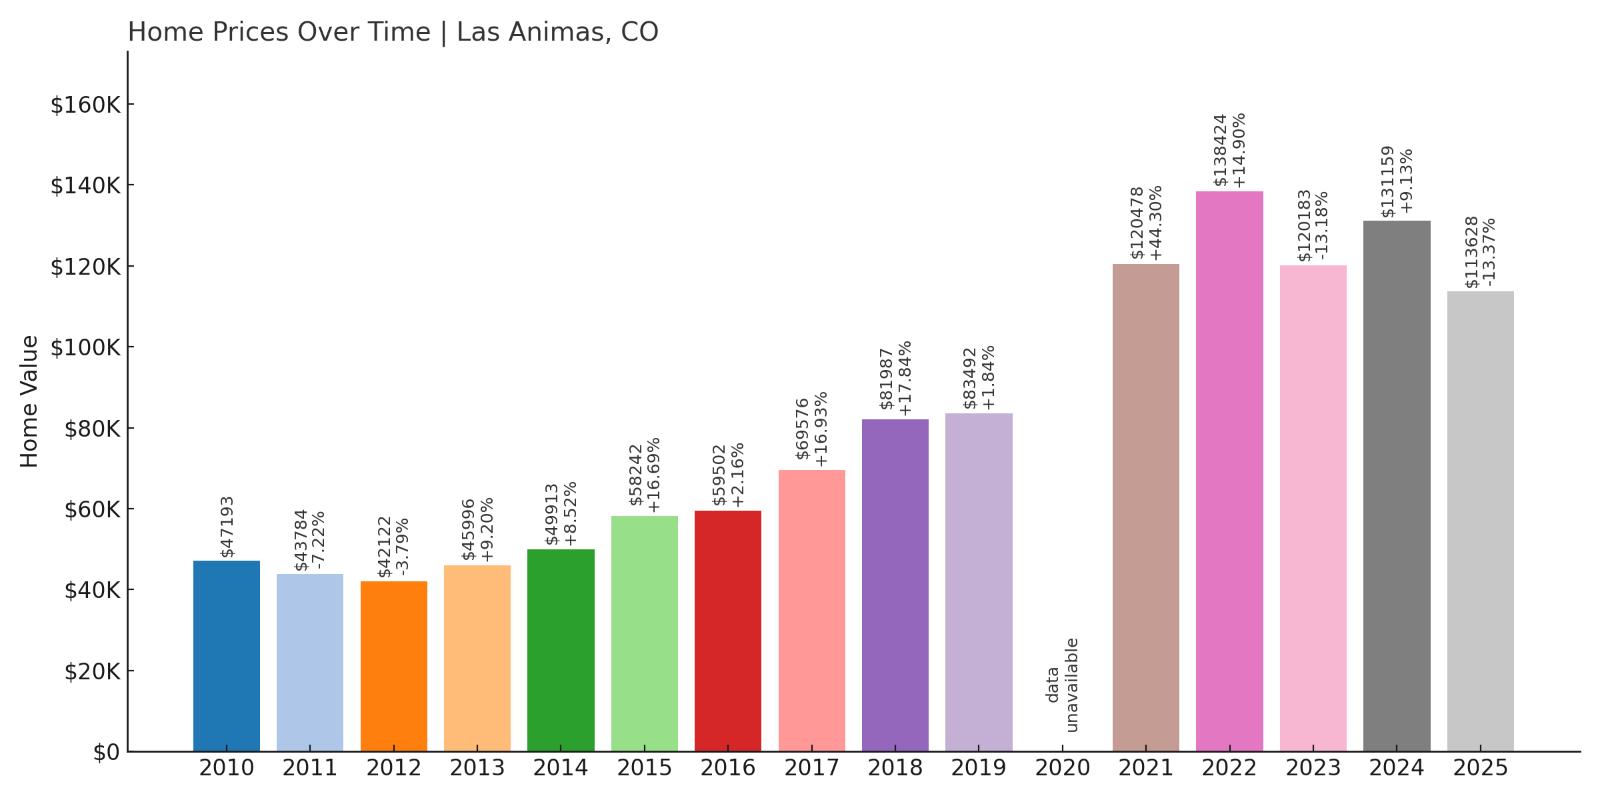
- 2010: $47,193
- 2011: $43,784 (-$3,409, -7.22% from previous year)
- 2012: $42,122 (-$1,661, -3.79% from previous year)
- 2013: $45,996 (+$3,874, +9.20% from previous year)
- 2014: $49,913 (+$3,917, +8.52% from previous year)
- 2015: $58,242 (+$8,329, +16.69% from previous year)
- 2016: $59,502 (+$1,260, +2.16% from previous year)
- 2017: $69,576 (+$10,074, +16.93% from previous year)
- 2018: $81,987 (+$12,411, +17.84% from previous year)
- 2019: $83,492 (+$1,505, +1.84% from previous year)
- 2020: N/A
- 2021: $120,478 (+$36,986, +44.30% from previous year)
- 2022: $138,424 (+$17,946, +14.90% from previous year)
- 2023: $120,183 (-$18,240, -13.18% from previous year)
- 2024: $131,159 (+$10,976, +9.13% from previous year)
- 2025: $113,628 (-$17,531, -13.37% from previous year)
Las Animas has seen a 141% increase in home prices since 2010, but 2025 marks its second year of decline. After peaking in 2022, values have dropped by nearly $25,000, suggesting a market in correction—but prices are still significantly above their long-term average.
Las Animas – Big Swings in Bent County

Las Animas, the seat of Bent County, is a historic town along the Arkansas River. It offers one of the lowest cost-of-living indexes in Colorado and has long been a bargain for budget-minded homebuyers. Like many rural towns, it saw prices climb during the early 2020s due to heightened demand.
Recent declines may reflect the return of market equilibrium. But with prices still over double what they were in 2010, Las Animas remains a case study in how rural affordability has evolved post-pandemic.