Would you like to save this?
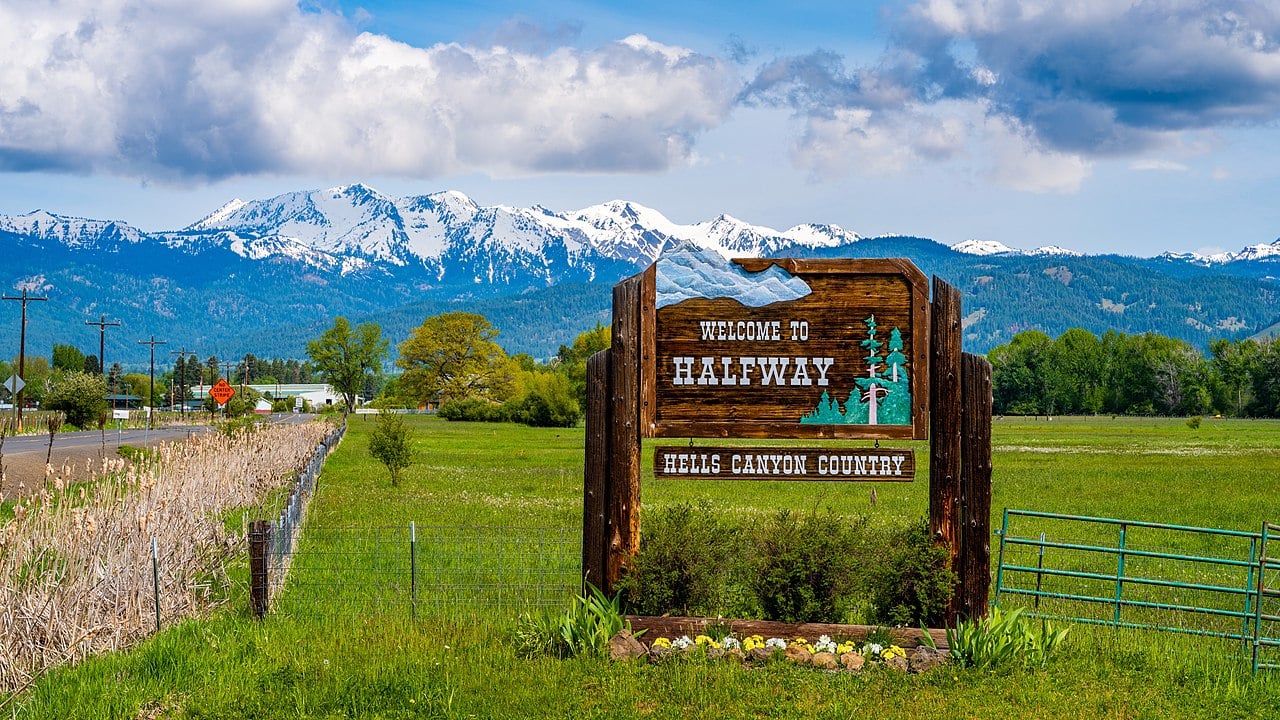
Data from the Zillow Home Value Index shows just how far home prices have climbed in Oregon’s most in-demand towns. While big cities still draw plenty of attention, it’s often the smaller, well-positioned communities—those near trails, coastlines, or top-rated schools—that now top the state’s real estate charts. These 19 places have seen steady price growth since 2010, with some taking off dramatically during the pandemic boom.
19. Mount Hood Parkdale – 122% Home Price Increase Since 2010
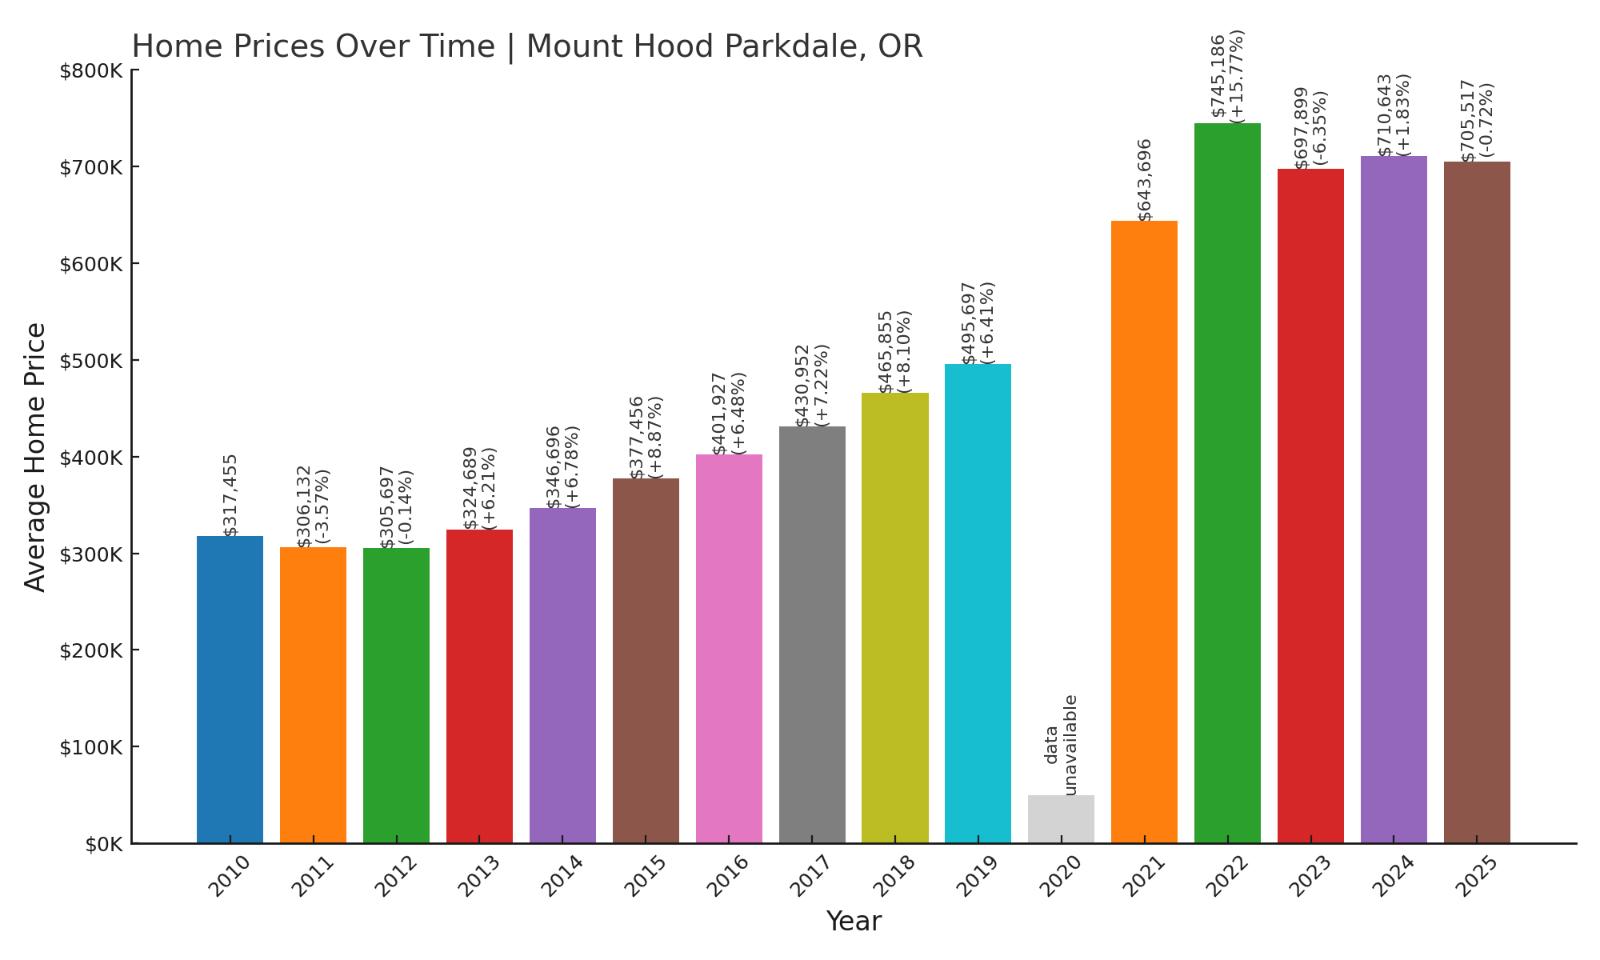
- 2010: $317,455
- 2011: $306,132 (-$11,323, -3.57% from previous year)
- 2012: $305,697 (-$435, -0.14% from previous year)
- 2013: $324,689 (+$18,992, +6.21% from previous year)
- 2014: $346,696 (+$22,007, +6.78% from previous year)
- 2015: $377,456 (+$30,760, +8.87% from previous year)
- 2016: $401,927 (+$24,471, +6.48% from previous year)
- 2017: $430,952 (+$29,025, +7.22% from previous year)
- 2018: $465,855 (+$34,903, +8.10% from previous year)
- 2019: $495,697 (+$29,842, +6.41% from previous year)
- 2020: N/A
- 2021: $643,696
- 2022: $745,186 (+$101,490, +15.76% from previous year)
- 2023: $697,899 (-$47,287, -6.35% from previous year)
- 2024: $710,643 (+$12,744, +1.83% from previous year)
- 2025: $705,517 (-$5,126, -0.72% from previous year)
Mount Hood Parkdale’s home prices have more than doubled since 2010, reflecting growing demand for scenic living outside urban centers. Despite some market cooling after 2022, the overall trend points to steady long-term appreciation in this picturesque part of Oregon.
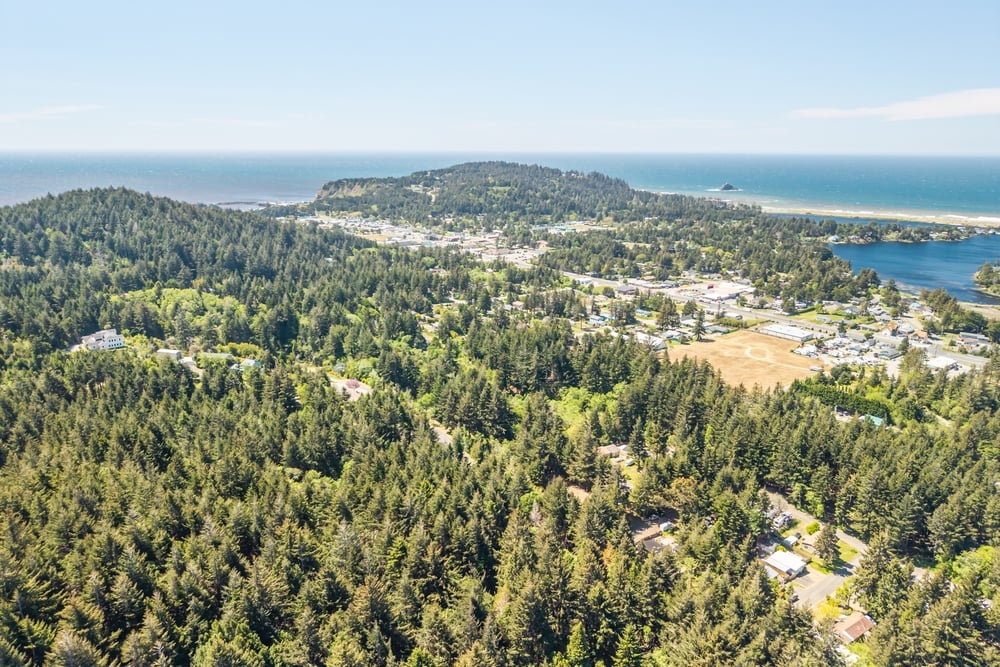
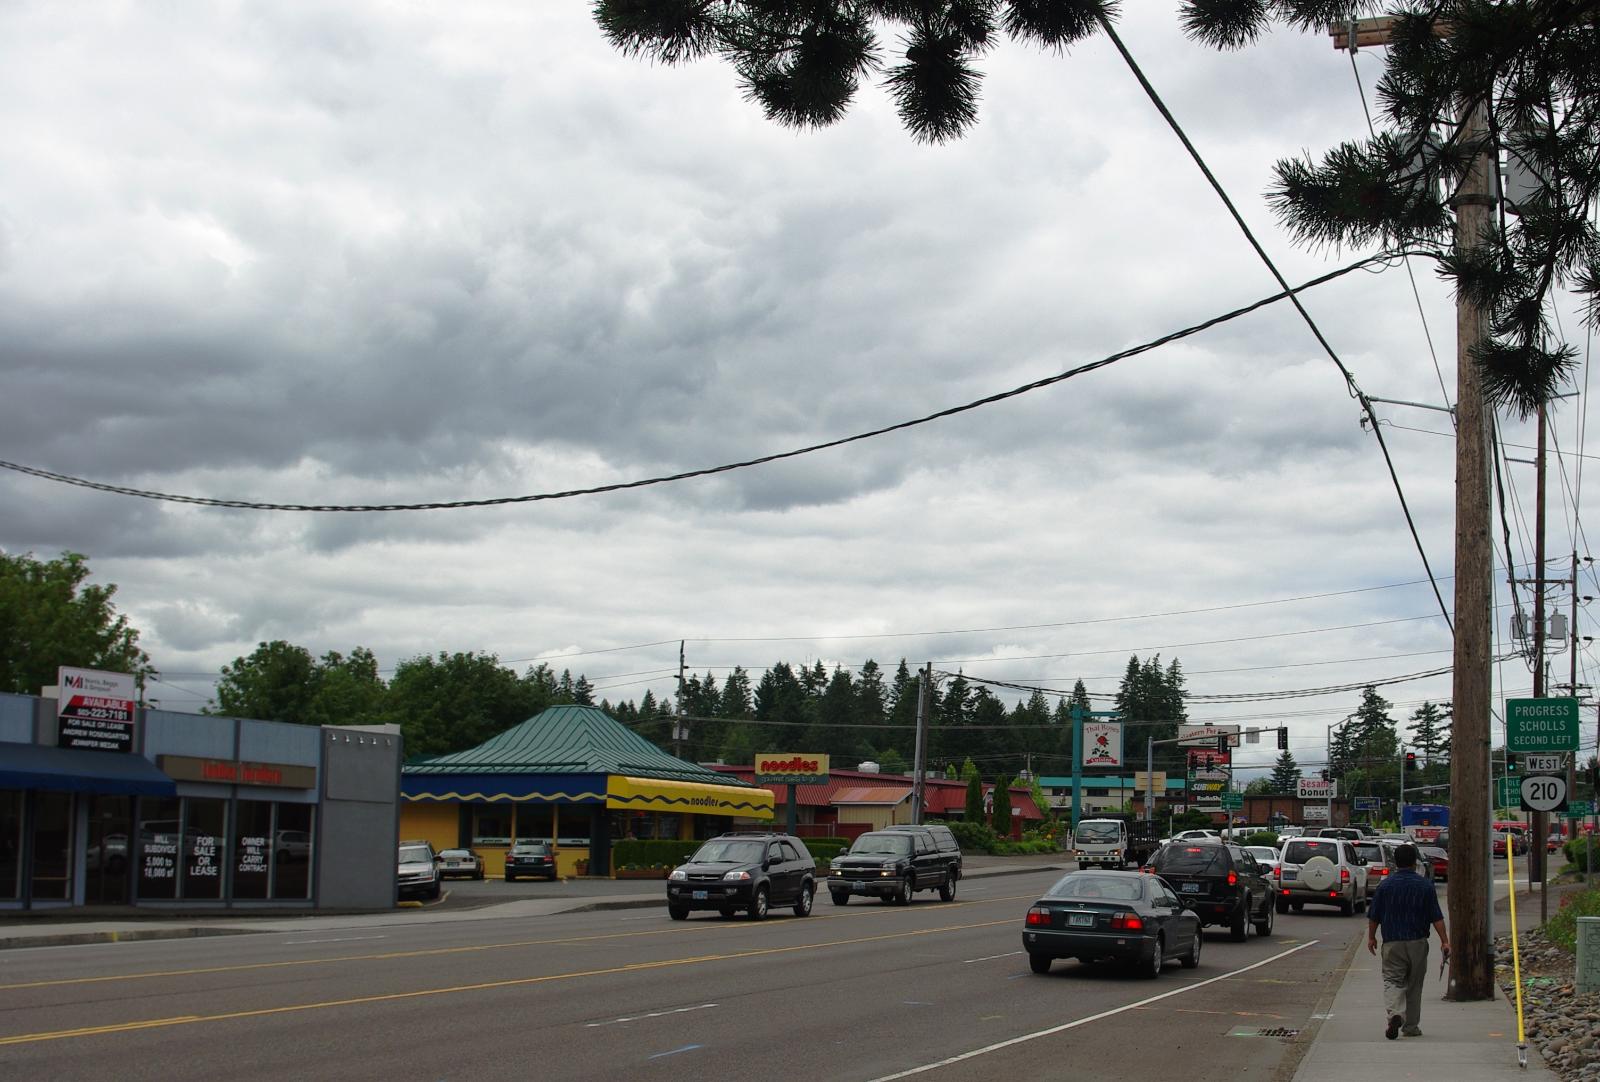
Mount Hood Parkdale – Scenic Living in the Shadow of a Volcano
Mount Hood Parkdale sits in northern Oregon, surrounded by forested slopes, mountain trails, and agricultural land. It’s popular with those looking for a rural lifestyle that doesn’t sacrifice natural beauty. Many residents are drawn by the proximity to Mount Hood, a year-round playground for skiing, hiking, and photography.
With a 2025 median home price over $700,000, the town reflects lifestyle-driven demand. Buyers here are often second-home owners, retirees, or professionals who can work remotely. While 2023 brought a dip in prices, the long-term trend remains upward, with mild adjustments through 2024 and 2025.
18. Happy Valley – 105% Home Price Increase Since 2010
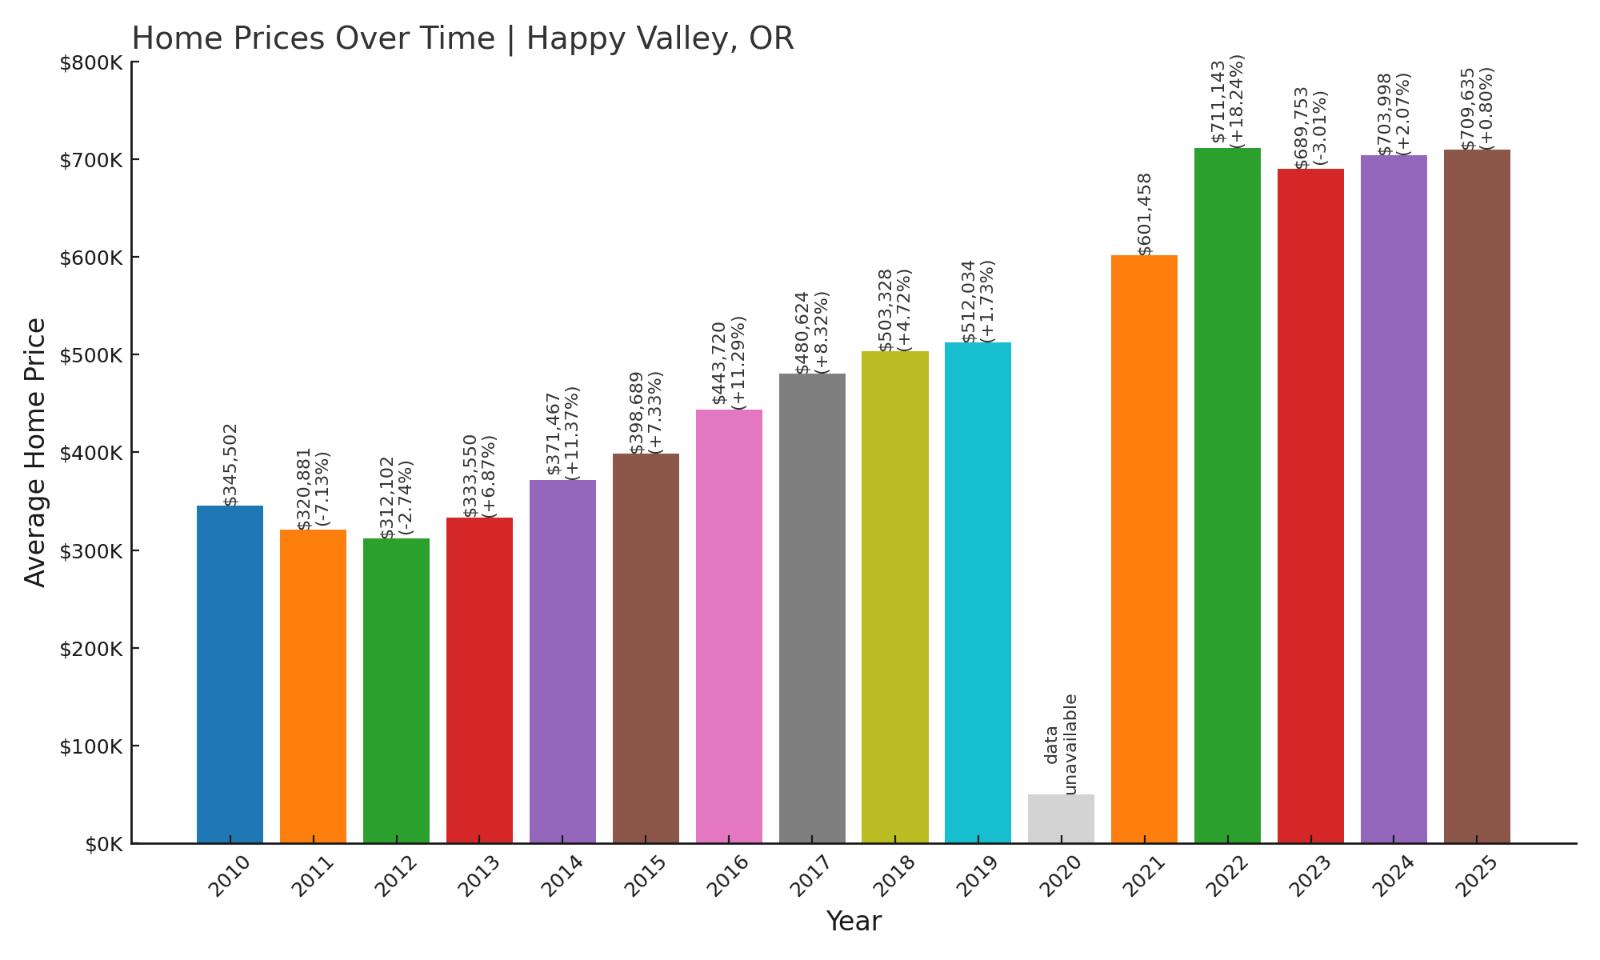
- 2010: $345,502
- 2011: $320,881 (-$24,621, -7.13% from previous year)
- 2012: $312,102 (-$8,779, -2.74% from previous year)
- 2013: $333,550 (+$21,448, +6.87% from previous year)
- 2014: $371,467 (+$37,917, +11.37% from previous year)
- 2015: $398,689 (+$27,222, +7.33% from previous year)
- 2016: $443,720 (+$45,031, +11.29% from previous year)
- 2017: $480,624 (+$36,904, +8.32% from previous year)
- 2018: $503,328 (+$22,704, +4.72% from previous year)
- 2019: $512,034 (+$8,706, +1.73% from previous year)
- 2020: N/A
- 2021: $601,458
- 2022: $711,143 (+$109,685, +18.24% from previous year)
- 2023: $689,753 (-$21,390, -3.01% from previous year)
- 2024: $703,998 (+$14,245, +2.07% from previous year)
- 2025: $709,635 (+$5,637, +0.80% from previous year)
Happy Valley’s home prices have surged since 2010, driven by suburban expansion and strong demand for family-friendly housing near Portland. Even with some recent plateaus, values remain well above pre-pandemic levels, showing the lasting pull of this fast-growing suburb.
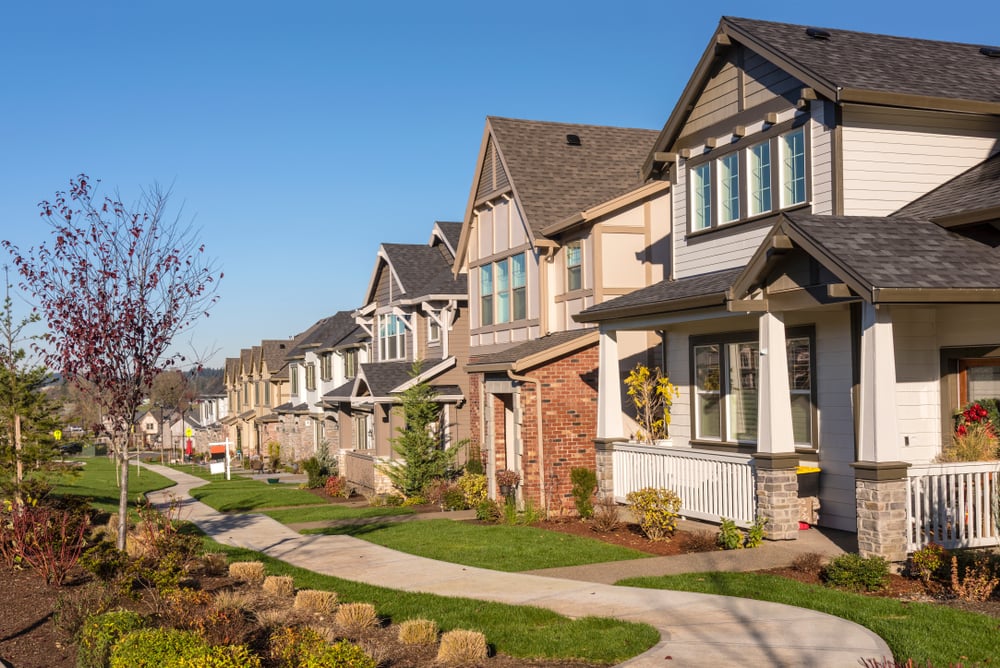
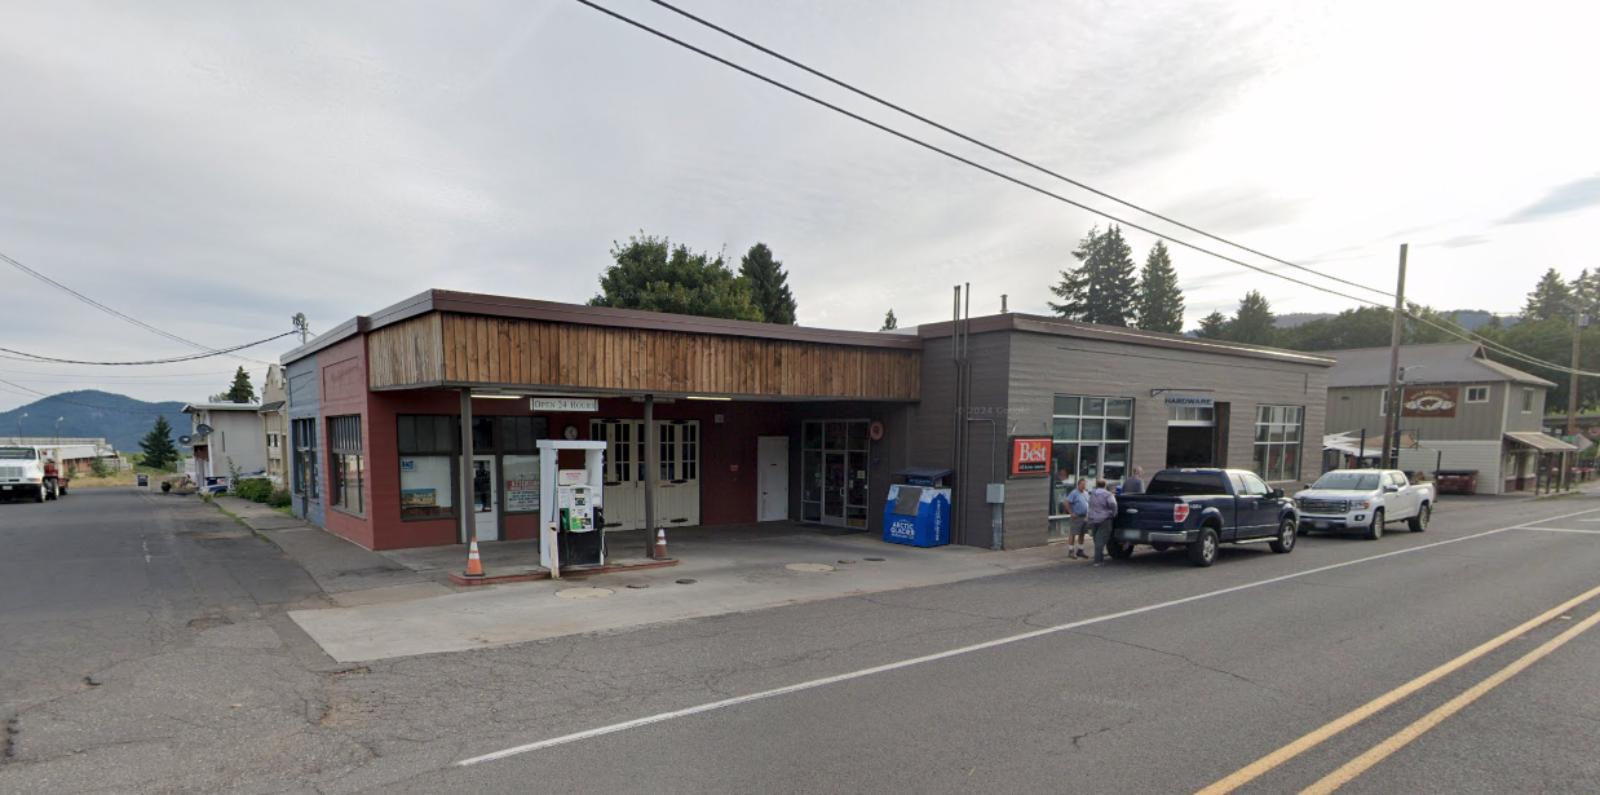
Happy Valley – Suburban Comfort with City Proximity
Were You Meant
to Live In?
Happy Valley is located just southeast of Portland, offering a blend of upscale neighborhoods, modern amenities, and access to top-rated schools. Its rapid growth over the last decade has included new housing developments, shopping centers, and infrastructure upgrades.
The market here reflects both convenience and quality of life. Families and professionals looking to escape urban congestion without sacrificing access to city jobs have fueled the boom. As of 2025, the median home value hovers around $710,000, solidifying its status as one of Oregon’s most expensive housing markets.
17. Mulino – 118% Home Price Increase Since 2010
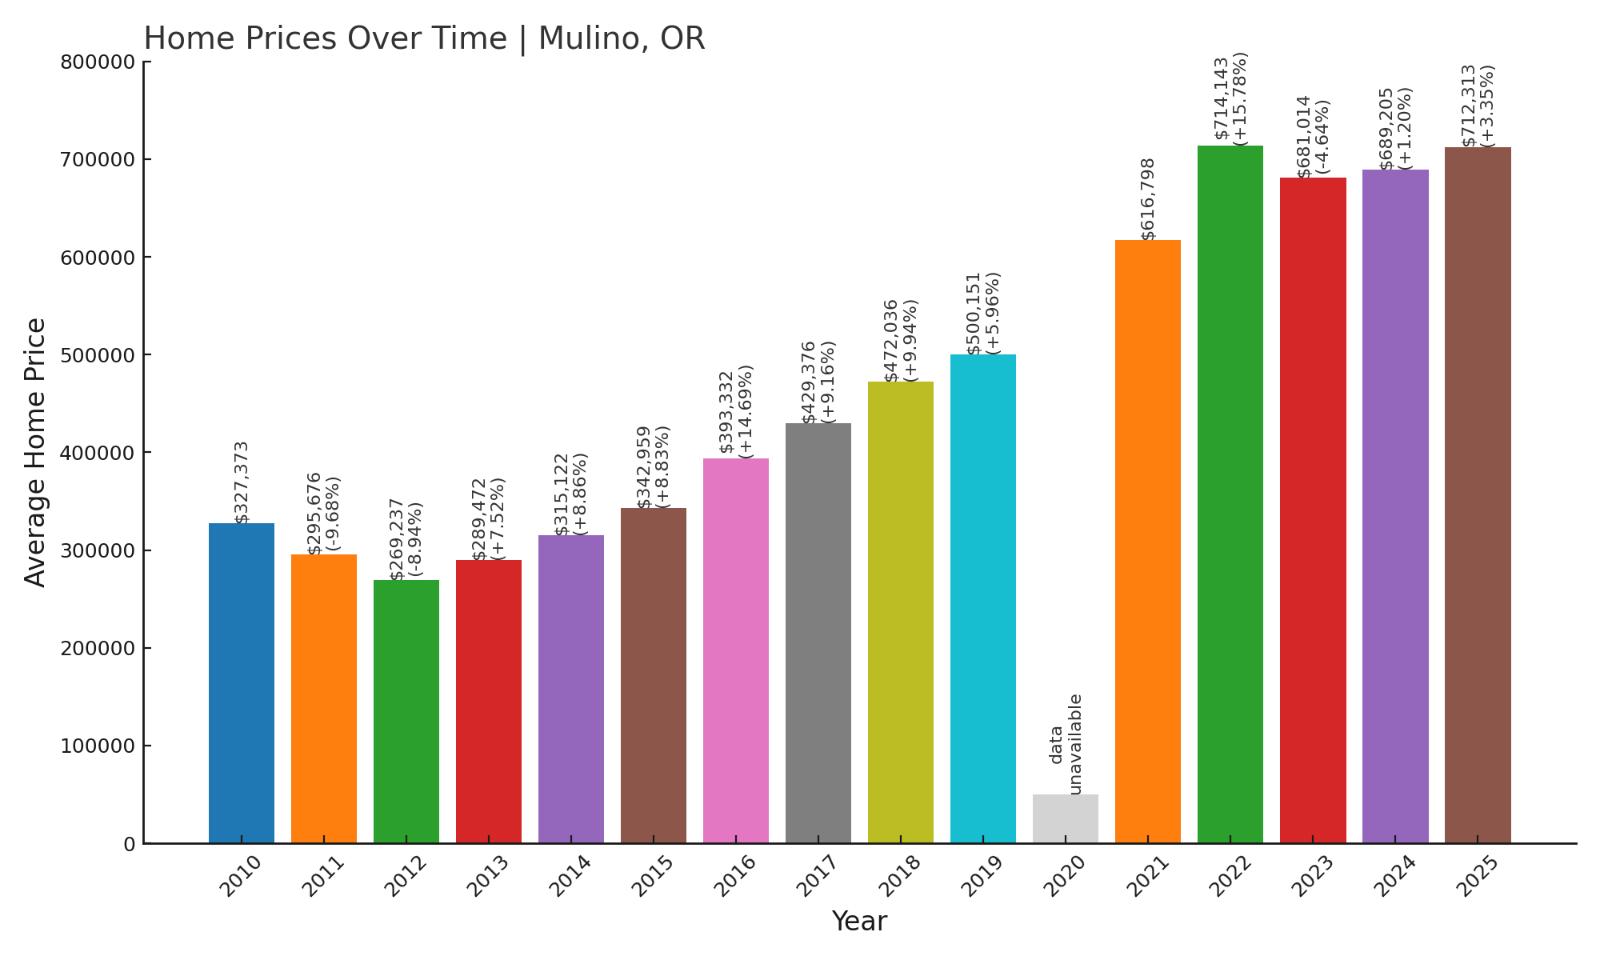
- 2010: $327,373
- 2011: $295,676 (-$31,697, -9.68% from previous year)
- 2012: $269,237 (-$26,439, -8.94% from previous year)
- 2013: $289,472 (+$20,235, +7.52% from previous year)
- 2014: $315,122 (+$25,650, +8.86% from previous year)
- 2015: $342,959 (+$27,837, +8.83% from previous year)
- 2016: $393,332 (+$50,373, +14.69% from previous year)
- 2017: $429,376 (+$36,044, +9.16% from previous year)
- 2018: $472,036 (+$42,660, +9.94% from previous year)
- 2019: $500,151 (+$28,115, +5.96% from previous year)
- 2020: N/A
- 2021: $616,798
- 2022: $714,143 (+$97,345, +15.78% from previous year)
- 2023: $681,014 (-$33,129, -4.64% from previous year)
- 2024: $689,205 (+$8,191, +1.20% from previous year)
- 2025: $712,313 (+$23,108, +3.35% from previous year)
Mulino’s housing market has posted a 118% increase since 2010, despite some early dips and a brief pause in 2023. Its rural charm paired with proximity to Portland continues to attract buyers looking for space and privacy without giving up access to services.
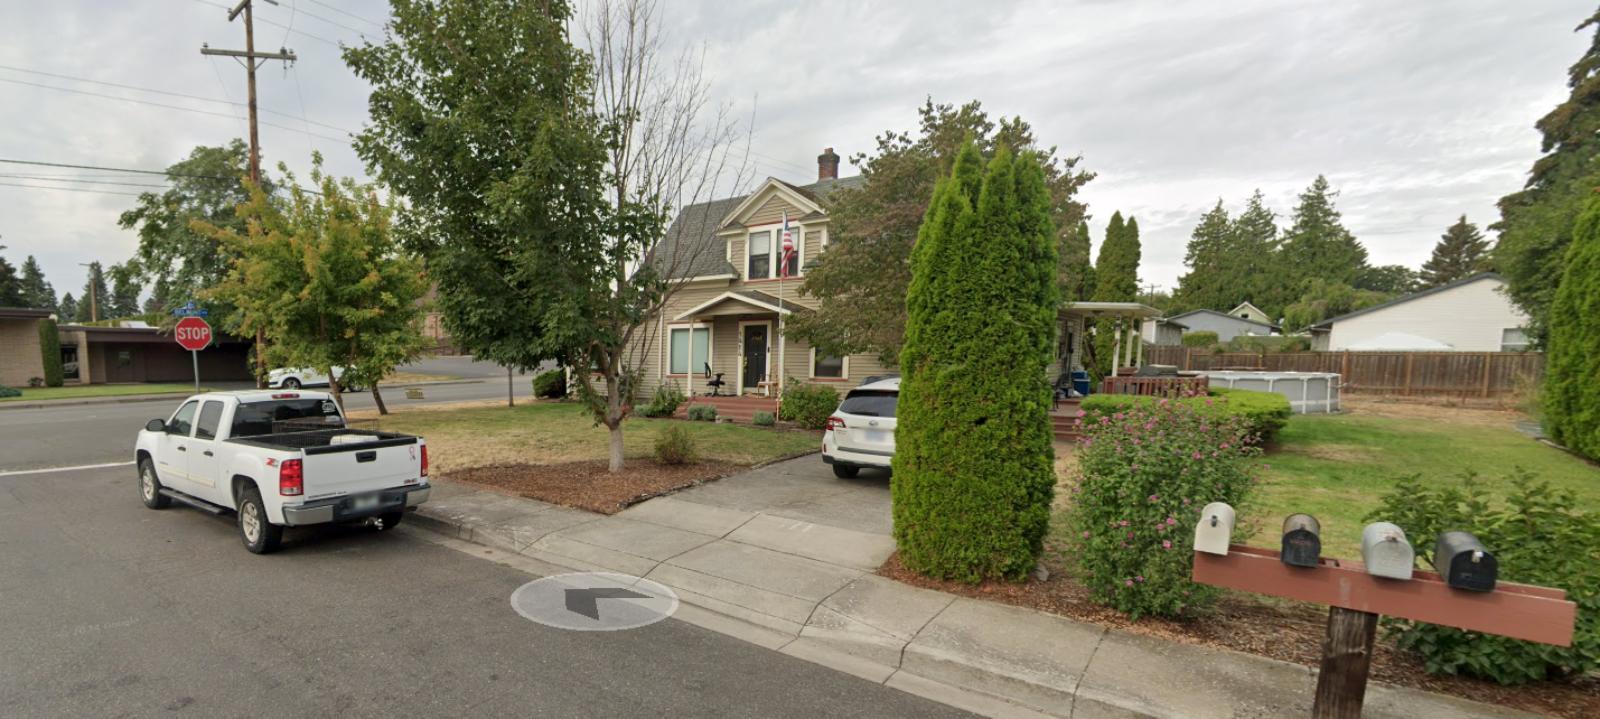
Mulino – Rural Peace Just Outside the City

Mulino is a small, unincorporated community in Clackamas County, located between Oregon City and Molalla. Known for farms, forests, and large lots, it’s a prime choice for buyers who want elbow room. While it’s quiet and undeveloped compared to suburbs, major roads keep it connected to the Portland metro area.
The rise in home values reflects growing interest in semi-rural properties, especially during and after the pandemic. In 2025, the average home price exceeds $700,000, a sharp contrast to where the market stood just over a decade ago.
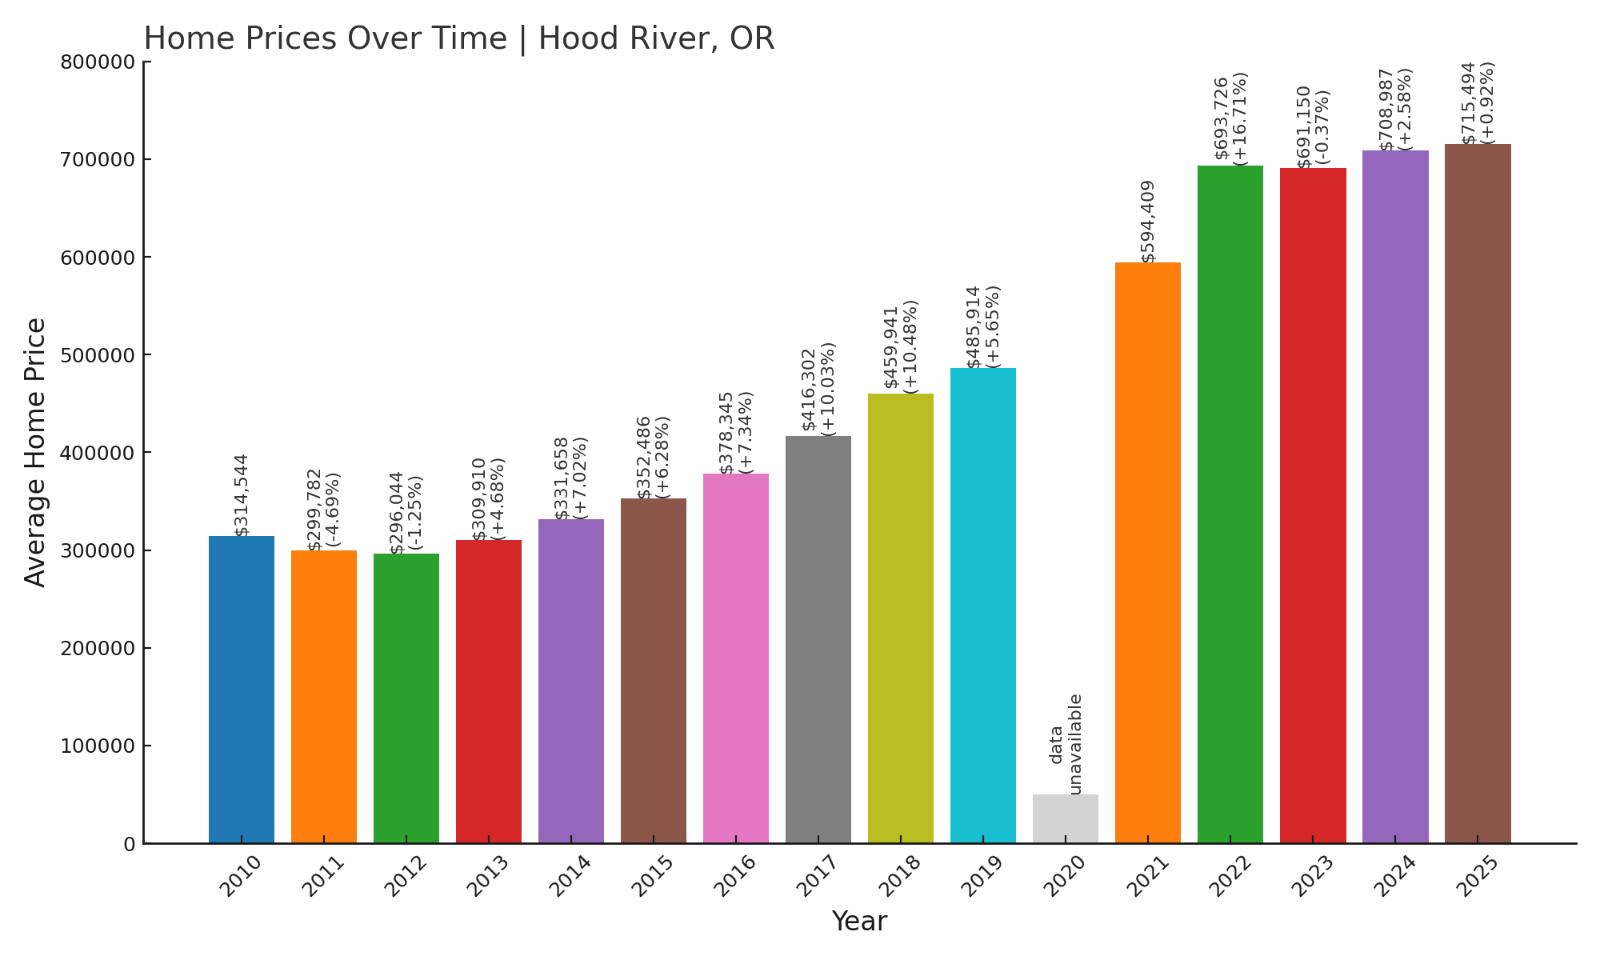
16. Hood River – 127% Home Price Increase Since 2010
Home Stratosphere Guide
Your Personality Already Knows
How Your Home Should Feel
113 pages of room-by-room design guidance built around your actual brain, your actual habits, and the way you actually live.
You might be an ISFJ or INFP designer…
You design through feeling — your spaces are personal, comforting, and full of meaning. The guide covers your exact color palettes, room layouts, and the one mistake your type always makes.
The full guide maps all 16 types to specific rooms, palettes & furniture picks ↓
You might be an ISTJ or INTJ designer…
You crave order, function, and visual calm. The guide shows you how to create spaces that feel both serene and intentional — without ending up sterile.
The full guide maps all 16 types to specific rooms, palettes & furniture picks ↓
You might be an ENFP or ESTP designer…
You design by instinct and energy. Your home should feel alive. The guide shows you how to channel that into rooms that feel curated, not chaotic.
The full guide maps all 16 types to specific rooms, palettes & furniture picks ↓
You might be an ENTJ or ESTJ designer…
You value quality, structure, and things done right. The guide gives you the framework to build rooms that feel polished without overthinking every detail.
The full guide maps all 16 types to specific rooms, palettes & furniture picks ↓
- 2010: $314,544
- 2011: $299,782 (-$14,762, -4.69% from previous year)
- 2012: $296,044 (-$3,738, -1.25% from previous year)
- 2013: $309,910 (+$13,866, +4.68% from previous year)
- 2014: $331,658 (+$21,748, +7.02% from previous year)
- 2015: $352,486 (+$20,828, +6.28% from previous year)
- 2016: $378,345 (+$25,859, +7.33% from previous year)
- 2017: $416,302 (+$37,957, +10.03% from previous year)
- 2018: $459,941 (+$43,639, +10.48% from previous year)
- 2019: $485,914 (+$25,973, +5.65% from previous year)
- 2020: N/A
- 2021: $594,409
- 2022: $693,726 (+$99,317, +16.71% from previous year)
- 2023: $691,150 (-$2,576, -0.37% from previous year)
- 2024: $708,987 (+$17,837, +2.58% from previous year)
- 2025: $715,494 (+$6,507, +0.92% from previous year)
Since 2010, Hood River has seen a 127% rise in home values, with steady growth nearly every year. Even the mild softening in 2023 didn’t hold back the long-term trend. As of 2025, average home values are comfortably above $700,000.
Hood River – Where Adventure Meets Affordability No More
Hood River is perched along the Columbia River Gorge and has long been known for windsurfing, mountain biking, breweries, and small-town charm. What was once a budget-friendly escape has transformed into a premium real estate market driven by lifestyle appeal and limited inventory.
The town’s popularity among both Portland transplants and out-of-state buyers has kept demand high. Its location, sandwiched between river and mountain, means housing is limited—helping to push values up year after year.
15. Camp Sherman – 31% Home Price Increase Since 2021

- 2010: N/A
- 2011: N/A
- 2012: N/A
- 2013: N/A
- 2014: N/A
- 2015: N/A
- 2016: N/A
- 2017: N/A
- 2018: N/A
- 2019: N/A
- 2020: N/A
- 2021: $552,291
- 2022: $659,109 (+$106,818, +19.35% from previous year)
- 2023: $659,535 (+$426, +0.06% from previous year)
- 2024: $731,302 (+$71,767, +10.88% from previous year)
- 2025: $724,806 (-$6,496, -0.89% from previous year)
Camp Sherman’s prices have increased by 31% since 2021, though earlier data is unavailable. This small, quiet town has grown in popularity with buyers seeking forested retreats and riverside cabins—especially in the wake of remote work trends.
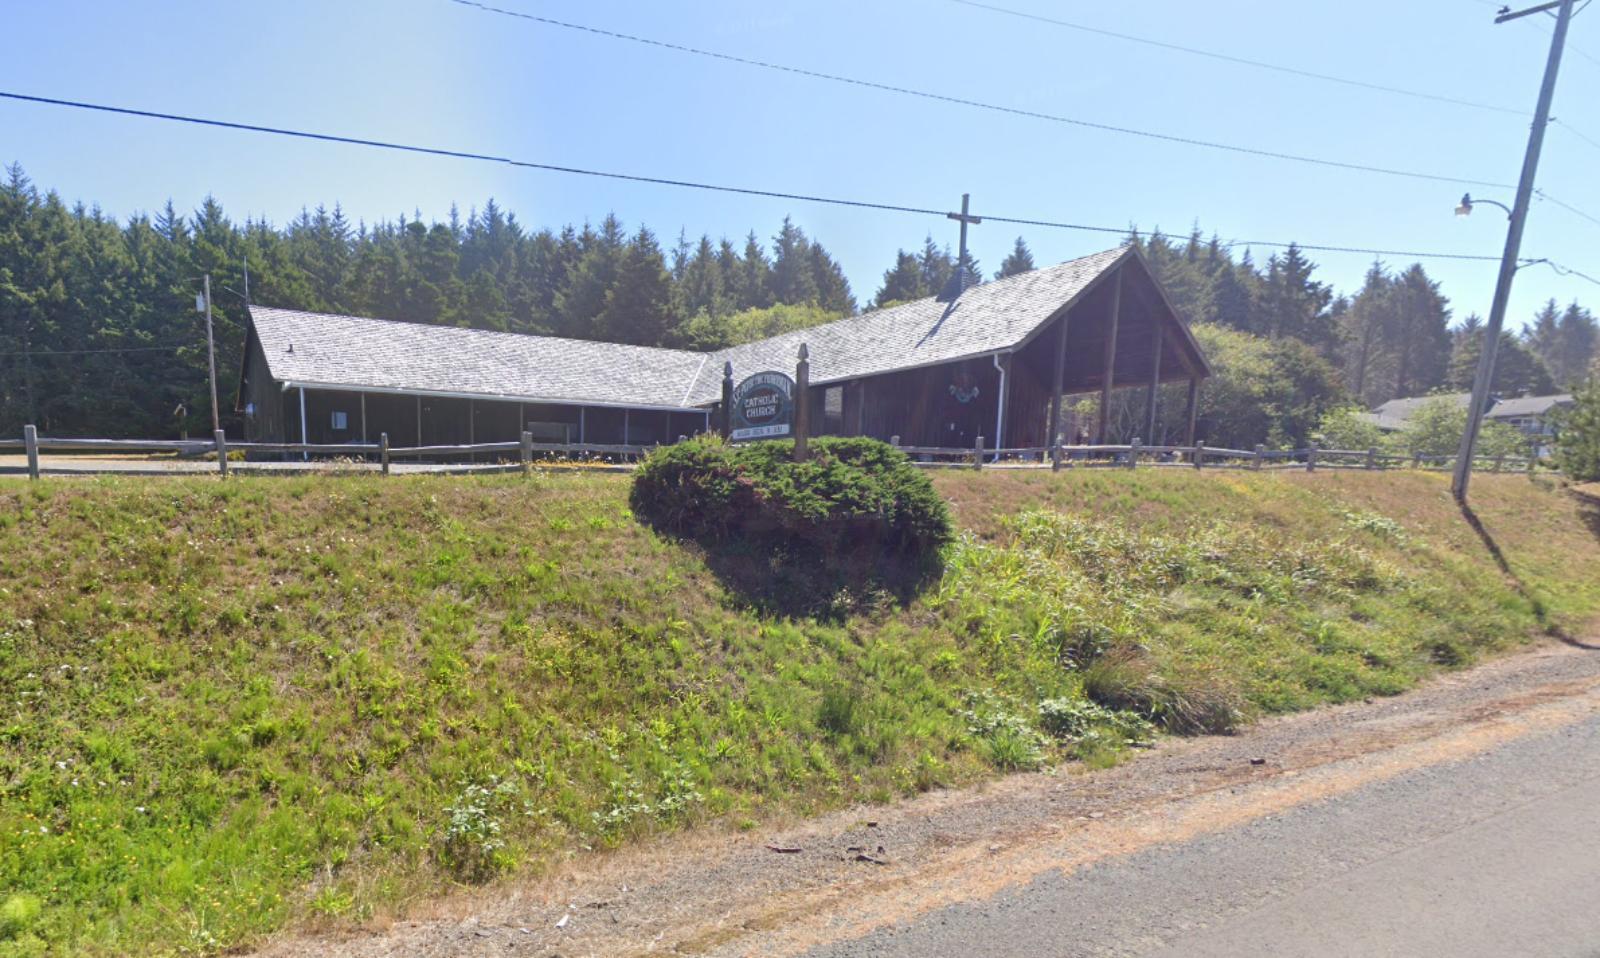
Camp Sherman – Hidden in the Pines, but on the Radar

Nestled near the Metolius River in Central Oregon, Camp Sherman is an unincorporated area prized for its natural beauty and old-school cabins. There are no traffic lights, and cell service is sparse—but that’s part of the charm. The town’s homes are often second residences or legacy properties passed down through families.
From 2021 to 2025, prices rose significantly—especially in 2022 and 2024. While values slipped slightly in 2025, demand remains high among those who value nature, seclusion, and an authentic Oregon experience.
14. Boring – 104% Home Price Increase Since 2010
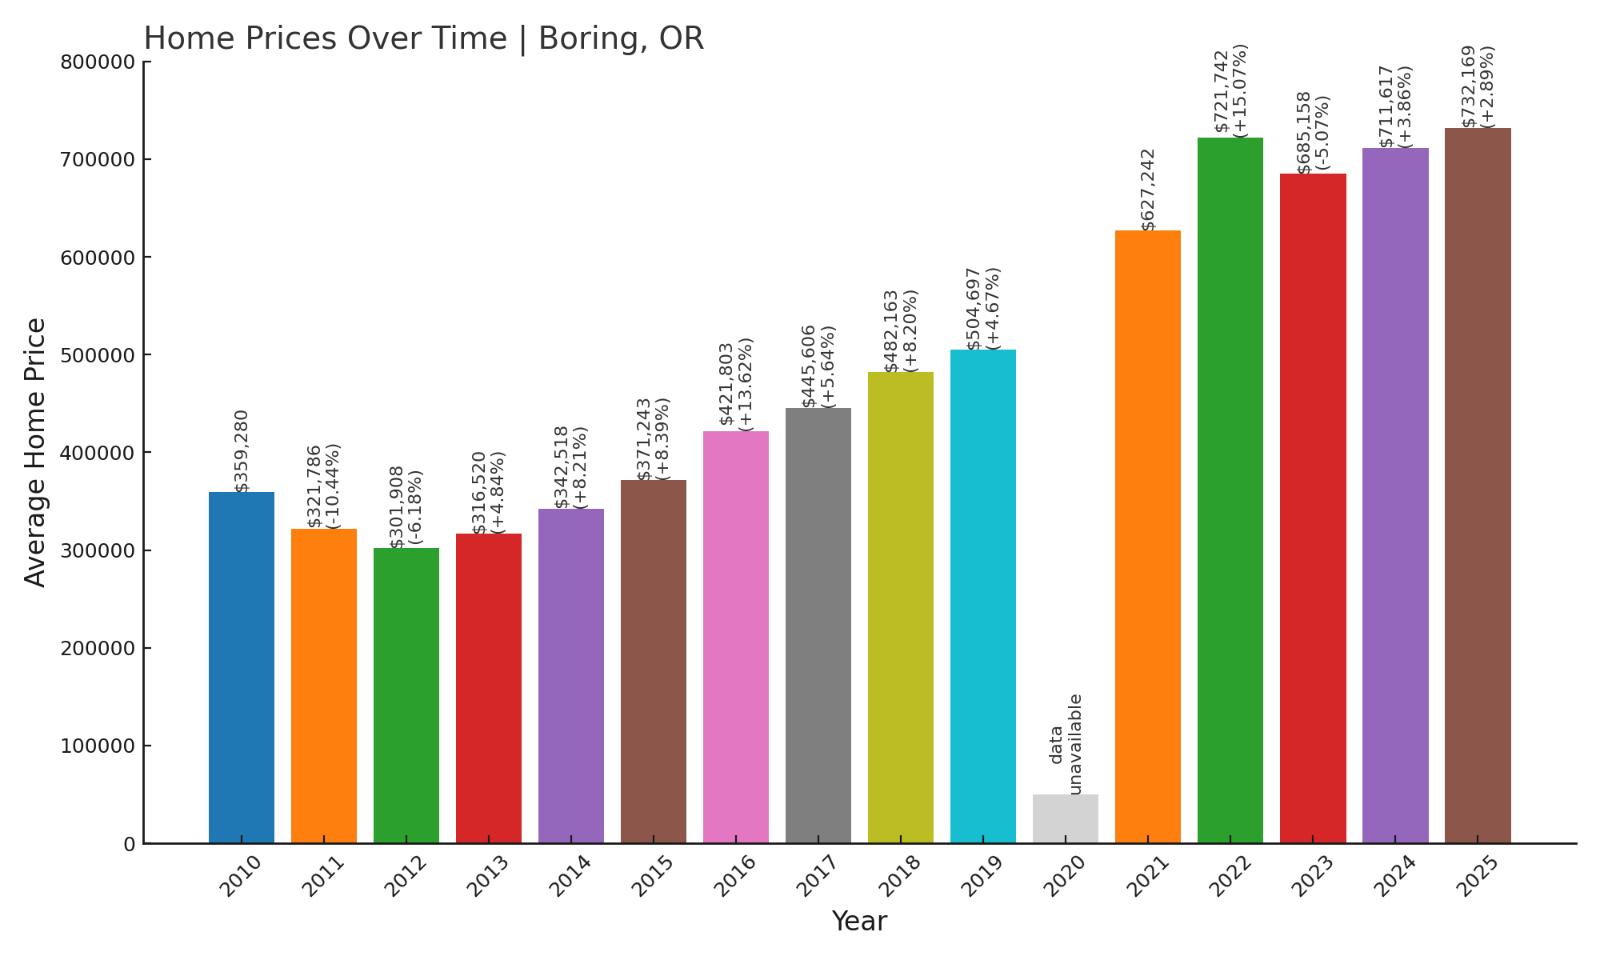
- 2010: $359,280
- 2011: $321,786 (-$37,494, -10.44% from previous year)
- 2012: $301,908 (-$19,878, -6.18% from previous year)
- 2013: $316,520 (+$14,612, +4.84% from previous year)
- 2014: $342,518 (+$25,998, +8.21% from previous year)
- 2015: $371,243 (+$28,725, +8.38% from previous year)
- 2016: $421,803 (+$50,560, +13.62% from previous year)
- 2017: $445,606 (+$23,803, +5.64% from previous year)
- 2018: $482,163 (+$36,557, +8.20% from previous year)
- 2019: $504,697 (+$22,534, +4.67% from previous year)
- 2020: N/A
- 2021: $627,242
- 2022: $721,742 (+$94,500, +15.07% from previous year)
- 2023: $685,158 (-$36,584, -5.07% from previous year)
- 2024: $711,617 (+$26,459, +3.86% from previous year)
- 2025: $732,169 (+$20,552, +2.89% from previous year)
Boring’s home values have more than doubled since 2010. While the name might suggest otherwise, the local market is anything but dull. Steady appreciation and limited supply have made this area a quiet standout in Oregon’s real estate scene.
Boring – Rural Roots, Rising Values
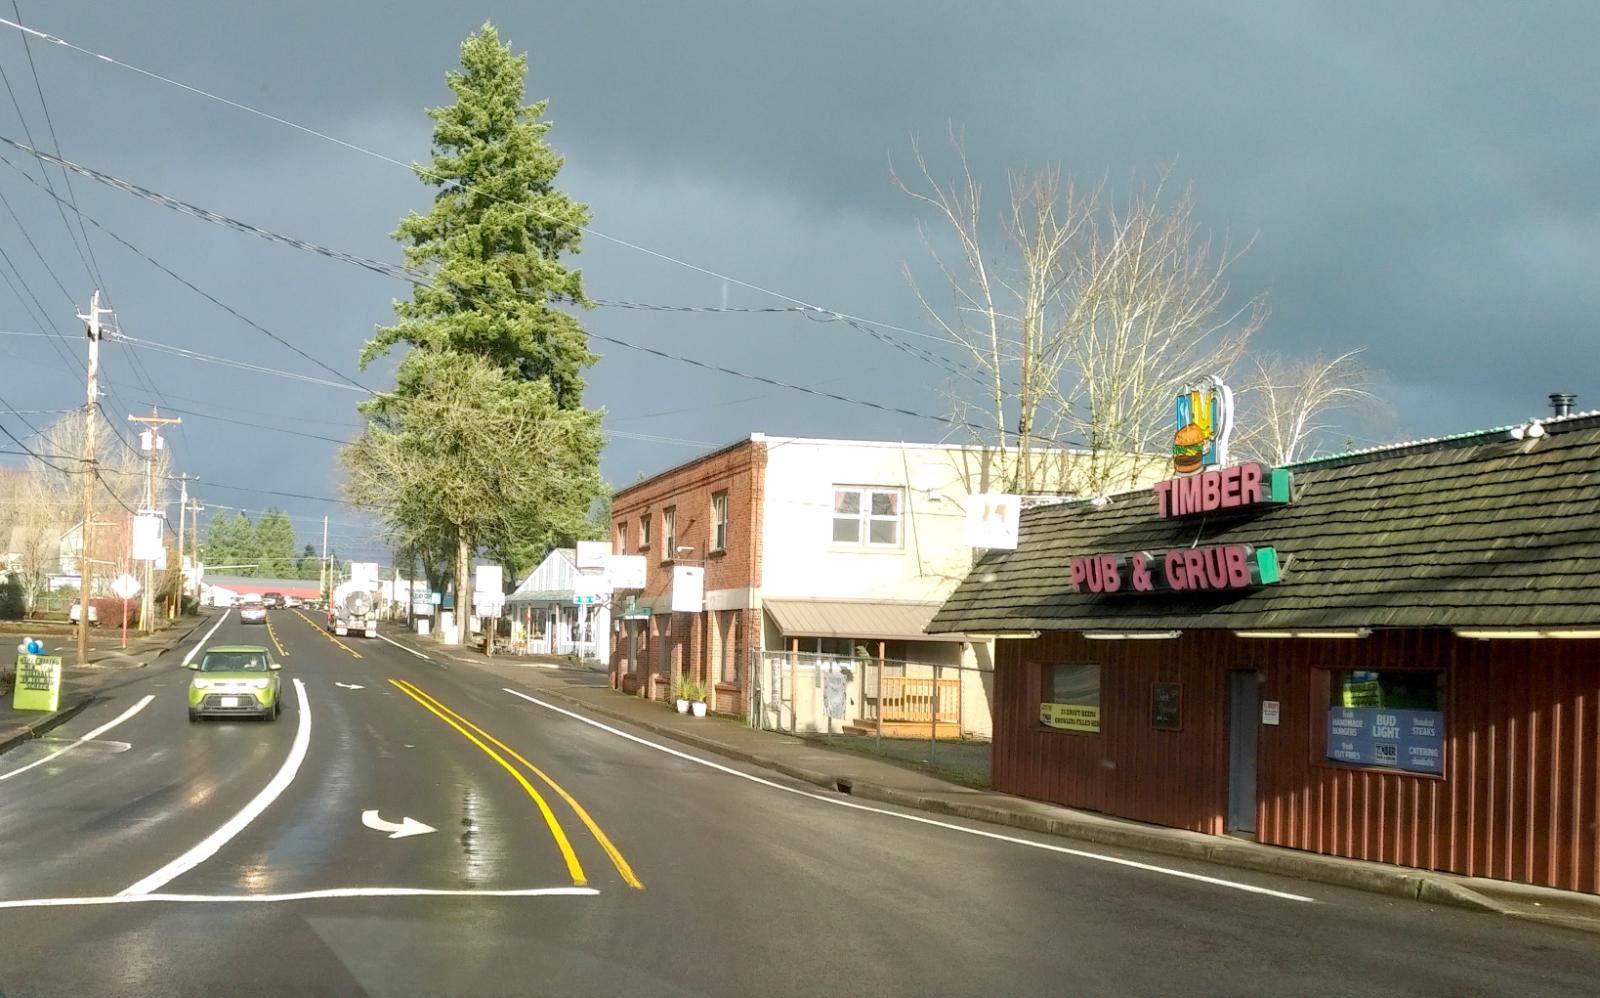
Located between Gresham and Sandy, Boring offers a rural setting within reach of Portland. With open land, tree-lined roads, and a slower pace of life, it appeals to those looking to escape suburbia while staying connected.
The growth in home prices reflects long-term confidence in the area. Though the market briefly dipped in 2023, recent gains show continued demand for homes in peaceful, well-located areas like Boring. As of 2025, home values hover above $730,000.
13. Rickreall – 118% Home Price Increase Since 2010
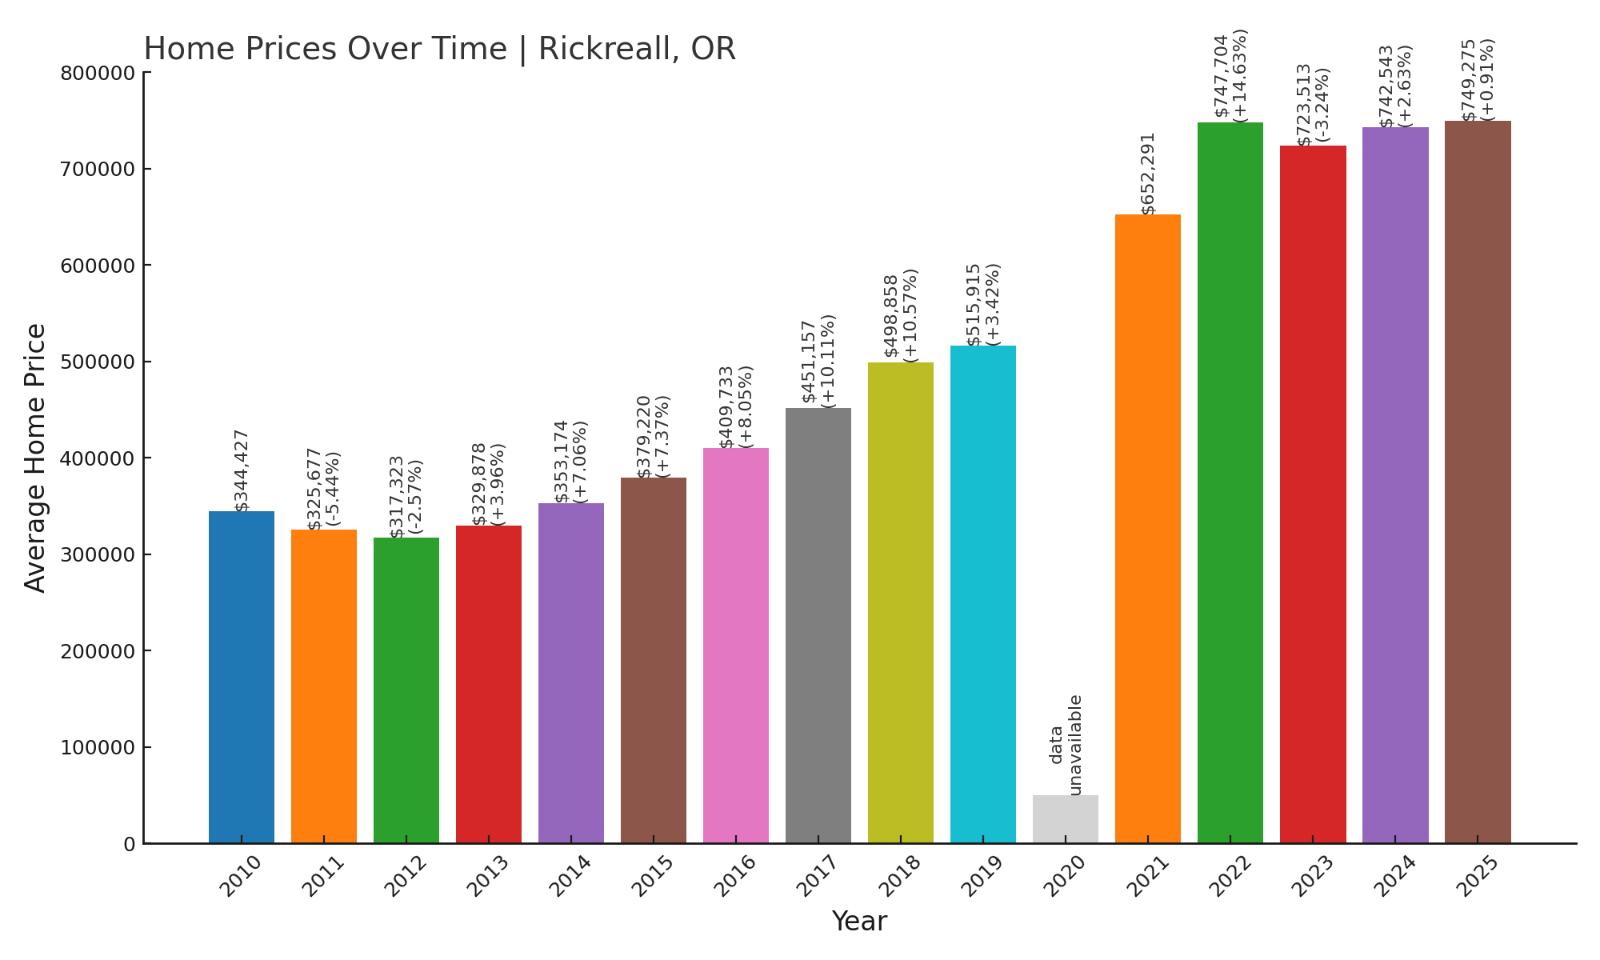
- 2010: $344,427
- 2011: $325,677 (-$18,750, -5.44% from previous year)
- 2012: $317,323 (-$8,354, -2.57% from previous year)
- 2013: $329,878 (+$12,555, +3.96% from previous year)
- 2014: $353,174 (+$23,296, +7.06% from previous year)
- 2015: $379,220 (+$26,046, +7.37% from previous year)
- 2016: $409,733 (+$30,513, +8.05% from previous year)
- 2017: $451,157 (+$41,424, +10.11% from previous year)
- 2018: $498,858 (+$47,701, +10.58% from previous year)
- 2019: $515,915 (+$17,057, +3.42% from previous year)
- 2020: N/A
- 2021: $652,291
- 2022: $747,704 (+$95,413, +14.63% from previous year)
- 2023: $723,513 (-$24,191, -3.23% from previous year)
- 2024: $742,543 (+$19,030, +2.63% from previous year)
- 2025: $749,275 (+$6,732, +0.91% from previous year)
Rickreall has seen home values surge by 118% since 2010, driven by strong year-over-year growth, particularly in the late 2010s. Despite some short-term fluctuations, prices continue to trend upward as of 2025.
Rickreall – A Small Town on the Rise
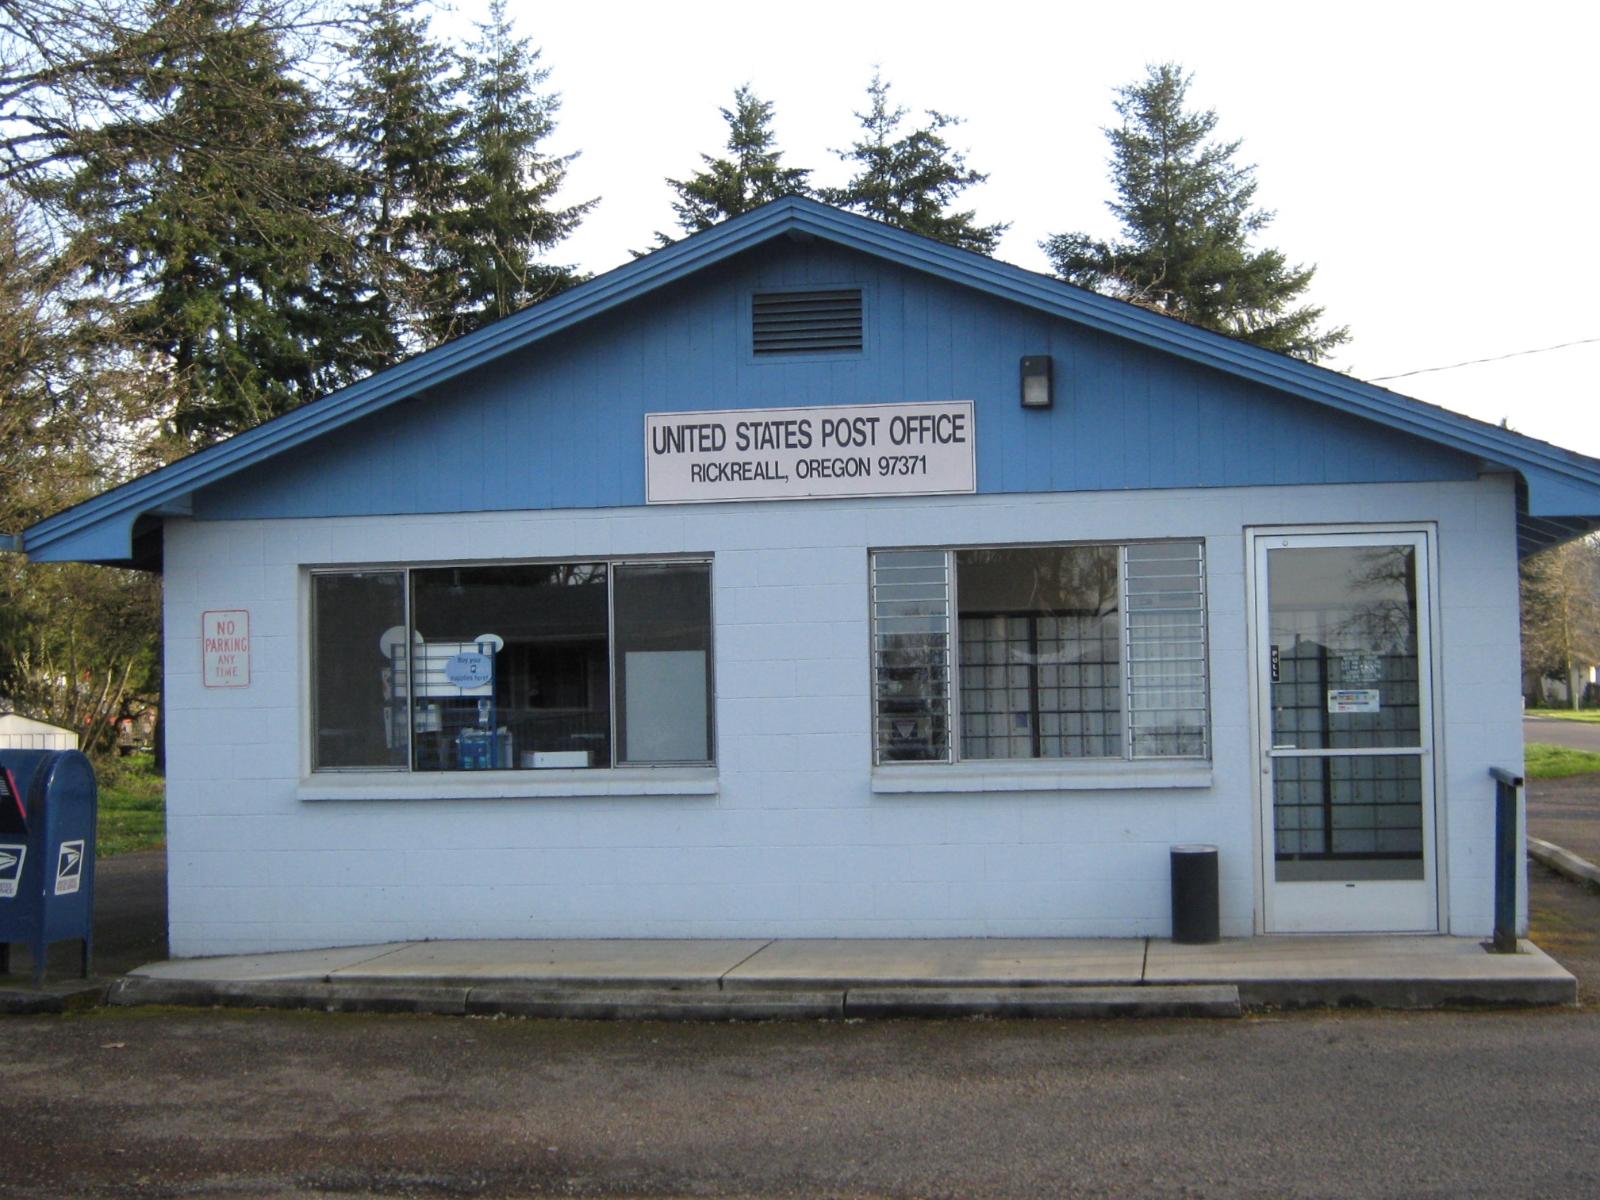
Situated in Polk County between Salem and Dallas, Rickreall is a tiny community with deep agricultural roots. It’s home to vineyards, family farms, and an easygoing pace of life—traits that have increasingly appealed to out-of-area buyers.
As Salem’s influence has spread outward, towns like Rickreall have gained attention. Its central location and growing popularity with remote workers have helped push home values toward the $750,000 mark.
12. Bend – 192% Home Price Increase Since 2010
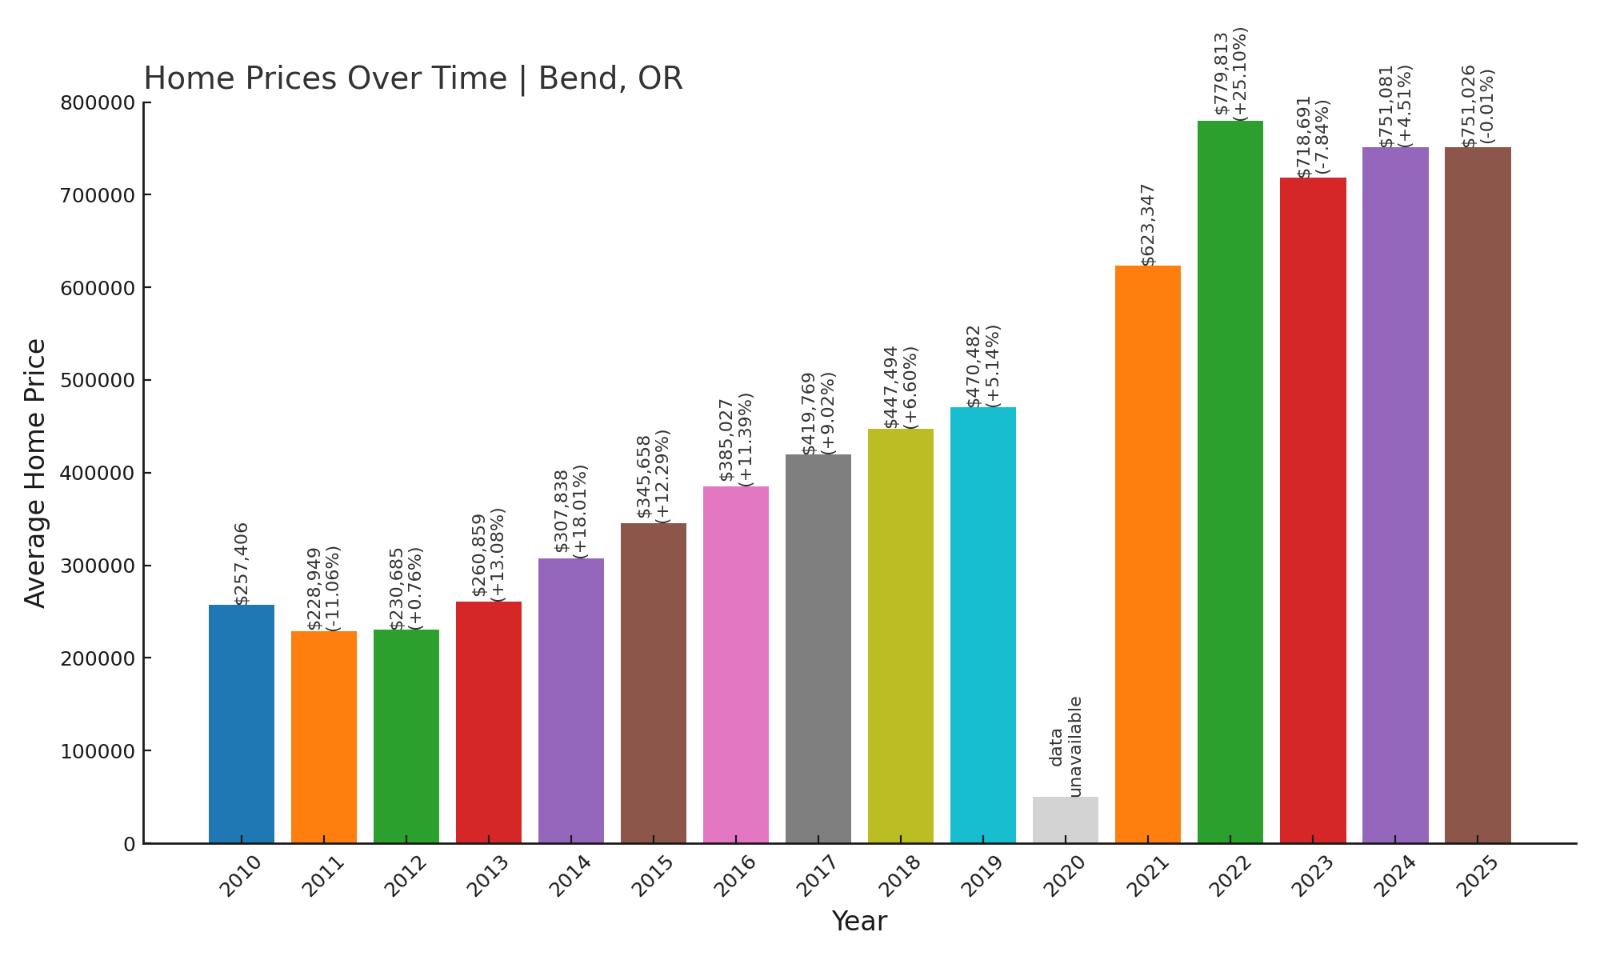
- 2010: $257,406
- 2011: $228,949 (-$28,457, -11.06% from previous year)
- 2012: $230,685 (+$1,736, +0.76% from previous year)
- 2013: $260,859 (+$30,174, +13.08% from previous year)
- 2014: $307,838 (+$46,979, +18.01% from previous year)
- 2015: $345,658 (+$37,820, +12.28% from previous year)
- 2016: $385,027 (+$39,369, +11.39% from previous year)
- 2017: $419,769 (+$34,742, +9.02% from previous year)
- 2018: $447,494 (+$27,725, +6.60% from previous year)
- 2019: $470,482 (+$22,988, +5.14% from previous year)
- 2020: N/A
- 2021: $623,347
- 2022: $779,813 (+$156,466, +25.10% from previous year)
- 2023: $718,691 (-$61,122, -7.84% from previous year)
- 2024: $751,081 (+$32,390, +4.51% from previous year)
- 2025: $751,026 (-$55, -0.01% from previous year)
Since 2010, home values in Bend have nearly tripled. The biggest surges came during the pandemic years, with prices holding steady in recent cycles. As of 2025, Bend remains one of Oregon’s most sought-after and expensive real estate markets.
Bend – From Outdoor Playground to Premium Market

Bend has evolved from a recreational hotspot to a full-fledged high-demand housing market. Set in Central Oregon near the Cascade Mountains, it offers a mix of adventure, restaurants, and a growing tech and startup community.
Its growth has been fueled by in-migration from California and the Portland metro. With demand outpacing supply, the housing market here has soared. Even with a recent cooling phase, 2025 home prices are holding above $750,000.
11. Beavercreek – 118% Home Price Increase Since 2010
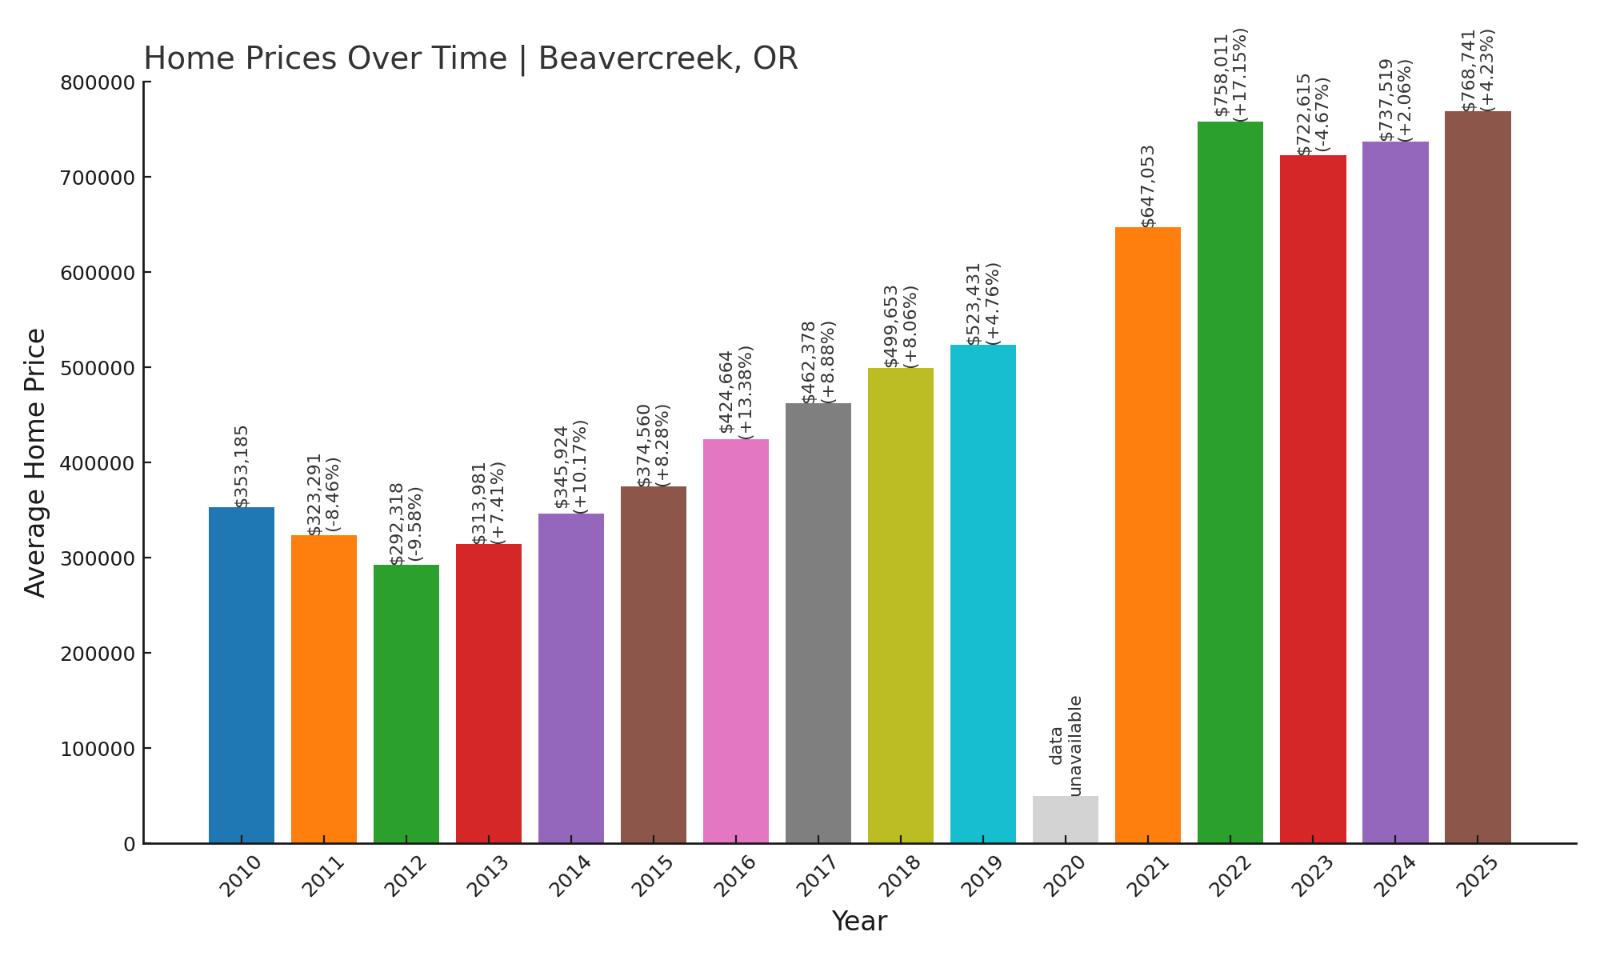
- 2010: $353,185
- 2011: $323,291 (-$29,894, -8.47% from previous year)
- 2012: $292,318 (-$30,973, -9.58% from previous year)
- 2013: $313,981 (+$21,663, +7.41% from previous year)
- 2014: $345,924 (+$31,943, +10.17% from previous year)
- 2015: $374,560 (+$28,636, +8.28% from previous year)
- 2016: $424,664 (+$50,104, +13.37% from previous year)
- 2017: $462,378 (+$37,714, +8.88% from previous year)
- 2018: $499,653 (+$37,275, +8.06% from previous year)
- 2019: $523,431 (+$23,778, +4.76% from previous year)
- 2020: N/A
- 2021: $647,053
- 2022: $758,011 (+$110,958, +17.15% from previous year)
- 2023: $722,615 (-$35,396, -4.67% from previous year)
- 2024: $737,519 (+$14,904, +2.06% from previous year)
- 2025: $768,741 (+$31,222, +4.23% from previous year)
Beavercreek home values have climbed over 118% since 2010. Rural but accessible, this area has attracted steady interest from buyers seeking larger properties outside Portland. After a dip in 2023, values are rising once again in 2025.
Beavercreek – Spacious Living, Surging Prices
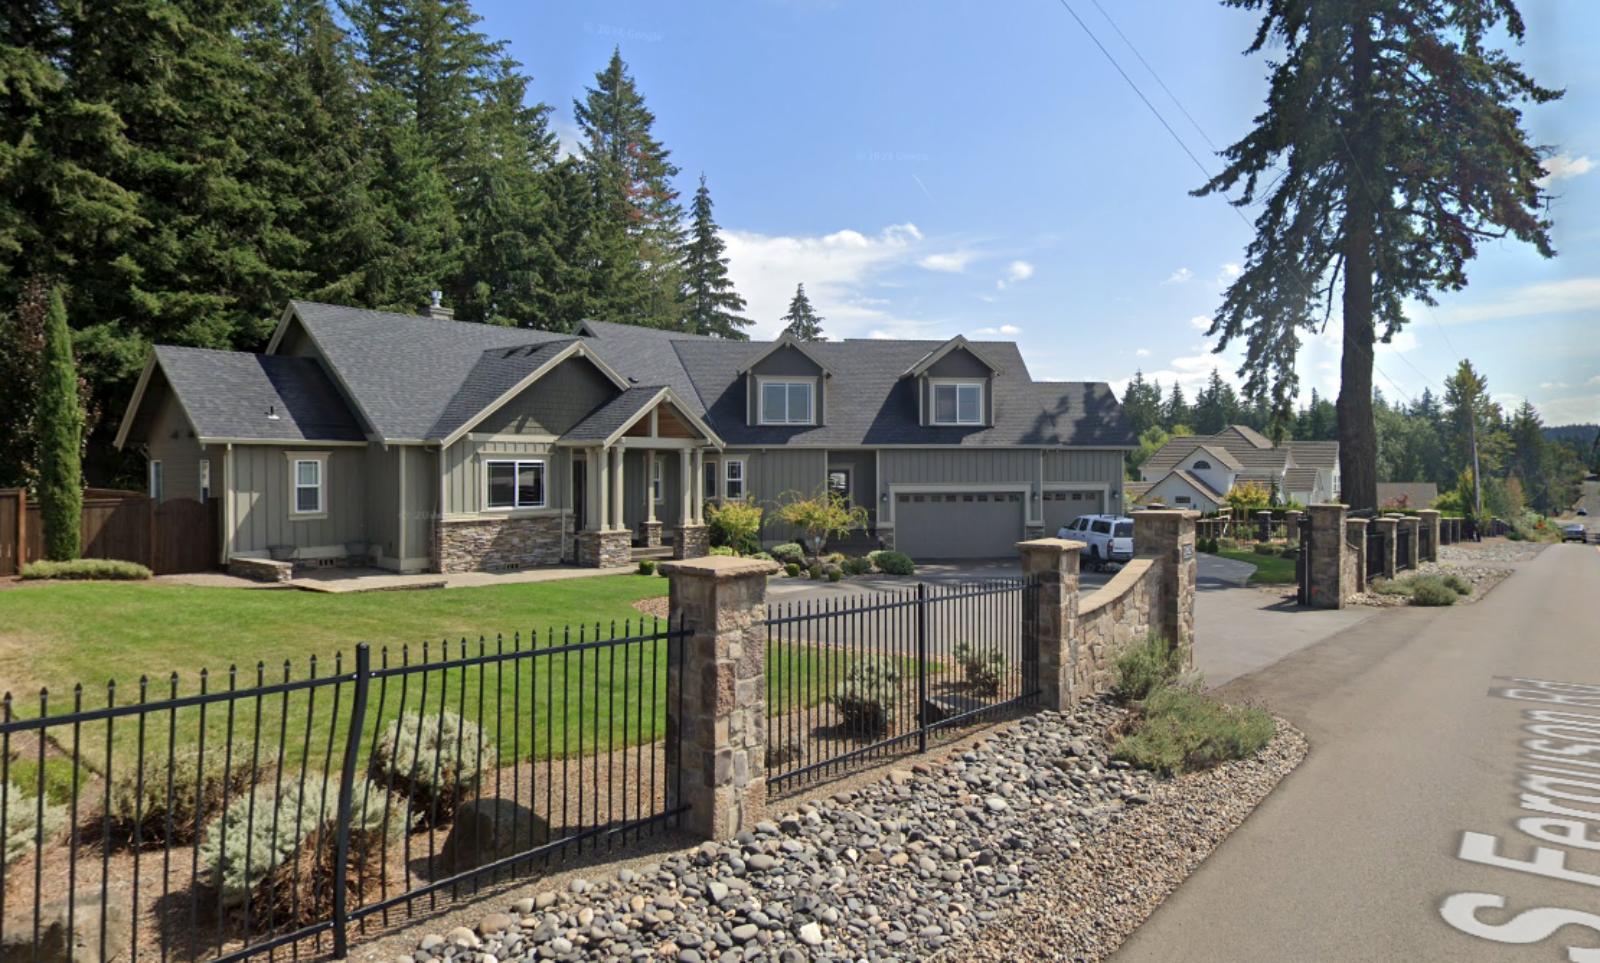
Beavercreek is known for its mix of wooded lots, farmland, and rural subdivisions. It’s not a town in the formal sense, but the community stretches across a broad area with easy access to Oregon City and I-205.
The real estate here tends to feature large homes and acreage—appealing to buyers who want privacy and room to grow. 2025 values are pushing toward $770,000, with demand driven by lifestyle preferences and low inventory.
10. West Linn – 102% Home Price Increase Since 2010

Would you like to save this?
- 2010: $389,320
- 2011: $356,457 (-$32,863, -8.44% from previous year)
- 2012: $334,688 (-$21,769, -6.11% from previous year)
- 2013: $360,697 (+$26,009, +7.77% from previous year)
- 2014: $396,056 (+$35,359, +9.81% from previous year)
- 2015: $424,050 (+$27,994, +7.07% from previous year)
- 2016: $469,163 (+$45,113, +10.64% from previous year)
- 2017: $505,015 (+$35,852, +7.64% from previous year)
- 2018: $528,893 (+$23,878, +4.73% from previous year)
- 2019: $542,239 (+$13,346, +2.52% from previous year)
- 2020: N/A
- 2021: $640,059
- 2022: $764,437 (+$124,378, +19.43% from previous year)
- 2023: $756,358 (-$8,079, -1.06% from previous year)
- 2024: $780,275 (+$23,917, +3.16% from previous year)
- 2025: $787,462 (+$7,187, +0.92% from previous year)
Home values in West Linn have risen 102% since 2010, making it one of the most consistently high-priced towns in the Portland metro. Even with a mild dip in 2023, the overall trend remains strong in 2025.
West Linn – Suburban Prestige Along the River
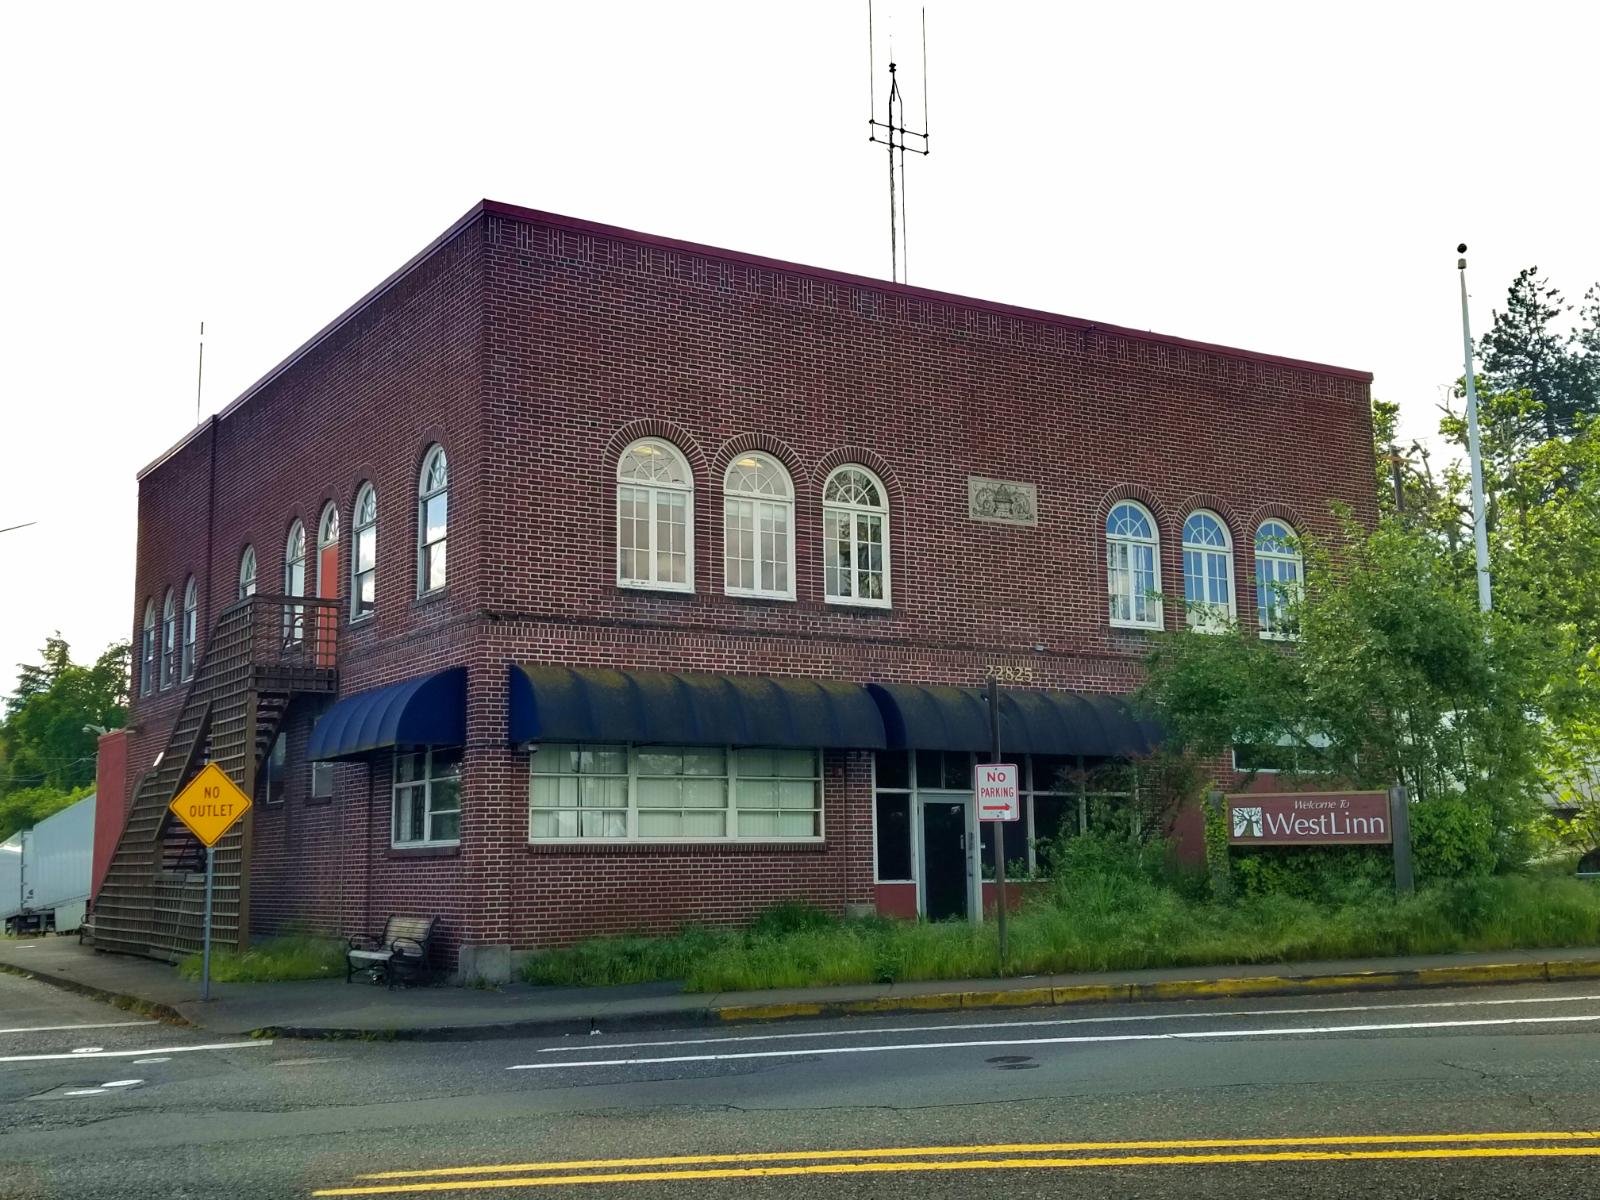
West Linn sits on the Willamette River south of Portland and is known for its excellent schools, affluent neighborhoods, and beautiful river views. It’s a perennial favorite for families and professionals alike.
The town’s housing market has been remarkably resilient. Prices jumped significantly during the 2020–2022 boom and have held firm above $780,000 as of 2025, reflecting steady demand and limited turnover in the area.
9. West Slope – 121% Home Price Increase Since 2010
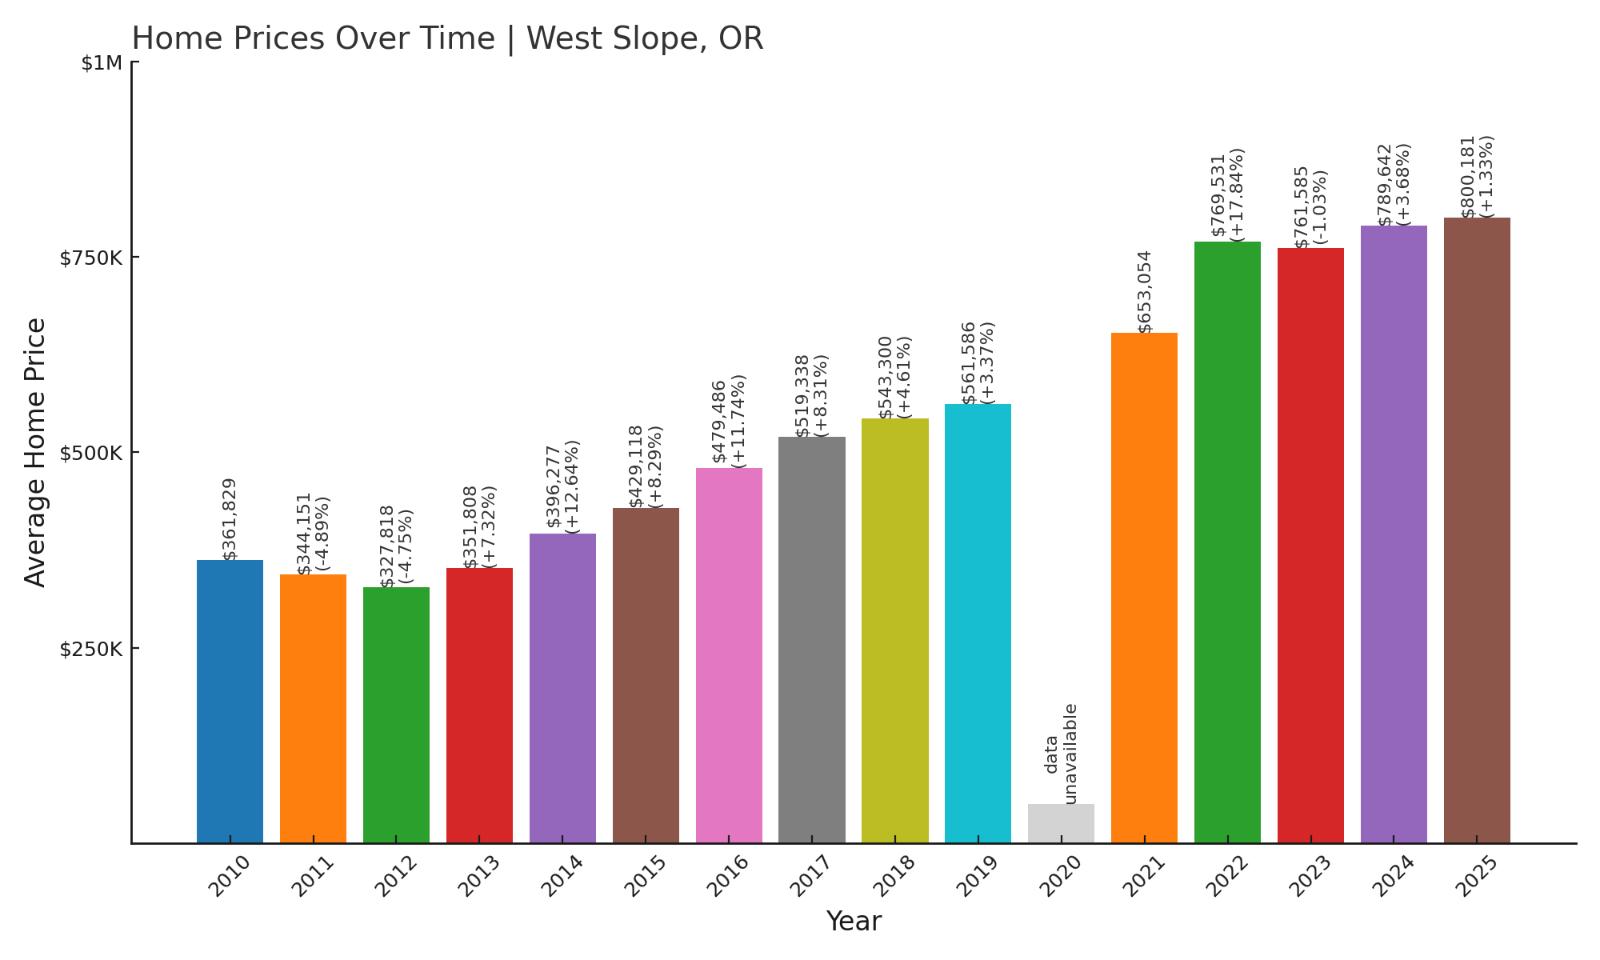
- 2010: $361,829
- 2011: $344,151 (-$17,678, -4.88% from previous year)
- 2012: $327,818 (-$16,333, -4.75% from previous year)
- 2013: $351,808 (+$23,990, +7.32% from previous year)
- 2014: $396,277 (+$44,469, +12.64% from previous year)
- 2015: $429,118 (+$32,841, +8.29% from previous year)
- 2016: $479,486 (+$50,368, +11.74% from previous year)
- 2017: $519,338 (+$39,852, +8.31% from previous year)
- 2018: $543,300 (+$23,962, +4.61% from previous year)
- 2019: $561,586 (+$18,286, +3.37% from previous year)
- 2020: N/A
- 2021: $653,054
- 2022: $769,531 (+$116,477, +17.84% from previous year)
- 2023: $761,585 (-$7,946, -1.03% from previous year)
- 2024: $789,642 (+$28,057, +3.68% from previous year)
- 2025: $800,181 (+$10,539, +1.33% from previous year)
West Slope has posted an impressive 121% increase in home values since 2010, with double-digit growth years propelling it into the top 10 most expensive towns in Oregon.
West Slope – Tucked Between Hills and City Life
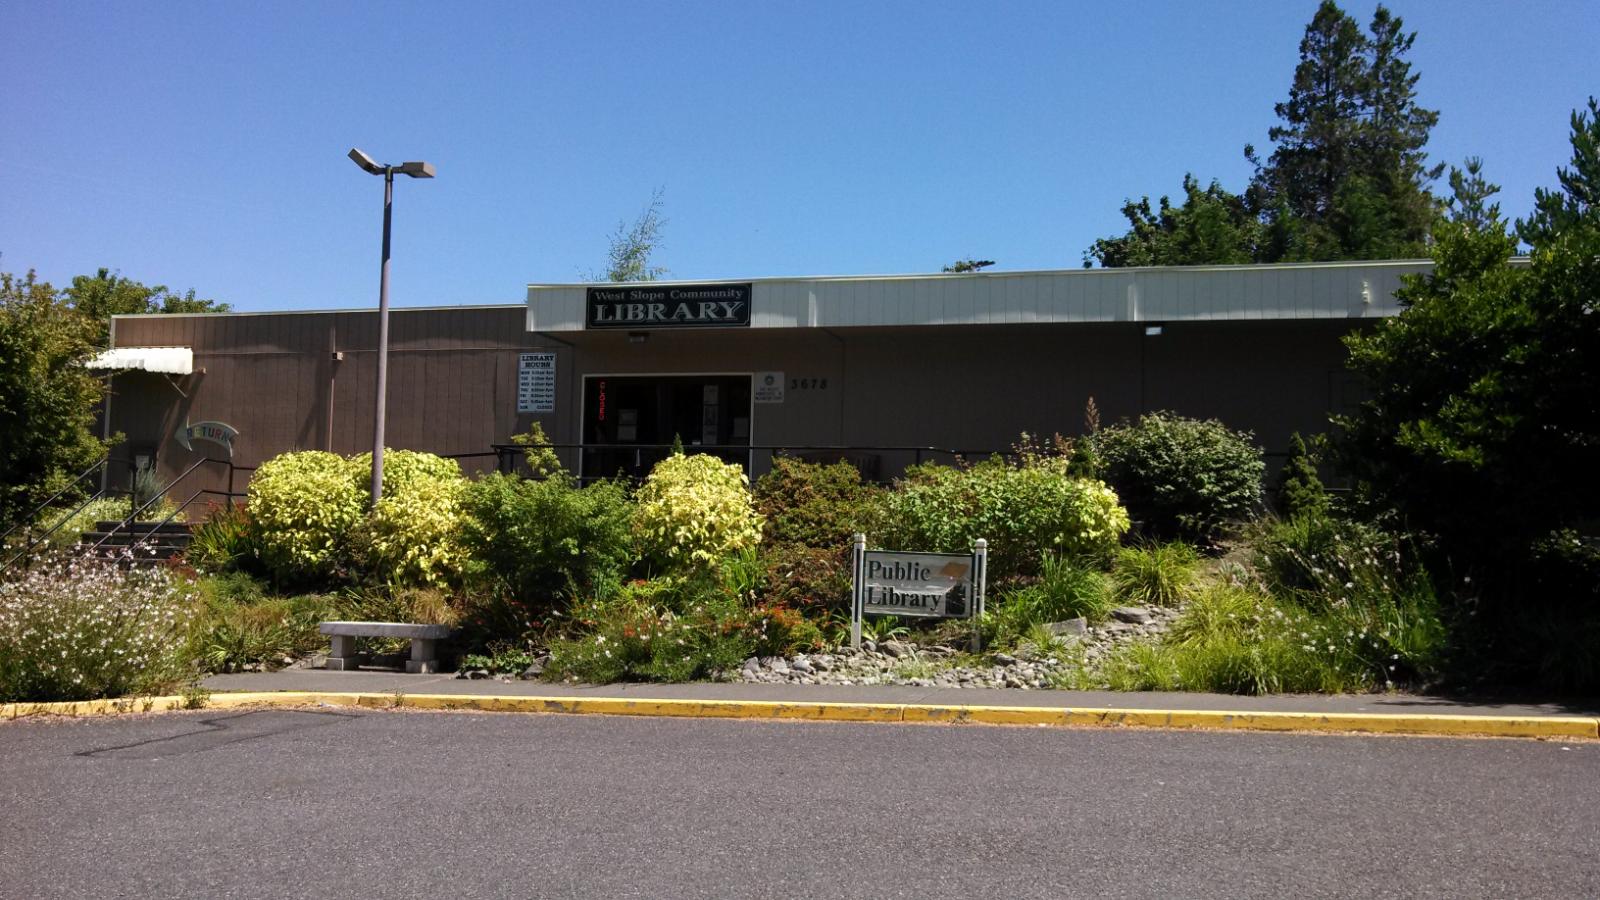
West Slope is a small, upscale community just west of downtown Portland. Nestled on hilly terrain, the area offers leafy streets, quick freeway access, and proximity to both downtown and the Sunset Corridor tech hubs.
Its location, quiet charm, and low housing turnover contribute to consistently strong home values. The average home now goes for over $800,000—nearly double what it cost in 2010.
8. Durham – 122% Home Price Increase Since 2010
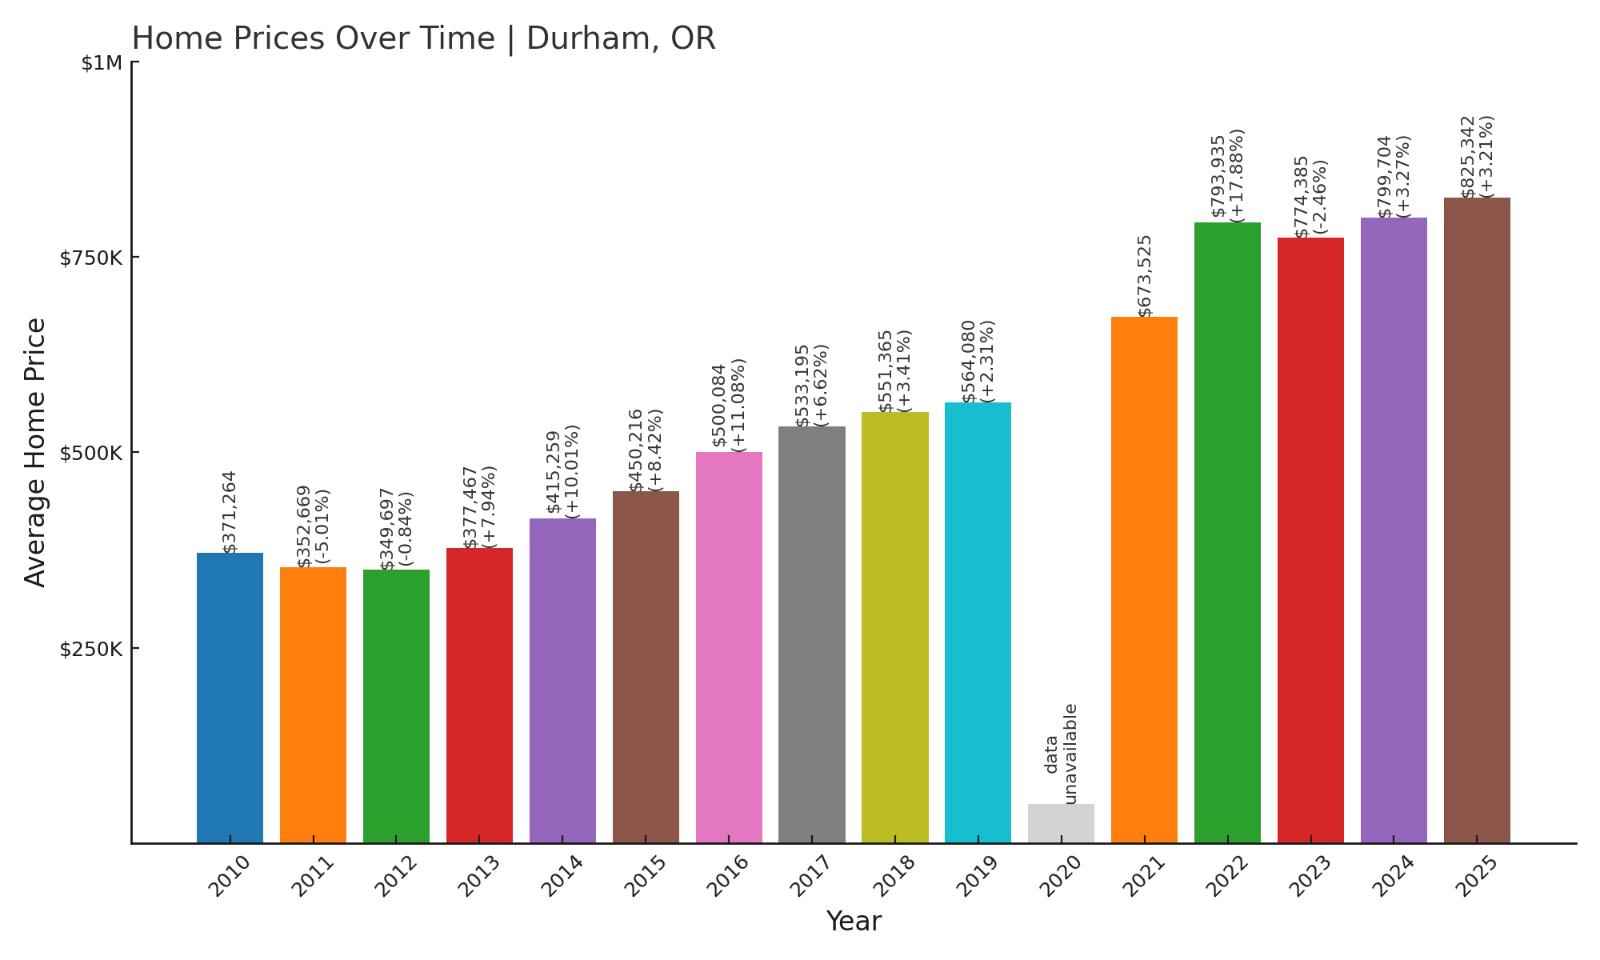
- 2010: $371,264
- 2011: $352,669 (-$18,595, -5.01% from previous year)
- 2012: $349,697 (-$2,972, -0.84% from previous year)
- 2013: $377,467 (+$27,770, +7.94% from previous year)
- 2014: $415,259 (+$37,792, +10.01% from previous year)
- 2015: $450,216 (+$34,957, +8.42% from previous year)
- 2016: $500,084 (+$49,868, +11.08% from previous year)
- 2017: $533,195 (+$33,111, +6.62% from previous year)
- 2018: $551,365 (+$18,170, +3.41% from previous year)
- 2019: $564,080 (+$12,715, +2.31% from previous year)
- 2020: N/A
- 2021: $673,525
- 2022: $793,935 (+$120,410, +17.88% from previous year)
- 2023: $774,385 (-$19,550, -2.46% from previous year)
- 2024: $799,704 (+$25,319, +3.27% from previous year)
- 2025: $825,342 (+$25,638, +3.21% from previous year)
Durham’s housing market has grown steadily since 2010, with total appreciation reaching 122%. Recent gains show continued buyer interest and resilient demand in this tucked-away neighborhood.
Durham – Quiet and Convenient in Washington County
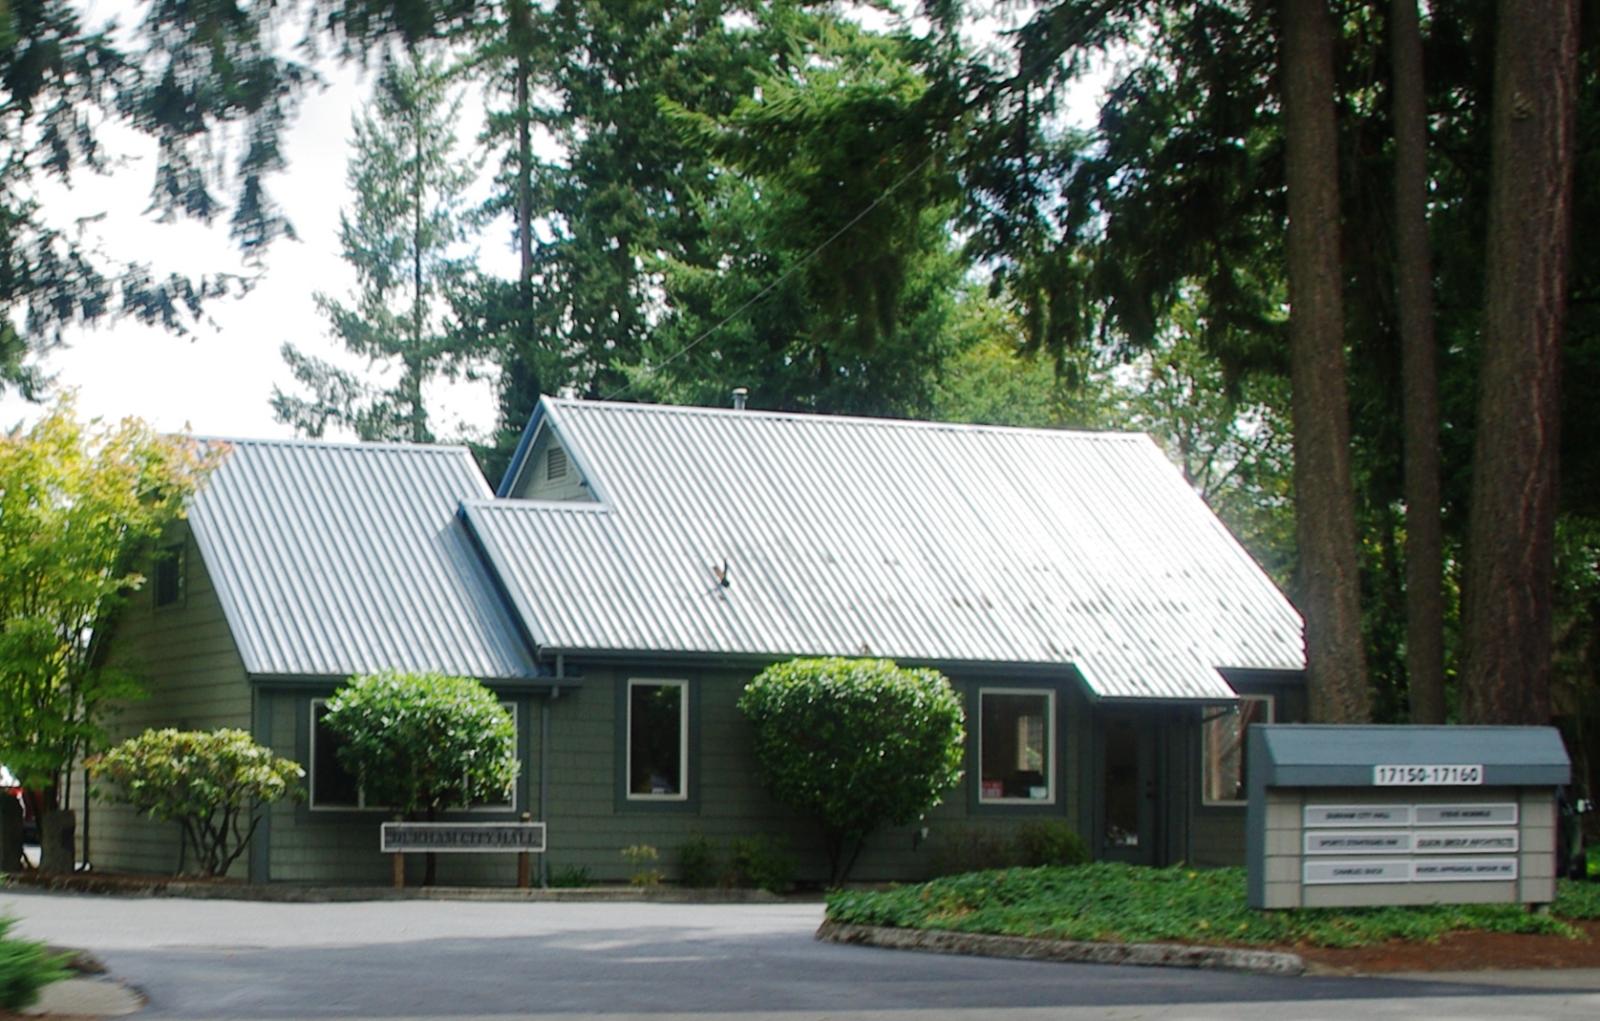
Durham is a tiny city in Washington County nestled between Tigard and Tualatin. With just over 1,000 residents, it’s often overlooked—but its tree-lined streets and proximity to parks and shopping have kept it in demand.
With median home prices now exceeding $825,000, Durham has become a premium neighborhood. It’s especially popular among buyers who want serenity without sacrificing location.
7. Sisters – 120% Home Price Increase Since 2010
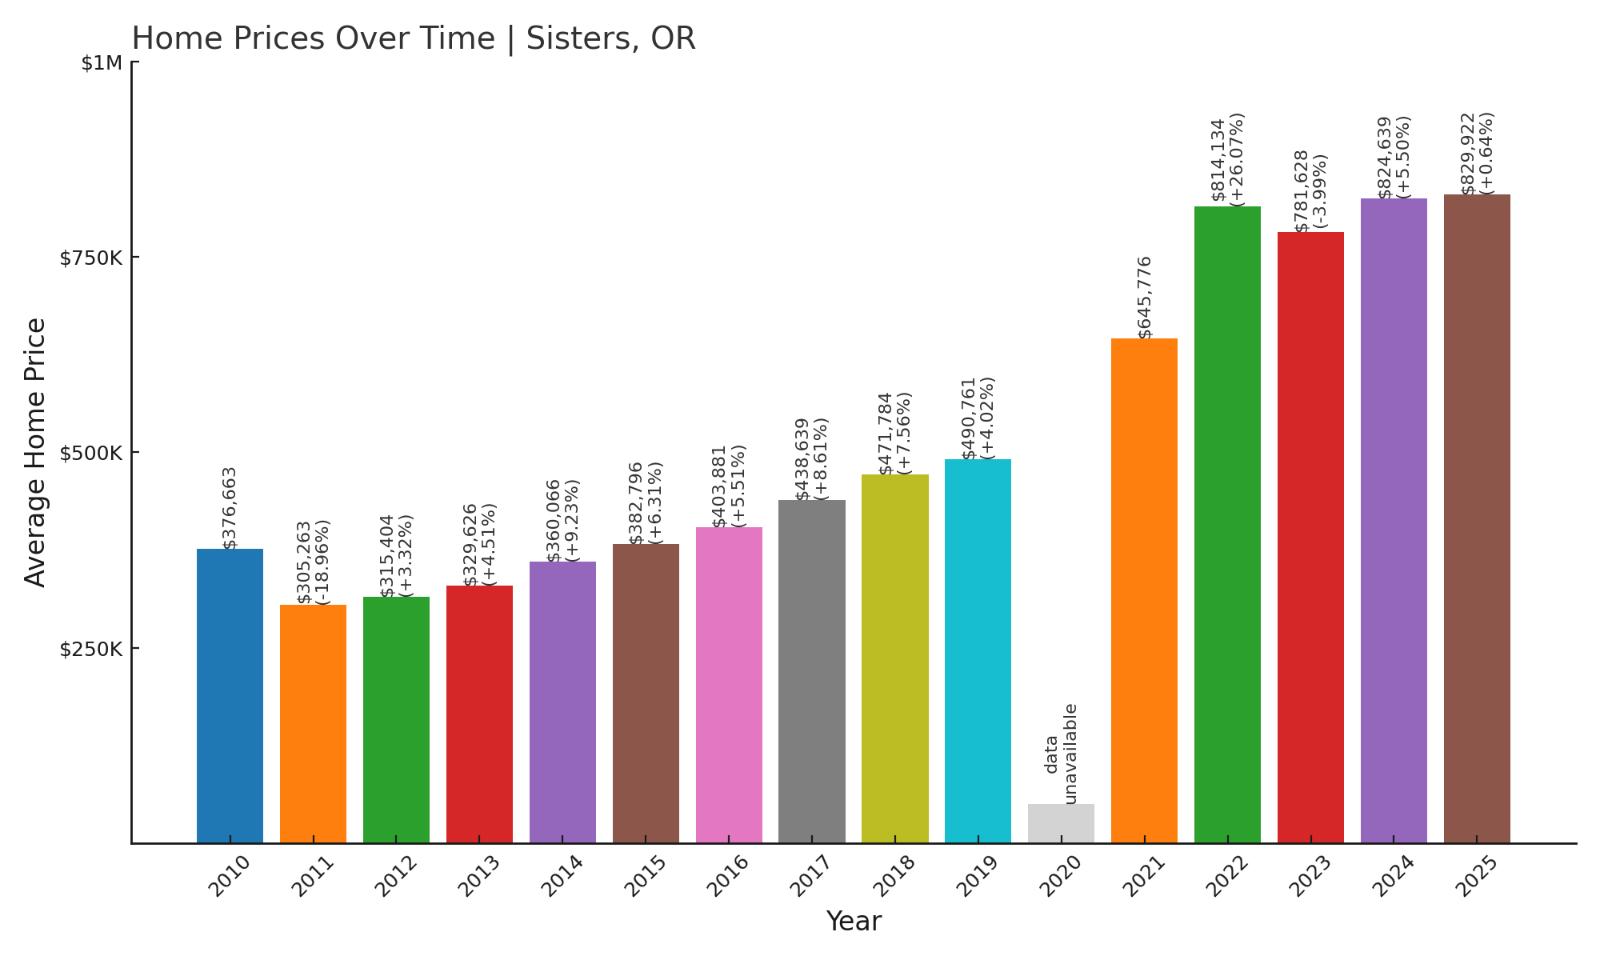
- 2010: $376,663
- 2011: $305,263 (-$71,400, -18.96% from previous year)
- 2012: $315,404 (+$10,141, +3.32% from previous year)
- 2013: $329,626 (+$14,222, +4.51% from previous year)
- 2014: $360,066 (+$30,440, +9.24% from previous year)
- 2015: $382,796 (+$22,730, +6.31% from previous year)
- 2016: $403,881 (+$21,085, +5.51% from previous year)
- 2017: $438,639 (+$34,758, +8.61% from previous year)
- 2018: $471,784 (+$33,145, +7.56% from previous year)
- 2019: $490,761 (+$18,977, +4.02% from previous year)
- 2020: N/A
- 2021: $645,776
- 2022: $814,134 (+$168,358, +26.07% from previous year)
- 2023: $781,628 (-$32,506, -3.99% from previous year)
- 2024: $824,639 (+$43,011, +5.50% from previous year)
- 2025: $829,922 (+$5,283, +0.64% from previous year)
Sisters has more than doubled in value since 2010. While it saw a major jump in 2022, values have held strong through 2025. Demand for scenic small-town living continues to power the local market.
Sisters – Gateway to the Cascades, Strong in Value

Sisters is a charming town in Deschutes County known for its mountain backdrop, Western-themed downtown, and access to hiking, skiing, and fly fishing. It’s a favorite for retirees and second-home buyers.
2025 values near $830,000 reflect both the town’s growing popularity and limited housing inventory. Even with minor pullbacks, long-term appreciation remains solidly upward.
6. Manzanita – 103% Home Price Increase Since 2010
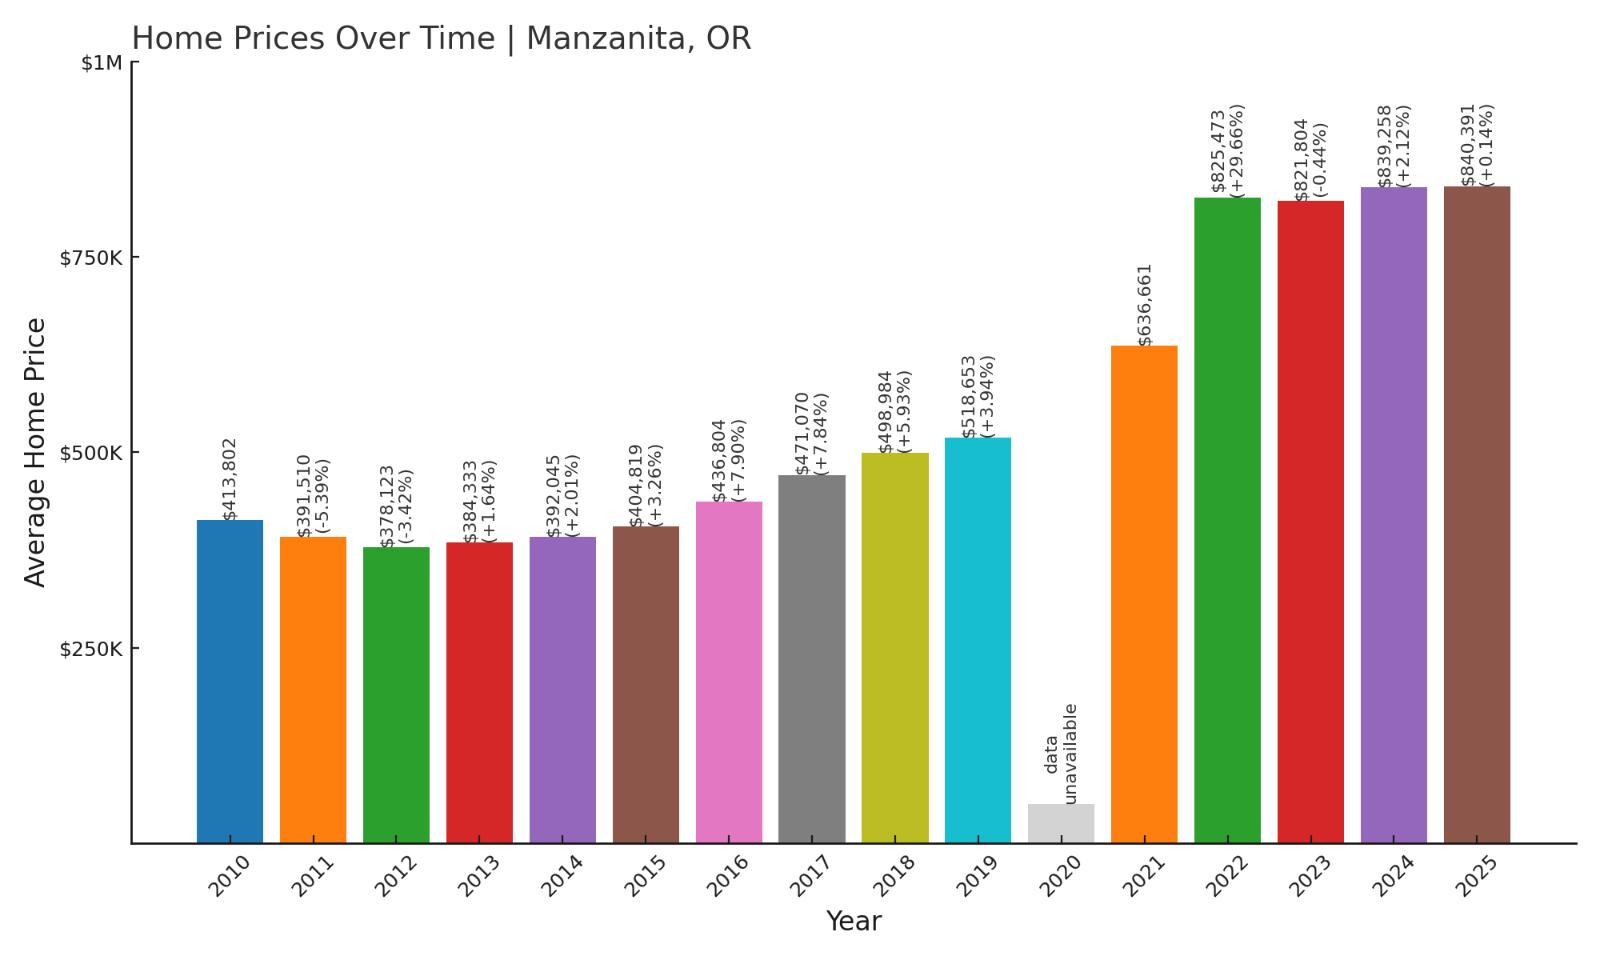
- 2010: $413,802
- 2011: $391,510 (-$22,292, -5.39% from previous year)
- 2012: $378,123 (-$13,387, -3.42% from previous year)
- 2013: $384,333 (+$6,210, +1.64% from previous year)
- 2014: $392,045 (+$7,712, +2.01% from previous year)
- 2015: $404,819 (+$12,774, +3.26% from previous year)
- 2016: $436,804 (+$31,985, +7.90% from previous year)
- 2017: $471,070 (+$34,266, +7.84% from previous year)
- 2018: $498,984 (+$27,914, +5.92% from previous year)
- 2019: $518,653 (+$19,669, +3.94% from previous year)
- 2020: N/A
- 2021: $636,661
- 2022: $825,473 (+$188,812, +29.66% from previous year)
- 2023: $821,804 (-$3,669, -0.44% from previous year)
- 2024: $839,258 (+$17,454, +2.12% from previous year)
- 2025: $840,391 (+$1,133, +0.13% from previous year)
Manzanita’s home values have more than doubled since 2010, fueled by strong interest in coastal properties. Though recent price growth has slowed, its long-term appreciation remains one of the strongest on Oregon’s coast.
Manzanita – Coastal Calm with Climbing Prices
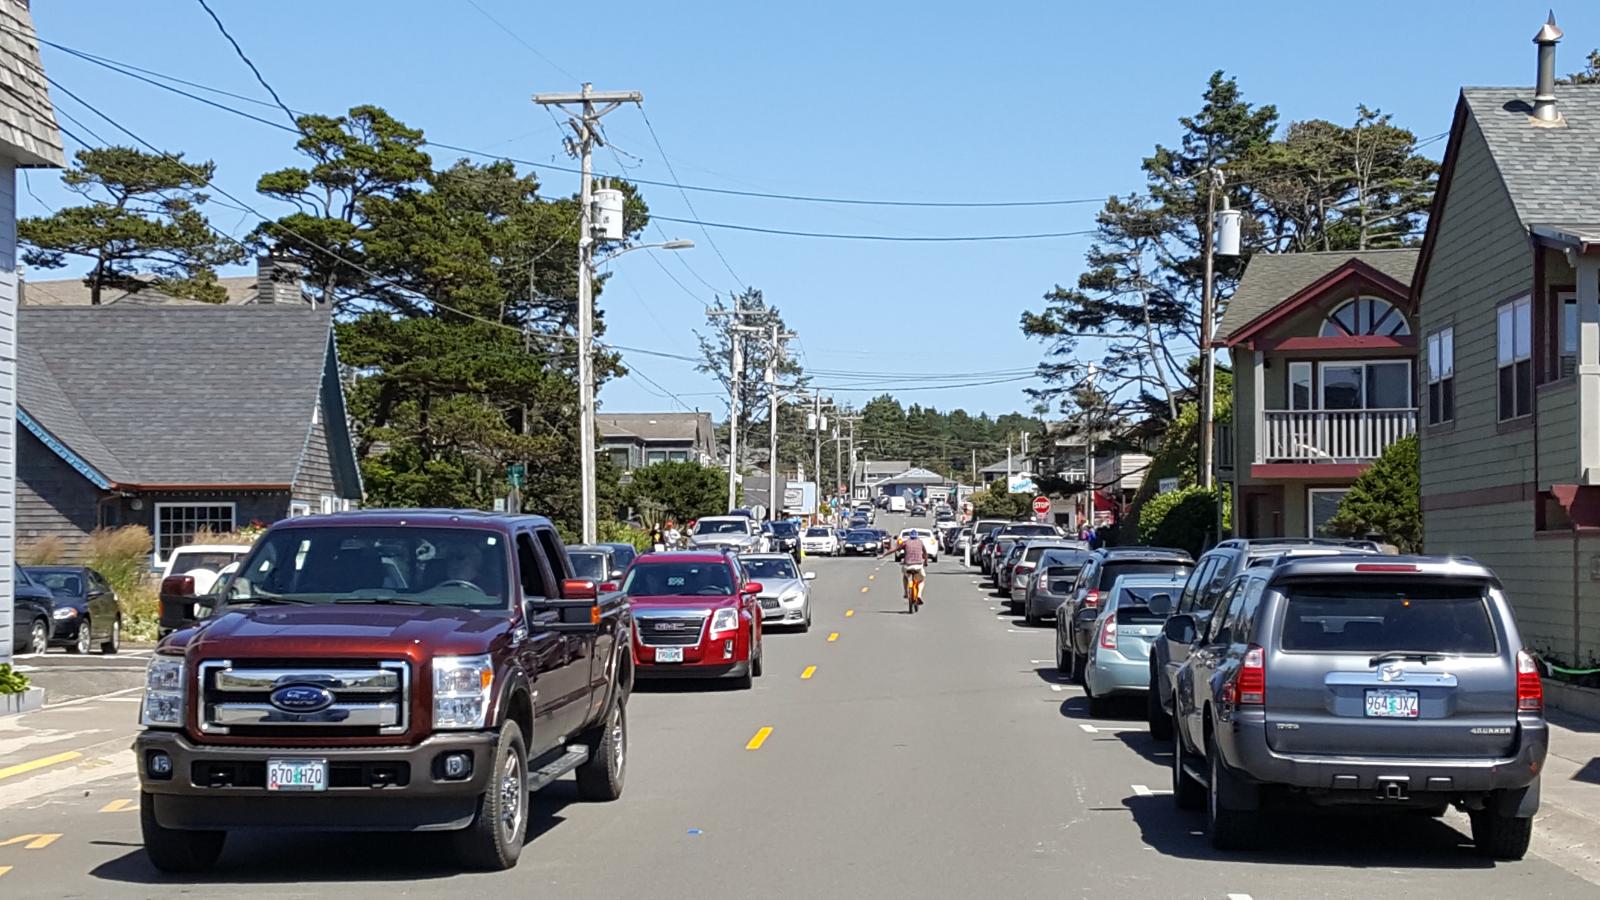
Manzanita is a small coastal town on the northern Oregon coast, offering ocean views, boutique shops, and a laid-back vibe that attracts vacationers and retirees alike. It’s less commercialized than Seaside or Cannon Beach but still highly desirable.
With home values now topping $840,000, Manzanita reflects the continued premium placed on scenic coastal living. Limited inventory and consistent demand have made it one of the priciest beach towns in the state.
5. Lake Oswego – 104% Home Price Increase Since 2010
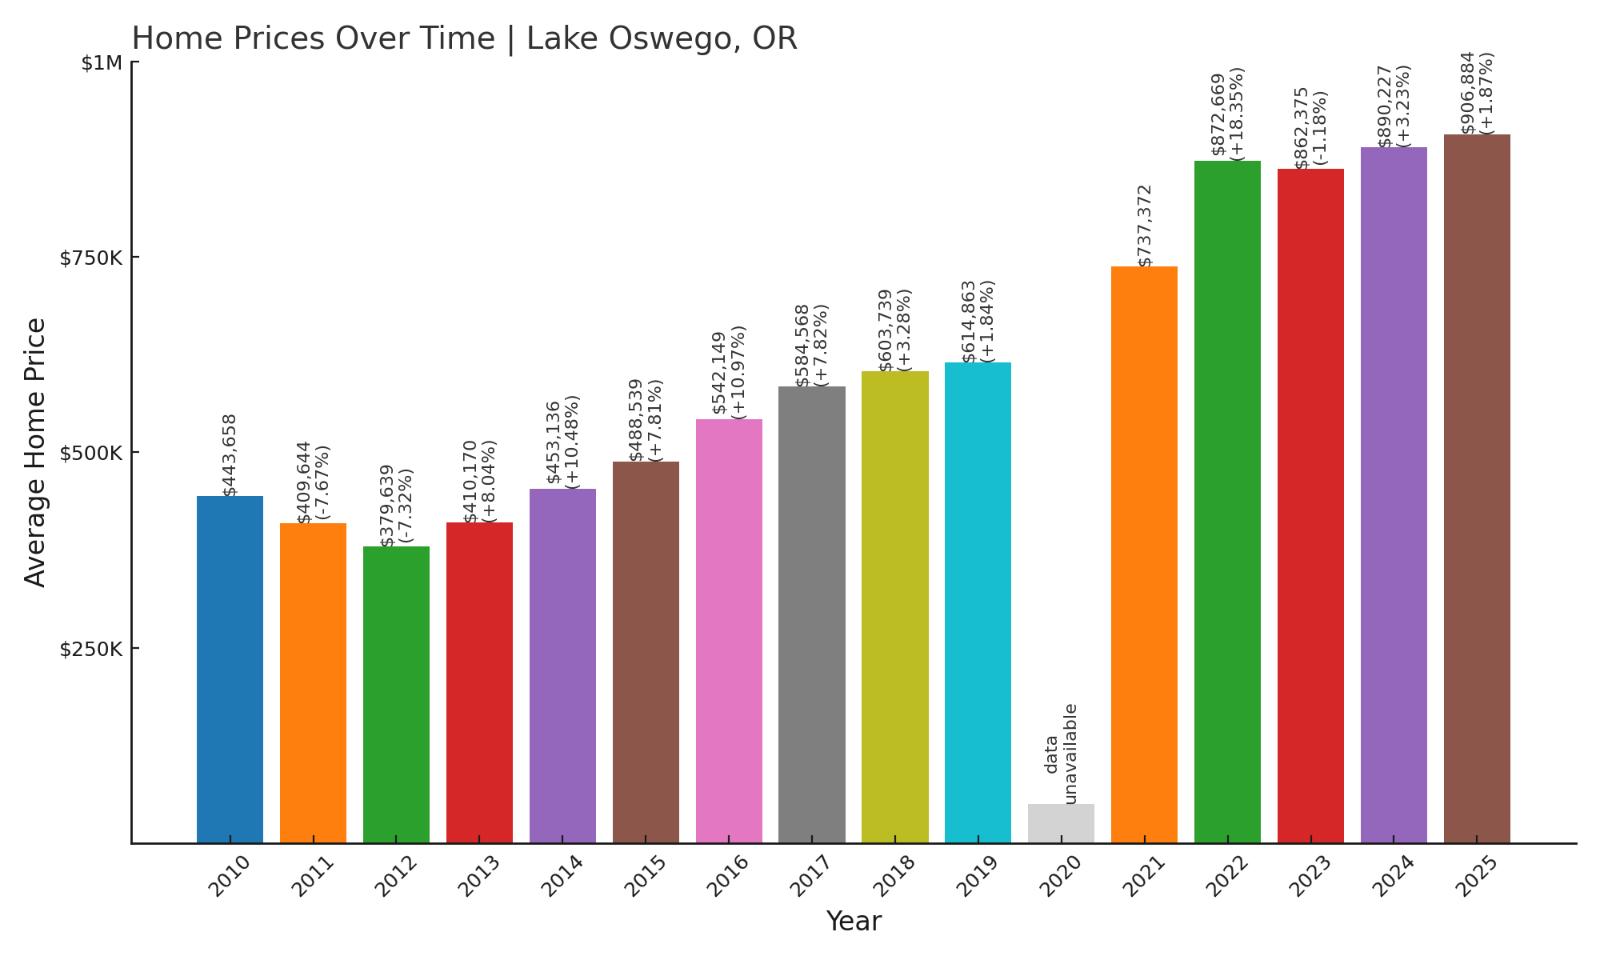
- 2010: $443,658
- 2011: $409,644 (-$34,014, -7.67% from previous year)
- 2012: $379,639 (-$30,005, -7.32% from previous year)
- 2013: $410,170 (+$30,531, +8.04% from previous year)
- 2014: $453,136 (+$42,966, +10.47% from previous year)
- 2015: $488,539 (+$35,403, +7.81% from previous year)
- 2016: $542,149 (+$53,610, +10.97% from previous year)
- 2017: $584,568 (+$42,419, +7.82% from previous year)
- 2018: $603,739 (+$19,171, +3.28% from previous year)
- 2019: $614,863 (+$11,124, +1.84% from previous year)
- 2020: N/A
- 2021: $737,372
- 2022: $872,669 (+$135,297, +18.35% from previous year)
- 2023: $862,375 (-$10,294, -1.18% from previous year)
- 2024: $890,227 (+$27,852, +3.23% from previous year)
- 2025: $906,884 (+$16,657, +1.87% from previous year)
Lake Oswego’s home prices have risen over 100% since 2010, marking it as one of Oregon’s top-tier residential markets. Known for stability and affluence, the area continues to command a premium in 2025.
Lake Oswego – Consistently One of Oregon’s Finest
Lake Oswego is a well-established, upscale suburb of Portland known for its private lake, excellent schools, and manicured neighborhoods. It’s long been a benchmark for luxury living in Oregon.
The real estate market here has remained remarkably resilient. Even during broader market corrections, demand remains strong, and inventory is low. As of 2025, the average home price has crossed $900,000.
4. Cannon Beach – 108% Home Price Increase Since 2010
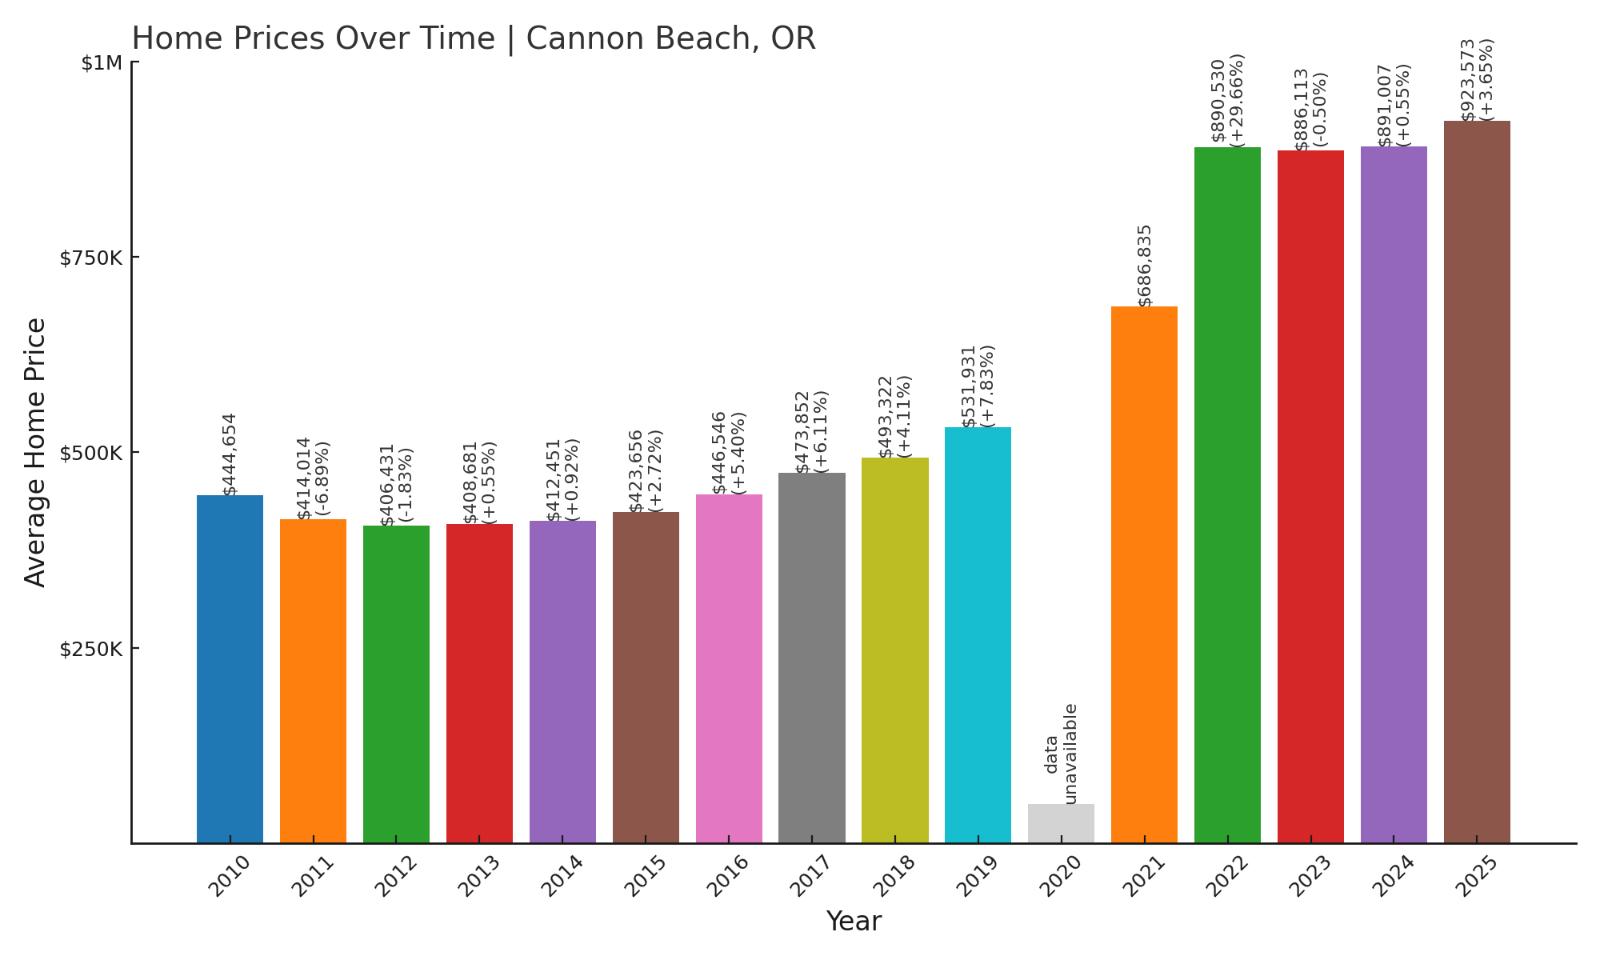
- 2010: $444,654
- 2011: $414,014 (-$30,640, -6.89% from previous year)
- 2012: $406,431 (-$7,583, -1.83% from previous year)
- 2013: $408,681 (+$2,250, +0.55% from previous year)
- 2014: $412,451 (+$3,770, +0.92% from previous year)
- 2015: $423,656 (+$11,205, +2.72% from previous year)
- 2016: $446,546 (+$22,890, +5.40% from previous year)
- 2017: $473,852 (+$27,306, +6.12% from previous year)
- 2018: $493,322 (+$19,470, +4.11% from previous year)
- 2019: $531,931 (+$38,609, +7.83% from previous year)
- 2020: N/A
- 2021: $686,835
- 2022: $890,530 (+$203,695, +29.66% from previous year)
- 2023: $886,113 (-$4,417, -0.50% from previous year)
- 2024: $891,007 (+$4,894, +0.55% from previous year)
- 2025: $923,573 (+$32,566, +3.66% from previous year)
Home prices in Cannon Beach have climbed 108% since 2010, with significant acceleration in the last five years. As of 2025, prices are continuing to rise, with homes now averaging over $920,000.
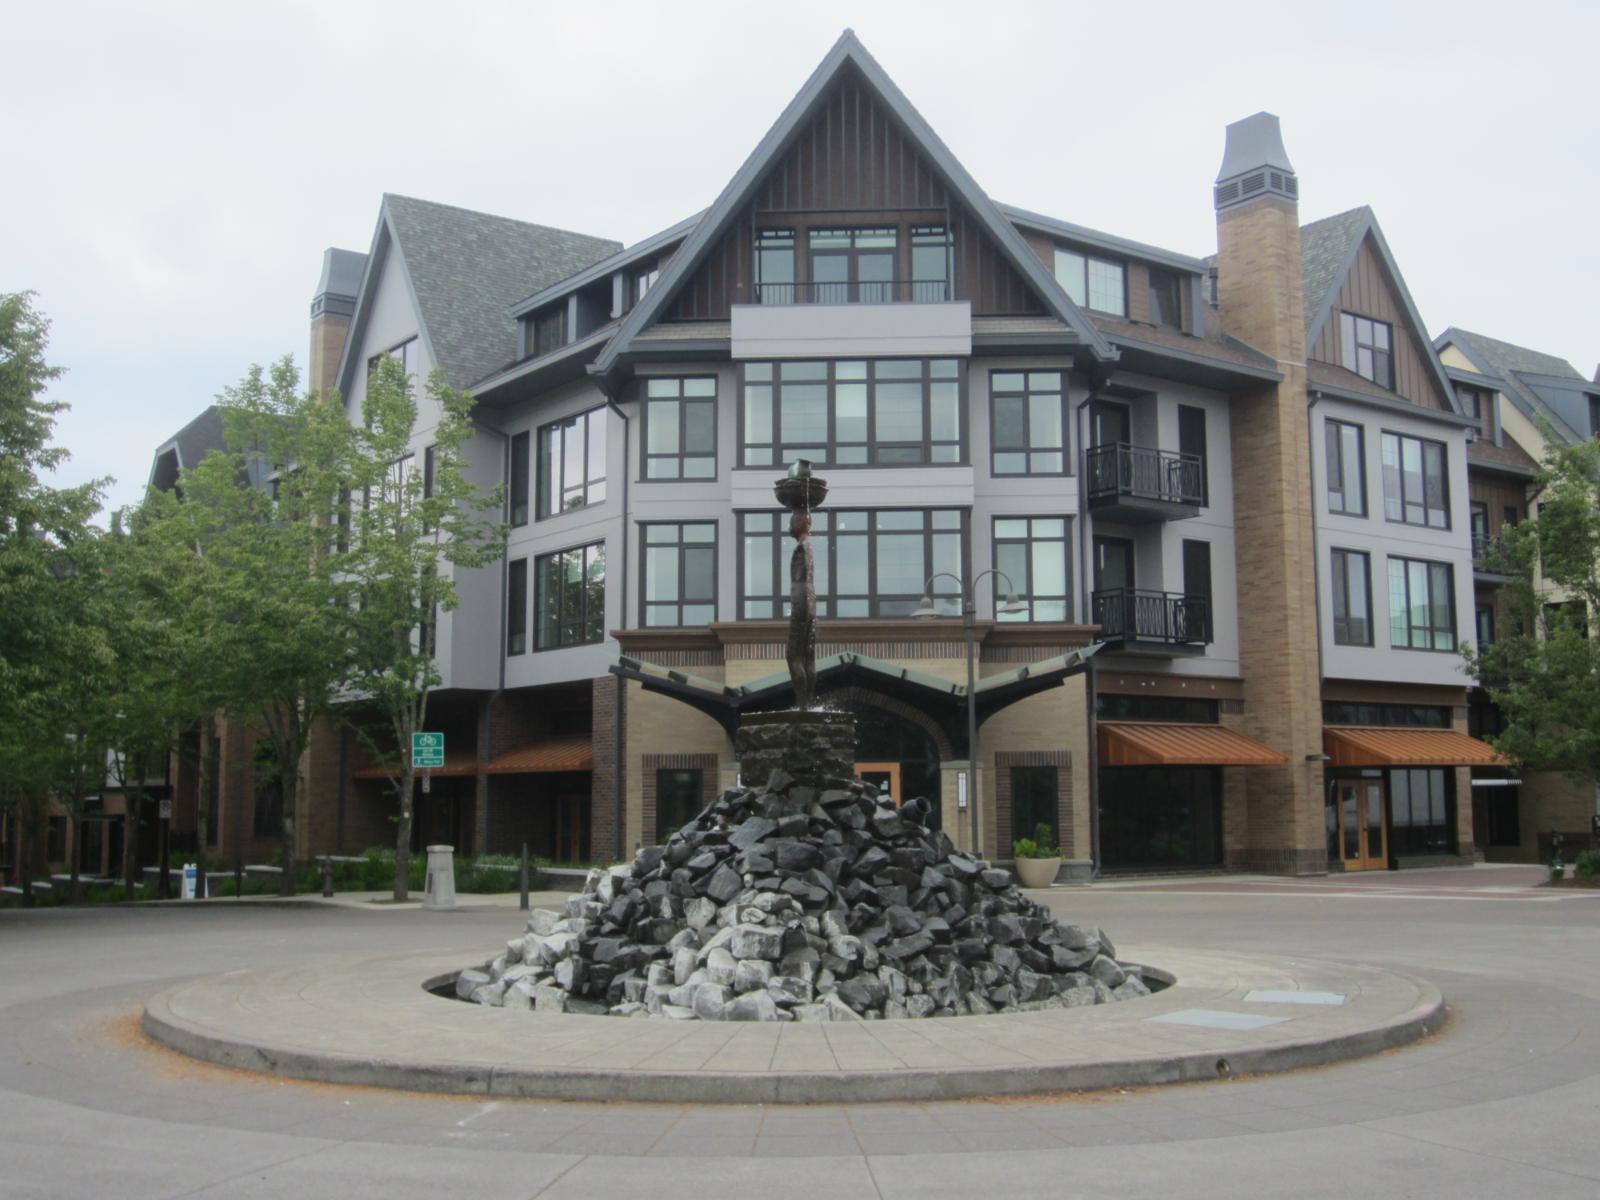
Cannon Beach – Oregon’s Most Iconic Shoreline Comes at a Price
Cannon Beach is one of the most photographed spots on the Oregon Coast, home to Haystack Rock and an upscale tourist scene. It’s a top choice for second homes and vacation rentals, which has pushed inventory down and values up.
The market here is competitive and seasonal, but the long-term appreciation has been steady. Scenic views and walkable charm make this town one of the priciest places to live on the coast.
3. Raleigh Hills – 112% Home Price Increase Since 2010
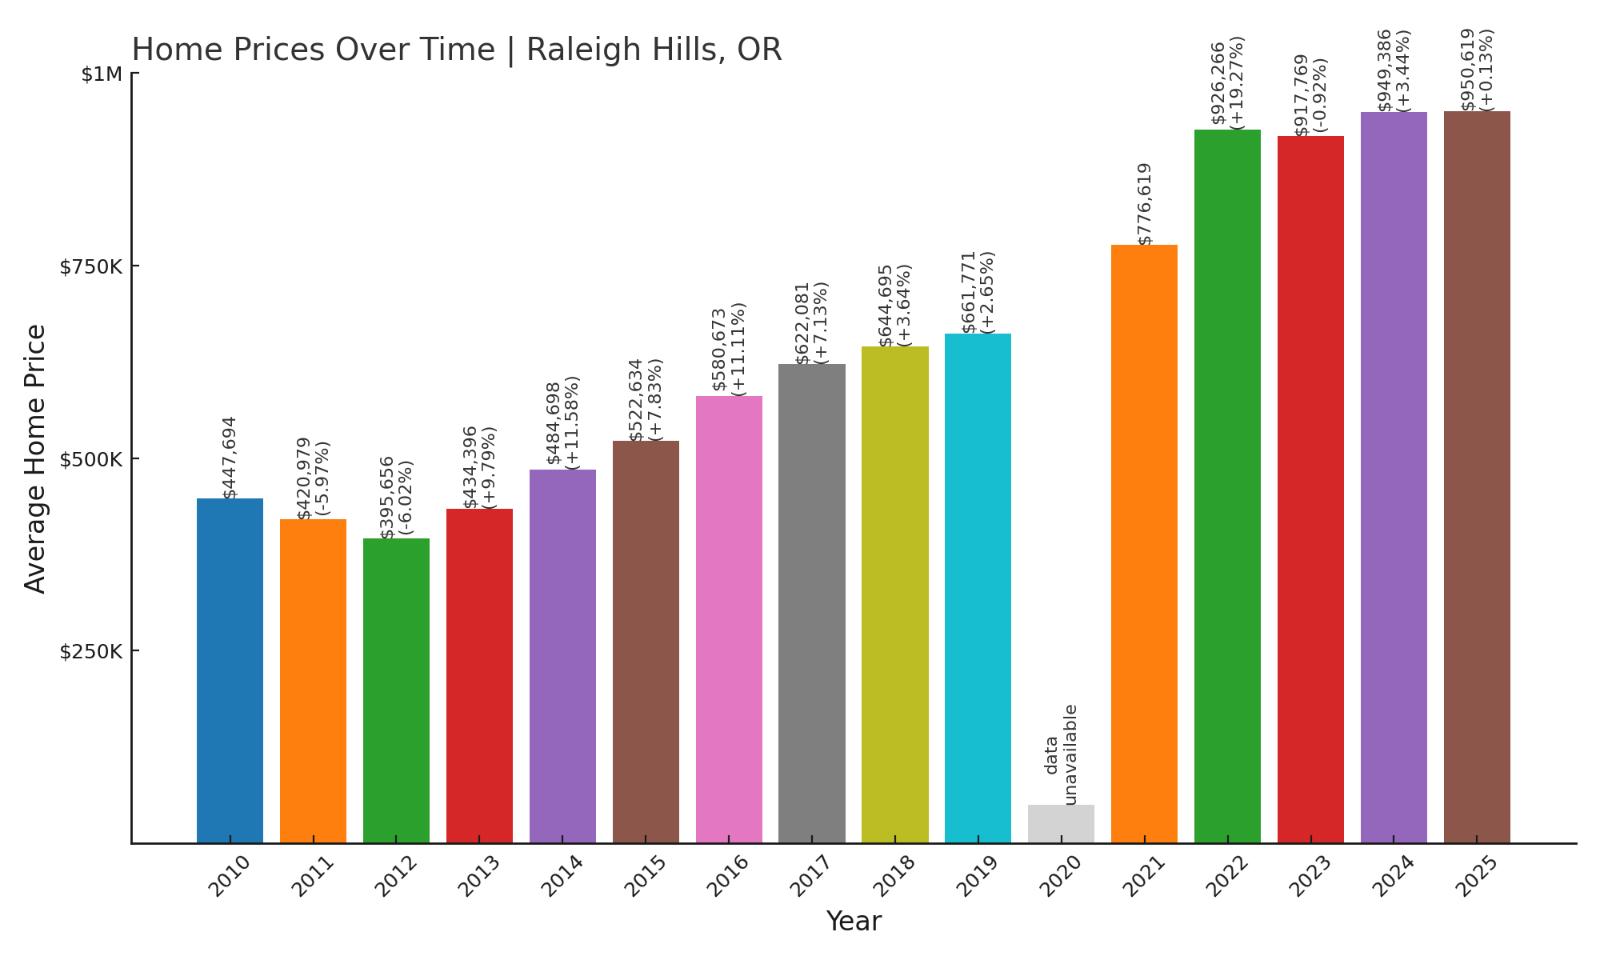
- 2010: $447,694
- 2011: $420,979 (-$26,715, -5.97% from previous year)
- 2012: $395,656 (-$25,323, -6.02% from previous year)
- 2013: $434,396 (+$38,740, +9.79% from previous year)
- 2014: $484,698 (+$50,302, +11.58% from previous year)
- 2015: $522,634 (+$37,936, +7.83% from previous year)
- 2016: $580,673 (+$58,039, +11.10% from previous year)
- 2017: $622,081 (+$41,408, +7.13% from previous year)
- 2018: $644,695 (+$22,614, +3.64% from previous year)
- 2019: $661,771 (+$17,076, +2.65% from previous year)
- 2020: N/A
- 2021: $776,619
- 2022: $926,266 (+$149,647, +19.27% from previous year)
- 2023: $917,769 (-$8,497, -0.92% from previous year)
- 2024: $949,386 (+$31,617, +3.44% from previous year)
- 2025: $950,619 (+$1,233, +0.13% from previous year)
Home values in Raleigh Hills have increased by 112% since 2010, bolstered by its desirable location and solid school zones. Growth has been steady and strong with prices now nearing the $1 million mark.
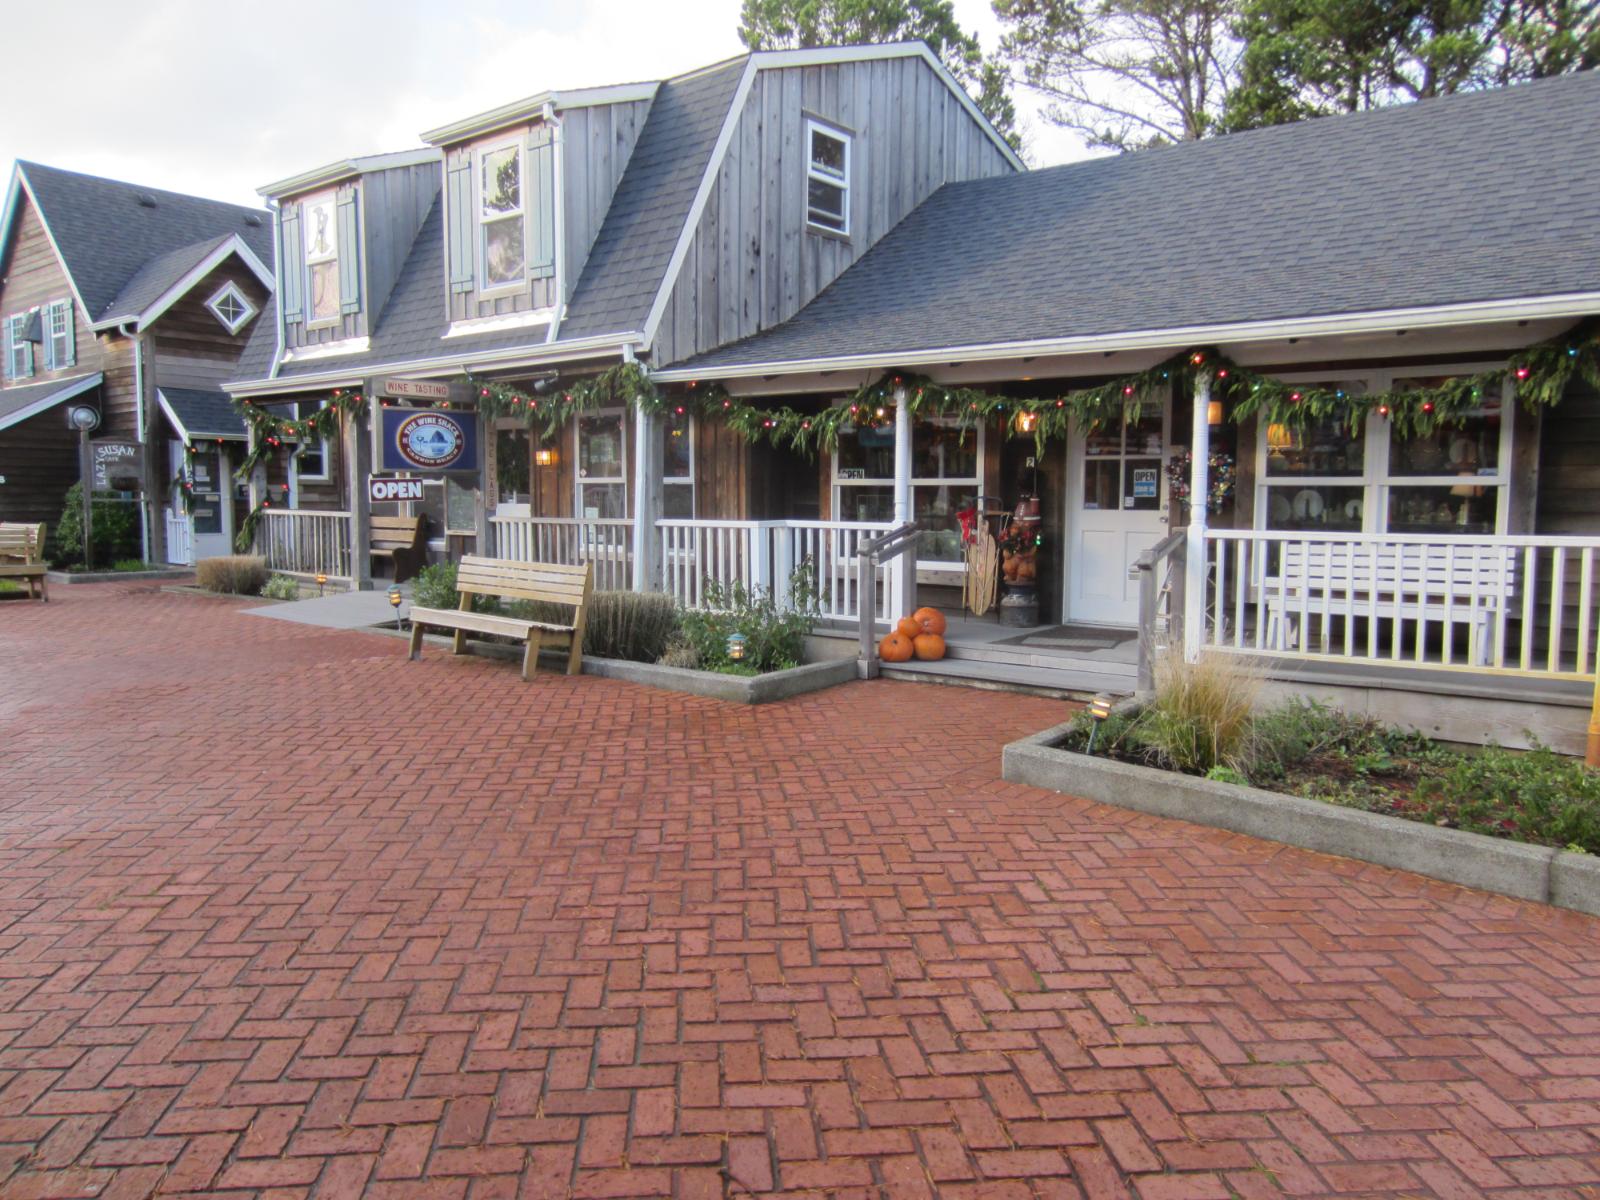
Raleigh Hills – Suburban Comfort with City Access
Raleigh Hills is an unincorporated suburb west of Portland. It offers quiet neighborhoods, large homes, and quick access to downtown via Beaverton-Hillsdale Highway. The mix of space and convenience makes it popular with families and professionals.
Home values rose rapidly during the pandemic and have remained stable. With limited new construction and high demand, prices continue to rise into 2025.
2. Arch Cape – 95% Home Price Increase Since 2010

- 2010: $489,005
- 2011: $444,115 (-$44,890, -9.18% from previous year)
- 2012: $433,136 (-$10,979, -2.47% from previous year)
- 2013: $439,729 (+$6,593, +1.52% from previous year)
- 2014: $463,162 (+$23,433, +5.33% from previous year)
- 2015: $490,041 (+$26,879, +5.80% from previous year)
- 2016: $515,862 (+$25,821, +5.27% from previous year)
- 2017: $558,065 (+$42,203, +8.18% from previous year)
- 2018: $553,594 (-$4,471, -0.80% from previous year)
- 2019: $594,360 (+$40,766, +7.36% from previous year)
- 2020: N/A
- 2021: $748,982
- 2022: $951,725 (+$202,743, +27.07% from previous year)
- 2023: $937,082 (-$14,643, -1.54% from previous year)
- 2024: $960,920 (+$23,838, +2.54% from previous year)
- 2025: $953,538 (-$7,382, -0.77% from previous year)
Arch Cape home values have surged by 95% since 2010, and prices remain above $950,000 in 2025. This coastal enclave has become a favorite for buyers wanting a quieter alternative to Cannon Beach.
Arch Cape – Quiet Luxury on the Coast
Just south of Cannon Beach, Arch Cape is a residential community with dramatic bluffs, tidepools, and private beach access. It’s prized for its low density, natural setting, and high-end homes tucked into the trees.
Real estate here is highly exclusive. With limited listings and strong demand, prices have steadily climbed. While small fluctuations occur, the overall trajectory continues upward.
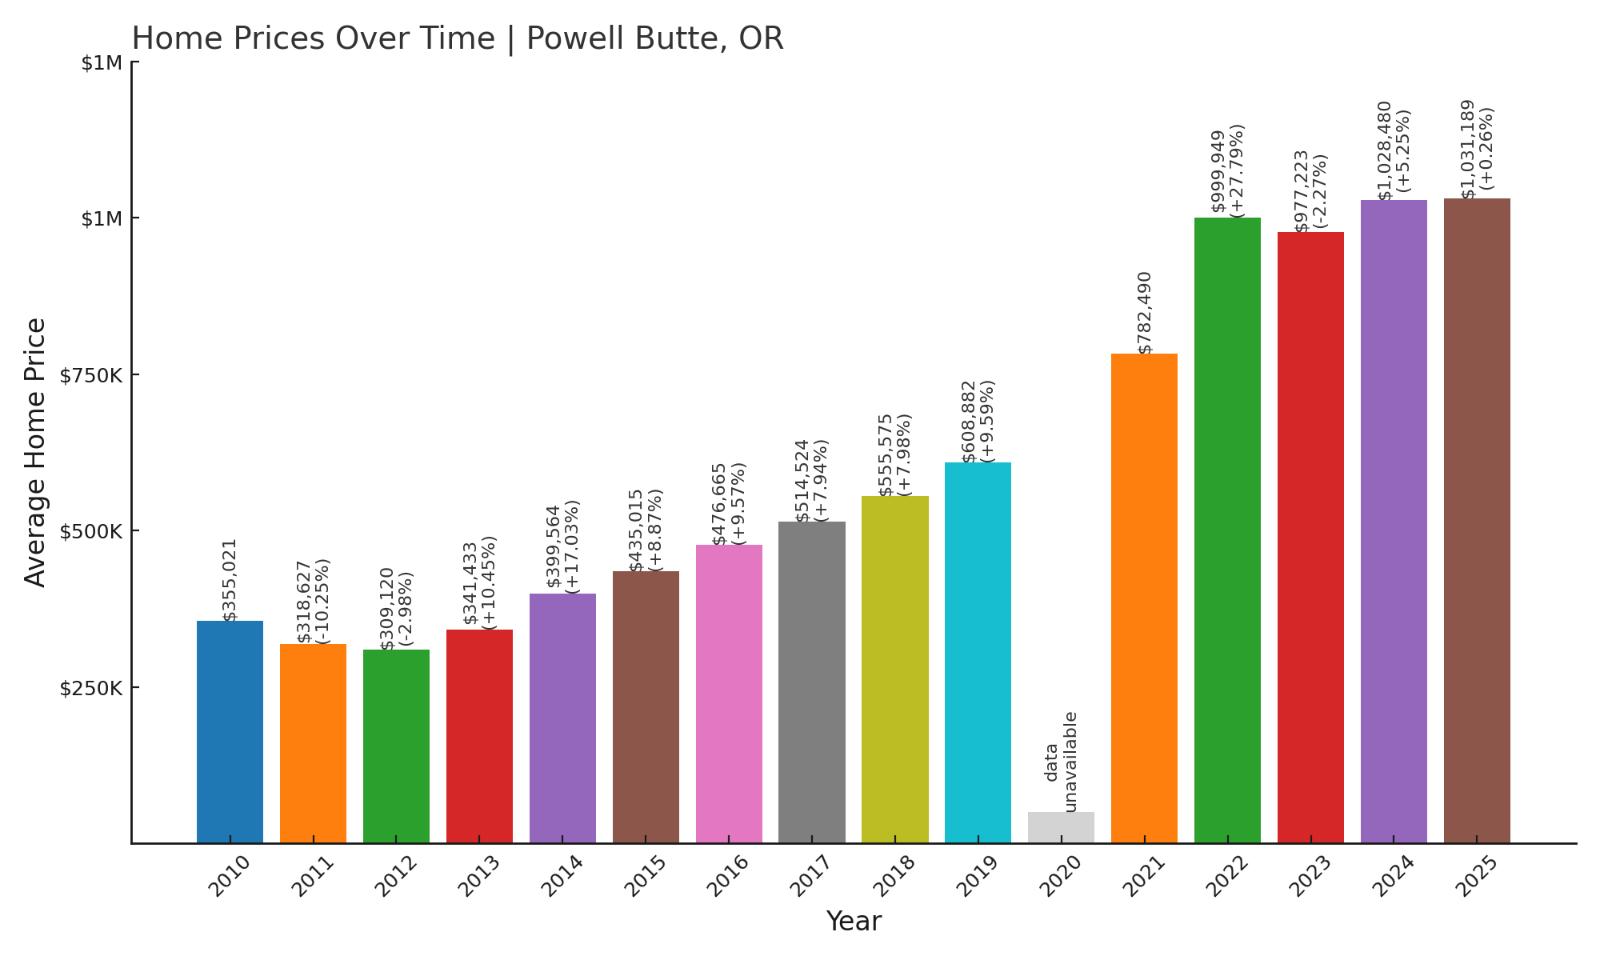
1. Powell Butte – 190% Home Price Increase Since 2010
Would you like to save this?
- 2010: $355,021
- 2011: $318,627 (-$36,394, -10.25% from previous year)
- 2012: $309,120 (-$9,507, -2.98% from previous year)
- 2013: $341,433 (+$32,313, +10.45% from previous year)
- 2014: $399,564 (+$58,131, +17.02% from previous year)
- 2015: $435,015 (+$35,451, +8.87% from previous year)
- 2016: $476,665 (+$41,650, +9.57% from previous year)
- 2017: $514,524 (+$37,859, +7.94% from previous year)
- 2018: $555,575 (+$41,051, +7.98% from previous year)
- 2019: $608,882 (+$53,307, +9.59% from previous year)
- 2020: N/A
- 2021: $782,490
- 2022: $999,949 (+$217,459, +27.78% from previous year)
- 2023: $977,223 (-$22,726, -2.27% from previous year)
- 2024: $1,028,480 (+$51,257, +5.24% from previous year)
- 2025: $1,031,189 (+$2,709, +0.26% from previous year)
Powell Butte tops the list with a 190% increase since 2010. Home prices crossed the $1 million mark in 2024, driven by large parcels, mountain views, and premium rural living.
Powell Butte – Oregon’s Most Expensive Market in 2025
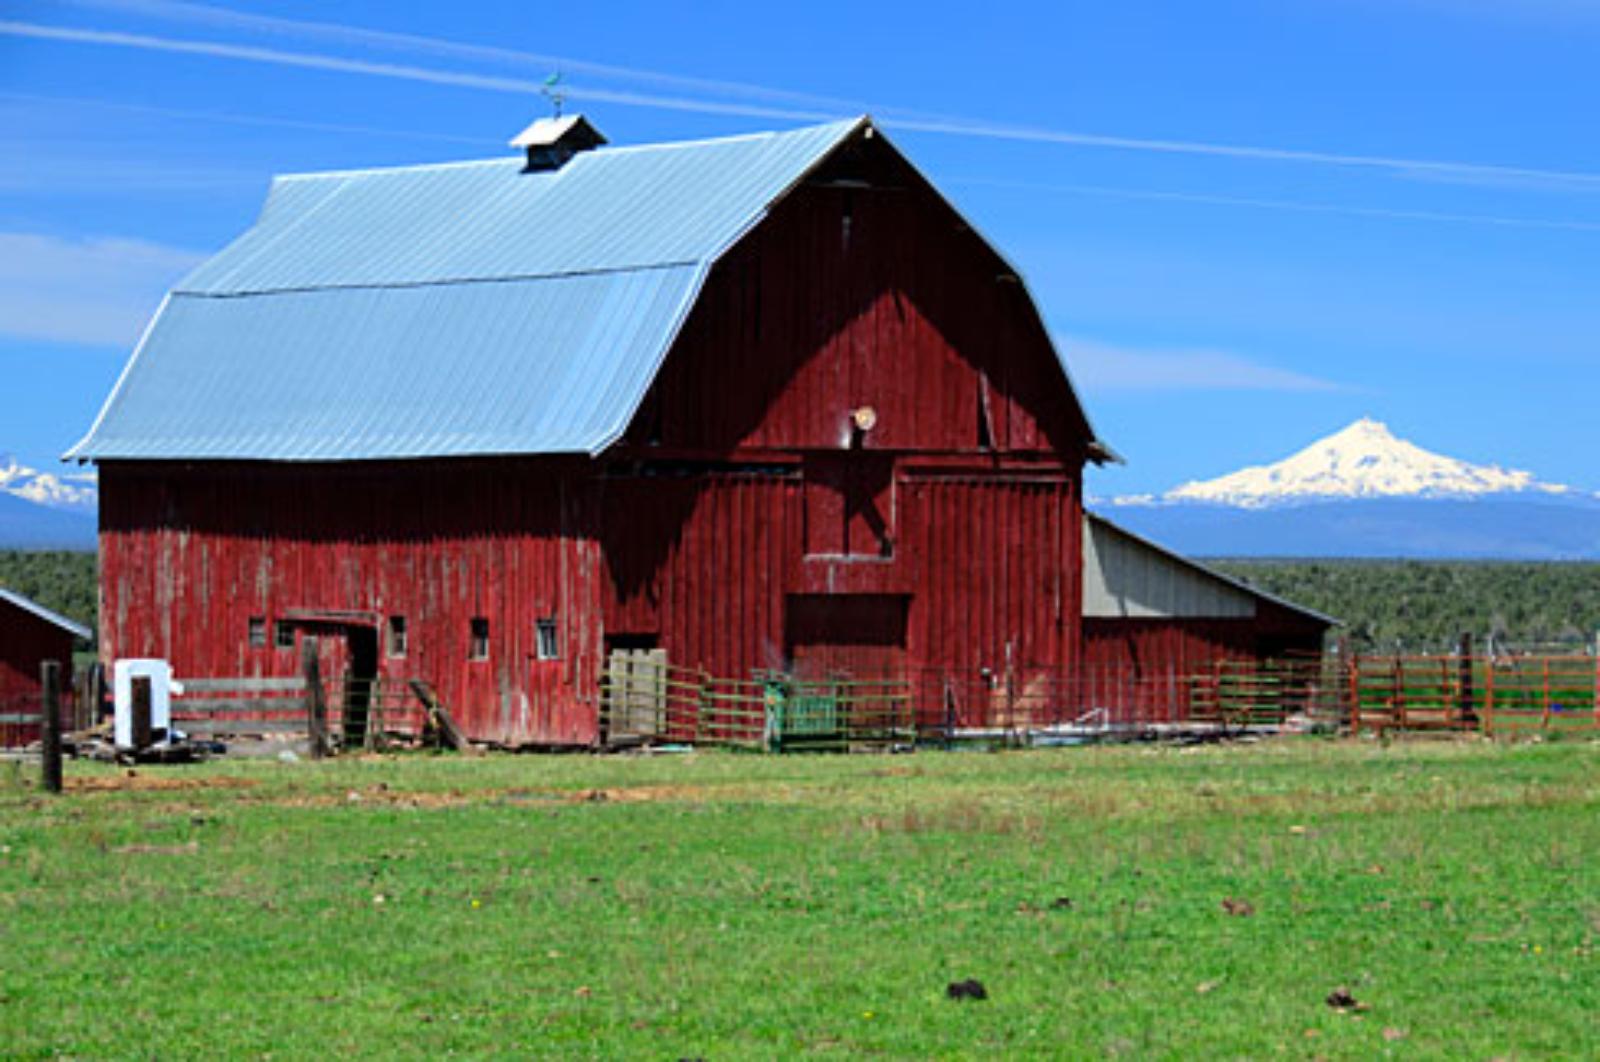
Located in Crook County east of Bend, Powell Butte offers luxury ranches, panoramic views, and space to spare. Its rural luxury appeal has attracted buyers from across the West Coast.
As of 2025, average prices exceed $1 million, making Powell Butte the most expensive town in Oregon. The combination of exclusivity and landscape-driven lifestyle has elevated it to the top spot.