🔥 Would you like to save this?
Washington’s housing market has changed fast—and in some towns, the numbers are staggering. According to the Zillow Home Value Index, home values in 18 communities have surged since 2010, outpacing both state and national averages. From tech-driven suburbs to once-sleepy rural towns, these places have become red-hot real estate markets with major staying power.
18. Bothell – 199% Home Price Increase Since 2010
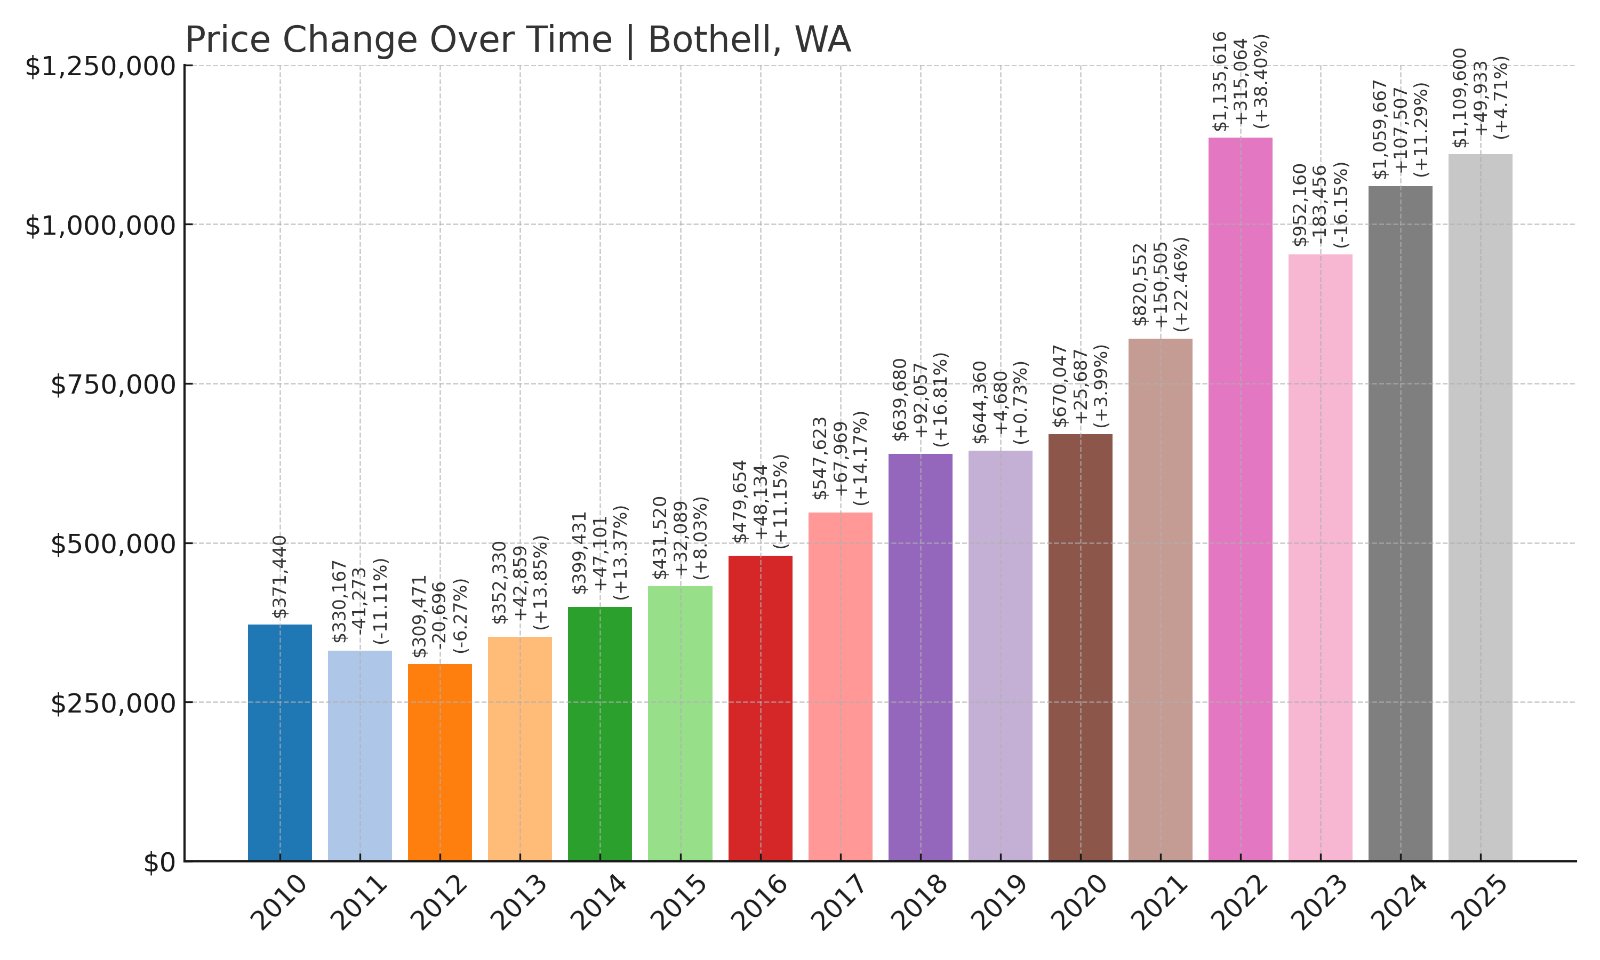
- 2010: $371,440
- 2011: $330,167 (-$41,273, -11.11% from previous year)
- 2012: $309,471 (-$20,696, -6.27% from previous year)
- 2013: $352,330 (+$42,858, +13.85% from previous year)
- 2014: $399,431 (+$47,101, +13.37% from previous year)
- 2015: $431,520 (+$32,089, +8.03% from previous year)
- 2016: $479,654 (+$48,133, +11.15% from previous year)
- 2017: $547,623 (+$67,970, +14.17% from previous year)
- 2018: $639,680 (+$92,057, +16.81% from previous year)
- 2019: $644,360 (+$4,680, +0.73% from previous year)
- 2020: $670,047 (+$25,688, +3.99% from previous year)
- 2021: $820,552 (+$150,505, +22.46% from previous year)
- 2022: $1,135,616 (+$315,063, +38.40% from previous year)
- 2023: $952,160 (-$183,456, -16.15% from previous year)
- 2024: $1,059,667 (+$107,507, +11.29% from previous year)
- 2025: $1,109,600 (+$49,933, +4.71% from previous year)
Bothell’s home prices nearly tripled since 2010, climbing from $371,440 to over $1.1 million by 2025. While prices dipped in 2011 and again in 2023, the city’s overall growth remains strong. Its strategic location near Seattle’s tech corridor and consistent redevelopment efforts continue to attract buyers.
In order to come up with the very specific design ideas, we create most designs with the assistance of state-of-the-art AI interior design software. Also, assume links that take you off the site are affiliate links such as links to Amazon. this means we may earn a commission if you buy something.
Bothell – Suburban Growth Meets Tech Proximity
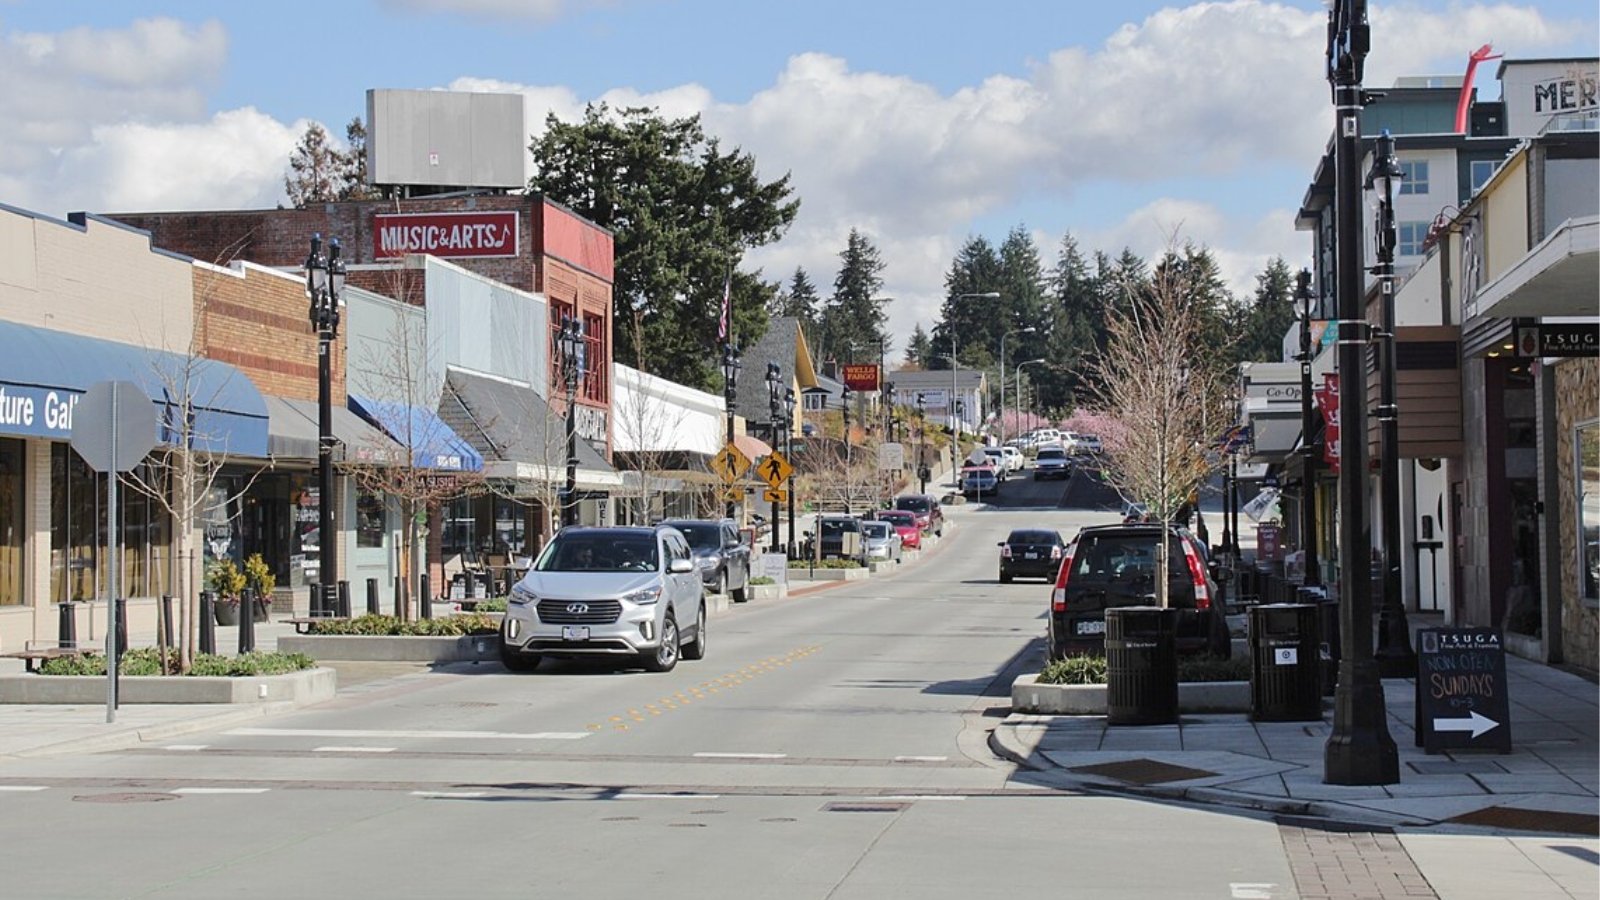
Bothell is located northeast of Seattle, offering residents easy access to major employers like Microsoft and Amazon. The city has invested heavily in revitalizing its downtown, creating walkable streets lined with local businesses and restaurants. This development, combined with top-ranked schools in the Northshore School District, keeps demand high.
In recent years, Bothell’s biotech and medical research sectors have expanded, adding to job opportunities in the area. Its balance of urban convenience and suburban comfort continues to drive prices upward despite market corrections, cementing Bothell’s reputation as one of Washington’s most sought-after communities.
17. Snoqualmie – 222% Home Price Increase Since 2010
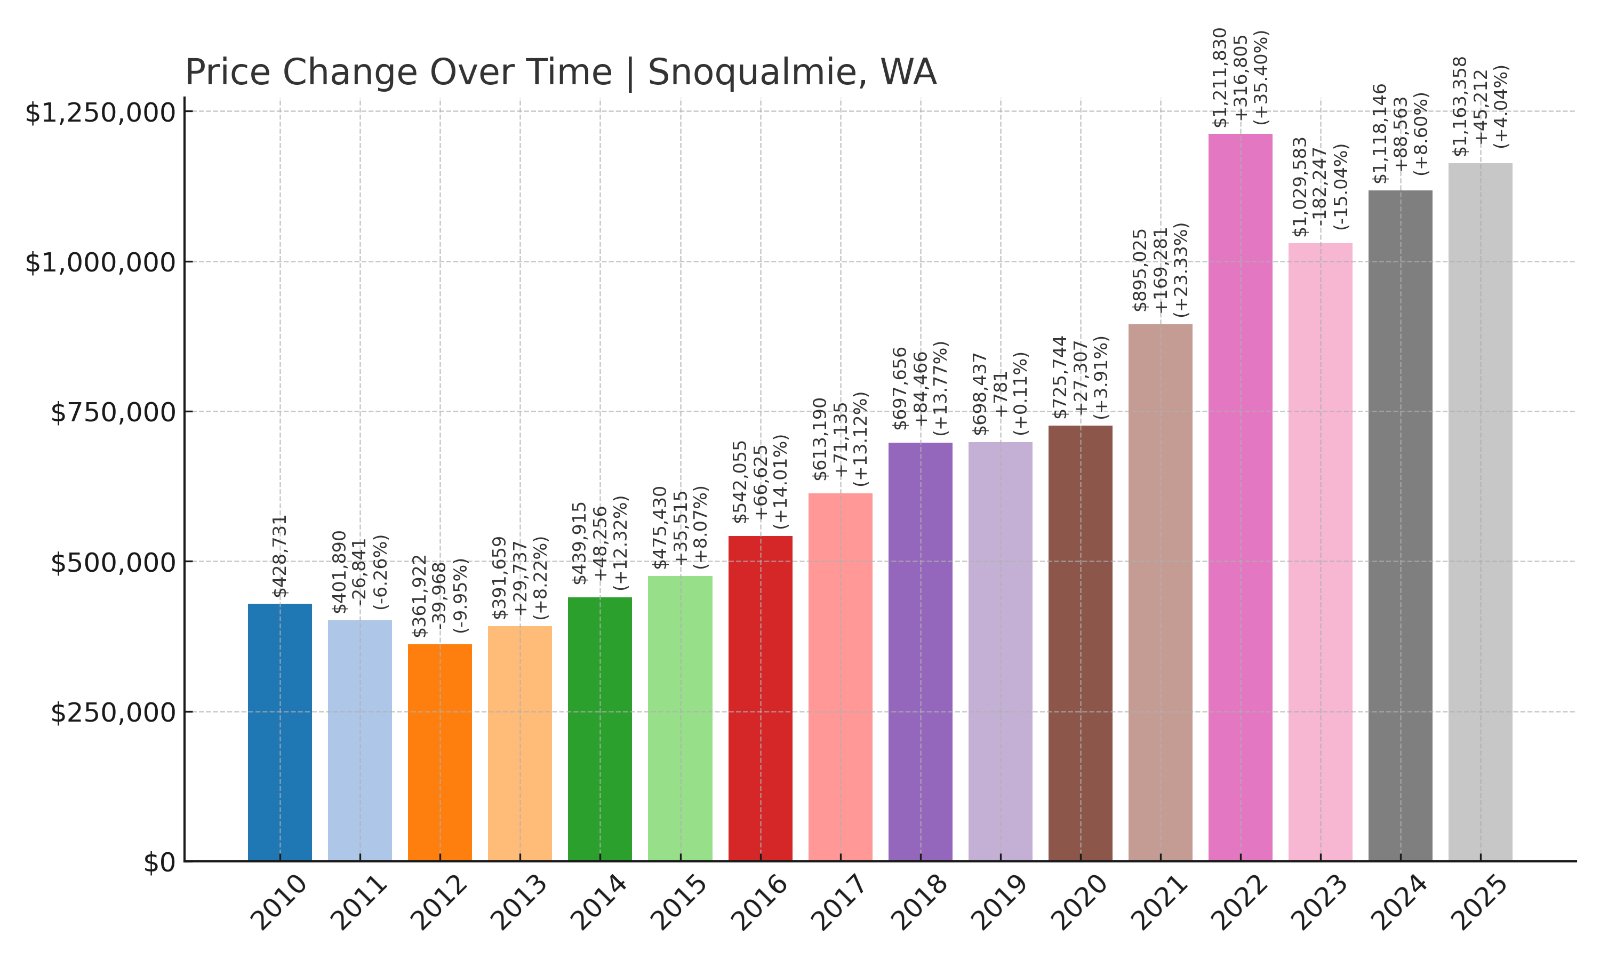
- 2010: $428,731
- 2011: $401,890 (-$26,841, -6.26% from previous year)
- 2012: $361,922 (-$39,969, -9.95% from previous year)
- 2013: $391,659 (+$29,738, +8.22% from previous year)
- 2014: $439,915 (+$48,255, +12.32% from previous year)
- 2015: $475,430 (+$35,515, +8.07% from previous year)
- 2016: $542,055 (+$66,625, +14.01% from previous year)
- 2017: $613,190 (+$71,135, +13.12% from previous year)
- 2018: $697,656 (+$84,466, +13.77% from previous year)
- 2019: $698,437 (+$781, +0.11% from previous year)
- 2020: $725,744 (+$27,307, +3.91% from previous year)
- 2021: $895,025 (+$169,282, +23.33% from previous year)
- 2022: $1,211,830 (+$316,805, +35.40% from previous year)
- 2023: $1,029,583 (-$182,247, -15.04% from previous year)
- 2024: $1,118,146 (+$88,563, +8.60% from previous year)
- 2025: $1,163,358 (+$45,212, +4.04% from previous year)
Snoqualmie’s home prices have climbed from $428,731 in 2010 to $1.16 million in 2025, with only brief declines in 2011, 2012, and 2023. Its popularity is driven by its natural beauty, historic charm, and access to Bellevue and Seattle employment centers.
Snoqualmie – Living Among Waterfalls and Mountains
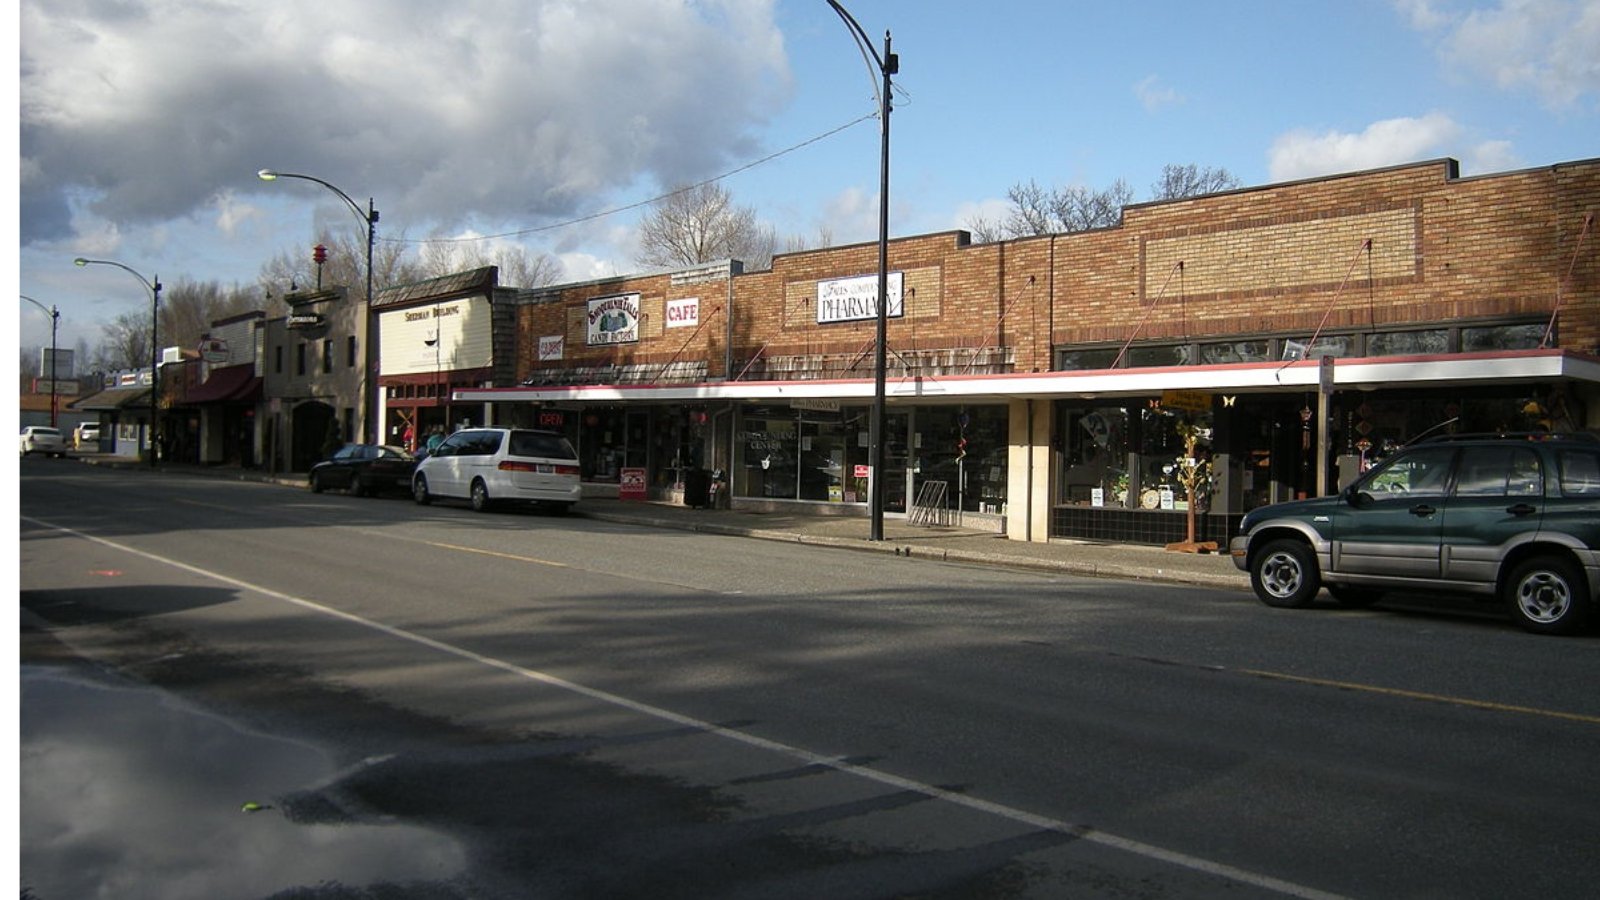
Famous for Snoqualmie Falls, a stunning 268-foot waterfall, the town draws both tourists and new residents seeking scenic beauty. Neighborhoods like Snoqualmie Ridge offer modern homes, golf courses, and parks with mountain views. Residents enjoy a quiet lifestyle just a 30-minute drive from Bellevue’s offices.
Data shows that Snoqualmie’s rapid appreciation is linked to its excellent schools and high quality of life. According to the Washington Office of Superintendent of Public Instruction, local schools rank among the top in the state. This makes Snoqualmie especially attractive to families prioritizing education and outdoor recreation.
16. Issaquah – 191% Home Price Increase Since 2010
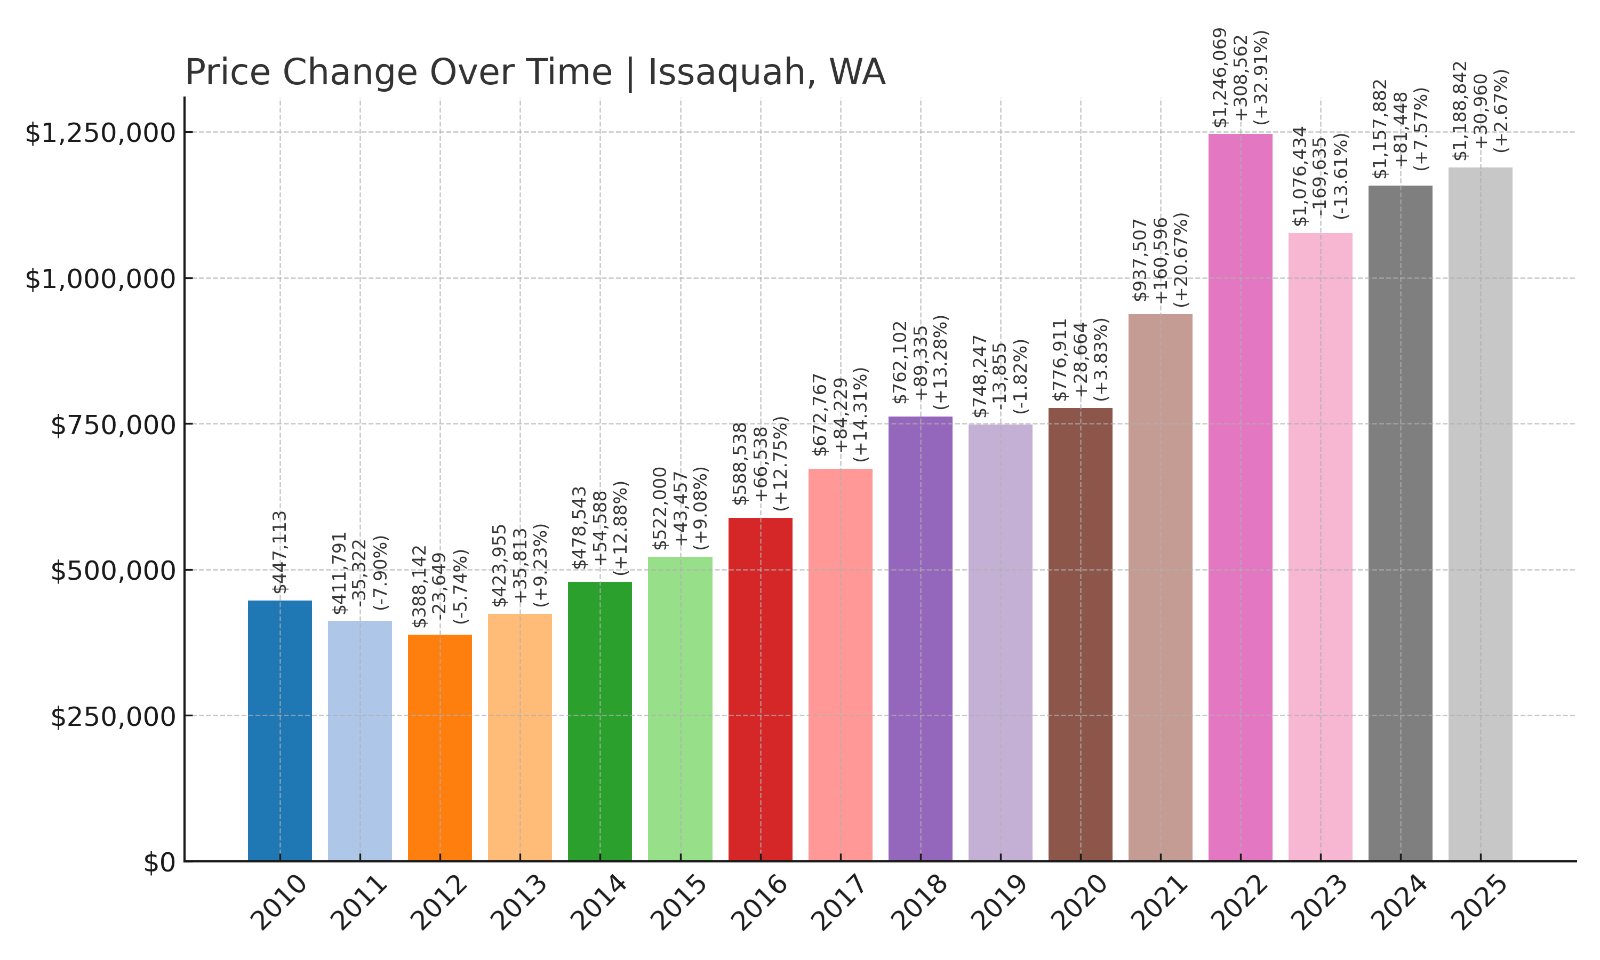
- 2010: $447,113
- 2011: $411,791 (-$35,322, -7.90% from previous year)
- 2012: $388,142 (-$23,648, -5.74% from previous year)
- 2013: $423,955 (+$35,812, +9.23% from previous year)
- 2014: $478,543 (+$54,589, +12.88% from previous year)
- 2015: $522,000 (+$43,456, +9.08% from previous year)
- 2016: $588,538 (+$66,538, +12.75% from previous year)
- 2017: $672,767 (+$84,230, +14.31% from previous year)
- 2018: $762,102 (+$89,335, +13.28% from previous year)
- 2019: $748,247 (-$13,855, -1.82% from previous year)
- 2020: $776,911 (+$28,664, +3.83% from previous year)
- 2021: $937,507 (+$160,596, +20.67% from previous year)
- 2022: $1,246,069 (+$308,562, +32.91% from previous year)
- 2023: $1,076,434 (-$169,635, -13.61% from previous year)
- 2024: $1,157,882 (+$81,448, +7.57% from previous year)
- 2025: $1,188,842 (+$30,960, +2.67% from previous year)
Issaquah’s home prices have almost doubled since 2010, from $447,113 to nearly $1.19 million. Despite market corrections in 2011, 2012, and 2023, its long-term trend remains strong, driven by its combination of urban access and outdoor amenities.
Issaquah – Where City Meets Wilderness
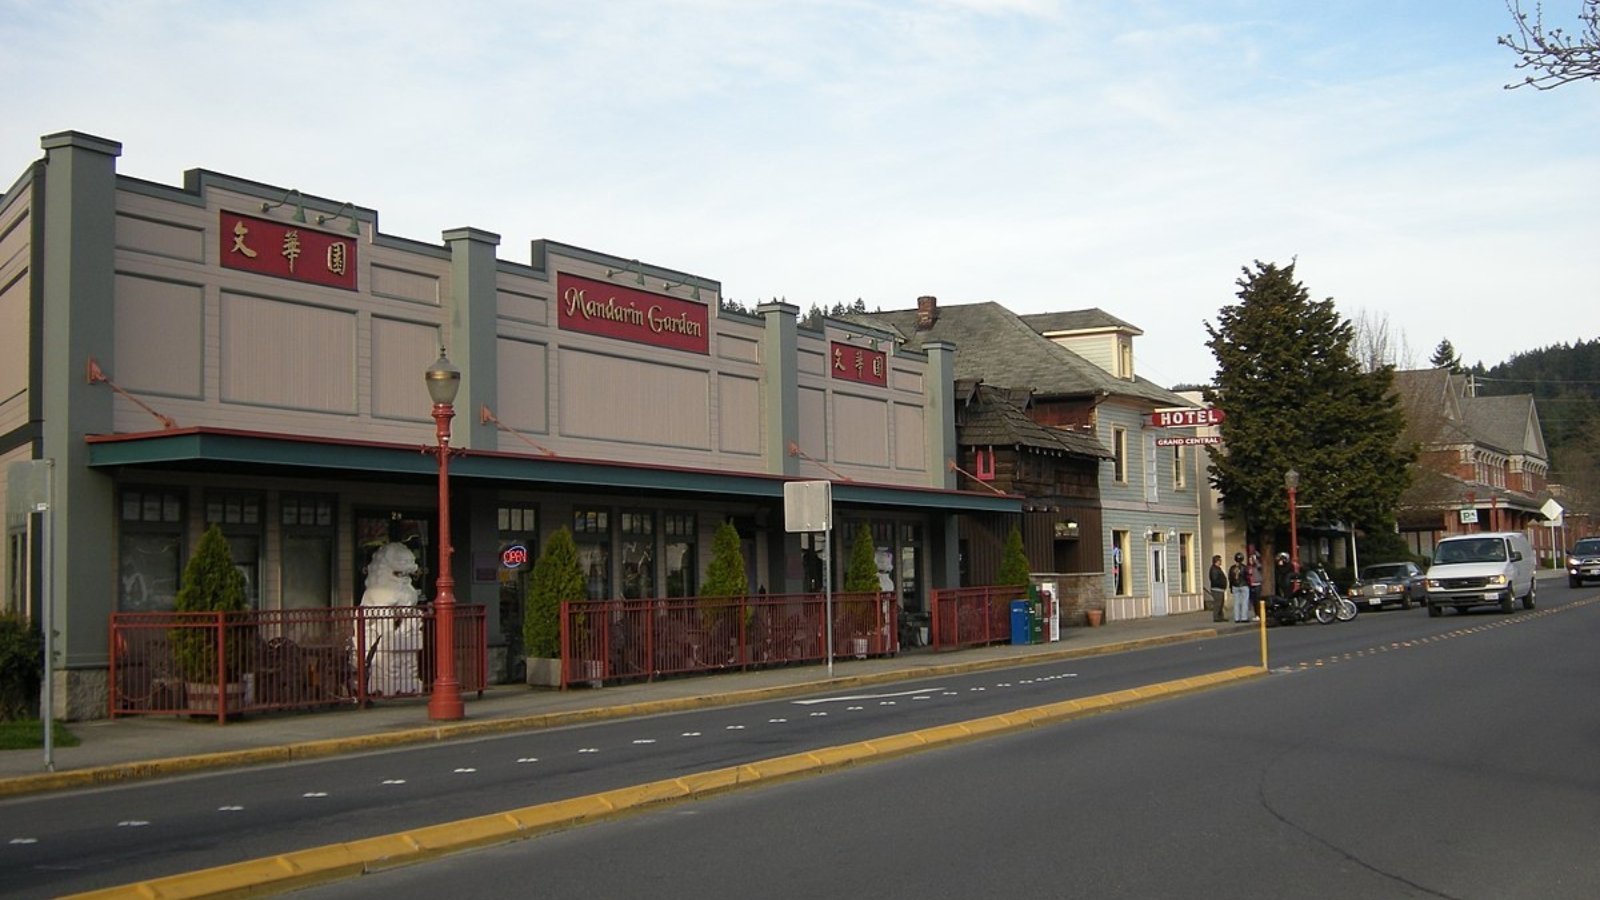
Located along I-90 east of Seattle, Issaquah offers quick commutes while bordering the Cascade foothills. The town is known for Tiger Mountain State Forest, paragliding launches, and hiking trails minutes from residential areas. Its historic downtown adds local character with restaurants and galleries in restored early-20th-century buildings.
Issaquah schools consistently rank among the best in King County, further supporting its popularity. According to Zillow, continued price increases in 2024 and 2025 highlight steady buyer demand. The area appeals to those who want urban convenience without sacrificing outdoor access and quiet neighborhoods.
15. Bainbridge Island – 119% Home Price Increase Since 2010
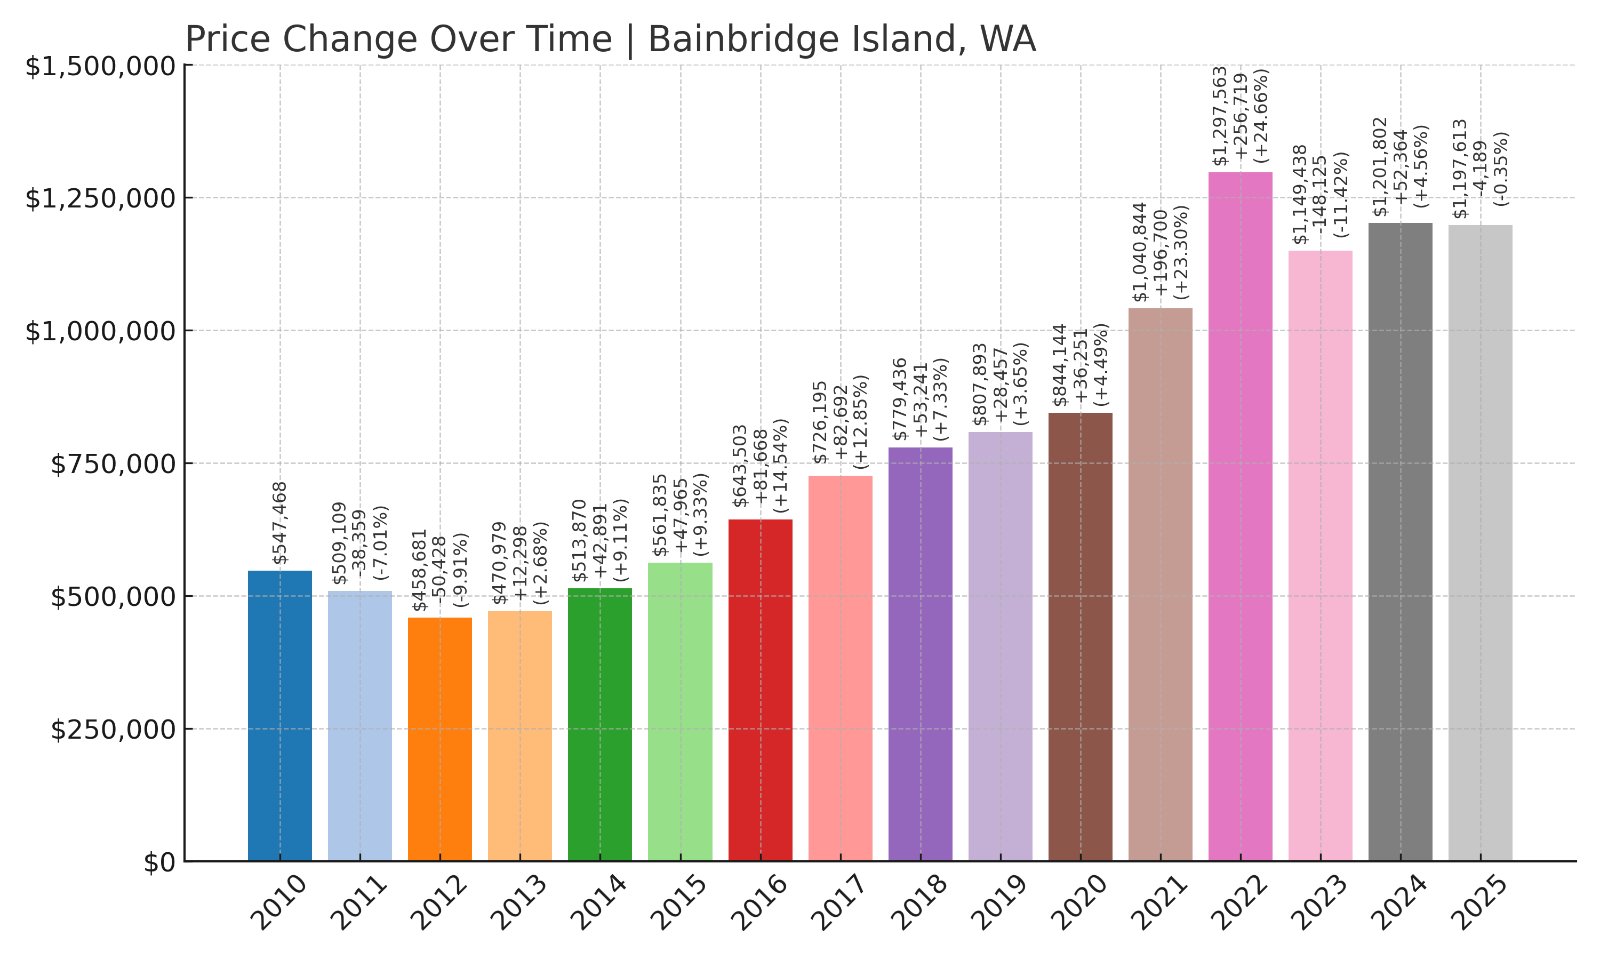
- 2010: $547,468
- 2011: $509,109 (-$38,359, -7.01% from previous year)
- 2012: $458,681 (-$50,428, -9.91% from previous year)
- 2013: $470,979 (+$12,297, +2.68% from previous year)
- 2014: $513,870 (+$42,891, +9.11% from previous year)
- 2015: $561,835 (+$47,965, +9.33% from previous year)
- 2016: $643,503 (+$81,669, +14.54% from previous year)
- 2017: $726,195 (+$82,692, +12.85% from previous year)
- 2018: $779,436 (+$53,241, +7.33% from previous year)
- 2019: $807,893 (+$28,457, +3.65% from previous year)
- 2020: $844,144 (+$36,251, +4.49% from previous year)
- 2021: $1,040,844 (+$196,700, +23.30% from previous year)
- 2022: $1,297,563 (+$256,718, +24.66% from previous year)
- 2023: $1,149,438 (-$148,125, -11.42% from previous year)
- 2024: $1,201,802 (+$52,364, +4.56% from previous year)
- 2025: $1,197,613 (-$4,189, -0.35% from previous year)
Bainbridge Island’s home prices have more than doubled since 2010, peaking above $1.29 million in 2022 before stabilizing around $1.19 million. Its appeal remains strong, driven by ferry access to Seattle and its quiet island lifestyle.
Bainbridge Island – Seattle’s Tranquil Neighbor
Bainbridge Island is a 35-minute ferry ride from downtown Seattle, offering small-town life with easy city access. The island features local farms, wineries, and art galleries, alongside beaches and forests ideal for outdoor activities. Its schools are among Washington’s top-rated according to the Office of Superintendent of Public Instruction.
Housing prices reflect its desirability among commuters and retirees. While 2023 saw a price dip, values remained stable through 2024 and 2025. Bainbridge’s balance of peaceful island living and urban connection continues to sustain strong real estate demand in the Puget Sound region.
14. Fall City – 145% Home Price Increase Since 2010
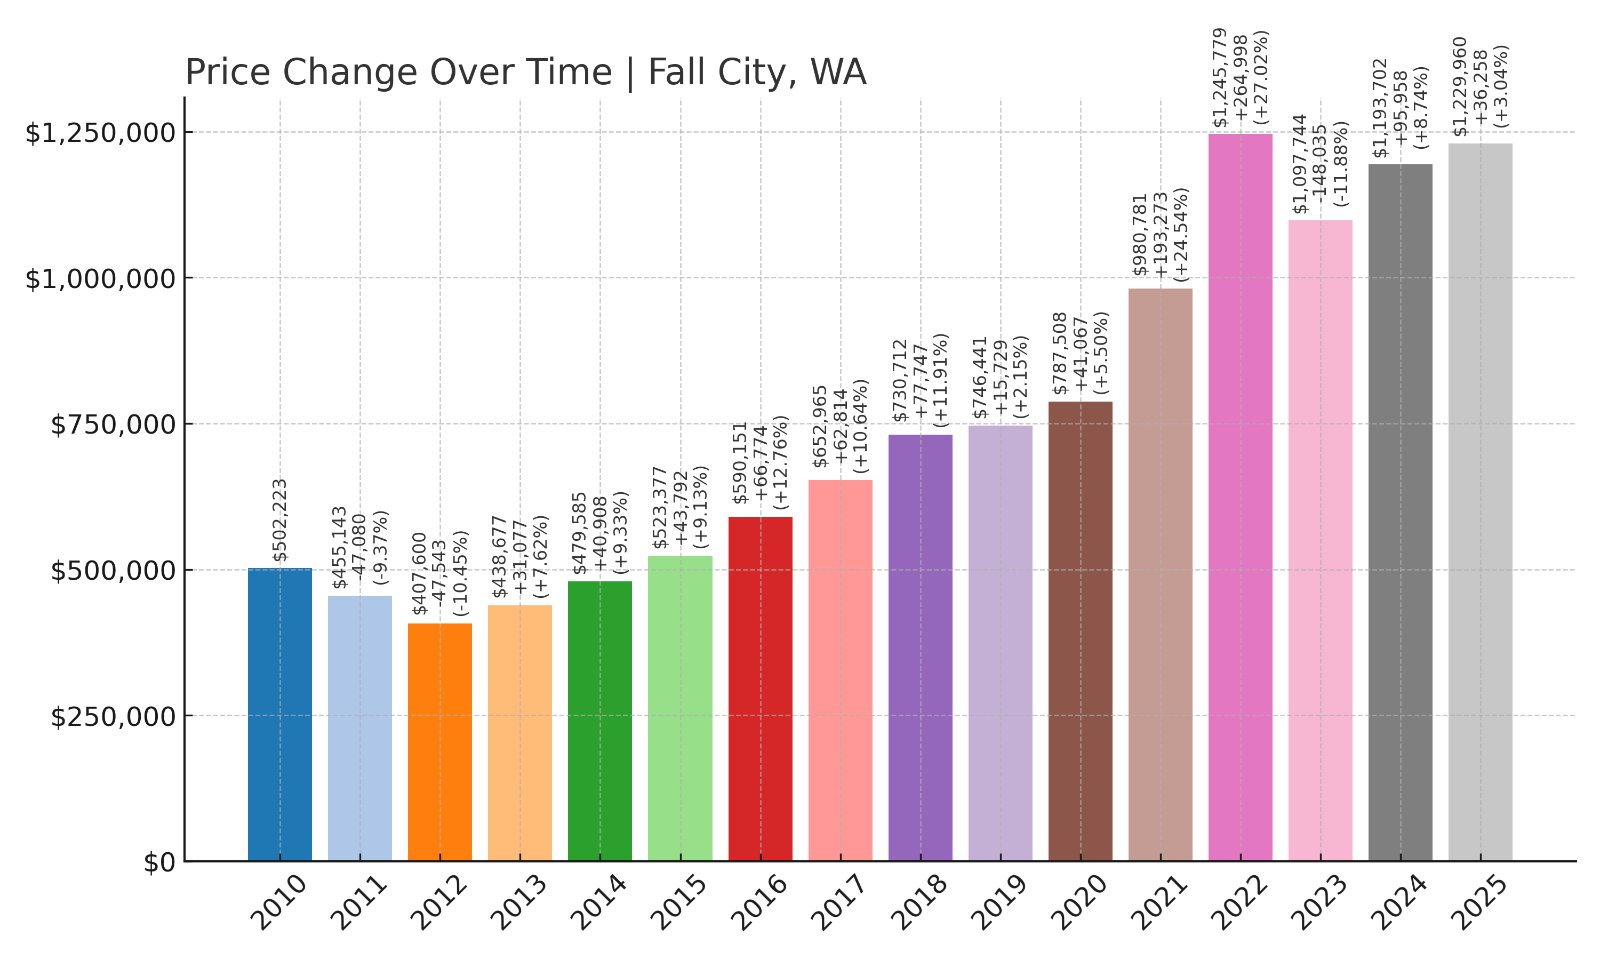
- 2010: $502,223
- 2011: $455,143 (-$47,080, -9.37% from previous year)
- 2012: $407,600 (-$47,543, -10.45% from previous year)
- 2013: $438,677 (+$31,077, +7.62% from previous year)
- 2014: $479,585 (+$40,907, +9.33% from previous year)
- 2015: $523,377 (+$43,792, +9.13% from previous year)
- 2016: $590,151 (+$66,775, +12.76% from previous year)
- 2017: $652,965 (+$62,814, +10.64% from previous year)
- 2018: $730,712 (+$77,746, +11.91% from previous year)
- 2019: $746,441 (+$15,730, +2.15% from previous year)
- 2020: $787,508 (+$41,067, +5.50% from previous year)
- 2021: $980,781 (+$193,273, +24.54% from previous year)
- 2022: $1,245,779 (+$264,998, +27.02% from previous year)
- 2023: $1,097,744 (-$148,036, -11.88% from previous year)
- 2024: $1,193,702 (+$95,958, +8.74% from previous year)
- 2025: $1,229,960 (+$36,258, +3.04% from previous year)
Fall City’s home values have increased by nearly 150% since 2010, rising from just over $500,000 to $1.23 million in 2025. Its affordability relative to other Seattle suburbs and rural charm continue to appeal to buyers seeking space and quiet.
Fall City – Rural Charm With Urban Access
Located along the Snoqualmie River east of Seattle, Fall City offers a rural lifestyle with panoramic views of the Cascade foothills. Its housing market benefits from proximity to Snoqualmie and Issaquah while maintaining a small-town feel with local diners, farmstands, and riverfront parks.
Fall City Elementary serves local families, and the area is known for community events like Fall City Days. According to Zillow data, the town’s price increases slowed slightly after 2022, but values remain strong in 2025. Buyers often choose Fall City for its combination of acreage, quiet living, and convenient access to regional job centers.
13. Kirkland – 209% Home Price Increase Since 2010
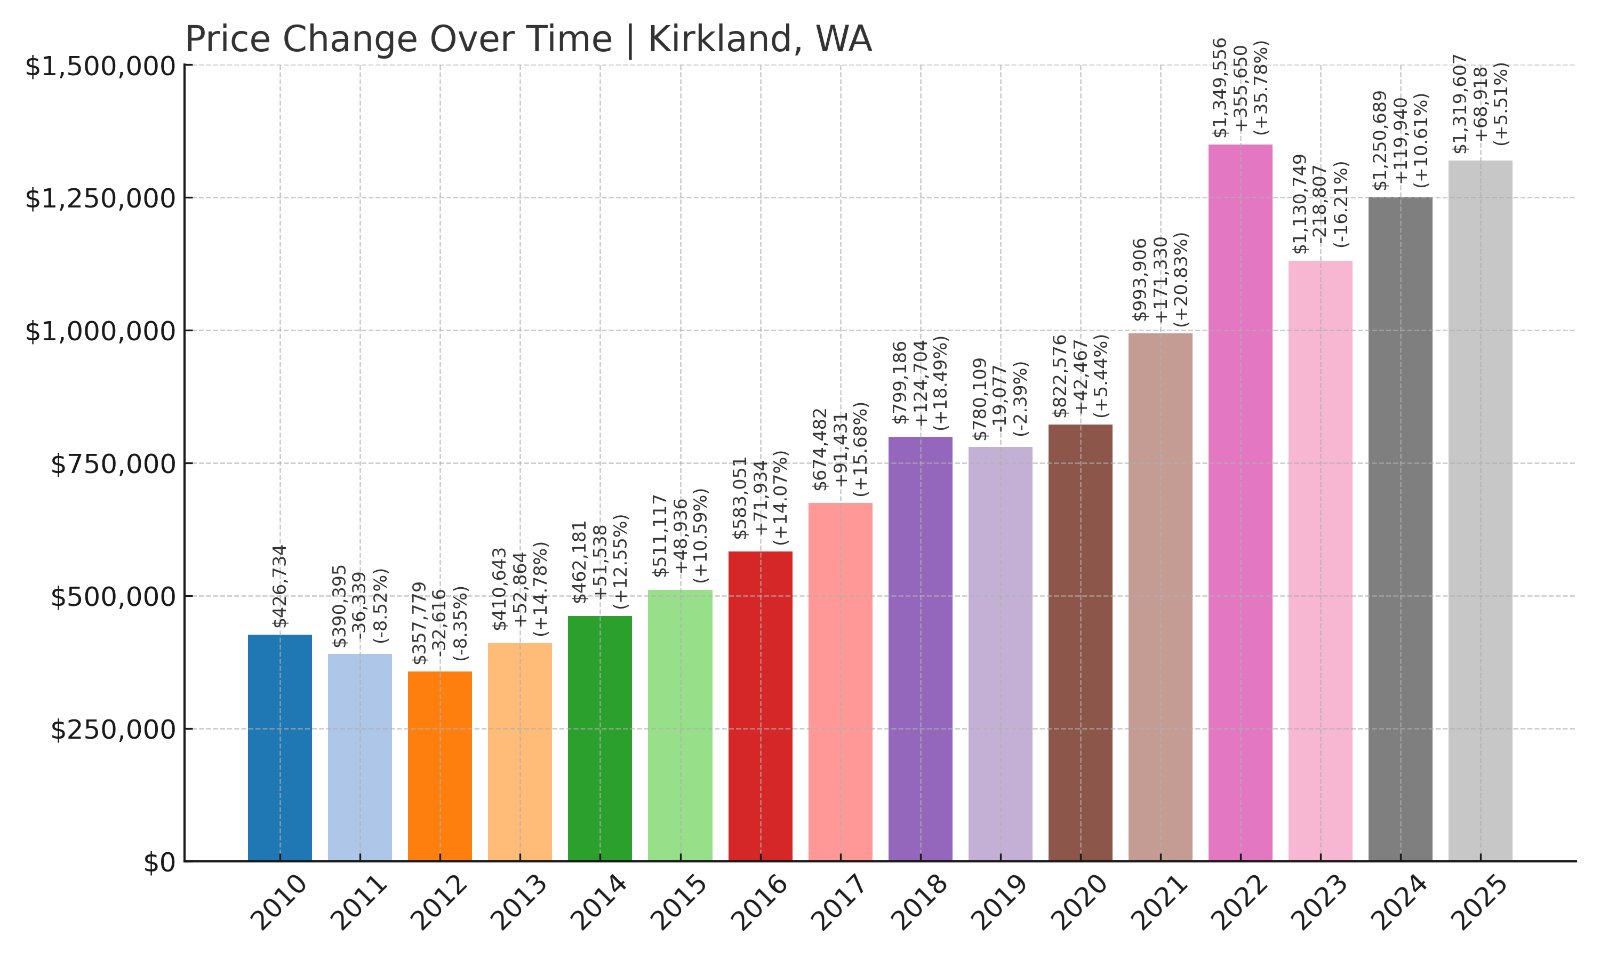
- 2010: $426,734
- 2011: $390,395 (-$36,338, -8.52% from previous year)
- 2012: $357,779 (-$32,617, -8.35% from previous year)
- 2013: $410,643 (+$52,865, +14.78% from previous year)
- 2014: $462,181 (+$51,537, +12.55% from previous year)
- 2015: $511,117 (+$48,937, +10.59% from previous year)
- 2016: $583,051 (+$71,934, +14.07% from previous year)
- 2017: $674,482 (+$91,430, +15.68% from previous year)
- 2018: $799,186 (+$124,704, +18.49% from previous year)
- 2019: $780,109 (-$19,076, -2.39% from previous year)
- 2020: $822,576 (+$42,467, +5.44% from previous year)
- 2021: $993,906 (+$171,330, +20.83% from previous year)
- 2022: $1,349,556 (+$355,650, +35.78% from previous year)
- 2023: $1,130,749 (-$218,807, -16.21% from previous year)
- 2024: $1,250,689 (+$119,940, +10.61% from previous year)
- 2025: $1,319,607 (+$68,918, +5.51% from previous year)
Kirkland’s home prices have more than tripled since 2010, reaching over $1.3 million by 2025. Despite occasional market corrections, its long-term upward trend is driven by its lakefront lifestyle and proximity to major tech employers.
Kirkland – Lakeside Living and Tech Innovation
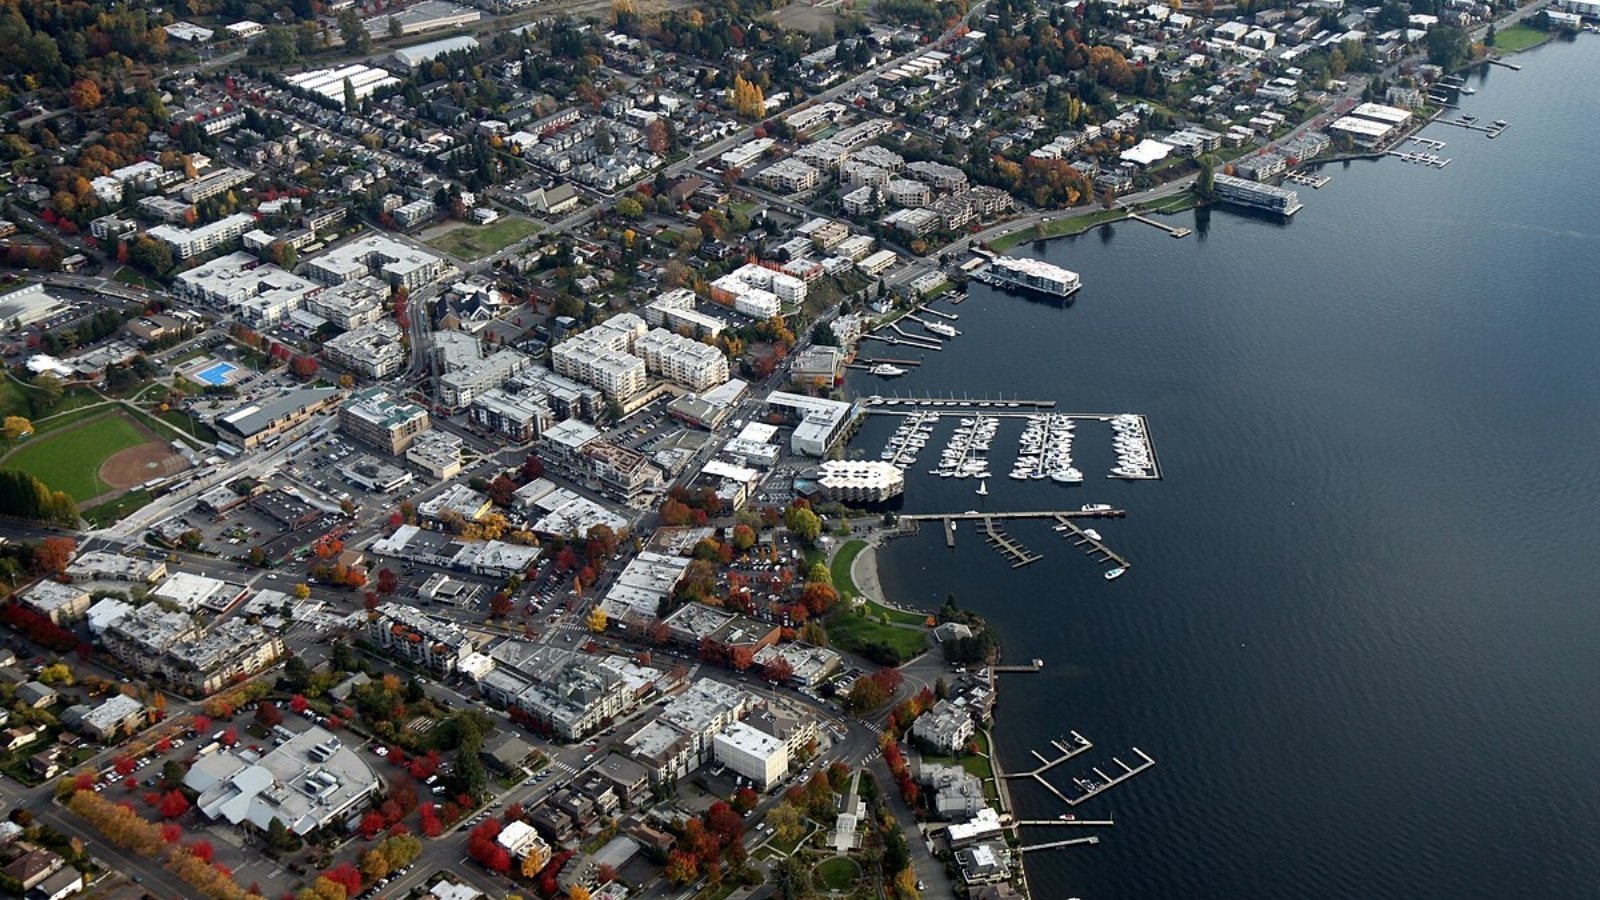
Located along the northeast shore of Lake Washington, Kirkland combines a bustling waterfront downtown with suburban neighborhoods. Residents enjoy public beaches, marinas, and art galleries, alongside restaurants and boutique shops lining Lake Street.
According to the City of Kirkland, major employers like Google and Tableau continue expanding local offices, increasing demand for nearby housing. With highly rated schools and quick access to Seattle via I-405 and SR 520, Kirkland remains one of the region’s most desirable real estate markets.
12. Newcastle – 186% Home Price Increase Since 2010

🔥 Would you like to save this?
- 2010: $499,607
- 2011: $468,175 (-$31,432, -6.29% from previous year)
- 2012: $448,712 (-$19,463, -4.16% from previous year)
- 2013: $501,707 (+$52,994, +11.81% from previous year)
- 2014: $552,232 (+$50,526, +10.07% from previous year)
- 2015: $596,506 (+$44,274, +8.02% from previous year)
- 2016: $668,844 (+$72,338, +12.13% from previous year)
- 2017: $752,818 (+$83,974, +12.56% from previous year)
- 2018: $861,502 (+$108,684, +14.44% from previous year)
- 2019: $862,862 (+$1,360, +0.16% from previous year)
- 2020: $899,229 (+$36,367, +4.21% from previous year)
- 2021: $1,083,655 (+$184,425, +20.51% from previous year)
- 2022: $1,460,164 (+$376,509, +34.74% from previous year)
- 2023: $1,262,032 (-$198,132, -13.57% from previous year)
- 2024: $1,374,760 (+$112,728, +8.93% from previous year)
- 2025: $1,428,616 (+$53,856, +3.92% from previous year)
Newcastle’s home values rose from just under $500,000 in 2010 to nearly $1.43 million by 2025. This steady growth is supported by its small-town feel combined with convenient access to Seattle and Bellevue workplaces.
Newcastle – Quiet Neighborhoods Near Big City Jobs
Situated between Bellevue and Renton, Newcastle offers residents forested hills, community parks, and golf courses with views of Lake Washington. The city’s Coal Creek Parkway provides a direct route to Bellevue’s tech offices, making it ideal for commuters.
The Newcastle Golf Club and local trails attract families and retirees alike. According to Zillow data, demand here remains high thanks to its schools within the Issaquah and Renton districts and its balance of peaceful neighborhoods with urban access.
11. Woodinville – 178% Home Price Increase Since 2010

- 2010: $517,092
- 2011: $483,703 (-$33,389, -6.46% from previous year)
- 2012: $446,492 (-$37,211, -7.69% from previous year)
- 2013: $489,357 (+$42,865, +9.60% from previous year)
- 2014: $550,402 (+$61,045, +12.47% from previous year)
- 2015: $596,165 (+$45,763, +8.31% from previous year)
- 2016: $659,785 (+$63,620, +10.67% from previous year)
- 2017: $747,020 (+$87,234, +13.22% from previous year)
- 2018: $839,157 (+$92,137, +12.33% from previous year)
- 2019: $842,919 (+$3,762, +0.45% from previous year)
- 2020: $882,129 (+$39,209, +4.65% from previous year)
- 2021: $1,088,962 (+$206,834, +23.45% from previous year)
- 2022: $1,478,573 (+$389,611, +35.78% from previous year)
- 2023: $1,245,551 (-$233,022, -15.76% from previous year)
- 2024: $1,370,095 (+$124,544, +10.00% from previous year)
- 2025: $1,436,338 (+$66,243, +4.83% from previous year)
Woodinville’s home prices rose from just over $517,000 in 2010 to nearly $1.44 million in 2025. Despite a decline in 2023, values rebounded strongly, reflecting enduring demand for this wine-country community near Seattle.
Woodinville – Washington’s Wine Capital Meets Suburban Comfort
Woodinville is known for its over 130 wineries and tasting rooms, attracting wine tourists year-round. The town offers a suburban atmosphere with easy access to Redmond, Kirkland, and Bellevue job markets, making it popular among tech workers.
With top-rated Northshore School District schools and outdoor amenities like the Sammamish River Trail, housing demand remains steady. According to Redfin, Woodinville continues to see strong buyer interest, supporting consistent price growth even as markets stabilize.
10. Redmond – 198% Home Price Increase Since 2010
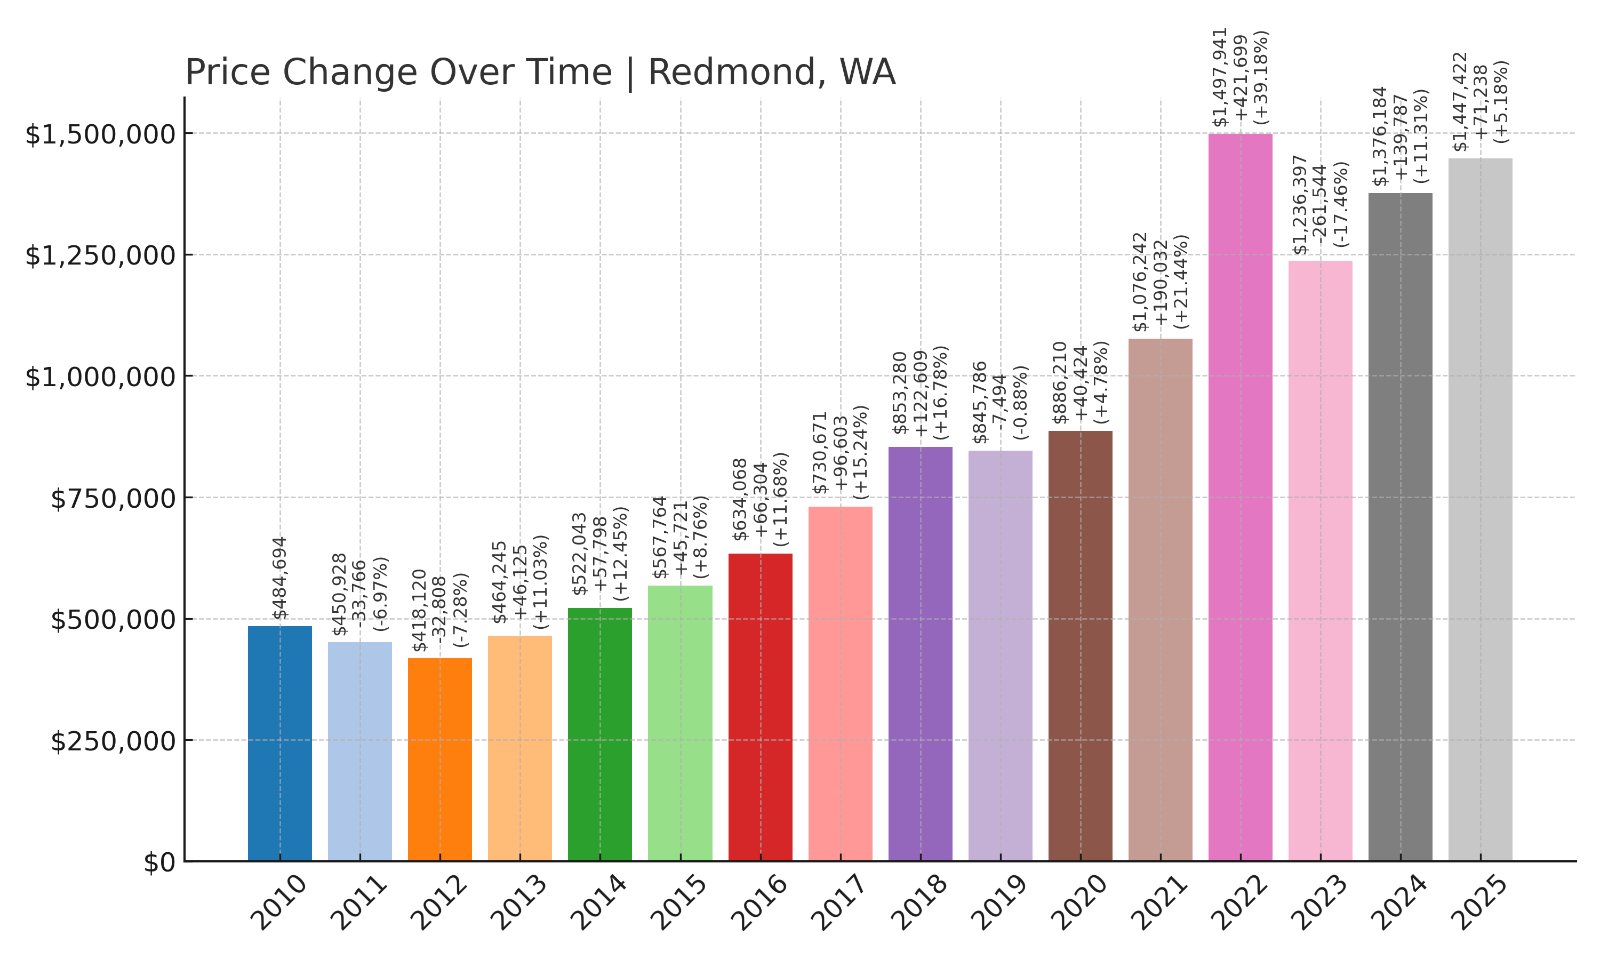
- 2010: $484,694
- 2011: $450,928 (-$33,766, -6.97% from previous year)
- 2012: $418,120 (-$32,807, -7.28% from previous year)
- 2013: $464,245 (+$46,124, +11.03% from previous year)
- 2014: $522,043 (+$57,799, +12.45% from previous year)
- 2015: $567,764 (+$45,720, +8.76% from previous year)
- 2016: $634,068 (+$66,304, +11.68% from previous year)
- 2017: $730,671 (+$96,604, +15.24% from previous year)
- 2018: $853,280 (+$122,609, +16.78% from previous year)
- 2019: $845,786 (-$7,495, -0.88% from previous year)
- 2020: $886,210 (+$40,424, +4.78% from previous year)
- 2021: $1,076,242 (+$190,032, +21.44% from previous year)
- 2022: $1,497,941 (+$421,699, +39.18% from previous year)
- 2023: $1,236,397 (-$261,544, -17.46% from previous year)
- 2024: $1,376,184 (+$139,788, +11.31% from previous year)
- 2025: $1,447,422 (+$71,237, +5.18% from previous year)
Redmond’s home values have tripled since 2010, now approaching $1.45 million. The city’s role as a major tech hub fuels its strong housing market, even with brief declines like in 2023.
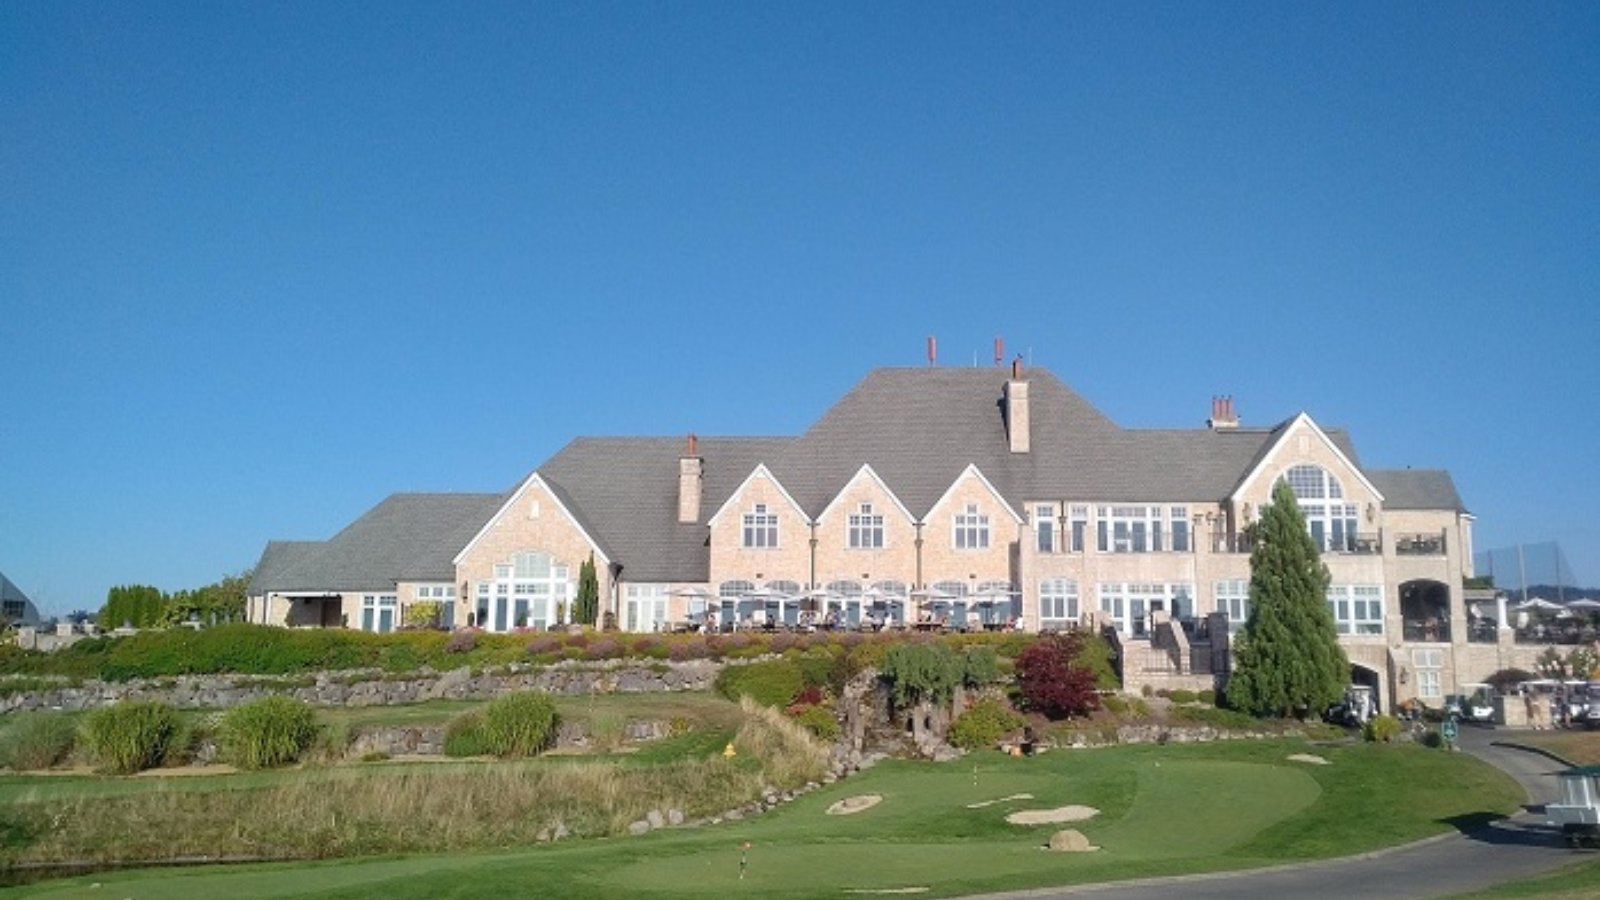
Redmond – The Heart of Tech in Washington
Home to Microsoft’s headquarters, Redmond is one of the state’s fastest-growing cities. Its mix of corporate campuses, new apartment complexes, and residential neighborhoods creates strong housing demand from tech workers and their families.
Residents benefit from parks like Marymoor, extensive bike trails, and strong public schools. According to Zillow, Redmond’s prices continue trending upward, driven by job growth and limited inventory within commuting distance to Seattle and Bellevue.
9. Bellevue – 205% Home Price Increase Since 2010
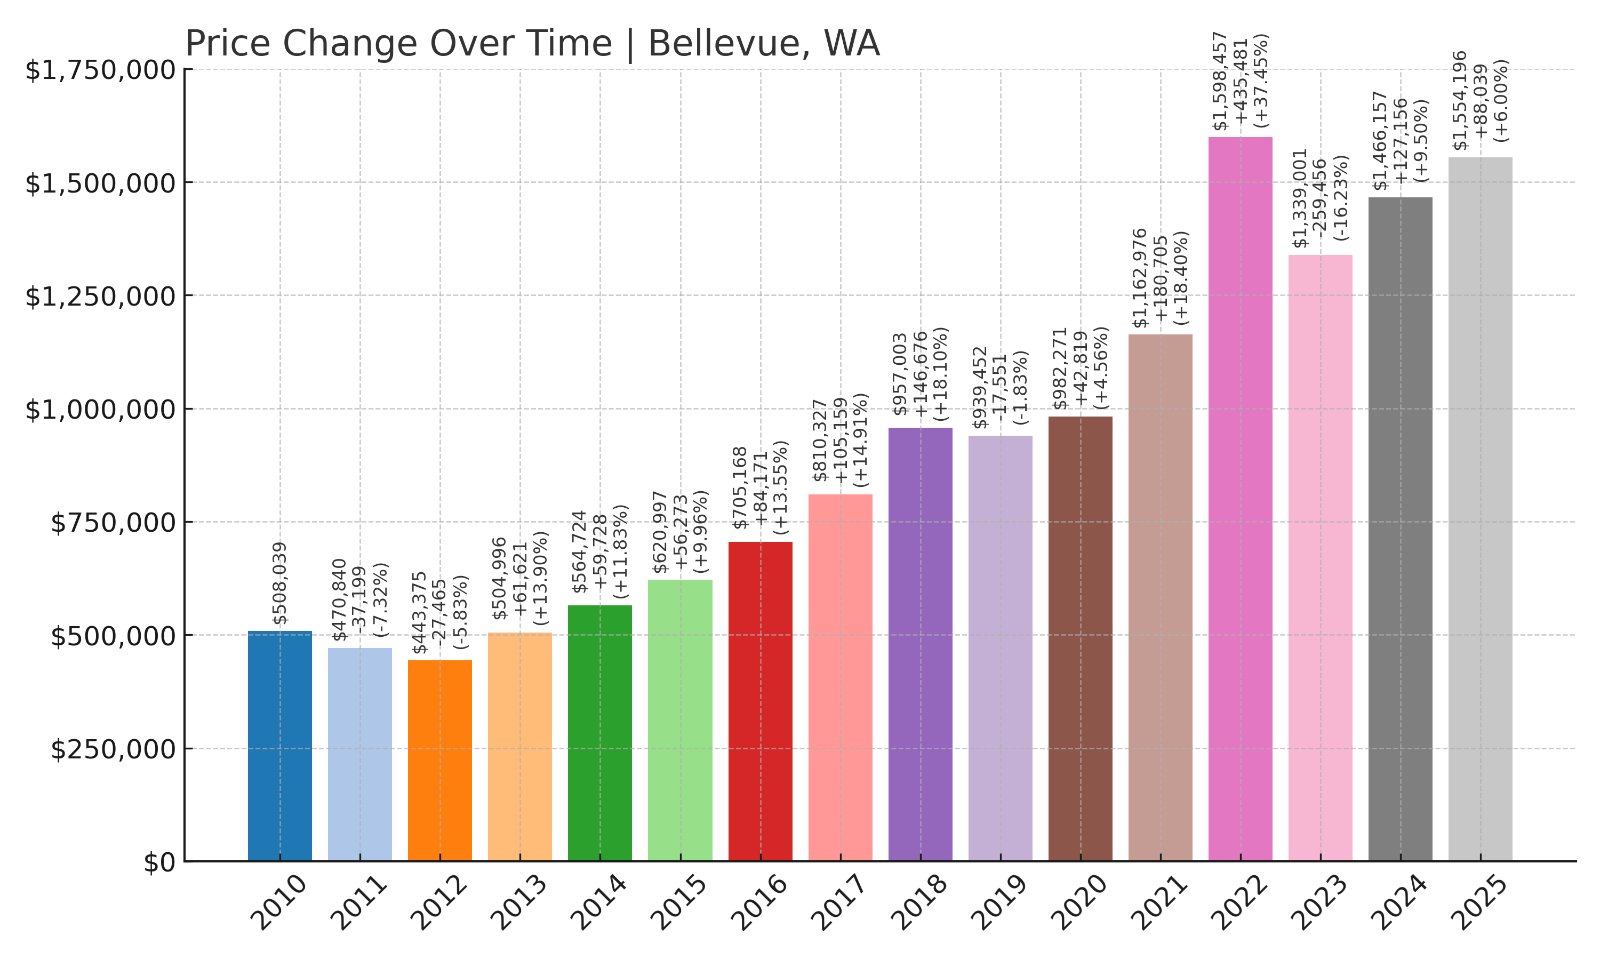
- 2010: $508,039
- 2011: $470,840 (-$37,199, -7.32% from previous year)
- 2012: $443,375 (-$27,465, -5.83% from previous year)
- 2013: $504,996 (+$61,621, +13.90% from previous year)
- 2014: $564,724 (+$59,728, +11.83% from previous year)
- 2015: $620,997 (+$56,273, +9.96% from previous year)
- 2016: $705,168 (+$84,171, +13.55% from previous year)
- 2017: $810,327 (+$105,158, +14.91% from previous year)
- 2018: $957,003 (+$146,677, +18.10% from previous year)
- 2019: $939,452 (-$17,551, -1.83% from previous year)
- 2020: $982,271 (+$42,819, +4.56% from previous year)
- 2021: $1,162,976 (+$180,705, +18.40% from previous year)
- 2022: $1,598,457 (+$435,481, +37.45% from previous year)
- 2023: $1,339,001 (-$259,456, -16.23% from previous year)
- 2024: $1,466,157 (+$127,156, +9.50% from previous year)
- 2025: $1,554,196 (+$88,039, +6.00% from previous year)
Bellevue’s home prices have more than tripled since 2010, rising from just over $508,000 to $1.55 million in 2025. This dramatic growth reflects the city’s emergence as a major tech hub and one of Washington’s most desirable urban centers.
Bellevue – The Eastside’s Economic Powerhouse
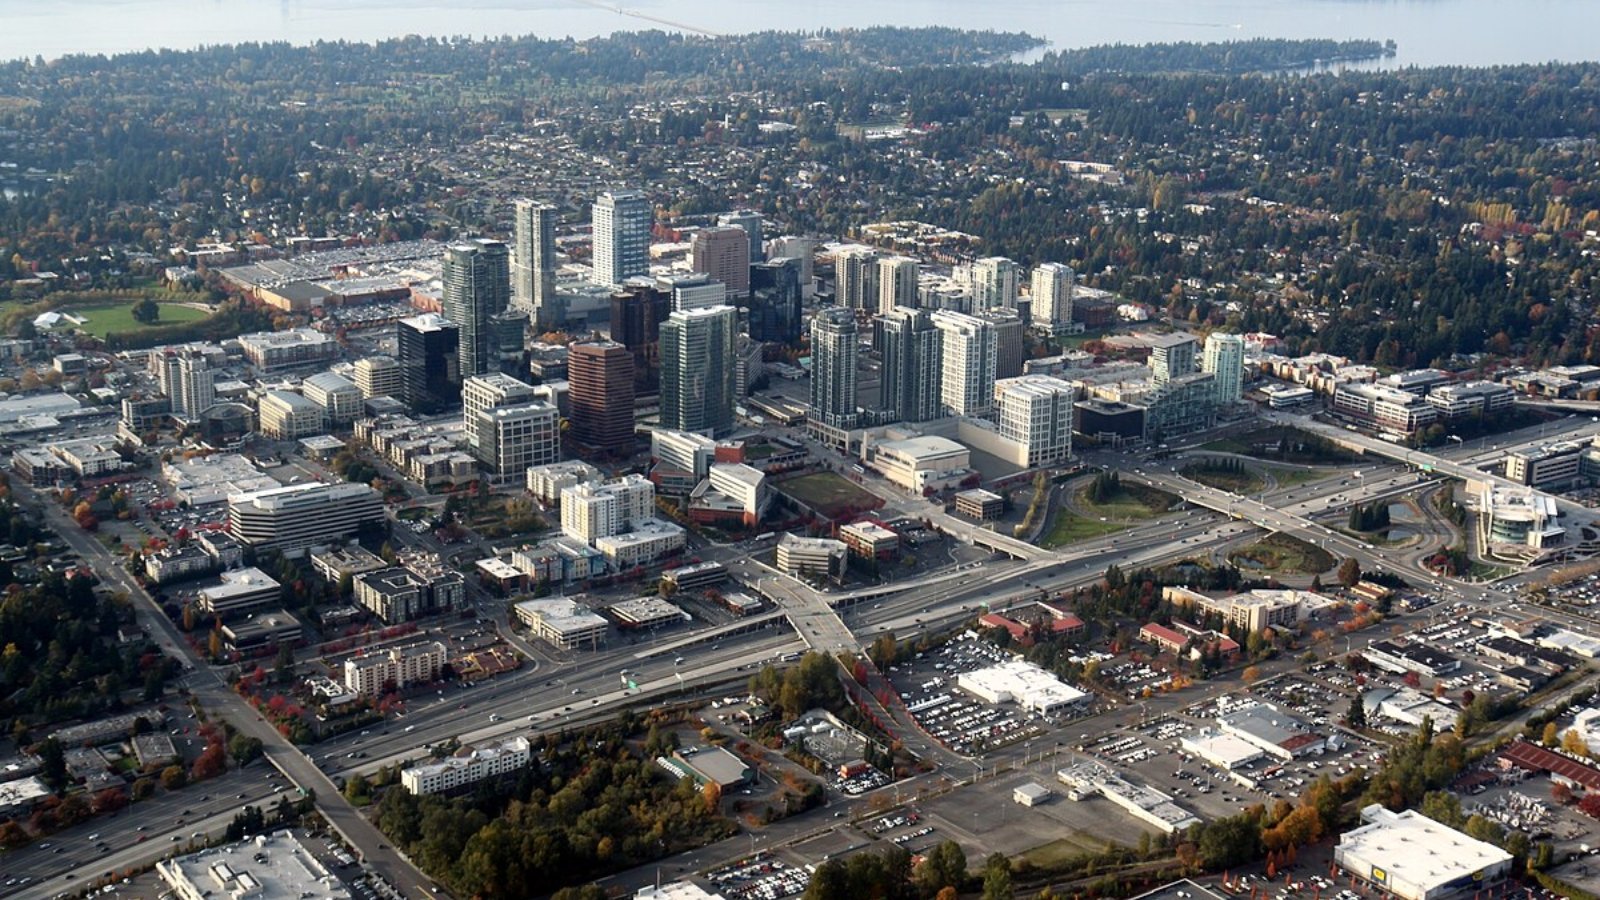
Bellevue lies directly across Lake Washington from Seattle, connected via I-90 and SR 520 bridges. Over the past decade, it has transformed into a booming city with gleaming high-rises, luxury shopping centers like The Bellevue Collection, and rapidly expanding tech campuses for companies such as Amazon, Microsoft, and Meta.
According to the City of Bellevue, its population has grown steadily alongside job opportunities, driving consistent housing demand. The city’s excellent schools, urban amenities, and proximity to Seattle continue to attract buyers, keeping Bellevue among the top housing markets in the Pacific Northwest.
8. Sammamish – 211% Home Price Increase Since 2010
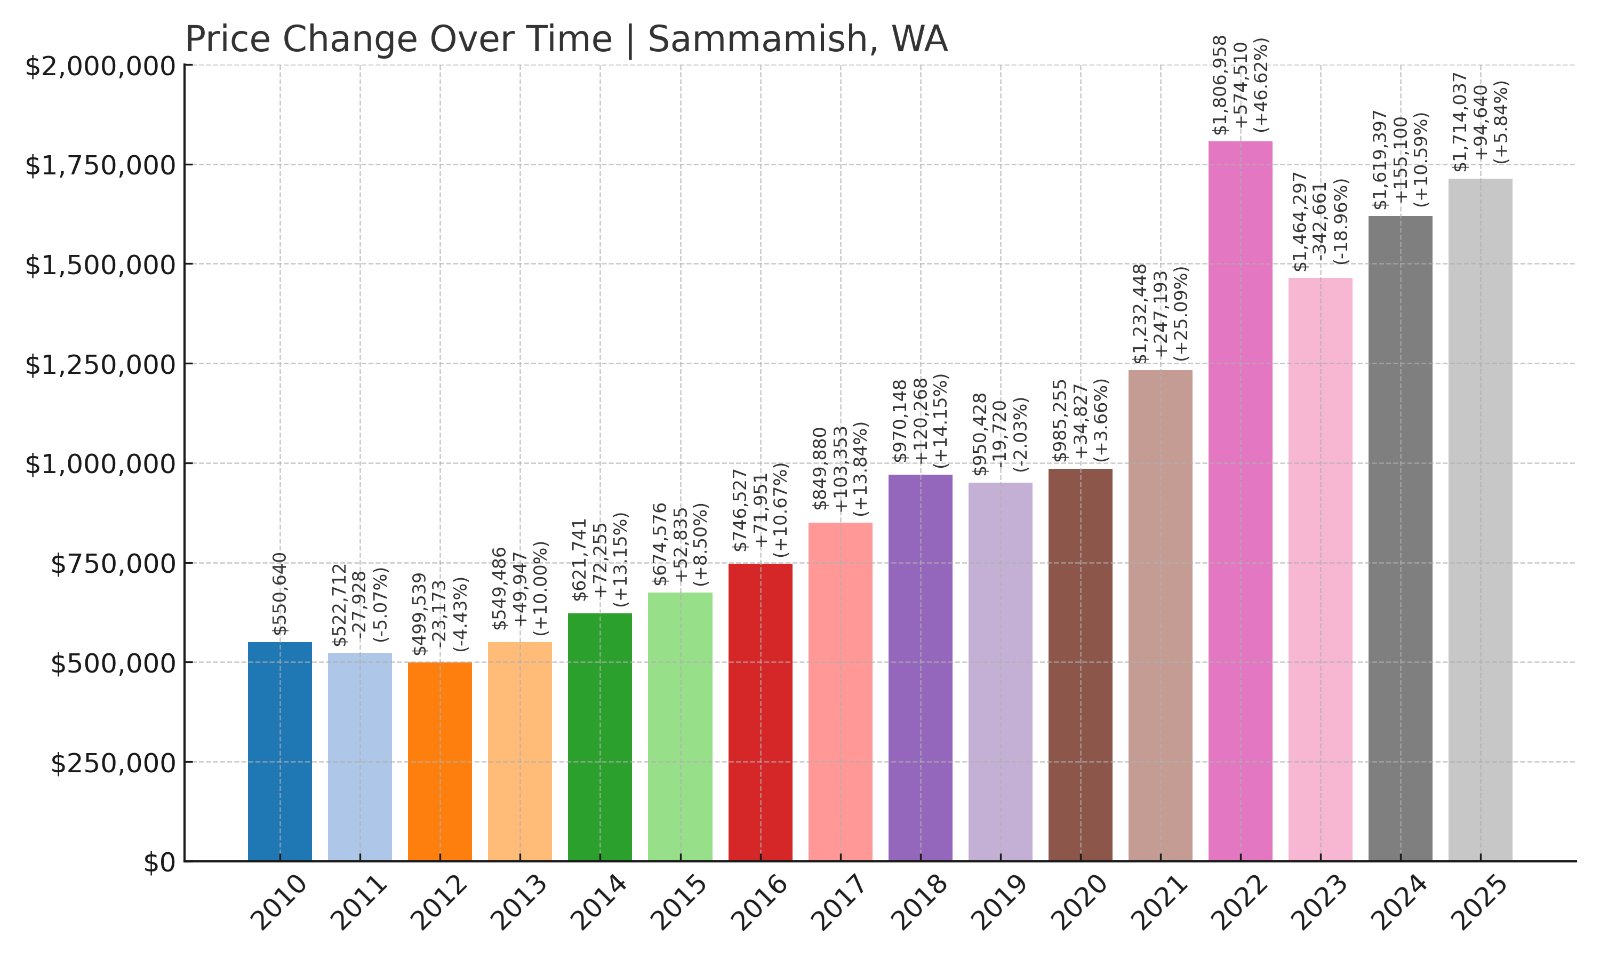
- 2010: $550,640
- 2011: $522,712 (-$27,928, -5.07% from previous year)
- 2012: $499,539 (-$23,173, -4.43% from previous year)
- 2013: $549,486 (+$49,947, +10.00% from previous year)
- 2014: $621,741 (+$72,255, +13.15% from previous year)
- 2015: $674,576 (+$52,835, +8.50% from previous year)
- 2016: $746,527 (+$71,951, +10.67% from previous year)
- 2017: $849,880 (+$103,353, +13.84% from previous year)
- 2018: $970,148 (+$120,268, +14.15% from previous year)
- 2019: $950,428 (-$19,720, -2.03% from previous year)
- 2020: $985,255 (+$34,827, +3.66% from previous year)
- 2021: $1,232,448 (+$247,193, +25.09% from previous year)
- 2022: $1,806,958 (+$574,510, +46.62% from previous year)
- 2023: $1,464,297 (-$342,661, -18.96% from previous year)
- 2024: $1,619,397 (+$155,100, +10.59% from previous year)
- 2025: $1,714,037 (+$94,641, +5.84% from previous year)
Sammamish home prices have more than tripled since 2010, climbing from $550,640 to over $1.7 million in 2025. While the town saw declines in 2011, 2012, and 2023, strong recoveries show continued demand in this growing suburb.
Sammamish – A Family-Friendly Suburb With Natural Beauty
Located east of Redmond, Sammamish is known for its top-rated schools, quiet residential neighborhoods, and proximity to Lake Sammamish State Park. The city consistently ranks among Washington’s best places to live, attracting families looking for larger homes and safer streets.
According to Zillow data, prices surged particularly in 2021 and 2022, driven by buyers seeking more space during the pandemic. Even after a 2023 market correction, values rebounded quickly. With its numerous parks, trails, and community events, Sammamish remains one of King County’s most desirable suburbs.
7. Mercer Island – 155% Home Price Increase Since 2010
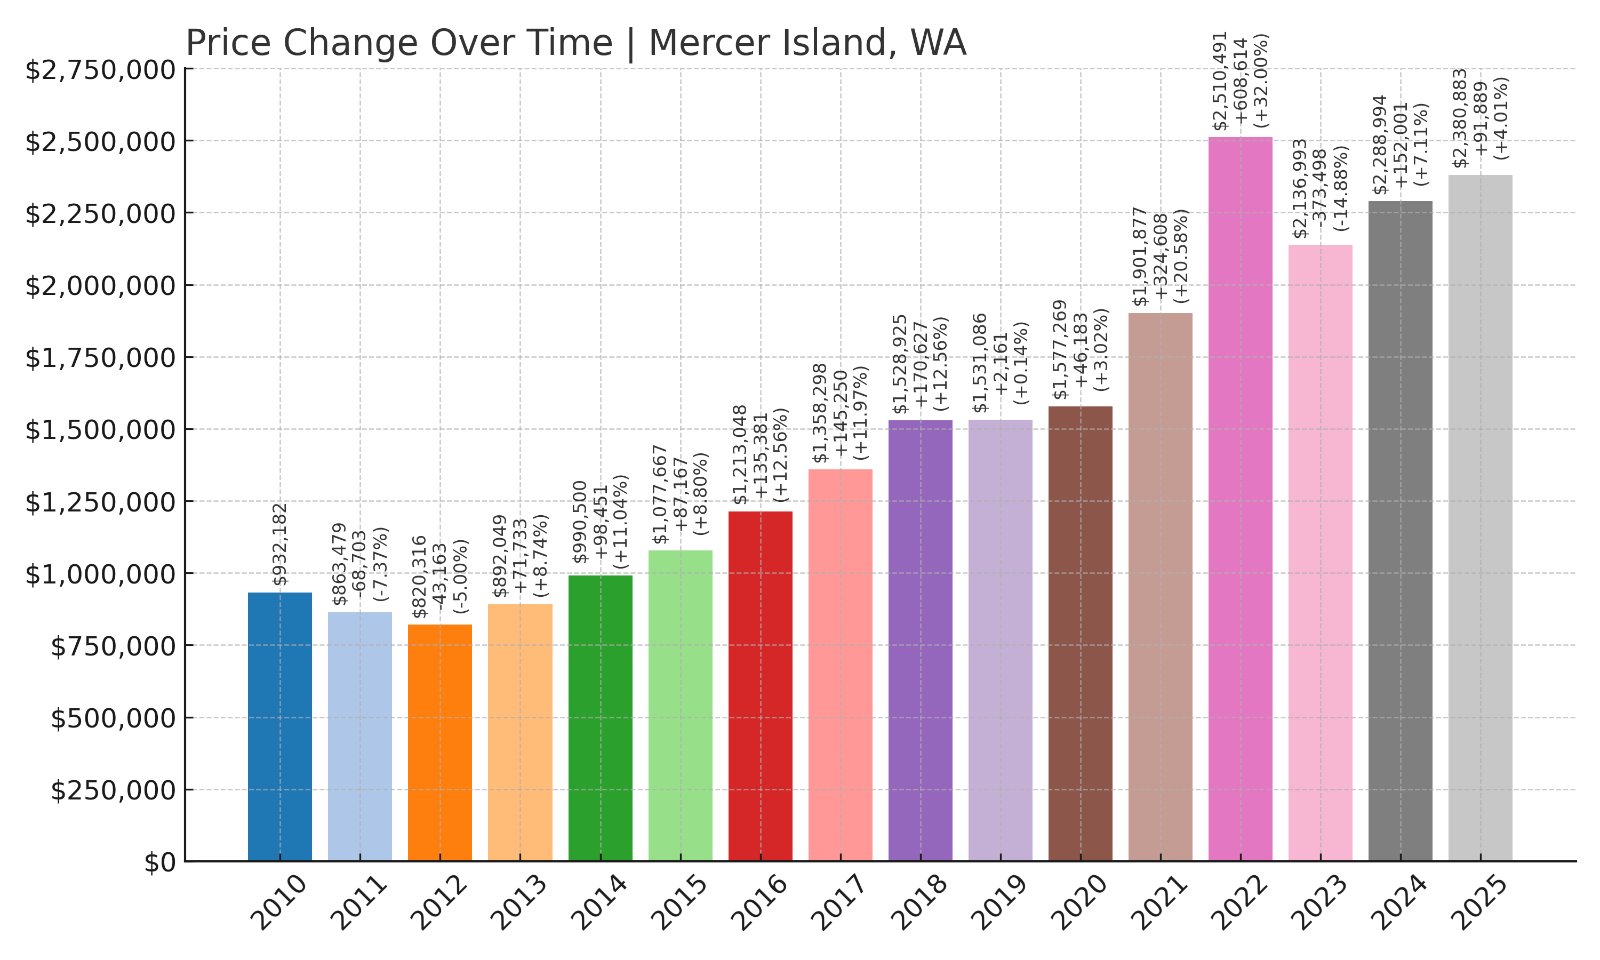
- 2010: $932,182
- 2011: $863,479 (-$68,703, -7.37% from previous year)
- 2012: $820,316 (-$43,163, -5.00% from previous year)
- 2013: $892,049 (+$71,733, +8.74% from previous year)
- 2014: $990,500 (+$98,451, +11.04% from previous year)
- 2015: $1,077,667 (+$87,167, +8.80% from previous year)
- 2016: $1,213,048 (+$135,381, +12.56% from previous year)
- 2017: $1,358,298 (+$145,251, +11.97% from previous year)
- 2018: $1,528,925 (+$170,626, +12.56% from previous year)
- 2019: $1,531,086 (+$2,161, +0.14% from previous year)
- 2020: $1,577,269 (+$46,183, +3.02% from previous year)
- 2021: $1,901,877 (+$324,608, +20.58% from previous year)
- 2022: $2,510,491 (+$608,614, +32.00% from previous year)
- 2023: $2,136,993 (-$373,498, -14.88% from previous year)
- 2024: $2,288,994 (+$152,001, +7.11% from previous year)
- 2025: $2,380,883 (+$91,889, +4.01% from previous year)
Mercer Island’s home prices rose from $932,182 in 2010 to nearly $2.4 million in 2025, driven by its exclusive location and easy access to Seattle and Bellevue. Even during market dips like 2023, values remain among the highest in Washington.
Mercer Island – Island Living Minutes From Downtown
Mercer Island sits in Lake Washington between Seattle and Bellevue, connected by I-90 bridges in both directions. This location provides a peaceful suburban feel with quick city access, making it popular among executives and professionals.
The city offers top public schools, upscale parks, and waterfront properties with sweeping views. According to Redfin, Mercer Island remains one of Washington’s most expensive housing markets due to its limited land area and strong demand for privacy and convenience.
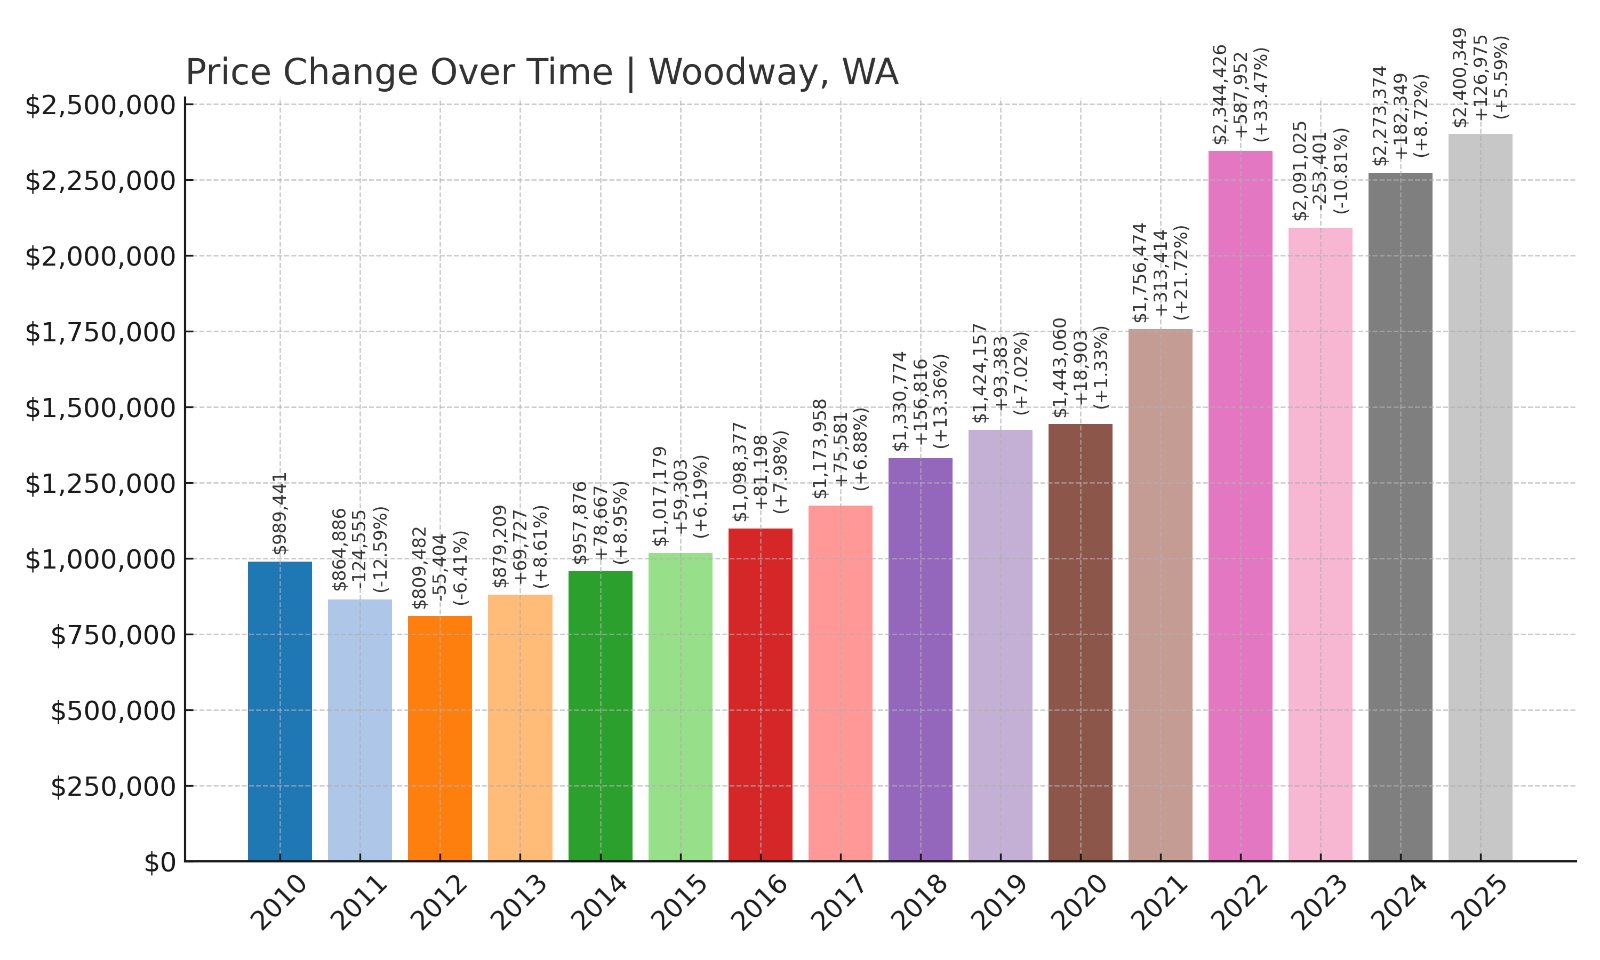
6. Woodway – 142% Home Price Increase Since 2010
🔥 Would you like to save this?
- 2010: $989,441
- 2011: $864,886 (-$124,555, -12.59% from previous year)
- 2012: $809,482 (-$55,405, -6.41% from previous year)
- 2013: $879,209 (+$69,727, +8.61% from previous year)
- 2014: $957,876 (+$78,667, +8.95% from previous year)
- 2015: $1,017,179 (+$59,303, +6.19% from previous year)
- 2016: $1,098,377 (+$81,198, +7.98% from previous year)
- 2017: $1,173,958 (+$75,581, +6.88% from previous year)
- 2018: $1,330,774 (+$156,816, +13.36% from previous year)
- 2019: $1,424,157 (+$93,384, +7.02% from previous year)
- 2020: $1,443,060 (+$18,902, +1.33% from previous year)
- 2021: $1,756,474 (+$313,414, +21.72% from previous year)
- 2022: $2,344,426 (+$587,951, +33.47% from previous year)
- 2023: $2,091,025 (-$253,400, -10.81% from previous year)
- 2024: $2,273,374 (+$182,348, +8.72% from previous year)
- 2025: $2,400,349 (+$126,976, +5.59% from previous year)
Woodway’s home prices grew from just under $1 million in 2010 to $2.4 million in 2025. Its blend of forested lots and waterfront views attracts buyers looking for privacy within commuting distance of Seattle.
Woodway – A Secluded Community North of Seattle
Located near Edmonds along Puget Sound, Woodway is known for its large wooded properties and quiet, rural feel. The town has strict zoning that maintains its character of spacious estates surrounded by trees and greenery.
According to Zillow, demand here remains strong despite market dips due to its limited housing supply and unique setting. Residents enjoy quick access to Edmonds waterfront, ferries to the Olympic Peninsula, and a short drive to Seattle or Everett.
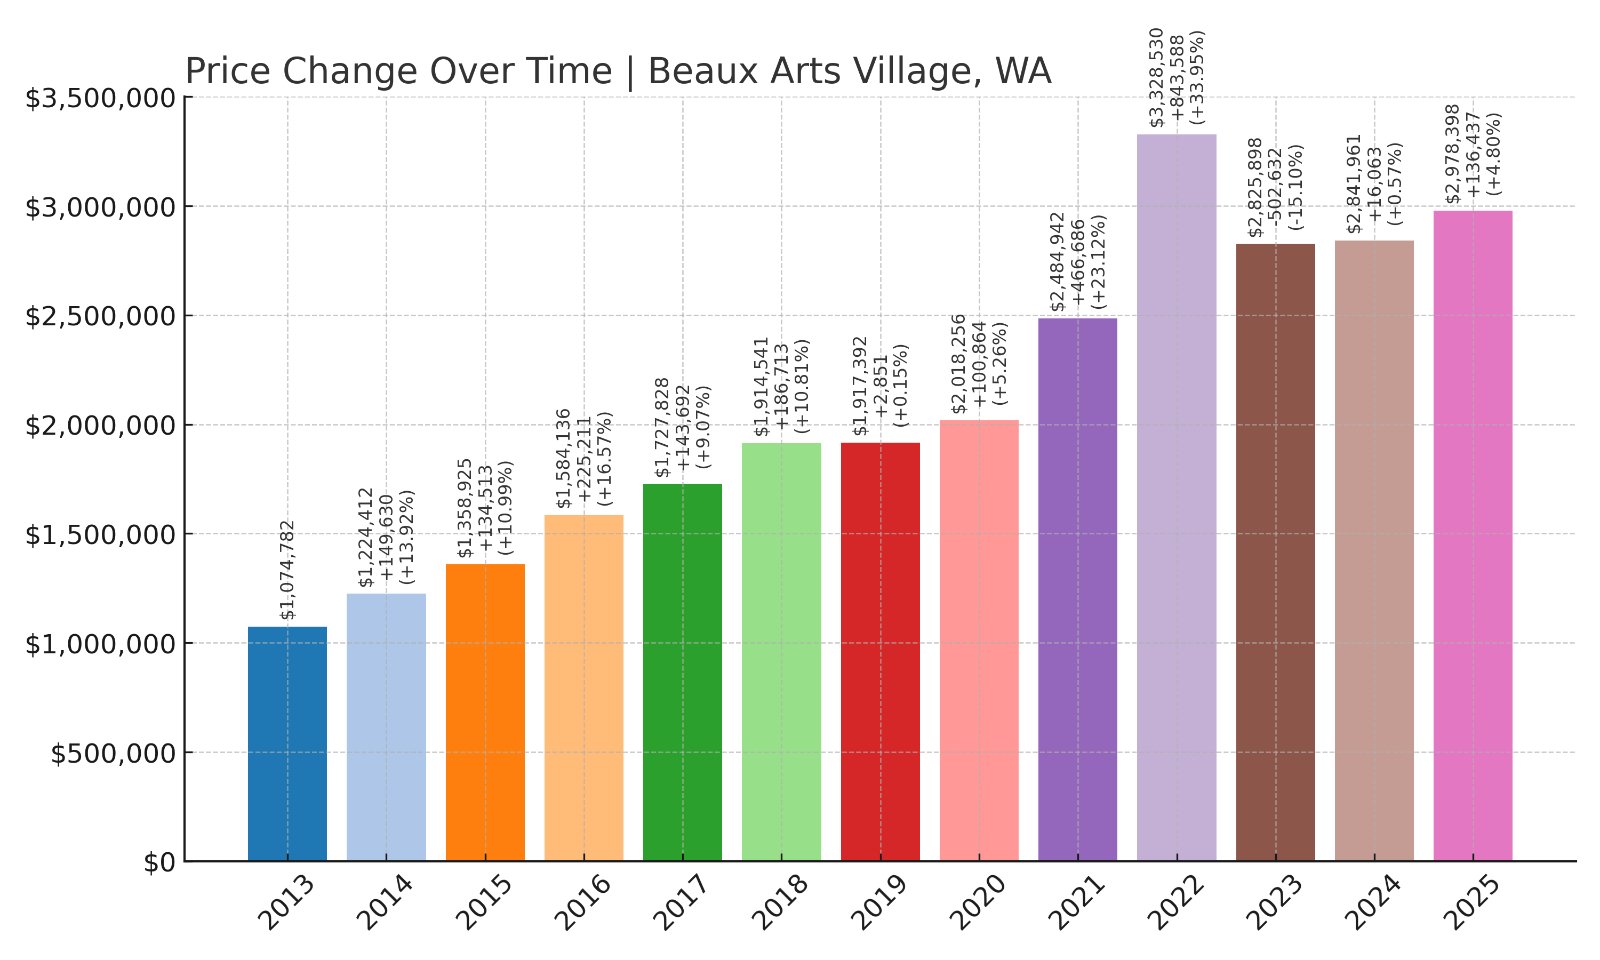
5. Beaux Arts Village – 177% Home Price Increase Since 2013
- 2010: N/A
- 2011: N/A
- 2012: N/A
- 2013: $1,074,782
- 2014: $1,224,412 (+$149,630, +13.92% from previous year)
- 2015: $1,358,925 (+$134,513, +10.99% from previous year)
- 2016: $1,584,136 (+$225,211, +16.57% from previous year)
- 2017: $1,727,828 (+$143,692, +9.07% from previous year)
- 2018: $1,914,541 (+$186,713, +10.81% from previous year)
- 2019: $1,917,392 (+$2,851, +0.15% from previous year)
- 2020: $2,018,256 (+$100,864, +5.26% from previous year)
- 2021: $2,484,942 (+$466,687, +23.12% from previous year)
- 2022: $3,328,530 (+$843,587, +33.95% from previous year)
- 2023: $2,825,898 (-$502,631, -15.10% from previous year)
- 2024: $2,841,961 (+$16,063, +0.57% from previous year)
- 2025: $2,978,398 (+$136,436, +4.80% from previous year)
Beaux Arts Village home prices have nearly tripled since first recorded in 2013, reaching just under $3 million in 2025. Its small-town exclusivity and prime Lake Washington location keep prices among the highest in the state.
Beaux Arts Village – Exclusive Enclave on Lake Washington
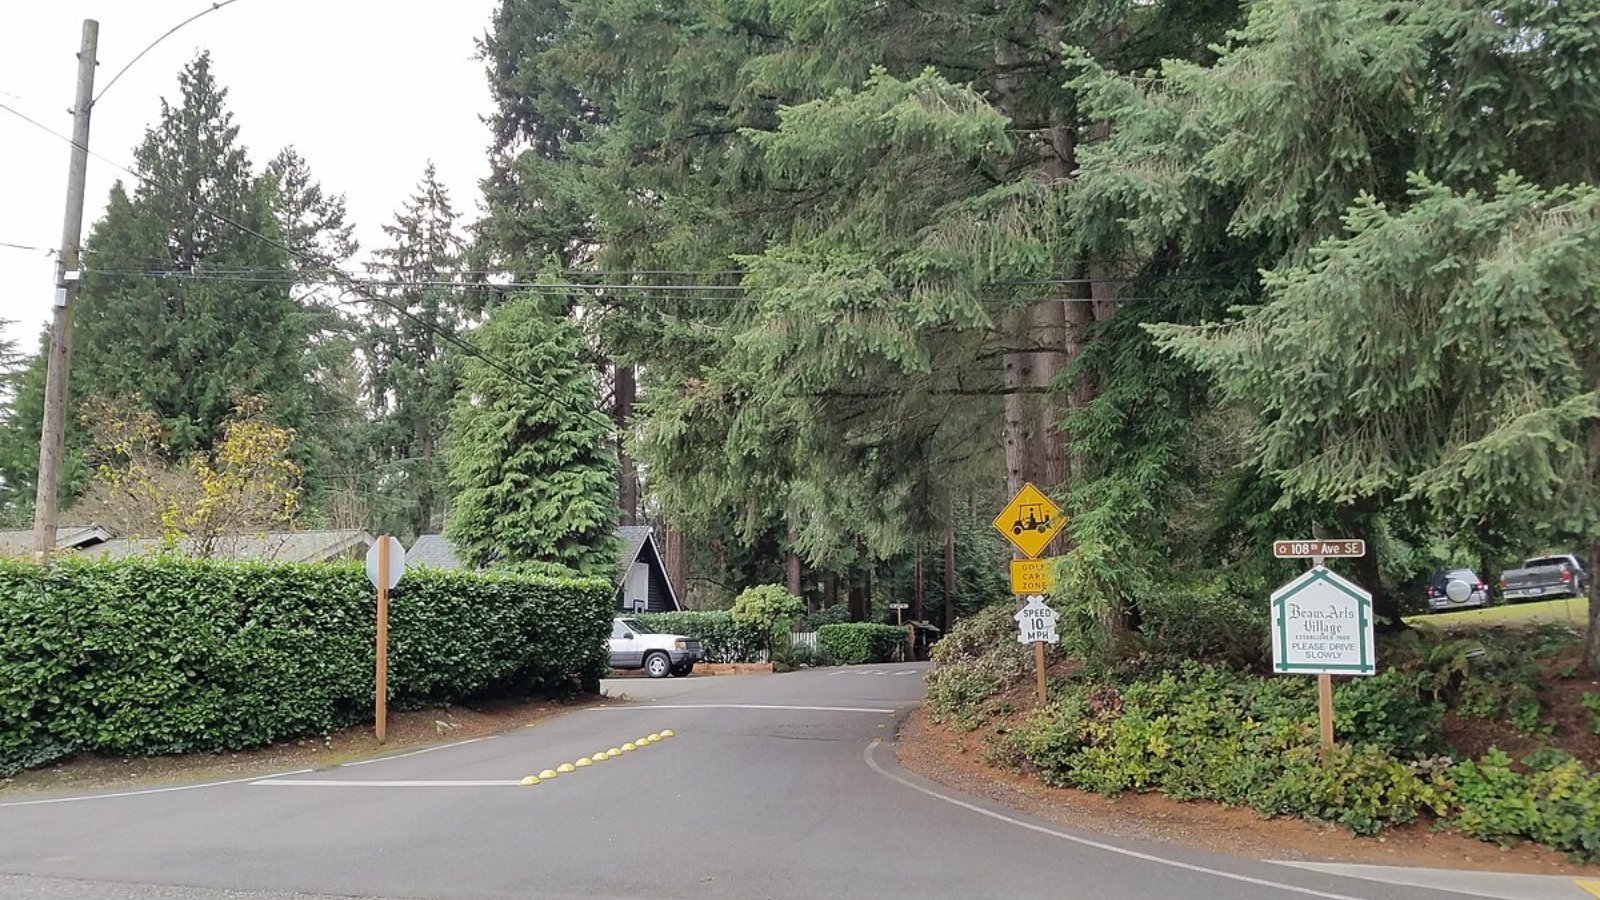
Located south of Bellevue, Beaux Arts Village is one of Washington’s smallest towns with fewer than 300 residents. Originally founded as an artists’ colony, it now consists of quiet residential streets with private lakefront access.
Residents benefit from strong Bellevue School District schools and quick commutes to tech campuses. According to Zillow, its limited housing inventory and prestigious waterfront properties keep demand high despite occasional market dips.
4. Clyde Hill – 197% Home Price Increase Since 2010
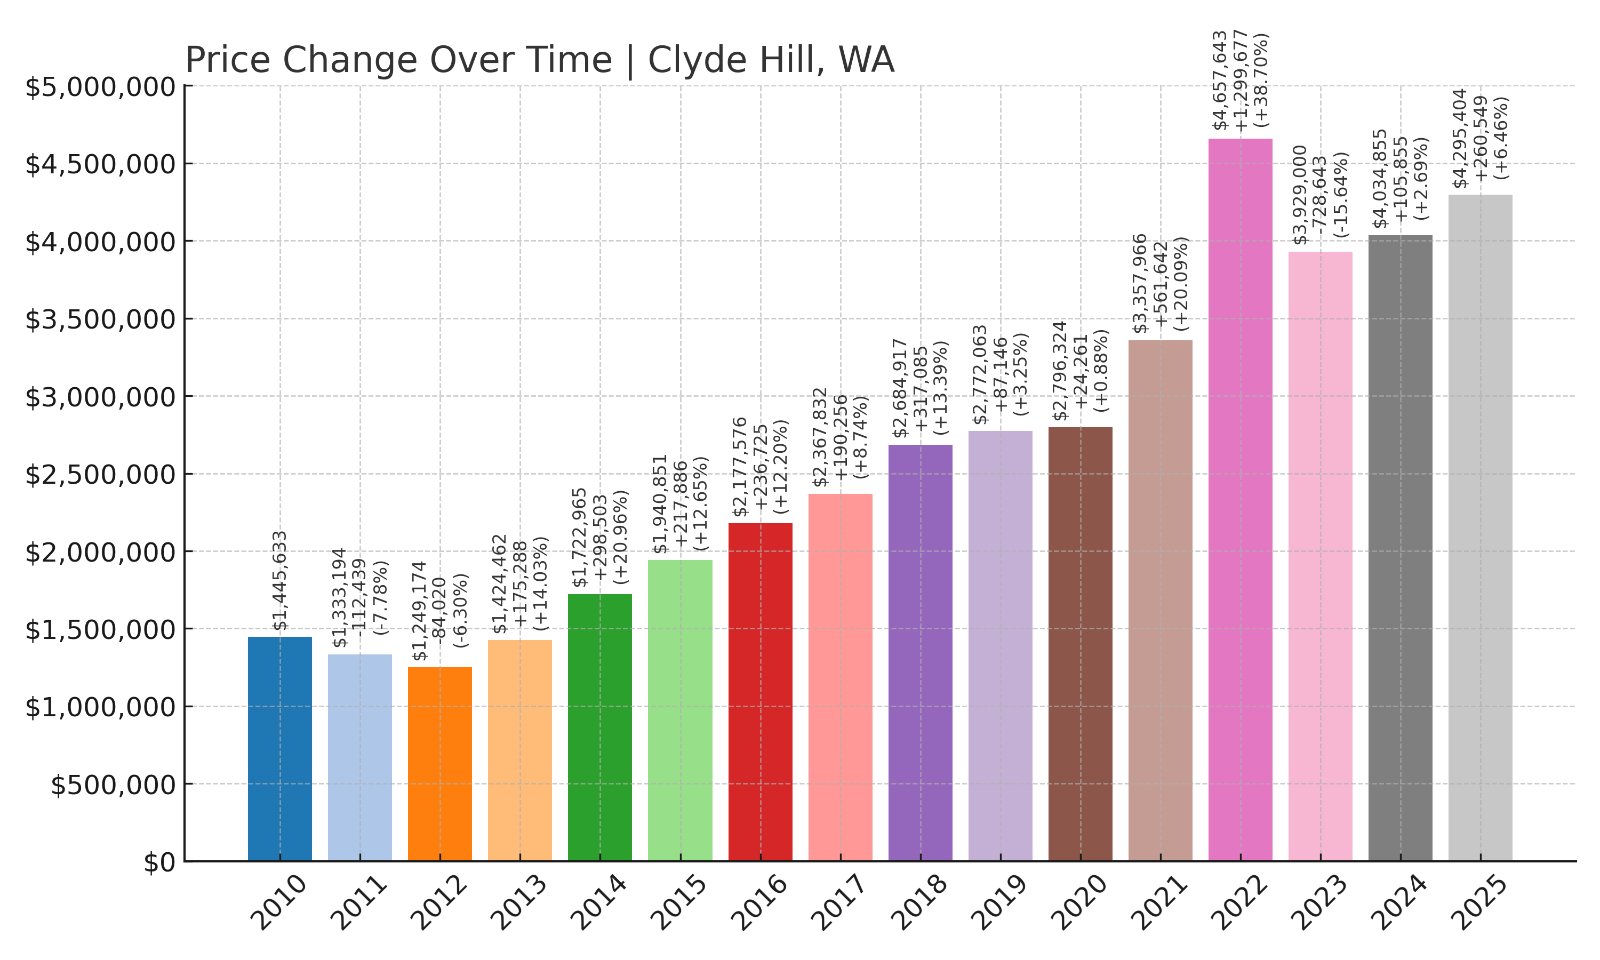
- 2010: $1,445,633
- 2011: $1,333,194 (-$112,440, -7.78% from previous year)
- 2012: $1,249,174 (-$84,019, -6.30% from previous year)
- 2013: $1,424,462 (+$175,287, +14.03% from previous year)
- 2014: $1,722,965 (+$298,503, +20.96% from previous year)
- 2015: $1,940,851 (+$217,886, +12.65% from previous year)
- 2016: $2,177,576 (+$236,724, +12.20% from previous year)
- 2017: $2,367,832 (+$190,256, +8.74% from previous year)
- 2018: $2,684,917 (+$317,086, +13.39% from previous year)
- 2019: $2,772,063 (+$87,146, +3.25% from previous year)
- 2020: $2,796,324 (+$24,260, +0.88% from previous year)
- 2021: $3,357,966 (+$561,643, +20.09% from previous year)
- 2022: $4,657,643 (+$1,299,677, +38.70% from previous year)
- 2023: $3,929,000 (-$728,642, -15.64% from previous year)
- 2024: $4,034,855 (+$105,855, +2.69% from previous year)
- 2025: $4,295,404 (+$260,549, +6.46% from previous year)
Clyde Hill’s home prices nearly tripled since 2010, rising from $1.4 million to over $4.29 million in 2025. Its steady growth reflects its exclusive reputation and prime location near Bellevue’s tech sector and downtown Seattle.
Clyde Hill – Prestigious Neighborhood With Panoramic Views
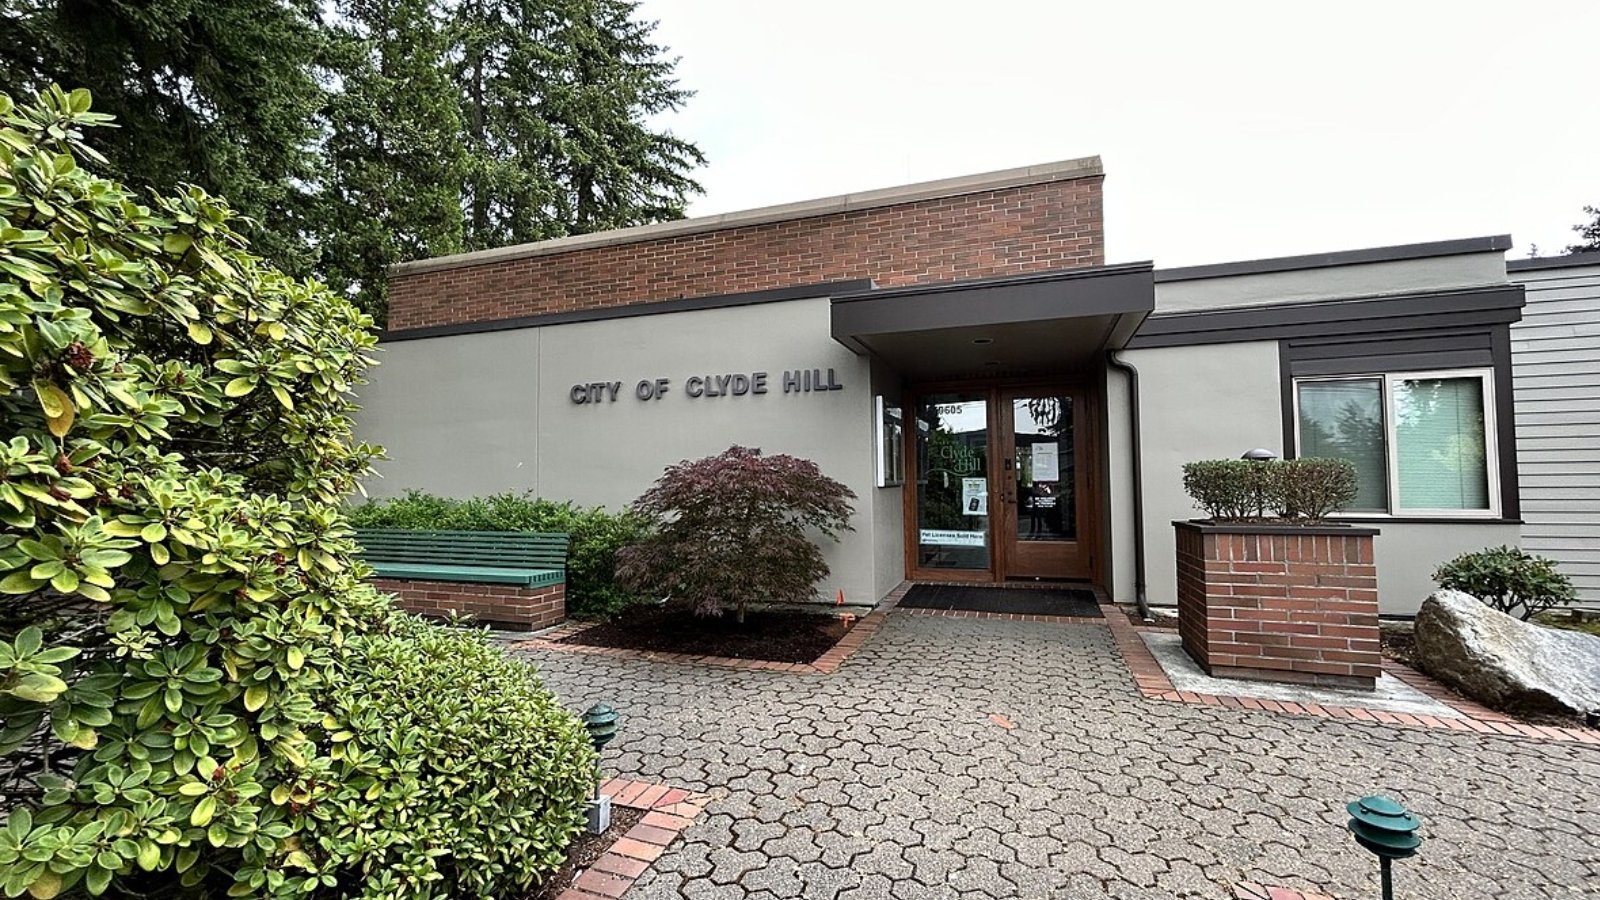
Clyde Hill is an upscale residential city west of downtown Bellevue. Homes here often have sweeping views of Lake Washington, the Seattle skyline, and the Olympic Mountains. Strict zoning limits commercial development, preserving its quiet, residential character.
According to Zillow, Clyde Hill’s limited housing supply and desirable school district keep demand high. Residents enjoy proximity to major employers in Bellevue and Seattle, while living in one of the Puget Sound region’s most prestigious neighborhoods.
3. Yarrow Point – 170% Home Price Increase Since 2010
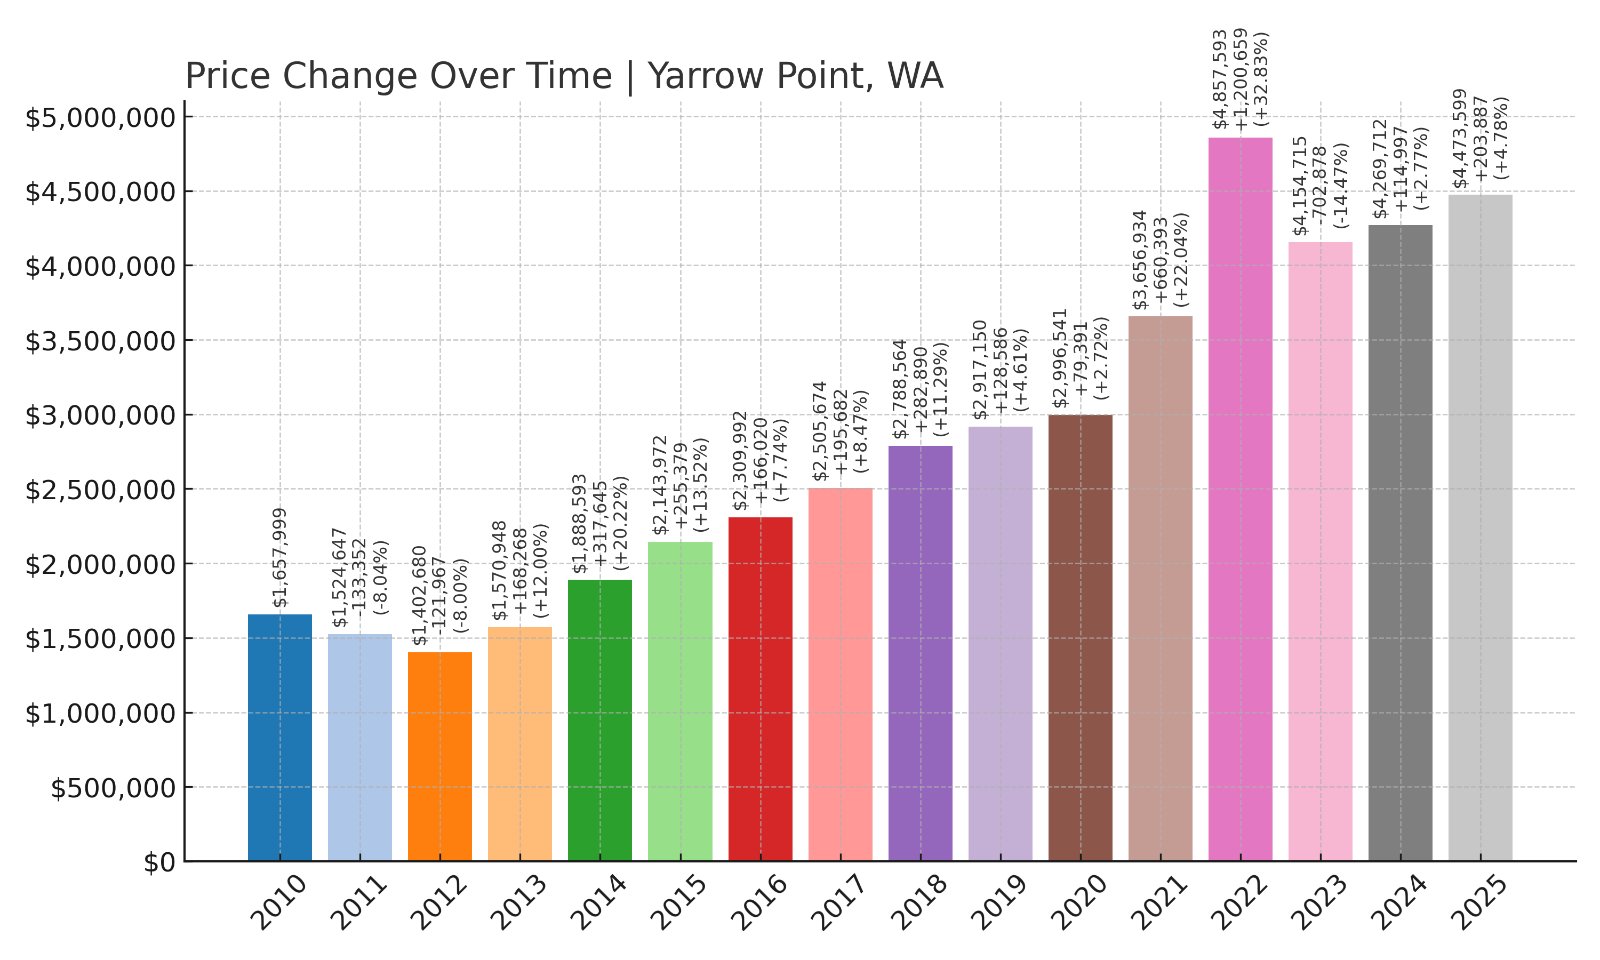
- 2010: $1,657,999
- 2011: $1,524,647 (-$133,352, -8.04% from previous year)
- 2012: $1,402,680 (-$121,966, -8.00% from previous year)
- 2013: $1,570,948 (+$168,267, +12.00% from previous year)
- 2014: $1,888,593 (+$317,646, +20.22% from previous year)
- 2015: $2,143,972 (+$255,378, +13.52% from previous year)
- 2016: $2,309,992 (+$166,020, +7.74% from previous year)
- 2017: $2,505,674 (+$195,682, +8.47% from previous year)
- 2018: $2,788,564 (+$282,890, +11.29% from previous year)
- 2019: $2,917,150 (+$128,586, +4.61% from previous year)
- 2020: $2,996,541 (+$79,391, +2.72% from previous year)
- 2021: $3,656,934 (+$660,392, +22.04% from previous year)
- 2022: $4,857,593 (+$1,200,660, +32.83% from previous year)
- 2023: $4,154,715 (-$702,878, -14.47% from previous year)
- 2024: $4,269,712 (+$114,996, +2.77% from previous year)
- 2025: $4,473,599 (+$203,888, +4.78% from previous year)
Yarrow Point’s home prices rose from $1.65 million in 2010 to over $4.47 million in 2025, more than doubling over the period. This exclusive peninsula community maintains some of the highest property values in Washington.
Yarrow Point – Peninsula Living With Elite Privacy

Located on a peninsula jutting into Lake Washington, Yarrow Point is surrounded by water on three sides. Its quiet streets and waterfront estates are sought after by executives and entrepreneurs looking for privacy and prestige near Seattle and Bellevue.
Homes here often feature private docks and panoramic lake views. According to Zillow, limited inventory and its unique location continue to support strong home price growth, even through occasional market corrections.
2. Medina – 184% Home Price Increase Since 2010
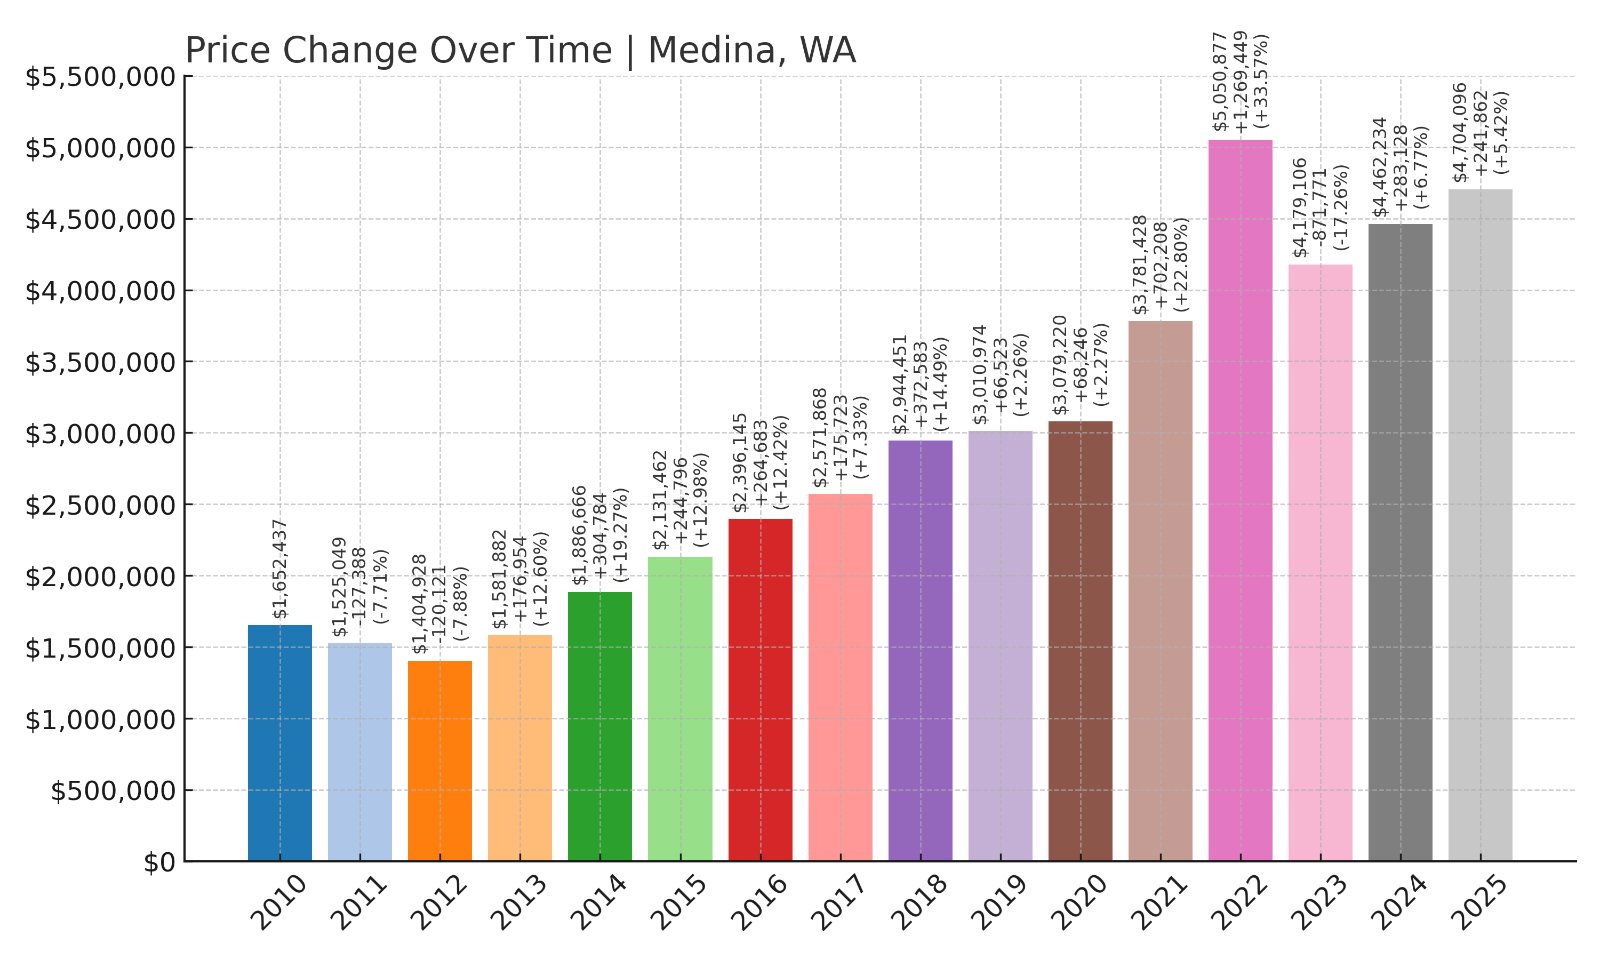
- 2010: $1,652,437
- 2011: $1,525,049 (-$127,388, -7.71% from previous year)
- 2012: $1,404,928 (-$120,121, -7.88% from previous year)
- 2013: $1,581,882 (+$176,954, +12.60% from previous year)
- 2014: $1,886,666 (+$304,784, +19.27% from previous year)
- 2015: $2,131,462 (+$244,796, +12.98% from previous year)
- 2016: $2,396,145 (+$264,684, +12.42% from previous year)
- 2017: $2,571,868 (+$175,723, +7.33% from previous year)
- 2018: $2,944,451 (+$372,583, +14.49% from previous year)
- 2019: $3,010,974 (+$66,523, +2.26% from previous year)
- 2020: $3,079,220 (+$68,246, +2.27% from previous year)
- 2021: $3,781,428 (+$702,208, +22.80% from previous year)
- 2022: $5,050,877 (+$1,269,449, +33.57% from previous year)
- 2023: $4,179,106 (-$871,771, -17.26% from previous year)
- 2024: $4,462,234 (+$283,128, +6.77% from previous year)
- 2025: $4,704,096 (+$241,863, +5.42% from previous year)
Medina’s home prices nearly tripled since 2010, reaching $4.7 million by 2025. This small community’s exclusivity, large lakefront lots, and security make it one of the nation’s wealthiest neighborhoods.
Medina – Home to Billionaires and Waterfront Estates

🔥 Would you like to save this?
Located west of Bellevue on Lake Washington, Medina is famous for its secluded mansions and high-profile residents, including Bill Gates. Strict security and zoning preserve its quiet streets and private shoreline properties.
According to Redfin, Medina consistently ranks as Washington’s most expensive housing market. With limited inventory, strong schools, and unmatched lakefront estates, it continues to attract wealthy buyers seeking privacy and proximity to Bellevue’s business district.
1. Hunts Point – 170% Home Price Increase Since 2013
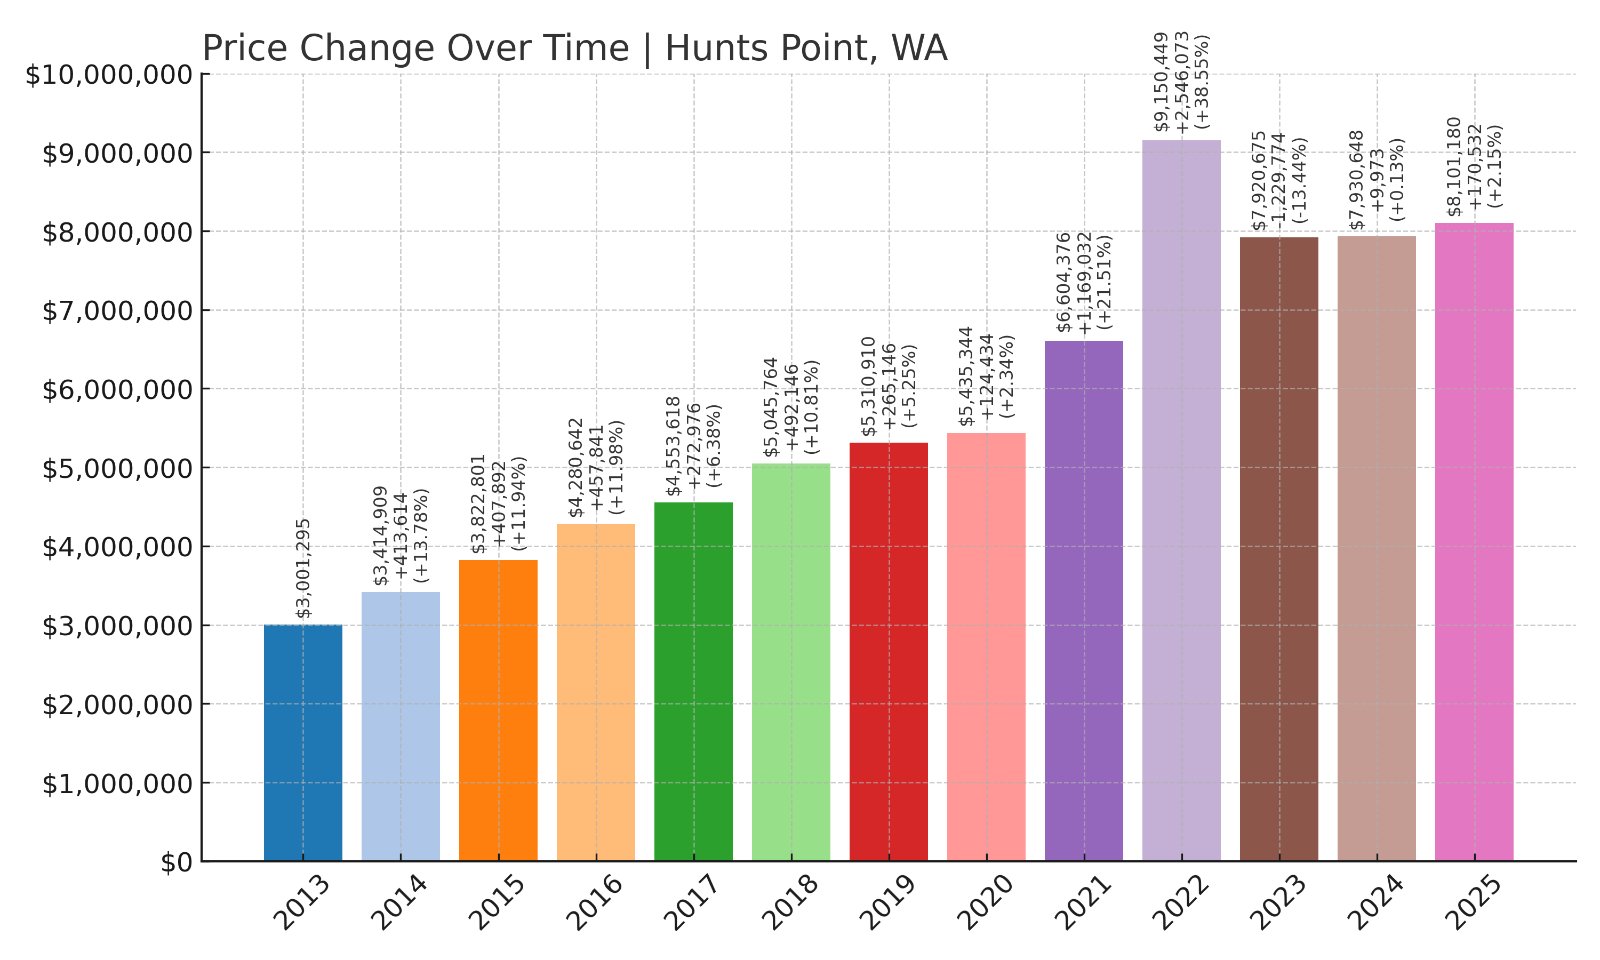
- 2010: N/A
- 2011: N/A
- 2012: N/A
- 2013: $3,001,295
- 2014: $3,414,909 (+$413,614, +13.78% from previous year)
- 2015: $3,822,801 (+$407,892, +11.94% from previous year)
- 2016: $4,280,642 (+$457,841, +11.98% from previous year)
- 2017: $4,553,618 (+$272,976, +6.38% from previous year)
- 2018: $5,045,764 (+$492,146, +10.81% from previous year)
- 2019: $5,310,910 (+$265,146, +5.25% from previous year)
- 2020: $5,435,344 (+$124,434, +2.34% from previous year)
- 2021: $6,604,376 (+$1,169,032, +21.51% from previous year)
- 2022: $9,150,449 (+$2,546,073, +38.55% from previous year)
- 2023: $7,920,675 (-$1,229,774, -13.44% from previous year)
- 2024: $7,930,648 (+$9,974, +0.13% from previous year)
- 2025: $8,101,180 (+$170,531, +2.15% from previous year)
Hunts Point home prices have grown from $3 million in 2013 to over $8.1 million in 2025. This ultra-exclusive community on the eastside of Lake Washington holds the highest property values in the state.
Hunts Point – Ultra-Luxury on a Private Peninsula
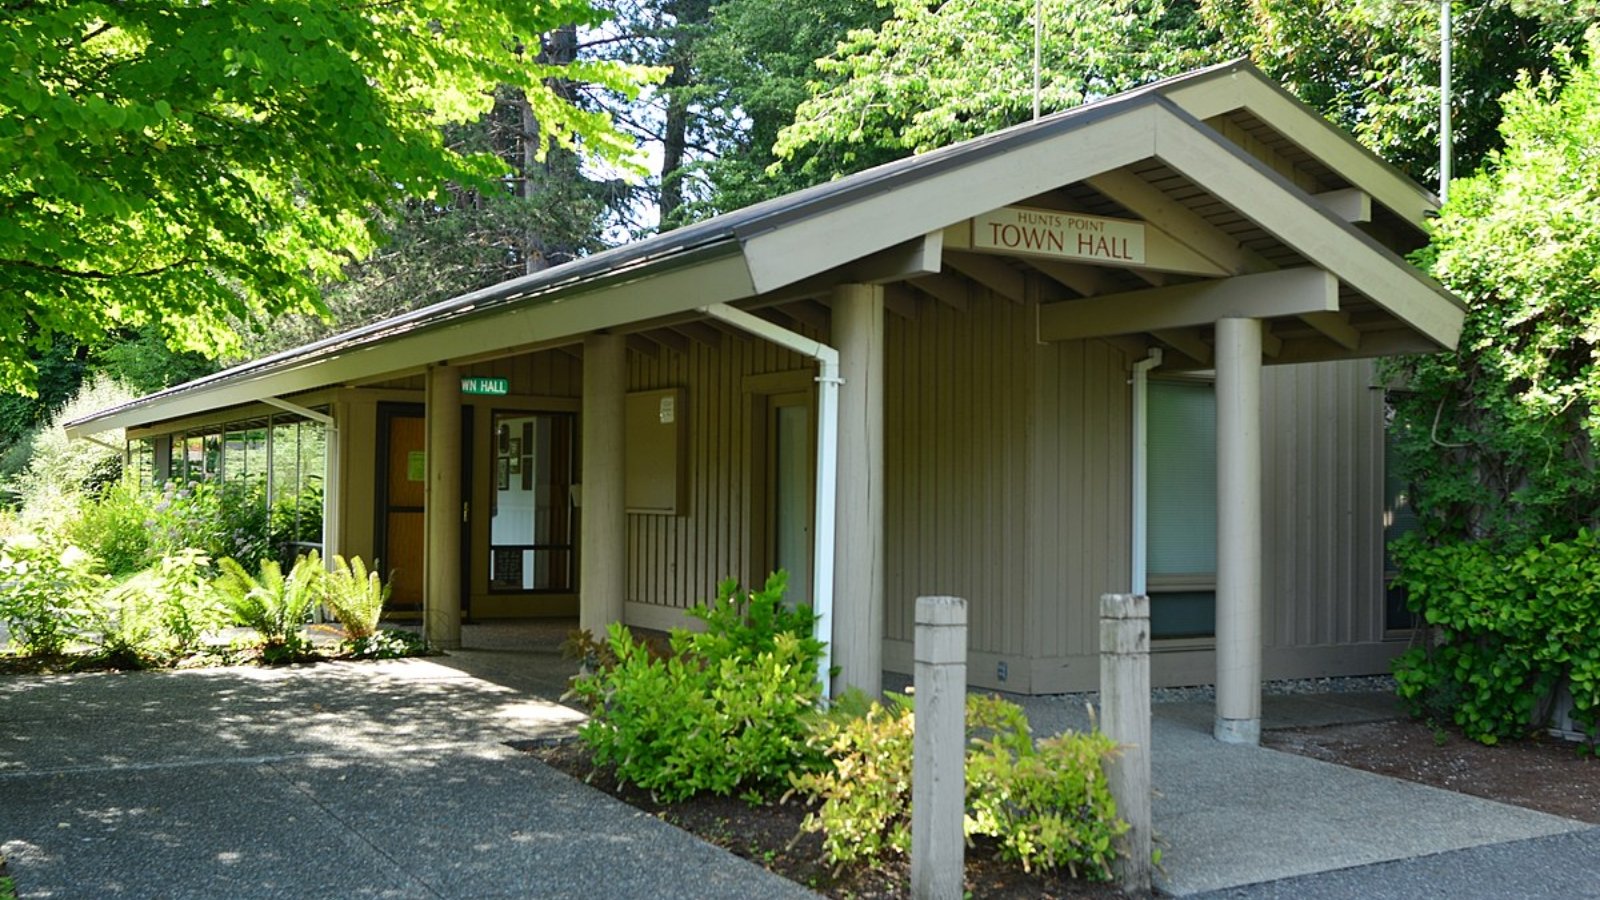
Hunts Point is a small peninsula north of Bellevue with under 500 residents. Known for sprawling estates and private docks, it offers unmatched waterfront access and security. Homes here regularly sell for over $5 million, with some properties exceeding $10 million.
According to Zillow, Hunts Point’s limited housing stock and prestigious reputation keep prices consistently high. Residents enjoy quick access to Bellevue’s amenities and Seattle’s business centers while living in one of the most exclusive communities in the Pacific Northwest.