Would you like to save this?
The Zillow Home Value Index reveals a surprising truth about North Carolina in 2025—some towns are still seriously affordable. While much of the state has seen steep price climbs, these 19 spots have stayed budget-friendly, making them ideal for cost-conscious buyers, small investors, or anyone craving rural calm without the financial squeeze.
From Piedmont foothills to tucked-away coastal corners, these towns stand out for their low housing costs and steady, manageable growth. They aren’t flashy, but they offer space, potential, and value that’s getting harder to find across the Southeast.
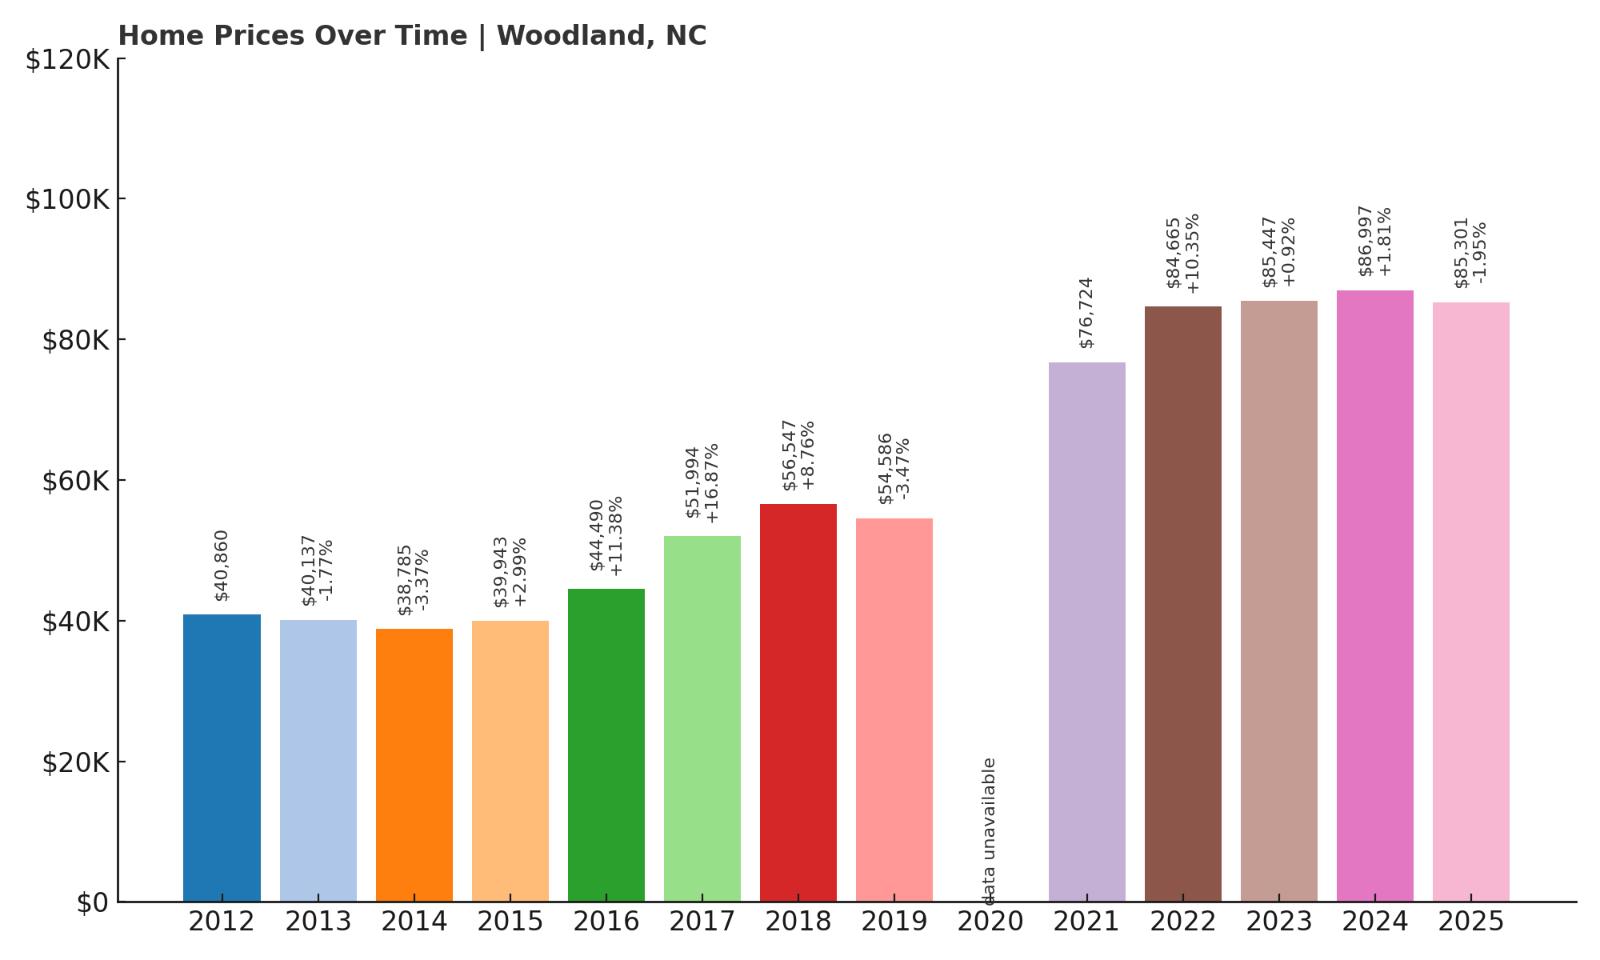
19. Woodland – 109% Home Price Increase Since 2012
- 2010: N/A
- 2011: N/A
- 2012: $40,860
- 2013: $40,137 ($-724, -1.77% from previous year)
- 2014: $38,785 ($-1,352, -3.37% from previous year)
- 2015: $39,943 (+$1,158, +2.99% from previous year)
- 2016: $44,490 (+$4,547, +11.38% from previous year)
- 2017: $51,994 (+$7,504, +16.87% from previous year)
- 2018: $56,547 (+$4,553, +8.76% from previous year)
- 2019: $54,586 ($-1,961, -3.47% from previous year)
- 2020: N/A
- 2021: $76,724
- 2022: $84,665 (+$7,941, +10.35% from previous year)
- 2023: $85,447 (+$782, +0.92% from previous year)
- 2024: $86,997 (+$1,551, +1.81% from previous year)
- 2025: $85,301 ($-1,696, -1.95% from previous year)
Woodland’s home prices more than doubled since 2012, starting at just over $40,000 and peaking above $86,000 before a modest decline in 2025. The steepest jump came between 2016 and 2017, when prices surged over 16%. While there’s been a slight dip recently, this town still holds strong appeal as one of North Carolina’s most affordable housing markets.
Woodland – Quiet Countryside Living With Affordable Homes

Located in Northampton County in northeastern North Carolina, Woodland is a quiet agricultural town that has remained well below the radar of larger housing booms. It offers a low cost of living and a close-knit, rural atmosphere. Access to major highways allows for commutes to nearby employment hubs while keeping property taxes and home values relatively low.
Despite market turbulence in recent years, Woodland has shown consistent long-term growth. The surge in value from 2016 onward suggests increased buyer interest, possibly driven by urban migration trends and remote work flexibility. Though small in size, Woodland is a viable option for anyone prioritizing affordability without completely sacrificing accessibility.
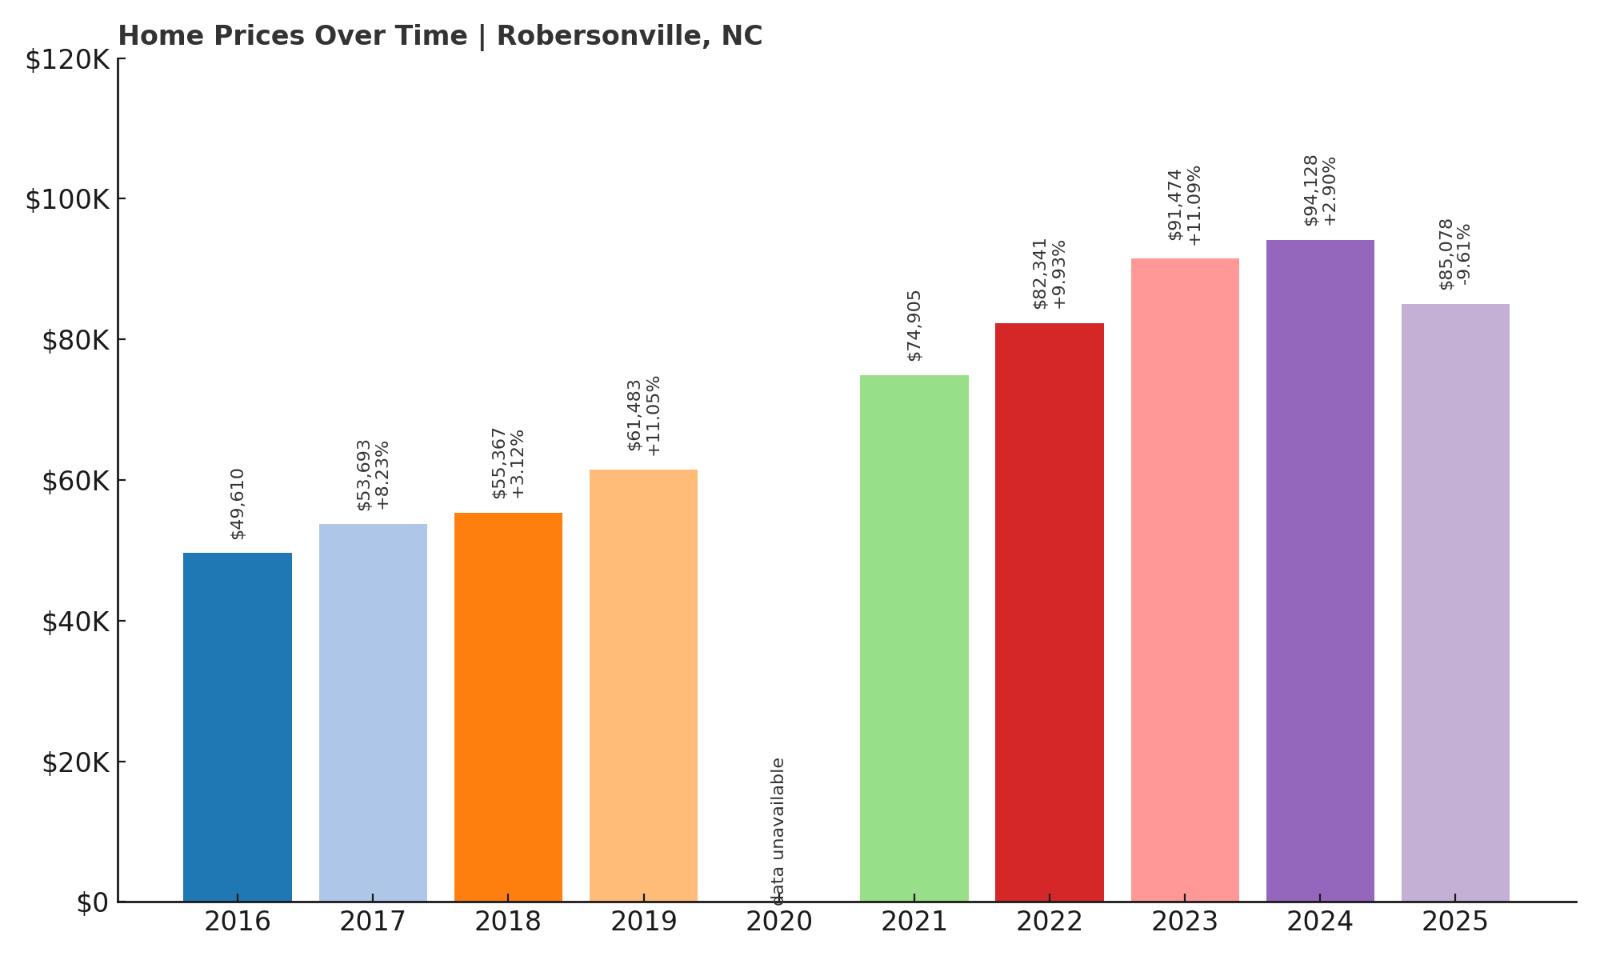
18. Robersonville – 71% Home Price Increase Since 2016
- 2010: N/A
- 2011: N/A
- 2012: N/A
- 2013: N/A
- 2014: N/A
- 2015: N/A
- 2016: $49,610
- 2017: $53,693 (+$4,082, +8.23% from previous year)
- 2018: $55,367 (+$1,674, +3.12% from previous year)
- 2019: $61,483 (+$6,117, +11.05% from previous year)
- 2020: N/A
- 2021: $74,905
- 2022: $82,341 (+$7,435, +9.93% from previous year)
- 2023: $91,474 (+$9,133, +11.09% from previous year)
- 2024: $94,128 (+$2,654, +2.90% from previous year)
- 2025: $85,078 ($-9,049, -9.61% from previous year)
Since 2016, home values in Robersonville jumped from under $50,000 to a peak of $94,128 in 2024 before dipping to $85,078 in 2025. That’s a substantial increase of over 70% across nine years, driven by significant gains between 2019 and 2023. Despite the drop in the most recent year, Robersonville still remains far below state price averages.
Robersonville – Small Town with Big Value Gains
Robersonville, located in Martin County, blends affordability with access to nearby Greenville and the Inner Banks region. This eastern North Carolina town has long served as a hub for farming and small-scale manufacturing. Its housing market reflects stable economic undercurrents with an influx of buyer interest during the pandemic-era migration shifts.
The steady increase in prices from 2016 to 2023 hints at outside demand meeting still-low local supply. Robersonville’s modest population and available land make it attractive for those looking for large lots or starter homes without breaking the bank. Even with the recent dip, its price point makes it among the most wallet-friendly towns in the state.
17. Garysburg – 98% Home Price Increase Since 2013

- 2010: N/A
- 2011: N/A
- 2012: N/A
- 2013: $42,398
- 2014: $40,448 ($-1,950, -4.60% from previous year)
- 2015: $39,347 ($-1,101, -2.72% from previous year)
- 2016: $44,251 (+$4,904, +12.46% from previous year)
- 2017: $49,819 (+$5,568, +12.58% from previous year)
- 2018: $53,946 (+$4,128, +8.29% from previous year)
- 2019: $54,726 (+$780, +1.45% from previous year)
- 2020: N/A
- 2021: $79,038
- 2022: $89,090 (+$10,052, +12.72% from previous year)
- 2023: $84,313 ($-4,777, -5.36% from previous year)
- 2024: $81,389 ($-2,925, -3.47% from previous year)
- 2025: $84,112 (+$2,724, +3.35% from previous year)
Garysburg’s price trend showcases a nearly two-fold increase from 2013 to 2025. While recent years have seen some slight drops, the general trend is still upward, with prices stabilizing around $84,000. Growth was particularly strong in the years leading up to 2022, indicating possible infrastructure or demand shifts.
Garysburg – Strong Gains and Affordable Options
In the Roanoke Rapids area of Northampton County, Garysburg has emerged as a low-cost alternative to pricier markets in central or coastal North Carolina. This town offers access to I-95 and regional commerce, making it an appealing spot for commuters who want low housing costs and convenience.
Garysburg’s property values jumped quickly between 2016 and 2022, suggesting demand from those priced out elsewhere. Although values slipped slightly during the broader market correction, they remain well above pre-2020 levels. For buyers with flexibility and a rural preference, Garysburg delivers both price and potential.
16. Oak City – 5% Home Price Increase Since 2022
- 2010: N/A
- 2011: N/A
- 2012: N/A
- 2013: N/A
- 2014: N/A
- 2015: N/A
- 2016: N/A
- 2017: N/A
- 2018: N/A
- 2019: N/A
- 2020: N/A
- 2021: N/A
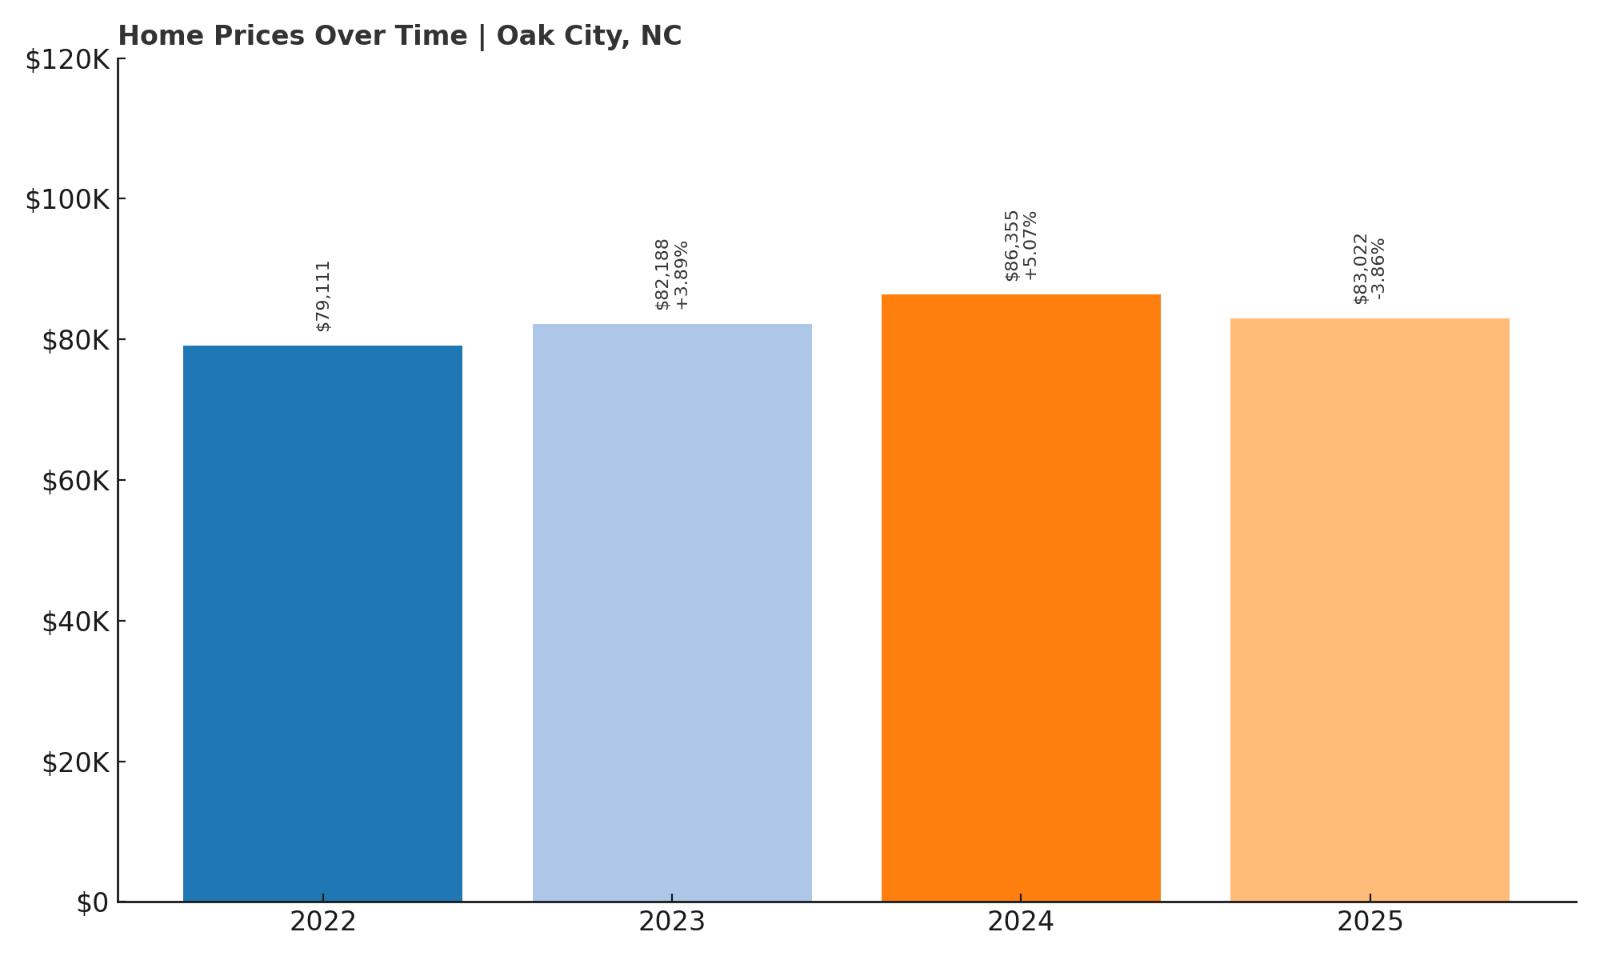
- 2022: $79,111
- 2023: $82,188 (+$3,077, +3.89% from previous year)
- 2024: $86,355 (+$4,168, +5.07% from previous year)
- 2025: $83,022 ($-3,334, -3.86% from previous year)
Though short on historical data, Oak City’s prices have inched up around 5% since 2022, peaking in 2024 before a slight correction. Even with the dip, its price remains in the low $80,000s—still highly competitive compared to statewide averages.
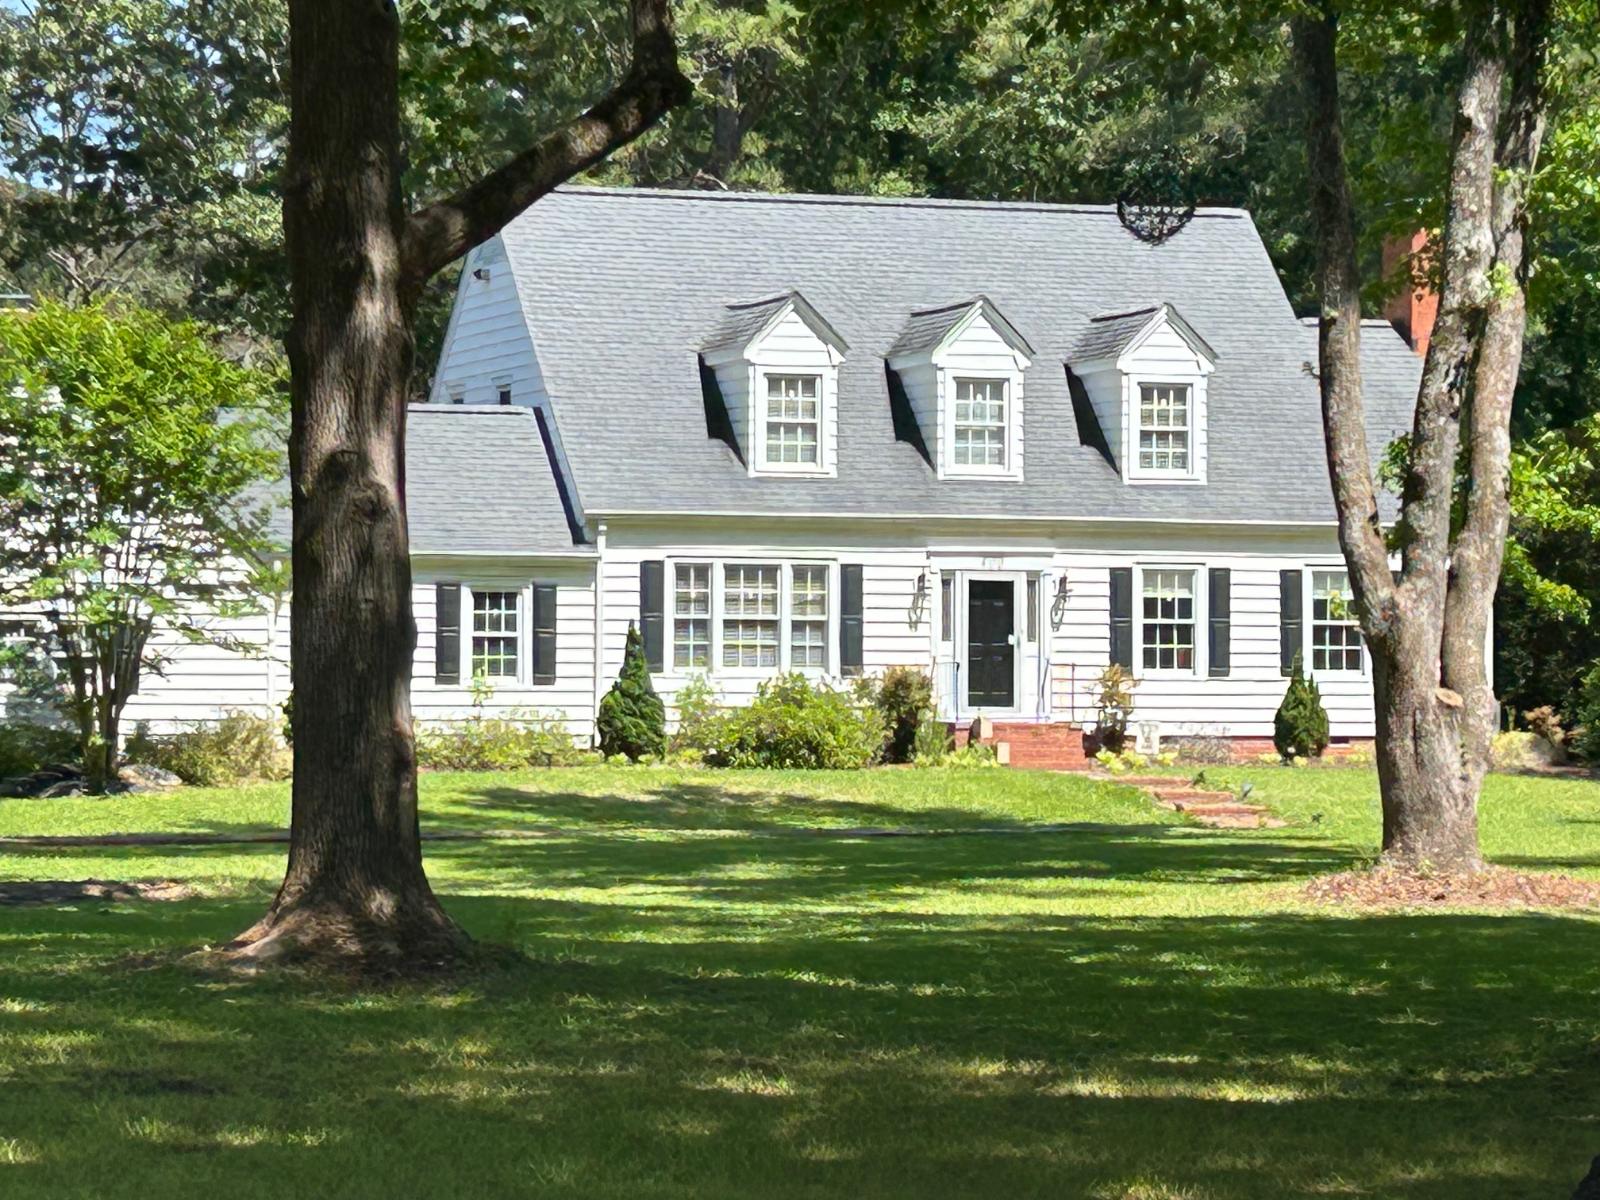
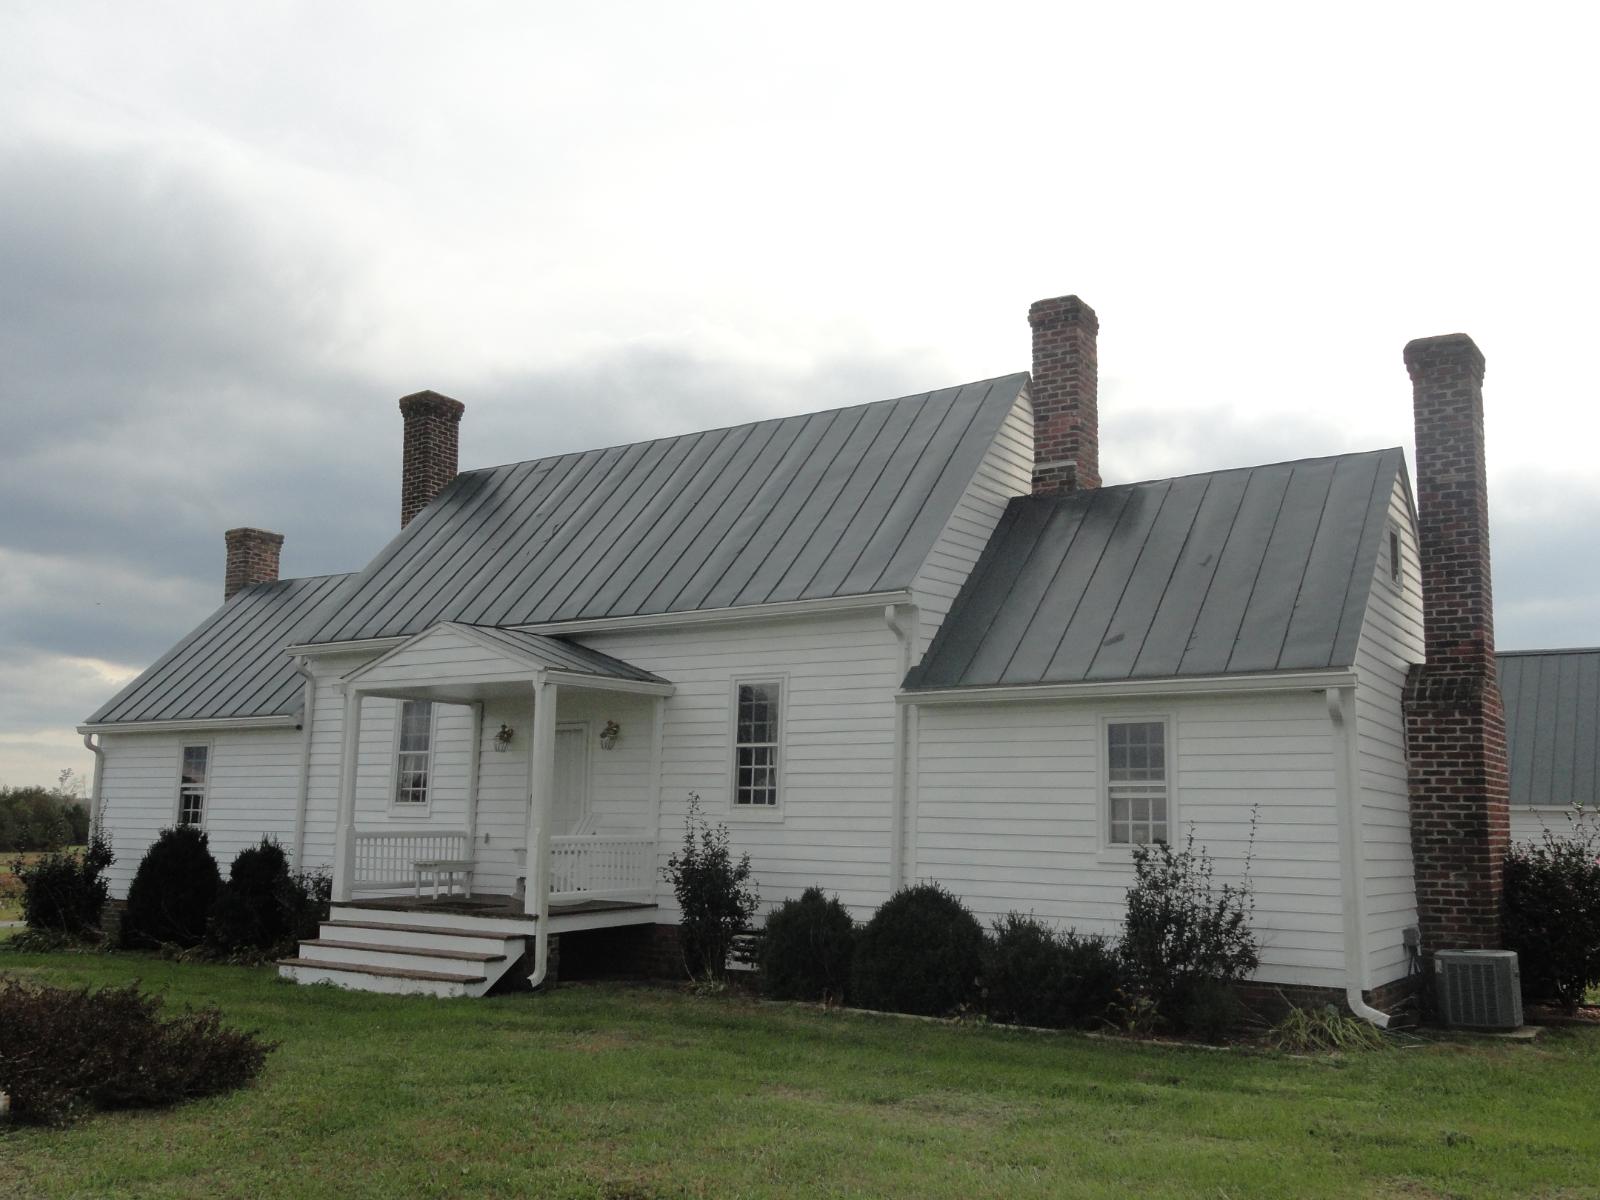
Oak City – Quiet Affordability With Stable Prices
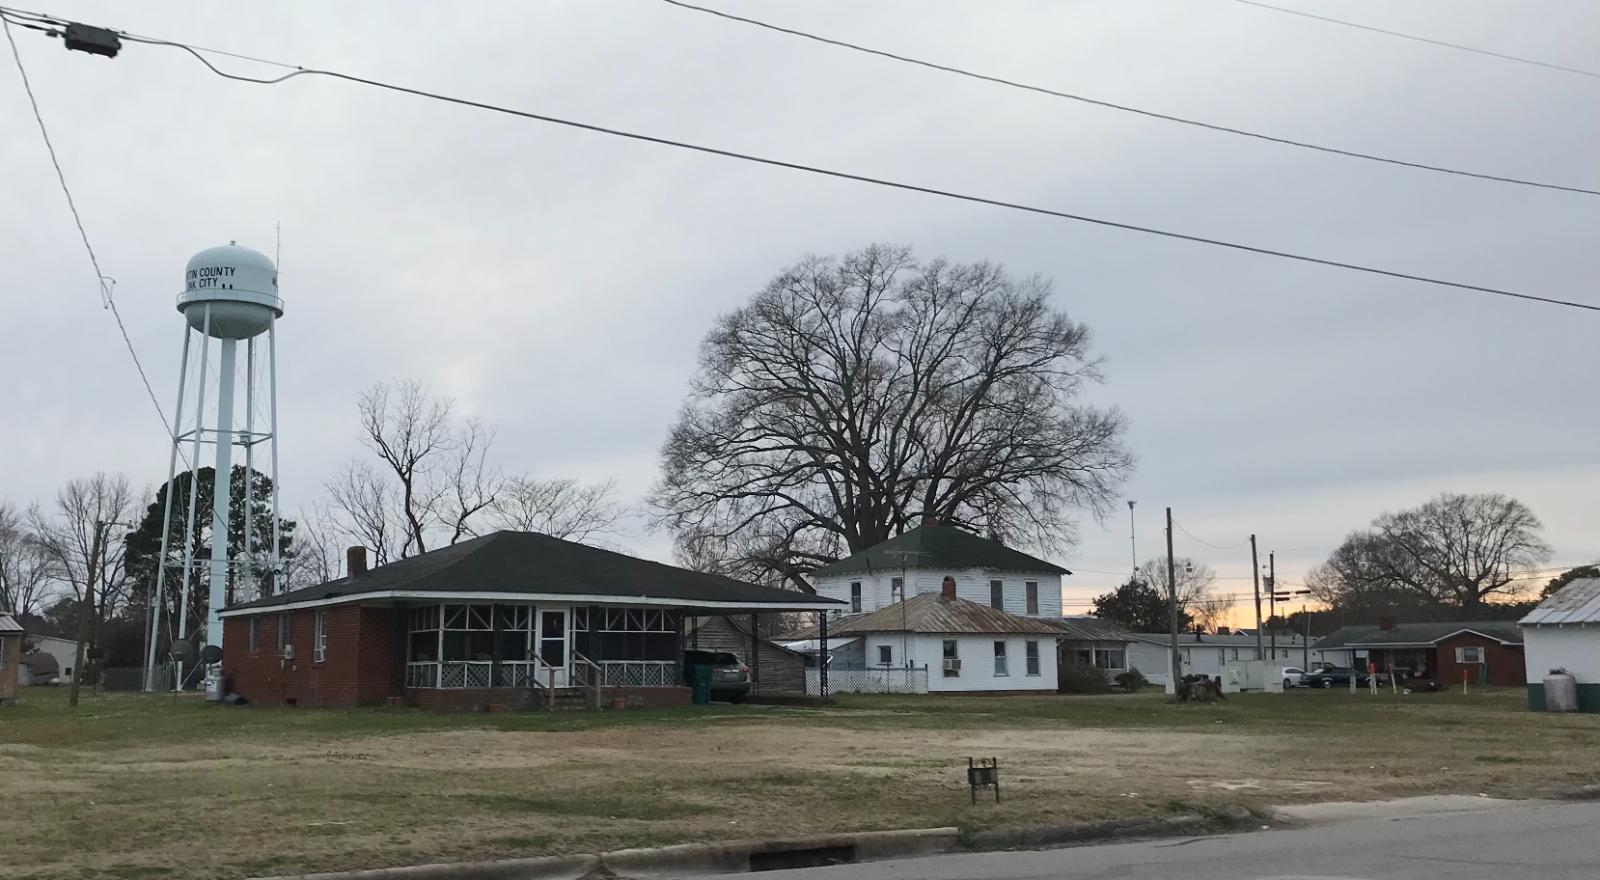
Oak City sits in Martin County, surrounded by farmland and quiet roads. The town has stayed off the radar for most buyers, which has helped keep prices affordable while still seeing slight growth from 2022 through 2024. The housing stock consists largely of single-family homes and mobile units on large plots.
Oak City may appeal most to locals or remote workers looking for low prices in a peaceful setting. It’s not a place undergoing rapid change, but its consistency and lack of volatility make it attractive for long-term holds or retirement-focused buyers.
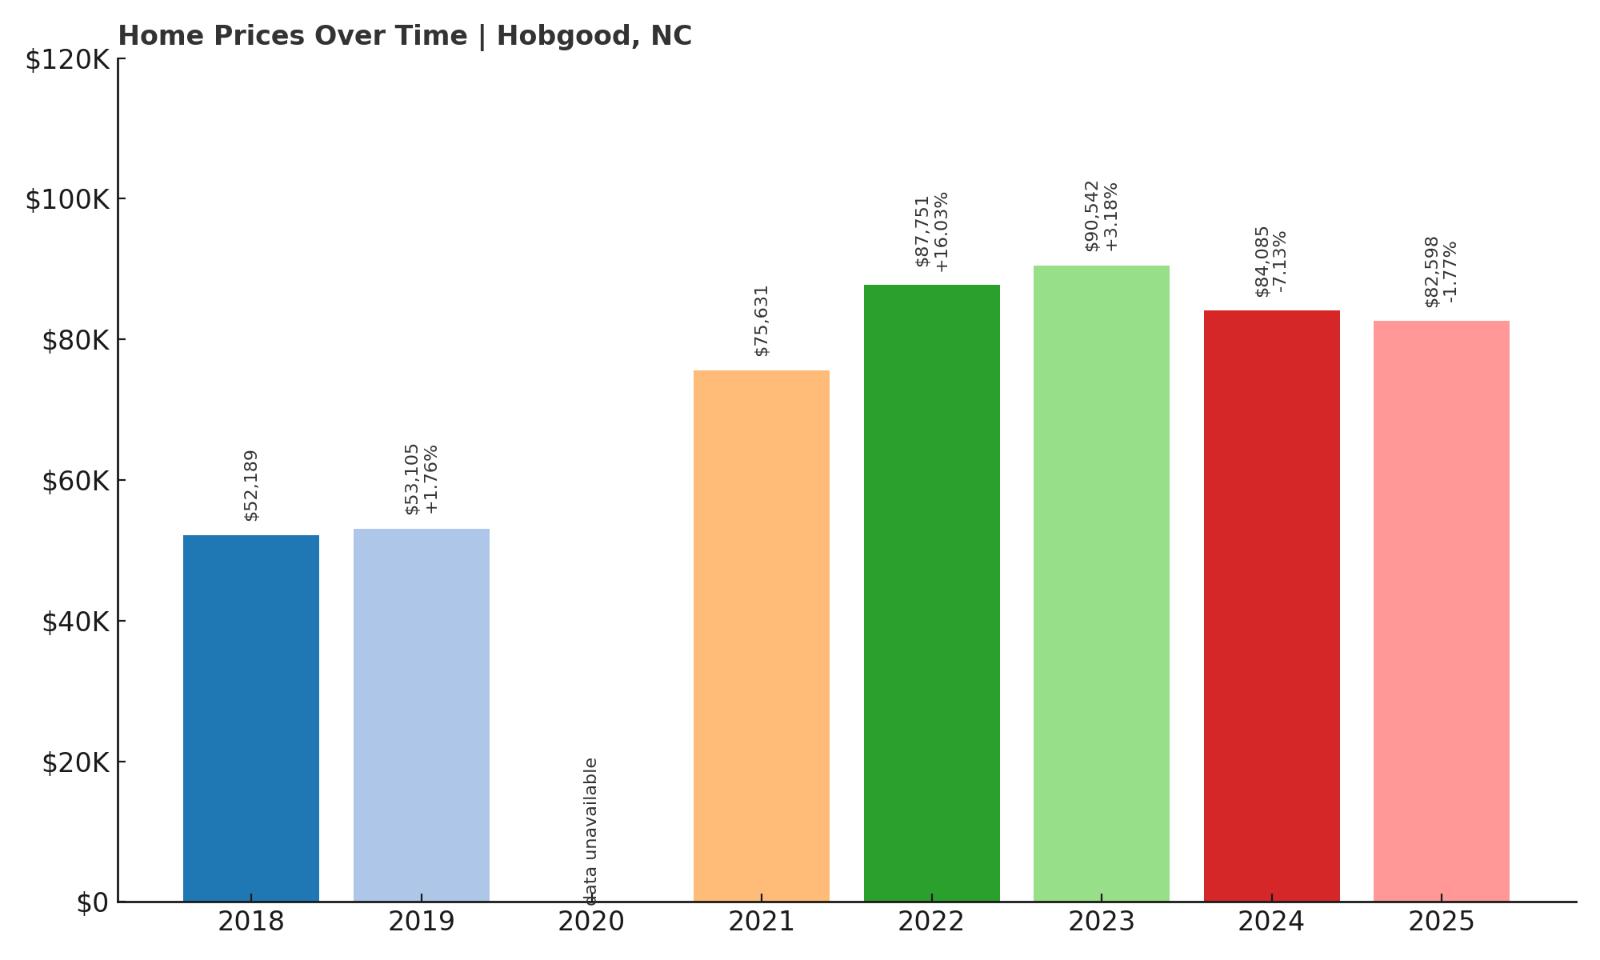
15. Hobgood – 58% Home Price Increase Since 2018
- 2010: N/A
- 2011: N/A
- 2012: N/A
- 2013: N/A
- 2014: N/A
- 2015: N/A
- 2016: N/A
- 2017: N/A
- 2018: $52,189
- 2019: $53,105 (+$916, +1.76% from previous year)
- 2020: N/A
- 2021: $75,631
- 2022: $87,751 (+$12,120, +16.02% from previous year)
- 2023: $90,542 (+$2,791, +3.18% from previous year)
- 2024: $84,085 ($-6,457, -7.13% from previous year)
- 2025: $82,598 ($-1,486, -1.77% from previous year)
From a starting point of $52,189 in 2018, Hobgood’s prices have grown by nearly 60%, fueled by double-digit spikes in 2021 and 2022. Although prices fell slightly in 2024 and 2025, the town remains an affordable option for buyers looking below six-figure home values.
Hobgood – Big Gains in a Small Town

Hobgood lies on the border of Halifax and Edgecombe counties and has kept its quiet charm even as prices climbed. The town experienced notable growth in 2021 and 2022, possibly due to broader economic shifts that encouraged rural investment. Even with recent price dips, it retains a sub-$85,000 average, which is rare in today’s market.
With its small population and mix of older homes, Hobgood hasn’t seen large-scale development, making it attractive for those who want simplicity and value. It may not be bustling, but for homebuyers on a tight budget, it delivers a significant price advantage without compromising the sense of community.
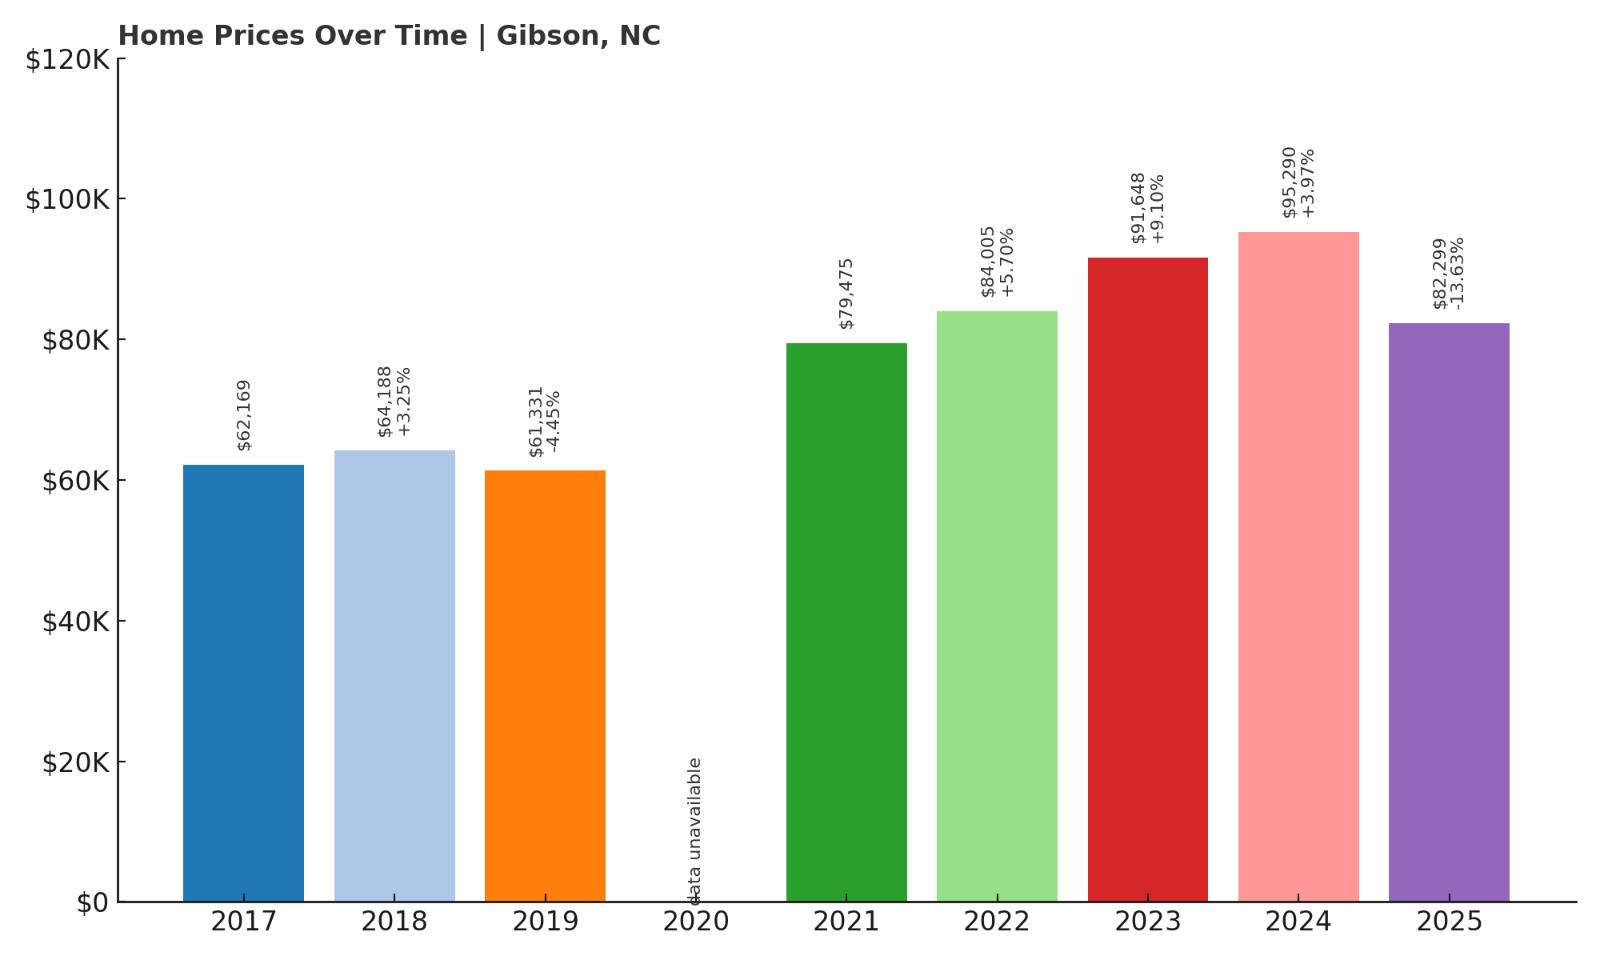
14. Gibson – 32% Home Price Increase Since 2017
- 2010: N/A
- 2011: N/A
- 2012: N/A
- 2013: N/A
- 2014: N/A
- 2015: N/A
- 2016: N/A
- 2017: $62,169
- 2018: $64,188 (+$2,019, +3.25% from previous year)
- 2019: $61,331 ($-2,857, -4.45% from previous year)
- 2020: N/A
- 2021: $79,475
- 2022: $84,005 (+$4,530, +5.70% from previous year)
- 2023: $91,648 (+$7,642, +9.10% from previous year)
- 2024: $95,290 (+$3,642, +3.97% from previous year)
- 2025: $82,299 ($-12,991, -13.63% from previous year)
Home prices in Gibson have increased by 32% since 2017, starting at $62,169 and ending at $82,299 in 2025. The town saw steady appreciation through 2023, with particularly strong growth between 2021 and 2023. However, 2025 brought a notable price drop of over 13%, the largest decline in this data set. This could reflect a short-term correction after a period of rapid inflation. Despite that dip, the current value remains well above earlier years, suggesting a net gain over time. Gibson’s price movement paints a picture of volatility typical of smaller markets with limited inventory. The town remains highly affordable despite the price swings. For buyers with patience and a long-term view, Gibson still offers entry points far below statewide averages.
Gibson – A Rural Market with Peaks and Dips
Located near the South Carolina border in Scotland County, Gibson is a small town surrounded by farmland and quiet backroads. It’s a quiet and unassuming place with a strong sense of community. The town has very little commercial development, which helps keep demand—and prices—relatively low. In recent years, a wave of interest in affordable rural living led to price gains, especially during the 2021–2023 window. Gibson’s homes tend to be modest and older, offering value to buyers willing to invest in upgrades. Though 2025 saw a sharp dip in value, this could present an opportunity for those looking to buy low. Its proximity to larger towns like Laurinburg and Bennettsville makes it feasible for commuting. For buyers chasing low-cost ownership with long-term potential, Gibson fits the bill.
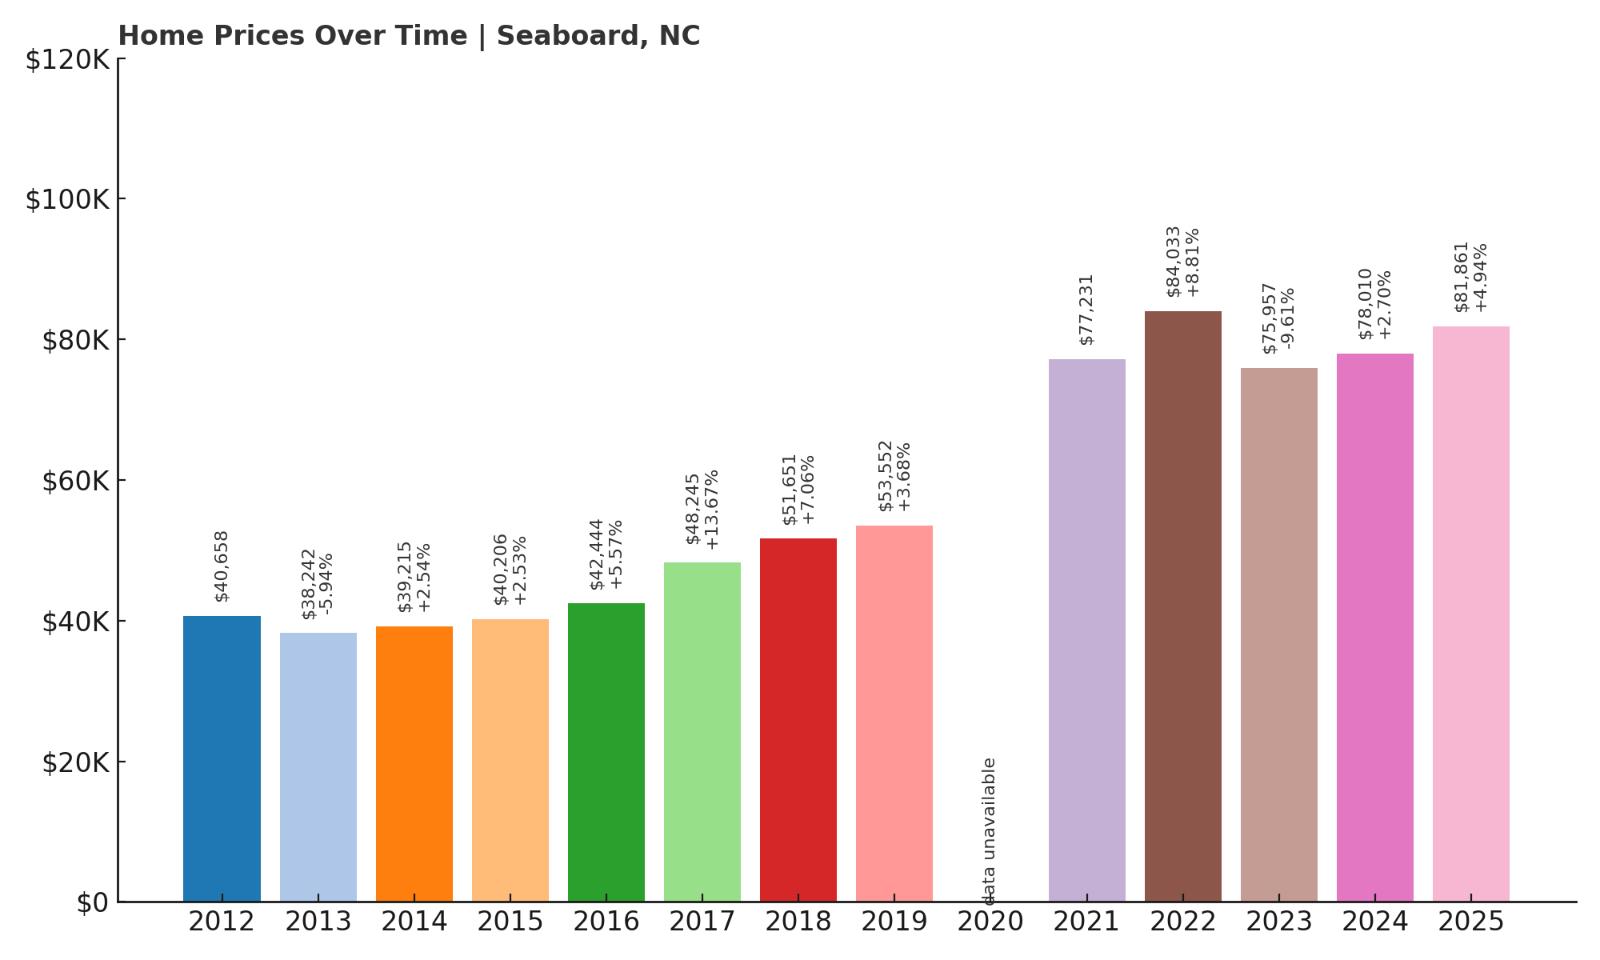
13. Seaboard – 101% Home Price Increase Since 2012
Would you like to save this?
- 2010: N/A
- 2011: N/A
- 2012: $40,658
- 2013: $38,242 ($-2,415, -5.94% from previous year)
- 2014: $39,215 (+$972, +2.54% from previous year)
- 2015: $40,206 (+$991, +2.53% from previous year)
- 2016: $42,444 (+$2,238, +5.57% from previous year)
- 2017: $48,245 (+$5,802, +13.67% from previous year)
- 2018: $51,651 (+$3,406, +7.06% from previous year)
- 2019: $53,552 (+$1,901, +3.68% from previous year)
- 2020: N/A
- 2021: $77,231
- 2022: $84,033 (+$6,802, +8.81% from previous year)
- 2023: $75,957 ($-8,076, -9.61% from previous year)
- 2024: $78,010 (+$2,053, +2.70% from previous year)
- 2025: $81,861 (+$3,851, +4.94% from previous year)
From 2012 to 2025, home prices in Seaboard rose by more than 100%, beginning at $40,658 and climbing to $81,861. After a few early declines, the town experienced solid growth, especially between 2016 and 2018. A second wave of price jumps arrived in 2021 and 2022, followed by a brief dip in 2023. Prices have since resumed a steady upward trend. This pattern indicates a market that responds sharply to regional demand but remains on a long-term growth trajectory. Despite occasional volatility, Seaboard continues to offer affordability compared to the rest of the state. It remains a viable location for budget-minded buyers who aren’t deterred by modest price fluctuations. The sub-$85,000 price point in 2025 still reflects considerable value.
Seaboard – Long-Term Growth in a Small Community

Seaboard is another quiet Northampton County town that’s seeing the ripple effects of rising interest in rural real estate. Its housing stock is a mix of historic single-family homes and smaller units, many dating back decades. Access to major roads like NC-186 helps residents reach nearby towns like Roanoke Rapids and Jackson. Seaboard is small, with a population of just a few hundred people, but its affordability and community-driven atmosphere make it attractive to retirees and remote workers alike. The large price surge in 2021 and 2022 hints at increased buyer interest from outside the area. That said, prices remain far below urban averages, allowing buyers to secure property without major financial stress. The modest rebound in 2024 and 2025 suggests confidence returning to the local market. Seaboard may not be a hotspot, but it’s steady, simple, and affordable.
12. Garland – 106% Home Price Increase Since 2010
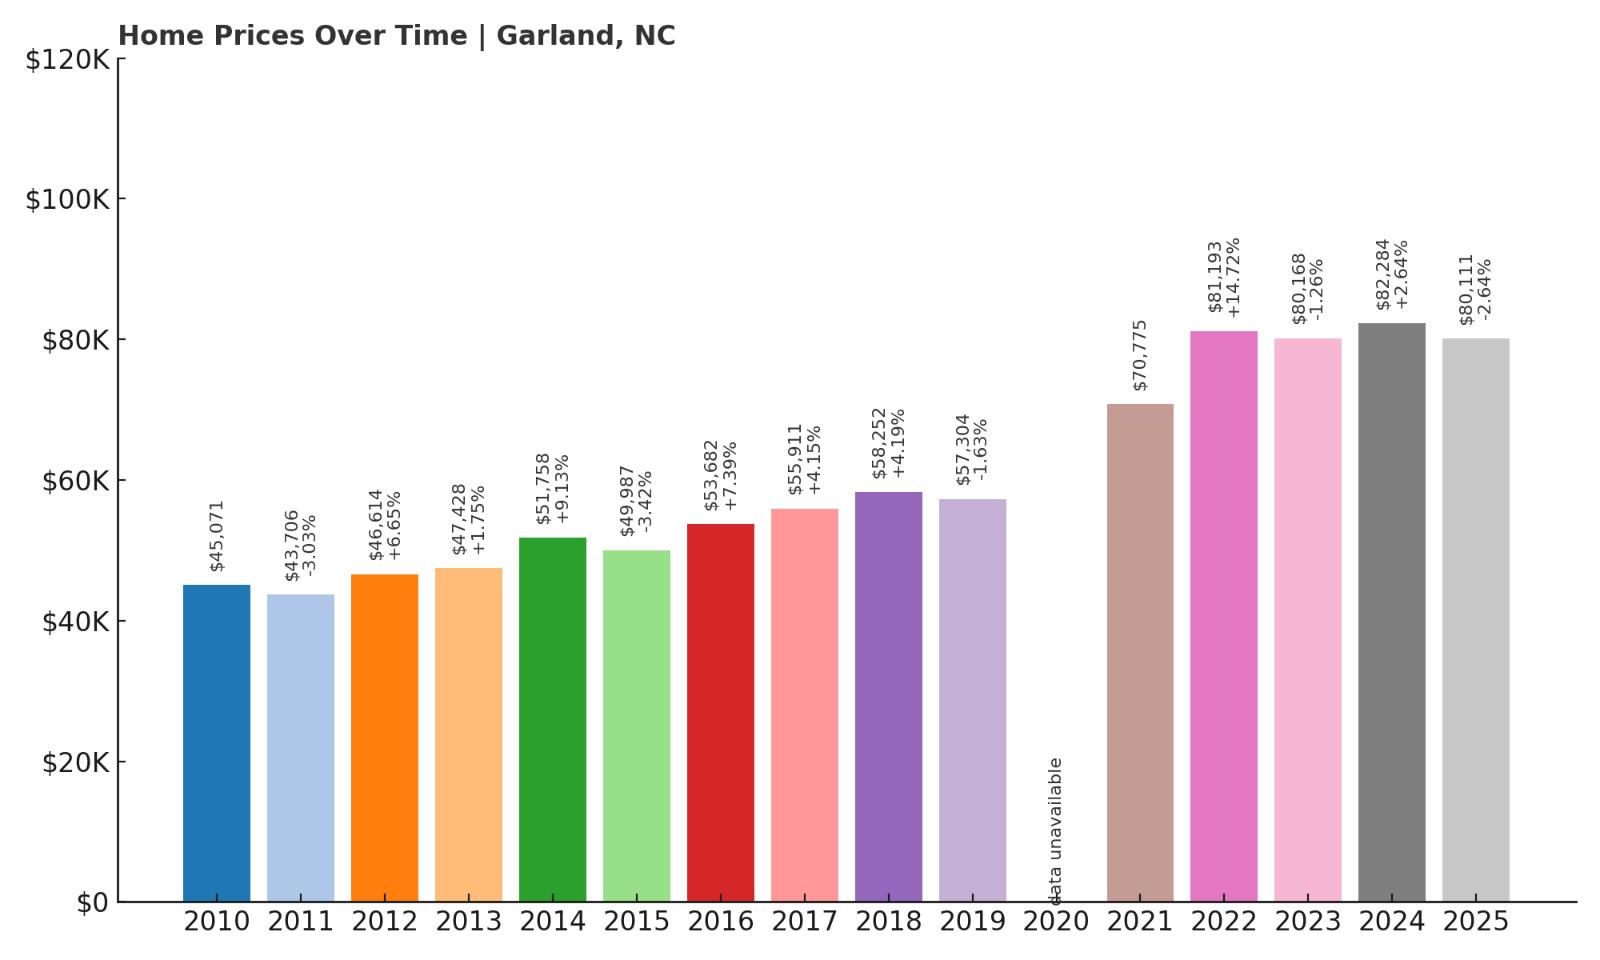
- 2010: $45,071
- 2011: $43,706 ($-1,365, -3.03% from previous year)
- 2012: $46,614 (+$2,908, +6.65% from previous year)
- 2013: $47,428 (+$814, +1.75% from previous year)
- 2014: $51,758 (+$4,330, +9.13% from previous year)
- 2015: $49,987 ($-1,771, -3.42% from previous year)
- 2016: $53,682 (+$3,694, +7.39% from previous year)
- 2017: $55,911 (+$2,229, +4.15% from previous year)
- 2018: $58,252 (+$2,341, +4.19% from previous year)
- 2019: $57,304 ($-948, -1.63% from previous year)
- 2020: N/A
- 2021: $70,775
- 2022: $81,193 (+$10,418, +14.72% from previous year)
- 2023: $80,168 ($-1,025, -1.26% from previous year)
- 2024: $82,284 (+$2,116, +2.64% from previous year)
- 2025: $80,111 ($-2,173, -2.64% from previous year)
Garland’s home values more than doubled from 2010 to 2025, starting at $45,071 and reaching $80,111. The town saw a few dips, but these were short-lived compared to the strong growth years. Notably, 2022 marked a large jump with nearly 15% appreciation. The more recent years have been stable with slight decreases that don’t undermine the long-term trend. This kind of pricing history shows resilience, especially for such a small market. Garland has attracted attention for its affordability and steady upward mobility. Buyers who entered the market in the early 2010s would have seen strong returns. Even in 2025, Garland is an affordable entry point compared to North Carolina’s median home price.
Garland – Rural Charm and Strong Price Performance
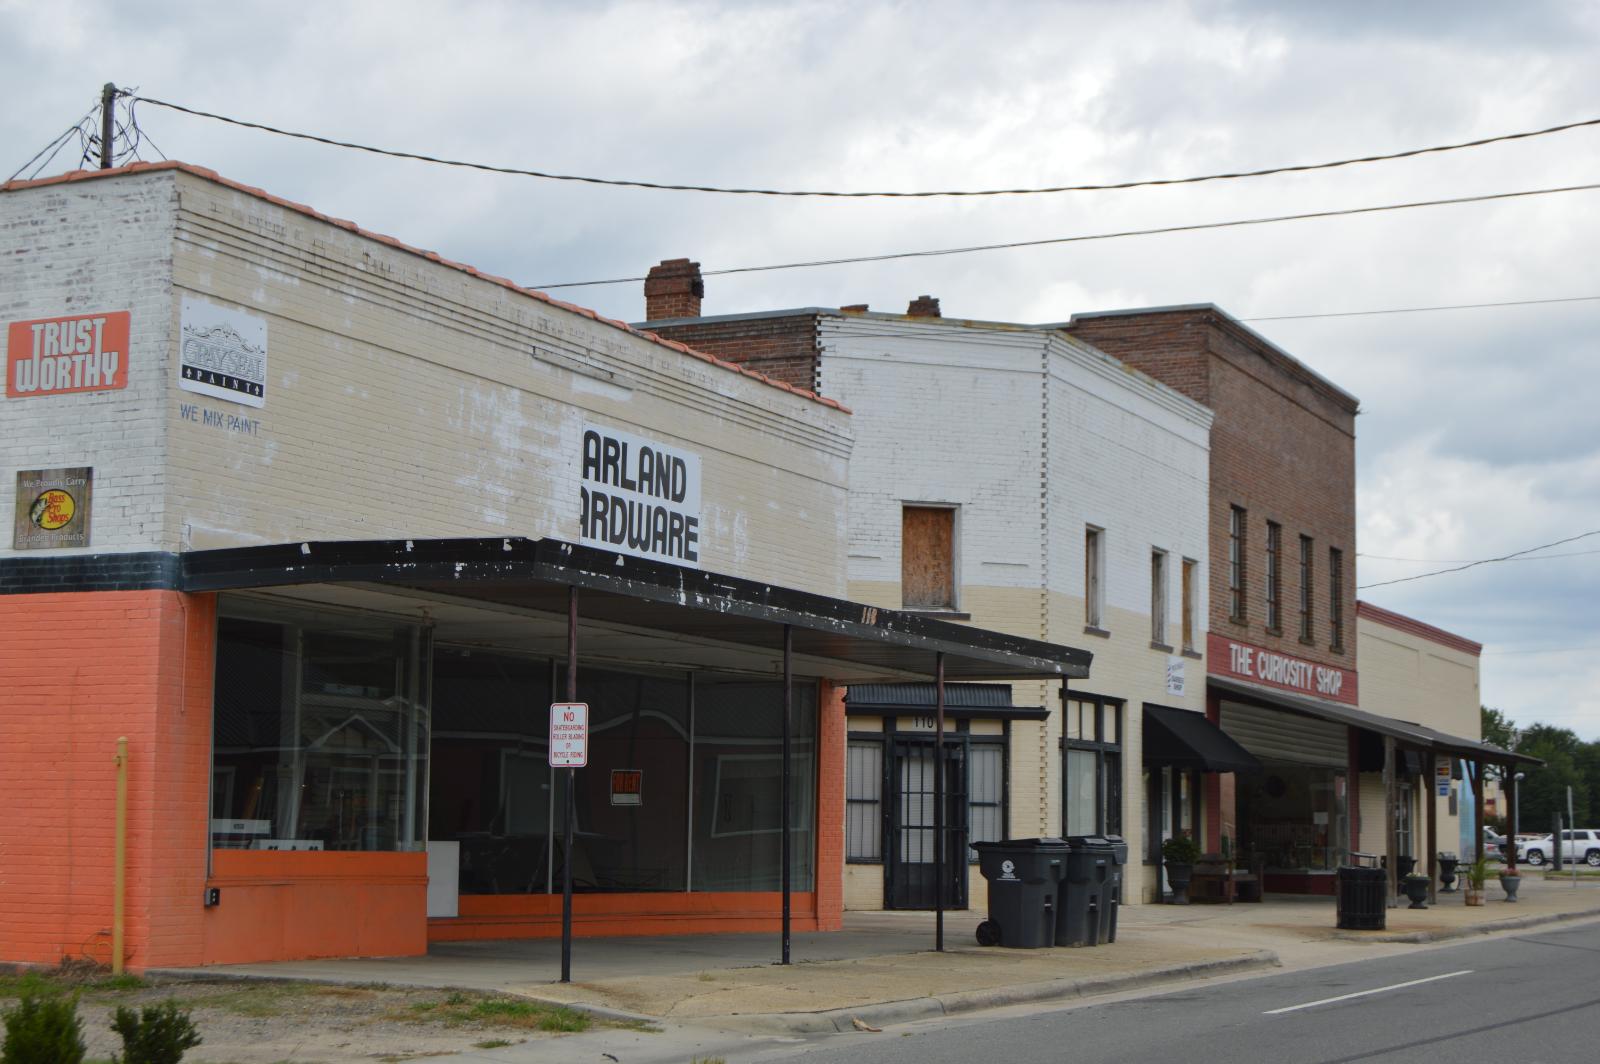
Garland is a quiet town in Sampson County, known for its agricultural roots and strong community ties. It’s the kind of place where neighbors know each other and growth happens slowly but surely. The town is strategically positioned between Fayetteville and Wilmington, making it a potential choice for buyers who want peace and quiet with access to bigger cities. Garland’s affordability and space are appealing for retirees, small families, or remote workers. Infrastructure is limited, but the low prices help compensate for fewer amenities. Housing stock ranges from historic cottages to newer modular homes. The big jump in prices in 2022 likely came from broader trends that drove buyers to small, rural areas. Even with recent price stabilization, Garland remains one of the better-performing small towns in the region.
11. Scotland Neck – 70% Home Price Increase Since 2010
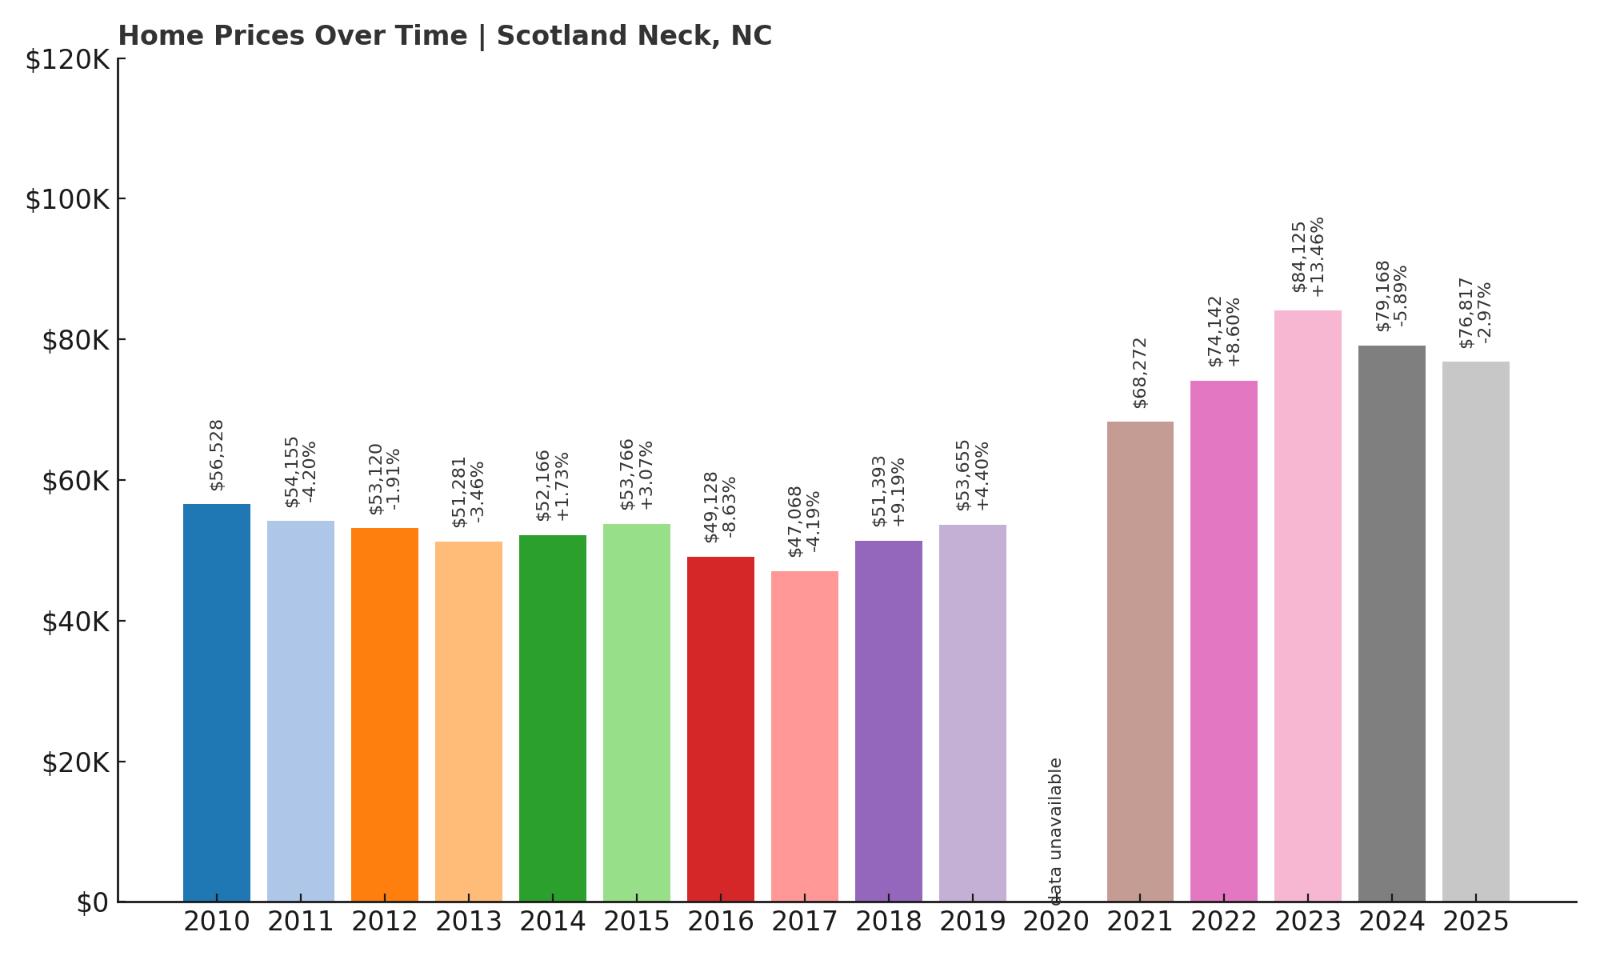
- 2010: $56,528
- 2011: $54,155 ($-2,373, -4.20% from previous year)
- 2012: $53,120 ($-1,035, -1.91% from previous year)
- 2013: $51,281 ($-1,839, -3.46% from previous year)
- 2014: $52,166 (+$885, +1.73% from previous year)
- 2015: $53,766 (+$1,600, +3.07% from previous year)
- 2016: $49,128 ($-4,638, -8.63% from previous year)
- 2017: $47,068 ($-2,061, -4.19% from previous year)
- 2018: $51,393 (+$4,325, +9.19% from previous year)
- 2019: $53,655 (+$2,262, +4.40% from previous year)
- 2020: N/A
- 2021: $68,272
- 2022: $74,142 (+$5,870, +8.60% from previous year)
- 2023: $84,125 (+$9,983, +13.46% from previous year)
- 2024: $79,168 ($-4,957, -5.89% from previous year)
- 2025: $76,817 ($-2,351, -2.97% from previous year)
Scotland Neck’s housing market has seen a 70% increase since 2010, despite early declines and some dips in recent years. Prices dipped in the mid-2010s but recovered strongly starting in 2018. The biggest gains came in 2021 and 2023, when appreciation topped 13%. Even with a slight downturn in 2024 and 2025, values remain well above historical norms. The town’s affordability and potential for rebound make it worth a look. Scotland Neck combines modest housing prices with solid infrastructure and amenities. Price growth is real, even if not totally consistent. For long-term buyers, it still presents a compelling value story.
Scotland Neck – Stable Growth in a Resilient Town
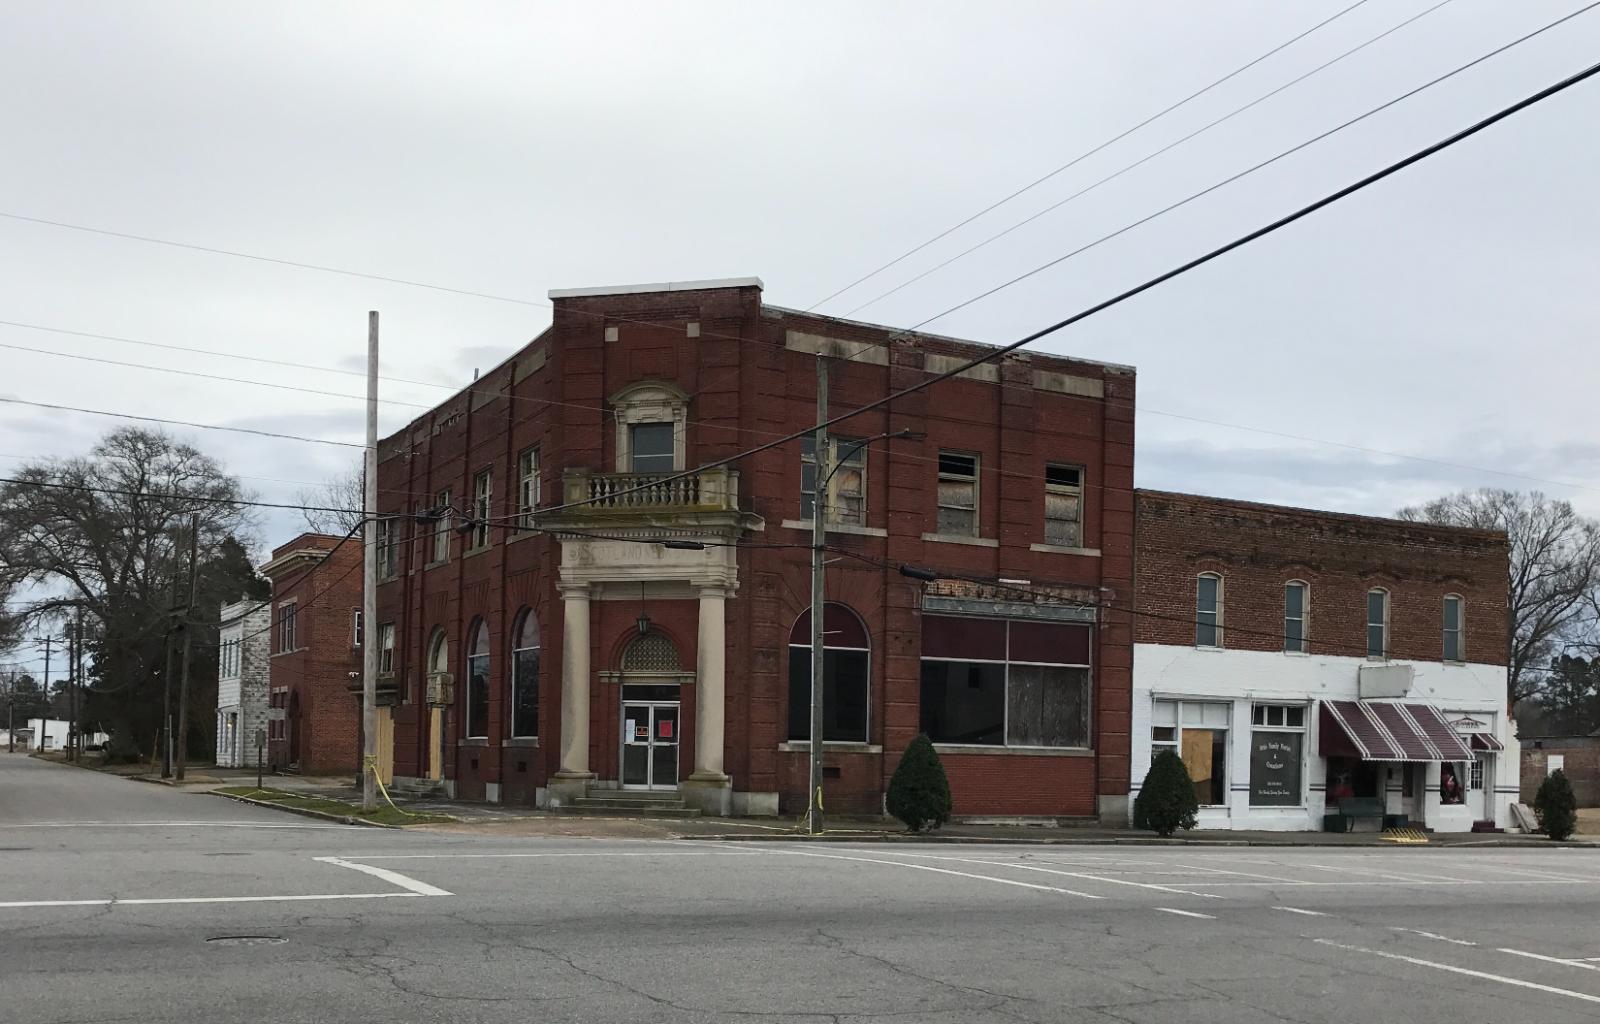
Located in Halifax County, Scotland Neck sits along US-258 and has long been a crossroads for agriculture and trade. It’s a small town with a strong historical identity and a number of preserved buildings. Housing in the area includes older brick homes and affordable wood-frame properties, often set on large lots. The town’s growth in the last five years is tied to both returning residents and out-of-towners seeking lower costs. While the price drop in 2024 and 2025 may raise eyebrows, it likely reflects market correction rather than economic decline. Overall, Scotland Neck offers livable prices, a walkable main street, and essential services. Buyers here can find value without isolation. The town’s performance proves that even smaller North Carolina towns can hold strong through housing cycles.
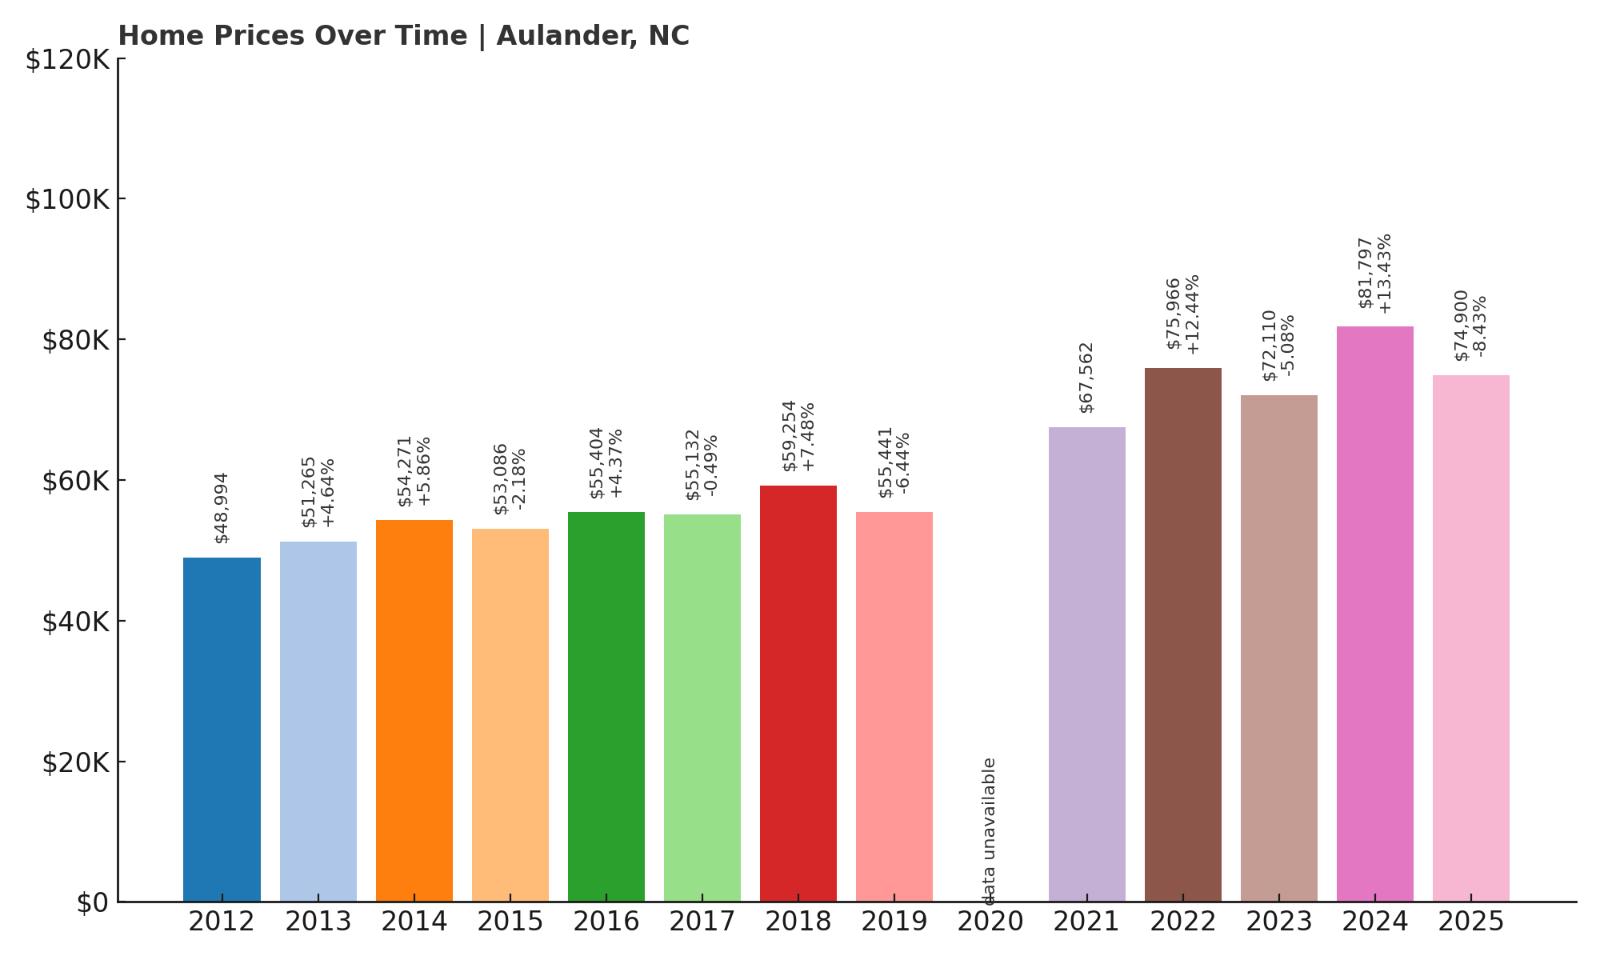
10. Aulander – 53% Home Price Increase Since 2012
- 2010: N/A
- 2011: N/A
- 2012: $48,994
- 2013: $51,265 (+$2,271, +4.64% from previous year)
- 2014: $54,271 (+$3,005, +5.86% from previous year)
- 2015: $53,086 ($-1,185, -2.18% from previous year)
- 2016: $55,404 (+$2,318, +4.37% from previous year)
- 2017: $55,132 ($-272, -0.49% from previous year)
- 2018: $59,254 (+$4,121, +7.48% from previous year)
- 2019: $55,441 ($-3,812, -6.43% from previous year)
- 2020: N/A
- 2021: $67,562
- 2022: $75,966 (+$8,404, +12.44% from previous year)
- 2023: $72,110 ($-3,855, -5.08% from previous year)
- 2024: $81,797 (+$9,686, +13.43% from previous year)
- 2025: $74,900 ($-6,897, -8.43% from previous year)
Aulander has seen a home price increase of about 53% since 2012, despite several price dips along the way. The town experienced steady growth between 2012 and 2018, then a decline in 2019. Prices rose sharply again in 2021 and 2022, followed by a slight stumble in 2023. The jump in 2024 pushed values past $81,000 before dropping again in 2025. The price volatility points to an active market where small changes in demand have a noticeable impact. Even with fluctuations, the long-term price trajectory is clearly upward. Aulander remains one of the cheapest towns in the state, offering good value for buyers comfortable with a bit of market movement. As of 2025, the town still sits well below the six-figure mark, making it accessible for many first-time buyers.
Aulander – Price Shifts and Long-Term Opportunity
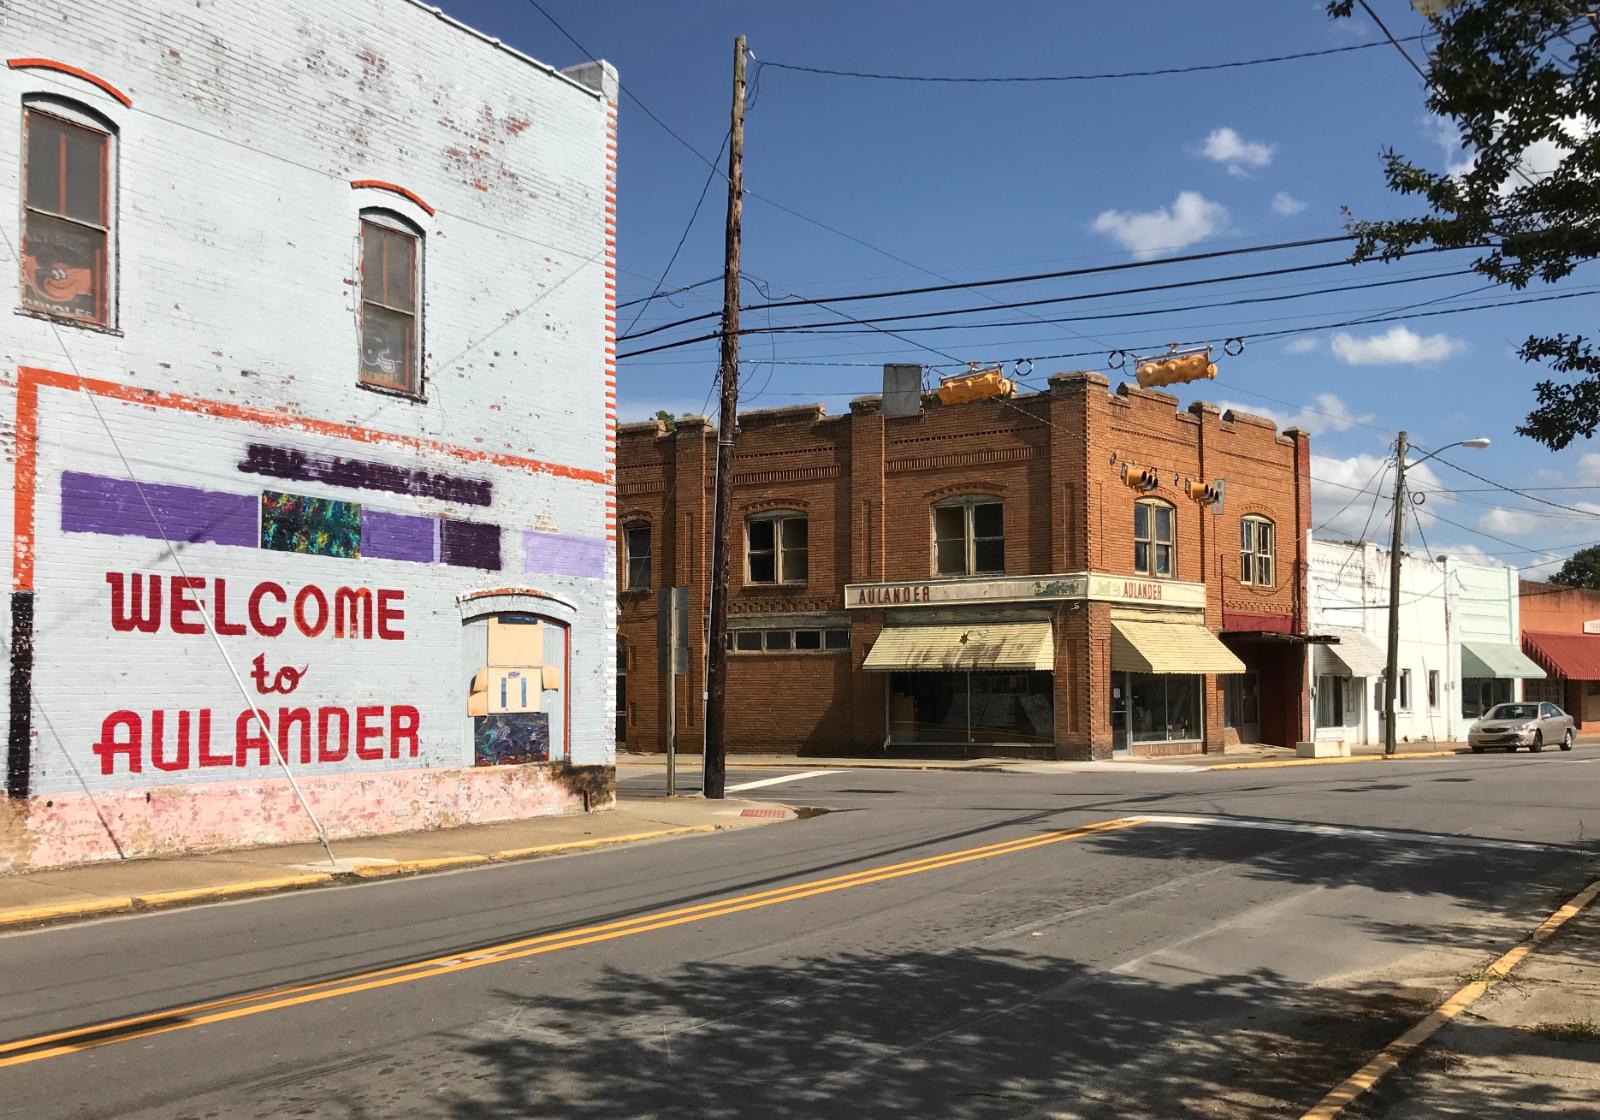
Aulander is located in Bertie County in northeastern North Carolina. It’s a quiet town with a tight-knit community and easy access to nearby employment centers like Ahoskie and Windsor. With its low housing costs and rural setting, Aulander has drawn interest from retirees, young families, and remote workers alike. The homes here are modest and often sit on spacious lots, offering privacy and potential for customization. Like many rural towns, its housing stock is aging, but prices have reflected growing interest in low-cost living. The significant price rise in 2024 may have been driven by renewed migration from larger cities. Aulander is also attractive for those seeking investment properties or affordable second homes. It’s a place where buyers can find value—and space—without overspending.


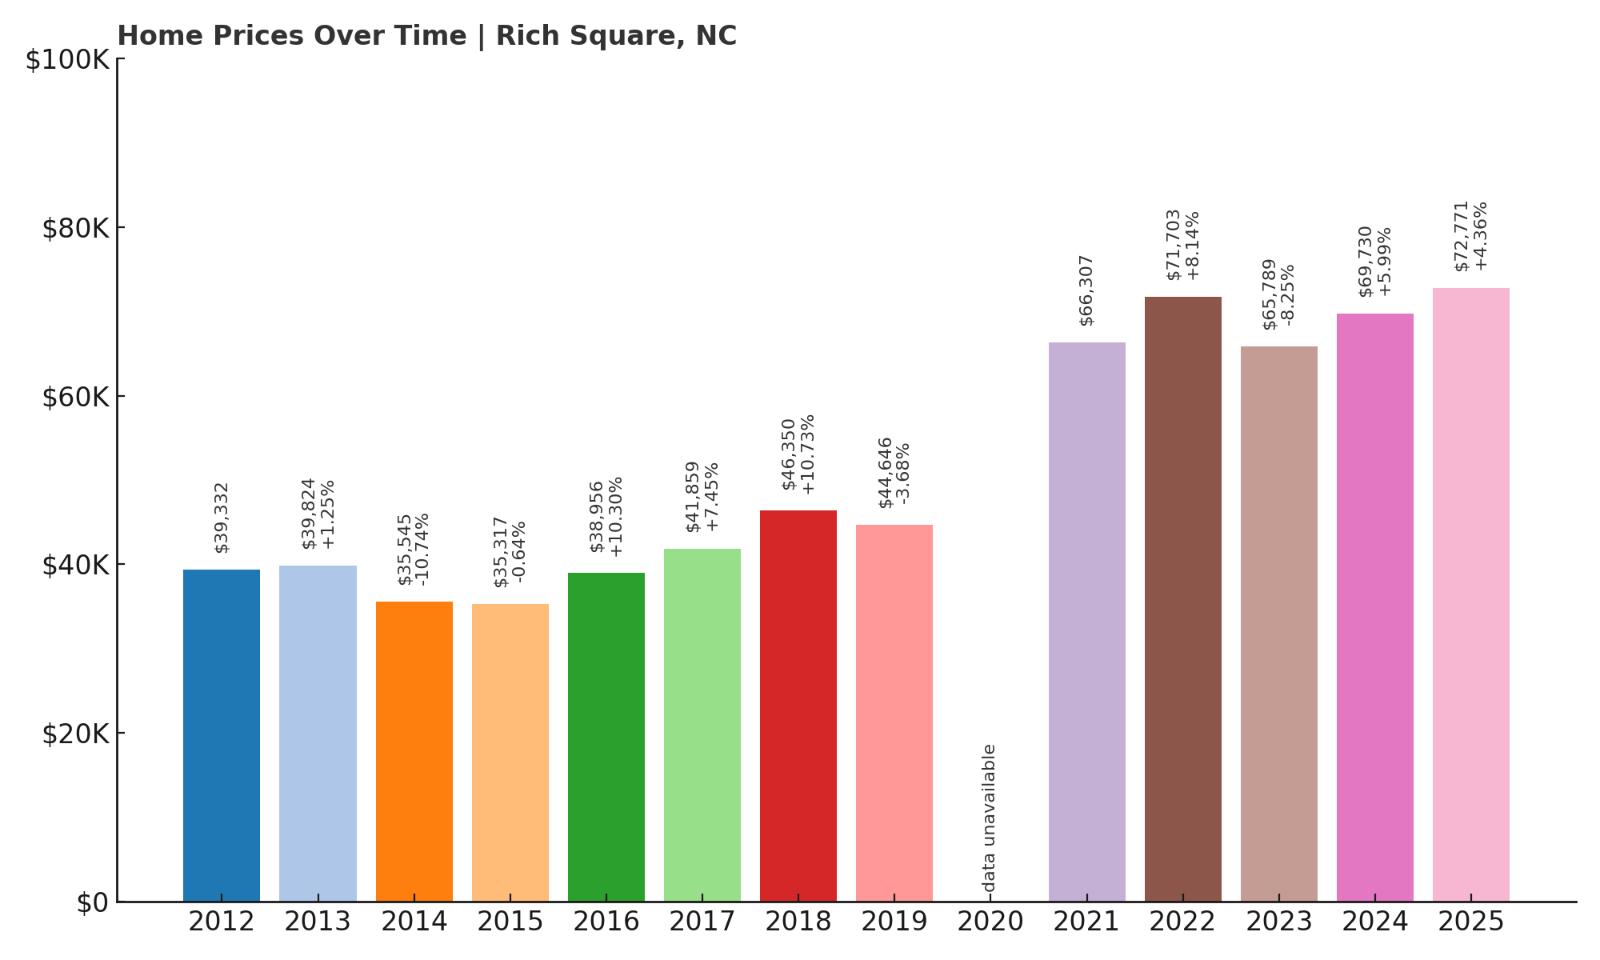
9. Rich Square – 85% Home Price Increase Since 2012
- 2010: N/A
- 2011: N/A
- 2012: $39,332
- 2013: $39,824 (+$492, +1.25% from previous year)
- 2014: $35,545 ($-4,279, -10.74% from previous year)
- 2015: $35,317 ($-228, -0.64% from previous year)
- 2016: $38,956 (+$3,639, +10.30% from previous year)
- 2017: $41,859 (+$2,903, +7.45% from previous year)
- 2018: $46,350 (+$4,490, +10.73% from previous year)
- 2019: $44,646 ($-1,704, -3.68% from previous year)
- 2020: N/A
- 2021: $66,307
- 2022: $71,703 (+$5,396, +8.14% from previous year)
- 2023: $65,789 ($-5,915, -8.25% from previous year)
- 2024: $69,730 (+$3,941, +5.99% from previous year)
- 2025: $72,771 (+$3,041, +4.36% from previous year)
Home values in Rich Square have grown 85% since 2012, a notable jump for a small town in rural North Carolina. The price climb wasn’t smooth, with dips in 2014, 2015, and again in 2023, but the overall trend is positive. From 2016 to 2018, prices rose steadily and significantly, topping $46,000. The largest leap came in 2021 when prices surged over $20,000 in a single year. Even after a soft correction, prices ended 2025 at $72,771—nearly doubling in just over a decade. This kind of growth suggests long-term buyer interest in the area, likely fueled by broader affordability concerns. Rich Square offers below-average home prices while maintaining solid potential for appreciation. It remains one of the most accessible towns for entry-level homebuyers or investors in eastern North Carolina.
Rich Square – Affordable Homes and Market Momentum
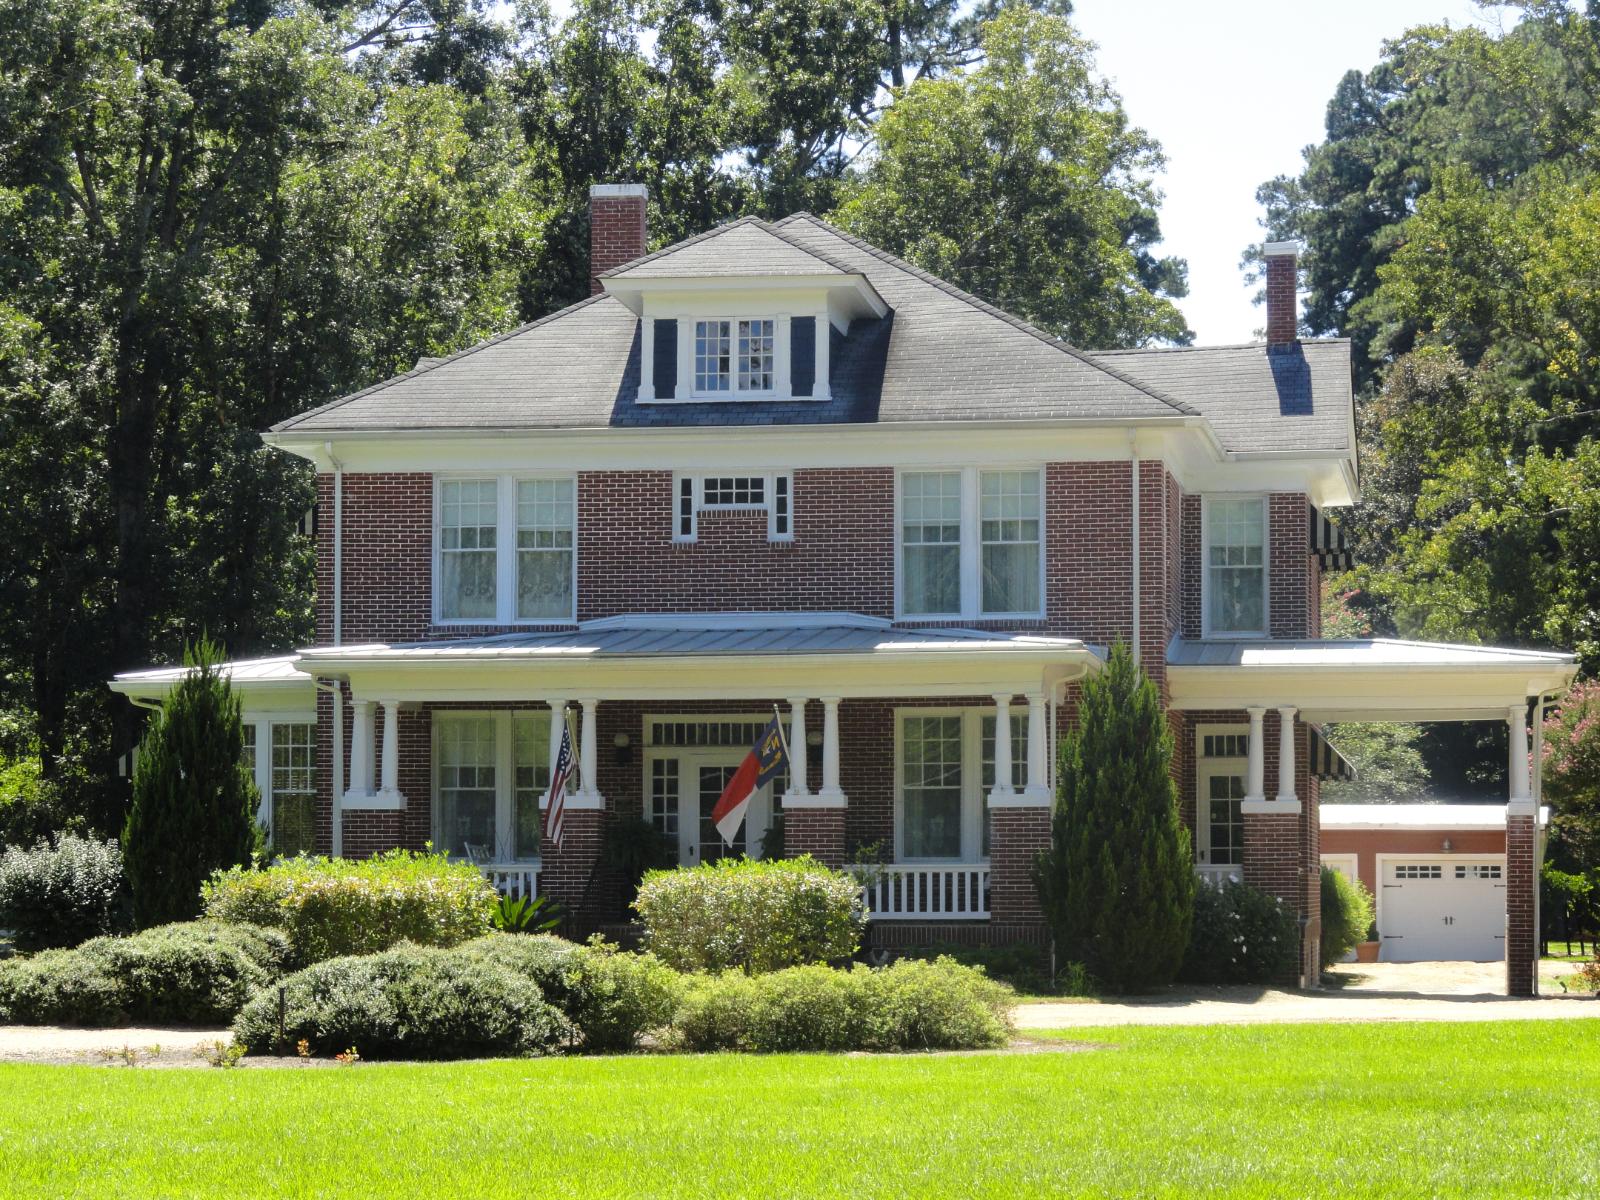
Rich Square, located in Northampton County, is a small town with agricultural roots and historic character. The community is close to Murfreesboro and Woodland, making it part of a lightly populated but well-connected rural region. The housing stock here includes older single-story homes and small family dwellings, many of which are under $80,000 even after recent gains. Rich Square has experienced waves of renewed interest, likely driven by regional buyers looking for value and space. Its recent price rebound suggests increasing buyer confidence, even if the town lacks major development. Local services are basic but sufficient for daily needs, and the area is known for its quiet atmosphere. Rich Square appeals to those who want affordability without isolation. For long-term value at a reasonable price, it’s one of the better bets in this part of the state.
8. Windsor – 15% Home Price Increase Since 2010
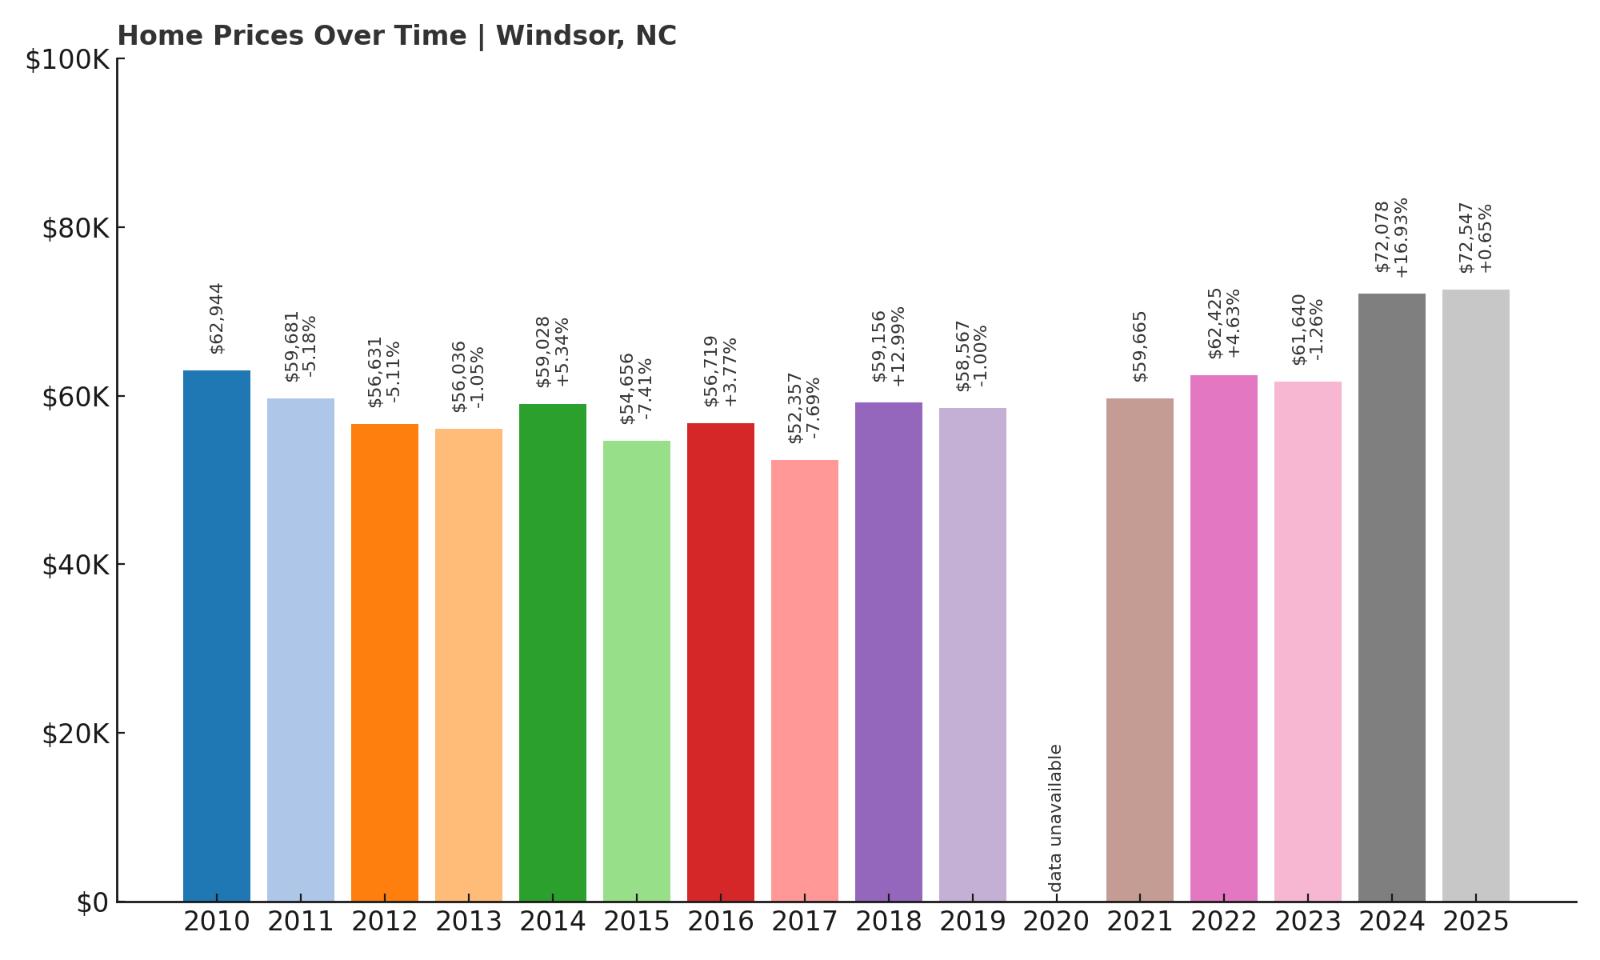
- 2010: $62,944
- 2011: $59,681 ($-3,262, -5.18% from previous year)
- 2012: $56,631 ($-3,051, -5.11% from previous year)
- 2013: $56,036 ($-595, -1.05% from previous year)
- 2014: $59,028 (+$2,993, +5.34% from previous year)
- 2015: $54,656 ($-4,372, -7.41% from previous year)
- 2016: $56,719 (+$2,063, +3.77% from previous year)
- 2017: $52,357 ($-4,362, -7.69% from previous year)
- 2018: $59,156 (+$6,799, +12.99% from previous year)
- 2019: $58,567 ($-588, -0.99% from previous year)
- 2020: N/A
- 2021: $59,665
- 2022: $62,425 (+$2,760, +4.63% from previous year)
- 2023: $61,640 ($-785, -1.26% from previous year)
- 2024: $72,078 (+$10,438, +16.93% from previous year)
- 2025: $72,547 (+$469, +0.65% from previous year)
Windsor’s home prices have increased just over 15% from 2010 to 2025, though the path has been anything but steady. The town saw early declines, some strong gains around 2014, and another big jump in 2024. From 2018 onward, values moved upward overall, even as some years posted small losses. The town’s peak came in 2025, with prices just topping $72,500. For buyers tracking slow but steady progress, Windsor offers a conservative investment profile. Price volatility was lower here compared to many other towns on this list. Its affordability has remained consistent, which may help attract long-term buyers. Windsor is a good candidate for those who prefer low-risk appreciation over wild price swings.
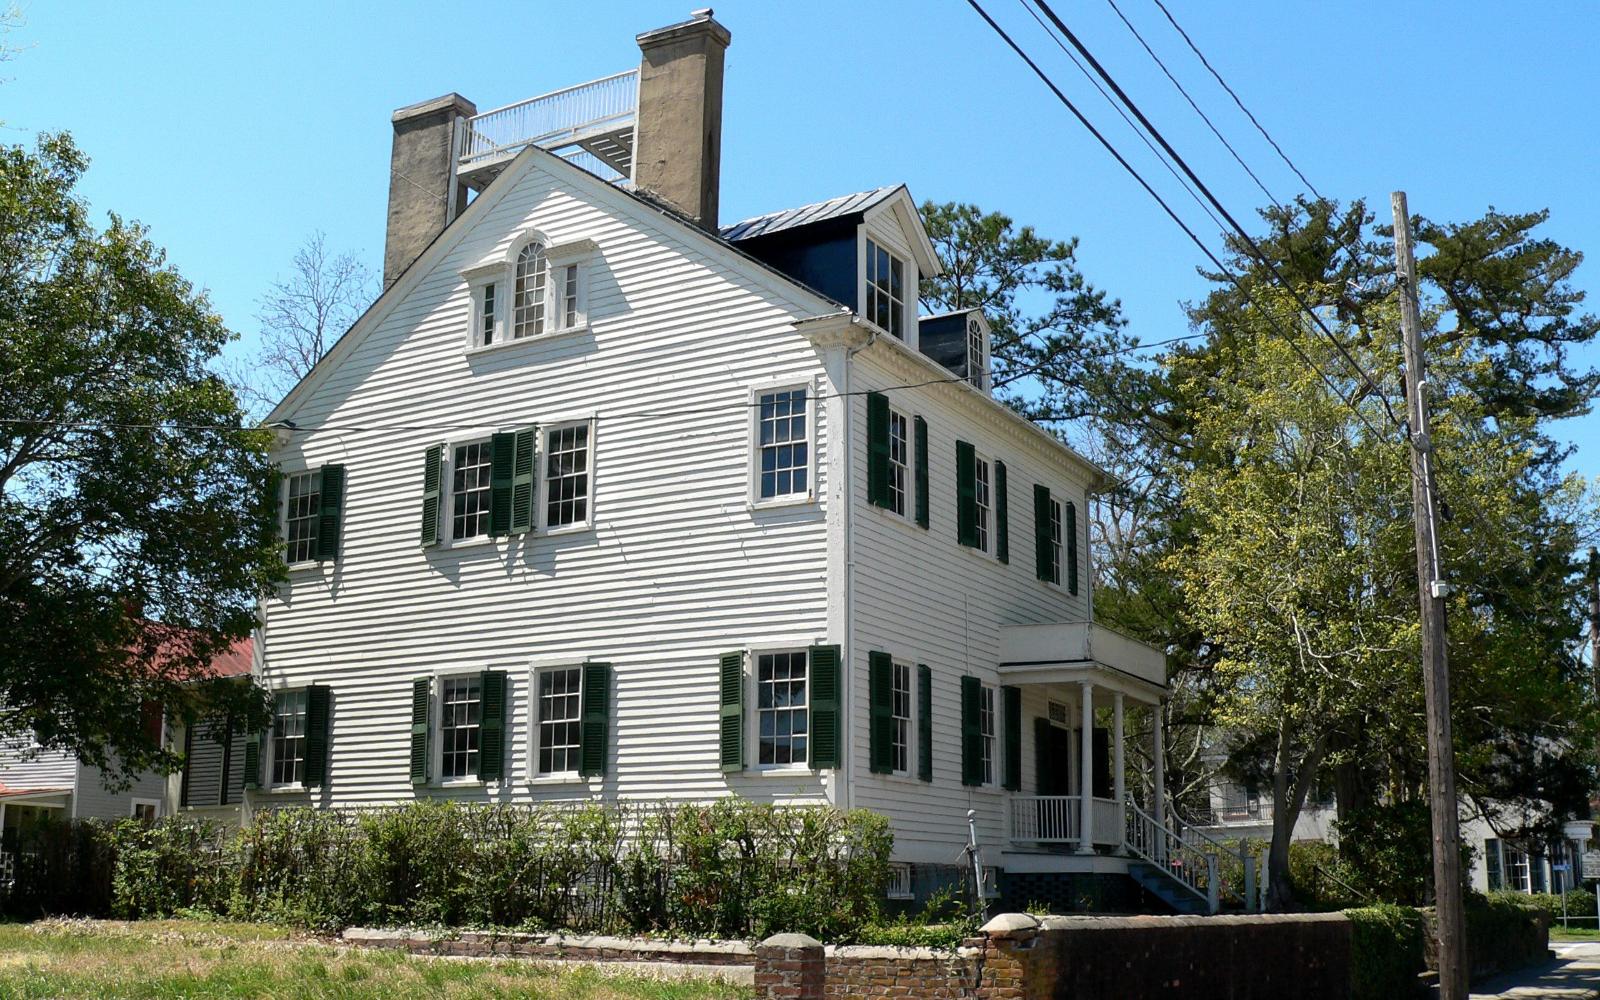
Windsor – Gradual Growth in a Historic River Town

Windsor sits along the Cashie River in Bertie County and boasts a long history dating back to the 1700s. The town is known for its scenic views, walking trails, and outdoor spaces that bring residents closer to nature. Housing here includes a mix of historic homes and newer builds on the outskirts. While prices have risen gradually, the town has avoided the spikes seen elsewhere, likely due to steady demand and a balanced housing supply. Windsor is popular with retirees and nature lovers who appreciate the riverwalk and proximity to Edenton and the Albemarle Sound. Services in town include schools, healthcare, and grocery options, making it self-sufficient for daily living. Though not a growth hotspot, Windsor offers a solid quality of life and remains one of the more livable affordable towns in the region. Its modest pricing, stable trajectory, and riverfront charm make it a hidden value.
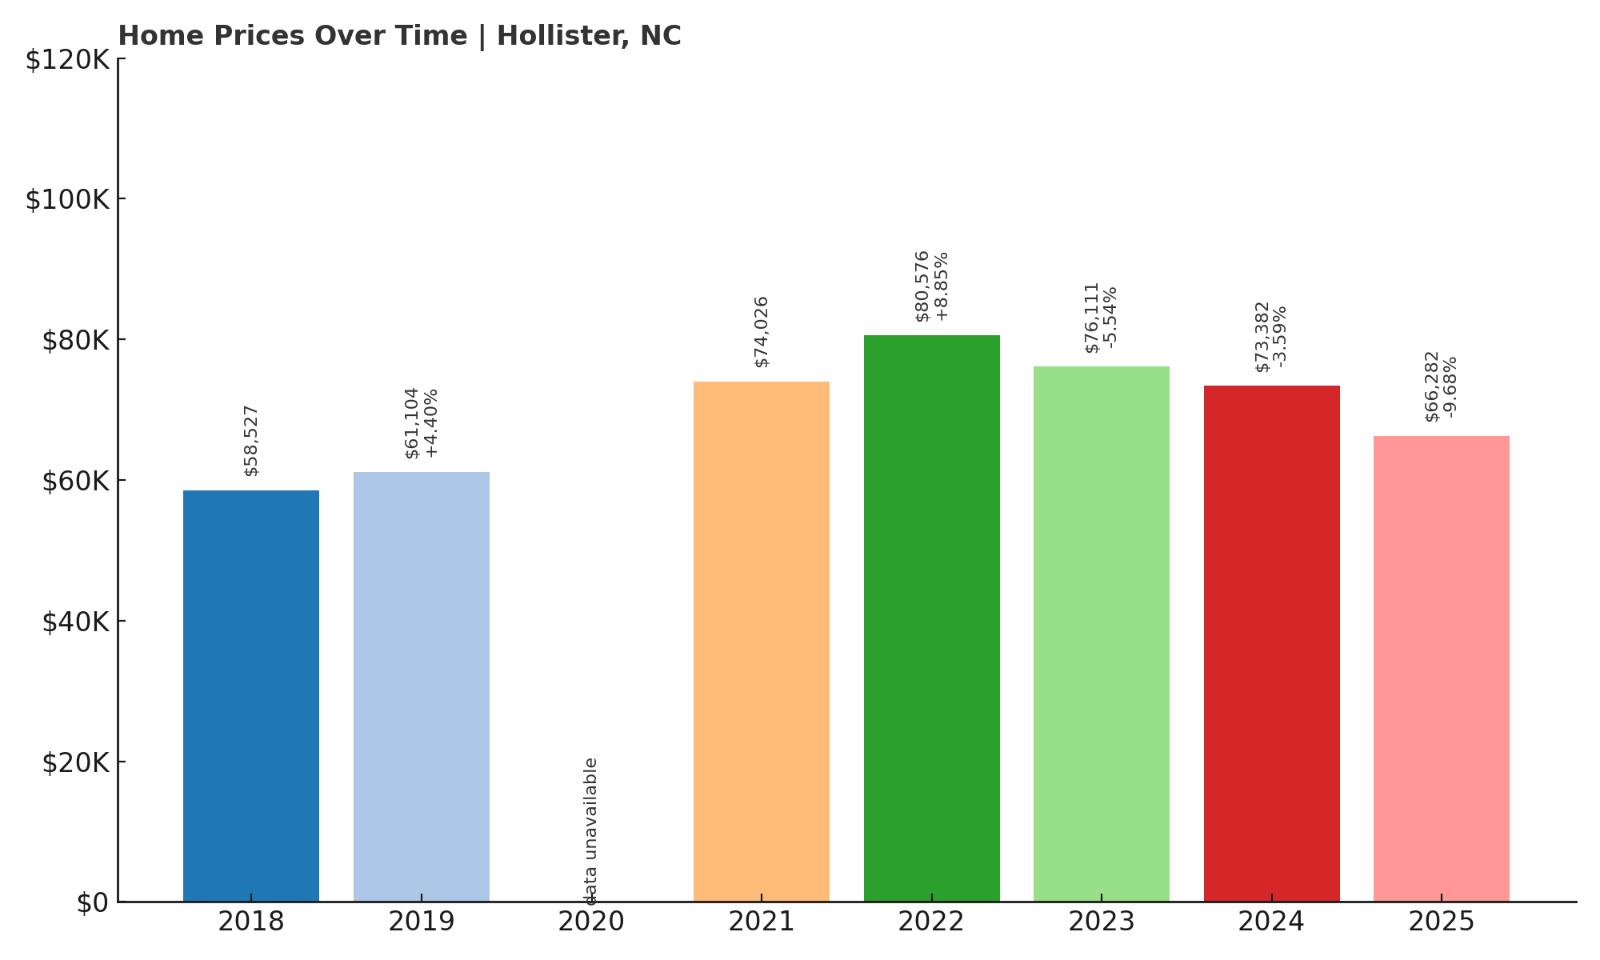
7. Hollister – 13% Home Price Increase Since 2018
Would you like to save this?
- 2010: N/A
- 2011: N/A
- 2012: N/A
- 2013: N/A
- 2014: N/A
- 2015: N/A
- 2016: N/A
- 2017: N/A
- 2018: $58,527
- 2019: $61,104 (+$2,577, +4.40% from previous year)
- 2020: N/A
- 2021: $74,026
- 2022: $80,576 (+$6,550, +8.85% from previous year)
- 2023: $76,111 ($-4,465, -5.54% from previous year)
- 2024: $73,382 ($-2,730, -3.59% from previous year)
- 2025: $66,282 ($-7,100, -9.67% from previous year)
Since 2018, Hollister’s home prices have climbed by about 13%, reaching $66,282 in 2025. The most significant growth happened in 2021 and 2022, with prices jumping to over $80,000 before retreating in later years. Despite that decline, prices are still well above 2018 levels. The trajectory shows a town that benefited from temporary demand spikes, likely pandemic-related, and is now settling back into more sustainable pricing. Hollister’s market may appeal to those looking for value just off the peak. The town saw strong mid-term appreciation before softening, a pattern that may create opportunities for buyers in 2025. For affordability with a recent history of growth, Hollister offers a solid case. The current pricing sits at the low end of rural affordability ranges in the state.
Hollister – Highs and Lows in a Tight Market
Hollister is located in Halifax County and is part of the Haliwa-Saponi tribal community, giving it unique cultural importance in the region. The town is small and surrounded by forested land and farmland, offering a peaceful atmosphere. Its housing market is very limited, which likely contributed to the sharp price increases seen in 2021 and 2022. The subsequent drop was expected as prices cooled across rural areas that had seen fast growth. For buyers, the current values in Hollister may reflect a brief window of opportunity. It’s a town with character, cultural heritage, and a lower-than-average price tag. Local infrastructure is minimal, but basic services are available within driving distance. Hollister’s long-term potential depends on maintaining its identity while staying attractive to those priced out of nearby markets.
6. Enfield – 45% Home Price Increase Since 2010
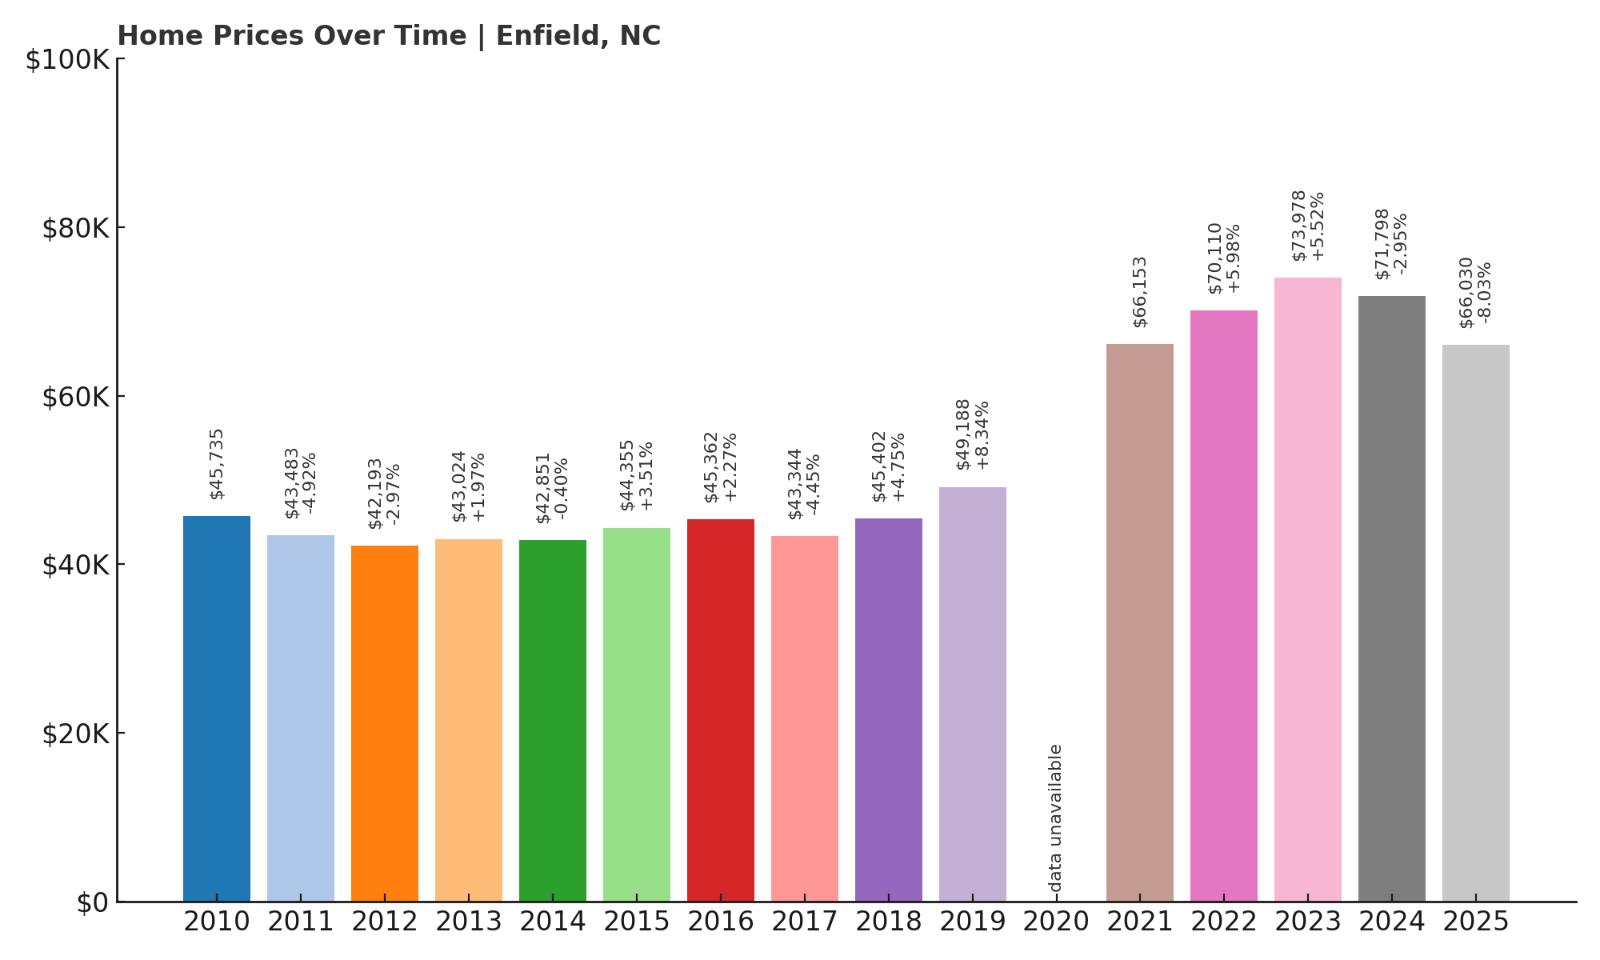
- 2010: $45,735
- 2011: $43,483 ($-2,252, -4.92% from previous year)
- 2012: $42,193 ($-1,290, -2.97% from previous year)
- 2013: $43,024 (+$832, +1.97% from previous year)
- 2014: $42,851 ($-173, -0.40% from previous year)
- 2015: $44,355 (+$1,503, +3.51% from previous year)
- 2016: $45,362 (+$1,007, +2.27% from previous year)
- 2017: $43,344 ($-2,018, -4.45% from previous year)
- 2018: $45,402 (+$2,059, +4.75% from previous year)
- 2019: $49,188 (+$3,786, +8.34% from previous year)
- 2020: N/A
- 2021: $66,153
- 2022: $70,110 (+$3,957, +5.98% from previous year)
- 2023: $73,978 (+$3,868, +5.52% from previous year)
- 2024: $71,798 ($-2,181, -2.95% from previous year)
- 2025: $66,030 ($-5,768, -8.03% from previous year)
Enfield’s home values have risen by 45% since 2010, starting in the mid-$40,000s and reaching just over $66,000 by 2025. Prices showed a consistent upward trend between 2018 and 2023, including a particularly strong leap in 2021. The town did experience modest declines in 2024 and 2025, but those followed five solid years of appreciation. Despite some dips in earlier years, the long-term trend reflects resilience. Enfield’s affordability, along with proximity to I-95, makes it an attractive low-cost housing option. The market here tends to be slow-moving, which makes it less prone to dramatic booms or busts. Buyers who prioritize stability over fast returns may find Enfield to be a good fit. Its under-the-radar status helps keep competition low and prices accessible.
Enfield – Steady Growth in a Historic Location
Located in Halifax County, Enfield is one of the oldest towns in North Carolina. It was once a hub for peanut farming and retains much of its historic charm, with several buildings listed on the National Register of Historic Places. The local economy is modest, but access to Highway 301 and nearby Rocky Mount adds convenience. Enfield appeals to those who want small-town living with a rich heritage and quiet streets. Its housing market features a mix of turn-of-the-century homes and smaller post-war builds. With relatively few new constructions, price growth has been mostly tied to renewed interest in affordable rural communities. The town is also attractive to retirees and longtime residents who value familiarity and affordability. Though growth here isn’t explosive, the long-term trend is encouraging for value-minded buyers.
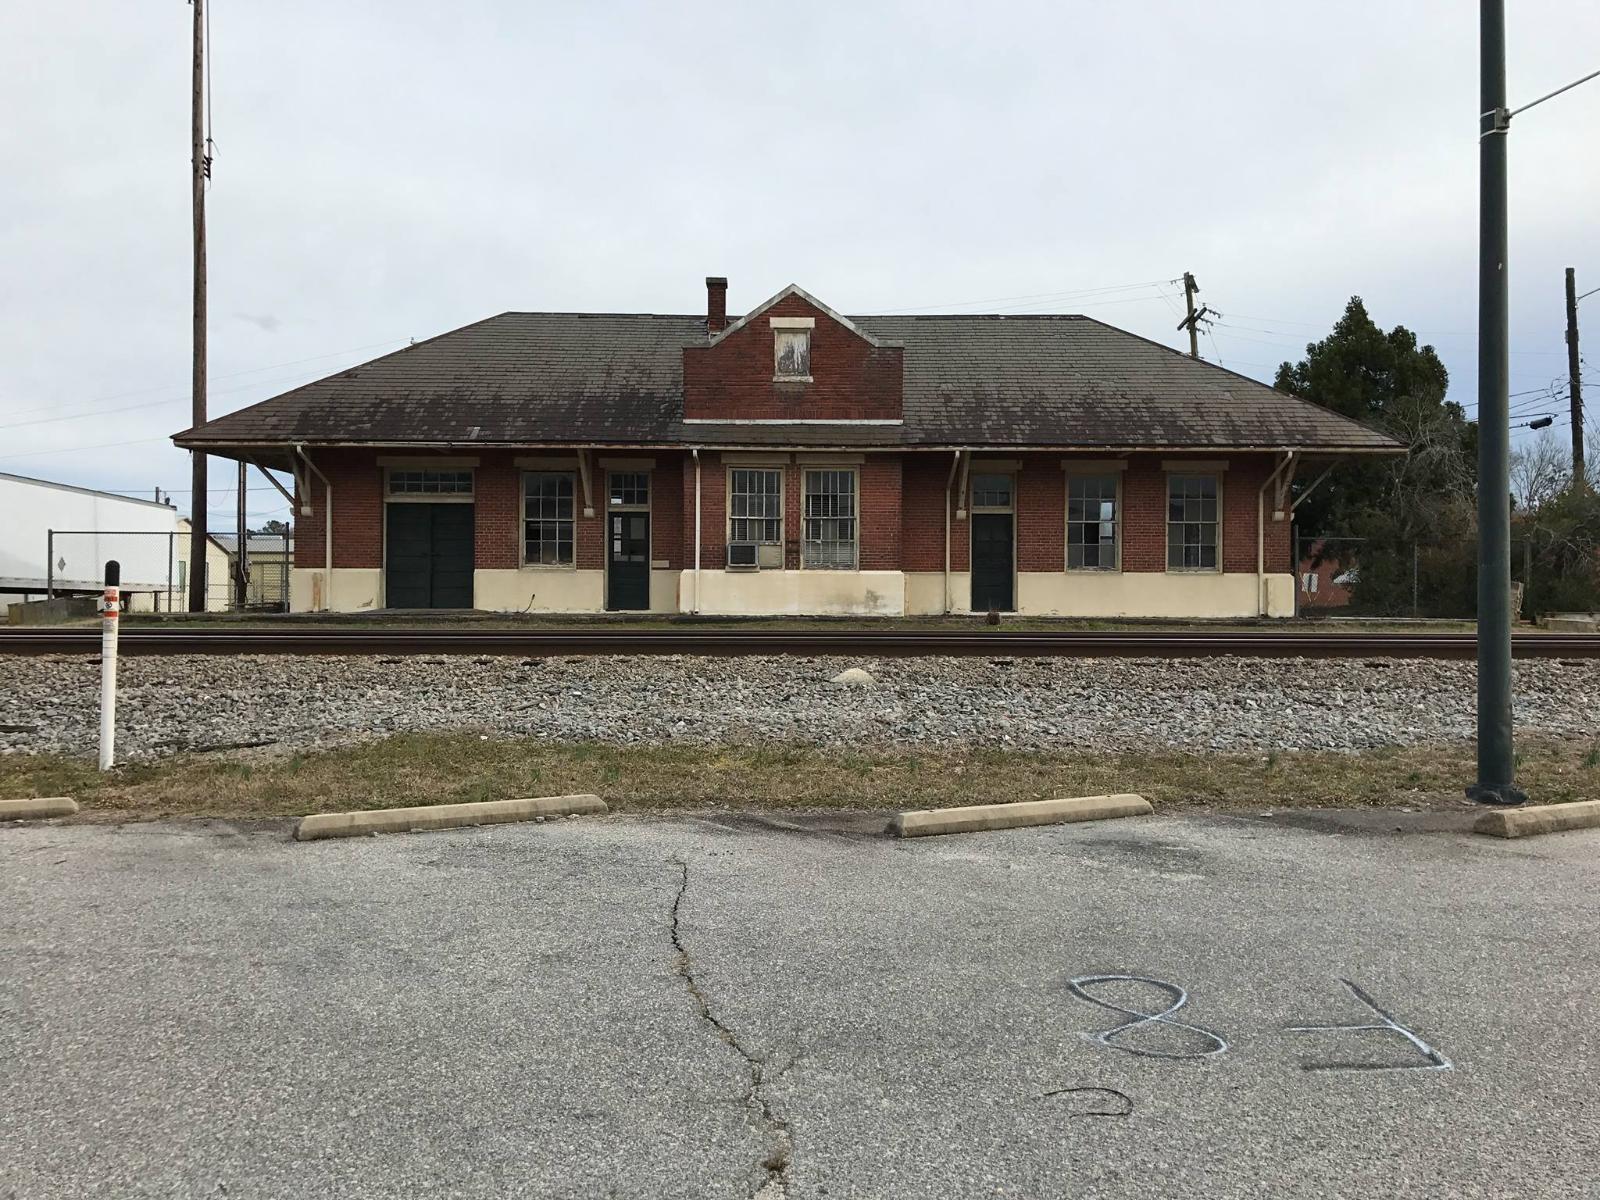
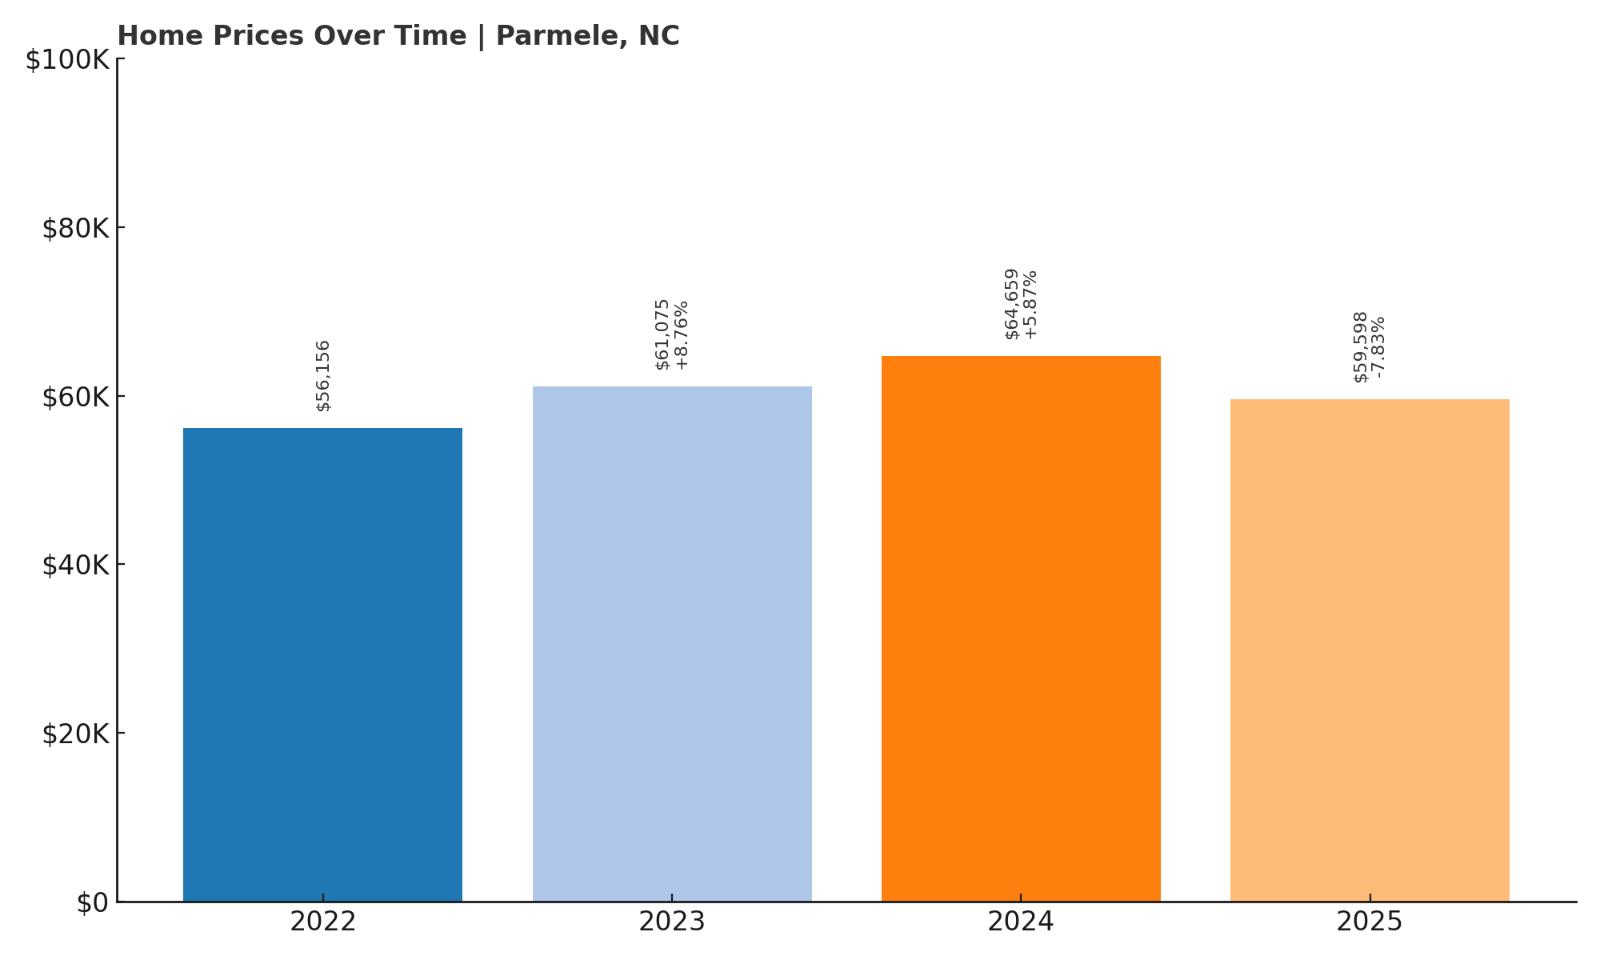
5. Parmele – 6% Home Price Increase Since 2022
- 2010: N/A
- 2011: N/A
- 2012: N/A
- 2013: N/A
- 2014: N/A
- 2015: N/A
- 2016: N/A
- 2017: N/A
- 2018: N/A
- 2019: N/A
- 2020: N/A
- 2021: N/A
- 2022: $56,156
- 2023: $61,075 (+$4,919, +8.76% from previous year)
- 2024: $64,659 (+$3,584, +5.87% from previous year)
- 2025: $59,598 ($-5,061, -7.83% from previous year)
Parmele’s home prices increased just over 6% since 2022, despite a recent drop in 2025. The town posted healthy gains in 2023 and 2024, topping out near $65,000 before giving back some of those gains. Limited data from earlier years makes long-term trends harder to track, but what’s visible is promising. The short growth window indicates a market that responded to rising demand in the early 2020s. Although 2025 saw a pullback, values remain well above the 2022 baseline. For buyers entering the market now, Parmele may offer a good combination of affordability and upside. Its small size likely contributes to sharp year-to-year changes. Even with some volatility, home values remain among the lowest in North Carolina.
Parmele – A Tiny Town With Affordable Homes
Parmele is a small community in Martin County with a population under 300. It’s one of the smallest towns on this list, and that’s reflected in both its housing stock and pricing behavior. The local economy is quiet, with few commercial or public facilities, making this town ideal for those seeking total rural seclusion. Most homes here are older and modest, situated on large lots or near agricultural land. The affordability is a major draw for buyers priced out of more active markets. Parmele’s rise in home prices in 2023 and 2024 may have been due to isolated sales rather than a wave of demand, which is typical for a town this small. That said, the low cost of entry remains a key advantage. For buyers who prioritize peace and savings over amenities, Parmele delivers unmatched value.
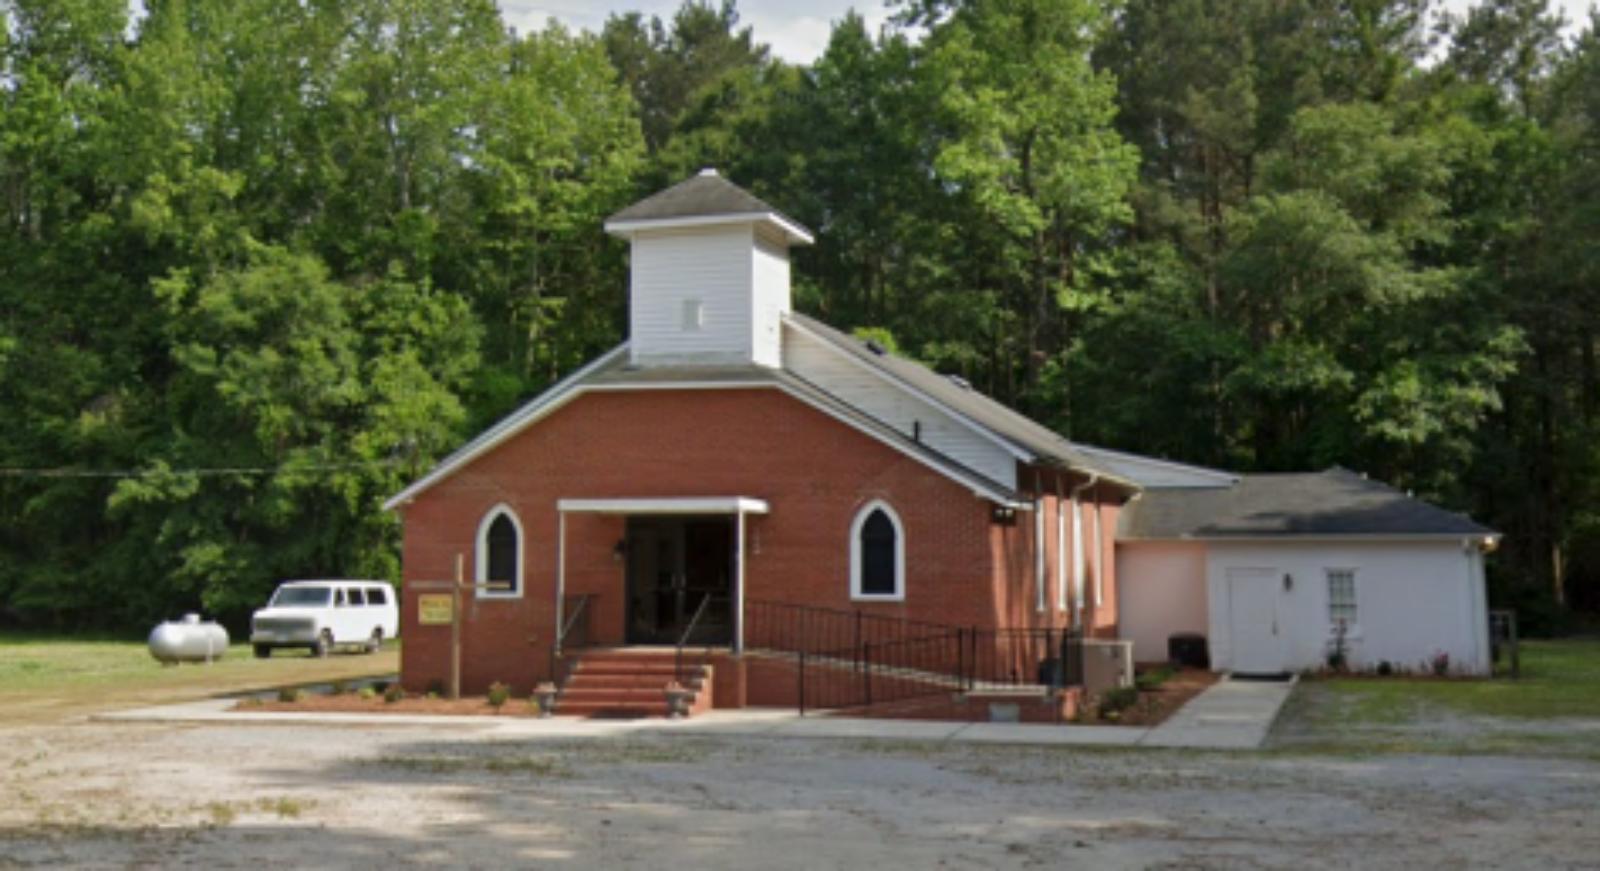
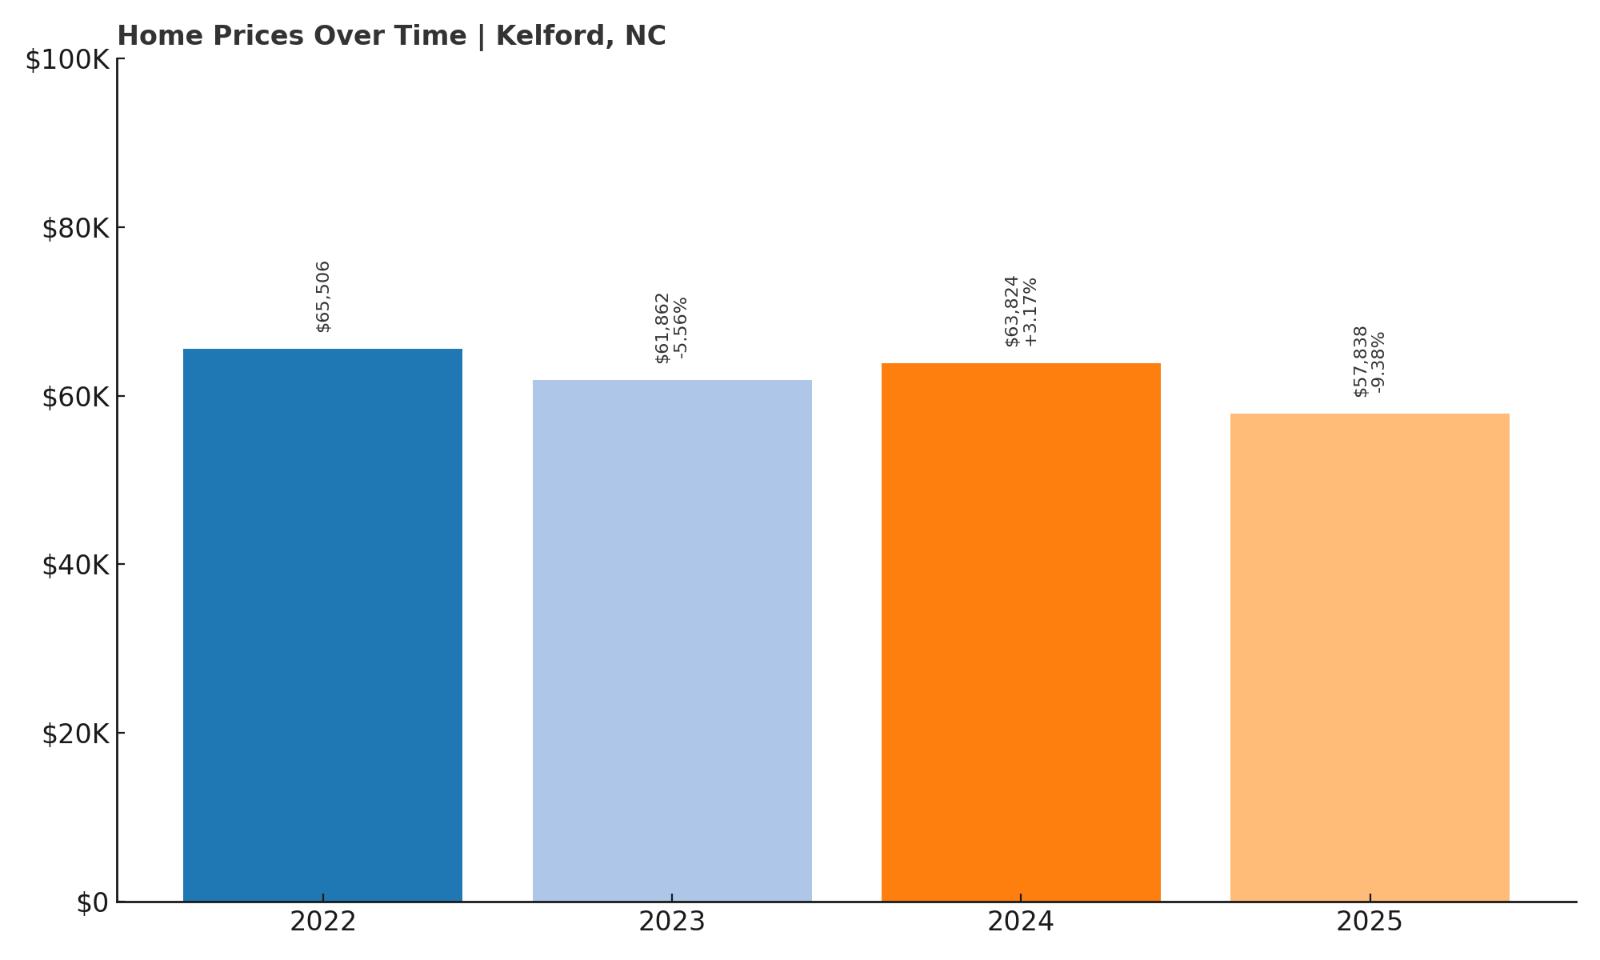
4. Kelford – 12% Home Price Decrease Since 2022
- 2010: N/A
- 2011: N/A
- 2012: N/A
- 2013: N/A
- 2014: N/A
- 2015: N/A
- 2016: N/A
- 2017: N/A
- 2018: N/A
- 2019: N/A
- 2020: N/A
- 2021: N/A
- 2022: $65,506
- 2023: $61,862 ($-3,644, -5.56% from previous year)
- 2024: $63,824 (+$1,962, +3.17% from previous year)
- 2025: $57,838 ($-5,986, -9.38% from previous year)
Kelford’s prices have dropped 12% since 2022, moving from $65,506 down to $57,838 by 2025. The town saw a partial recovery in 2024, but 2025 brought another decline. This kind of movement is typical in very small towns where a handful of transactions can sway market averages. While this decrease might concern short-term investors, buyers focused on affordability will find value here. Kelford remains one of the least expensive towns in the state. It offers housing well below statewide averages, making it appealing to those looking to own without a large mortgage. For long-term buyers, the current price point may be an entry opportunity. Kelford is not a fast-growth market, but its extremely low barrier to entry makes it attractive for very low-budget housing needs.
Kelford – Rural Real Estate at Rock-Bottom Prices
Kelford is a quiet agricultural town in Bertie County. With a population under 300, it has very few amenities, but what it lacks in size it makes up for in cost savings. The town’s remote setting and limited housing stock help keep prices low, even as other parts of the state appreciate. Most homes in Kelford are older, single-family units with basic construction and simple layouts. For cash buyers or those interested in homesteading or renovation projects, the pricing here is highly attractive. Public services are limited, but surrounding towns offer access to shopping, healthcare, and schools. Kelford is ideal for buyers looking to escape rising housing costs and willing to trade convenience for price. While short-term volatility is possible, its affordability remains hard to beat.
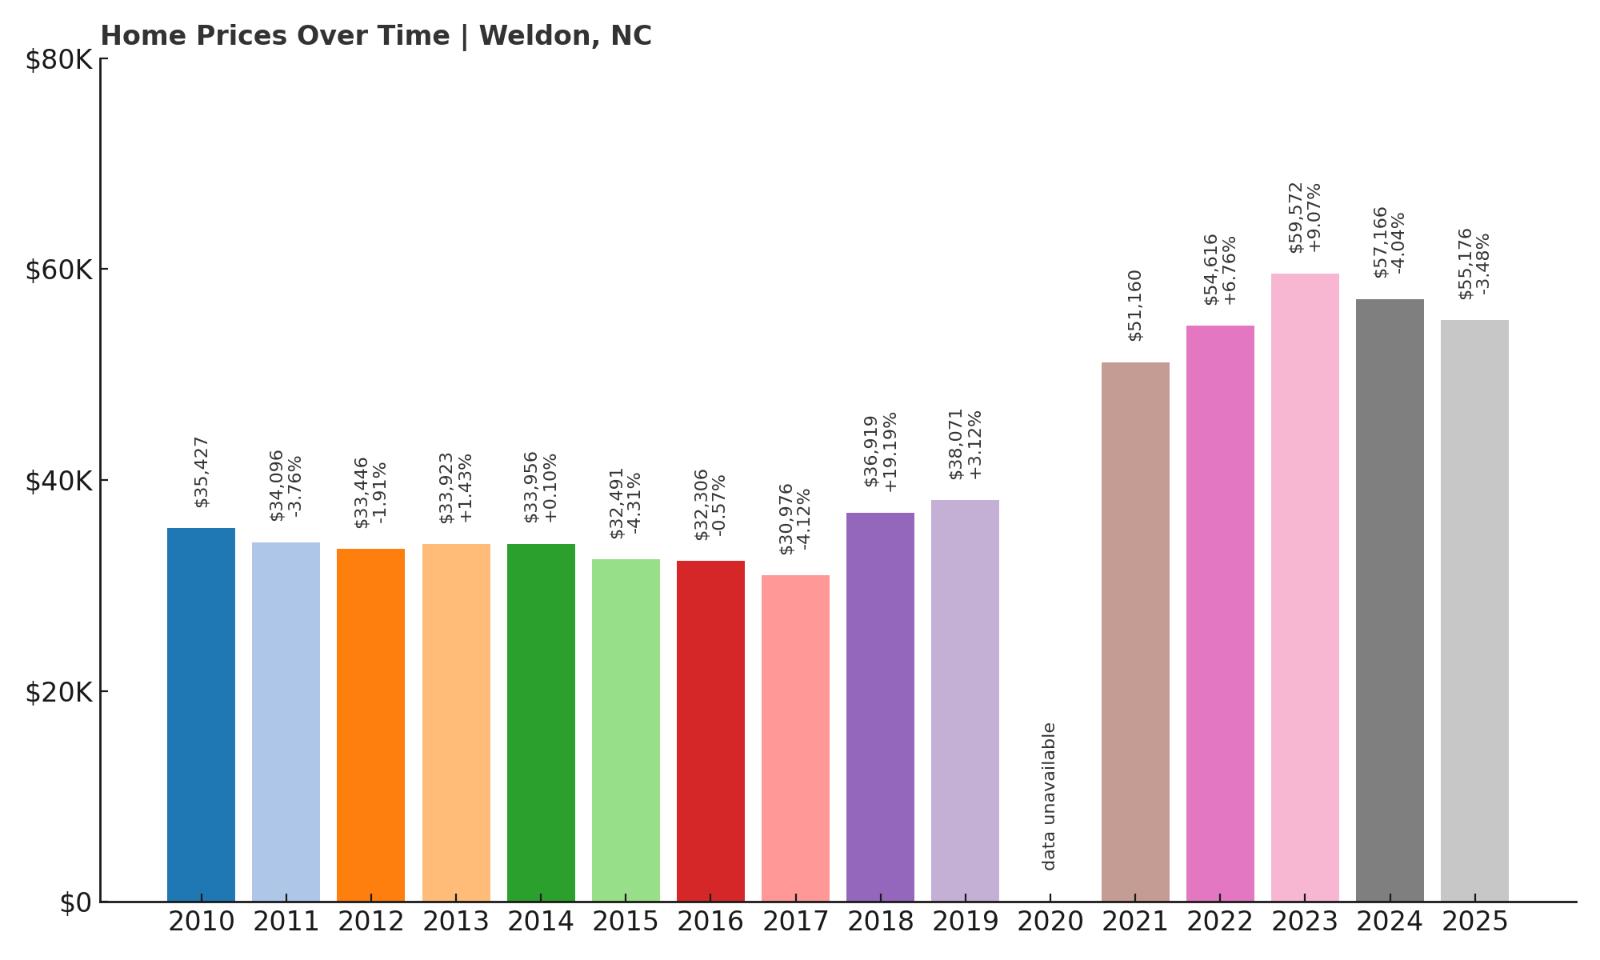
3. Weldon – 55% Home Price Increase Since 2010
- 2010: $35,427
- 2011: $34,096 ($-1,331, -3.76% from previous year)
- 2012: $33,446 ($-649, -1.90% from previous year)
- 2013: $33,923 (+$476, +1.42% from previous year)
- 2014: $33,956 (+$33, +0.10% from previous year)
- 2015: $32,491 ($-1,465, -4.31% from previous year)
- 2016: $32,306 ($-185, -0.57% from previous year)
- 2017: $30,976 ($-1,330, -4.12% from previous year)
- 2018: $36,919 (+$5,943, +19.19% from previous year)
- 2019: $38,071 (+$1,151, +3.12% from previous year)
- 2020: N/A
- 2021: $51,160
- 2022: $54,616 (+$3,456, +6.75% from previous year)
- 2023: $59,572 (+$4,956, +9.07% from previous year)
- 2024: $57,166 ($-2,406, -4.04% from previous year)
- 2025: $55,176 ($-1,990, -3.48% from previous year)
Weldon’s housing market has seen a 55% increase in home prices since 2010, with notable jumps in 2018 and 2021. Early in the decade, the town experienced a decline, but that changed in 2018 when prices rose nearly 20%. From there, Weldon continued to see upward momentum, peaking in 2023 before softening slightly. While values dipped in 2024 and 2025, they remain far above their 2010 levels. This kind of growth shows that even small, overlooked towns can offer long-term gains. Weldon remains deeply affordable despite these increases, with prices still in the mid-$50,000 range. For those seeking a balance between low cost and upward trend, this town is a compelling option. Buyers focused on steady appreciation without paying a premium should consider Weldon.
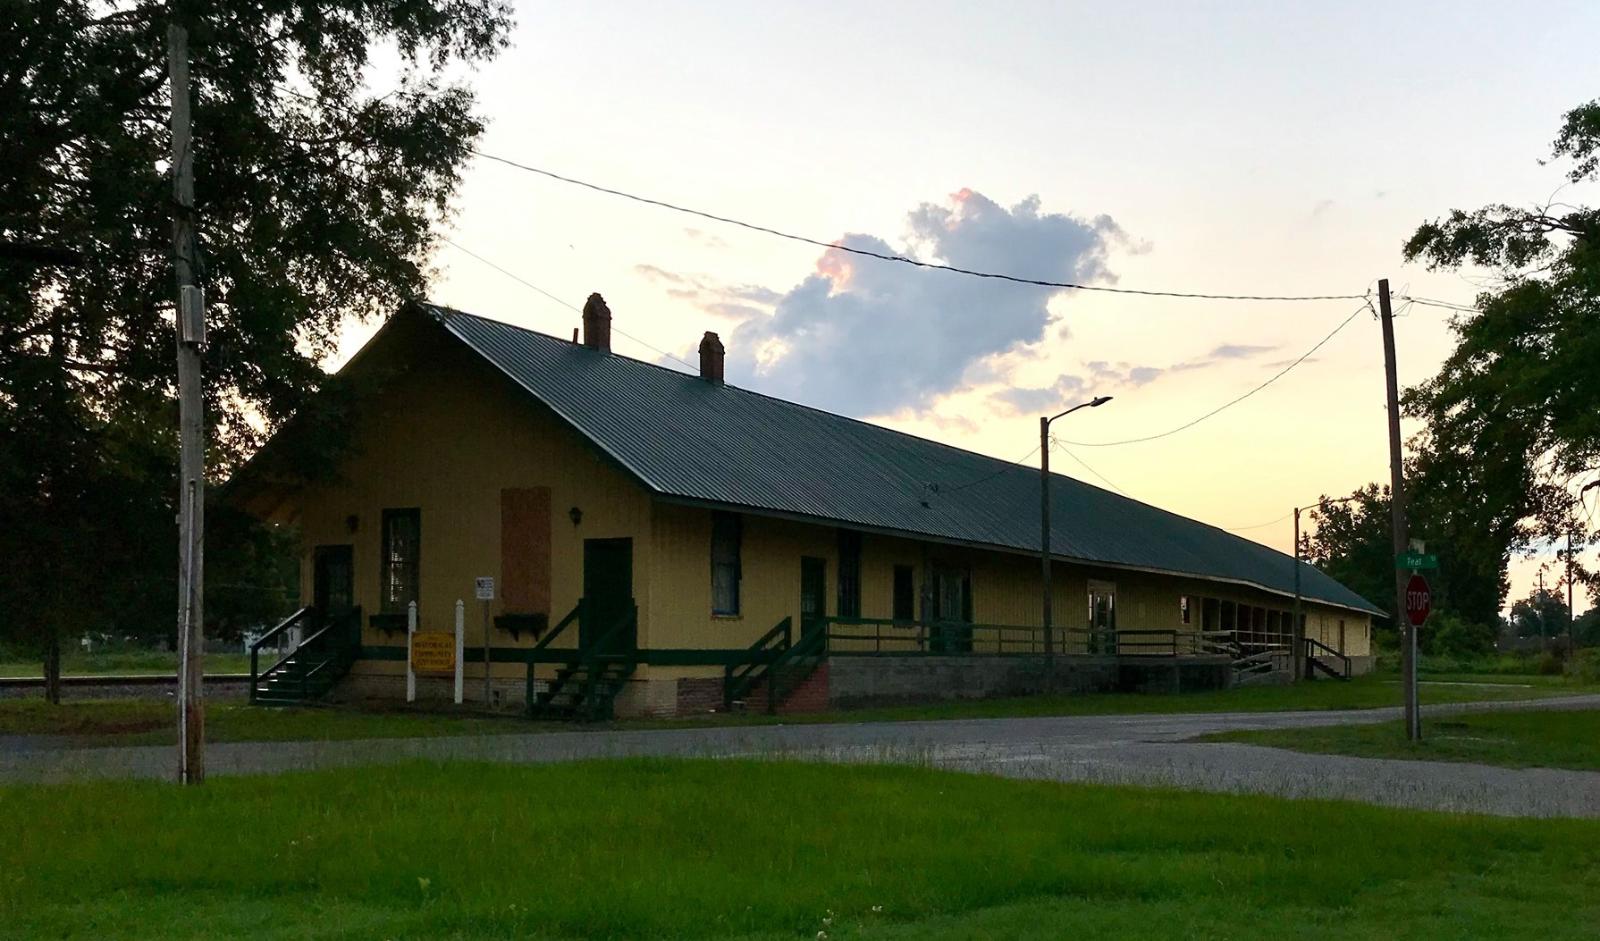
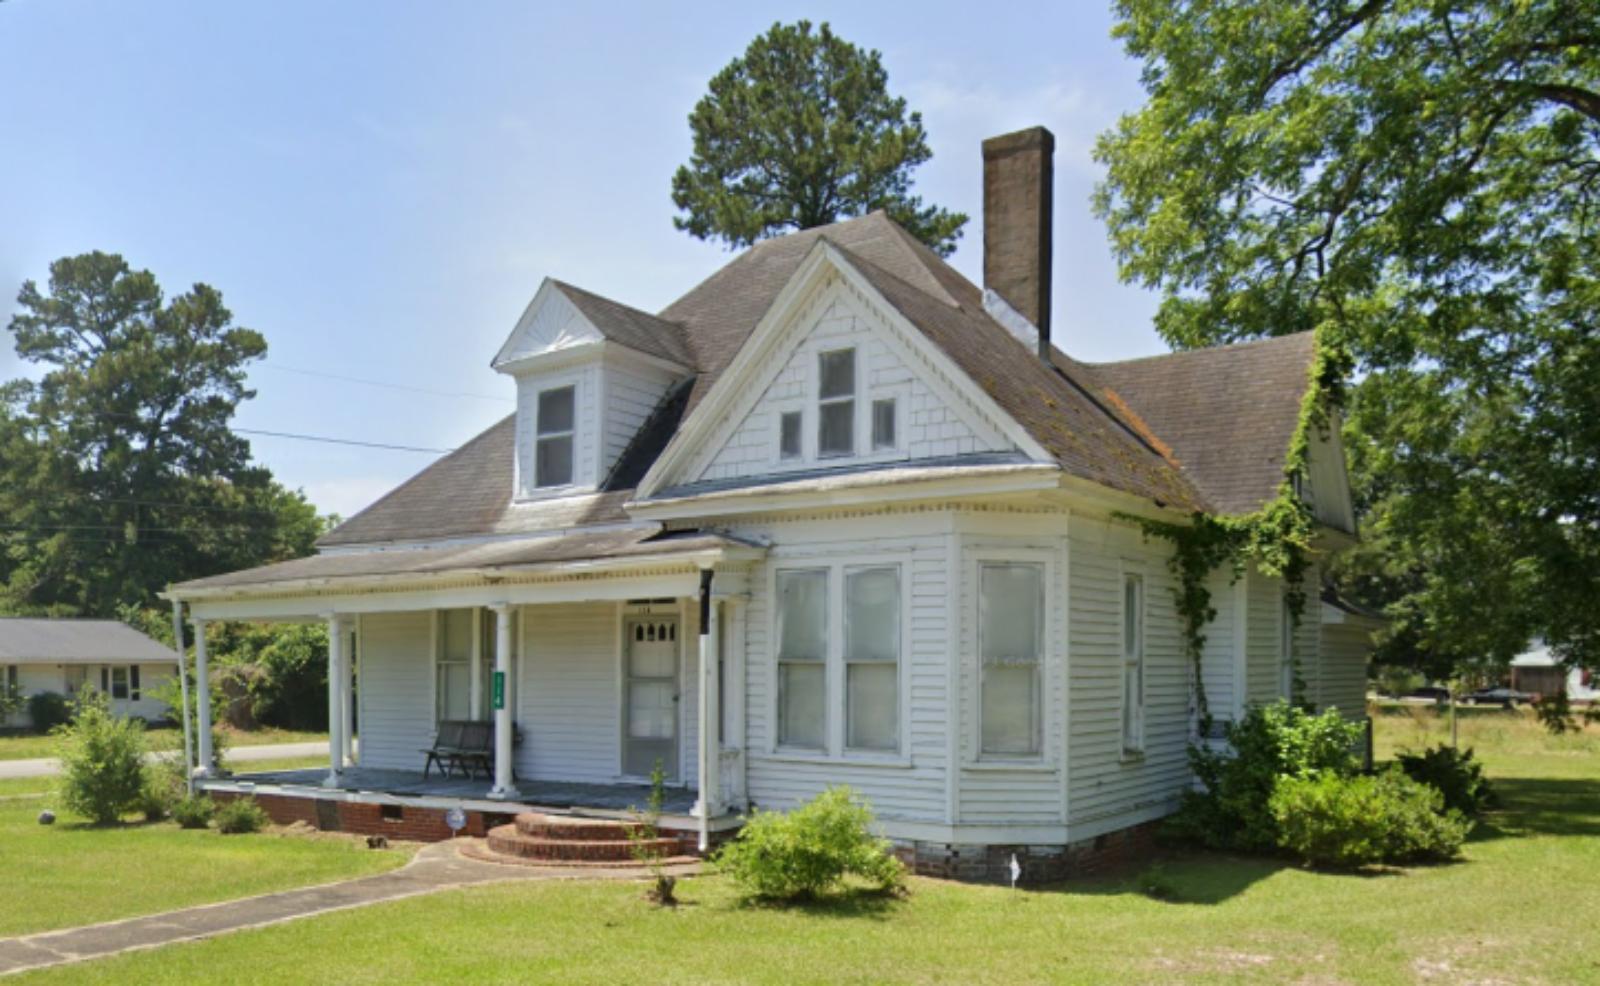
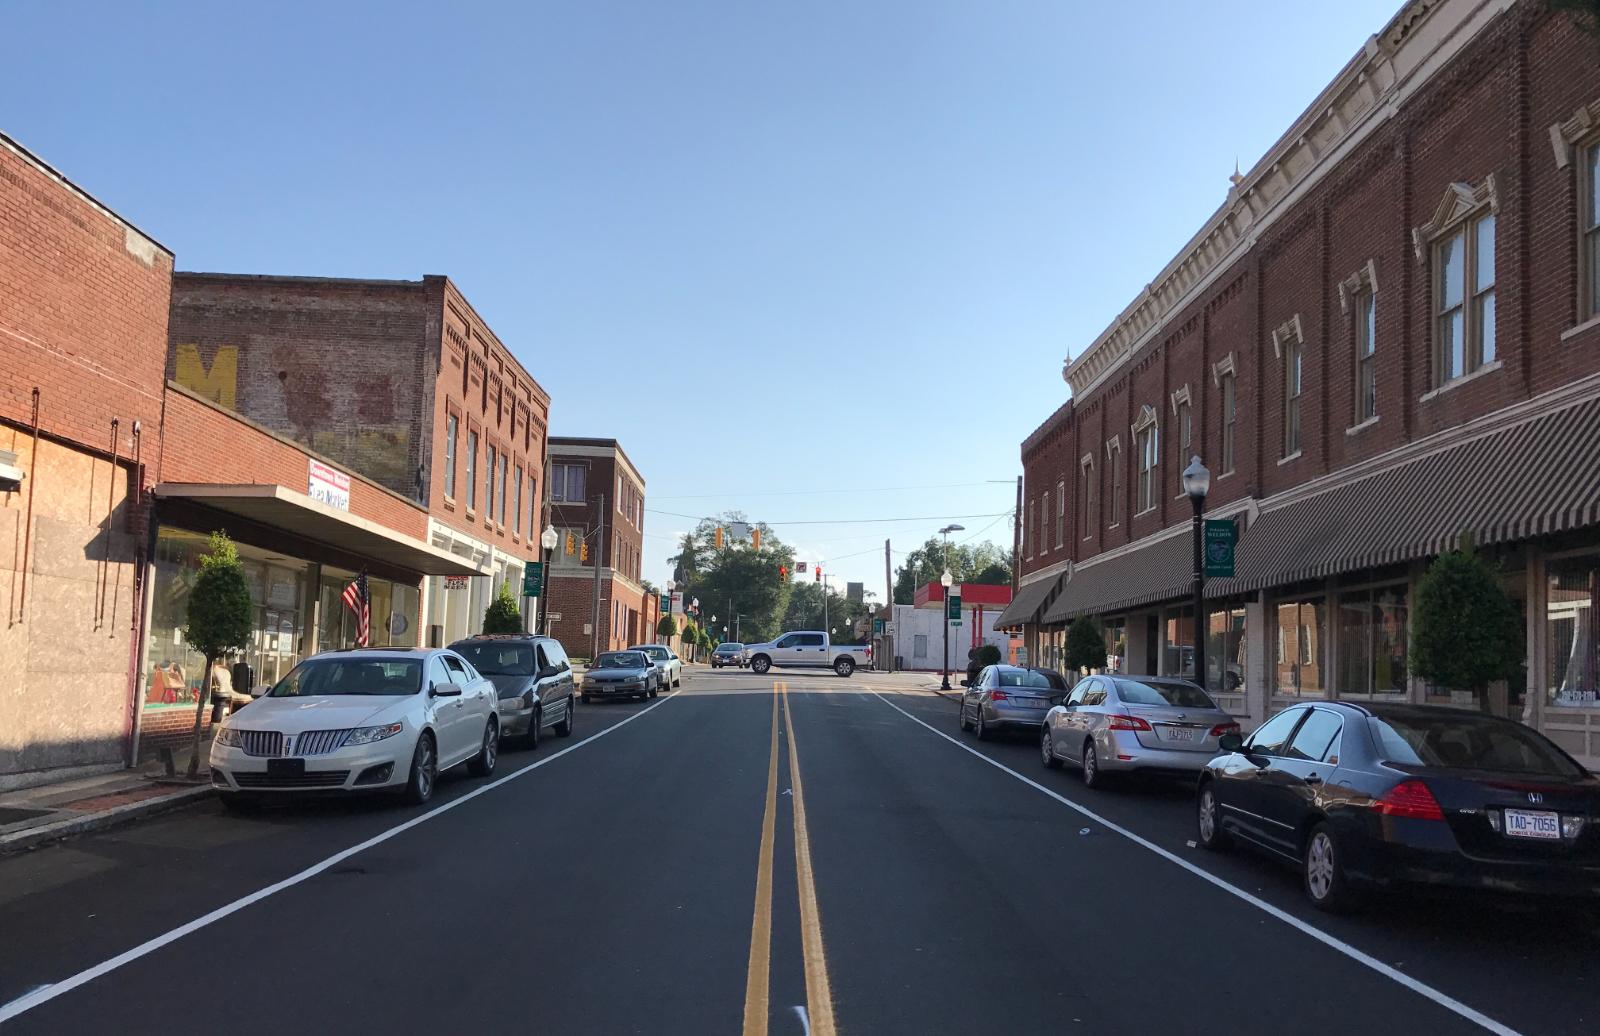
Weldon – Historic Infrastructure Meets Rural Value
Would you like to save this?
Located along the Roanoke River in Halifax County, Weldon has a rich history as a transportation hub. Once a key link in the state’s rail network, it retains some of that infrastructure today. Weldon offers walkable streets, local dining, and riverfront scenery, which sets it apart from more isolated rural communities. The town’s housing stock includes early 20th-century homes and newer builds, offering a wide range of options for budget-conscious buyers. Its connection to I-95 makes it more accessible than many other small towns in the region. Weldon’s modest but real growth over the past decade reflects increasing interest from buyers looking beyond traditional markets. It’s a place with character, community, and solid fundamentals. For those looking to invest in a place with history and heart, Weldon is worth a closer look.
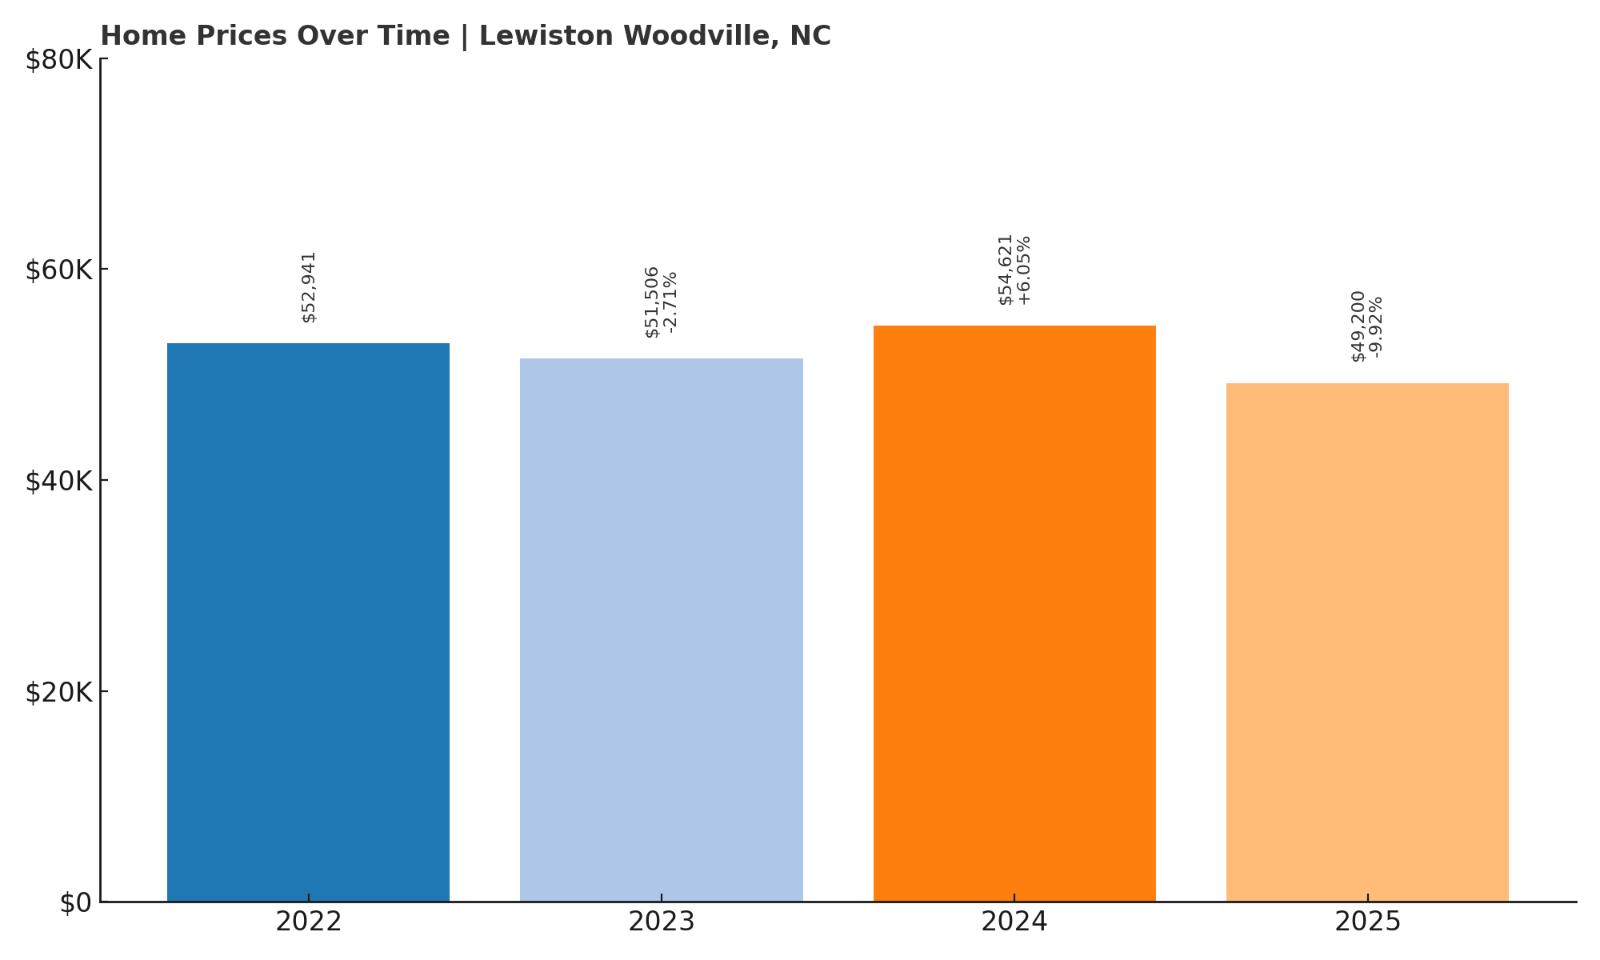
2. Lewiston Woodville – 7% Home Price Decrease Since 2022
- 2010: N/A
- 2011: N/A
- 2012: N/A
- 2013: N/A
- 2014: N/A
- 2015: N/A
- 2016: N/A
- 2017: N/A
- 2018: N/A
- 2019: N/A
- 2020: N/A
- 2021: N/A
- 2022: $52,941
- 2023: $51,506 ($-1,435, -2.71% from previous year)
- 2024: $54,621 (+$3,114, +6.05% from previous year)
- 2025: $49,200 ($-5,421, -9.92% from previous year)
Lewiston Woodville has experienced a 7% decrease in home values since 2022, making it one of the few towns in this list with a downward trend over the short term. Prices peaked in 2024 at $54,621 before falling to $49,200 in 2025. The decline likely reflects local market dynamics rather than broad regional weakness. With limited historical data, it’s difficult to determine long-term patterns, but recent volatility suggests a cautious approach. That said, prices remain very low in absolute terms, keeping the town squarely in the affordability zone. For buyers prioritizing price over appreciation, this town still delivers. Its dip may even create opportunity for investors or bargain hunters. Lewiston Woodville continues to be one of the most cost-effective markets in eastern North Carolina.
Lewiston Woodville – Deeply Affordable and Under-the-Radar

Lewiston Woodville is a small, agricultural community in Bertie County formed by the merger of two towns in the mid-20th century. Its rural setting and low population make it a quiet place to live, but also contribute to its limited market activity. The town is surrounded by farmland and forest, giving it a distinctly laid-back atmosphere. There are few local amenities, though nearby Windsor and Ahoskie provide access to groceries, schools, and health services. Most of the housing here consists of single-family homes and mobile units. Affordability is the town’s defining feature, and even after a few price dips, it remains a top choice for buyers on a budget. For those willing to trade convenience for cost, Lewiston Woodville delivers some of the lowest prices in the state. It’s best suited for buyers seeking long-term holds, simple living, or inexpensive second homes.
1. Roxobel – 17% Home Price Decrease Since 2022
- 2010: N/A
- 2011: N/A
- 2012: N/A
- 2013: N/A
- 2014: N/A
- 2015: N/A
- 2016: N/A
- 2017: N/A
- 2018: N/A
- 2019: N/A
- 2020: N/A
- 2021: N/A
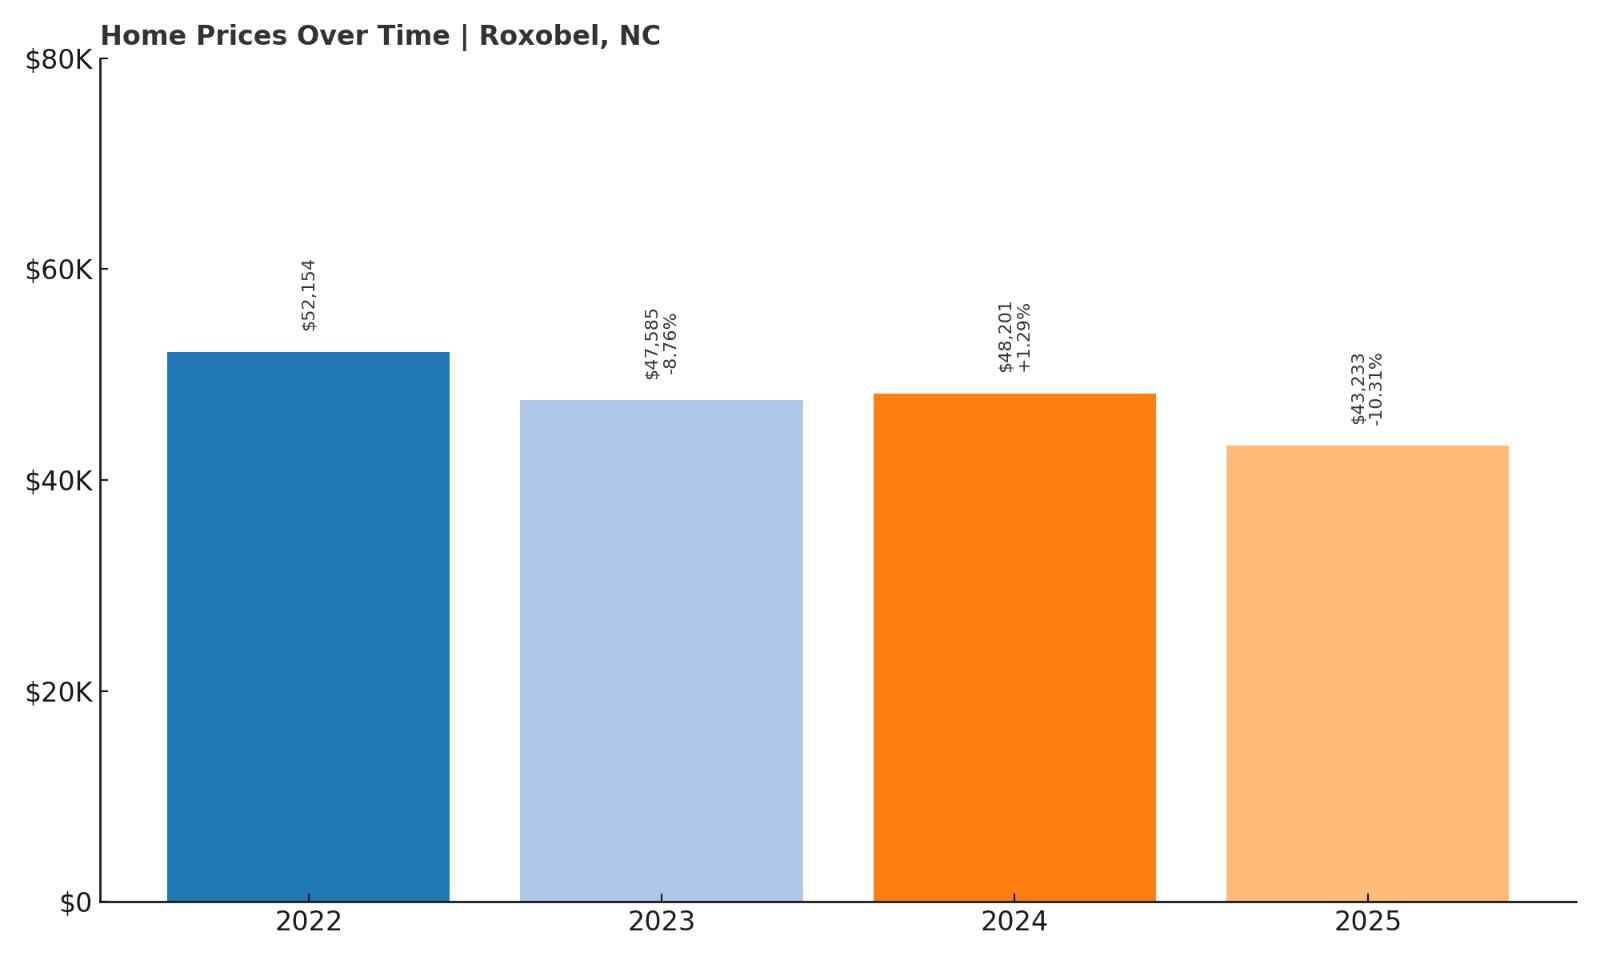
- 2022: $52,154
- 2023: $47,585 ($-4,569, -8.76% from previous year)
- 2024: $48,201 (+$616, +1.30% from previous year)
- 2025: $43,233 ($-4,968, -10.31% from previous year)
Roxobel holds the distinction of being the most affordable town in North Carolina based on 2025 data, with home prices falling 17% since 2022. Prices dipped below $44,000 in 2025 after peaking in 2022, reflecting one of the steepest declines among all towns analyzed. Despite these losses, the ultra-low home values keep it attractive for price-focused buyers. It’s a clear example of a market that may be cooling but still presents tremendous value for the right kind of homeowner. For those able to maintain or renovate a property, Roxobel may represent a hidden opportunity. The low price ceiling also means that any small gains in the future could represent significant percentage returns. For now, the market favors buyers. Roxobel may be best suited for local buyers or investors interested in long-term holds at bargain-basement prices.
Roxobel – North Carolina’s Lowest-Cost Housing Market in 2025
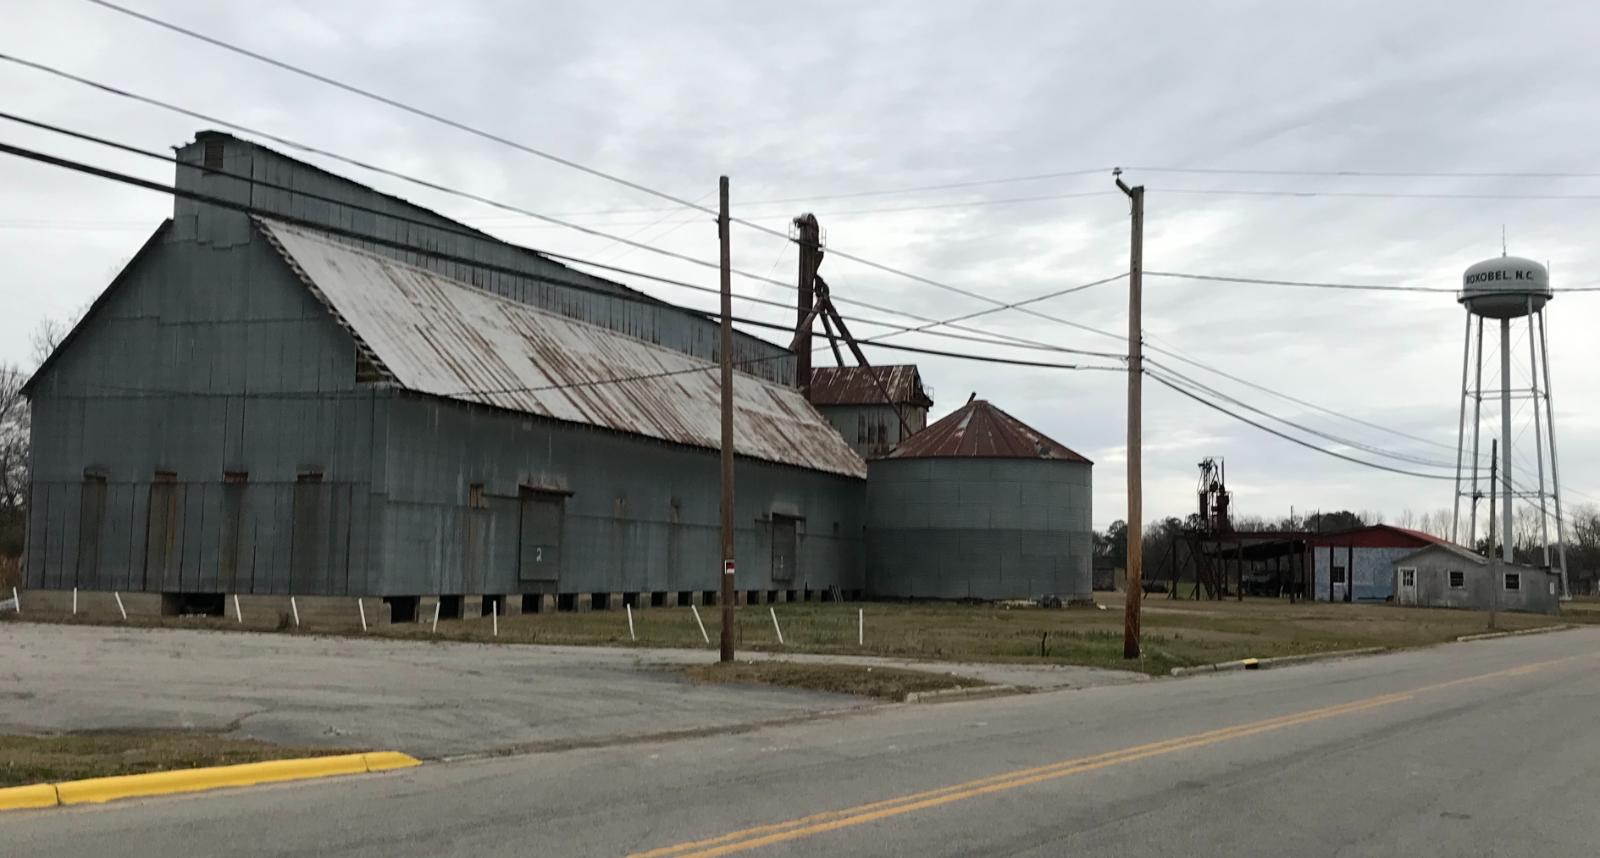
Roxobel is a small, rural town in Bertie County surrounded by woods, fields, and quiet roads. It’s one of the most affordable housing markets in all of North Carolina, but it comes with trade-offs. The town has limited infrastructure, few commercial centers, and a very small population. However, for those who value privacy and ultra-low costs, Roxobel is difficult to beat. Homes here tend to be older and may require work, but land is inexpensive and opportunities for low-cost ownership abound. The town’s proximity to slightly larger communities like Rich Square or Aulander allows residents to access essential services without too much travel. It’s not a growth hotspot, but for frugal buyers or real estate flippers, it may hold hidden potential. Roxobel exemplifies the type of deeply affordable market that still exists in North Carolina—if you know where to look.