Would you like to save this?
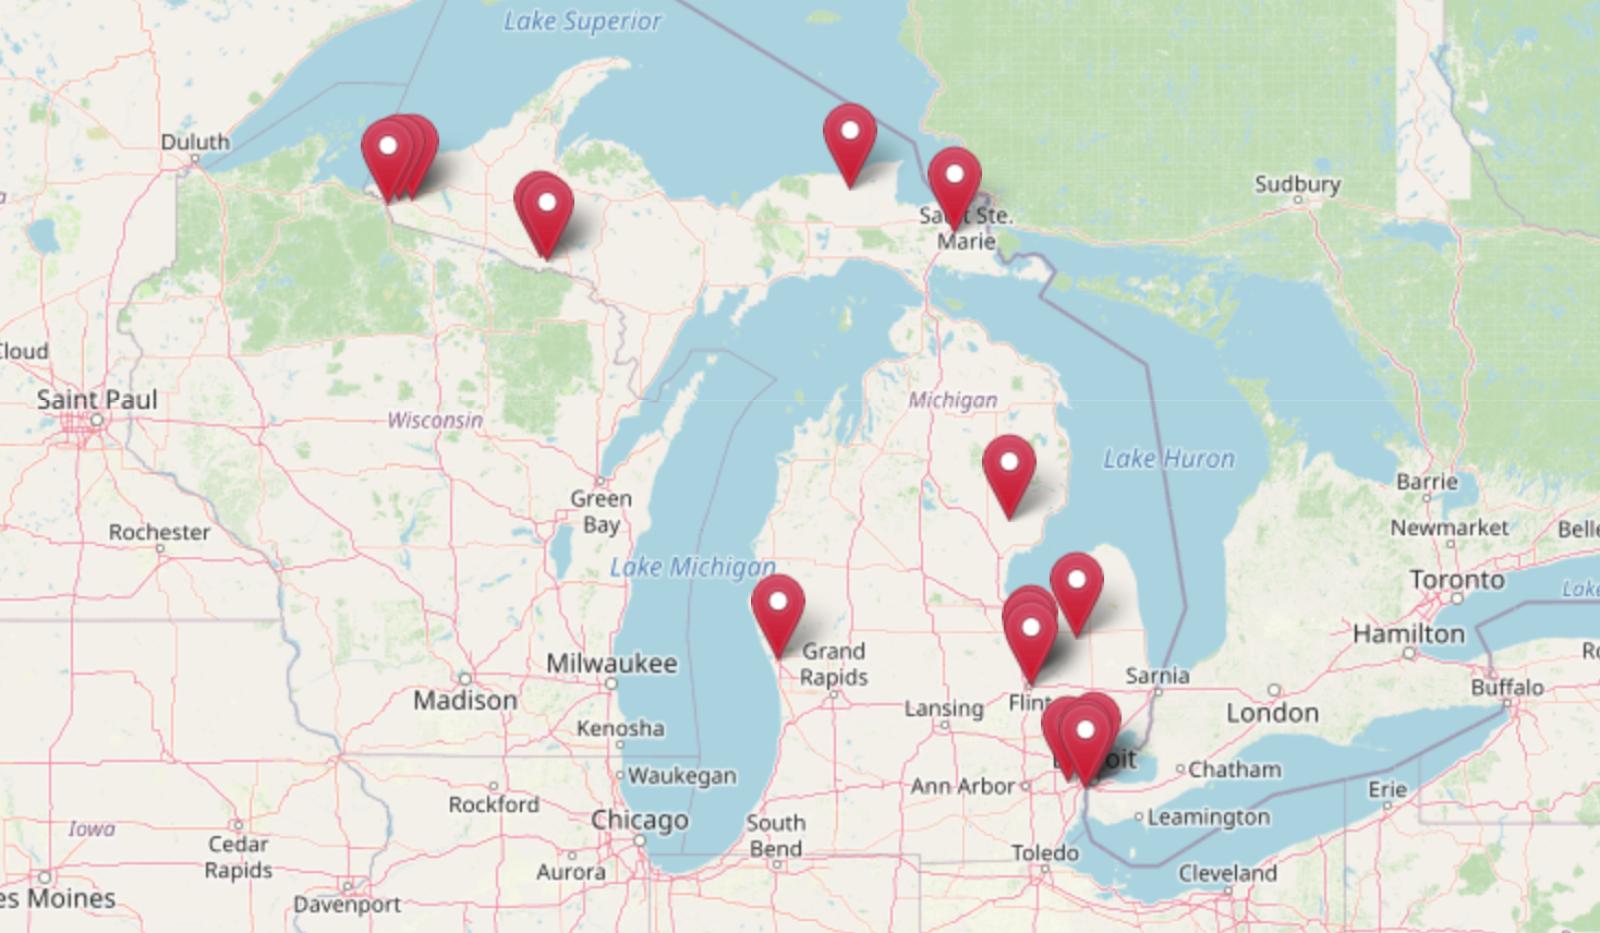
Zillow’s Home Value Index shows that Michigan is still home to some of the lowest-cost houses in the country—and these 18 towns are the standouts. As of May 2025, every place on this list has average home prices well below the state median, with a few still hovering under $50,000. While prices in cities like Ann Arbor have soared, these smaller communities offer real value for buyers who don’t mind skipping the spotlight. Some are shrinking, some are simply overlooked—but for now, they’re among the last truly affordable places to buy a home in the state.
18. Mt Morris – 236% Home Price Increase Since 2011
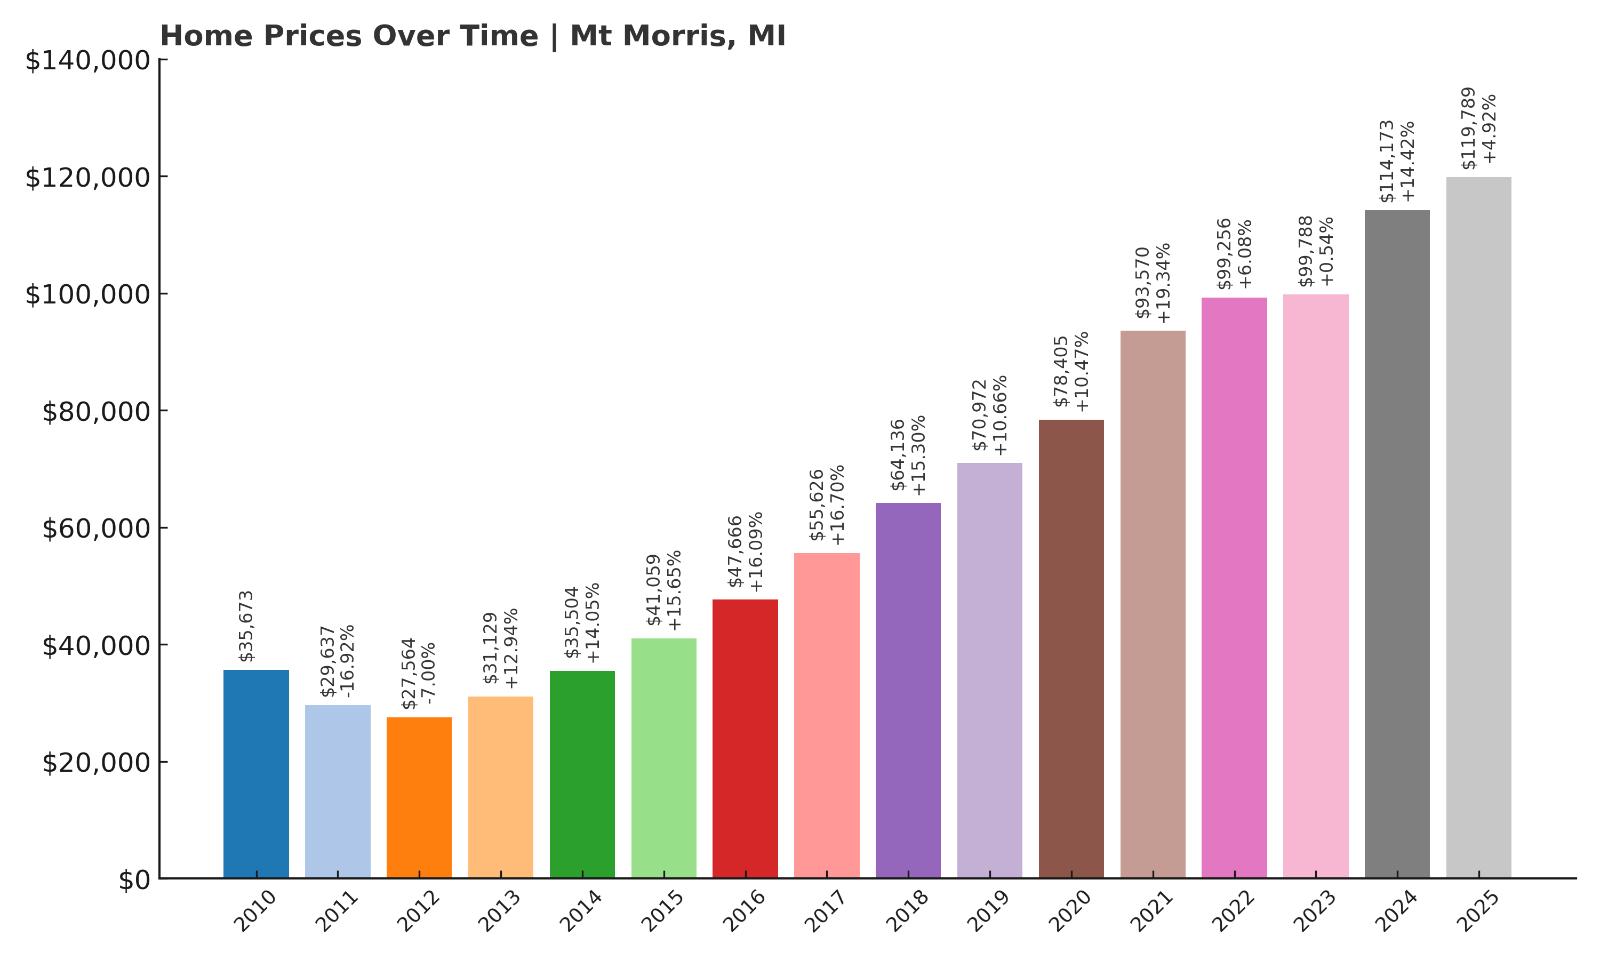
- 2010: $35,673
- 2011: $29,637 (-$6,035, -16.92% from previous year)
- 2012: $27,564 (-$2,074, -7.00% from previous year)
- 2013: $31,129 (+$3,565, +12.94% from previous year)
- 2014: $35,504 (+$4,375, +14.05% from previous year)
- 2015: $41,059 (+$5,555, +15.65% from previous year)
- 2016: $47,666 (+$6,607, +16.09% from previous year)
- 2017: $55,626 (+$7,960, +16.70% from previous year)
- 2018: $64,136 (+$8,509, +15.30% from previous year)
- 2019: $70,972 (+$6,837, +10.66% from previous year)
- 2020: $78,405 (+$7,432, +10.47% from previous year)
- 2021: $93,570 (+$15,165, +19.34% from previous year)
- 2022: $99,256 (+$5,686, +6.08% from previous year)
- 2023: $99,788 (+$532, +0.54% from previous year)
- 2024: $114,173 (+$14,386, +14.42% from previous year)
- 2025: $119,789 (+$5,615, +4.92% from previous year)
Mt Morris has seen a dramatic 236% increase in home prices since 2011, with the average value rising from just under $30,000 to nearly $120,000 in 2025. While prices were flat between 2022 and 2023, they jumped sharply again in 2024, continuing into 2025. The data reveals steady, double-digit percentage gains through much of the 2010s, reflecting a consistent upward trend. This sustained appreciation signals renewed interest in the area and a recovery from the deeply undervalued levels seen during the early 2010s. The town has transitioned from bargain-basement pricing to modest affordability while still remaining accessible for most buyers.
Mt Morris – Rebounding After Years of Decline
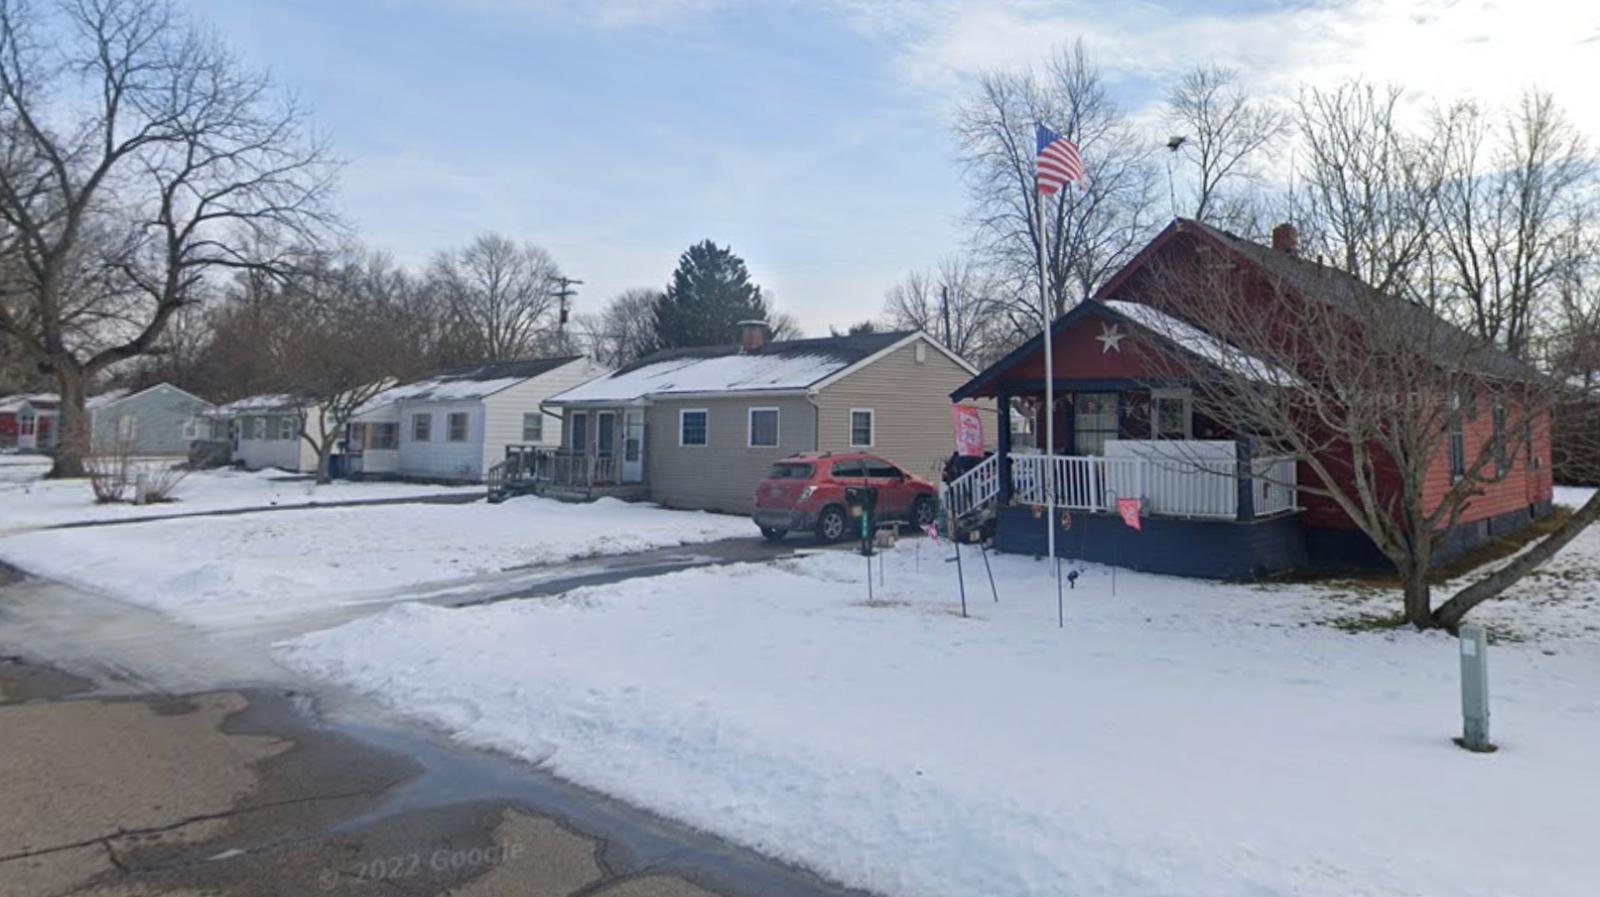
Located in Genesee County just northwest of Flint, Mt Morris has long been considered one of Michigan’s more economically challenged areas. But over the past decade, the town has started to rebound, benefiting from Flint’s slow revitalization efforts and broader regional infrastructure improvements. As Detroit’s suburbs continue to sprawl and prices elsewhere climb, communities like Mt Morris have attracted attention for offering value without entirely sacrificing access to job centers or highways.
Mt Morris still faces challenges, but the recent home price surge suggests renewed optimism from buyers and investors. Schools, parks, and affordable retail options provide a functional lifestyle at a fraction of the cost you’d pay elsewhere in the state. Despite being one of the cheapest housing markets in Michigan, the town’s sharp appreciation curve means affordability might not last much longer if these trends continue.
17. Bessemer – 142% Home Price Increase Since 2012
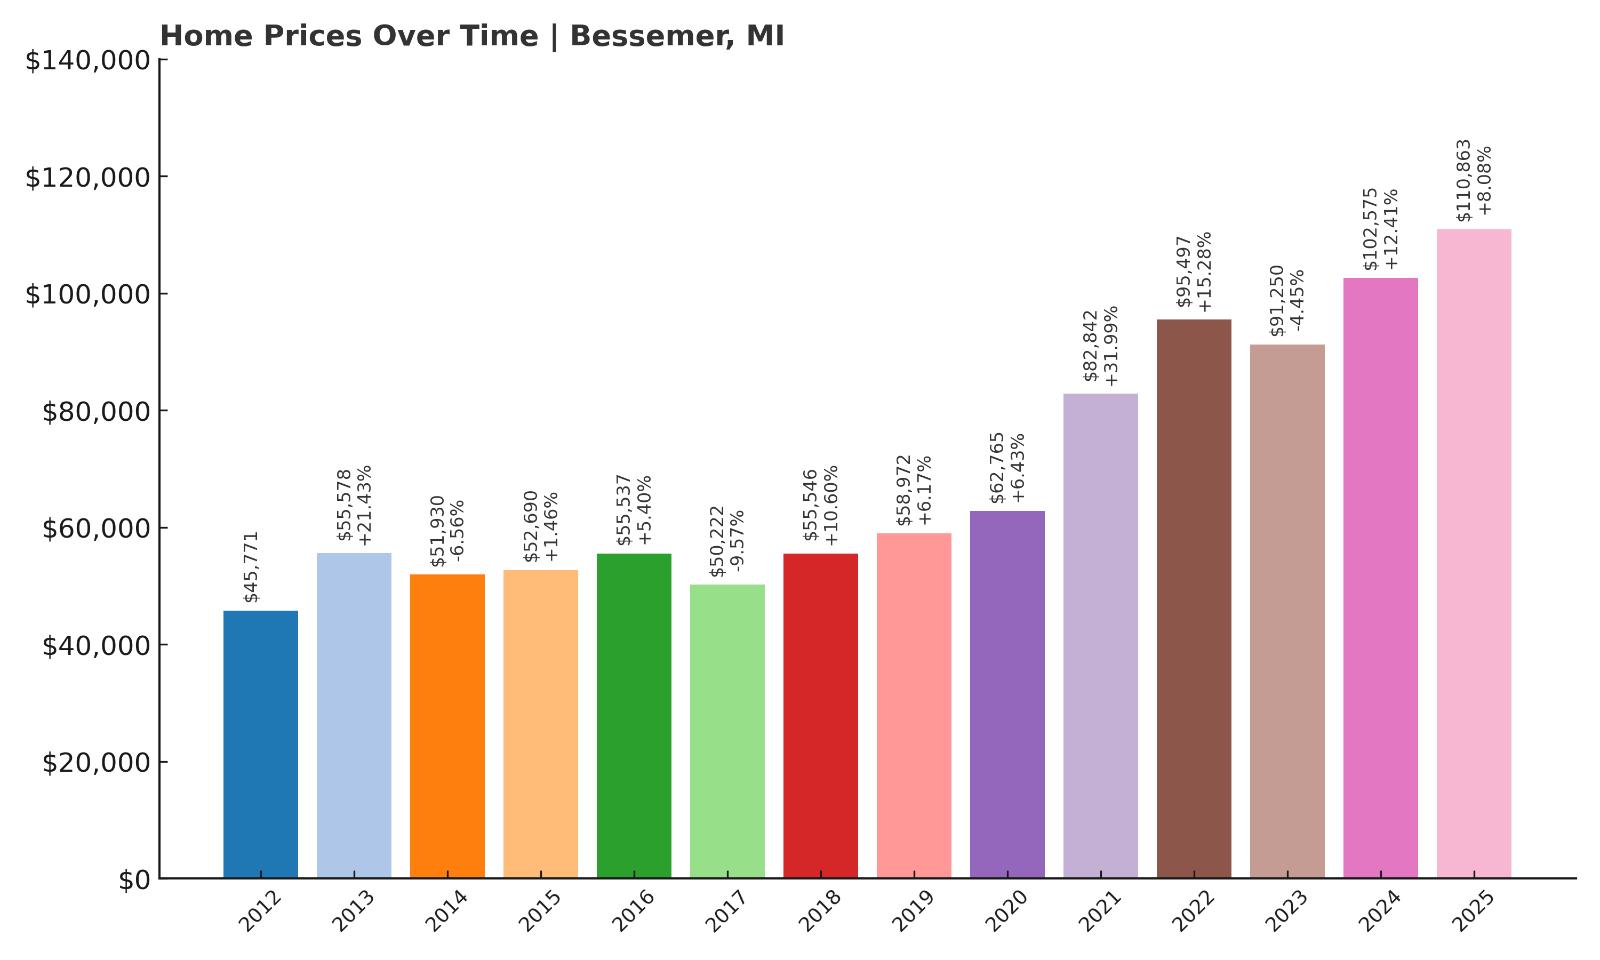
- 2010: N/A
- 2011: N/A
- 2012: $45,771
- 2013: $55,578 (+$9,807, +21.43% from previous year)
- 2014: $51,930 (-$3,649, -6.56% from previous year)
- 2015: $52,690 (+$760, +1.46% from previous year)
- 2016: $55,537 (+$2,847, +5.40% from previous year)
- 2017: $50,222 (-$5,315, -9.57% from previous year)
- 2018: $55,546 (+$5,324, +10.60% from previous year)
- 2019: $58,972 (+$3,426, +6.17% from previous year)
- 2020: $62,765 (+$3,793, +6.43% from previous year)
- 2021: $82,842 (+$20,077, +31.99% from previous year)
- 2022: $95,497 (+$12,655, +15.28% from previous year)
- 2023: $91,250 (-$4,247, -4.45% from previous year)
- 2024: $102,575 (+$11,325, +12.41% from previous year)
- 2025: $110,863 (+$8,288, +8.08% from previous year)
Home prices in Bessemer have risen 142% since 2012, nearly doubling over the past decade. After a period of up-and-down fluctuations in the mid-2010s, values surged after 2020, with particularly steep gains in 2021 and 2022. Even with a minor dip in 2023, the town recovered quickly, reaching a new high in 2025. This blend of volatility and growth suggests a market that’s small but increasingly being noticed, possibly due to regional shifts and renewed buyer interest in Michigan’s Upper Peninsula.
Bessemer – Affordable Living in the Western U.P.
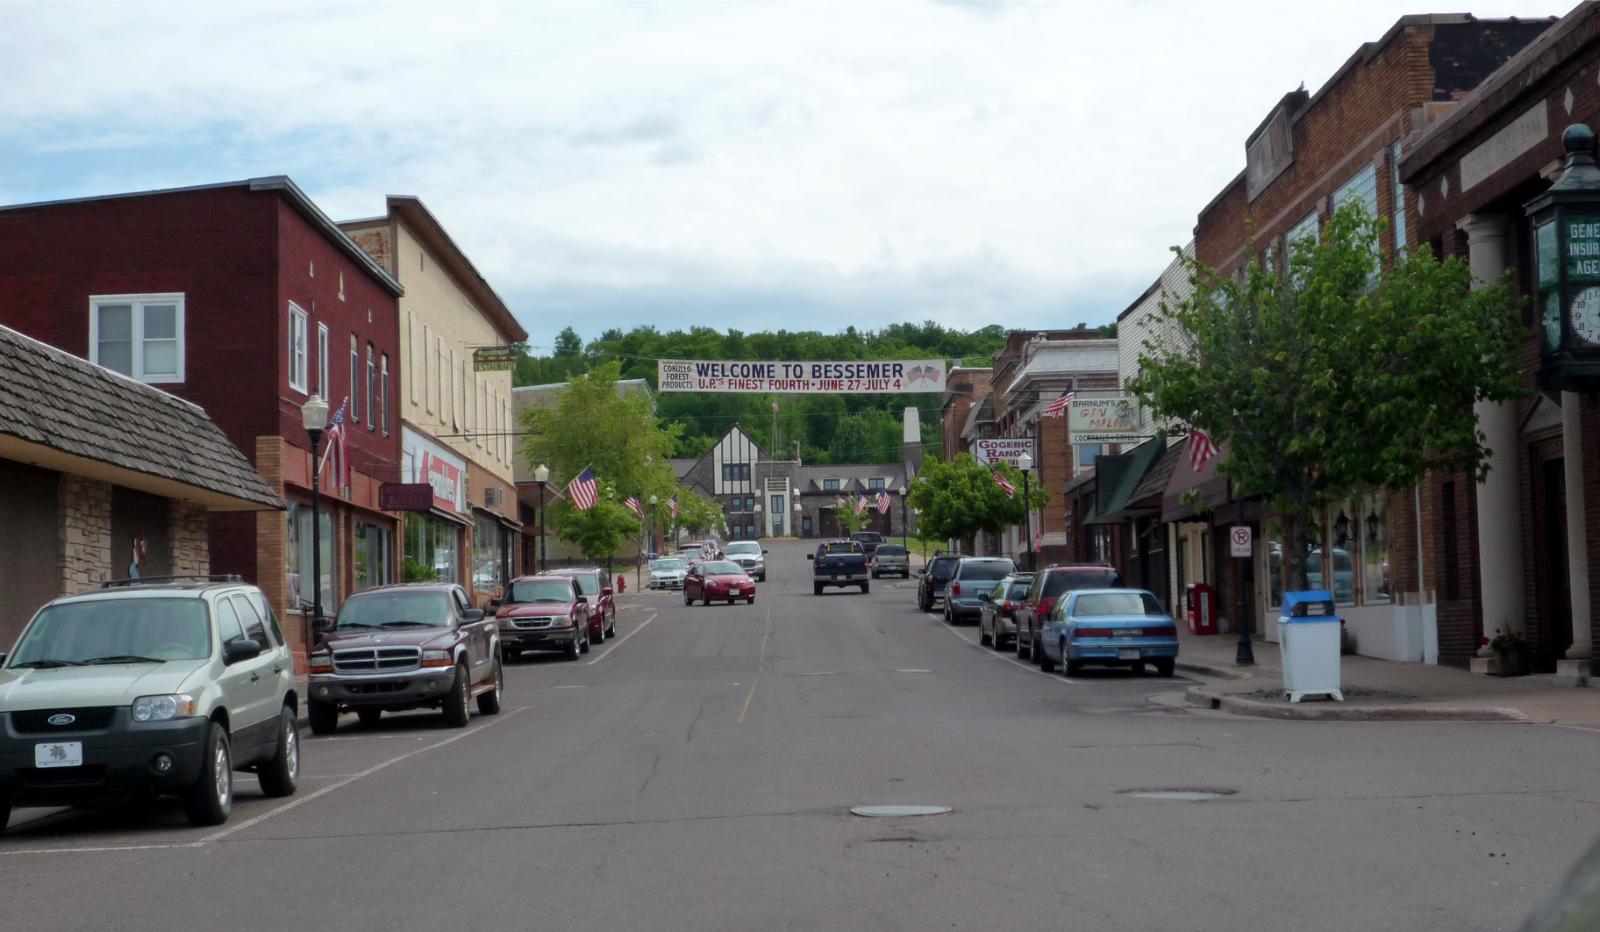
Bessemer is tucked away in Gogebic County near Michigan’s western border with Wisconsin. It’s a quiet town known for outdoor recreation, including skiing, hiking, and snowmobiling—major draws for seasonal residents and retirees. While it’s isolated by Lower Peninsula standards, the area appeals to those seeking tranquility, fresh air, and exceptionally low real estate prices.
The sharp post-2020 rise in prices may be tied to a broader U.P. trend where remote workers and second-home buyers have started to explore alternative living environments. Despite these increases, Bessemer’s average price remains just above $110,000—making it highly affordable even after substantial appreciation. With its proximity to natural beauty and its small-town appeal, Bessemer offers a distinct value proposition for buyers looking to live outside the bustle of city life.
16. Inkster – 529% Home Price Increase Since 2012
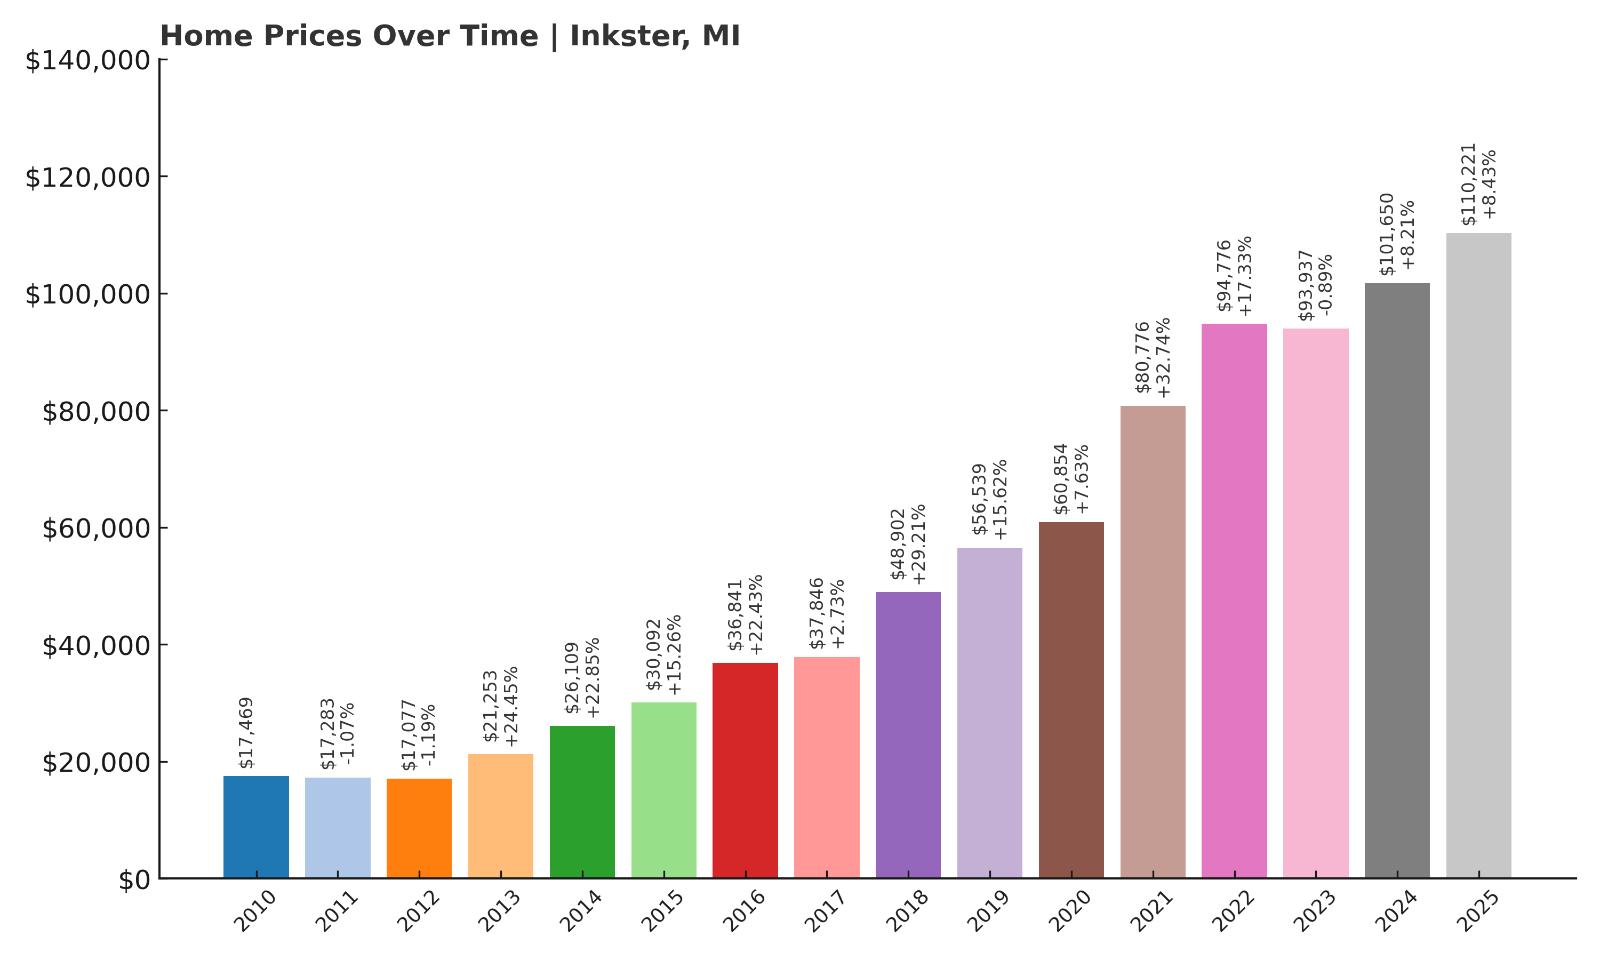
- 2010: $17,469
- 2011: $17,283 (-$186, -1.07% from previous year)
- 2012: $17,077 (-$205, -1.19% from previous year)
- 2013: $21,253 (+$4,175, +24.45% from previous year)
- 2014: $26,109 (+$4,856, +22.85% from previous year)
- 2015: $30,092 (+$3,983, +15.26% from previous year)
- 2016: $36,841 (+$6,749, +22.43% from previous year)
- 2017: $37,846 (+$1,005, +2.73% from previous year)
- 2018: $48,902 (+$11,056, +29.21% from previous year)
- 2019: $56,539 (+$7,636, +15.62% from previous year)
- 2020: $60,854 (+$4,315, +7.63% from previous year)
- 2021: $80,776 (+$19,922, +32.74% from previous year)
- 2022: $94,776 (+$14,000, +17.33% from previous year)
- 2023: $93,937 (-$839, -0.89% from previous year)
- 2024: $101,650 (+$7,714, +8.21% from previous year)
- 2025: $110,221 (+$8,570, +8.43% from previous year)
Inkster’s housing market has undergone a remarkable transformation, with prices climbing from just $17,000 in 2012 to over $110,000 in 2025—a 529% increase. The most explosive growth occurred after 2020, with double-digit annual gains signaling rising demand. Despite a brief dip in 2023, the market resumed its upward trend the following year. This long-term surge highlights a dramatic reversal of fortune for a town once considered one of the most undervalued in Michigan.
Inkster – Rapid Growth in Metro Detroit’s Outskirts
Would you like to save this?
Inkster lies just west of Dearborn and roughly 20 minutes from downtown Detroit. For years, it struggled with high vacancy rates and underinvestment. But as the broader Detroit metro area recovers and gentrification pushes housing demand outward, Inkster has become a target for budget-conscious buyers. Improved public services and proximity to key highways have also contributed to its appeal.
The dramatic growth in home prices speaks to this shifting perception. While it remains one of the more affordable communities in Wayne County, rising values suggest its “cheap buy” status may not last. Investors, especially those interested in long-term value, have increasingly looked at Inkster as a promising alternative to more expensive nearby suburbs.
15. Newberry – 32% Home Price Increase Since 2016
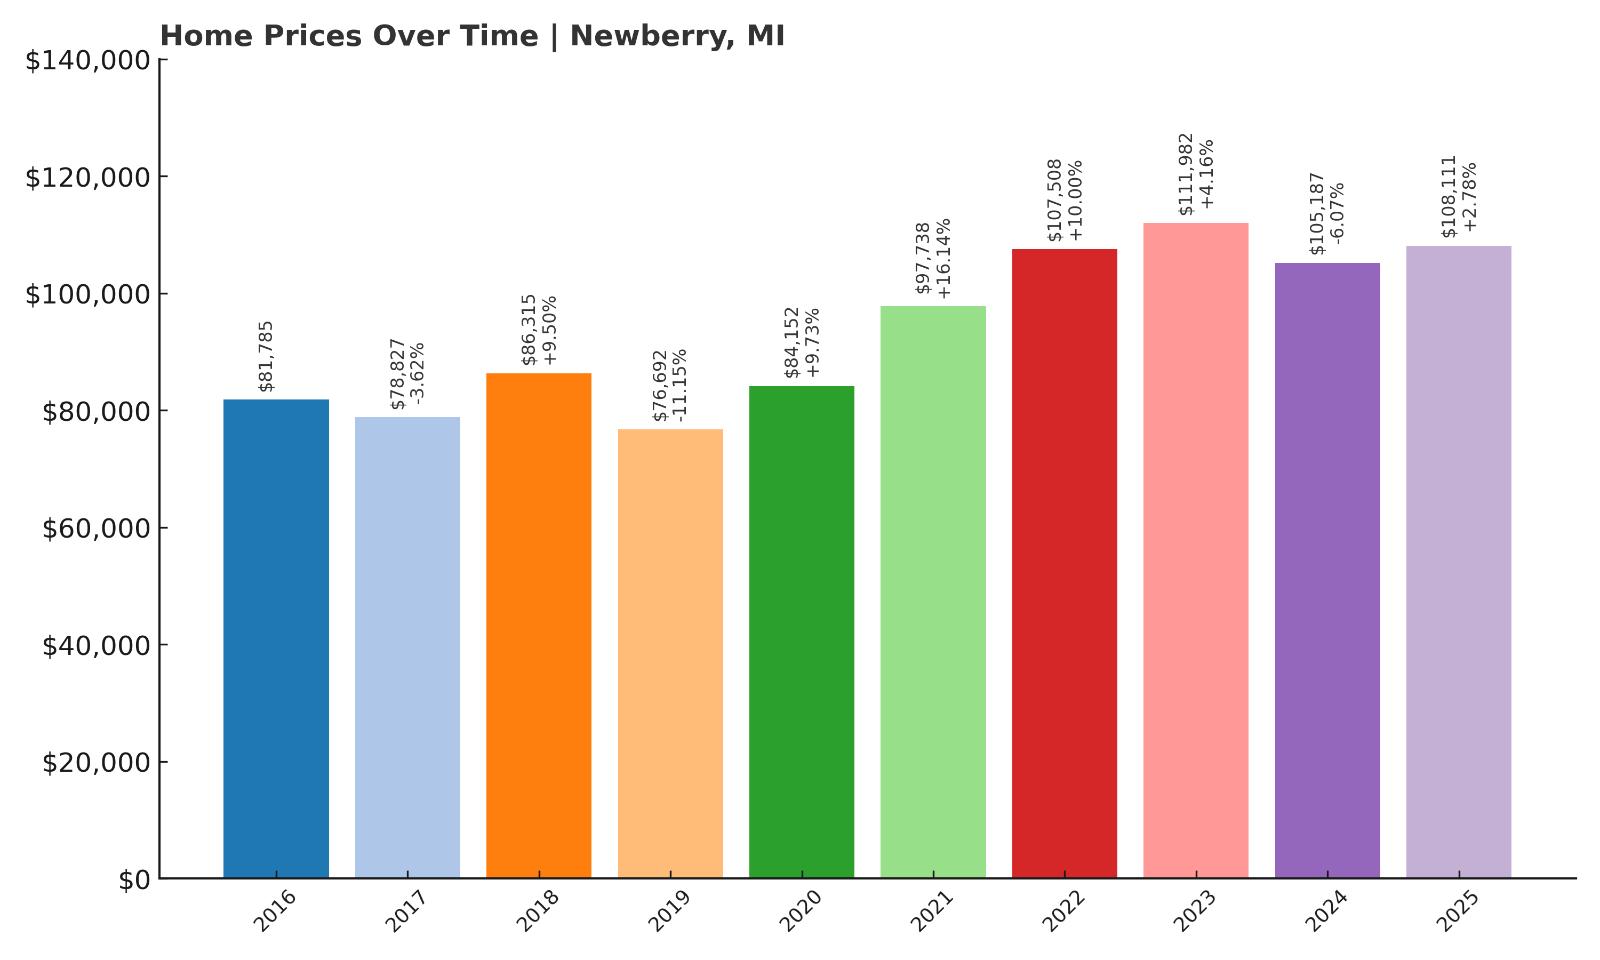
- 2010: N/A
- 2011: N/A
- 2012: N/A
- 2013: N/A
- 2014: N/A
- 2015: N/A
- 2016: $81,785
- 2017: $78,827 (-$2,958, -3.62% from previous year)
- 2018: $86,315 (+$7,488, +9.50% from previous year)
- 2019: $76,692 (-$9,623, -11.15% from previous year)
- 2020: $84,152 (+$7,461, +9.73% from previous year)
- 2021: $97,738 (+$13,586, +16.14% from previous year)
- 2022: $107,508 (+$9,770, +10.00% from previous year)
- 2023: $111,982 (+$4,475, +4.16% from previous year)
- 2024: $105,187 (-$6,796, -6.07% from previous year)
- 2025: $108,111 (+$2,924, +2.78% from previous year)
Since 2016, Newberry’s home prices have increased by 32%, with the most dramatic rise occurring between 2020 and 2022. Despite a few minor setbacks—including a 6% drop in 2024—prices rebounded by 2025, suggesting renewed stability. The market’s overall trend is one of steady growth with occasional pullbacks, which is typical for smaller towns in Michigan’s Upper Peninsula that depend heavily on seasonal demand and economic cycles.
Newberry – Gateway to Tahquamenon Falls and Quiet U.P. Living
Newberry, known as the gateway to Tahquamenon Falls State Park, is one of the most scenic and peaceful communities in Michigan’s Upper Peninsula. It’s located in Luce County, far from any major metro area, and surrounded by forests, lakes, and outdoor attractions. While its remote location can deter some buyers, it’s precisely that solitude that draws others, particularly retirees, hunters, and nature lovers.
The housing market here has remained relatively affordable, though the recent post-pandemic growth shows increasing interest in remote living. Tourism provides a seasonal economic boost, but long-term stability still hinges on public services and rural infrastructure investments. With an average price just over $108,000 in 2025, Newberry remains one of Michigan’s cheapest options for owning a home surrounded by natural beauty.
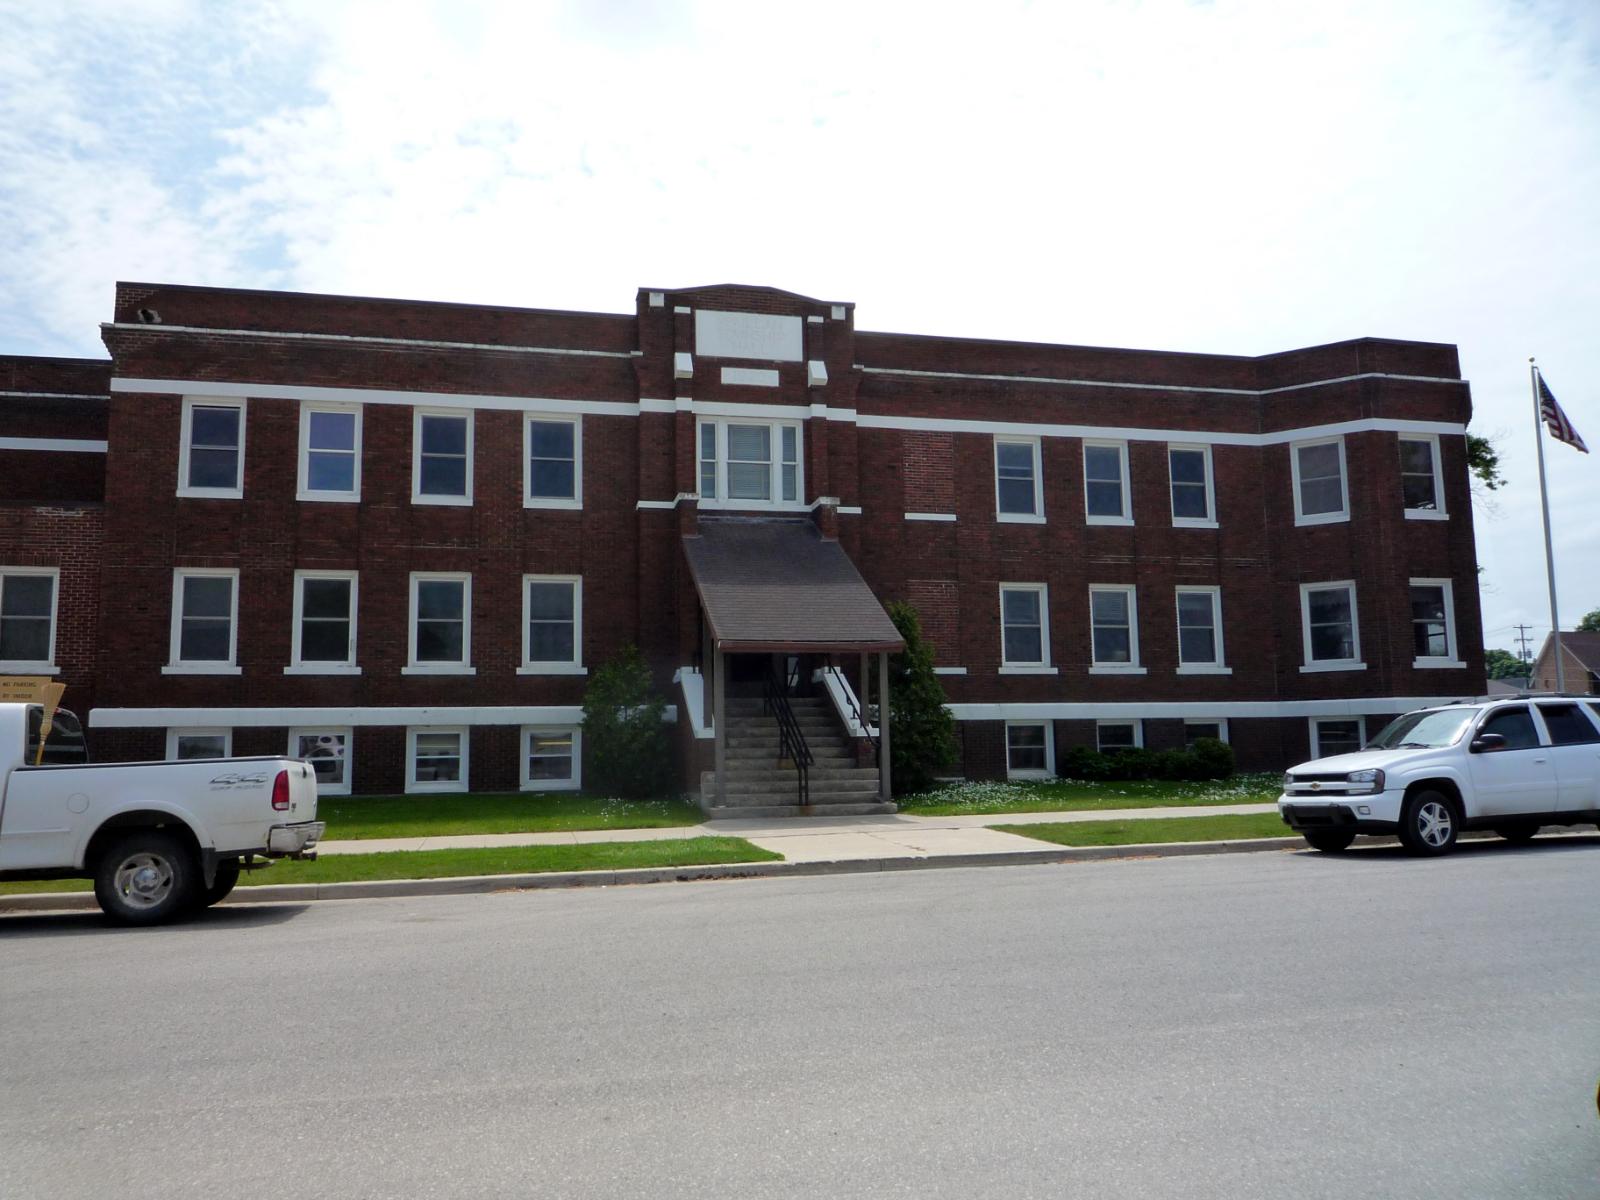
14. Wakefield – 62% Home Price Increase Since 2012
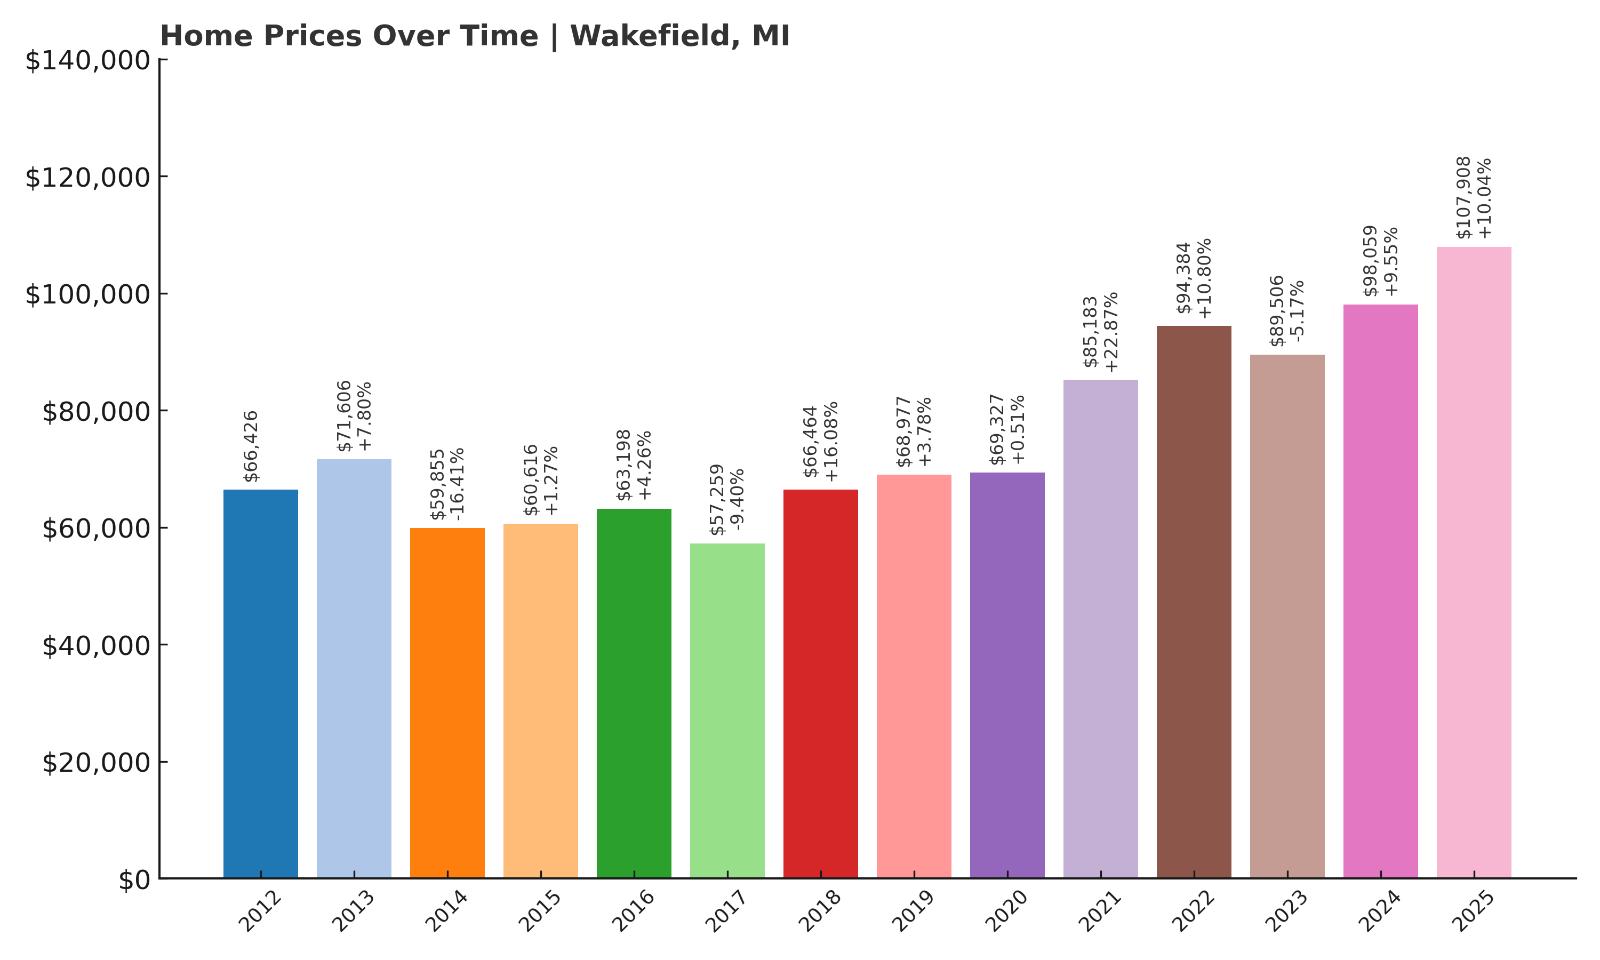
- 2010: N/A
- 2011: N/A
- 2012: $66,426
- 2013: $71,606 (+$5,180, +7.80% from previous year)
- 2014: $59,855 (-$11,751, -16.41% from previous year)
- 2015: $60,616 (+$760, +1.27% from previous year)
- 2016: $63,198 (+$2,583, +4.26% from previous year)
- 2017: $57,259 (-$5,939, -9.40% from previous year)
- 2018: $66,464 (+$9,205, +16.08% from previous year)
- 2019: $68,977 (+$2,513, +3.78% from previous year)
- 2020: $69,327 (+$350, +0.51% from previous year)
- 2021: $85,183 (+$15,855, +22.87% from previous year)
- 2022: $94,384 (+$9,202, +10.80% from previous year)
- 2023: $89,506 (-$4,878, -5.17% from previous year)
- 2024: $98,059 (+$8,552, +9.55% from previous year)
- 2025: $107,908 (+$9,849, +10.04% from previous year)
Wakefield’s home prices have grown 62% since 2012, with particularly large jumps since 2021. Like many small U.P. towns, it experienced ups and downs throughout the 2010s, but the market has surged in the last four years. After a small setback in 2023, prices rebounded strongly and hit nearly $108,000 in 2025. This recent uptick suggests strong buyer interest, likely tied to the town’s recreational appeal and changing rural migration patterns.
Wakefield – Scenic Trails and a Steady Real Estate Climb
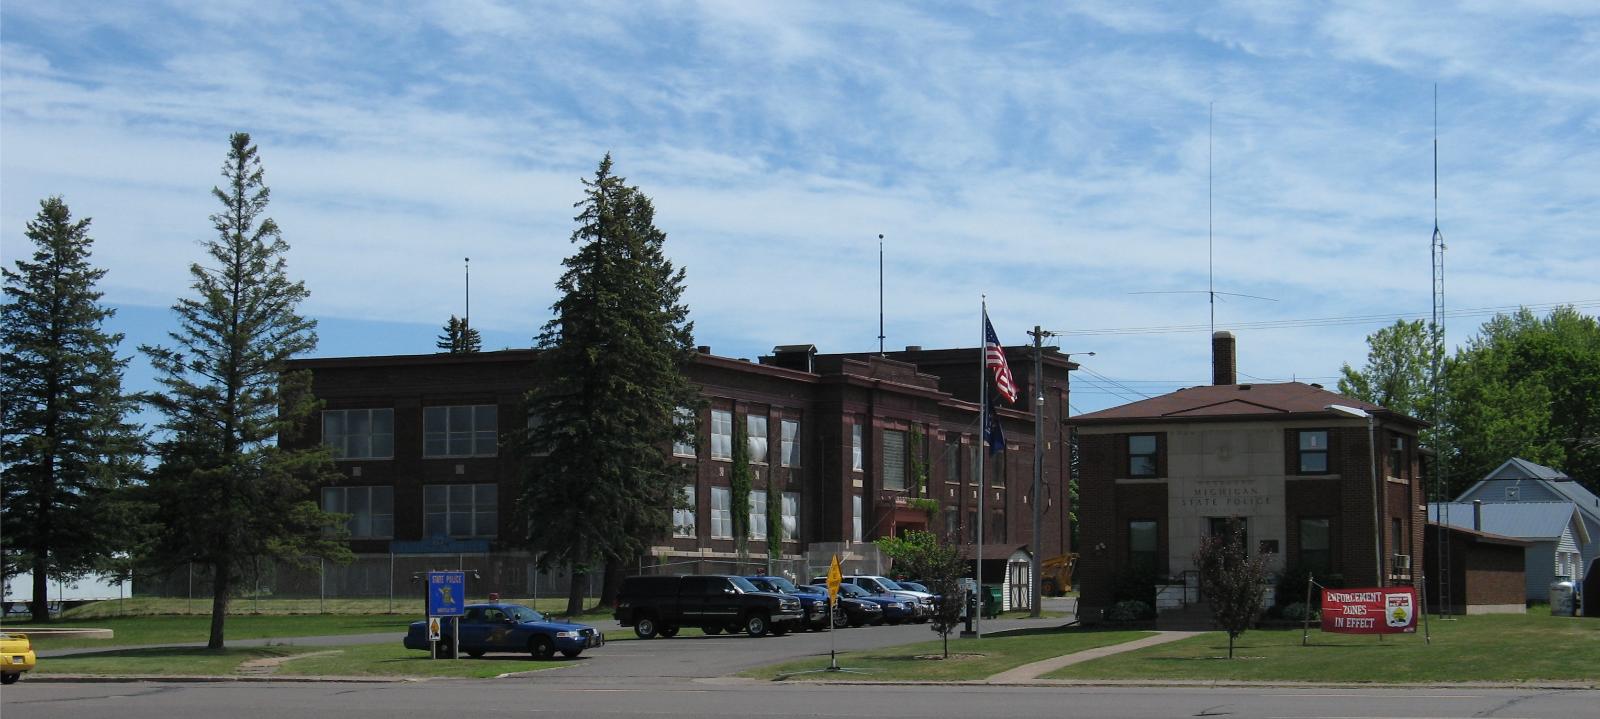
Wakefield is a picturesque town in Michigan’s western Upper Peninsula, not far from Lake Superior and the Wisconsin border. Surrounded by forests and hills, it’s known for ski resorts, hiking trails, and proximity to outdoor destinations like the Porcupine Mountains. Its affordable housing stock has become increasingly attractive to retirees and vacation home buyers, particularly as southern Michigan prices soar.
Despite some volatility in past years, Wakefield’s housing market has shown sustained momentum since 2020. The area’s beauty, combined with its affordability, gives it staying power in an otherwise niche market. With prices now approaching $110,000, it may not remain a low-cost destination for long—especially if remote work continues to drive interest in scenic, rural places.
13. Mount Morris – 144% Home Price Increase Since 2012
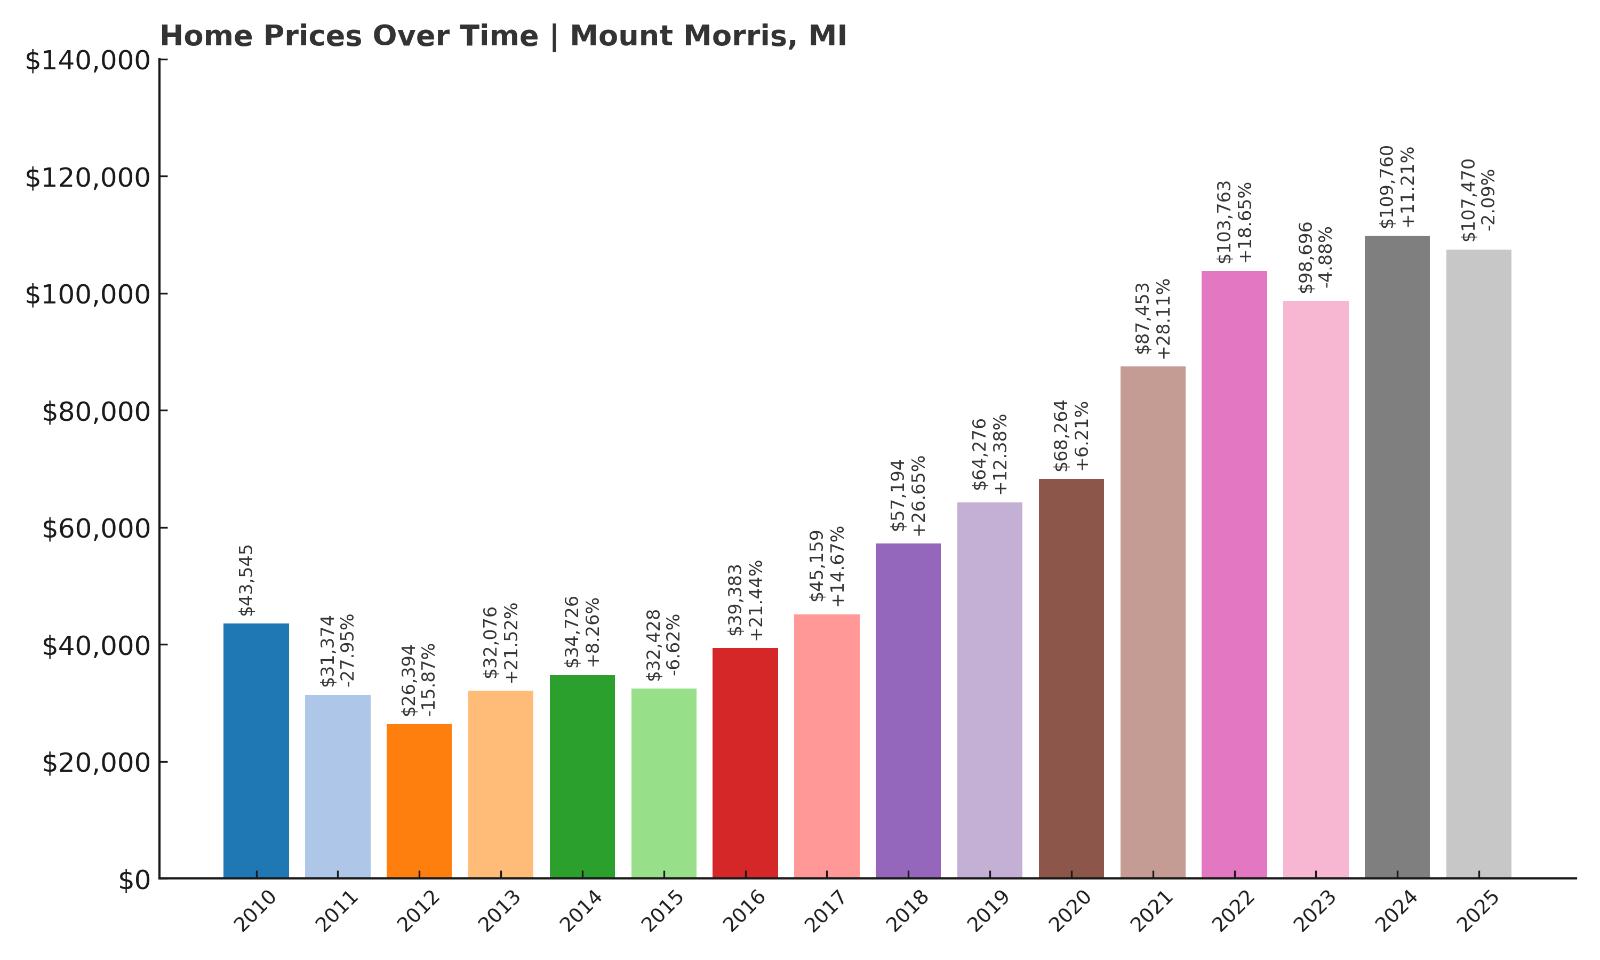
- 2010: $43,545
- 2011: $31,374 (-$12,170, -27.95% from previous year)
- 2012: $26,394 (-$4,980, -15.87% from previous year)
- 2013: $32,076 (+$5,681, +21.52% from previous year)
- 2014: $34,726 (+$2,651, +8.26% from previous year)
- 2015: $32,428 (-$2,298, -6.62% from previous year)
- 2016: $39,383 (+$6,954, +21.44% from previous year)
- 2017: $45,159 (+$5,776, +14.67% from previous year)
- 2018: $57,194 (+$12,036, +26.65% from previous year)
- 2019: $64,276 (+$7,082, +12.38% from previous year)
- 2020: $68,264 (+$3,988, +6.21% from previous year)
- 2021: $87,453 (+$19,188, +28.11% from previous year)
- 2022: $103,763 (+$16,310, +18.65% from previous year)
- 2023: $98,696 (-$5,067, -4.88% from previous year)
- 2024: $109,760 (+$11,063, +11.21% from previous year)
- 2025: $107,470 (-$2,290, -2.09% from previous year)
Since 2012, Mount Morris has experienced a substantial 144% jump in average home values, rising from just $26,394 to over $107,000 in 2025. The market gained significant momentum after 2016, peaking during the pandemic boom years, where double-digit growth became the norm. After a dip in 2023, prices bounced back strongly in 2024 before settling slightly in 2025. Overall, the long-term trend shows a town that’s increasingly on the radar for budget-conscious buyers. Despite a few bumps, Mount Morris’s housing market has outpaced expectations and shows signs of long-term appreciation potential. Its affordability, even after such dramatic growth, continues to attract new residents and investors looking for opportunities in Genesee County. With prices still under $110,000, the town remains far more accessible than many other Michigan markets.
Mount Morris – Growth in a Gritty Corner of Genesee County
Mount Morris, often overshadowed by its larger neighbor Flint, is one of those places that’s seen tough times—but also resilience. Located just a few miles from the heart of Flint, this town was once part of a broader post-industrial decline that hit mid-Michigan hard in the early 2000s. But as housing demand has slowly crept back into the region, Mount Morris has carved out its own appeal. Buyers priced out of metro areas have turned to this town for its low cost of entry and manageable commute options. Schools and infrastructure have seen modest improvements, and proximity to I-75 provides convenient access to larger cities. While the town still faces economic hurdles, the housing data suggests buyers are seeing value here. It’s this balance—affordability paired with signs of turnaround—that’s driving continued price appreciation.
The community offers a range of modest single-family homes, often with sizable lots and older construction. While new development remains limited, the steady price climb reflects demand even in the absence of luxury upgrades. Local parks, schools, and businesses serve a population that values affordability over flash. Mount Morris isn’t a destination for everyone, but for many first-time homebuyers and investors, it represents a rare opportunity to get into the housing market without breaking the bank. As Flint stabilizes and nearby markets grow more expensive, Mount Morris could continue to quietly rise in value while retaining its working-class identity.
12. Prescott – 111% Home Price Increase Since 2012
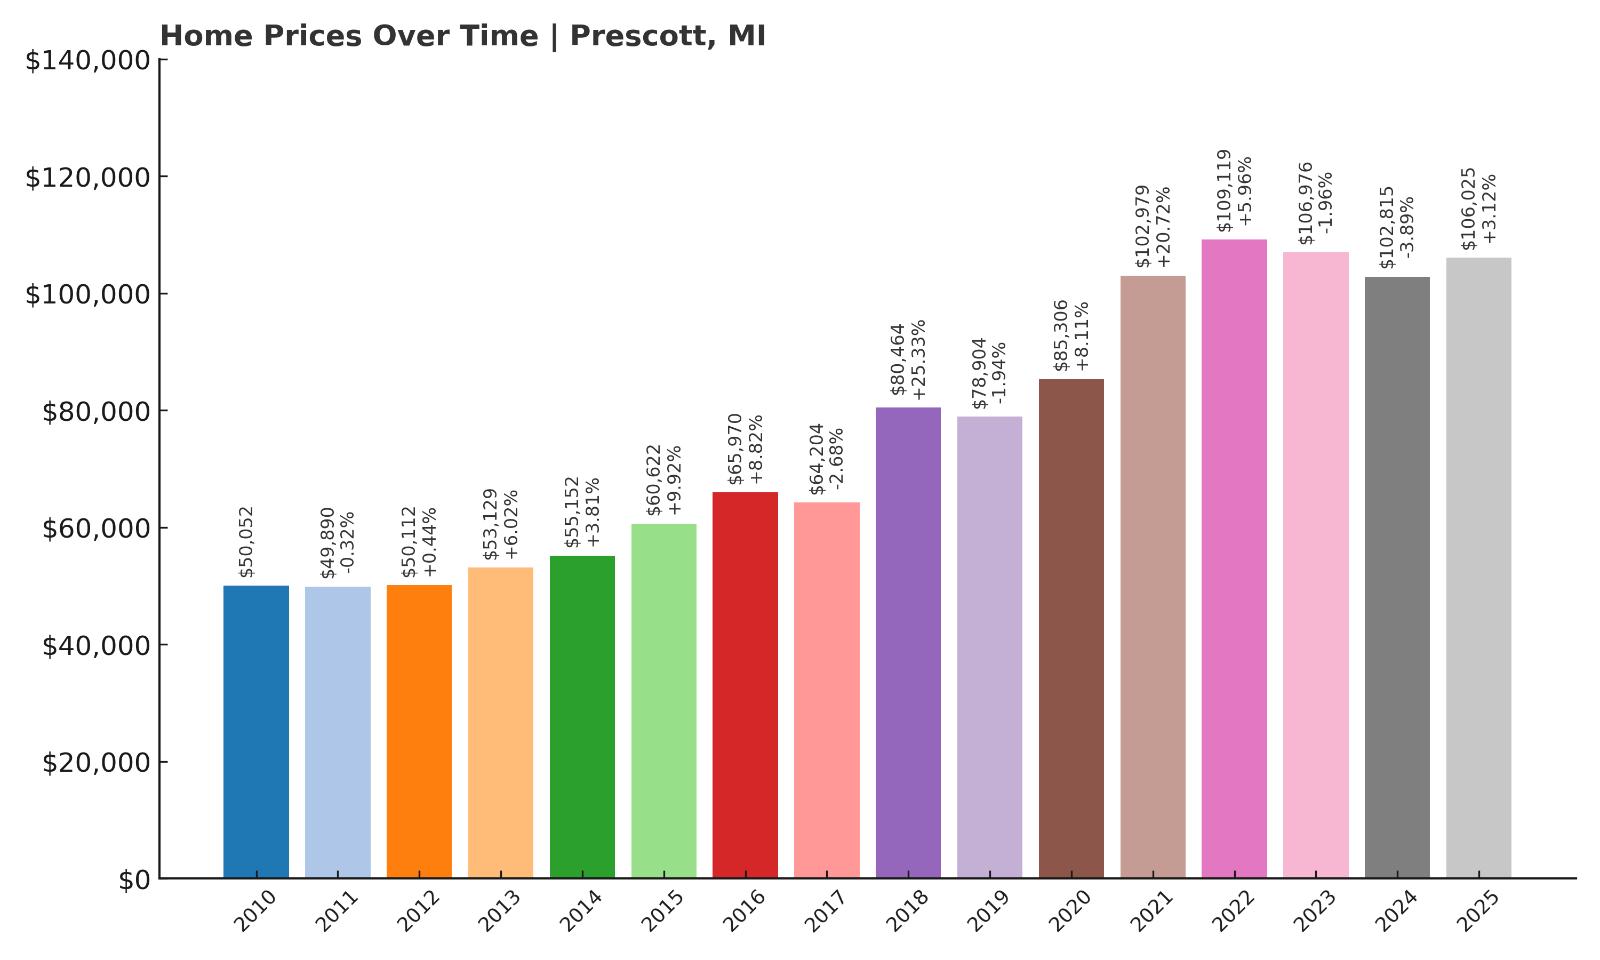
- 2010: $50,052
- 2011: $49,890 (-$161, -0.32% from previous year)
- 2012: $50,112 (+$221, +0.44% from previous year)
- 2013: $53,129 (+$3,017, +6.02% from previous year)
- 2014: $55,152 (+$2,024, +3.81% from previous year)
- 2015: $60,622 (+$5,470, +9.92% from previous year)
- 2016: $65,970 (+$5,348, +8.82% from previous year)
- 2017: $64,204 (-$1,766, -2.68% from previous year)
- 2018: $80,464 (+$16,261, +25.33% from previous year)
- 2019: $78,904 (-$1,560, -1.94% from previous year)
- 2020: $85,306 (+$6,402, +8.11% from previous year)
- 2021: $102,979 (+$17,672, +20.72% from previous year)
- 2022: $109,119 (+$6,141, +5.96% from previous year)
- 2023: $106,976 (-$2,143, -1.96% from previous year)
- 2024: $102,815 (-$4,161, -3.89% from previous year)
- 2025: $106,025 (+$3,209, +3.12% from previous year)
Prescott’s housing market has more than doubled since 2012, with home prices climbing 111% over the last 13 years. The town saw particularly steep gains between 2016 and 2021, with 2021 standing out for its nearly 21% single-year increase. While there have been modest pullbacks since 2022, the general trend remains upward. The average home value hit $106,025 in 2025, which still places it among Michigan’s more affordable markets. The data indicates that despite recent volatility, Prescott has held onto most of its post-pandemic gains and remains a relatively steady performer for such a small town. Its long-term affordability combined with periodic growth spikes makes it an appealing option for price-conscious buyers looking outside metro hubs.
Prescott – A Quiet Rural Market With Surprising Momentum
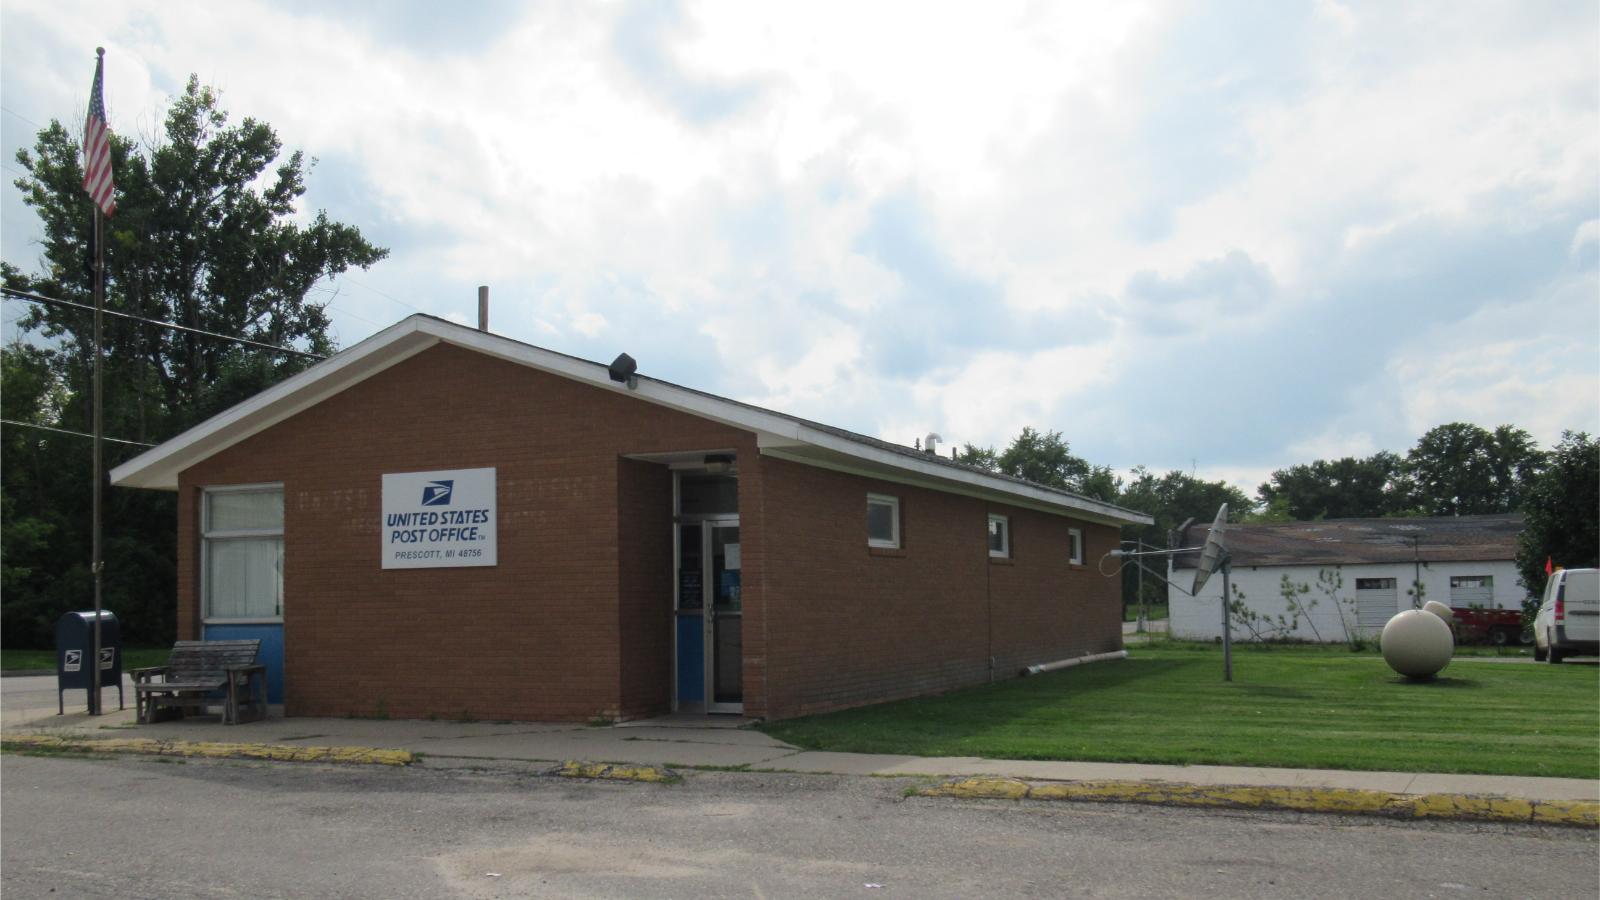
Located in Ogemaw County in northeastern Michigan, Prescott is a tiny rural town that often flies under the radar. With fewer than 300 residents, it’s one of the smallest towns on this list, but that hasn’t stopped it from seeing big shifts in its housing market. What Prescott lacks in population density, it makes up for in space, affordability, and simplicity. Most homes in the area are single-story residences with large yards, and many are older, lending the town a distinctly small-town charm. It’s a place where buyers can escape high prices and live close to nature while still enjoying essential amenities within driving distance in West Branch or Standish.
The recent price increases are a reminder that even the smallest Michigan towns are not immune to broader economic forces. As more people leave cities in search of space and affordability, towns like Prescott have seen renewed interest. Its home values may still be relatively low, but they’re no longer static. With hunting, fishing, and outdoor recreation at its doorstep, Prescott is becoming an unexpected option for those looking for a simple life—or for investors hoping to get in early in a market with room to grow.
11. Iron River – 86% Home Price Increase Since 2012

- 2010: $55,701
- 2011: $54,304 (-$1,397, -2.51% from previous year)
- 2012: $56,646 (+$2,342, +4.31% from previous year)
- 2013: $58,573 (+$1,927, +3.40% from previous year)
- 2014: $57,719 (-$854, -1.46% from previous year)
- 2015: $58,943 (+$1,225, +2.12% from previous year)
- 2016: $66,146 (+$7,203, +12.22% from previous year)
- 2017: $60,362 (-$5,784, -8.74% from previous year)
- 2018: $62,988 (+$2,626, +4.35% from previous year)
- 2019: $64,858 (+$1,870, +2.97% from previous year)
- 2020: $71,076 (+$6,218, +9.59% from previous year)
- 2021: $81,916 (+$10,840, +15.25% from previous year)
- 2022: $83,235 (+$1,319, +1.61% from previous year)
- 2023: $85,539 (+$2,304, +2.77% from previous year)
- 2024: $95,134 (+$9,595, +11.22% from previous year)
- 2025: $105,634 (+$10,500, +11.04% from previous year)
Iron River has seen its average home price rise 86% since 2012, climbing from $56,646 to $105,634 by 2025. The growth has been steady, with a few dips along the way but an unmistakable upward trajectory overall. Key growth years like 2016, 2021, and 2024–2025 contributed to significant jumps in valuation. Unlike some towns that saw sharp pandemic-related spikes, Iron River’s trend line is more consistent, reflecting slow, organic demand. Its affordability relative to nearby markets remains intact, but rising prices suggest that may be changing. Buyers looking for low-cost options in the Upper Peninsula are clearly taking notice, pushing prices higher year after year.
Iron River – A U.P. Community On the Rise
Iron River is a scenic town in Iron County near the western edge of Michigan’s Upper Peninsula. Known for its forests, lakes, and small-town charm, it attracts retirees, hunters, snowmobilers, and families looking for peace and affordability. Though once heavily reliant on mining and timber, the town has shifted toward recreation and seasonal tourism. The steady rise in home values mirrors a broader trend in rural Michigan, where quality of life and natural surroundings are drawing newcomers, especially in the post-pandemic era. Iron River benefits from having basic amenities like schools, a hospital, and a historic downtown—all wrapped in a serene wilderness setting.
Real estate in Iron River remains affordable, but that window may not stay open much longer. The $105K average home price in 2025 still undercuts state and national norms, yet double-digit growth in multiple years shows that demand is creeping up. Some of this pressure comes from out-of-state buyers exploring lakefront or vacation home options, while others are local renters finally entering the market. Whatever the cause, Iron River’s housing market is heating up in a quiet, steady way—and those who buy now may benefit the most in the long run.
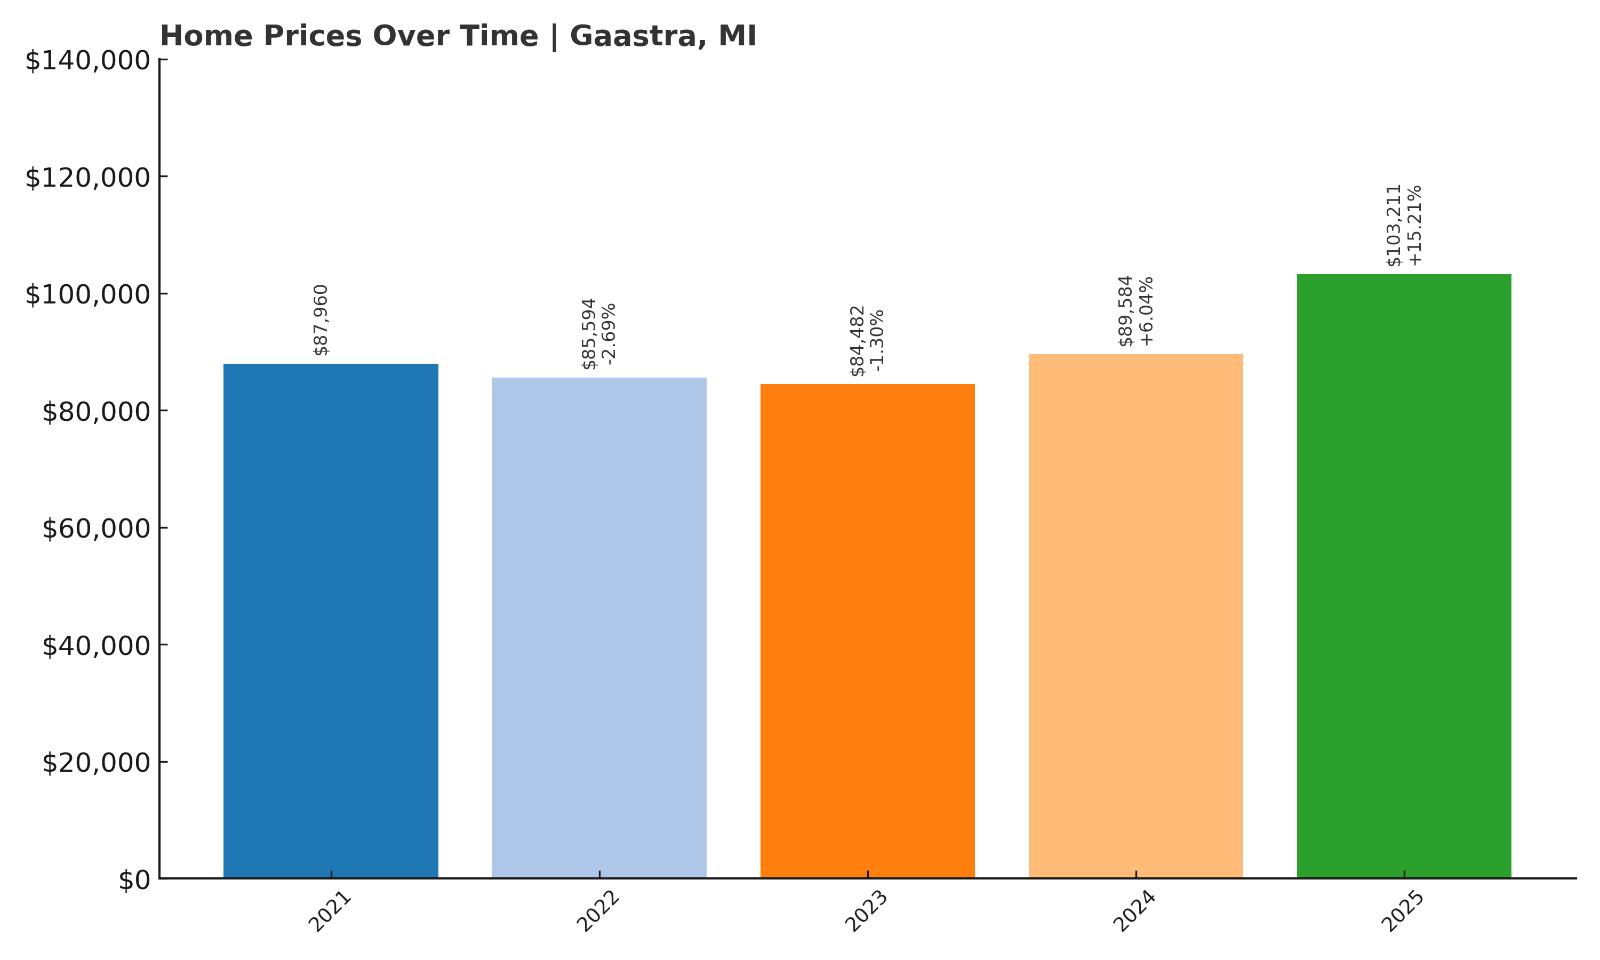
10. Gaastra – 17% Home Price Increase Since 2021
- 2010: N/A
- 2011: N/A
- 2012: N/A
- 2013: N/A
- 2014: N/A
- 2015: N/A
- 2016: N/A
- 2017: N/A
- 2018: N/A
- 2019: N/A
- 2020: N/A
- 2021: $87,960
- 2022: $85,594 (-$2,366, -2.69% from previous year)
- 2023: $84,482 (-$1,112, -1.30% from previous year)
- 2024: $89,584 (+$5,102, +6.04% from previous year)
- 2025: $103,211 (+$13,627, +15.21% from previous year)
Though Gaastra’s home value data begins only in 2021, prices have risen a solid 17% in that short window, climbing from $87,960 to $103,211 by 2025. After two years of slight decline in 2022 and 2023, the town’s housing market rebounded impressively, with prices jumping over 15% in the last recorded year. This rapid recovery pushed the town past the $100K average mark, signaling strong renewed demand. While limited data prevents long-term trend analysis, the recent spike may indicate increased interest from buyers looking beyond the more developed Upper Peninsula towns. Gaastra’s movement suggests it’s emerging from obscurity into a niche spot for affordable homeownership.
Gaastra – A Small Town With Big Potential
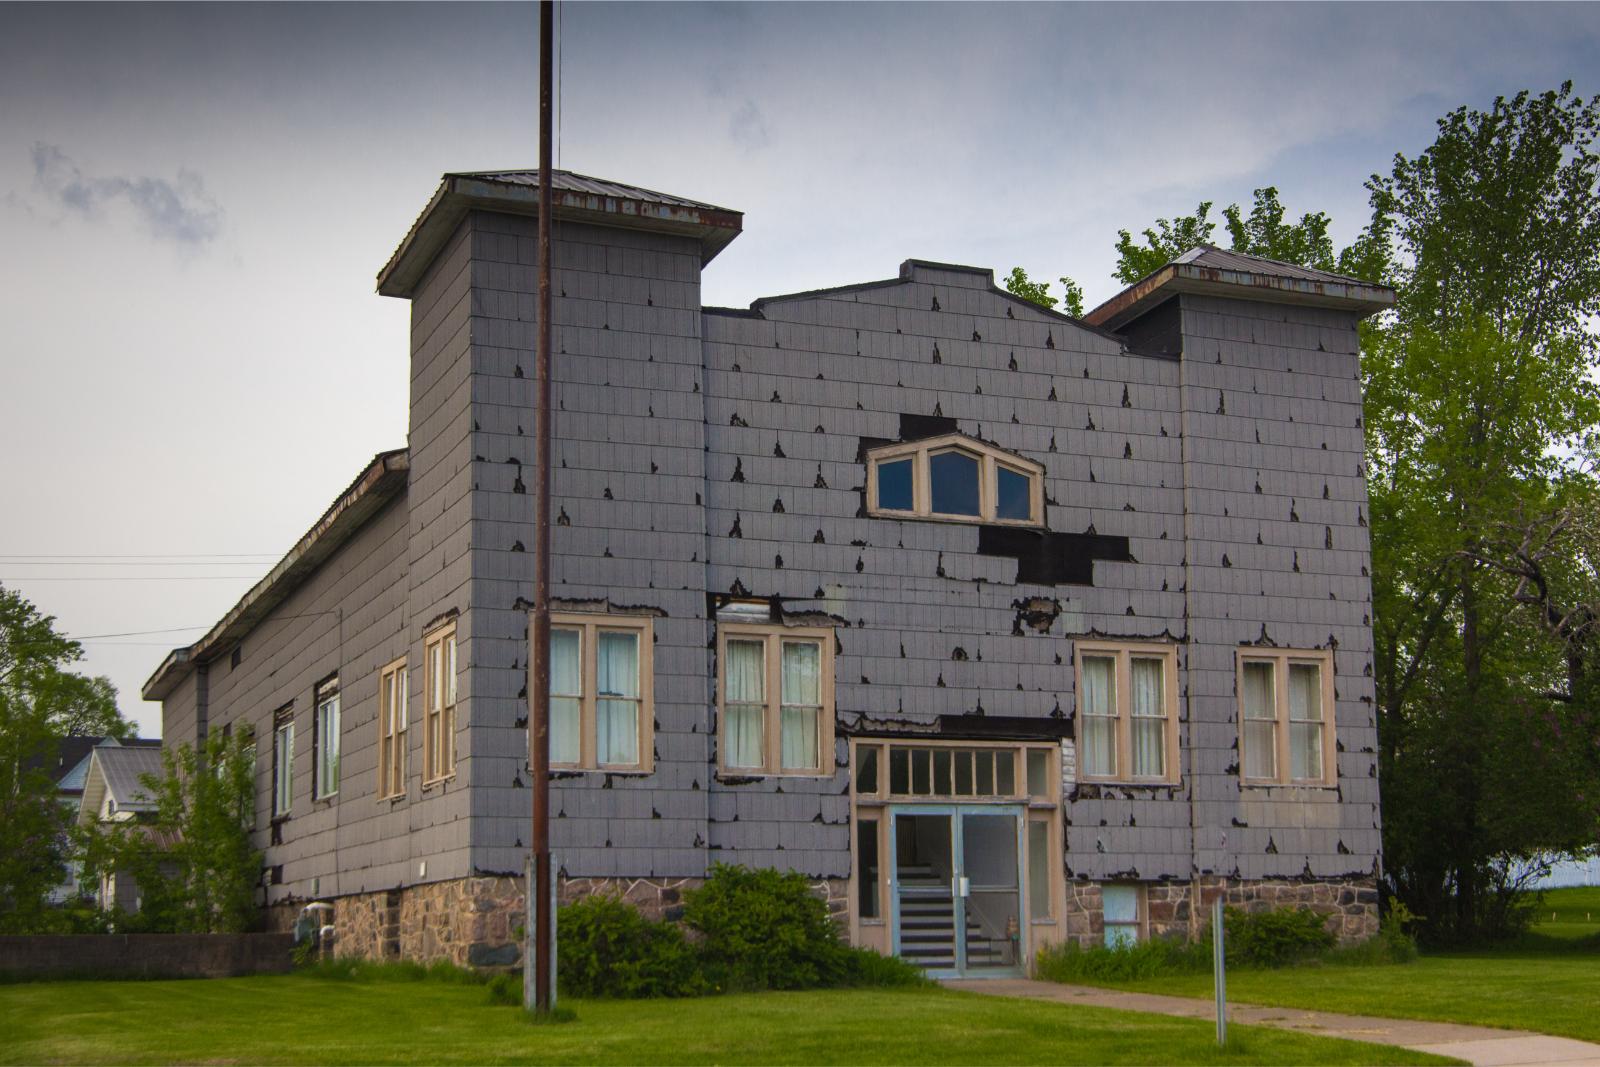
Gaastra is a tiny community tucked into Iron County in Michigan’s western Upper Peninsula. With a population under 400, it’s one of the smallest incorporated cities in the state. But what Gaastra lacks in size, it makes up for in affordability and access to the surrounding region’s natural beauty. It sits just a few miles from Iron River, allowing residents to take advantage of nearby services while enjoying an even quieter, more rural lifestyle. The limited housing stock keeps the real estate market relatively thin, but recent gains suggest that even these low-volume markets are seeing increased demand, especially from retirees and outdoor enthusiasts.
While the town itself doesn’t offer a large commercial core, its location is its biggest asset. Nearby lakes, trails, and campgrounds make it attractive for those looking for a slow-paced, nature-filled life. It’s also an option for budget-conscious buyers who can’t afford pricier homes in Iron River or Crystal Falls. As the Upper Peninsula gains traction with remote workers and investors, Gaastra may benefit from spillover interest. Though it’s still highly affordable compared to state averages, that could change if the recent growth streak continues.
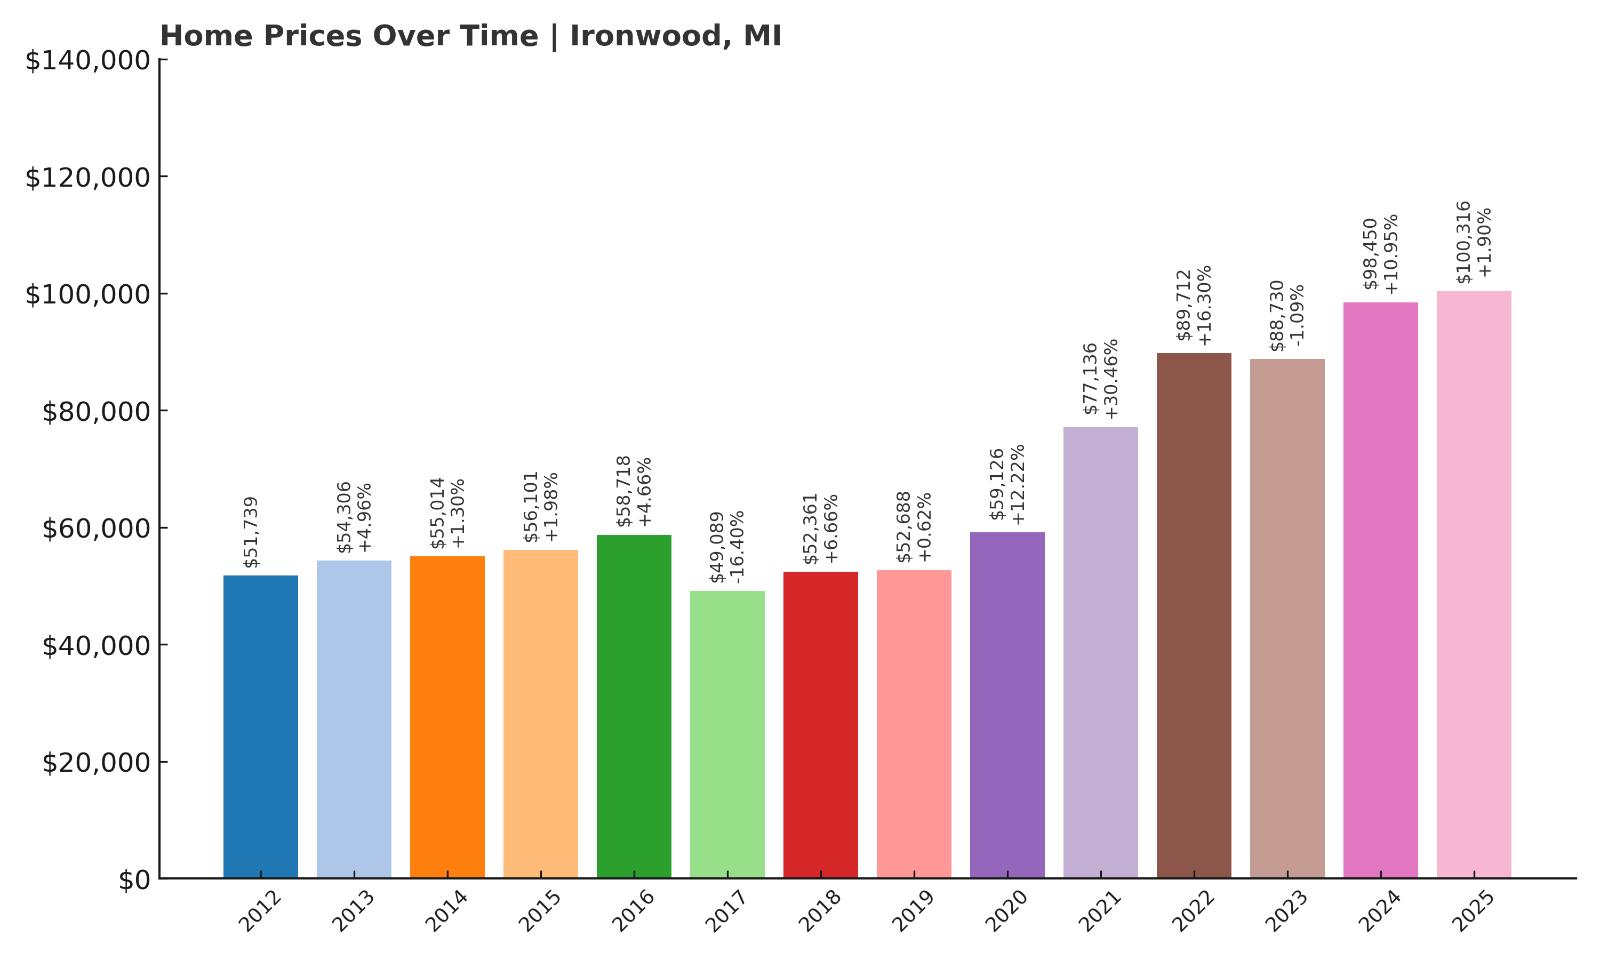
9. Ironwood – 94% Home Price Increase Since 2012
Would you like to save this?
- 2010: N/A
- 2011: N/A
- 2012: $51,739
- 2013: $54,306 (+$2,567, +4.96% from previous year)
- 2014: $55,014 (+$709, +1.30% from previous year)
- 2015: $56,101 (+$1,087, +1.98% from previous year)
- 2016: $58,718 (+$2,617, +4.66% from previous year)
- 2017: $49,089 (-$9,629, -16.40% from previous year)
- 2018: $52,361 (+$3,272, +6.66% from previous year)
- 2019: $52,688 (+$327, +0.62% from previous year)
- 2020: $59,126 (+$6,438, +12.22% from previous year)
- 2021: $77,136 (+$18,011, +30.46% from previous year)
- 2022: $89,712 (+$12,576, +16.30% from previous year)
- 2023: $88,730 (-$982, -1.09% from previous year)
- 2024: $98,450 (+$9,720, +10.95% from previous year)
- 2025: $100,316 (+$1,866, +1.90% from previous year)
Ironwood’s housing market has surged by 94% since 2012, with much of the growth occurring in the last five years. After a large dip in 2017, the market quickly rebounded and took off during the pandemic housing boom. The most dramatic jump came in 2021, when average prices rose over 30% in a single year. While the market cooled slightly in 2023, it resumed its climb in 2024 and has remained stable into 2025, with home values now just over $100,000. These patterns reflect rising demand for Upper Peninsula real estate and growing buyer interest in Ironwood’s unique blend of charm and affordability.
Ironwood – Outdoor Recreation and Steady Price Growth

Ironwood is located in Gogebic County at the far western tip of Michigan’s Upper Peninsula, bordering Wisconsin. It’s one of the U.P.’s more prominent towns and a well-known destination for winter sports, especially skiing and snowmobiling. Copper Peak, the western hemisphere’s largest ski flying hill, is just outside of town, drawing visitors and seasonal residents. With charming architecture, a small downtown, and proximity to both Porcupine Mountains and Lake Superior, Ironwood has a lot to offer for its size. These assets are now being reflected in its housing market, which has nearly doubled in value over the last decade.
In recent years, Ironwood has gained attention not only from tourists but also from remote workers and downstate transplants looking for a better quality of life. Its housing market offers a rare combination: livability, natural beauty, and homes still priced under the national average. Though inventory remains tight and seasonal fluctuations still affect demand, the price gains suggest long-term confidence in the area. If the region continues to attract new residents and second-home buyers, Ironwood could see even more appreciation in the coming years.
8. Kincheloe – 73% Home Price Increase Since 2012
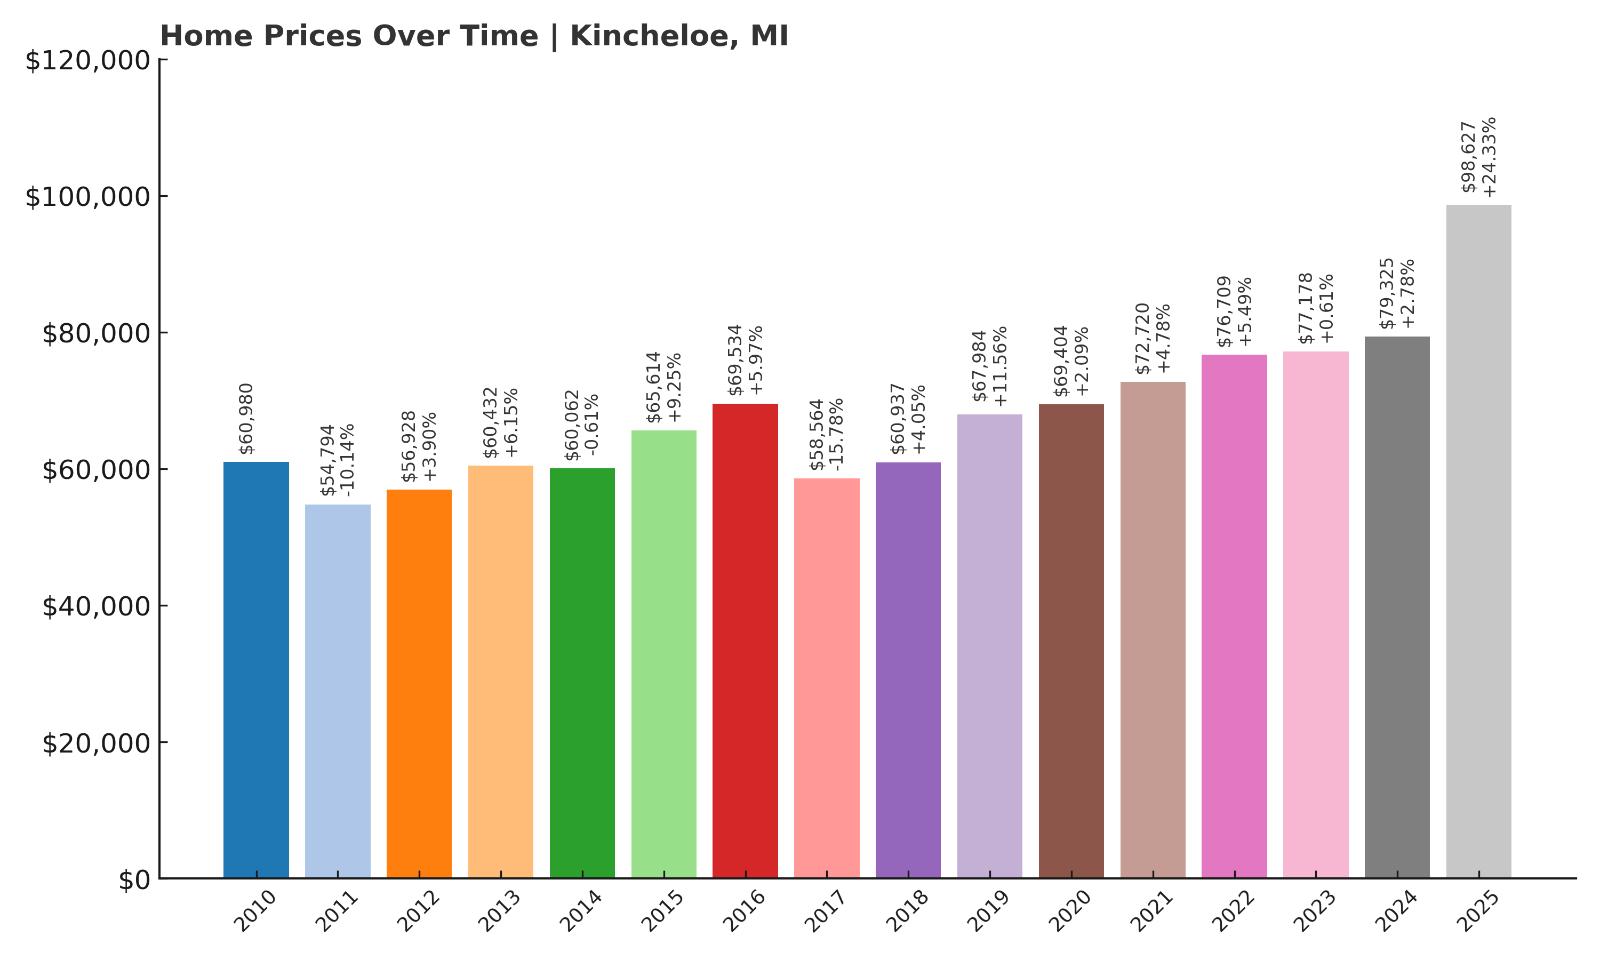
- 2010: $60,980
- 2011: $54,794 (-$6,186, -10.14% from previous year)
- 2012: $56,928 (+$2,135, +3.90% from previous year)
- 2013: $60,432 (+$3,504, +6.15% from previous year)
- 2014: $60,062 (-$371, -0.61% from previous year)
- 2015: $65,614 (+$5,553, +9.25% from previous year)
- 2016: $69,534 (+$3,920, +5.97% from previous year)
- 2017: $58,564 (-$10,970, -15.78% from previous year)
- 2018: $60,937 (+$2,373, +4.05% from previous year)
- 2019: $67,984 (+$7,047, +11.56% from previous year)
- 2020: $69,404 (+$1,420, +2.09% from previous year)
- 2021: $72,720 (+$3,316, +4.78% from previous year)
- 2022: $76,709 (+$3,989, +5.49% from previous year)
- 2023: $77,178 (+$469, +0.61% from previous year)
- 2024: $79,325 (+$2,147, +2.78% from previous year)
- 2025: $98,627 (+$19,302, +24.33% from previous year)
Kincheloe’s housing market has grown a substantial 73% since 2012, and its most impressive surge occurred just in the past year—between 2024 and 2025—when average prices jumped by more than $19,000 in one leap. Though the town saw setbacks in 2017, prices steadily climbed again after that dip, reflecting a longer-term trend of gradual but sustained appreciation. For nearly a decade, annual increases hovered between 2% and 11%, but the recent acceleration suggests a spike in buyer interest or local development. The sharp uptick in 2025 could be a sign of significant market movement or infrastructure changes that have made the area more attractive. This kind of price behavior is typical of smaller towns that experience a sudden influx of demand, whether from new residents, investors, or a changing local economy. What’s clear is that Kincheloe is no longer coasting quietly—its housing data shows upward pressure that could signal a shift in its real estate future. Even with a 2025 average of under $100,000, the pace of change implies that this window of affordability may not stay open for long. Buyers seeking a foothold in the eastern Upper Peninsula might want to take notice while prices are still relatively accessible.
Kincheloe – A Quiet Community Poised for Change
Kincheloe is located in Chippewa County in Michigan’s eastern Upper Peninsula, just south of Sault Ste. Marie and the Canadian border. Once a former Air Force base town, the area still bears signs of its military past, with large lots, barrack-style homes, and grid-like neighborhood planning. Today, it’s largely residential and remarkably quiet, with a sparse commercial presence and a tight-knit local population. The nearby Chippewa County International Airport and several correctional facilities provide local employment, and its relative proximity to Lake Superior and the Soo Locks makes it a surprising hub for budget-conscious families, retirees, and workers commuting to larger towns nearby. Unlike tourist-heavy U.P. markets, Kincheloe has remained under the radar, but its affordability and infrastructure make it ripe for rediscovery.
There’s a unique calm to Kincheloe that appeals to people looking for a practical, no-frills lifestyle. Homes here are often priced significantly below the state average, yet offer more square footage and land than many properties in suburban Michigan. The recent surge in home prices may reflect renewed interest from buyers priced out of more well-known towns, or perhaps from remote workers seeking solitude and affordability. With its strong road access, rural character, and quiet growth, Kincheloe is positioned as a sleeper market that could continue to draw attention in the coming years. Though development remains minimal for now, even small shifts in demand can transform a market like this—and recent price data suggests it’s already happening.
7. Ecorse – 352% Home Price Increase Since 2013
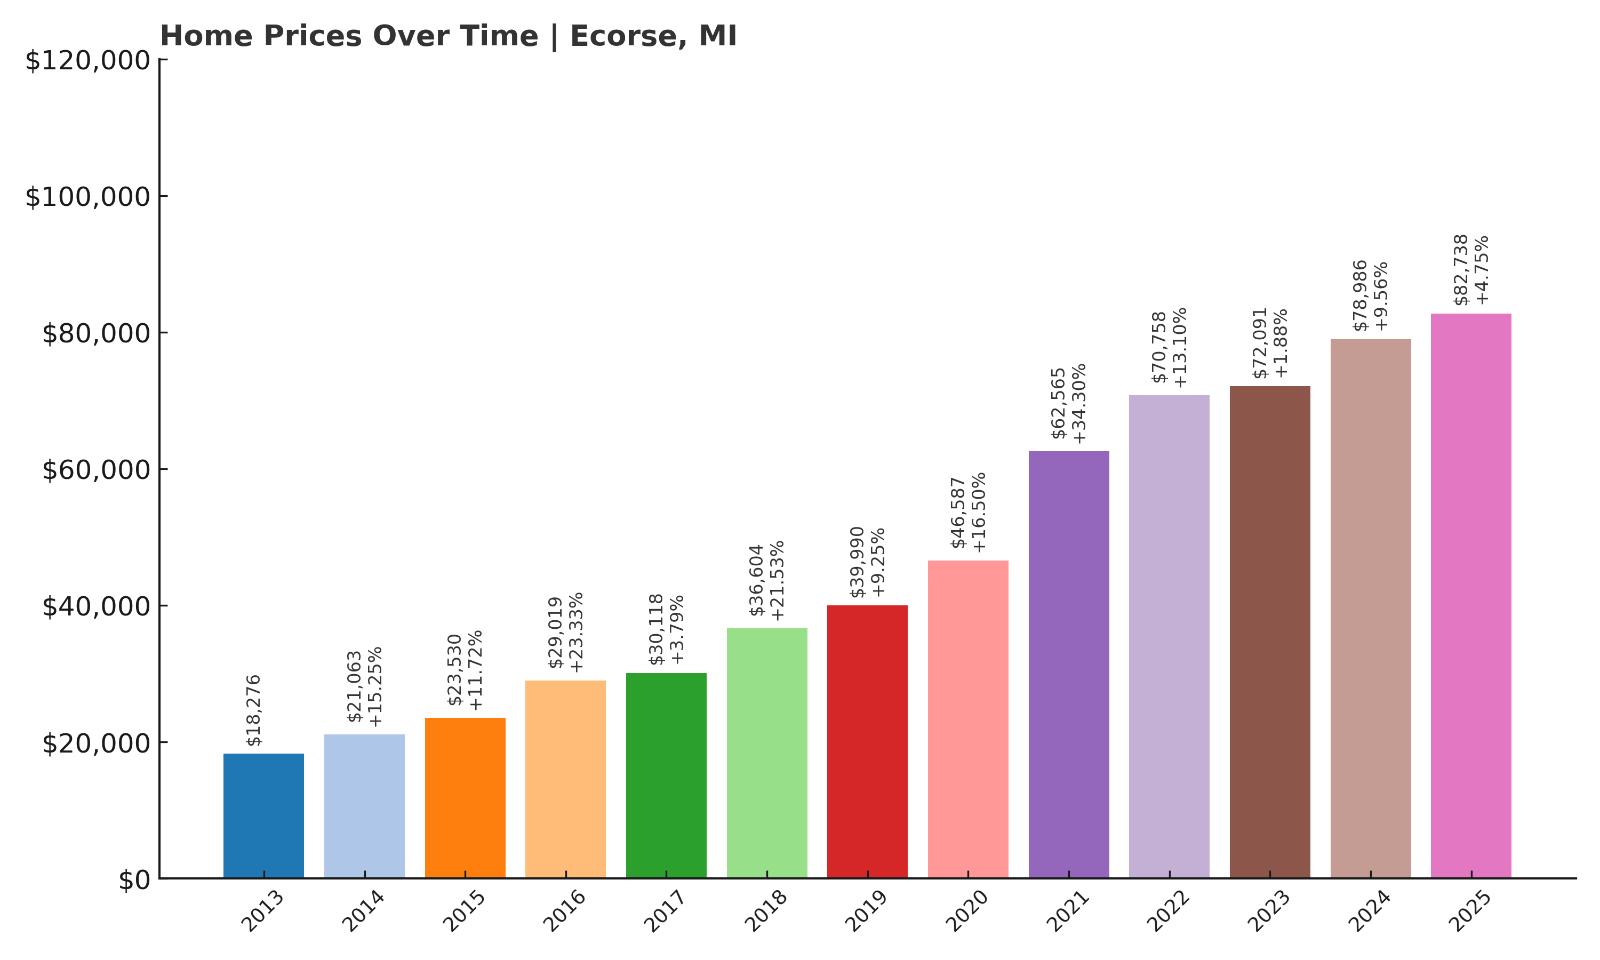
- 2010: N/A
- 2011: N/A
- 2012: N/A
- 2013: $18,276
- 2014: $21,063 (+$2,787, +15.25% from previous year)
- 2015: $23,530 (+$2,468, +11.72% from previous year)
- 2016: $29,019 (+$5,489, +23.33% from previous year)
- 2017: $30,118 (+$1,099, +3.79% from previous year)
- 2018: $36,604 (+$6,486, +21.53% from previous year)
- 2019: $39,990 (+$3,386, +9.25% from previous year)
- 2020: $46,587 (+$6,597, +16.50% from previous year)
- 2021: $62,565 (+$15,978, +34.30% from previous year)
- 2022: $70,758 (+$8,193, +13.10% from previous year)
- 2023: $72,091 (+$1,333, +1.88% from previous year)
- 2024: $78,986 (+$6,895, +9.56% from previous year)
- 2025: $82,738 (+$3,752, +4.75% from previous year)
Ecorse’s housing market has experienced an eye-catching 352% increase in home values since 2013. From an average price of just $18,276 in 2013, values have climbed to $82,738 in 2025—a dramatic transformation by any measure. This growth hasn’t been a one-year wonder either. The town has seen consistent year-over-year increases, with especially sharp jumps between 2016 and 2022. The gains reflect a decade of steady buyer interest, redevelopment, and spillover demand from Detroit’s revitalizing housing market. Even with prices rising so significantly, Ecorse remains one of the more affordable towns along the Detroit River. That combination of accessibility, proximity, and value continues to attract new residents, first-time buyers, and even investors seeking properties that can appreciate in the long term. Though the largest spikes may be behind it, Ecorse’s long-term upward trend is likely to continue.
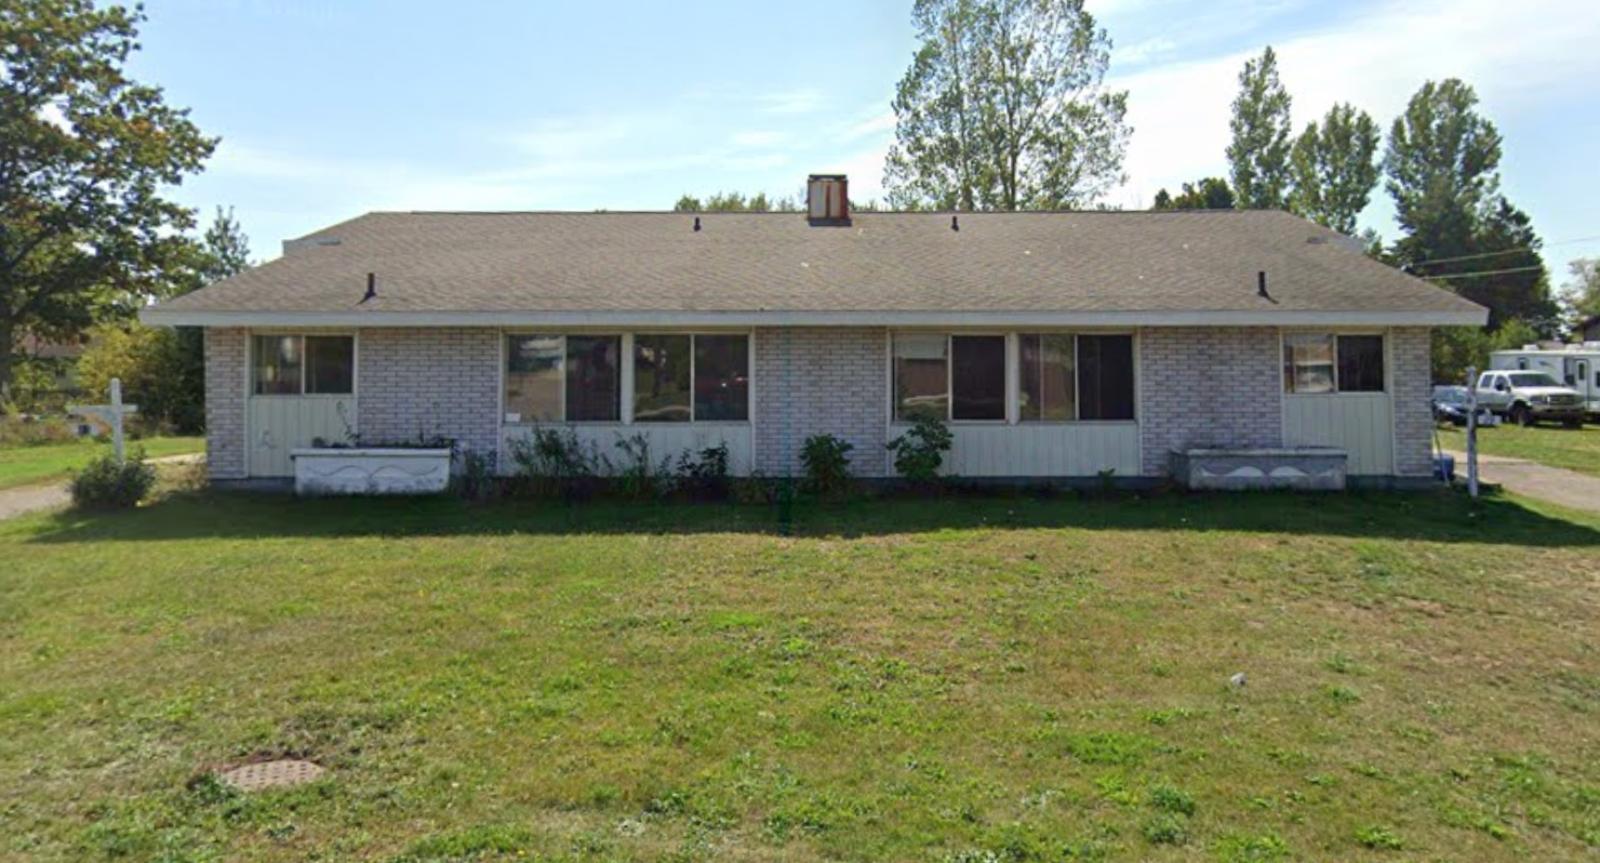
Ecorse – From Industrial Past to Affordable Future
Ecorse sits along the banks of the Detroit River in Wayne County, directly south of Detroit proper. Once heavily industrial, the town has slowly transitioned into a quiet residential enclave with historic homes, modest commercial corridors, and a working-class identity. While still facing economic headwinds, Ecorse has benefitted from its location—close to downtown Detroit, major highways, and the growing Downriver suburbs. This geographic advantage has made it appealing to buyers priced out of Dearborn, Lincoln Park, or other nearby markets. Improvements in city infrastructure, investments in riverfront beautification, and the broader economic recovery in southeast Michigan have all helped raise Ecorse’s housing profile.
The town’s housing stock consists mostly of small bungalows and ranch-style homes built in the mid-20th century. While many homes require renovation, the relatively low price point makes that investment feasible for both owners and landlords. Its schools and municipal services are improving slowly, and the town’s sense of community remains strong. For those seeking affordable homeownership within reach of metro Detroit’s job markets, Ecorse presents a compelling case. The price gains over the past decade are a sign that others have started to take notice, too. Though not without its challenges, Ecorse is quietly shedding its industrial image and becoming a viable, budget-friendly housing destination for a new generation of residents.
6. River Rouge – 321% Home Price Increase Since 2012
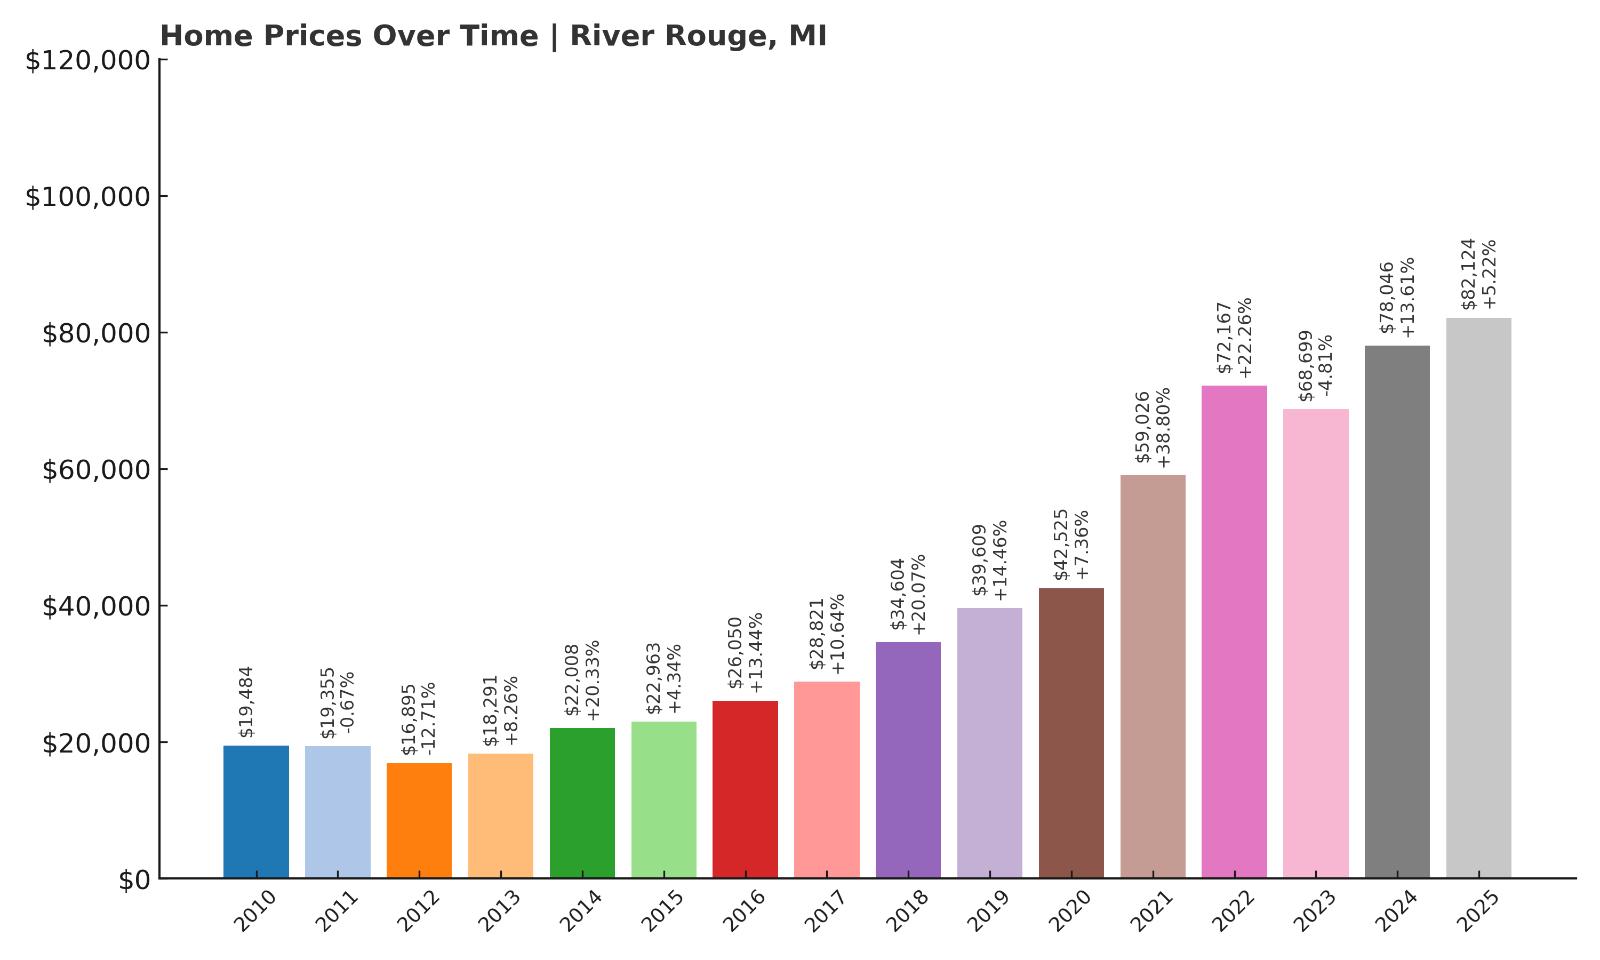
- 2010: $19,484
- 2011: $19,355 (-$130, -0.67% from previous year)
- 2012: $16,895 (-$2,459, -12.71% from previous year)
- 2013: $18,291 (+$1,395, +8.26% from previous year)
- 2014: $22,008 (+$3,718, +20.33% from previous year)
- 2015: $22,963 (+$954, +4.34% from previous year)
- 2016: $26,050 (+$3,087, +13.44% from previous year)
- 2017: $28,821 (+$2,771, +10.64% from previous year)
- 2018: $34,604 (+$5,783, +20.07% from previous year)
- 2019: $39,609 (+$5,005, +14.46% from previous year)
- 2020: $42,525 (+$2,916, +7.36% from previous year)
- 2021: $59,026 (+$16,501, +38.80% from previous year)
- 2022: $72,167 (+$13,141, +22.26% from previous year)
- 2023: $68,699 (-$3,468, -4.81% from previous year)
- 2024: $78,046 (+$9,348, +13.61% from previous year)
- 2025: $82,124 (+$4,078, +5.22% from previous year)
River Rouge has seen a staggering 321% increase in home prices since 2012, going from $16,895 to $82,124 in just over a decade. The most dramatic growth began around 2016, and the pace accelerated sharply during the pandemic-era housing boom. Even after a modest decline in 2023, the market rebounded strongly, adding nearly $14,000 over the next two years. The long-term trend is unmistakable—River Rouge is transforming. These numbers reflect more than just real estate fluctuations; they point to a growing demand for affordable housing near Detroit and a newfound interest in once-overlooked neighborhoods. With prices now firmly above $80,000, the town is no longer a bargain basement option, but it still offers strong value compared to regional norms. Buyers who entered the market five or ten years ago have seen impressive equity gains, and new buyers are likely to find it still relatively affordable with room to grow.
River Rouge – Urban Edge With Affordable Appeal
Bordering Detroit along the Detroit River, River Rouge has an industrial past that’s deeply tied to the shipping, steel, and automotive industries. The town is home to Zug Island and parts of the Ford Rouge Complex, long symbols of Michigan’s manufacturing might. For decades, this association kept housing demand low. But in recent years, River Rouge has begun a quiet reinvention. As prices in Detroit and Dearborn have soared, this small city has attracted renewed attention. While it’s still gritty in parts, there are signs of revitalization: community cleanups, new housing renovations, and increased interest from first-time buyers and investors. Its location—within 15 minutes of downtown Detroit—makes it particularly appealing to commuters who want to own rather than rent.
River Rouge’s housing stock includes modest brick homes, vintage bungalows, and fixer-uppers priced well below surrounding areas. Public transportation links and improved public safety have helped its image, and the city’s riverfront location offers long-term potential for redevelopment. Though it’s still early in the town’s evolution, the housing numbers suggest that River Rouge has already turned a corner. For buyers with vision and a willingness to invest in a transitioning neighborhood, it remains one of the last places in metro Detroit where affordable homeownership is still within reach.
5. Muskegon Heights – 140% Home Price Increase Since 2012
- 2010: $34,421
- 2011: $33,912 (-$509, -1.48% from previous year)
- 2012: $25,946 (-$7,966, -23.49% from previous year)
- 2013: $26,279 (+$333, +1.29% from previous year)
- 2014: $28,820 (+$2,541, +9.67% from previous year)
- 2015: $29,598 (+$777, +2.70% from previous year)
- 2016: $31,014 (+$1,416, +4.78% from previous year)
- 2017: $35,034 (+$4,020, +12.96% from previous year)
- 2018: $41,088 (+$6,054, +17.28% from previous year)
- 2019: $45,866 (+$4,778, +11.63% from previous year)
- 2020: $46,739 (+$873, +1.90% from previous year)
- 2021: $60,706 (+$13,967, +29.88% from previous year)
- 2022: $76,120 (+$15,414, +25.39% from previous year)
- 2023: $73,782 (-$2,339, -3.07% from previous year)
- 2024: $79,517 (+$5,735, +7.77% from previous year)
- 2025: $81,125 (+$1,608, +2.02% from previous year)
Muskegon Heights has witnessed a dramatic turnaround in its housing market, with prices soaring 140% since 2012. Once grappling with steep declines in the early 2010s, the city began a slow recovery that gained speed from 2017 onward. The period between 2020 and 2022 was particularly explosive, with back-to-back double-digit growth years pushing values from the mid-$40Ks to well over $75K. Although prices dipped in 2023, they resumed their upward climb in the years that followed, landing at $81,125 in 2025. These movements reflect both long-term investor interest and short-term affordability demand. For buyers priced out of nearby Muskegon or even Grand Rapids, Muskegon Heights continues to offer one of the lowest entry points into Michigan’s urban housing market—though that window is closing fast.
Muskegon Heights – Affordable Living by Lake Michigan
Muskegon Heights is a city with grit, history, and a growing sense of purpose. Nestled near the shores of Lake Michigan, it offers proximity to Muskegon’s waterfront attractions and marinas without the hefty price tag. While the city has faced challenges related to crime, schools, and disinvestment, its location and improving infrastructure are undeniable assets. Over the past several years, community-led revitalization efforts and external investment have begun to reshape parts of the city. Homebuyers are discovering that what was once a tough sell is now an affordable alternative near the lake, especially as prices in surrounding towns increase.
The housing stock in Muskegon Heights includes older single-family homes, many of which feature large lots and walkable access to local amenities. The area appeals to both investors and first-time buyers looking to stretch their dollars. With its access to Muskegon Lake, highways, and a growing regional economy, Muskegon Heights is poised for continued growth. It’s still one of the most affordable options in coastal Michigan, but the price trajectory over the last few years suggests it may not be for long. The data clearly points to a market in motion, not one in decline.
4. Detroit – 206% Home Price Increase Since 2012
- 2010: $25,524
- 2011: $22,598 (-$2,926, -11.46% from previous year)
- 2012: $19,447 (-$3,151, -13.94% from previous year)
- 2013: $21,014 (+$1,566, +8.05% from previous year)
- 2014: $24,343 (+$3,330, +15.84% from previous year)
- 2015: $28,178 (+$3,835, +15.75% from previous year)
- 2016: $32,999 (+$4,821, +17.11% from previous year)
- 2017: $34,219 (+$1,220, +3.70% from previous year)
- 2018: $41,164 (+$6,945, +20.30% from previous year)
- 2019: $49,167 (+$8,003, +19.44% from previous year)
- 2020: $53,680 (+$4,513, +9.18% from previous year)
- 2021: $69,732 (+$16,052, +29.90% from previous year)
- 2022: $81,977 (+$12,245, +17.56% from previous year)
- 2023: $74,936 (-$7,041, -8.59% from previous year)
- 2024: $78,020 (+$3,084, +4.12% from previous year)
- 2025: $78,746 (+$726, +0.93% from previous year)
Detroit’s recovery story is best told through its housing data. Since bottoming out in 2012 at just $19,447, home values have risen over 206%, reaching nearly $79,000 in 2025. The most dramatic gains happened between 2015 and 2022, when a combination of urban renewal, population inflows, and institutional investment fueled the sharpest rise in the city’s modern history. Despite a cooling period in 2023, the market quickly stabilized, showing small but positive growth into 2025. What once symbolized urban decline is now slowly being reshaped into one of the country’s most talked-about real estate revivals.
Detroit – The Motor City’s Housing Market Keeps Moving
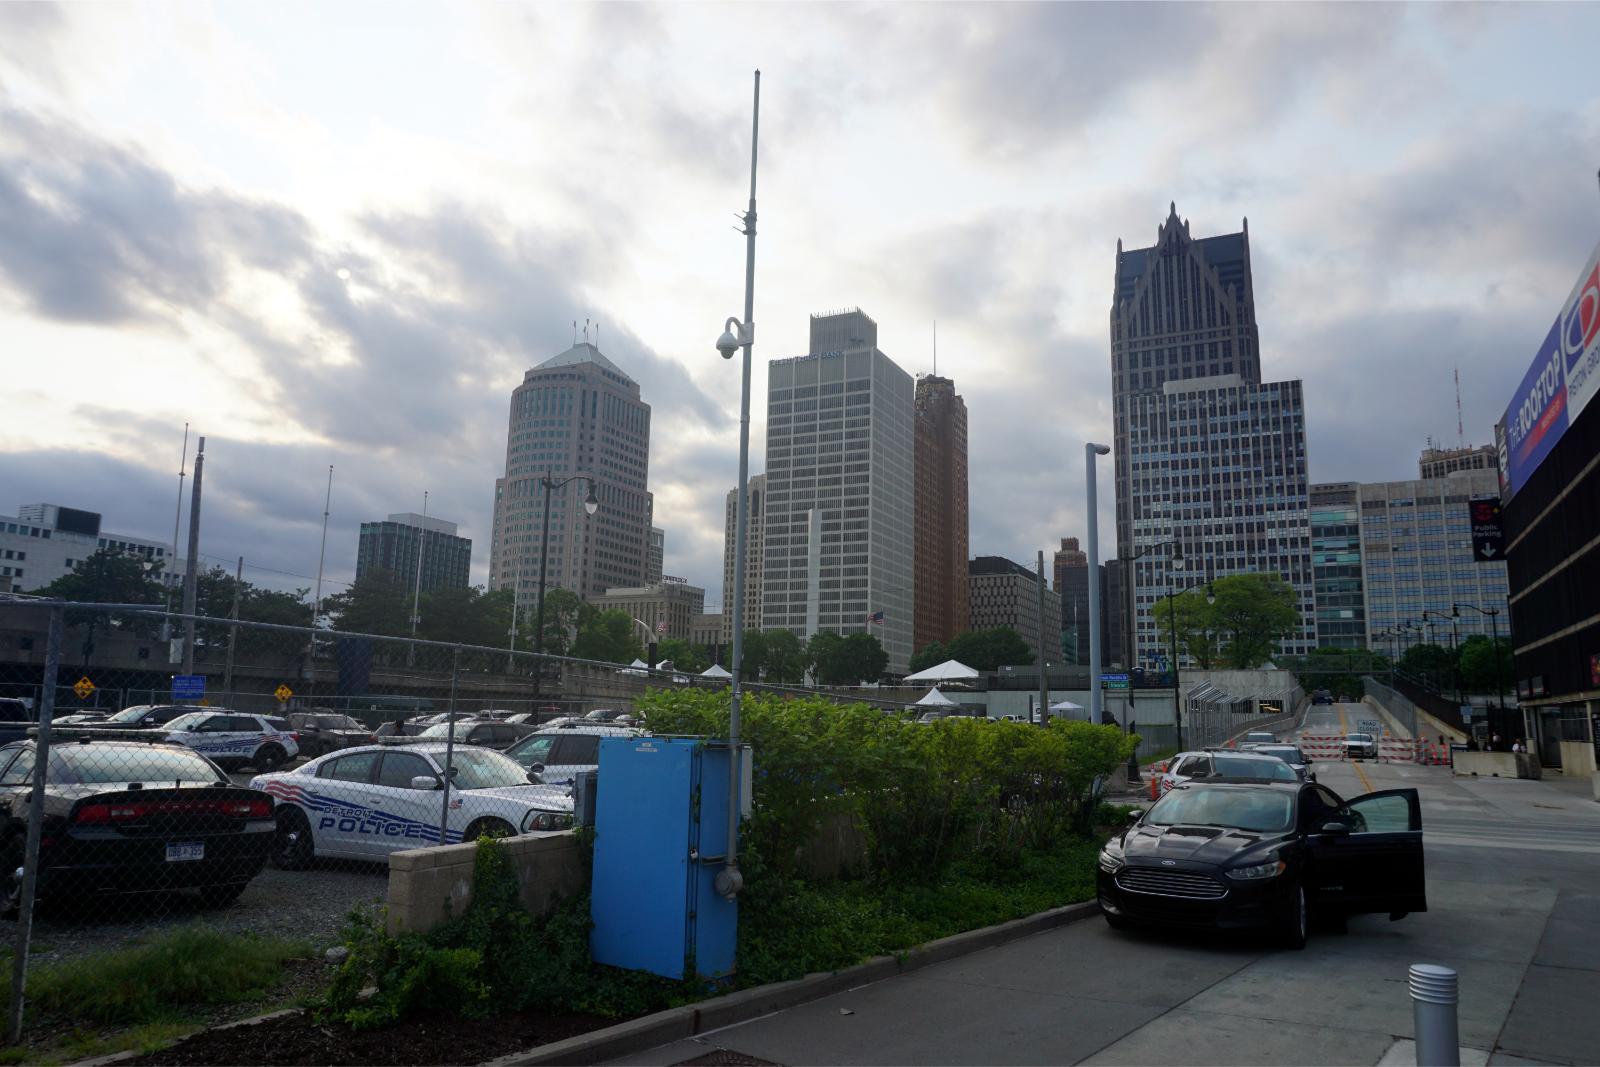
Detroit’s trajectory has shifted dramatically over the past decade. Once marked by massive vacancies and rock-bottom home values, the city is now a magnet for developers, entrepreneurs, and new residents seeking opportunity and space. While some neighborhoods remain distressed, others—like Corktown, Midtown, and parts of the East Side—are seeing active renovation, new construction, and vibrant small business growth. The city’s affordable housing stock, coupled with job creation and expanding public transit options, has made it one of the most promising urban markets for long-term growth in the Midwest.
Despite its dramatic price growth, Detroit still ranks among the most affordable major cities in the U.S., and that’s a big part of its appeal. Buyers can find everything from historic homes in revitalized districts to fixer-uppers in need of vision and elbow grease. With support from both public and private sectors, Detroit’s real estate rebound seems far from over. The current price level still offers significant upside for buyers willing to bet on continued momentum and community-driven progress.
3. Silverwood – 60% Home Price Decrease Since 2010
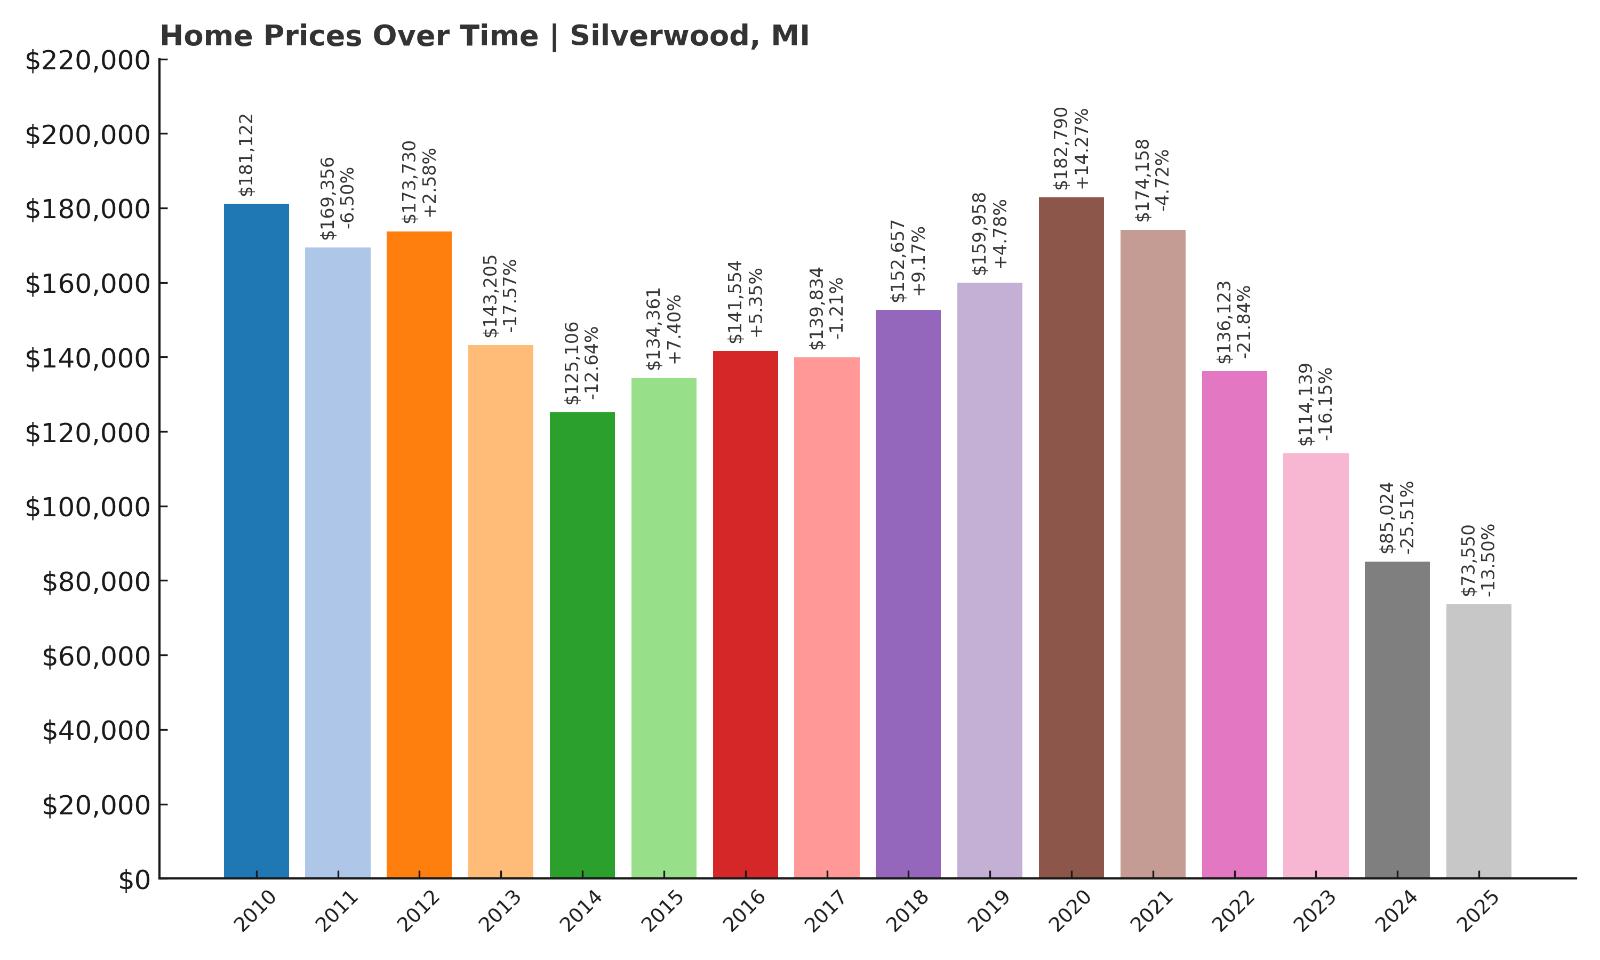
- 2010: $181,122
- 2011: $169,356 (-$11,767, -6.50% from previous year)
- 2012: $173,730 (+$4,374, +2.58% from previous year)
- 2013: $143,205 (-$30,525, -17.57% from previous year)
- 2014: $125,106 (-$18,099, -12.64% from previous year)
- 2015: $134,361 (+$9,255, +7.40% from previous year)
- 2016: $141,554 (+$7,192, +5.35% from previous year)
- 2017: $139,834 (-$1,719, -1.21% from previous year)
- 2018: $152,657 (+$12,823, +9.17% from previous year)
- 2019: $159,958 (+$7,301, +4.78% from previous year)
- 2020: $182,790 (+$22,832, +14.27% from previous year)
- 2021: $174,158 (-$8,632, -4.72% from previous year)
- 2022: $136,123 (-$38,035, -21.84% from previous year)
- 2023: $114,139 (-$21,984, -16.15% from previous year)
- 2024: $85,024 (-$29,116, -25.51% from previous year)
- 2025: $73,550 (-$11,474, -13.50% from previous year)
Silverwood stands out as an anomaly in this list—not because prices soared, but because they plummeted. Since 2010, home values have dropped by an astonishing 60%, falling from over $181,000 to just $73,550 in 2025. Most of the collapse occurred after 2021, with three consecutive years of double-digit declines wiping out much of the market’s previous gains. It’s a pattern that suggests deep underlying challenges: shrinking demand, out-migration, or collapsing investment confidence. Whatever the reasons, Silverwood is no longer a high-priced outlier—it’s now one of the most affordable markets in the state, and not by choice.
Silverwood – From Highs to Lows in Michigan’s Thumb Region
Silverwood is a small, rural community located in Michigan’s Thumb region, straddling Lapeer and Tuscola counties. Its economy is largely agricultural, and the town lacks major commercial infrastructure or industry. For years, it had a surprisingly high average home value—likely skewed by a limited housing stock and larger rural properties. But the recent freefall in prices points to a declining market with fewer buyers and little turnover. The sharp drop since 2022 suggests a correction, possibly due to reduced interest in second homes or agricultural land, which can inflate averages in low-volume towns like this.
Silverwood’s affordability is undeniable, but the declining trend makes it risky. Still, for buyers interested in land, quiet living, or bargain property investment, it could offer a rare opportunity. The market’s future depends on local economic stability and whether new buyers are willing to take a chance. As it stands, Silverwood is no longer a high-priced mystery—it’s a reminder that not all housing markets are on the rise.
2. Flint – 166% Home Price Increase Since 2012
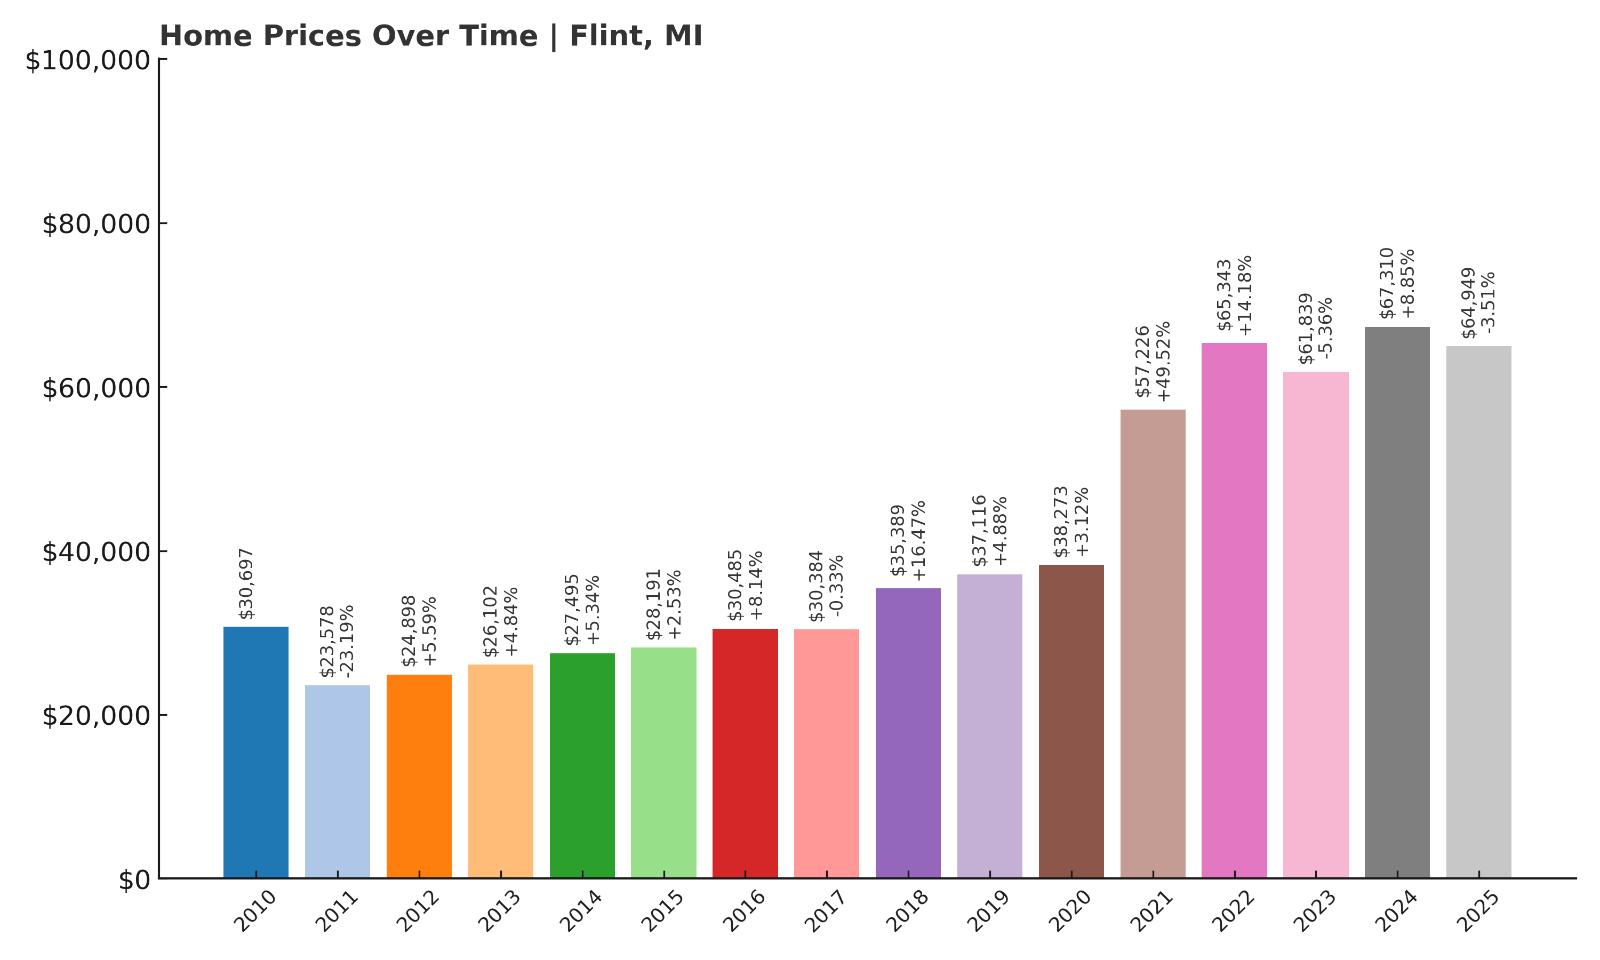
- 2010: $30,697
- 2011: $23,578 (-$7,119, -23.19% from previous year)
- 2012: $24,898 (+$1,319, +5.59% from previous year)
- 2013: $26,102 (+$1,204, +4.84% from previous year)
- 2014: $27,495 (+$1,393, +5.34% from previous year)
- 2015: $28,191 (+$696, +2.53% from previous year)
- 2016: $30,485 (+$2,295, +8.14% from previous year)
- 2017: $30,384 (-$102, -0.33% from previous year)
- 2018: $35,389 (+$5,005, +16.47% from previous year)
- 2019: $37,116 (+$1,727, +4.88% from previous year)
- 2020: $38,273 (+$1,157, +3.12% from previous year)
- 2021: $57,226 (+$18,953, +49.52% from previous year)
- 2022: $65,343 (+$8,116, +14.18% from previous year)
- 2023: $61,839 (-$3,504, -5.36% from previous year)
- 2024: $67,310 (+$5,472, +8.85% from previous year)
- 2025: $64,949 (-$2,361, -3.51% from previous year)
Flint has seen a 166% rise in home values since 2012, with prices growing from under $25,000 to nearly $65,000 in 2025. That journey hasn’t been smooth—growth has come in fits and starts, and recent years have brought some backsliding. But overall, the trajectory is one of recovery. After a particularly strong jump in 2021, prices moderated but remained elevated. The city’s low baseline has long attracted investors and risk-tolerant buyers, and the recent data shows that the gamble has paid off for many.
Flint – Rebuilding a Market With Deep Roots
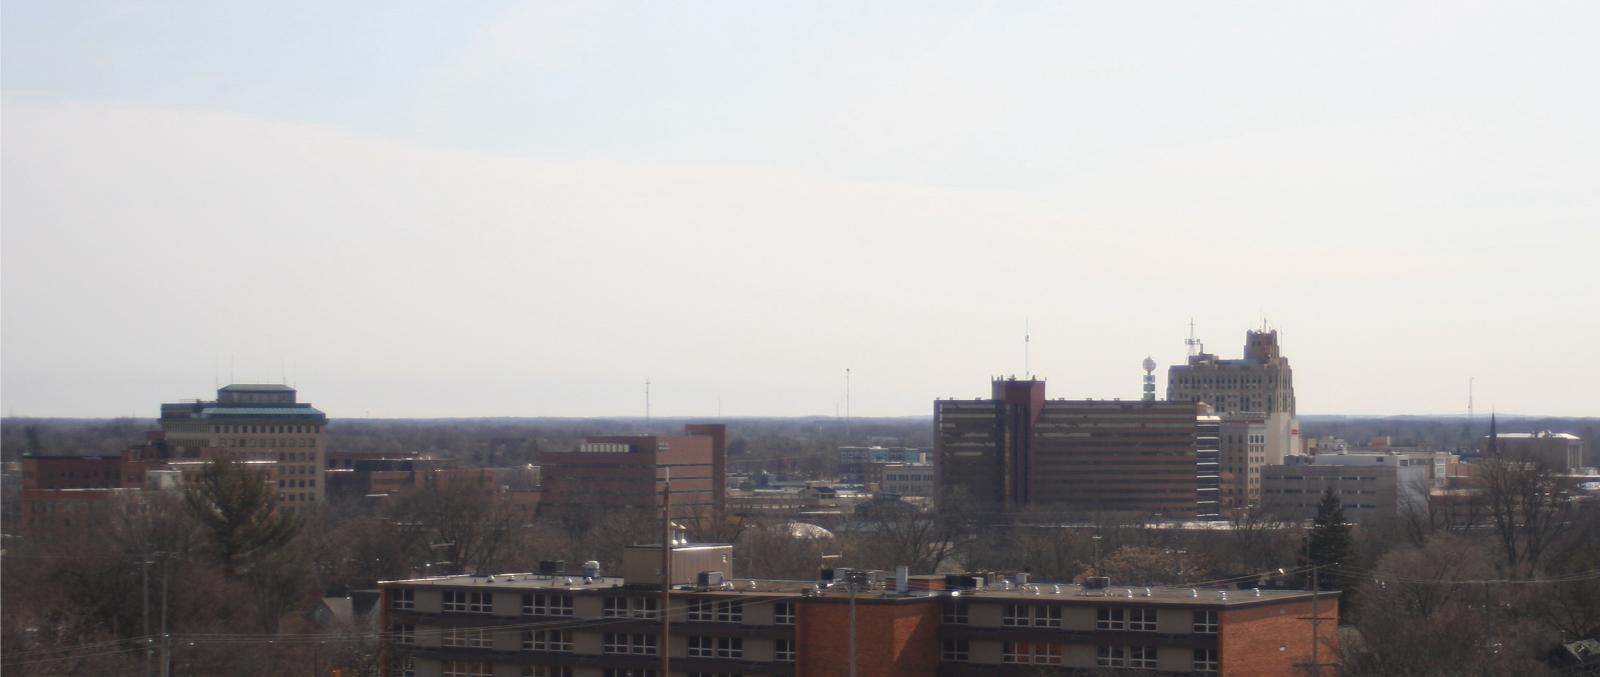
Flint’s story is complex. Devastated by deindustrialization and then further shaken by a public health crisis, the city has spent the past decade attempting to stabilize and rebuild. Despite its well-known struggles, the city is full of vibrant communities, historic housing, and an enduring cultural backbone. In recent years, downtown Flint has seen new businesses, education partnerships, and housing investments, particularly from institutions like the University of Michigan-Flint and local nonprofits. That renewed focus is part of what’s helped boost prices across the city.
Affordability remains Flint’s key selling point, and for many first-time buyers, it’s one of the only metro areas in the country where homeownership is still realistic. Flint isn’t without risk, but the price recovery shows signs of resiliency and progress. In a state where real estate is often driven by proximity to lakes or high-end suburban amenities, Flint proves that value also lies in persistence and reinvention.
1. Beecher – 154% Home Price Increase Since 2014
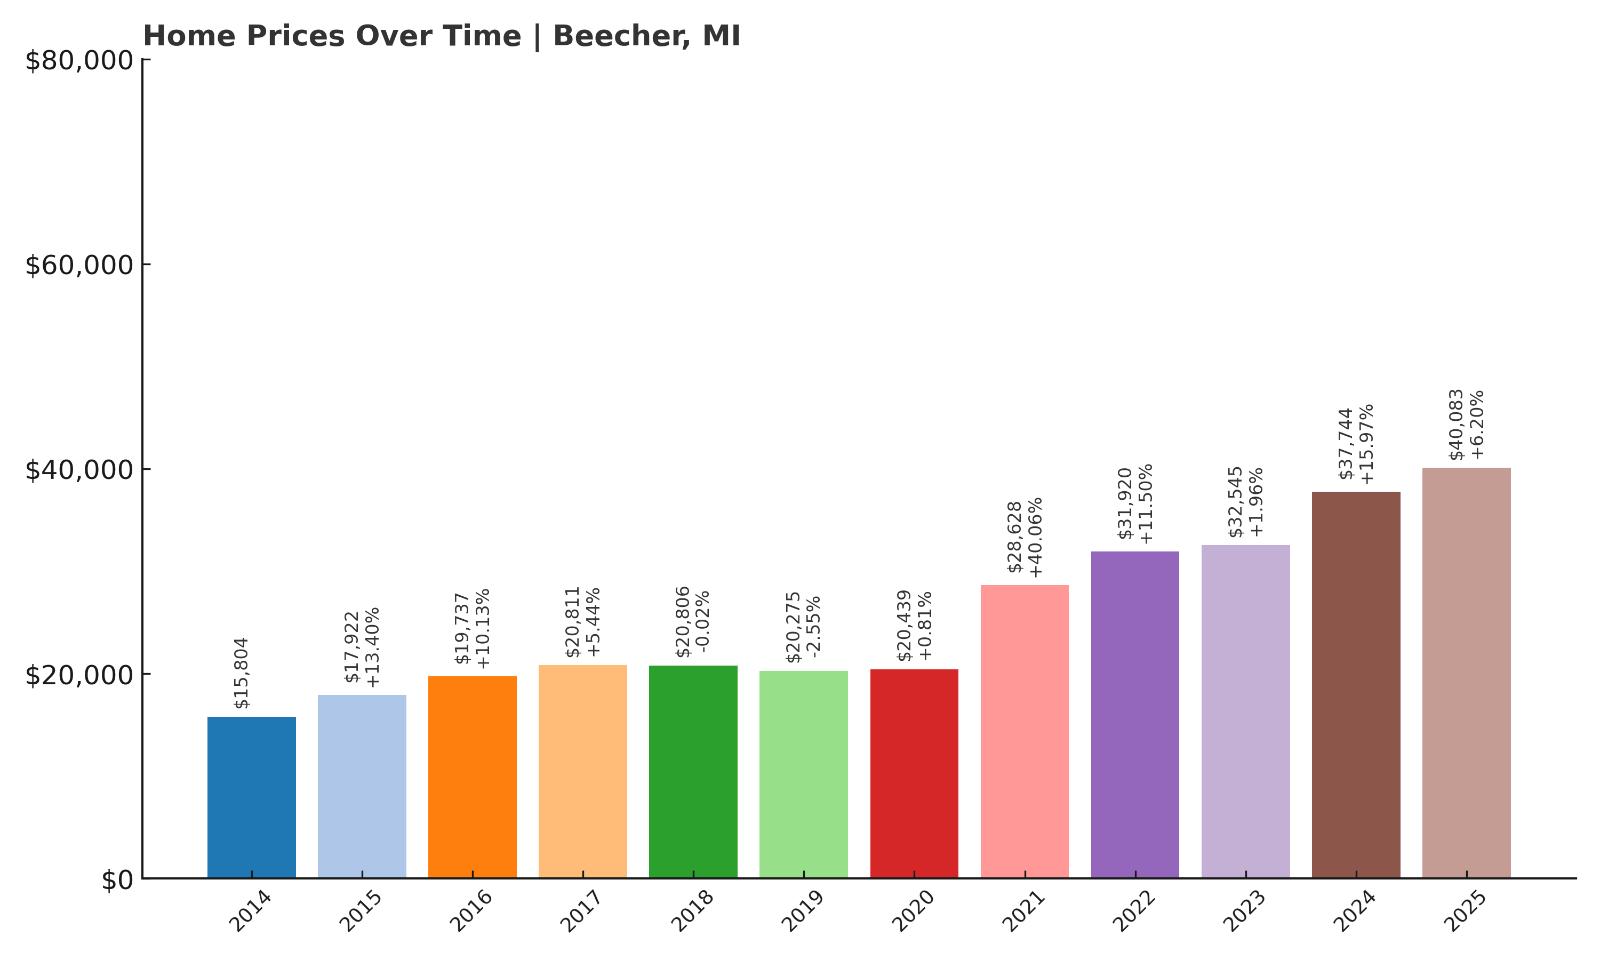
- 2010: N/A
- 2011: N/A
- 2012: N/A
- 2013: N/A
- 2014: $15,804
- 2015: $17,922 (+$2,118, +13.40% from previous year)
- 2016: $19,737 (+$1,815, +10.13% from previous year)
- 2017: $20,811 (+$1,074, +5.44% from previous year)
- 2018: $20,806 (-$5, -0.02% from previous year)
- 2019: $20,275 (-$531, -2.55% from previous year)
- 2020: $20,439 (+$165, +0.81% from previous year)
- 2021: $28,628 (+$8,189, +40.06% from previous year)
- 2022: $31,920 (+$3,291, +11.50% from previous year)
- 2023: $32,545 (+$626, +1.96% from previous year)
- 2024: $37,744 (+$5,198, +15.97% from previous year)
- 2025: $40,083 (+$2,339, +6.20% from previous year)
Beecher takes the top spot on this list with a 154% price increase since 2014. Though starting from a low base of just $15,804, its market has consistently appreciated year after year. Despite minor setbacks in 2018 and 2019, prices took off in 2021 and have remained on an upward trajectory since. In 2025, the average home value reached $40,083—still one of the lowest in the state, but far from its previous lows. The town’s growth signals increasing interest from buyers who want to enter the housing market affordably while seeing their investment appreciate steadily.
Beecher – Small Prices, Steady Growth
Beecher is a census-designated place just north of Flint, often grouped with Flint’s suburban fringe but with an identity of its own. It remains one of Michigan’s most affordable communities, yet the trends suggest change is underway. With modest homes, mostly older construction, and few luxury developments, Beecher appeals to buyers seeking simplicity and low overhead. The area hasn’t experienced large-scale development, but small improvements in infrastructure, community outreach, and accessibility are helping to shift perceptions and attract residents who see value in its low prices.
Its proximity to Flint gives Beecher the advantages of urban adjacency without the same intensity of public scrutiny or infrastructure burdens. For real estate investors and first-time buyers alike, Beecher’s numbers make a compelling case. While the market still has room to grow, its consistent appreciation and ultra-low price point place it in a unique position. This is one of the few places in Michigan where you can still buy a home for under $50,000 and expect meaningful price growth year over year.