Would you like to save this?
Using data from the Zillow Home Value Index, we’ve ranked the 17 most affordable housing markets across Oklahoma as of May 2025. These towns have some of the lowest home prices in the state, yet many have still seen price increases over time. While the statewide average home value has climbed to over $180,000, several of the places listed here remain well below $70,000—making them potential options for budget-conscious buyers, investors, or retirees looking to stay within reach of services and small-town charm.
Some of these communities have shown slow, steady appreciation. Others saw sharp spikes and dips in recent years, often reflecting local changes in jobs, population, or infrastructure. Each entry includes a full home price history going back to 2010 (or earliest available year) and a deeper look at what makes that town affordable—and what buyers might expect going forward. From farming towns in western Oklahoma to historic centers near the Texas border, here are 17 places where homeownership is still possible without breaking the bank.
17. Eldorado – 49.30% Home Price Increase Since 2010
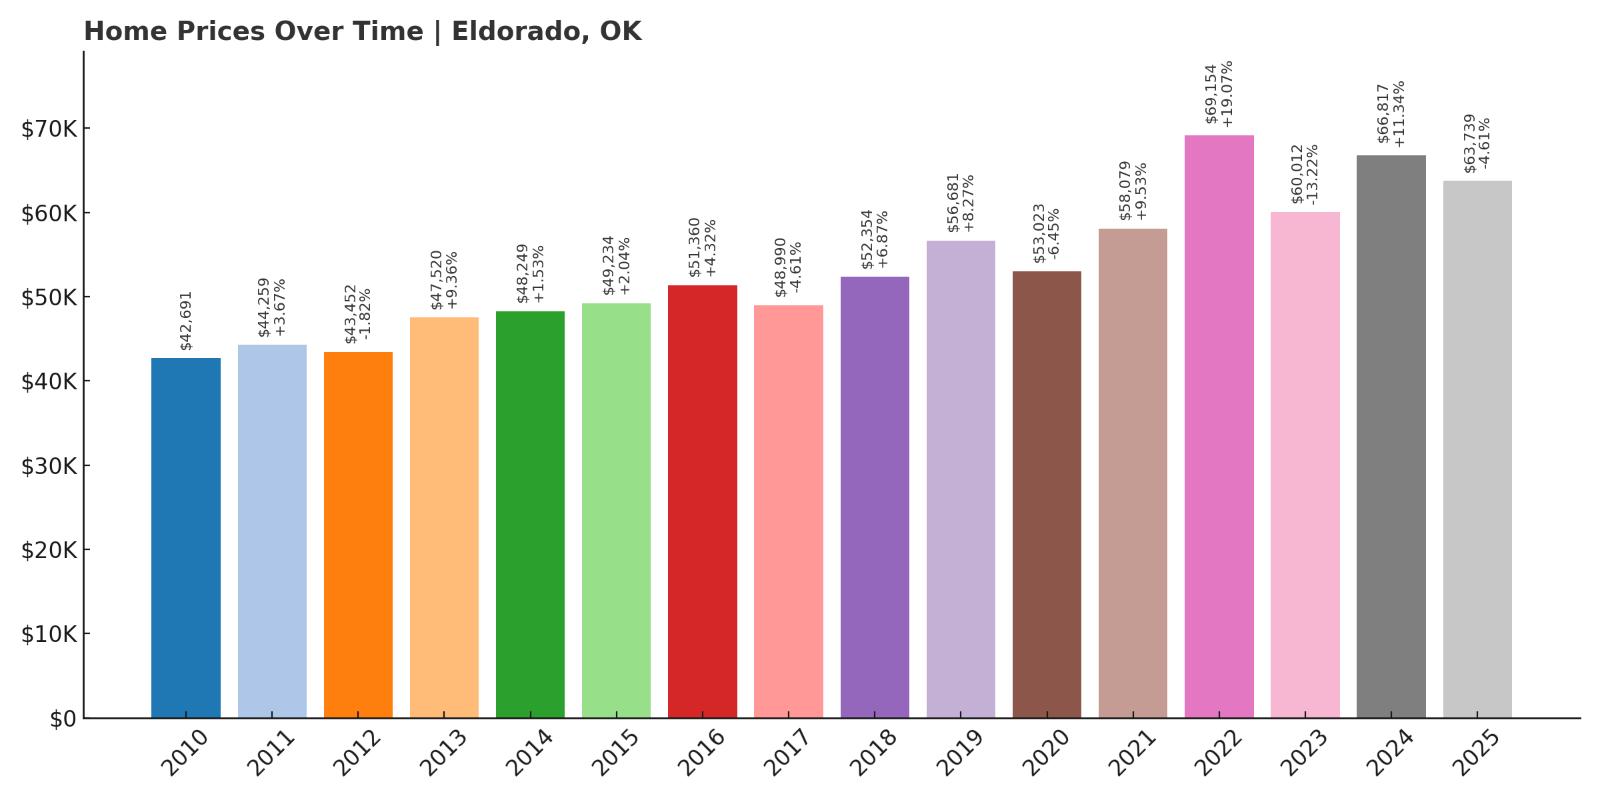
- 2010: $42,691
- 2011: $44,259 (+$1,569, +3.67% from previous year)
- 2012: $43,452 (-$808, -1.82% from previous year)
- 2013: $47,520 (+$4,069, +9.36% from previous year)
- 2014: $48,249 (+$728, +1.53% from previous year)
- 2015: $49,234 (+$986, +2.04% from previous year)
- 2016: $51,360 (+$2,125, +4.32% from previous year)
- 2017: $48,990 (-$2,370, -4.61% from previous year)
- 2018: $52,354 (+$3,364, +6.87% from previous year)
- 2019: $56,681 (+$4,328, +8.27% from previous year)
- 2020: $53,023 (-$3,658, -6.45% from previous year)
- 2021: $58,079 (+$5,055, +9.53% from previous year)
- 2022: $69,154 (+$11,075, +19.07% from previous year)
- 2023: $60,012 (-$9,142, -13.22% from previous year)
- 2024: $66,817 (+$6,805, +11.34% from previous year)
- 2025: $63,739 (-$3,078, -4.61% from previous year)
Home prices in Eldorado have risen nearly 50% since 2010, despite some notable dips in the early 2020s. Starting at just under $43,000 in 2010, the market peaked in 2022 at over $69,000 before dipping back down to $63,739 in 2025. The ups and downs show some volatility, but the longer trend is clearly upward, making Eldorado an affordable entry point with long-term growth potential.
Eldorado – Rural Living with Long-Term Upside

Located in southwestern Oklahoma near the Texas border, Eldorado is a quiet agricultural town surrounded by open plains. Its remote setting and small population help explain the lower home values, but that same isolation may also appeal to buyers looking for space and simplicity. With basic amenities and a tight-knit local community, Eldorado offers a rural lifestyle with very low housing costs. Despite its size, the town has seen solid growth in home prices—particularly from 2018 to 2022, when values surged more than 30%. That kind of momentum is notable for a town this small.
While the market has cooled a bit since its 2022 peak, Eldorado remains one of Oklahoma’s most affordable places to buy. Prices under $65,000 in 2025 mean it’s still accessible to budget-conscious buyers. The local economy centers on farming and ranching, and housing demand may fluctuate with agricultural trends. But for those who value affordability, quiet living, and space to grow, Eldorado offers long-term potential at an entry-level price point.
16. Blackwell – 70.41% Home Price Increase Since 2010
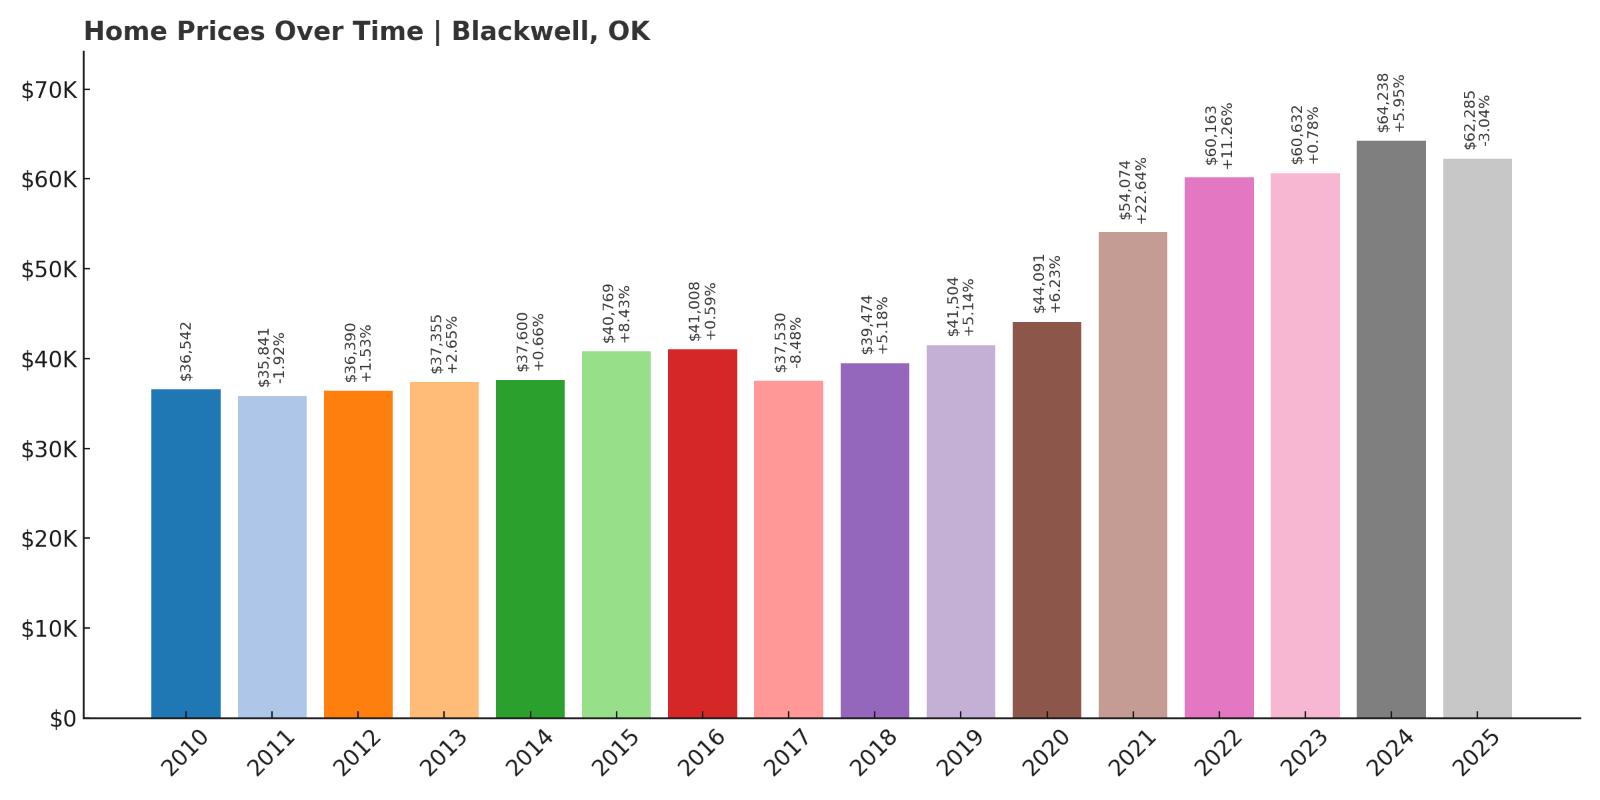
- 2010: $36,542
- 2011: $35,841 (-$701, -1.92% from previous year)
- 2012: $36,390 (+$549, +1.53% from previous year)
- 2013: $37,355 (+$965, +2.65% from previous year)
- 2014: $37,600 (+$245, +0.66% from previous year)
- 2015: $40,769 (+$3,169, +8.43% from previous year)
- 2016: $41,008 (+$239, +0.59% from previous year)
- 2017: $37,530 (-$3,478, -8.48% from previous year)
- 2018: $39,474 (+$1,944, +5.18% from previous year)
- 2019: $41,504 (+$2,030, +5.14% from previous year)
- 2020: $44,091 (+$2,587, +6.23% from previous year)
- 2021: $54,074 (+$9,983, +22.64% from previous year)
- 2022: $60,163 (+$6,089, +11.26% from previous year)
- 2023: $60,632 (+$469, +0.78% from previous year)
- 2024: $64,238 (+$3,606, +5.95% from previous year)
- 2025: $62,285 (-$1,953, -3.04% from previous year)
Blackwell has seen strong long-term appreciation, climbing more than 70% since 2010. While there were small setbacks in 2011 and 2017, prices generally trended upward and peaked in 2024 at over $64,000. Even after a slight dip in 2025, the town’s values remain significantly higher than a decade ago, offering both affordability and appreciation potential.
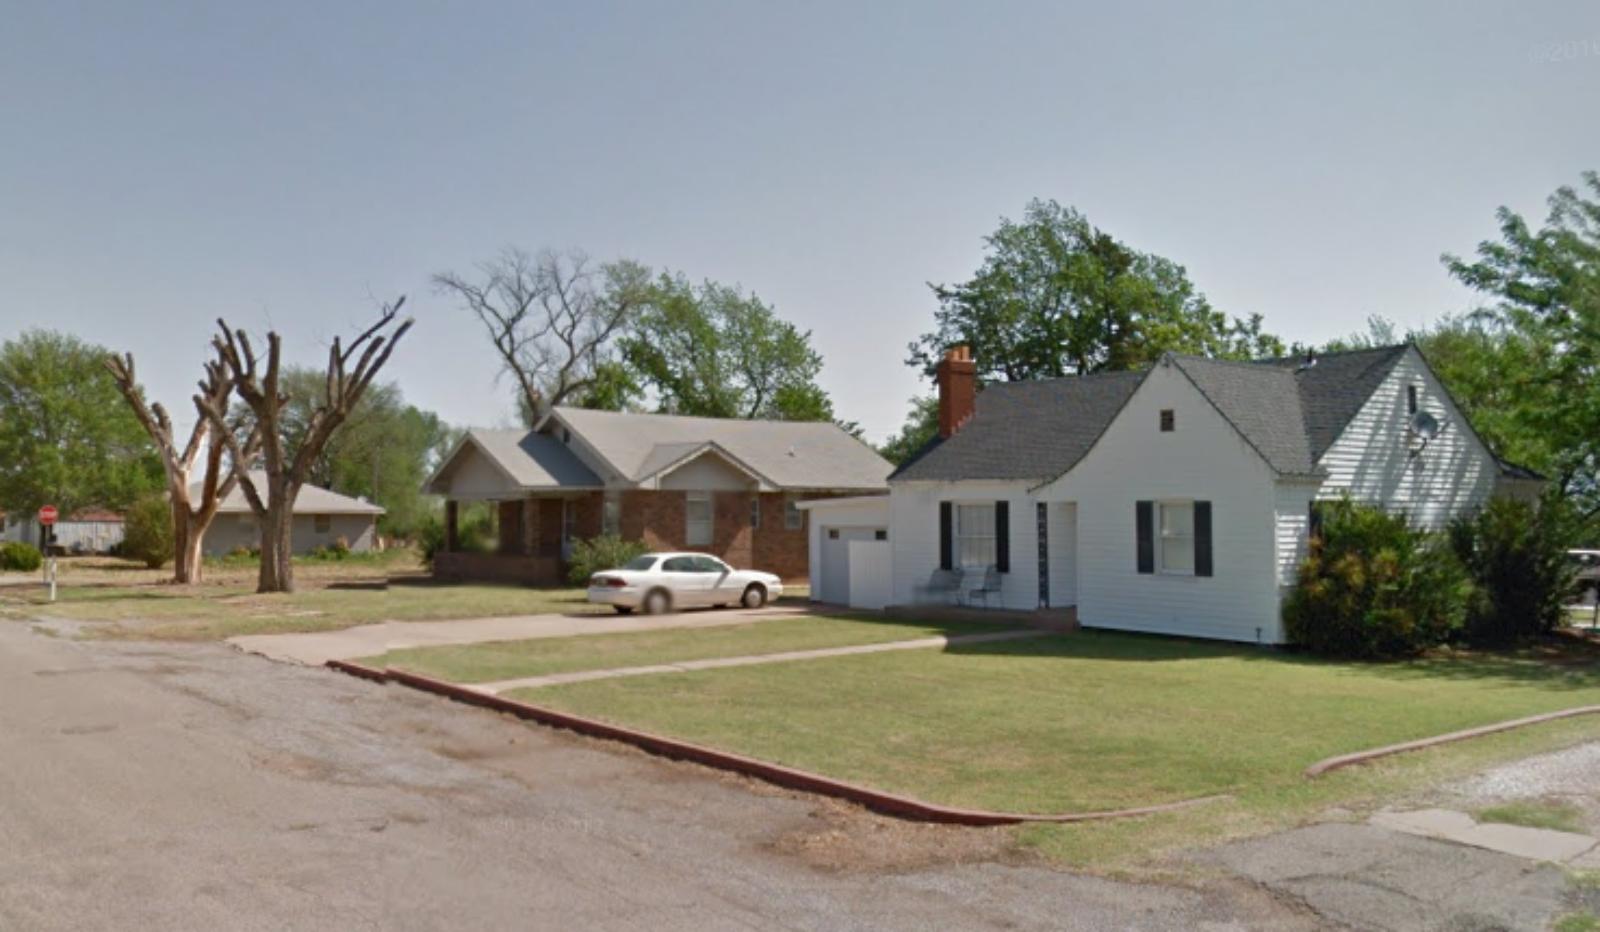
Blackwell – Historic Charm and Steady Growth

Kitchen Style?
Situated in north-central Oklahoma near the Kansas border, Blackwell is a historic town known for its downtown district, railroad heritage, and local schools. Though relatively small, it serves as a hub for surrounding rural areas and has key amenities like a hospital and community college branch. These resources help maintain local demand and steady housing activity. Prices stayed mostly flat in the early 2010s but began rising sharply after 2020, with a major jump in 2021 that pushed values up over 20% in a single year.
Even now, with a modest dip in 2025, Blackwell’s home values remain among the most attractive in the state for buyers seeking affordability without sacrificing community infrastructure. Its proximity to I-35 provides easy access to larger cities like Oklahoma City and Wichita, making it appealing to commuters and remote workers. For those who want historic charm, low prices, and future upside, Blackwell is worth a close look.
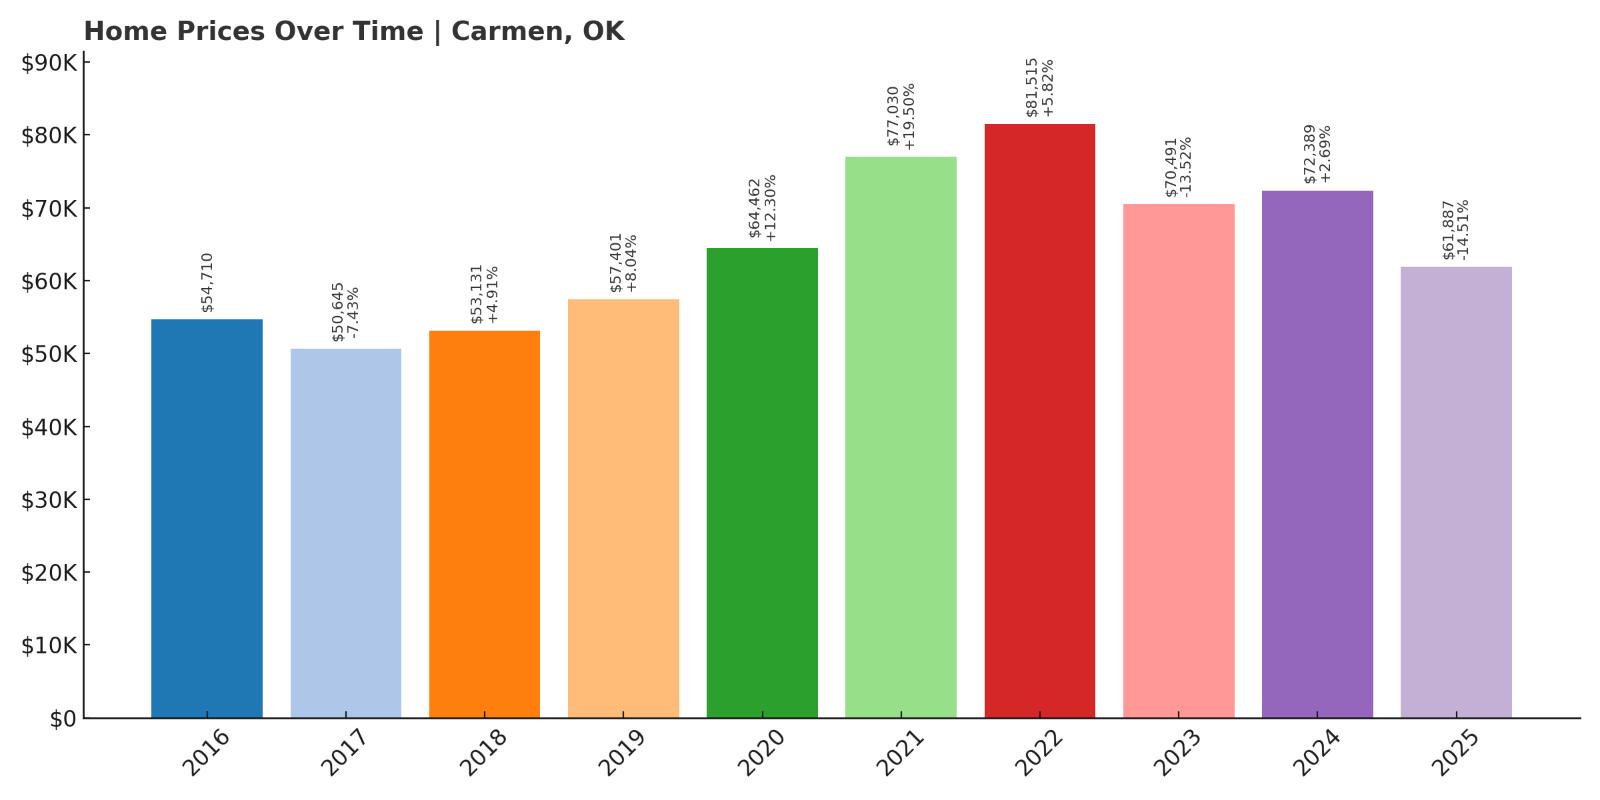
15. Carmen – 13.10% Home Price Increase Since 2016
- 2010: N/A
- 2011: N/A
- 2012: N/A
- 2013: N/A
- 2014: N/A
- 2015: N/A
- 2016: $54,710
- 2017: $50,645 (-$4,065, -7.43% from previous year)
- 2018: $53,131 (+$2,486, +4.91% from previous year)
- 2019: $57,401 (+$4,271, +8.04% from previous year)
- 2020: $64,462 (+$7,060, +12.30% from previous year)
- 2021: $77,030 (+$12,568, +19.50% from previous year)
- 2022: $81,515 (+$4,485, +5.82% from previous year)
- 2023: $70,491 (-$11,024, -13.52% from previous year)
- 2024: $72,389 (+$1,898, +2.69% from previous year)
- 2025: $61,887 (-$10,502, -14.51% from previous year)
Carmen’s home prices started at around $54,700 in 2016 and reached a peak of over $81,000 in 2022, before pulling back to $61,887 in 2025. That’s still a net gain of over 13%, though recent drops may raise questions about local economic shifts or demand. Even so, Carmen remains affordable compared to statewide averages.
Carmen – Peaks, Pullbacks, and Opportunity
Carmen is a tiny community in northwestern Oklahoma that exemplifies rural living. With fewer than 500 residents, it offers a peaceful lifestyle with very low housing competition. After several years of steady appreciation, home values rose sharply between 2019 and 2022. That jump was followed by a significant price correction, suggesting the market may have overshot temporarily or been affected by local job shifts or migration patterns.
Despite the recent dip, prices are still higher than in 2016, and Carmen remains a cheap buy in Oklahoma terms. Its housing market might appeal to bargain hunters who believe in a rebound or to those seeking a quiet, cost-effective retreat. Access to larger towns like Enid makes it feasible for remote workers and retirees. For anyone willing to overlook market volatility, Carmen could represent hidden value.
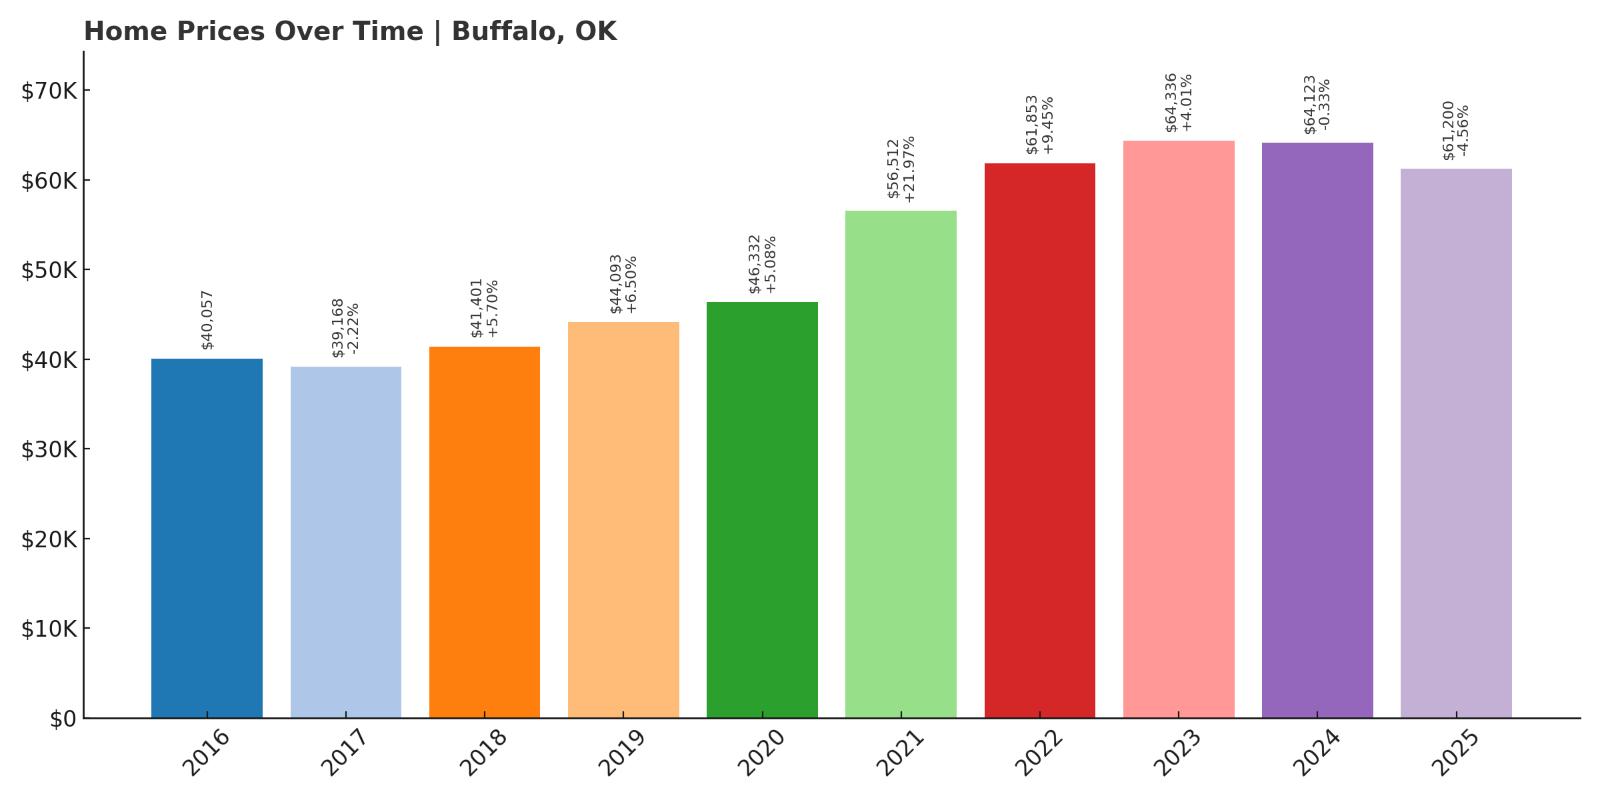
14. Buffalo – 52.80% Home Price Increase Since 2016
Home Stratosphere Guide
Your Personality Already Knows
How Your Home Should Feel
113 pages of room-by-room design guidance built around your actual brain, your actual habits, and the way you actually live.
You might be an ISFJ or INFP designer…
You design through feeling — your spaces are personal, comforting, and full of meaning. The guide covers your exact color palettes, room layouts, and the one mistake your type always makes.
The full guide maps all 16 types to specific rooms, palettes & furniture picks ↓
You might be an ISTJ or INTJ designer…
You crave order, function, and visual calm. The guide shows you how to create spaces that feel both serene and intentional — without ending up sterile.
The full guide maps all 16 types to specific rooms, palettes & furniture picks ↓
You might be an ENFP or ESTP designer…
You design by instinct and energy. Your home should feel alive. The guide shows you how to channel that into rooms that feel curated, not chaotic.
The full guide maps all 16 types to specific rooms, palettes & furniture picks ↓
You might be an ENTJ or ESTJ designer…
You value quality, structure, and things done right. The guide gives you the framework to build rooms that feel polished without overthinking every detail.
The full guide maps all 16 types to specific rooms, palettes & furniture picks ↓
- 2010: N/A
- 2011: N/A
- 2012: N/A
- 2013: N/A
- 2014: N/A
- 2015: N/A
- 2016: $40,057
- 2017: $39,168 (-$890, -2.22% from previous year)
- 2018: $41,401 (+$2,233, +5.70% from previous year)
- 2019: $44,093 (+$2,692, +6.50% from previous year)
- 2020: $46,332 (+$2,239, +5.08% from previous year)
- 2021: $56,512 (+$10,180, +21.97% from previous year)
- 2022: $61,853 (+$5,342, +9.45% from previous year)
- 2023: $64,336 (+$2,483, +4.01% from previous year)
- 2024: $64,123 (-$213, -0.33% from previous year)
- 2025: $61,200 (-$2,923, -4.56% from previous year)
Buffalo has experienced a steady climb in home values since 2016, with prices rising over 50% in less than a decade. While values dipped slightly in 2017 and again after 2023, the overall growth trajectory has been upward. The largest spike came in 2021, when home prices jumped by nearly 22% in a single year—pushing Buffalo above the $60,000 mark for the first time. Even with some recent corrections, current values remain well above their 2016 baseline, showing sustained long-term growth while remaining among the most affordable markets in Oklahoma.
Buffalo – Quiet Growth in Oklahoma’s Northwest Corner

Located in Harper County near the Oklahoma-Kansas border, Buffalo is a small town known for its courthouse square, open skies, and ranching roots. Its rural location has kept demand and home prices relatively low, but the numbers show that interest in the area has picked up. The dramatic jump in 2021 prices likely reflects post-pandemic rural migration trends and increased interest in remote living. While growth has cooled slightly since then, the town continues to offer steady value, with price fluctuations that are mild compared to urban markets. Buffalo’s modest infrastructure, including a public school district and local library, supports the needs of its residents without the high costs of larger cities.
The town’s housing market is shaped by its surroundings—mainly agriculture and energy—which can create seasonal demand but also long-term affordability. Its far-northwest location puts it away from major highways and cities, which may limit commuting appeal but also shields it from the sharp volatility of more trafficked areas. For buyers seeking a peaceful lifestyle, solid home values, and price tags that still hover around $60,000, Buffalo stands out as a dependable and affordable place to own property in Oklahoma’s High Plains region.
13. Hobart – 55.91% Home Price Increase Since 2016

- 2010: N/A
- 2011: N/A
- 2012: N/A
- 2013: N/A
- 2014: N/A
- 2015: N/A
- 2016: $39,236
- 2017: $37,972 (-$1,264, -3.22% from previous year)
- 2018: $39,989 (+$2,017, +5.31% from previous year)
- 2019: $40,566 (+$576, +1.44% from previous year)
- 2020: $41,546 (+$981, +2.42% from previous year)
- 2021: $50,205 (+$8,659, +20.84% from previous year)
- 2022: $57,644 (+$7,438, +14.82% from previous year)
- 2023: $54,245 (-$3,398, -5.90% from previous year)
- 2024: $64,667 (+$10,421, +19.21% from previous year)
- 2025: $61,163 (-$3,504, -5.42% from previous year)
Since 2016, home values in Hobart have grown by over 55%, driven by a few major jumps and some moderate pullbacks. The market really took off in 2021 and again in 2024, with double-digit growth both years. Though prices dipped slightly in 2023 and again in 2025, they remain significantly above their pre-2020 levels. With home values hovering just over $61,000, Hobart still ranks as a highly affordable market despite its substantial appreciation.
Hobart – Small Town Appeal with Modern Momentum

Hobart is located in Kiowa County in southwestern Oklahoma and serves as the county seat. With a population just under 3,000, it’s known for its friendly atmosphere, walkable streets, and the General Tommy Franks Museum. This civic and historical identity gives Hobart a bit more character than similarly sized towns. The strong price increases in 2021 and 2024 suggest that buyers have taken note—possibly those looking for a lower-cost alternative to nearby Lawton or Wichita Falls. The town’s affordability, paired with its access to healthcare, schools, and modest commercial infrastructure, has helped maintain housing demand despite broader economic uncertainty.
While recent volatility is worth noting, Hobart’s long-term price trajectory remains positive. It offers one of the better values in the western half of the state, with housing still priced far below the state average. Its location along US Route 183 makes regional travel easy, while the quiet pace of life appeals to retirees and remote workers alike. Whether it’s the history, low cost of living, or a sense of rooted community, Hobart continues to show that affordability doesn’t have to mean stagnation.
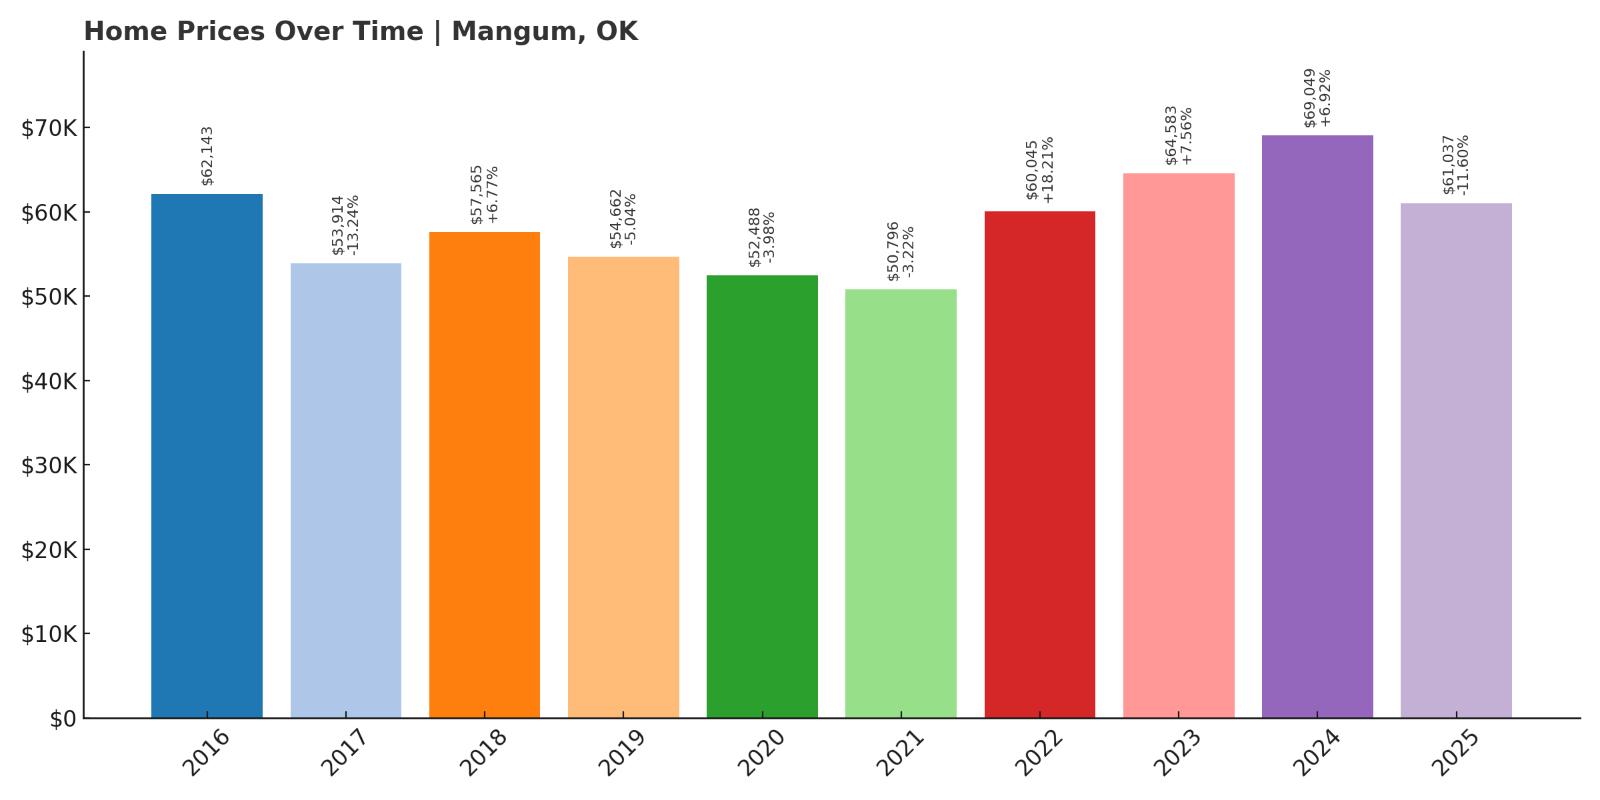
12. Mangum – -1.78% Home Price Decrease Since 2016
- 2010: N/A
- 2011: N/A
- 2012: N/A
- 2013: N/A
- 2014: N/A
- 2015: N/A
- 2016: $62,143
- 2017: $53,914 (-$8,228, -13.24% from previous year)
- 2018: $57,565 (+$3,651, +6.77% from previous year)
- 2019: $54,662 (-$2,903, -5.04% from previous year)
- 2020: $52,488 (-$2,174, -3.98% from previous year)
- 2021: $50,796 (-$1,692, -3.22% from previous year)
- 2022: $60,045 (+$9,249, +18.21% from previous year)
- 2023: $64,583 (+$4,538, +7.56% from previous year)
- 2024: $69,049 (+$4,466, +6.92% from previous year)
- 2025: $61,037 (-$8,012, -11.60% from previous year)
Unlike other towns on this list, Mangum has seen more price volatility than sustained growth. Home values today are actually slightly lower than they were in 2016, despite sharp increases from 2021 to 2024. After peaking at just over $69,000, the market dropped nearly 12% in 2025, wiping out much of the short-term gains. This uneven trend may signal that prices in Mangum are highly sensitive to local economic shifts or temporary demand surges.
Mangum – Sharp Swings in a Southern Plains Market

Mangum sits in Greer County, in southwestern Oklahoma, and has a long history tied to agriculture and ranching. It’s the kind of place where historic brick buildings line the main street and Friday night football still draws a crowd. But its housing market has been anything but predictable. Following several years of mild declines, prices jumped dramatically from 2021 through 2024, perhaps due to pandemic-era migration or local development. The drop in 2025 is one of the steepest on this list, and it brings current values just below their 2016 level. This suggests a market that is reactive—both to positive and negative trends.
Still, Mangum’s overall affordability remains a draw, especially for buyers who are flexible and seeking larger lots or older homes at lower prices. The town offers essential services, a regional hospital, and a few cultural attractions that give it staying power despite economic headwinds. For anyone weighing risk versus cost, Mangum represents a market that may offer opportunity for a well-timed purchase—but it’s not for the risk-averse. Monitoring local trends will be key for anyone considering a move here.
11. Temple – 57.96% Home Price Increase Since 2010
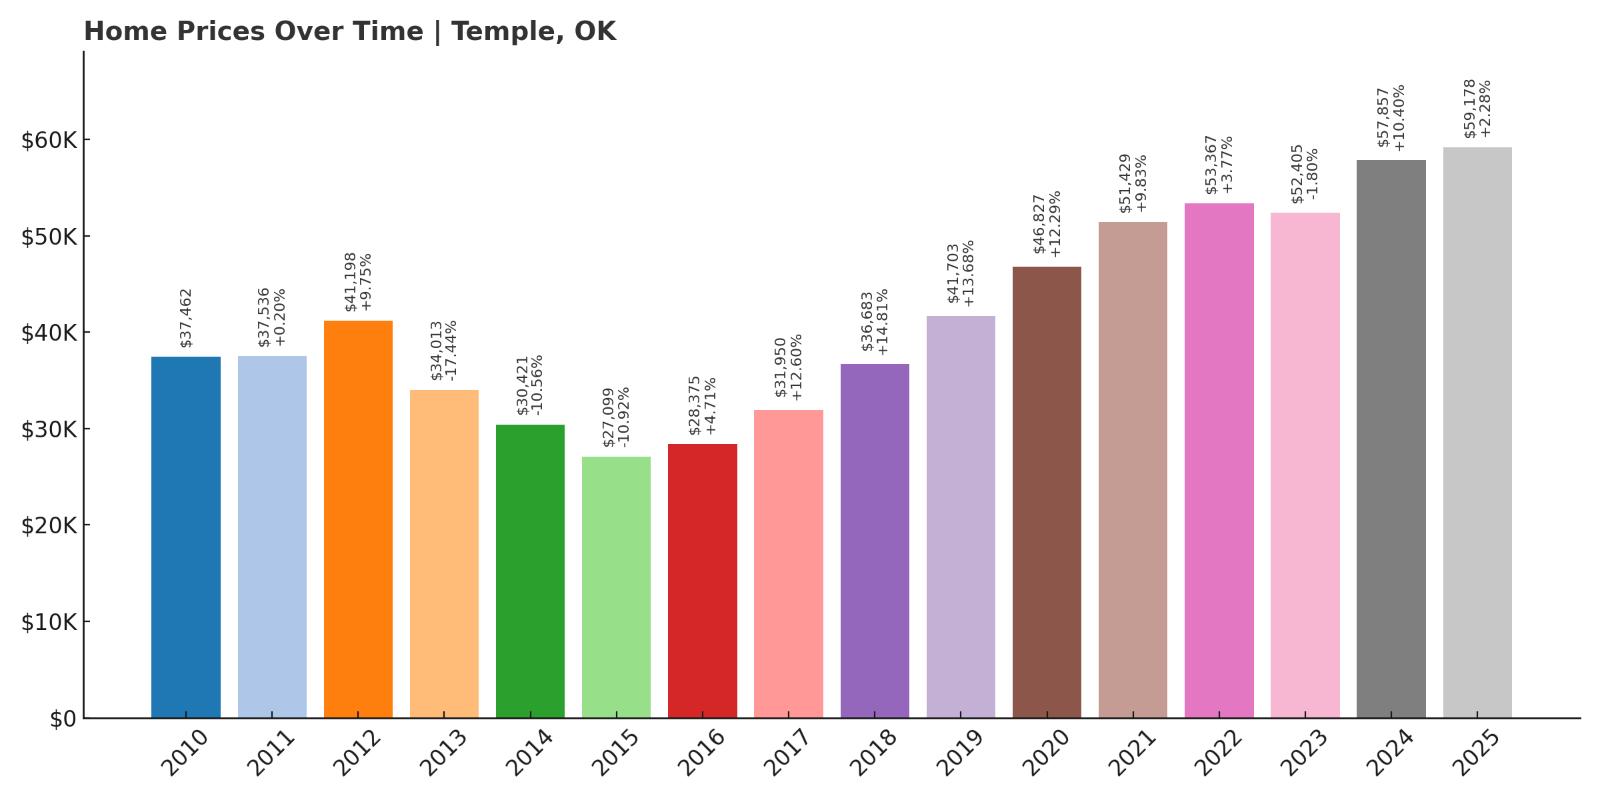
- 2010: $37,462
- 2011: $37,536 (+$74, +0.20% from previous year)
- 2012: $41,198 (+$3,662, +9.75% from previous year)
- 2013: $34,013 (-$7,185, -17.44% from previous year)
- 2014: $30,421 (-$3,592, -10.56% from previous year)
- 2015: $27,099 (-$3,322, -10.92% from previous year)
- 2016: $28,375 (+$1,276, +4.71% from previous year)
- 2017: $31,950 (+$3,576, +12.60% from previous year)
- 2018: $36,683 (+$4,732, +14.81% from previous year)
- 2019: $41,703 (+$5,020, +13.68% from previous year)
- 2020: $46,827 (+$5,124, +12.29% from previous year)
- 2021: $51,429 (+$4,602, +9.83% from previous year)
- 2022: $53,367 (+$1,938, +3.77% from previous year)
- 2023: $52,405 (-$962, -1.80% from previous year)
- 2024: $57,857 (+$5,451, +10.40% from previous year)
- 2025: $59,178 (+$1,321, +2.28% from previous year)
Temple’s housing market has climbed nearly 58% since 2010, despite experiencing a major dip between 2013 and 2015. After bottoming out at just over $27,000, home values rebounded steadily, gaining strength each year through 2020. Even with a brief pause in 2023, the town closed 2025 with an average home value of $59,178—more than double its low point and far above where it started fifteen years ago. This steady rise suggests renewed confidence in the local market and growing interest in rural, affordable communities.
Temple – Resilient Growth in a Rural Market
Temple is a small town in Cotton County near the Red River, offering rural seclusion with access to nearby towns like Walters and Lawton. Once a thriving stop along the Rock Island Railroad, Temple has faced its share of economic shifts over the years, reflected in its deep home price drop from 2012 to 2015. But those years of decline were followed by a strong and consistent rebound, especially between 2017 and 2020 when prices climbed by more than 50%. This growth likely reflects broader housing trends seen across the state—where rural towns became more appealing due to affordability and the rise of remote work during and after the pandemic. The price jumps during those years weren’t just lucky—they mirrored buyer demand and renewed interest in more spread-out communities with lower overhead.
Today, Temple continues to offer homes under $60,000—well below Oklahoma’s median—but the appreciation shows it’s not being overlooked. With its own school system, basic services, and access to agriculture and energy jobs nearby, Temple manages to provide functionality without high cost. Its quiet, flat surroundings appeal to retirees and longtime residents, and the price data shows that its market has matured significantly since the mid-2010s. While buyers here aren’t chasing dramatic short-term returns, they are getting solid long-term value in a community that’s proven its ability to recover and grow. Temple’s trajectory reflects stability over flash, making it a safe haven for affordable homeownership in southwestern Oklahoma.
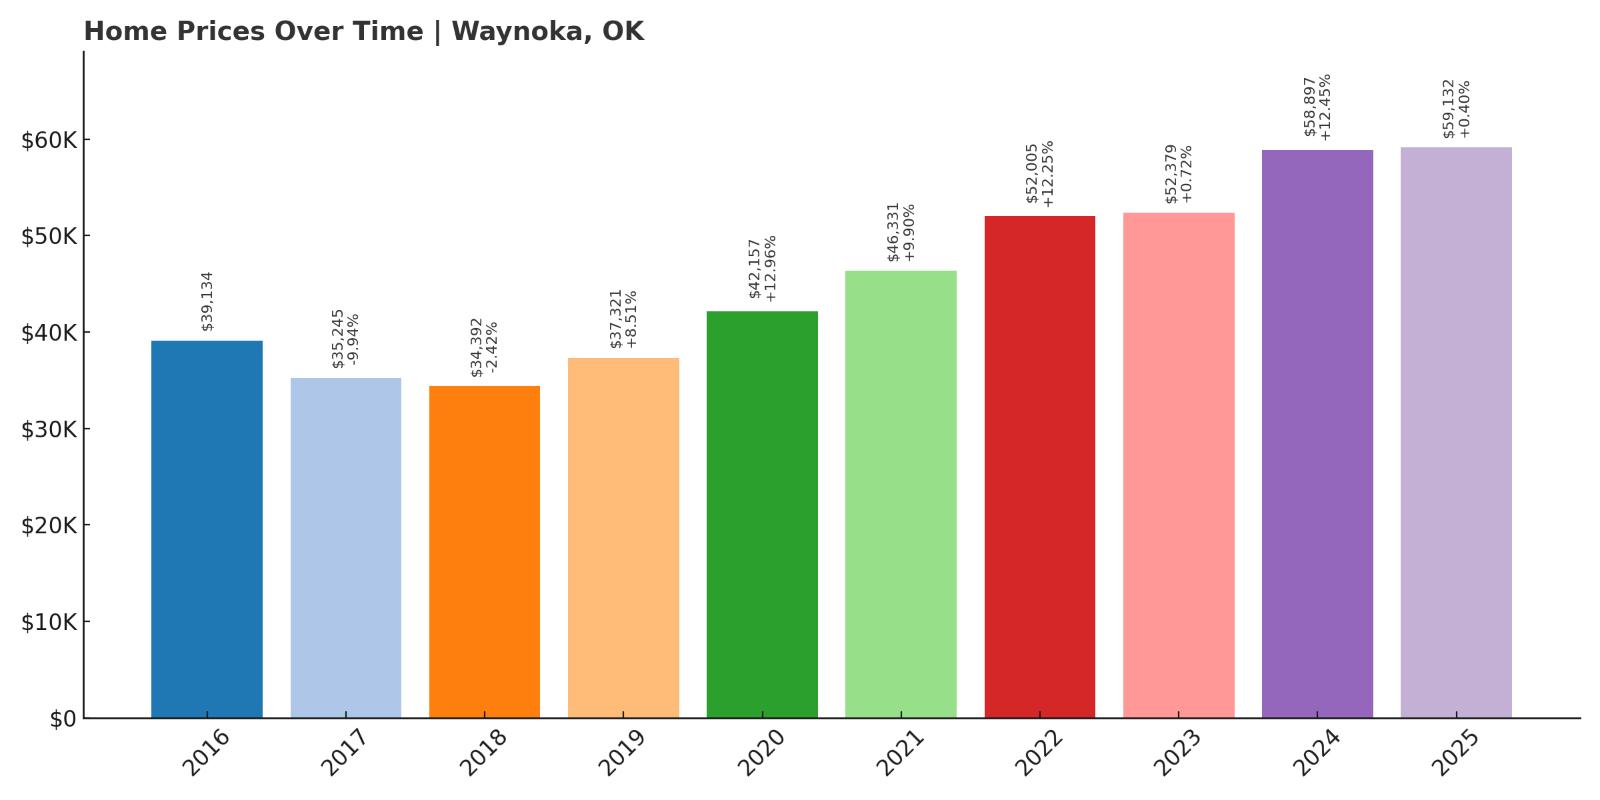
10. Waynoka – 51.13% Home Price Increase Since 2016
- 2010: N/A
- 2011: N/A
- 2012: N/A
- 2013: N/A
- 2014: N/A
- 2015: N/A
- 2016: $39,134
- 2017: $35,245 (-$3,890, -9.94% from previous year)
- 2018: $34,392 (-$852, -2.42% from previous year)
- 2019: $37,321 (+$2,928, +8.51% from previous year)
- 2020: $42,157 (+$4,836, +12.96% from previous year)
- 2021: $46,331 (+$4,174, +9.90% from previous year)
- 2022: $52,005 (+$5,674, +12.25% from previous year)
- 2023: $52,379 (+$374, +0.72% from previous year)
- 2024: $58,897 (+$6,519, +12.45% from previous year)
- 2025: $59,132 (+$235, +0.40% from previous year)
Waynoka’s home prices have climbed over 51% since 2016, moving from around $39,000 to just over $59,000 in less than a decade. After small declines in 2017 and 2018, the market turned upward and has been gaining steadily ever since. The biggest increases happened between 2019 and 2022, when home values surged by over $14,000. The latest data from 2025 shows continued growth, albeit modest, suggesting a market that’s found its stride and offers reliable returns without sharp volatility.
Waynoka – Outdoor Appeal and Steady Value

Waynoka is located in Woods County and is best known as the home of Little Sahara State Park—a giant sand dune recreation area that brings in thousands of visitors each year for off-roading and outdoor events. That tourism boost is unique among Oklahoma’s rural towns and may partly explain Waynoka’s stronger price performance since 2019. Unlike many towns its size, Waynoka benefits from a constant influx of weekend travelers, seasonal events, and camper traffic, which keeps some level of economic activity flowing year-round. Add in the town’s proximity to Alva, where residents can access college campuses, medical care, and retail, and it’s easy to see why this small community continues to gain traction. Home prices rose by more than 30% between 2019 and 2022 alone—a signal that buyers and investors have taken notice.
While it’s not a large town, Waynoka has developed a solid housing market around its modest base. Properties remain extremely affordable, with values still under $60,000, and price growth has been consistent without wild fluctuations. Its location also places it within reasonable driving distance of Enid and Woodward, giving residents access to broader job markets while enjoying the quiet pace of rural life. For buyers looking for a small-town setting with some tourism energy, stable price appreciation, and outdoor attractions that bring in consistent traffic, Waynoka checks many boxes. Its performance over the past decade proves that even lesser-known communities can thrive when the conditions are right.
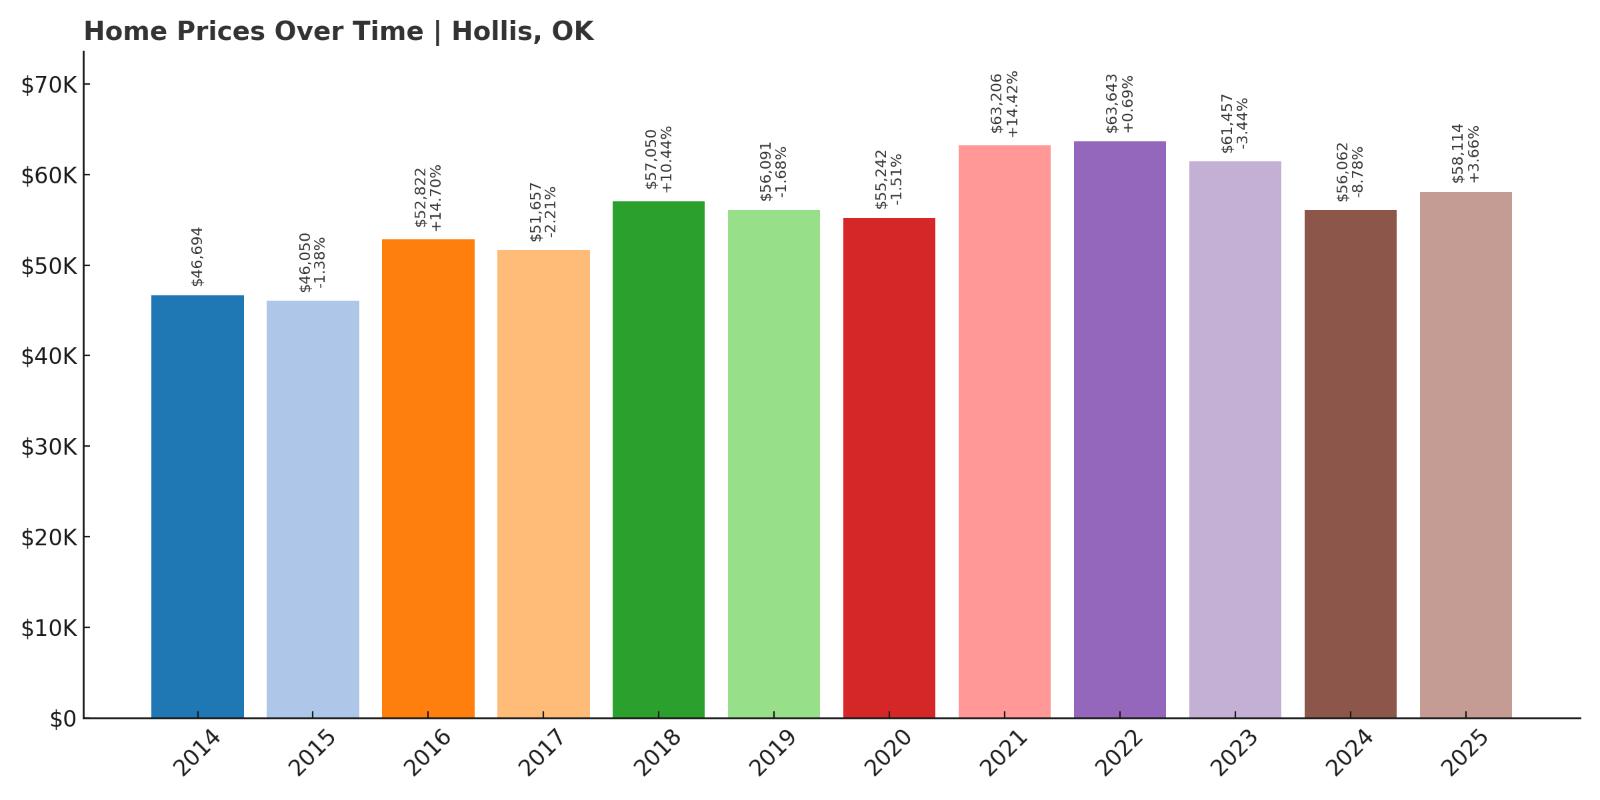
9. Hollis – 24.44% Home Price Increase Since 2014
- 2010: N/A
- 2011: N/A
- 2012: N/A
- 2013: N/A
- 2014: $46,694
- 2015: $46,050 (-$644, -1.38% from previous year)
- 2016: $52,822 (+$6,772, +14.70% from previous year)
- 2017: $51,657 (-$1,165, -2.21% from previous year)
- 2018: $57,050 (+$5,393, +10.44% from previous year)
- 2019: $56,091 (-$959, -1.68% from previous year)
- 2020: $55,242 (-$849, -1.51% from previous year)
- 2021: $63,206 (+$7,965, +14.42% from previous year)
- 2022: $63,643 (+$437, +0.69% from previous year)
- 2023: $61,457 (-$2,186, -3.44% from previous year)
- 2024: $56,062 (-$5,396, -8.78% from previous year)
- 2025: $58,114 (+$2,053, +3.66% from previous year)
Home prices in Hollis have grown by nearly 25% since 2014, with a pattern of surges and soft pullbacks. After reaching over $63,000 in 2021, the market cooled in 2023 and 2024 before climbing slightly again in 2025. Despite recent dips, prices remain higher than in most towns of its size, and the long-term trend has been moderately positive, suggesting a slow but upward crawl in value.
Hollis – A Western Hub with a History of Resilience

Hollis, located in Harmon County near the Texas border, has long served as a regional center for farming and ranching communities. It’s also the birthplace of NFL legend Darrell Royal and maintains a strong local identity rooted in agriculture and high school sports. The housing market has mirrored its economic base: periods of strength followed by periods of retrenchment. Notably, between 2014 and 2016, home values jumped more than 14%, likely due to a wave of local investment or home upgrades. However, prices then fluctuated with modest losses in several years before climbing sharply in 2021. That spike—one of the largest in the town’s timeline—suggests a renewed interest, possibly fueled by buyers priced out of other areas.
Hollis remains deeply affordable with 2025 values still under $60,000, yet its pricing trends show that it’s more than a stagnant market. Residents benefit from essential services like a public school system, a local hospital, and a walkable downtown, all of which contribute to consistent housing demand. The recent decline in 2023 and 2024 may reflect broader rural slowdowns, but the 2025 rebound could point to stabilization. For buyers looking for a town with historical significance, affordable housing, and the infrastructure to support long-term living, Hollis presents a well-rounded option in southwestern Oklahoma.
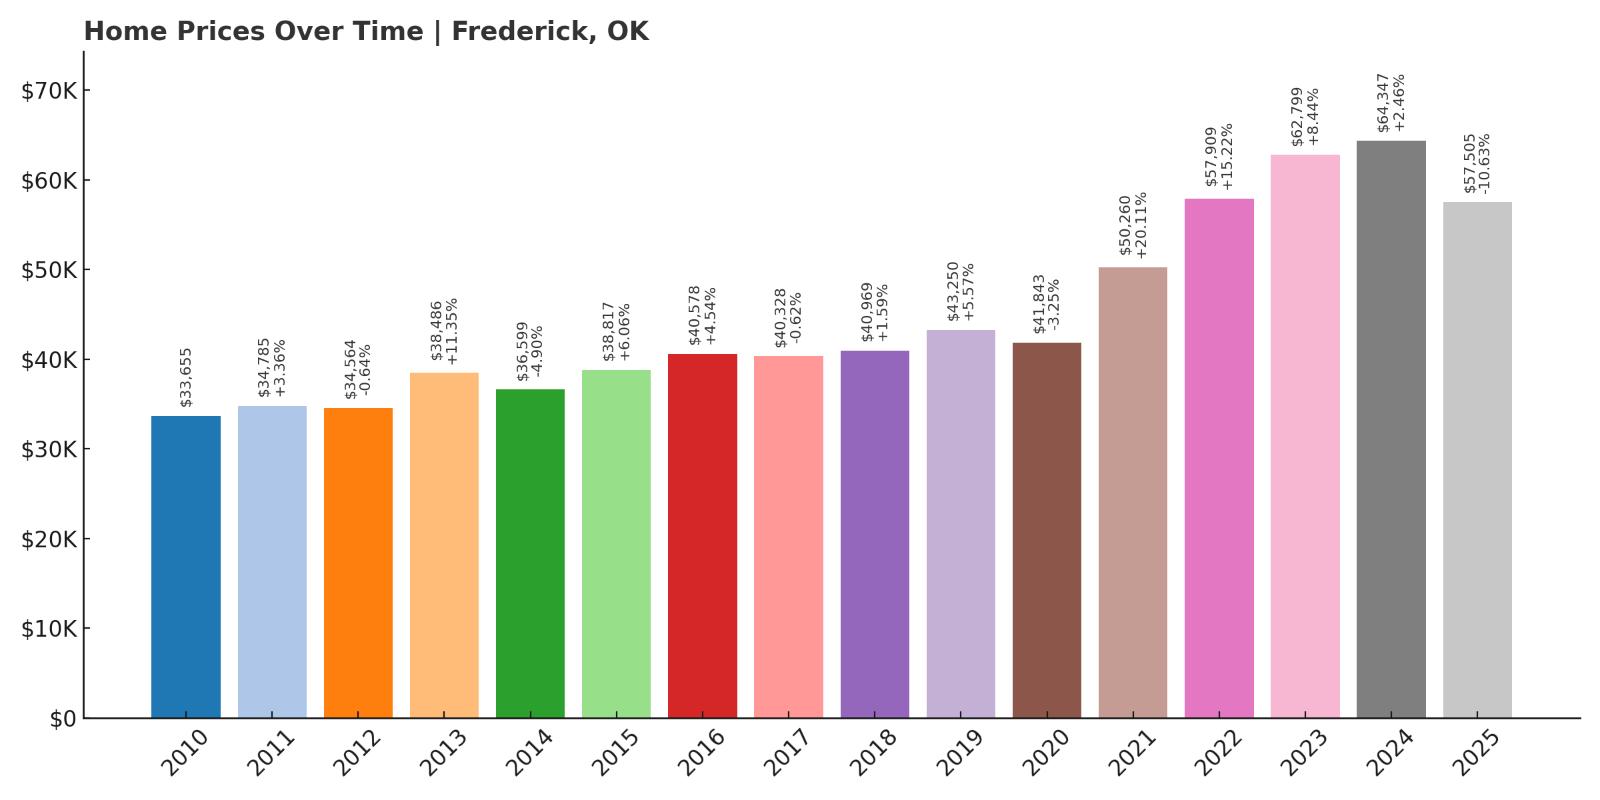
8. Frederick – 70.91% Home Price Increase Since 2010
Would you like to save this?
- 2010: $33,655
- 2011: $34,785 (+$1,130, +3.36% from previous year)
- 2012: $34,564 (-$221, -0.64% from previous year)
- 2013: $38,486 (+$3,922, +11.35% from previous year)
- 2014: $36,599 (-$1,887, -4.90% from previous year)
- 2015: $38,817 (+$2,217, +6.06% from previous year)
- 2016: $40,578 (+$1,762, +4.54% from previous year)
- 2017: $40,328 (-$250, -0.62% from previous year)
- 2018: $40,969 (+$640, +1.59% from previous year)
- 2019: $43,250 (+$2,281, +5.57% from previous year)
- 2020: $41,843 (-$1,406, -3.25% from previous year)
- 2021: $50,260 (+$8,417, +20.11% from previous year)
- 2022: $57,909 (+$7,649, +15.22% from previous year)
- 2023: $62,799 (+$4,890, +8.44% from previous year)
- 2024: $64,347 (+$1,548, +2.46% from previous year)
- 2025: $57,505 (-$6,841, -10.63% from previous year)
Frederick’s housing market has grown by nearly 71% since 2010, with most of that growth occurring in the last five years. Prices soared from around $42,000 in 2020 to over $64,000 in 2024 before pulling back to $57,505 in 2025. Even with the recent decline, home values remain far higher than a decade ago, pointing to strong medium-term appreciation.
Frederick – A Regional Anchor with Recent Price Surges

Frederick is the county seat of Tillman County in southwestern Oklahoma and plays a central role in the region’s agricultural economy. Unlike smaller satellite towns, Frederick has enough infrastructure to support steady housing demand, including a hospital, public schools, and a small airport. Between 2020 and 2023, home prices here jumped more than 50%, making it one of the strongest performers in the entire list. This rise may reflect increased interest from buyers seeking access to services without the high prices found in metro areas. Frederick’s relatively flat pricing from 2010 to 2018 gave way to a sharp upward trend starting in 2021, showing that it’s no longer just a sleepy rural outpost.
Though prices dipped in 2025, the overall trajectory is still highly positive. The presence of civic institutions, medical care, and stable employment in the region helps anchor the housing market even during broader slowdowns. Residents here benefit from both community-scale amenities and wide open space—an increasingly rare combination. Buyers looking at long-term affordability with a track record of performance should see Frederick as more than just a budget pick; it’s a town with a solid foundation and room for future growth.
7. Weleetka – 98.60% Home Price Increase Since 2010
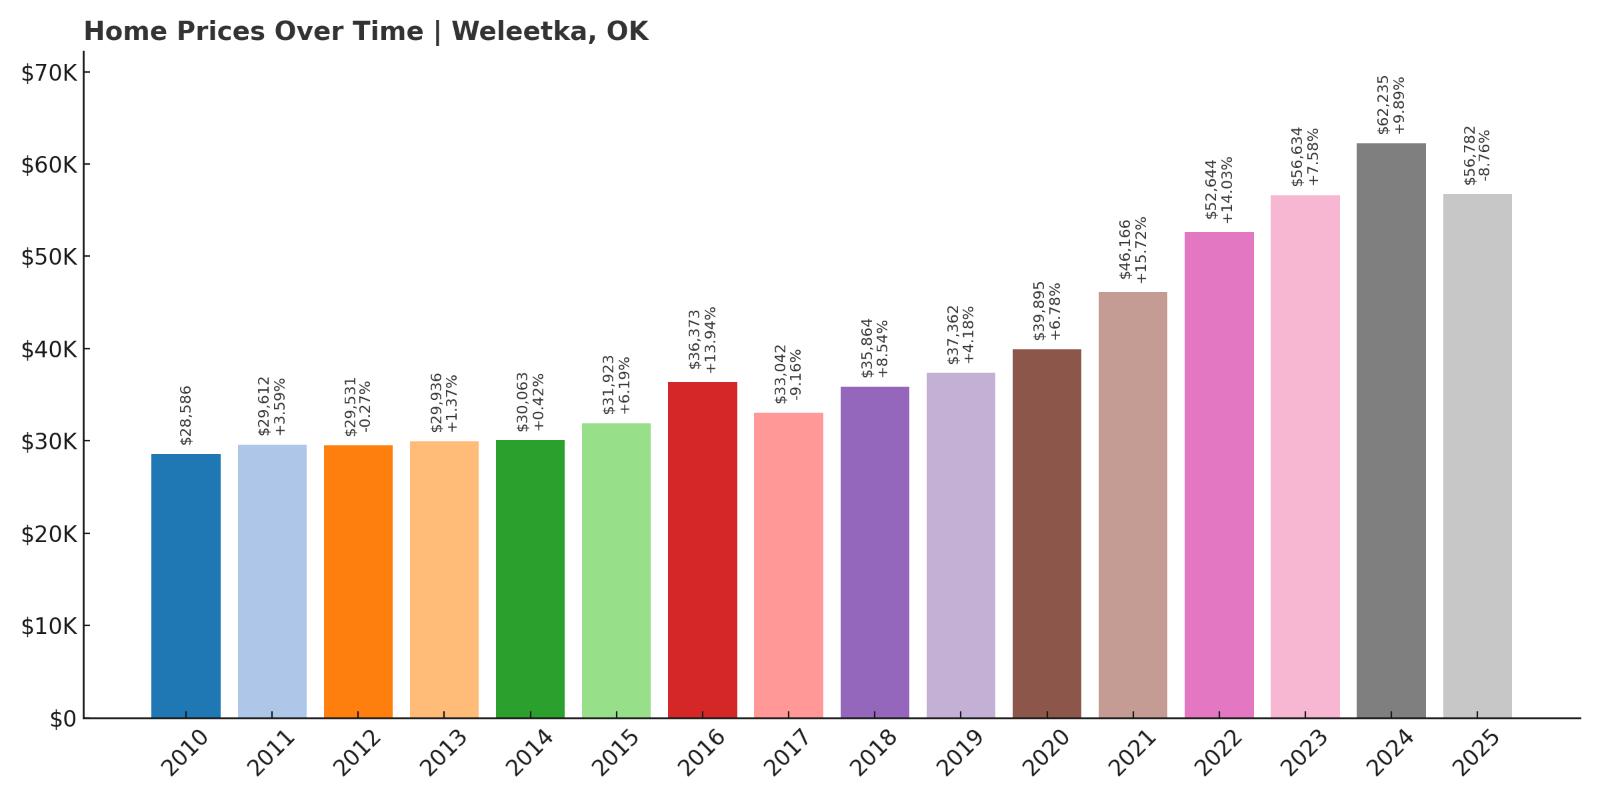
- 2010: $28,586
- 2011: $29,612 (+$1,026, +3.59% from previous year)
- 2012: $29,531 (-$81, -0.27% from previous year)
- 2013: $29,936 (+$405, +1.37% from previous year)
- 2014: $30,063 (+$127, +0.42% from previous year)
- 2015: $31,923 (+$1,860, +6.19% from previous year)
- 2016: $36,373 (+$4,450, +13.94% from previous year)
- 2017: $33,042 (-$3,331, -9.16% from previous year)
- 2018: $35,864 (+$2,822, +8.54% from previous year)
- 2019: $37,362 (+$1,497, +4.18% from previous year)
- 2020: $39,895 (+$2,533, +6.78% from previous year)
- 2021: $46,166 (+$6,271, +15.72% from previous year)
- 2022: $52,644 (+$6,478, +14.03% from previous year)
- 2023: $56,634 (+$3,990, +7.58% from previous year)
- 2024: $62,235 (+$5,601, +9.89% from previous year)
- 2025: $56,782 (-$5,453, -8.76% from previous year)
Weleetka has nearly doubled its home prices since 2010, making it one of the strongest long-term performers on this list. Prices climbed steadily in recent years, especially from 2020 to 2024, when values rose by more than $22,000. Even with a moderate correction in 2025, the market remains up nearly 99% over 15 years—a major feat for a rural town.
Weleetka – Historic Roots and Exceptional Growth

Were You Meant
to Live In?
Weleetka is a small town in Okfuskee County, originally built up as a railroad stop in the early 1900s. Its history is still visible in its quiet downtown and old train depot, but the housing market here tells a story of new life. After years of sluggish gains, the town saw consistent year-over-year appreciation starting in 2016, accelerated by pandemic-era rural migration. The surge between 2020 and 2024—nearly 56% growth in four years—suggests that buyers began seeking out smaller, quieter towns with room to breathe. Weleetka’s proximity to I-40 and major job corridors likely added to its appeal for those wanting space without losing highway access.
The recent dip in 2025 might give some buyers pause, but it doesn’t erase the strong gains made in the years before. Home prices still sit well above their pre-2020 levels, and the town offers homes far below Oklahoma’s average cost. Weleetka continues to attract buyers with its affordability, walkability, and ties to agriculture and light industry. For anyone looking to stretch their dollar while still betting on a market with historical strength, this town deserves serious consideration.
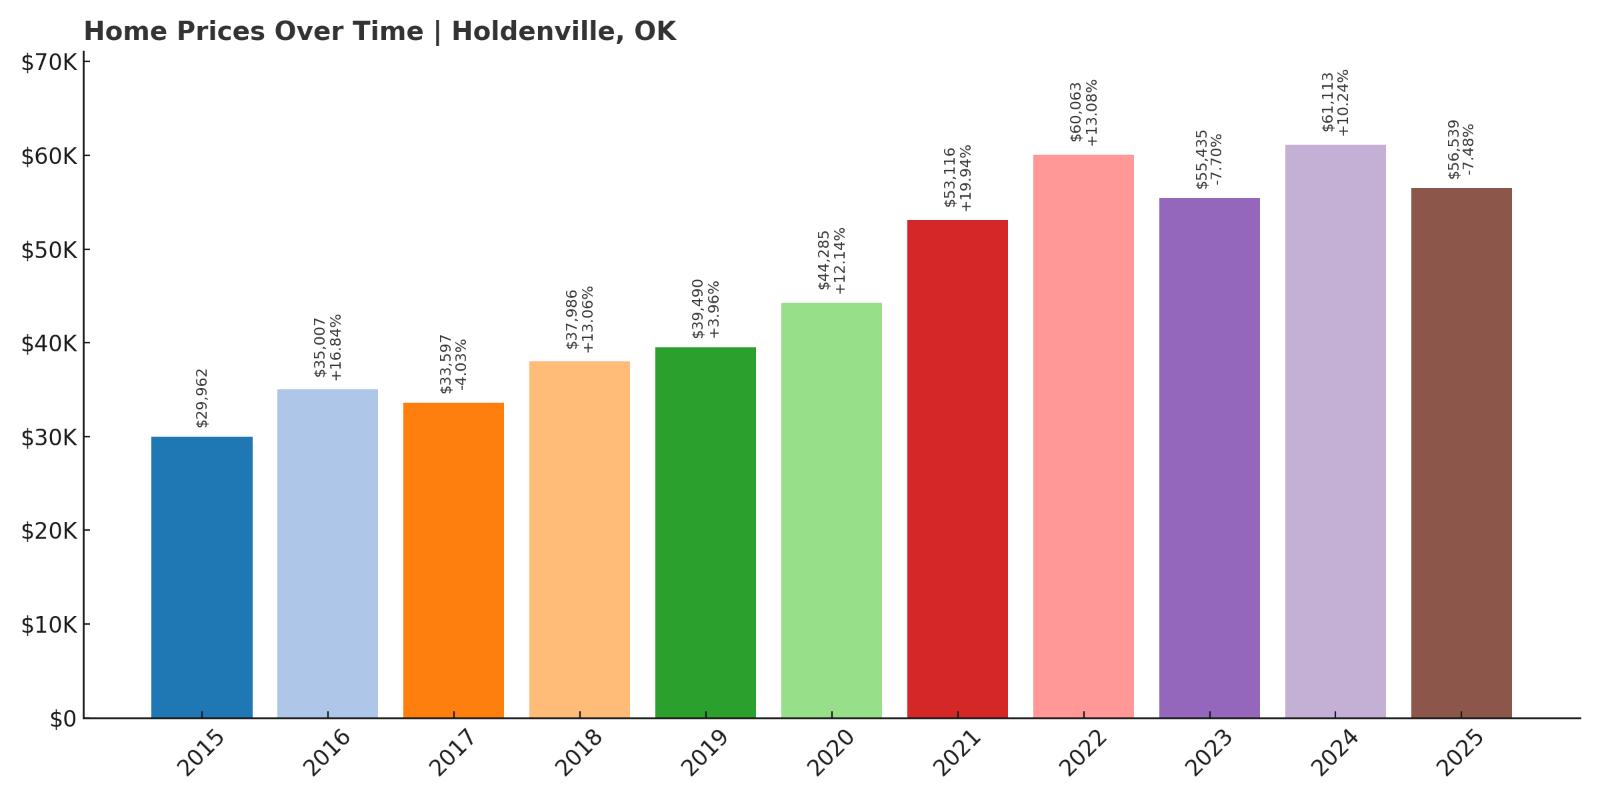
6. Holdenville – 88.67% Home Price Increase Since 2015
- 2010: N/A
- 2011: N/A
- 2012: N/A
- 2013: N/A
- 2014: N/A
- 2015: $29,962
- 2016: $35,007 (+$5,045, +16.84% from previous year)
- 2017: $33,597 (-$1,410, -4.03% from previous year)
- 2018: $37,986 (+$4,389, +13.06% from previous year)
- 2019: $39,490 (+$1,504, +3.96% from previous year)
- 2020: $44,285 (+$4,795, +12.14% from previous year)
- 2021: $53,116 (+$8,831, +19.94% from previous year)
- 2022: $60,063 (+$6,947, +13.08% from previous year)
- 2023: $55,435 (-$4,627, -7.70% from previous year)
- 2024: $61,113 (+$5,677, +10.24% from previous year)
- 2025: $56,539 (-$4,573, -7.48% from previous year)
Home values in Holdenville have surged nearly 89% since 2015, with particularly steep growth between 2020 and 2022. Despite recent dips in 2023 and 2025, the overall trend has remained strongly upward. From under $30,000 in 2015, average home prices rose to over $61,000 in 2024 before settling slightly lower in 2025. That level of appreciation—almost doubling in a decade—shows a market that has matured quickly while remaining accessible to budget-conscious buyers.
Holdenville – An Emerging Market with Strong Momentum

Holdenville is the county seat of Hughes County and serves as a regional hub in east-central Oklahoma. It benefits from a combination of small-town character and steady public infrastructure, including schools, a hospital, and a vibrant historic district. The city is also home to the Davis Correctional Facility and other major employers that help anchor the local economy. Housing values saw a major leap from 2020 to 2022, increasing by over 35% in just two years. That momentum was likely fueled by the broader trend of rural affordability during the pandemic and rising interest in secondary towns with essential services. Even with small corrections afterward, Holdenville’s 2025 price point remains far higher than pre-pandemic levels, pointing to a sustained shift in market value.
Holdenville’s location on U.S. Route 270 keeps it well connected to Shawnee and Ada, while its proximity to lakes and natural spaces makes it appealing for families and retirees alike. The market’s recent volatility is worth noting, but it appears to reflect a broader rebalancing rather than a collapse in demand. For those seeking a well-established town with upward pricing momentum, reliable infrastructure, and a blend of affordability and appreciation, Holdenville presents one of the more dynamic markets on this list. It’s a place that has grown substantially in recent years without losing its small-town core.
5. Ringling – 110.05% Home Price Increase Since 2010
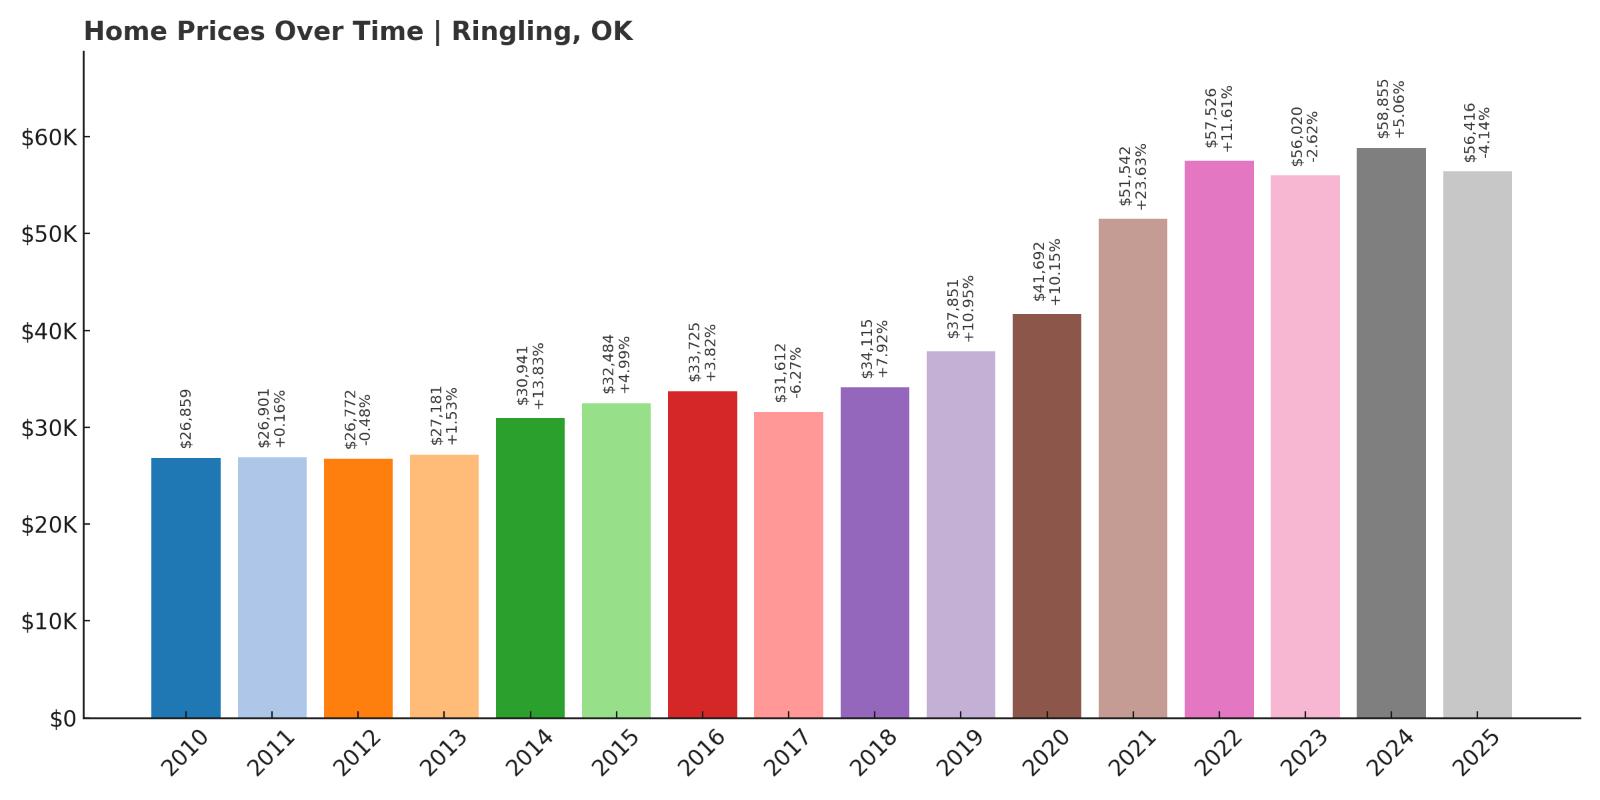
- 2010: $26,859
- 2011: $26,901 (+$42, +0.16% from previous year)
- 2012: $26,772 (-$129, -0.48% from previous year)
- 2013: $27,181 (+$409, +1.53% from previous year)
- 2014: $30,941 (+$3,759, +13.83% from previous year)
- 2015: $32,484 (+$1,544, +4.99% from previous year)
- 2016: $33,725 (+$1,241, +3.82% from previous year)
- 2017: $31,612 (-$2,113, -6.27% from previous year)
- 2018: $34,115 (+$2,503, +7.92% from previous year)
- 2019: $37,851 (+$3,736, +10.95% from previous year)
- 2020: $41,692 (+$3,840, +10.15% from previous year)
- 2021: $51,542 (+$9,851, +23.63% from previous year)
- 2022: $57,526 (+$5,984, +11.61% from previous year)
- 2023: $56,020 (-$1,507, -2.62% from previous year)
- 2024: $58,855 (+$2,836, +5.06% from previous year)
- 2025: $56,416 (-$2,439, -4.14% from previous year)
Ringling’s housing market has more than doubled since 2010, with home values climbing 110% over the past 15 years. The sharpest increases occurred after 2018, with particularly explosive growth between 2020 and 2021. Even after a slight pullback in 2025, the town’s average home price remains well above its pre-pandemic levels, offering strong evidence of long-term market strength in this small Jefferson County community.
Ringling – Big Appreciation in a Small-Town Setting

Ringling sits in south-central Oklahoma and is named after the famous Ringling Brothers of circus fame, who helped finance the town’s railroad connection in the early 1900s. Today, it remains a modest, close-knit community with fewer than 1,000 residents—but its housing market tells a different story. Prices more than doubled since 2010, thanks in part to strong demand for low-cost housing and the appeal of small towns during a time of shifting living preferences. Between 2019 and 2021 alone, Ringling’s average home price rose by over $13,000, or roughly 35%. This spike reflects broader interest in Oklahoma’s least expensive markets, especially those with some historical identity and highway access.
Despite its size, Ringling offers a public school district, basic medical facilities, and a location near oil and agricultural jobs in Jefferson and Carter Counties. U.S. Highway 70 runs through the area, making it relatively easy to reach larger hubs like Ardmore. While the slight declines in 2023 and 2025 may raise questions about long-term volatility, the broader picture remains impressive: sustained appreciation over time, affordability, and consistent housing demand. Ringling is a good example of how even small towns, when positioned well, can become real estate success stories—especially for buyers priced out of urban Oklahoma markets.
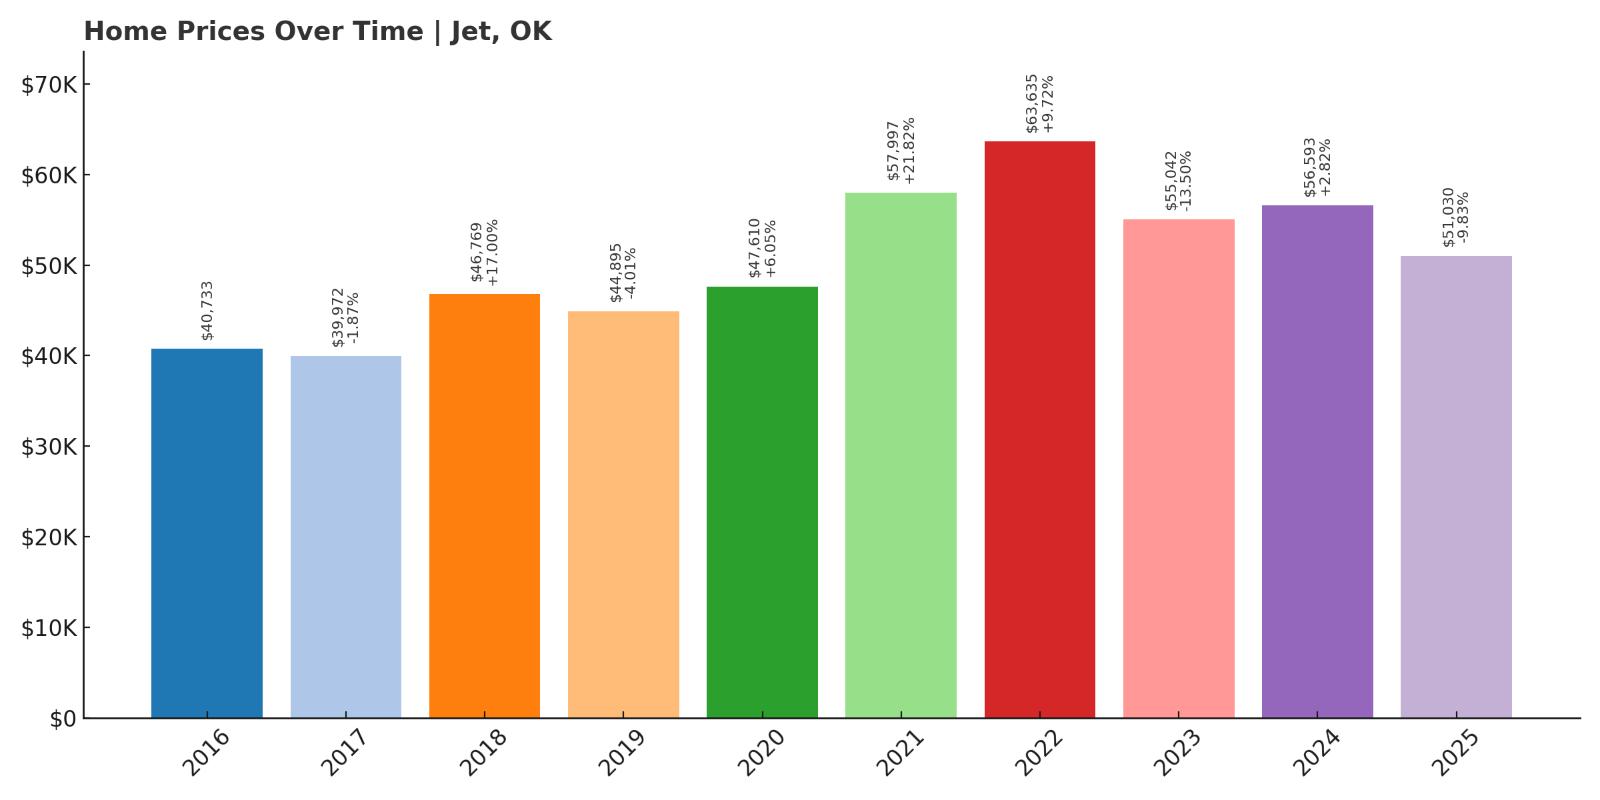
4. Jet – 25.23% Home Price Increase Since 2016
- 2010: N/A
- 2011: N/A
- 2012: N/A
- 2013: N/A
- 2014: N/A
- 2015: N/A
- 2016: $40,733
- 2017: $39,972 (-$761, -1.87% from previous year)
- 2018: $46,769 (+$6,797, +17.00% from previous year)
- 2019: $44,895 (-$1,874, -4.01% from previous year)
- 2020: $47,610 (+$2,715, +6.05% from previous year)
- 2021: $57,997 (+$10,388, +21.82% from previous year)
- 2022: $63,635 (+$5,637, +9.72% from previous year)
- 2023: $55,042 (-$8,593, -13.50% from previous year)
- 2024: $56,593 (+$1,551, +2.82% from previous year)
- 2025: $51,030 (-$5,562, -9.83% from previous year)
Home prices in Jet have increased over 25% since 2016, with most of that growth occurring between 2020 and 2022. The market peaked in 2022 at over $63,000 before falling back to $51,030 by 2025. While recent years have seen corrections, the long-term trend still points upward, especially when compared to the sub-$41,000 baseline in 2016.
Jet – Small Town Living on the Edge of the Salt Plains

Jet is a tiny town in Alfalfa County, best known as the southern gateway to Salt Plains National Wildlife Refuge—a sprawling natural area that draws birdwatchers, campers, and tourists. The town itself has fewer than 300 residents, but its proximity to outdoor recreation and migratory bird routes gives it an unusual draw. Home values began rising sharply in 2020, with a massive 21% jump in 2021 alone. This could have been influenced by pandemic-era travel habits, where more people sought out rural areas with natural amenities. Jet’s relative proximity to Enid, a larger city to the southeast, also makes it a reachable escape for weekenders or remote workers looking for space.
The recent downturn in prices suggests some cooling after rapid growth, but prices are still far higher than they were a decade ago. Jet has remained largely unchanged in terms of population and development, which may help explain its price stability over the years. Basic services are limited, but the town offers peace, sky-filled horizons, and one of Oklahoma’s most unique landscapes just minutes away. For buyers who want solitude and low costs with the bonus of a scenic backdrop, Jet holds a quiet kind of appeal. Its affordability and connection to nature set it apart from other towns on this list.
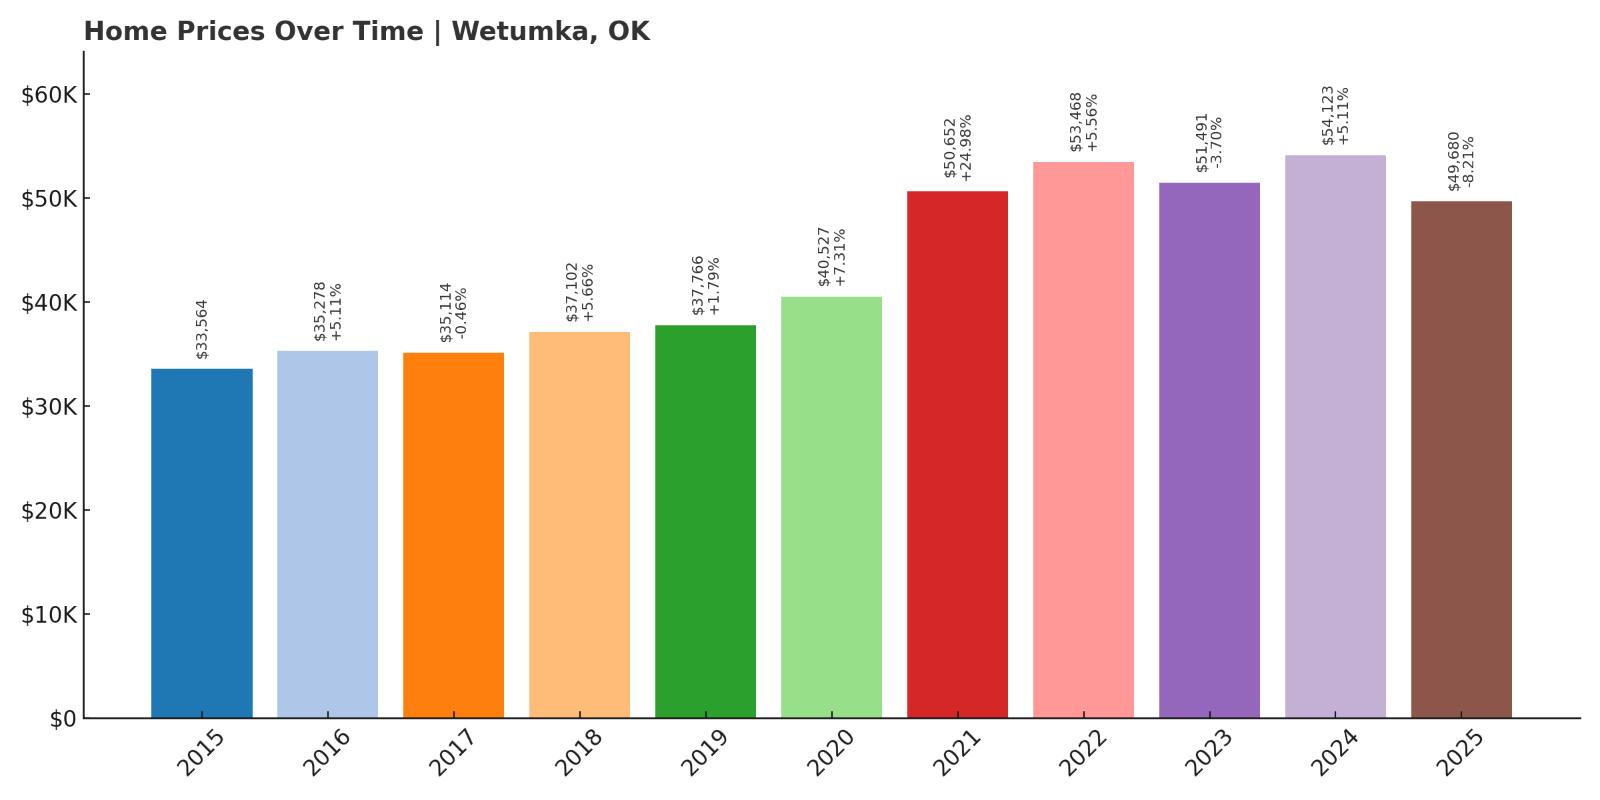
3. Wetumka – 47.96% Home Price Increase Since 2015
- 2010: N/A
- 2011: N/A
- 2012: N/A
- 2013: N/A
- 2014: N/A
- 2015: $33,564
- 2016: $35,278 (+$1,714, +5.11% from previous year)
- 2017: $35,114 (-$163, -0.46% from previous year)
- 2018: $37,102 (+$1,988, +5.66% from previous year)
- 2019: $37,766 (+$664, +1.79% from previous year)
- 2020: $40,527 (+$2,761, +7.31% from previous year)
- 2021: $50,652 (+$10,125, +24.98% from previous year)
- 2022: $53,468 (+$2,816, +5.56% from previous year)
- 2023: $51,491 (-$1,977, -3.70% from previous year)
- 2024: $54,123 (+$2,632, +5.11% from previous year)
- 2025: $49,680 (-$4,442, -8.21% from previous year)
Wetumka’s housing market has grown by nearly 48% since 2015, led by a dramatic price surge in 2021. That single year saw home values jump nearly 25%, a rare increase for a rural market of this size. Prices have dipped slightly since then but remain well above pre-2020 levels, closing 2025 at just under $50,000—still highly affordable by state standards.
Wetumka – Modest Prices, Major Gains

Located in Hughes County, Wetumka is a small town with a deep Native American heritage and a long-standing link to the Muscogee Nation. Despite its size, it has attracted attention for its affordability and central location between Okemah and Holdenville. Its most impressive growth came in 2021 when values jumped by over $10,000—a shift that likely reflected a spike in rural housing demand during the pandemic. That leap changed the town’s trajectory and brought more attention to a market that had previously been slow and steady. While prices have adjusted since then, they haven’t fallen below 2019 levels, which suggests the market found a new, higher baseline.
Wetumka remains a deeply budget-friendly market, yet the data shows it’s not stuck in place. The town has its own school district, some small retail activity, and civic infrastructure that helps anchor residents. The volatility in the last two years may reflect broader regional shifts, but the underlying value proposition remains strong. Buyers interested in Oklahoma’s most affordable markets with room for upward movement will find Wetumka worth watching. Its sharp but sustained growth points to a town gaining traction—not just surviving, but slowly evolving.
2. Grandfield – 53.03% Home Price Increase Since 2010
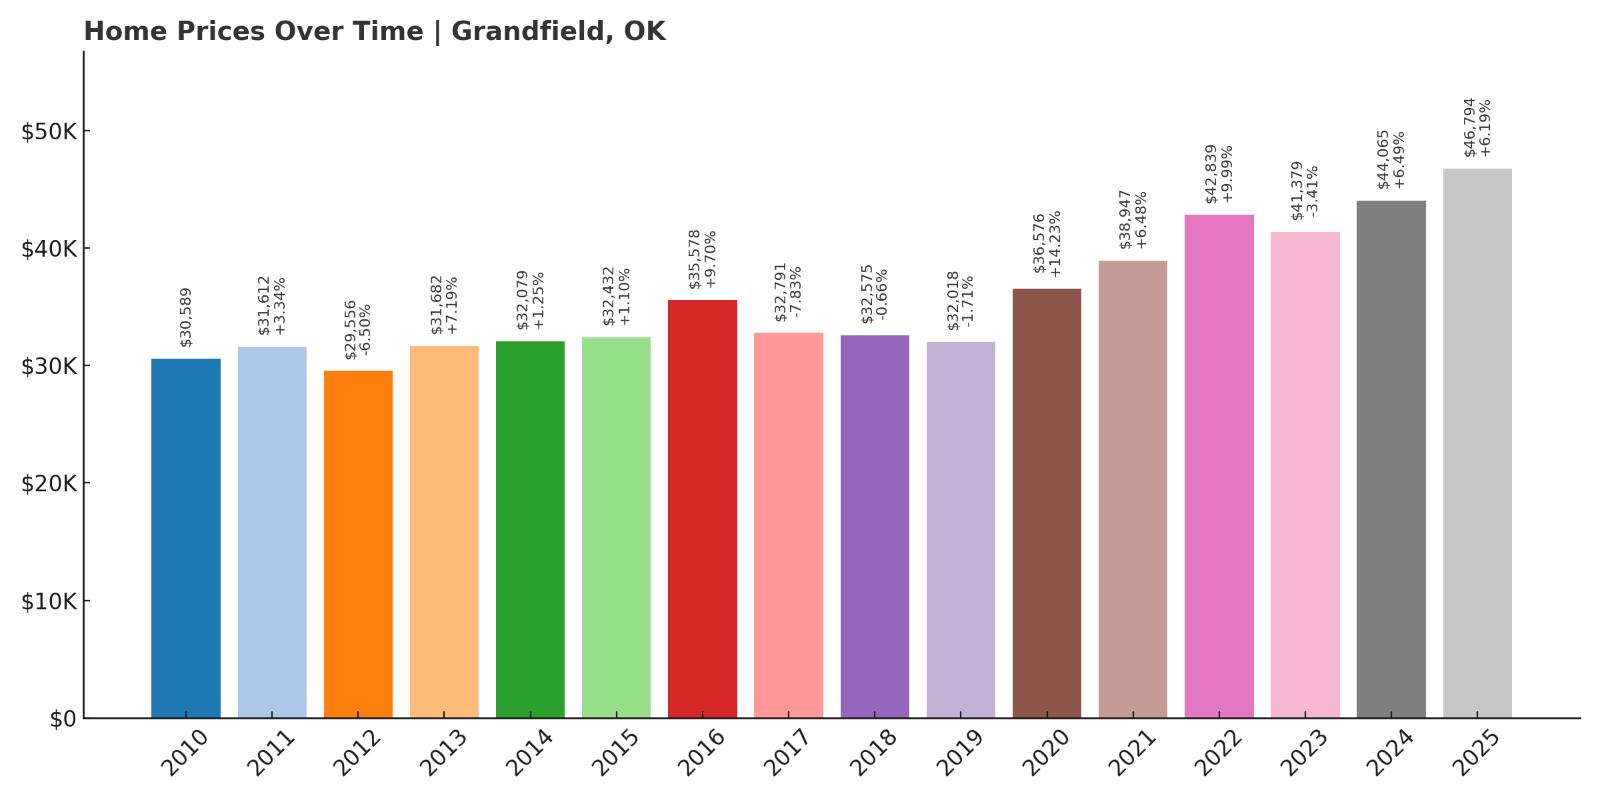
- 2010: $30,589
- 2011: $31,612 (+$1,023, +3.34% from previous year)
- 2012: $29,556 (-$2,056, -6.50% from previous year)
- 2013: $31,682 (+$2,127, +7.19% from previous year)
- 2014: $32,079 (+$396, +1.25% from previous year)
- 2015: $32,432 (+$353, +1.10% from previous year)
- 2016: $35,578 (+$3,146, +9.70% from previous year)
- 2017: $32,791 (-$2,786, -7.83% from previous year)
- 2018: $32,575 (-$217, -0.66% from previous year)
- 2019: $32,018 (-$556, -1.71% from previous year)
- 2020: $36,576 (+$4,557, +14.23% from previous year)
- 2021: $38,947 (+$2,371, +6.48% from previous year)
- 2022: $42,839 (+$3,892, +9.99% from previous year)
- 2023: $41,379 (-$1,460, -3.41% from previous year)
- 2024: $44,065 (+$2,686, +6.49% from previous year)
- 2025: $46,794 (+$2,729, +6.19% from previous year)
Grandfield’s home prices have risen by just over 53% since 2010, with some of the strongest gains occurring between 2020 and 2025. After nearly a decade of flat performance, the town’s market picked up pace, and values climbed consistently for five straight years. In 2025, average prices reached $46,794—still affordable, but notably higher than earlier trends would suggest.
Grandfield – Quiet Progress in a Border Town

Grandfield lies in Tillman County, just north of the Red River and the Texas state line. Historically tied to agriculture and oil services, it has seen periods of economic ups and downs, which are reflected in its earlier housing data. Between 2010 and 2019, values bounced slightly but remained largely unchanged. Then, in 2020, the market began to accelerate. That year marked the beginning of five consecutive years of price growth, totaling more than $10,000 in added value. This momentum suggests that Grandfield, like many rural border towns, benefited from increased interest in lower-cost housing near employment centers in both Oklahoma and Texas.
While still small and relatively quiet, Grandfield offers good access to regional highways and is within reach of Wichita Falls, a major job hub just across the border. This dual access—rural affordability with metropolitan proximity—makes it a smart option for commuters or remote workers. The upward trend in home values shows growing stability, and with prices still under $50,000, Grandfield remains highly accessible. Buyers seeking growth without volatility will find it among the most promising of Oklahoma’s smallest towns.
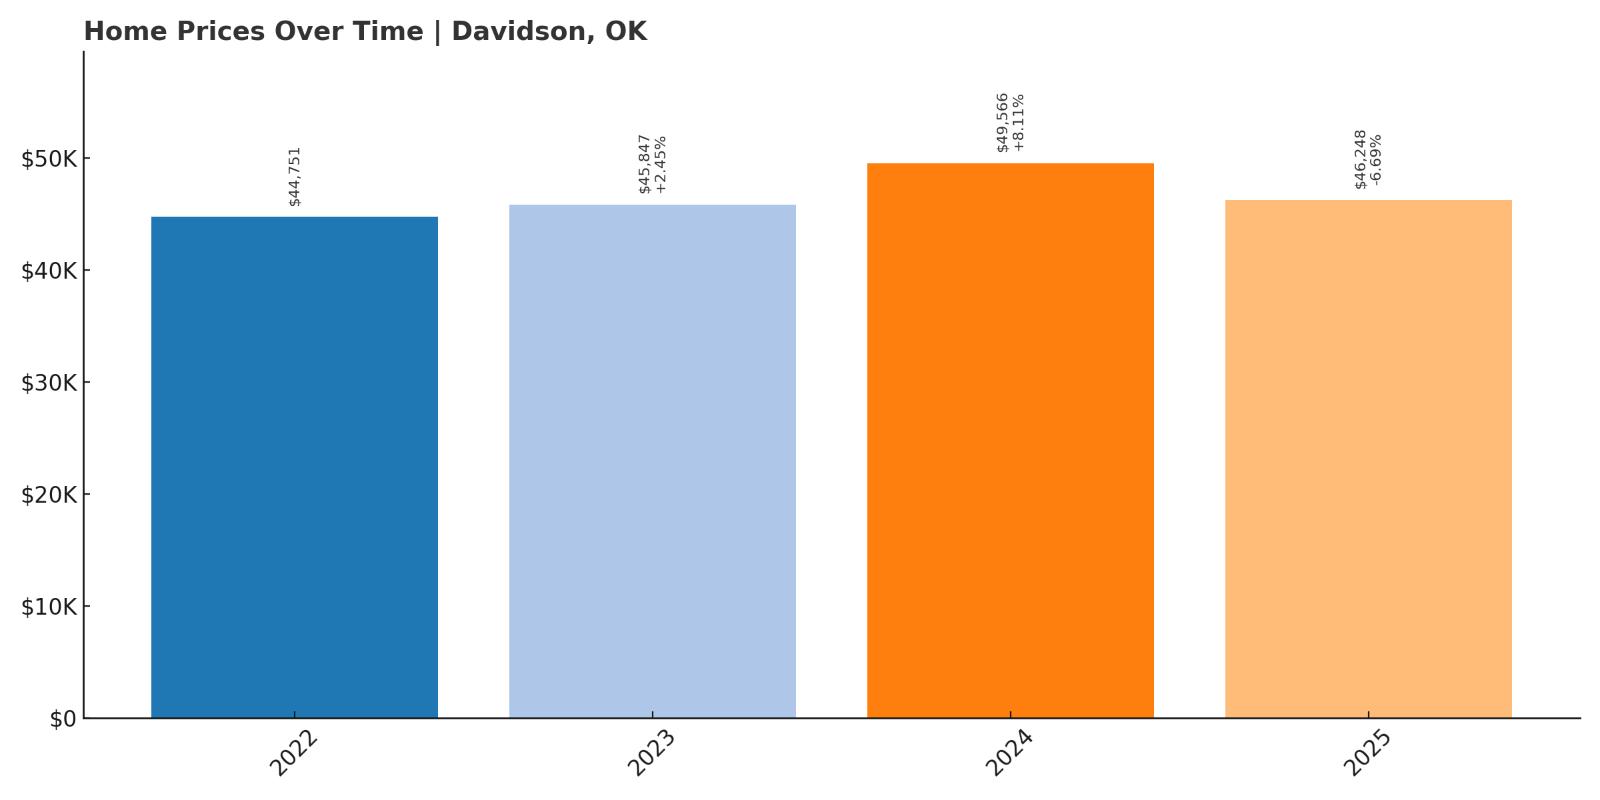
1. Davidson – 3.34% Home Price Increase Since 2022
- 2010: N/A
- 2011: N/A
- 2012: N/A
- 2013: N/A
- 2014: N/A
- 2015: N/A
- 2016: N/A
- 2017: N/A
- 2018: N/A
- 2019: N/A
- 2020: N/A
- 2021: N/A
- 2022: $44,751
- 2023: $45,847 (+$1,096, +2.45% from previous year)
- 2024: $49,566 (+$3,719, +8.11% from previous year)
- 2025: $46,248 (-$3,317, -6.69% from previous year)
Davidson has the least amount of available price history on this list, but even with data starting in 2022, the town has posted a modest 3.34% increase over three years. Prices peaked in 2024 at just under $50,000 before dropping to $46,248 in 2025. Though the recent dip is notable, values remain slightly higher than when Zillow first began tracking the area.
Davidson – A Snapshot of a Market Just Taking Shape

Located in Tillman County, Davidson is a very small town near the Texas border, with a population of just a few hundred people. Its housing market data only goes back to 2022, which limits analysis but also hints at a market in early stages of formal tracking. The town’s average home prices rose by over $4,800 between 2022 and 2024 before falling again in 2025. Despite the drop, this kind of movement in such a small community shows there’s some buyer activity—even if it’s minimal. Davidson’s location near Frederick and the Red River may make it appealing for buyers looking for extremely low-cost housing in a rural setting.
With home values still under $47,000, Davidson is among the most affordable towns in the state. Its small size means services are limited, but for people who prioritize peace, land, and ultra-low housing costs, Davidson remains an option. The lack of earlier data makes long-term trends hard to pinpoint, but the short-term growth and pricing position point to a market that could gain traction as surrounding towns become more expensive. For now, it offers unmatched affordability with signs of modest but real growth.