Would you like to save this?
Fresh numbers from the Zillow Home Value Index show home prices climbing fastest in North Carolina’s most coveted towns—especially along the coast and in the mountains. The 2025 data highlights sharp increases in property values in places where demand is surging and inventory remains tight. From private beachfront enclaves to quiet mountain retreats, these 19 spots stand out for their soaring prices, driven by unique amenities, scenic settings, and growing attention from both local and out-of-state buyers.
Ranked from least to most expensive among North Carolina’s top-tier markets, this snapshot reveals where housing values are rising most—and why. You’ll find when prices jumped, how values have shifted, and what makes these towns stand out in a crowded market.
19. Saint James – 78% Home Price Increase Since 2012
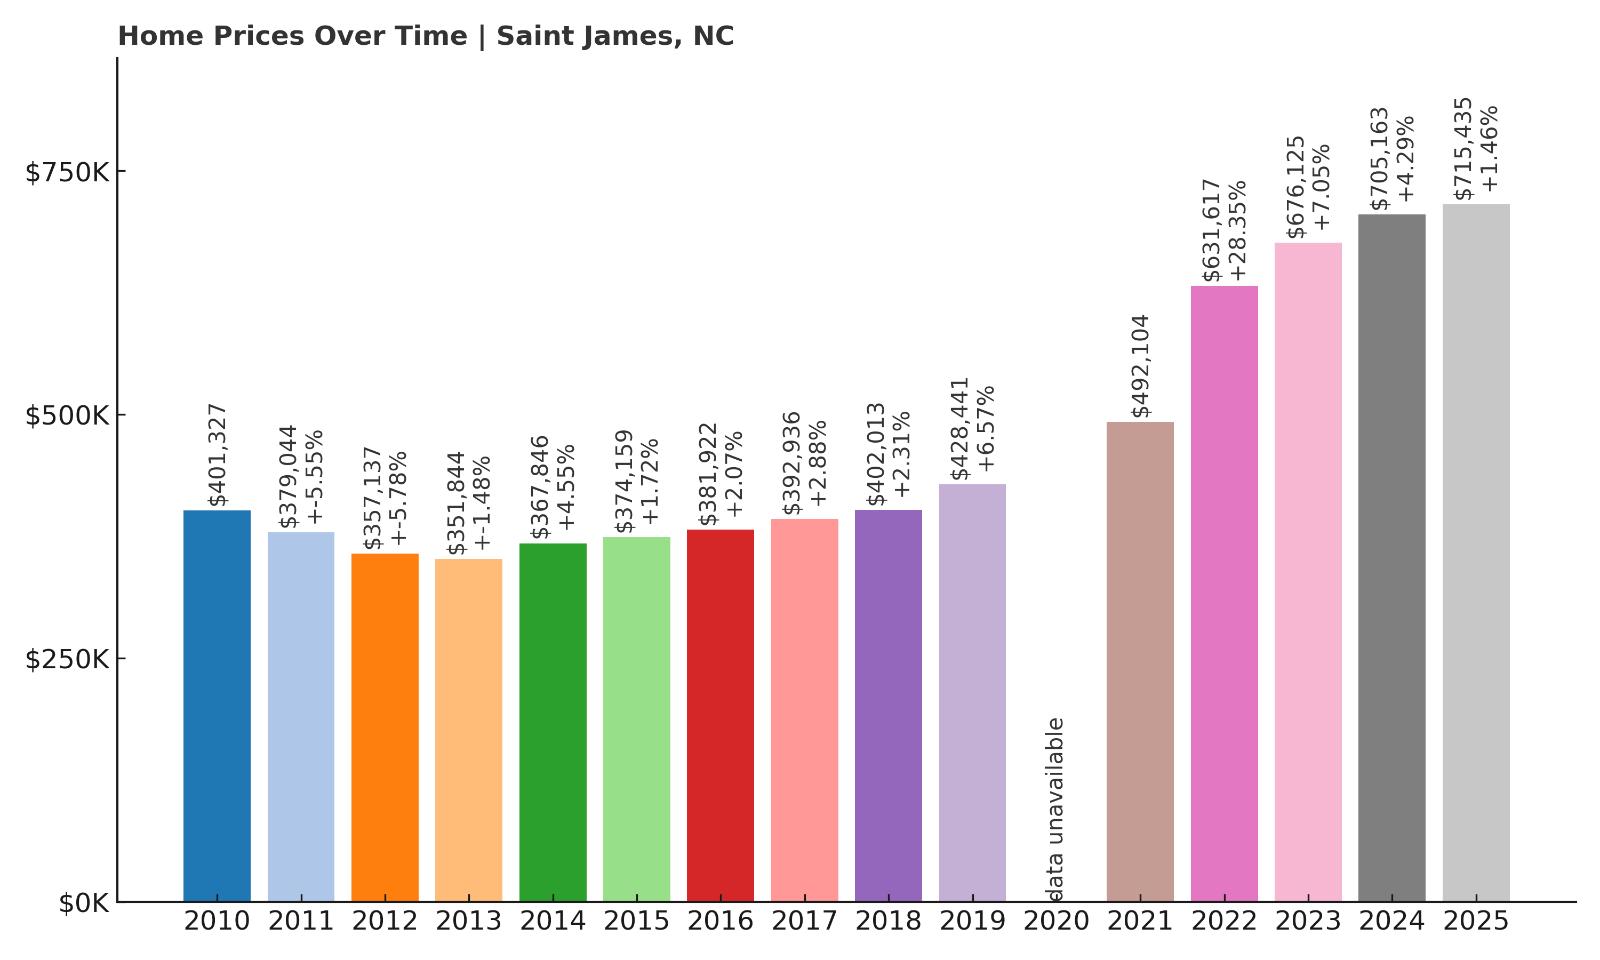
- 2010: $401,327
- 2011: $379,044 (-$22,283, -5.55% from previous year)
- 2012: $357,137 (-$21,907, -5.78% from previous year)
- 2013: $351,844 (-$5,293, -1.48% from previous year)
- 2014: $367,846 (+$16,003, +4.55% from previous year)
- 2015: $374,159 (+$6,312, +1.72% from previous year)
- 2016: $381,922 (+$7,763, +2.07% from previous year)
- 2017: $392,936 (+$11,014, +2.88% from previous year)
- 2018: $402,013 (+$9,077, +2.31% from previous year)
- 2019: $428,441 (+$26,428, +6.57% from previous year)
- 2020: N/A
- 2021: $492,104
- 2022: $631,617 (+$139,512, +28.35% from previous year)
- 2023: $676,125 (+$44,508, +7.05% from previous year)
- 2024: $705,163 (+$29,038, +4.29% from previous year)
- 2025: $715,435 (+$10,272, +1.46% from previous year)
Since 2012, Saint James has seen a home price increase of nearly 78%, rising from $357,137 to $715,435 in 2025. The steepest jump came in 2022, when prices leapt more than 28% in a single year. While recent gains have slowed, the overall trend shows steady appreciation over the past decade. This consistency highlights growing demand for the town’s peaceful setting and high-end coastal living.
Saint James – Private Golf and Gated Luxury on the Cape Fear Coast
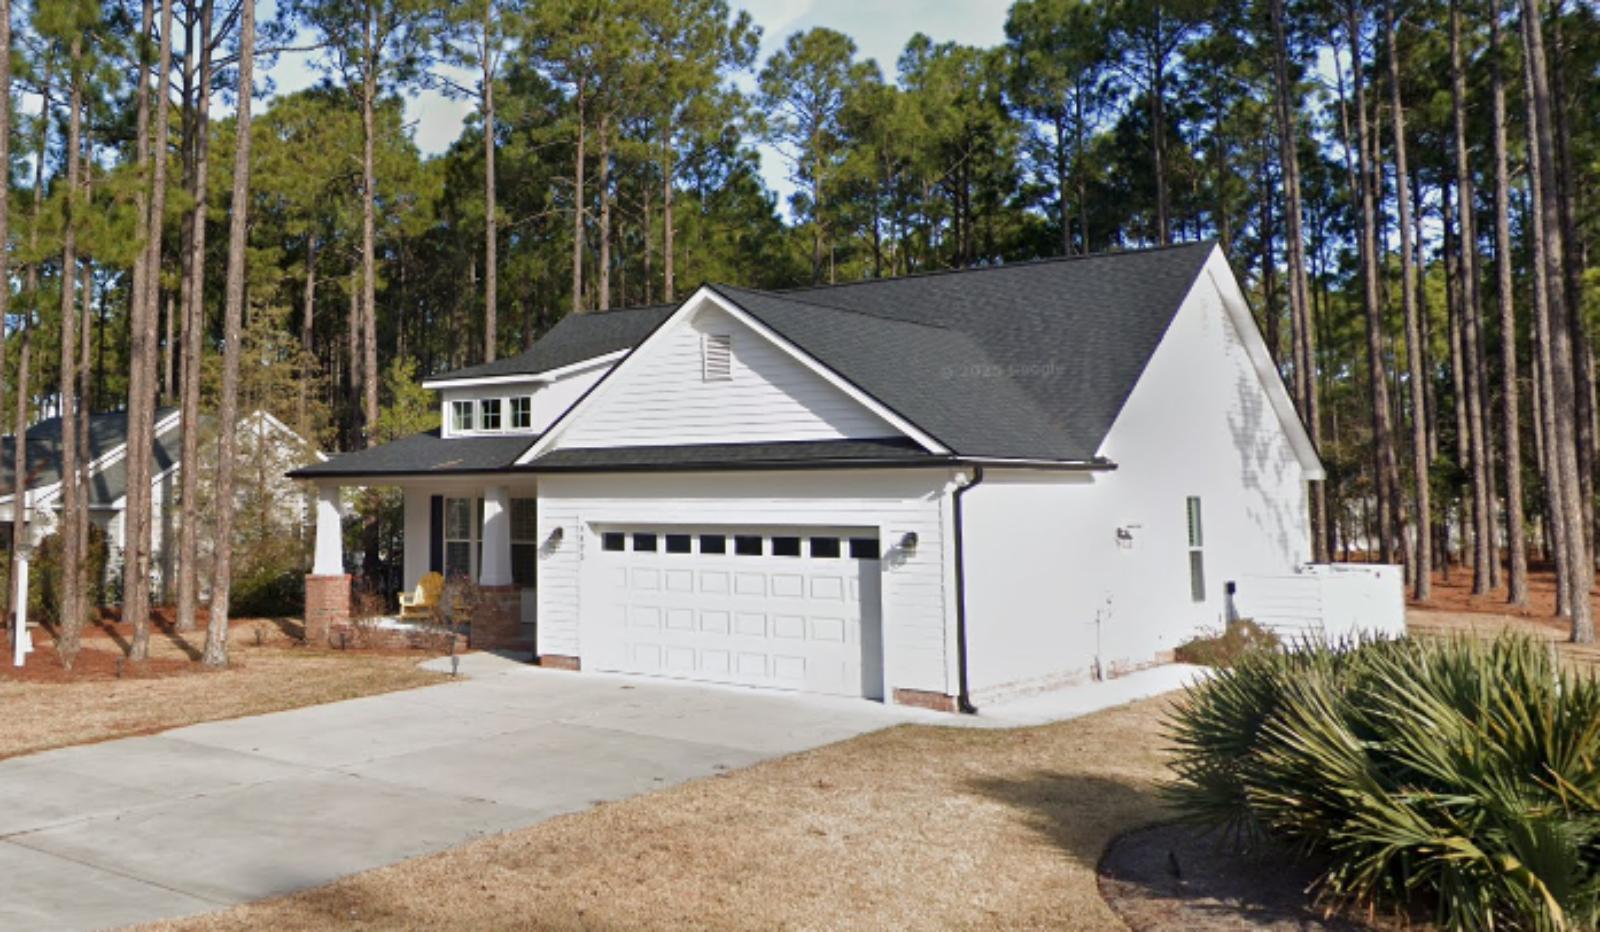
Located near the southern tip of North Carolina’s coast, Saint James is a master-planned, gated community that blends resort-style living with small-town ease. The town is home to several private golf courses, a marina, and scenic walking trails. Its proximity to Southport and the beaches of Oak Island makes it especially attractive to retirees and second-home buyers looking for luxury and leisure. The significant price appreciation mirrors this demand, particularly among those drawn to its low traffic, high security, and well-maintained infrastructure. Despite modest gains in 2025, the town’s long-term value trajectory remains solid.
Saint James also benefits from its reputation as a low-crime, highly maintained community with amenities that rival those of exclusive resorts. As more high-net-worth buyers move into the region, this private enclave continues to hold its status as one of North Carolina’s premier real estate markets.
18. Lake Toxaway – 132% Home Price Increase Since 2012

- 2010: $308,315
- 2011: $305,119 (-$3,196, -1.04% from previous year)
- 2012: $310,090 (+$4,971, +1.63% from previous year)
- 2013: $305,499 (-$4,591, -1.48% from previous year)
- 2014: $315,146 (+$9,647, +3.16% from previous year)
- 2015: $324,142 (+$8,996, +2.85% from previous year)
- 2016: $331,450 (+$7,309, +2.25% from previous year)
- 2017: $346,024 (+$14,574, +4.40% from previous year)
- 2018: $364,481 (+$18,457, +5.33% from previous year)
- 2019: $368,885 (+$4,404, +1.21% from previous year)
- 2020: N/A
- 2021: $466,565
- 2022: $595,410 (+$128,845, +27.62% from previous year)
- 2023: $614,084 (+$18,675, +3.14% from previous year)
- 2024: $664,967 (+$50,882, +8.29% from previous year)
- 2025: $719,602 (+$54,635, +8.22% from previous year)
Lake Toxaway’s median home price has surged from $310,090 in 2012 to $719,602 in 2025, a gain of more than 132%. The area has posted particularly strong appreciation over the past three years, with consecutive year-over-year growth above 8%. This momentum places it among the fastest-rising high-end markets in the state, drawing attention from luxury buyers seeking space, elevation, and privacy.
Lake Toxaway – High-Altitude Luxury in Western NC

Lake Toxaway sits high in the Blue Ridge Mountains, known for its private lake, exclusive homes, and serene environment. At nearly 3,000 feet elevation, the area offers cooler summers and dramatic vistas that appeal to second-home buyers and remote professionals alike. Unlike tourist-heavy mountain towns, Lake Toxaway provides a more secluded experience with high-end homes spread across large lots.
The recent jump in prices likely reflects renewed interest from buyers seeking quiet luxury in post-pandemic markets. The area’s remoteness, paired with upscale amenities like golf clubs and private lake access, has pushed values up sharply. With limited inventory and continued demand for mountain retreats, the upward pressure on home values here shows little sign of slowing.
17. Nags Head – 108% Home Price Increase Since 2012
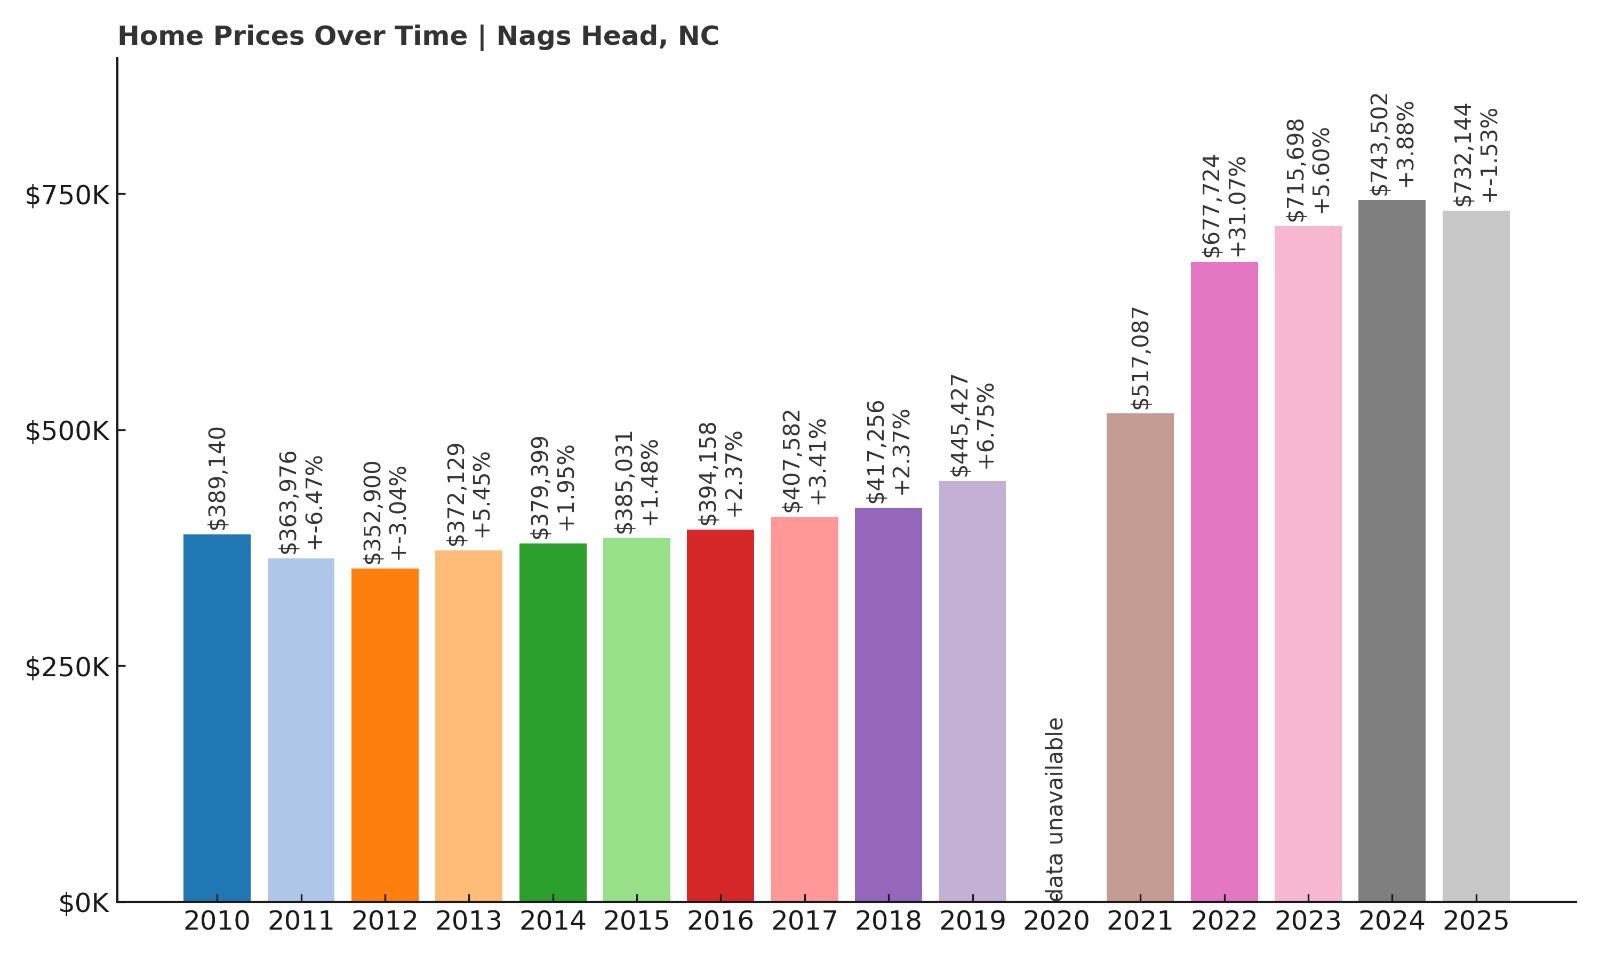
- 2010: $389,140
- 2011: $363,976 (-$25,164, -6.47% from previous year)
- 2012: $352,900 (-$11,076, -3.04% from previous year)
- 2013: $372,129 (+$19,229, +5.45% from previous year)
- 2014: $379,399 (+$7,270, +1.95% from previous year)
- 2015: $385,031 (+$5,632, +1.48% from previous year)
- 2016: $394,158 (+$9,127, +2.37% from previous year)
- 2017: $407,582 (+$13,424, +3.41% from previous year)
- 2018: $417,256 (+$9,674, +2.37% from previous year)
- 2019: $445,427 (+$28,170, +6.75% from previous year)
- 2020: N/A
- 2021: $517,087
- 2022: $677,724 (+$160,637, +31.07% from previous year)
- 2023: $715,698 (+$37,974, +5.60% from previous year)
- 2024: $743,502 (+$27,803, +3.88% from previous year)
- 2025: $732,144 (-$11,358, -1.53% from previous year)
From $352,900 in 2012 to $732,144 in 2025, home prices in Nags Head have more than doubled. Though the latest data shows a slight dip of 1.5%, the town’s overall growth remains strong. Major gains occurred in 2022, with a staggering 31% increase, indicating a surge in demand likely driven by remote work and vacation home interest.
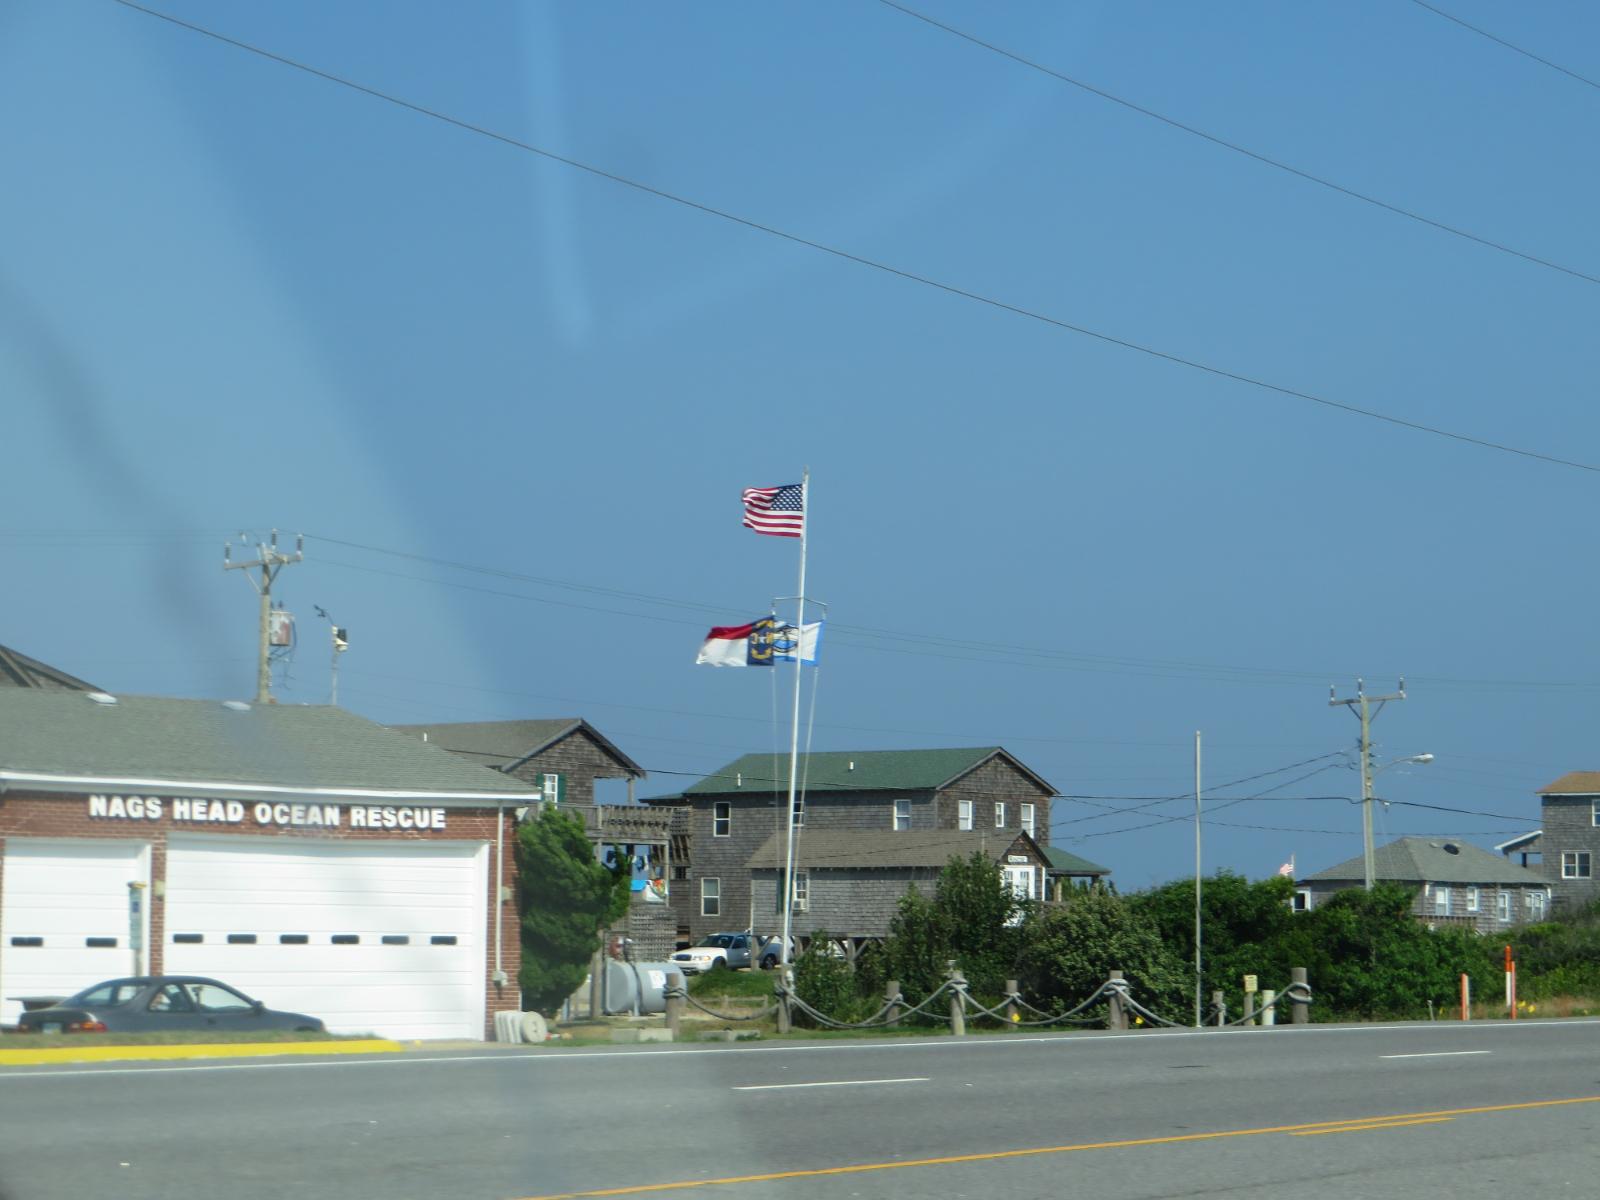
Nags Head – Popular and Pricey on the Outer Banks
Would you like to save this?
Nags Head is one of the most recognizable names on North Carolina’s Outer Banks, a long stretch of barrier islands known for stunning beaches and strong summer tourism. The area blends classic beach-town charm with a growing selection of modern amenities, making it a popular spot for both short-term rentals and seasonal homeowners. Its robust infrastructure, wide beaches, and historic pier make it a perennial favorite for family vacations and second homes.
That visibility comes at a price. The surge in 2022 reflects broader demand for coastal living during the pandemic, when remote work allowed more people to live where they vacation. Although prices dipped slightly in 2025, they remain well above pre-2021 levels. With oceanfront property increasingly scarce, Nags Head’s real estate market continues to command top dollar on the Outer Banks.
16. Blowing Rock – 111% Home Price Increase Since 2012
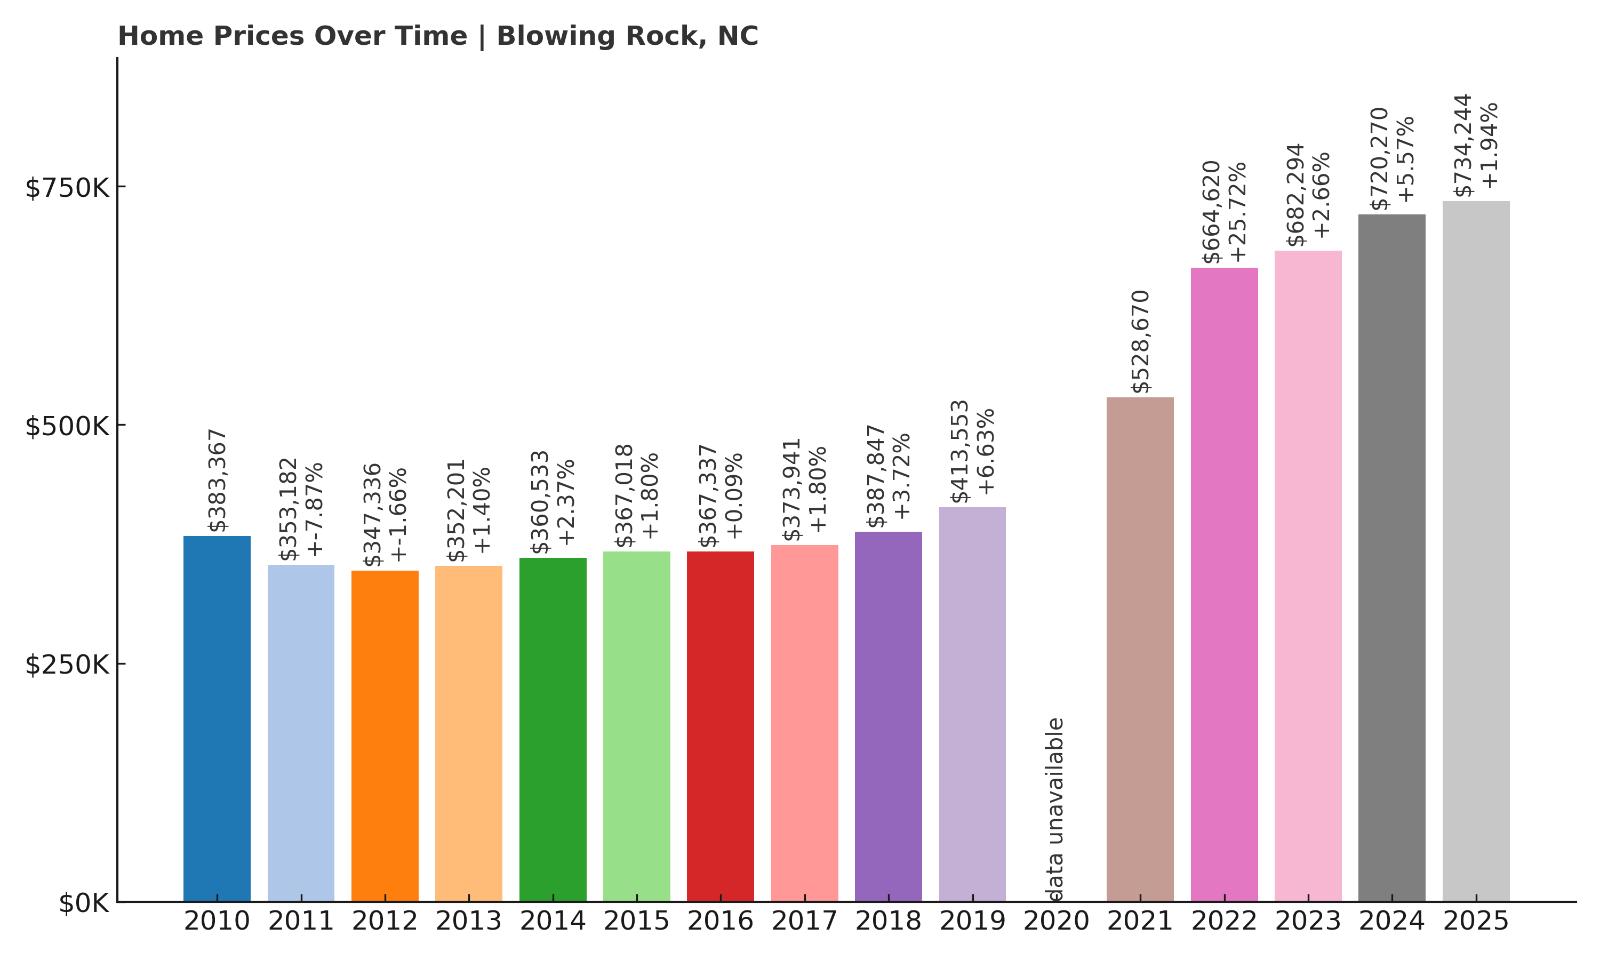
- 2010: $383,367
- 2011: $353,182 (-$30,185, -7.87% from previous year)
- 2012: $347,336 (-$5,846, -1.66% from previous year)
- 2013: $352,201 (+$4,866, +1.40% from previous year)
- 2014: $360,533 (+$8,332, +2.37% from previous year)
- 2015: $367,018 (+$6,484, +1.80% from previous year)
- 2016: $367,337 (+$319, +0.09% from previous year)
- 2017: $373,941 (+$6,604, +1.80% from previous year)
- 2018: $387,847 (+$13,906, +3.72% from previous year)
- 2019: $413,553 (+$25,706, +6.63% from previous year)
- 2020: N/A
- 2021: $528,670
- 2022: $664,620 (+$135,950, +25.72% from previous year)
- 2023: $682,294 (+$17,674, +2.66% from previous year)
- 2024: $720,270 (+$37,976, +5.57% from previous year)
- 2025: $734,244 (+$13,974, +1.94% from previous year)
Home prices in Blowing Rock jumped 111% from $347,336 in 2012 to $734,244 in 2025. After a steady climb, the market exploded in 2021–2022 with a 25% increase in a single year. The town’s enduring popularity and limited supply have helped it remain one of the top-priced mountain destinations in the state.
Blowing Rock – Scenic Elevation Meets Serious Real Estate

Blowing Rock, perched along the Blue Ridge Parkway, has long attracted visitors with its mountain views, art galleries, and upscale boutiques. It’s one of North Carolina’s most charming small towns and a favorite for weekend getaways. Those seeking year-round living enjoy its well-maintained neighborhoods and walkable downtown.
The spike in home values aligns with increased demand from retirees and second-home buyers, especially during and after the pandemic. As remote workers sought cooler climates and scenic escapes, Blowing Rock’s limited inventory pushed prices higher. Despite a modest increase in 2025, long-term appreciation remains robust.
15. Emerald Isle – 99% Home Price Increase Since 2012
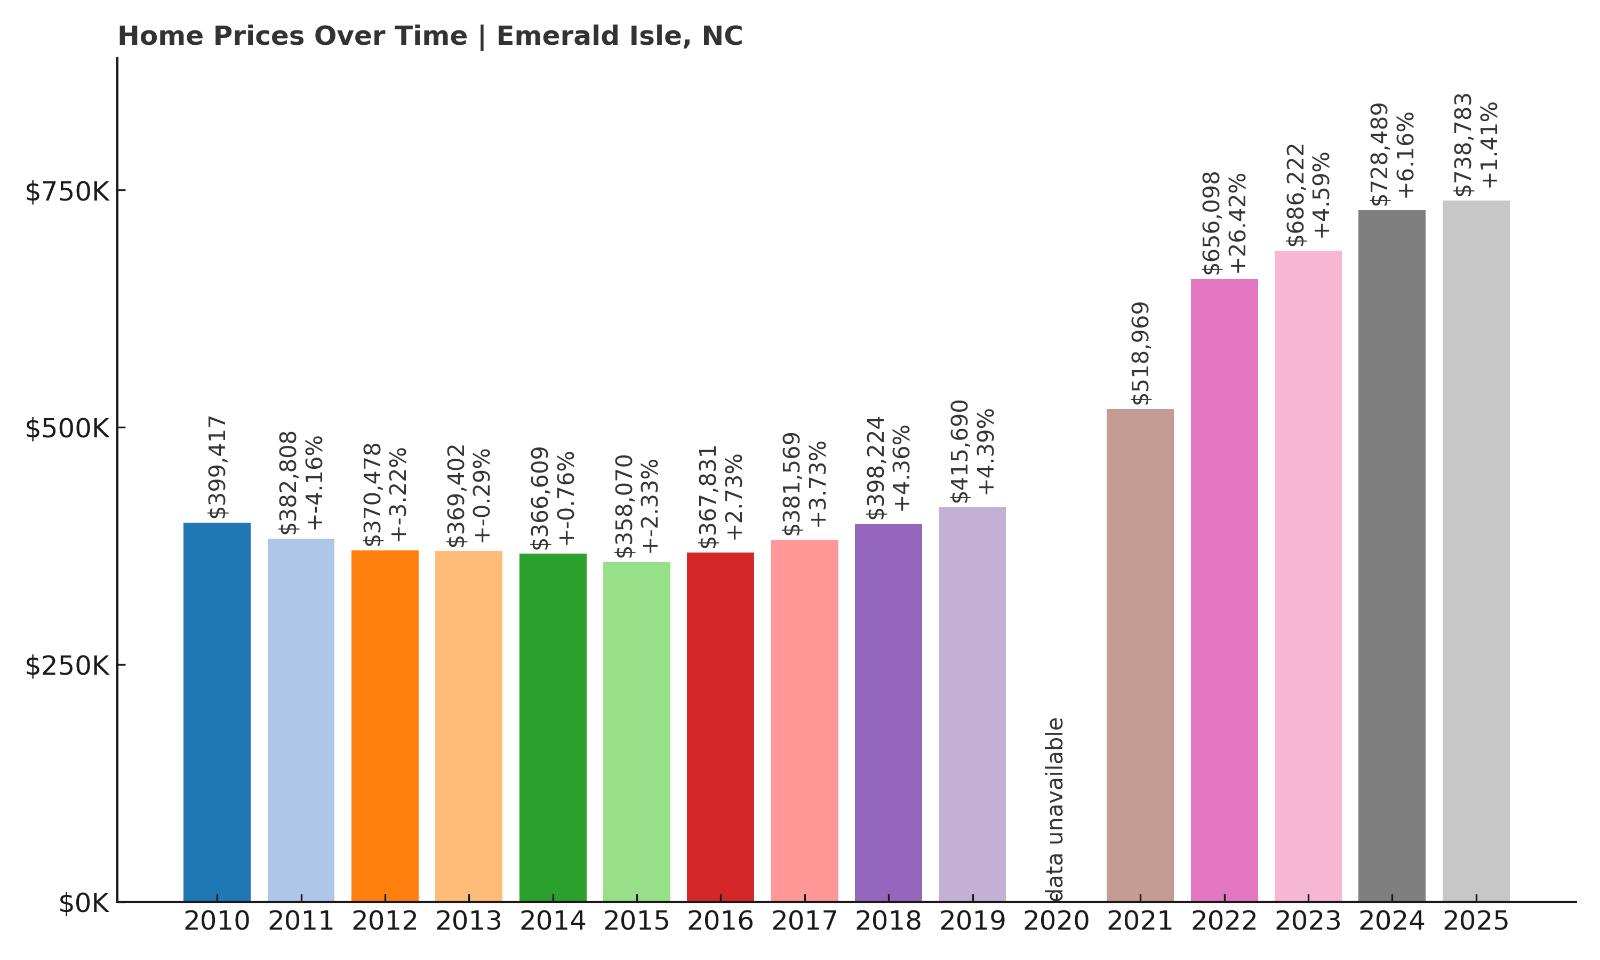
- 2010: $399,417
- 2011: $382,808 (-$16,610, -4.16% from previous year)
- 2012: $370,478 (-$12,330, -3.22% from previous year)
- 2013: $369,402 (-$1,077, -0.29% from previous year)
- 2014: $366,609 (-$2,792, -0.76% from previous year)
- 2015: $358,070 (-$8,539, -2.33% from previous year)
- 2016: $367,831 (+$9,761, +2.73% from previous year)
- 2017: $381,569 (+$13,738, +3.73% from previous year)
- 2018: $398,224 (+$16,655, +4.36% from previous year)
- 2019: $415,690 (+$17,466, +4.39% from previous year)
- 2020: N/A
- 2021: $518,969
- 2022: $656,098 (+$137,129, +26.42% from previous year)
- 2023: $686,222 (+$30,124, +4.59% from previous year)
- 2024: $728,489 (+$42,267, +6.16% from previous year)
- 2025: $738,783 (+$10,294, +1.41% from previous year)
Emerald Isle home prices have nearly doubled since 2012, rising from $370,478 to $738,783 by 2025. The strongest gains happened between 2021 and 2022, with a jump of over $137,000. While recent growth has slowed, the upward trend continues in this desirable coastal town.
Emerald Isle – Classic Beach Living with Consistent Demand
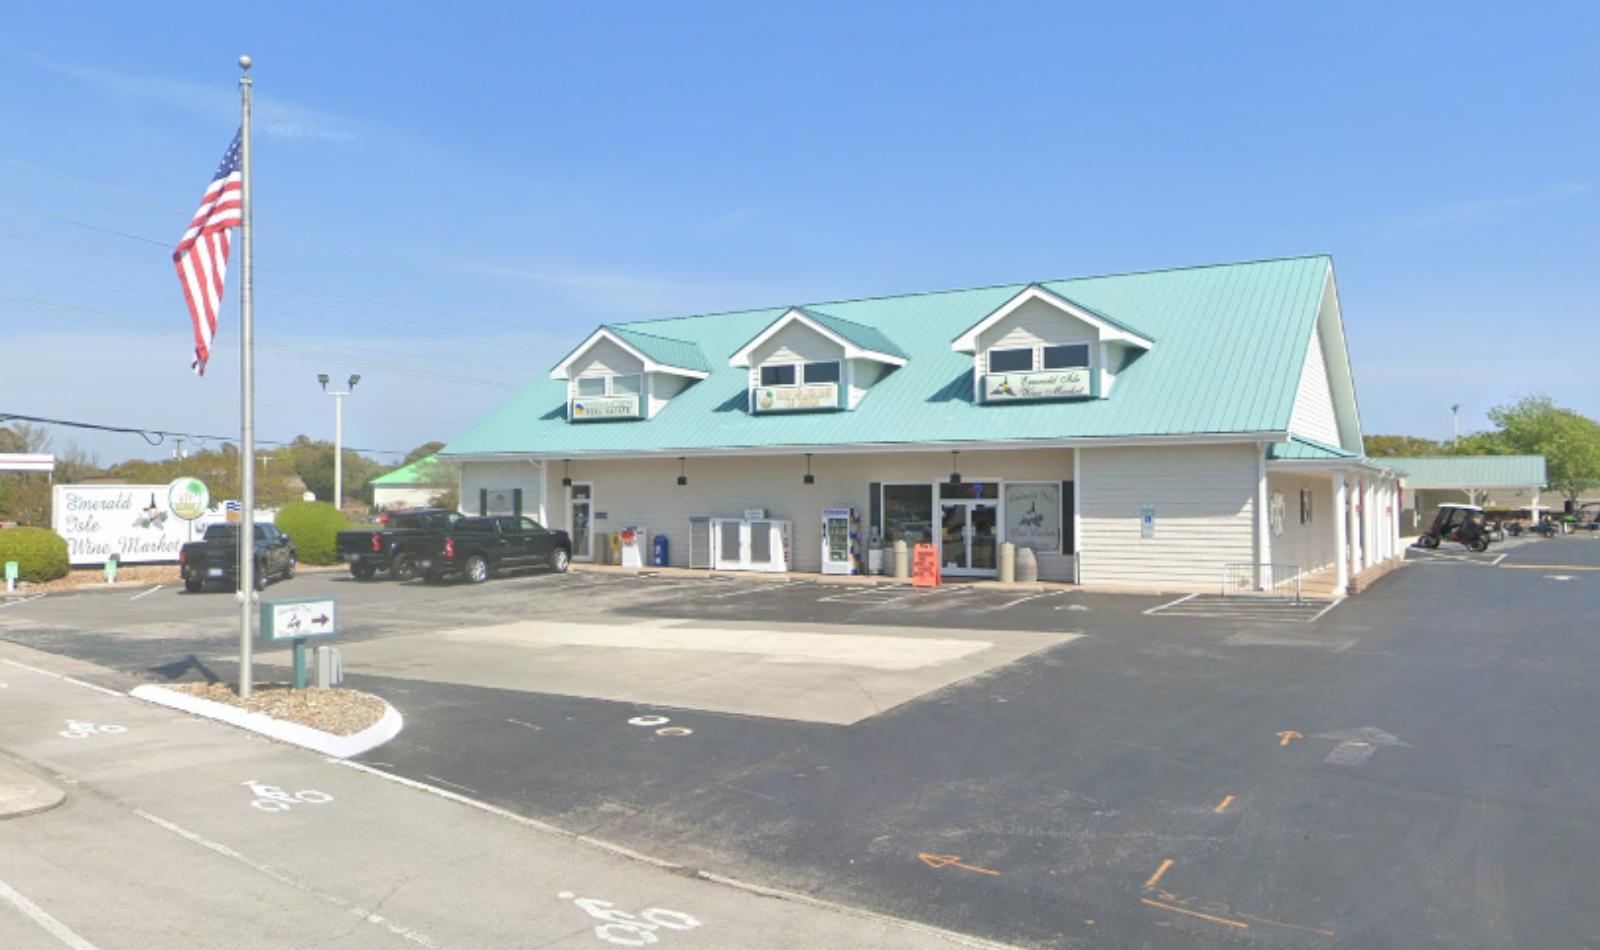
Located along North Carolina’s Crystal Coast, Emerald Isle is known for its family-friendly beaches, bike paths, and laid-back atmosphere. It’s a go-to summer destination that also draws long-term buyers seeking peaceful, oceanfront living. The town’s small footprint and zoning restrictions limit development, keeping demand high and supply low.
Its home prices surged as vacationers and remote workers sought refuge during the pandemic. Since then, the market has stabilized but continues to inch upward. Emerald Isle’s nearly 100% price increase over the past decade reflects both its natural beauty and steady buyer interest in beachside property that’s a bit off the beaten path.
14. Glenville – 110% Home Price Increase Since 2012
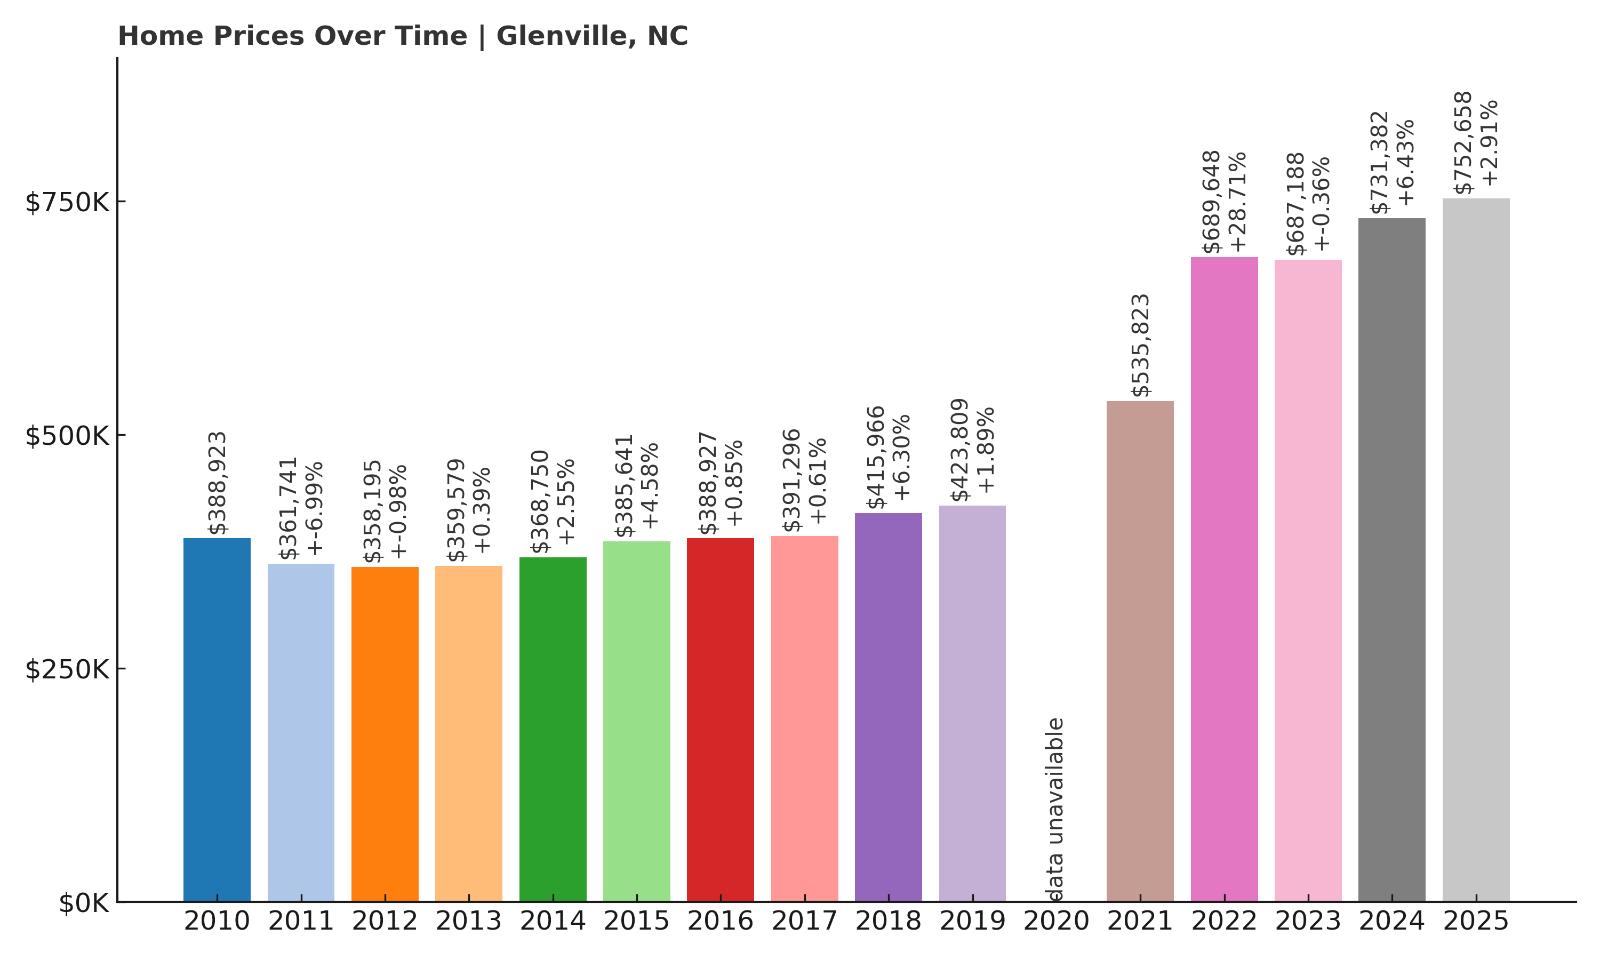
- 2010: $388,923
- 2011: $361,741 (-$27,182, -6.99% from previous year)
- 2012: $358,195 (-$3,546, -0.98% from previous year)
- 2013: $359,579 (+$1,385, +0.39% from previous year)
- 2014: $368,750 (+$9,170, +2.55% from previous year)
- 2015: $385,641 (+$16,892, +4.58% from previous year)
- 2016: $388,927 (+$3,286, +0.85% from previous year)
- 2017: $391,296 (+$2,369, +0.61% from previous year)
- 2018: $415,966 (+$24,671, +6.30% from previous year)
- 2019: $423,809 (+$7,842, +1.89% from previous year)
- 2020: N/A
- 2021: $535,823
- 2022: $689,648 (+$153,826, +28.71% from previous year)
- 2023: $687,188 (-$2,460, -0.36% from previous year)
- 2024: $731,382 (+$44,194, +6.43% from previous year)
- 2025: $752,658 (+$21,276, +2.91% from previous year)
Glenville’s home values have climbed from $358,195 in 2012 to $752,658 in 2025 — a 110% increase. The strongest single-year gain came in 2022, when prices jumped nearly 29%. The market briefly dipped in 2023 but rebounded with consistent growth over the next two years. Overall, Glenville has shown stable long-term appreciation with a few standout surges. This track record makes it one of western North Carolina’s most valuable markets for upscale buyers. While inventory remains tight, demand continues to increase, especially among second-home seekers. The town’s elevation and scenic surroundings have helped maintain its appeal. Even as growth moderates, Glenville remains a high-performing, resilient market in the state’s real estate landscape.
Glenville – Mountain Lake Living in the Cashiers Plateau
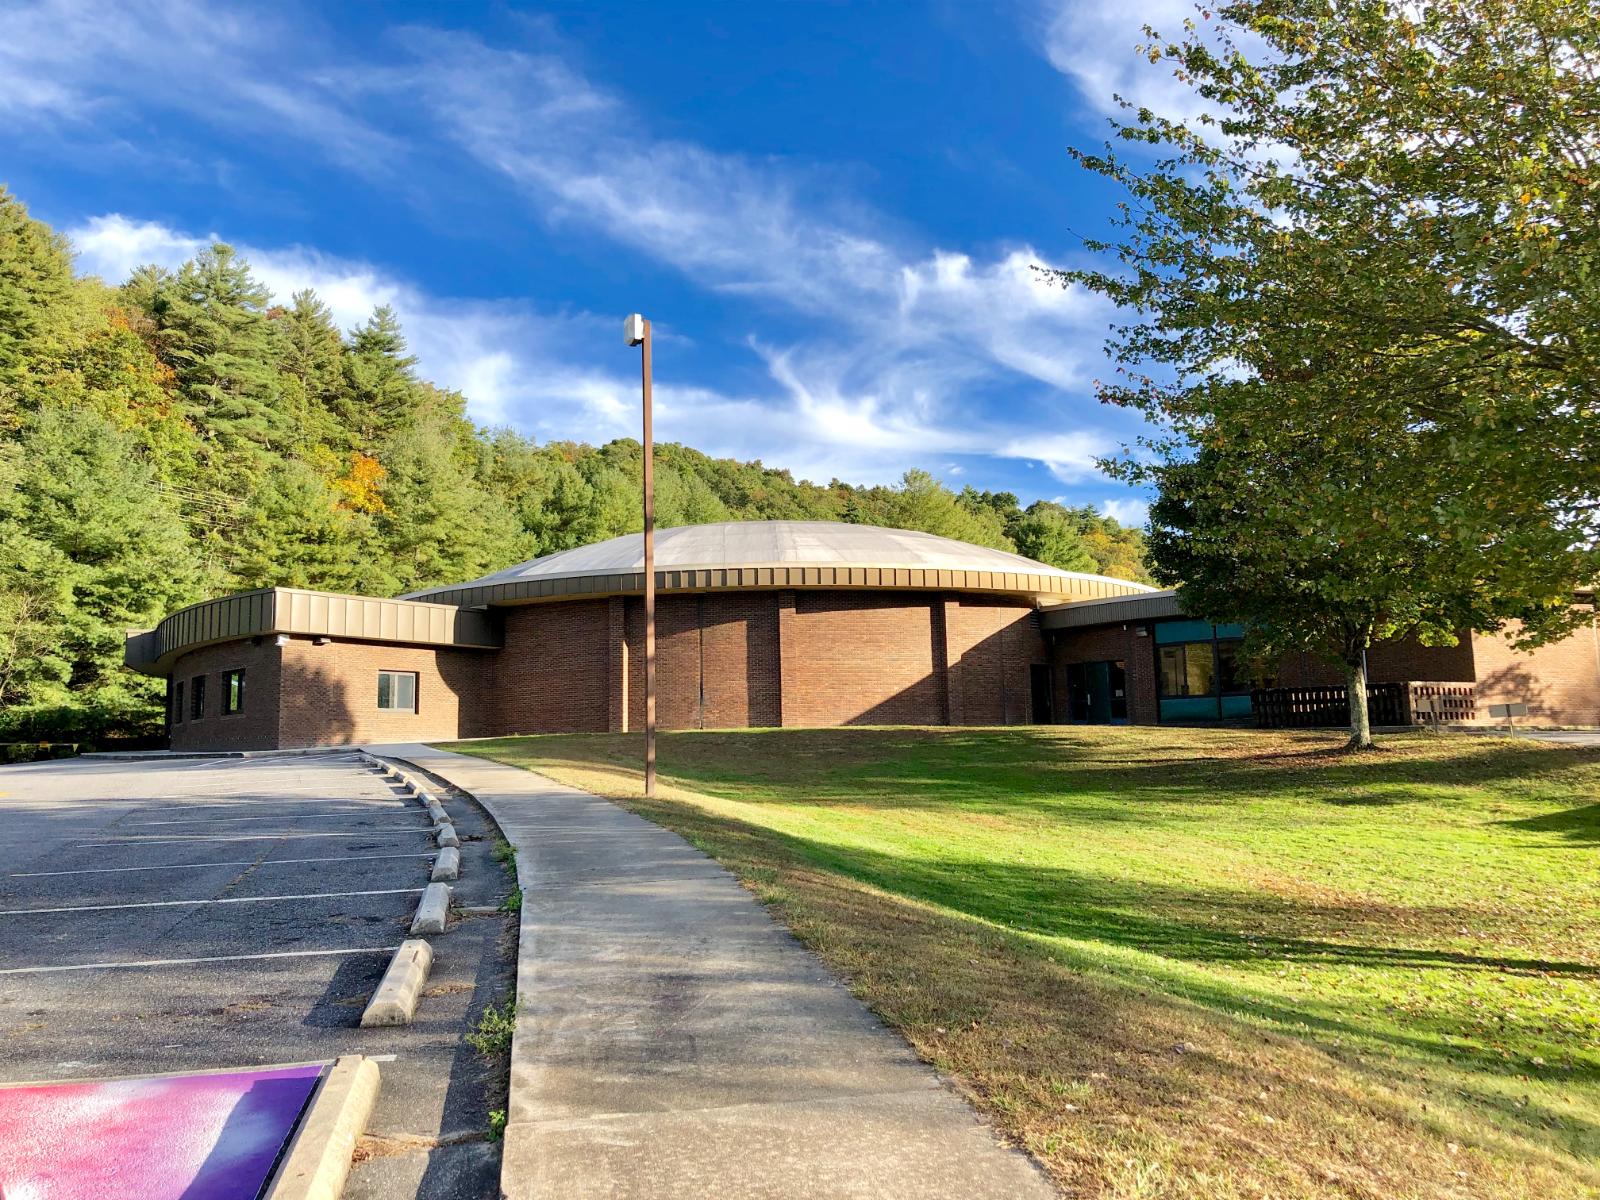
Glenville is tucked in the Blue Ridge Mountains of Jackson County and surrounds the highest-elevation lake east of the Mississippi River. At over 3,400 feet, it offers cool summers, clean air, and picturesque views — all factors driving its rising property values. The town’s proximity to Cashiers and Highlands adds even more appeal, giving residents access to shopping, dining, and golf within a short drive. Homes in Glenville tend to be large, with scenic vistas and water access, making them perfect for seasonal residents and luxury buyers. The town also benefits from tight zoning and environmental protections, which restrict overdevelopment and help preserve its charm. The local market attracts retirees, professionals working remotely, and vacationers from the Southeast. Buyers looking for a quiet, upscale mountain retreat are drawn to Glenville’s balance of nature and comfort. With continued demand and very limited supply, its price trajectory is likely to remain strong for years to come.
13. Kure Beach – 128% Home Price Increase Since 2012
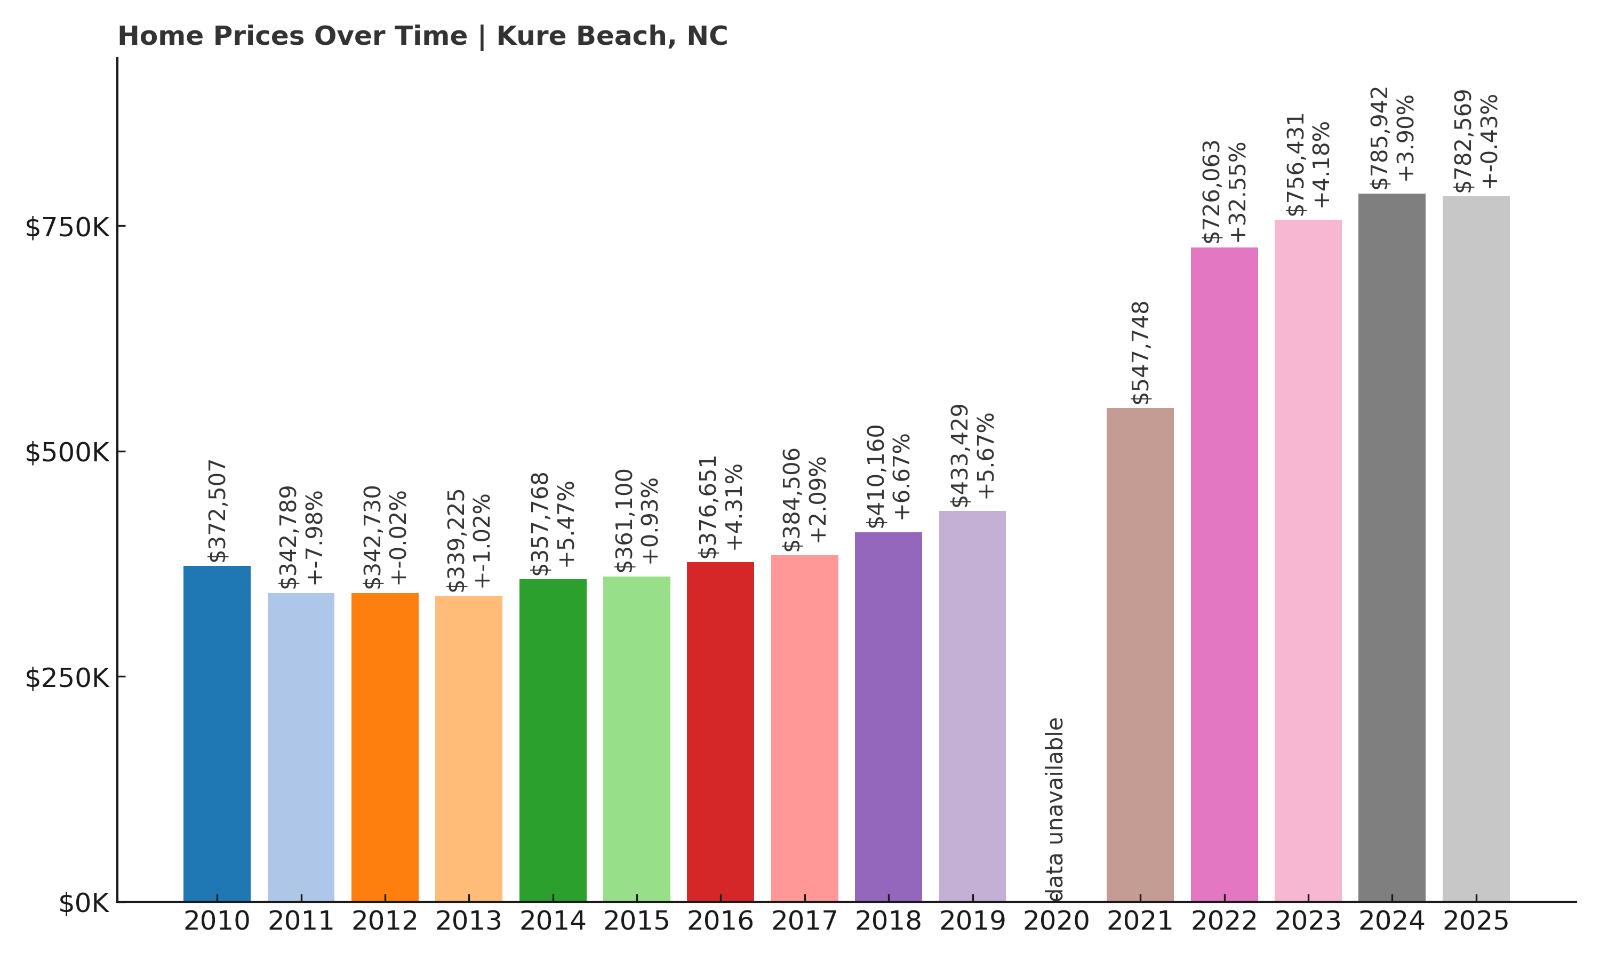
- 2010: $372,507
- 2011: $342,789 (-$29,719, -7.98% from previous year)
- 2012: $342,730 (-$59, -0.02% from previous year)
- 2013: $339,225 (-$3,505, -1.02% from previous year)
- 2014: $357,768 (+$18,543, +5.47% from previous year)
- 2015: $361,100 (+$3,332, +0.93% from previous year)
- 2016: $376,651 (+$15,551, +4.31% from previous year)
- 2017: $384,506 (+$7,856, +2.09% from previous year)
- 2018: $410,160 (+$25,654, +6.67% from previous year)
- 2019: $433,429 (+$23,269, +5.67% from previous year)
- 2020: N/A
- 2021: $547,748
- 2022: $726,063 (+$178,315, +32.55% from previous year)
- 2023: $756,431 (+$30,369, +4.18% from previous year)
- 2024: $785,942 (+$29,510, +3.90% from previous year)
- 2025: $782,569 (-$3,373, -0.43% from previous year)
Kure Beach saw home prices more than double between 2012 and 2025, with values rising from $342,730 to $782,569 — a gain of 128%. The biggest increase came in 2022, when home values jumped by over 32%. Although 2025 saw a very slight decline of 0.43%, the overall trajectory has been sharply upward. The town’s steady appreciation is largely due to its oceanfront location and limited buildable land. Consistent year-over-year gains, especially in the late 2010s, set the stage for the explosive growth that followed. Strong interest from vacation-home buyers and retirees has helped maintain pricing strength. Despite some softening, prices remain historically high. Kure Beach has proven to be one of the state’s most resilient and sought-after waterfront markets.
Kure Beach – Quiet Shores with Coastal Demand
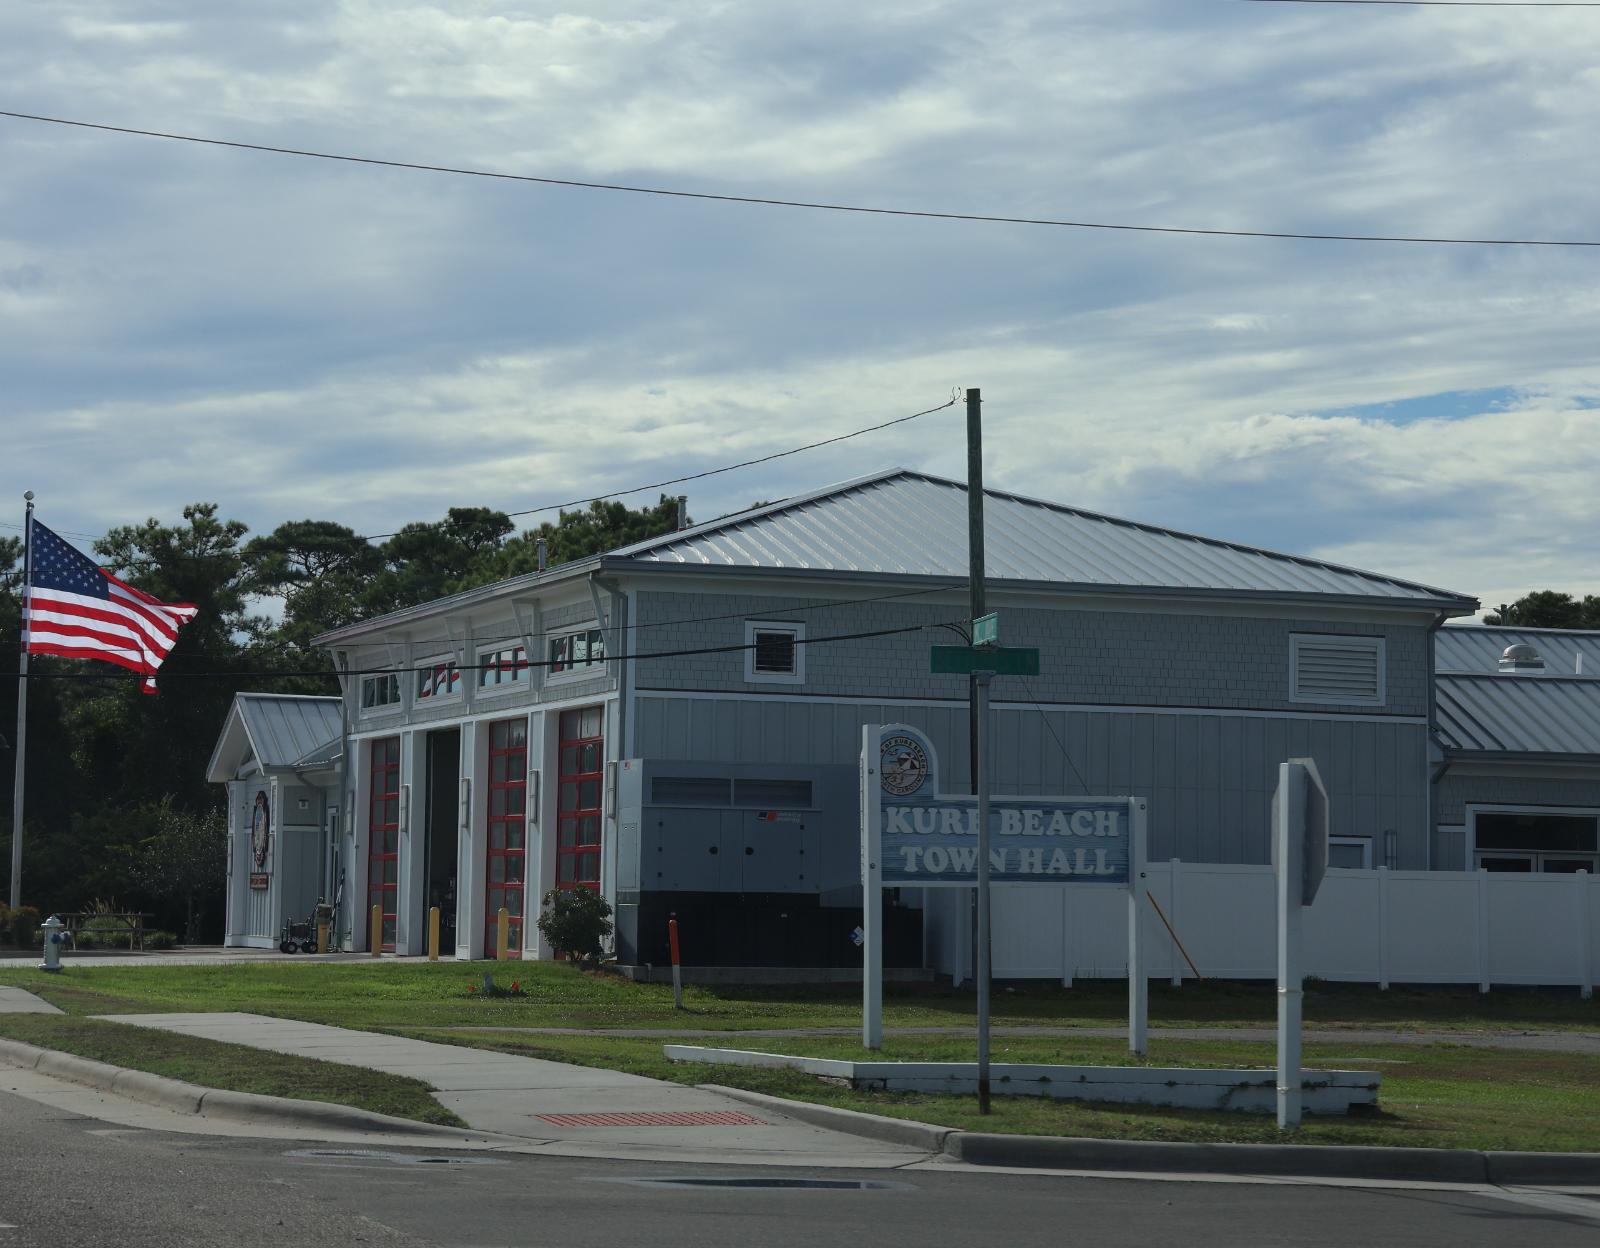
Kure Beach sits on Pleasure Island, just south of Carolina Beach, and offers a quieter alternative to the busier tourist areas nearby. Its appeal lies in its balance of accessibility and serenity, with attractions like Fort Fisher and the North Carolina Aquarium located just minutes away. The town’s zoning keeps high-rises and overdevelopment in check, helping to preserve its laid-back, residential feel. Most homes are single-family properties, often with beach views or just steps from the shoreline. The local economy is boosted by tourism, but Kure Beach has become a favorite for permanent residents as well. Many buyers are retirees or remote workers looking to escape urban sprawl while enjoying the Atlantic coast. The strong 2022 price surge was likely fueled by limited inventory and rising interest in vacation homes. Even with the recent leveling off, Kure Beach remains a top-tier coastal market in North Carolina.
12. Southern Shores – 102% Home Price Increase Since 2012
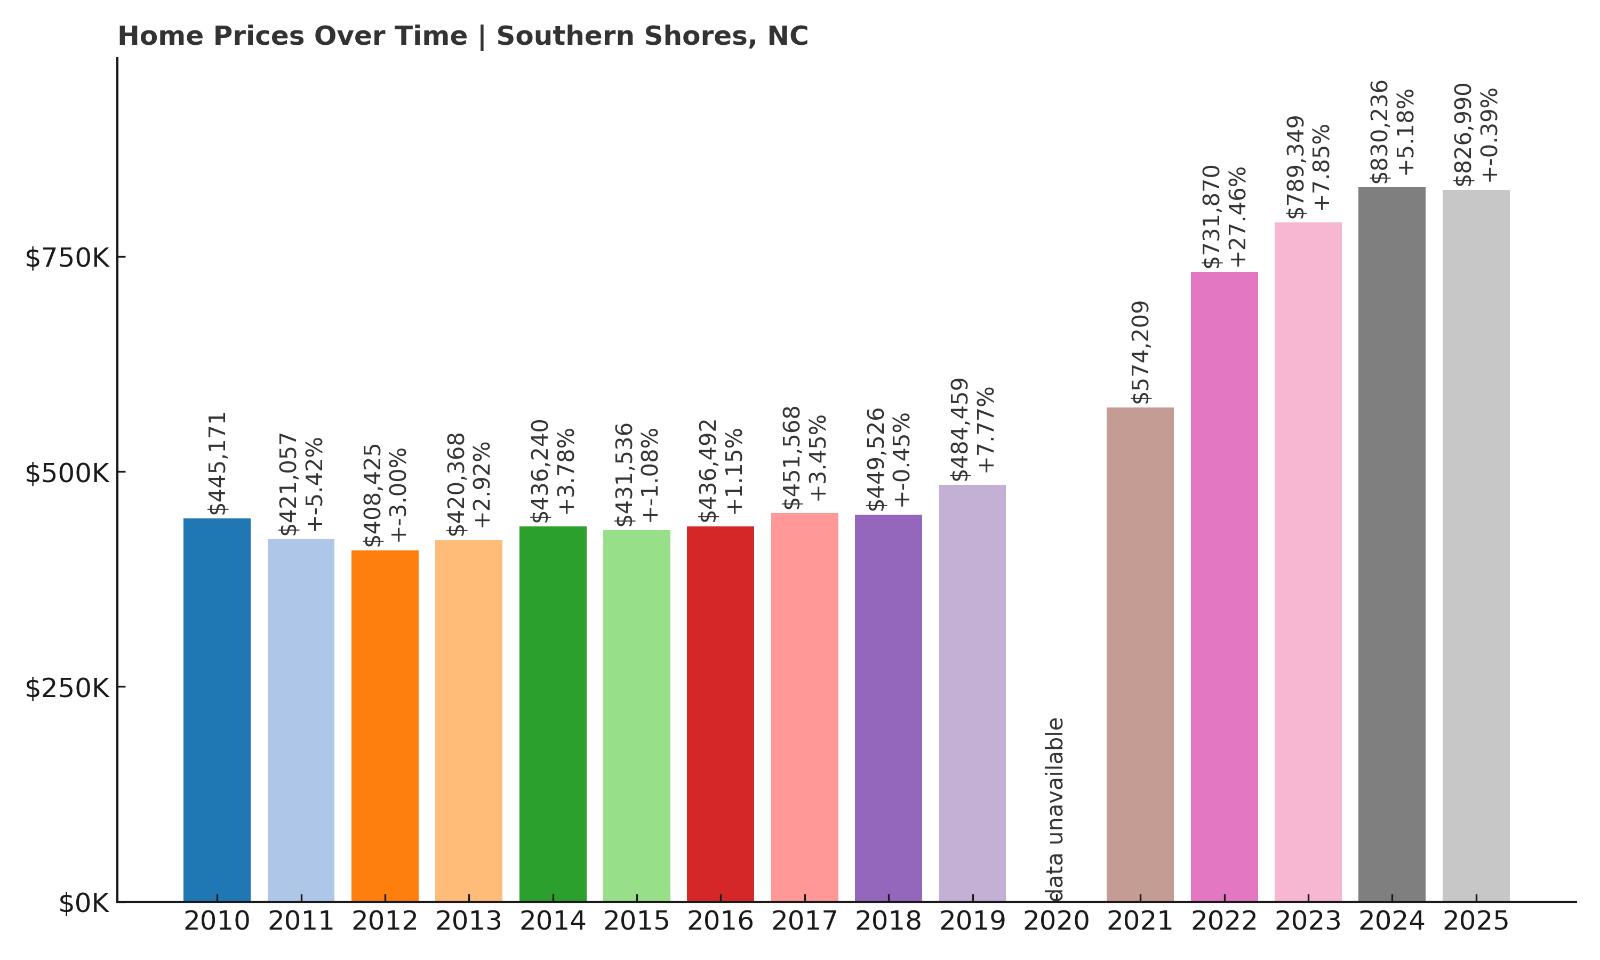
- 2010: $445,171
- 2011: $421,057 (-$24,115, -5.42% from previous year)
- 2012: $408,425 (-$12,632, -3.00% from previous year)
- 2013: $420,368 (+$11,944, +2.92% from previous year)
- 2014: $436,240 (+$15,872, +3.78% from previous year)
- 2015: $431,536 (-$4,705, -1.08% from previous year)
- 2016: $436,492 (+$4,957, +1.15% from previous year)
- 2017: $451,568 (+$15,075, +3.45% from previous year)
- 2018: $449,526 (-$2,041, -0.45% from previous year)
- 2019: $484,459 (+$34,933, +7.77% from previous year)
- 2020: N/A
- 2021: $574,209
- 2022: $731,870 (+$157,661, +27.46% from previous year)
- 2023: $789,349 (+$57,478, +7.85% from previous year)
- 2024: $830,236 (+$40,887, +5.18% from previous year)
- 2025: $826,990 (-$3,246, -0.39% from previous year)
Home prices in Southern Shores have grown from $408,425 in 2012 to $826,990 in 2025, marking a 102% increase. The sharpest rise came in 2022 with a 27% year-over-year jump, followed by continued growth through 2024. The slight drop in 2025 doesn’t offset the longer-term trend of strong appreciation. The town’s real estate values have remained resilient even in years with national market fluctuations. Southern Shores appeals to both permanent residents and seasonal homeowners, creating steady demand. Its consistent price increases are backed by tight housing supply and desirable location. It’s a town that continues to attract interest without the rollercoaster pricing seen in some other areas. Even modest corrections have been brief and shallow, reinforcing its strength in the market.
Southern Shores – A Quiet Powerhouse on the Outer Banks
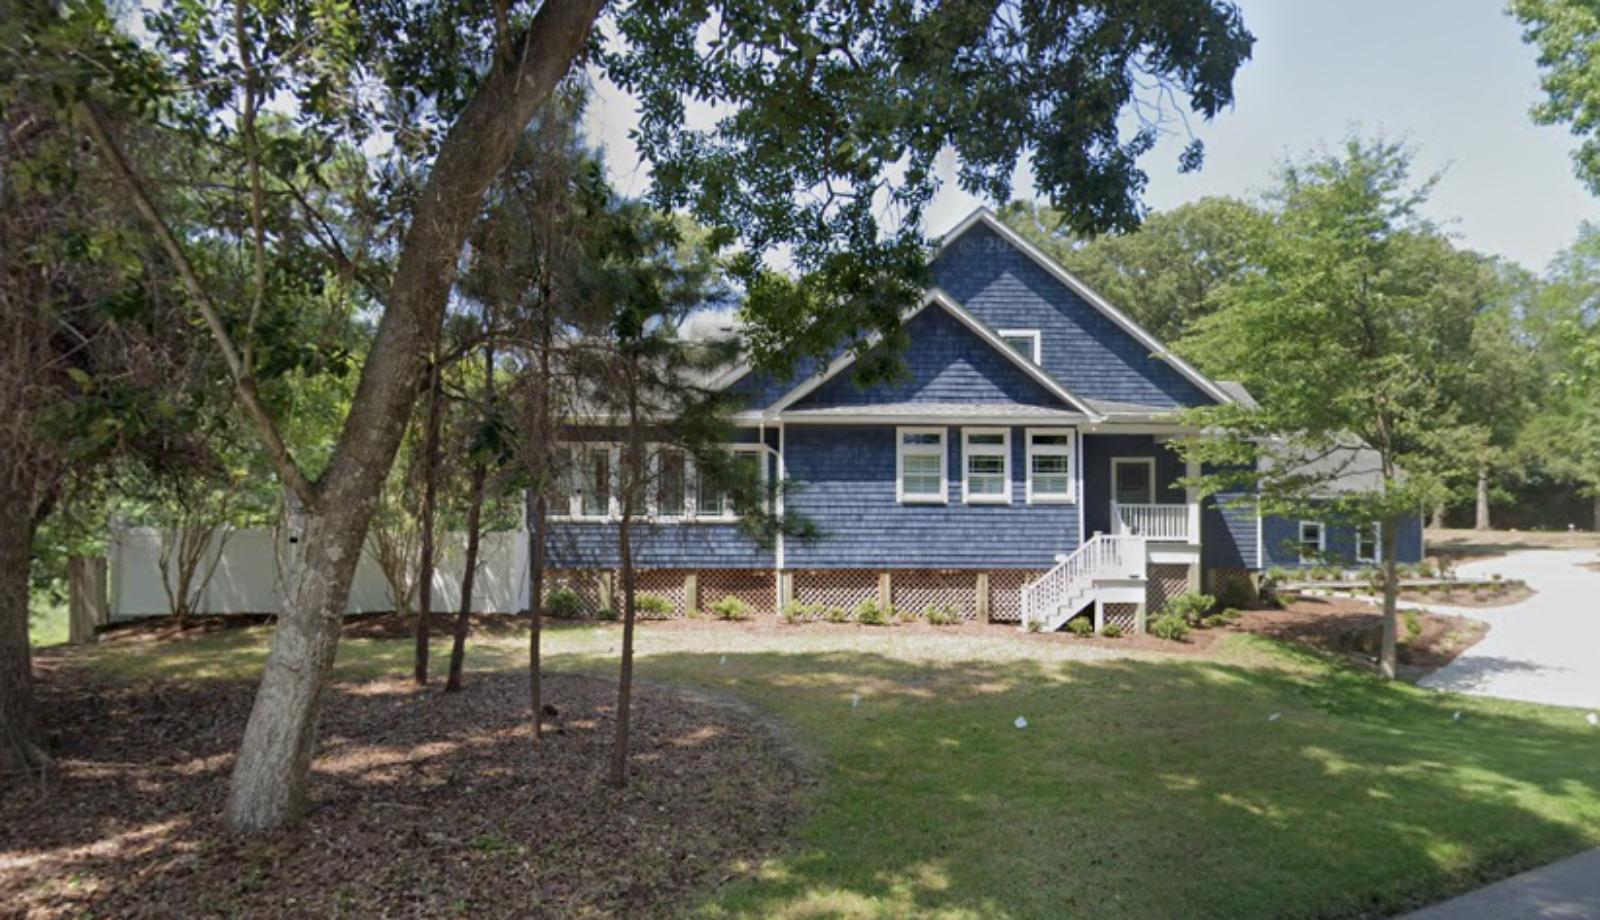
Southern Shores is located between Duck and Kitty Hawk on North Carolina’s Outer Banks, offering a tranquil setting that’s just close enough to major attractions without being overrun. The town features leafy neighborhoods, a network of bike trails, and private beach access points for residents. It’s ideal for families, retirees, and professionals who want coastal living with a low-key atmosphere. The town’s governance emphasizes preservation and sensible development, which has kept the area from becoming over-commercialized. Many homes sit on large lots and offer proximity to both the ocean and the Currituck Sound. The market here remains strong due to its unique blend of privacy, safety, and easy access to essentials. Buyers appreciate the peaceful environment, good schools, and strong property values. As one of the more exclusive sections of the Outer Banks, Southern Shores continues to be a premium investment for North Carolina coastal property.
11. Waves – 93% Home Price Increase Since 2012
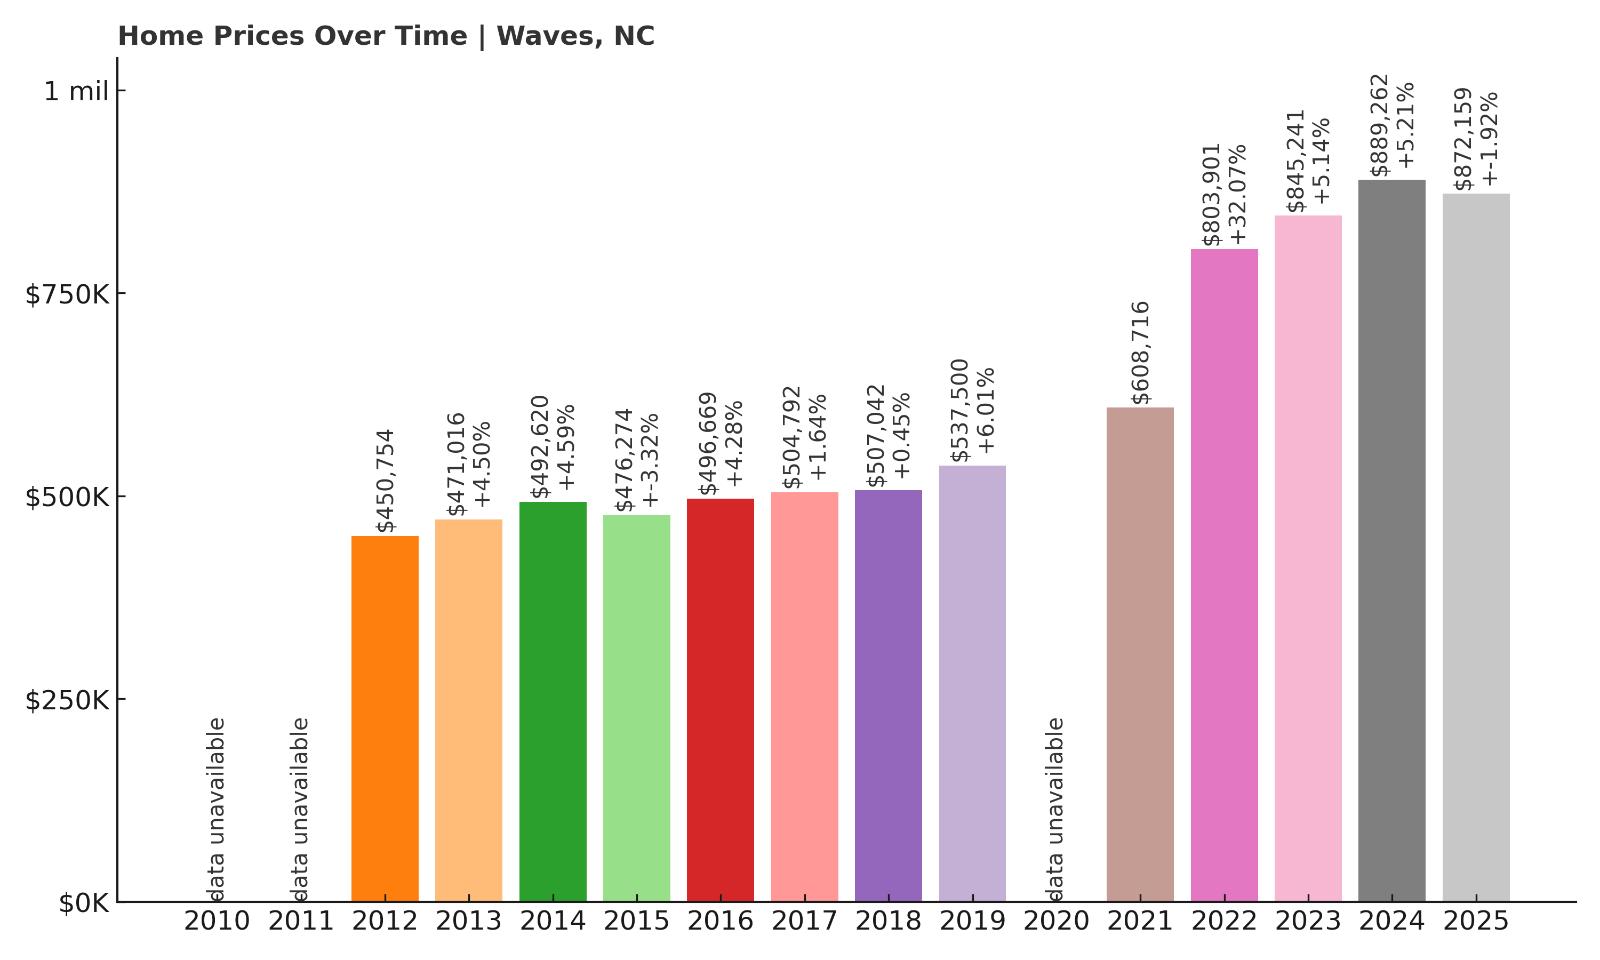
- 2010: N/A
- 2011: N/A
- 2012: $450,754
- 2013: $471,016 (+$20,262, +4.50% from previous year)
- 2014: $492,620 (+$21,604, +4.59% from previous year)
- 2015: $476,274 (-$16,346, -3.32% from previous year)
- 2016: $496,669 (+$20,396, +4.28% from previous year)
- 2017: $504,792 (+$8,122, +1.64% from previous year)
- 2018: $507,042 (+$2,251, +0.45% from previous year)
- 2019: $537,500 (+$30,458, +6.01% from previous year)
- 2020: N/A
- 2021: $608,716
- 2022: $803,901 (+$195,185, +32.06% from previous year)
- 2023: $845,241 (+$41,340, +5.14% from previous year)
- 2024: $889,262 (+$44,021, +5.21% from previous year)
- 2025: $872,159 (-$17,103, -1.92% from previous year)
Home values in Waves surged 93% between 2012 and 2025, climbing from $450,754 to $872,159. The biggest spike came in 2022, with an enormous 32% single-year increase that marked a high point in local price momentum. Gains continued through 2024, though 2025 saw a modest 1.9% decline. This dip, however, came after three years of exceptionally rapid growth. Overall, the market in Waves has shown high volatility but with a strong upward trajectory. It’s a town that clearly benefited from pandemic-era interest in remote-friendly, beachside locations. The near-doubling of prices over 13 years underscores its rising status among North Carolina’s most exclusive coastal enclaves. While future gains may slow, the baseline for Waves’ real estate market is now far higher than a decade ago.
Waves – Surf Culture and Scenic Privacy on Hatteras Island
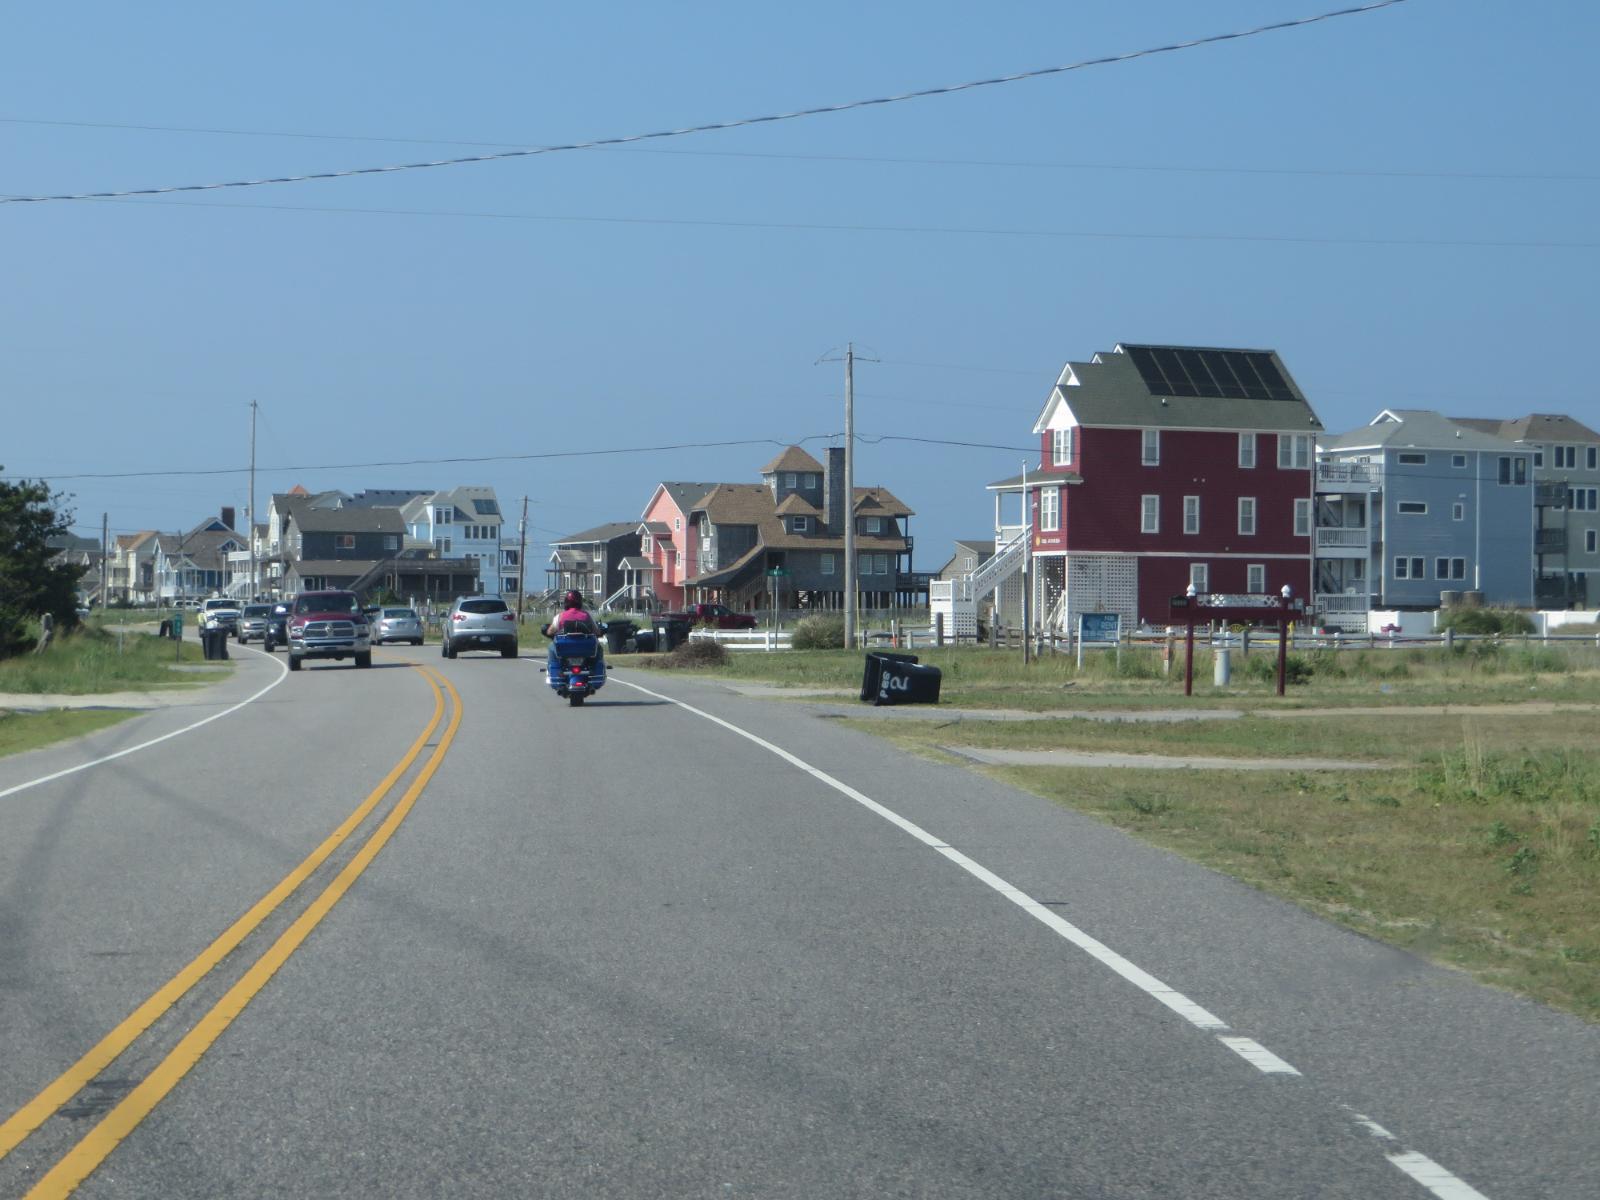
Waves is a small, unincorporated village located on Hatteras Island in Dare County, part of North Carolina’s Outer Banks. The town is popular among surfers and beachgoers who prefer a quieter, more remote feel than you’ll find farther north on the island chain. With direct access to both the Atlantic Ocean and Pamlico Sound, it offers some of the best water sport opportunities in the region. Waves doesn’t have the crowds or commercial development of bigger beach towns, which is a major draw for those seeking tranquility. Many homes are elevated, single-family properties that double as short-term rentals, giving the town a dual identity as both vacation haven and investment hotspot. The jump in prices during the early 2020s came as remote workers and second-home buyers discovered its charm. Local restrictions on development have helped maintain its open feel and prevent overbuilding. With beautiful views, strong rental potential, and limited inventory, Waves is now firmly positioned as one of the Outer Banks’ most desirable places to own real estate.
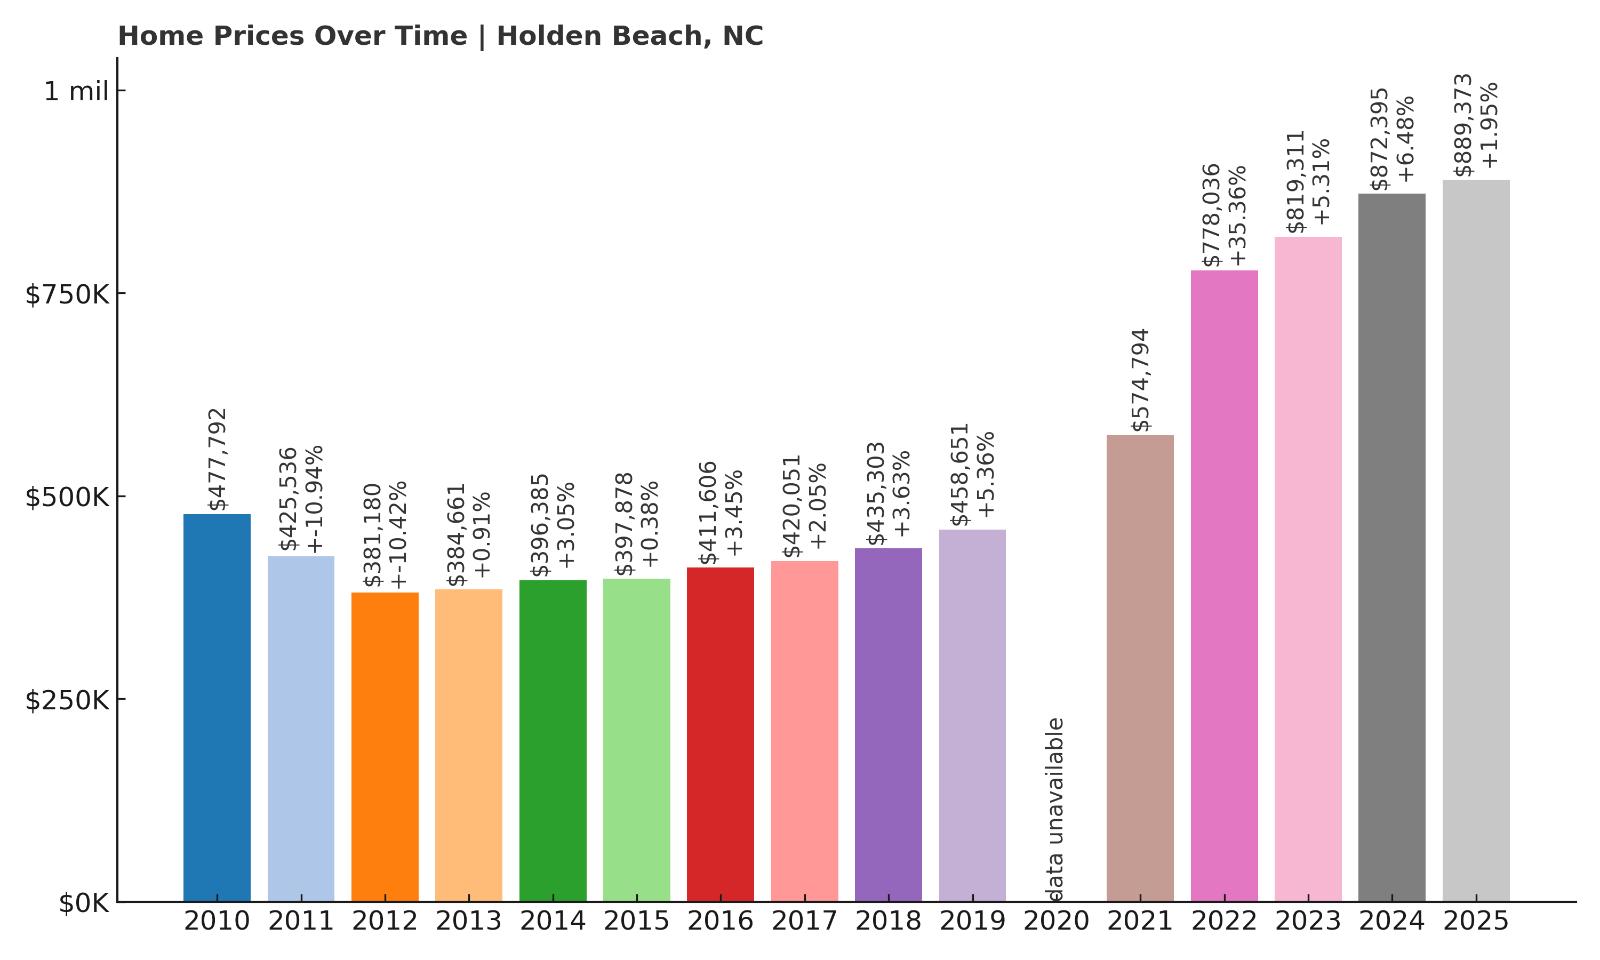
10. Holden Beach – 133% Home Price Increase Since 2012
Would you like to save this?
- 2010: $477,792
- 2011: $425,536 (-$52,256, -10.94% from previous year)
- 2012: $381,180 (-$44,356, -10.42% from previous year)
- 2013: $384,661 (+$3,480, +0.91% from previous year)
- 2014: $396,385 (+$11,724, +3.05% from previous year)
- 2015: $397,878 (+$1,493, +0.38% from previous year)
- 2016: $411,606 (+$13,728, +3.45% from previous year)
- 2017: $420,051 (+$8,446, +2.05% from previous year)
- 2018: $435,303 (+$15,252, +3.63% from previous year)
- 2019: $458,651 (+$23,349, +5.36% from previous year)
- 2020: N/A
- 2021: $574,794
- 2022: $778,036 (+$203,242, +35.36% from previous year)
- 2023: $819,311 (+$41,276, +5.31% from previous year)
- 2024: $872,395 (+$53,084, +6.48% from previous year)
- 2025: $889,373 (+$16,978, +1.95% from previous year)
Home prices in Holden Beach have surged by 133% since 2012, when the median was $381,180. That figure reached $889,373 by 2025, capping off more than a decade of steady and sometimes dramatic increases. The most remarkable year was 2022, when prices shot up by more than $200,000 — a 35% jump. Even as growth slowed after that, prices continued to climb at a strong pace. This kind of sustained appreciation indicates a healthy, in-demand market with resilient buyer interest. The moderate gain in 2025 further reinforces Holden Beach’s position as a stable investment. Much of the demand has come from second-home buyers, investors, and retirees. With limited land and a pristine setting, Holden Beach has become one of the premier coastal real estate destinations in the Carolinas.
Holden Beach – Family-Friendly Charm on the Southern Coast
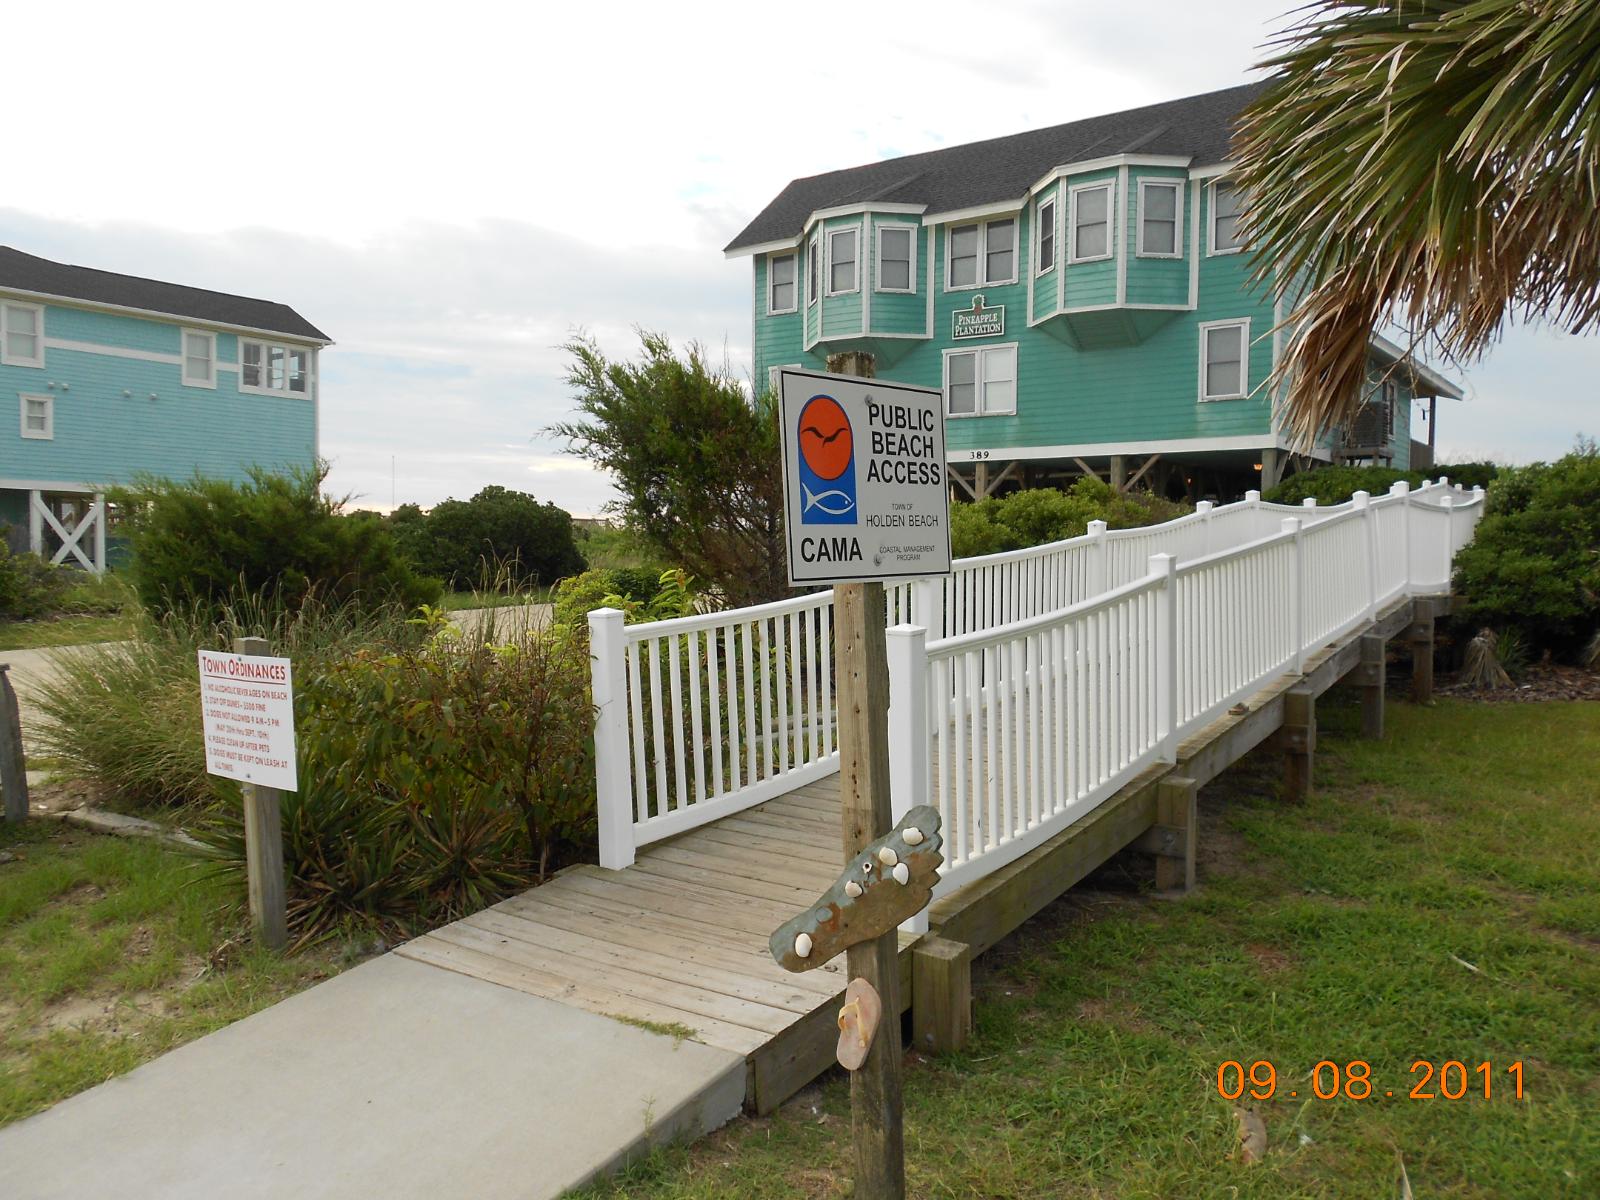
Holden Beach is located in Brunswick County along the southeastern coast of North Carolina, nestled between Wilmington and Myrtle Beach. Known for its wide, quiet beaches and relaxed atmosphere, it’s a favorite for families looking to escape the commercial clutter of bigger beach towns. Development here is intentionally restrained — you won’t find high-rises or big resorts. Most properties are single-family homes, often used as vacation rentals or multigenerational family getaways. The island is accessible by a single bridge, adding to its secluded charm while still being convenient to regional amenities. Buyers are drawn to the community’s safety, scenic boardwalks, and laid-back vibe. In recent years, demand has surged as more people seek tranquil escapes that still offer strong rental potential. With limited space to expand and ongoing interest from both investors and end-users, Holden Beach remains one of the most desirable and stable markets on North Carolina’s coastline.
9. Corolla – 86% Home Price Increase Since 2012
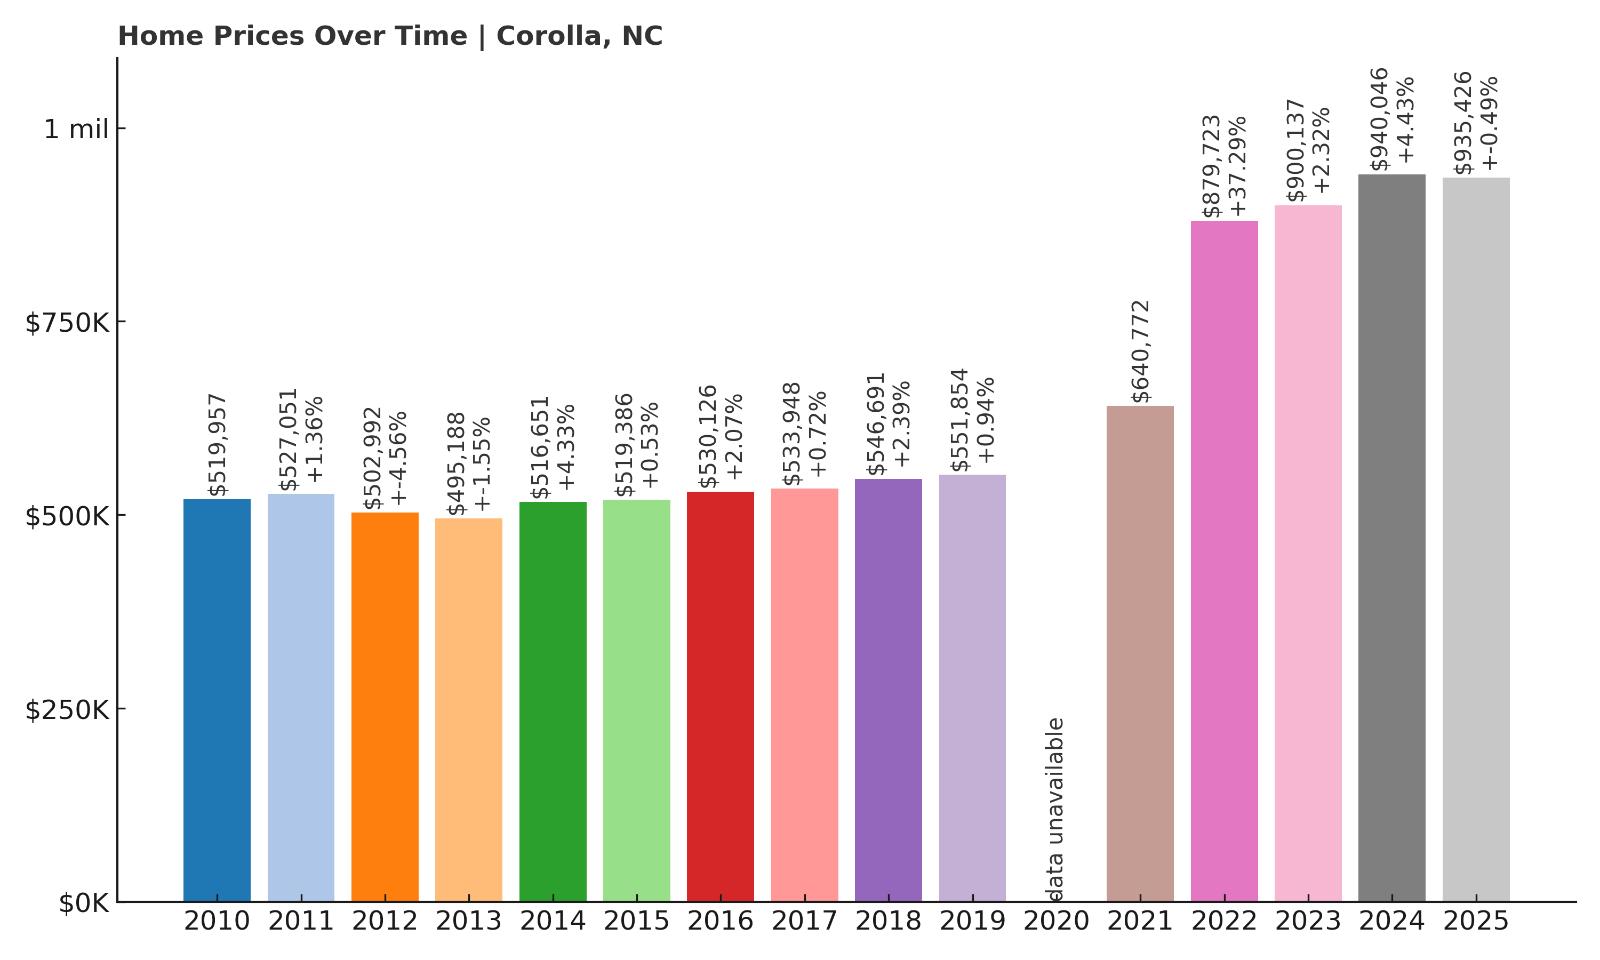
- 2010: $519,957
- 2011: $527,051 (+$7,094, +1.36% from previous year)
- 2012: $502,992 (-$24,058, -4.56% from previous year)
- 2013: $495,188 (-$7,804, -1.55% from previous year)
- 2014: $516,651 (+$21,462, +4.33% from previous year)
- 2015: $519,386 (+$2,735, +0.53% from previous year)
- 2016: $530,126 (+$10,740, +2.07% from previous year)
- 2017: $533,948 (+$3,823, +0.72% from previous year)
- 2018: $546,691 (+$12,743, +2.39% from previous year)
- 2019: $551,854 (+$5,163, +0.94% from previous year)
- 2020: N/A
- 2021: $640,772
- 2022: $879,723 (+$238,951, +37.29% from previous year)
- 2023: $900,137 (+$20,414, +2.32% from previous year)
- 2024: $940,046 (+$39,909, +4.43% from previous year)
- 2025: $935,426 (-$4,620, -0.49% from previous year)
From $502,992 in 2012 to $935,426 in 2025, home values in Corolla rose by 86%, making it one of the strongest luxury markets on the Outer Banks. The biggest single-year jump came in 2022, when prices exploded by over 37%. Although there was a minor dip in 2025, the town’s long-term upward trajectory is firmly intact. The consistent rise from 2012 to 2021 set the stage for the dramatic pandemic-era gains. Demand has remained solid thanks to the town’s exclusivity and high-end appeal. Corolla has limited inventory, and large, upscale homes dominate the market. Many buyers are looking for second homes or investment properties with strong rental returns. This continued buyer interest, combined with geographic constraints, has helped maintain high price levels even in a slightly cooling broader market.
Corolla – Remote Luxury with Wild Horses and Wide Beaches
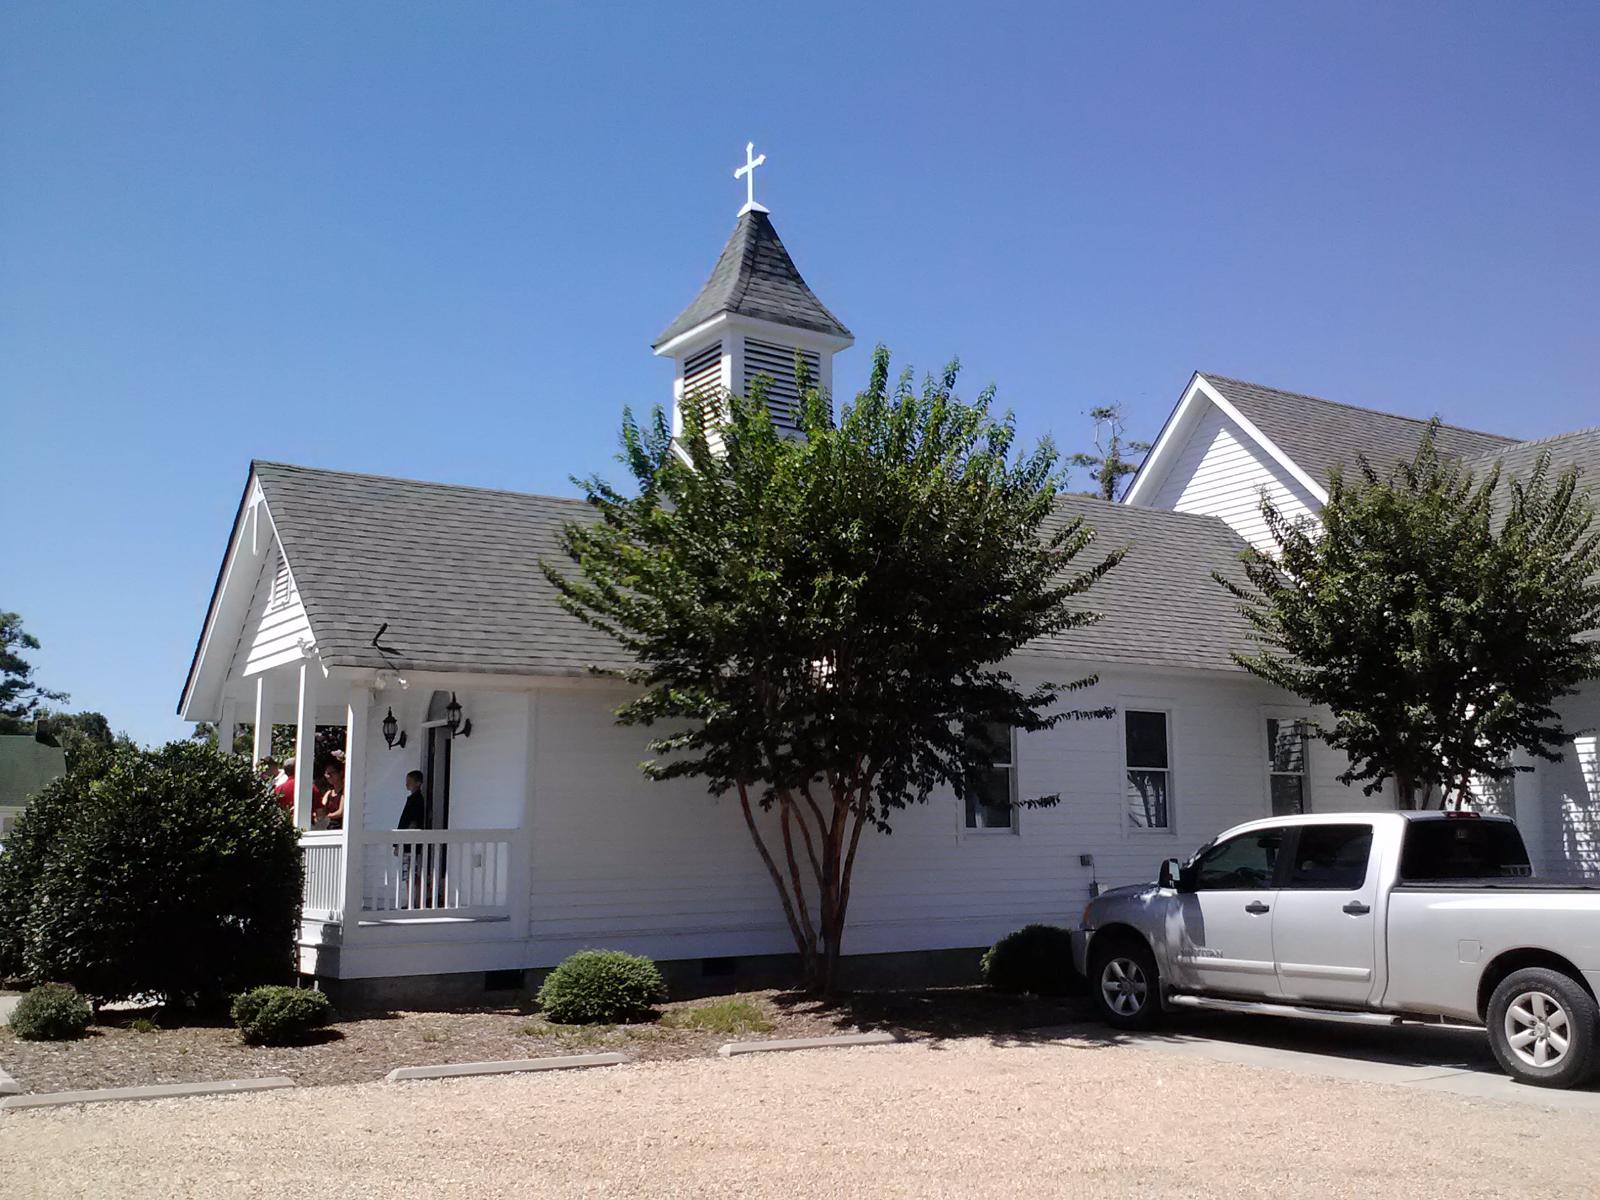
Corolla is located near the northern tip of the Outer Banks and is known for its large vacation homes, stunning beaches, and a herd of wild horses that roam the area — one of its most iconic attractions. This part of the barrier islands is accessible only by a single road, adding to its remote and exclusive feel. Unlike more developed towns farther south, Corolla has managed to stay low-density, with very few commercial structures and minimal tourist congestion. Homes here are often expansive, designed for large groups, and frequently booked throughout the vacation season. The strong 2022 price spike reflects the influx of remote workers and investors seeking peaceful, high-yield coastal properties. Corolla also benefits from excellent beach quality, wide shorelines, and access to outdoor activities like kayaking, off-road driving, and fishing. It appeals especially to buyers looking for privacy without sacrificing modern comforts. Even with slight price dips, Corolla’s market remains anchored by its prestige and rental potential.
8. Topsail Beach – 96% Home Price Increase Since 2012
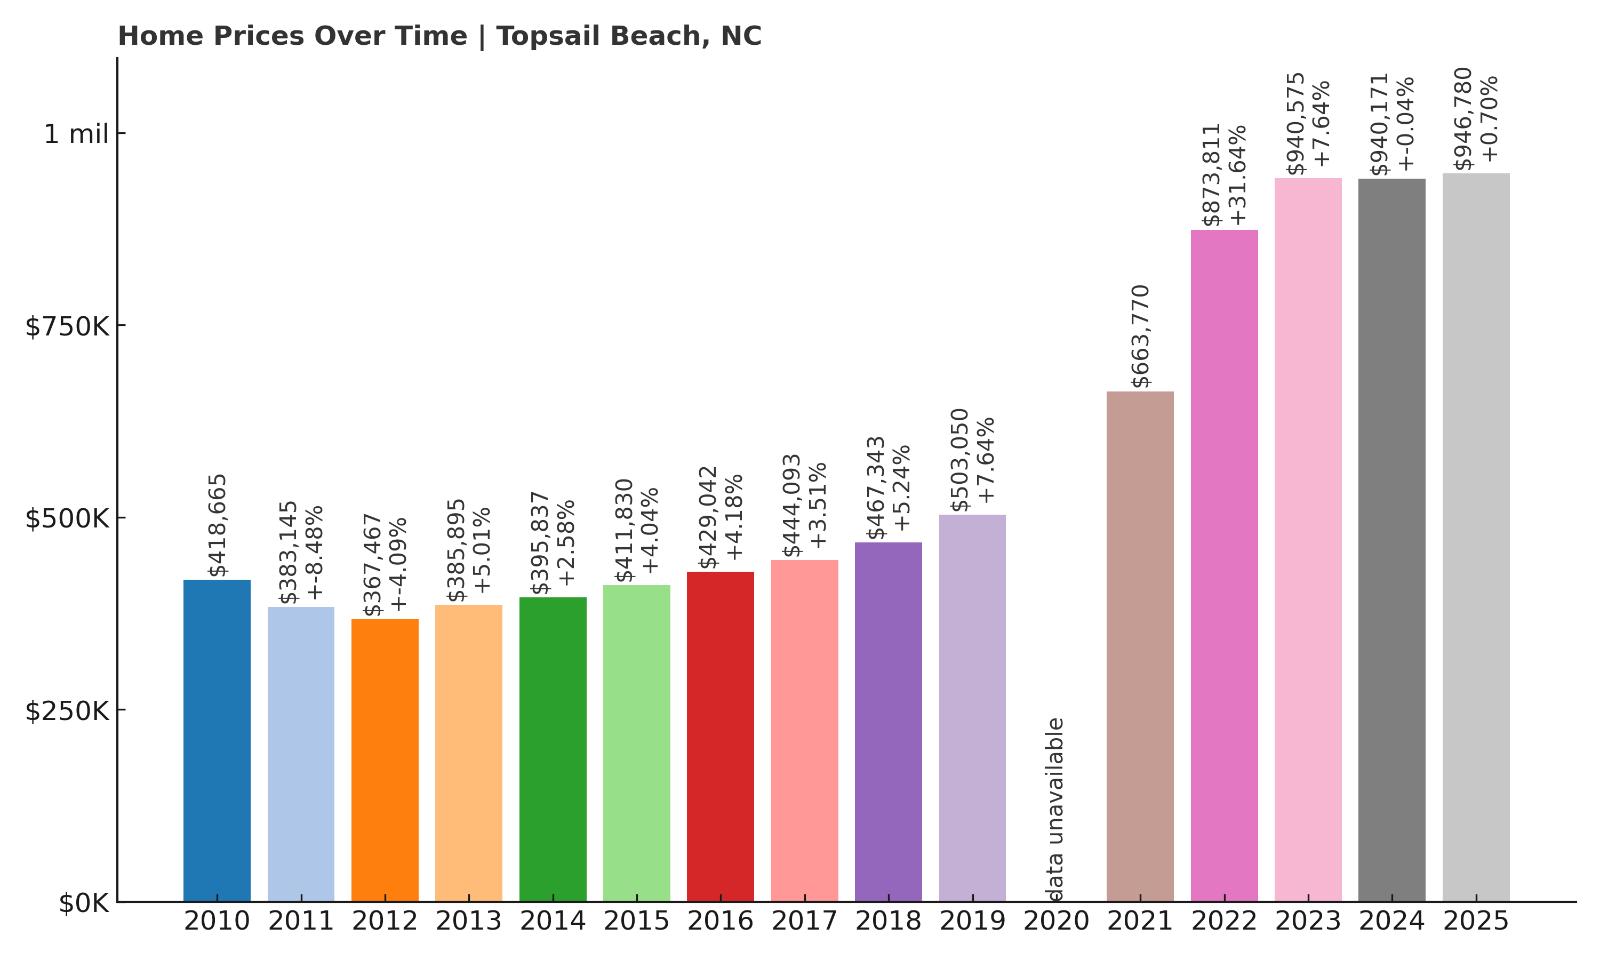
- 2010: $418,665
- 2011: $383,145 (-$35,520, -8.48% from previous year)
- 2012: $367,467 (-$15,678, -4.09% from previous year)
- 2013: $385,895 (+$18,428, +5.01% from previous year)
- 2014: $395,837 (+$9,943, +2.58% from previous year)
- 2015: $411,830 (+$15,992, +4.04% from previous year)
- 2016: $429,042 (+$17,212, +4.18% from previous year)
- 2017: $444,093 (+$15,051, +3.51% from previous year)
- 2018: $467,343 (+$23,250, +5.24% from previous year)
- 2019: $503,050 (+$35,706, +7.64% from previous year)
- 2020: N/A
- 2021: $663,770
- 2022: $873,811 (+$210,042, +31.64% from previous year)
- 2023: $940,575 (+$66,764, +7.64% from previous year)
- 2024: $940,171 (-$404, -0.04% from previous year)
- 2025: $946,780 (+$6,609, +0.70% from previous year)
Since 2012, home prices in Topsail Beach have nearly doubled, rising from $367,467 to $946,780 — a 96% gain. The biggest leap occurred in 2022, when values increased by over $210,000 in just one year. That surge was followed by a flat year in 2024 and only a slight increase in 2025. Despite the slowdown, the town’s long-term trend remains upward. The consistency of earlier gains in the 2010s helped establish a solid foundation for its 2020s price boom. Like many coastal markets, Topsail Beach saw a wave of demand from remote workers and vacation-home seekers. While growth has slowed, the town remains one of North Carolina’s most stable and desirable coastal investments. Its combination of steady appreciation and strong rental demand keeps it in high regard among both homeowners and investors.
Topsail Beach – Tranquility and Tradition on a Barrier Island
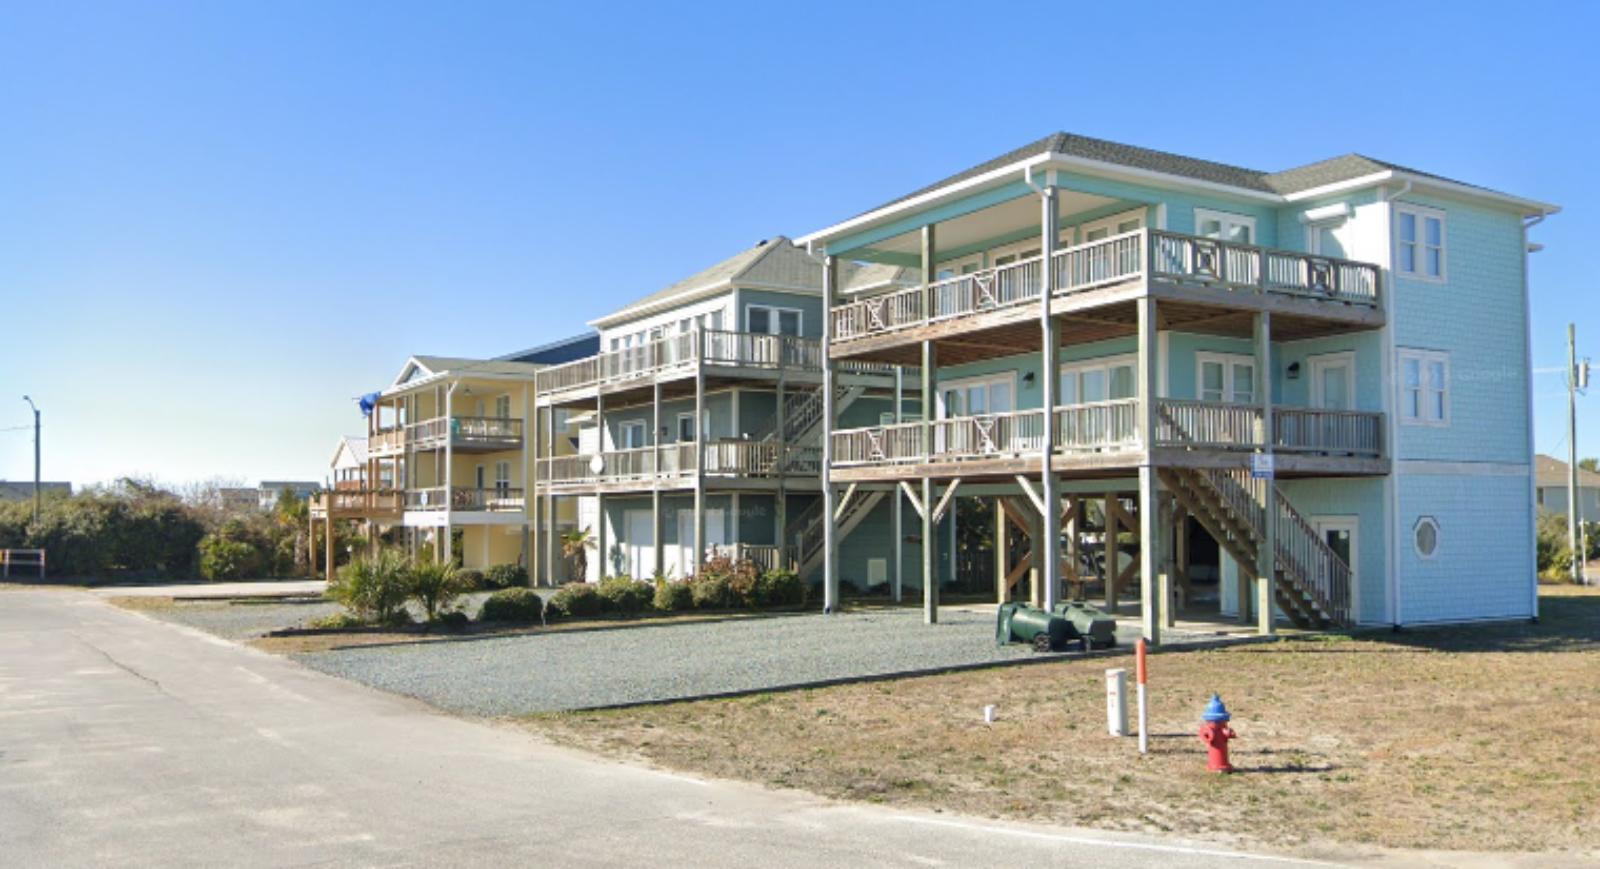
Topsail Beach is the southernmost town on Topsail Island, a barrier island located north of Wilmington. Known for its peaceful atmosphere, long stretches of shoreline, and absence of major commercial development, it’s often described as one of the last truly quiet beaches in the state. Most of the housing stock consists of modestly sized cottages and raised single-family homes, many with direct ocean views. The town has long attracted families, retirees, and beach lovers looking for a low-key lifestyle. It also features a sea turtle rescue and rehabilitation center, highlighting its commitment to environmental stewardship. The rapid rise in prices over the past few years reflects both a tightening housing supply and renewed buyer interest in simple, oceanfront living. With limited room for expansion and a loyal base of repeat renters and buyers, Topsail Beach has managed to preserve its charm while becoming a premium coastal destination. Its stability and scenic appeal continue to make it one of the smartest places to own property on North Carolina’s coast.
7. Highlands – 85% Home Price Increase Since 2012
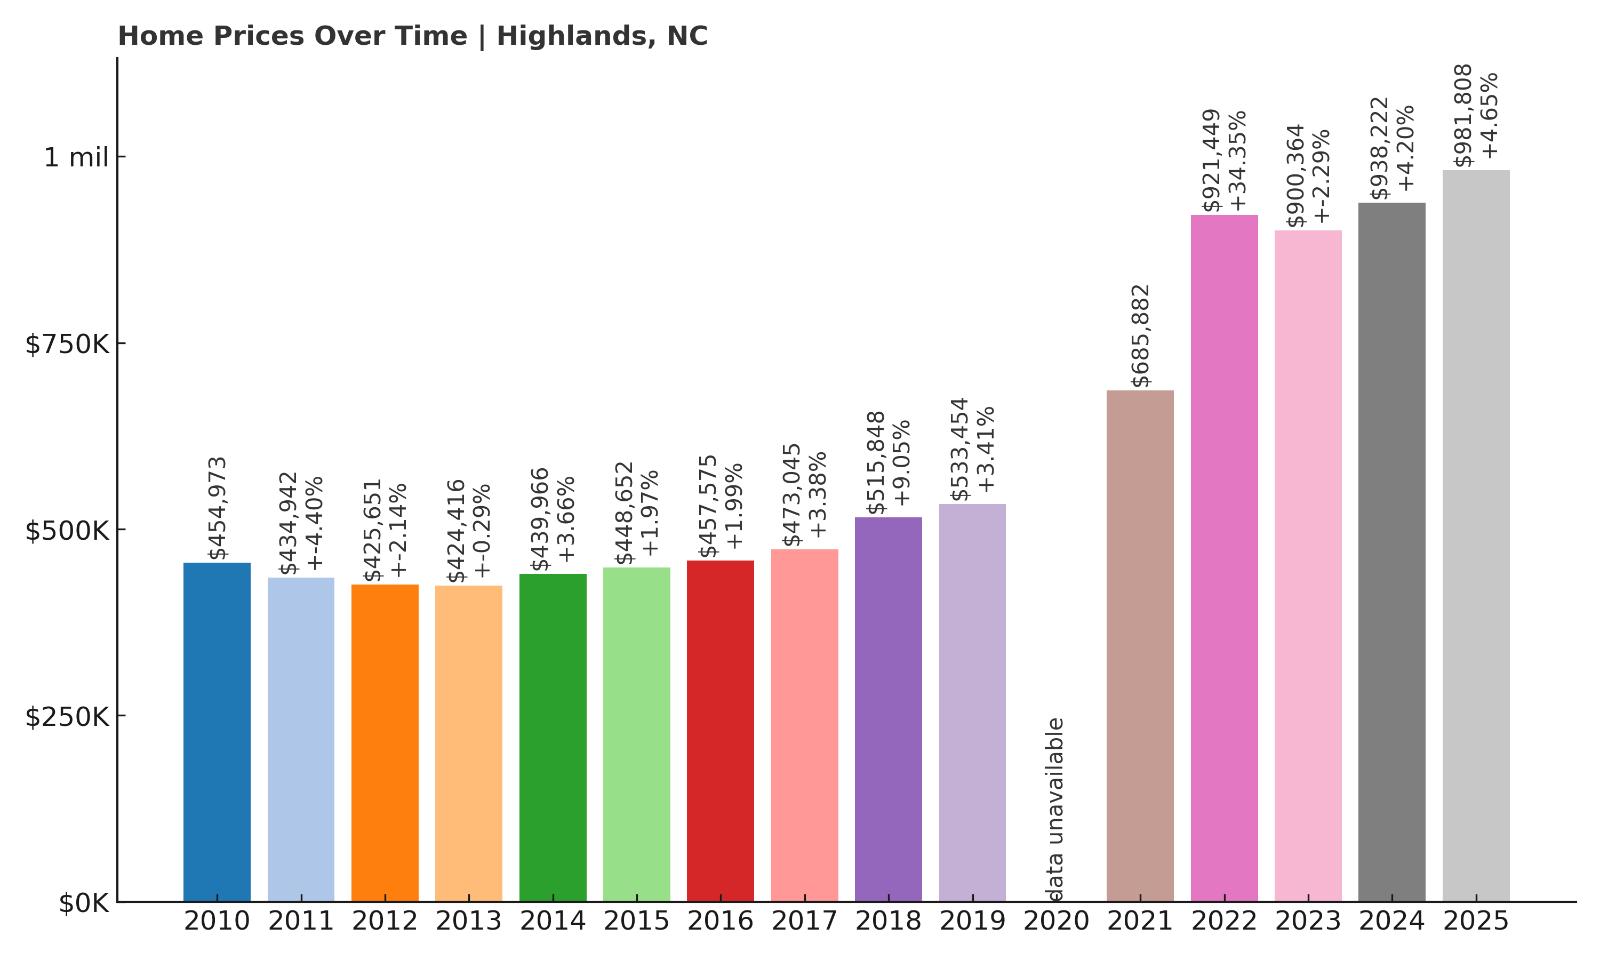
- 2010: $454,973
- 2011: $434,942 (-$20,031, -4.40% from previous year)
- 2012: $425,651 (-$9,291, -2.14% from previous year)
- 2013: $424,416 (-$1,235, -0.29% from previous year)
- 2014: $439,966 (+$15,550, +3.66% from previous year)
- 2015: $448,652 (+$8,686, +1.97% from previous year)
- 2016: $457,575 (+$8,923, +1.99% from previous year)
- 2017: $473,045 (+$15,470, +3.38% from previous year)
- 2018: $515,848 (+$42,803, +9.05% from previous year)
- 2019: $533,454 (+$17,606, +3.41% from previous year)
- 2020: N/A
- 2021: $685,882
- 2022: $921,449 (+$235,567, +34.35% from previous year)
- 2023: $900,364 (-$21,085, -2.29% from previous year)
- 2024: $938,222 (+$37,858, +4.20% from previous year)
- 2025: $981,808 (+$43,587, +4.65% from previous year)
Highlands has seen home prices rise 85% since 2012, climbing from $425,651 to $981,808 by 2025. The most dramatic increase occurred in 2022, when prices jumped by more than $235,000 in a single year. While 2023 saw a slight correction, values rebounded strongly in the following two years. This pattern reflects a market that is both in-demand and resilient. Steady appreciation throughout the 2010s helped establish Highlands as a solid real estate investment. The town attracts high-income buyers seeking a cool, elevated retreat far from the bustle of the city. With strong demand and little new housing supply, home values here continue to climb. Highlands remains one of the premier high-altitude property markets in the state, with lasting appeal and limited room for growth.
Highlands – Elevated Elegance in Western North Carolina
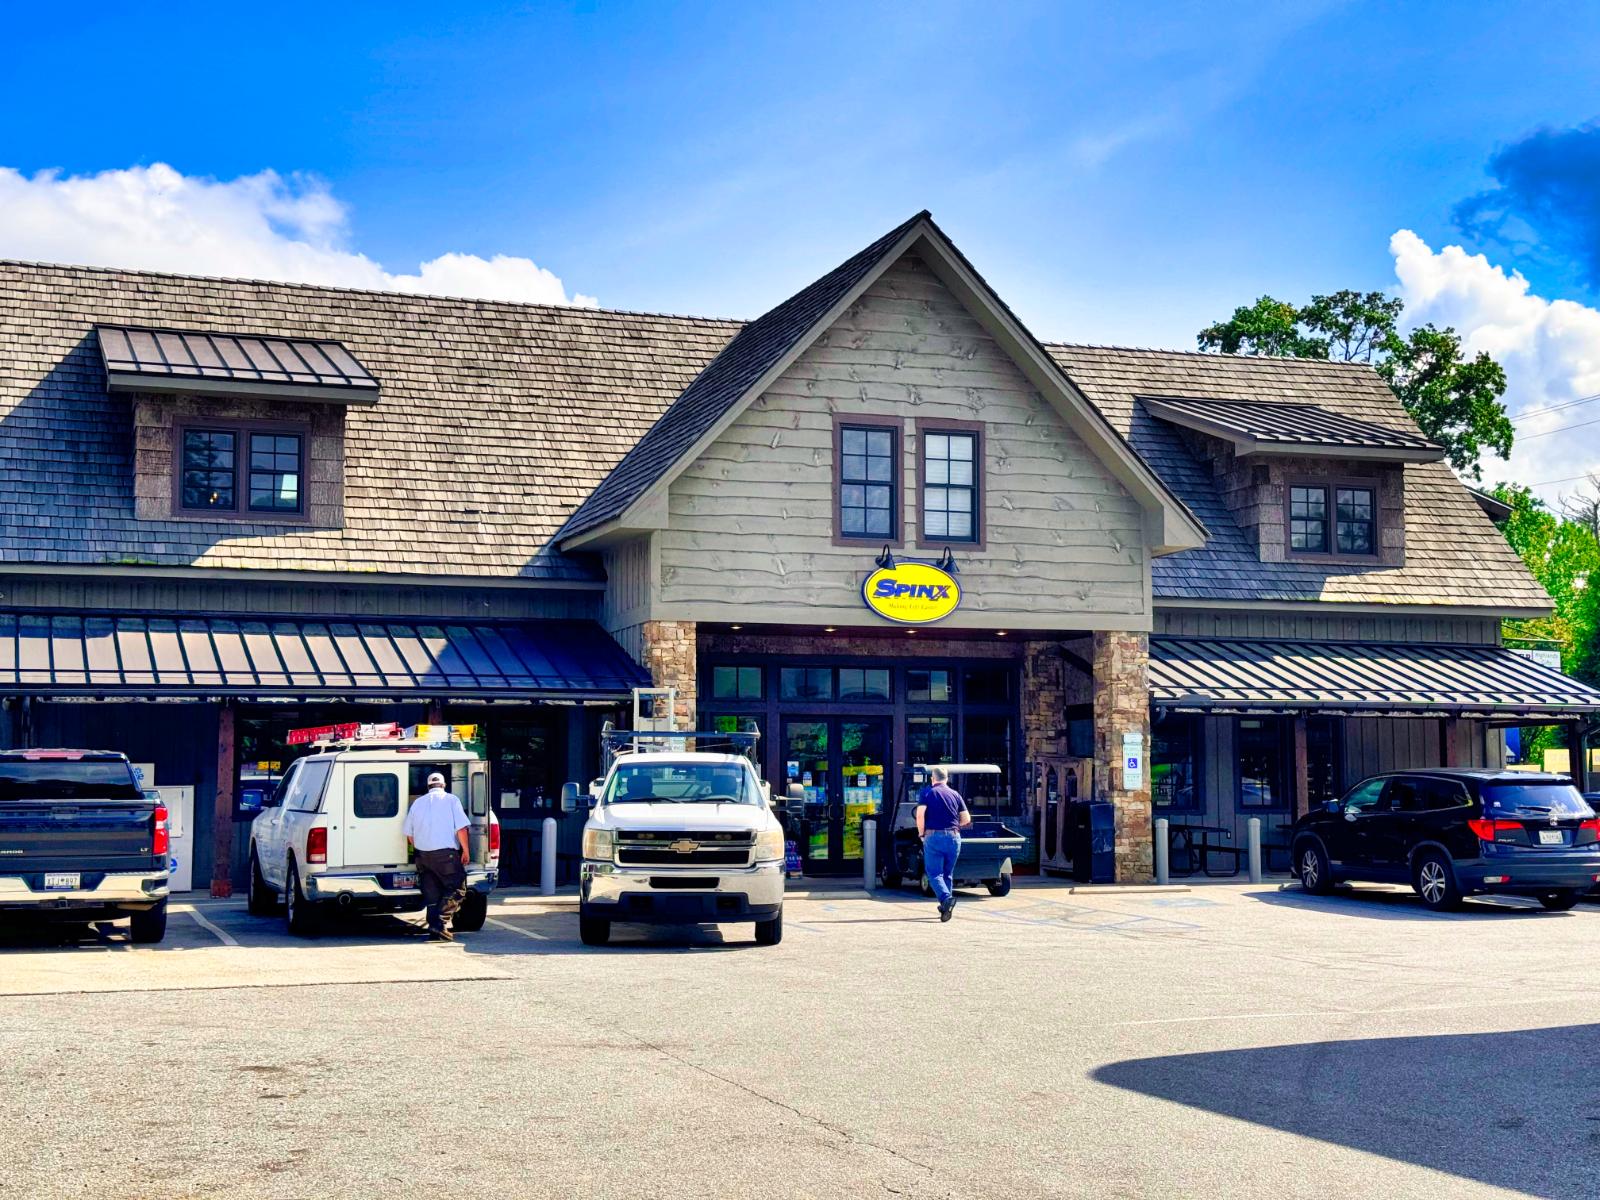
Nestled in the Nantahala National Forest near the Georgia border, Highlands is one of the most exclusive mountain towns in North Carolina. Known for its upscale boutiques, fine dining, and cultural institutions like the Highlands Playhouse, it blends natural beauty with refined living. The town sits at over 4,000 feet elevation, providing cooler temperatures year-round — a big draw for seasonal residents from the Southeast. Real estate in Highlands includes everything from rustic log cabins to multimillion-dollar estates, often surrounded by forests or overlooking mountain vistas. The surge in home prices post-2020 reflected an increased demand for luxury retreats in scenic, secluded settings. The town also benefits from strict development regulations that protect its character and preserve land values. With its blend of outdoor recreation and cultural sophistication, Highlands attracts retirees, investors, and vacationers alike. As a result, its housing market remains both competitive and high-value year after year.
6. Duck – 96% Home Price Increase Since 2012
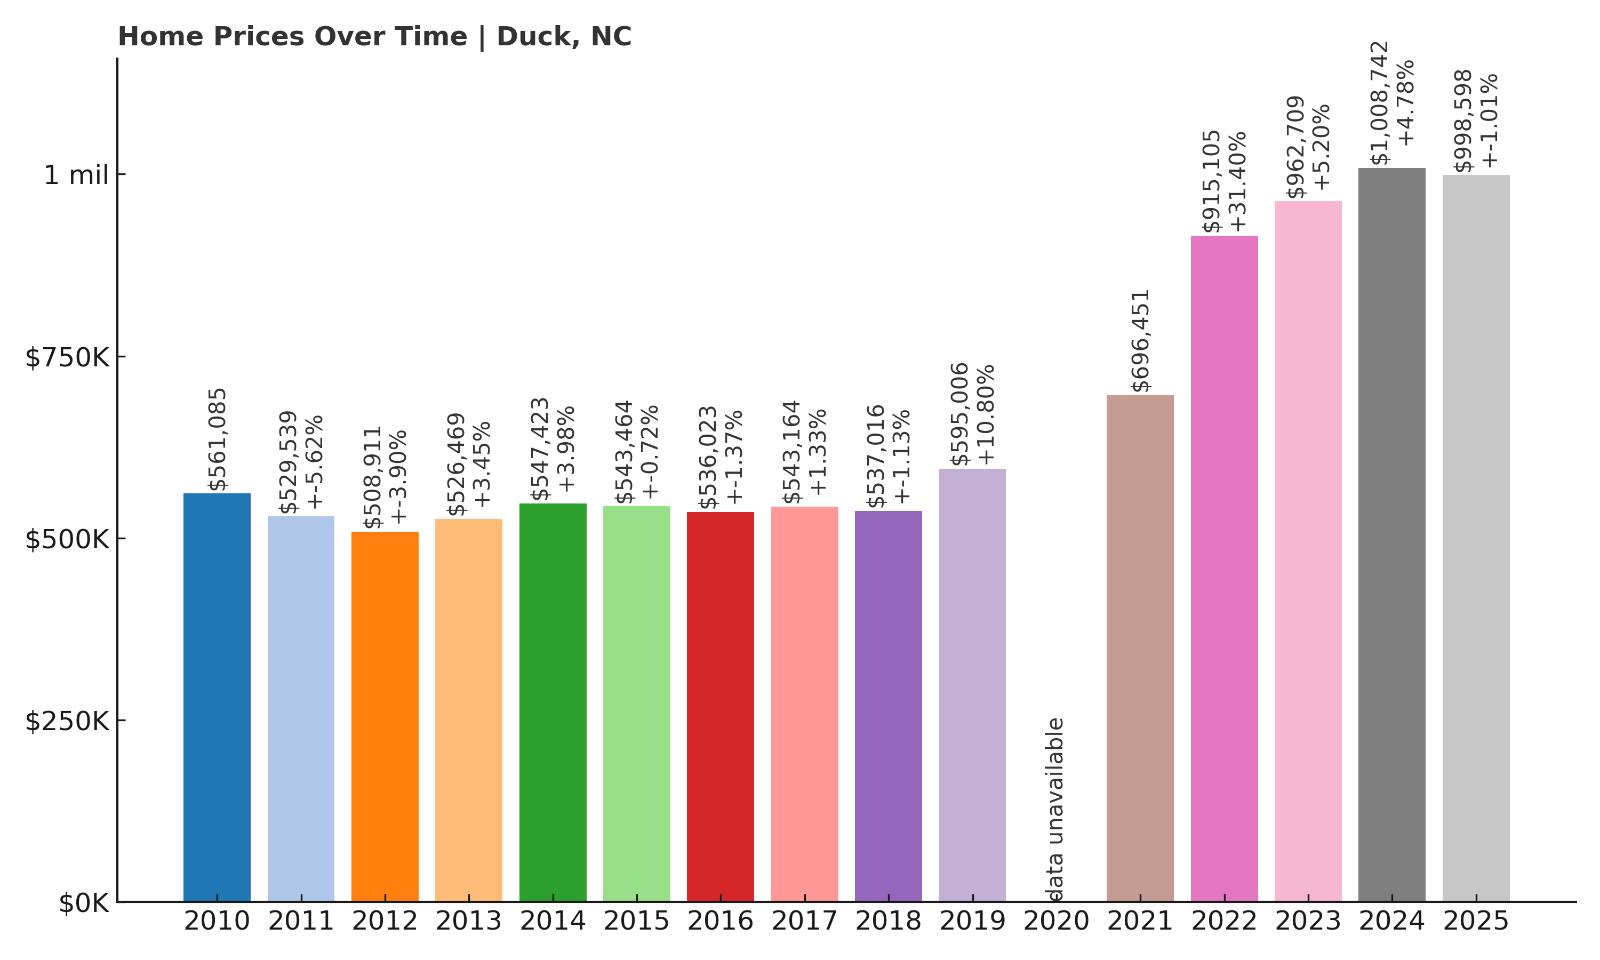
- 2010: $561,085
- 2011: $529,539 (-$31,546, -5.62% from previous year)
- 2012: $508,911 (-$20,628, -3.90% from previous year)
- 2013: $526,469 (+$17,559, +3.45% from previous year)
- 2014: $547,423 (+$20,953, +3.98% from previous year)
- 2015: $543,464 (-$3,959, -0.72% from previous year)
- 2016: $536,023 (-$7,441, -1.37% from previous year)
- 2017: $543,164 (+$7,141, +1.33% from previous year)
- 2018: $537,016 (-$6,148, -1.13% from previous year)
- 2019: $595,006 (+$57,990, +10.80% from previous year)
- 2020: N/A
- 2021: $696,451
- 2022: $915,105 (+$218,655, +31.40% from previous year)
- 2023: $962,709 (+$47,603, +5.20% from previous year)
- 2024: $1,008,742 (+$46,033, +4.78% from previous year)
- 2025: $998,598 (-$10,144, -1.01% from previous year)
Duck’s home prices have climbed from $508,911 in 2012 to $998,598 in 2025 — a 96% increase over 13 years. The sharpest jump came in 2022 with a 31% leap, part of a broader post-pandemic surge seen in many coastal areas. Prices continued to rise through 2024 before experiencing a mild dip in 2025. Still, Duck’s market has proven to be remarkably strong and resilient, with near-continuous upward movement since the early 2010s. Its overall trajectory suggests enduring demand, particularly among second-home buyers and investors. The town’s property values benefited from limited supply and high interest in luxury oceanfront homes. Duck’s established appeal, paired with an absence of overdevelopment, has helped it maintain long-term value. Even slight corrections have been small compared to its decade-long growth, reinforcing its standing as a high-performing market in the Outer Banks.
Duck – Laid-Back Luxury on the Northern Outer Banks
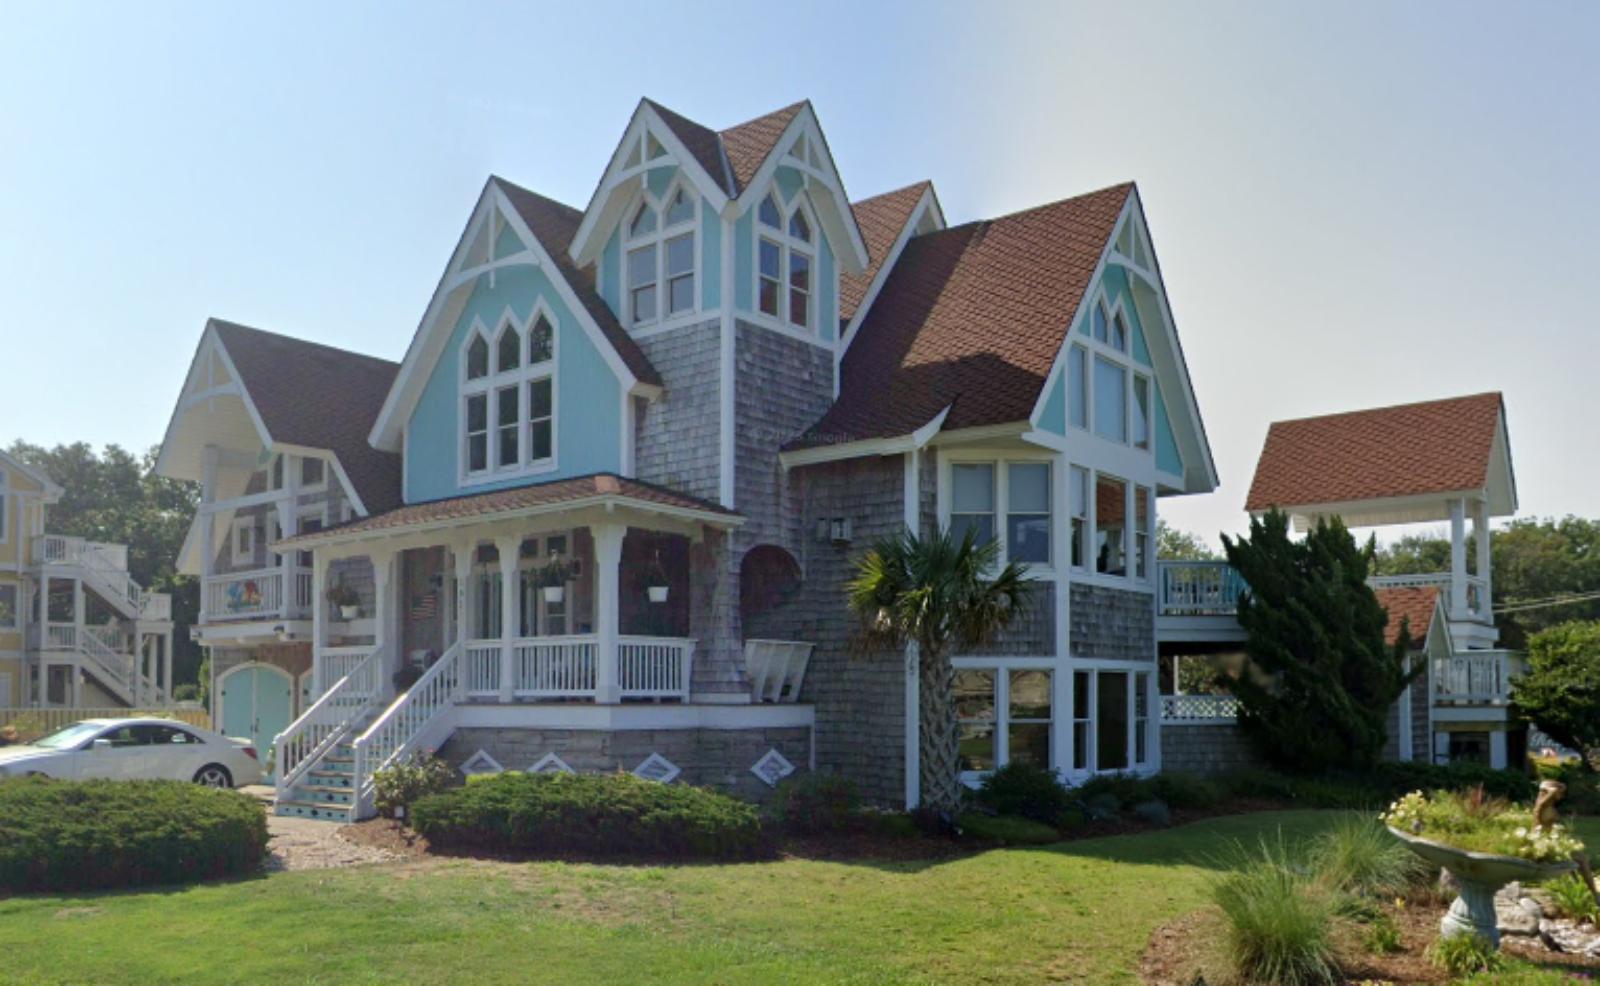
Duck is a small, upscale town on the Outer Banks that combines walkability, charm, and sweeping ocean views. Its compact downtown features boutiques, cafes, and a soundside boardwalk, making it one of the most pedestrian-friendly destinations on the coast. The town is zoned to keep a low profile — literally — with restrictions on high-rise buildings that preserve sightlines and protect the local character. Homes in Duck are typically vacation properties, many of which offer strong rental potential during peak seasons. Its beaches are less crowded than those farther south, which appeals to families and retirees looking for peaceful getaways. Duck also hosts seasonal events like jazz festivals and art shows that add to its cultural cachet. The strong demand seen over the past few years reflects a national trend toward smaller, amenity-rich towns that offer both recreation and relaxation. Duck’s elevated home prices mirror the town’s stature as one of the most desirable — and stylish — places to own real estate in coastal North Carolina.
5. Weddington – 156% Home Price Increase Since 2012
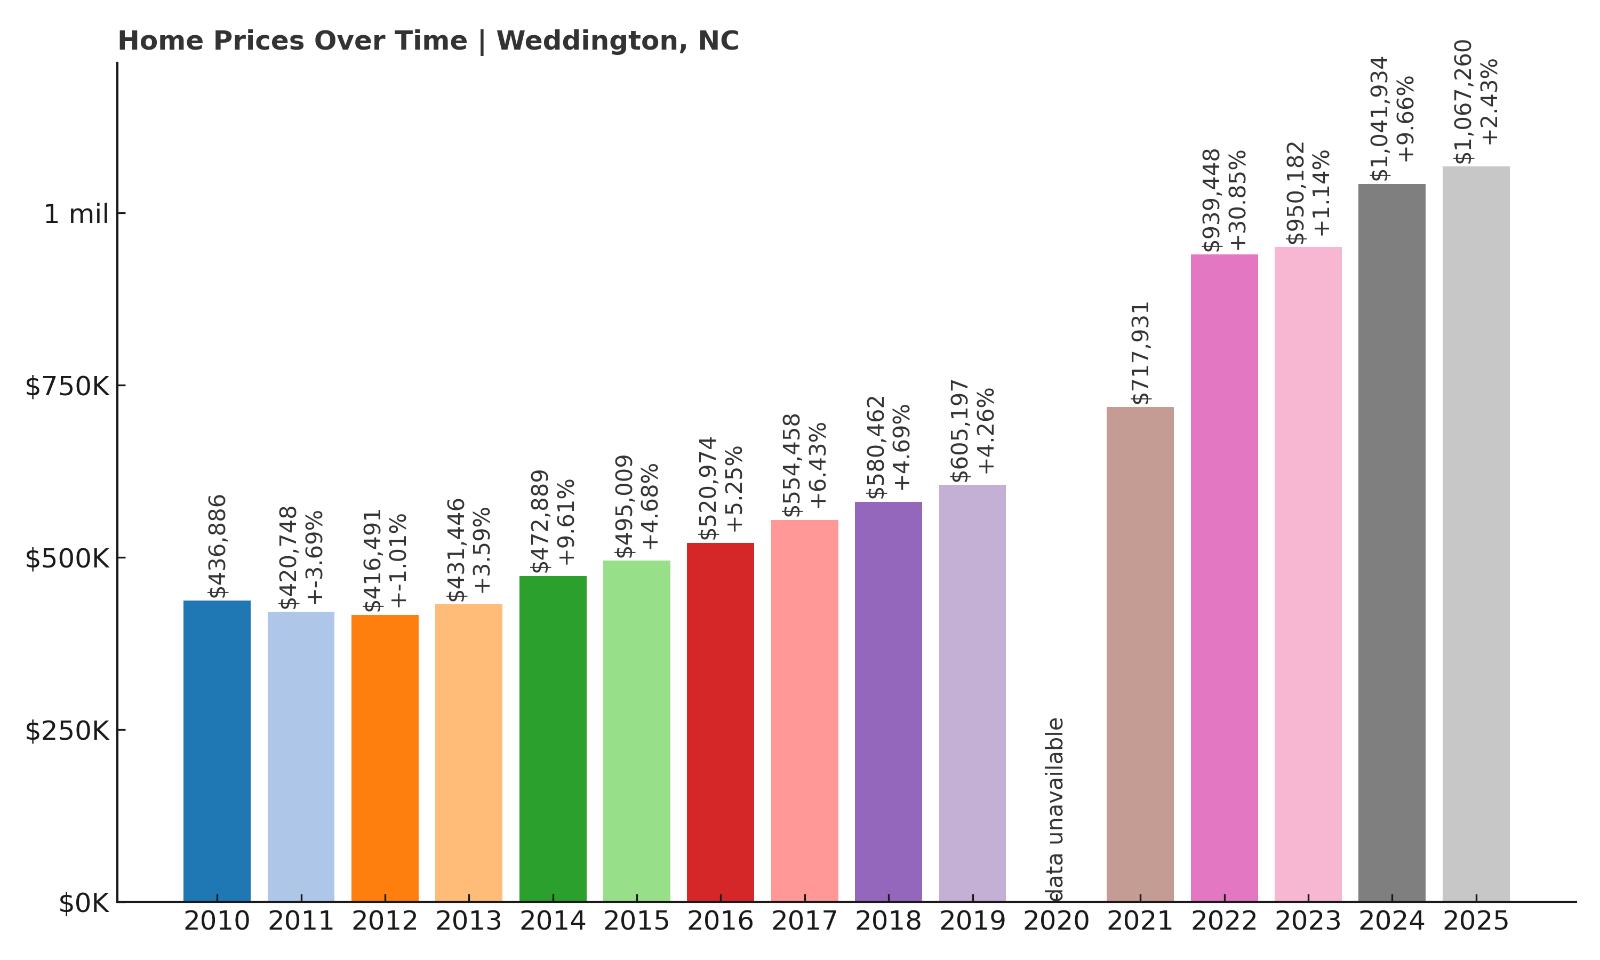
- 2010: $436,886
- 2011: $420,748 (-$16,137, -3.69% from previous year)
- 2012: $416,491 (-$4,257, -1.01% from previous year)
- 2013: $431,446 (+$14,955, +3.59% from previous year)
- 2014: $472,889 (+$41,443, +9.61% from previous year)
- 2015: $495,009 (+$22,120, +4.68% from previous year)
- 2016: $520,974 (+$25,966, +5.25% from previous year)
- 2017: $554,458 (+$33,484, +6.43% from previous year)
- 2018: $580,462 (+$26,004, +4.69% from previous year)
- 2019: $605,197 (+$24,735, +4.26% from previous year)
- 2020: N/A
- 2021: $717,931
- 2022: $939,448 (+$221,517, +30.85% from previous year)
- 2023: $950,182 (+$10,734, +1.14% from previous year)
- 2024: $1,041,934 (+$91,752, +9.66% from previous year)
- 2025: $1,067,260 (+$25,325, +2.43% from previous year)
Weddington’s home prices jumped from $416,491 in 2012 to $1,067,260 in 2025 — a remarkable 156% increase. After consistent growth in the 2010s, values exploded in 2022 with a 30% spike, followed by steady gains through 2025. This makes Weddington one of the fastest-growing high-end markets in North Carolina. While the pace of growth has slowed slightly, values continue to inch upward, signaling persistent demand. The town’s appeal lies in its proximity to Charlotte and its reputation for excellent schools and upscale living. With large homes, generous lots, and a semi-rural feel, Weddington offers a rare blend of luxury and tranquility within commuting distance of a major city. It’s also become a magnet for affluent professionals and families seeking more space and privacy. The town’s steady appreciation over more than a decade reflects both its desirability and long-term investment value.
Weddington – Suburban Sophistication Just Outside Charlotte
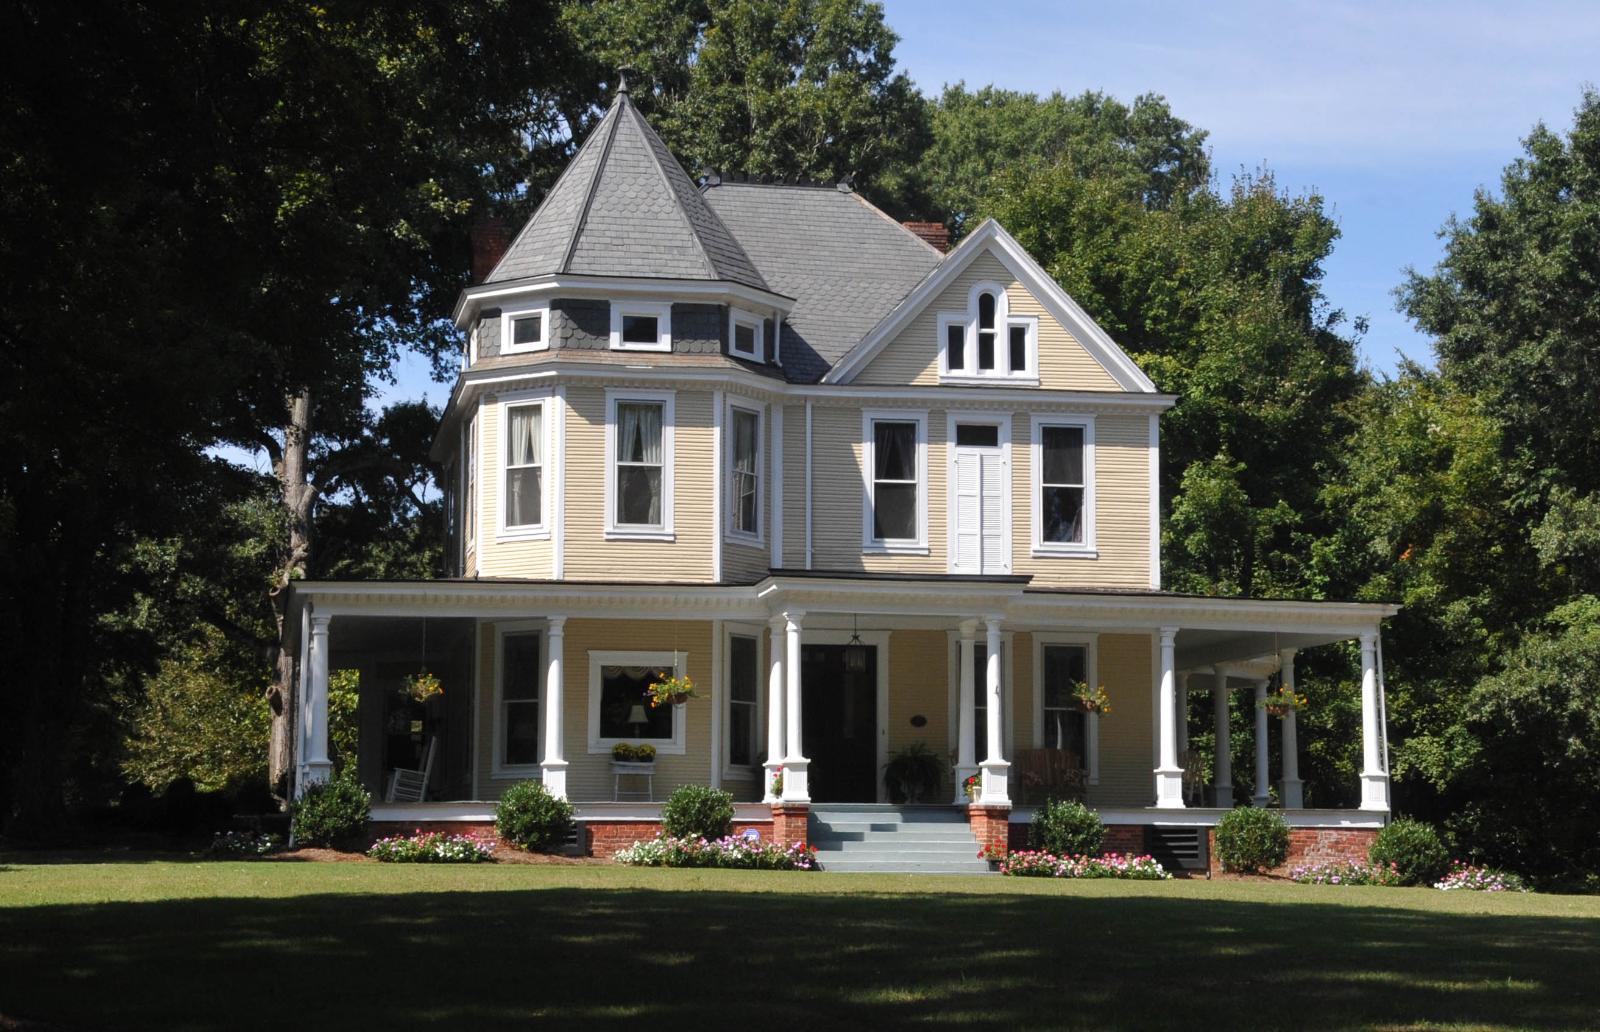
Located in Union County, just southeast of Charlotte, Weddington offers the kind of spacious, upscale suburban living that’s increasingly hard to find. The town is known for its top-rated public schools, including those in the Weddington cluster, and its abundance of new construction homes on large lots. Most of the area is zoned for low-density residential use, which has helped preserve its peaceful, family-friendly character. Weddington has seen strong in-migration over the past decade, particularly from urban dwellers looking to trade cramped spaces for custom-built estates. Its location near the I-485 loop provides easy access to Charlotte’s employment centers, yet the town itself remains quiet and distinctly residential. Amenities like parks, equestrian centers, and golf courses round out the lifestyle appeal. The 2022 surge in prices aligned with broader trends of urban flight and rising demand for flexible living spaces. With its blend of natural beauty, space, and strong community ties, Weddington continues to shine as a premier destination for luxury living in North Carolina.
4. Marvin – 147% Home Price Increase Since 2012
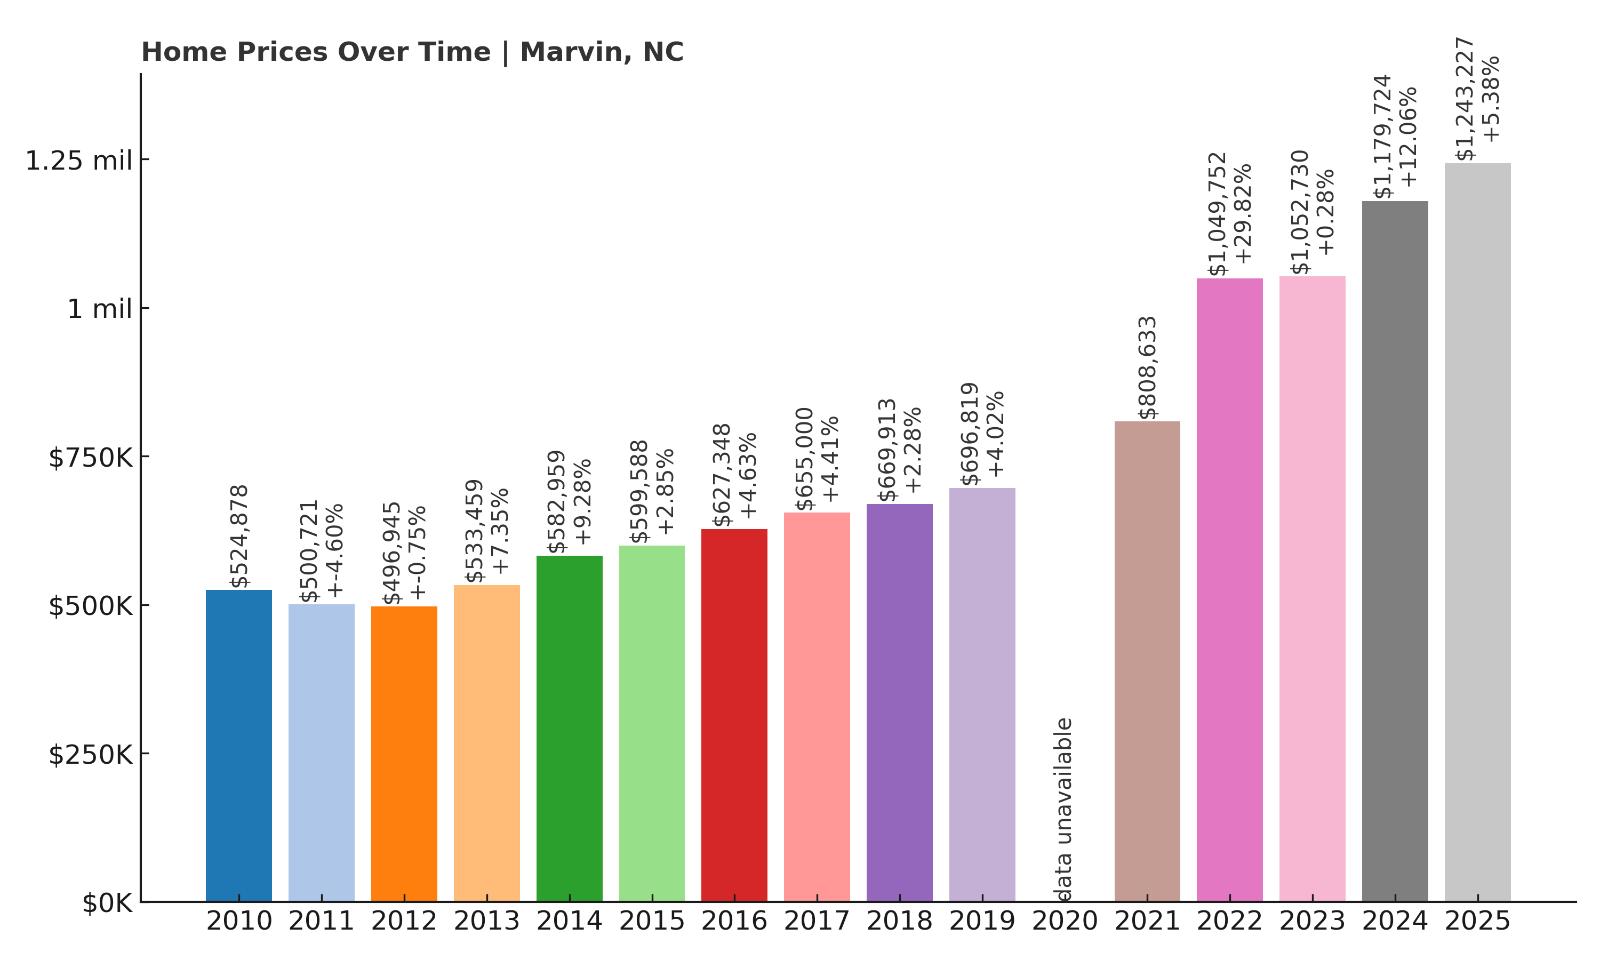
- 2010: $524,878
- 2011: $500,721 (-$24,157, -4.60% from previous year)
- 2012: $496,945 (-$3,776, -0.75% from previous year)
- 2013: $533,459 (+$36,514, +7.35% from previous year)
- 2014: $582,959 (+$49,500, +9.28% from previous year)
- 2015: $599,588 (+$16,628, +2.85% from previous year)
- 2016: $627,348 (+$27,760, +4.63% from previous year)
- 2017: $655,000 (+$27,651, +4.41% from previous year)
- 2018: $669,913 (+$14,913, +2.28% from previous year)
- 2019: $696,819 (+$26,906, +4.02% from previous year)
- 2020: N/A
- 2021: $808,633
- 2022: $1,049,752 (+$241,119, +29.82% from previous year)
- 2023: $1,052,730 (+$2,978, +0.28% from previous year)
- 2024: $1,179,724 (+$126,994, +12.06% from previous year)
- 2025: $1,243,227 (+$63,502, +5.38% from previous year)
Between 2012 and 2025, home values in Marvin soared from $496,945 to $1,243,227 — a 147% increase. The largest jump occurred in 2022, when prices leapt nearly 30% in just one year. That momentum carried into 2024, which posted another double-digit gain. In 2025, the market cooled slightly but still added over $63,000 to the median price. Marvin’s appreciation has been remarkably consistent, with very few years of decline and strong year-over-year gains for most of the last decade. This long-term stability has made it a go-to for buyers seeking both luxury and dependable equity growth. The town’s zoning laws and limited commercial development have helped protect property values over time. Buyers looking for upscale living near Charlotte have increasingly chosen Marvin over more crowded alternatives, driving prices higher year after year.
Marvin – Quiet Prestige in Charlotte’s Southside
Marvin is an affluent village in Union County, known for its spacious homes, tree-lined streets, and semi-rural charm. Despite being just 25 miles from Uptown Charlotte, it feels like a peaceful retreat with a strong sense of exclusivity and privacy. Homes in Marvin are often built on one-acre lots or larger, and many belong to master-planned communities with clubhouses, trails, and golf courses. The town is part of the high-performing Union County Public Schools district, a major factor in attracting families. In recent years, Marvin has seen a steady influx of wealthy professionals relocating from Charlotte and other metro areas. The 2022 spike in home prices reflected rising interest from buyers who wanted more space and quiet without sacrificing access to city amenities. Local regulations limit high-density development, helping maintain the town’s low-key, high-value character. With limited housing inventory and ongoing buyer demand, Marvin has firmly established itself as one of North Carolina’s most elite residential communities.
3. Cashiers – 152% Home Price Increase Since 2012
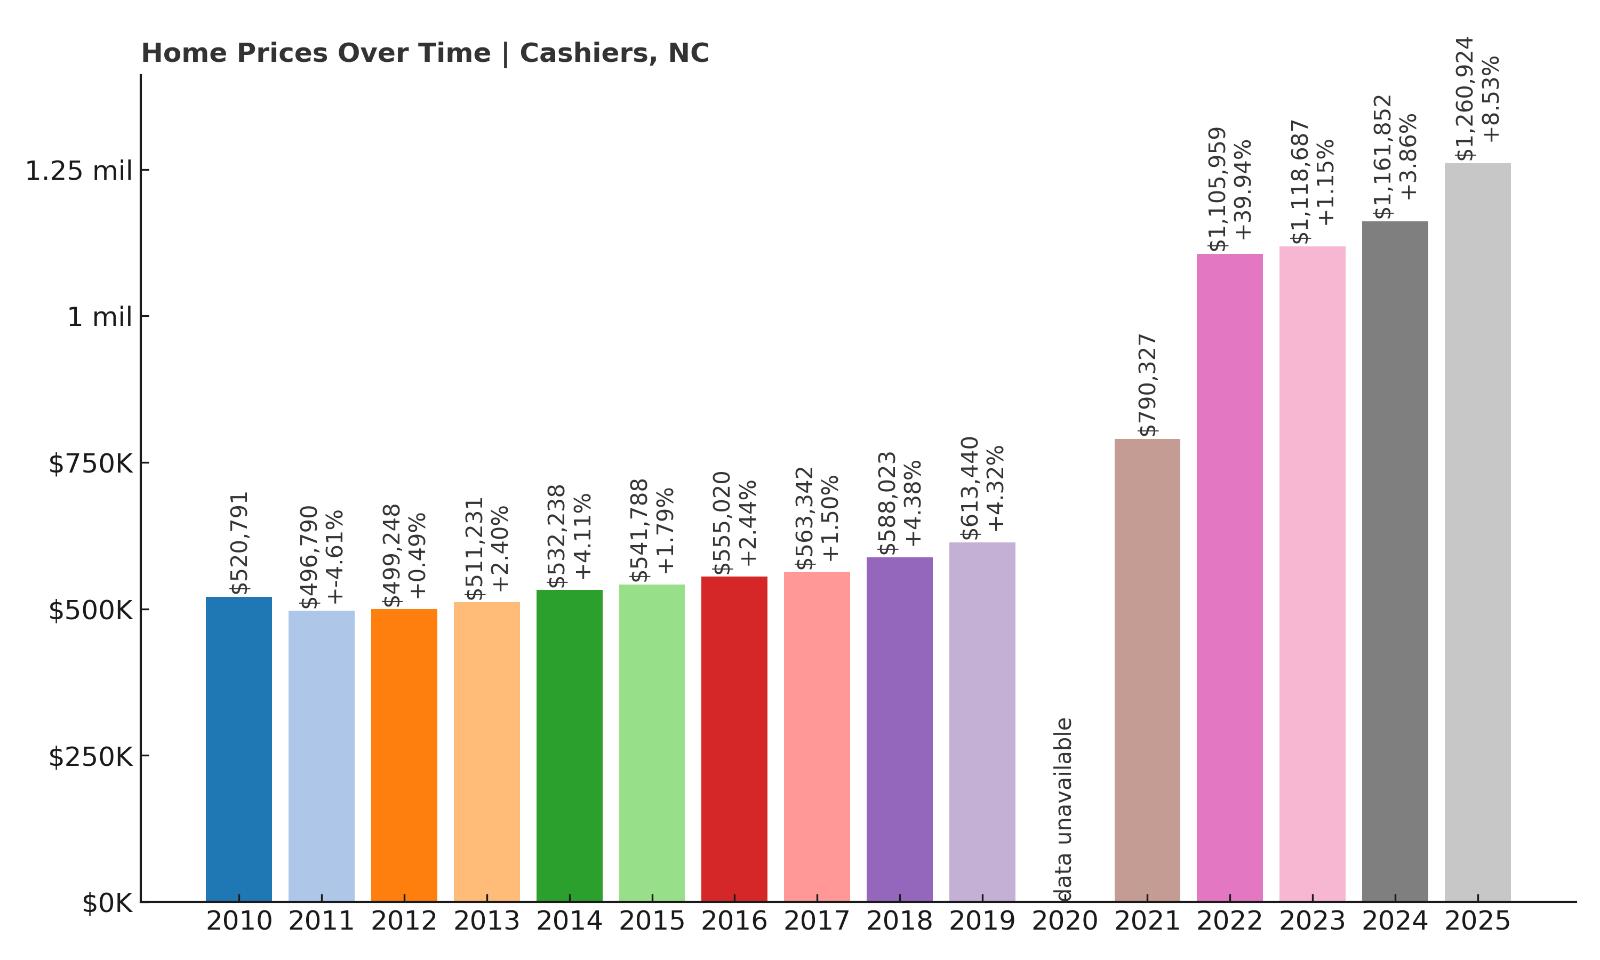
- 2010: $520,791
- 2011: $496,790 (-$24,000, -4.61% from previous year)
- 2012: $499,248 (+$2,458, +0.49% from previous year)
- 2013: $511,231 (+$11,983, +2.40% from previous year)
- 2014: $532,238 (+$21,007, +4.11% from previous year)
- 2015: $541,788 (+$9,550, +1.79% from previous year)
- 2016: $555,020 (+$13,232, +2.44% from previous year)
- 2017: $563,342 (+$8,322, +1.50% from previous year)
- 2018: $588,023 (+$24,681, +4.38% from previous year)
- 2019: $613,440 (+$25,418, +4.32% from previous year)
- 2020: N/A
- 2021: $790,327
- 2022: $1,105,959 (+$315,632, +39.94% from previous year)
- 2023: $1,118,687 (+$12,728, +1.15% from previous year)
- 2024: $1,161,852 (+$43,165, +3.86% from previous year)
- 2025: $1,260,924 (+$99,072, +8.53% from previous year)
Home values in Cashiers rose from $499,248 in 2012 to $1,260,924 in 2025 — a 152% increase. This luxury mountain town saw its sharpest spike in 2022, when median prices jumped nearly 40% in one year. That explosive growth helped vault Cashiers into the top three most expensive housing markets in North Carolina. Subsequent years brought continued, if slower, growth — with a strong rebound in 2025. Unlike some vacation markets, Cashiers hasn’t experienced a significant post-pandemic correction. Instead, it has held onto its gains while adding new value year after year. This resilience points to enduring interest among affluent buyers who want high-elevation homes with privacy and style. The price growth in recent years suggests that Cashiers has transitioned from a seasonal getaway to a serious year-round destination for wealthier homeowners.
Cashiers – A Blue Ridge Haven for High-End Buyers

Cashiers is located in Jackson County in western North Carolina, perched high on a plateau in the Blue Ridge Mountains. It’s known for its cool summers, hiking trails, waterfalls, and small-town charm — but also for its growing reputation as a luxury destination. The town is home to high-end clubs and golf resorts like Wade Hampton and Mountaintop, which attract affluent buyers from Atlanta, Charlotte, and beyond. Despite its rural setting, Cashiers offers fine dining, designer boutiques, and custom-built estates nestled among forests and mountain streams. Its elevation of over 3,400 feet makes it a natural air conditioner during the sweltering Southern summers. The surge in home prices reflects rising interest from full-time residents as well as second-home owners. Strict building guidelines and a lack of large-scale development help maintain both its scenic beauty and exclusivity. With limited inventory and soaring demand, Cashiers is now one of the premier mountain markets in the entire Southeastern U.S.
2. Bald Head Island – 94% Home Price Increase Since 2012
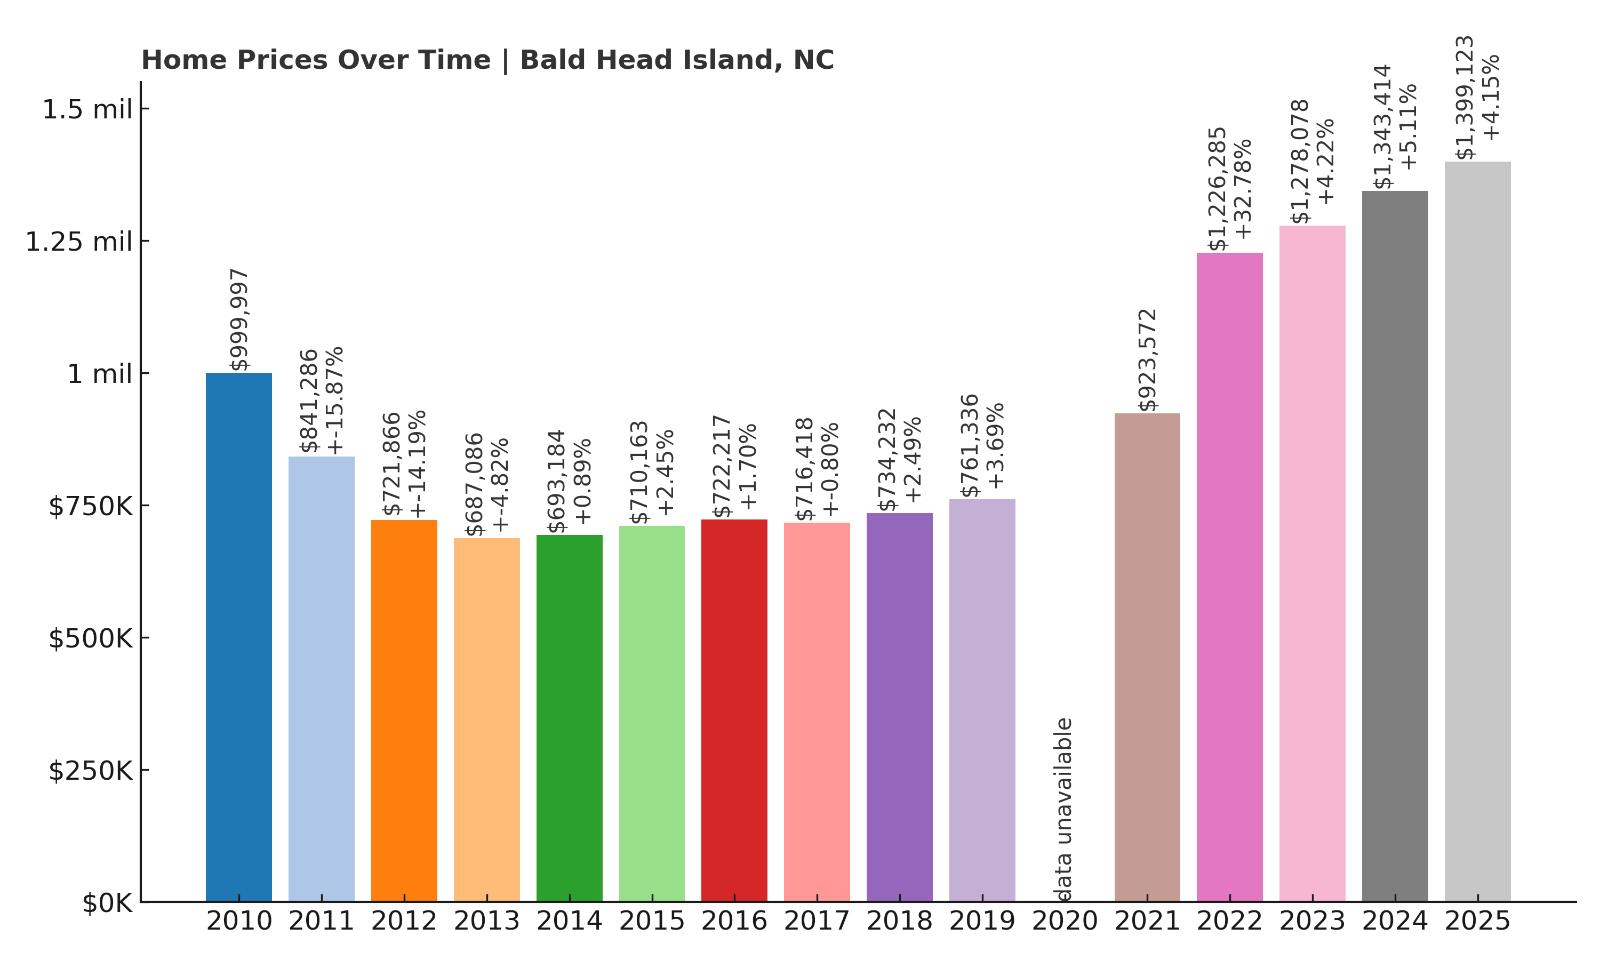
- 2010: $999,997
- 2011: $841,286 (-$158,711, -15.87% from previous year)
- 2012: $721,866 (-$119,420, -14.19% from previous year)
- 2013: $687,086 (-$34,779, -4.82% from previous year)
- 2014: $693,184 (+$6,098, +0.89% from previous year)
- 2015: $710,163 (+$16,978, +2.45% from previous year)
- 2016: $722,217 (+$12,054, +1.70% from previous year)
- 2017: $716,418 (-$5,799, -0.80% from previous year)
- 2018: $734,232 (+$17,814, +2.49% from previous year)
- 2019: $761,336 (+$27,104, +3.69% from previous year)
- 2020: N/A
- 2021: $923,572
- 2022: $1,226,285 (+$302,713, +32.78% from previous year)
- 2023: $1,278,078 (+$51,793, +4.22% from previous year)
- 2024: $1,343,414 (+$65,336, +5.11% from previous year)
- 2025: $1,399,123 (+$55,709, +4.15% from previous year)
Bald Head Island’s home values have climbed from $721,866 in 2012 to $1,399,123 in 2025 — a 94% gain. After declining from 2010 to 2013, the market began to recover and ultimately took off following 2020. The biggest leap came in 2022 with a 32% gain, followed by consistent increases each year. Unlike many other luxury markets, Bald Head Island saw no major price correction after its boom — only sustained upward movement. Limited inventory, strict access, and high demand have all contributed to the consistent value growth. The island’s exclusive atmosphere and unique car-free lifestyle add to its appeal. Buyers here are looking for something different: not just beach access, but total escape. Its long-term appreciation shows that this kind of niche luxury continues to resonate with high-income buyers.
Bald Head Island – Coastal Living with a Twist of Seclusion

Located off the southeastern tip of North Carolina, Bald Head Island is a unique car-free island that’s accessible only by ferry or private boat. Residents and visitors get around by golf cart, bike, or on foot, giving the island an unusually peaceful and quiet atmosphere. Real estate here is dominated by large vacation homes, many with oceanfront views or marshside serenity. The island is home to maritime forests, nature preserves, and pristine beaches — a rare combination that creates a sense of living in harmony with the environment. Local development is strictly regulated to protect the island’s natural character. As demand for secluded, luxurious coastal homes has increased, Bald Head Island has seen sharp increases in home values. The rise in remote work has further fueled interest, as buyers now prioritize privacy and lifestyle over commute times. With very limited new construction and consistently strong demand, this market continues to command top-tier prices on the North Carolina coast.
1. Wrightsville Beach – 124% Home Price Increase Since 2012

- 2010: $767,808
- 2011: $699,463 (-$68,345, -8.90% from previous year)
- 2012: $670,130 (-$29,333, -4.19% from previous year)
- 2013: $651,611 (-$18,519, -2.76% from previous year)
- 2014: $701,913 (+$50,302, +7.72% from previous year)
- 2015: $736,805 (+$34,892, +4.97% from previous year)
- 2016: $772,846 (+$36,041, +4.89% from previous year)
- 2017: $772,810 (-$37, -0.00% from previous year)
- 2018: $804,547 (+$31,738, +4.11% from previous year)
- 2019: $842,977 (+$38,430, +4.78% from previous year)
- 2020: N/A
- 2021: $1,046,195
- 2022: $1,377,695 (+$331,500, +31.69% from previous year)
- 2023: $1,421,581 (+$43,887, +3.19% from previous year)
- 2024: $1,460,454 (+$38,873, +2.73% from previous year)
- 2025: $1,526,874 (+$66,419, +4.55% from previous year)
Wrightsville Beach takes the top spot with a 124% increase in home values since 2012, jumping from $670,130 to $1,526,874 by 2025. The most dramatic rise came in 2022, when prices surged by over $330,000 — a 31% increase. The years since have seen smaller, yet consistent gains, solidifying its position as North Carolina’s most expensive housing market. Wrightsville’s high prices reflect a mix of exclusivity, beauty, and demand that few coastal towns can match. Tight inventory, strict zoning, and nearly universal ocean views help explain the consistently rising values. Even as other markets slowed, Wrightsville stayed strong, with 2025 posting another healthy gain. This town’s market shows no signs of softening and continues to be a bellwether for North Carolina’s luxury coastal real estate.
Wrightsville Beach – North Carolina’s Premier Oceanfront Address
Located just east of Wilmington, Wrightsville Beach is often considered the gold standard for coastal living in North Carolina. It combines urban access with a laid-back, beach-centric lifestyle, attracting everyone from retirees to young professionals. The island is tightly built, with nearly all homes within walking distance of the water, and zoning rules keep it from becoming overcrowded. It’s known for its upscale real estate, clean beaches, and vibrant downtown area with surf shops, seafood restaurants, and marina life. Buyers are drawn to its blend of accessibility, elegance, and rental income potential. The town’s strong appreciation over the past decade reflects both its natural beauty and rock-solid fundamentals. With limited land, consistently high demand, and a reputation as the state’s most prestigious beach town, Wrightsville Beach continues to lead the pack in luxury home value and desirability.