Would you like to save this?
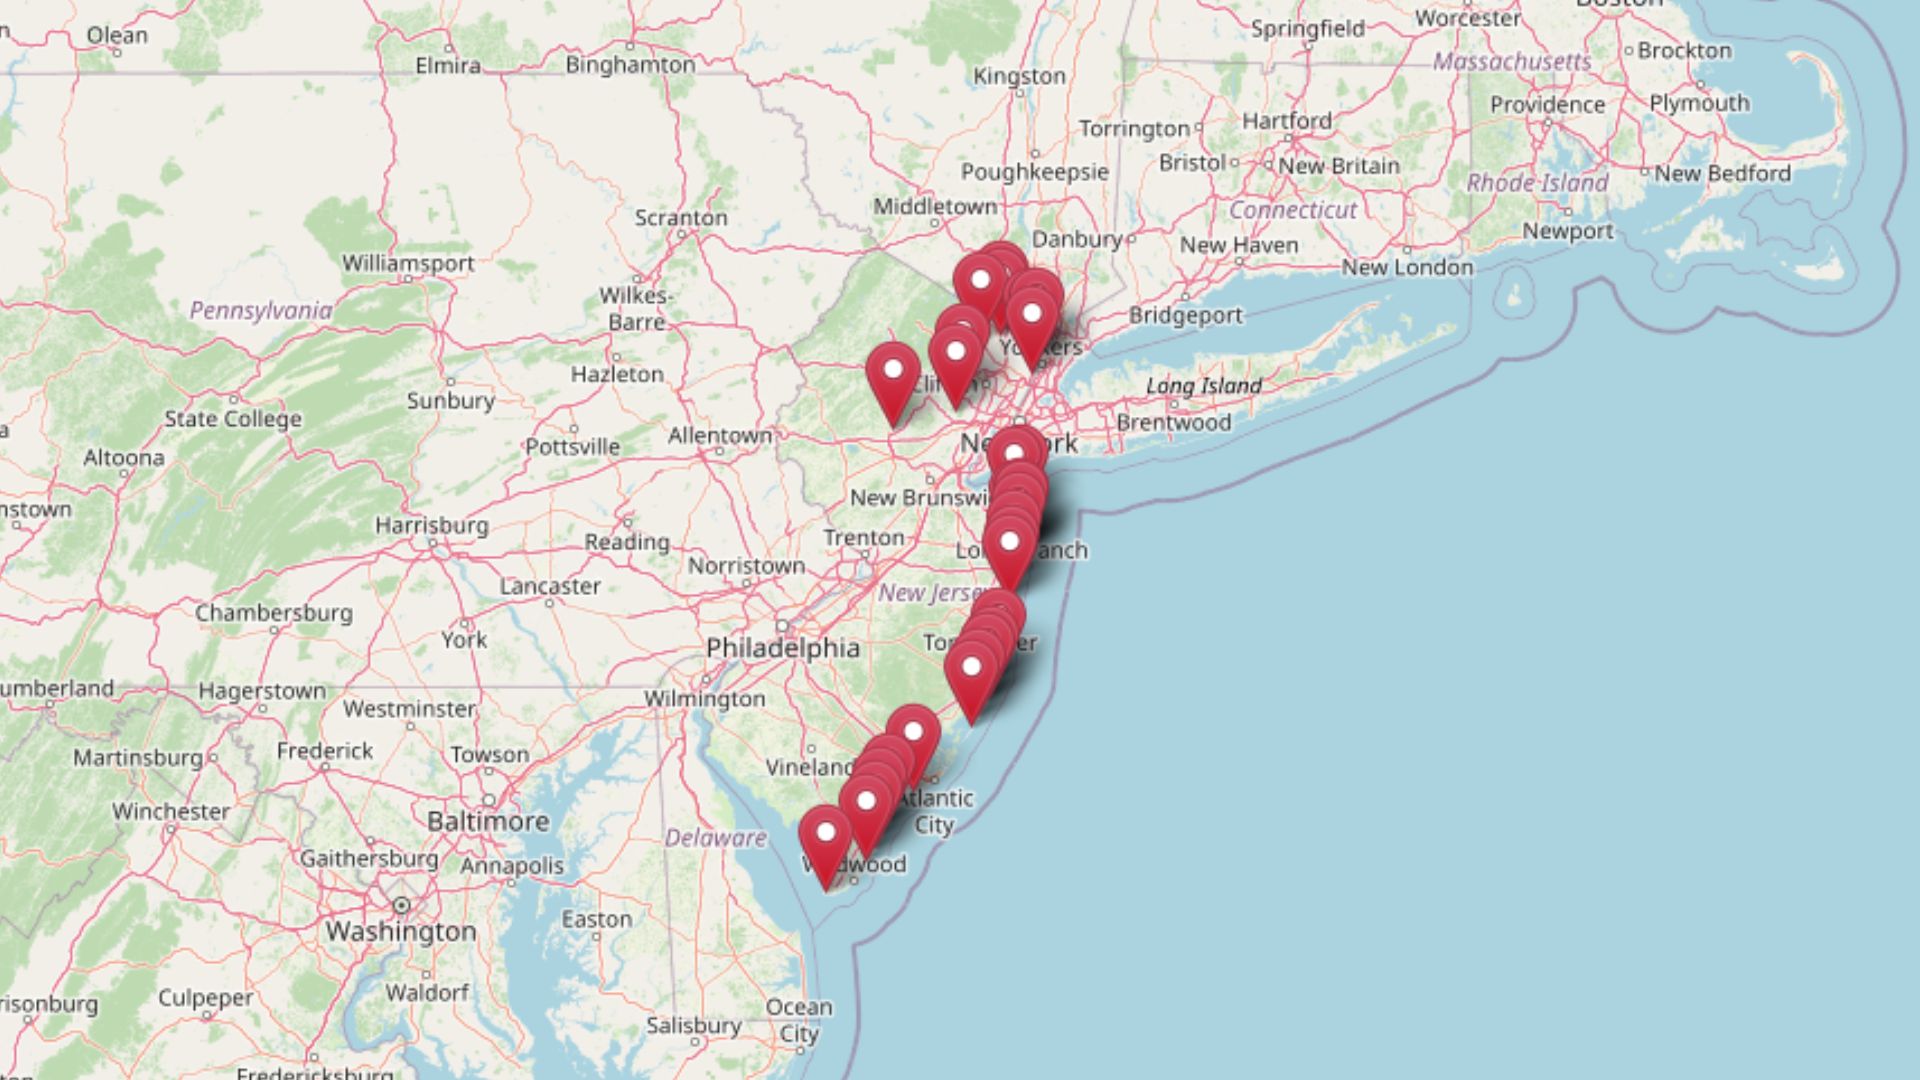
New Jersey’s property boom may be running out of road. Based on the Zillow Home Values Index, analysts have flagged 20 towns across the state where housing prices now show clear signs of vulnerability. These communities share a troubling pattern: home values stretched far above long-term trends, rapid price swings, and market behavior that mirrors past downturns. Whether driven by tourism reliance or rapid gentrification, each of these towns faces rising risks that current property prices may be unsustainable.
20. Hillside – Crash Risk Percentage: 81.25%
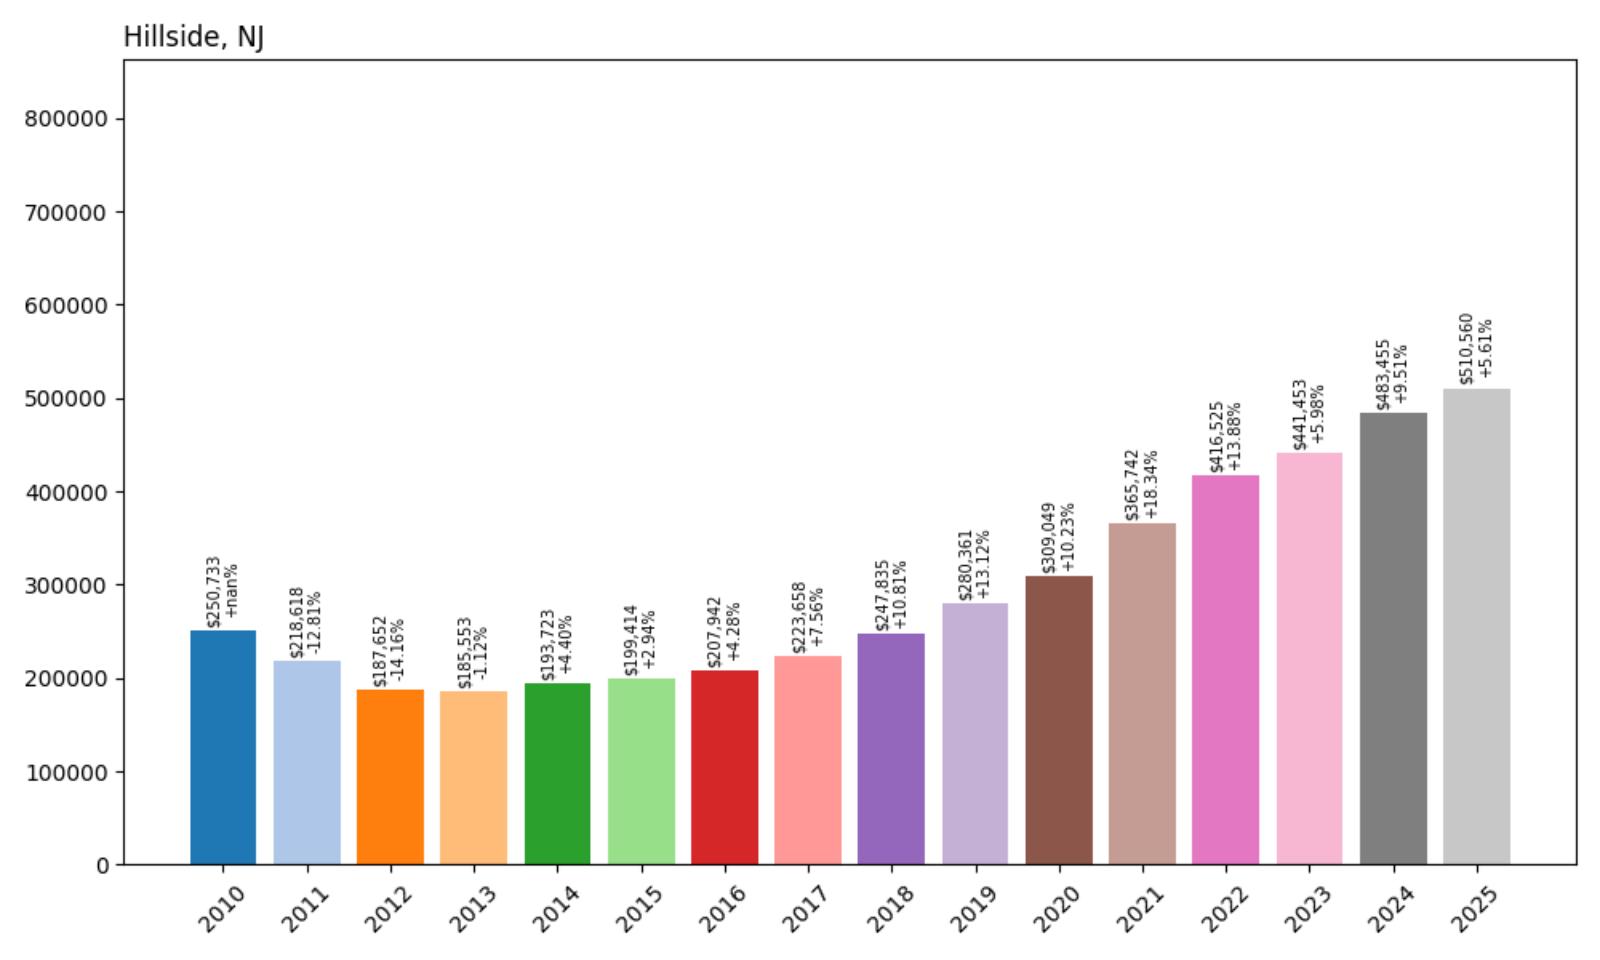
- Crash Risk Percentage: 81.25%
- Historical crashes (8%+ drops): 2
- Worst historical crash: -14.2% (2012)
- Total price increase since 2010: +103.6%
- Overextended above long-term average: +73.0%
- Price volatility (annual swings): 9.0%
- Current 2025 price: $510,560
Hillside’s housing data reveals a market stretched to concerning levels, with prices more than doubling since 2010 and currently sitting 73% above historical trends. The Union County township has experienced two significant crashes over the past 15 years, including a devastating 14.2% drop in 2012 during the post-recession recovery period. This pattern of boom-and-bust cycles suggests the market lacks fundamental stability.
Hillside – Dangerous Overextension in Union County
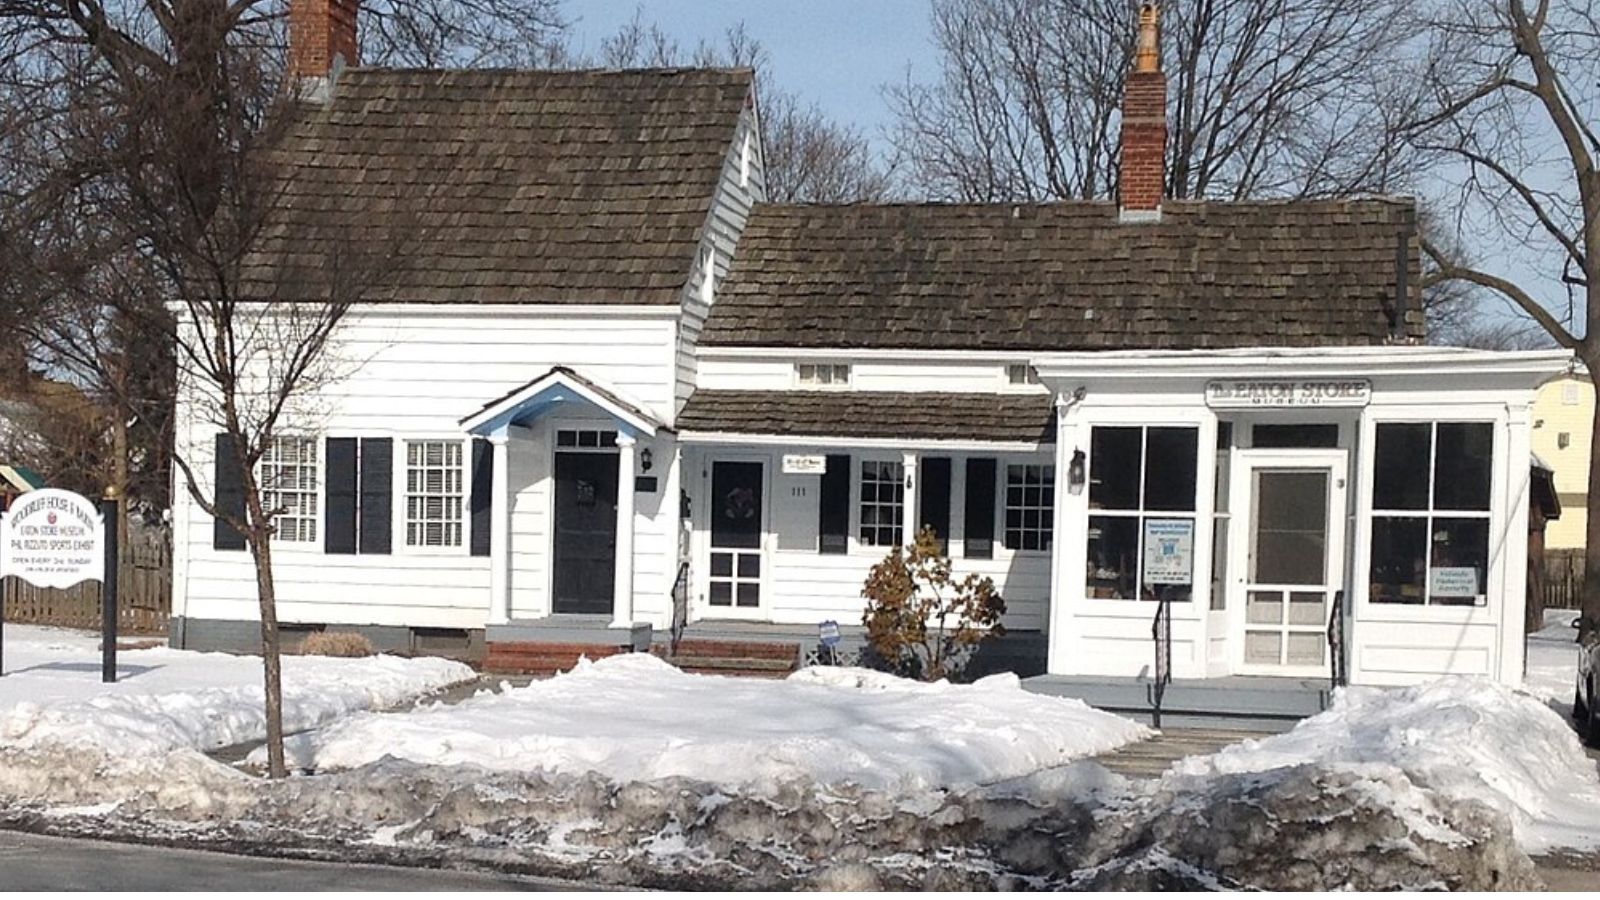
Located in Union County just southwest of Newark, Hillside sits at a crossroads of major transportation routes including the Garden State Parkway and Routes 22 and 82. The township’s 2.8 square miles house approximately 21,000 residents in a predominantly working-class community. Hillside’s economy relies heavily on its proximity to Newark’s job market and its role as a transportation hub, making it vulnerable to broader economic shifts in the region.
The current median price of $510,560 represents mathematical unsustainability when compared to local income levels and historical norms. Hillside’s 9% annual price volatility indicates an unstable market prone to sharp corrections. The township’s dependence on commuter traffic to New York City and its aging housing stock from the 1940s-1960s era create additional risk factors that could trigger rapid price declines if economic conditions deteriorate.
19. Hopatcong – Crash Risk Percentage: 81.35%
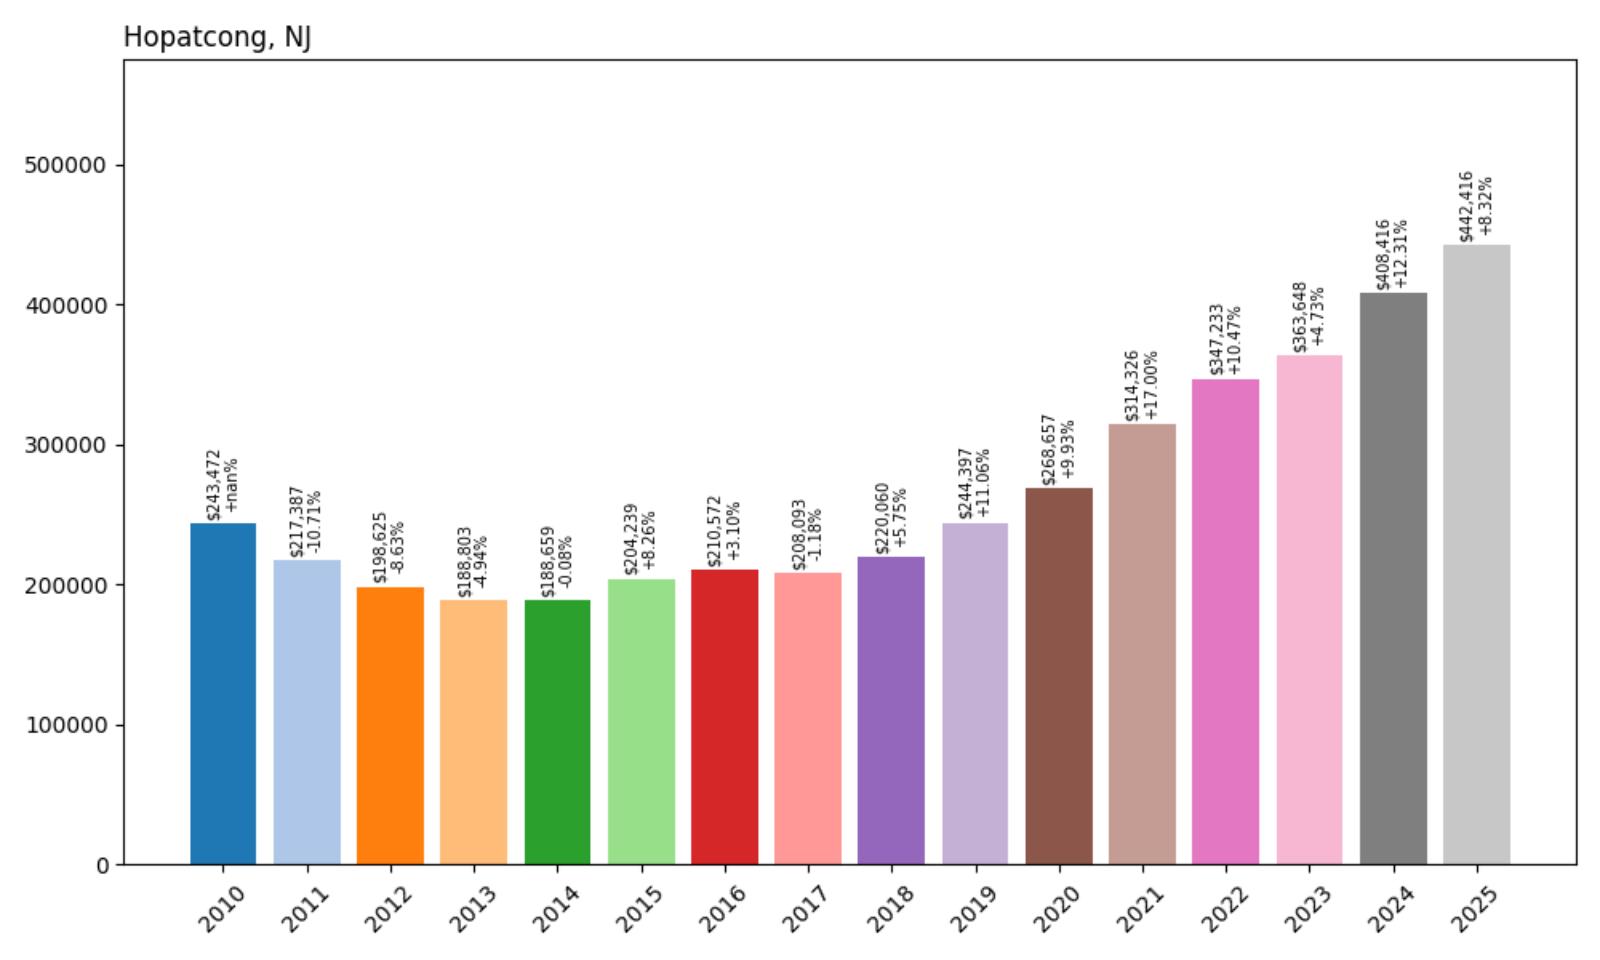
- Crash Risk Percentage: 81.35%
- Historical crashes (8%+ drops): 2
- Worst historical crash: -10.7% (2011)
- Total price increase since 2010: +81.7%
- Overextended above long-term average: +65.8%
- Price volatility (annual swings): 8.0%
- Current 2025 price: $442,416
Hopatcong’s lakefront location has driven dramatic price appreciation, but the borough now shows clear signs of overheating. With home values 65.8% above long-term averages and an 81.7% increase since 2010, the market has reached levels that may be unsustainable for a community of 15,000 residents. The borough’s history includes two previous crashes, demonstrating vulnerability to economic downturns.
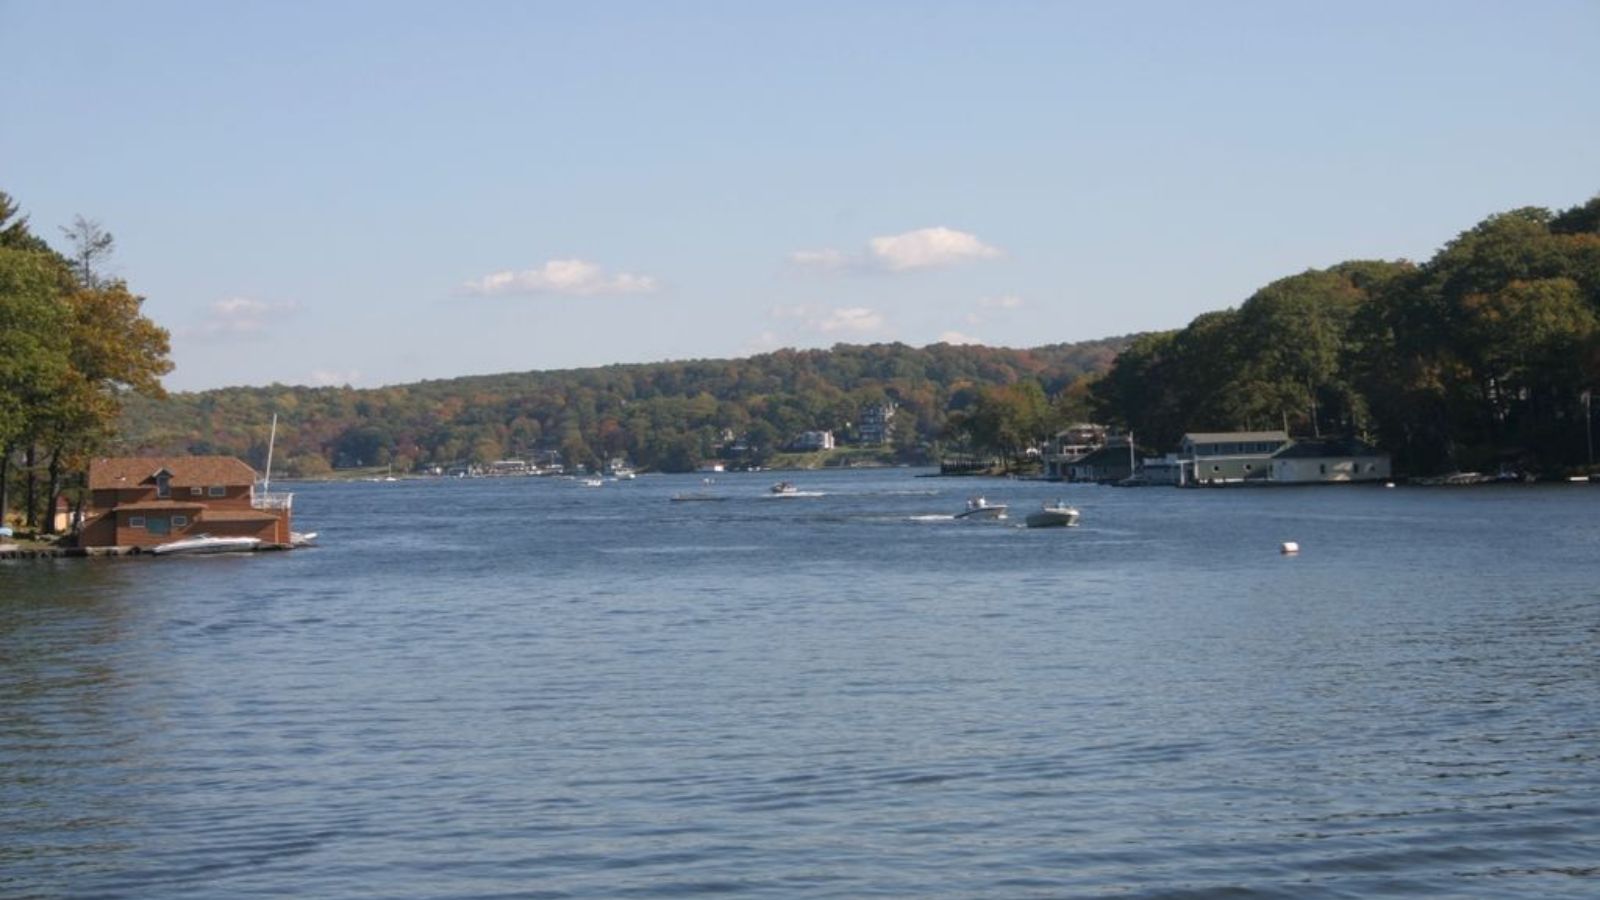
Hopatcong – Lake Community Under Pressure
Kitchen Style?
Hopatcong, situated around New Jersey’s largest freshwater lake in Morris and Sussex counties, has evolved from a summer vacation destination into a year-round residential community. The borough’s appeal stems from its recreational opportunities, including boating, fishing, and waterfront living, which has attracted both retirees and families seeking alternatives to more expensive lakefront properties elsewhere in the region. However, this demand has pushed prices beyond what many local incomes can support.
The current median price of $442,416 reflects the premium commanded by lakefront and lake-view properties, but may not be sustainable given the community’s seasonal economic fluctuations and limited employment opportunities. Hopatcong’s 8% price volatility and history of market corrections, including a 10.7% crash in 2011, suggest that current valuations could face significant pressure if demand from outside buyers diminishes or if broader economic conditions force residents to sell.
18. Egg Harbor City – Crash Risk Percentage: 82.15%
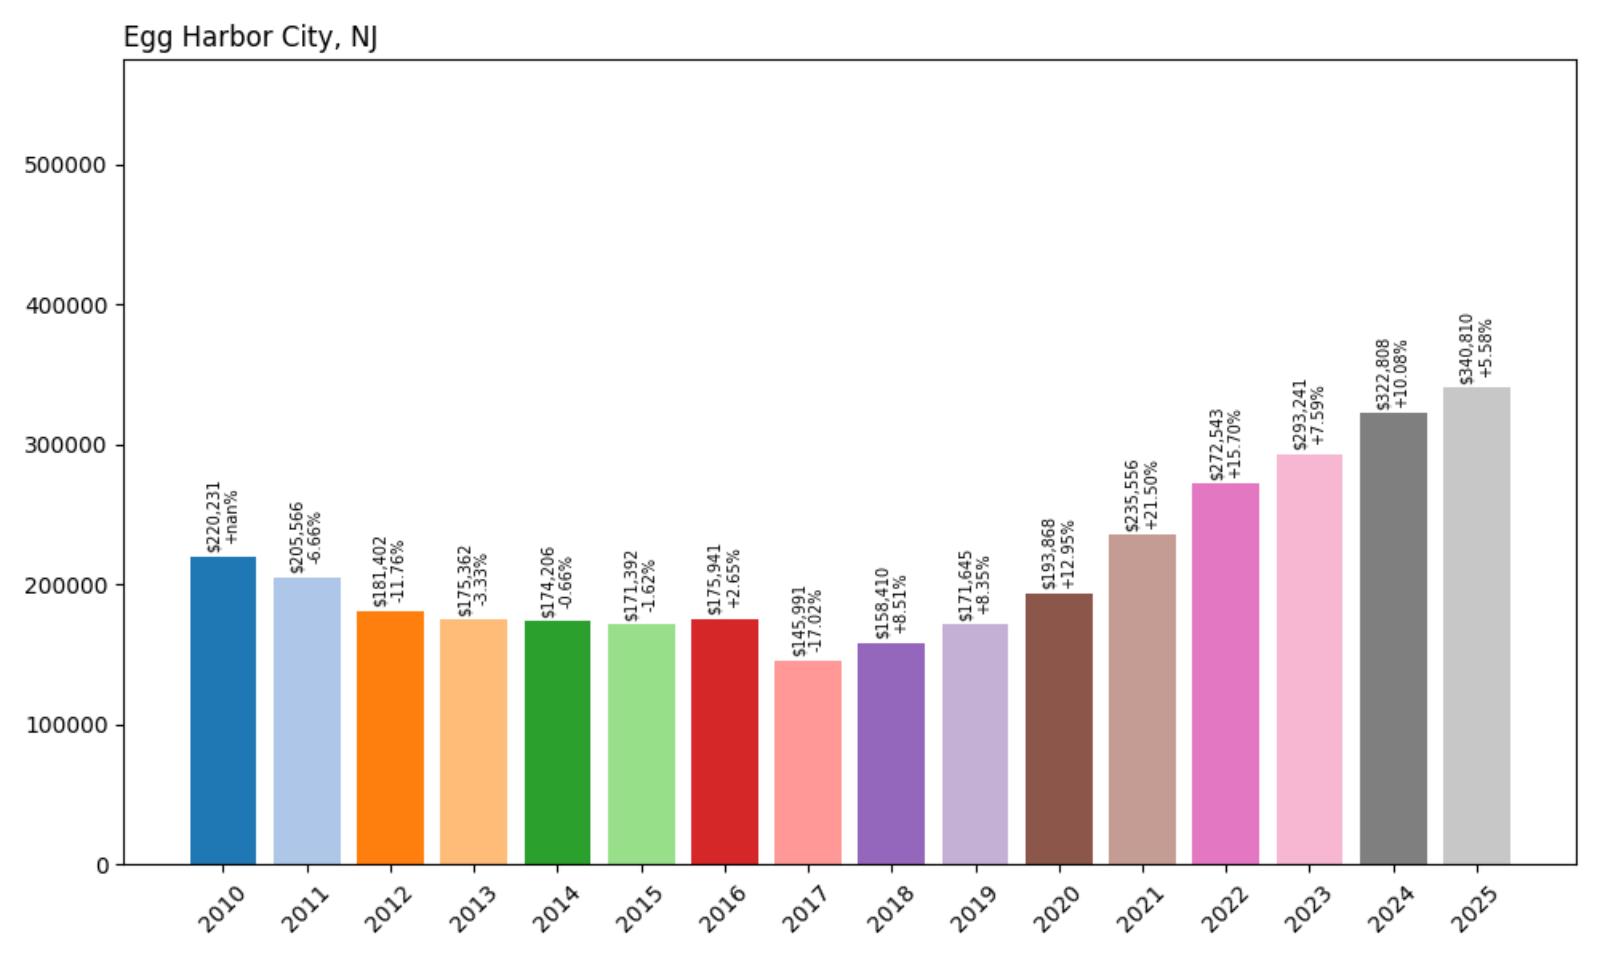
- Crash Risk Percentage: 82.15%
- Historical crashes (8%+ drops): 2
- Worst historical crash: -17.0% (2017)
- Total price increase since 2010: +54.8%
- Overextended above long-term average: +58.6%
- Price volatility (annual swings): 10.4%
- Current 2025 price: $340,810
Egg Harbor City stands out with the most recent severe crash in our dataset, experiencing a devastating 17% price drop in 2017. Despite this recent correction, the Atlantic County city has already rebounded to concerning levels, sitting 58.6% above long-term trends. The 10.4% annual volatility signals an inherently unstable market prone to dramatic swings.
Egg Harbor City – Recent Crash Survivor at Risk Again
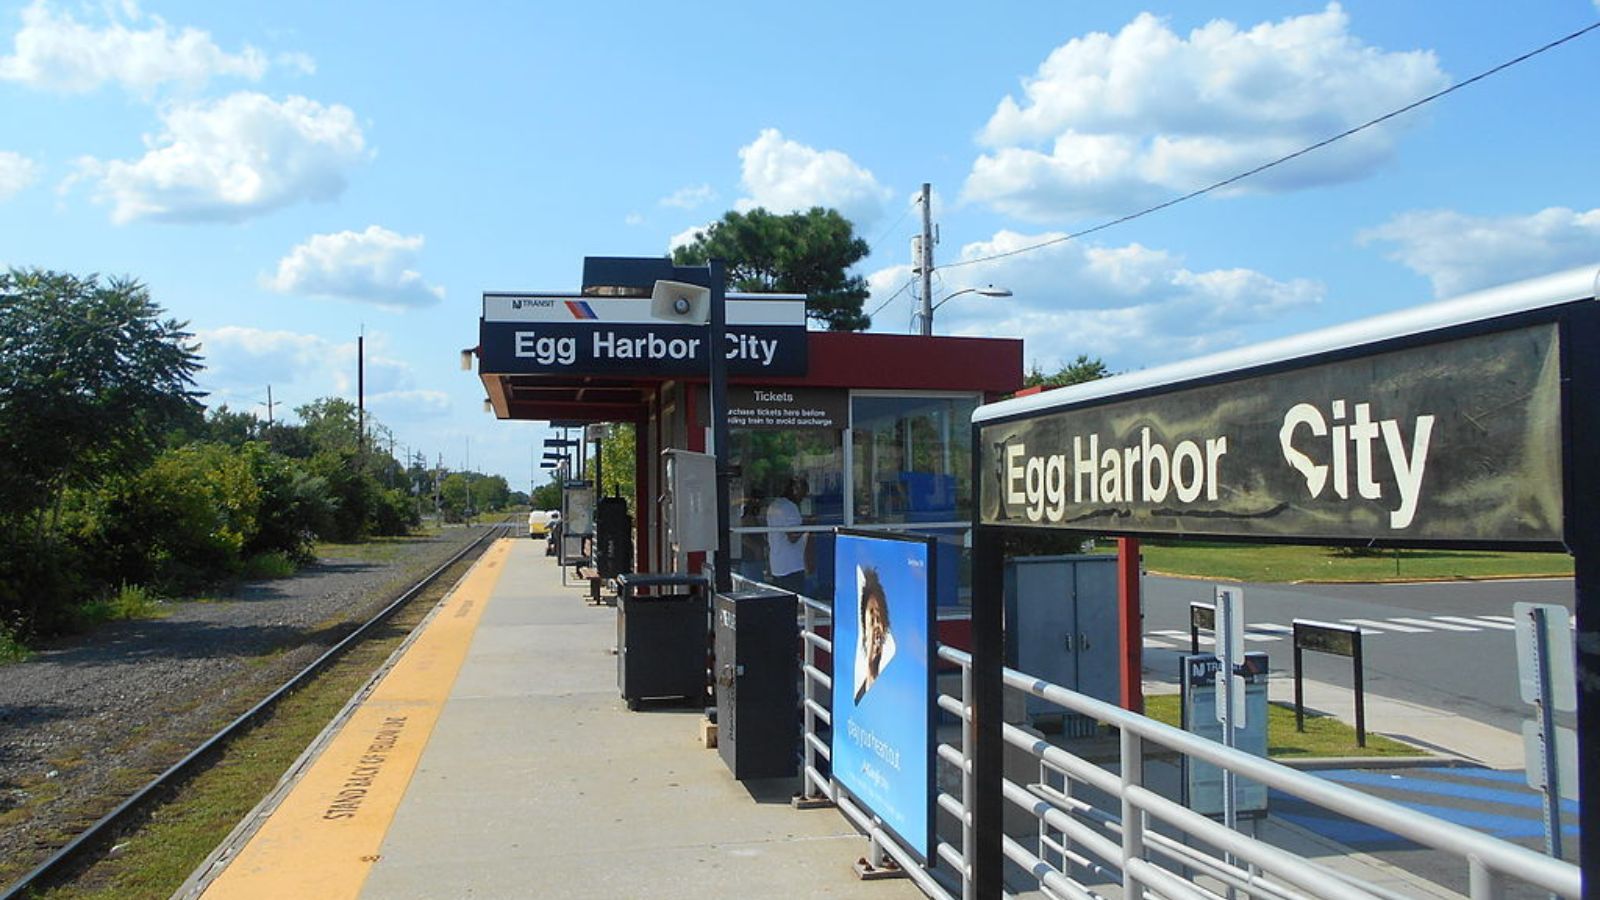
Located in Atlantic County’s Pine Barrens region, Egg Harbor City serves as a small urban center of approximately 4,200 residents surrounded by rural and conservation lands. The city’s economy has historically depended on agriculture, small manufacturing, and its role as a service center for the surrounding area. Its proximity to Atlantic City, about 20 miles southeast, has provided some economic benefits but also exposed the community to the volatility of the tourism and casino industries.
The city’s recent crash in 2017, which saw prices plummet by 17%, demonstrated the market’s fragility and susceptibility to rapid corrections. Despite this recent correction, home values have rebounded to $340,810, representing a 54.8% increase since 2010 and placing current prices 58.6% above sustainable levels. The combination of high volatility, recent crash history, and limited economic diversification creates a perfect storm for another potential price collapse, particularly if broader regional economic pressures intensify.
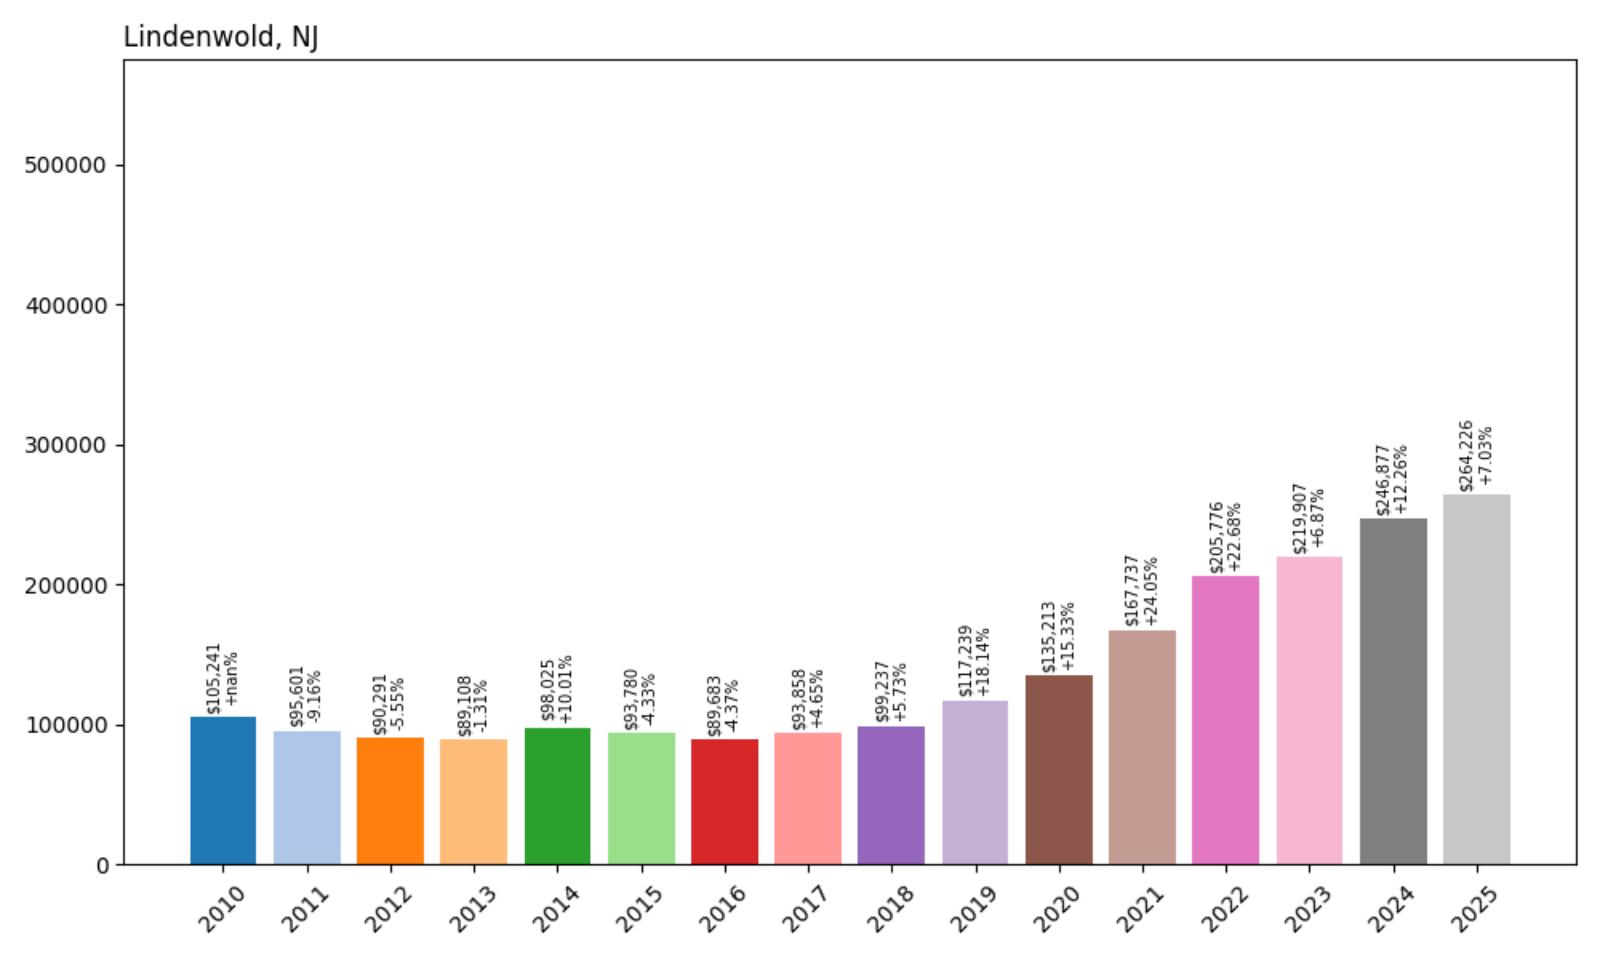
17. Lindenwold – Crash Risk Percentage: 83.30%
Home Stratosphere Guide
Your Personality Already Knows
How Your Home Should Feel
113 pages of room-by-room design guidance built around your actual brain, your actual habits, and the way you actually live.
You might be an ISFJ or INFP designer…
You design through feeling — your spaces are personal, comforting, and full of meaning. The guide covers your exact color palettes, room layouts, and the one mistake your type always makes.
The full guide maps all 16 types to specific rooms, palettes & furniture picks ↓
You might be an ISTJ or INTJ designer…
You crave order, function, and visual calm. The guide shows you how to create spaces that feel both serene and intentional — without ending up sterile.
The full guide maps all 16 types to specific rooms, palettes & furniture picks ↓
You might be an ENFP or ESTP designer…
You design by instinct and energy. Your home should feel alive. The guide shows you how to channel that into rooms that feel curated, not chaotic.
The full guide maps all 16 types to specific rooms, palettes & furniture picks ↓
You might be an ENTJ or ESTJ designer…
You value quality, structure, and things done right. The guide gives you the framework to build rooms that feel polished without overthinking every detail.
The full guide maps all 16 types to specific rooms, palettes & furniture picks ↓
- Crash Risk Percentage: 83.30%
- Historical crashes (8%+ drops): 1
- Worst historical crash: -9.2% (2011)
- Total price increase since 2010: +151.1%
- Overextended above long-term average: +91.1%
- Price volatility (annual swings): 10.4%
- Current 2025 price: $264,226
Lindenwold presents one of the most dramatic appreciation stories in our analysis, with home values soaring 151.1% since 2010. The Camden County borough now sits 91.1% above its long-term average, representing extreme overextension. While the community has experienced only one historical crash, the magnitude of current overvaluation suggests significant correction potential.
Lindenwold – Extreme Appreciation Meets Reality
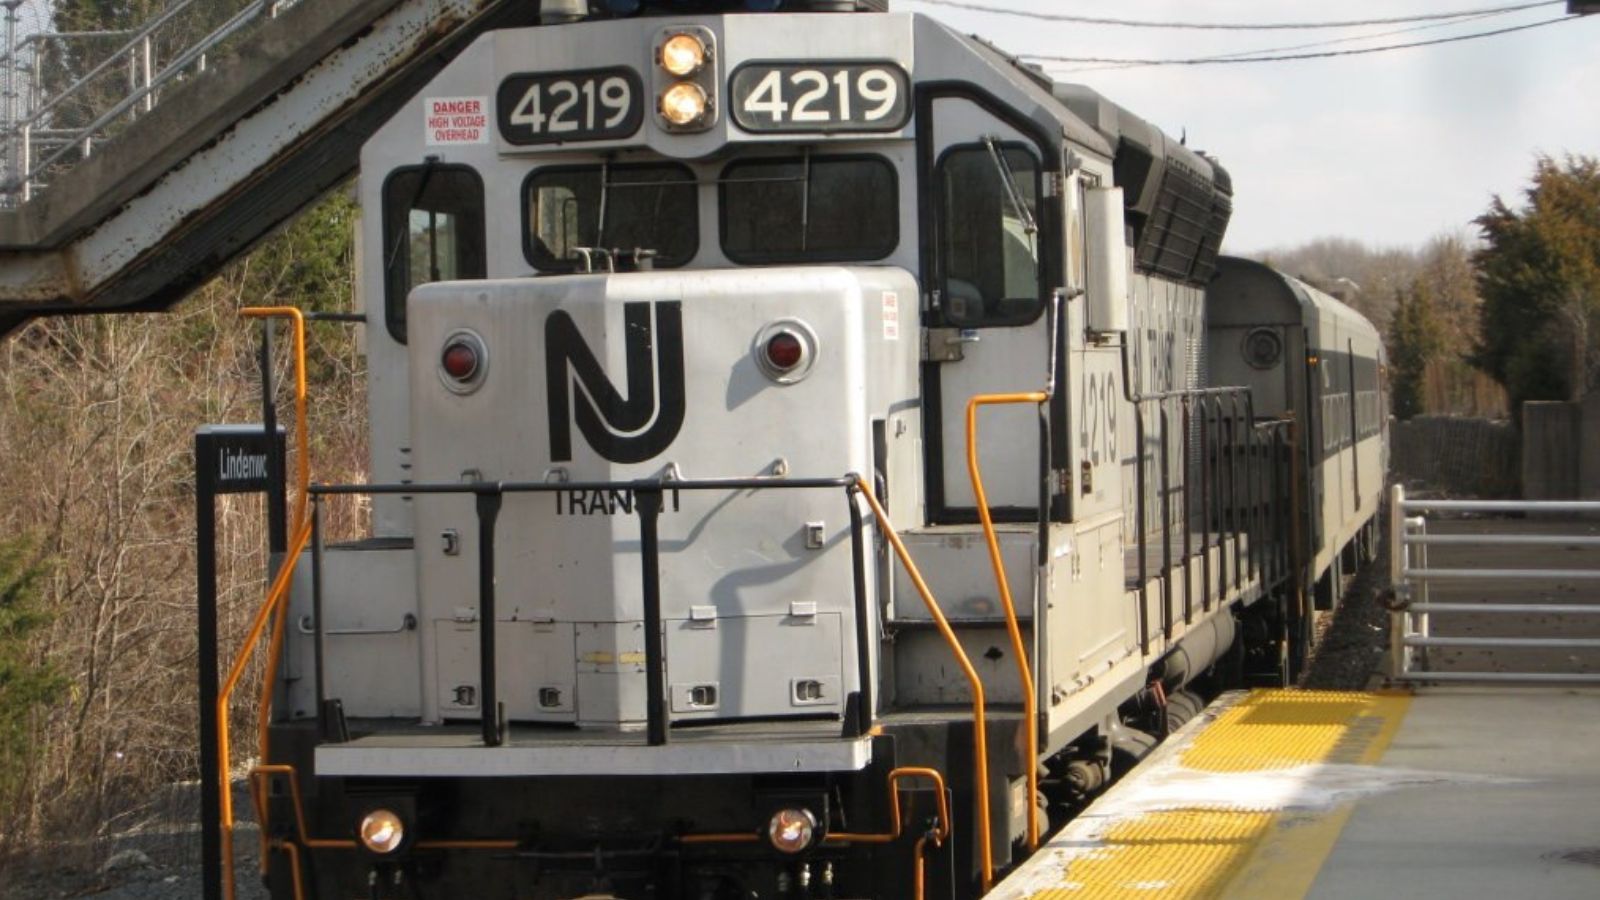
Lindenwold, a Camden County borough of approximately 17,000 residents, has transformed from an affordable suburban community into a housing market showing signs of speculative excess. Located about 15 miles southeast of Philadelphia, the borough benefits from its position along major transportation corridors and its accessibility to both Philadelphia and southern New Jersey employment centers. The presence of the PATCO High Speed Line provides direct rail service to Center City Philadelphia, making Lindenwold attractive to commuters seeking affordable alternatives to higher-priced areas.
However, the 151.1% price increase since 2010 has pushed the current median price of $264,226 far beyond historical norms, with values now 91.1% above long-term averages. This extreme overextension, combined with 10.4% annual volatility, suggests that prices have risen faster than local economic fundamentals can support. The borough’s dependence on commuter demand and its limited local employment base create vulnerabilities that could trigger rapid price corrections if transportation patterns change or if economic pressures force residents to relocate closer to employment centers.
16. Willingboro Township – Crash Risk Percentage: 83.45%

- Crash Risk Percentage: 83.45%
- Historical crashes (8%+ drops): 2
- Worst historical crash: -13.0% (2011)
- Total price increase since 2010: +118.8%
- Overextended above long-term average: +78.6%
- Price volatility (annual swings): 9.7%
- Current 2025 price: $355,640
Willingboro Township’s planned community design hasn’t protected it from market volatility, with two historical crashes including a 13% decline in 2011. The Burlington County township has seen prices more than double since 2010, reaching levels 78.6% above historical norms. This combination of crash history and current overextension creates substantial downside risk.
Willingboro Township – Planned Community Facing Unplanned Risks
Willingboro Township, located in Burlington County along the Delaware River, was originally developed in the 1950s as Levittown, one of America’s first mass-produced suburban communities. The township’s 7.8 square miles house approximately 31,000 residents in a carefully planned layout of single-family homes, townhouses, and garden apartments. Its location between Trenton and Philadelphia, with access to major highways and public transportation, has made it attractive to families seeking affordable suburban living with urban job access.
The current median price of $355,640 represents a dramatic departure from the community’s original affordable housing mission, with values increasing 118.8% since 2010 and now sitting 78.6% above sustainable levels. Willingboro’s history of market crashes, including a 13% decline in 2011, demonstrates the community’s vulnerability to broader economic pressures. The township’s aging housing stock, much of it approaching 70 years old, combined with its dependence on commuter demand and moderate price volatility of 9.7%, suggests that current valuations may not be sustainable if economic conditions deteriorate or if buyer preferences shift away from older suburban communities.
15. South Toms River – Crash Risk Percentage: 83.85%
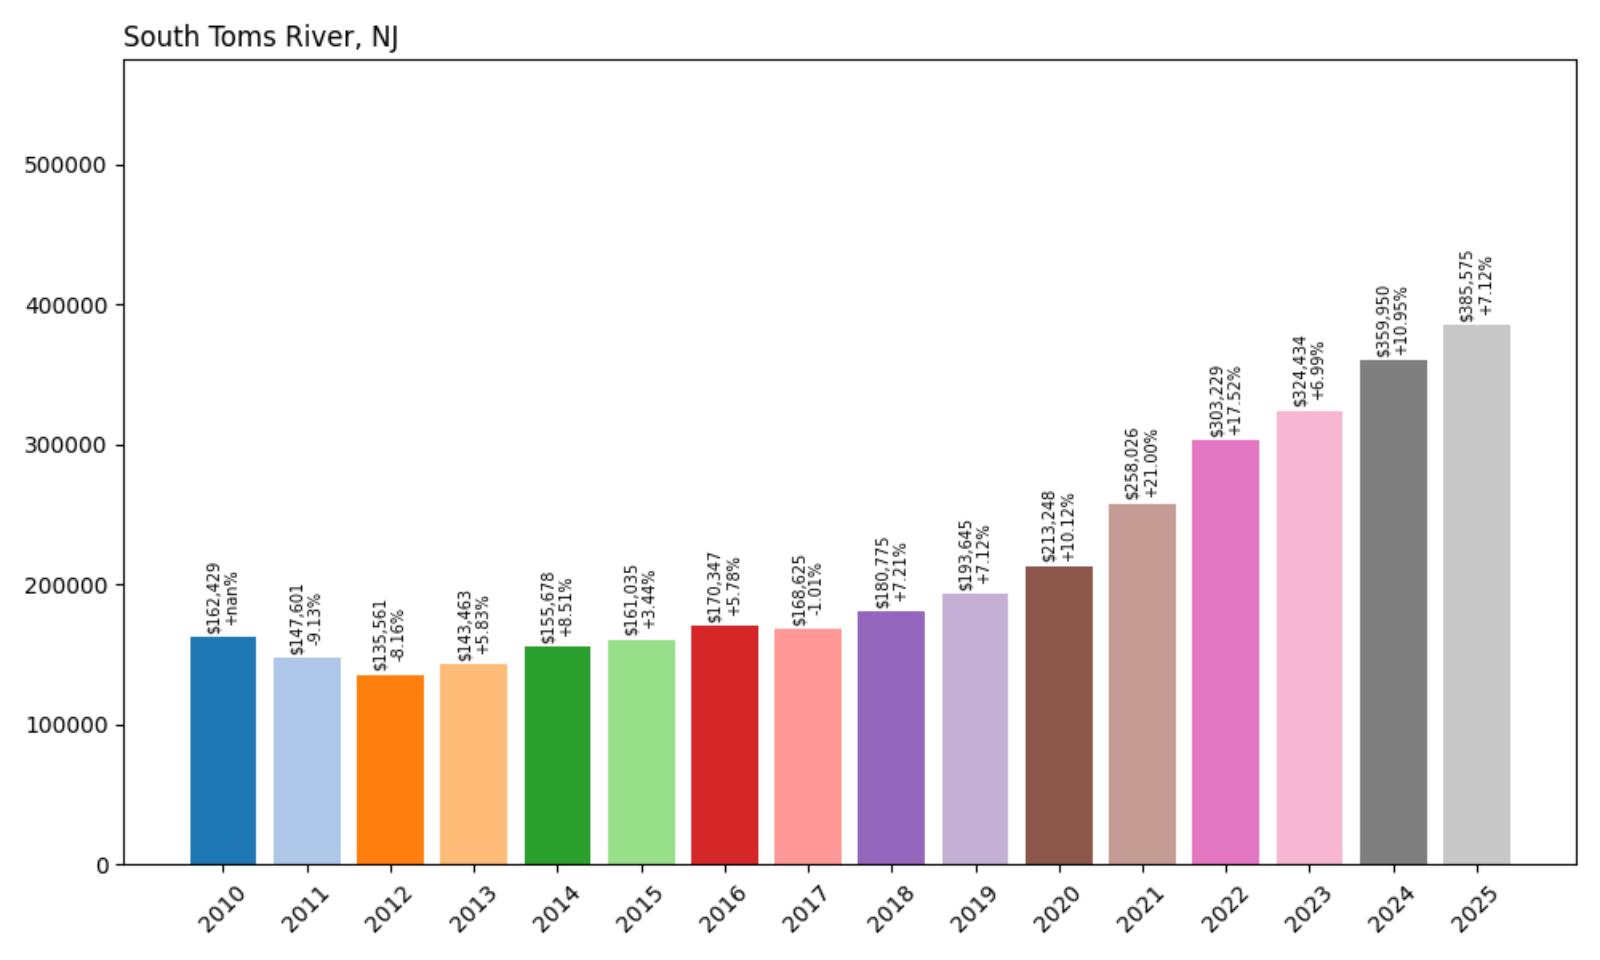
- Crash Risk Percentage: 83.85%
- Historical crashes (8%+ drops): 2
- Worst historical crash: -9.1% (2011)
- Total price increase since 2010: +137.4%
- Overextended above long-term average: +78.1%
- Price volatility (annual swings): 8.0%
- Current 2025 price: $385,575
South Toms River has experienced remarkable price appreciation, with values increasing 137.4% since 2010, pushing the Ocean County borough 78.1% above long-term averages. Despite two previous crashes, including a 9.1% decline in 2011, rapid appreciation has created new vulnerability. The community’s 8% volatility indicates ongoing market instability.
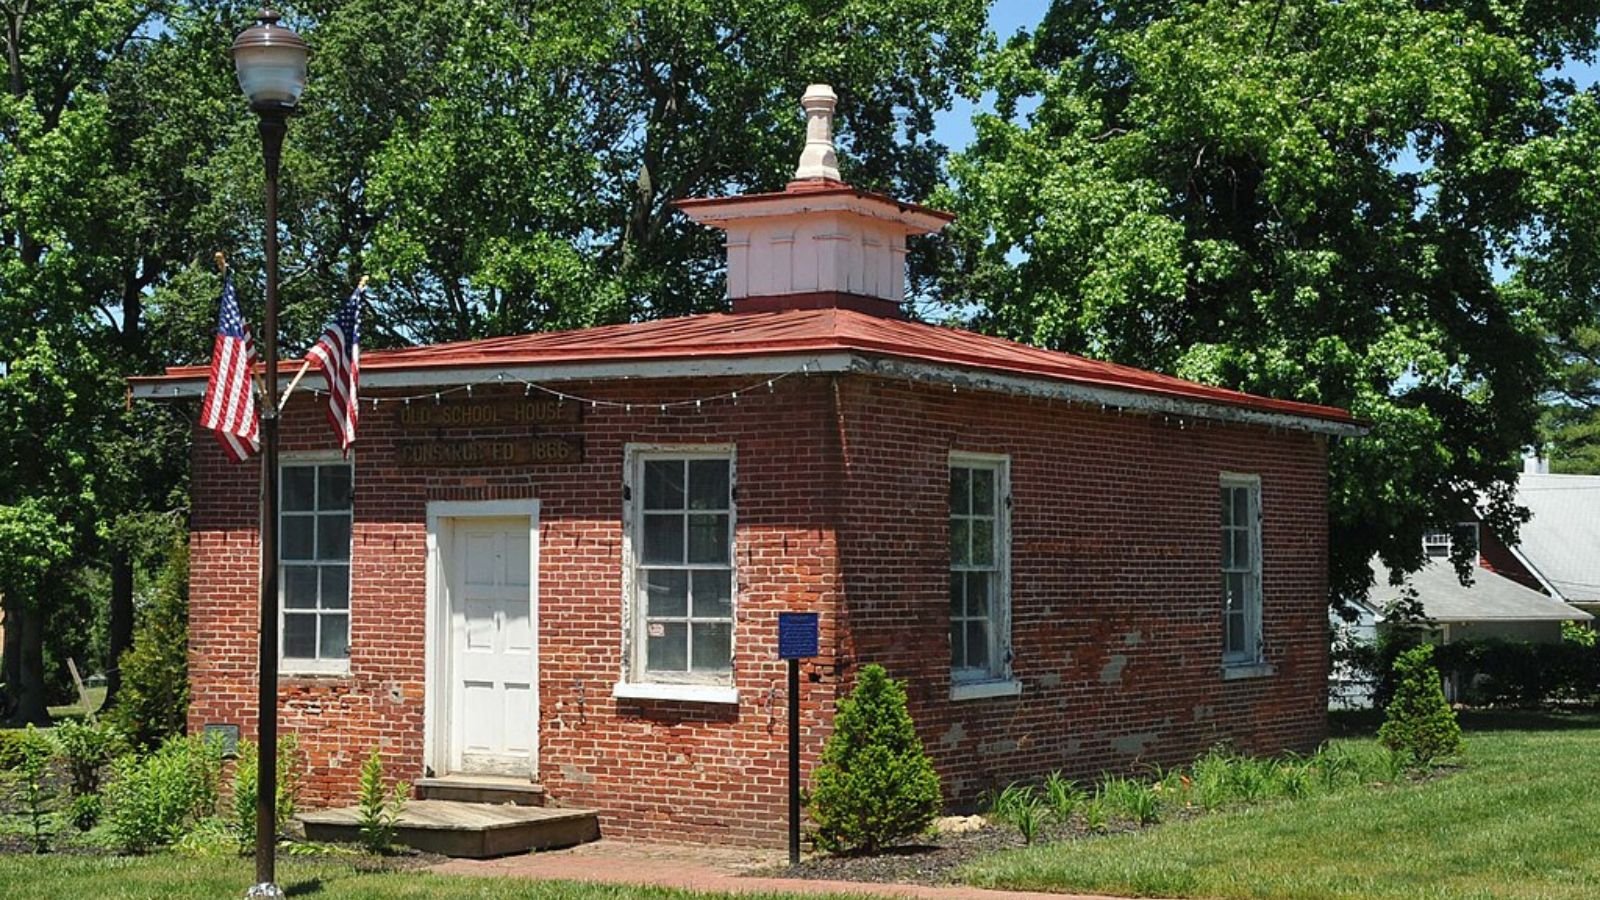
South Toms River – Shore Community Pricing Out Residents
South Toms River, a small Ocean County borough of approximately 3,700 residents, sits along the Toms River waterway about 10 miles inland from the Atlantic Ocean. The community has historically served as an affordable alternative to beachfront properties while still offering water access and proximity to shore recreational opportunities. Its location provides easy access to both the Jersey Shore and employment centers in central New Jersey, making it attractive to both retirees and working families.
However, the current median price of $385,575 reflects a 137.4% increase since 2010 that has fundamentally altered the community’s character and affordability. With values now 78.1% above historical trends, South Toms River has priced out many traditional residents and become vulnerable to market corrections. The borough’s small size and limited economic base make it particularly susceptible to rapid price swings, as evidenced by its history of crashes and current 8% annual volatility. If demand from outside buyers diminishes or if broader economic pressures affect the region, the community could face significant price corrections.
14. Newark – Crash Risk Percentage: 84.50%
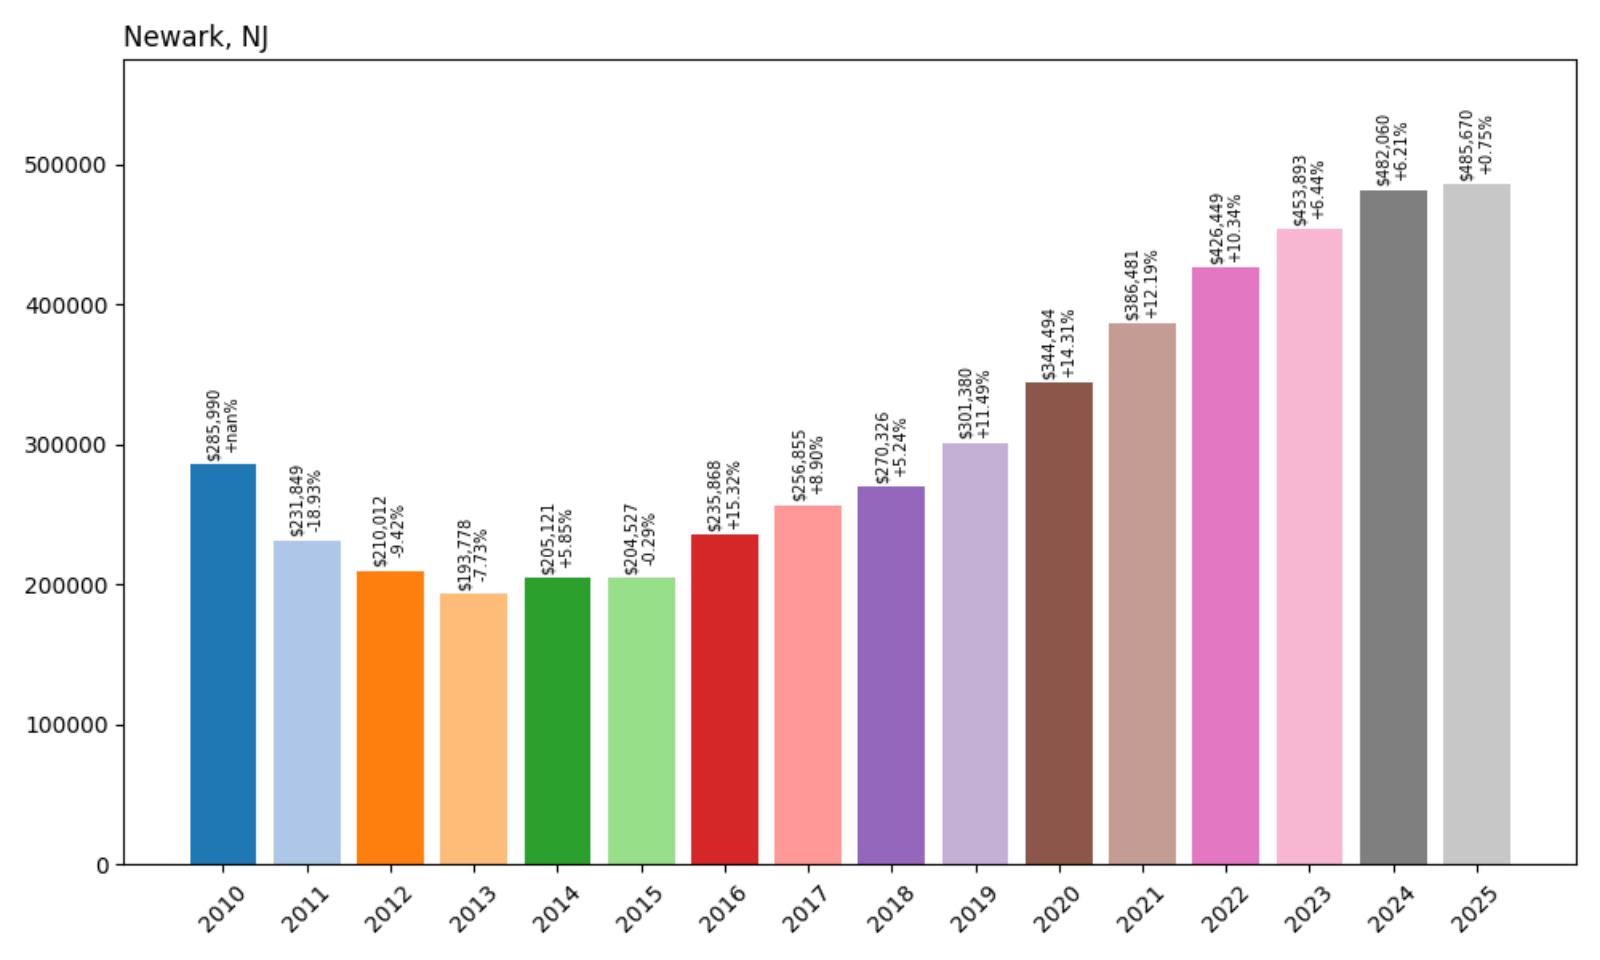
- Crash Risk Percentage: 84.50%
- Historical crashes (8%+ drops): 2
- Worst historical crash: -18.9% (2011)
- Total price increase since 2010: +69.8%
- Overextended above long-term average: +56.2%
- Price volatility (annual swings): 9.7%
- Current 2025 price: $485,670
Newark’s position as New Jersey’s largest city hasn’t insulated it from severe market volatility, including a catastrophic 18.9% crash in 2011. While price appreciation since 2010 has been more moderate at 69.8%, the current median of $485,670 still represents overextension of 56.2% above long-term norms. The city’s 9.7% volatility reflects ongoing market uncertainty.
Newark – Urban Revival Meets Market Reality

Newark, Essex County’s largest city with approximately 282,000 residents, has undergone significant transformation over the past decade through urban renewal efforts, infrastructure investments, and gentrification pressures. As New Jersey’s largest city and a major transportation hub with extensive rail and bus connections to New York City, Newark has attracted renewed interest from developers and residents seeking more affordable alternatives to Manhattan and Brooklyn. The city’s downtown revitalization, new residential developments, and cultural institutions have contributed to changing perceptions and increased demand.
Despite these positive developments, Newark’s housing market shows troubling vulnerability signs, with the current median price of $485,670 representing 56.2% overextension above sustainable levels. The city’s history of severe market crashes, including an 18.9% decline in 2011, demonstrates the market’s susceptibility to rapid corrections during economic downturns. Newark’s 9.7% annual volatility and dependence on commuter demand from New York City create additional risk factors. If economic conditions deteriorate or if work-from-home trends reduce commuter traffic, the city could face significant pressure on its overextended housing values.
13. Plainfield – Crash Risk Percentage: 88.55%
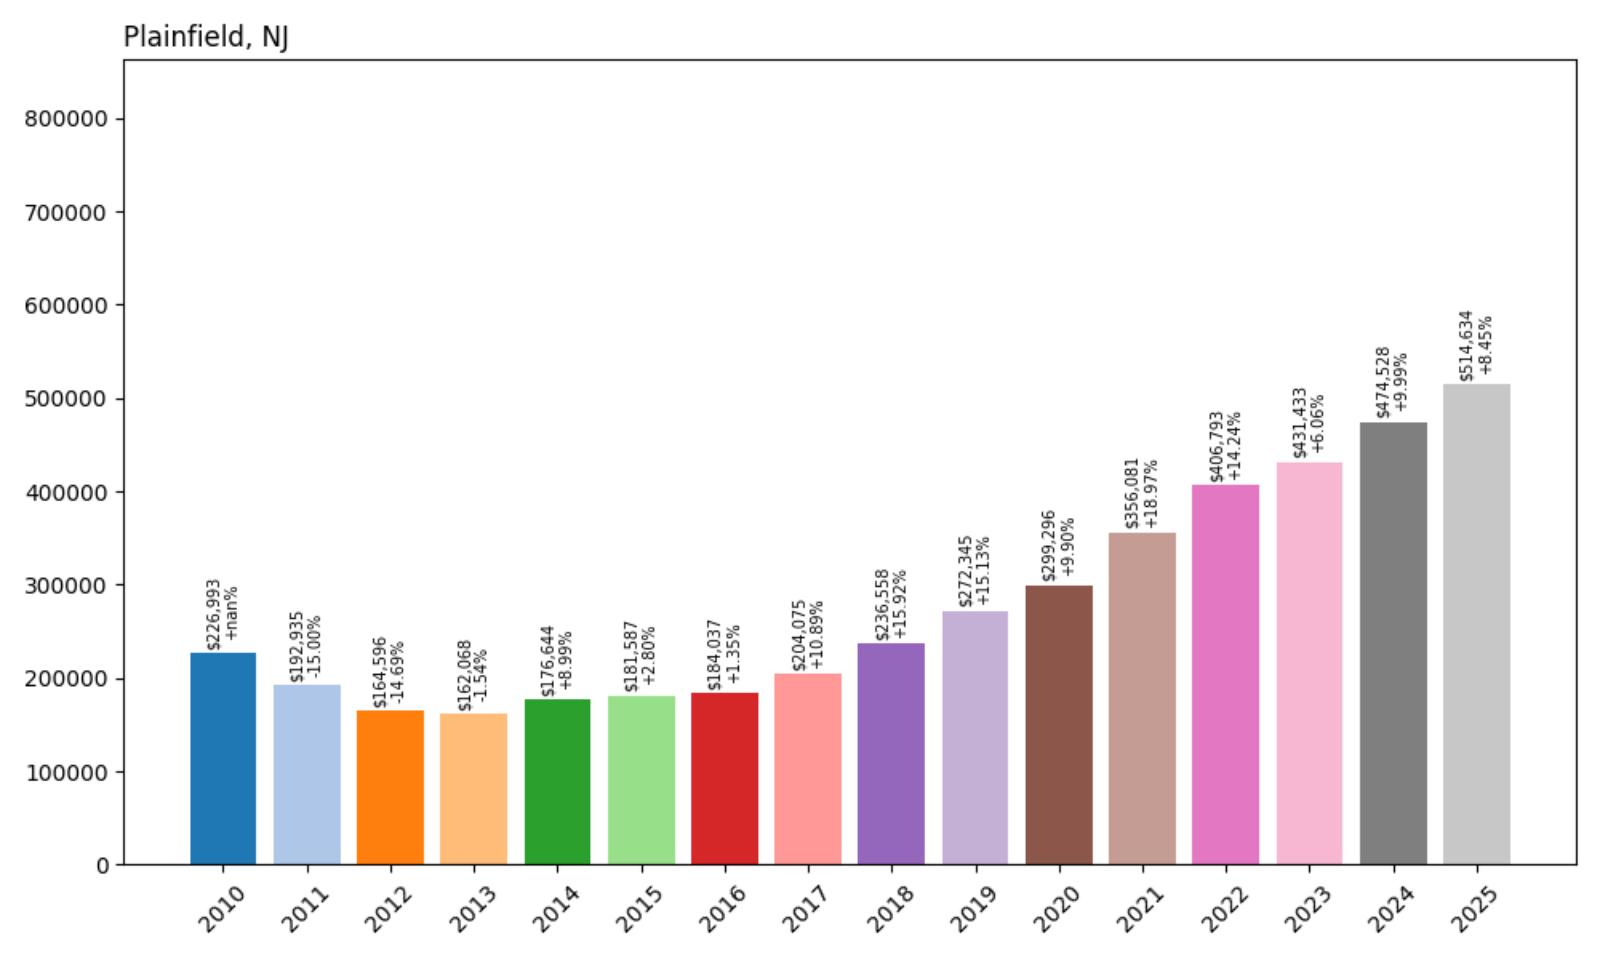
- Crash Risk Percentage: 88.55%
- Historical crashes (8%+ drops): 2
- Worst historical crash: -15.0% (2011)
- Total price increase since 2010: +126.7%
- Overextended above long-term average: +83.6%
- Price volatility (annual swings): 10.2%
- Current 2025 price: $514,634
Plainfield tops our list with the highest current median price at $514,634, representing a staggering 126.7% increase since 2010. The Union County city sits 83.6% above long-term averages, indicating extreme overvaluation. With two historical crashes and 10.2% annual volatility, Plainfield demonstrates significant instability despite its proximity to major employment centers.
Plainfield – High Prices, High Risk in Union County
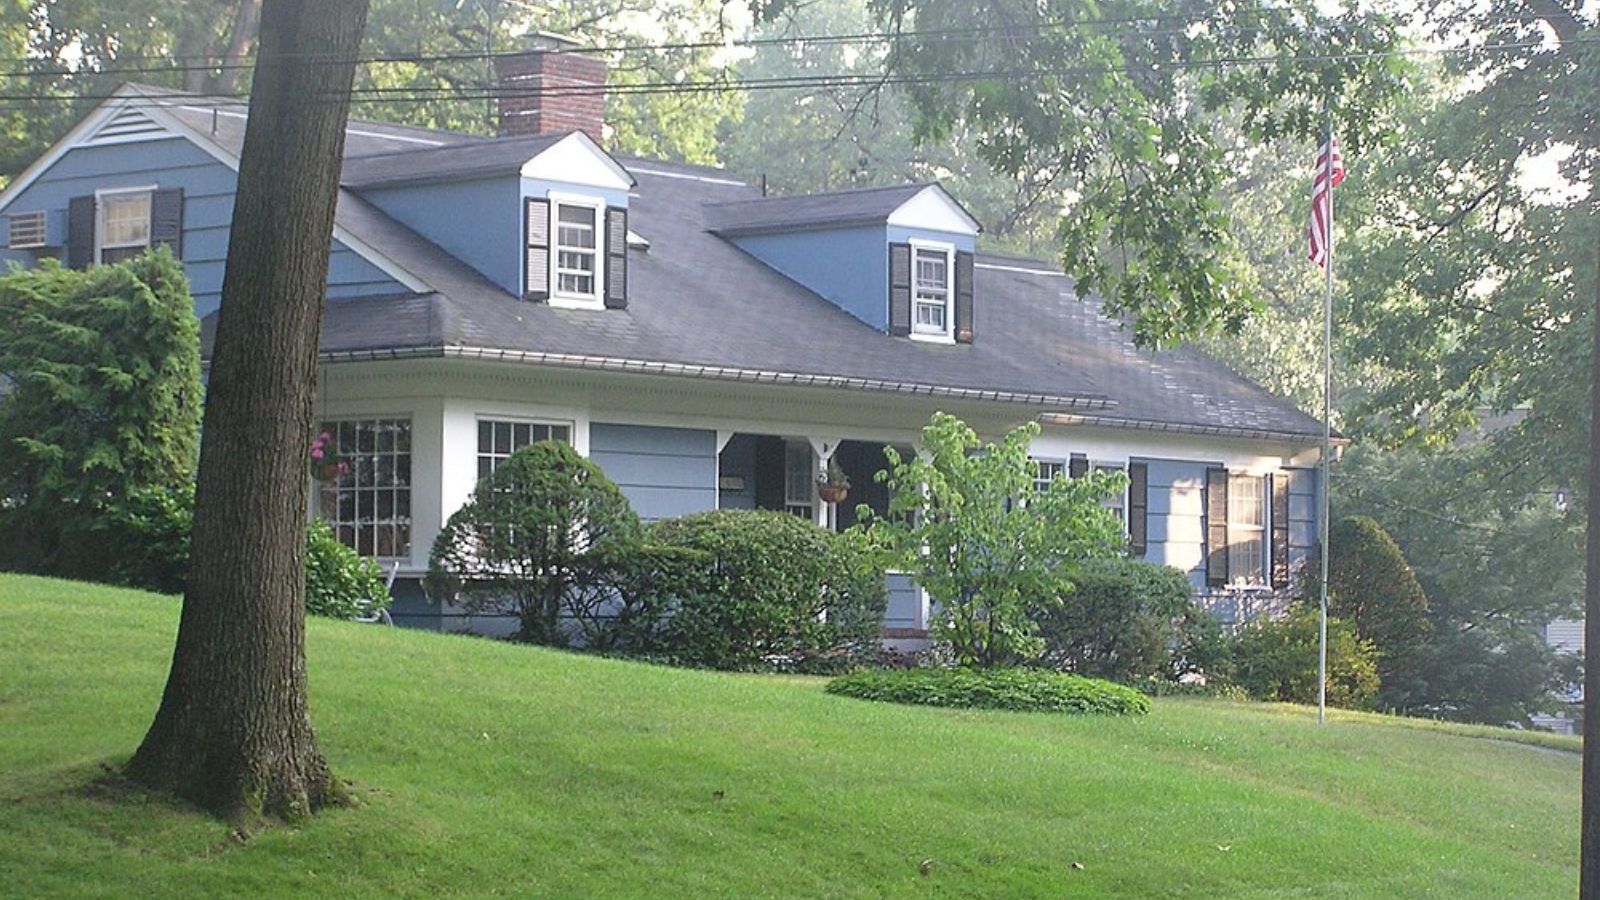
Plainfield, located in Union County approximately 30 miles southwest of Manhattan, has evolved from an industrial city into a commuter community serving the greater New York metropolitan area. The city of roughly 50,000 residents benefits from excellent transportation links, including NJ Transit rail service to New York Penn Station and proximity to major highways. Historic downtown revitalization efforts and the development of new residential projects have attracted buyers seeking alternatives to more expensive nearby communities.
However, the current median price of $514,634 represents the highest in our analysis and a 126.7% increase since 2010 that has pushed values 83.6% beyond sustainable levels. Plainfield’s crash history, including a 15% decline in 2011, combined with high volatility of 10.2%, suggests the market lacks fundamental stability. The city’s dependence on commuter demand and its competition with other communities offering similar access to New York create vulnerabilities that could trigger significant corrections if economic conditions change or if buyer preferences shift toward more affordable alternatives.
12. Orange – Crash Risk Percentage: 88.75%
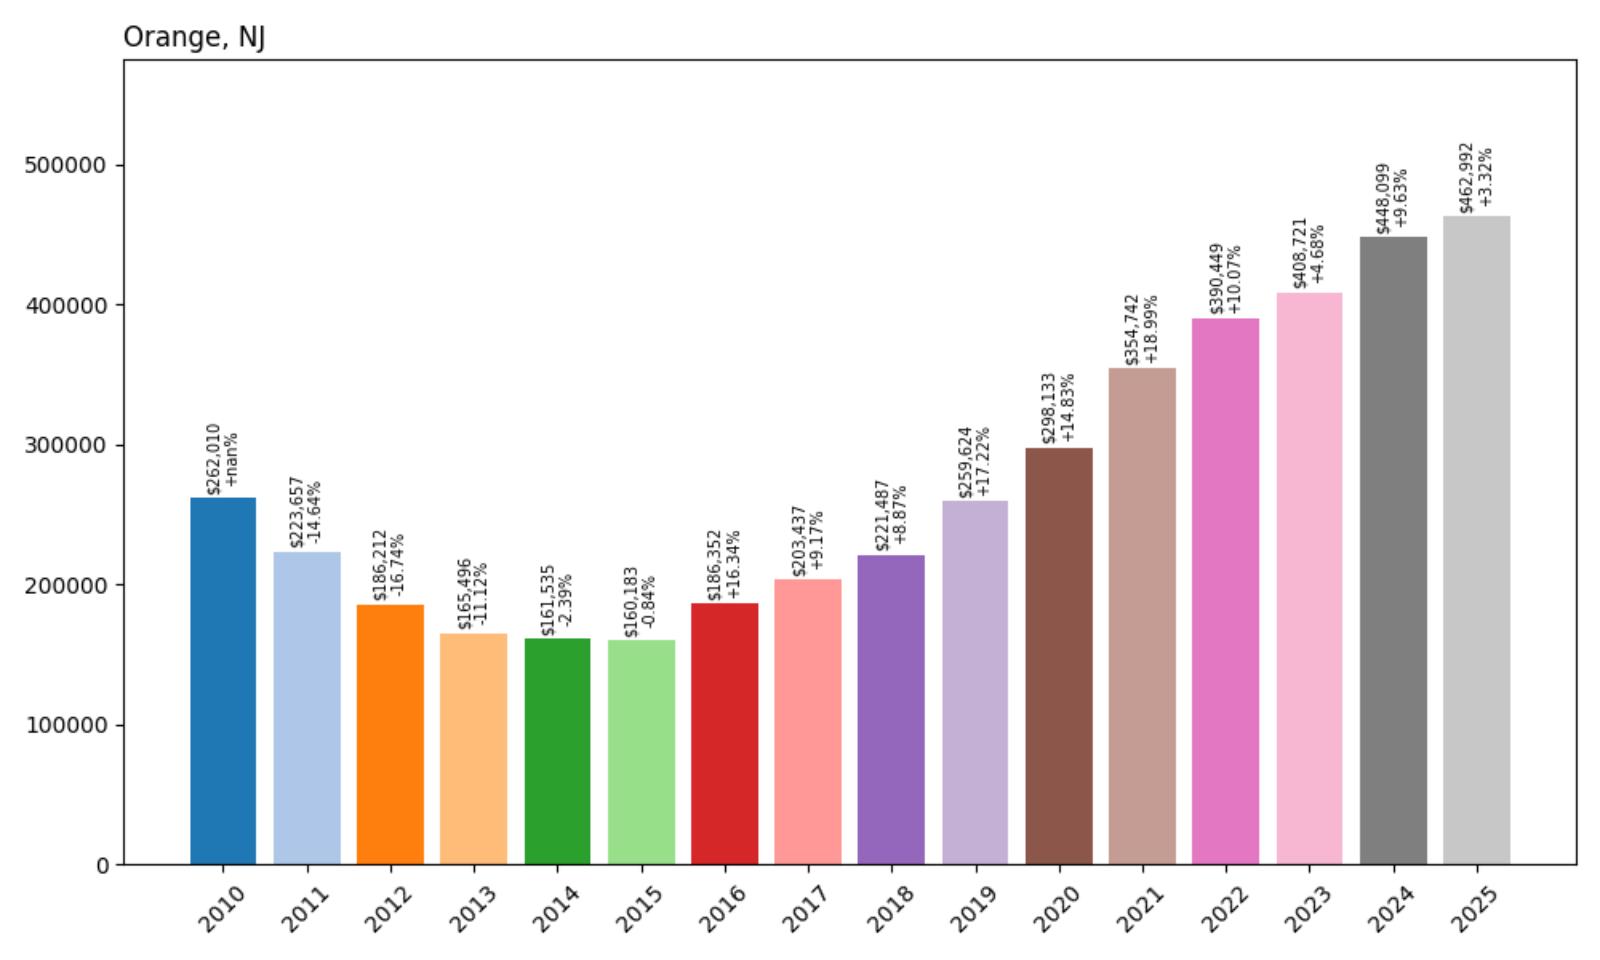
- Crash Risk Percentage: 88.75%
- Historical crashes (8%+ drops): 3
- Worst historical crash: -16.7% (2012)
- Total price increase since 2010: +76.7%
- Overextended above long-term average: +68.6%
- Price volatility (annual swings): 11.5%
- Current 2025 price: $462,992
Orange demonstrates the most crash-prone pattern in our analysis, with three historical price drops including a severe 16.7% decline in 2012. The Essex County city’s 11.5% annual volatility represents the highest instability among communities analyzed. Despite moderate appreciation since 2010, current prices remain 68.6% overextended, creating substantial downside risk.
Orange – Three-Time Crash Veteran Shows Warning Signs
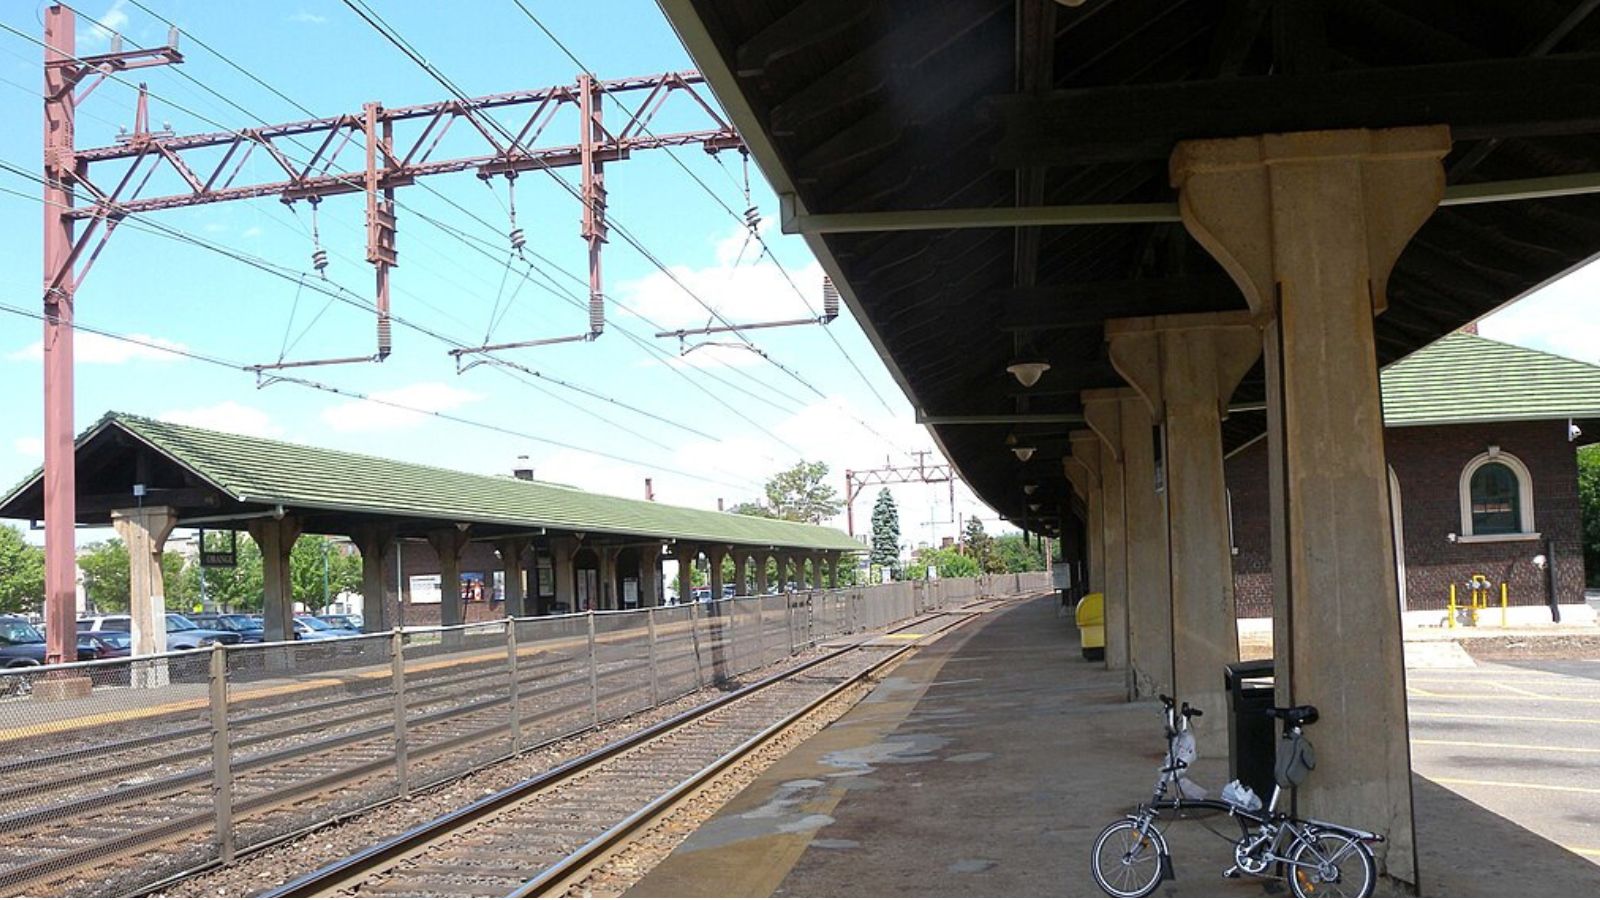
Orange, an Essex County city of approximately 30,000 residents, occupies a strategic location just west of Newark with direct access to major transportation arteries leading to New York City. The city has undergone periods of decline and renewal, with recent efforts focused on downtown revitalization and attracting new residents seeking affordable alternatives to more expensive nearby communities. Orange’s compact 2.2 square miles contain a mix of historic architecture, new developments, and ongoing redevelopment projects.
The city’s housing market history reveals extreme instability, with three separate crashes over the past 15 years, including a devastating 16.7% decline in 2012. Current median prices of $462,992, while representing a 76.7% increase since 2010, remain 68.6% above sustainable levels. Orange’s 11.5% annual volatility—the highest in our analysis—indicates a market prone to dramatic swings. The combination of crash history, high volatility, and current overextension suggests Orange faces particularly high risk of another significant price correction, especially if broader economic pressures affect the region.
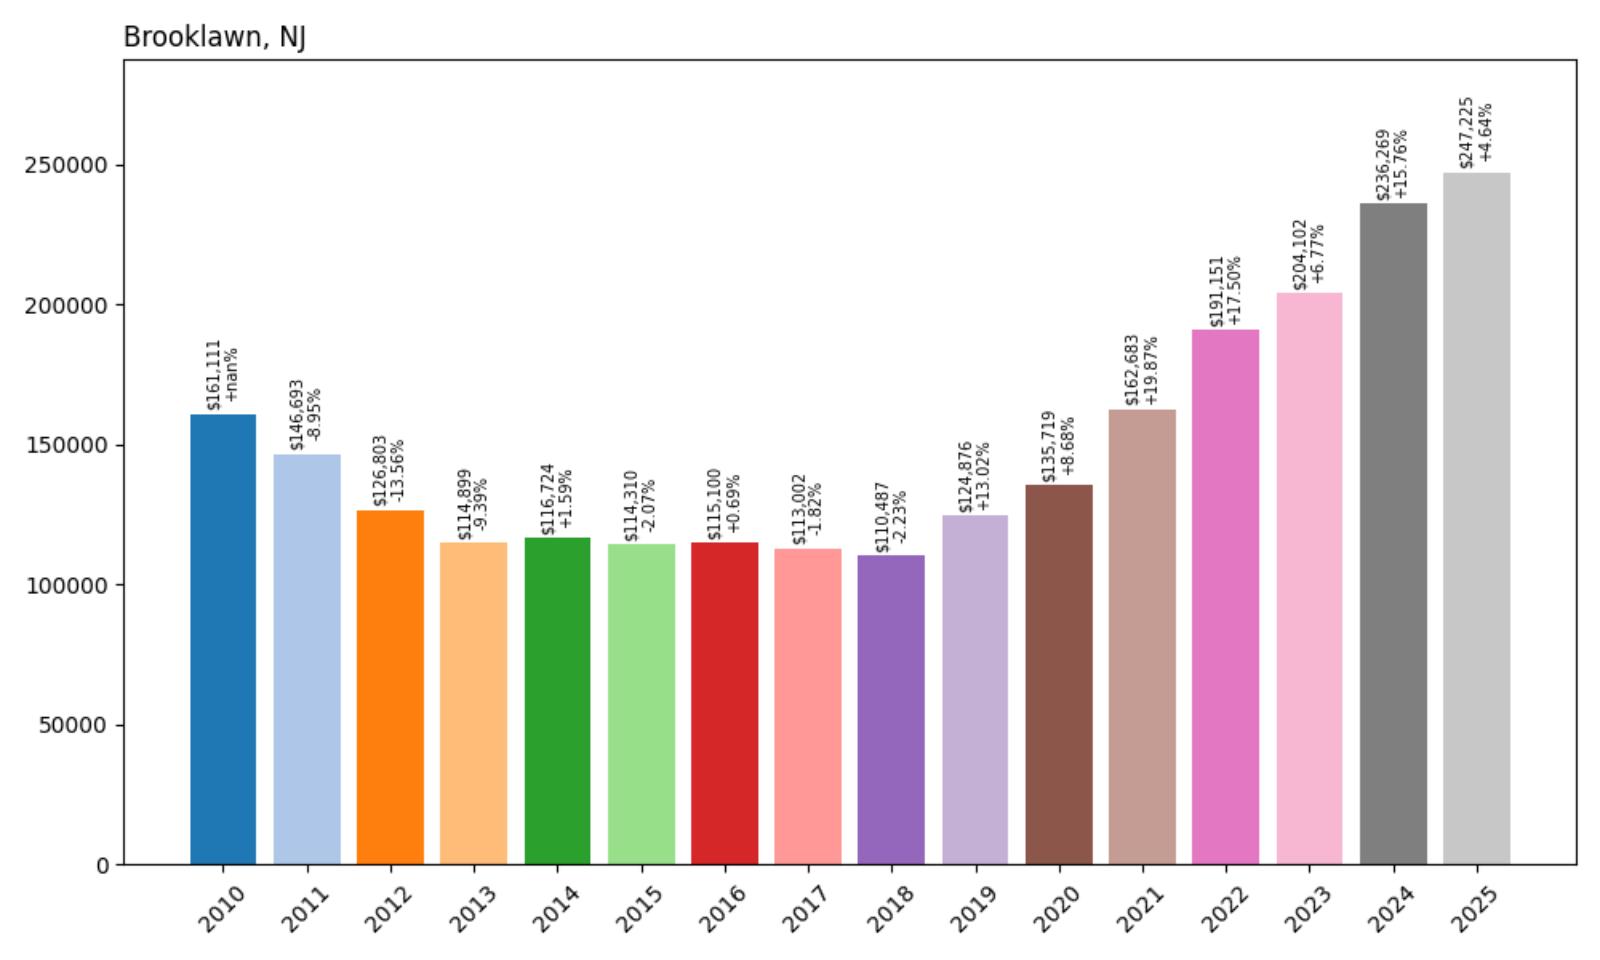
11. Brooklawn – Crash Risk Percentage: 88.85%
Would you like to save this?
- Crash Risk Percentage: 88.85%
- Historical crashes (8%+ drops): 3
- Worst historical crash: -13.6% (2012)
- Total price increase since 2010: +53.5%
- Overextended above long-term average: +63.4%
- Price volatility (annual swings): 10.2%
- Current 2025 price: $247,225
Brooklawn’s small size hasn’t protected it from major market volatility, with three historical crashes including a 13.6% decline in 2012. The Camden County borough’s current median of $247,225 represents the second-lowest in our analysis, yet still sits 63.4% above long-term trends. High volatility of 10.2% signals continued market instability despite relatively modest recent appreciation.
Brooklawn – Small Borough, Big Risks

Brooklawn, one of New Jersey’s smallest boroughs with just over 1,900 residents, sits along the Delaware River in Camden County directly across from Philadelphia. The borough’s 0.7 square miles contain primarily residential neighborhoods with easy access to Philadelphia via the Betsy Ross Bridge. Despite its small size, Brooklawn has attracted residents seeking affordable housing with urban access, benefiting from its proximity to Philadelphia’s job market and cultural amenities.
However, the borough’s tiny size has also made its housing market extremely volatile, with three separate crashes over the past 15 years demonstrating susceptibility to rapid price swings. The current median price of $247,225, while among the lowest in our analysis, still represents 63.4% overextension above historical norms despite modest 53.5% appreciation since 2010. Brooklawn’s 10.2% annual volatility and limited housing stock make it particularly vulnerable to market disruptions. If demand from Philadelphia commuters diminishes or if broader economic pressures affect the region, the borough’s small market could experience dramatic price corrections.
10. Trenton – Crash Risk Percentage: 89.45%
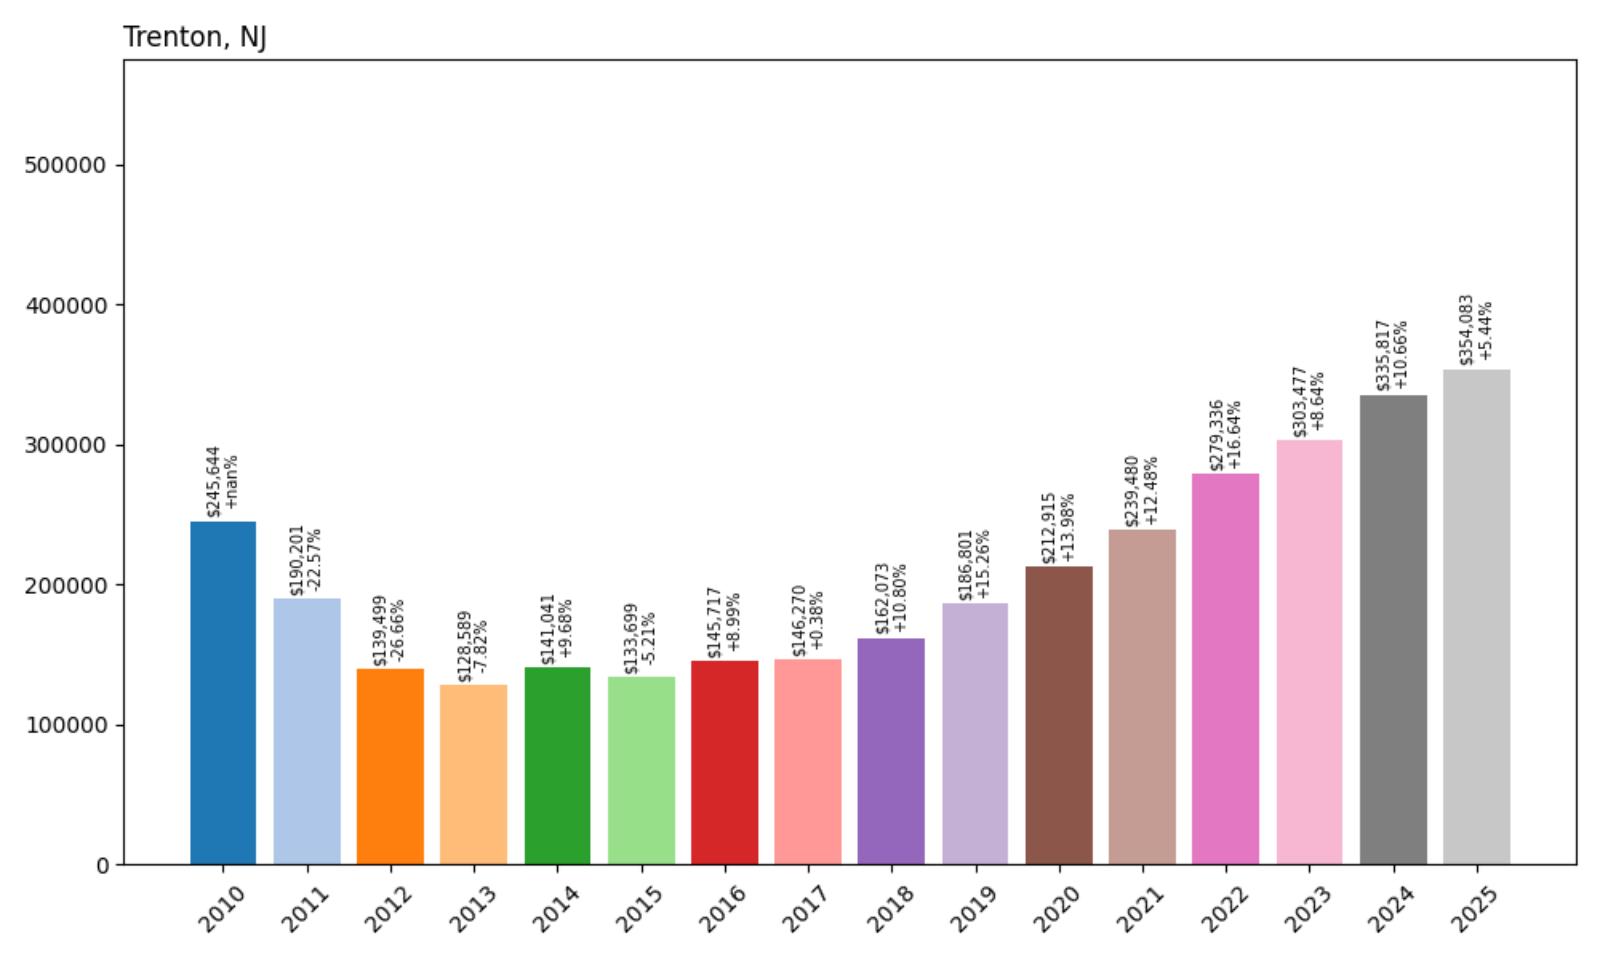
- Crash Risk Percentage: 89.45%
- Historical crashes (8%+ drops): 2
- Worst historical crash: -26.7% (2012)
- Total price increase since 2010: +44.1%
- Overextended above long-term average: +69.4%
- Price volatility (annual swings): 13.4%
- Current 2025 price: $354,083
New Jersey’s capital city experienced the most severe historical crash in our analysis, with home values plummeting 26.7% in 2012. While subsequent appreciation has been moderate at 44.1% since 2010, current prices remain dangerously overextended at 69.4% above long-term averages. Trenton’s 13.4% volatility represents extreme market instability that could trigger another major correction.
Trenton – Capital City’s Volatile Housing Market
Trenton, New Jersey’s capital city with approximately 84,000 residents, serves as the seat of state government and a regional center for Mercer County. Located along the Delaware River between New York and Philadelphia, Trenton benefits from its central location and government employment base. The city has undergone various revitalization efforts, including downtown development projects and initiatives to attract new residents and businesses to the historic capital.
Despite its status as the state capital, Trenton’s housing market shows extreme vulnerability, highlighted by the devastating 26.7% crash in 2012—the worst in our entire analysis. The current median price of $354,083 reflects moderate 44.1% appreciation since 2010, but values remain 69.4% above sustainable levels. Trenton’s extraordinary 13.4% annual volatility indicates a fundamentally unstable market susceptible to dramatic price swings. The combination of severe crash history, extreme volatility, and current overextension suggests Trenton faces particularly high risk of another major correction, especially if state budget pressures affect government employment or if broader regional economic conditions deteriorate.
9. Keansburg – Crash Risk Percentage: 90.25%
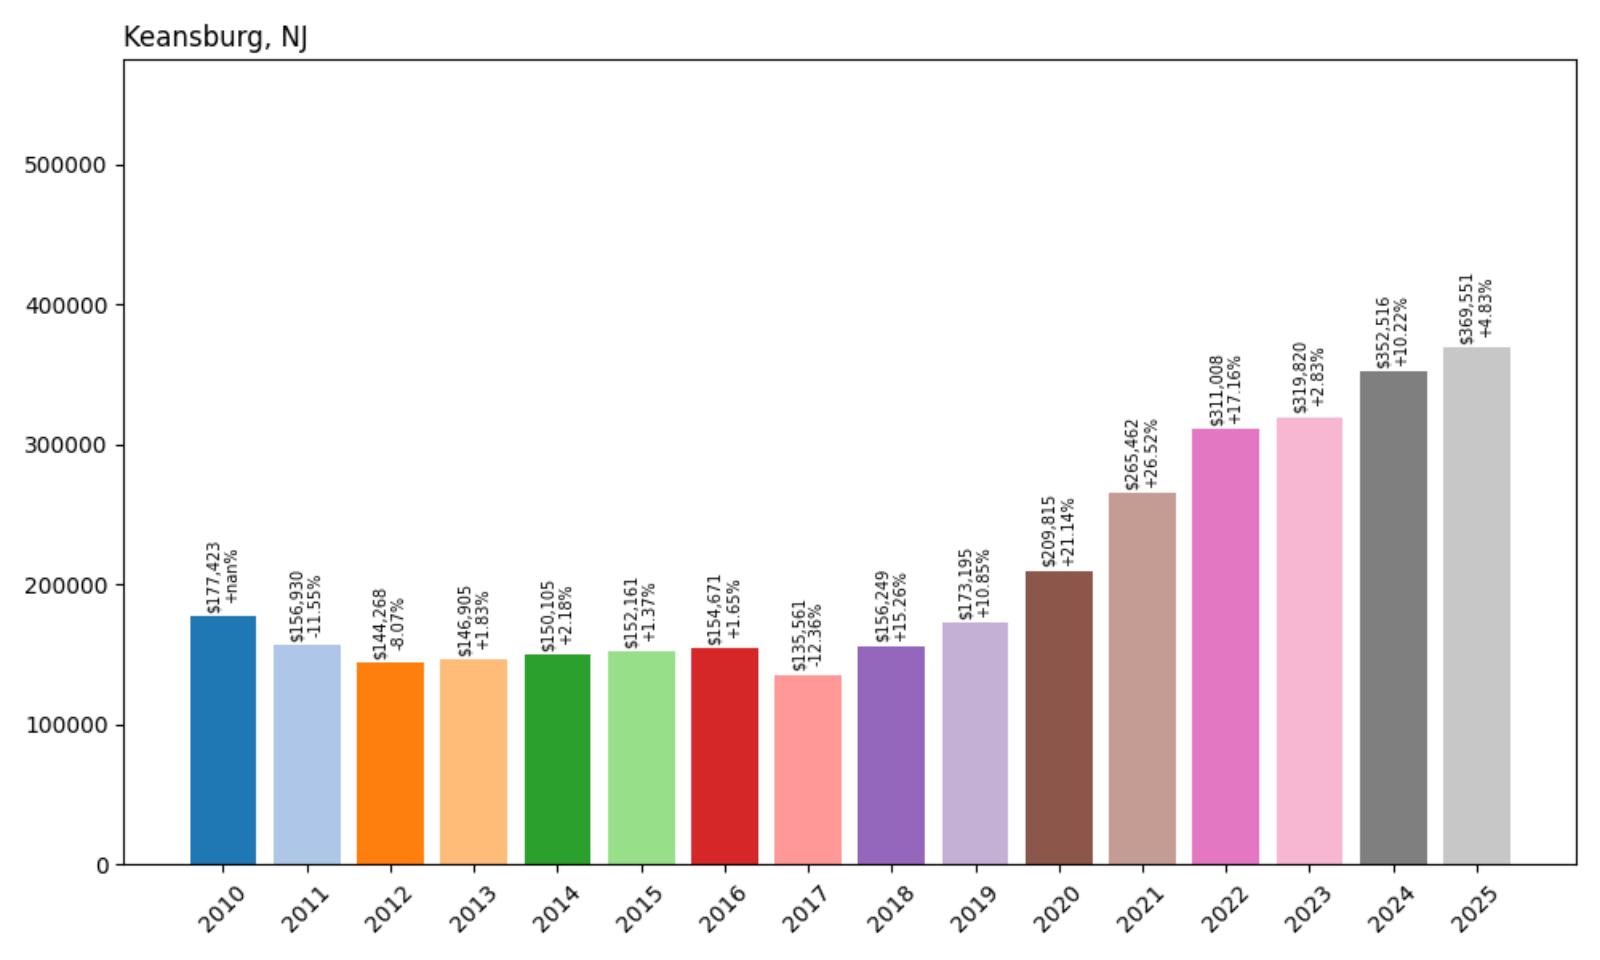
- Crash Risk Percentage: 90.25%
- Historical crashes (8%+ drops): 3
- Worst historical crash: -12.4% (2017)
- Total price increase since 2010: +108.3%
- Overextended above long-term average: +75.2%
- Price volatility (annual swings): 11.4%
- Current 2025 price: $369,551
Keansburg’s bayfront location has driven dramatic price appreciation of 108.3% since 2010, but the Monmouth County borough shows concerning instability with three historical crashes, including a recent 12.4% decline in 2017. Current values sit 75.2% above long-term averages, while 11.4% volatility signals continued market uncertainty in this coastal community.
Keansburg – Bayfront Community’s Bubble Concerns

Keansburg, located on the Raritan Bay in Monmouth County, has evolved from a working-class summer resort community into a year-round residential area attracting buyers seeking affordable waterfront access. The borough of approximately 10,000 residents offers bay beaches, fishing opportunities, and proximity to both New York City employment centers and Jersey Shore recreation. Recent development projects and infrastructure improvements have contributed to increased interest in the community.
However, Keansburg’s housing market exhibits extreme volatility, with three separate crashes over the past 15 years, including a recent 12.4% decline in 2017 that demonstrates ongoing market instability. The current median price of $369,551 represents a dramatic 108.3% increase since 2010, pushing values 75.2% above sustainable levels. The borough’s 11.4% annual volatility and dependence on seasonal tourism and commuter demand create significant vulnerabilities. If economic conditions deteriorate or if buyer preferences shift away from smaller waterfront communities, Keansburg could face another significant price correction given its history of market instability and current overextension.
8. Atlantic City – Crash Risk Percentage: 90.55%
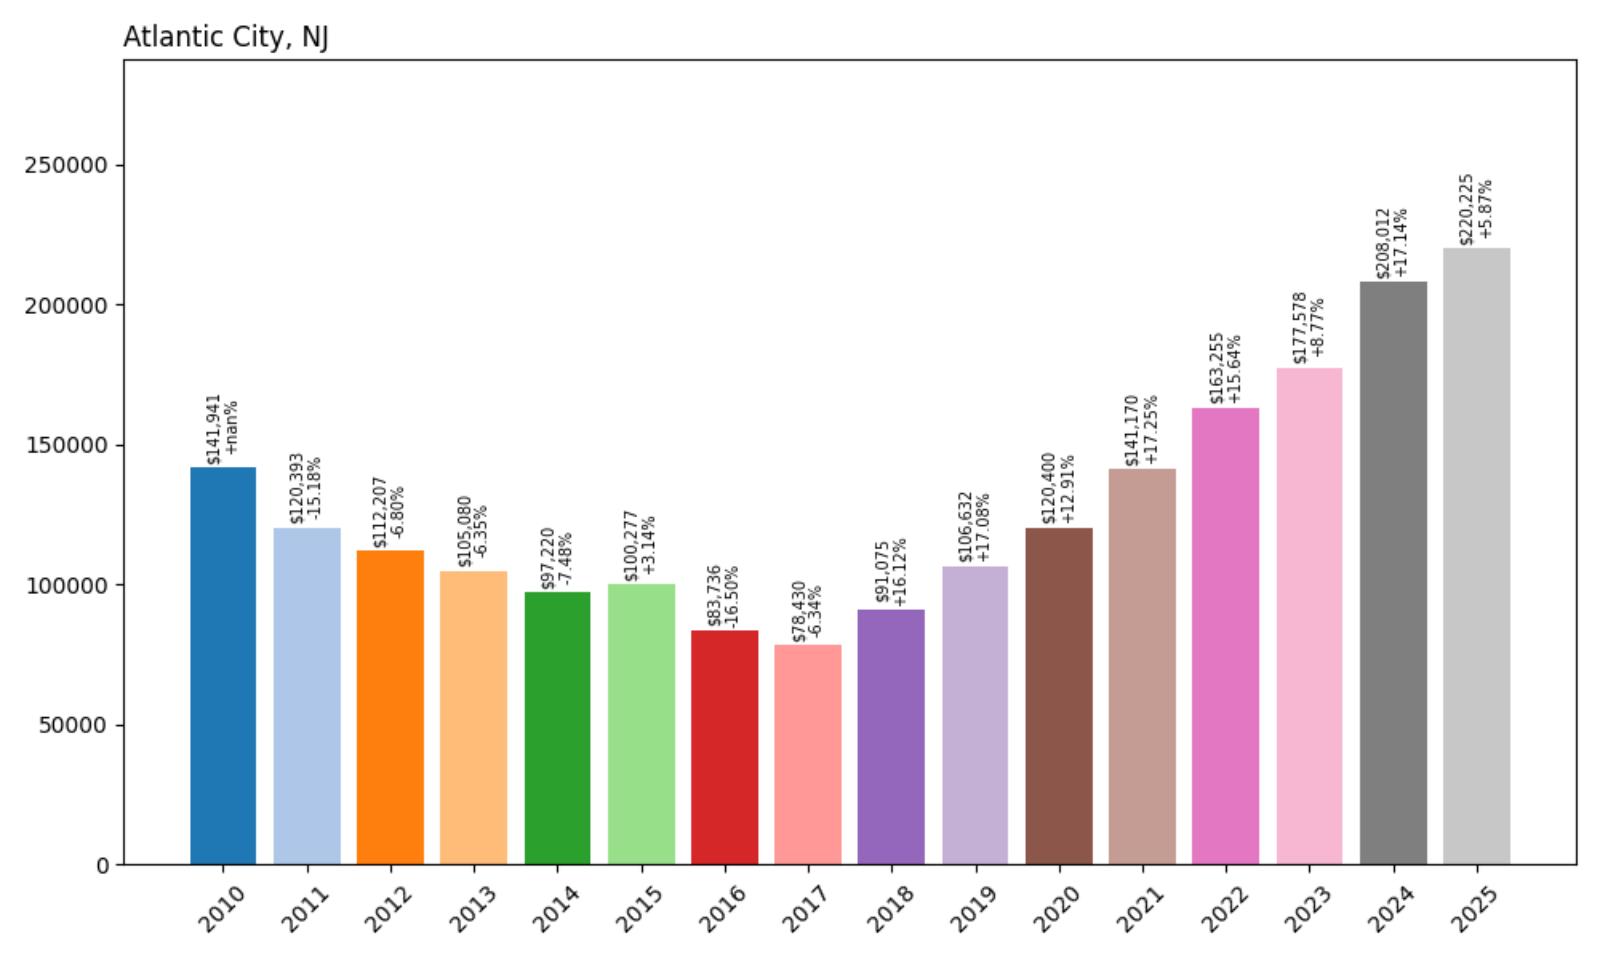
- Crash Risk Percentage: 90.55%
- Historical crashes (8%+ drops): 2
- Worst historical crash: -16.5% (2016)
- Total price increase since 2010: +55.2%
- Overextended above long-term average: +70.4%
- Price volatility (annual swings): 12.4%
- Current 2025 price: $220,225
Atlantic City’s tourism-dependent economy creates inherent housing market instability, evidenced by two major crashes including a 16.5% decline in 2016. Despite having the lowest median price in our analysis at $220,225, values still sit 70.4% above long-term trends. The resort city’s 12.4% volatility reflects the boom-and-bust nature of its casino and tourism economy.
Atlantic City – Resort Economy Drives Housing Volatility

Atlantic City, the famous seaside resort and gambling destination with approximately 37,000 residents, has experienced dramatic economic cycles tied to the rise and decline of its casino industry. According to recent reports, New Jersey is among three states expected to see housing market trouble, with Atlantic County specifically identified as particularly vulnerable due to unemployment and economic challenges. The city’s economy depends heavily on tourism, gaming, and seasonal employment, creating inherent instability that affects housing demand and prices.
The current median price of $220,225—the lowest in our analysis—might seem affordable, but represents 70.4% overextension above historical norms despite moderate 55.2% appreciation since 2010. Atlantic City’s recent 16.5% crash in 2016 demonstrates the market’s vulnerability to economic downturns and industry-specific pressures. With 12.4% annual volatility and an economy dependent on discretionary spending, the resort city faces continued risks from changing tourism patterns, competition from other gaming destinations, and broader economic pressures. If tourism declines or if casino industry consolidation continues, Atlantic City’s already vulnerable housing market could experience another significant correction.
7. Gloucester City – Crash Risk Percentage: 91.55%
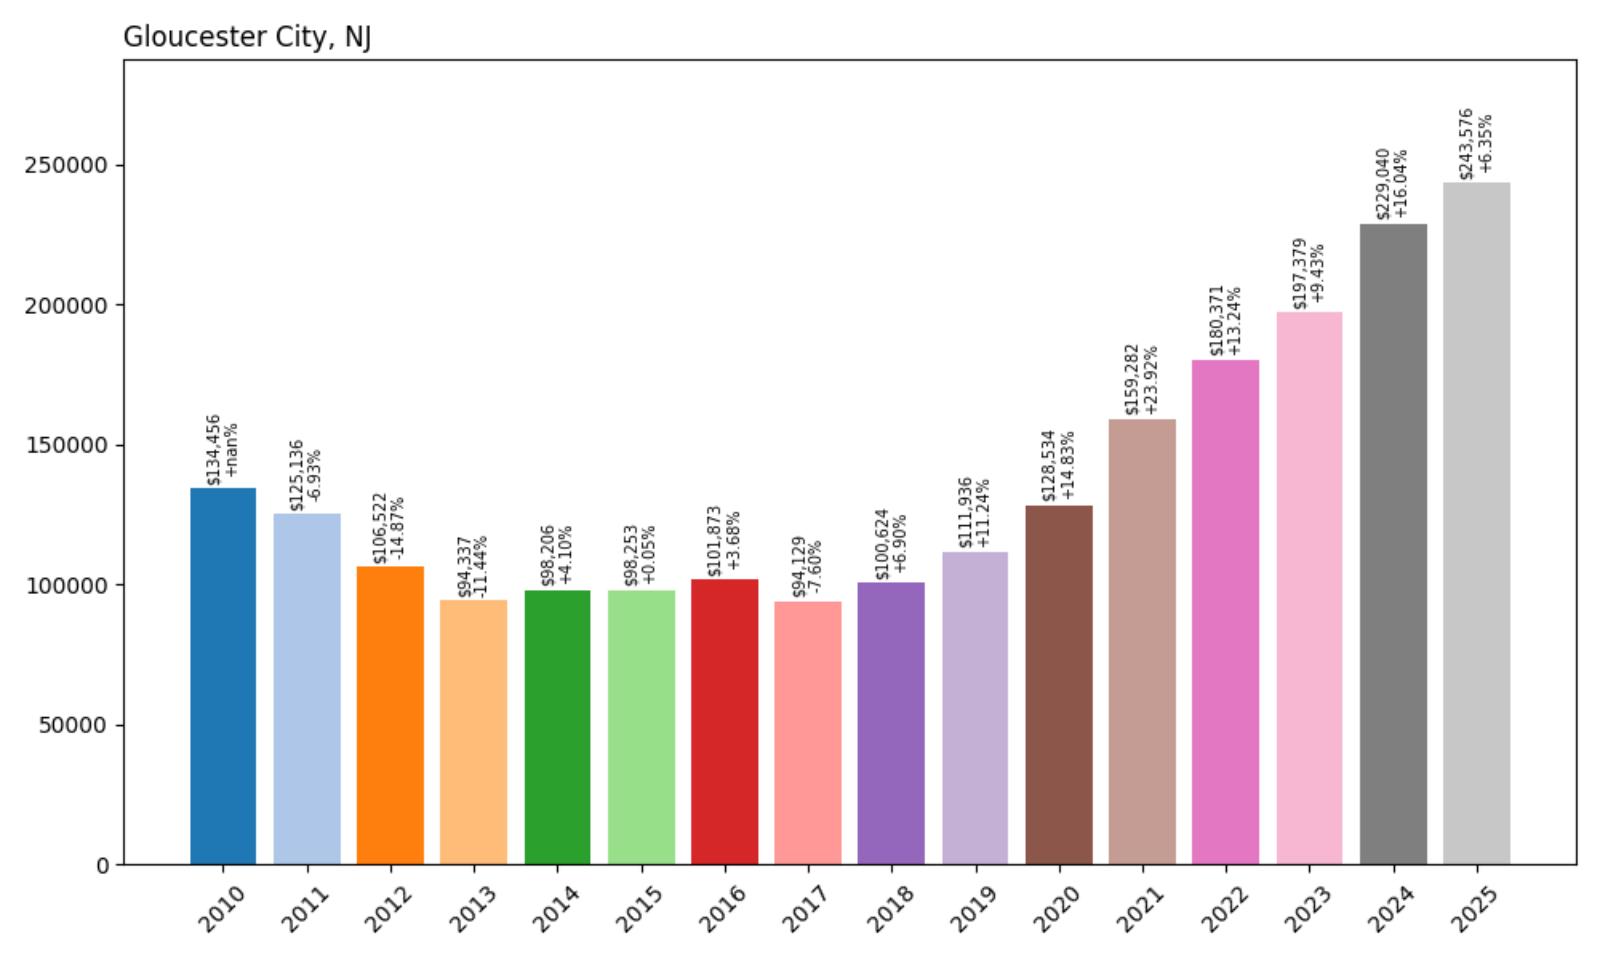
- Crash Risk Percentage: 91.55%
- Historical crashes (8%+ drops): 2
- Worst historical crash: -14.9% (2012)
- Total price increase since 2010: +81.2%
- Overextended above long-term average: +76.9%
- Price volatility (annual swings): 11.0%
- Current 2025 price: $243,576
Gloucester City’s position along the Delaware River across from Philadelphia has driven substantial price appreciation of 81.2% since 2010, but current values now sit 76.9% above sustainable levels. The Camden County city has experienced two major crashes, including a severe 14.9% decline in 2012. High volatility of 11% indicates continued market instability despite the community’s geographic advantages.
Gloucester City – River Town’s Risky Rebound
Gloucester City, located along the Delaware River in Camden County with approximately 11,000 residents, benefits from its proximity to Philadelphia and historic waterfront character. The city has worked to revitalize its downtown area and waterfront, attracting residents seeking affordable alternatives to Philadelphia with maintained urban access. Its location provides easy commuting options to Philadelphia’s Center City via the Betsy Ross Bridge and public transportation connections.
However, the current median price of $243,576 represents an 81.2% increase since 2010 that has pushed values 76.9% above historical norms, creating significant vulnerability. Gloucester City’s crash history, including a devastating 14.9% decline in 2012, demonstrates the market’s susceptibility to rapid corrections during economic downturns. The city’s 11% annual volatility and dependence on commuter demand from Philadelphia create additional risk factors. If economic conditions deteriorate or if work-from-home trends reduce commuter traffic, Gloucester City could face substantial pressure on its overextended housing values.
6. Roselle – Crash Risk Percentage: 92.10%
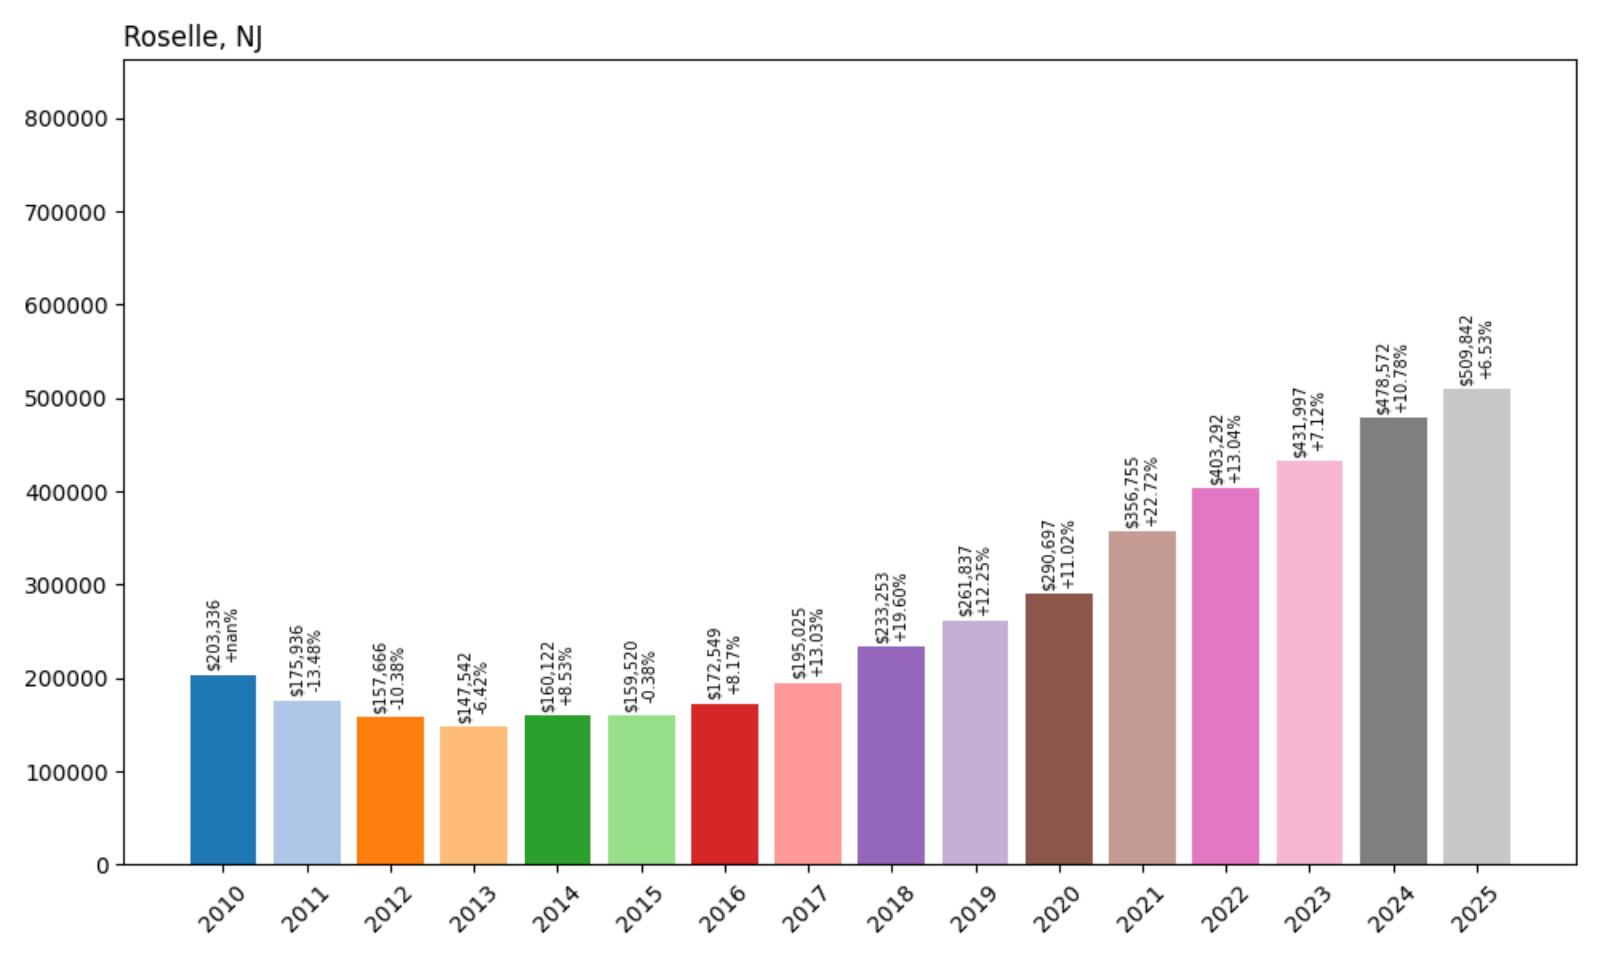
- Crash Risk Percentage: 92.10%
- Historical crashes (8%+ drops): 2
- Worst historical crash: -13.5% (2011)
- Total price increase since 2010: +150.7%
- Overextended above long-term average: +88.0%
- Price volatility (annual swings): 10.3%
- Current 2025 price: $509,842
Roselle presents extreme overvaluation with prices soaring 150.7% since 2010, pushing the Union County borough 88% above long-term averages. The current median of $509,842 represents dramatic appreciation that may be unsustainable. Despite two historical crashes and 10.3% volatility, rapid price gains have created new vulnerability in this transportation-accessible community.
Roselle – Commuter Premium Creates Crash Risk
Roselle, a Union County borough of approximately 21,000 residents, has benefited significantly from its excellent transportation links to New York City, including NJ Transit rail service and proximity to major highways. Located about 20 miles southwest of Manhattan, the borough has attracted buyers seeking more affordable alternatives to expensive nearby communities while maintaining easy access to metropolitan employment centers. Recent development and infrastructure improvements have contributed to increased demand and rapid price appreciation.
The current median price of $509,842 reflects a staggering 150.7% increase since 2010 that has pushed values 88% beyond sustainable levels—among the highest overextension rates in our analysis. Roselle’s history of market crashes, including a 13.5% decline in 2011, combined with 10.3% annual volatility, suggests the market lacks fundamental stability. The borough’s heavy dependence on commuter demand and competition with other transit-accessible communities create vulnerabilities that could trigger significant corrections if economic conditions change or if transportation patterns shift due to remote work trends.
5. Paulsboro – Crash Risk Percentage: 92.20%
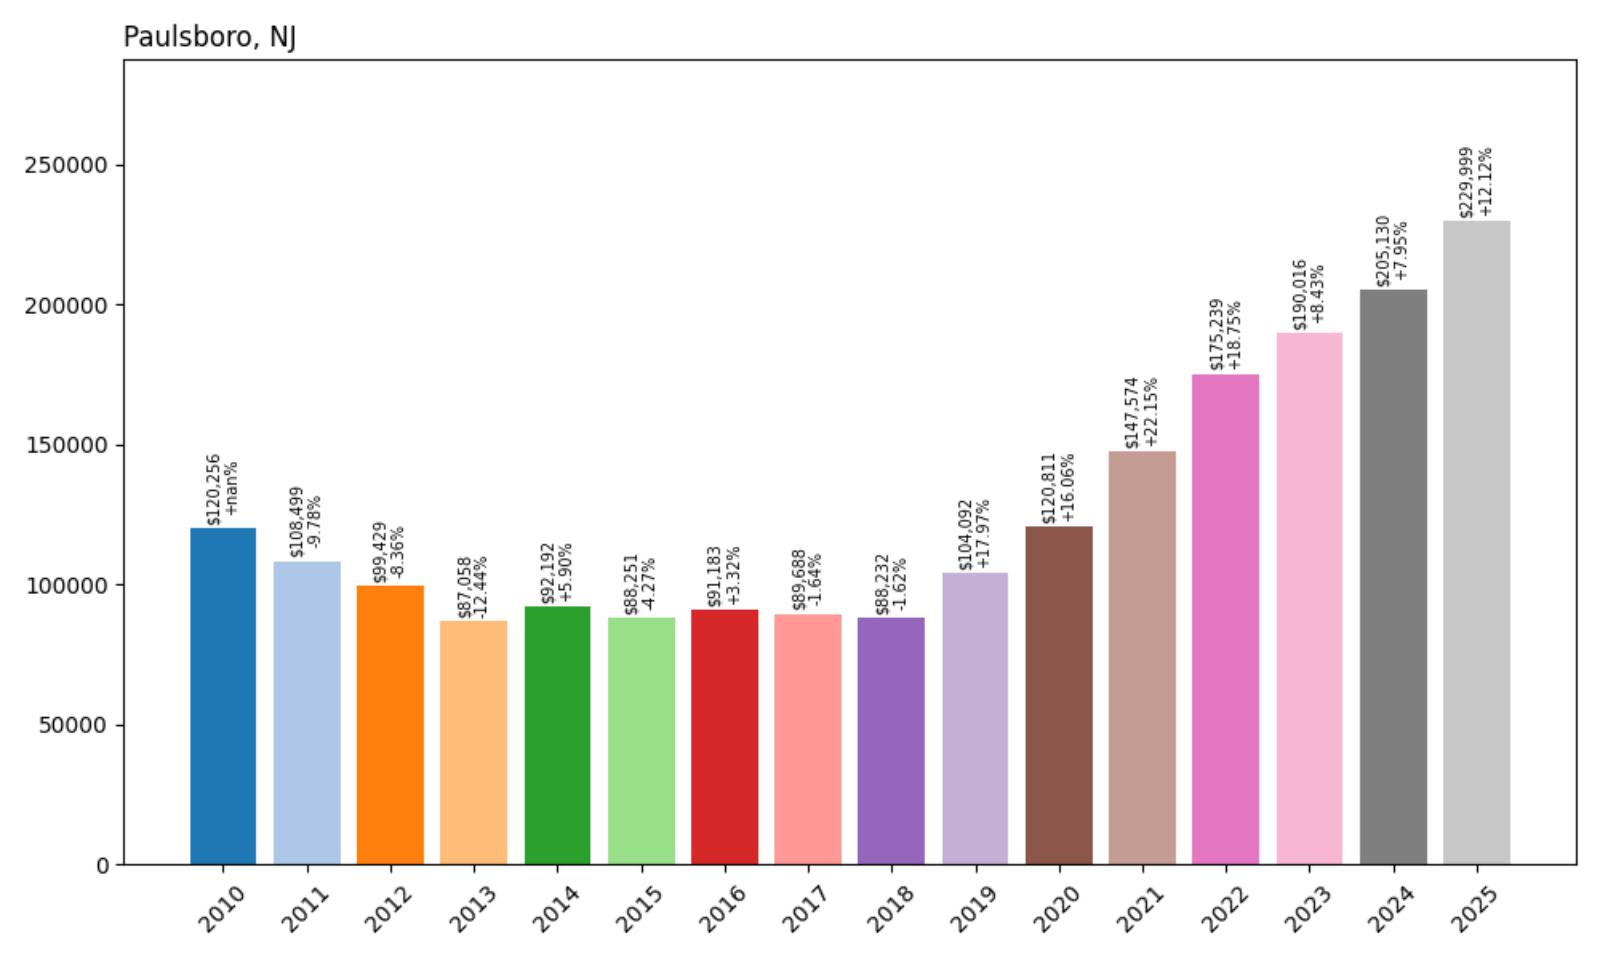
- Crash Risk Percentage: 92.20%
- Historical crashes (8%+ drops): 3
- Worst historical crash: -12.4% (2013)
- Total price increase since 2010: +91.3%
- Overextended above long-term average: +80.6%
- Price volatility (annual swings): 11.1%
- Current 2025 price: $229,999
Paulsboro’s industrial heritage hasn’t protected it from severe market volatility, with three separate crashes over 15 years including a 12.4% decline in 2013. The Gloucester County borough has seen prices nearly double since 2010, reaching levels 80.6% above historical trends. High volatility of 11.1% signals continued instability in this Delaware River community.
Paulsboro – Industrial Town’s Housing Instability

Paulsboro, located along the Delaware River in Gloucester County with approximately 6,000 residents, has historically served as an industrial center with major petrochemical and refining operations. The borough’s economy has traditionally depended on industrial employment, but recent economic diversification efforts and its proximity to Philadelphia have attracted new residents seeking affordable housing with urban access. Infrastructure improvements and waterfront development projects have contributed to renewed interest in the community.
However, Paulsboro’s housing market exhibits extreme instability, with three separate crashes over the past 15 years demonstrating susceptibility to both industrial economic cycles and broader market pressures. The current median price of $229,999 represents a dramatic 91.3% increase since 2010, pushing values 80.6% above sustainable levels. The borough’s 11.1% annual volatility and dependence on both industrial employment and commuter demand create significant vulnerabilities. If industrial operations decline or if broader economic pressures affect the region, Paulsboro could face another significant price correction given its history of market instability and current overextension.
4. Irvington – Crash Risk Percentage: 95.00%
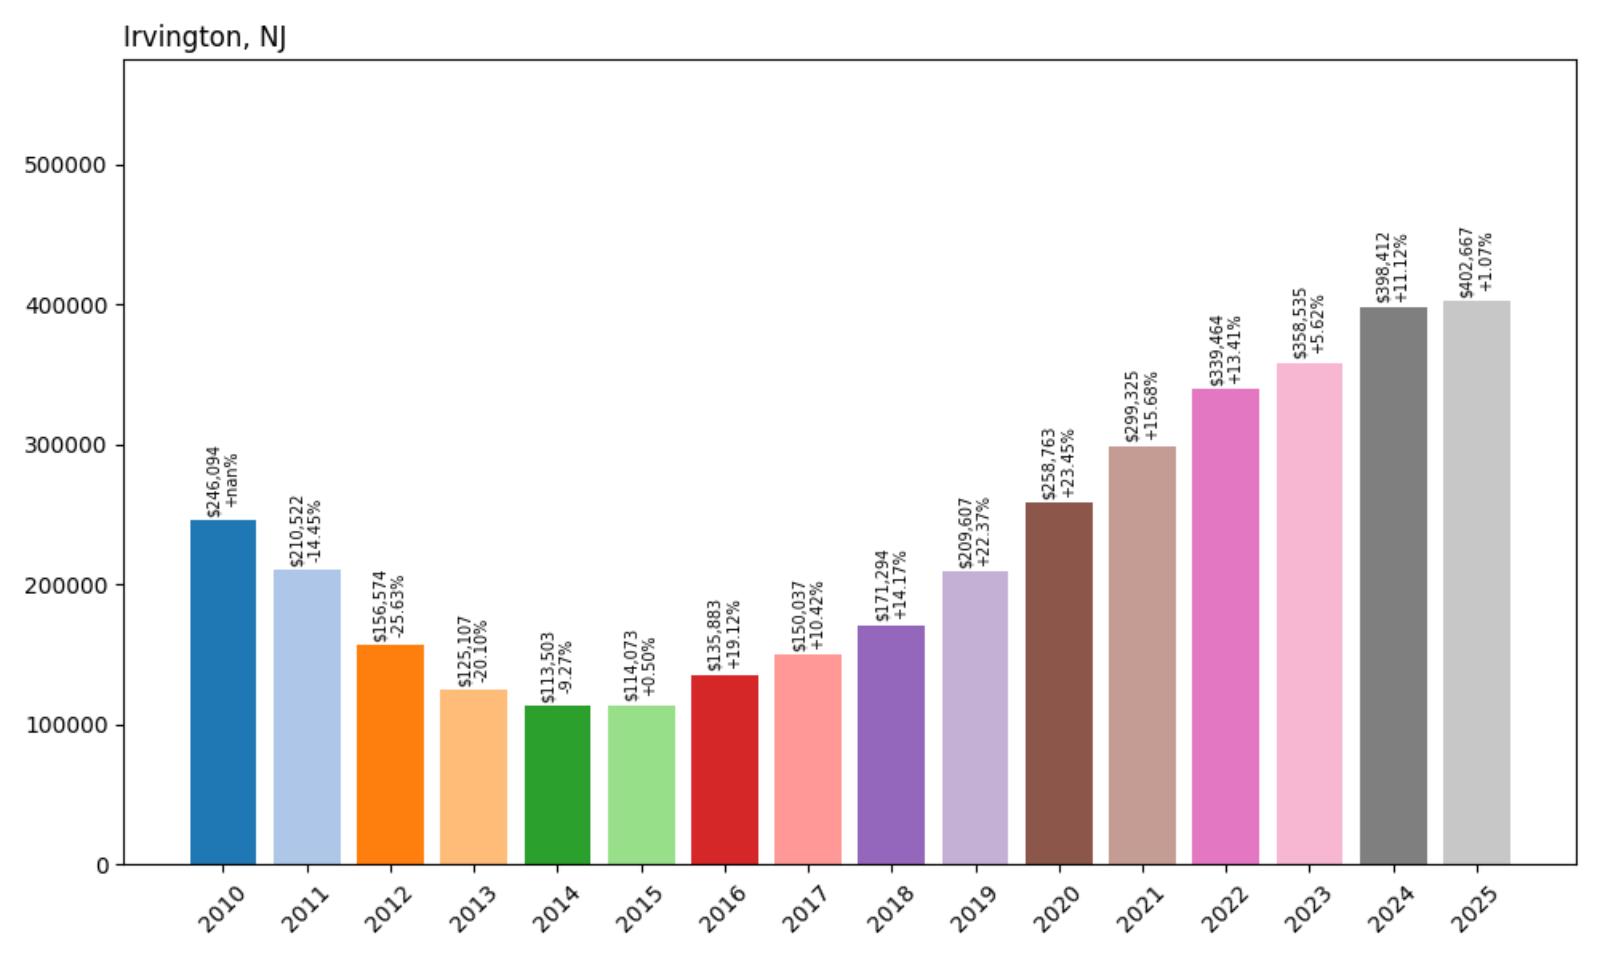
- Crash Risk Percentage: 95.00%
- Historical crashes (8%+ drops): 4
- Worst historical crash: -25.6% (2012)
- Total price increase since 2010: +63.6%
- Overextended above long-term average: +74.6%
- Price volatility (annual swings): 15.5%
- Current 2025 price: $402,667
Irvington ties for the highest crash risk percentage at 95%, with four historical crashes including a catastrophic 25.6% decline in 2012—the second-worst in our analysis. The Essex County township’s extreme 15.5% volatility represents the highest instability among all communities studied. Despite moderate appreciation, current overextension of 74.6% creates substantial downside risk.
Irvington – Four-Time Crash Veteran Shows Maximum Risk

Irvington, an Essex County township of approximately 54,000 residents, borders Newark and benefits from proximity to major transportation networks serving the New York metropolitan area. The township has undergone periods of economic challenge and renewal, with recent efforts focused on attracting new residents and businesses through development incentives and infrastructure improvements. Its location provides access to both Newark’s employment opportunities and direct transportation links to Manhattan.
Irvington’s housing market history reveals extraordinary instability, with four separate crashes over the past 15 years, including a devastating 25.6% decline in 2012—the second-worst crash in our entire analysis. The township’s extreme 15.5% annual volatility—the highest in our study—indicates a fundamentally unstable market prone to dramatic price swings. While current median prices of $402,667 represent moderate 63.6% appreciation since 2010, values remain 74.6% above sustainable levels. The combination of extensive crash history, extreme volatility, and current overextension places Irvington at maximum risk for another significant price correction.
3. Woodlynne – Crash Risk Percentage: 95.00%
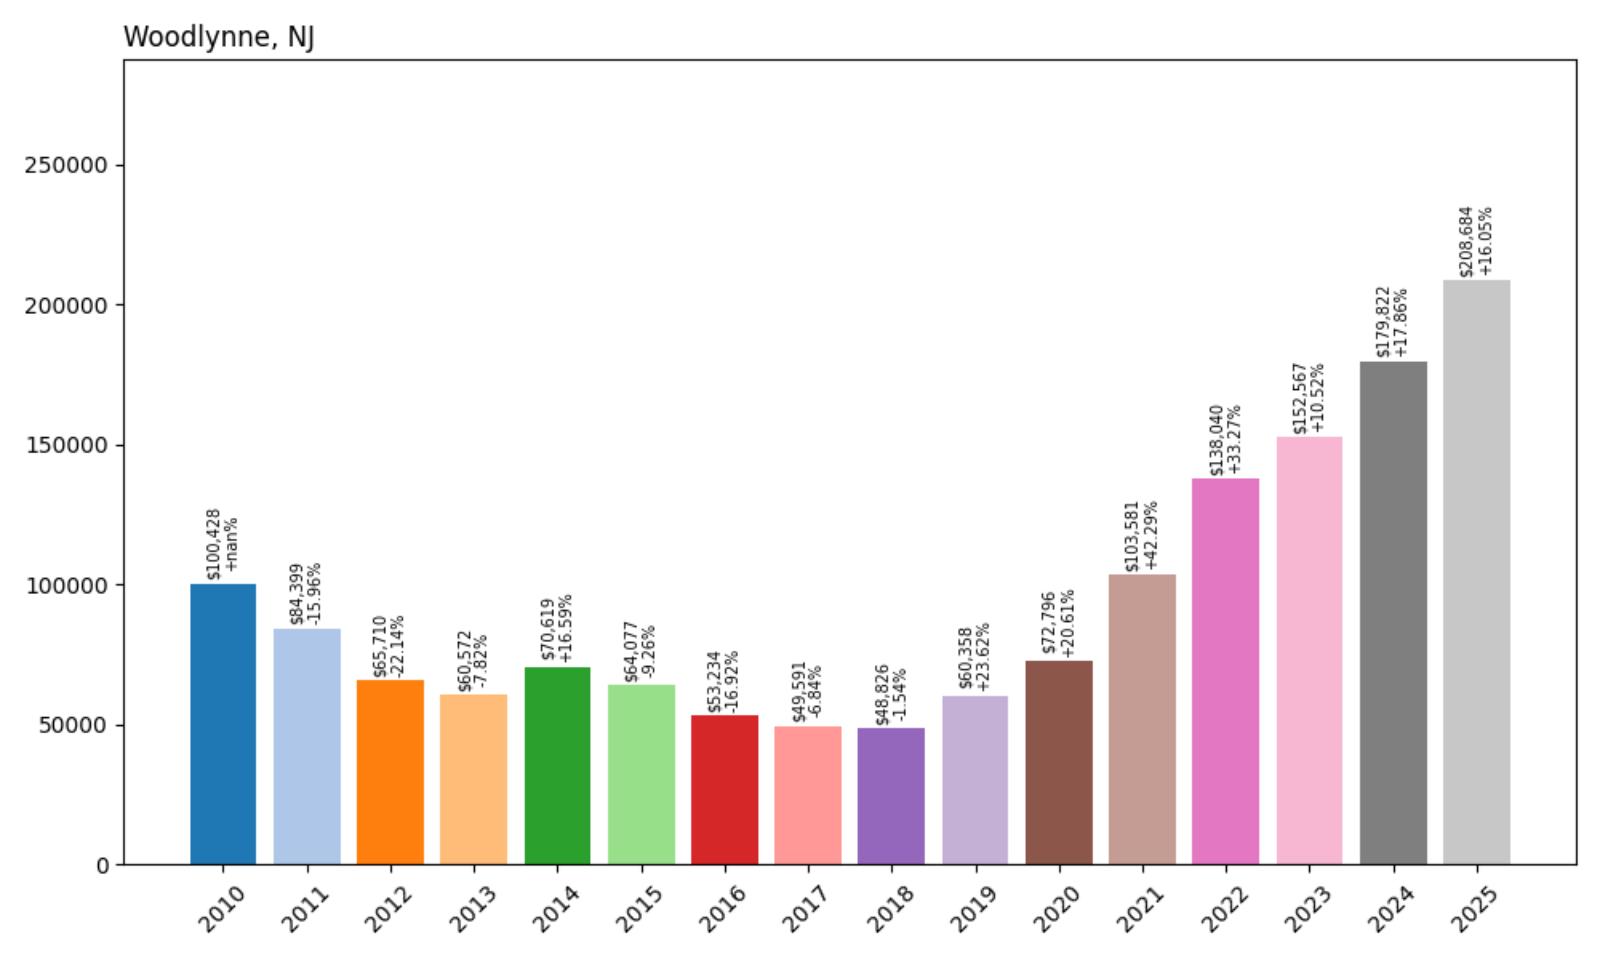
- Crash Risk Percentage: 95.00%
- Historical crashes (8%+ drops): 4
- Worst historical crash: -22.1% (2012)
- Total price increase since 2010: +107.8%
- Overextended above long-term average: +120.6%
- Price volatility (annual swings): 19.6%
- Current 2025 price: $208,684
Woodlynne exhibits the most extreme market conditions in our analysis, with values 120.6% above long-term averages—the highest overextension rate. The tiny Camden County borough has experienced four crashes, including a severe 22.1% decline in 2012. Its astronomical 19.6% volatility represents unprecedented instability that could trigger dramatic price corrections.
Woodlynne – Extreme Overextension in Tiny Borough
Woodlynne, one of New Jersey’s smallest municipalities with just over 2,700 residents in 0.3 square miles, sits along the Delaware River in Camden County adjacent to Camden and Philadelphia. Despite its tiny size, the borough has attracted residents seeking affordable housing with urban access, benefiting from its proximity to Philadelphia via the Betsy Ross Bridge. Recent development pressures and its strategic location have contributed to dramatic price appreciation.
However, Woodlynne’s housing market shows the most extreme conditions in our entire analysis, with the current median price of $208,684 representing 120.6% overextension above historical norms—the highest in our study. The borough’s extraordinary 19.6% annual volatility indicates a market prone to dramatic swings, while its history of four separate crashes, including a devastating 22.1% decline in 2012, demonstrates extreme instability. Woodlynne’s tiny size and limited housing stock make it particularly vulnerable to rapid price corrections. If demand diminishes or if broader economic pressures affect the region, the borough could experience catastrophic price declines given its unprecedented overextension and volatility.
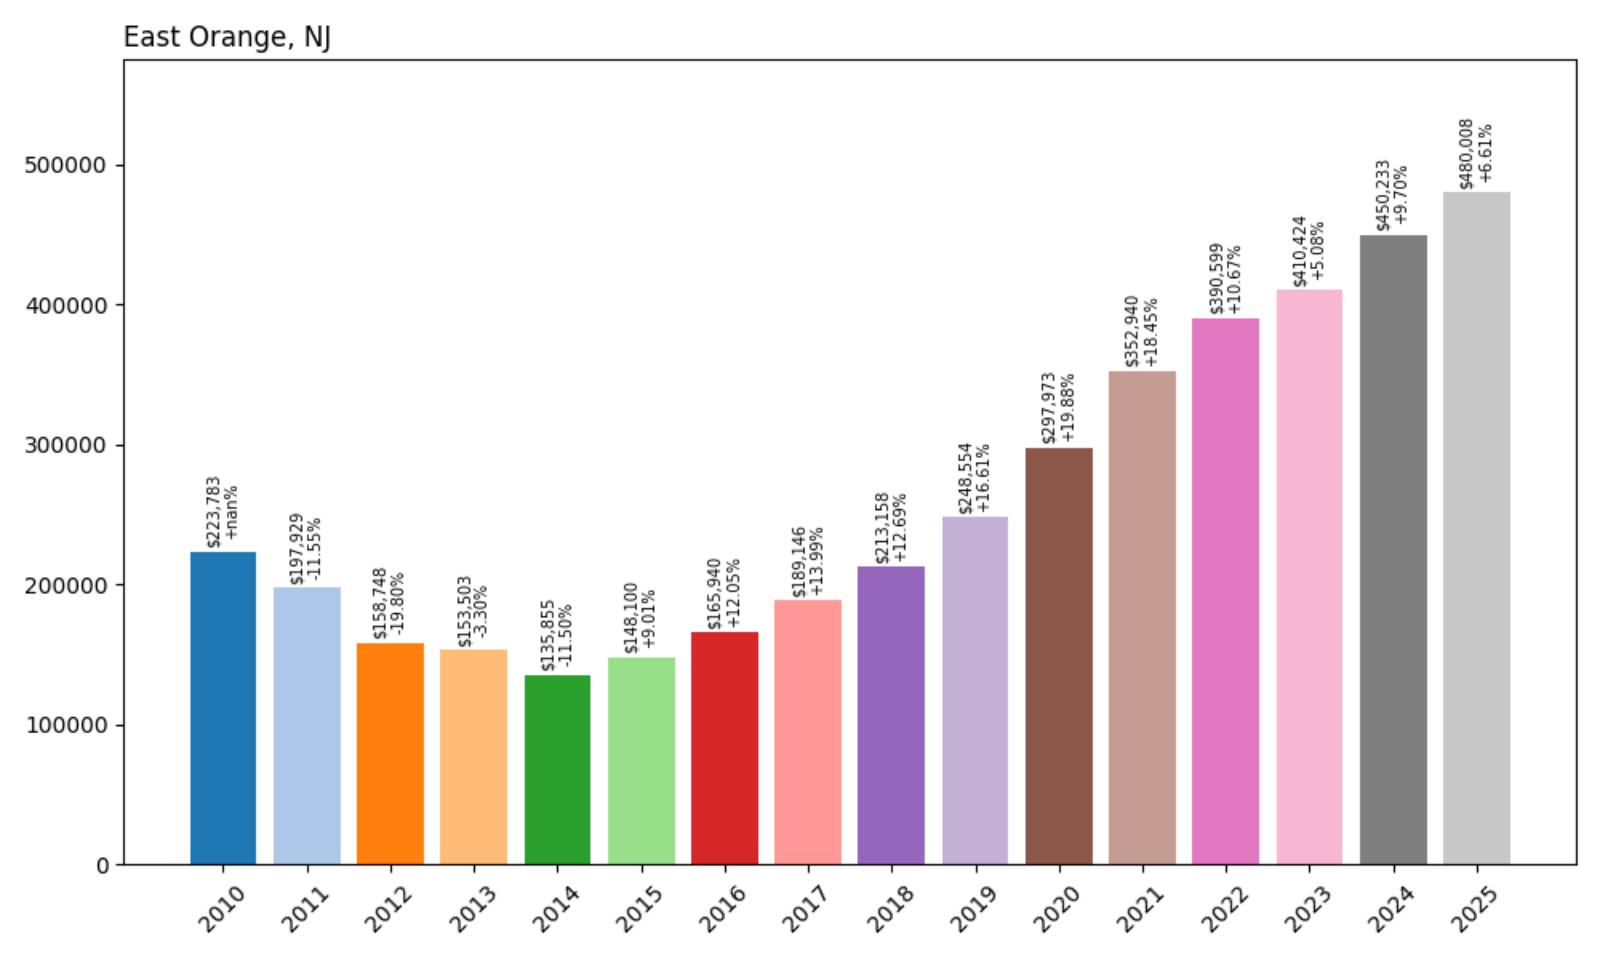
2. East Orange – Crash Risk Percentage: 95.00%
Would you like to save this?
- Crash Risk Percentage: 95.00%
- Historical crashes (8%+ drops): 3
- Worst historical crash: -19.8% (2012)
- Total price increase since 2010: +114.5%
- Overextended above long-term average: +82.1%
- Price volatility (annual swings): 12.0%
- Current 2025 price: $480,008
East Orange ranks second in crash risk with dramatic price appreciation of 114.5% since 2010, pushing values 82.1% above sustainable levels. The Essex County city has experienced three major crashes, including a severe 19.8% decline in 2012. Current prices approaching $480,000 represent significant overvaluation for a community with moderate volatility of 12%.
East Orange – Gentrification Pressures Create Vulnerability

East Orange, an Essex County city of approximately 69,000 residents, has undergone significant transformation through gentrification and urban renewal efforts. Located just west of Newark with excellent transportation access to New York City, the city has attracted new residents seeking more affordable alternatives to expensive metropolitan markets. According to recent market data, East Orange home prices were up 26.9% compared to last year, selling for a median price of $630K, though our analysis shows lower current values, indicating market volatility and data variations across sources.
The current median price of $480,008 in our analysis represents a substantial 114.5% increase since 2010 that has pushed values 82.1% above historical norms. East Orange’s history of three major crashes, including a devastating 19.8% decline in 2012, demonstrates the market’s vulnerability to economic downturns and shifts in buyer sentiment. The city’s 12% annual volatility and dependence on gentrification trends create significant risks. If economic conditions deteriorate or if gentrification pressures shift to other areas, East Orange could face substantial corrections given its high overextension and crash history.
1. Pleasantville – Crash Risk Percentage: 95.00%
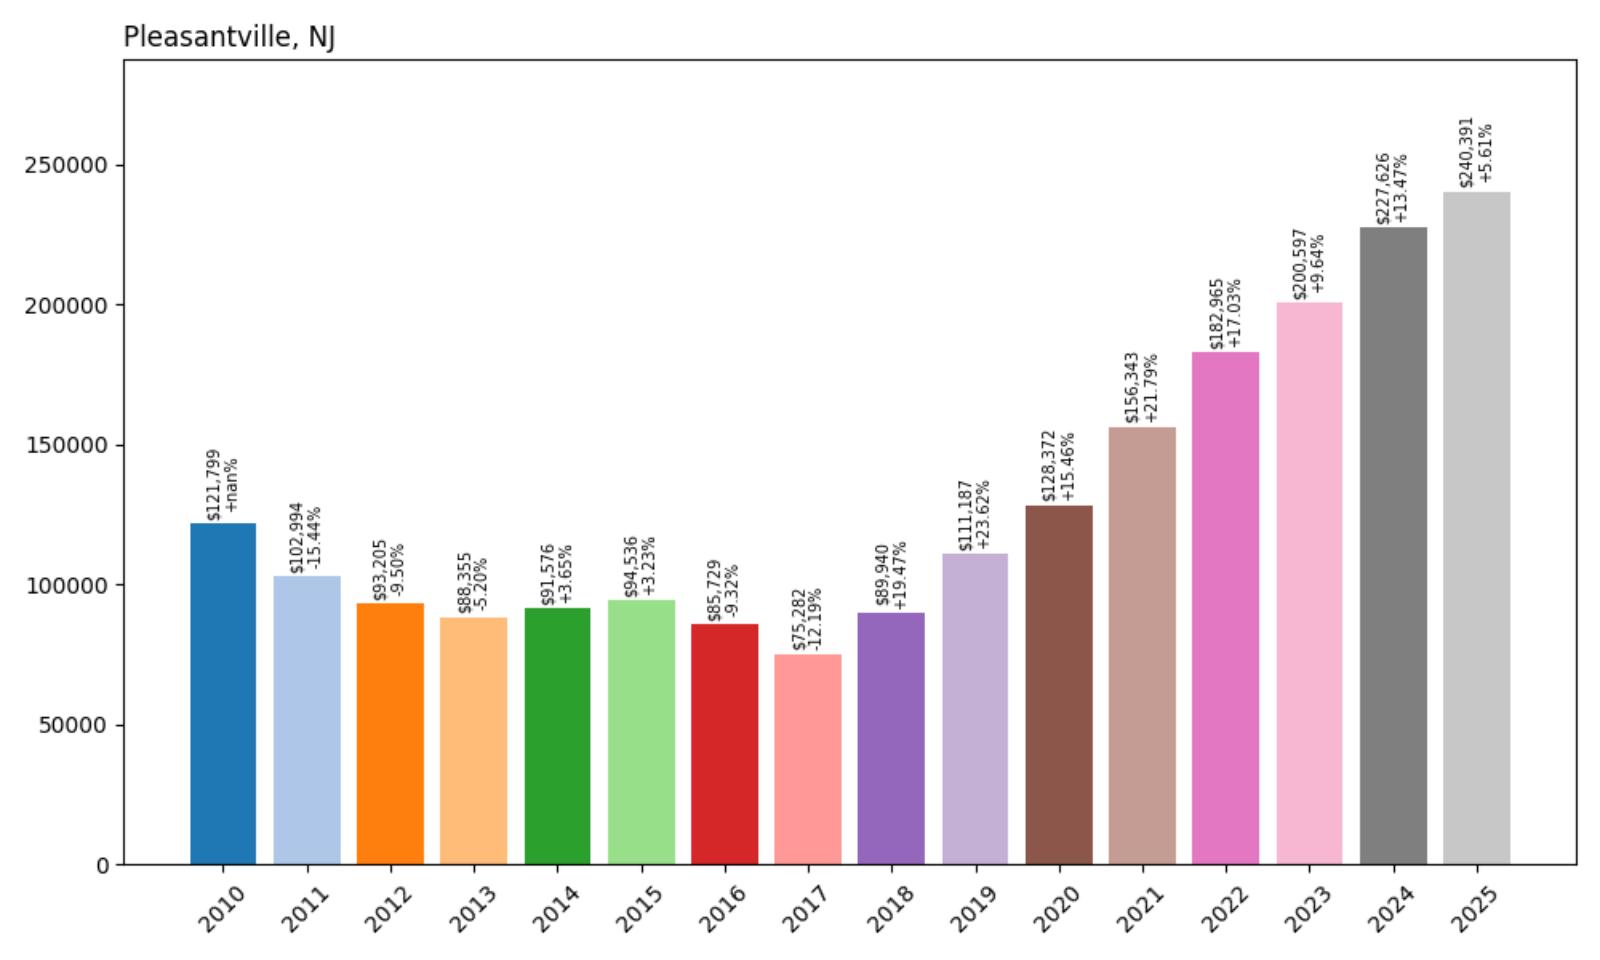
- Crash Risk Percentage: 95.00%
- Historical crashes (8%+ drops): 4
- Worst historical crash: -15.4% (2011)
- Total price increase since 2010: +97.4%
- Overextended above long-term average: +84.0%
- Price volatility (annual swings): 13.1%
- Current 2025 price: $240,391
Pleasantville tops our highest-risk list with four historical crashes and values 84% above long-term averages. The Atlantic County city has nearly doubled in price since 2010, reaching levels that may be unsustainable given local economic fundamentals. High volatility of 13.1% signals continued market instability in this community that has already experienced multiple severe corrections.
Pleasantville – Atlantic County’s Most Vulnerable Market

Pleasantville, located in Atlantic County with approximately 20,000 residents, serves as a residential community between the Pine Barrens and the Atlantic City region. The city had the eighth-highest property tax rate in New Jersey, with an equalized rate of 4.903% in 2020, compared to 2.560% in the county as a whole and a statewide average of 2.279%. According to recent census data, the poverty rate stands at 23.3%, indicating economic challenges that contrast sharply with rising home values.
The current median price of $240,391 represents a dramatic 97.4% increase since 2010 that has pushed values 84% above sustainable levels, creating extreme vulnerability in a community where the median household income is $52,403. Pleasantville’s extraordinary history of four separate crashes over 15 years, combined with 13.1% annual volatility, demonstrates fundamental market instability. The combination of high property taxes, significant poverty rates, and extreme overextension creates conditions ripe for another major correction. If regional economic pressures intensify or if Atlantic County’s tourism-dependent economy faces challenges, Pleasantville’s overextended housing market appears poised for significant decline.