🔥 Would you like to save this?
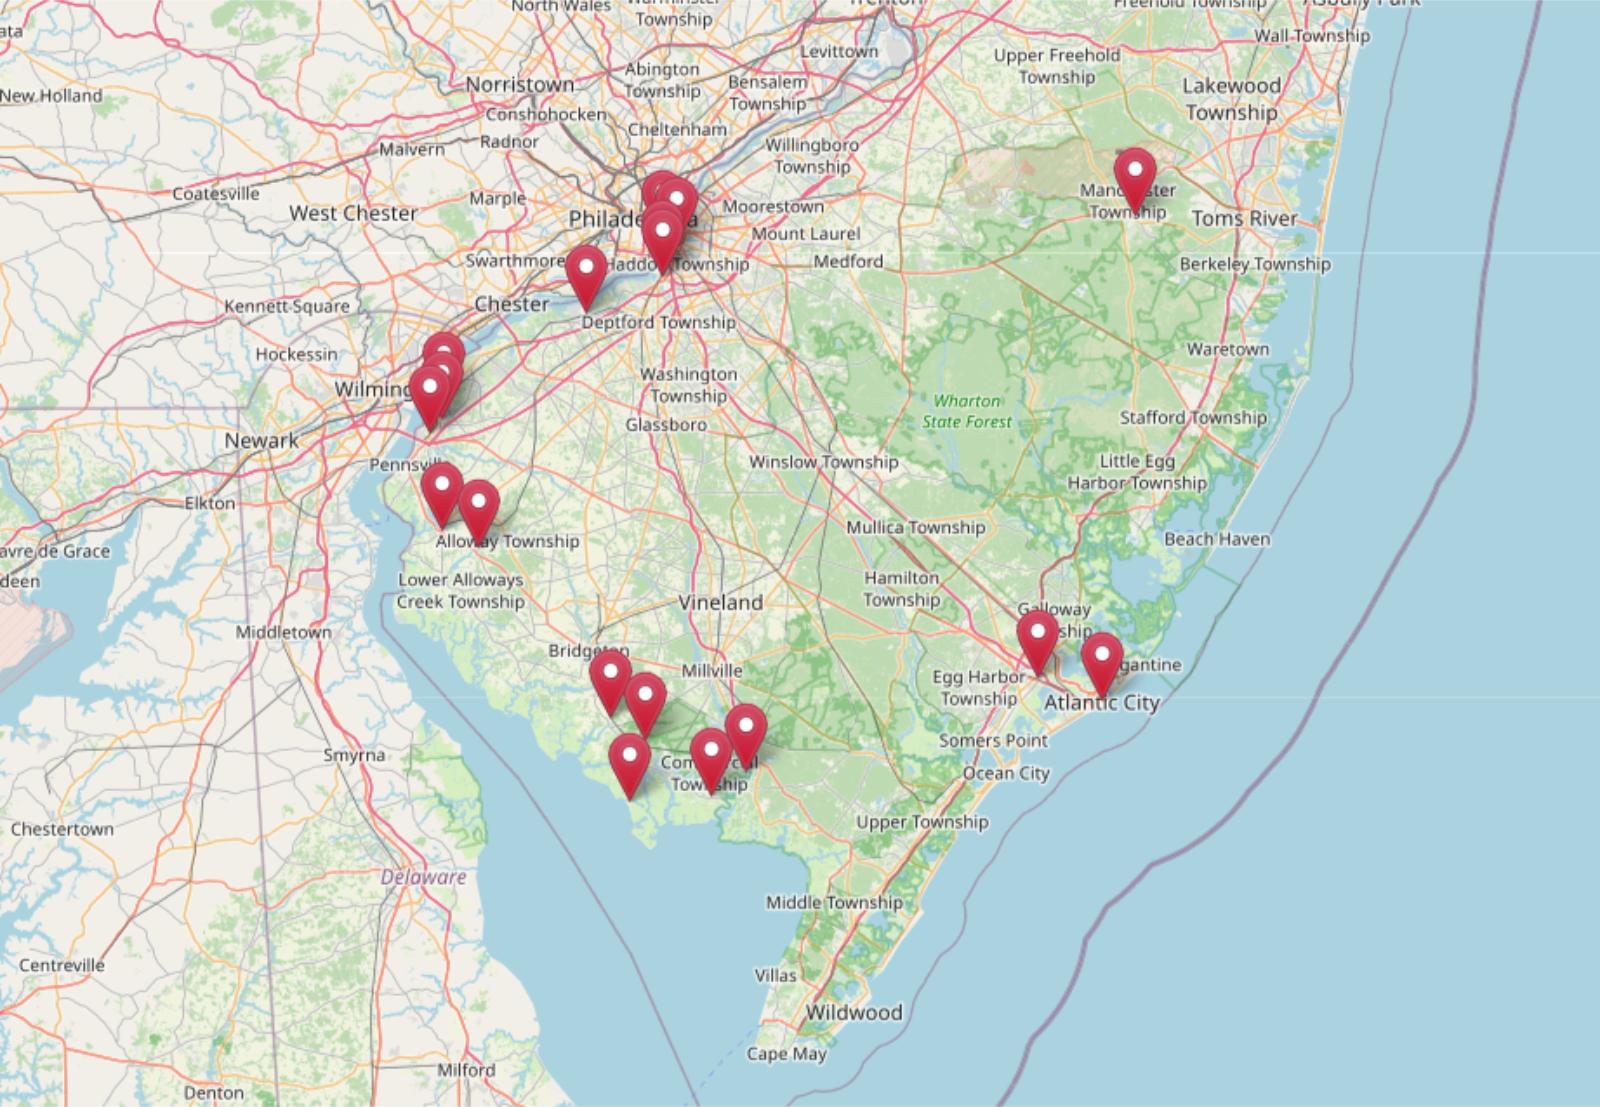
While the Zillow Home Value Index shows prices climbing across most of New Jersey, a few towns have bucked the trend. These 18 spots still have some of the lowest home values in the state as of 2025, offering real possibilities for buyers who don’t want to overpay. Some have held steady for years, while others are just starting to recover from past dips—but all remain surprisingly accessible in a market known for its high price tags.
18. Carneys Point – 73% Home Price Increase Since 2010

- 2010: $144,077
- 2011: $138,821 (-5,256, -3.65% from previous year)
- 2012: $137,810 (-1,011, -0.73% from previous year)
- 2013: $134,944 (-2,867, -2.08% from previous year)
- 2014: $140,553 (+5,609, +4.16% from previous year)
- 2015: $136,210 (-4,343, -3.09% from previous year)
- 2016: $134,088 (-2,122, -1.56% from previous year)
- 2017: $132,095 (-1,993, -1.49% from previous year)
- 2018: $131,415 (-680, -0.51% from previous year)
- 2019: $131,225 (-190, -0.14% from previous year)
- 2020: $149,159 (+17,934, +13.67% from previous year)
- 2021: $173,601 (+24,443, +16.39% from previous year)
- 2022: $205,895 (+32,294, +18.60% from previous year)
- 2023: $221,134 (+15,239, +7.40% from previous year)
- 2024: $241,597 (+20,463, +9.25% from previous year)
- 2025: $249,406 (+7,809, +3.23% from previous year)
Carneys Point saw sluggish home price movement for most of the 2010s, with modest declines nearly every year through 2019. But since 2020, the market here has reversed course dramatically. Prices jumped more than 70% from 2010 to 2025, signaling renewed demand in this southwestern Salem County town. Despite the gains, homes here remain among the most affordable in the state.
In order to come up with the very specific design ideas, we create most designs with the assistance of state-of-the-art AI interior design software. Also, assume links that take you off the site are affiliate links such as links to Amazon. this means we may earn a commission if you buy something.
Carneys Point – Industrial Roots, Affordable Living

Located along the Delaware River near the Pennsylvania border, Carneys Point offers easy access to Wilmington and Philadelphia while retaining a quieter, small-town atmosphere. The area has historically been industrial, with DuPont’s presence shaping the local economy for decades. That legacy, paired with a relatively large housing stock and modest property taxes, helps explain why prices stayed flat for so long—and why recent growth feels like a long-awaited correction.
Buyers are increasingly attracted to Carneys Point for its proximity to major highways, including I-295 and the New Jersey Turnpike. The town is served by Penns Grove-Carneys Point Regional School District and features local parks and amenities. For price-conscious shoppers who still want a foothold in the Mid-Atlantic corridor, this is one of the few remaining bargains.
17. Brooklawn – 53% Home Price Increase Since 2010

- 2010: $161,111
- 2011: $146,693 (-14,418, -8.95% from previous year)
- 2012: $126,803 (-19,891, -13.56% from previous year)
- 2013: $114,899 (-11,904, -9.39% from previous year)
- 2014: $116,724 (+1,825, +1.59% from previous year)
- 2015: $114,310 (-2,414, -2.07% from previous year)
- 2016: $115,100 (+790, +0.69% from previous year)
- 2017: $113,002 (-2,098, -1.82% from previous year)
- 2018: $110,487 (-2,516, -2.23% from previous year)
- 2019: $124,876 (+14,390, +13.02% from previous year)
- 2020: $135,719 (+10,842, +8.68% from previous year)
- 2021: $162,683 (+26,965, +19.87% from previous year)
- 2022: $191,151 (+28,468, +17.50% from previous year)
- 2023: $204,102 (+12,950, +6.77% from previous year)
- 2024: $236,269 (+32,167, +15.76% from previous year)
- 2025: $247,225 (+10,957, +4.64% from previous year)
Brooklawn’s housing market tells a tale of steep decline followed by a decade-long rebound. After bottoming out in the early 2010s, home prices in this Camden County borough have climbed steadily since 2018. As of May 2025, home values have grown 53% from their 2010 level, making it an appealing choice for those priced out of neighboring areas.
Brooklawn – A Turnaround Story in South Jersey

Sitting just outside Gloucester City and minutes from Philadelphia, Brooklawn combines accessibility with affordability. While it struggled during the housing crisis—losing nearly 30% of value between 2010 and 2013—the town has regained its footing thanks to regional growth and increased demand from commuters seeking cheaper alternatives to Center City.
Brooklawn features a mix of modest single-family homes, small parks, and a tight-knit community vibe. It’s served by the Gateway Regional High School district and benefits from its location along US Route 130. For buyers eyeing future appreciation without breaking the bank, Brooklawn presents an attractive mix of past volatility and current momentum.
16. Leesburg – 1.6% Home Price Decrease Since 2024

- 2010: N/A
- 2011: N/A
- 2012: N/A
- 2013: N/A
- 2014: N/A
- 2015: N/A
- 2016: N/A
- 2017: N/A
- 2018: N/A
- 2019: N/A
- 2020: N/A
- 2021: N/A
- 2022: N/A
- 2023: N/A
- 2024: $247,809
- 2025: $243,827 (-3,982, -1.61% from previous year)
Leesburg only recently entered the Zillow Home Value Index dataset, with data available from 2024 onward. In that short time, it’s already seen a slight drop in home values, down 1.6% in the last year. That puts it on the radar as a town that may offer more stable pricing in the near term—especially compared to some of its more volatile neighbors.
Leesburg – Rural Charm and Slow Market Movements

Located in Maurice River Township, Leesburg is part of Cumberland County and offers a more rural setting than many of the towns on this list. It has a long history dating back to the 18th century and has traditionally been associated with maritime and agricultural industries. Because of its secluded nature and limited housing turnover, property values have been relatively slow to change.
The slight decline from 2024 to 2025 may not indicate a larger trend, but it does reflect broader stabilization in rural real estate markets across southern New Jersey. For buyers seeking peace, space, and a price point that’s still within reach, Leesburg offers a low-pressure environment to enter the market—even if the long-term growth trajectory remains uncertain.
15. Gloucester City – 81% Home Price Increase Since 2010

- 2010: $134,456
- 2011: $125,136 (-9,320, -6.93% from previous year)
- 2012: $106,522 (-18,614, -14.87% from previous year)
- 2013: $94,337 (-12,185, -11.44% from previous year)
- 2014: $98,206 (+3,869, +4.10% from previous year)
- 2015: $98,253 (+47, +0.05% from previous year)
- 2016: $101,873 (+3,620, +3.68% from previous year)
- 2017: $94,129 (-7,744, -7.60% from previous year)
- 2018: $100,624 (+6,495, +6.90% from previous year)
- 2019: $111,936 (+11,312, +11.24% from previous year)
- 2020: $128,534 (+16,597, +14.83% from previous year)
- 2021: $159,282 (+30,749, +23.92% from previous year)
- 2022: $180,371 (+21,089, +13.24% from previous year)
- 2023: $197,379 (+17,008, +9.43% from previous year)
- 2024: $229,040 (+31,661, +16.04% from previous year)
- 2025: $243,576 (+14,536, +6.35% from previous year)
Gloucester City experienced sharp declines through 2013 but has surged since then, posting a total price increase of 81% since 2010. The steepest gains occurred between 2020 and 2022, when prices jumped by more than 50% over two years. That upward momentum has continued into 2025, though at a slower pace.
Gloucester City – Blue-Collar Roots Meet Urban Access

Just across the Delaware River from Philadelphia, Gloucester City is an old industrial town with deep Irish-American roots and a strong working-class culture. Its proximity to major employers, I-76, and the Walt Whitman Bridge makes it a strategic spot for commuters. The city has recently attracted attention for its redevelopment efforts and relatively affordable housing.
Gloucester City’s schools are operated independently from Camden County’s larger districts, and the town features a walkable main street and riverside parks. As prices in neighboring Camden and Pennsauken climb, this town is increasingly seen as a smart option for buyers who want close-in access without premium costs. Its recent growth reflects both improved demand and renewed local investment.
14. Cedarville – 52% Home Price Increase Since 2016

- 2010: N/A
- 2011: N/A
- 2012: N/A
- 2013: N/A
- 2014: N/A
- 2015: N/A
- 2016: $159,455
- 2017: $161,166 (+1,710, +1.07% from previous year)
- 2018: $152,425 (-8,741, -5.42% from previous year)
- 2019: $160,523 (+8,098, +5.31% from previous year)
- 2020: $171,103 (+10,580, +6.59% from previous year)
- 2021: $191,831 (+20,728, +12.11% from previous year)
- 2022: $220,747 (+28,916, +15.07% from previous year)
- 2023: $232,554 (+11,807, +5.35% from previous year)
- 2024: $245,979 (+13,425, +5.77% from previous year)
- 2025: $243,232 (-2,747, -1.12% from previous year)
Since data first became available in 2016, home prices in Cedarville have risen by over 52%. Most of that growth came between 2020 and 2022, with a brief softening observed in the most recent year. Despite that dip, this Cumberland County town remains among the state’s most affordable.
Cedarville – Steady Growth in a Quiet Corner of New Jersey

Cedarville is an unincorporated community within Lawrence Township, known for its rural setting, farmlands, and the tranquil waters of Cedar Lake. This part of Cumberland County has long attracted those seeking distance from the hustle of city life. Homes here are often detached, spacious, and priced well below the state median, offering good value for buyers prioritizing space over proximity to urban centers.
The market’s gains in the early 2020s likely reflect growing interest in remote work and lifestyle-driven moves. With relatively little inventory and slow turnover, even minor increases in demand can move the needle. For those looking to settle somewhere quiet and affordable, Cedarville offers a calm market with long-term potential.
13. Pleasantville – 97% Home Price Increase Since 2010

- 2010: $121,799
- 2011: $102,994 (-18,805, -15.44% from previous year)
- 2012: $93,205 (-9,789, -9.50% from previous year)
- 2013: $88,355 (-4,851, -5.20% from previous year)
- 2014: $91,576 (+3,221, +3.65% from previous year)
- 2015: $94,536 (+2,960, +3.23% from previous year)
- 2016: $85,729 (-8,808, -9.32% from previous year)
- 2017: $75,282 (-10,447, -12.19% from previous year)
- 2018: $89,940 (+14,659, +19.47% from previous year)
- 2019: $111,187 (+21,247, +23.62% from previous year)
- 2020: $128,372 (+17,185, +15.46% from previous year)
- 2021: $156,343 (+27,971, +21.79% from previous year)
- 2022: $182,965 (+26,622, +17.03% from previous year)
- 2023: $200,597 (+17,633, +9.64% from previous year)
- 2024: $227,626 (+27,029, +13.47% from previous year)
- 2025: $240,391 (+12,764, +5.61% from previous year)
Pleasantville has experienced a dramatic home price journey since 2010, beginning with sharp declines and ending with one of the strongest rebounds in this list. From a 2017 low of $75,282, prices more than tripled over the next eight years to reach $240,391 by 2025. The turnaround has been especially noticeable since 2019, when double-digit percentage increases became the norm. In total, the city has seen a 97% increase in home values over 15 years, making it one of the most improved—yet still affordable—markets in New Jersey.
Pleasantville – Urban Revival with Access to the Shore

Located just west of Atlantic City, Pleasantville is part of Atlantic County and offers a strategic location between the coast and inland South Jersey. The city has long been considered more affordable than its casino-lined neighbor, which has helped it attract buyers seeking proximity to the shore without sky-high prices. Its accessibility via the Atlantic City Expressway and NJ Transit bus lines also makes it a convenient option for commuters and workers in the tourism sector. Despite earlier years of economic decline and housing stagnation, recent development initiatives have started to pay off.
Pleasantville’s housing stock is a mix of single-family homes, duplexes, and small apartment complexes. Local schools are part of the Pleasantville Public School District, and there are several parks and shopping options scattered throughout the city. While it still faces challenges tied to income levels and public infrastructure, the steep home price growth in the past five years signals renewed interest. Buyers looking for long-term value and up-and-coming neighborhoods will find Pleasantville an intriguing option that’s quickly shedding its “overlooked” status.
12. Quinton – 62% Home Price Increase Since 2019

🔥 Would you like to save this?
- 2010: N/A
- 2011: N/A
- 2012: N/A
- 2013: N/A
- 2014: N/A
- 2015: N/A
- 2016: N/A
- 2017: N/A
- 2018: N/A
- 2019: $147,745
- 2020: $157,931 (+10,186, +6.89% from previous year)
- 2021: $171,900 (+13,969, +8.84% from previous year)
- 2022: $210,956 (+39,056, +22.72% from previous year)
- 2023: $231,009 (+20,053, +9.51% from previous year)
- 2024: $253,218 (+22,209, +9.61% from previous year)
- 2025: $239,661 (-13,557, -5.35% from previous year)
Quinton’s market has moved quickly in recent years. Starting from $147,745 in 2019, home values surged by 62% to reach $239,661 by 2025. The biggest jumps came in 2022 and 2024, when prices rose by over 20% each year. The slight pullback in 2025 doesn’t erase those gains but may reflect some cooling after a hot streak. Even so, Quinton remains one of the most affordable towns in the state, with a current price level well below New Jersey’s median home value.
Quinton – Small-Town Growth in Salem County

Situated in rural Salem County, Quinton is a township that emphasizes open space, farming, and a slower pace of life. The area features mostly detached single-family homes on larger lots, with a mix of older properties and newer construction. While it doesn’t offer the dense commercial corridors of urban centers, it does provide direct access to Route 49 and is within reach of the Delaware Memorial Bridge and Wilmington, DE. Its location has likely contributed to the uptick in buyer interest, especially among those working remotely or commuting across state lines.
Education services are provided by the Quinton Township School District and nearby high schools in Salem. Local amenities include Quinton Township Lake and various parks and wooded areas, making it a peaceful place to settle. The recent home price surge may reflect increased demand for less densely populated areas—a trend seen across much of rural America in the wake of the pandemic. While 2025 brought a slight correction, Quinton’s long-term trajectory remains one of upward movement.
11. Paulsboro – 91% Home Price Increase Since 2010
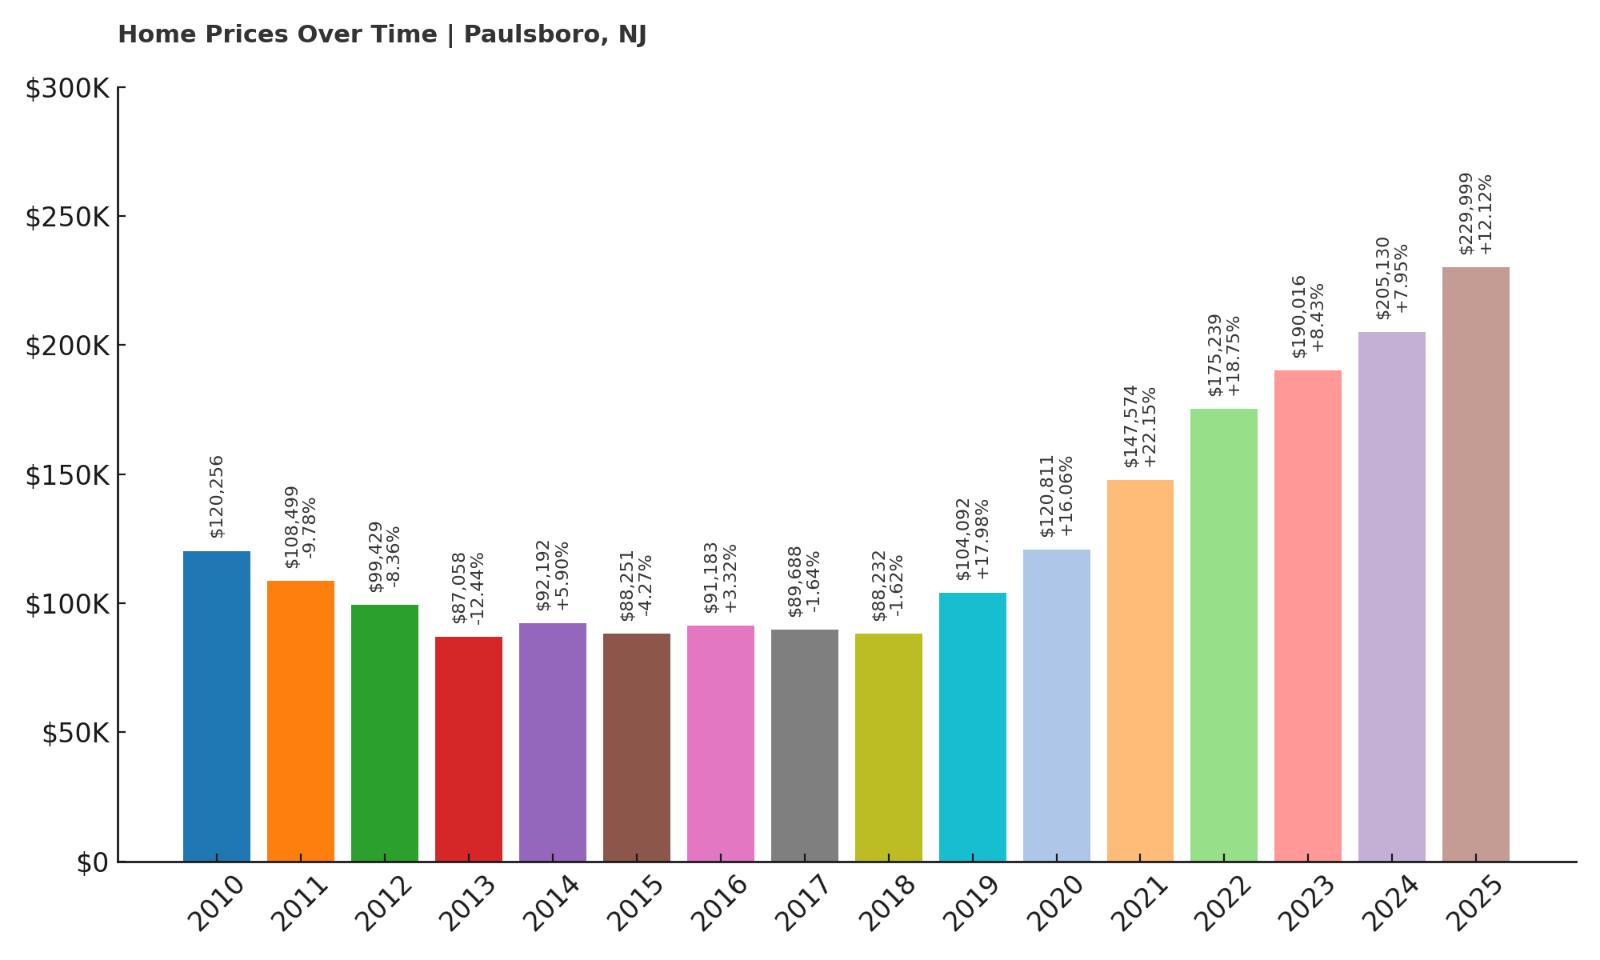
- 2010: $120,256
- 2011: $108,499 (-11,758, -9.78% from previous year)
- 2012: $99,429 (-9,070, -8.36% from previous year)
- 2013: $87,058 (-12,371, -12.44% from previous year)
- 2014: $92,192 (+5,134, +5.90% from previous year)
- 2015: $88,251 (-3,941, -4.27% from previous year)
- 2016: $91,183 (+2,932, +3.32% from previous year)
- 2017: $89,688 (-1,495, -1.64% from previous year)
- 2018: $88,232 (-1,456, -1.62% from previous year)
- 2019: $104,092 (+15,860, +17.97% from previous year)
- 2020: $120,811 (+16,719, +16.06% from previous year)
- 2021: $147,574 (+26,763, +22.15% from previous year)
- 2022: $175,239 (+27,665, +18.75% from previous year)
- 2023: $190,016 (+14,778, +8.43% from previous year)
- 2024: $205,130 (+15,114, +7.95% from previous year)
- 2025: $229,999 (+24,869, +12.12% from previous year)
Home prices in Paulsboro nearly doubled from 2010 to 2025, gaining 91% over the 15-year period. While the early years were marked by sharp declines, the town rebounded significantly starting in 2019. The past five years alone brought consistent double-digit growth, peaking in 2021 with a 22% year-over-year increase. As of May 2025, the average home price is $229,999—still well below the state average.
Paulsboro – Port Access and Affordable Real Estate

Located in Gloucester County, Paulsboro sits along the Delaware River and is home to the Paulsboro Marine Terminal, one of the region’s most important shipping hubs. The town has traditionally served industrial and blue-collar workers, but its affordable housing and improved infrastructure have started to draw interest from first-time buyers and investors. With easy access to I-295 and Route 130, it’s well-positioned for commuters traveling to Camden or Philadelphia.
The local school district, Paulsboro Public Schools, serves the town’s modest population, and recent investments in the port and logistics sectors have brought renewed economic attention. Though it still faces economic challenges, Paulsboro is showing signs of long-term revitalization. Its impressive price growth over the last five years reflects that shift—and with current values still low by state standards, there’s room for further upside.
10. Salem – 73% Home Price Increase Since 2010

- 2010: $130,551
- 2011: $124,730 (-5,822, -4.46% from previous year)
- 2012: $122,832 (-1,898, -1.52% from previous year)
- 2013: $119,944 (-2,888, -2.35% from previous year)
- 2014: $113,955 (-5,988, -4.99% from previous year)
- 2015: $114,024 (+69, +0.06% from previous year)
- 2016: $114,688 (+665, +0.58% from previous year)
- 2017: $110,899 (-3,789, -3.30% from previous year)
- 2018: $107,667 (-3,232, -2.91% from previous year)
- 2019: $108,842 (+1,174, +1.09% from previous year)
- 2020: $127,664 (+18,822, +17.29% from previous year)
- 2021: $161,666 (+34,002, +26.63% from previous year)
- 2022: $178,292 (+16,626, +10.28% from previous year)
- 2023: $198,020 (+19,728, +11.06% from previous year)
- 2024: $212,835 (+14,815, +7.48% from previous year)
- 2025: $226,152 (+13,318, +6.26% from previous year)
Salem’s home values climbed from $130,551 in 2010 to $226,152 in 2025, representing a 73% increase over 15 years. After nearly a decade of sluggish or negative growth, things turned sharply in 2020 with back-to-back years of rapid appreciation. Between 2020 and 2021 alone, prices jumped more than 26%, and that momentum has largely continued since. These gains brought Salem closer to the state’s mid-range price tier, but it still holds its place among New Jersey’s most affordable towns.
Salem – Historic Port City with Renewed Attention

Salem is one of the oldest towns in New Jersey, founded in the 1600s, and that legacy is still evident in its preserved historic homes, colonial architecture, and town layout. Nestled in southwestern Salem County along the Delaware River, the city offers a mix of industrial zones and scenic residential neighborhoods. Despite its rich history, Salem has long struggled with underinvestment and economic stagnation. However, recent years have brought renewed attention, with development projects and efforts to attract new businesses slowly changing the local landscape.
Homebuyers are increasingly eyeing Salem for its value and proximity to larger urban centers like Wilmington and Philadelphia. Its road network—including Routes 45 and 49—makes commuting feasible while still offering the small-town lifestyle many buyers are looking for. With real estate values rising consistently since 2020, Salem seems to be undergoing a gradual transformation, attracting those who want to live somewhere with historical charm, quiet surroundings, and lower-than-average housing costs.
9. Atlantic City – 55% Home Price Increase Since 2010

- 2010: $141,941
- 2011: $120,393 (-21,549, -15.18% from previous year)
- 2012: $112,207 (-8,186, -6.80% from previous year)
- 2013: $105,080 (-7,127, -6.35% from previous year)
- 2014: $97,220 (-7,860, -7.48% from previous year)
- 2015: $100,277 (+3,057, +3.14% from previous year)
- 2016: $83,736 (-16,542, -16.50% from previous year)
- 2017: $78,430 (-5,306, -6.34% from previous year)
- 2018: $91,075 (+12,645, +16.12% from previous year)
- 2019: $106,632 (+15,557, +17.08% from previous year)
- 2020: $120,400 (+13,768, +12.91% from previous year)
- 2021: $141,170 (+20,770, +17.25% from previous year)
- 2022: $163,255 (+22,086, +15.64% from previous year)
- 2023: $177,578 (+14,322, +8.77% from previous year)
- 2024: $208,012 (+30,434, +17.14% from previous year)
- 2025: $220,225 (+12,213, +5.87% from previous year)
Atlantic City’s housing market has been through boom, bust, and now something of a steady recovery. From a high in 2010, prices fell dramatically—hitting bottom in 2017 with a 45% loss compared to their peak. But since then, it’s been a story of consistent rebounds. From 2017 to 2025, prices rose 180%, with especially strong surges from 2019 to 2022. As of 2025, the median home price stands at $220,225, up 55% from 2010 and climbing steadily.
Atlantic City – Rebuilding Value Beyond the Boardwalk

Known worldwide for its casinos and the iconic Boardwalk, Atlantic City has long been a paradox in New Jersey’s real estate landscape. It offers some of the state’s lowest housing prices in a location that also happens to be one of its most visited. The city struggled through the 2010s with casino closures, job losses, and budget challenges. But in recent years, a push for diversification—including investments in entertainment, retail, and housing—has breathed new life into the market. New businesses, improved infrastructure, and waterfront development have all played a role in drawing residents back.
Affordable housing options, beach access, and walkability continue to appeal to younger buyers and investors. While challenges persist in some neighborhoods, others are seeing a wave of renovations and new construction. Atlantic City’s unique combination of location, culture, and price accessibility makes it one of the more dynamic towns on this list. For those willing to look past old headlines, the housing data shows a market that’s rebounding faster than many expected—and may still be undervalued.
8. Newport – 3.4% Home Price Decrease Since 2024

- 2010: N/A
- 2011: N/A
- 2012: N/A
- 2013: N/A
- 2014: N/A
- 2015: N/A
- 2016: N/A
- 2017: N/A
- 2018: N/A
- 2019: N/A
- 2020: N/A
- 2021: N/A
- 2022: N/A
- 2023: N/A
- 2024: $225,217
- 2025: $217,509 (-7,708, -3.42% from previous year)
Newport is one of several towns on this list with limited historical pricing data, but the numbers we do have suggest a recent softening in the market. Between 2024 and 2025, home values dipped by 3.4%, a notable shift that may reflect local economic changes or broader cooling trends. With a current price of $217,509, Newport still ranks as one of the most affordable housing markets in the state as of May 2025, offering an opportunity for buyers willing to act during a dip.
Newport – Quiet Bayside Living with Affordable Homes

Located in Cumberland County, Newport is a small bayside community that offers a peaceful, rural lifestyle surrounded by marshes, tidal creeks, and wildlife habitats. It sits on the edge of the Nantuxent Creek and is part of Downe Township, a region known more for nature preserves than bustling development. For many residents, this isolation is exactly the point: it’s a place where space, privacy, and affordability go hand in hand. The town’s housing stock tends to be older, with modest single-family homes often priced significantly below the state average.
Despite limited infrastructure and a low population density, Newport remains attractive to retirees and buyers seeking a quiet escape from urban life. The slight home price decrease from 2024 to 2025 might indicate temporary oversupply or shifting interest, but it also creates a strategic entry point for long-term buyers. With nearby access to fishing areas, natural trails, and serene views of the Delaware Bay, Newport offers more than just price appeal—it provides a lifestyle that’s hard to find elsewhere in New Jersey.
7. Whiting – 2.9% Home Price Increase Since 2024

- 2010: N/A
- 2011: N/A
- 2012: N/A
- 2013: N/A
- 2014: N/A
- 2015: N/A
- 2016: N/A
- 2017: N/A
- 2018: N/A
- 2019: N/A
- 2020: N/A
- 2021: N/A
- 2022: N/A
- 2023: N/A
- 2024: $211,276
- 2025: $217,376 (+6,100, +2.89% from previous year)
Whiting has only recently entered the housing data set, but the latest figures show modest positive growth. From 2024 to 2025, home prices climbed nearly 3%, rising to $217,376. While that growth is not explosive, it reflects steady demand and stability—two qualities that many buyers value in uncertain economic times. Given its placement on this affordability list, Whiting offers a relatively low-cost option within central New Jersey.
Whiting – Active Adult Living in Ocean County

Whiting is a census-designated place within Manchester Township in Ocean County, best known for its large concentration of 55+ retirement communities. It’s a magnet for older adults seeking manageable homes, walkable neighborhoods, and proximity to the Jersey Shore without the high prices of coastal towns. The area is designed for convenience and comfort, with many homes located in planned communities that offer clubhouses, swimming pools, and maintenance services as part of homeowner associations.
While Whiting doesn’t offer much in terms of nightlife or major retail, it does provide a calm and structured environment, supported by local healthcare facilities and convenient access to Route 70 and the Garden State Parkway. Its appeal lies in its affordability, low-maintenance living, and sense of community. The slight price increase over the past year indicates stable demand among retirees and fixed-income buyers—a trend likely to continue as New Jersey’s older population grows.
6. Woodlynne – 108% Home Price Increase Since 2010

🔥 Would you like to save this?
- 2010: $100,428
- 2011: $84,399 (-16,029, -15.96% from previous year)
- 2012: $65,710 (-18,689, -22.14% from previous year)
- 2013: $60,572 (-5,138, -7.82% from previous year)
- 2014: $70,619 (+10,046, +16.59% from previous year)
- 2015: $64,077 (-6,541, -9.26% from previous year)
- 2016: $53,234 (-10,844, -16.92% from previous year)
- 2017: $49,591 (-3,642, -6.84% from previous year)
- 2018: $48,826 (-765, -1.54% from previous year)
- 2019: $60,358 (+11,531, +23.62% from previous year)
- 2020: $72,796 (+12,438, +20.61% from previous year)
- 2021: $103,581 (+30,784, +42.29% from previous year)
- 2022: $138,040 (+34,459, +33.27% from previous year)
- 2023: $152,567 (+14,527, +10.52% from previous year)
- 2024: $179,822 (+27,255, +17.86% from previous year)
- 2025: $208,684 (+28,861, +16.05% from previous year)
Woodlynne’s housing market has experienced one of the most dramatic rebounds in the state. After falling to just $48,826 in 2018, prices have more than quadrupled, reaching $208,684 in 2025. The town has posted annual gains exceeding 30% in some years, particularly between 2020 and 2022. Compared to its 2010 value, prices have risen by 108%—an extraordinary shift for such a small borough.
Woodlynne – Small Footprint, Big Recovery

Woodlynne is a tiny borough located in Camden County, bordered by Camden City and Collingswood. Despite its size—less than a third of a square mile—it packs in a high density of housing and residents. Historically, Woodlynne struggled with disinvestment and aging infrastructure, but its location has become a major asset. As surrounding areas have gentrified and seen major price hikes, Woodlynne’s affordability has turned heads. Proximity to PATCO rail lines and major roads like Route 130 make it especially appealing to commuters and renters.
The town’s remarkable home value surge reflects a broader trend: interest in close-in, lower-cost urban neighborhoods. Many properties here are rowhomes or duplexes, often attracting first-time buyers or investors. While challenges related to schooling, municipal services, and public perception persist, the housing data makes one thing clear—Woodlynne is on the move. With values doubling in the last five years alone, it’s become one of New Jersey’s fastest-recovering real estate markets.
5. Port Norris – 87% Home Price Increase Since 2016

- 2010: N/A
- 2011: N/A
- 2012: N/A
- 2013: N/A
- 2014: N/A
- 2015: N/A
- 2016: $101,907
- 2017: $101,990 (+83, +0.08% from previous year)
- 2018: $97,404 (-4,586, -4.50% from previous year)
- 2019: $97,448 (+43, +0.04% from previous year)
- 2020: $118,938 (+21,490, +22.05% from previous year)
- 2021: $141,939 (+23,001, +19.34% from previous year)
- 2022: $169,852 (+27,913, +19.67% from previous year)
- 2023: $187,228 (+17,376, +10.23% from previous year)
- 2024: $198,114 (+10,886, +5.81% from previous year)
- 2025: $190,634 (-7,480, -3.78% from previous year)
Port Norris has seen home prices rise steadily since 2016, with values growing from just over $101,000 to more than $190,000 by 2025—an 87% increase. The most aggressive gains happened between 2020 and 2022, during a stretch when prices grew nearly 50% in just two years. That growth has tapered off recently, with a small decline in 2025, but the town still holds its position as one of the most affordable in the state. What’s notable here is how consistent the recovery has been after a stagnant period. This points to growing interest in rural communities with manageable home prices. Even with the recent dip, the current value is almost double what it was in 2016. It remains a promising place for budget-conscious buyers. Its affordability and gradual growth make it appealing to both homeowners and investors looking for long-term value in Southern New Jersey.
Port Norris – Oyster Legacy, Waterfront Potential

Port Norris is part of Commercial Township in Cumberland County and has deep historical roots as a former hub of New Jersey’s oyster industry. It’s located near the mouth of the Maurice River, offering close access to the Delaware Bay and miles of marshland, water trails, and wildlife areas. While its maritime prominence has faded, the charm of this quiet, working-class community persists. The housing stock is a mix of modest single-family homes, older frame houses, and some multi-unit properties, many of which date back several decades. The area is largely rural, with few commercial centers, but that’s part of the draw for those seeking privacy, space, and affordability. It’s also seen renewed interest in conservation and eco-tourism in recent years, which could bring subtle shifts to the housing market. Access to Route 47 connects residents to Vineland and Millville, while still offering a peaceful, remote lifestyle. With steady growth and historic character, Port Norris offers an underrated blend of affordability and identity.
4. Deepwater – 7.6% Home Price Increase Since 2024

- 2010: N/A
- 2011: N/A
- 2012: N/A
- 2013: N/A
- 2014: N/A
- 2015: N/A
- 2016: N/A
- 2017: N/A
- 2018: N/A
- 2019: N/A
- 2020: N/A
- 2021: N/A
- 2022: N/A
- 2023: N/A
- 2024: $176,813
- 2025: $190,197 (+13,384, +7.57% from previous year)
With only two years of pricing data, Deepwater presents a snapshot of a town just beginning to show up on the radar. Between 2024 and 2025, home values increased by 7.6%, from $176,813 to $190,197. While the sample size is small, the price level itself suggests that Deepwater remains extremely affordable relative to most of New Jersey. The town’s location likely plays a key role in holding values down, but the recent increase hints at renewed interest. This could be the result of spillover demand from surrounding areas or improving local amenities. For buyers who don’t mind being early movers, Deepwater might offer the kind of value that becomes much harder to find in a few years. Price-conscious shoppers should consider its upward trend, however modest. It may be one of the few places left where sub-$200K homes still exist in a state with far higher averages.
Deepwater – Strategic Location Meets Quiet Affordability

Deepwater is an unincorporated community within Pennsville Township, located in Salem County just north of the Delaware Memorial Bridge. Its proximity to Interstate 295 and U.S. Route 130 provides direct access to Wilmington, Philadelphia, and New Castle, Delaware, making it strategically appealing despite its small size. Deepwater is also home to the Salem Nuclear Power Plant and a number of industrial sites, which have long shaped the local economy and landscape. While this has kept the housing stock modest and largely utilitarian, it has also ensured steady employment and infrastructure in the area. Many of the homes are small ranches and Cape Cod-style houses that offer significant space for the price. The surrounding area features wetlands, fishing spots, and scenic byways, giving it a surprising mix of industry and nature. As the housing market in southern New Jersey tightens, Deepwater’s central location and low prices could draw more attention. For now, it remains a quiet and affordable alternative with the potential for more.
3. Penns Grove – 165% Home Price Increase Since 2010

- 2010: $70,389
- 2011: $66,050 (-4,339, -6.16% from previous year)
- 2012: $64,898 (-1,152, -1.74% from previous year)
- 2013: $63,832 (-1,065, -1.64% from previous year)
- 2014: $56,286 (-7,546, -11.82% from previous year)
- 2015: $57,618 (+1,332, +2.37% from previous year)
- 2016: $62,732 (+5,114, +8.88% from previous year)
- 2017: $64,453 (+1,721, +2.74% from previous year)
- 2018: $69,821 (+5,368, +8.33% from previous year)
- 2019: $66,989 (-2,833, -4.06% from previous year)
- 2020: $78,846 (+11,858, +17.70% from previous year)
- 2021: $107,253 (+28,407, +36.03% from previous year)
- 2022: $142,956 (+35,703, +33.29% from previous year)
- 2023: $156,207 (+13,250, +9.27% from previous year)
- 2024: $176,670 (+20,463, +13.10% from previous year)
- 2025: $186,743 (+10,074, +5.70% from previous year)
Penns Grove has seen remarkable price growth since 2010, jumping from just over $70,000 to nearly $187,000 in 2025—an increase of 165%. Much of that growth has come since 2020, with a particularly strong surge in 2021 and 2022, when values rose by over 75% combined. While prices still remain well below the state median, the sharp upward trajectory suggests a market in transition. Early 2010s figures showed little movement, even dipping as low as $56,000. But starting in 2020, demand picked up substantially. This may be tied to increased regional affordability pressure, pushing buyers toward overlooked towns like Penns Grove. With consistent annual gains since then, it’s quickly becoming one of the most improved markets in the region. Buyers looking for appreciation potential would be wise to pay attention to the signals here.
Penns Grove – Riverfront Town with Resilient Growth

Penns Grove is located along the Delaware River in Salem County, directly across from Wilmington, Delaware. It once thrived as a manufacturing town, and remnants of that history are still visible in its industrial zones and downtown grid. In recent decades, it has faced challenges typical of many small post-industrial towns—high vacancy rates, aging housing stock, and limited retail development. However, its affordability, riverside location, and access to regional transportation corridors are beginning to attract attention. The town is served by the Penns Grove-Carneys Point Regional School District and includes local parks, marinas, and small businesses along Main Street. While it lacks the polish of more suburban enclaves, its progress is reflected in the data. The recent housing boom, particularly since 2020, may signal a deeper transformation underway. For buyers who want to get in ahead of broader redevelopment trends, Penns Grove is one of the more compelling bets in the affordability space.
2. Fortescue – 4.6% Home Price Increase Since 2024

- 2010: N/A
- 2011: N/A
- 2012: N/A
- 2013: N/A
- 2014: N/A
- 2015: N/A
- 2016: N/A
- 2017: N/A
- 2018: N/A
- 2019: N/A
- 2020: N/A
- 2021: N/A
- 2022: N/A
- 2023: N/A
- 2024: $169,774
- 2025: $177,548 (+7,774, +4.58% from previous year)
Fortescue’s data begins in 2024, but even this short-term snapshot reveals a market trending upward. Between 2024 and 2025, home prices increased by 4.6%, moving from $169,774 to $177,548. While this gain is modest in absolute terms, it reinforces the town’s standing as one of the most affordable housing markets in the entire state. Its sub-$180,000 average home price is increasingly rare in New Jersey, where median values now exceed $400,000. The price increase, though small, may also reflect heightened interest in rural and coastal getaways. Buyers looking for affordability combined with access to nature could be driving that subtle shift. The limited supply of homes likely contributes to market stability here. Fortescue may not be well known, but it’s offering an affordability story worth watching closely.
Fortescue – A Tiny Fishing Village with Big Appeal

🔥 Would you like to save this?
Fortescue is a small bayside village located in Downe Township, Cumberland County, often referred to as the “Weakfish Capital of the World.” With a population in the low hundreds, this town is as remote and tranquil as it gets in New Jersey. It sits directly on the Delaware Bay and has long been known for its fishing docks, marinas, and scenic sunsets over the water. The housing stock here is small but distinctive, with a mix of modest bungalows and raised shore houses built to withstand coastal flooding. Unlike other towns that offer beach access at a premium, Fortescue delivers water views without the high price tag. It’s mostly seasonal and geared toward boaters, anglers, and retirees, though some year-round residents enjoy the seclusion. There are very few retail or dining options, and services are minimal, which contributes to its low housing costs. Still, for those who value quiet, natural beauty, and affordability over convenience, Fortescue is an unmatched option on New Jersey’s lesser-known shoreline.
1. Camden – 61% Home Price Increase Since 2010

- 2010: $92,222
- 2011: $83,902 (-8,319, -9.02% from previous year)
- 2012: $69,574 (-14,328, -17.08% from previous year)
- 2013: $62,789 (-6,785, -9.75% from previous year)
- 2014: $63,392 (+603, +0.96% from previous year)
- 2015: $63,991 (+599, +0.95% from previous year)
- 2016: $59,769 (-4,223, -6.60% from previous year)
- 2017: $60,332 (+564, +0.94% from previous year)
- 2018: $62,918 (+2,586, +4.29% from previous year)
- 2019: $72,505 (+9,587, +15.24% from previous year)
- 2020: $80,554 (+8,049, +11.10% from previous year)
- 2021: $99,856 (+19,302, +23.96% from previous year)
- 2022: $113,606 (+13,750, +13.77% from previous year)
- 2023: $114,997 (+1,391, +1.22% from previous year)
- 2024: $138,038 (+23,041, +20.04% from previous year)
- 2025: $148,468 (+10,430, +7.56% from previous year)
Camden holds the distinction of being the most affordable town in New Jersey, even after seeing a 61% increase in home values since 2010. Prices here dropped steeply early in the decade, falling to just over $60,000 by 2013. Since then, the rebound has been slow but increasingly steady, particularly after 2019. The biggest jump came in 2024, when home prices rose by more than 20% in a single year. This sudden uptick may signal changing investor sentiment or renewed demand for housing close to Philadelphia. With a 2025 home value of $148,468, Camden remains far below the state average and continues to attract first-time buyers, nonprofits, and flippers alike. While the gains are significant in percentage terms, they still represent one of the lowest price points in the state. That alone makes Camden a town worth watching in the years ahead.
Camden – A City Rebuilding, One Block at a Time

Camden is one of New Jersey’s most discussed cities, known for both its deep challenges and growing potential. Located directly across the Delaware River from Philadelphia, Camden has long struggled with poverty, crime, and economic decline. But recent years have seen meaningful investment from institutions like Rutgers University, Cooper Health, and private developers. Portions of the city—particularly along the waterfront—have undergone visible transformation, with new office buildings, parks, and residential projects taking shape. Despite these changes, Camden’s housing stock remains among the cheapest in the state, especially in older neighborhoods farther from downtown. Many homes are rowhouses or attached duplexes that offer low purchase prices but may require renovation. Public transit is excellent, with access to PATCO, NJ Transit, and river ferries to Center City Philadelphia. For buyers willing to engage with an evolving market, Camden offers opportunity at a scale few other places can match. It’s a city in transition—marked by both its history and its hopes for the future.