🔥 Would you like to save this?
Wyoming might be known for wide open spaces, but some of its towns come with sky-high price tags. According to the Zillow Home Value Index, the most expensive housing markets in the state now reach well into the million-dollar range. These aren’t just luxury enclaves—they’re towns where long-term trends, limited inventory, and strong demand have combined to steadily push home values up over time. Whether prices rose gradually or surged in recent years, this ranking shows exactly where Wyoming’s priciest real estate is today.
35. Bear River – 80% Home Price Increase Since 2018
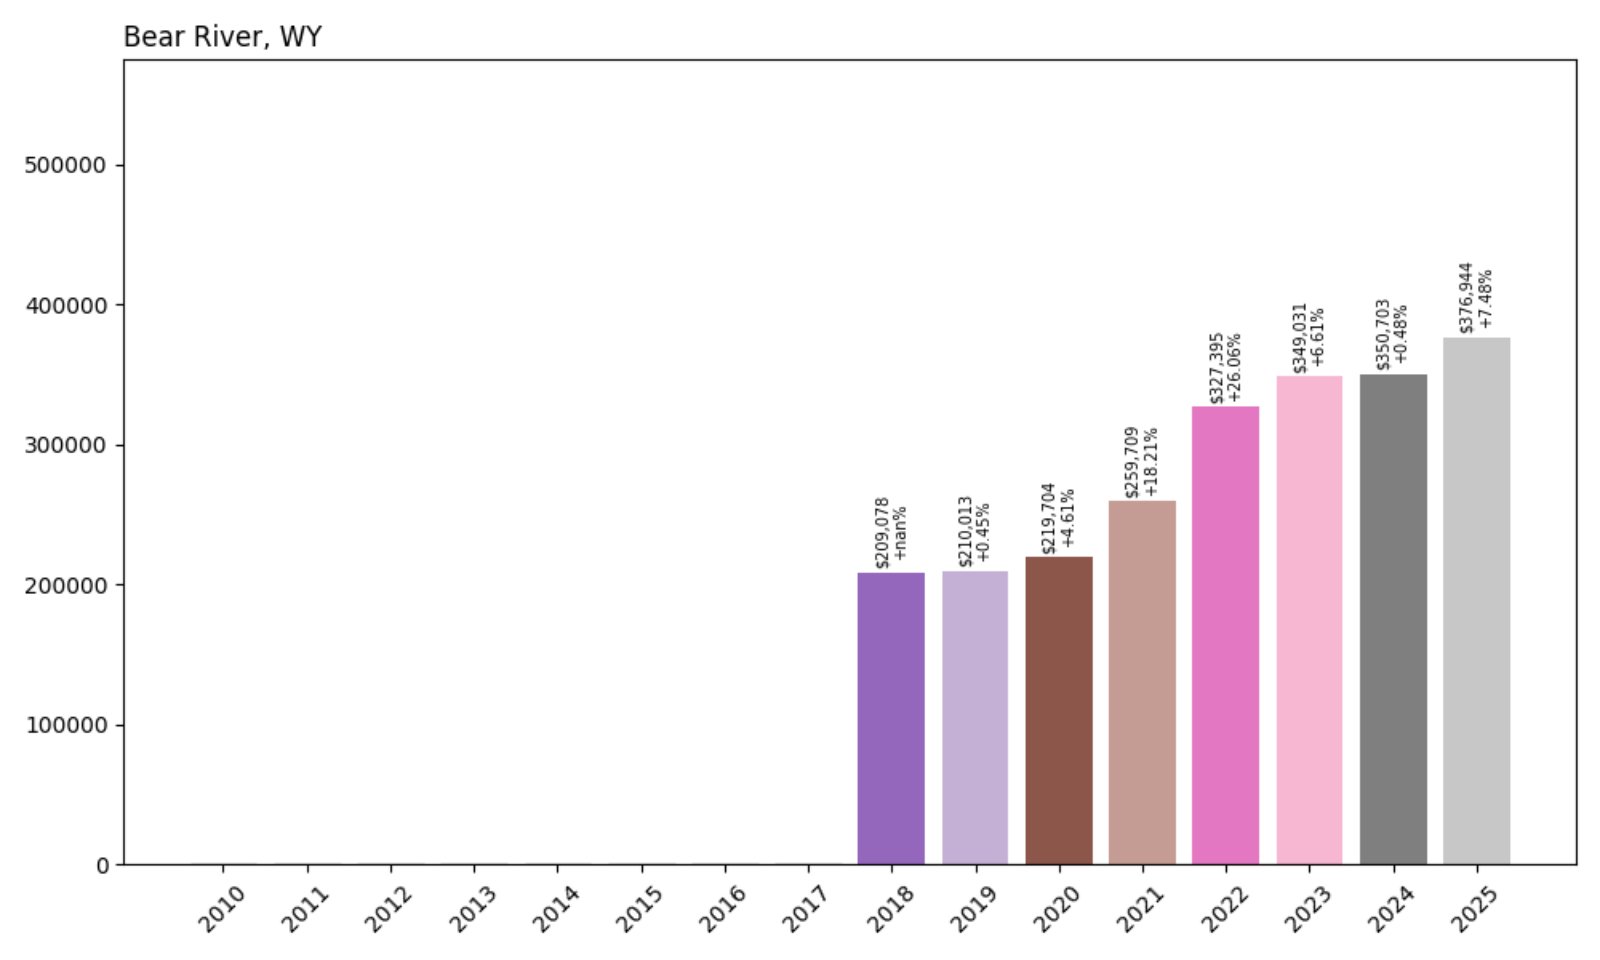
- 2018: $209,078
- 2019: $210,013 (+$936, +0.45% from previous year)
- 2020: $219,704 (+$9,691, +4.61% from previous year)
- 2021: $259,709 (+$40,005, +18.21% from previous year)
- 2022: $327,395 (+$67,686, +26.06% from previous year)
- 2023: $349,031 (+$21,636, +6.61% from previous year)
- 2024: $350,703 (+$1,672, +0.48% from previous year)
- 2025: $376,944 (+$26,241, +7.48% from previous year)
Bear River has seen a steady but powerful rise in home prices since 2018, with an 80% increase over seven years. The most notable jump came between 2020 and 2022, when values leapt by more than 25% annually. Although price growth has eased slightly in recent years, the town continues to gain value in 2025, pointing to solid ongoing demand.
In order to come up with the very specific design ideas, we create most designs with the assistance of state-of-the-art AI interior design software. Also, assume links that take you off the site are affiliate links such as links to Amazon. this means we may earn a commission if you buy something.
Bear River – Quiet Growth on Wyoming’s Western Edge
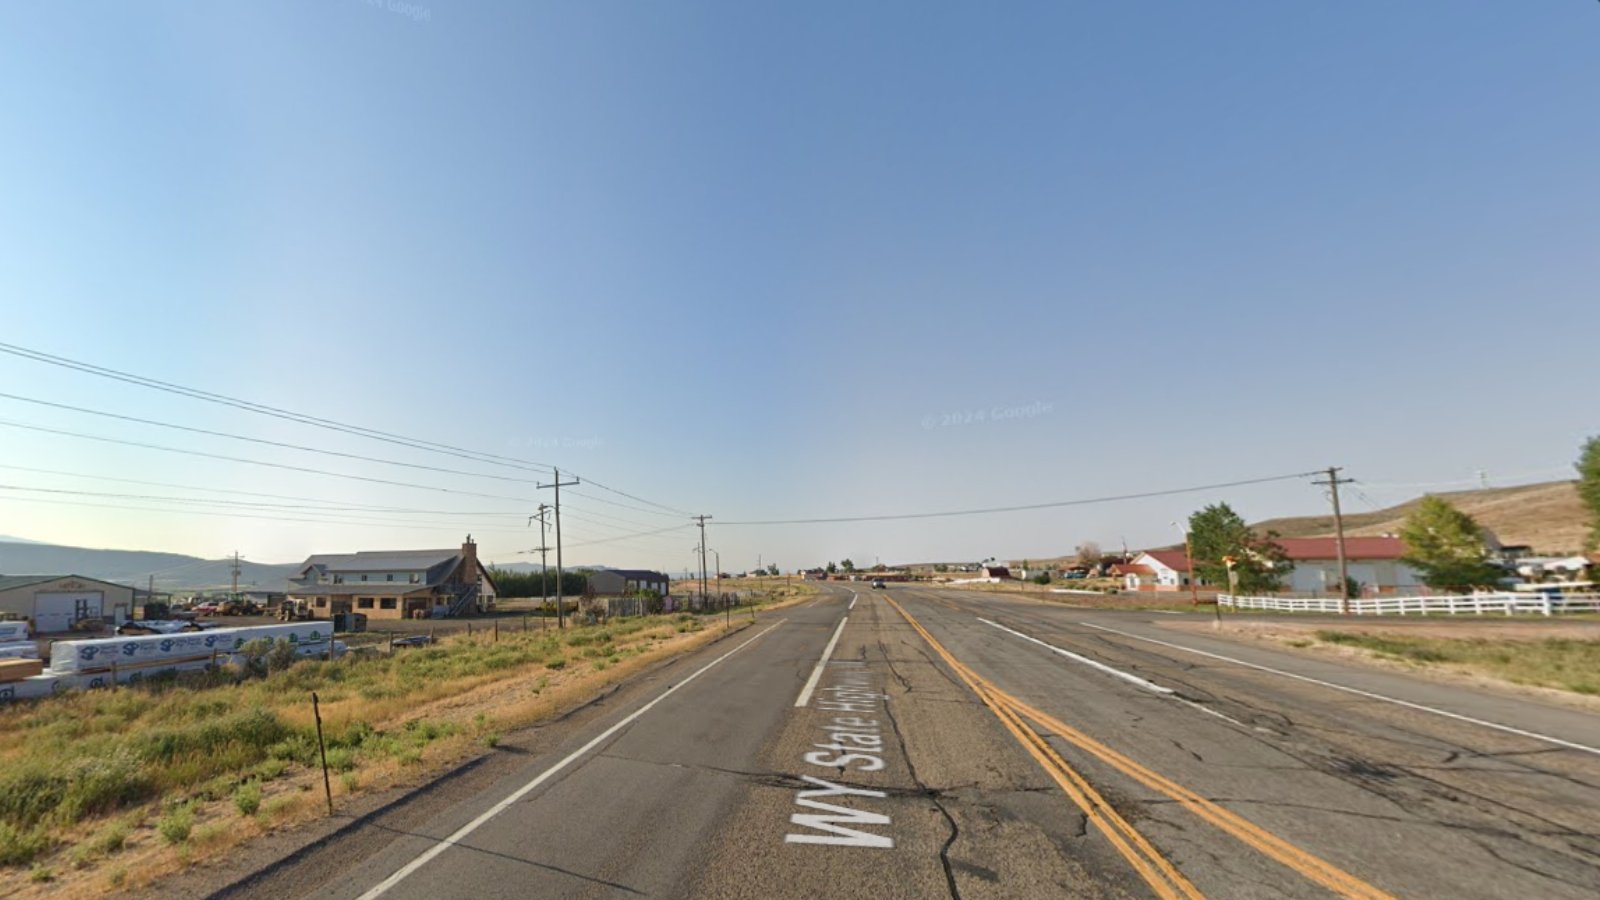
Located in Uinta County near the Utah border, Bear River is a small, quiet community with access to both the Wasatch Front and southwest Wyoming. Though less flashy than some resort towns, it offers affordability and proximity to regional jobs, recreation, and services. Its recent growth may be driven by spillover from nearby Evanston and an increasing interest in rural, accessible communities with rising appeal among remote workers and retirees alike.
With prices climbing but still below those of major hotspots, Bear River offers a rare balance of affordability and growth potential—making it a town to watch in the years ahead.
34. Lander – 92% Home Price Increase Since 2010
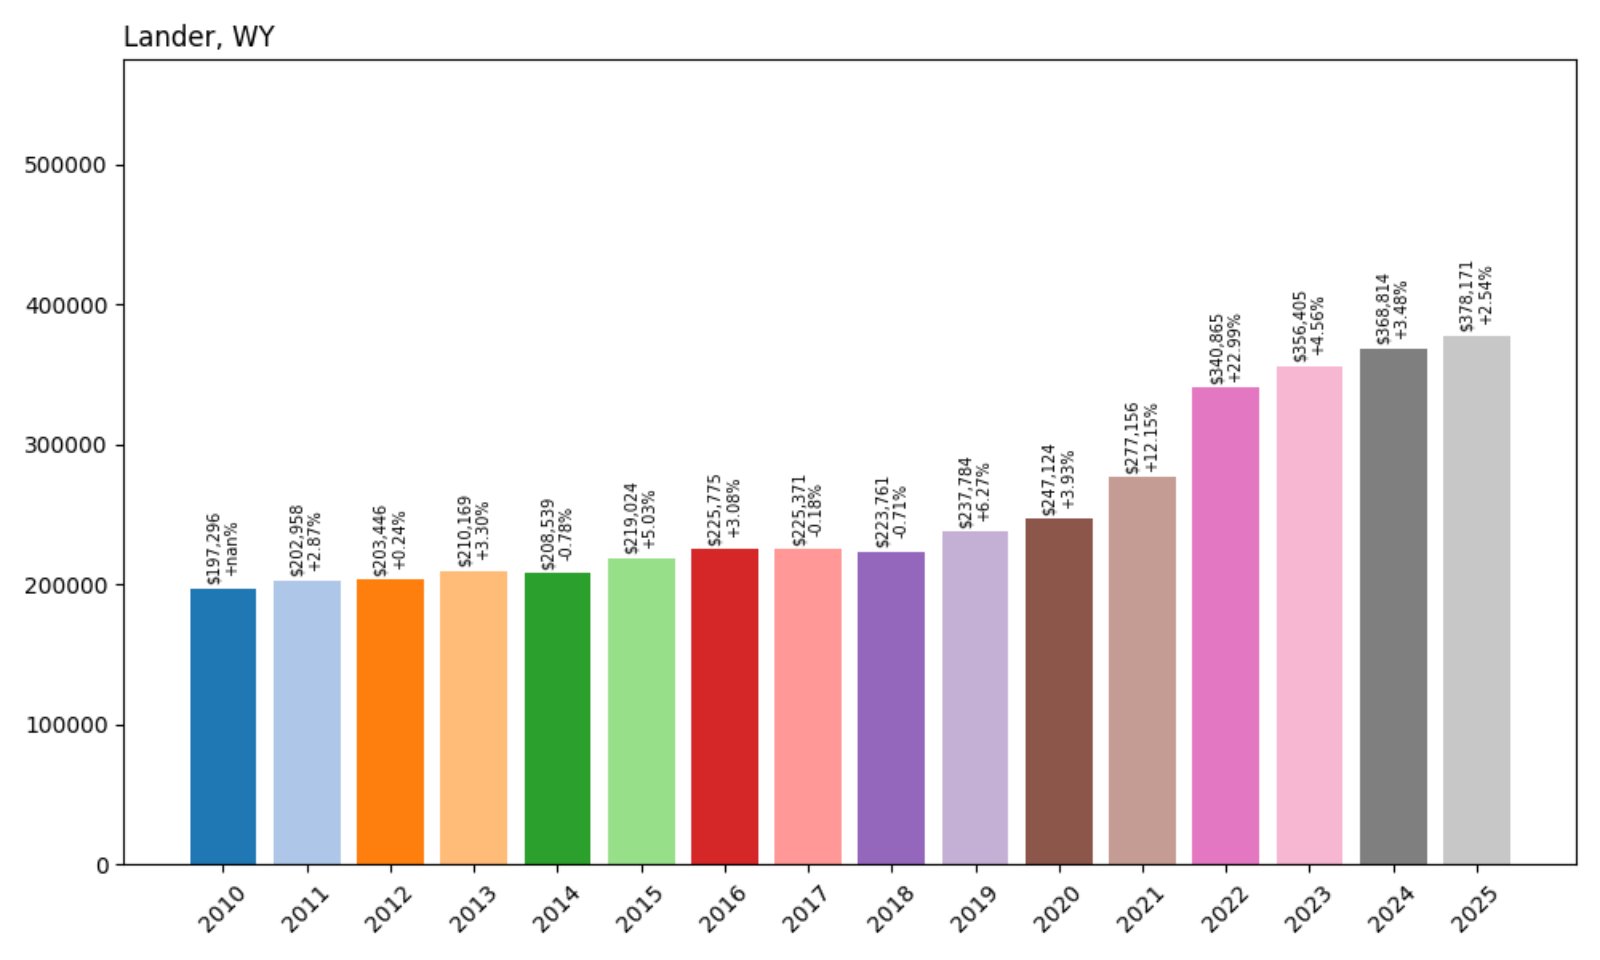
- 2010: $197,296
- 2011: $202,958 (+$5,662, +2.87% from previous year)
- 2012: $203,446 (+$488, +0.24% from previous year)
- 2013: $210,169 (+$6,723, +3.30% from previous year)
- 2014: $208,539 (−$1,630, −0.78% from previous year)
- 2015: $219,024 (+$10,485, +5.03% from previous year)
- 2016: $225,775 (+$6,750, +3.08% from previous year)
- 2017: $225,371 (−$404, −0.18% from previous year)
- 2018: $223,761 (−$1,610, −0.71% from previous year)
- 2019: $237,784 (+$14,023, +6.27% from previous year)
- 2020: $247,124 (+$9,341, +3.93% from previous year)
- 2021: $277,156 (+$30,032, +12.15% from previous year)
- 2022: $340,865 (+$63,709, +22.99% from previous year)
- 2023: $356,405 (+$15,539, +4.56% from previous year)
- 2024: $368,814 (+$12,409, +3.48% from previous year)
- 2025: $378,171 (+$9,357, +2.54% from previous year)
Since 2010, home prices in Lander have climbed nearly 92%. A slow rise early in the decade was followed by a major acceleration from 2020 onward, driven by year-after-year demand and economic tailwinds. The most explosive growth occurred between 2020 and 2022, with values rising by nearly 23% in just one year.
Lander – Outdoor Access and a Rising Market
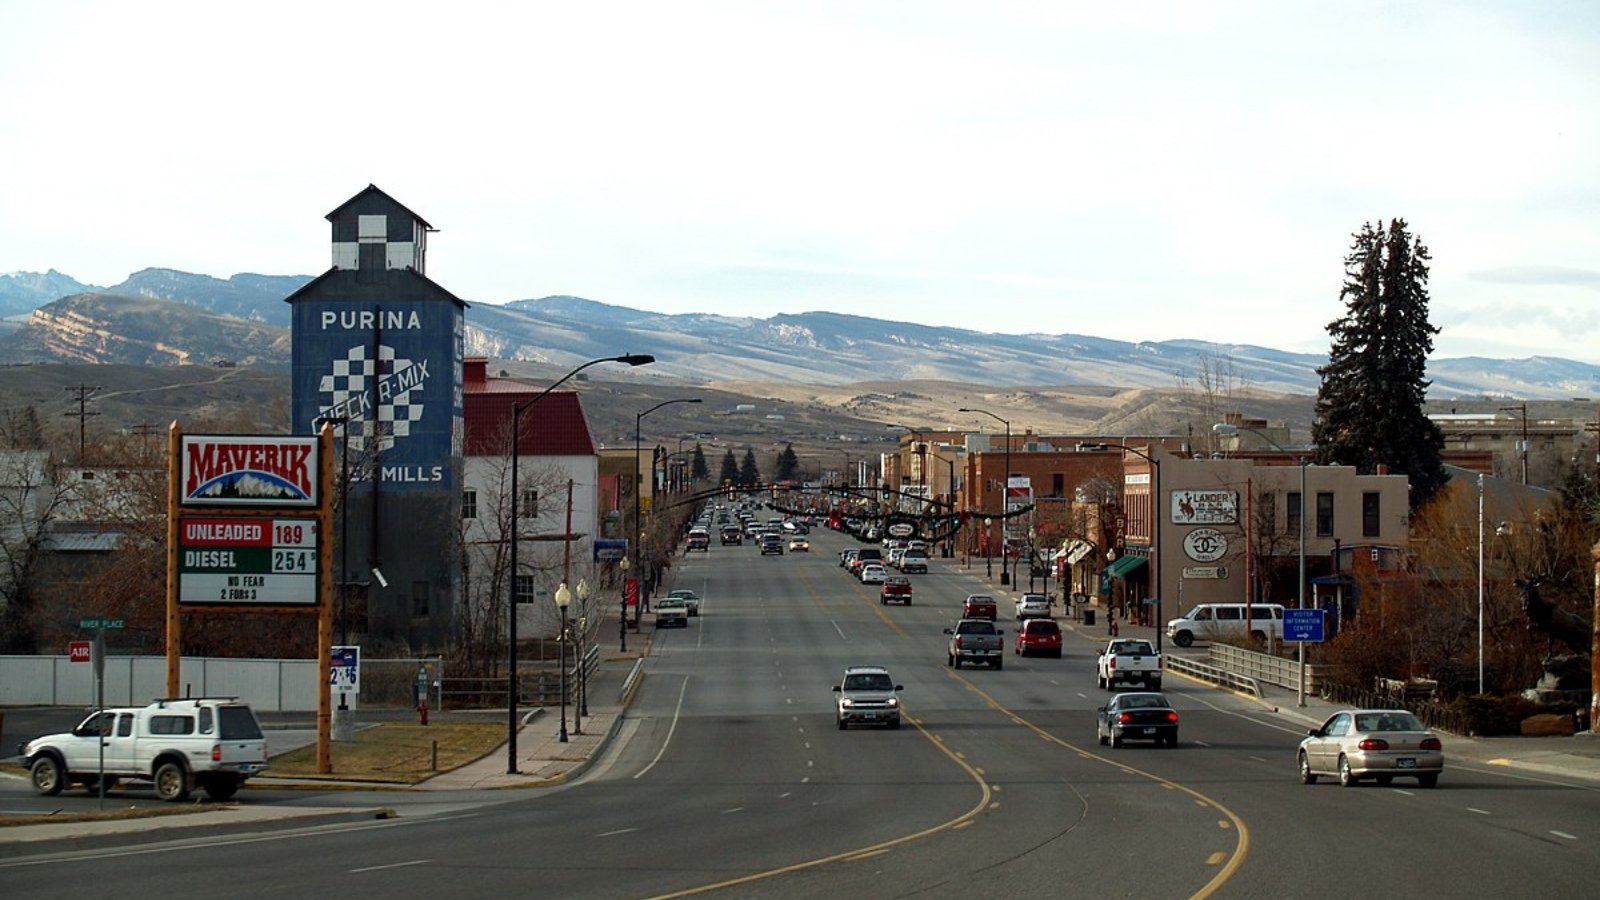
Lander, nestled at the base of the Wind River Mountains, is a gateway to vast wilderness and a hub for outdoor enthusiasts. It’s home to climbing meccas, national forests, and a thriving arts and tech scene. These lifestyle perks have helped make the town increasingly attractive to buyers looking for quality of life along with relative affordability.
The past few years have seen a wave of newcomers and returning residents driving up demand, particularly for single-family homes. Despite its growth, Lander remains more accessible than larger Wyoming towns—though that may not last forever as attention continues to grow.
33. Cheyenne – 81% Home Price Increase Since 2010
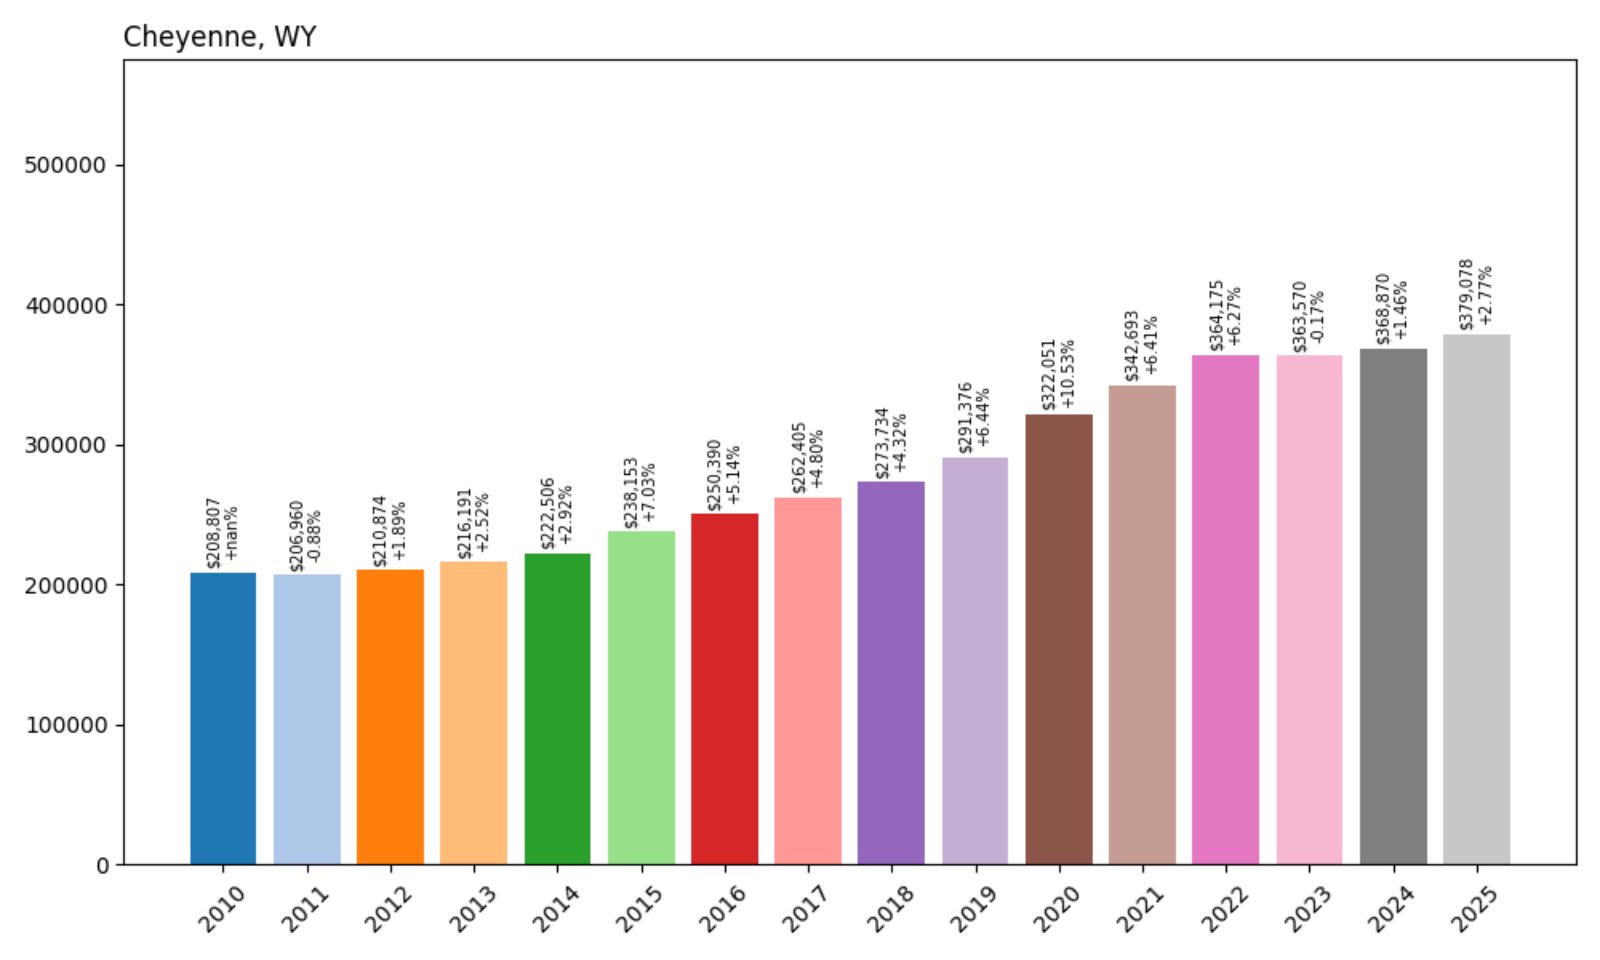
- 2010: $208,807
- 2011: $206,960 (−$1,846, −0.88% from previous year)
- 2012: $210,874 (+$3,914, +1.89% from previous year)
- 2013: $216,191 (+$5,318, +2.52% from previous year)
- 2014: $222,506 (+$6,315, +2.92% from previous year)
- 2015: $238,153 (+$15,647, +7.03% from previous year)
- 2016: $250,390 (+$12,237, +5.14% from previous year)
- 2017: $262,405 (+$12,015, +4.80% from previous year)
- 2018: $273,734 (+$11,329, +4.32% from previous year)
- 2019: $291,376 (+$17,642, +6.44% from previous year)
- 2020: $322,051 (+$30,676, +10.53% from previous year)
- 2021: $342,693 (+$20,642, +6.41% from previous year)
- 2022: $364,175 (+$21,482, +6.27% from previous year)
- 2023: $363,570 (−$605, −0.17% from previous year)
- 2024: $368,870 (+$5,299, +1.46% from previous year)
- 2025: $379,078 (+$10,208, +2.77% from previous year)
Cheyenne’s home values have grown steadily since 2010, rising by 81% over the 15-year period. Growth was especially strong from 2015 through 2021, when the market saw consistent 5–10% annual increases. While recent years have seen a slower pace, the city continues to build value year over year.
Cheyenne – The Capital’s Steady Ascent
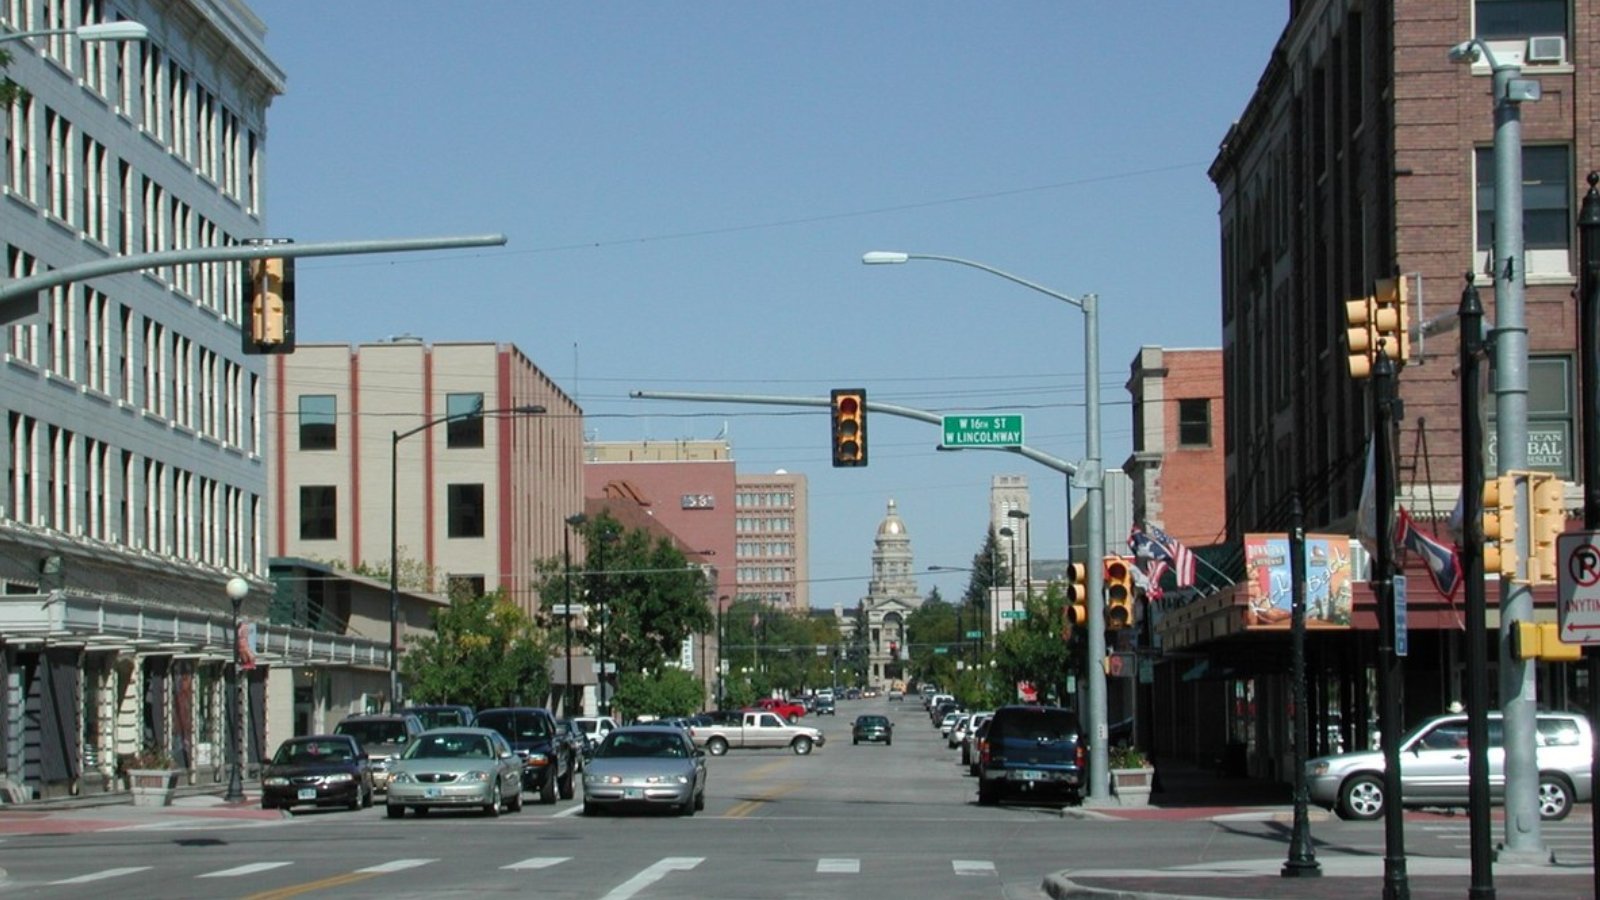
As the state capital and largest city, Cheyenne offers a blend of government jobs, access to I-80, and cultural amenities that attract residents from across the region. Its proximity to northern Colorado also makes it a convenient choice for commuters and remote workers alike.
With solid infrastructure and diverse housing stock, Cheyenne’s market has been relatively stable compared to boom-bust resort areas. This makes it appealing to families and long-term investors looking for both reliability and long-term upside.
32. Sundance – 73% Home Price Increase Since 2016
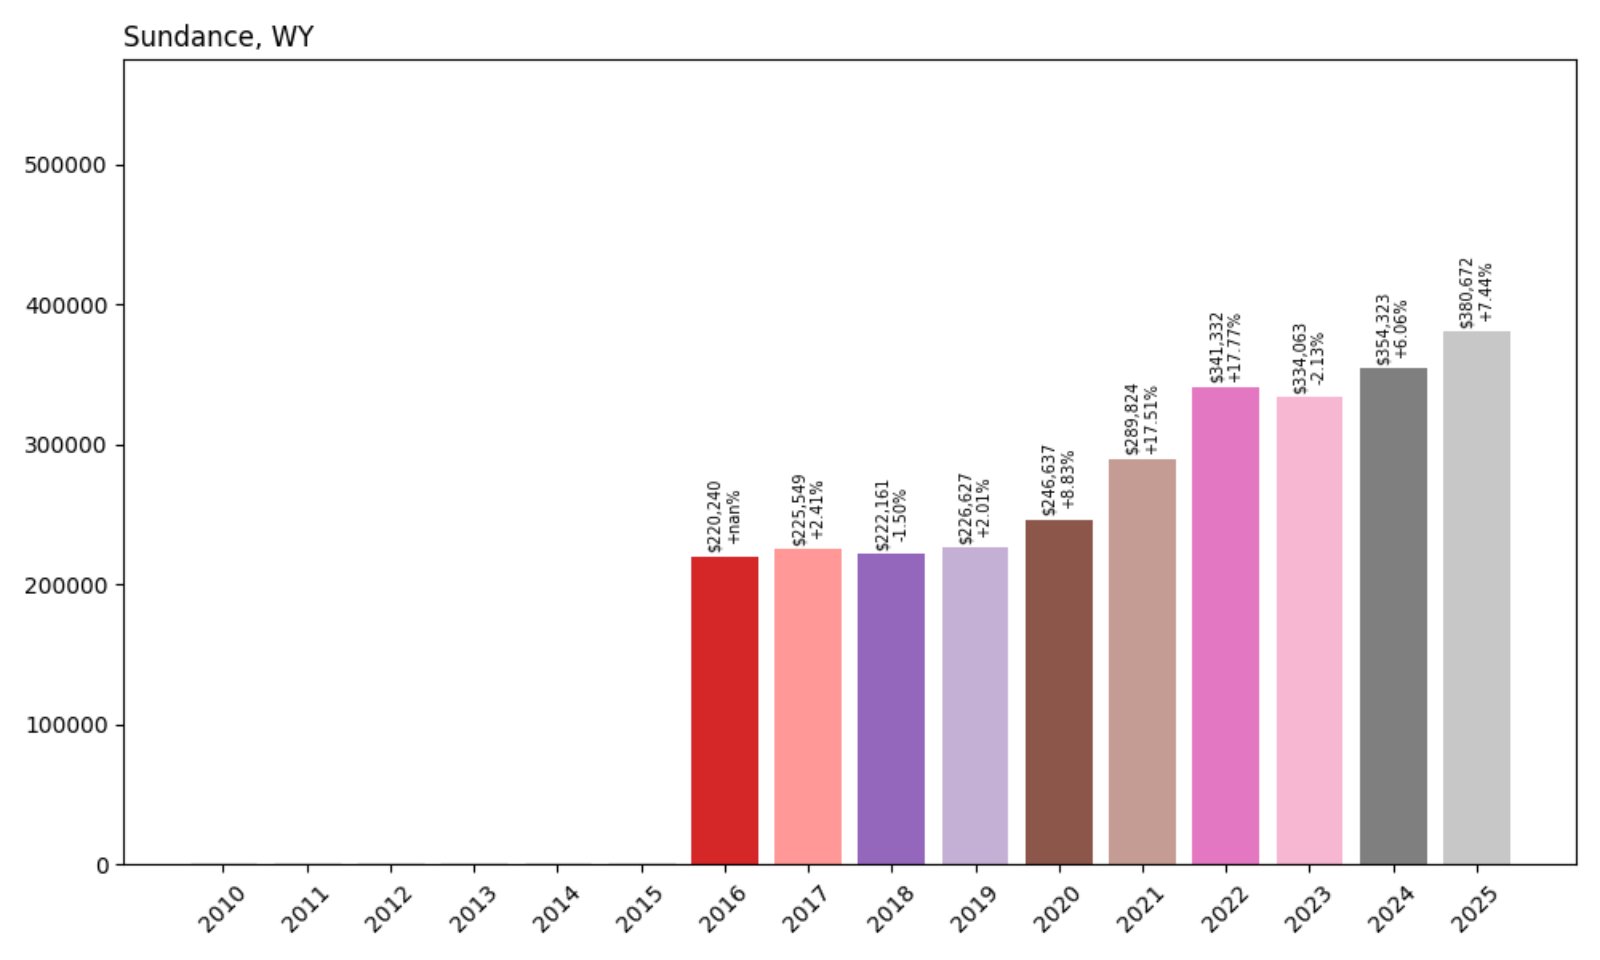
- 2016: $220,240
- 2017: $225,549 (+$5,309, +2.41% from previous year)
- 2018: $222,161 (−$3,389, −1.50% from previous year)
- 2019: $226,627 (+$4,466, +2.01% from previous year)
- 2020: $246,637 (+$20,010, +8.83% from previous year)
- 2021: $289,824 (+$43,187, +17.51% from previous year)
- 2022: $341,332 (+$51,508, +17.77% from previous year)
- 2023: $334,063 (−$7,268, −2.13% from previous year)
- 2024: $354,323 (+$20,260, +6.06% from previous year)
- 2025: $380,672 (+$26,349, +7.44% from previous year)
Sundance has experienced sharp growth since 2016, especially from 2020 to 2022, when prices jumped by more than 35% in just two years. After a small dip in 2023, prices bounced back, with healthy gains in both 2024 and 2025, bringing the total increase to 73% over the last nine years.
Sundance – Scenic and Surprisingly Competitive
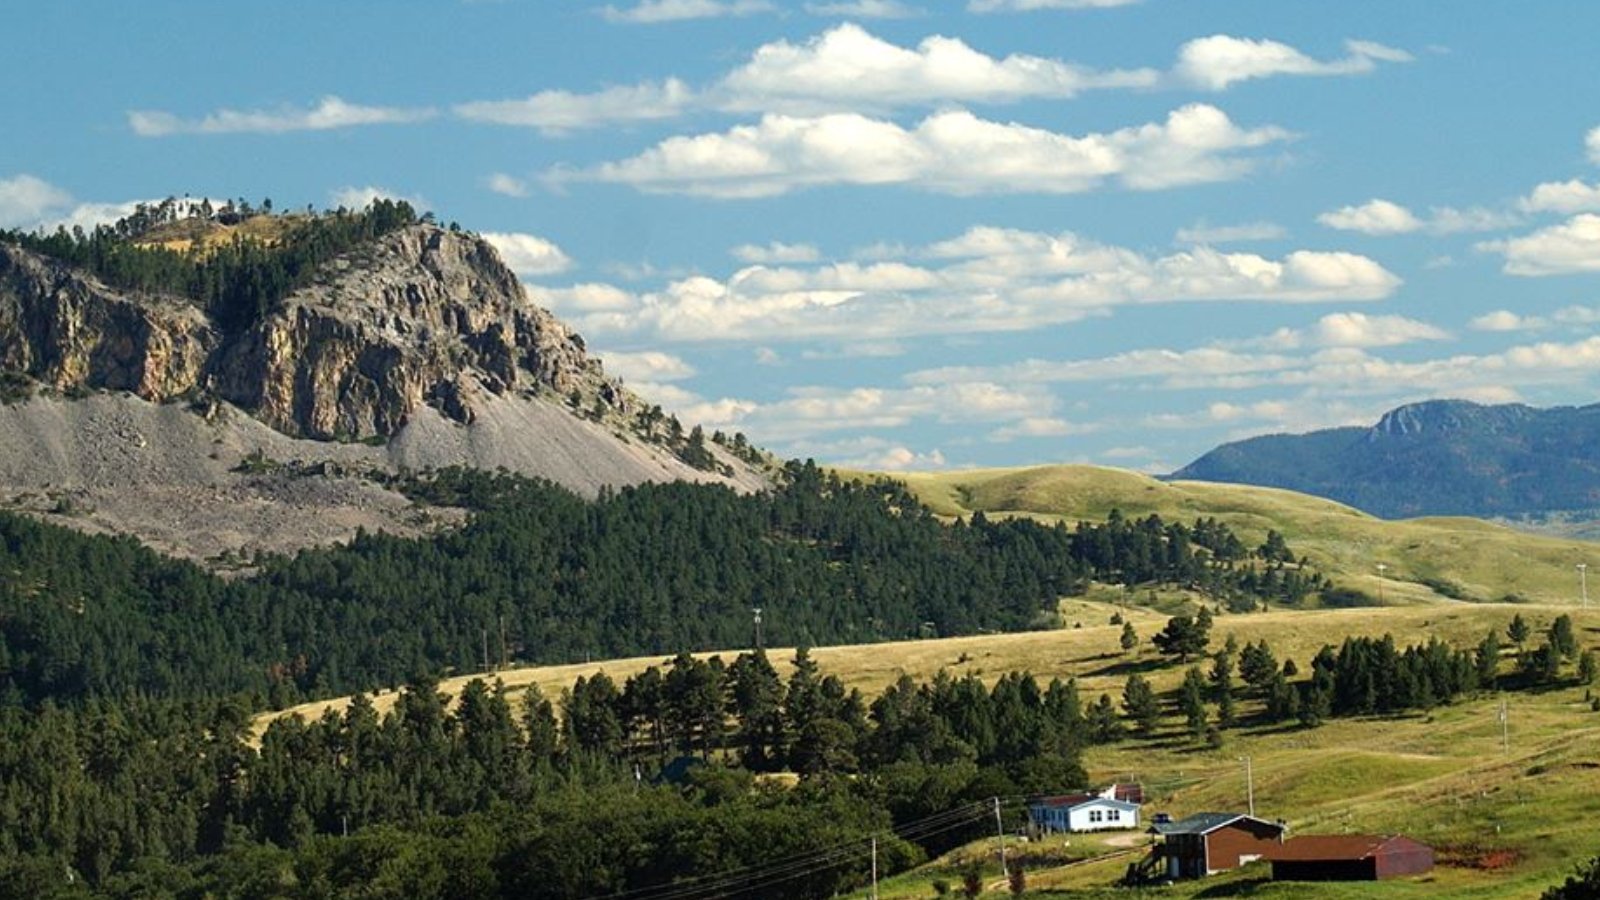
Named after the iconic Sundance Kid and surrounded by the Bear Lodge Mountains, this northeastern Wyoming town has long been known for its history and views. But in recent years, it’s also become known for rising real estate values, as buyers seek quieter alternatives to pricier hotspots.
Its location near the Black Hills and easy access to South Dakota markets have added appeal. With new construction and demand continuing in 2025, Sundance may be climbing the affordability ladder faster than some expect.
31. Laramie – 94% Home Price Increase Since 2010
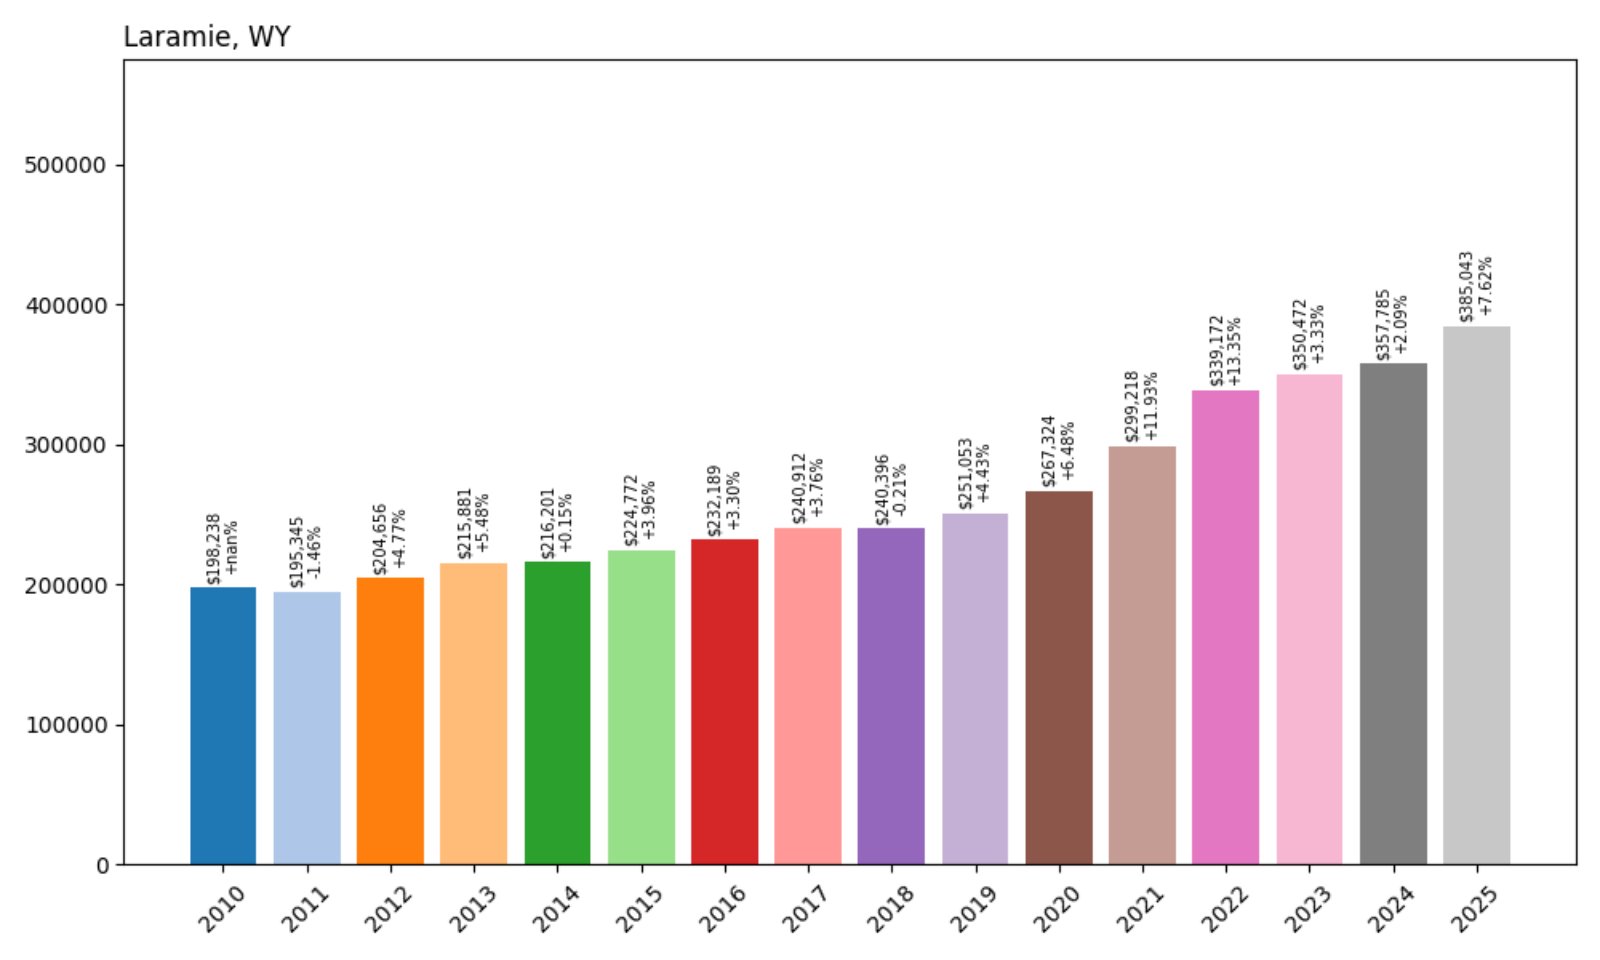
- 2010: $198,238
- 2011: $195,345 (−$2,893, −1.46% from previous year)
- 2012: $204,656 (+$9,311, +4.77% from previous year)
- 2013: $215,881 (+$11,224, +5.48% from previous year)
- 2014: $216,201 (+$320, +0.15% from previous year)
- 2015: $224,772 (+$8,572, +3.96% from previous year)
- 2016: $232,189 (+$7,417, +3.30% from previous year)
- 2017: $240,912 (+$8,723, +3.76% from previous year)
- 2018: $240,396 (−$516, −0.21% from previous year)
- 2019: $251,053 (+$10,658, +4.43% from previous year)
- 2020: $267,324 (+$16,271, +6.48% from previous year)
- 2021: $299,218 (+$31,894, +11.93% from previous year)
- 2022: $339,172 (+$39,954, +13.35% from previous year)
- 2023: $350,472 (+$11,300, +3.33% from previous year)
- 2024: $357,785 (+$7,314, +2.09% from previous year)
- 2025: $385,043 (+$27,257, +7.62% from previous year)
Home prices in Laramie have nearly doubled since 2010, with a 94% increase over 15 years. While the early part of the decade showed steady but modest growth, the market gained significant traction starting in 2020. Since then, prices have surged in multiple waves, especially in 2021 and 2022.
Laramie – A College Town With Expanding Appeal
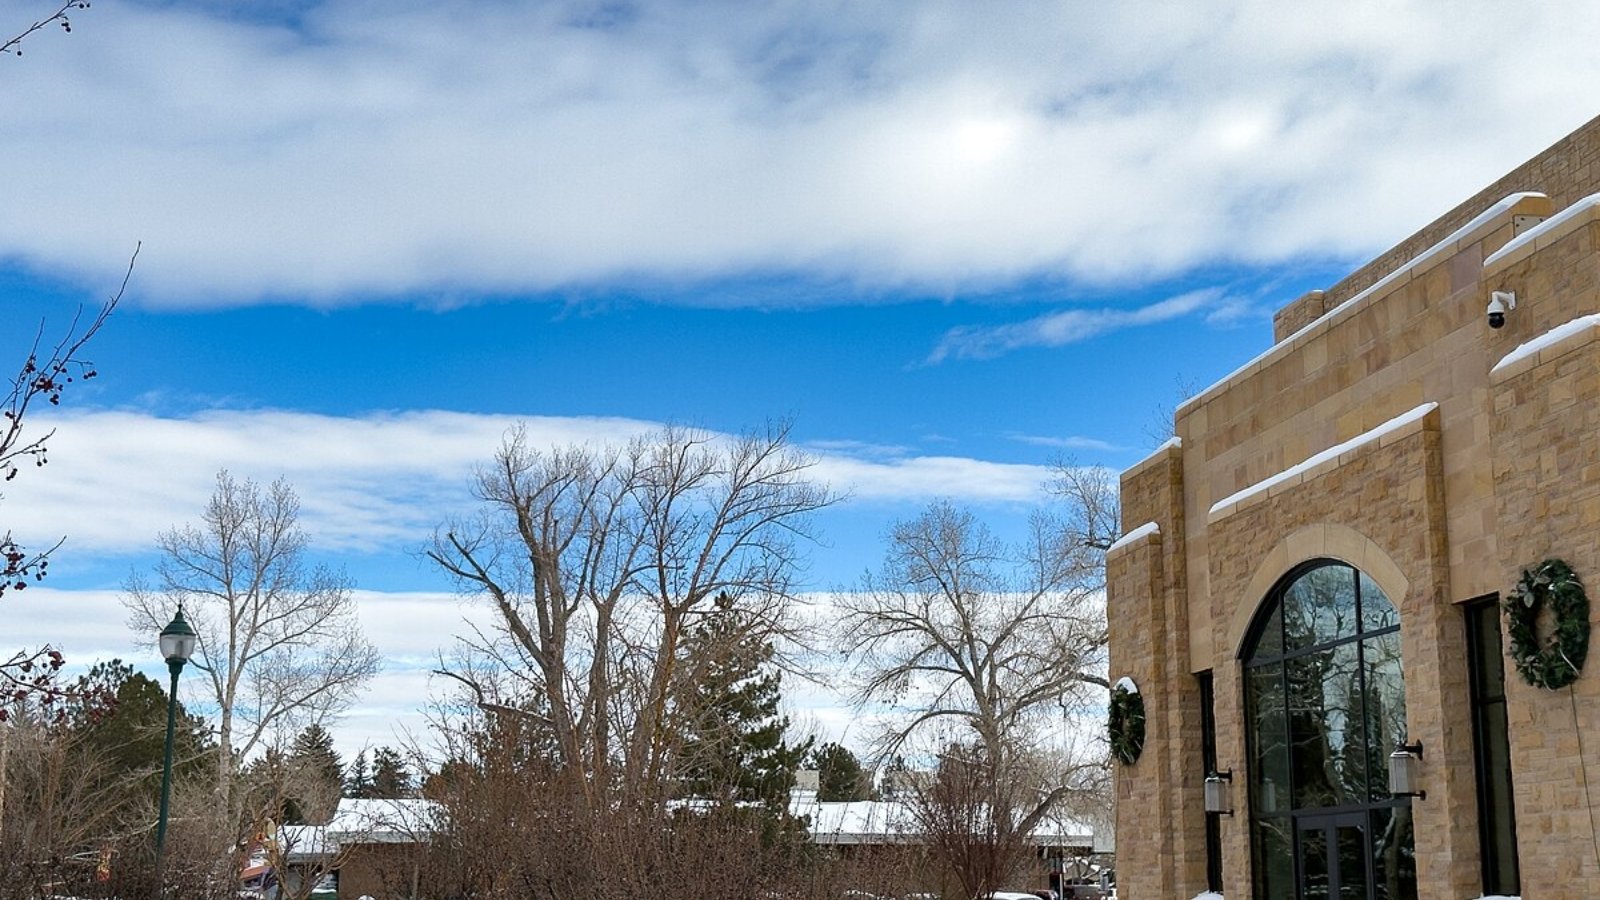
Home to the University of Wyoming, Laramie has long been known for its student-driven housing market. But over the past decade, its appeal has expanded beyond college ties. Young professionals, faculty, and retirees have all helped fuel demand for homes in the area, particularly in newer subdivisions and downtown remodels.
The town’s relative affordability compared to Boulder or Fort Collins, paired with its mountain access and growing cultural scene, continues to attract buyers from across the region. That demand is now reflected in its rising home values, which have turned Laramie into one of Wyoming’s most watched markets.
30. Kaycee – 39% Home Price Increase Since 2021
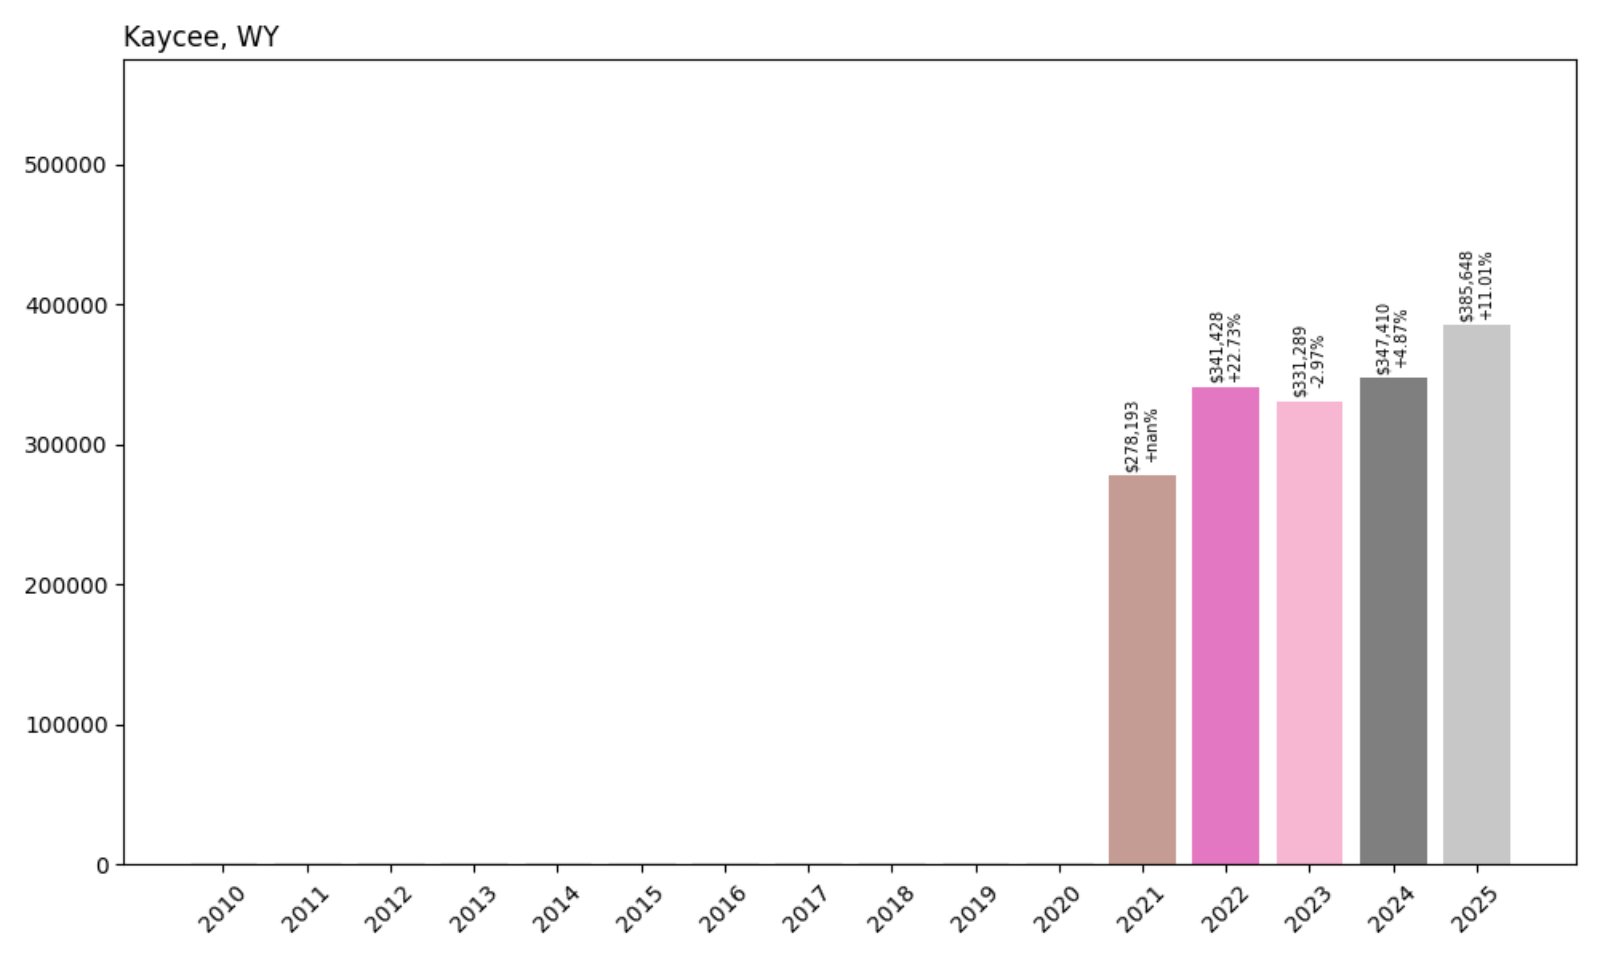
- 2021: $278,193
- 2022: $341,428 (+$63,235, +22.73% from previous year)
- 2023: $331,289 (−$10,139, −2.97% from previous year)
- 2024: $347,410 (+$16,121, +4.87% from previous year)
- 2025: $385,648 (+$38,238, +11.01% from previous year)
In just four years, Kaycee has posted a strong 39% gain in home values. The biggest leap came in 2022, with a jump of nearly 23%. Despite a temporary dip in 2023, prices have rebounded sharply in the past two years, suggesting strong underlying demand in this small town market.
Kaycee – Small Town, Big Moves in Price
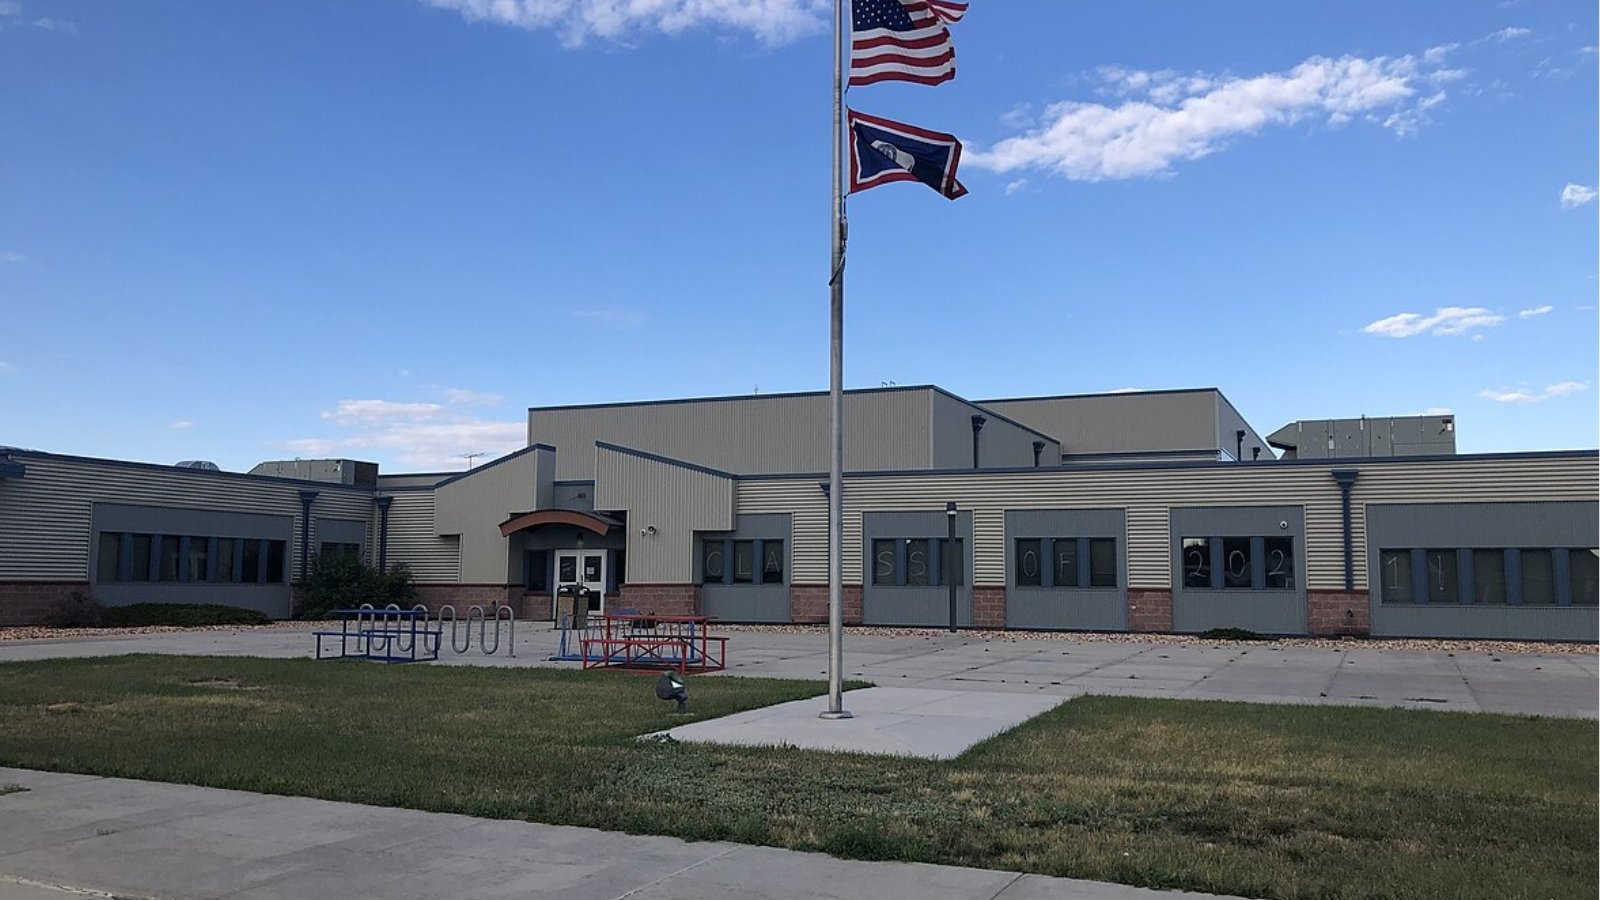
Kaycee is one of the smallest towns on this list, but its home values are moving like those in much bigger markets. Located in Johnson County along I-25, it has become increasingly attractive to buyers who want rural living without being isolated from regional hubs like Casper or Buffalo.
Its historic ties to Wyoming’s ranching heritage and open spaces have made it appealing to a new wave of buyers, particularly those looking for land and flexibility. As home inventory remains tight, Kaycee’s modest housing stock may continue to push values upward in the near future.
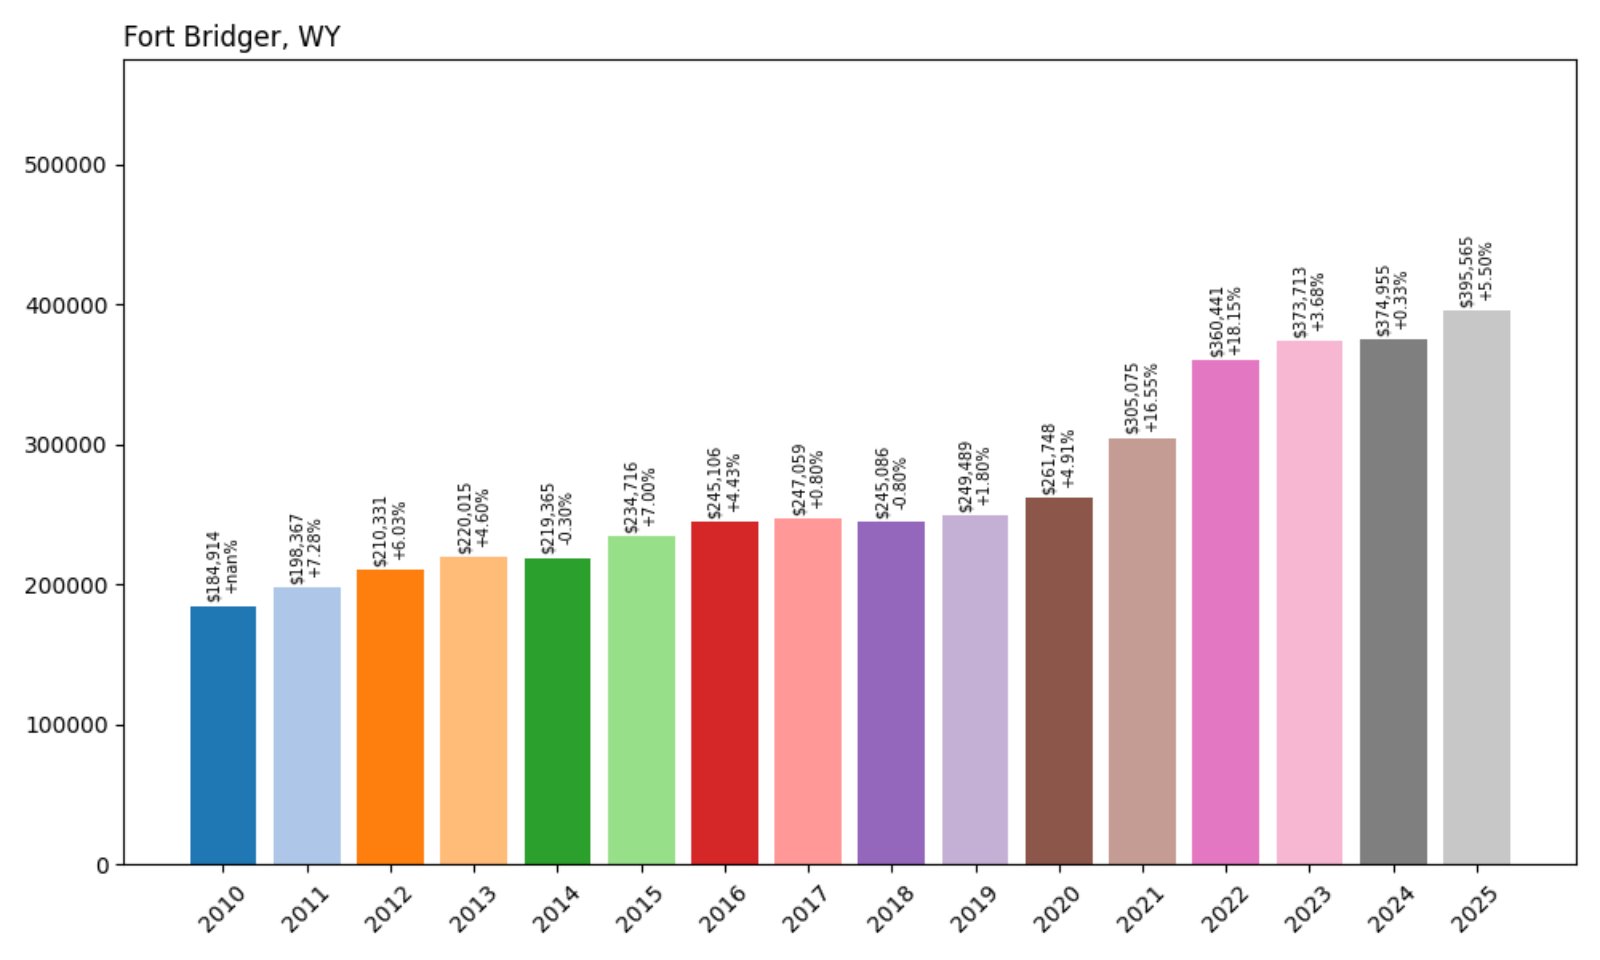
29. Fort Bridger – 114% Home Price Increase Since 2010
🔥 Would you like to save this?
- 2010: $184,914
- 2011: $198,367 (+$13,453, +7.28% from previous year)
- 2012: $210,331 (+$11,964, +6.03% from previous year)
- 2013: $220,015 (+$9,683, +4.60% from previous year)
- 2014: $219,365 (−$649, −0.30% from previous year)
- 2015: $234,716 (+$15,351, +7.00% from previous year)
- 2016: $245,106 (+$10,390, +4.43% from previous year)
- 2017: $247,059 (+$1,954, +0.80% from previous year)
- 2018: $245,086 (−$1,974, −0.80% from previous year)
- 2019: $249,489 (+$4,403, +1.80% from previous year)
- 2020: $261,748 (+$12,259, +4.91% from previous year)
- 2021: $305,075 (+$43,327, +16.55% from previous year)
- 2022: $360,441 (+$55,367, +18.15% from previous year)
- 2023: $373,713 (+$13,272, +3.68% from previous year)
- 2024: $374,955 (+$1,241, +0.33% from previous year)
- 2025: $395,565 (+$20,610, +5.50% from previous year)
Fort Bridger has seen home values more than double since 2010, increasing by 114%. The biggest jumps came post-2020, especially in 2021 and 2022, when the town followed broader trends of rural demand and real estate tightening across the West.
Fort Bridger – A Historic Outpost With Rising Value
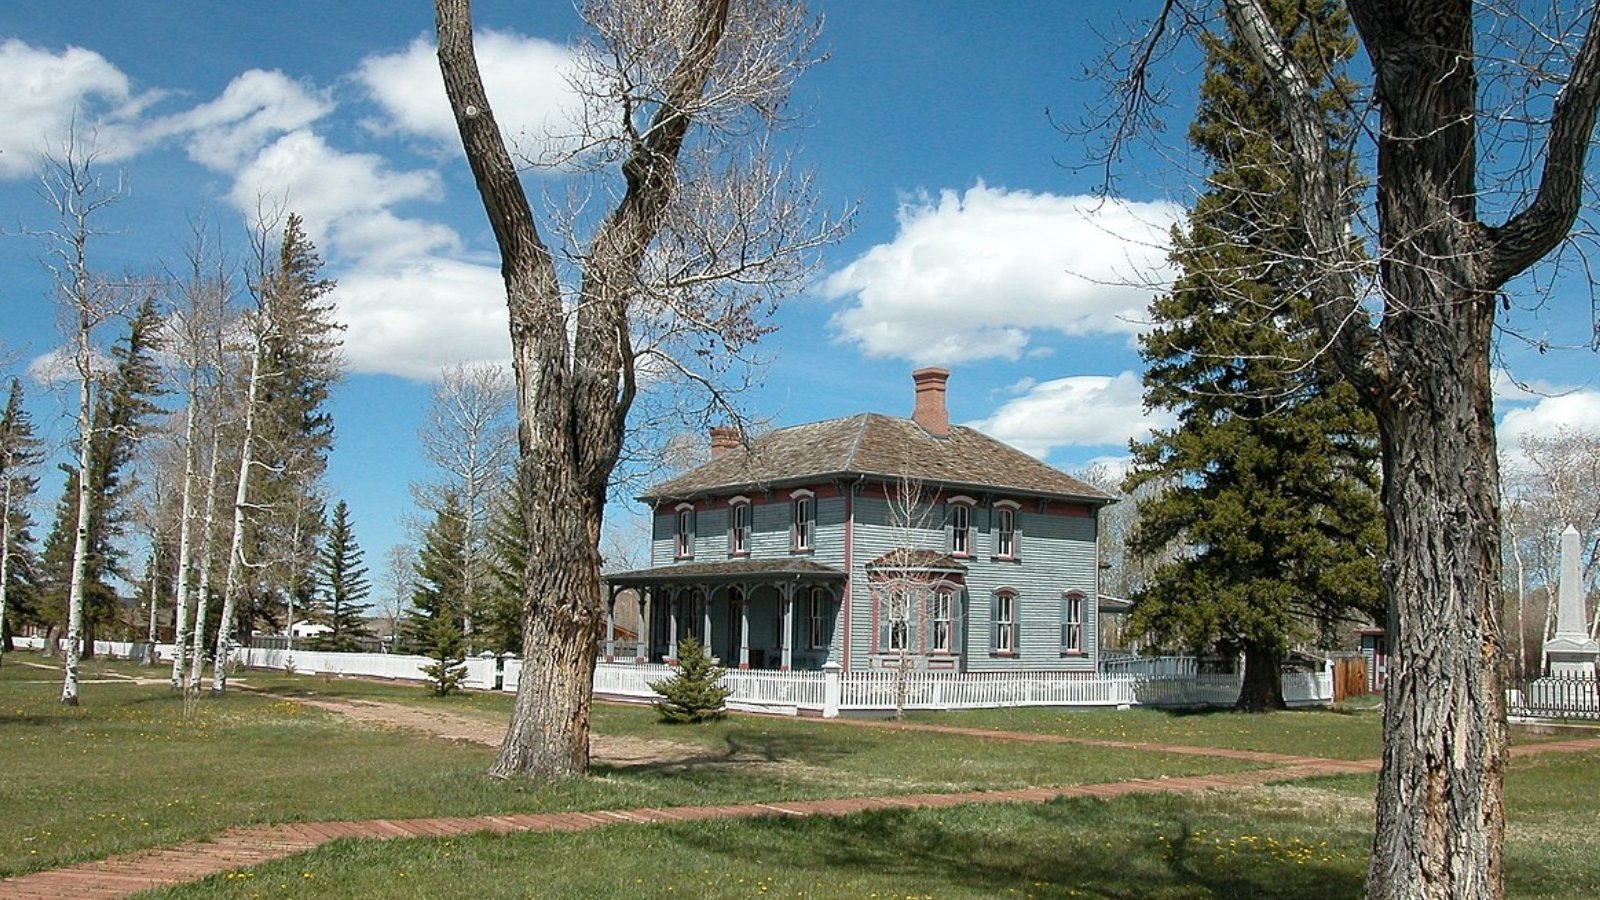
Best known for its 19th-century military fort, Fort Bridger has transformed from a history stop into a town where home values are climbing rapidly. With its location in Uinta County near the Utah border, it’s gained attention from cross-state commuters and investors alike.
Affordability relative to Salt Lake City and Evanston has made Fort Bridger a convenient alternative for buyers priced out of urban centers. As more people turn to small towns for permanent living, its blend of heritage and affordability continues to draw interest.
28. Hulett – 89% Home Price Increase Since 2016

- 2016: $211,250
- 2017: $210,361 (−$888, −0.42% from previous year)
- 2018: $217,541 (+$7,180, +3.41% from previous year)
- 2019: $220,438 (+$2,897, +1.33% from previous year)
- 2020: $234,890 (+$14,452, +6.56% from previous year)
- 2021: $274,851 (+$39,961, +17.01% from previous year)
- 2022: $342,328 (+$67,476, +24.55% from previous year)
- 2023: $337,969 (−$4,359, −1.27% from previous year)
- 2024: $358,809 (+$20,840, +6.17% from previous year)
- 2025: $399,997 (+$41,188, +11.48% from previous year)
Since 2016, home prices in Hulett have surged by nearly 90%, propelled by back-to-back gains from 2020 to 2022 and another strong increase in 2025. Even with a slight dip in 2023, the market remains on a sharp upward path, indicating sustained interest in this northeastern town.
Hulett – Devil’s Tower Views and Steep Price Gains
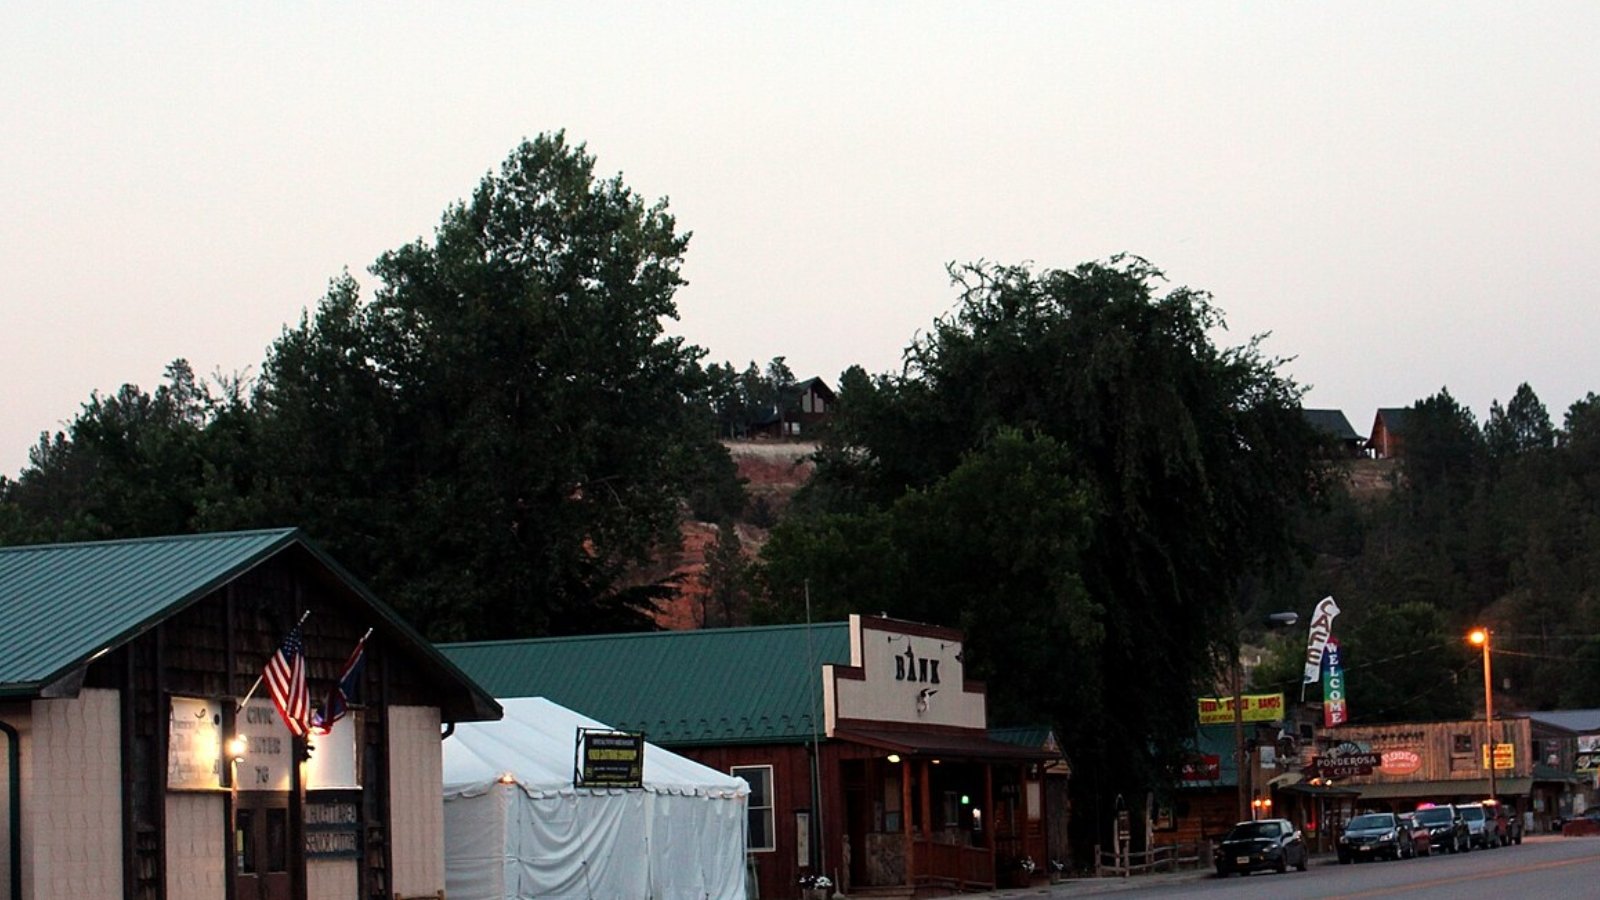
Hulett is tucked near Wyoming’s iconic Devil’s Tower, and that proximity may be contributing to its growing housing demand. As tourism draws attention to the region, Hulett has become a place where visitors increasingly look to stay long-term—either seasonally or permanently.
The town remains small and remote, but that’s part of its charm. Buyers seeking views, privacy, and connection to nature are helping drive demand, making Hulett one of the state’s more surprising real estate climbers.
27. Shell – 68% Home Price Increase Since 2019

- 2019: $238,789
- 2020: $237,662 (−$1,127, −0.47% from previous year)
- 2021: $288,226 (+$50,565, +21.28% from previous year)
- 2022: $348,557 (+$60,331, +20.93% from previous year)
- 2023: $349,843 (+$1,286, +0.37% from previous year)
- 2024: $366,678 (+$16,835, +4.81% from previous year)
- 2025: $402,299 (+$35,621, +9.71% from previous year)
Home values in Shell have grown by 68% since 2019, driven largely by massive gains in 2021 and 2022. While growth slowed slightly in 2023, it picked up again through 2025, pushing the town’s average home value above the $400K mark.
Shell – Rising Values in a Remote Western Gateway

Shell sits at the western edge of the Bighorn Mountains and is one of Wyoming’s more remote communities. Its stunning scenery, quiet surroundings, and access to recreation have attracted a niche group of buyers, including retirees and vacation-home seekers.
Though small in population, Shell’s property market has seen outsized gains in recent years. As inventory remains tight, and interest in rural living stays high, prices in Shell may continue their upward trend—especially for homes with land or views.
26. Buffalo – 101% Home Price Increase Since 2010

- 2010: $203,783
- 2011: $200,875 (−$2,908, −1.43% from previous year)
- 2012: $202,507 (+$1,632, +0.81% from previous year)
- 2013: $217,464 (+$14,958, +7.39% from previous year)
- 2014: $217,494 (+$29, +0.01% from previous year)
- 2015: $232,217 (+$14,723, +6.77% from previous year)
- 2016: $245,225 (+$13,008, +5.60% from previous year)
- 2017: $246,604 (+$1,379, +0.56% from previous year)
- 2018: $251,429 (+$4,826, +1.96% from previous year)
- 2019: $263,845 (+$12,415, +4.94% from previous year)
- 2020: $274,657 (+$10,813, +4.10% from previous year)
- 2021: $315,997 (+$41,340, +15.05% from previous year)
- 2022: $372,641 (+$56,644, +17.93% from previous year)
- 2023: $381,663 (+$9,022, +2.42% from previous year)
- 2024: $389,688 (+$8,025, +2.10% from previous year)
- 2025: $409,977 (+$20,289, +5.21% from previous year)
Buffalo’s home prices have more than doubled since 2010, with particularly strong gains from 2020 through 2022. Even as the pace of growth slowed recently, the town continued to post healthy annual increases through 2025.
Buffalo – Gateway to the Bighorns With Big Growth

Buffalo is one of Wyoming’s most charming small towns, located at the foot of the Bighorn Mountains. It’s a hub for travelers heading into the national forest and a popular place for retirees and families looking for a slower pace of life without sacrificing community resources.
The local housing market has benefited from its desirable location and appealing mix of walkable neighborhoods, historic sites, and nearby outdoor adventure. As demand has grown, so too have home values—making Buffalo an increasingly expensive place to buy in north-central Wyoming.
25. Antelope Valley-Crestview – 74% Home Price Increase Since 2010
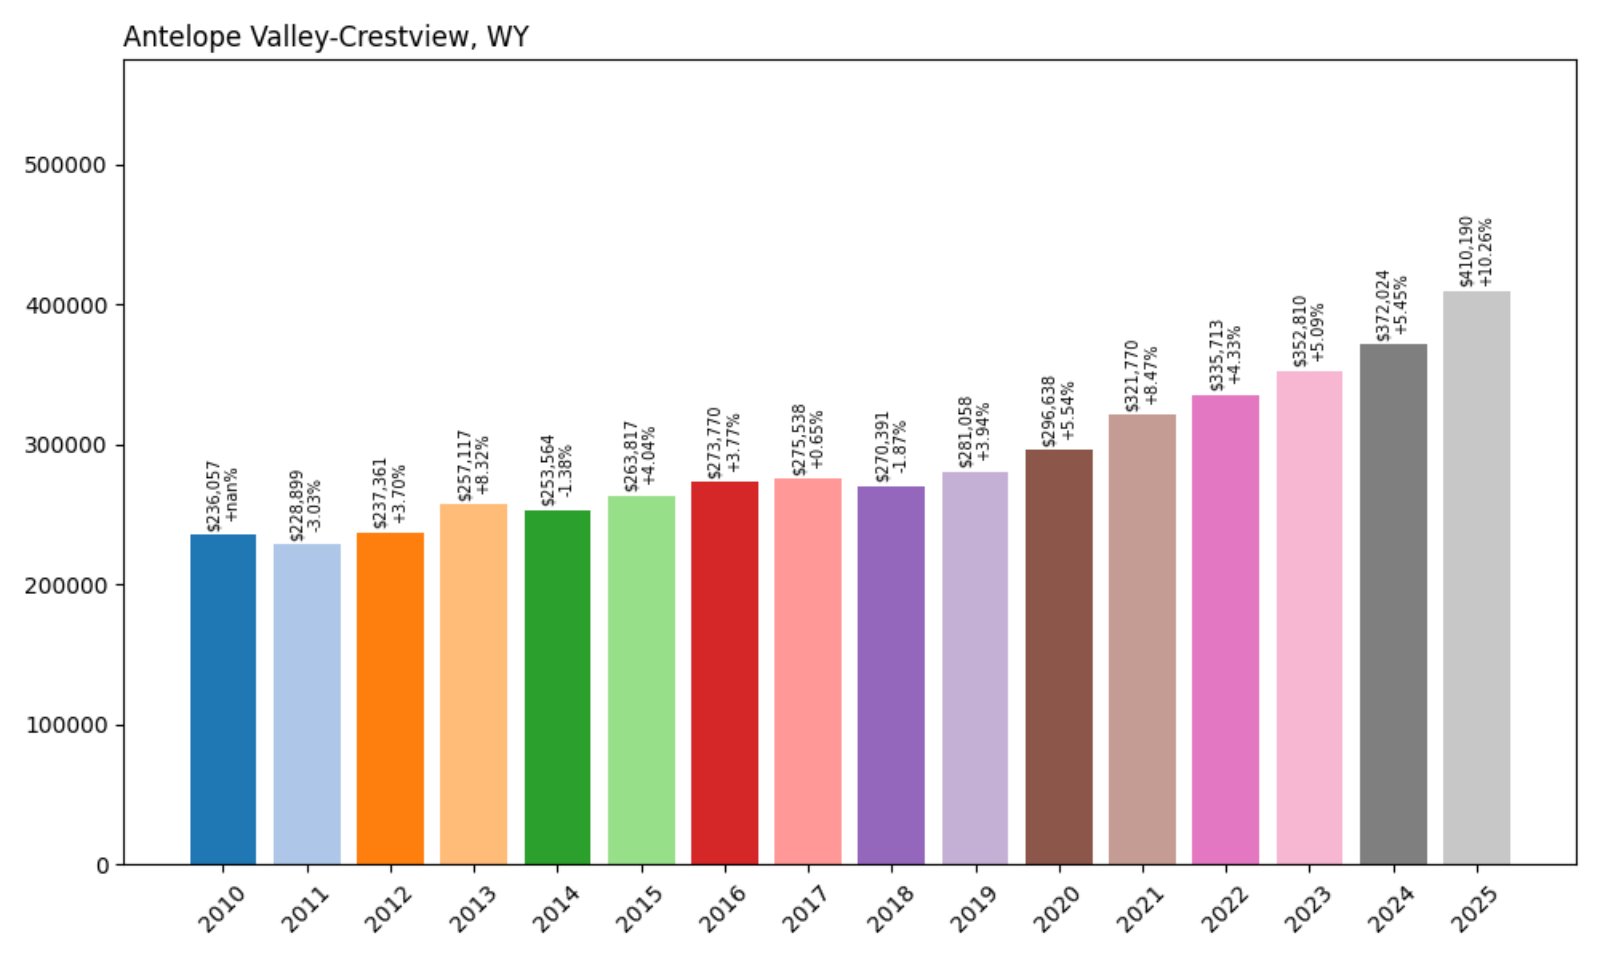
- 2010: $236,057
- 2011: $228,899 (−$7,158, −3.03% from previous year)
- 2012: $237,361 (+$8,462, +3.70% from previous year)
- 2013: $257,117 (+$19,756, +8.32% from previous year)
- 2014: $253,564 (−$3,553, −1.38% from previous year)
- 2015: $263,817 (+$10,253, +4.04% from previous year)
- 2016: $273,770 (+$9,953, +3.77% from previous year)
- 2017: $275,538 (+$1,768, +0.65% from previous year)
- 2018: $270,391 (−$5,147, −1.87% from previous year)
- 2019: $281,058 (+$10,667, +3.94% from previous year)
- 2020: $296,638 (+$15,580, +5.54% from previous year)
- 2021: $321,770 (+$25,132, +8.47% from previous year)
- 2022: $335,713 (+$13,942, +4.33% from previous year)
- 2023: $352,810 (+$17,098, +5.09% from previous year)
- 2024: $372,024 (+$19,213, +5.45% from previous year)
- 2025: $410,190 (+$38,166, +10.26% from previous year)
Antelope Valley-Crestview has experienced a 74% rise in home values since 2010, with especially strong growth over the last three years. Recent double-digit gains reflect renewed interest in this Cheyenne-area suburb.
Antelope Valley-Crestview – Suburban Gains Near the Capital

Located just northwest of Cheyenne, Antelope Valley-Crestview offers a blend of suburban space and quick access to city amenities. That combination has made it a popular choice for families and professionals seeking larger lots and newer homes without leaving Laramie County.
Its proximity to F.E. Warren Air Force Base and Cheyenne’s job market adds to its stability, while lower density and scenic views give it an edge in today’s housing market. Recent value jumps suggest this community is no longer flying under the radar.
24. Burlington – 62% Home Price Increase Since 2019
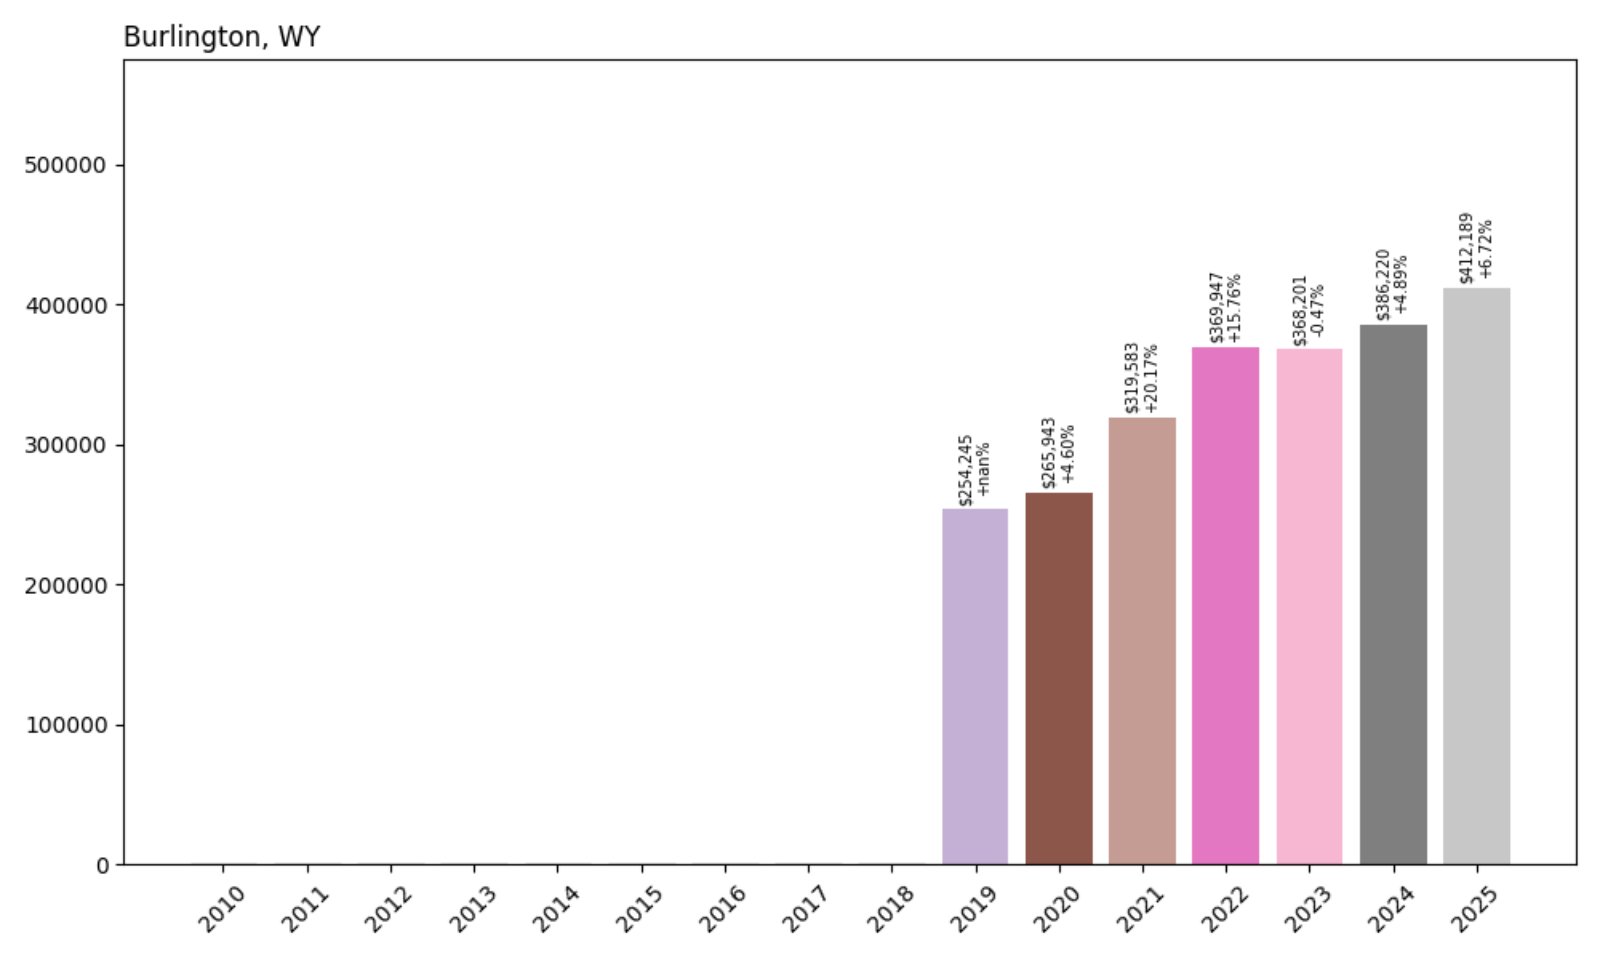
- 2019: $254,245
- 2020: $265,943 (+$11,698, +4.60% from previous year)
- 2021: $319,583 (+$53,641, +20.17% from previous year)
- 2022: $369,947 (+$50,363, +15.76% from previous year)
- 2023: $368,201 (−$1,745, −0.47% from previous year)
- 2024: $386,220 (+$18,019, +4.89% from previous year)
- 2025: $412,189 (+$25,968, +6.72% from previous year)
Burlington’s housing market has seen a 62% jump in prices since 2019. The most explosive growth happened during 2021 and 2022, though prices have continued to rise steadily through 2025 after a minor correction in 2023.
Burlington – Agricultural Roots Meet Modern Growth
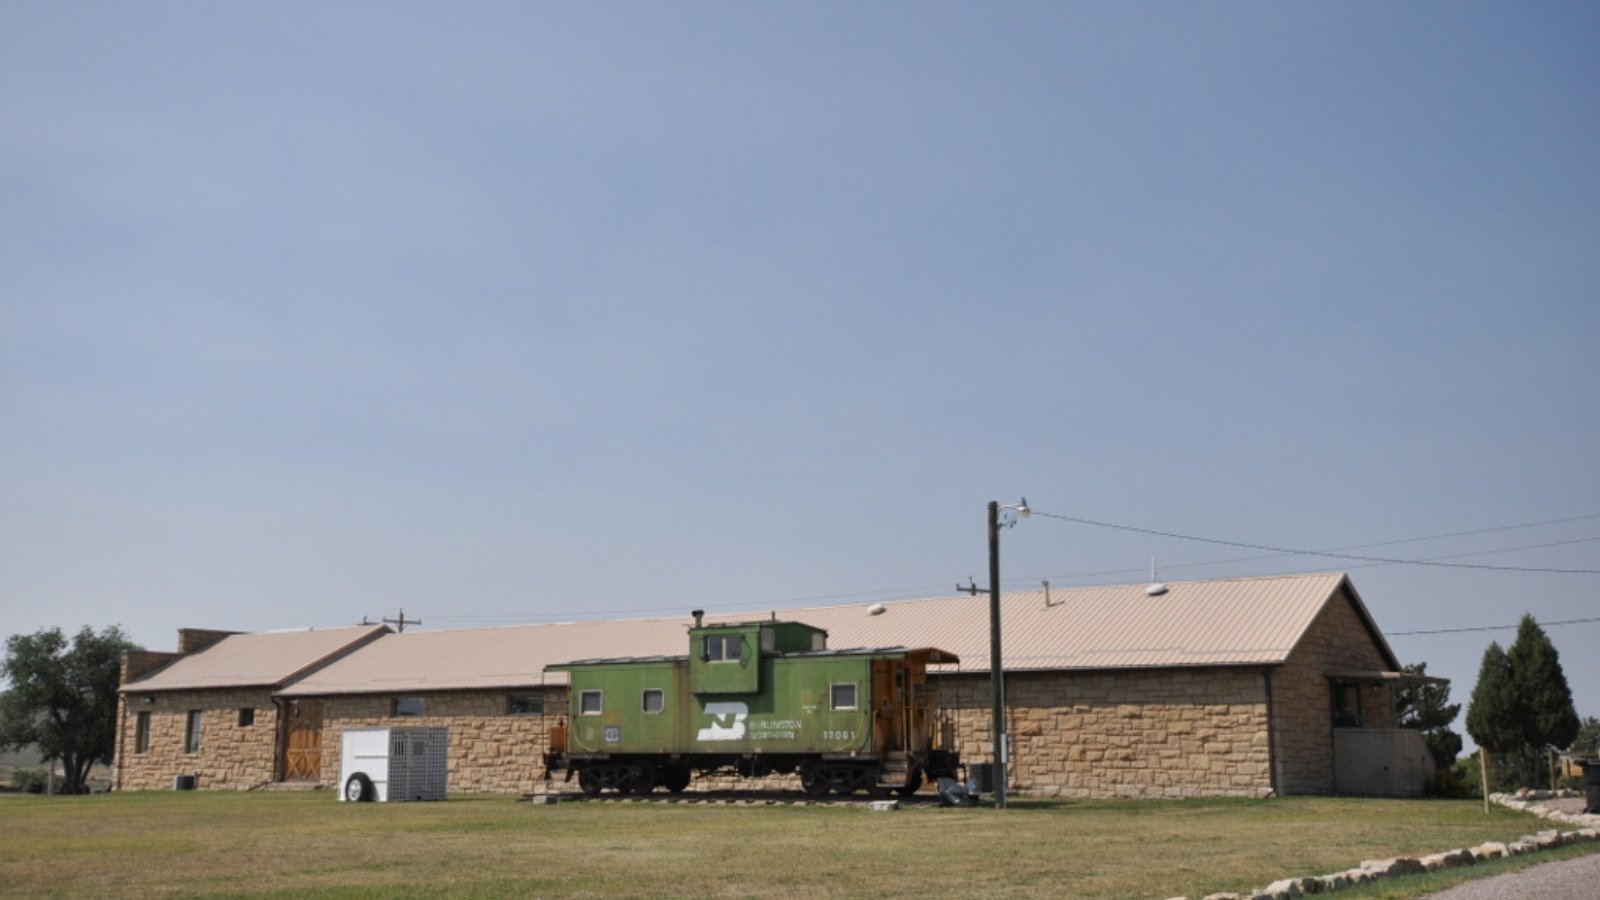
This small town in Big Horn County is primarily known for its agricultural background, but Burlington has seen a shift as newcomers explore quieter places to settle down. With a stable school system and strong community ties, the town has become an attractive option for buyers looking for space and affordability.
The market remains small, but increasing interest in rural lifestyle and land ownership is making Burlington one of the quieter success stories in Wyoming’s real estate landscape.
23. Farson – 59% Home Price Increase Since 2012

🔥 Would you like to save this?
- 2012: $262,183
- 2013: $295,543 (+$33,359, +12.72% from previous year)
- 2014: $294,015 (−$1,528, −0.52% from previous year)
- 2015: $304,648 (+$10,633, +3.62% from previous year)
- 2016: $314,390 (+$9,741, +3.20% from previous year)
- 2017: $310,022 (−$4,368, −1.39% from previous year)
- 2018: $313,501 (+$3,479, +1.12% from previous year)
- 2019: $312,766 (−$734, −0.23% from previous year)
- 2020: $324,372 (+$11,606, +3.71% from previous year)
- 2021: $370,175 (+$45,803, +14.12% from previous year)
- 2022: $392,239 (+$22,064, +5.96% from previous year)
- 2023: $393,814 (+$1,575, +0.40% from previous year)
- 2024: $413,296 (+$19,482, +4.95% from previous year)
- 2025: $416,179 (+$2,883, +0.70% from previous year)
Farson has experienced a 59% increase in home values since 2012, with the steepest rise occurring in 2021. Though the growth has tapered in recent years, prices remain higher than ever, suggesting lasting interest in this rural town.
Farson – Quiet Rural Growth in Southwestern Wyoming
Located in Sweetwater County, Farson is a small farming and ranching community known for its wide open spaces and agricultural roots. Its modest but steady rise in property values reflects interest from buyers who appreciate seclusion without disconnecting from Wyoming’s main roadways.
While not a booming market, Farson’s affordability and proximity to outdoor recreation make it a draw for retirees, hobby farmers, and those looking to build on open land. With few listings and slow turnover, even modest increases in demand have pushed prices upward.
22. Ranchester – 66% Home Price Increase Since 2017

- 2017: $252,801
- 2018: $255,680 (+$2,879, +1.14% from previous year)
- 2019: $268,302 (+$12,622, +4.94% from previous year)
- 2020: $288,362 (+$20,060, +7.48% from previous year)
- 2021: $330,076 (+$41,714, +14.47% from previous year)
- 2022: $383,186 (+$53,110, +16.09% from previous year)
- 2023: $395,663 (+$12,477, +3.26% from previous year)
- 2024: $396,529 (+$866, +0.22% from previous year)
- 2025: $418,724 (+$22,195, +5.60% from previous year)
Ranchester’s housing market has grown 66% since 2017, fueled by big jumps from 2020 to 2022. After a slower stretch, the town posted another strong gain in 2025, pointing to renewed buyer interest.
Ranchester – Suburban Growth in the Sheridan Foothills

Situated near the Montana border, Ranchester is a small town in Sheridan County that has seen an uptick in home prices as more buyers seek proximity to Sheridan without the city price tag. Its family-friendly reputation and easy access to schools and services have helped boost its appeal.
While new development is limited, demand for existing homes remains high. Buyers are drawn to the town’s scenic views and more relaxed pace—offering a quieter option just minutes from one of Wyoming’s most dynamic small cities.
21. Dayton – 67% Home Price Increase Since 2017

- 2017: $255,821
- 2018: $263,313 (+$7,491, +2.93% from previous year)
- 2019: $276,111 (+$12,798, +4.86% from previous year)
- 2020: $305,327 (+$29,216, +10.58% from previous year)
- 2021: $348,162 (+$42,835, +14.03% from previous year)
- 2022: $393,191 (+$45,029, +12.93% from previous year)
- 2023: $405,862 (+$12,672, +3.22% from previous year)
- 2024: $420,543 (+$14,681, +3.62% from previous year)
- 2025: $428,546 (+$8,003, +1.90% from previous year)
Home values in Dayton have grown by 67% since 2017. A trio of strong years from 2020 through 2022 led the way, and although gains have since slowed, the market has continued to climb steadily into 2025.
Dayton – A Scenic Stop With Steady Appeal

Dayton is nestled where the plains meet the Bighorn Mountains, offering both scenic charm and proximity to outdoor adventure. With strong community roots and a location near Sheridan, it appeals to buyers looking for value outside larger cities.
Its rising home prices reflect a broader trend of growth in northern Wyoming, especially in areas with desirable scenery, space, and a slower lifestyle. The consistent upward movement in Dayton’s market suggests that buyers see long-term value here.
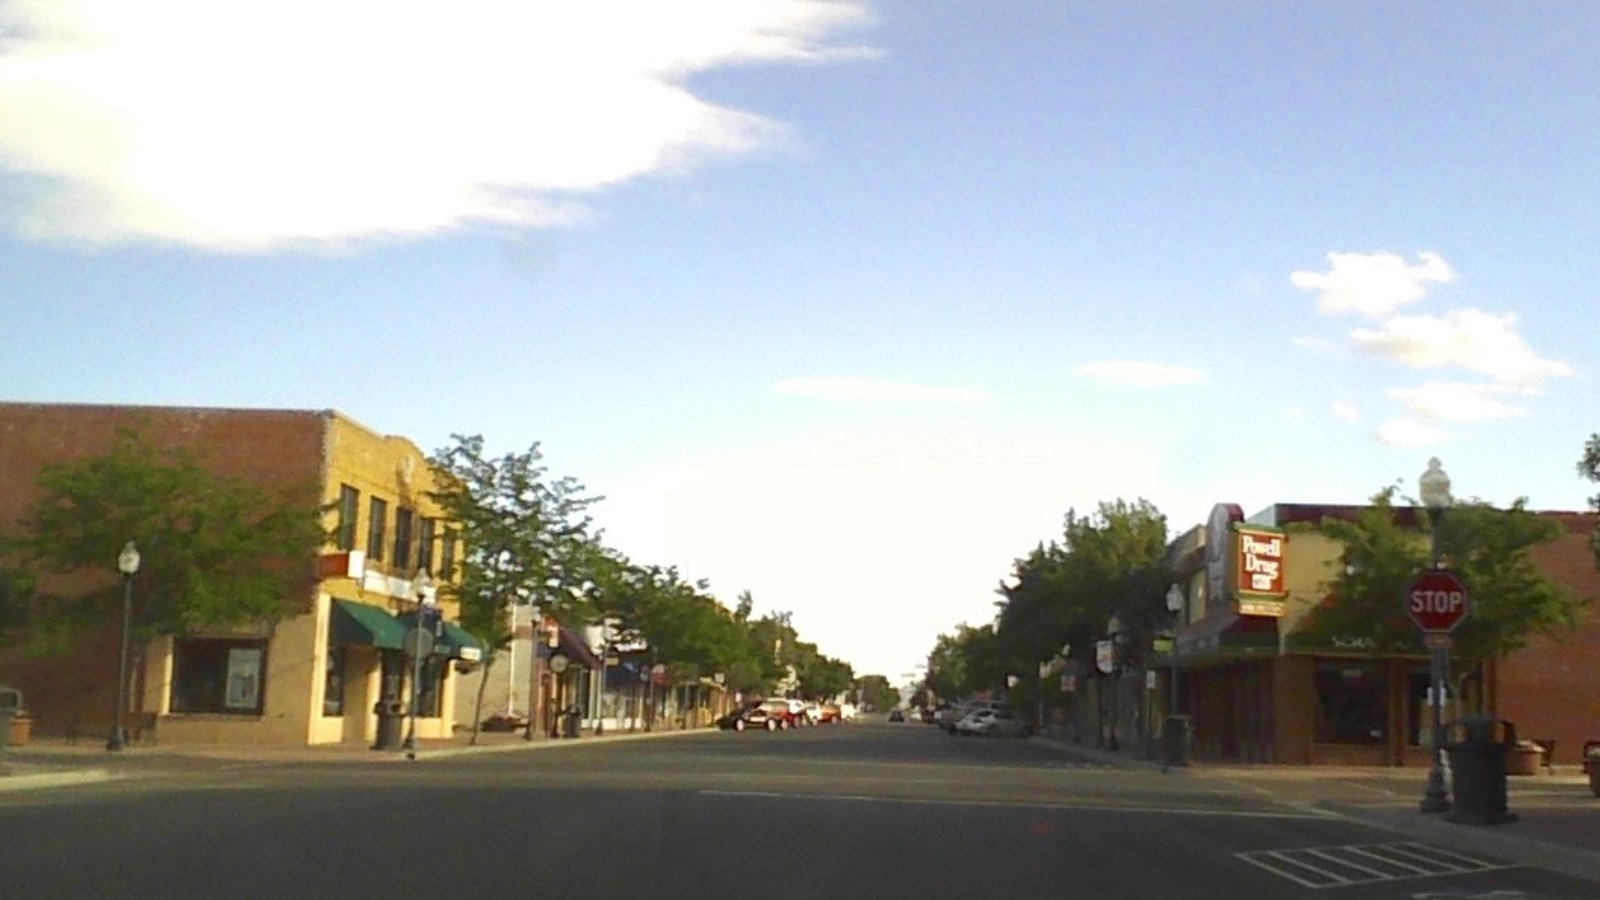
20. Powell – 104% Home Price Increase Since 2010
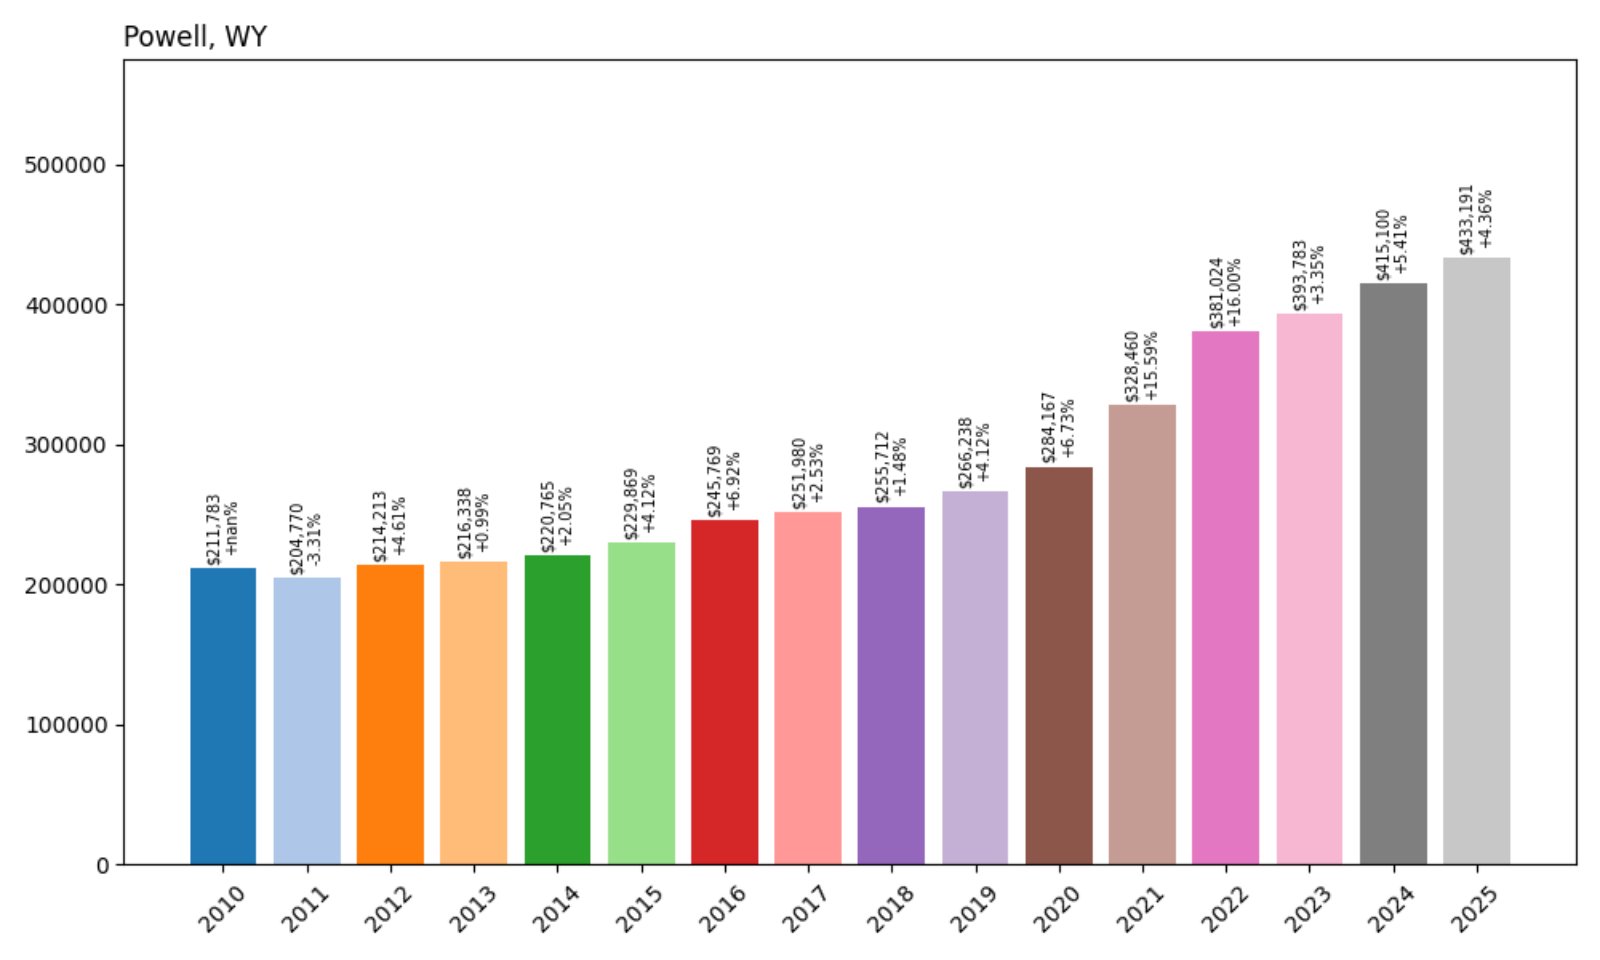
- 2010: $211,783
- 2011: $204,770 (−$7,013, −3.31% from previous year)
- 2012: $214,213 (+$9,444, +4.61% from previous year)
- 2013: $216,338 (+$2,124, +0.99% from previous year)
- 2014: $220,765 (+$4,427, +2.05% from previous year)
- 2015: $229,869 (+$9,104, +4.12% from previous year)
- 2016: $245,769 (+$15,899, +6.92% from previous year)
- 2017: $251,980 (+$6,211, +2.53% from previous year)
- 2018: $255,712 (+$3,732, +1.48% from previous year)
- 2019: $266,238 (+$10,526, +4.12% from previous year)
- 2020: $284,167 (+$17,929, +6.73% from previous year)
- 2021: $328,460 (+$44,294, +15.59% from previous year)
- 2022: $381,024 (+$52,564, +16.00% from previous year)
- 2023: $393,783 (+$12,759, +3.35% from previous year)
- 2024: $415,100 (+$21,317, +5.41% from previous year)
- 2025: $433,191 (+$18,091, +4.36% from previous year)
Powell’s housing market has seen prices more than double since 2010, with 104% total growth. A dramatic rise from 2020 through 2022 set the tone, but even in 2025 the market continues to inch higher.
Powell – Agricultural Tradition Meets Modern Growth
Located in Park County, Powell is historically an agricultural town with strong community ties and access to Yellowstone country. The presence of Northwest College and proximity to larger centers like Cody contribute to a diverse housing market.
Buyers are drawn by lower home prices compared to resort communities, yet Powell’s values have climbed substantially thanks to ongoing interest in Wyoming’s western tier. The town offers an attractive mix of education, infrastructure, and scenic living—pushing prices higher year after year.
19. Sheridan – 90% Home Price Increase Since 2012

- 2012: $229,596
- 2013: $240,687 (+$11,091, +4.83% from previous year)
- 2014: $238,563 (−$2,124, −0.88% from previous year)
- 2015: $252,090 (+$13,528, +5.67% from previous year)
- 2016: $261,217 (+$9,127, +3.62% from previous year)
- 2017: $262,953 (+$1,736, +0.66% from previous year)
- 2018: $273,621 (+$10,668, +4.06% from previous year)
- 2019: $291,495 (+$17,874, +6.53% from previous year)
- 2020: $308,987 (+$17,492, +6.00% from previous year)
- 2021: $351,186 (+$42,200, +13.66% from previous year)
- 2022: $407,731 (+$56,544, +16.10% from previous year)
- 2023: $417,322 (+$9,592, +2.35% from previous year)
- 2024: $414,720 (−$2,602, −0.62% from previous year)
- 2025: $436,485 (+$21,765, +5.25% from previous year)
Sheridan’s home values have increased by 90% since 2012, with a powerful growth streak between 2020 and 2022. Even after a slight dip in 2024, the market rebounded in 2025, keeping the city firmly in Wyoming’s top 20 for home prices.
Sheridan – Big Sky Living With City Perks

🔥 Would you like to save this?
Nestled beneath the Bighorn Mountains, Sheridan blends outdoor charm with one of Wyoming’s most established small-city economies. It boasts a thriving arts scene, regional medical center, and strong tourism during summer and fall.
The housing market here has long drawn interest, but the post-2020 boom elevated values dramatically. Newcomers from Colorado and beyond are choosing Sheridan for its scenery and livability, while longtime residents continue to invest in its upward trajectory.
18. Dubois – 107% Home Price Increase Since 2010
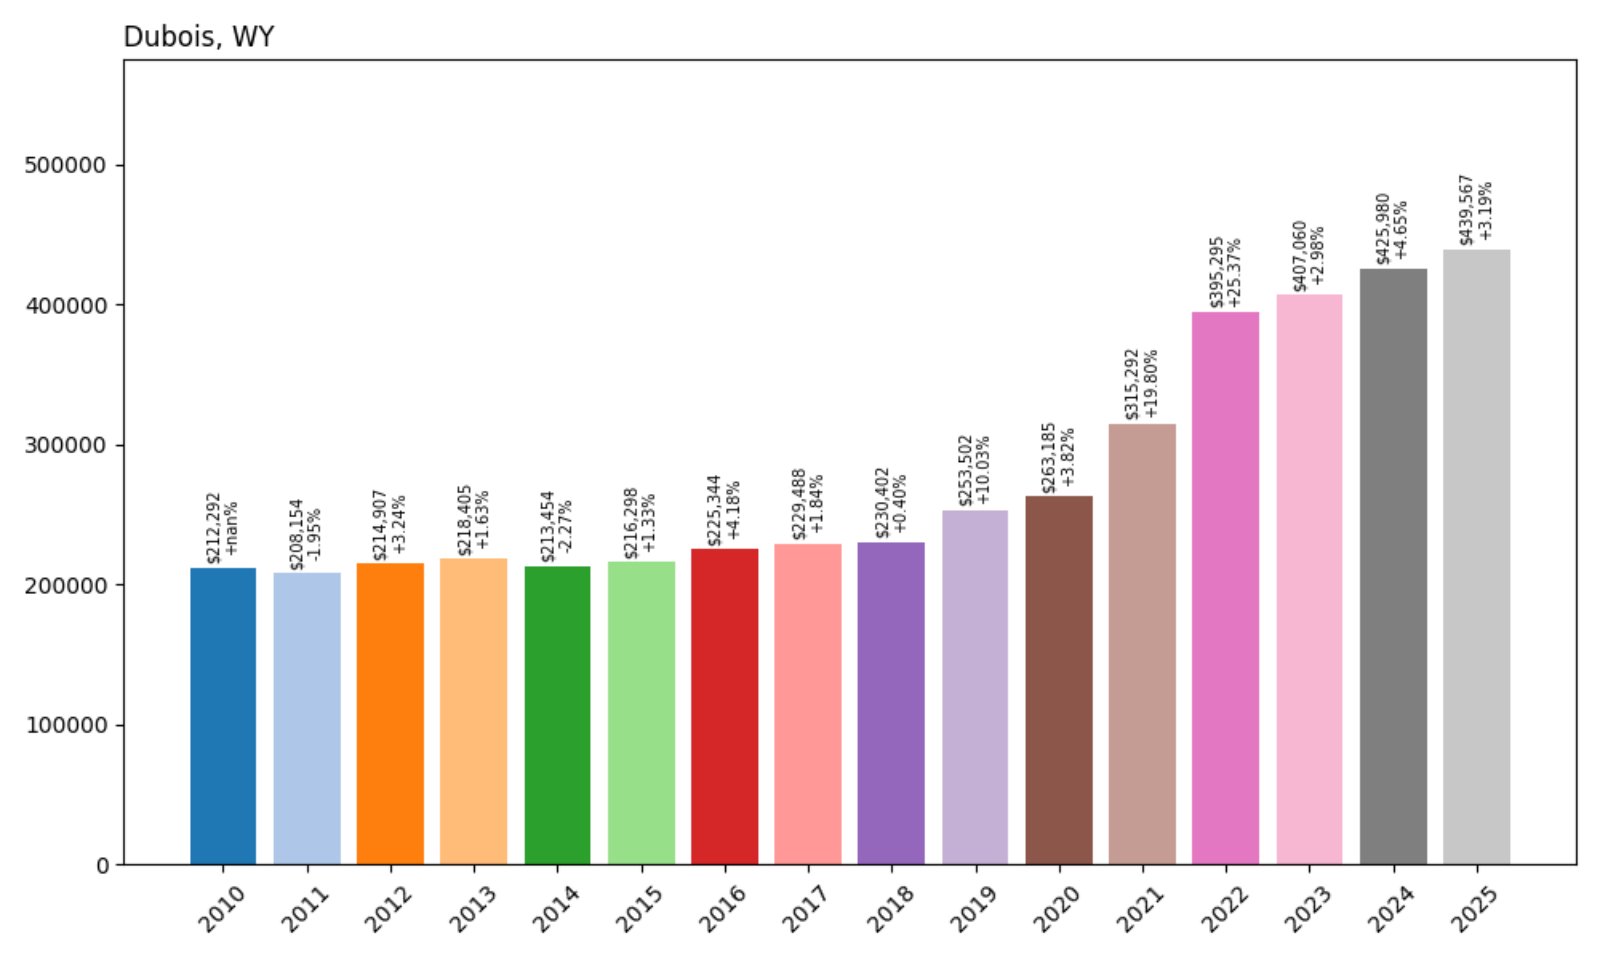
- 2010: $212,292
- 2011: $208,154 (−$4,138, −1.95% from previous year)
- 2012: $214,907 (+$6,753, +3.24% from previous year)
- 2013: $218,405 (+$3,498, +1.63% from previous year)
- 2014: $213,454 (−$4,950, −2.27% from previous year)
- 2015: $216,298 (+$2,844, +1.33% from previous year)
- 2016: $225,344 (+$9,045, +4.18% from previous year)
- 2017: $229,488 (+$4,144, +1.84% from previous year)
- 2018: $230,402 (+$914, +0.40% from previous year)
- 2019: $253,502 (+$23,100, +10.03% from previous year)
- 2020: $263,185 (+$9,683, +3.82% from previous year)
- 2021: $315,292 (+$52,107, +19.80% from previous year)
- 2022: $395,295 (+$80,003, +25.37% from previous year)
- 2023: $407,060 (+$11,765, +2.98% from previous year)
- 2024: $425,980 (+$18,919, +4.65% from previous year)
- 2025: $439,567 (+$13,587, +3.19% from previous year)
Dubois has more than doubled in value since 2010, with a staggering 25% increase in 2022 alone. While recent growth has been steadier, the trend continues upward, with a 107% increase overall across 15 years.
Dubois – Western Charm With Soaring Value
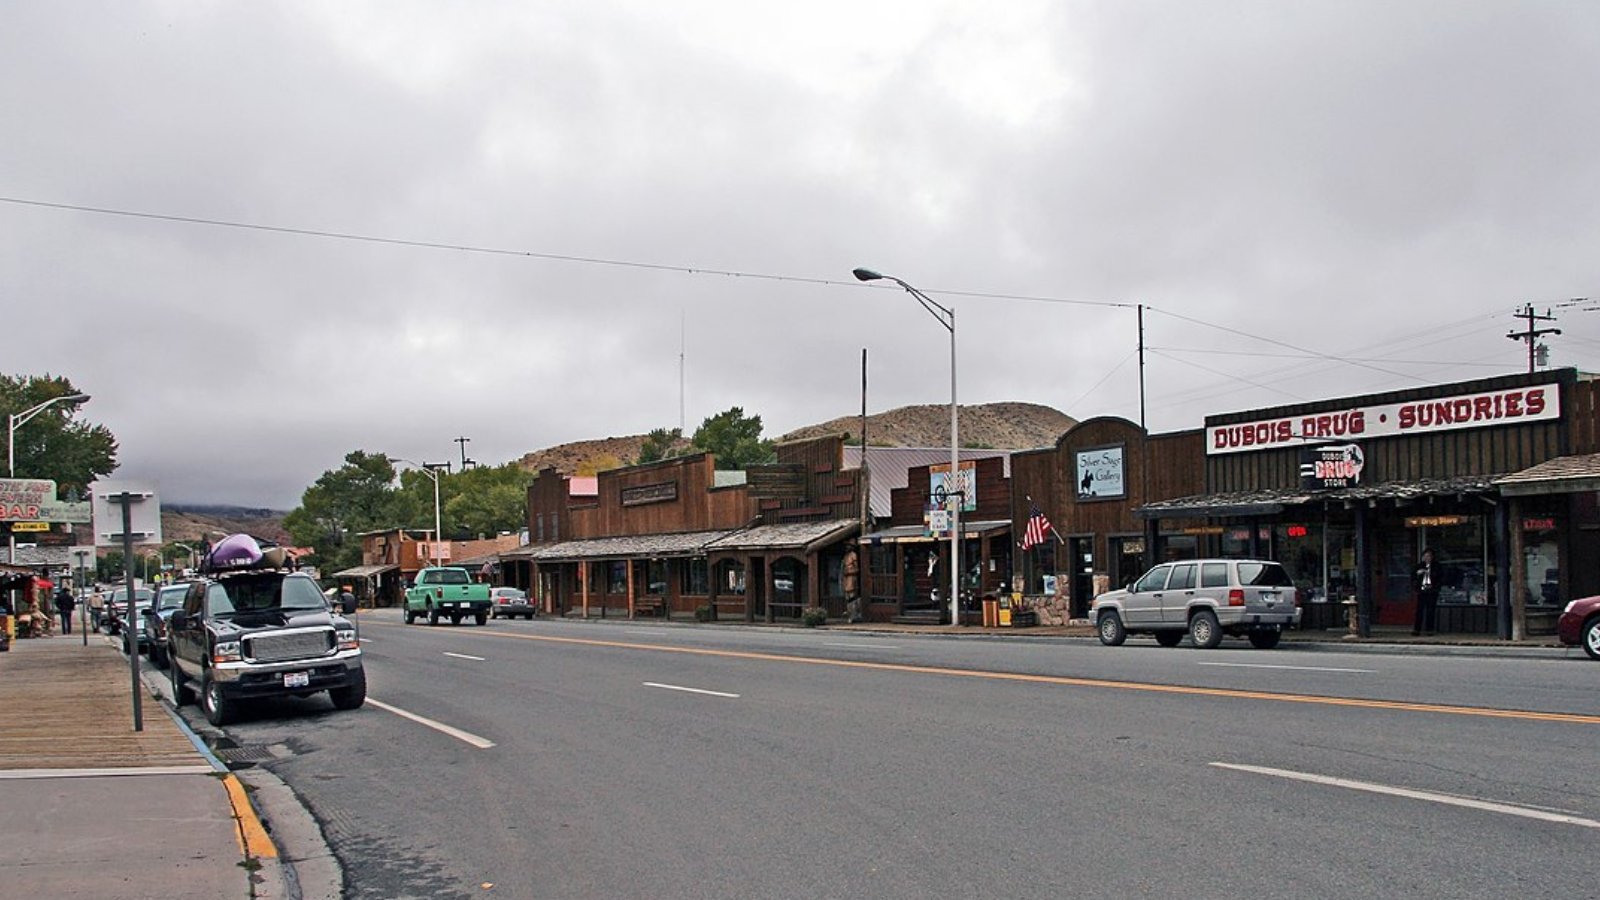
Set in a scenic valley along the Wind River, Dubois is a haven for outdoor adventurers, artists, and retirees alike. Its historic downtown and proximity to Yellowstone have kept the town on the radar of second-home buyers and remote workers.
Recent housing demand stems from its beauty and livability, coupled with limited inventory. This has made Dubois one of Wyoming’s fastest-rising rural markets—quietly building equity while maintaining its small-town feel.
17. Pinedale – 65% Home Price Increase Since 2012
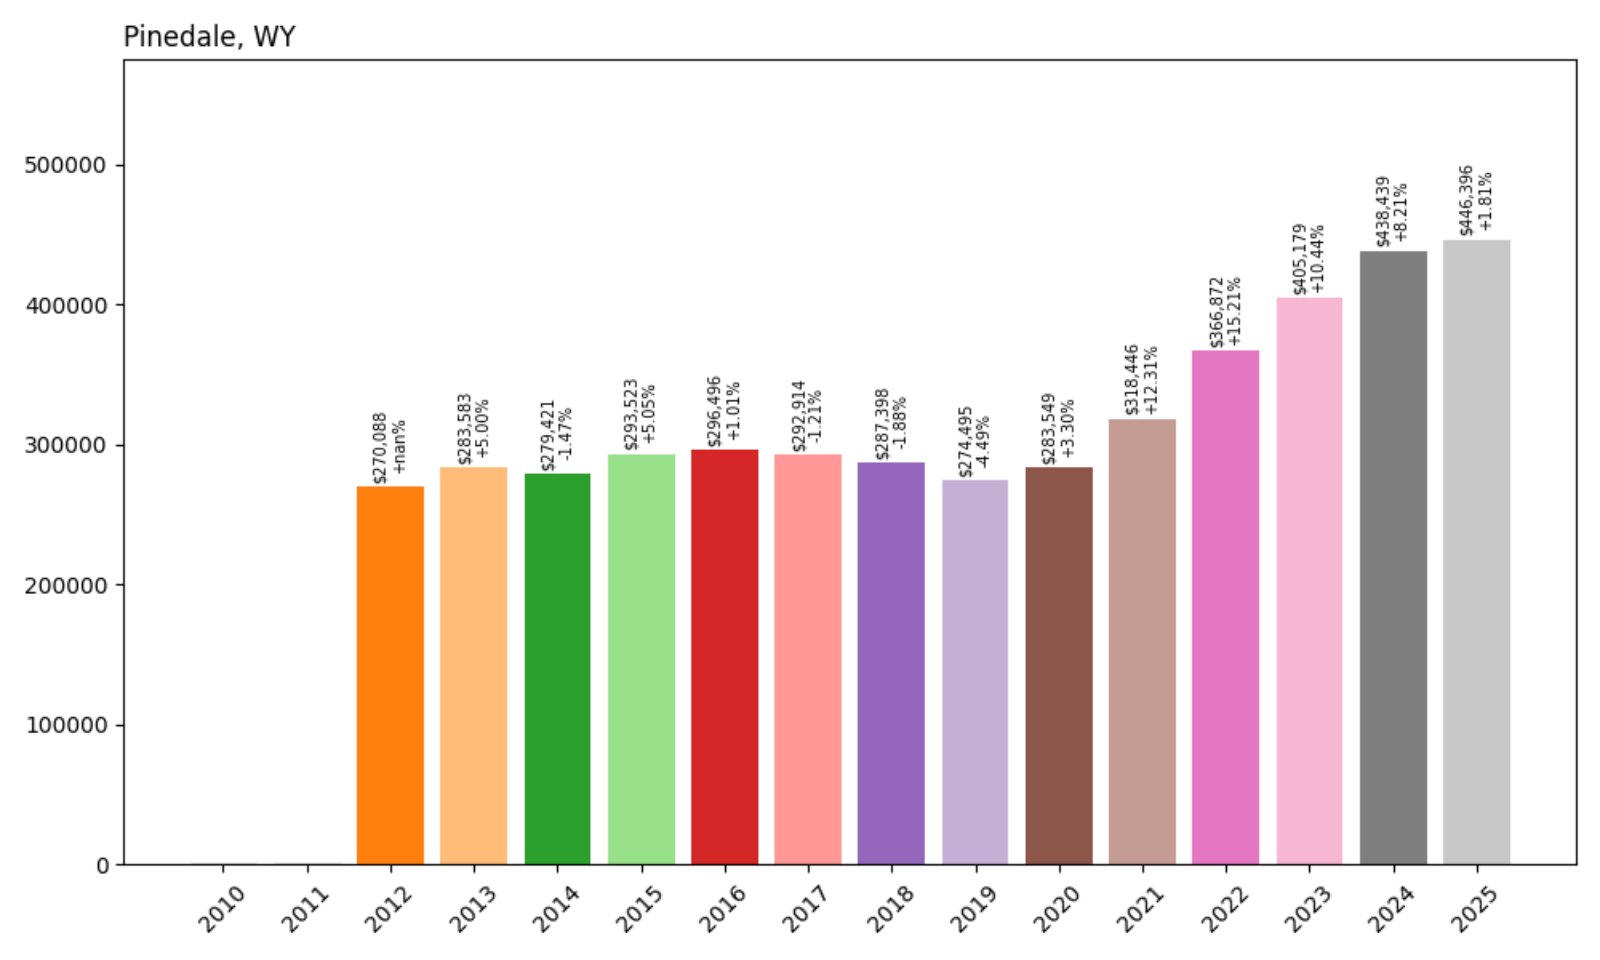
- 2012: $270,088
- 2013: $283,583 (+$13,495, +5.00% from previous year)
- 2014: $279,421 (−$4,161, −1.47% from previous year)
- 2015: $293,523 (+$14,101, +5.05% from previous year)
- 2016: $296,496 (+$2,974, +1.01% from previous year)
- 2017: $292,914 (−$3,582, −1.21% from previous year)
- 2018: $287,398 (−$5,516, −1.88% from previous year)
- 2019: $274,495 (−$12,903, −4.49% from previous year)
- 2020: $283,549 (+$9,054, +3.30% from previous year)
- 2021: $318,446 (+$34,897, +12.31% from previous year)
- 2022: $366,872 (+$48,426, +15.21% from previous year)
- 2023: $405,179 (+$38,307, +10.44% from previous year)
- 2024: $438,439 (+$33,260, +8.21% from previous year)
- 2025: $446,396 (+$7,957, +1.81% from previous year)
After a rocky stretch from 2016 to 2019, Pinedale’s market surged from 2020 to 2024, helping the town post a 65% total price increase since 2012. While 2025 showed more modest growth, values remain strong.
Pinedale – Breathtaking Backdrops and Steady Demand
Located near the Bridger-Teton National Forest, Pinedale is known for its rugged beauty and quick access to Wyoming’s best wilderness. It’s also the commercial center of Sublette County, supporting a growing population of seasonal and year-round residents.
The housing market has been driven by a renewed interest in mountain towns that still feel like home. As other areas have priced out buyers, Pinedale has emerged as a compelling option for those seeking space, scenery, and long-term potential.
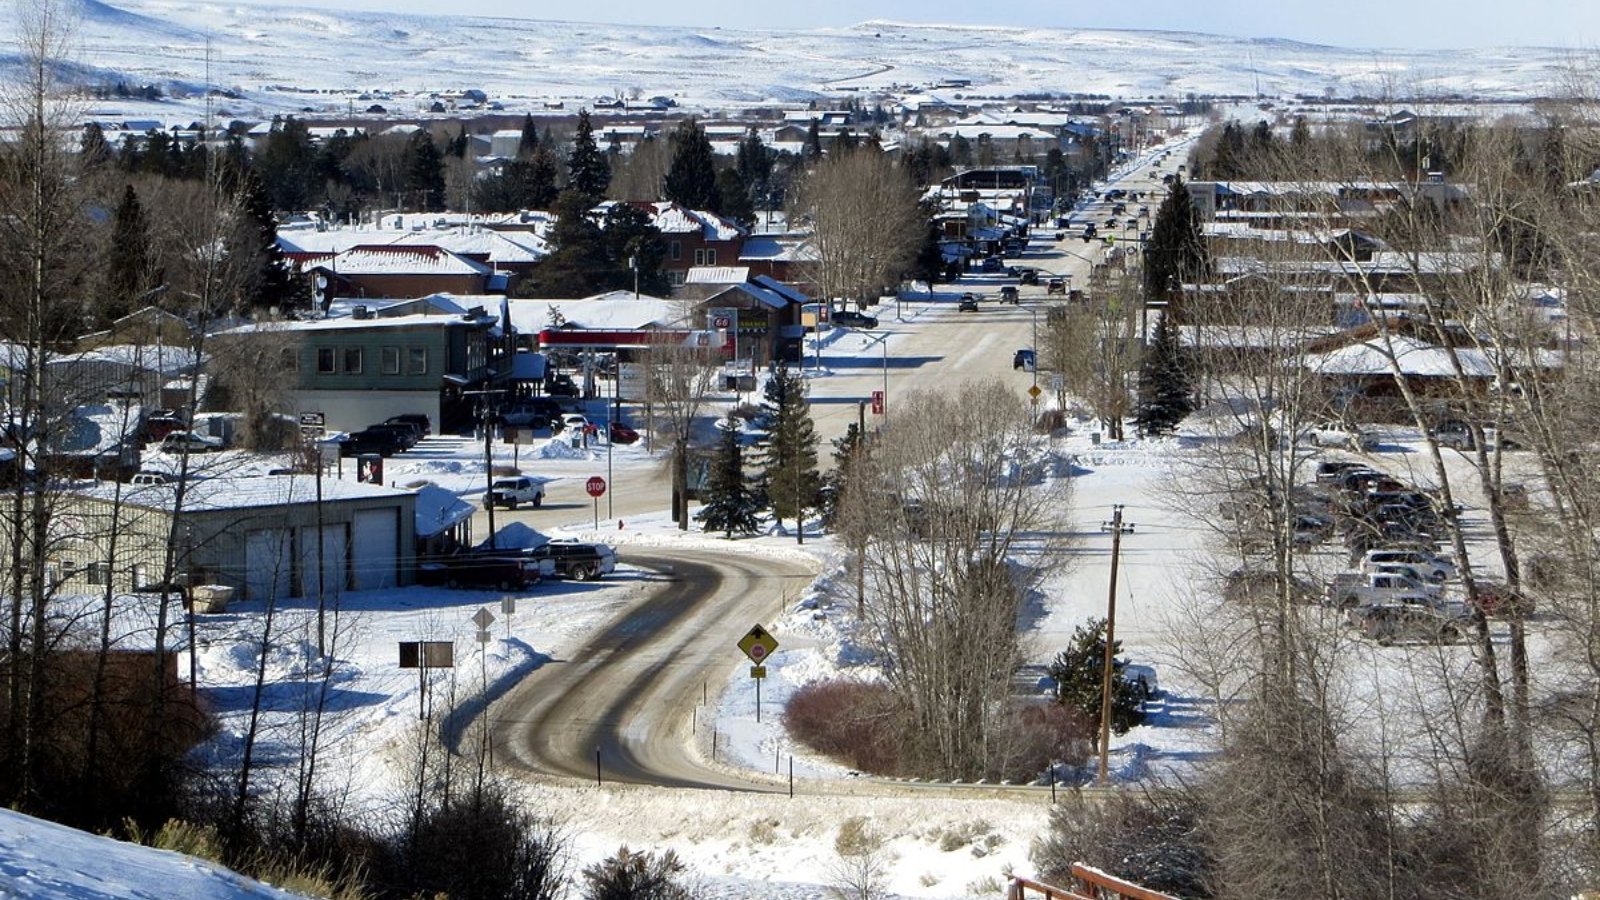
16. Afton – 9% Home Price Increase Since 2023
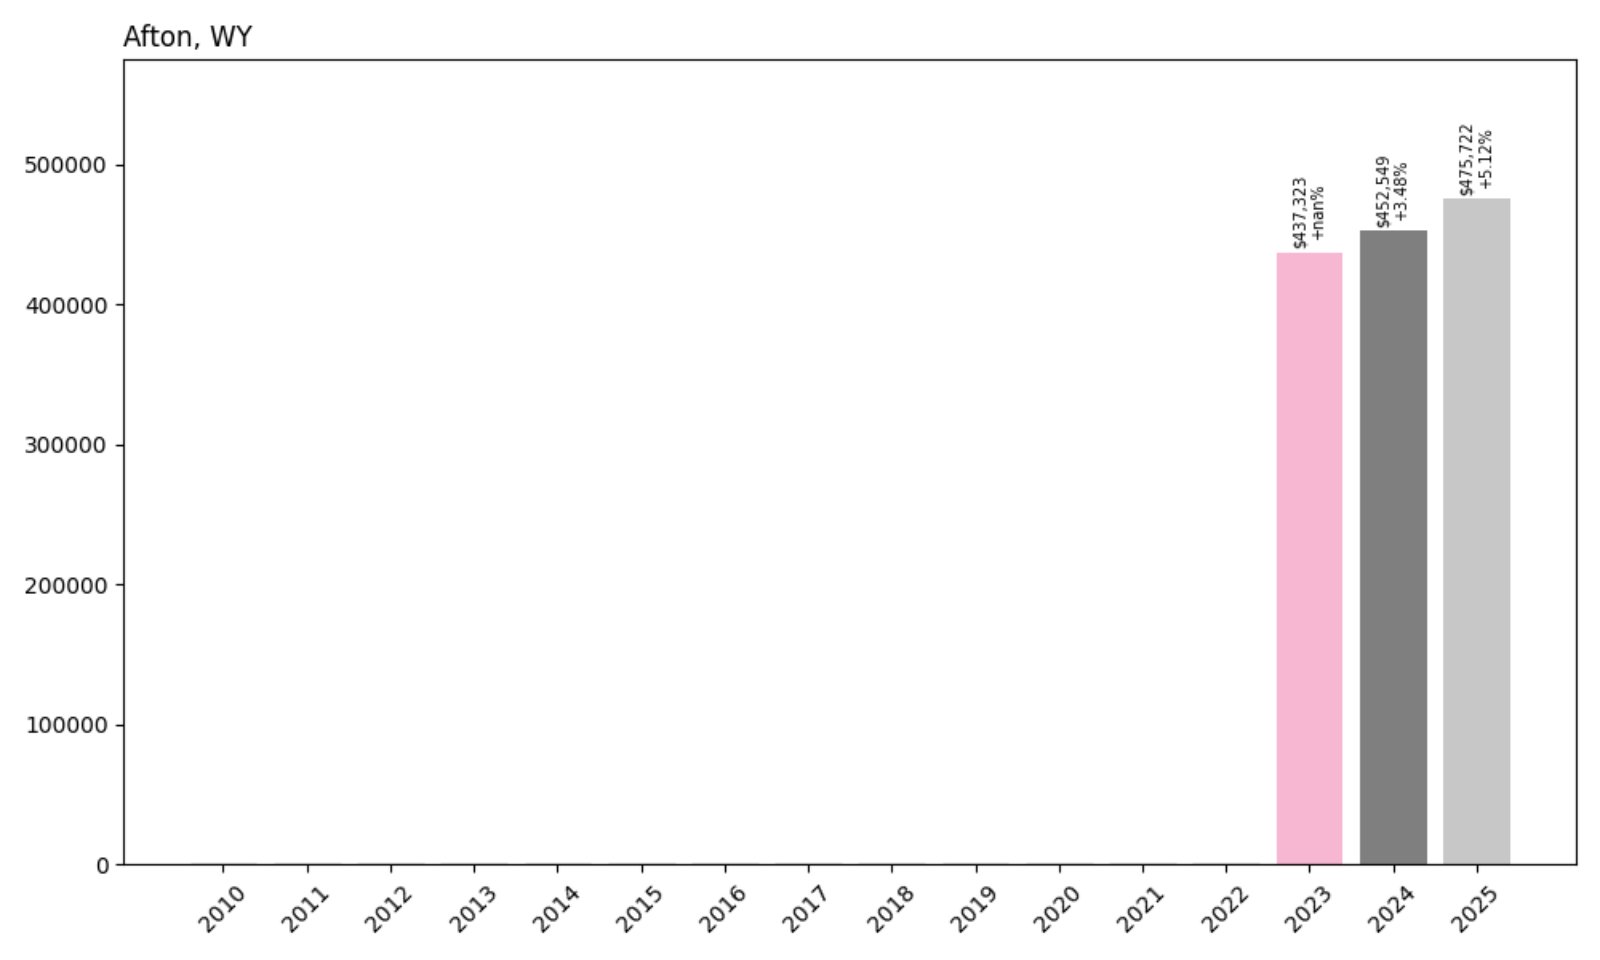
- 2023: $437,323
- 2024: $452,549 (+$15,227, +3.48% from previous year)
- 2025: $475,722 (+$23,173, +5.12% from previous year)
Afton’s home values have increased 9% in just the past two years, showing clear upward momentum. Though historical data is limited, the recent figures point to solid year-over-year growth in this Star Valley hub.
Afton – A Southern Gateway With Upscale Momentum
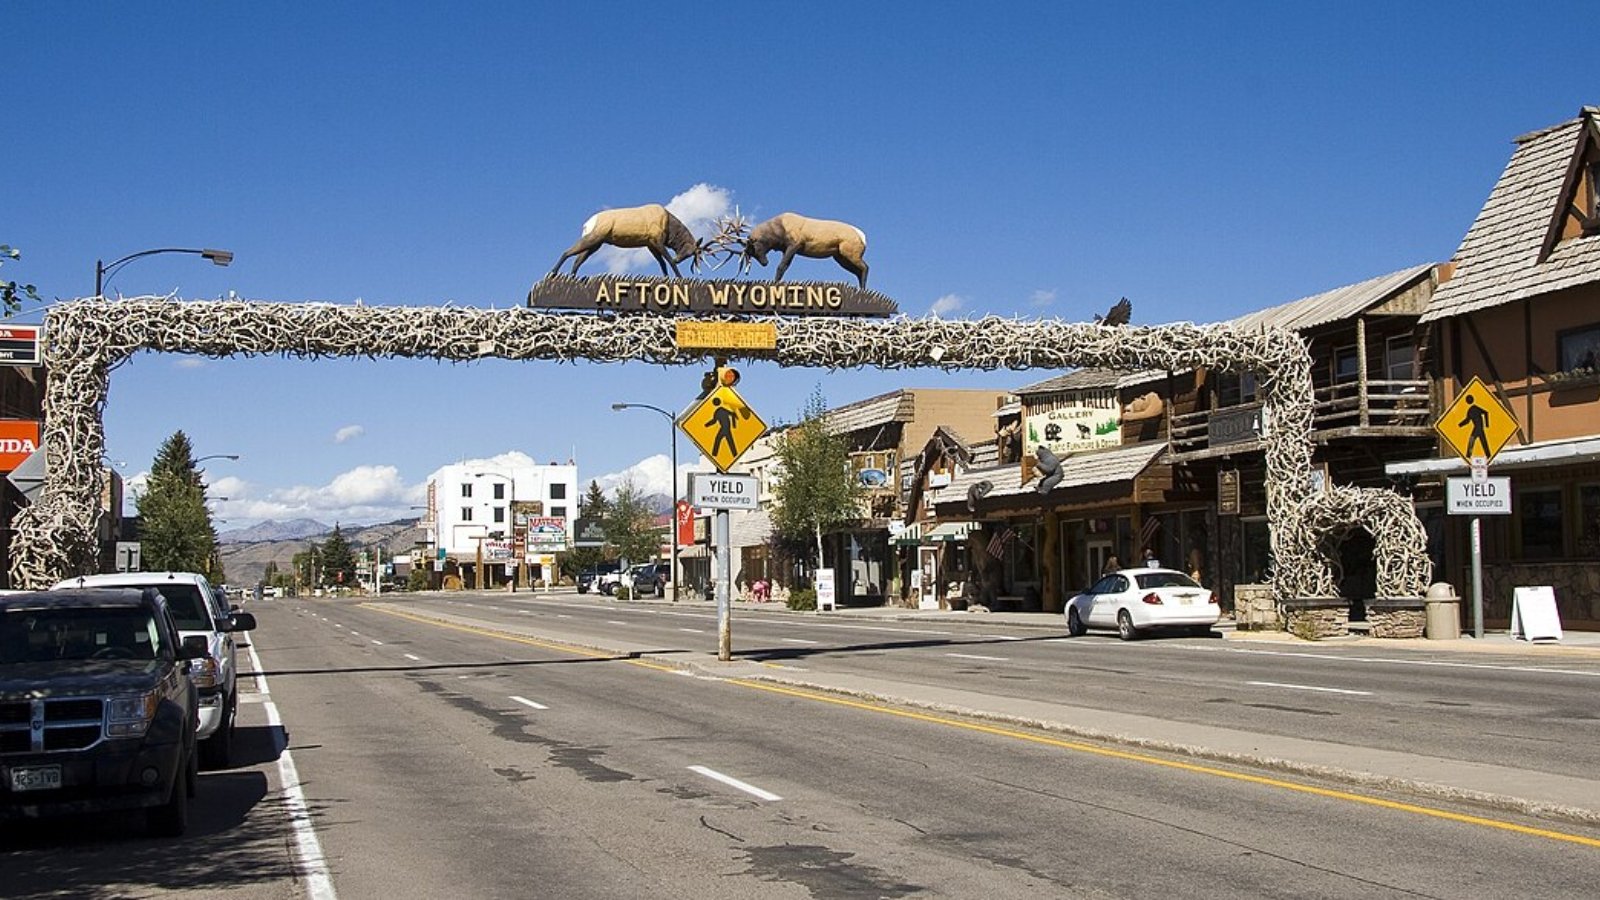
Afton is the largest town in Lincoln County’s scenic Star Valley region. Known for its welcoming community, beautiful natural surroundings, and close-knit culture, the town is becoming a desirable location for those moving from more crowded Western markets.
Recent investments in infrastructure and housing have helped raise home values quickly. With a growing reputation and increased demand, Afton is on track to continue climbing the ranks of Wyoming’s most expensive towns.
15. Boulder – 57% Home Price Increase Since 2017
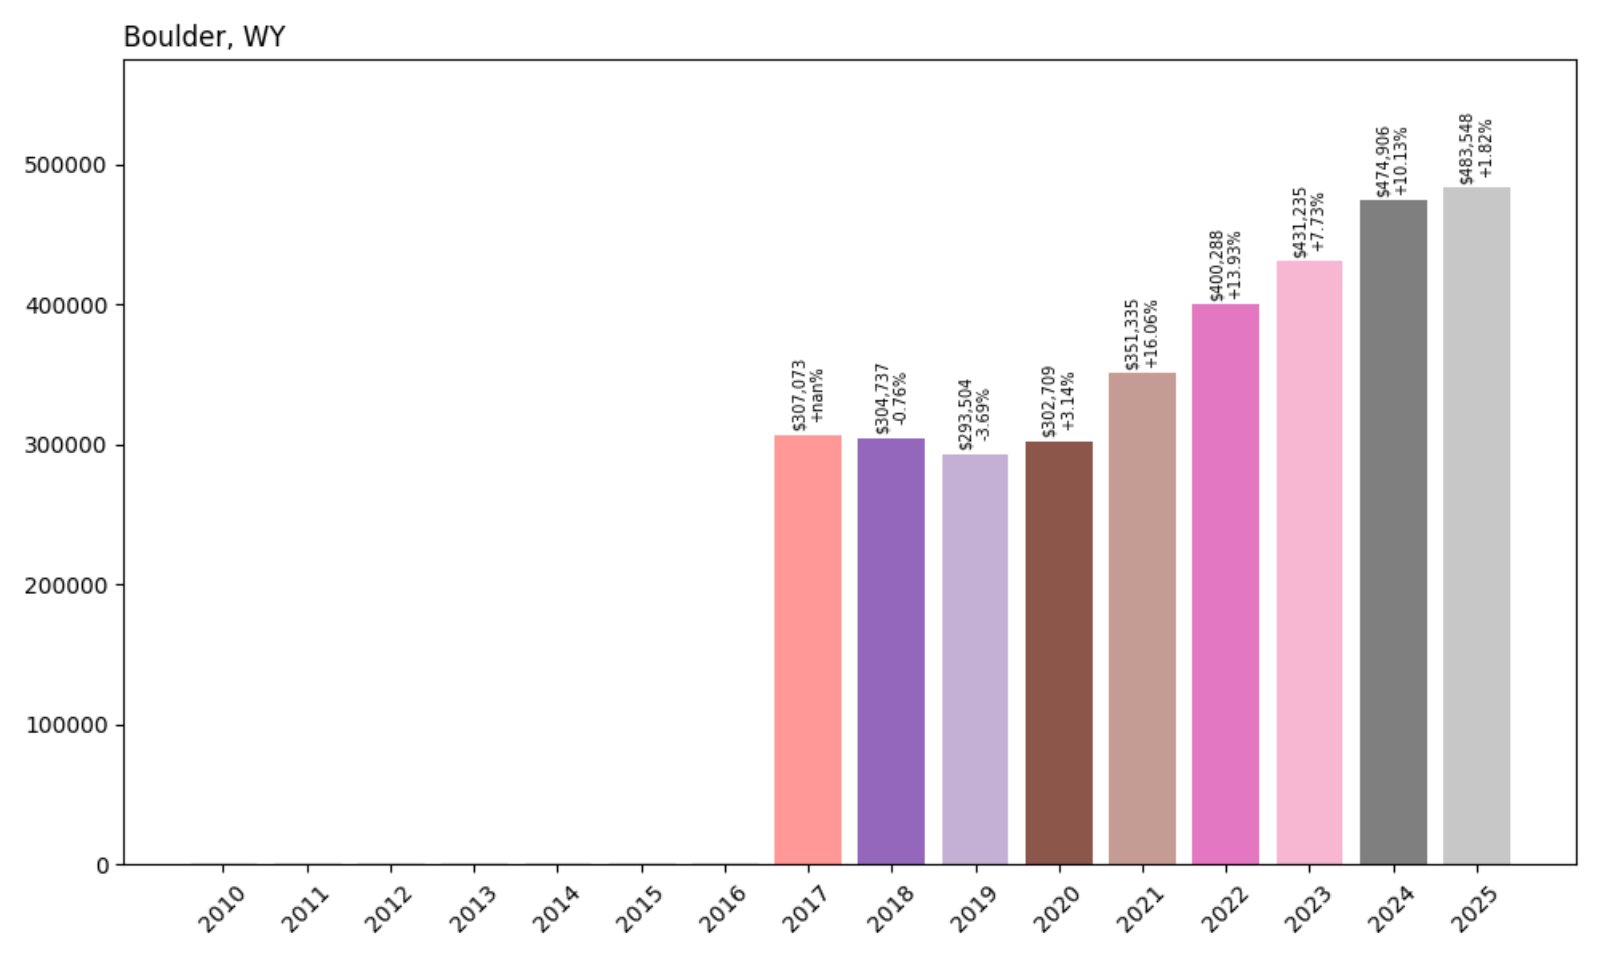
- 2017: $307,073
- 2018: $304,737 (−$2,336, −0.76% from previous year)
- 2019: $293,504 (−$11,233, −3.69% from previous year)
- 2020: $302,709 (+$9,204, +3.14% from previous year)
- 2021: $351,335 (+$48,626, +16.06% from previous year)
- 2022: $400,288 (+$48,953, +13.93% from previous year)
- 2023: $431,235 (+$30,947, +7.73% from previous year)
- 2024: $474,906 (+$43,672, +10.13% from previous year)
- 2025: $483,548 (+$8,641, +1.82% from previous year)
Home prices in Boulder have risen 57% since 2017, with the strongest increases between 2020 and 2024. Growth has slowed slightly in 2025 but remains positive, keeping the town among Wyoming’s most expensive markets.
Boulder – Remote, Rugged, and Rising
Located south of Pinedale, Boulder is a sparsely populated area with sweeping mountain views and direct access to outdoor recreation. With a mix of ranch properties and newer construction, it appeals to buyers looking for solitude and self-sufficiency.
Rising prices reflect increasing interest in remote properties that offer both value and beauty. As land becomes harder to come by in nearby areas, Boulder’s real estate market is seeing the effects of that spillover.
14. Rozet – 82% Home Price Increase Since 2011
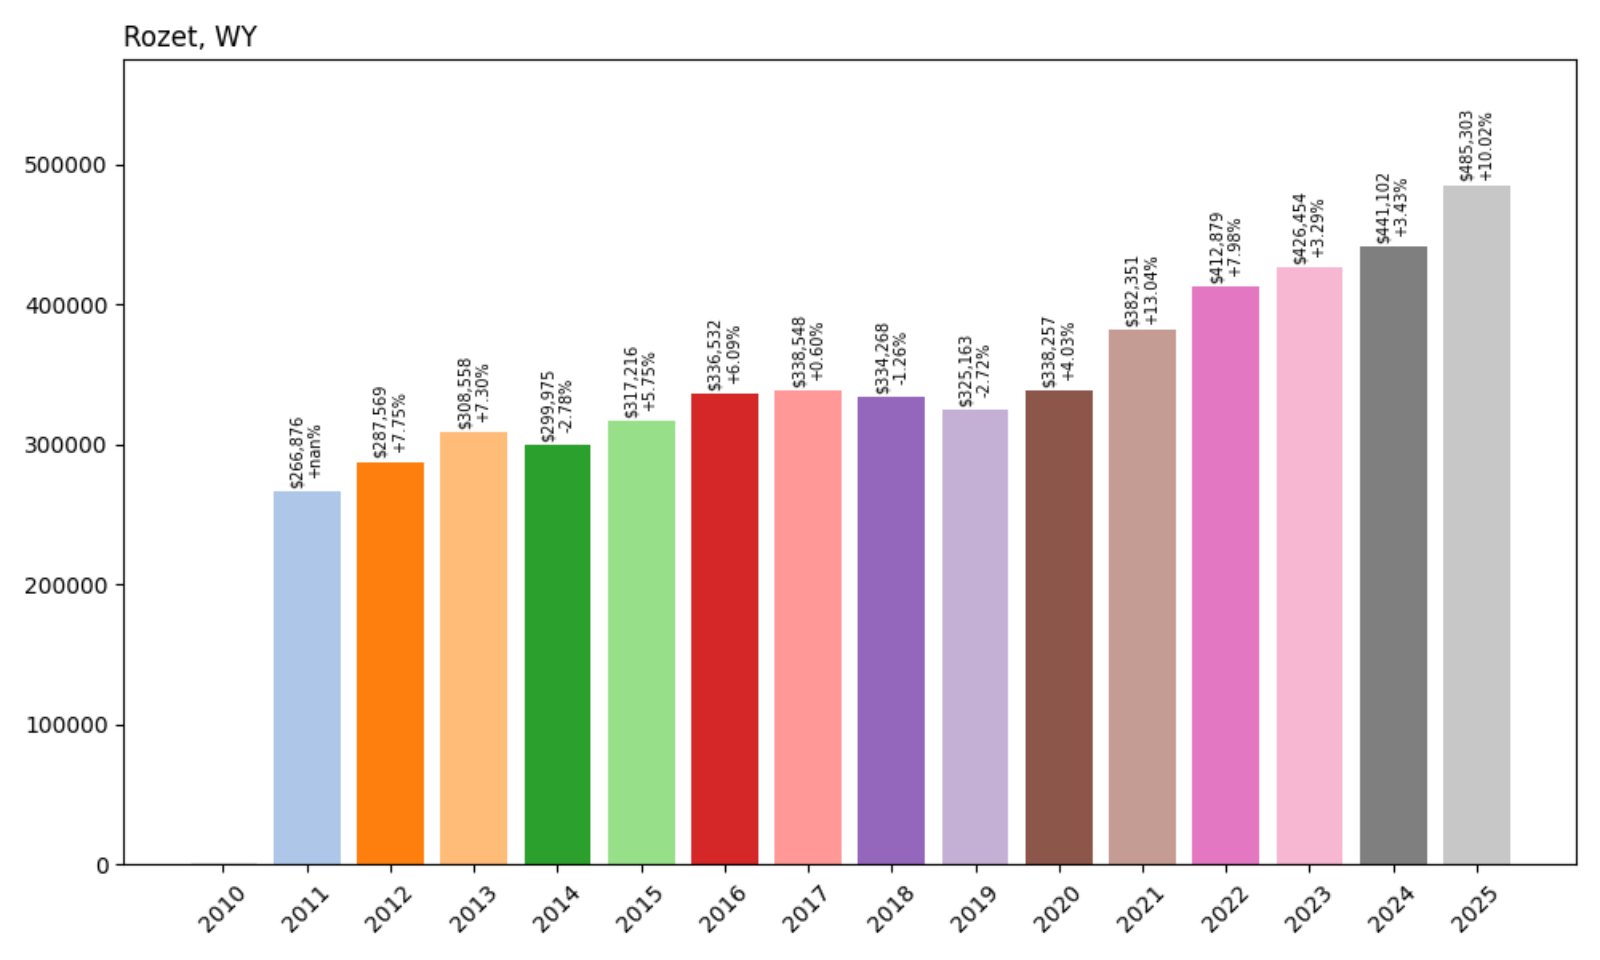
- 2011: $266,876
- 2012: $287,569 (+$20,693, +7.75% from previous year)
- 2013: $308,558 (+$20,989, +7.30% from previous year)
- 2014: $299,975 (−$8,583, −2.78% from previous year)
- 2015: $317,216 (+$17,241, +5.75% from previous year)
- 2016: $336,532 (+$19,316, +6.09% from previous year)
- 2017: $338,548 (+$2,016, +0.60% from previous year)
- 2018: $334,268 (−$4,280, −1.26% from previous year)
- 2019: $325,163 (−$9,105, −2.72% from previous year)
- 2020: $338,257 (+$13,093, +4.03% from previous year)
- 2021: $382,351 (+$44,094, +13.04% from previous year)
- 2022: $412,879 (+$30,528, +7.98% from previous year)
- 2023: $426,454 (+$13,575, +3.29% from previous year)
- 2024: $441,102 (+$14,648, +3.43% from previous year)
- 2025: $485,303 (+$44,200, +10.02% from previous year)
Rozet has posted an 82% increase in home values since 2011, gaining steady momentum over the past decade. After moderate growth earlier on, the last few years have brought faster appreciation—especially in 2025, with a double-digit jump.
Rozet – Quiet Gains in Campbell County
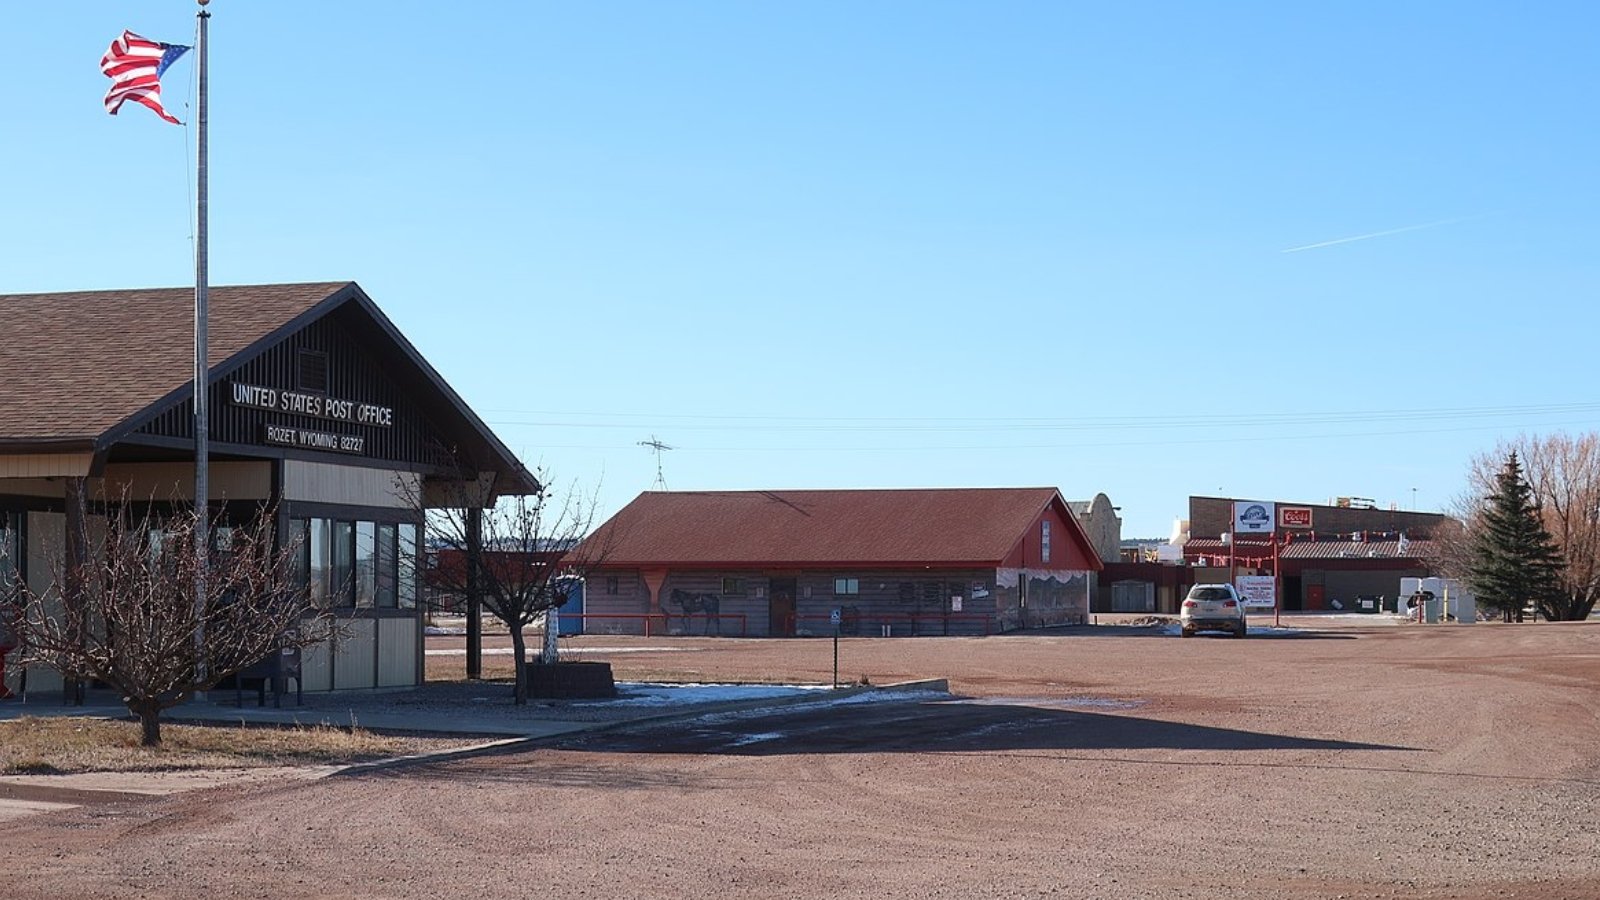
Rozet, located just outside Gillette, is a rural community where buyers are finding both land and value. With its proximity to coal and energy jobs and a peaceful setting, it offers a solid alternative to more congested markets.
As property demand grows in Campbell County, Rozet is benefiting from spillover interest—particularly among buyers seeking acreage, open skies, and relatively newer housing stock.
13. Daniel – 51% Home Price Increase Since 2017

- 2017: $322,909
- 2018: $311,649 (−$11,260, −3.49% from previous year)
- 2019: $291,262 (−$20,386, −6.54% from previous year)
- 2020: $306,866 (+$15,603, +5.36% from previous year)
- 2021: $350,099 (+$43,233, +14.09% from previous year)
- 2022: $400,492 (+$50,394, +14.39% from previous year)
- 2023: $438,449 (+$37,956, +9.48% from previous year)
- 2024: $469,915 (+$31,467, +7.18% from previous year)
- 2025: $487,316 (+$17,401, +3.70% from previous year)
Daniel’s housing market has grown by 51% since 2017, with most of that increase occurring in the last five years. From 2020 onward, demand pushed prices up sharply—adding over $180K in total value.
Daniel – A Remote Market on the Rise
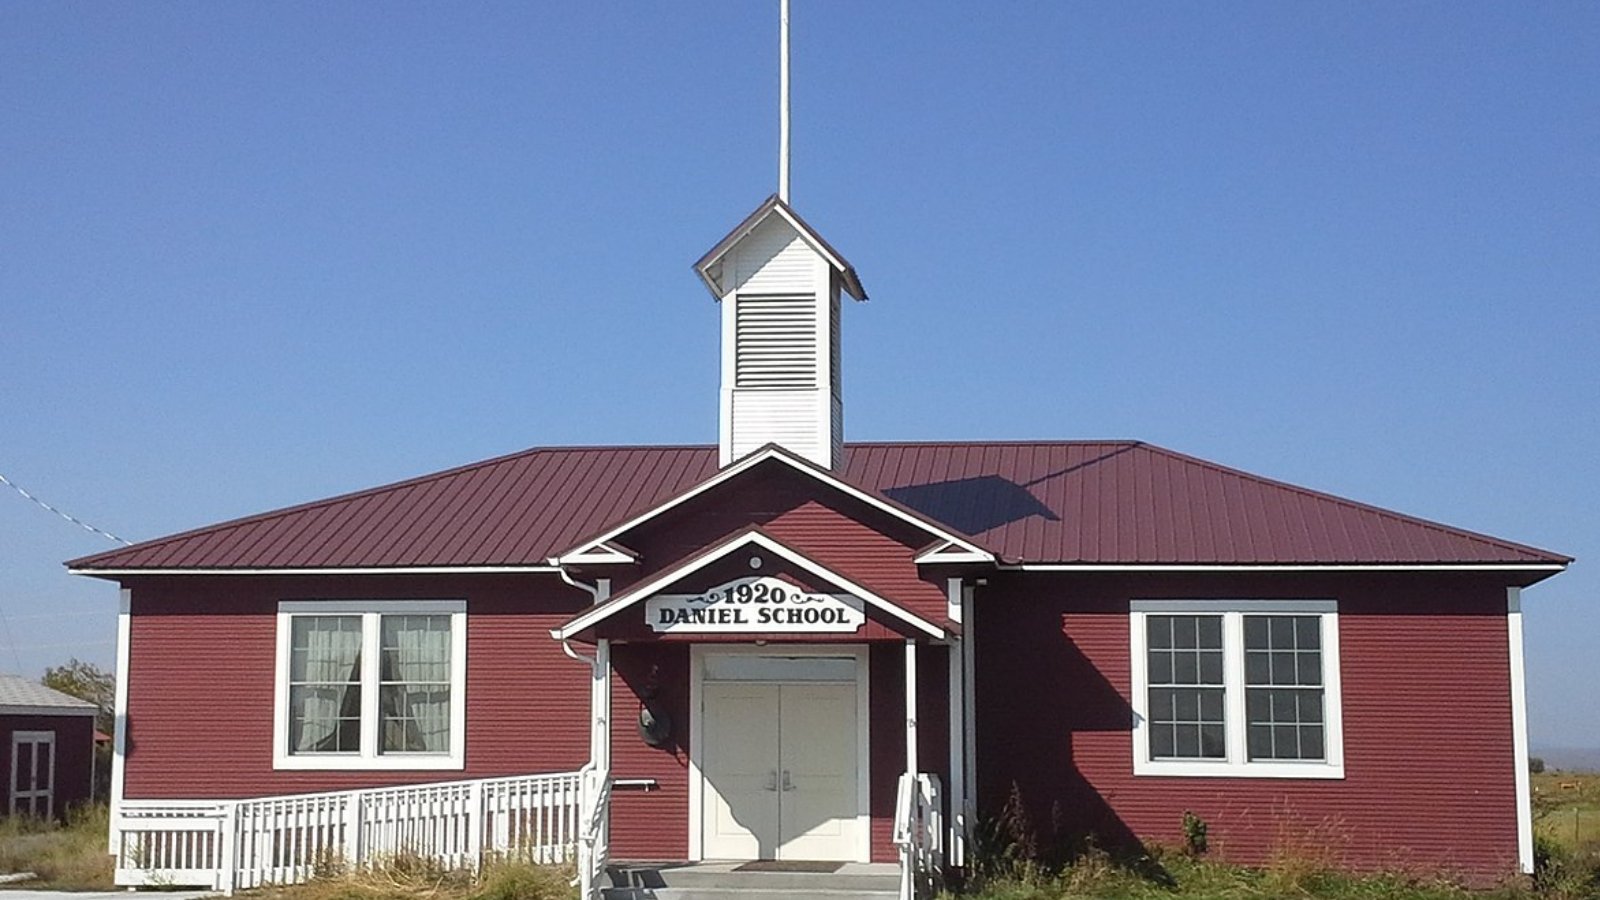
Daniel sits in Sublette County, where wide-open land and distant peaks define the landscape. The town is sparsely populated, but that hasn’t stopped prices from rising as buyers search for property away from tourist congestion.
This remote stretch of western Wyoming is now seeing increased buyer interest, particularly among those looking for second homes or rural retreats. With few listings, even modest demand has propelled prices skyward.
12. Carpenter – 112% Home Price Increase Since 2010
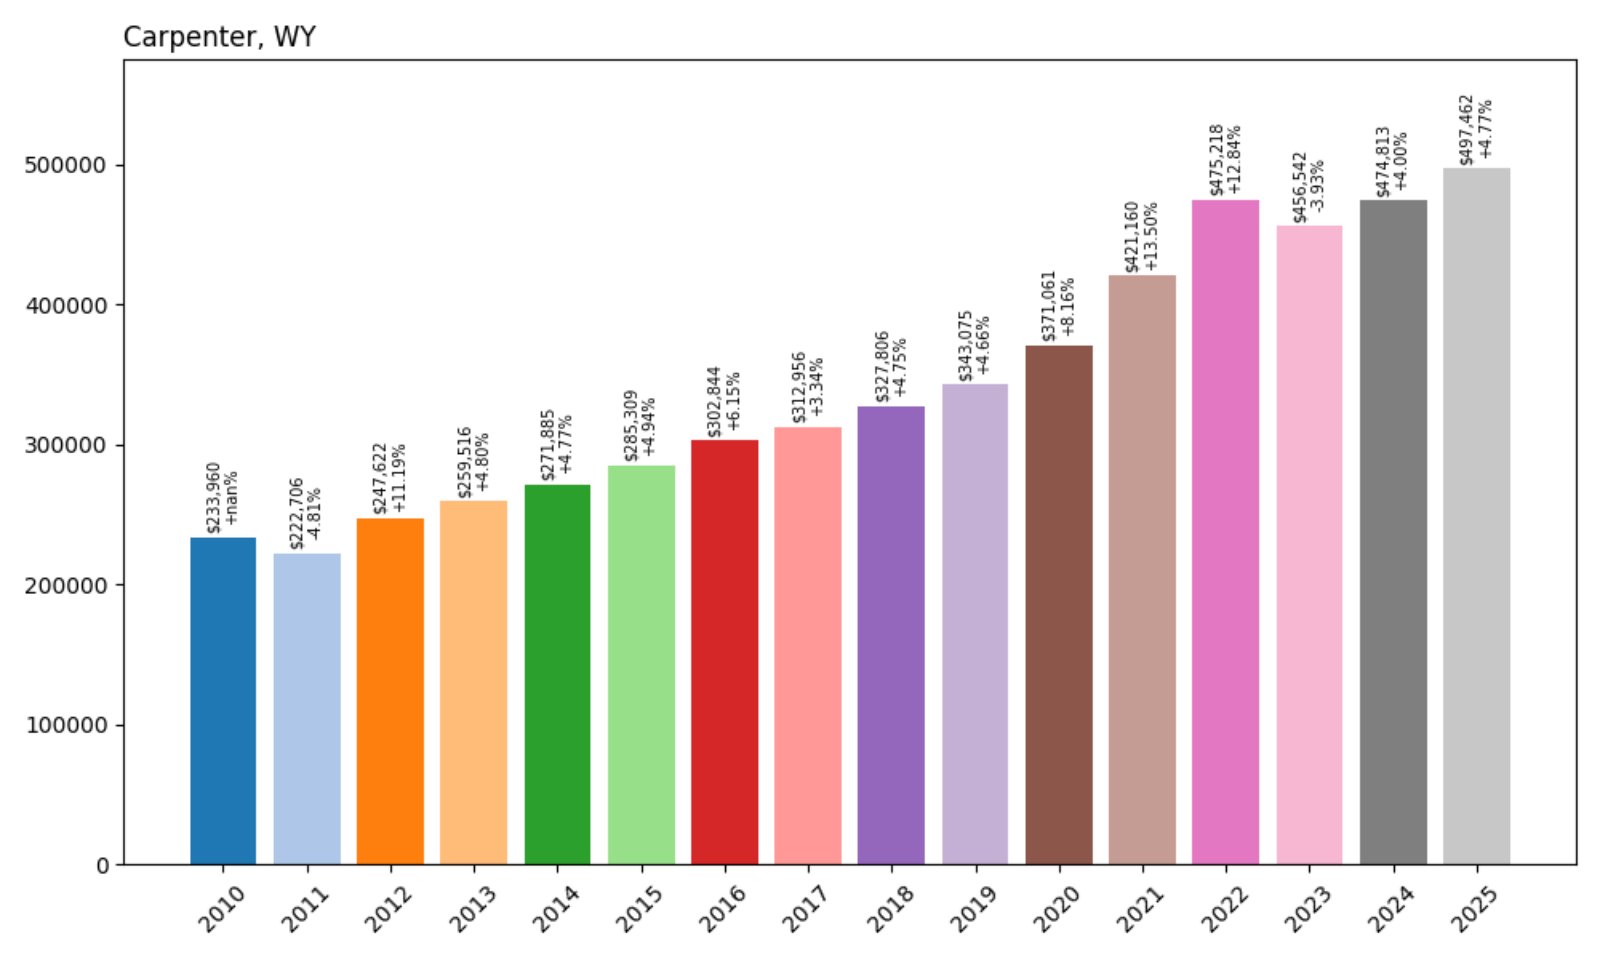
- 2010: $233,960
- 2011: $222,706 (−$11,254, −4.81% from previous year)
- 2012: $247,622 (+$24,915, +11.19% from previous year)
- 2013: $259,516 (+$11,894, +4.80% from previous year)
- 2014: $271,885 (+$12,369, +4.77% from previous year)
- 2015: $285,309 (+$13,424, +4.94% from previous year)
- 2016: $302,844 (+$17,535, +6.15% from previous year)
- 2017: $312,956 (+$10,111, +3.34% from previous year)
- 2018: $327,806 (+$14,851, +4.75% from previous year)
- 2019: $343,075 (+$15,269, +4.66% from previous year)
- 2020: $371,061 (+$27,987, +8.16% from previous year)
- 2021: $421,160 (+$50,098, +13.50% from previous year)
- 2022: $475,218 (+$54,058, +12.84% from previous year)
- 2023: $456,542 (−$18,676, −3.93% from previous year)
- 2024: $474,813 (+$18,271, +4.00% from previous year)
- 2025: $497,462 (+$22,649, +4.77% from previous year)
Carpenter has seen a 112% increase in home values since 2010, more than doubling over 15 years. Though it dipped slightly in 2023, prices bounced back and continued to rise in both 2024 and 2025.
Carpenter – Eastern Wyoming’s Consistent Climber
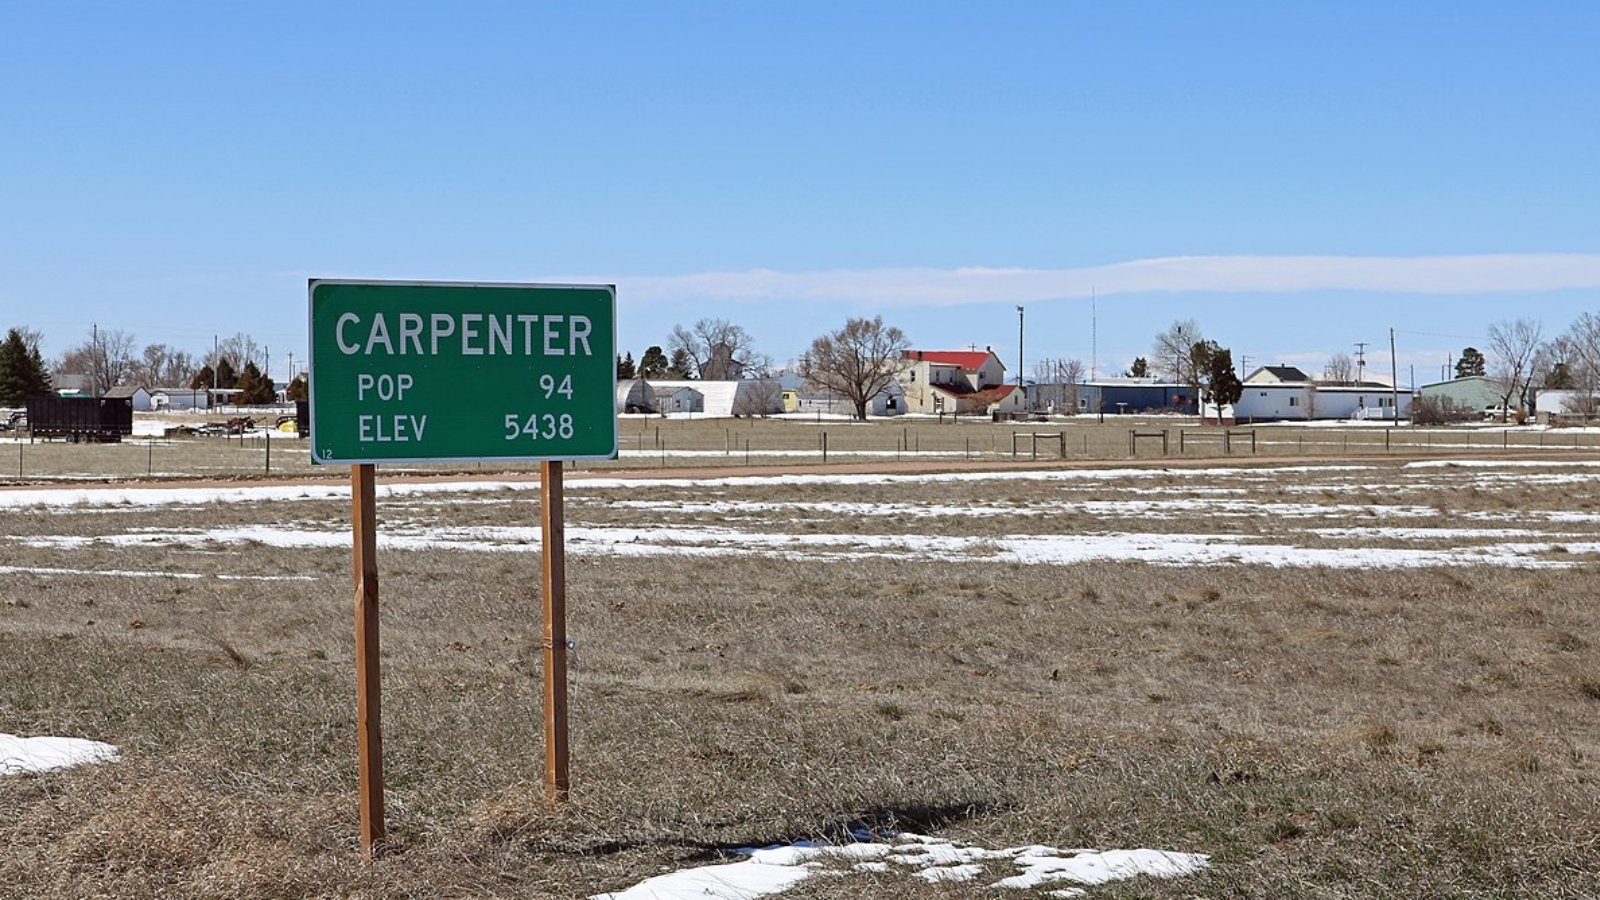
Located near the Nebraska border, Carpenter is a rural community in Laramie County that’s grown steadily in both population and price. Its appeal lies in affordable land, open space, and commuting distance to Cheyenne.
Strong gains in the 2020s pushed Carpenter firmly into Wyoming’s top tier of property markets. As buyers look east for affordability, this area remains well-positioned for continued growth.
11. Aladdin – 101% Home Price Increase Since 2016
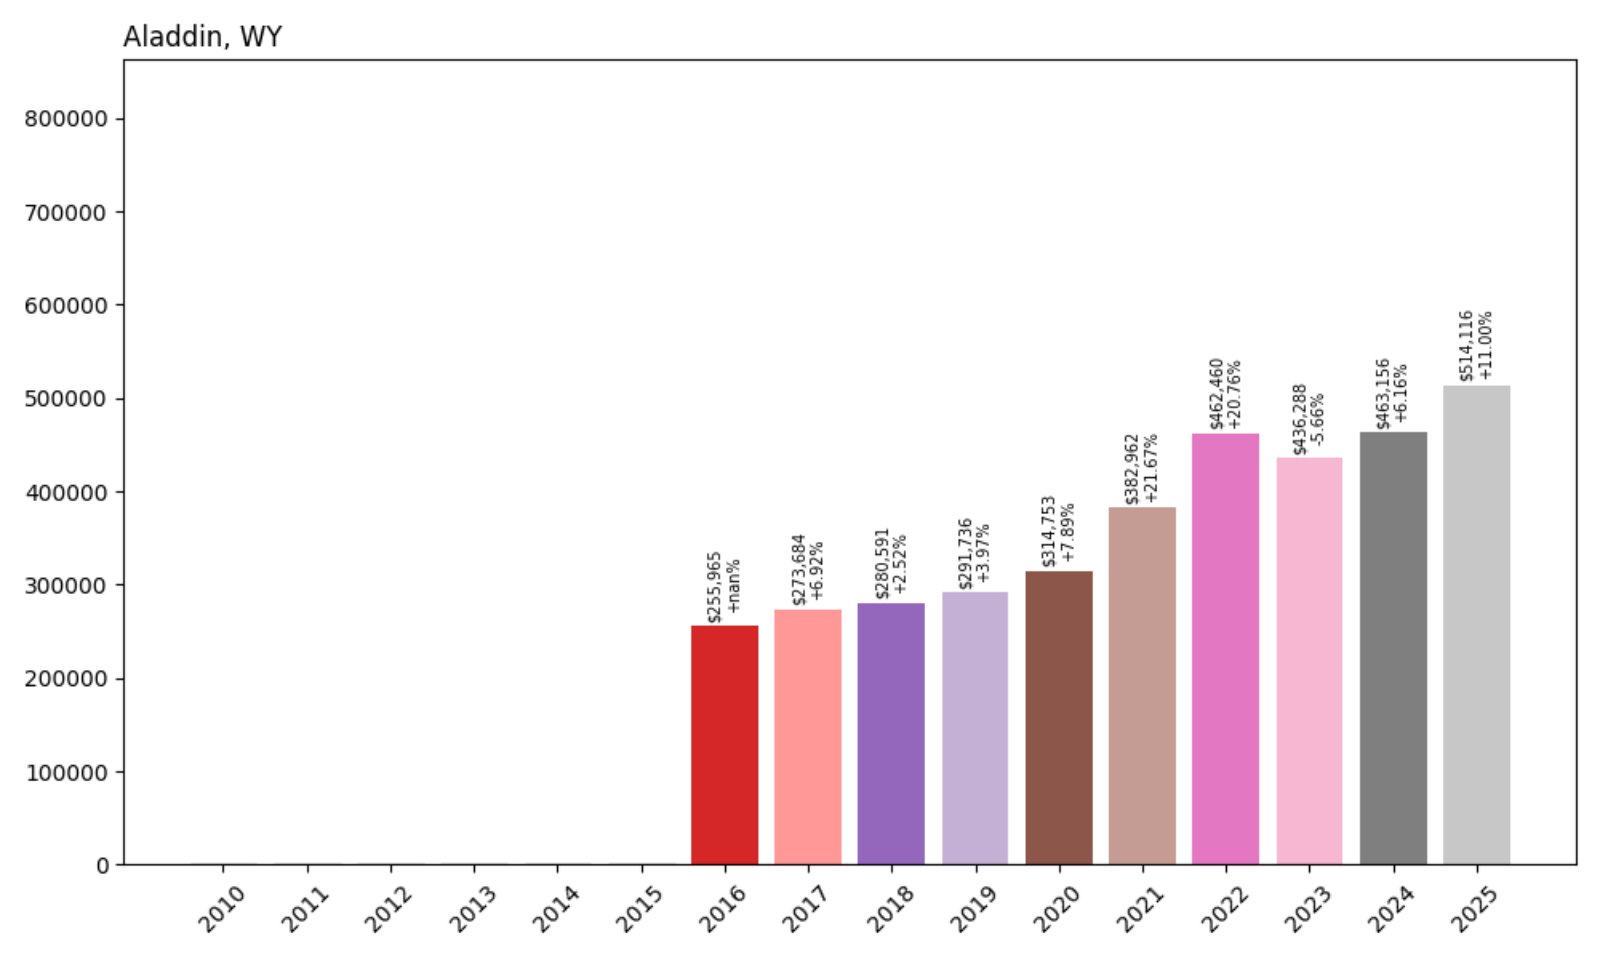
- 2016: $255,965
- 2017: $273,684 (+$17,718, +6.92% from previous year)
- 2018: $280,591 (+$6,907, +2.52% from previous year)
- 2019: $291,736 (+$11,145, +3.97% from previous year)
- 2020: $314,753 (+$23,017, +7.89% from previous year)
- 2021: $382,962 (+$68,209, +21.67% from previous year)
- 2022: $462,460 (+$79,498, +20.76% from previous year)
- 2023: $436,288 (−$26,172, −5.66% from previous year)
- 2024: $463,156 (+$26,868, +6.16% from previous year)
- 2025: $514,116 (+$50,960, +11.00% from previous year)
Aladdin has posted a 101% increase in home prices since 2016, bolstered by back-to-back 20%+ spikes in 2021 and 2022. Despite a dip in 2023, prices surged again in 2025 to reach a new high.
Aladdin – Eastern Edge Growth in Crook County
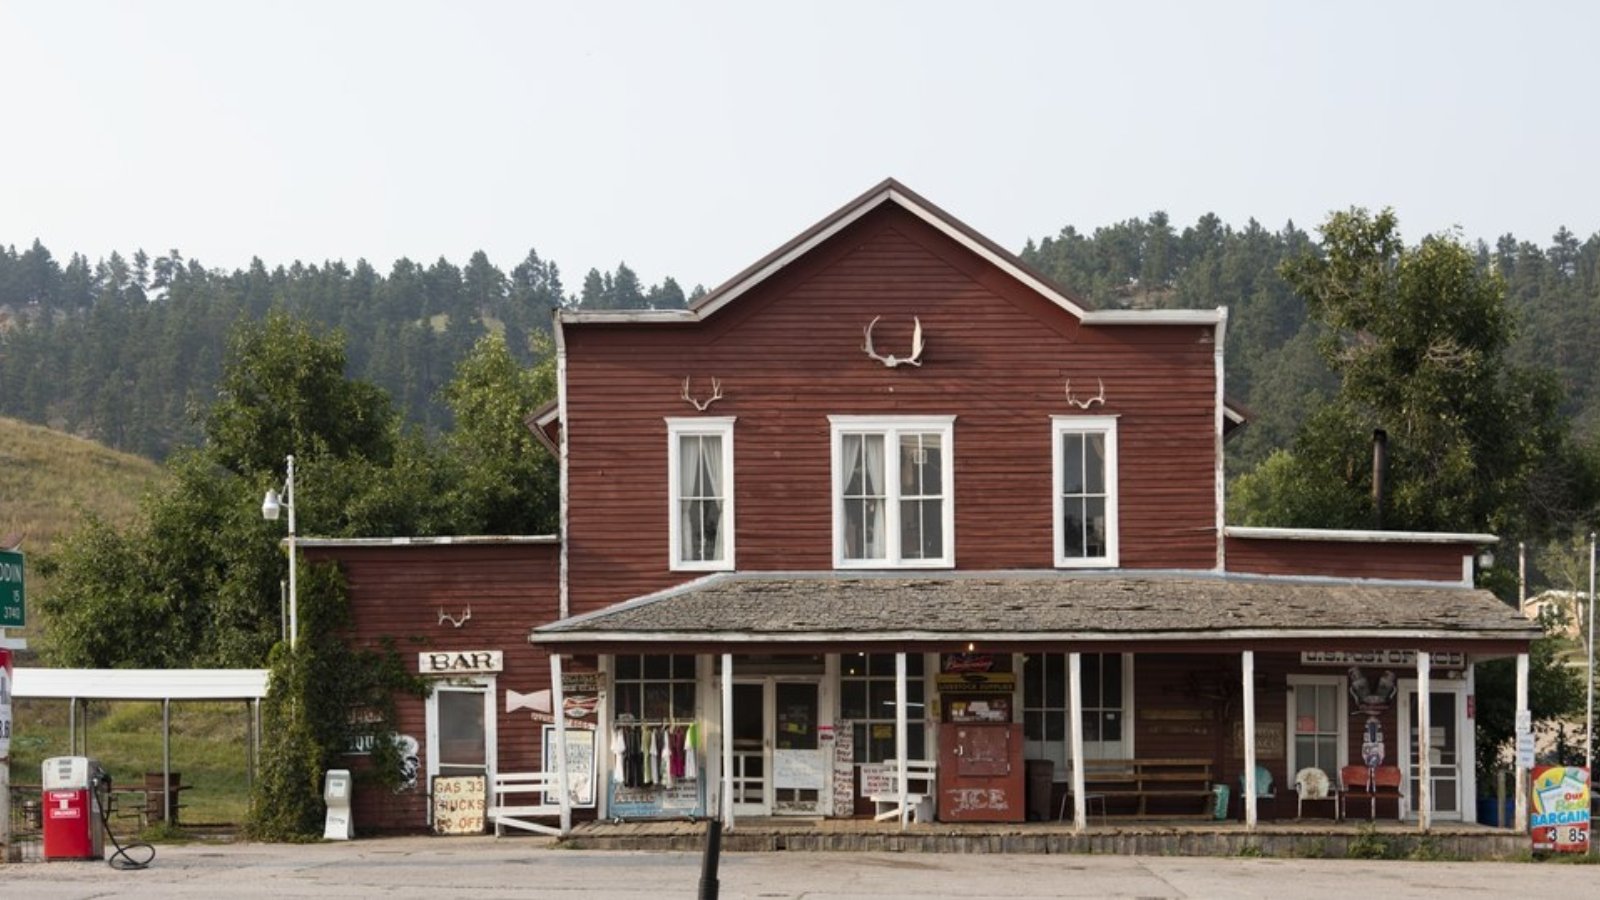
Aladdin is a tiny unincorporated town in Crook County with historical charm and open prairie appeal. With few listings and increasing interest in remote property, demand has quietly pushed this market higher than many would expect.
Its position near the Black Hills makes it appealing to buyers from South Dakota and Montana, while the limited housing stock contributes to frequent price jumps when sales do occur.
10. Cody – 126% Home Price Increase Since 2010

- 2010: $227,545
- 2011: $226,935 (−$610, −0.27% from previous year)
- 2012: $236,637 (+$9,702, +4.28% from previous year)
- 2013: $239,443 (+$2,807, +1.19% from previous year)
- 2014: $242,503 (+$3,060, +1.28% from previous year)
- 2015: $258,804 (+$16,301, +6.72% from previous year)
- 2016: $271,169 (+$12,365, +4.78% from previous year)
- 2017: $279,296 (+$8,127, +3.00% from previous year)
- 2018: $287,364 (+$8,068, +2.89% from previous year)
- 2019: $302,654 (+$15,291, +5.32% from previous year)
- 2020: $318,834 (+$16,180, +5.35% from previous year)
- 2021: $365,030 (+$46,196, +14.49% from previous year)
- 2022: $427,955 (+$62,924, +17.24% from previous year)
- 2023: $450,412 (+$22,457, +5.25% from previous year)
- 2024: $482,707 (+$32,295, +7.17% from previous year)
- 2025: $515,278 (+$32,571, +6.75% from previous year)
Home prices in Cody have soared 126% since 2010, driven by consistently strong annual growth. Gains in the last three years alone have added over $100,000 in value, confirming its position among Wyoming’s most in-demand towns.
Cody – Western Style With Lasting Market Strength
Cody’s unique blend of cowboy history, proximity to Yellowstone, and outdoor amenities has made it one of Wyoming’s most sought-after housing markets. It draws tourists, retirees, and out-of-state movers alike.
With strong demand and limited supply, prices continue to climb year after year. Whether it’s walkability in the historic downtown or quick access to scenic drives and rivers, Cody offers more than postcard views—it offers staying power in Wyoming real estate.
9. Banner – 83% Home Price Increase Since 2016
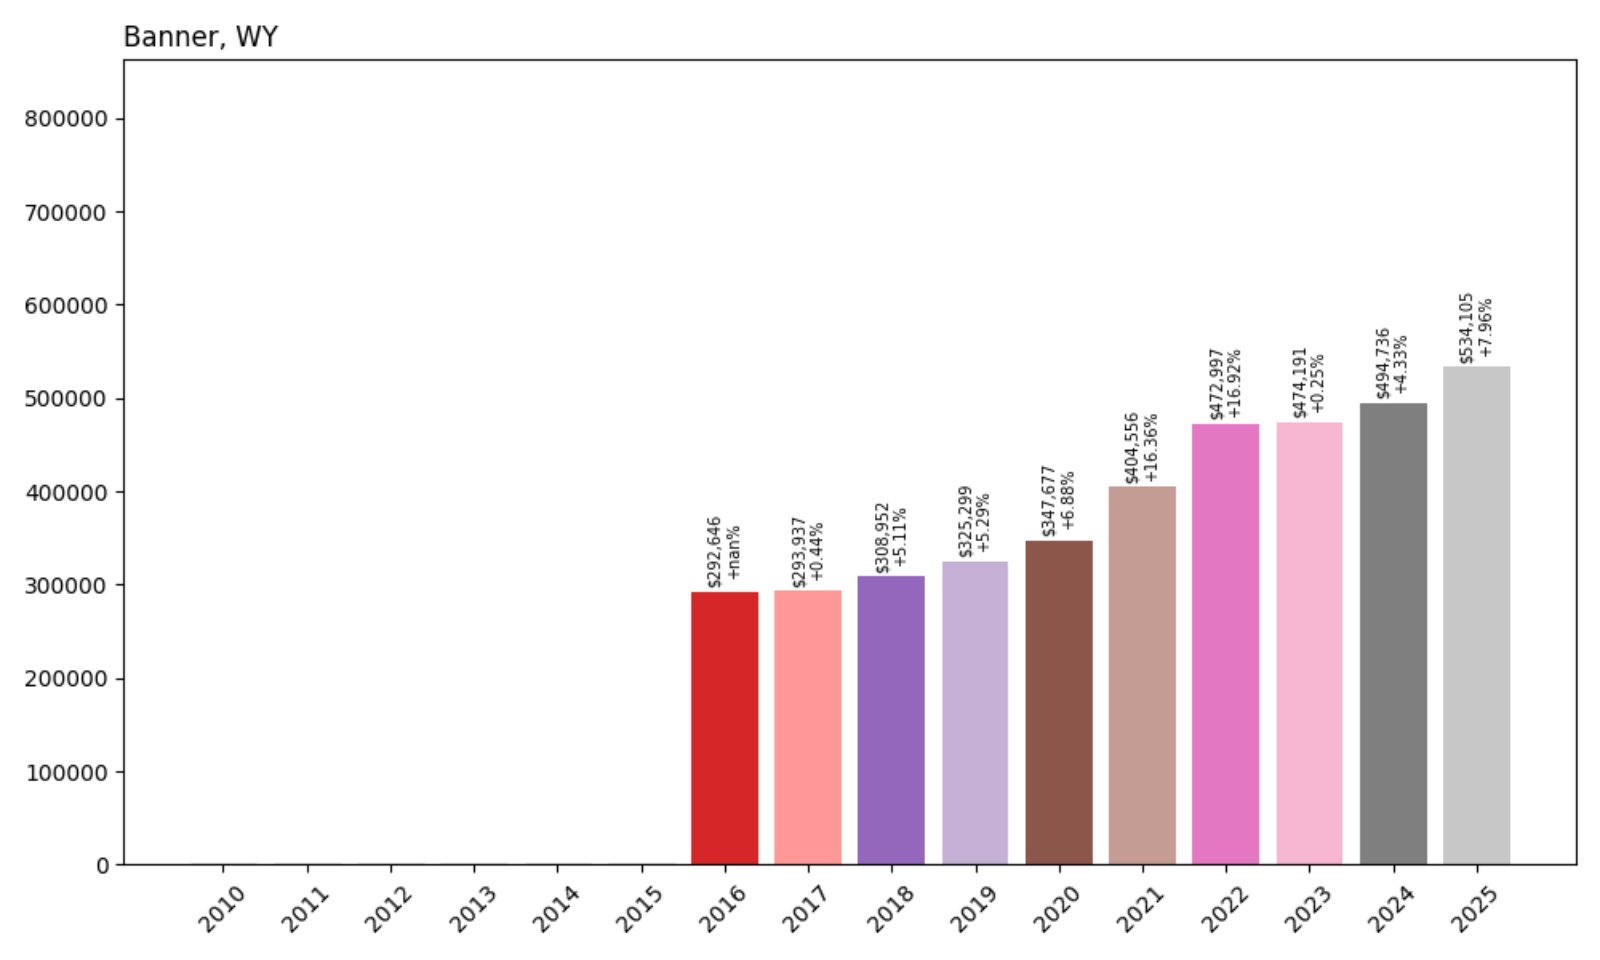
- 2016: $292,646
- 2017: $293,937 (+$1,291, +0.44% from previous year)
- 2018: $308,952 (+$15,015, +5.11% from previous year)
- 2019: $325,299 (+$16,346, +5.29% from previous year)
- 2020: $347,677 (+$22,378, +6.88% from previous year)
- 2021: $404,556 (+$56,879, +16.36% from previous year)
- 2022: $472,997 (+$68,441, +16.92% from previous year)
- 2023: $474,191 (+$1,195, +0.25% from previous year)
- 2024: $494,736 (+$20,545, +4.33% from previous year)
- 2025: $534,105 (+$39,369, +7.96% from previous year)
Banner’s home prices have climbed 83% since 2016. After steady growth early on, the town posted massive gains in 2021 and 2022, followed by a stable run into 2025 with moderate but consistent increases.
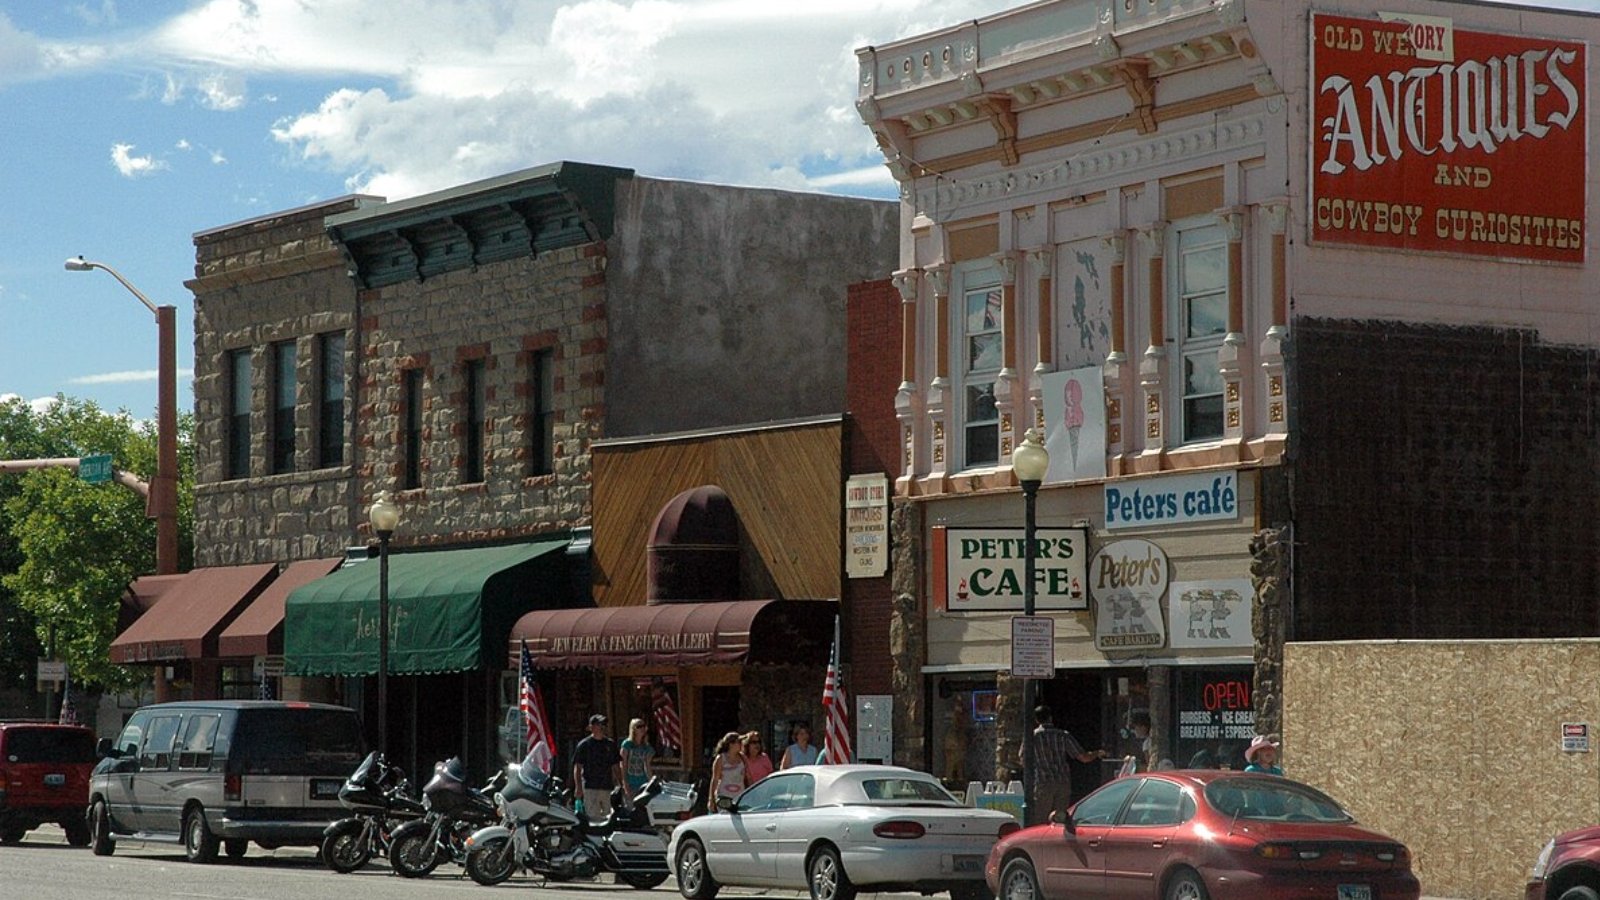
Banner – Hidden Elegance in the Bighorns
Located just south of Sheridan, Banner is a quiet and upscale rural enclave at the base of the Bighorn Mountains. Its scenic setting, limited housing supply, and proximity to outdoor recreation have made it an attractive spot for higher-income buyers looking for space and serenity.
As more buyers from out of state look to settle near nature with access to modern amenities, Banner has emerged as a luxury alternative to more crowded mountain towns—reflected clearly in its rising price tag.
8. Clearmont – 87% Home Price Increase Since 2017
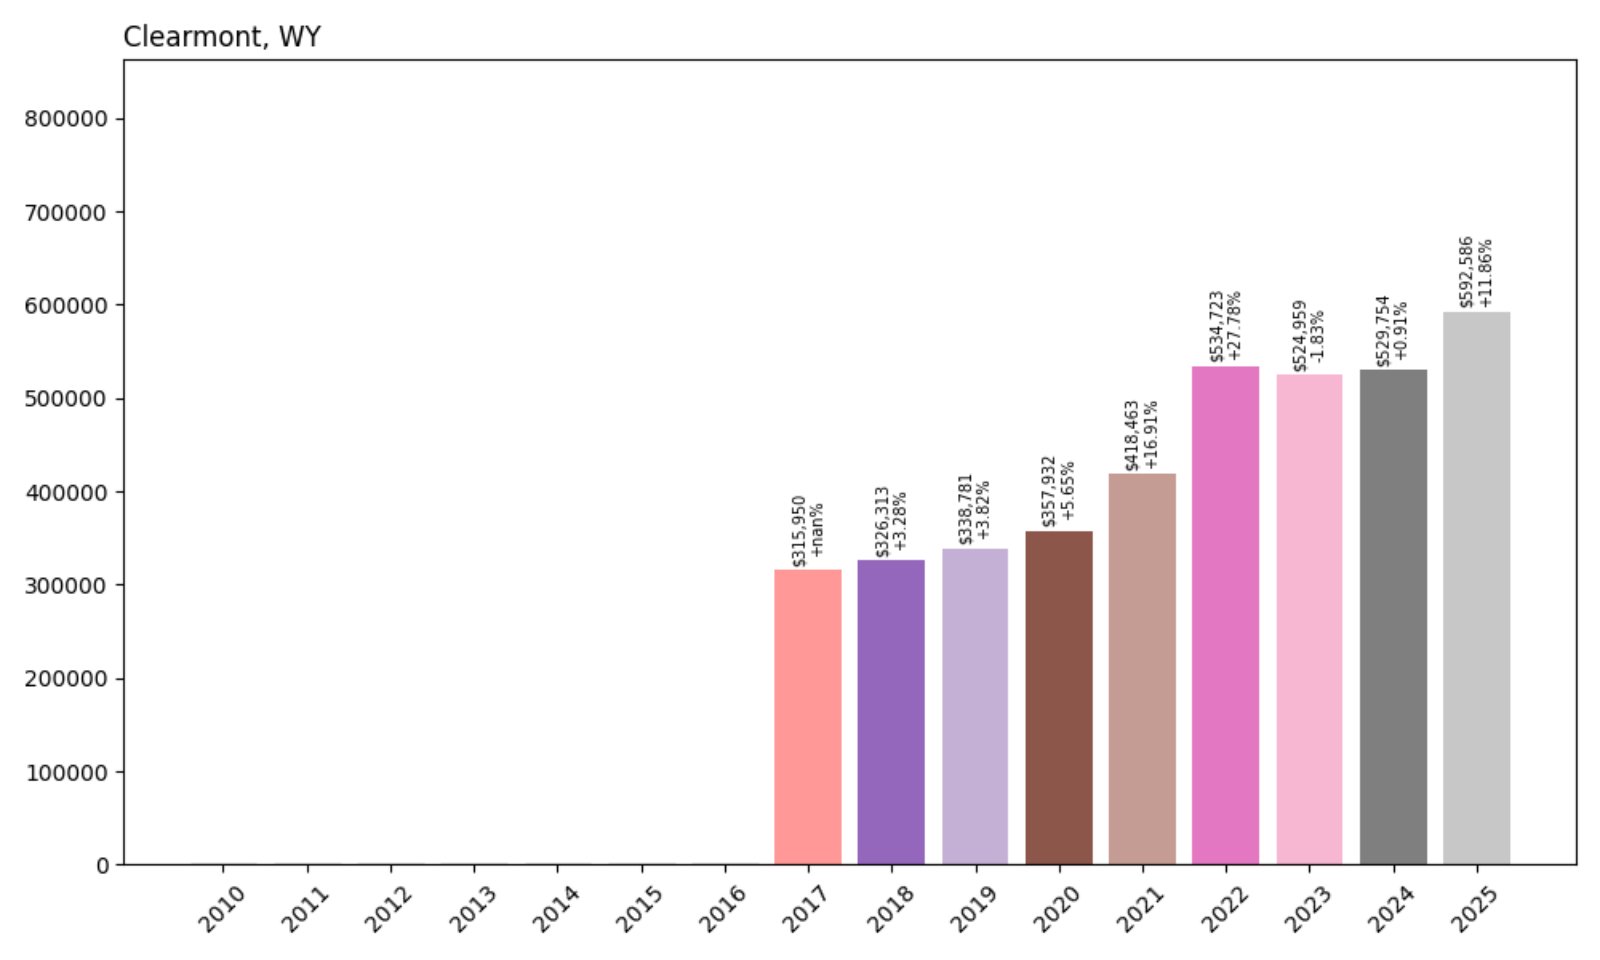
- 2017: $315,950
- 2018: $326,313 (+$10,363, +3.28% from previous year)
- 2019: $338,781 (+$12,468, +3.82% from previous year)
- 2020: $357,932 (+$19,151, +5.65% from previous year)
- 2021: $418,463 (+$60,531, +16.91% from previous year)
- 2022: $534,723 (+$116,260, +27.78% from previous year)
- 2023: $524,959 (−$9,764, −1.83% from previous year)
- 2024: $529,754 (+$4,795, +0.91% from previous year)
- 2025: $592,586 (+$62,832, +11.86% from previous year)
Clearmont’s home prices have surged by 87% since 2017, with standout growth in 2021 and a huge leap in 2022. After a small correction, 2025 brought another big increase, pushing values to their highest yet.
Clearmont – Big Growth in a Small Package
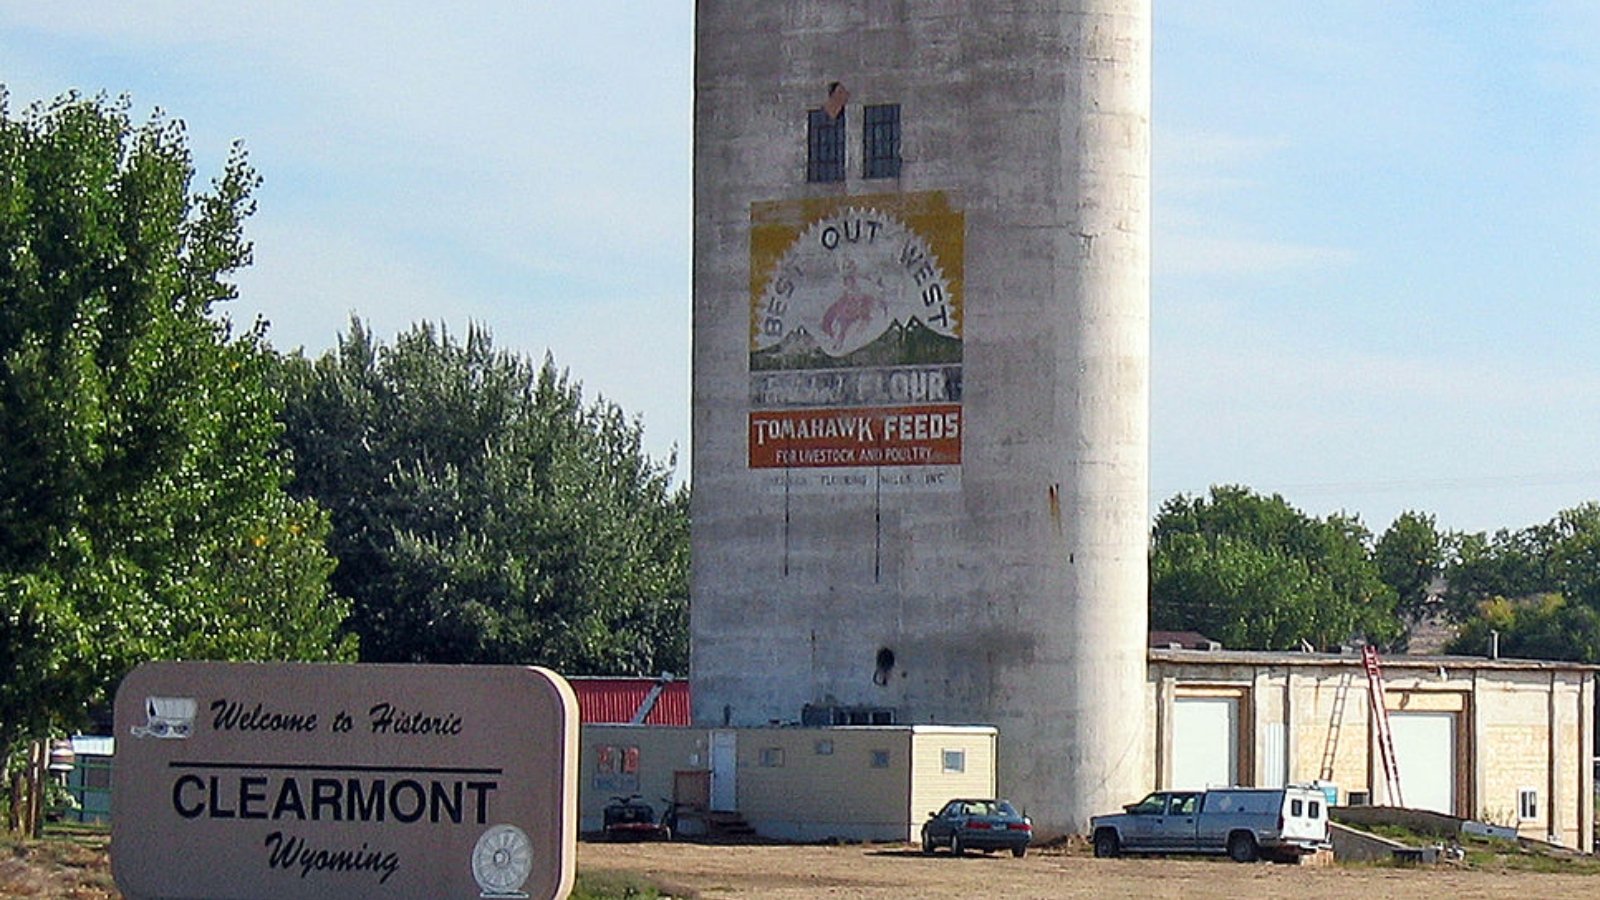
Clearmont is a tiny town in Sheridan County with fewer than 200 residents, but that hasn’t stopped it from becoming one of the state’s top performers in real estate. Buyers are drawn to its affordability, access to Sheridan, and peaceful setting along Clear Creek.
With few listings and increased interest in rural living, competition in Clearmont has helped drive prices upward. It’s a reminder that even Wyoming’s smallest towns can become investment hotspots when supply is limited and demand grows.
7. Cora – 61% Home Price Increase Since 2017
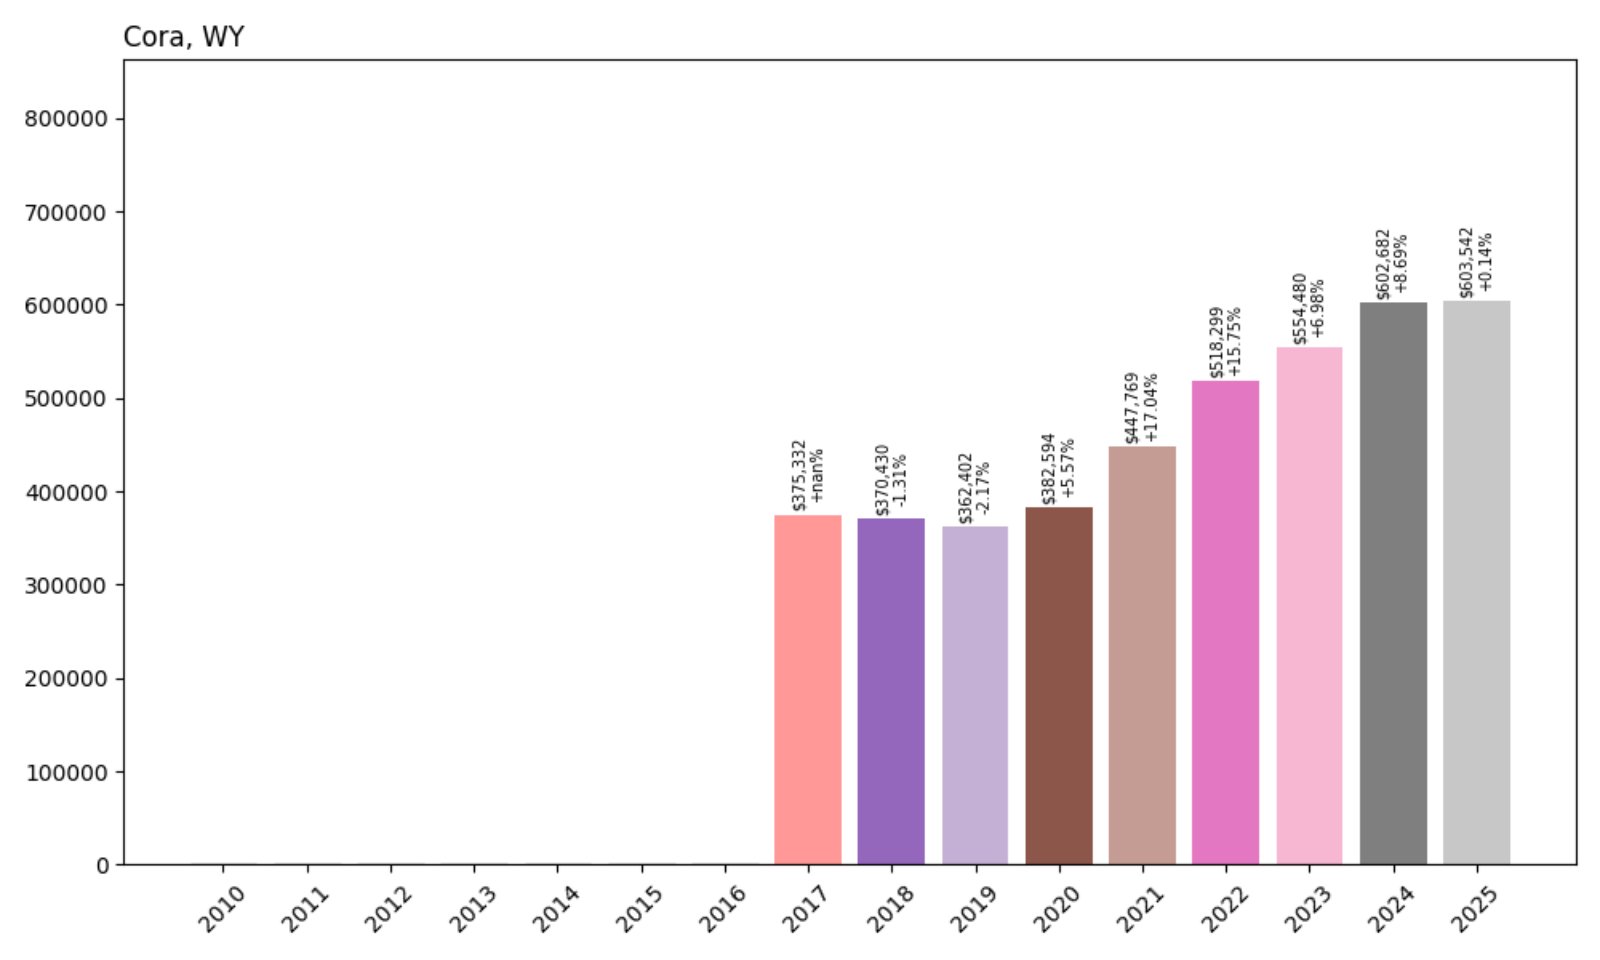
- 2017: $375,332
- 2018: $370,430 (−$4,902, −1.31% from previous year)
- 2019: $362,402 (−$8,028, −2.17% from previous year)
- 2020: $382,594 (+$20,192, +5.57% from previous year)
- 2021: $447,769 (+$65,175, +17.04% from previous year)
- 2022: $518,299 (+$70,530, +15.75% from previous year)
- 2023: $554,480 (+$36,181, +6.98% from previous year)
- 2024: $602,682 (+$48,202, +8.69% from previous year)
- 2025: $603,542 (+$860, +0.14% from previous year)
Cora’s home values are up 61% since 2017, with the strongest momentum between 2020 and 2022. Growth has slowed recently, but values remain high and stable heading into 2025.
Cora – A Tiny Town With Big Value
Cora is an unincorporated community in Sublette County near Pinedale. Surrounded by high plains and mountain views, it offers a mix of rural charm and modern price tags. Its limited housing stock and scenic setting have made it desirable among out-of-state buyers and long-term landowners.
Though growth has flattened in the past year, Cora remains one of Wyoming’s most expensive rural markets—proof that demand for beauty and quiet is as strong as ever.
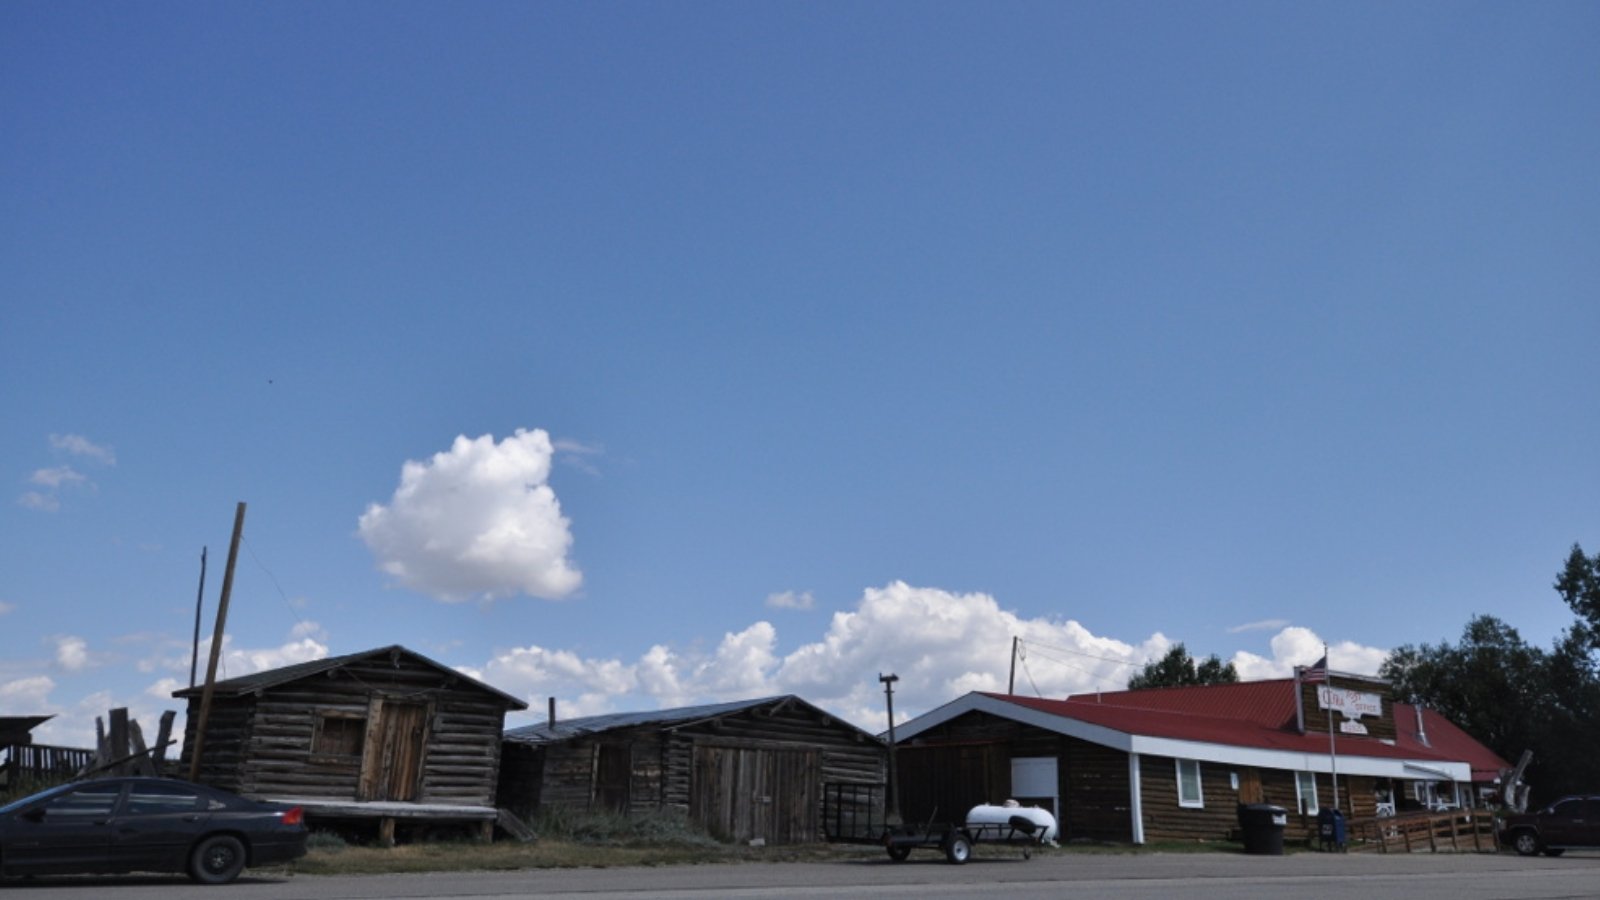
6. Parkman – 73% Home Price Increase Since 2017
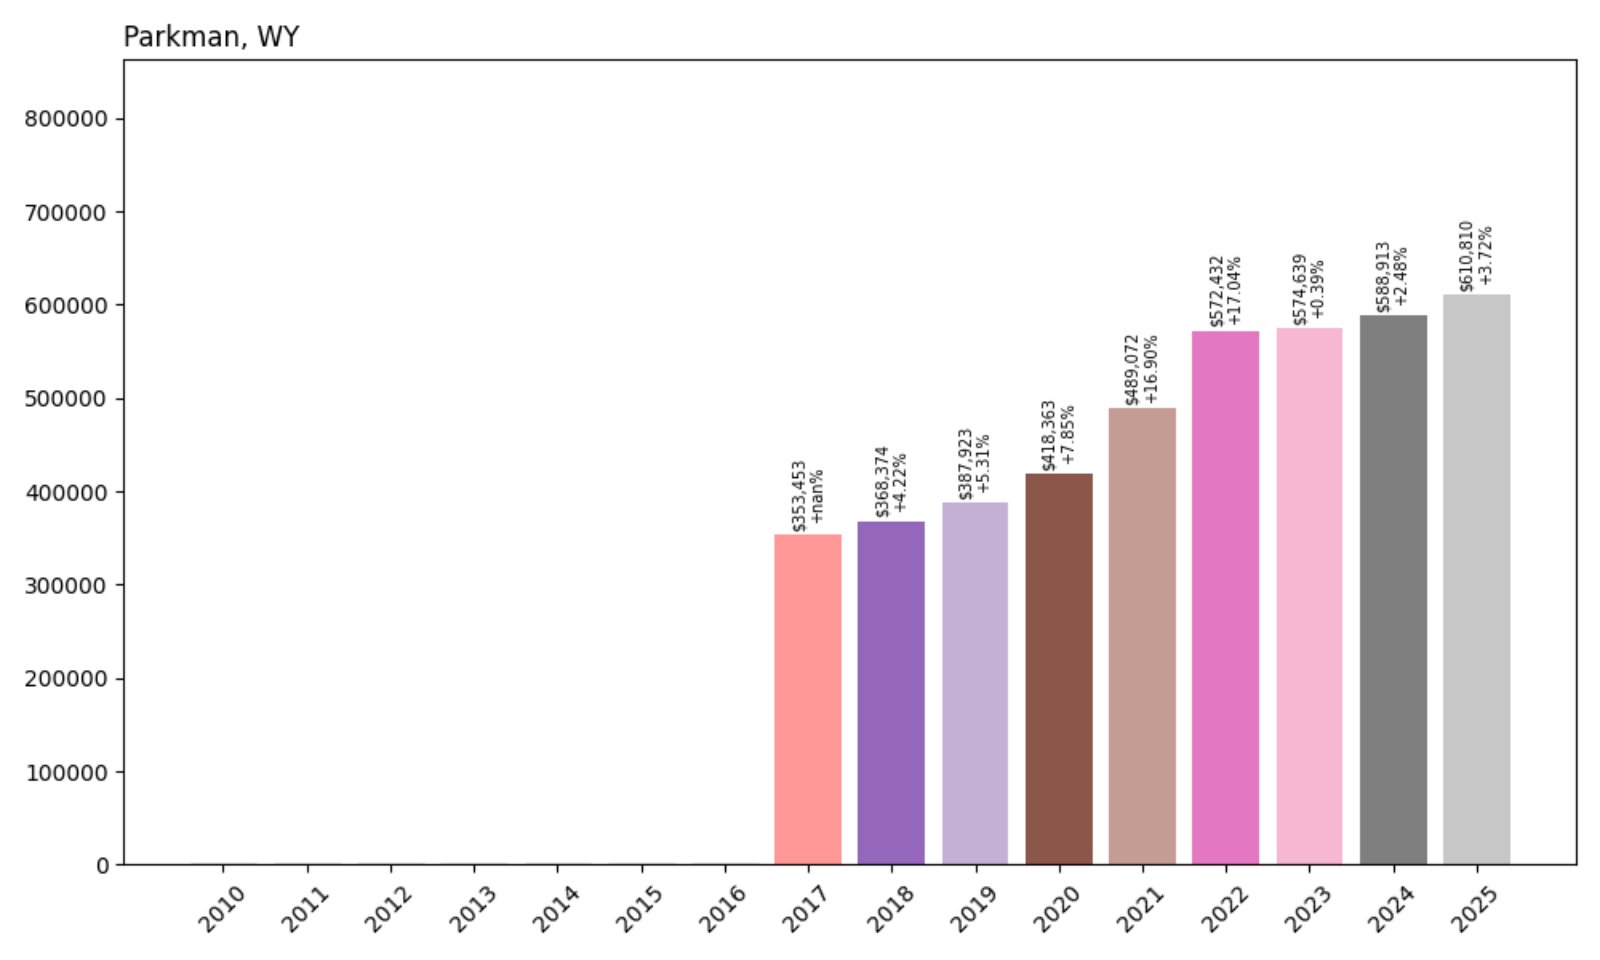
- 2017: $353,453
- 2018: $368,374 (+$14,921, +4.22% from previous year)
- 2019: $387,923 (+$19,549, +5.31% from previous year)
- 2020: $418,363 (+$30,440, +7.85% from previous year)
- 2021: $489,072 (+$70,709, +16.90% from previous year)
- 2022: $572,432 (+$83,360, +17.04% from previous year)
- 2023: $574,639 (+$2,207, +0.39% from previous year)
- 2024: $588,913 (+$14,274, +2.48% from previous year)
- 2025: $610,810 (+$21,898, +3.72% from previous year)
Parkman’s home prices have increased by 73% since 2017. The steepest growth occurred in 2021 and 2022, with values continuing a slower upward trend into 2025.
Parkman – High Prices in a Low-Key Setting
Located just north of Sheridan near the Montana border, Parkman is a small but increasingly expensive place to buy property. Its appeal lies in privacy, open land, and access to both states for work or recreation.
With buyers seeking quiet alternatives to city life, Parkman has seen prices surge. Even with modest population growth, home values continue climbing due to limited inventory and a strong reputation among those who know the area.
5. Alpine – 6% Home Price Increase Since 2023

- 2023: $666,528
- 2024: $696,939 (+$30,410, +4.56% from previous year)
- 2025: $706,864 (+$9,925, +1.42% from previous year)
Though data is only available since 2023, Alpine has already posted a 6% price increase in just two years. This growth, while modest compared to others, reinforces Alpine’s position near the top of Wyoming’s real estate market.
Alpine – Scenic Living at the Junction of Rivers and Mountains

Located at the confluence of the Snake, Salt, and Greys Rivers, Alpine is a gem in Lincoln County with stunning views and proximity to Jackson. As one of the state’s fastest-growing towns, it draws full-time residents and vacation homeowners alike.
Its rising prices reflect its desirability, especially for those priced out of Jackson. With lake access, outdoor adventure, and room to grow, Alpine’s high home values are no surprise to anyone who has spent time there.
4. Moran – 92% Home Price Increase Since 2016

- 2016: $726,229
- 2017: $776,510 (+$50,281, +6.93% from previous year)
- 2018: $814,318 (+$37,808, +4.87% from previous year)
- 2019: $866,659 (+$52,341, +6.43% from previous year)
- 2020: $934,574 (+$67,915, +7.84% from previous year)
- 2021: $1,153,151 (+$218,577, +23.39% from previous year)
- 2022: $1,431,009 (+$277,858, +24.09% from previous year)
- 2023: $1,511,712 (+$80,703, +5.64% from previous year)
- 2024: $1,582,004 (+$70,291, +4.65% from previous year)
- 2025: $1,657,031 (+$75,027, +4.74% from previous year)
Home prices in Moran have risen 92% since 2016. The town experienced especially rapid gains between 2020 and 2022, with the market continuing its upward trend into 2025.
Moran – Remote Wilderness With Million-Dollar Views

Located at the eastern edge of Grand Teton National Park, Moran combines natural grandeur with real estate scarcity. It’s one of the most scenic areas in Wyoming, attracting high-net-worth buyers seeking privacy, acreage, and proximity to world-class outdoor recreation.
Limited housing inventory and strict land protections keep Moran’s property values high. As a gateway to the Tetons, this tiny enclave offers both seclusion and serious long-term investment appeal.
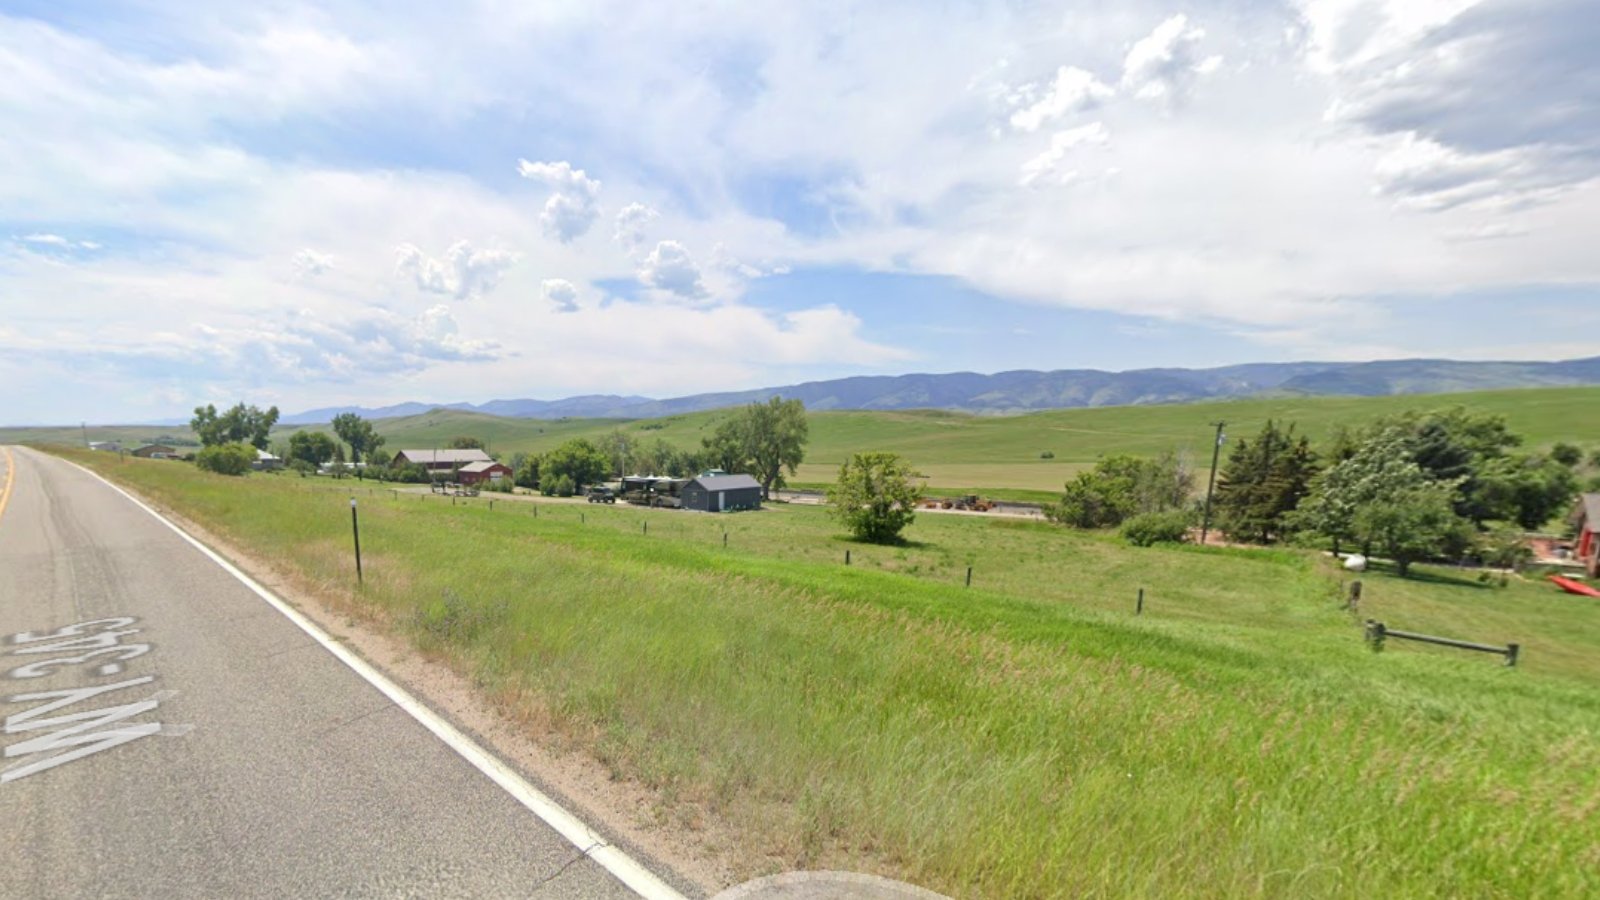
3. Alta – 122% Home Price Increase Since 2016
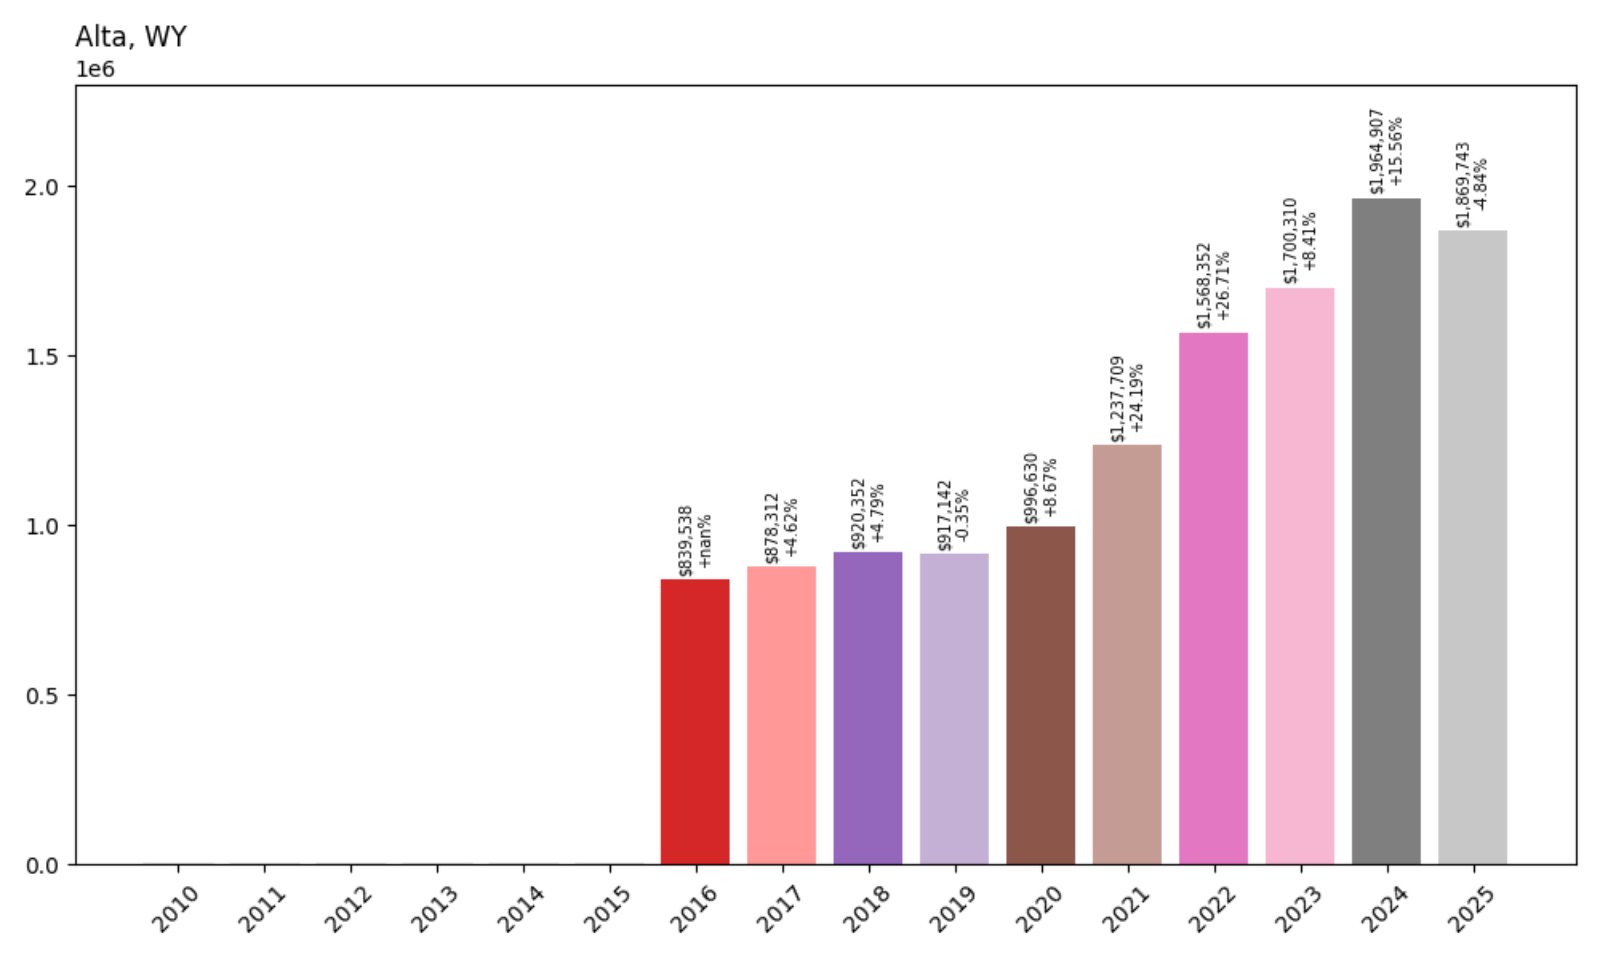
- 2016: $839,538
- 2017: $878,312 (+$38,774, +4.62% from previous year)
- 2018: $920,352 (+$42,041, +4.79% from previous year)
- 2019: $917,142 (−$3,210, −0.35% from previous year)
- 2020: $986,498 (+$69,355, +7.56% from previous year)
- 2021: $1,194,699 (+$208,200, +21.11% from previous year)
- 2022: $1,483,564 (+$288,865, +24.18% from previous year)
- 2023: $1,637,548 (+$153,984, +10.38% from previous year)
- 2024: $1,786,804 (+$149,256, +9.12% from previous year)
- 2025: $1,869,743 (+$82,939, +4.64% from previous year)
Alta’s home values have jumped 122% since 2016, with especially sharp increases between 2020 and 2022. Even with some slowing in 2025, it remains one of the priciest markets in the state.
Alta – Ski Town Prestige Without the Crowds
Sitting just over the Teton Pass from Jackson, Alta is home to rural tranquility and high-end living. It offers access to Grand Targhee Resort and draws skiers, outdoor enthusiasts, and second-home buyers looking for space and seclusion.
Alta’s appeal is strengthened by its views, proximity to Idaho, and relative quiet compared to Jackson. These factors have driven up demand—and prices—year after year.
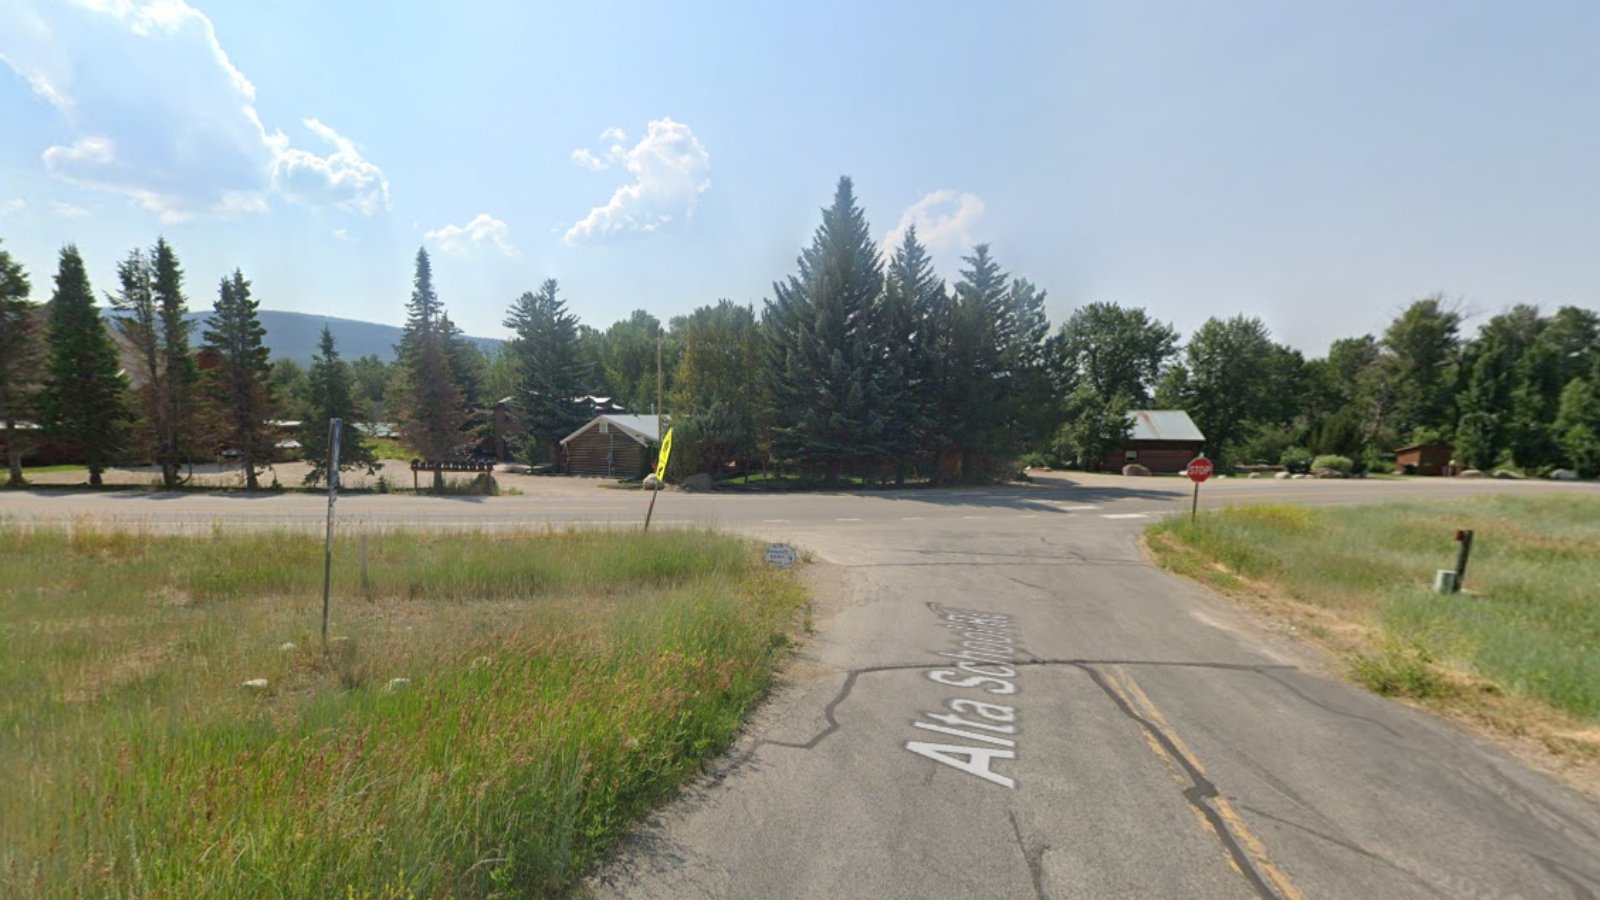
2. Jackson – 246% Home Price Increase Since 2010
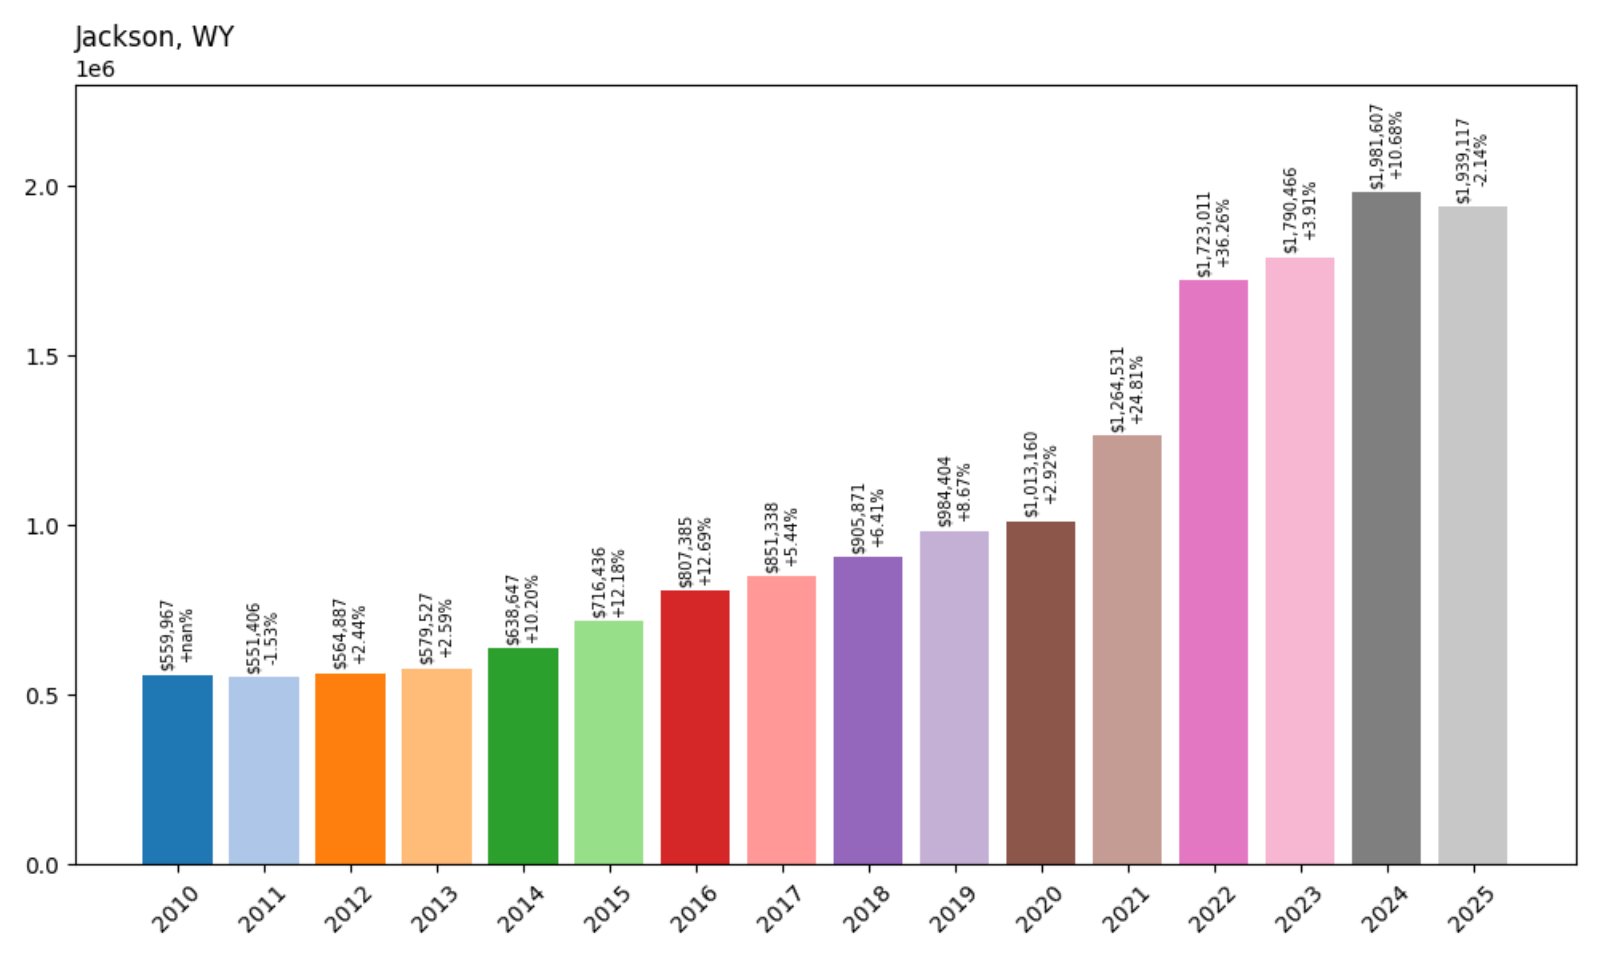
- 2010: $559,967
- 2011: $551,406 (−$8,561, −1.53% from previous year)
- 2012: $564,887 (+$13,481, +2.45% from previous year)
- 2013: $579,527 (+$14,640, +2.59% from previous year)
- 2014: $638,647 (+$59,120, +10.20% from previous year)
- 2015: $716,436 (+$77,789, +12.18% from previous year)
- 2016: $807,385 (+$90,949, +12.70% from previous year)
- 2017: $851,338 (+$43,953, +5.45% from previous year)
- 2018: $905,871 (+$54,533, +6.41% from previous year)
- 2019: $984,404 (+$78,533, +8.67% from previous year)
- 2020: $1,100,725 (+$116,321, +11.82% from previous year)
- 2021: $1,374,170 (+$273,445, +24.85% from previous year)
- 2022: $1,703,881 (+$329,711, +23.99% from previous year)
- 2023: $1,786,681 (+$82,800, +4.86% from previous year)
- 2024: $1,852,609 (+$65,928, +3.69% from previous year)
- 2025: $1,939,117 (+$86,508, +4.67% from previous year)
Jackson’s real estate market has seen a 246% increase since 2010, with monumental growth post-2020. In 2025, it remains one of the most elite and expensive towns not just in Wyoming—but the entire Rocky Mountain region.
Jackson – The Epicenter of Wyoming Luxury
Jackson is synonymous with luxury living. Nestled in the Jackson Hole valley, it offers unrivaled scenery, a booming economy, and access to some of the most exclusive ski resorts and wilderness in the country.
From celebrities to tech executives, buyers continue to flock to Jackson, pushing demand and values through the roof. High land costs, zoning limitations, and global interest all contribute to its sky-high pricing.
1. Wilson – 229% Home Price Increase Since 2010
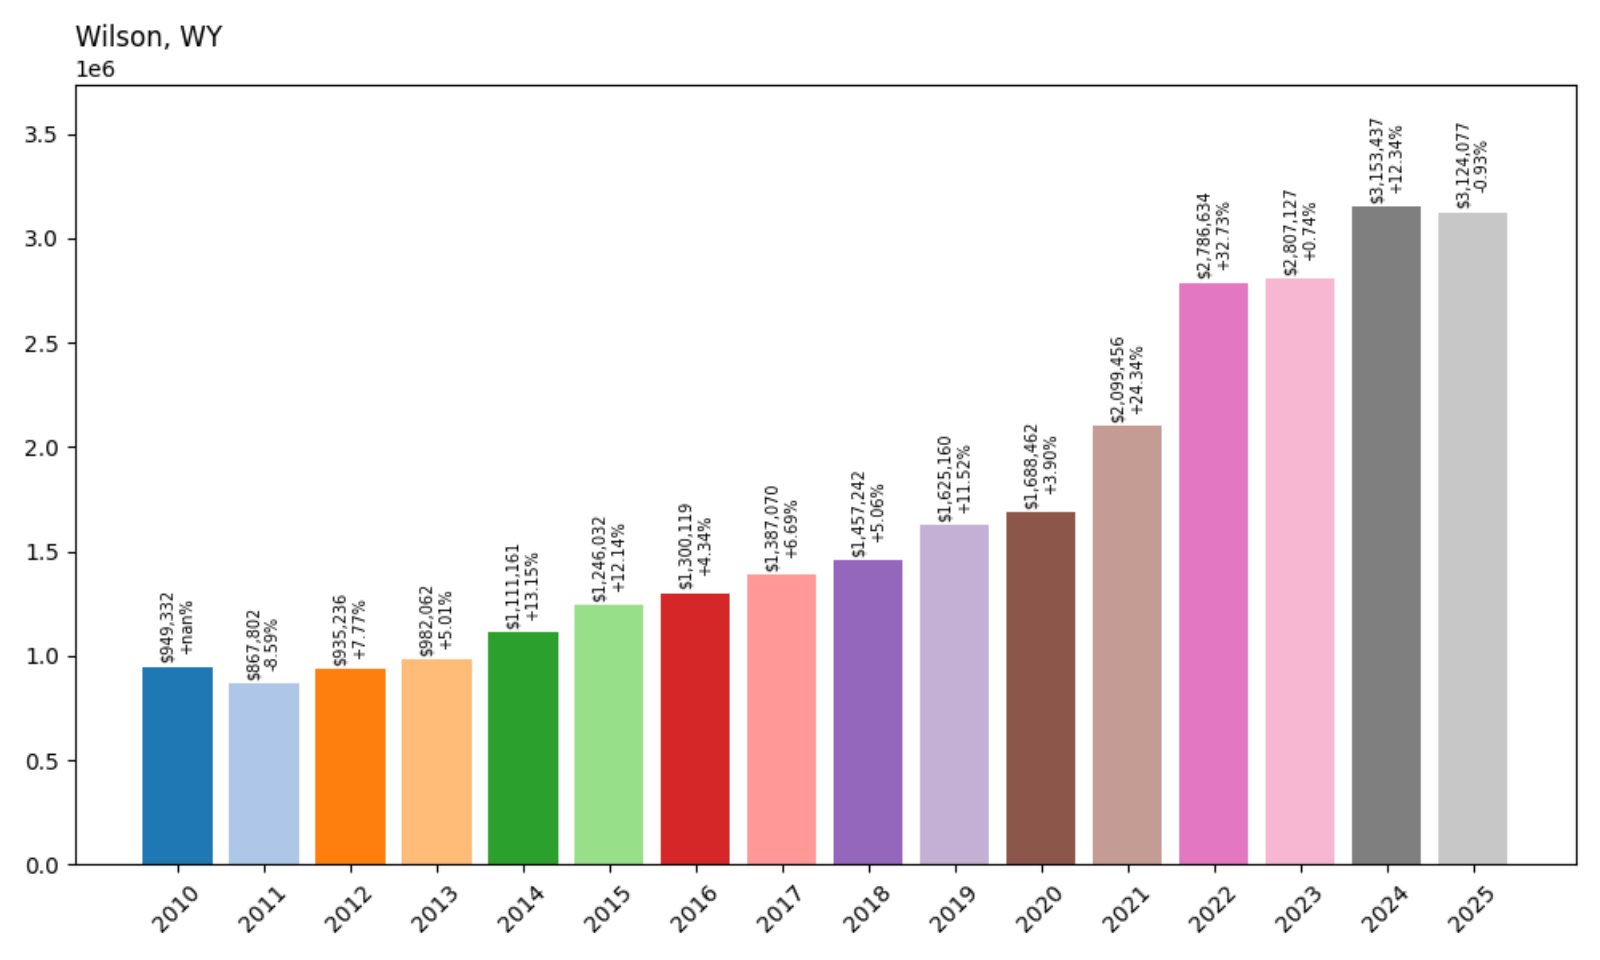
- 2010: $949,332
- 2011: $867,802 (−$81,530, −8.59% from previous year)
- 2012: $935,236 (+$67,434, +7.77% from previous year)
- 2013: $982,062 (+$46,826, +5.01% from previous year)
- 2014: $1,111,161 (+$129,099, +13.14% from previous year)
- 2015: $1,246,032 (+$134,871, +12.14% from previous year)
- 2016: $1,300,119 (+$54,087, +4.34% from previous year)
- 2017: $1,387,070 (+$86,951, +6.69% from previous year)
- 2018: $1,457,242 (+$70,172, +5.06% from previous year)
- 2019: $1,625,160 (+$167,918, +11.52% from previous year)
- 2020: $1,739,513 (+$114,353, +7.04% from previous year)
- 2021: $2,093,079 (+$353,566, +20.33% from previous year)
- 2022: $2,506,168 (+$413,089, +19.73% from previous year)
- 2023: $2,792,747 (+$286,579, +11.43% from previous year)
- 2024: $2,949,607 (+$156,860, +5.62% from previous year)
- 2025: $3,124,077 (+$174,470, +5.91% from previous year)
Wilson tops the list as Wyoming’s most expensive town in 2025, with a 229% rise in home values since 2010. Prices have tripled, with the median value now above $3.1 million.
Wilson – Wyoming’s Most Exclusive Address
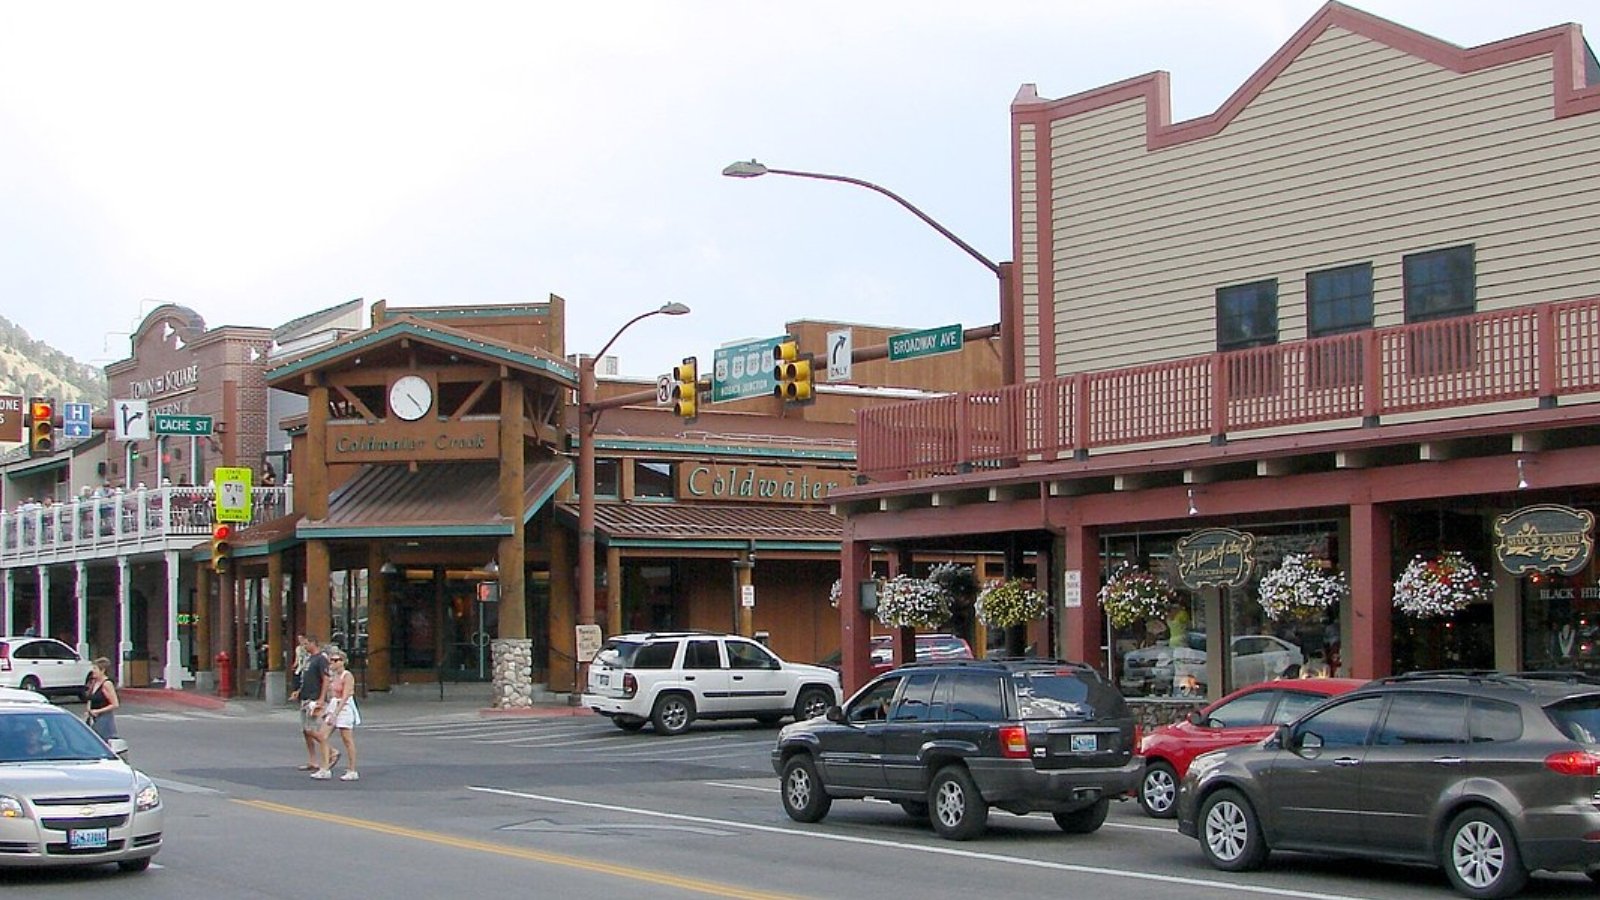
Located west of Jackson along the base of Teton Pass, Wilson is known for privacy, affluence, and proximity to both nature and high-end amenities. With large estates, mountain views, and access to both ski resorts and backcountry trails, it attracts elite buyers.
Land is limited and demand is persistent. Wilson’s status as Wyoming’s wealthiest zip code is reflected in its stratospheric home values—making it the clear number one on this list.