Would you like to save this?
West Virginia still carries a reputation for affordability—but the Zillow Home Value Index shows a different trend emerging in 2025. In these 24 towns, home prices are rising fast, making them the most expensive markets in the state.
From scenic riverside enclaves to growing mountain suburbs, these towns are drawing buyers with their views, convenience, and shifting local economies. Some saw explosive growth after the pandemic housing surge, while others have been quietly gaining value for over a decade. We’ve tracked the numbers from 2010 to now—and these are the places where West Virginia real estate is heating up.
24. Scott Depot – 64% Home Price Increase Since 2010
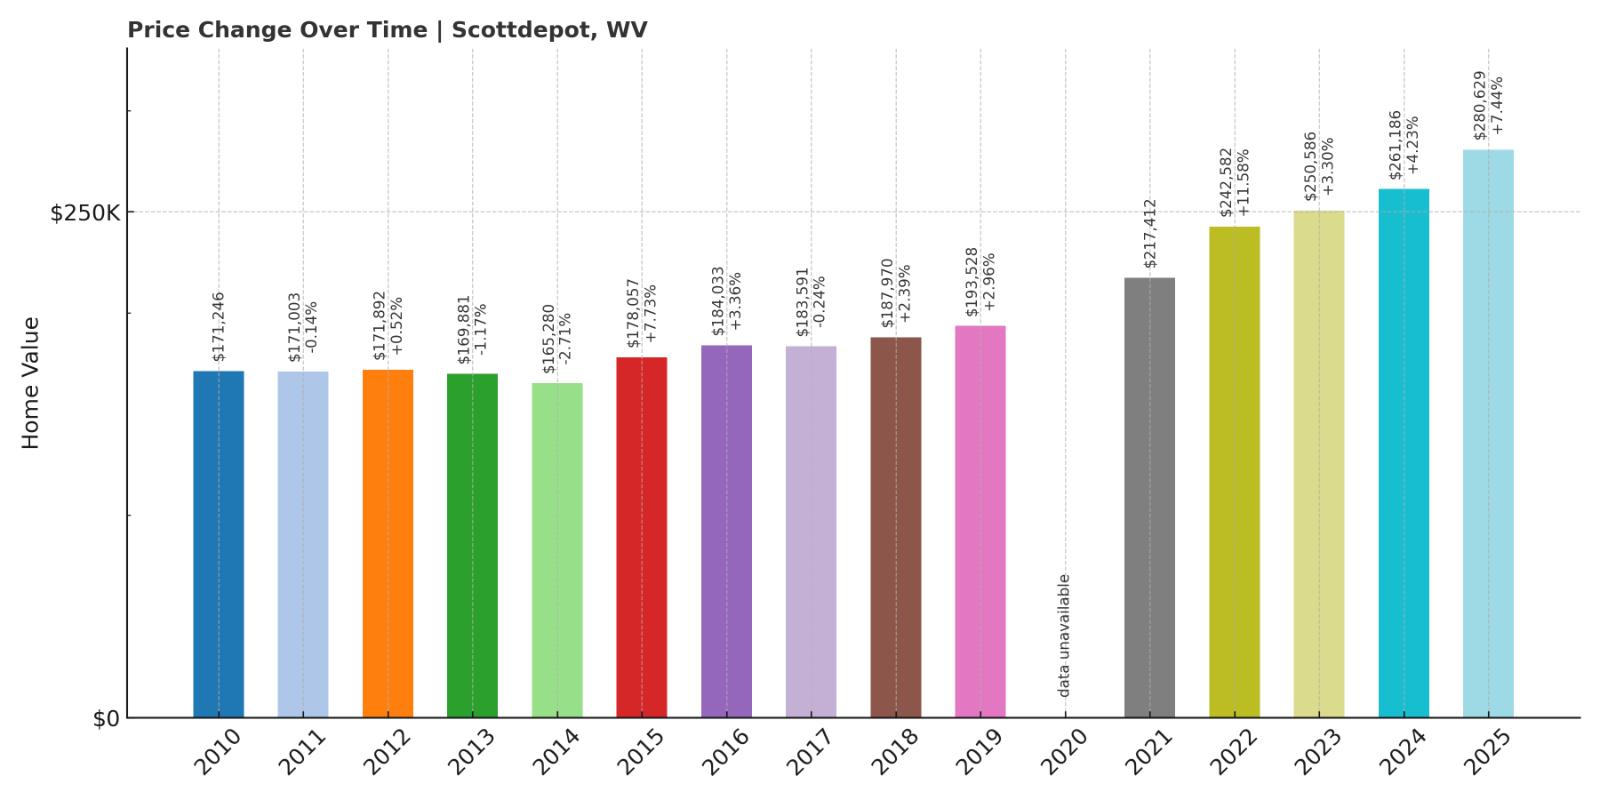
- 2010: $171,246 (-$5,291, -3.00% from previous year)
- 2011: $171,003 (-$243, -0.14% from previous year)
- 2012: $171,892 (+$889, +0.52% from previous year)
- 2013: $169,881 (-$2,011, -1.17% from previous year)
- 2014: $165,280 (-$4,601, -2.71% from previous year)
- 2015: $178,057 (+$12,777, +7.73% from previous year)
- 2016: $184,033 (+$5,976, +3.36% from previous year)
- 2017: $183,591 (-$442, -0.24% from previous year)
- 2018: $187,970 (+$4,379, +2.39% from previous year)
- 2019: $193,528 (+$5,558, +2.96% from previous year)
- 2020: N/A
- 2021: $217,412
- 2022: $242,582 (+$25,170, +11.58% from previous year)
- 2023: $250,586 (+$8,004, +3.30% from previous year)
- 2024: $261,186 (+$10,600, +4.23% from previous year)
- 2025: $280,629 (+$19,443, +7.44% from previous year)
Scott Depot home prices rose from $171,246 in 2010 to $280,629 in 2025—an increase of 64%. The housing market was relatively flat during the early part of the decade, with only slight fluctuations through 2019. Post-2020, prices accelerated, driven by larger jumps in 2022 and 2025, each exceeding 7% growth year-over-year.
Scott Depot – Gradual Growth with a Post-2020 Surge
Scott Depot is part of the Teays Valley region in Putnam County, nestled between Charleston and Huntington. It has long appealed to families and professionals seeking suburban living without being too far from larger employment hubs.
The real turning point came after 2020, when a surge in buyer demand—fueled in part by the rise in remote work and a shift toward mid-sized metros—pushed values up quickly. Unlike more volatile markets, Scott Depot’s growth has been steady and sustainable, with no major dips since 2013. That combination of resilience and recent momentum makes it one of the more reliable and increasingly expensive housing markets in the state.
23. Ranson – 128% Home Price Increase Since 2010
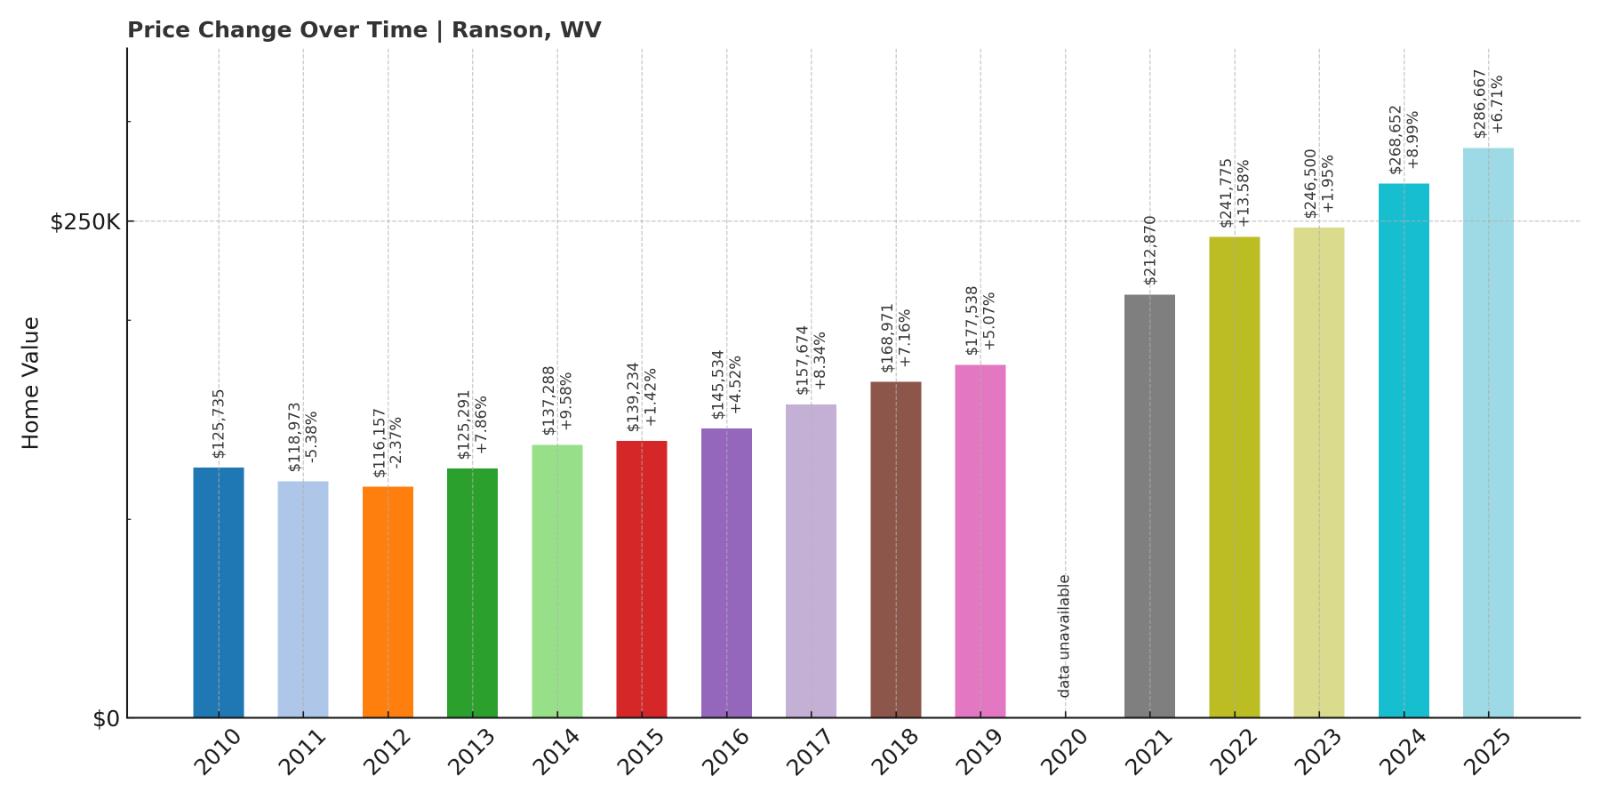
- 2010: $125,735 (-$3,325, -2.58% from previous year)
- 2011: $118,973 (-$6,762, -5.38% from previous year)
- 2012: $116,157 (-$2,815, -2.37% from previous year)
- 2013: $125,291 (+$9,134, +7.86% from previous year)
- 2014: $137,288 (+$11,997, +9.58% from previous year)
- 2015: $139,234 (+$1,946, +1.42% from previous year)
- 2016: $145,534 (+$6,300, +4.52% from previous year)
- 2017: $157,674 (+$12,140, +8.34% from previous year)
- 2018: $168,971 (+$11,298, +7.17% from previous year)
- 2019: $177,538 (+$8,566, +5.07% from previous year)
- 2020: N/A
- 2021: $212,870
- 2022: $241,775 (+$28,906, +13.58% from previous year)
- 2023: $246,500 (+$4,724, +1.95% from previous year)
- 2024: $268,652 (+$22,152, +8.99% from previous year)
- 2025: $286,667 (+$18,016, +6.71% from previous year)
Home values in Ranson more than doubled over 15 years, rising from $125,735 in 2010 to $286,667 in 2025—a 128% increase. The town’s biggest jumps occurred between 2021 and 2024, with multiple years of 8–13% growth. After a sluggish start in the early 2010s, the market gained serious momentum post-2015 and has remained strong since.
Ranson – A Small City with Big Value Gains
Kitchen Style?
Ranson, located in Jefferson County and bordering Charles Town, has become one of the most dynamic markets in West Virginia’s Eastern Panhandle. The area benefits from commuter access to Washington, D.C. via the MARC train, and ongoing residential and commercial development have transformed it from a small-town pass-through into a fast-growing hub.
Buyers are drawn to Ranson not only for its location but also for its walkability, newer housing options, and blend of suburban and small-city character. As nearby markets like Loudoun County, VA became prohibitively expensive, demand spilled over into Jefferson County. Ranson’s housing prices have responded accordingly, showing year-after-year growth that now ranks it among the state’s top performers.
22. Winfield – 61% Home Price Increase Since 2010
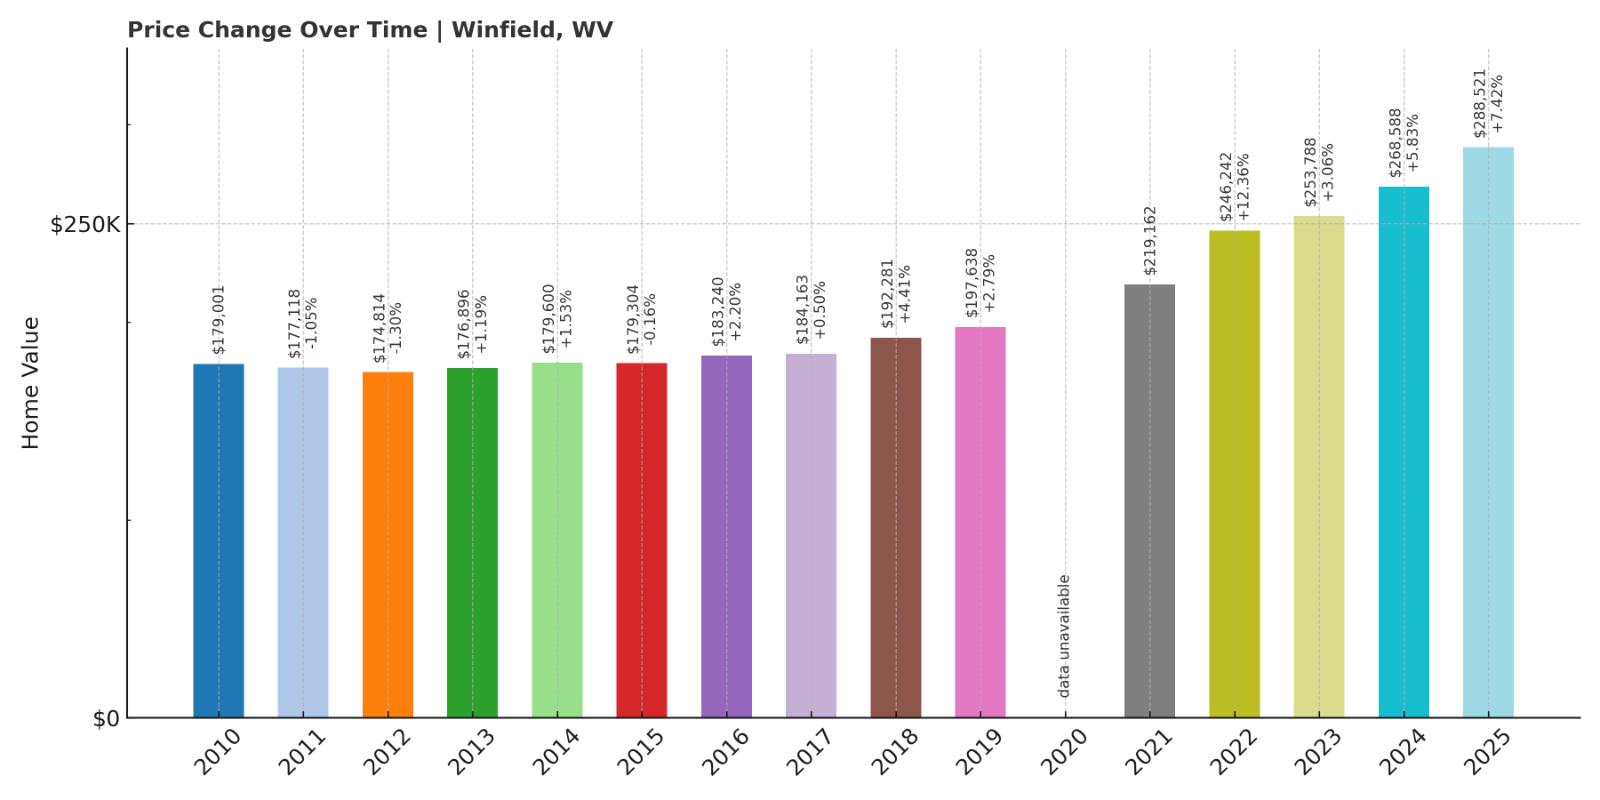
- 2010: $179,001 (+$30, +0.02% from previous year)
- 2011: $177,118 (-$1,882, -1.05% from previous year)
- 2012: $174,814 (-$2,305, -1.30% from previous year)
- 2013: $176,896 (+$2,082, +1.19% from previous year)
- 2014: $179,600 (+$2,703, +1.53% from previous year)
- 2015: $179,304 (-$296, -0.16% from previous year)
- 2016: $183,240 (+$3,936, +2.19% from previous year)
- 2017: $184,163 (+$923, +0.50% from previous year)
- 2018: $192,281 (+$8,118, +4.41% from previous year)
- 2019: $197,638 (+$5,357, +2.79% from previous year)
- 2020: N/A
- 2021: $219,162
- 2022: $246,242 (+$27,080, +12.36% from previous year)
- 2023: $253,788 (+$7,546, +3.06% from previous year)
- 2024: $268,588 (+$14,800, +5.83% from previous year)
- 2025: $288,521 (+$19,934, +7.42% from previous year)
Winfield home prices rose 61% from 2010 to 2025, starting at $179,001 and ending at $288,521. The market remained relatively quiet through the 2010s, with small year-to-year changes. Growth accelerated after 2020, including a 12.4% jump in 2022 and solid gains in the following years.
Winfield – A Quiet Climb in a Suburban Setting
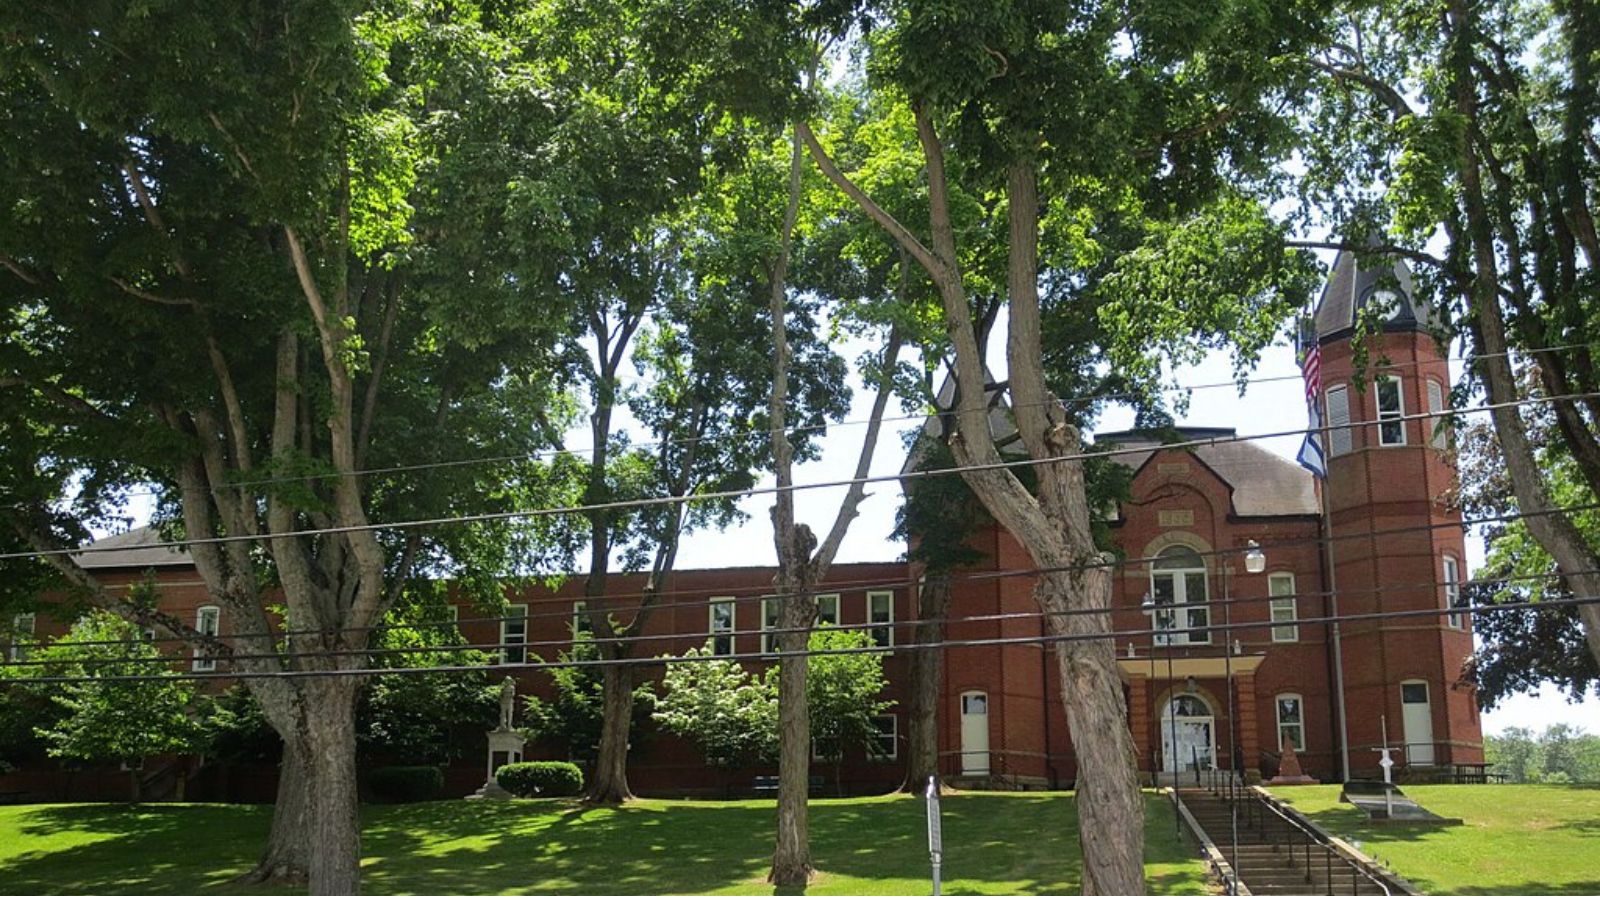
Winfield is a peaceful residential town along the Kanawha River in Putnam County, favored for its good school district and access to Charleston-area jobs. Unlike flashier real estate markets, Winfield has experienced steady, predictable growth that appeals to buyers looking for long-term stability. The lack of volatility in home prices through the early 2010s gave way to stronger demand in recent years as families sought space and quality schools.
Part of the town’s draw lies in its setting—green, spacious, and largely residential. There has been minimal overdevelopment, keeping inventory relatively tight and competition healthy. With demand rising for West Virginia’s stable suburban communities, Winfield’s gentle but persistent climb in home values now places it in the top tier statewide.
21. Bloomery – 81% Home Price Increase Since 2010
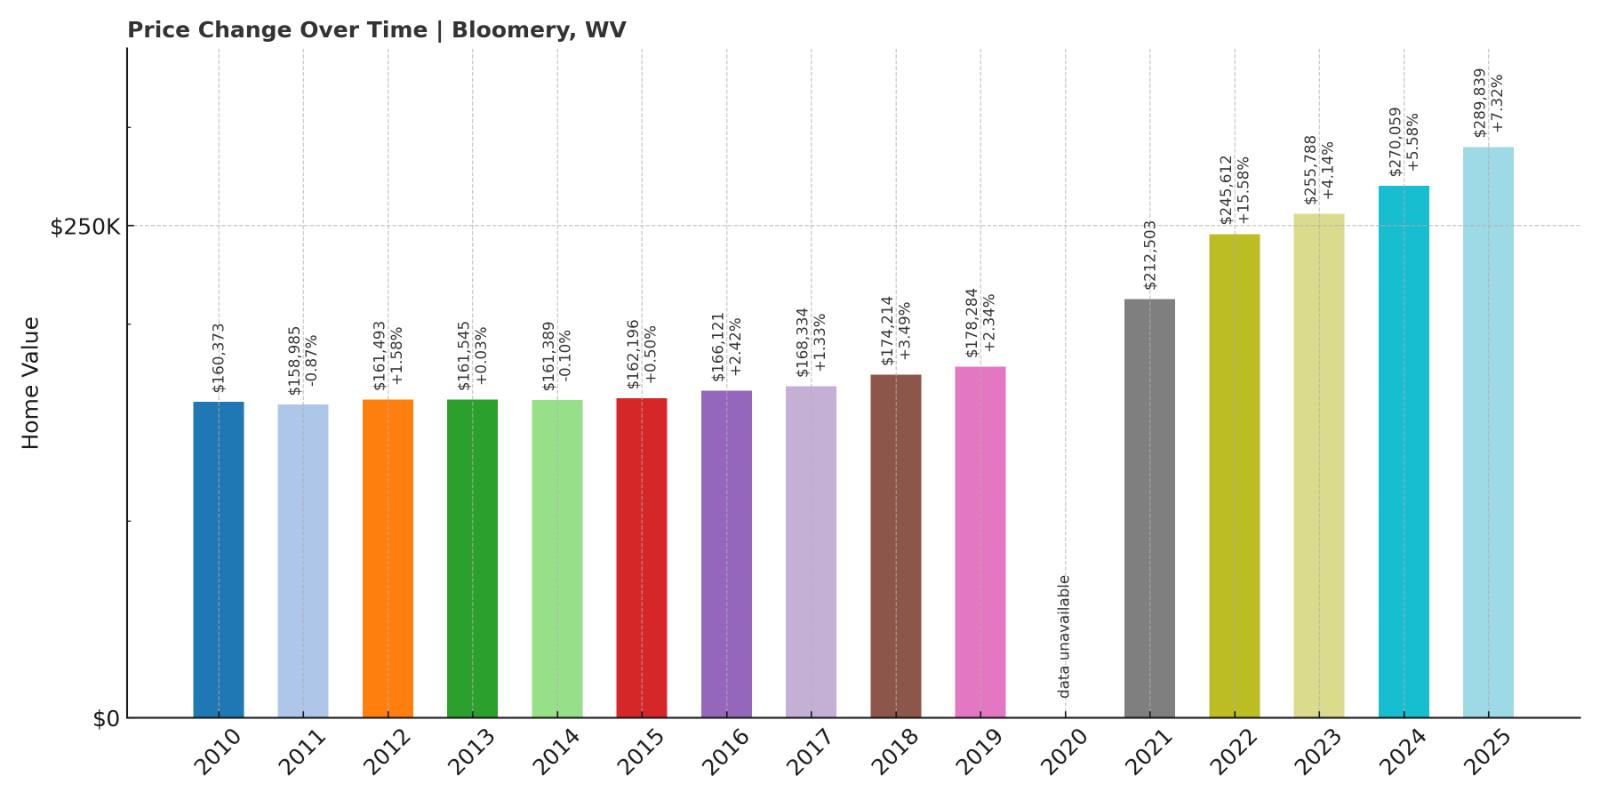

- 2010: $160,373 (-$8,330, -4.94% from previous year)
- 2011: $158,985 (-$1,389, -0.87% from previous year)
- 2012: $161,493 (+$2,508, +1.58% from previous year)
- 2013: $161,545 (+$52, +0.03% from previous year)
- 2014: $161,389 (-$156, -0.10% from previous year)
- 2015: $162,196 (+$807, +0.50% from previous year)
- 2016: $166,121 (+$3,925, +2.42% from previous year)
- 2017: $168,334 (+$2,212, +1.33% from previous year)
- 2018: $174,214 (+$5,880, +3.49% from previous year)
- 2019: $178,284 (+$4,070, +2.34% from previous year)
- 2020: N/A
- 2021: $212,503
- 2022: $245,612 (+$33,110, +15.58% from previous year)
- 2023: $255,788 (+$10,176, +4.14% from previous year)
- 2024: $270,059 (+$14,271, +5.58% from previous year)
- 2025: $289,839 (+$19,780, +7.32% from previous year)
Bloomery’s home prices rose 81% from 2010 to 2025, increasing from $160,373 to $289,839. The market saw modest increases for most of the decade, but prices began climbing faster after 2020. A 15.6% gain in 2022 marked a key turning point in market momentum.
Bloomery – A Rural Market with Rising Appeal
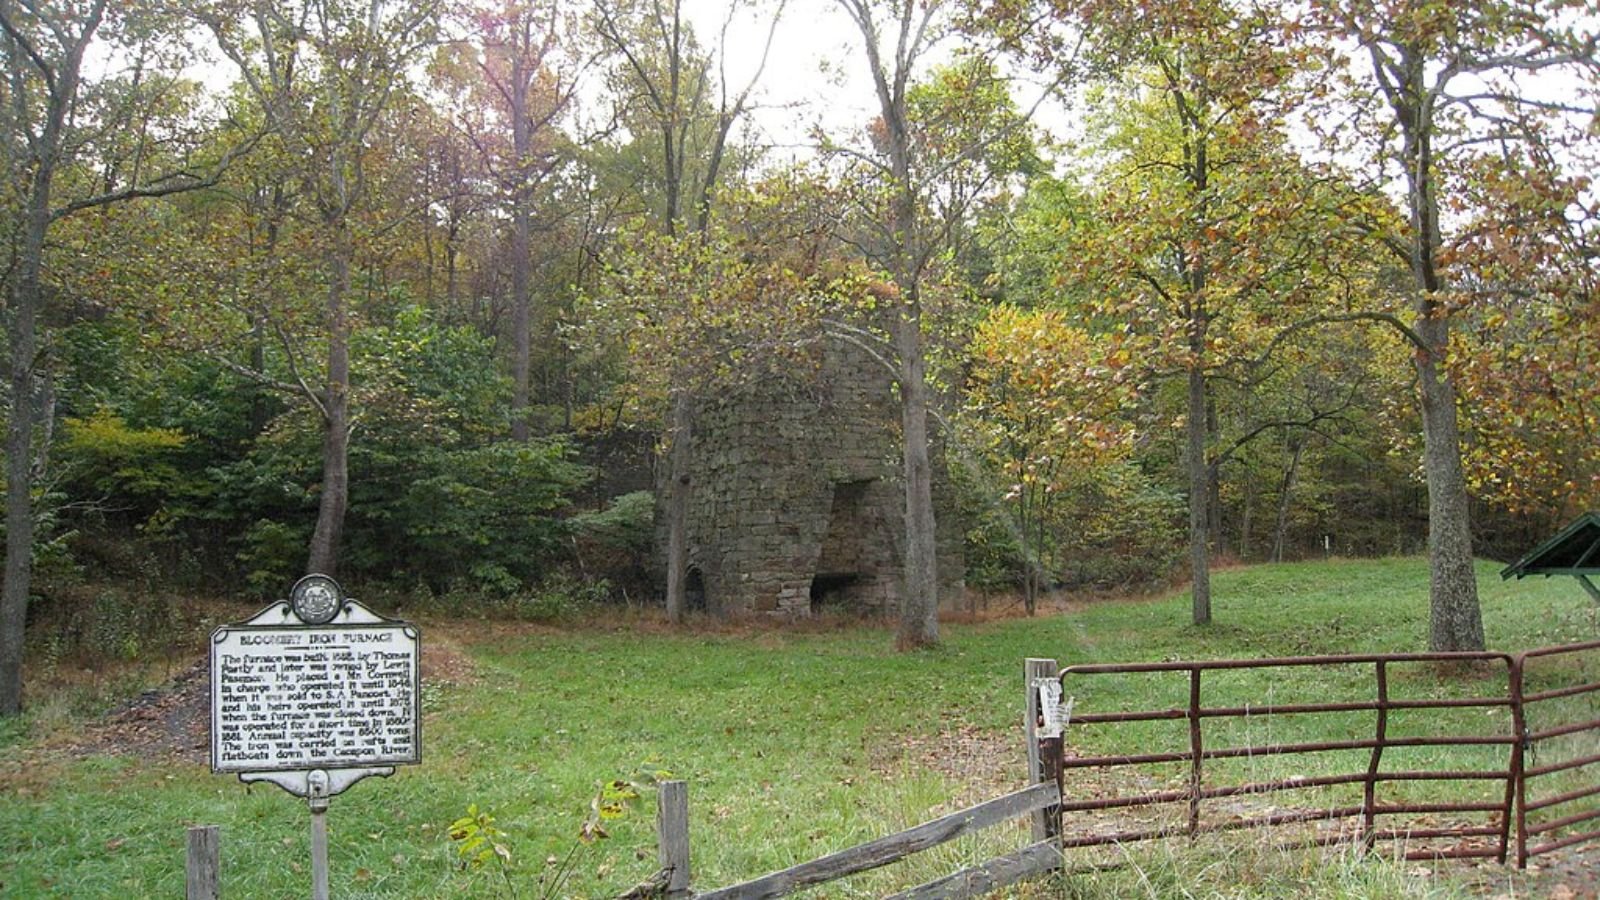
Bloomery, located in Hampshire County, is a rural and largely undeveloped part of West Virginia near the Virginia border. For years, the housing market here saw little change, but recent shifts in buyer preferences have altered that trajectory. As remote work became more common and buyers looked for more land and privacy, Bloomery’s appeal skyrocketed.
The town’s housing stock is modest, and available properties tend to offer acreage and privacy rather than subdivision-style uniformity. That has helped prices rise quickly as more people compete for fewer homes. With continued interest from out-of-state buyers, Bloomery has gone from a slow-growth area to a rapidly appreciating market.
20. Lewisburg – 41% Home Price Increase Since 2010
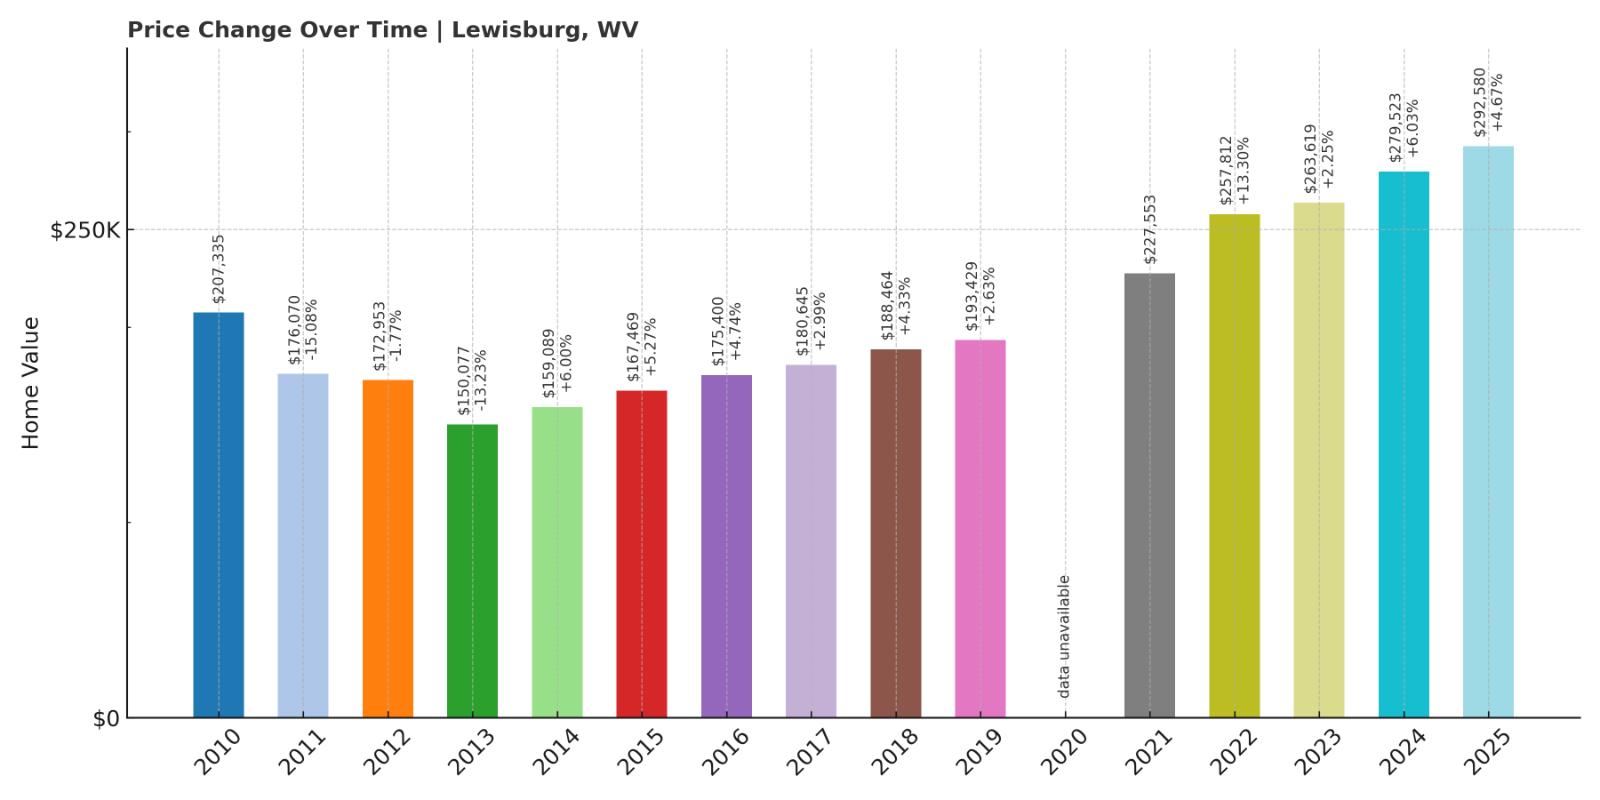
- 2010: $207,335
- 2011: $176,070 (-$31,264, -15.08% from previous year)
- 2012: $172,953 (-$3,117, -1.77% from previous year)
- 2013: $150,077 (-$22,876, -13.23% from previous year)
- 2014: $159,089 (+$9,012, +6.00% from previous year)
- 2015: $167,469 (+$8,380, +5.27% from previous year)
- 2016: $175,400 (+$7,931, +4.74% from previous year)
- 2017: $180,645 (+$5,245, +2.99% from previous year)
- 2018: $188,464 (+$7,819, +4.33% from previous year)
- 2019: $193,429 (+$4,965, +2.63% from previous year)
- 2020: N/A
- 2021: $227,553
- 2022: $257,812 (+$30,258, +13.30% from previous year)
- 2023: $263,619 (+$5,807, +2.25% from previous year)
- 2024: $279,523 (+$15,904, +6.03% from previous year)
- 2025: $292,580 (+$13,056, +4.67% from previous year)
Lewisburg’s home values increased by 41% over 15 years, from $207,335 to $292,580. After significant declines between 2010 and 2013, prices steadily rebounded. The biggest gain came in 2022, with a 13.3% jump over the prior year.
Lewisburg – Historic Charm and Steady Climb
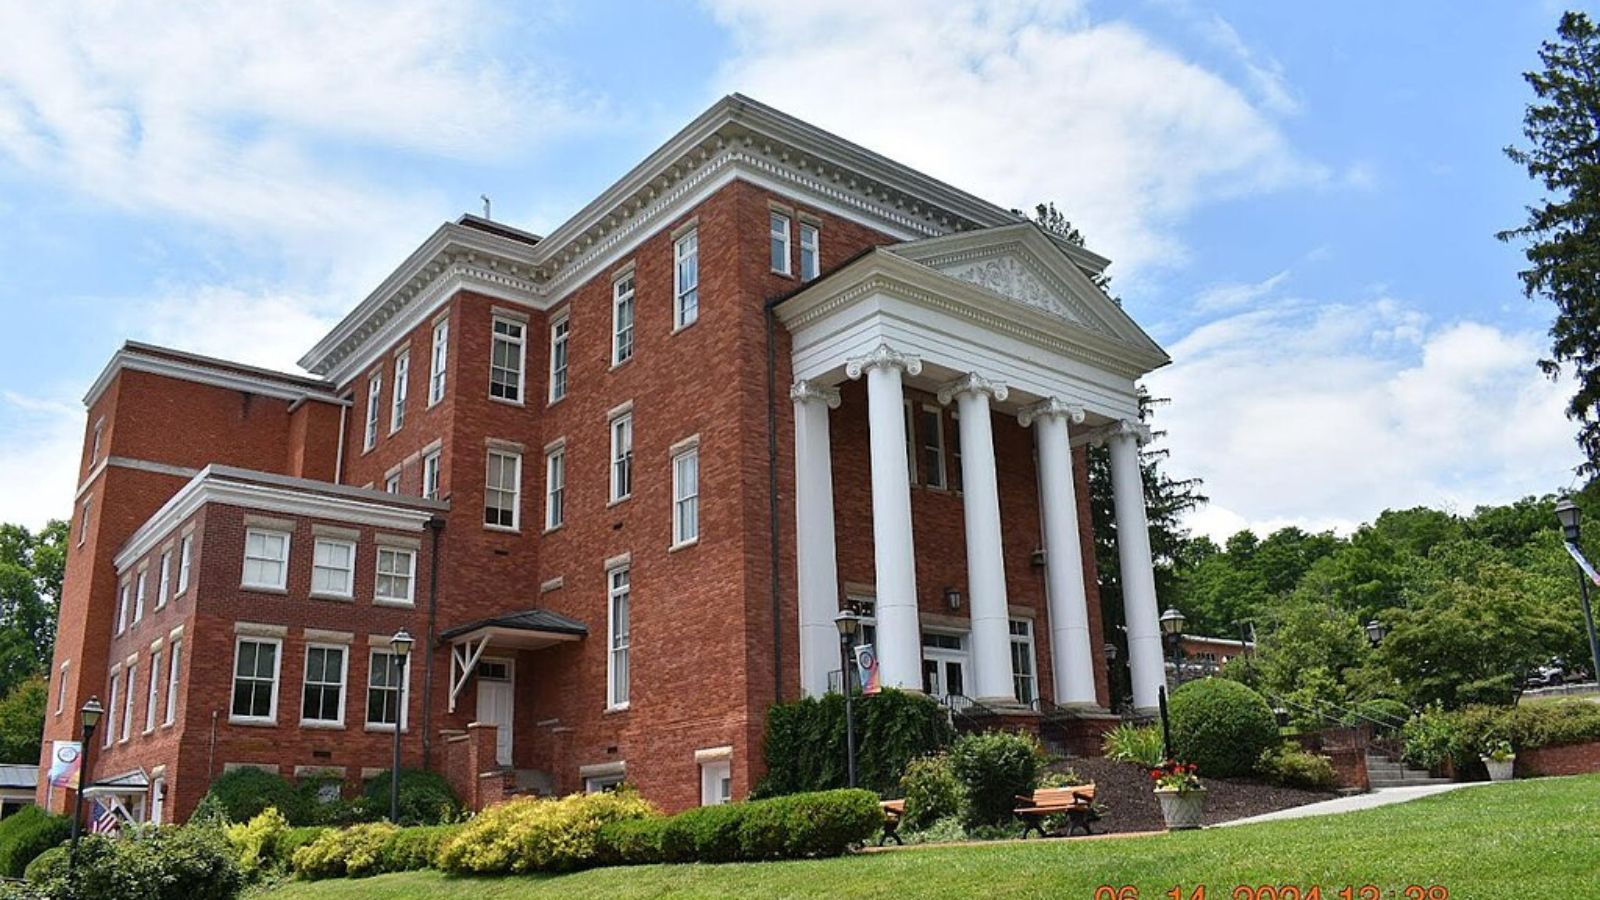
Known for its walkable downtown and cultural amenities, Lewisburg has been consistently ranked as one of West Virginia’s best small towns. Its housing market mirrors that reputation: while it suffered early setbacks, it has since recovered and seen sustained growth. With an active arts scene, quality restaurants, and a nationally recognized live theater, Lewisburg attracts buyers seeking lifestyle as much as value.
In recent years, the town has also benefited from a rise in second-home and retirement purchases. The supply of homes is limited, and its desirability has only grown as more people discover it. The result is a housing market that has proven both resilient and increasingly competitive.
19. Slanesville – 94% Home Price Increase Since 2010
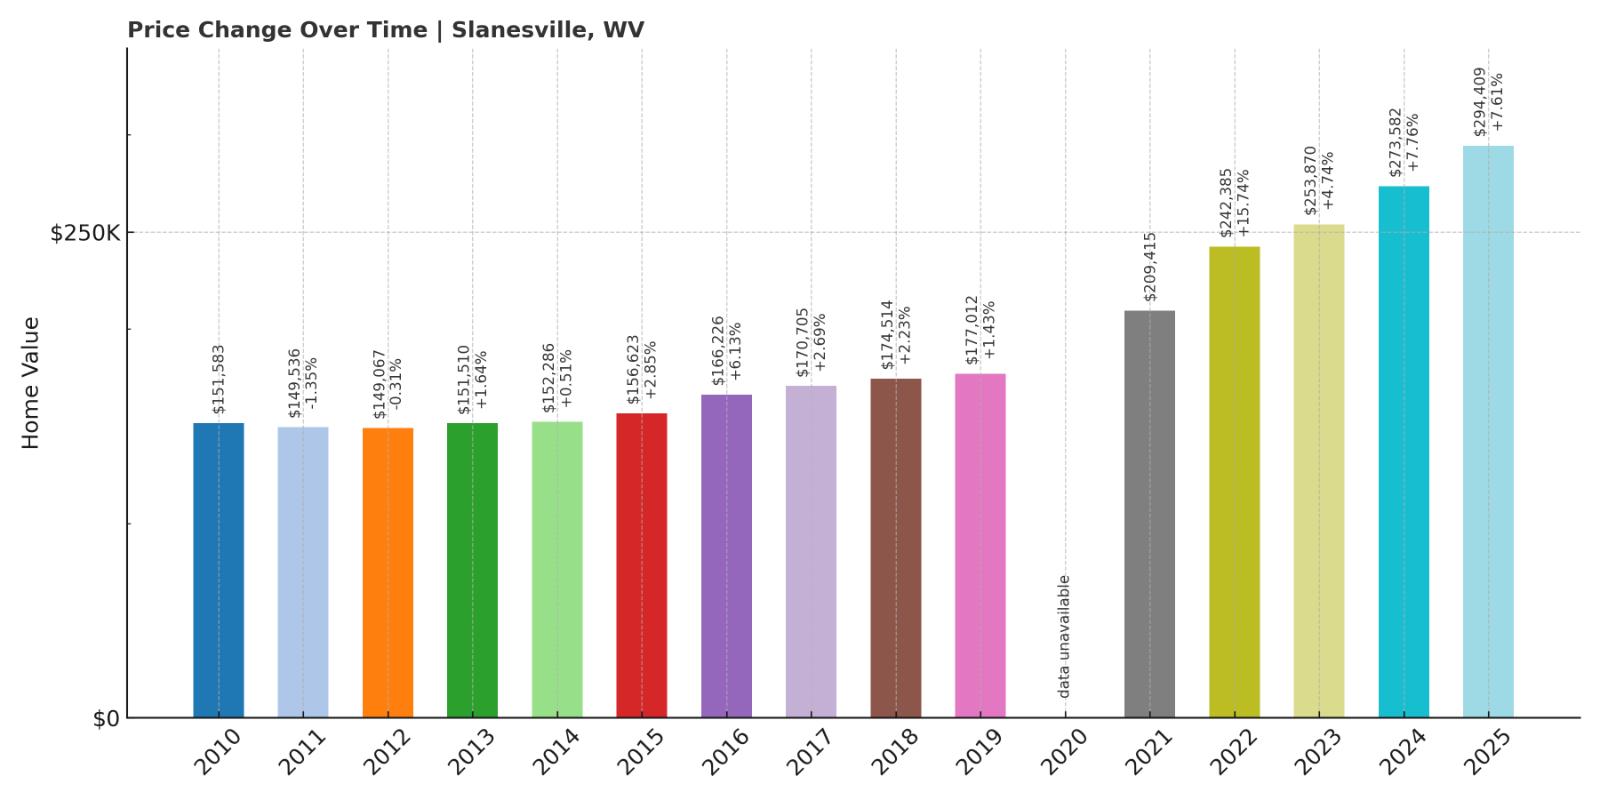
- 2010: $151,583 (-$8,536, -5.33% from previous year)
- 2011: $149,536 (-$2,047, -1.35% from previous year)
- 2012: $149,067 (-$468, -0.31% from previous year)
- 2013: $151,510 (+$2,443, +1.64% from previous year)
- 2014: $152,286 (+$776, +0.51% from previous year)
- 2015: $156,623 (+$4,337, +2.85% from previous year)
- 2016: $166,226 (+$9,604, +6.13% from previous year)
- 2017: $170,705 (+$4,479, +2.69% from previous year)
- 2018: $174,514 (+$3,809, +2.23% from previous year)
- 2019: $177,012 (+$2,498, +1.43% from previous year)
- 2020: N/A
- 2021: $209,415
- 2022: $242,385 (+$32,970, +15.74% from previous year)
- 2023: $253,870 (+$11,484, +4.74% from previous year)
- 2024: $273,582 (+$19,712, +7.76% from previous year)
- 2025: $294,409 (+$20,827, +7.61% from previous year)
Slanesville’s home prices have climbed 94% since 2010, increasing from $151,583 to $294,409 in 2025. The market saw only slight changes through most of the 2010s, with prices growing modestly year over year. The post-2020 market brought sharp increases, including a nearly 16% surge in 2022 and back-to-back gains exceeding 7% in both 2024 and 2025.
Slanesville – A Rural Market Experiencing Fast Growth
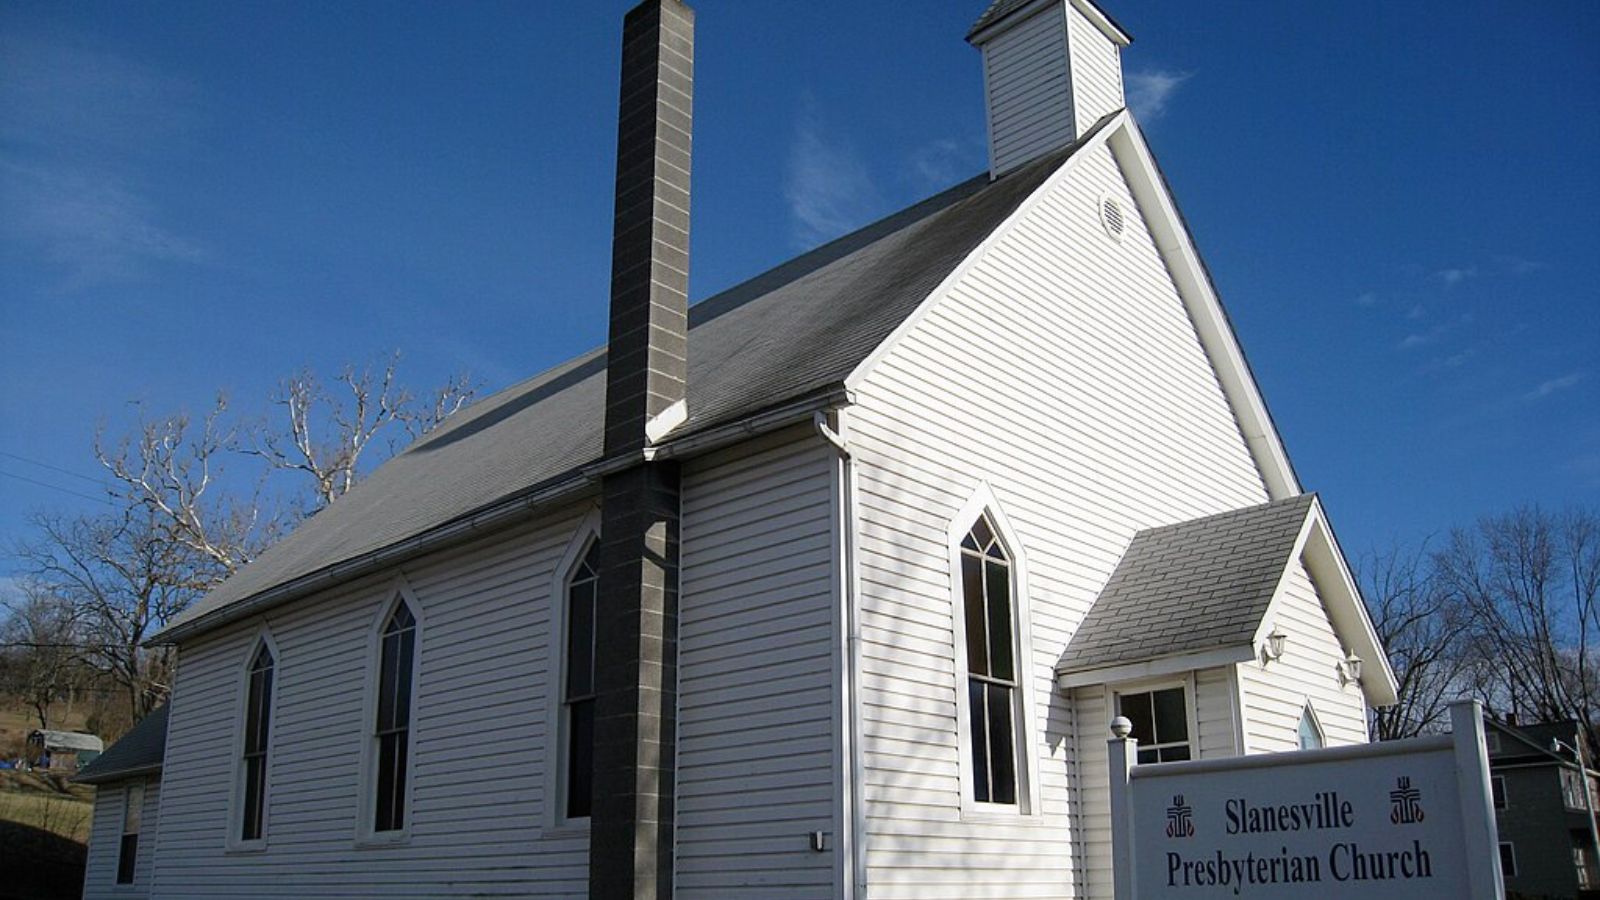
Slanesville is a quiet, unincorporated community in Hampshire County with deep rural roots and a scenic location. Historically overlooked, the town is now seeing the effects of a broader trend toward rural migration and affordability-driven relocations. Buyers from nearby states have taken notice of the spacious properties, forested lots, and low property taxes, driving demand in a once-sleepy market.
Limited new construction and a small housing stock have added pressure to prices. With more buyers seeking large parcels and fewer distractions, Slanesville’s appeal has grown sharply. Its recent home price performance shows how even remote locations are now part of West Virginia’s real estate boom—especially those offering privacy, views, and long-term value.
18. Bridgeport – 64% Home Price Increase Since 2010
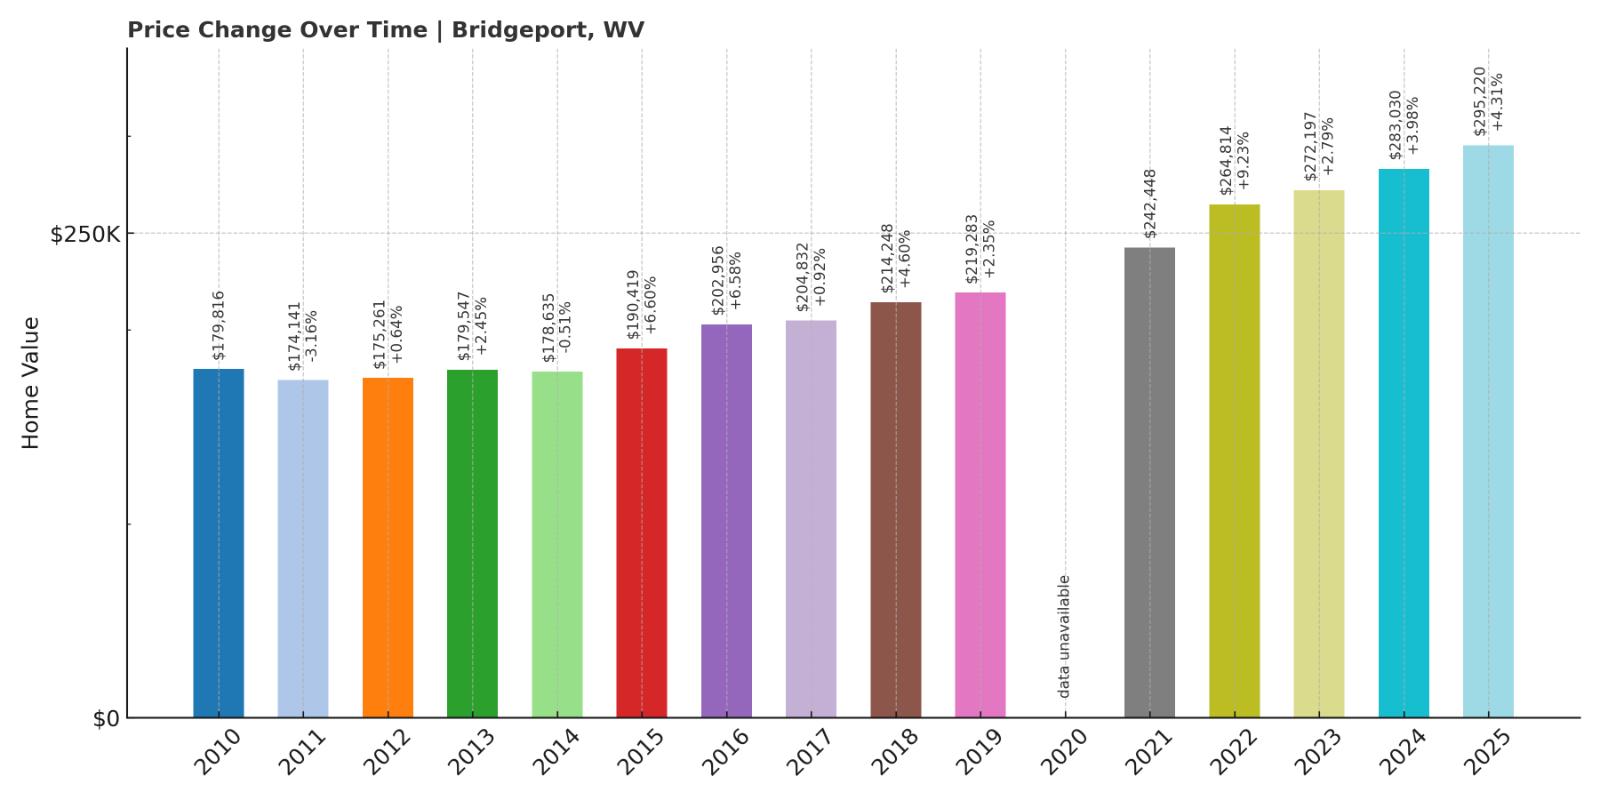
- 2010: $179,816 (+$3,336, +1.89% from previous year)
- 2011: $174,141 (-$5,675, -3.16% from previous year)
- 2012: $175,261 (+$1,120, +0.64% from previous year)
- 2013: $179,547 (+$4,286, +2.45% from previous year)
- 2014: $178,635 (-$913, -0.51% from previous year)
- 2015: $190,419 (+$11,784, +6.60% from previous year)
- 2016: $202,956 (+$12,538, +6.58% from previous year)
- 2017: $204,832 (+$1,876, +0.92% from previous year)
- 2018: $214,248 (+$9,416, +4.60% from previous year)
- 2019: $219,283 (+$5,035, +2.35% from previous year)
- 2020: N/A
- 2021: $242,448
- 2022: $264,814 (+$22,365, +9.22% from previous year)
- 2023: $272,197 (+$7,383, +2.79% from previous year)
- 2024: $283,030 (+$10,833, +3.98% from previous year)
- 2025: $295,220 (+$12,189, +4.31% from previous year)
Bridgeport home values increased from $179,816 in 2010 to $295,220 in 2025—a 64% gain. Most of the growth occurred after 2015, with consistent year-over-year appreciation and no major price corrections. The town’s strongest stretch came between 2021 and 2025, adding over $50,000 in value during that period alone.
Bridgeport – Consistent Growth in a Thriving Hub
Located in Harrison County, Bridgeport is one of the most economically stable and prosperous towns in West Virginia. Anchored by aerospace firms, medical centers, and strong schools, it consistently ranks as one of the most desirable places to live in the state. Bridgeport’s housing market reflects that stability, offering steady gains rather than dramatic spikes or dips.
The city also benefits from being a business and transportation hub, with easy access to I-79 and North Central West Virginia Airport. Its mix of high-paying jobs, local investment, and new housing developments have kept inventory tight and prices rising. Buyers see Bridgeport as a safe bet, which helps explain its long-term upward trend in home values.
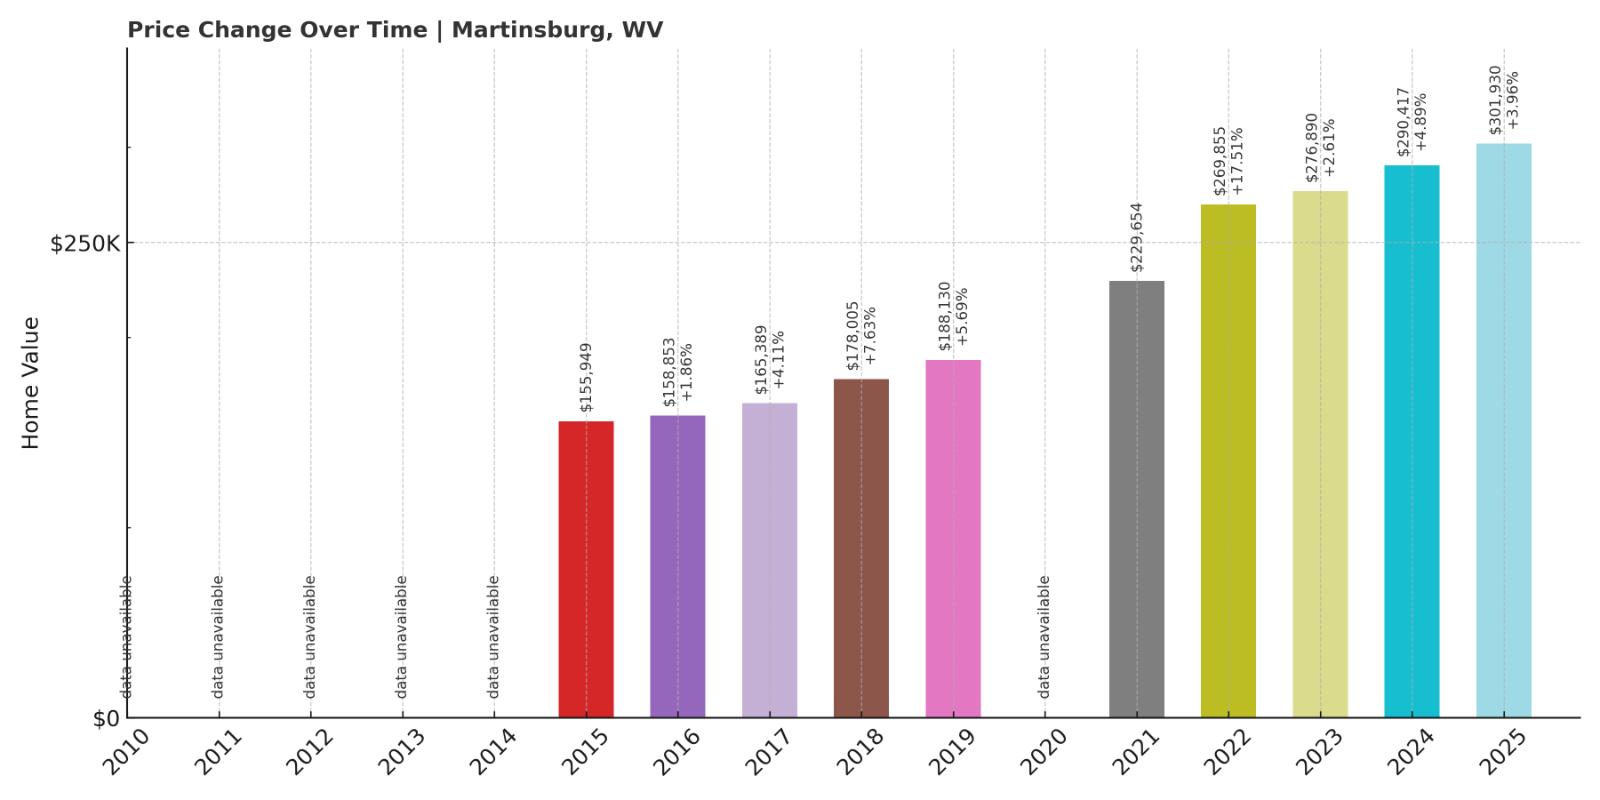
17. Martinsburg – 94% Home Price Increase Since 2015
- 2010: N/A
- 2011: N/A
- 2012: N/A
- 2013: N/A
- 2014: N/A
- 2015: $155,949
- 2016: $158,853 (+$2,904, +1.86% from previous year)
- 2017: $165,389 (+$6,536, +4.11% from previous year)
- 2018: $178,005 (+$12,616, +7.63% from previous year)
- 2019: $188,130 (+$10,125, +5.69% from previous year)
- 2020: N/A
- 2021: $229,654
- 2022: $269,855 (+$40,201, +17.50% from previous year)
- 2023: $276,890 (+$7,035, +2.61% from previous year)
- 2024: $290,417 (+$13,526, +4.89% from previous year)
- 2025: $301,930 (+$11,514, +3.96% from previous year)
Martinsburg home values nearly doubled in just ten years, increasing 94% from $155,949 in 2015 to $301,930 in 2025. Annual increases were solid through 2019, but the biggest gains occurred after 2020. A massive 17.5% spike in 2022 marked its strongest year on record.
Martinsburg – Eastern Panhandle Boomtown
Martinsburg is the commercial and residential center of the Eastern Panhandle, with direct MARC train service to Washington, D.C. Its location has made it especially appealing to commuters and remote workers looking to relocate from the crowded and expensive suburbs of Maryland and Virginia. In recent years, that demand has translated into fast-rising home prices and new housing development.
Local investments in schools, downtown revitalization, and health care facilities have added to Martinsburg’s appeal. It offers both affordability and accessibility, a rare mix in the region. As a result, Martinsburg’s housing market has shifted from undervalued to one of the hottest and most competitive in the state.
16. North Hills – 91% Home Price Increase Since 2010
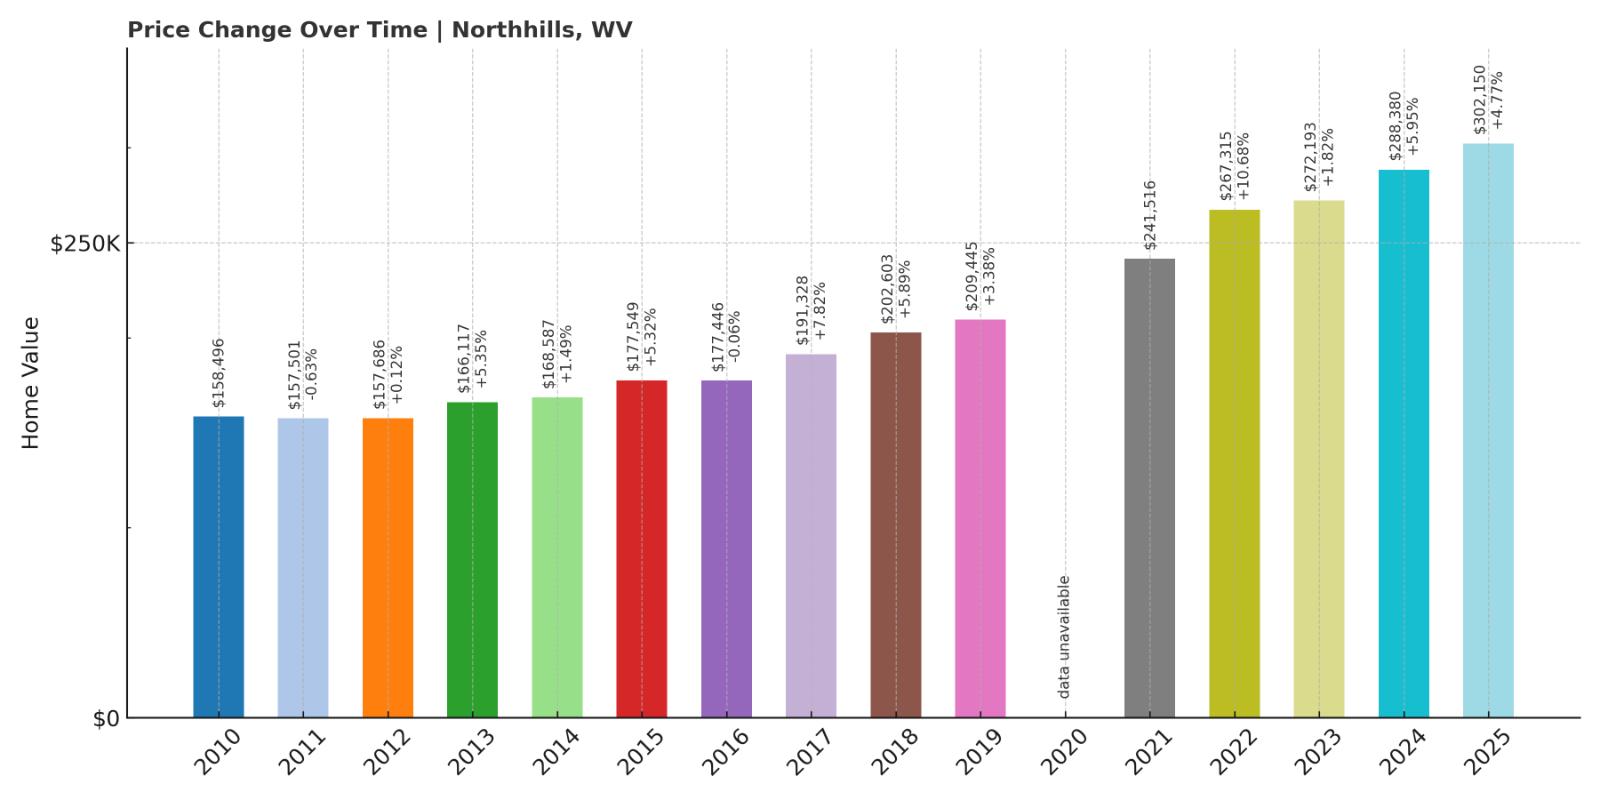
- 2010: $158,496
- 2011: $157,501 (-$996, -0.63% from previous year)
- 2012: $157,686 (+$185, +0.12% from previous year)
- 2013: $166,117 (+$8,432, +5.35% from previous year)
- 2014: $168,587 (+$2,470, +1.49% from previous year)
- 2015: $177,549 (+$8,962, +5.32% from previous year)
- 2016: $177,446 (-$103, -0.06% from previous year)
- 2017: $191,328 (+$13,882, +7.82% from previous year)
- 2018: $202,603 (+$11,274, +5.89% from previous year)
- 2019: $209,445 (+$6,842, +3.38% from previous year)
- 2020: N/A
- 2021: $241,516
- 2022: $267,315 (+$25,799, +10.68% from previous year)
- 2023: $272,193 (+$4,878, +1.82% from previous year)
- 2024: $288,380 (+$16,187, +5.95% from previous year)
- 2025: $302,150 (+$13,770, +4.78% from previous year)
North Hills home values rose 91% from $158,496 in 2010 to $302,150 in 2025. The market gained momentum in 2017 and posted double-digit gains in 2022. Prices have continued climbing in the years since, with no sign of slowing down.
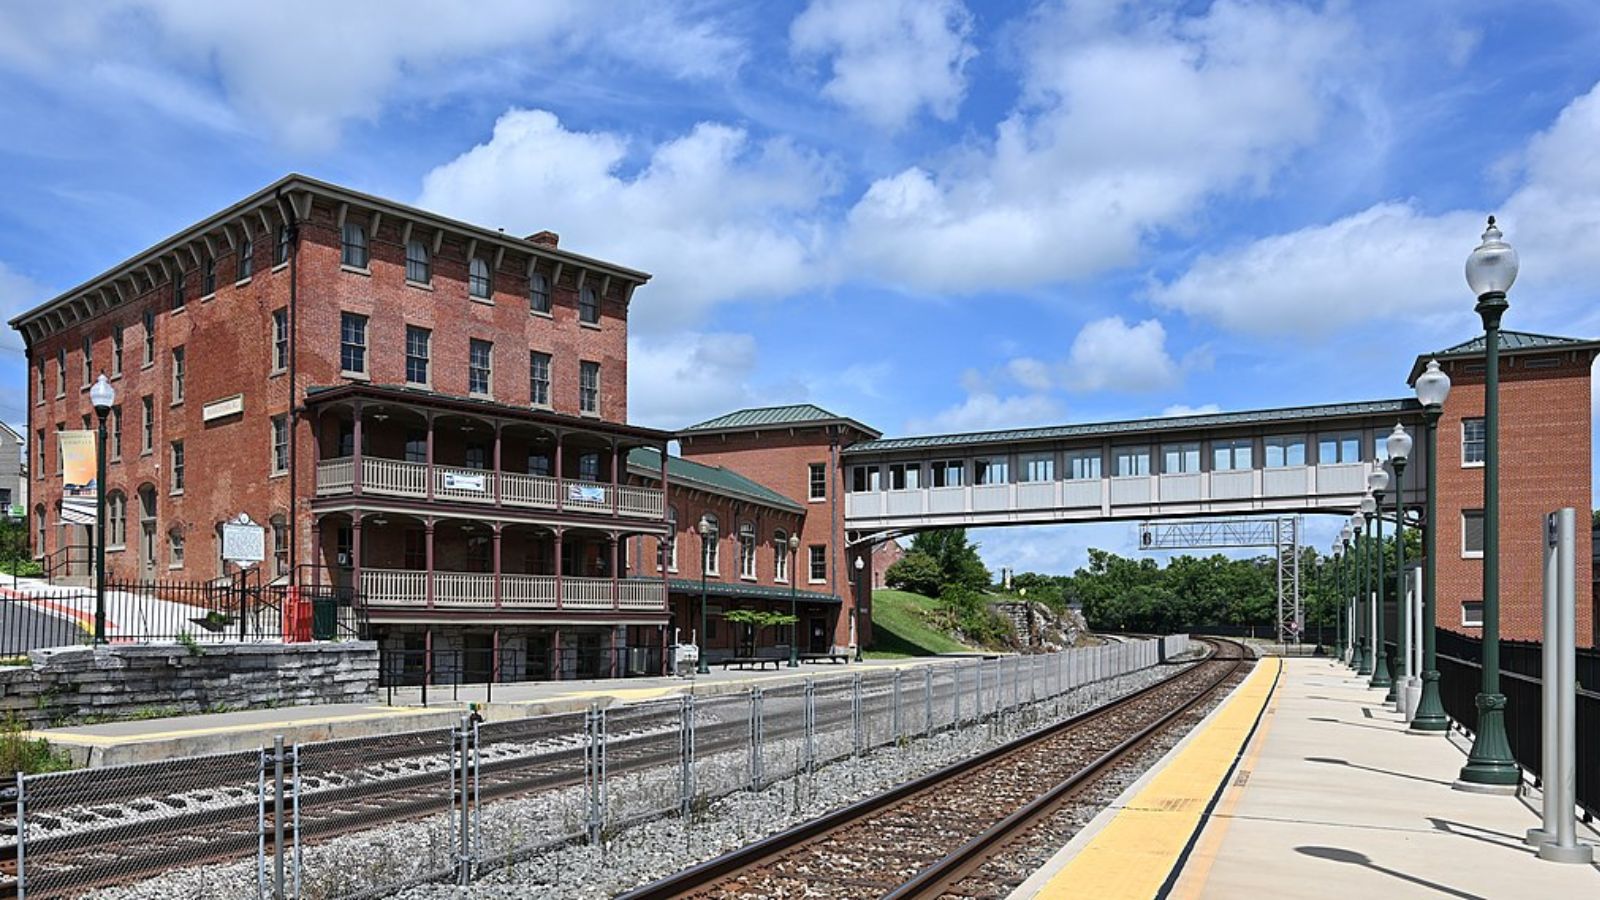
North Hills – Consistent Suburban Appreciation
North Hills, a quiet residential suburb near Parkersburg, has gained steady interest from buyers looking for long-term value. With good schools, solid infrastructure, and a short commute to local jobs, it’s an appealing option for families and retirees alike. The housing stock is well-kept, and demand has been strong enough to sustain price growth over the last decade.
Unlike more volatile markets, North Hills has never seen sharp declines in value—only steady progress. Its stability and suburban amenities have made it one of the Mid-Ohio Valley’s strongest performers. As surrounding areas experience spikes and corrections, North Hills continues to deliver predictable, above-average appreciation.
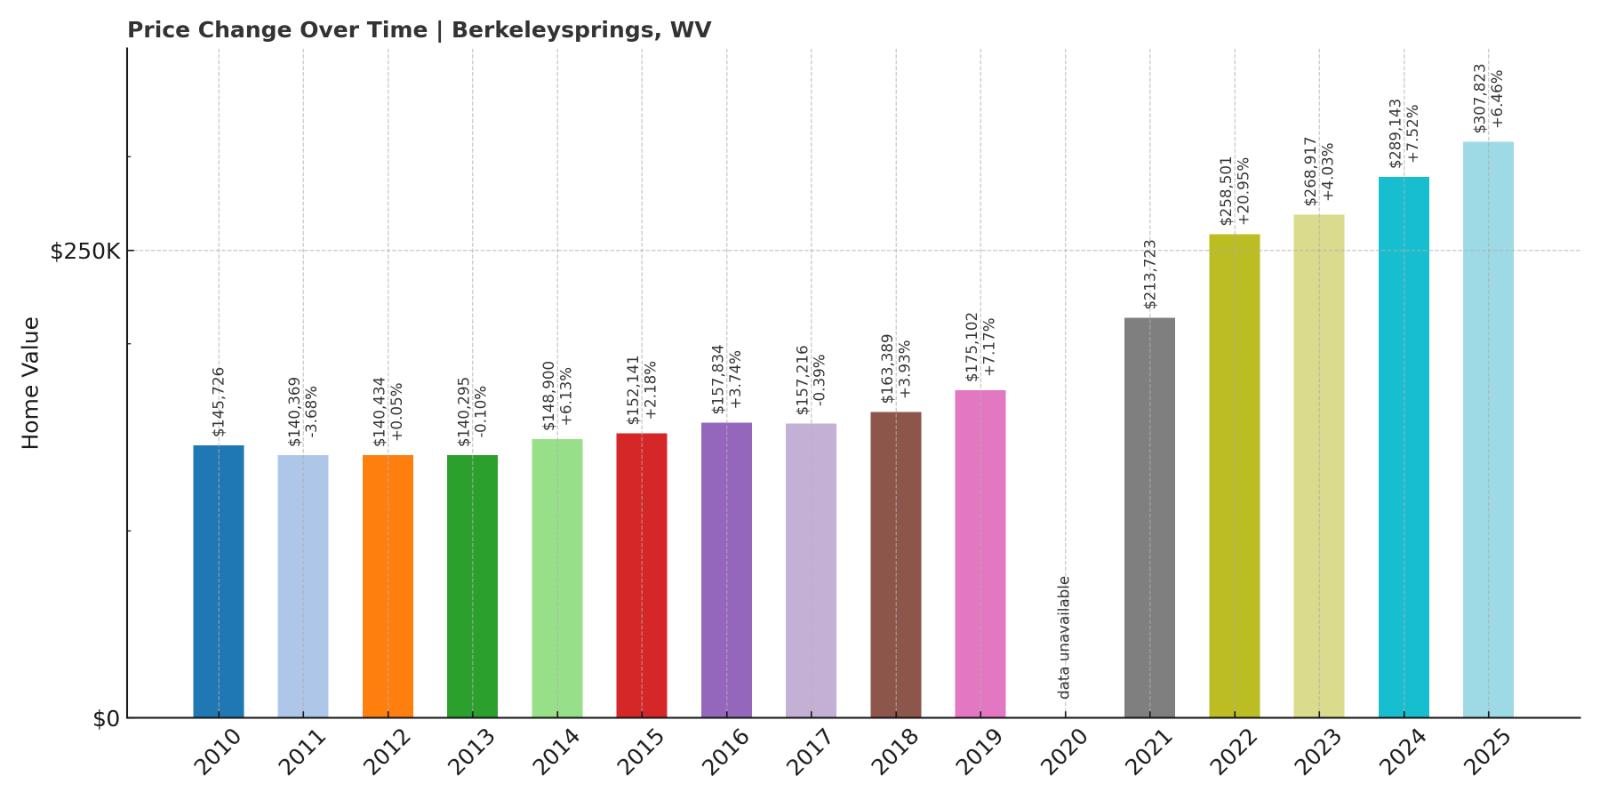
15. Berkeley Springs – 111% Home Price Increase Since 2010
Would you like to save this?


- 2010: $145,726 (-$8,911, -5.76% from previous year)
- 2011: $140,369 (-$5,357, -3.68% from previous year)
- 2012: $140,434 (+$65, +0.05% from previous year)
- 2013: $140,295 (-$139, -0.10% from previous year)
- 2014: $148,900 (+$8,605, +6.13% from previous year)
- 2015: $152,141 (+$3,241, +2.18% from previous year)
- 2016: $157,834 (+$5,694, +3.74% from previous year)
- 2017: $157,216 (-$619, -0.39% from previous year)
- 2018: $163,389 (+$6,173, +3.93% from previous year)
- 2019: $175,102 (+$11,713, +7.17% from previous year)
- 2020: N/A
- 2021: $213,723
- 2022: $258,501 (+$44,778, +20.95% from previous year)
- 2023: $268,917 (+$10,416, +4.03% from previous year)
- 2024: $289,143 (+$20,226, +7.52% from previous year)
- 2025: $307,823 (+$18,680, +6.46% from previous year)
Home values in Berkeley Springs rose from $145,726 in 2010 to $307,823 in 2025—an increase of 111%. The town saw modest appreciation through most of the 2010s, but the post-2020 period brought significant change. A 21% jump in 2022 was followed by three more years of steady, above-average growth.
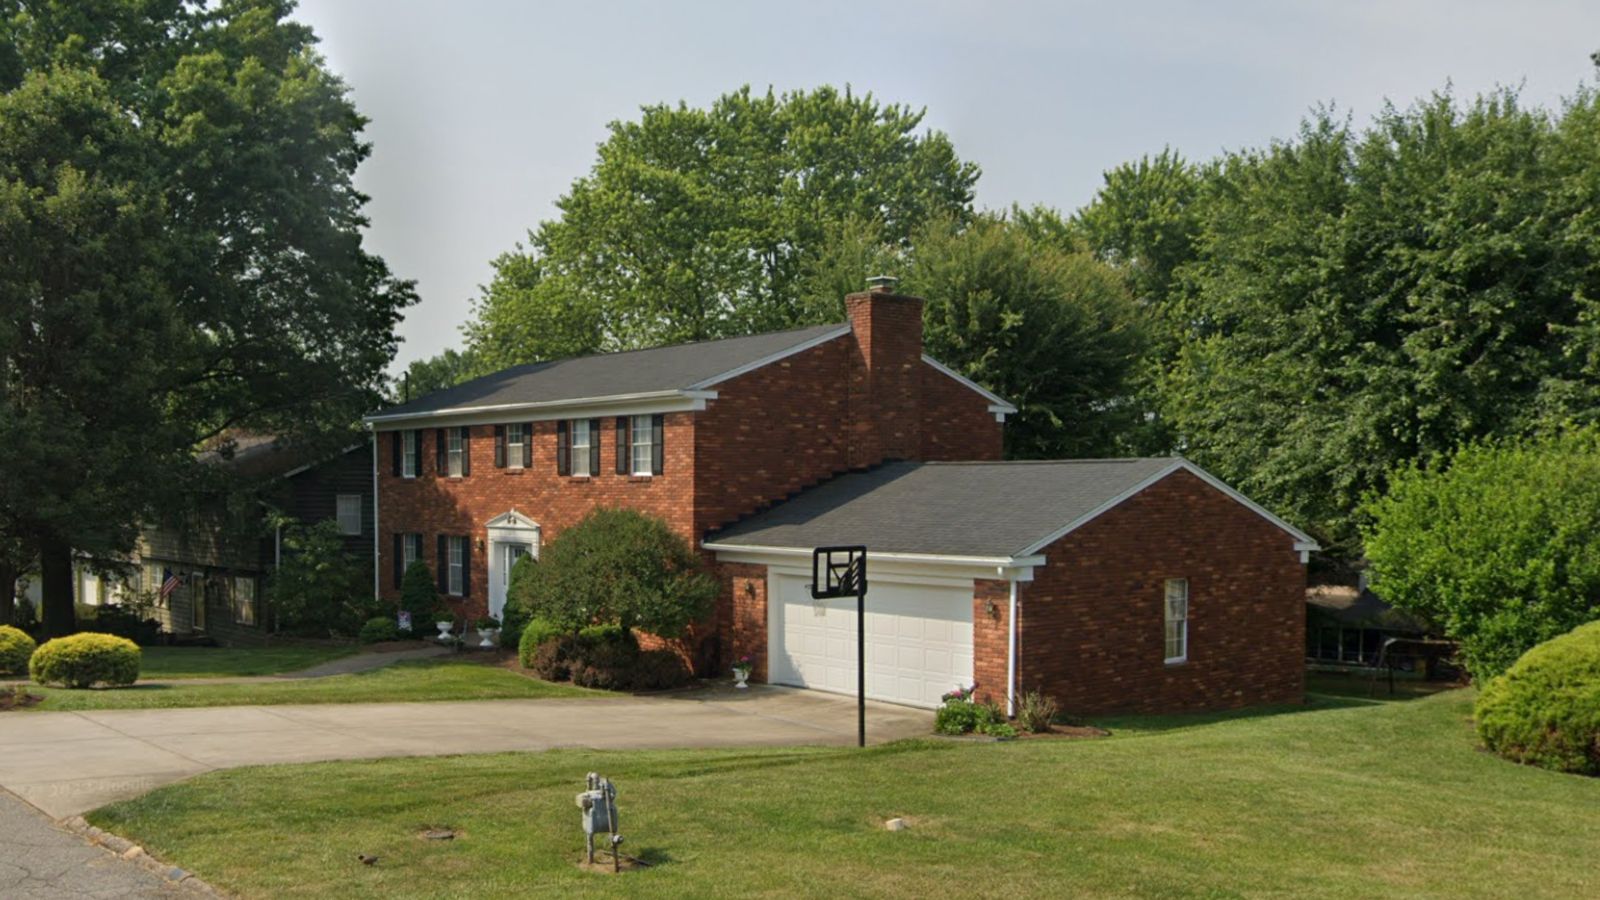
Berkeley Springs – Hot Springs and Hot Market
Berkeley Springs, located in Morgan County, is best known for its historic mineral springs and vibrant arts scene. It has long been a weekend destination for residents of Washington, D.C., and Baltimore, but in recent years, more people have decided to make it home. That shift from tourism to full-time residency has fueled the rise in home values, as limited inventory struggles to keep up with demand from out-of-state buyers and retirees seeking scenic, small-town living.
The area’s appeal extends beyond its charm—there are natural amenities, public parks, and a strong sense of community. With access to both I-70 and U.S. Route 522, it offers surprising connectivity despite its rural setting. As remote work has allowed people to rethink where they live, Berkeley Springs has benefited more than most, and its housing market reflects that rising interest.
14. Falling Waters – 72% Home Price Increase Since 2015
- 2010: N/A
- 2011: N/A
- 2012: N/A
- 2013: N/A
- 2014: N/A
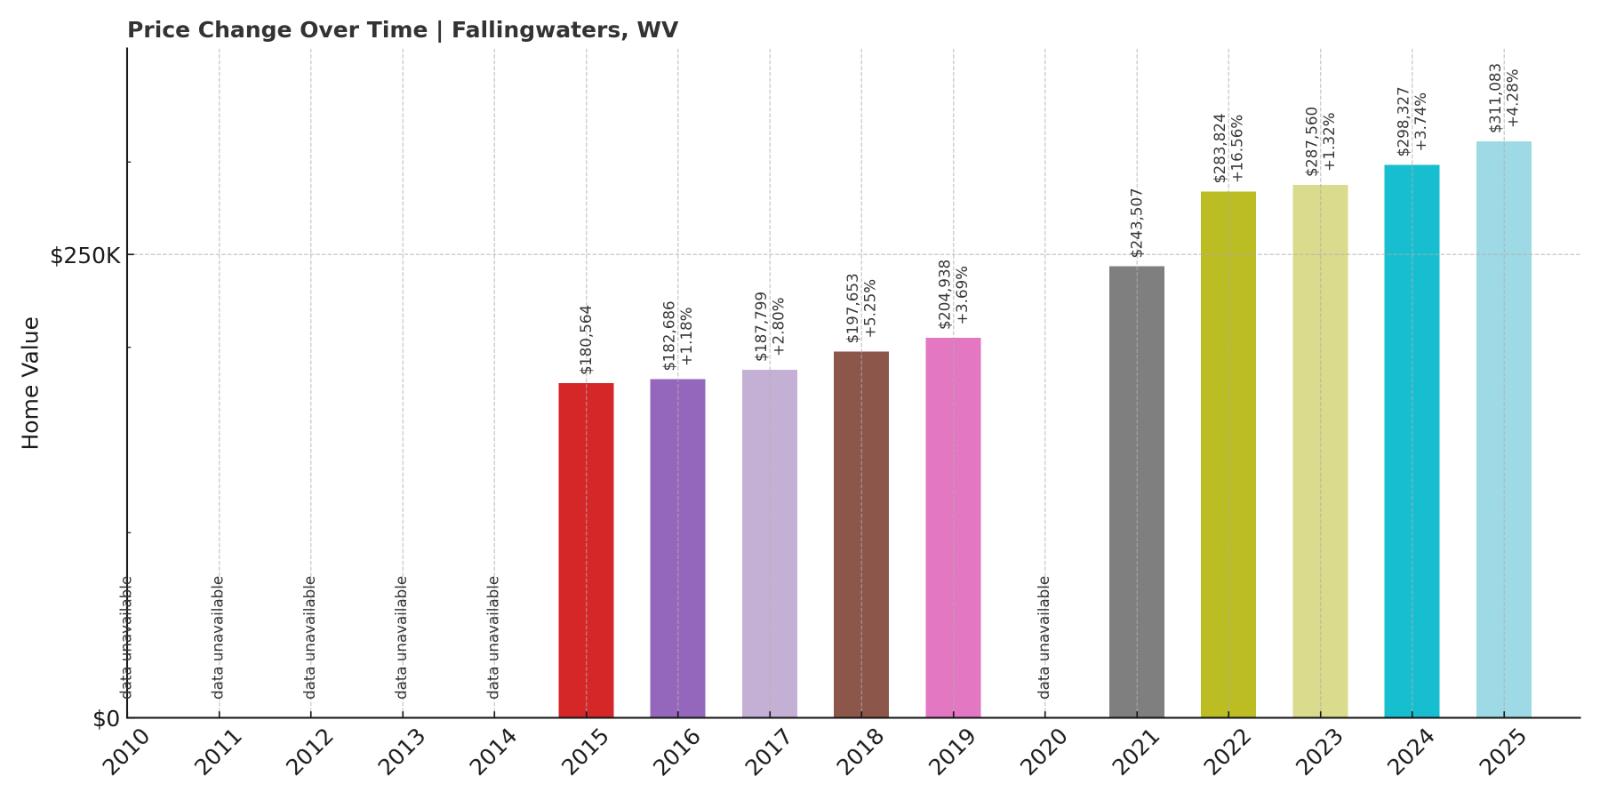
- 2015: $180,564
- 2016: $182,686 (+$2,122, +1.18% from previous year)
- 2017: $187,799 (+$5,113, +2.80% from previous year)
- 2018: $197,653 (+$9,854, +5.25% from previous year)
- 2019: $204,938 (+$7,285, +3.69% from previous year)
- 2020: N/A
- 2021: $243,507
- 2022: $283,824 (+$40,316, +16.56% from previous year)
- 2023: $287,560 (+$3,736, +1.32% from previous year)
- 2024: $298,327 (+$10,767, +3.74% from previous year)
- 2025: $311,083 (+$12,756, +4.28% from previous year)
Falling Waters home prices increased 72% between 2015 and 2025, rising from $180,564 to $311,083. Growth was modest in the late 2010s, but values surged after 2020. A 16.6% jump in 2022 was especially dramatic, followed by steady appreciation in subsequent years.
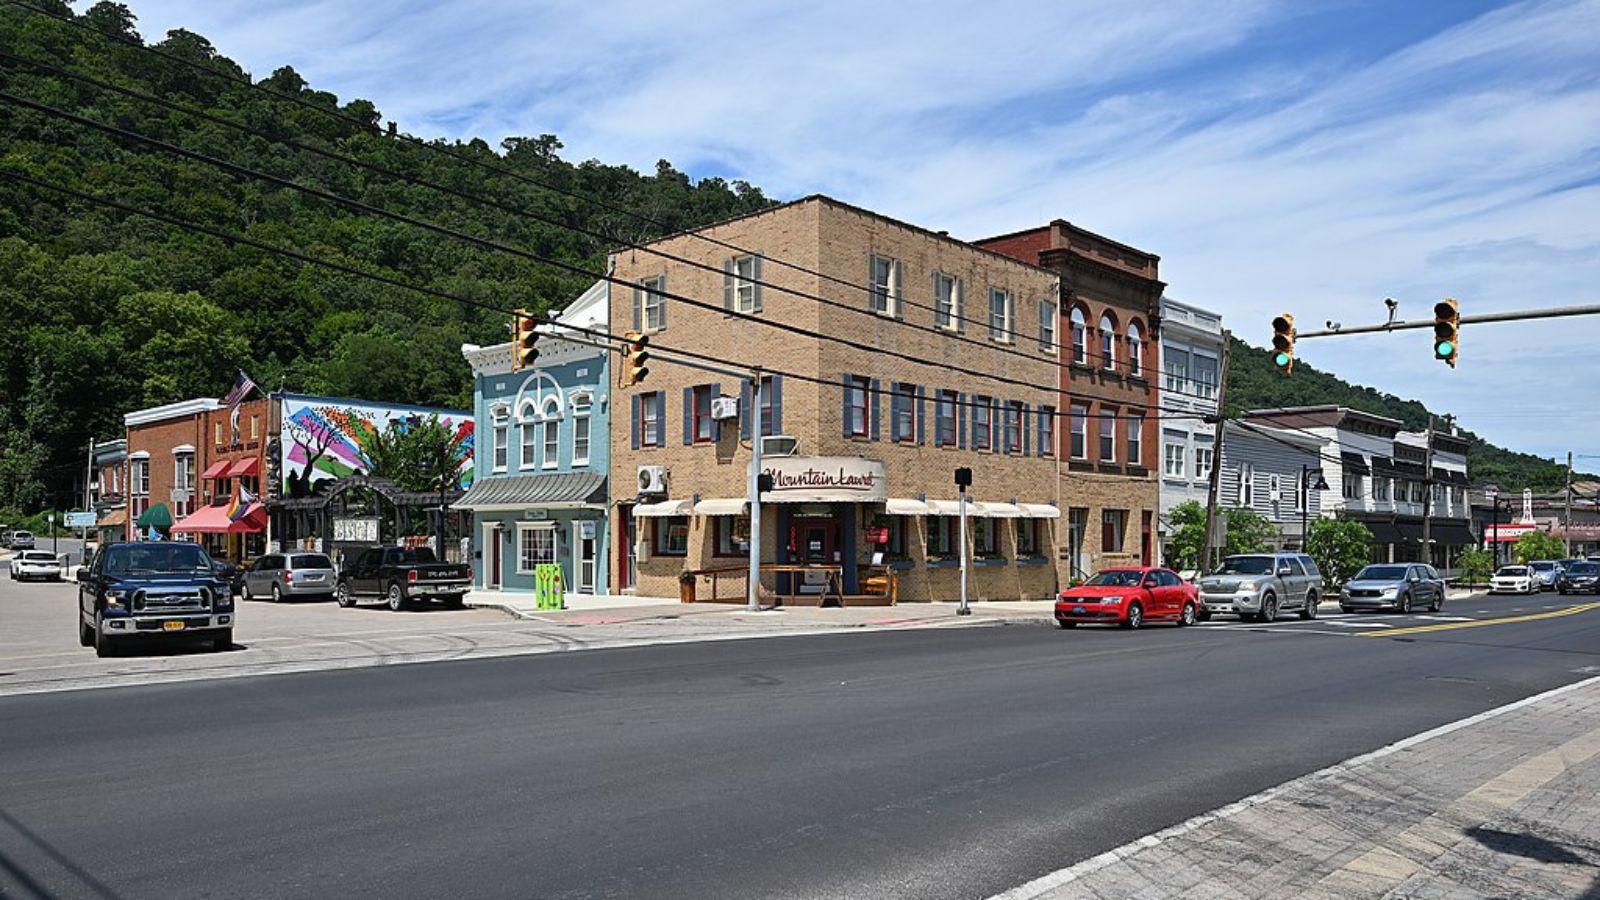
Falling Waters – Strong Momentum in the Housing Market
Falling Waters sits along the Potomac River in Berkeley County and has become a popular destination for buyers seeking a balance between rural calm and urban convenience. Its proximity to Hagerstown, MD and access to I-81 make it attractive for commuters working in both Maryland and Northern Virginia. The housing data reflects how this small community has transformed into a competitive real estate market, especially over the last five years.
The town’s recent home price growth can be traced to post-pandemic migration trends, where more people sought out lower-cost markets within reach of large metros. Falling Waters offers newer subdivisions, access to natural amenities like the river and trails, and a steadily growing population. As more infrastructure and retail development has arrived, its housing market has responded with consistent appreciation that shows no sign of slowing.
13. Bolivar – 104% Home Price Increase Since 2010
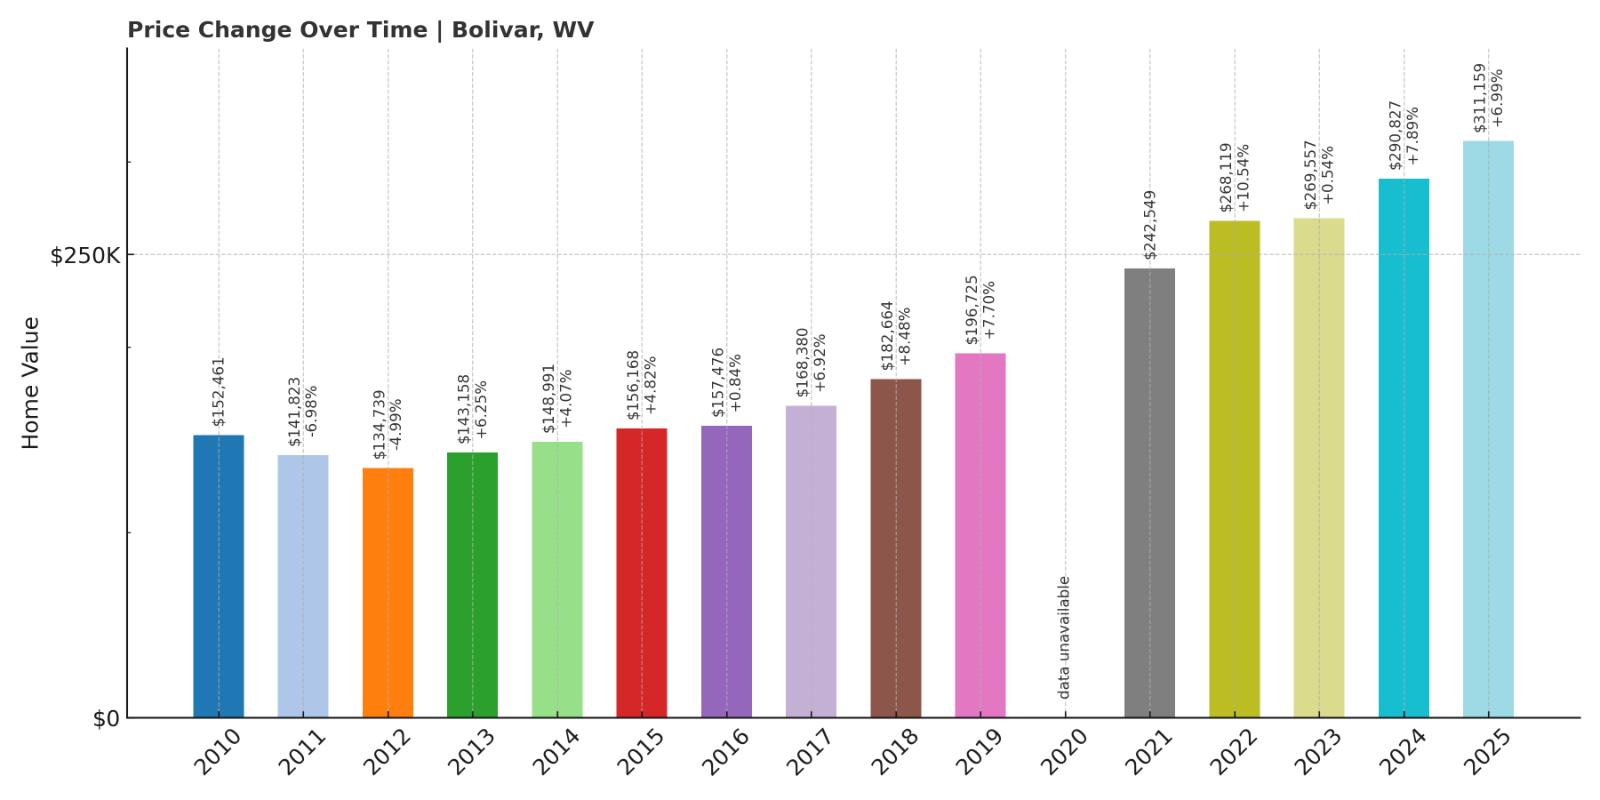
- 2010: $152,461 (-$2,827, -1.82% from previous year)
- 2011: $141,823 (-$10,638, -6.98% from previous year)
- 2012: $134,739 (-$7,084, -5.00% from previous year)
- 2013: $143,158 (+$8,419, +6.25% from previous year)
- 2014: $148,991 (+$5,833, +4.07% from previous year)
- 2015: $156,168 (+$7,177, +4.82% from previous year)
- 2016: $157,476 (+$1,308, +0.84% from previous year)
- 2017: $168,380 (+$10,904, +6.92% from previous year)
- 2018: $182,664 (+$14,283, +8.48% from previous year)
- 2019: $196,725 (+$14,061, +7.70% from previous year)
- 2020: N/A
- 2021: $242,549
- 2022: $268,119 (+$25,570, +10.54% from previous year)
- 2023: $269,557 (+$1,438, +0.54% from previous year)
- 2024: $290,827 (+$21,269, +7.89% from previous year)
- 2025: $311,159 (+$20,332, +6.99% from previous year)
Bolivar’s home prices have grown by 104% since 2010, rising from $152,461 to $311,159. After an early slump, the market picked up in 2013 and has posted strong gains every year since, with especially sharp growth beginning in 2021. The town added over $68,000 in value from 2022 to 2025 alone.
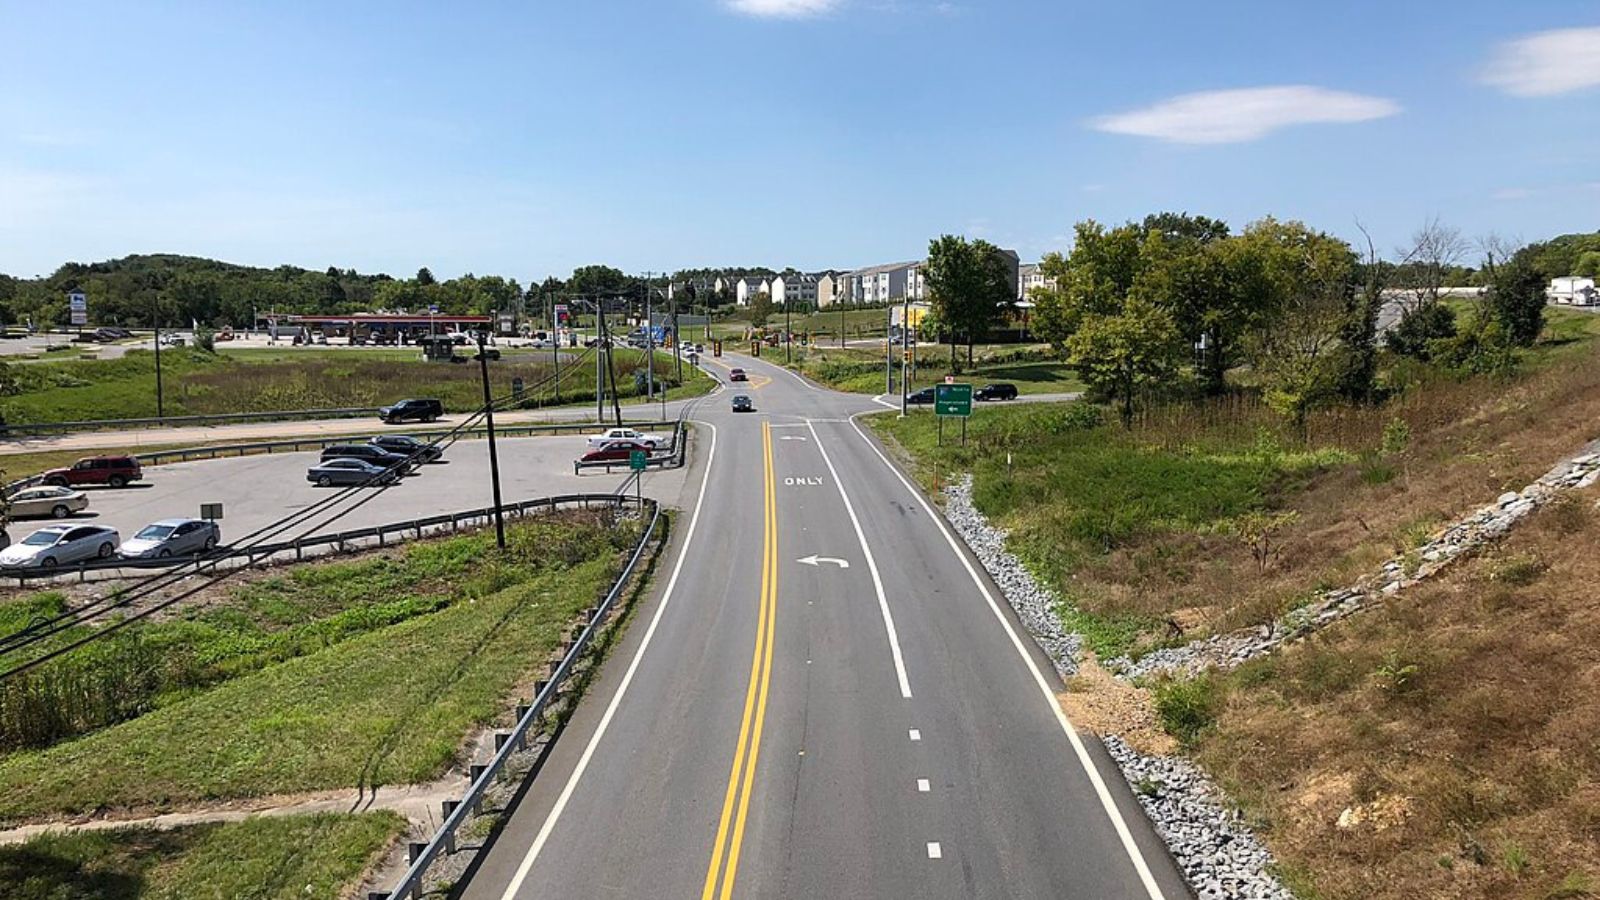
Bolivar – Steady Gains in a Scenic Setting
Bolivar shares a ridge with the better-known Harpers Ferry, and that proximity has worked in its favor as the area’s appeal has expanded. With views of the rivers, mountains, and protected parklands, Bolivar offers a peaceful lifestyle that’s still close to commuter routes and tourism activity. It’s an increasingly appealing spot for homebuyers priced out of nearby regions or seeking scenic real estate with long-term value.
In addition to natural charm, Bolivar has benefited from investment in local infrastructure and a slow but steady influx of new residents. Its historic homes and walkable layout add to its appeal, particularly among remote workers and retirees. With rising home prices and a stable upward trend, it’s clear that Bolivar is no longer a budget alternative—it’s a desirable destination in its own right.
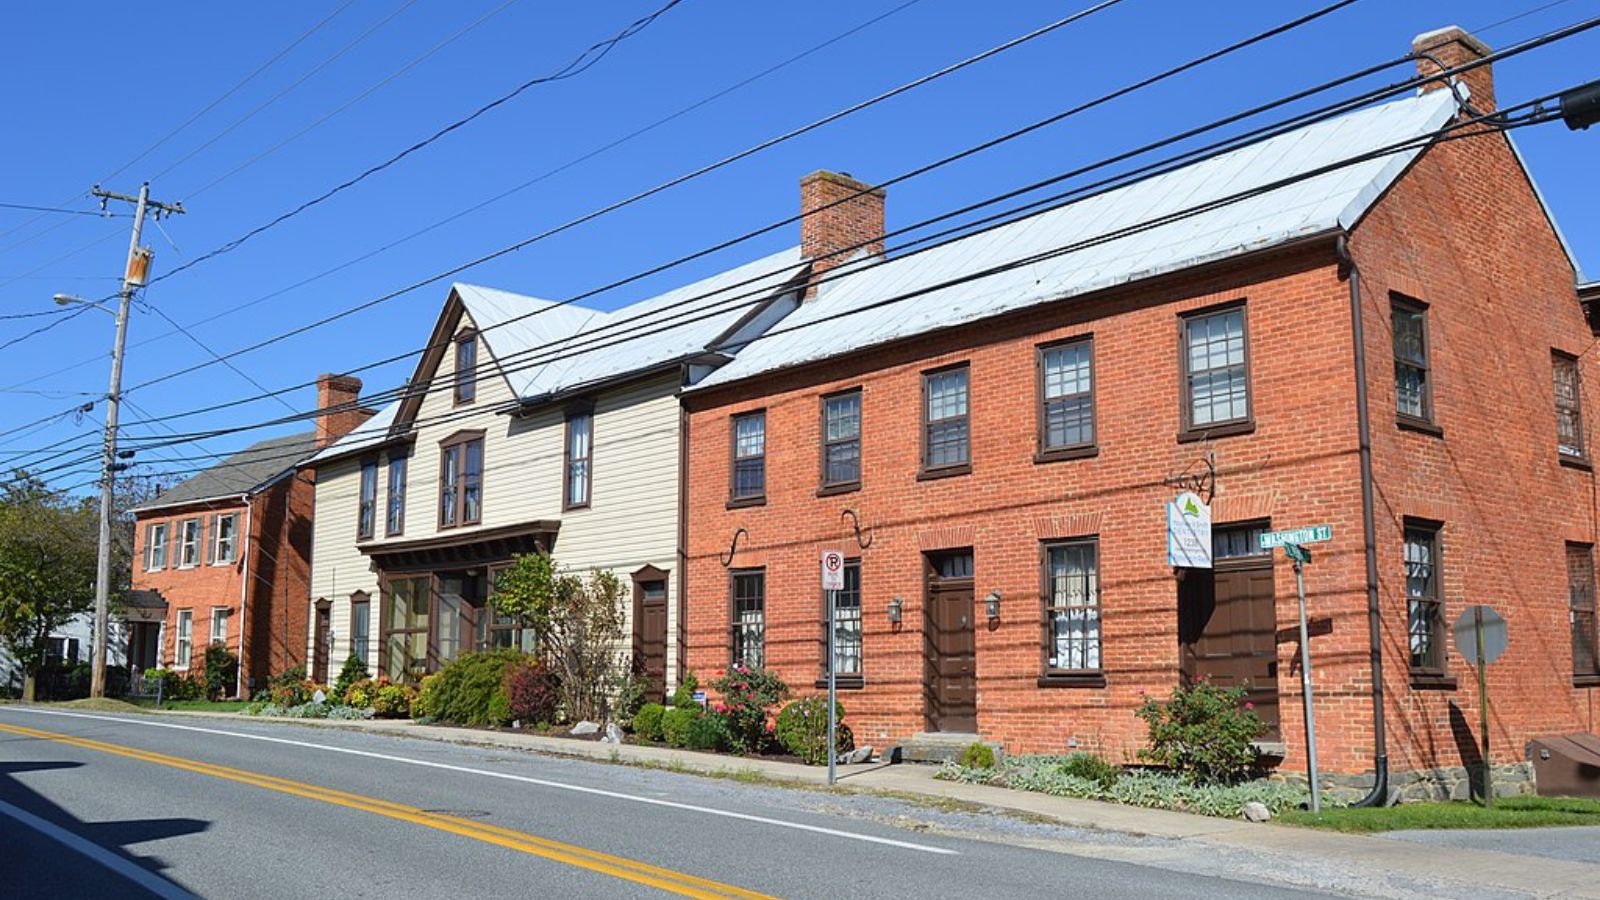
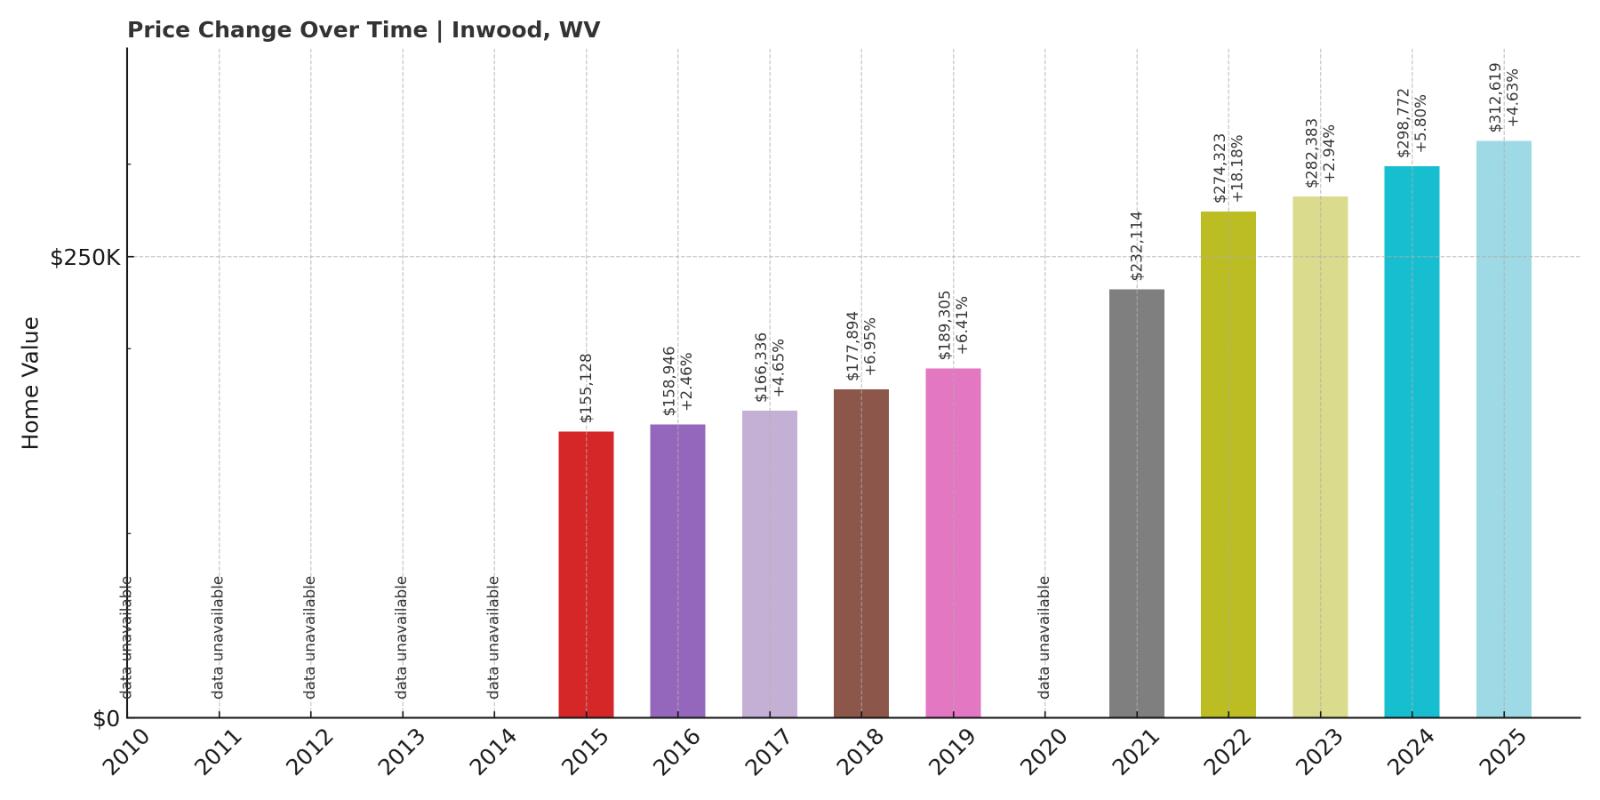
12. Inwood – 101% Home Price Increase Since 2015
- 2010: N/A
- 2011: N/A
- 2012: N/A
- 2013: N/A
- 2014: N/A
- 2015: $155,128
- 2016: $158,946 (+$3,818, +2.46% from previous year)
- 2017: $166,336 (+$7,390, +4.65% from previous year)
- 2018: $177,894 (+$11,558, +6.95% from previous year)
- 2019: $189,305 (+$11,411, +6.41% from previous year)
- 2020: N/A
- 2021: $232,114
- 2022: $274,323 (+$42,209, +18.18% from previous year)
- 2023: $282,383 (+$8,060, +2.94% from previous year)
- 2024: $298,772 (+$16,389, +5.80% from previous year)
- 2025: $312,619 (+$13,847, +4.63% from previous year)
Home prices in Inwood have increased by 101% since 2015, going from $155,128 to $312,619. Gains were consistent through 2019, but prices really accelerated after 2020. A nearly $42,000 spike in 2022 marked its strongest single-year growth on record.
Inwood – Big Increases for a Small Community
Inwood is one of the fastest-growing residential areas in Berkeley County. With easy access to Martinsburg, Winchester, and I-81, it has become a favorite for commuters looking for larger homes and better value. In recent years, new subdivisions and commercial development have transformed it into a major growth node for the region.
Despite its rapid growth, Inwood retains a small-town feel with local shops, schools, and parks anchoring its community life. The housing data shows that demand remains high, and the market is still adding value year after year. Inwood is no longer an up-and-coming area—it’s a firmly established market with staying power.
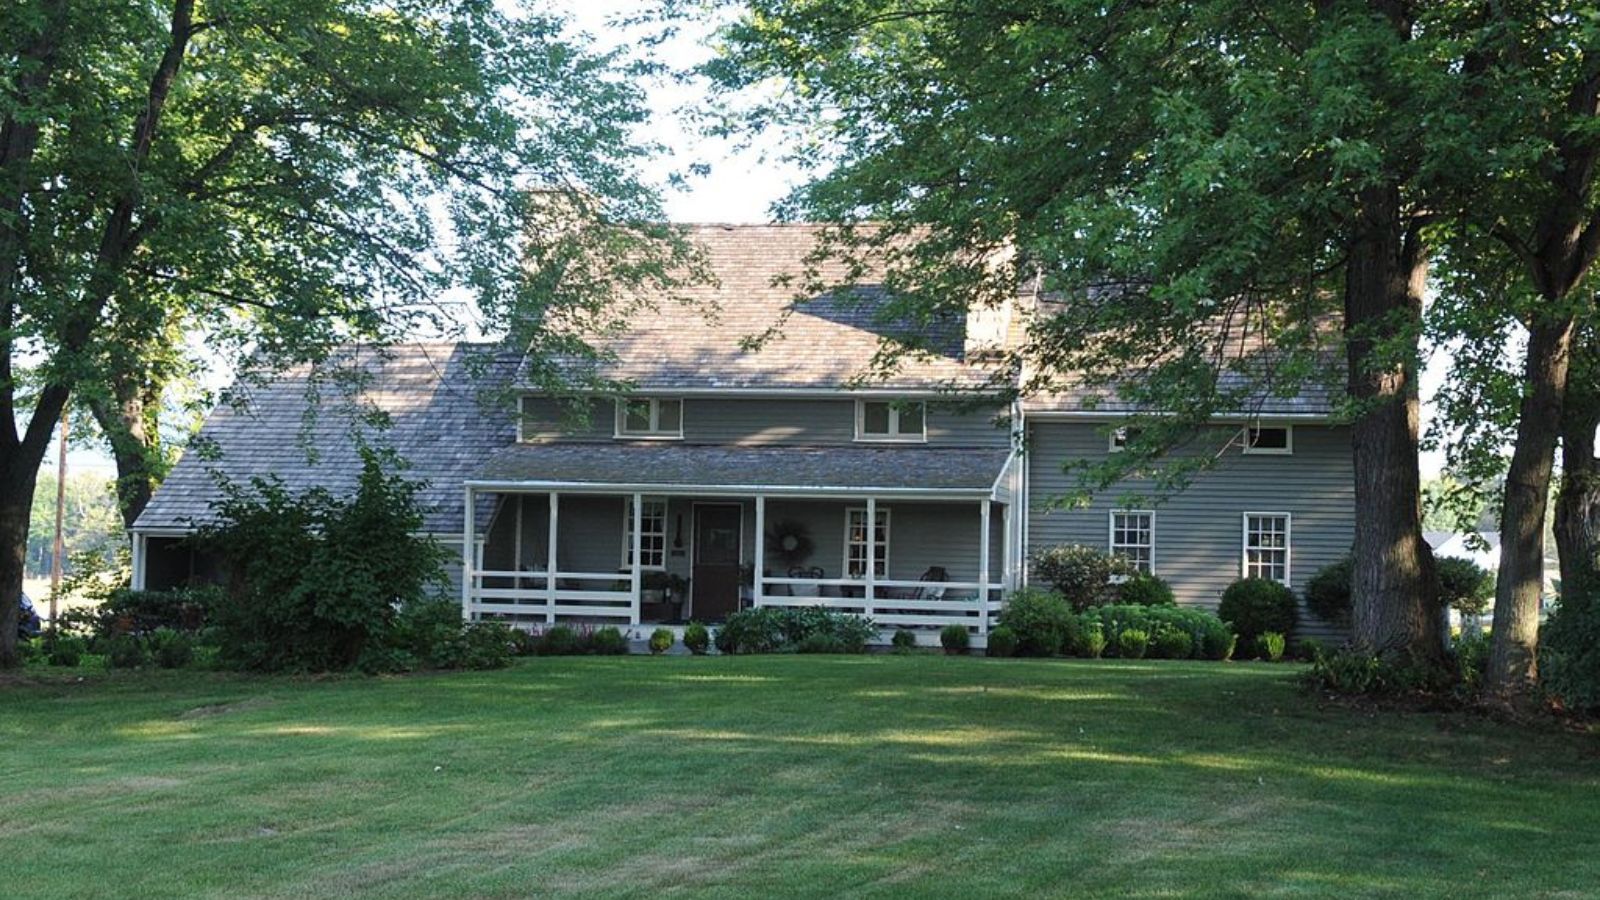
11. Capon Bridge – 88% Home Price Increase Since 2010
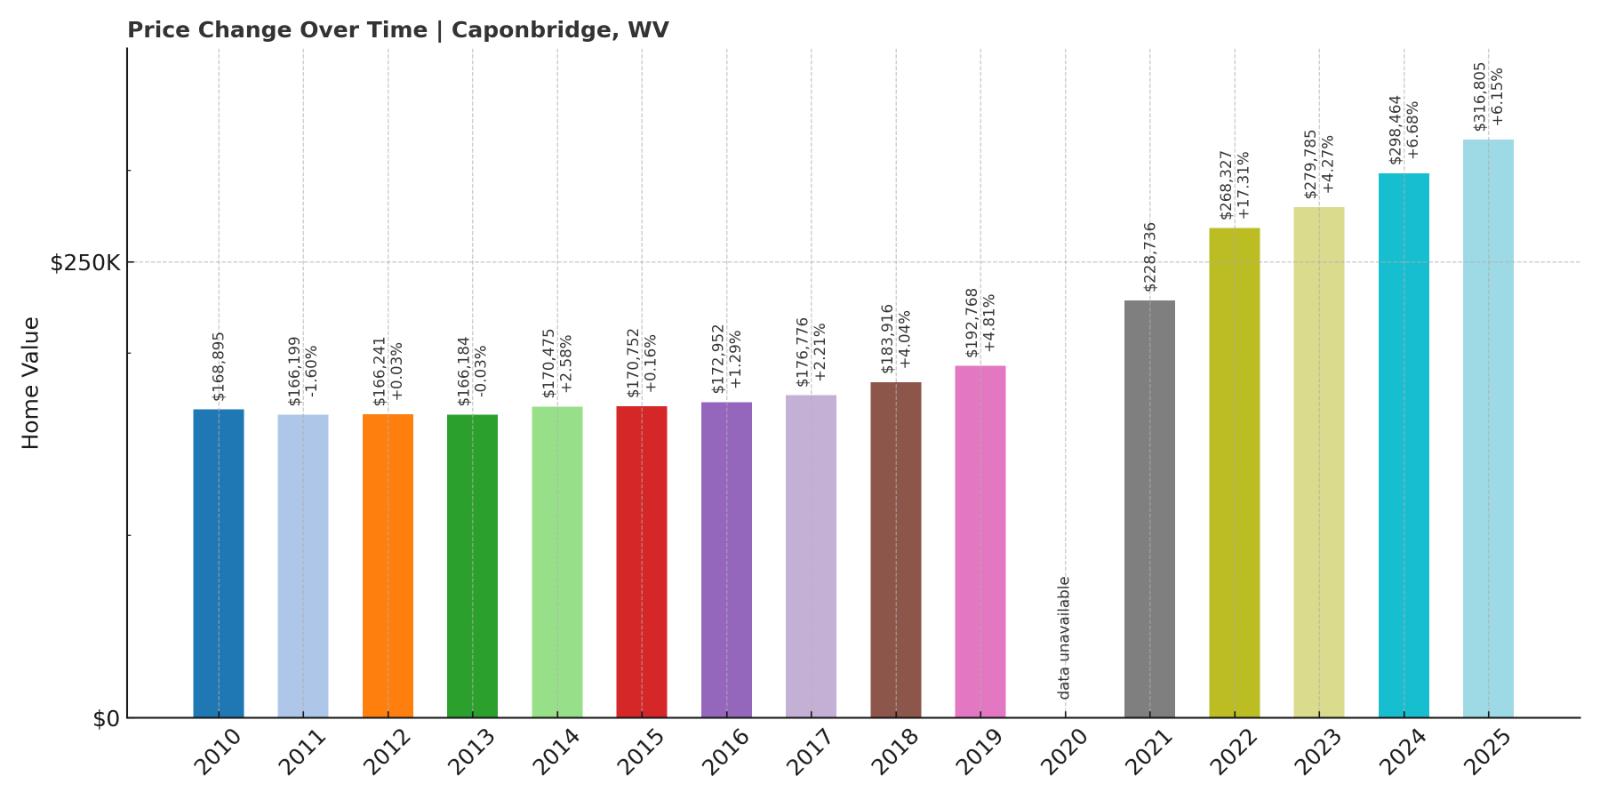
- 2010: $168,895 (-$8,843, -4.98% from previous year)
- 2011: $166,199 (-$2,696, -1.60% from previous year)
- 2012: $166,241 (+$42, +0.03% from previous year)
- 2013: $166,184 (-$57, -0.03% from previous year)
- 2014: $170,475 (+$4,291, +2.58% from previous year)
- 2015: $170,752 (+$277, +0.16% from previous year)
- 2016: $172,952 (+$2,199, +1.29% from previous year)
- 2017: $176,776 (+$3,824, +2.21% from previous year)
- 2018: $183,916 (+$7,140, +4.04% from previous year)
- 2019: $192,768 (+$8,852, +4.81% from previous year)
- 2020: N/A
- 2021: $228,736
- 2022: $268,327 (+$39,591, +17.31% from previous year)
- 2023: $279,785 (+$11,459, +4.27% from previous year)
- 2024: $298,464 (+$18,678, +6.68% from previous year)
- 2025: $316,805 (+$18,342, +6.15% from previous year)
From $168,895 in 2010 to $316,805 in 2025, Capon Bridge’s home values rose 88%. Growth was slow and steady for much of the decade, but prices jumped sharply after 2020. A standout year came in 2022, with a gain of more than $39,000.
Capon Bridge – Gateway to the Mountains with Soaring Demand
Capon Bridge is just west of the Virginia border along U.S. Route 50, making it an ideal location for those commuting to Winchester or looking for a rural escape. The town offers large lots, wooded properties, and scenic views, all while maintaining access to services and jobs nearby. That mix of affordability and proximity has pushed its home values steadily upward.
As more buyers search for homes outside expensive urban markets, Capon Bridge has grown in popularity with both local residents and transplants. Demand has intensified for available listings, and development remains modest, keeping supply tight. Its real estate story mirrors what’s happening across many small Appalachian towns—quiet places seeing major gains.
10. Bunker Hill – 100% Home Price Increase Since 2015
- 2010: N/A
- 2011: N/A
- 2012: N/A
- 2013: N/A
- 2014: N/A
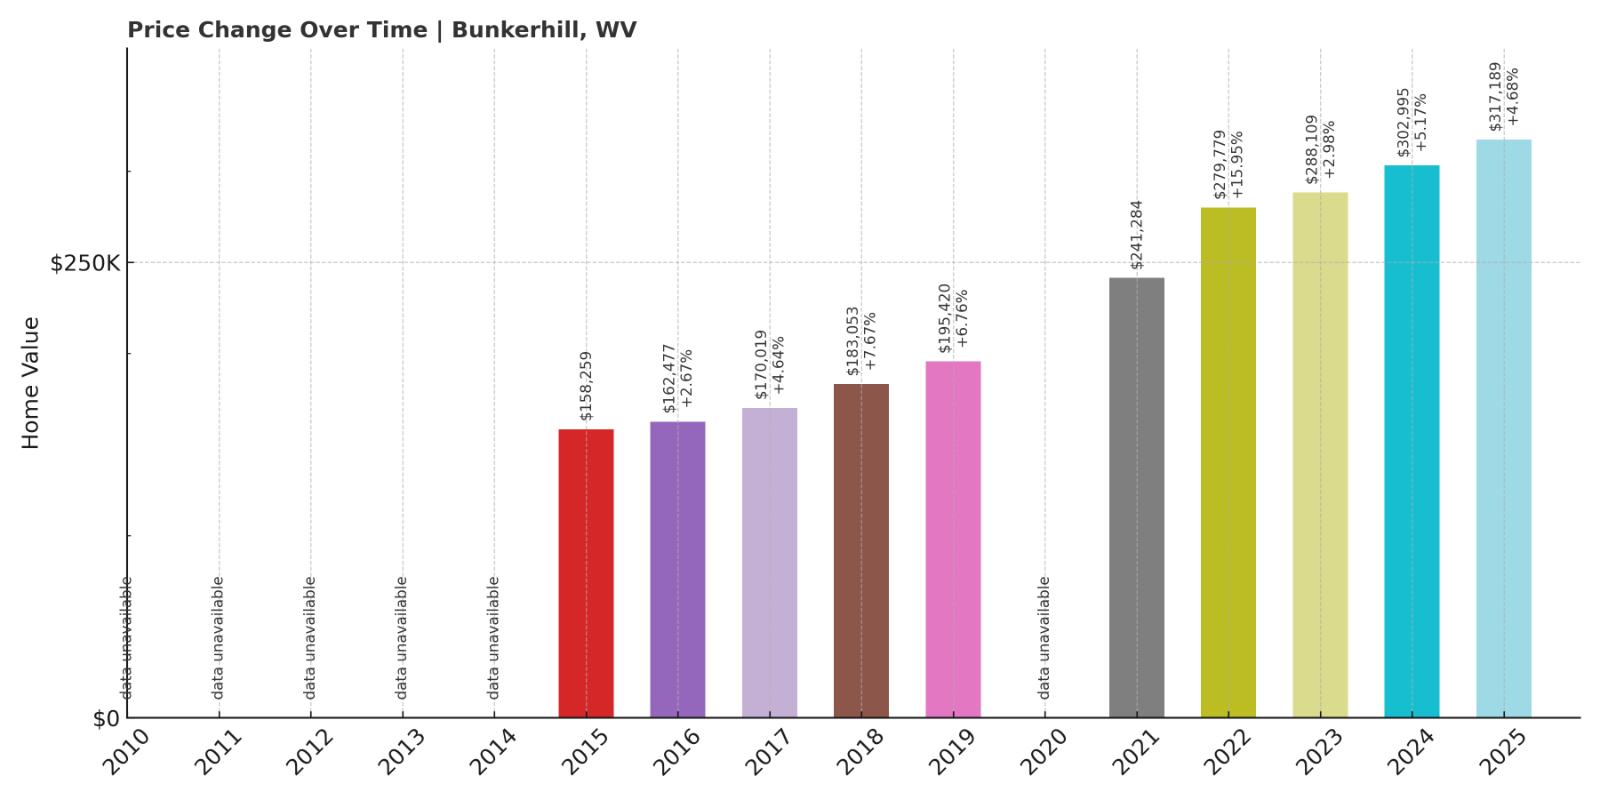
- 2015: $158,259
- 2016: $162,477 (+$4,218, +2.67% from previous year)
- 2017: $170,019 (+$7,542, +4.64% from previous year)
- 2018: $183,053 (+$13,033, +7.67% from previous year)
- 2019: $195,420 (+$12,368, +6.76% from previous year)
- 2020: N/A
- 2021: $241,284
- 2022: $279,779 (+$38,495, +15.95% from previous year)
- 2023: $288,109 (+$8,330, +2.98% from previous year)
- 2024: $302,995 (+$14,886, +5.17% from previous year)
- 2025: $317,189 (+$14,194, +4.68% from previous year)
Between 2015 and 2025, home values in Bunker Hill rose 100%, going from $158,259 to $317,189. The growth started steadily in the late 2010s and accelerated sharply after 2020. A 15.95% jump in 2022 marked its most significant increase, but the market has kept momentum with solid gains each year since.
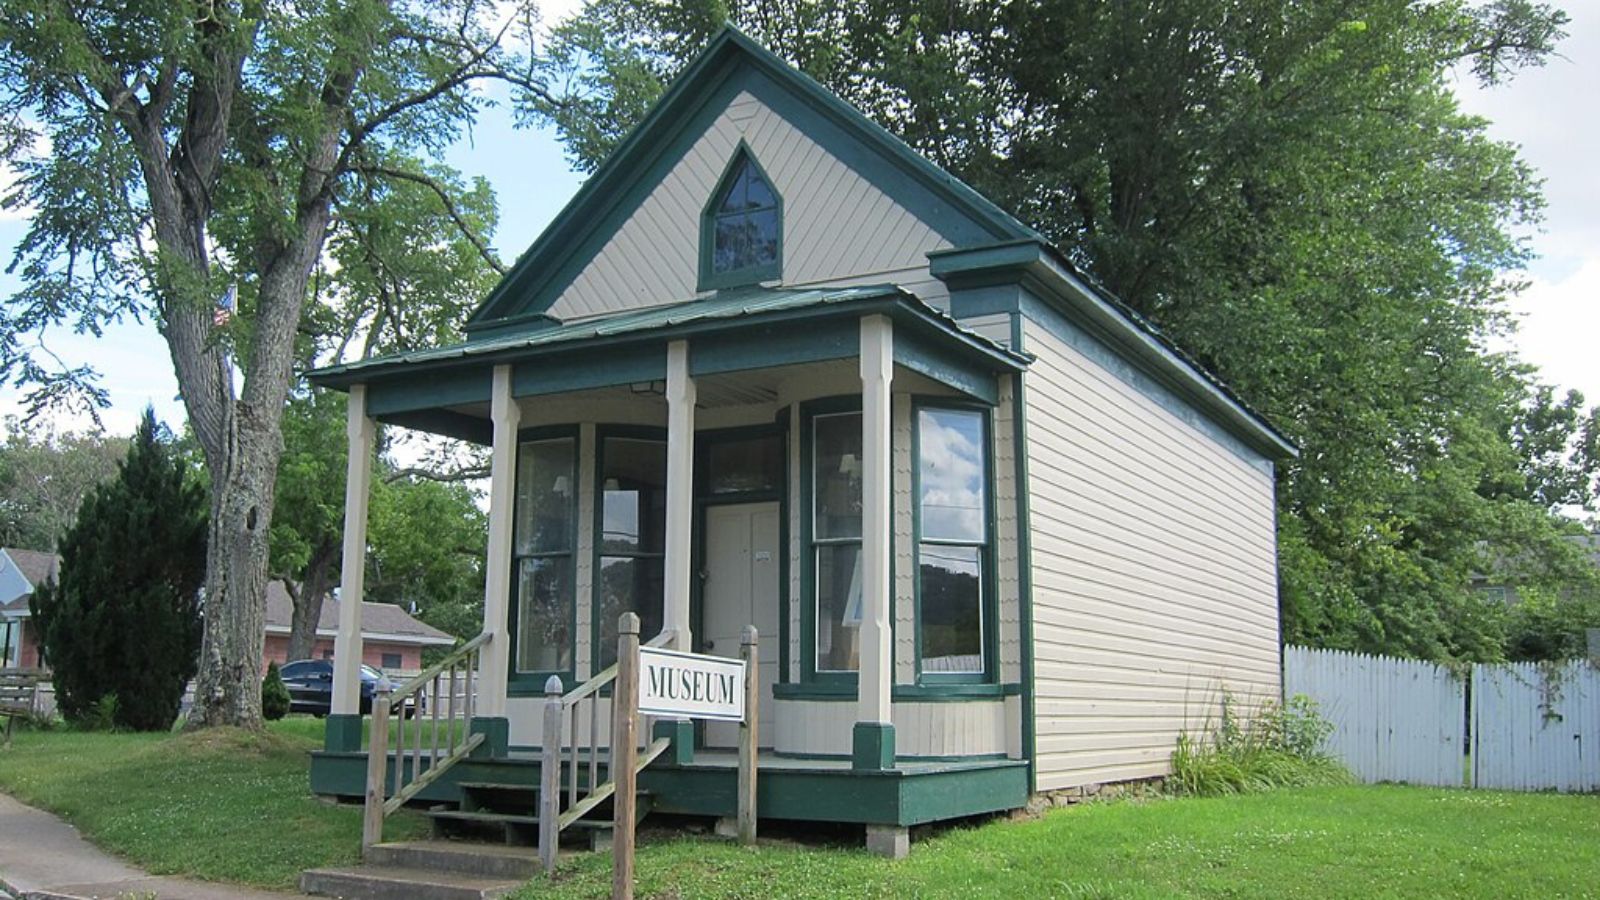
Bunker Hill – One of the Fastest-Growing Markets in the Panhandle
Bunker Hill sits in the southern part of Berkeley County, just minutes from the Virginia state line. Its location along I-81 makes it a natural choice for commuters traveling to Winchester or points deeper into Northern Virginia. Over the past decade, the town has evolved from a sleepy rural area to a rapidly developing suburb, complete with new neighborhoods, schools, and shopping amenities.
Buyers have flocked to Bunker Hill for its relative affordability and fresh housing stock. With prices in surrounding markets soaring, demand in Bunker Hill has intensified. While it once flew under the radar, the town is now firmly on the map as one of West Virginia’s most rapidly appreciating communities—offering both convenience and long-term value to its residents.
9. Davis – 70% Home Price Increase Since 2010
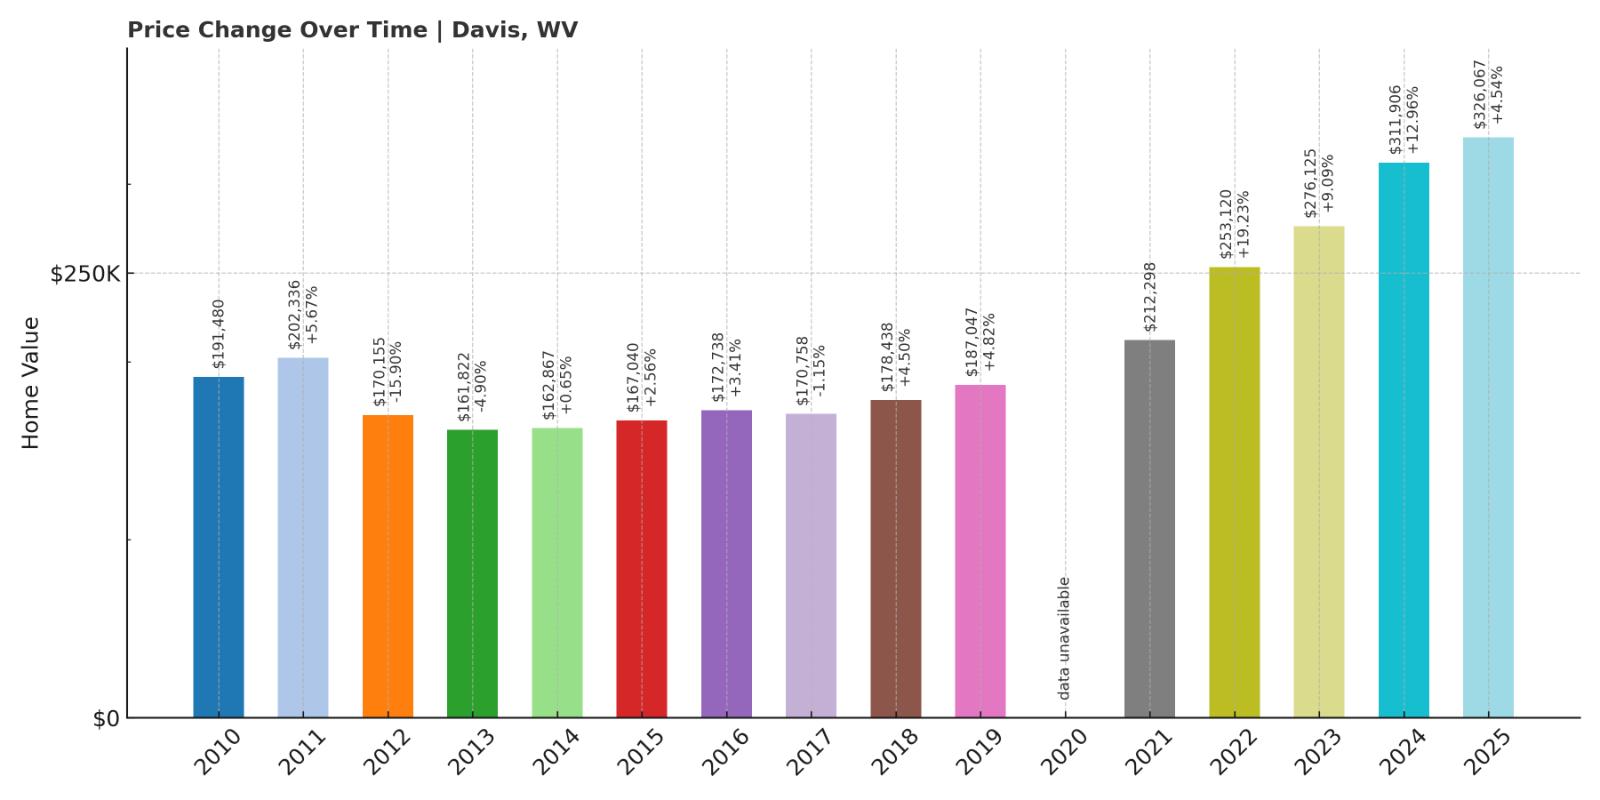
- 2010: $191,480 (+$6,819, +3.69% from previous year)
- 2011: $202,336 (+$10,857, +5.67% from previous year)
- 2012: $170,155 (-$32,181, -15.90% from previous year)
- 2013: $161,822 (-$8,333, -4.90% from previous year)
- 2014: $162,867 (+$1,045, +0.65% from previous year)
- 2015: $167,040 (+$4,173, +2.56% from previous year)
- 2016: $172,738 (+$5,698, +3.41% from previous year)
- 2017: $170,758 (-$1,980, -1.15% from previous year)
- 2018: $178,438 (+$7,679, +4.50% from previous year)
- 2019: $187,047 (+$8,610, +4.83% from previous year)
- 2020: N/A
- 2021: $212,298
- 2022: $253,120 (+$40,821, +19.23% from previous year)
- 2023: $276,125 (+$23,005, +9.09% from previous year)
- 2024: $311,906 (+$35,781, +12.96% from previous year)
- 2025: $326,067 (+$14,161, +4.54% from previous year)
Davis home prices rose from $191,480 in 2010 to $326,067 in 2025, marking a 70% increase. After a drop in the early 2010s, growth returned by 2015 and gained serious momentum after 2020. The town recorded especially strong gains between 2021 and 2024, including a nearly 13% jump in 2024 alone.
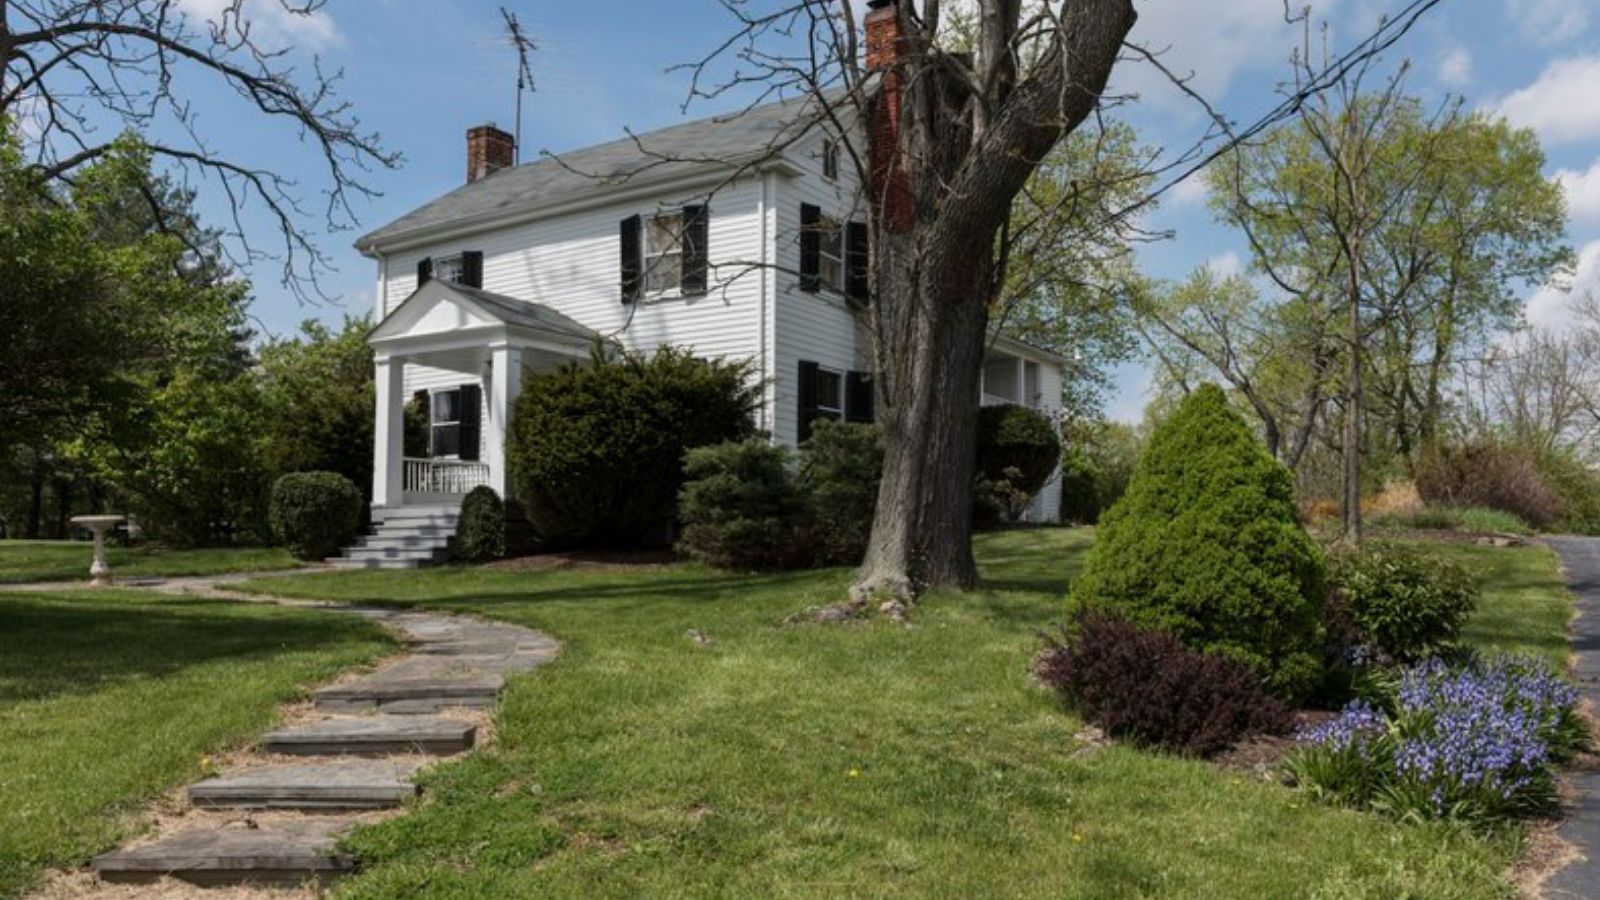
Davis – Tourism Appeal and Rising Home Values
Davis, located in Tucker County, is one of West Virginia’s best-known adventure towns. Surrounded by Blackwater Falls State Park, Canaan Valley Resort, and Dolly Sods Wilderness, it’s a year-round draw for outdoor enthusiasts. What was once a sleepy mountain town has evolved into a magnet for tourists, second-home buyers, and retirees—all of which has put upward pressure on home prices.
In recent years, remote workers have added to the buyer pool, attracted by the scenery and small-town charm. Demand has far outpaced the limited housing stock, and short-term rental interest has made the market even tighter. With natural beauty and a reputation for recreation, Davis has become one of West Virginia’s most in-demand places to own property.
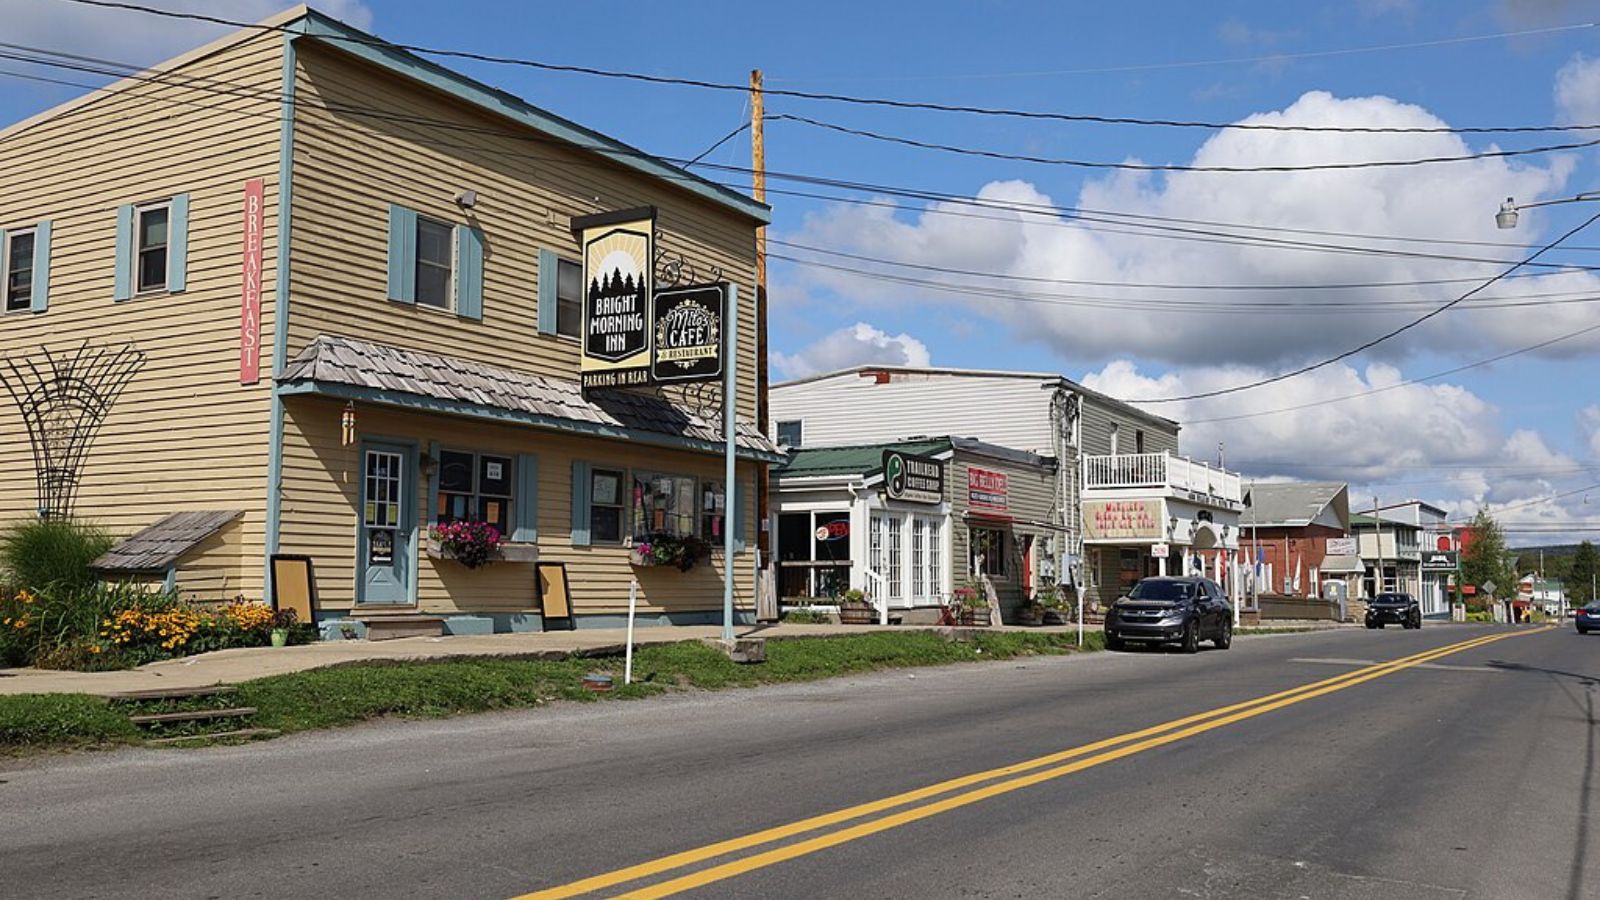
8. Hedgesville – 156% Home Price Increase Since 2010
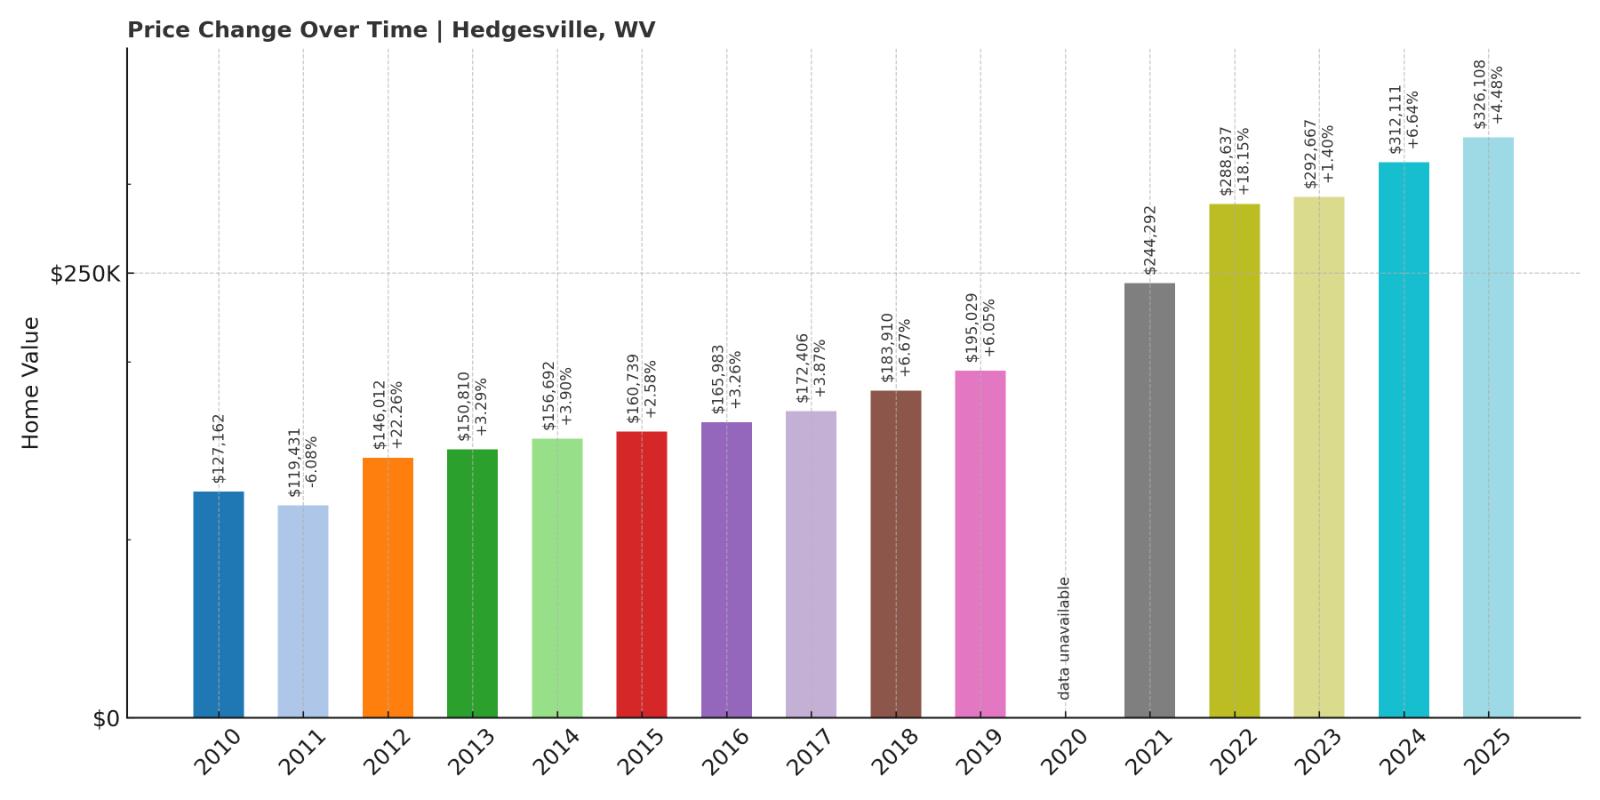
- 2010: $127,162 (-$12,653, -9.05% from previous year)
- 2011: $119,431 (-$7,731, -6.08% from previous year)
- 2012: $146,012 (+$26,581, +22.26% from previous year)
- 2013: $150,810 (+$4,798, +3.29% from previous year)
- 2014: $156,692 (+$5,882, +3.90% from previous year)
- 2015: $160,739 (+$4,046, +2.58% from previous year)
- 2016: $165,983 (+$5,245, +3.26% from previous year)
- 2017: $172,406 (+$6,423, +3.87% from previous year)
- 2018: $183,910 (+$11,504, +6.67% from previous year)
- 2019: $195,029 (+$11,119, +6.05% from previous year)
- 2020: N/A
- 2021: $244,292
- 2022: $288,637 (+$44,345, +18.15% from previous year)
- 2023: $292,667 (+$4,031, +1.40% from previous year)
- 2024: $312,111 (+$19,444, +6.64% from previous year)
- 2025: $326,108 (+$13,996, +4.48% from previous year)
Hedgesville’s home values jumped 156% over 15 years, rising from $127,162 in 2010 to $326,108 in 2025. Early years showed steady, modest increases, but growth surged after 2020. The sharpest gain came in 2022, with an 18% spike, followed by consistent increases through 2025.
Hedgesville – From Rural Bargain to Fast-Rising Market
Hedgesville, located in Berkeley County, offers a quieter setting than Martinsburg or Charles Town but still benefits from proximity to I-81 and commuter access. Historically a rural and budget-friendly market, it’s now drawing more attention from buyers looking for affordability within reach of major job hubs. With limited inventory and a growing reputation, it’s no surprise the housing market here has taken off.
The town’s appeal lies in its blend of small-town living and convenience. As buyers move farther out from the D.C. metro in search of better value and more space, Hedgesville has become a serious contender. That shift has transformed it from a rural outlier into one of West Virginia’s fastest-appreciating markets.
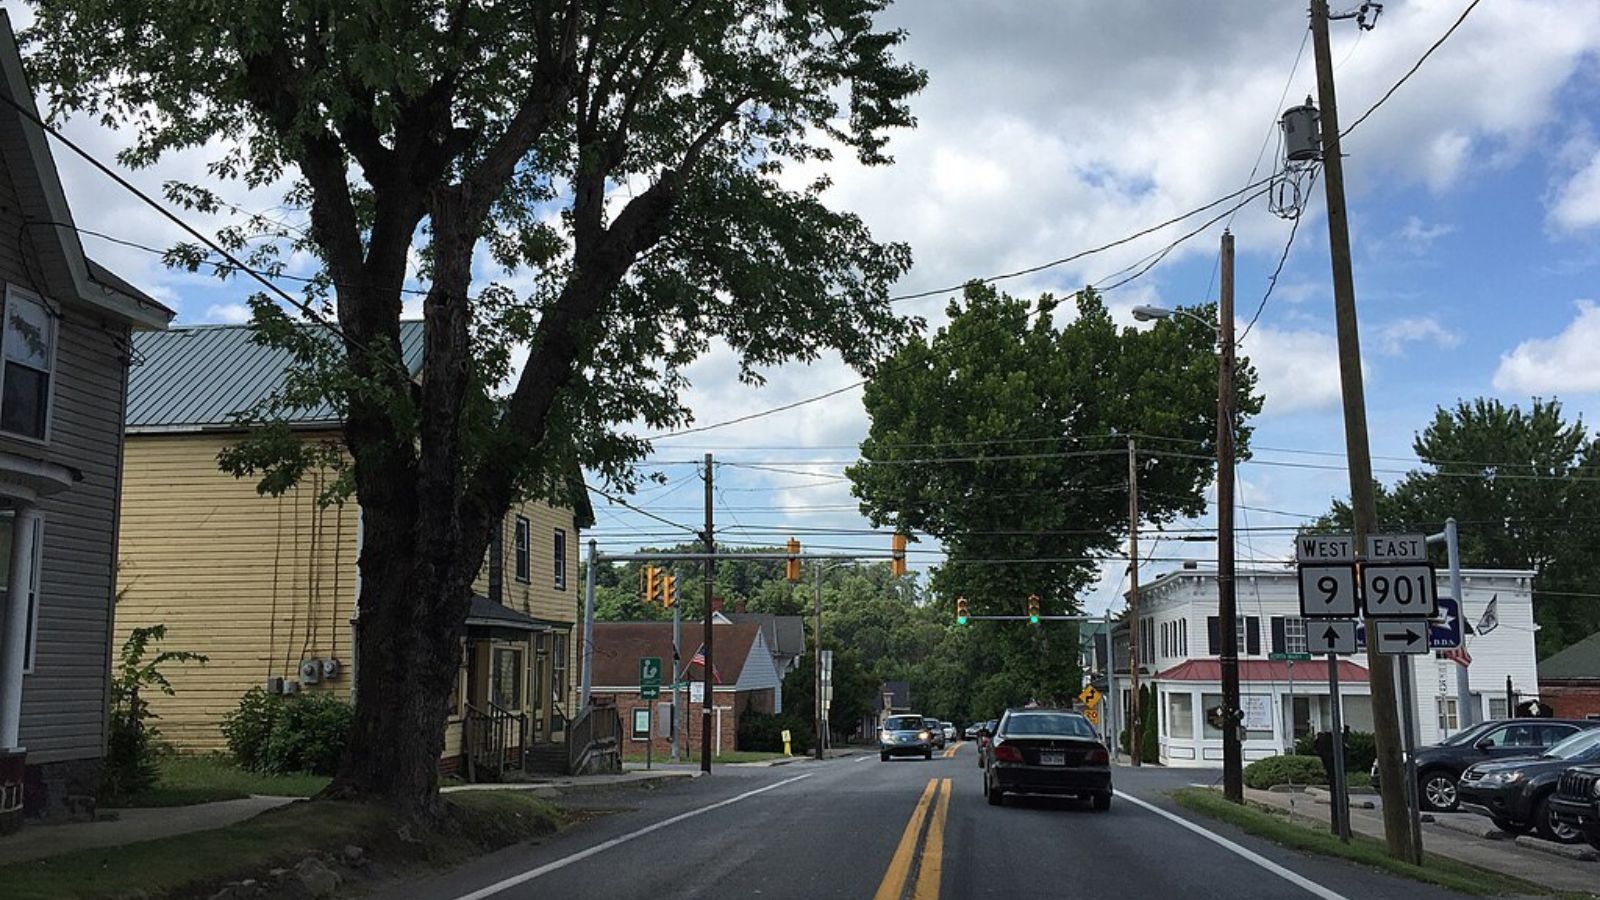
7. Gerrardstown – 137% Home Price Increase Since 2010
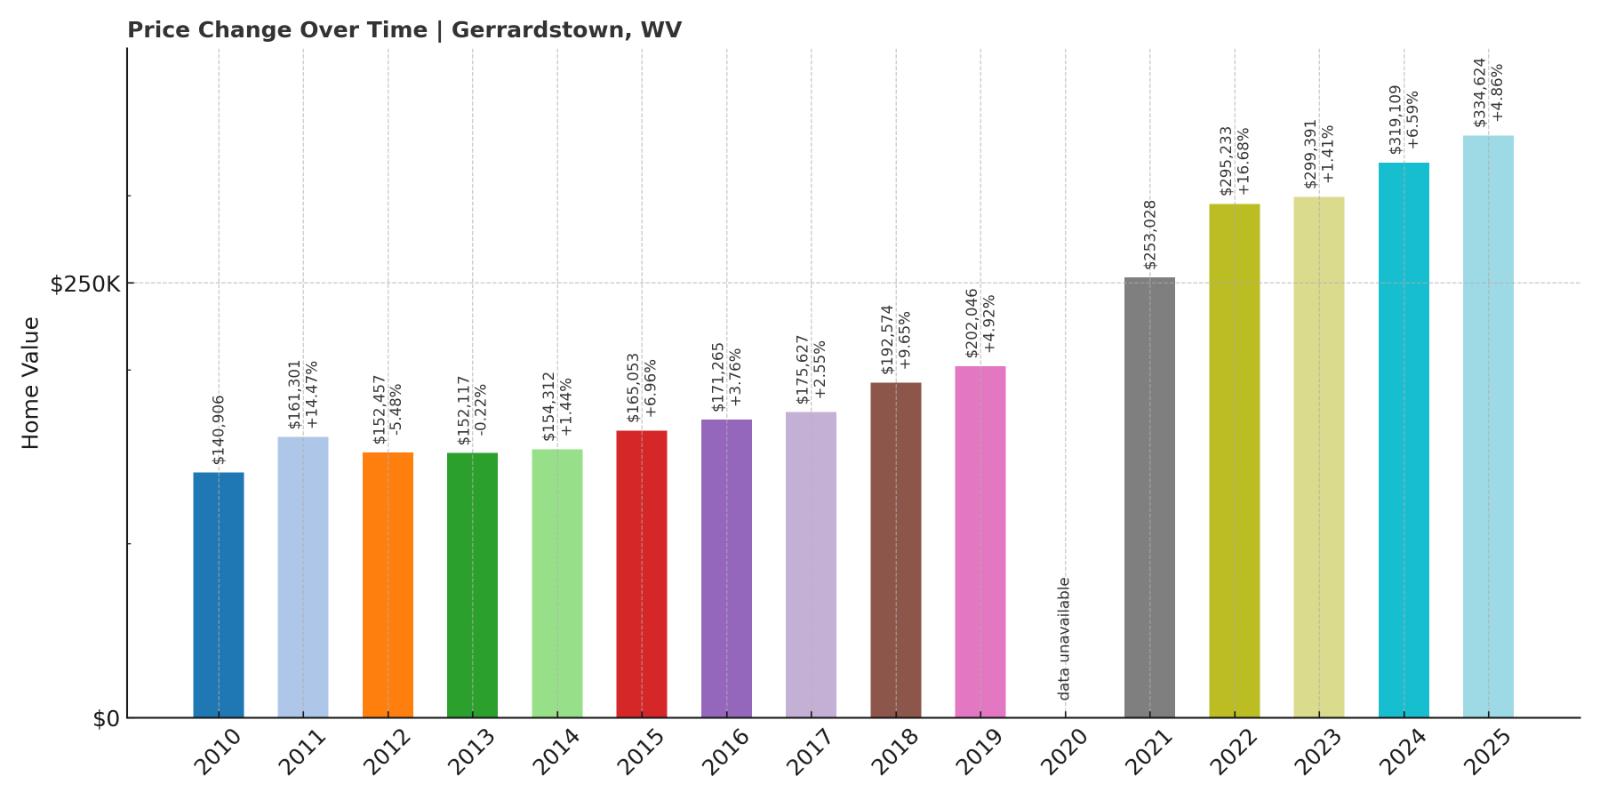
- 2010: $140,906 (-$10,033, -6.65% from previous year)
- 2011: $161,301 (+$20,394, +14.47% from previous year)
- 2012: $152,457 (-$8,844, -5.48% from previous year)
- 2013: $152,117 (-$340, -0.22% from previous year)
- 2014: $154,312 (+$2,195, +1.44% from previous year)
- 2015: $165,053 (+$10,741, +6.96% from previous year)
- 2016: $171,265 (+$6,213, +3.76% from previous year)
- 2017: $175,627 (+$4,362, +2.55% from previous year)
- 2018: $192,574 (+$16,947, +9.65% from previous year)
- 2019: $202,046 (+$9,472, +4.92% from previous year)
- 2020: N/A
- 2021: $253,028
- 2022: $295,233 (+$42,206, +16.68% from previous year)
- 2023: $299,391 (+$4,157, +1.41% from previous year)
- 2024: $319,109 (+$19,718, +6.59% from previous year)
- 2025: $334,624 (+$15,515, +4.86% from previous year)
Home prices in Gerrardstown more than doubled between 2010 and 2025, rising from $140,906 to $334,624—a 137% increase. After moderate gains through the 2010s, values surged after 2020, with a major spike in 2022. Price appreciation has remained strong through 2025.
Gerrardstown – Value Doubles in the Eastern Panhandle
Gerrardstown sits just southwest of Martinsburg in Berkeley County, surrounded by orchards, hills, and quiet backroads. It has long flown under the radar, but its housing market is now surging as more people look outside urban areas for more space and lower costs. With newer homes and scenic settings, Gerrardstown has gained attention from both locals and newcomers.
It’s close enough to major highways for commuters but remote enough to maintain a rural character. As nearby towns like Inwood and Bunker Hill fill up, buyers are expanding their search. That increased demand has pushed home prices higher and transformed Gerrardstown into one of the top appreciating areas in the state.
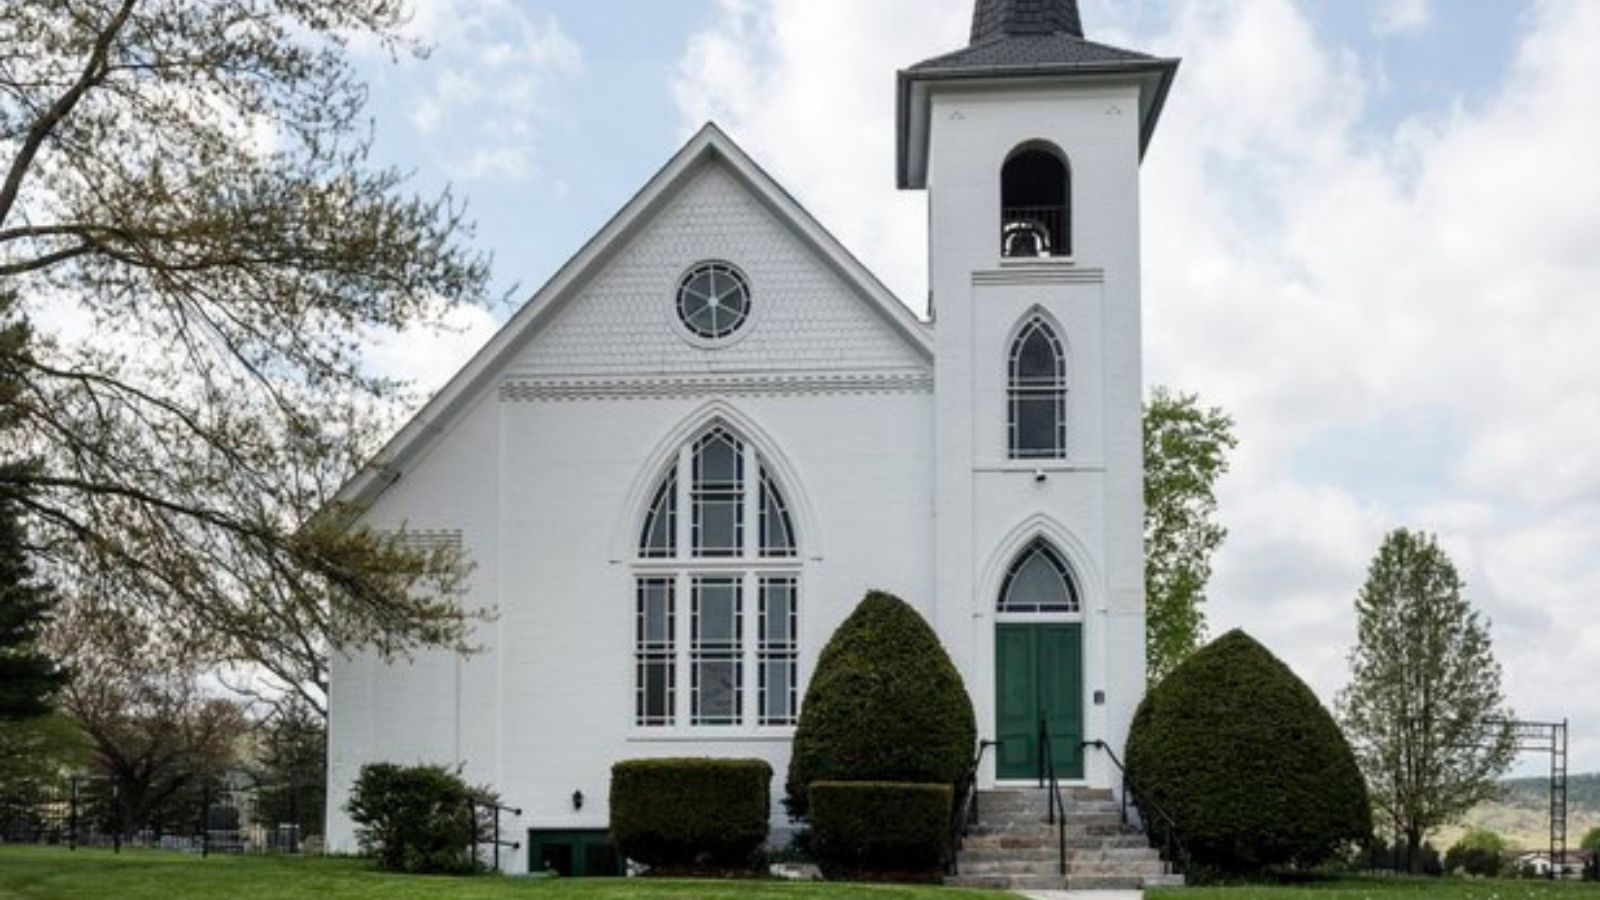
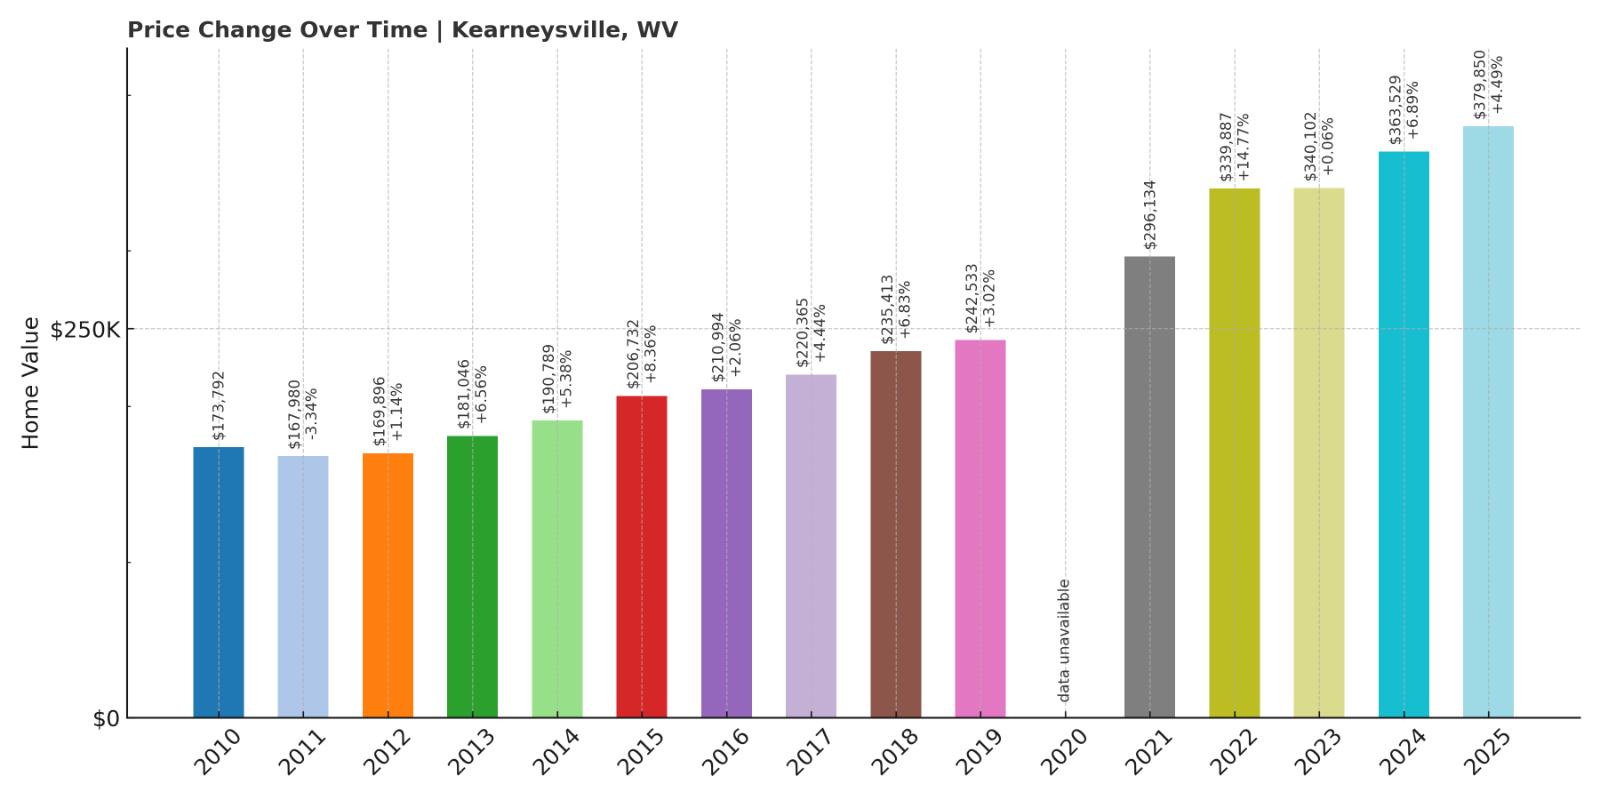
6. Kearneysville – 119% Home Price Increase Since 2010
Would you like to save this?
- 2010: $173,792 (-$17,545, -9.17% from previous year)
- 2011: $167,980 (-$5,812, -3.34% from previous year)
- 2012: $169,896 (+$1,916, +1.14% from previous year)
- 2013: $181,046 (+$11,149, +6.56% from previous year)
- 2014: $190,789 (+$9,743, +5.38% from previous year)
- 2015: $206,732 (+$15,943, +8.36% from previous year)
- 2016: $210,994 (+$4,261, +2.06% from previous year)
- 2017: $220,365 (+$9,371, +4.44% from previous year)
- 2018: $235,413 (+$15,049, +6.83% from previous year)
- 2019: $242,533 (+$7,119, +3.02% from previous year)
- 2020: N/A
- 2021: $296,134
- 2022: $339,887 (+$43,753, +14.77% from previous year)
- 2023: $340,102 (+$215, +0.06% from previous year)
- 2024: $363,529 (+$23,427, +6.89% from previous year)
- 2025: $379,850 (+$16,322, +4.49% from previous year)
Kearneysville home values grew from $173,792 in 2010 to $379,850 in 2025—a 119% increase. After consistent gains through the 2010s, prices jumped dramatically after 2020. The largest spike occurred in 2022, with values climbing nearly 15% in just one year.
Kearneysville – A Quiet Crossroads Turned Price Leader
Kearneysville straddles Jefferson and Berkeley counties, tucked between Charles Town and Martinsburg. Once known mainly for farmland and research centers, it’s now on the radar for homebuyers seeking space and proximity to commuter routes. While the town lacks a dense commercial core, that hasn’t stopped demand for its roomy properties and convenient location from surging.
Buyers priced out of nearby towns have turned to Kearneysville as a strong alternative, and development has followed. While it retains a distinctly rural vibe, growth is happening quickly. With its central location and rapidly rising values, Kearneysville now ranks among the most expensive housing markets in the state.
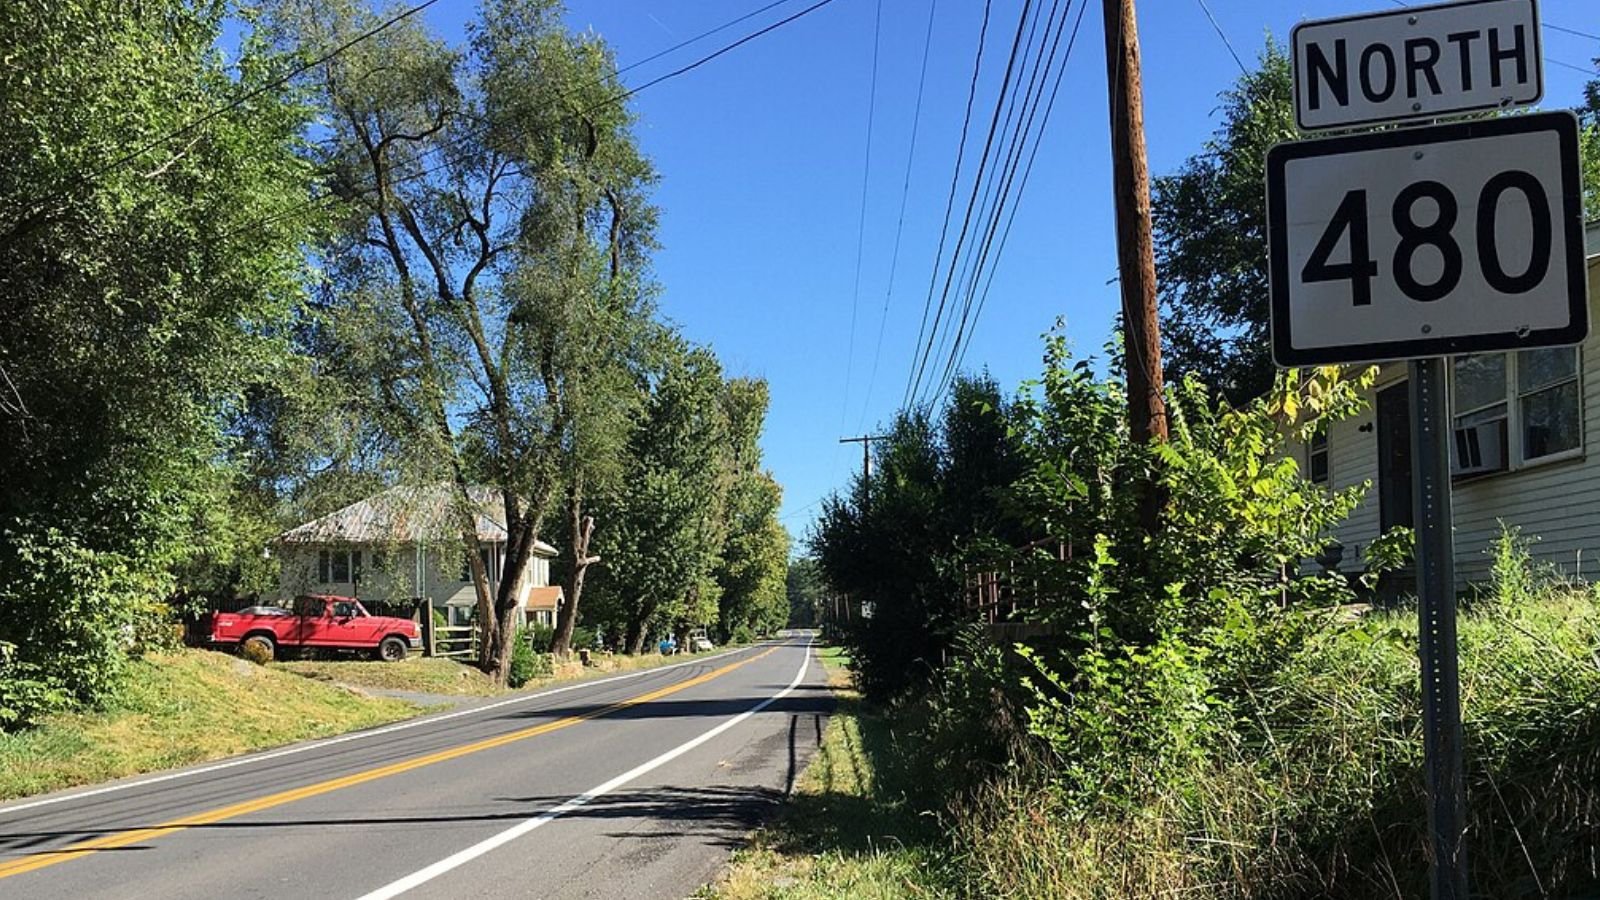
5. Harpers Ferry – 95% Home Price Increase Since 2010
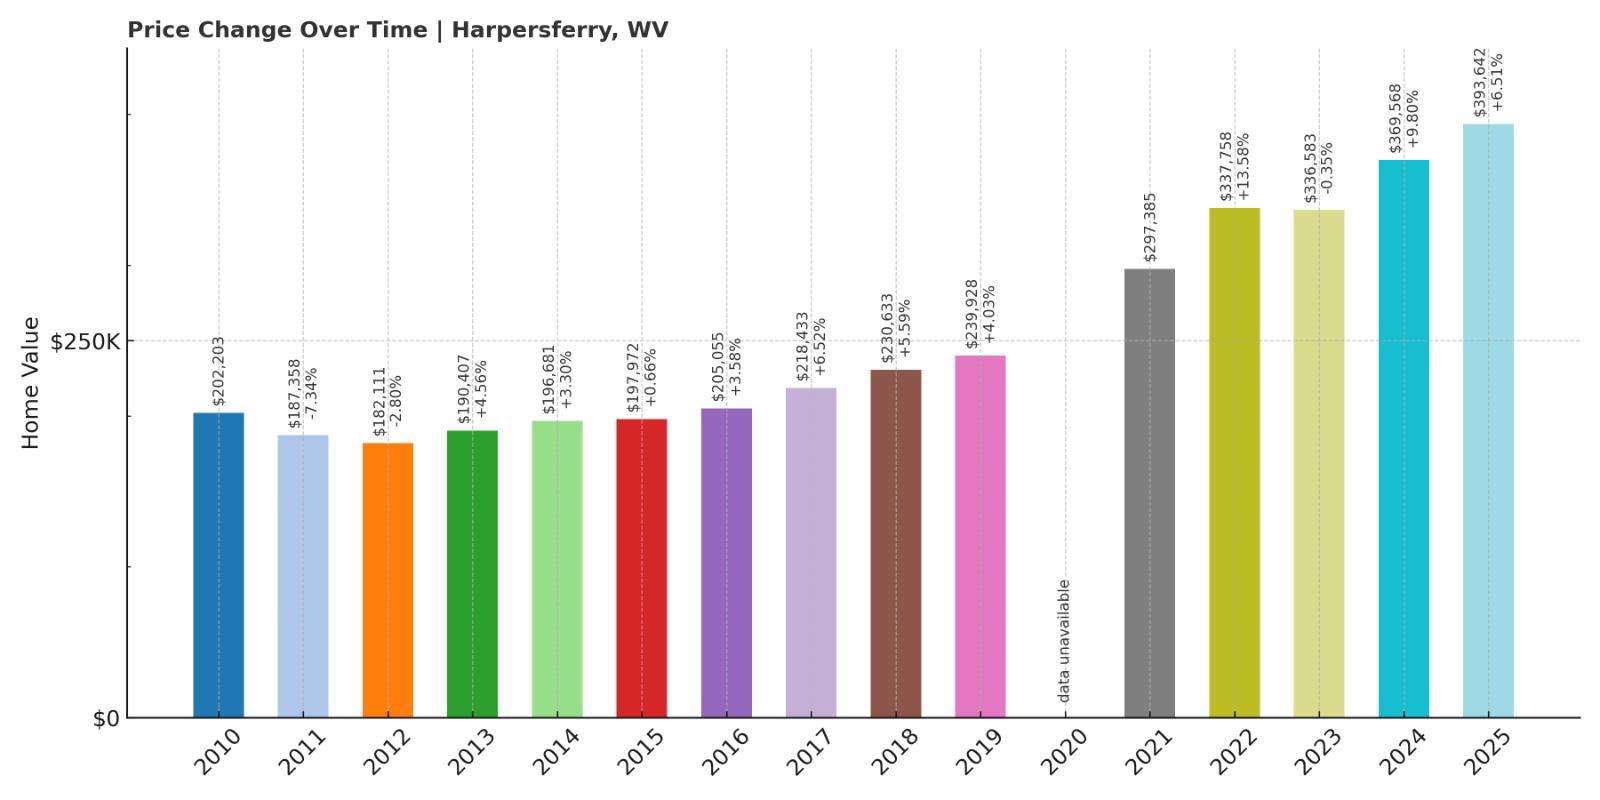
- 2010: $202,203 (-$10,773, -5.06% from previous year)
- 2011: $187,358 (-$14,845, -7.34% from previous year)
- 2012: $182,111 (-$5,248, -2.80% from previous year)
- 2013: $190,407 (+$8,296, +4.56% from previous year)
- 2014: $196,681 (+$6,274, +3.30% from previous year)
- 2015: $197,972 (+$1,291, +0.66% from previous year)
- 2016: $205,055 (+$7,083, +3.58% from previous year)
- 2017: $218,433 (+$13,378, +6.52% from previous year)
- 2018: $230,633 (+$12,199, +5.58% from previous year)
- 2019: $239,928 (+$9,295, +4.03% from previous year)
- 2020: N/A
- 2021: $297,385
- 2022: $337,758 (+$40,373, +13.58% from previous year)
- 2023: $336,583 (-$1,175, -0.35% from previous year)
- 2024: $369,568 (+$32,985, +9.80% from previous year)
- 2025: $393,642 (+$24,075, +6.51% from previous year)
From $202,203 in 2010 to $393,642 in 2025, Harpers Ferry home values grew 95%. While the early 2010s were uneven, prices took off after 2020. A surge in 2022, followed by more gains in 2024 and 2025, helped push it into the top five most expensive towns in West Virginia.
Harpers Ferry – Historic Beauty and Strong Buyer Demand
Harpers Ferry is one of the state’s most iconic destinations, situated at the confluence of the Potomac and Shenandoah Rivers. Known for its Civil War history, scenic views, and access to the Appalachian Trail, the town draws a steady stream of visitors. But in recent years, it’s also drawn buyers—many from out of state—looking for a picturesque small-town lifestyle with a front-row seat to nature and history.
While its geography limits how much new housing can be built, that very scarcity adds to its value. Demand has remained strong, even with occasional slowdowns. Harpers Ferry’s charm, accessibility via MARC train, and natural setting ensure it remains one of the most desirable (and pricey) places to buy in West Virginia.
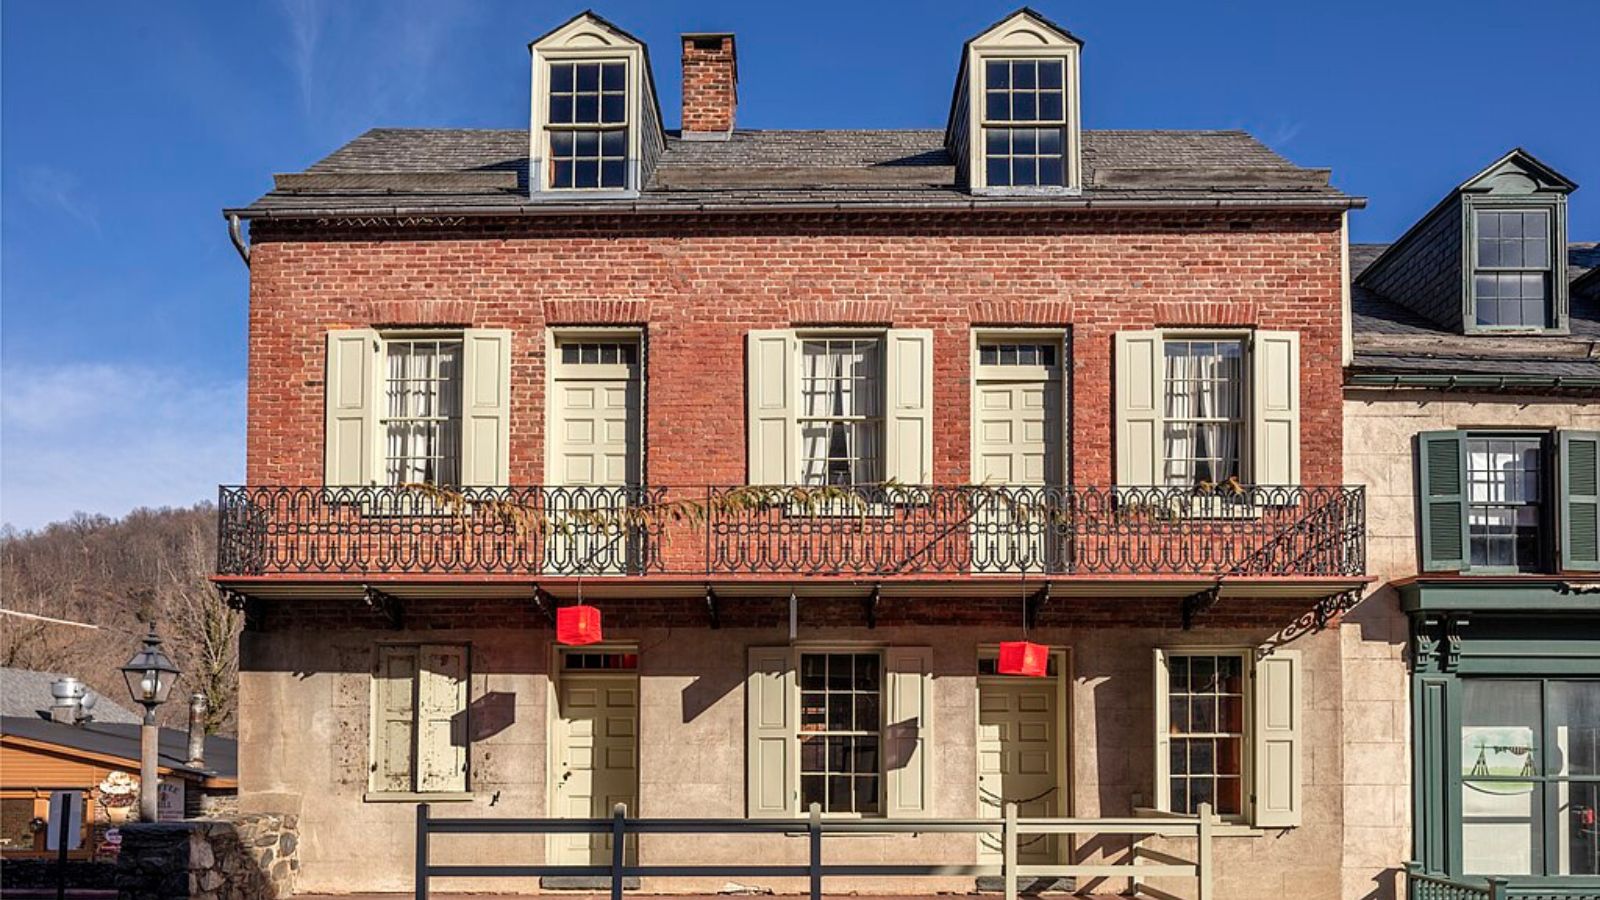
4. Charles Town – 93% Home Price Increase Since 2010
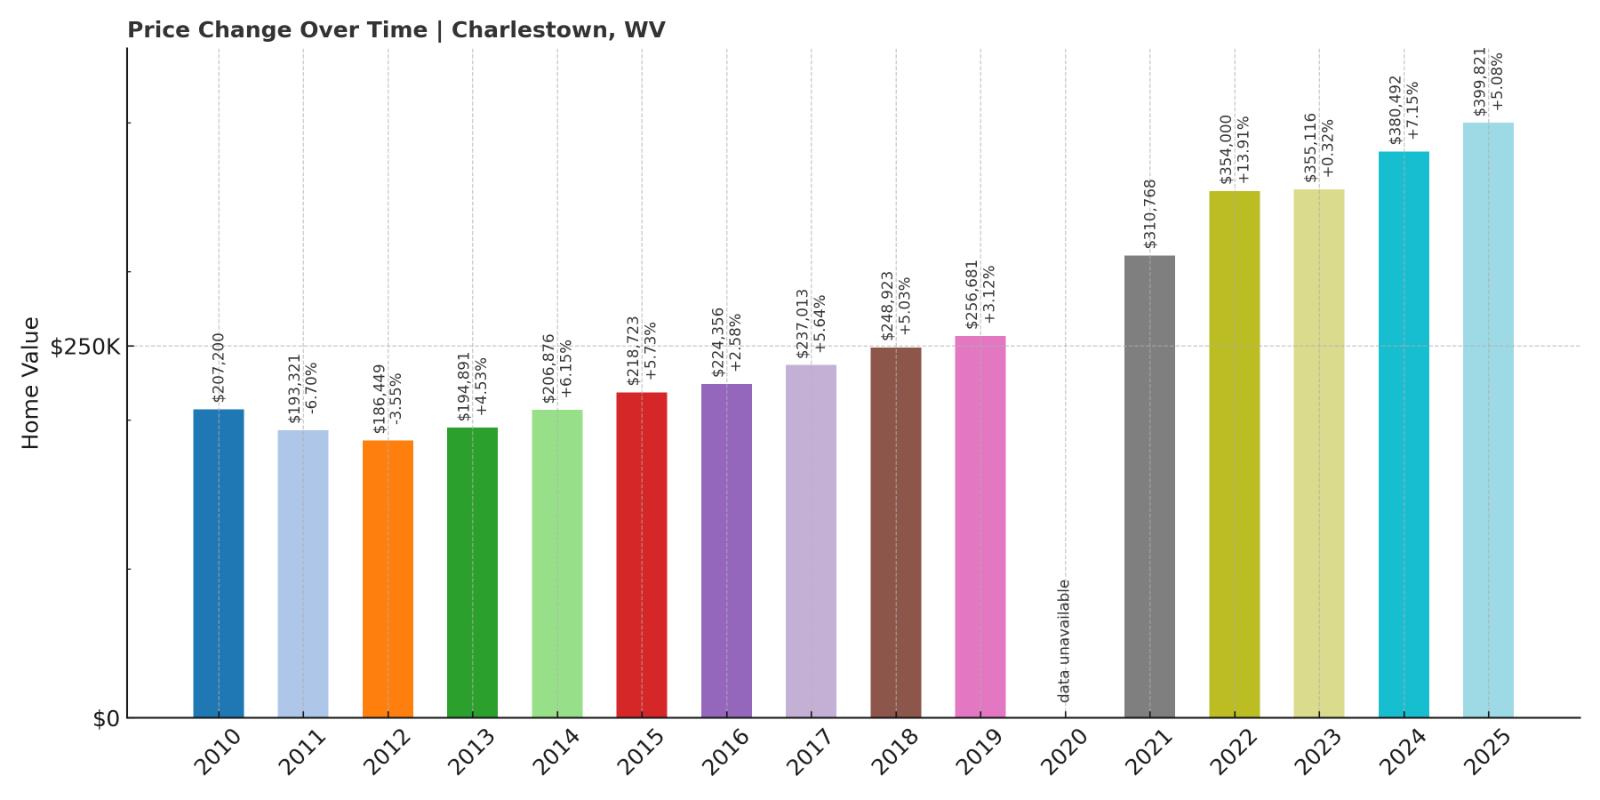
- 2010: $207,200 (-$8,621, -3.99% from previous year)
- 2011: $193,321 (-$13,879, -6.70% from previous year)
- 2012: $186,449 (-$6,872, -3.55% from previous year)
- 2013: $194,891 (+$8,442, +4.53% from previous year)
- 2014: $206,876 (+$11,985, +6.15% from previous year)
- 2015: $218,723 (+$11,846, +5.73% from previous year)
- 2016: $224,356 (+$5,633, +2.58% from previous year)
- 2017: $237,013 (+$12,657, +5.64% from previous year)
- 2018: $248,923 (+$11,910, +5.03% from previous year)
- 2019: $256,681 (+$7,757, +3.12% from previous year)
- 2020: N/A
- 2021: $310,768
- 2022: $354,000 (+$43,232, +13.91% from previous year)
- 2023: $355,116 (+$1,116, +0.32% from previous year)
- 2024: $380,492 (+$25,376, +7.15% from previous year)
- 2025: $399,821 (+$19,328, +5.08% from previous year)
Charles Town home values grew 93% from $207,200 in 2010 to $399,821 in 2025. The early 2010s were slow, but gains began compounding steadily after 2015. Price growth accelerated dramatically post-2020, with especially large jumps in 2022 and 2024.
Charles Town – Suburban Amenities and Steady Demand
Charles Town is one of the larger towns in Jefferson County and has evolved into a fully formed suburban hub. With schools, shopping, and healthcare options all nearby, it offers more convenience than smaller surrounding communities. That balance between lifestyle and affordability has made it one of the most consistently popular housing markets in the region.
Its location along U.S. Route 340 makes it a commuting choice for D.C.-area workers, while still retaining a local identity and walkable downtown. As demand for housing in the Eastern Panhandle has grown, Charles Town’s prices have followed suit—reaching all-time highs in 2025 and still trending upward.
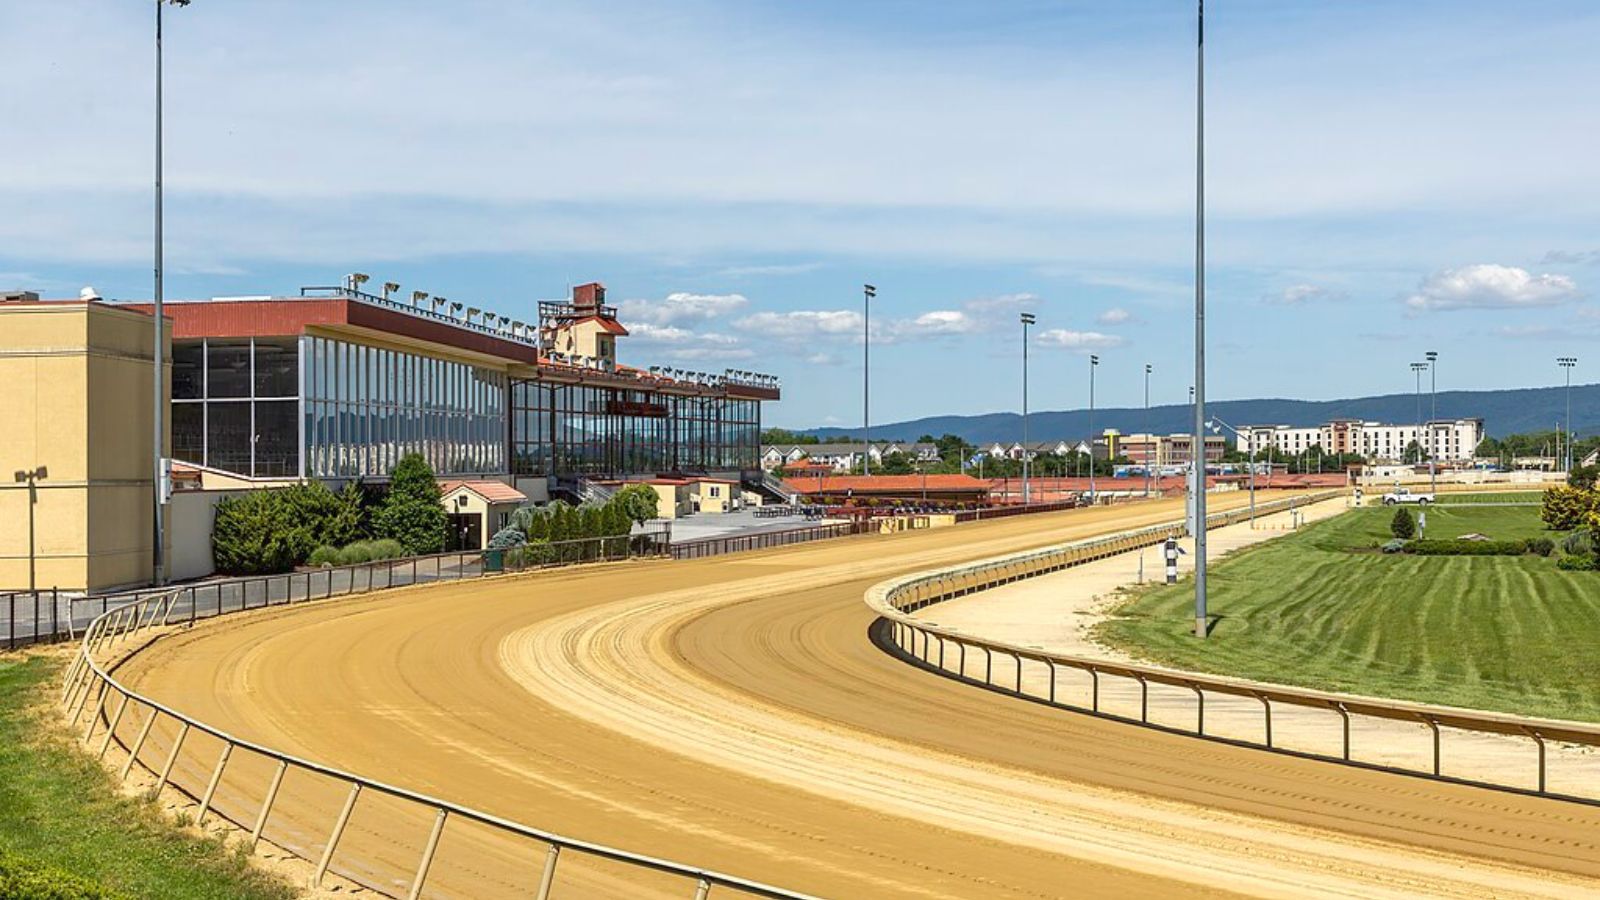
3. Shenandoah Junction – 111% Home Price Increase Since 2010
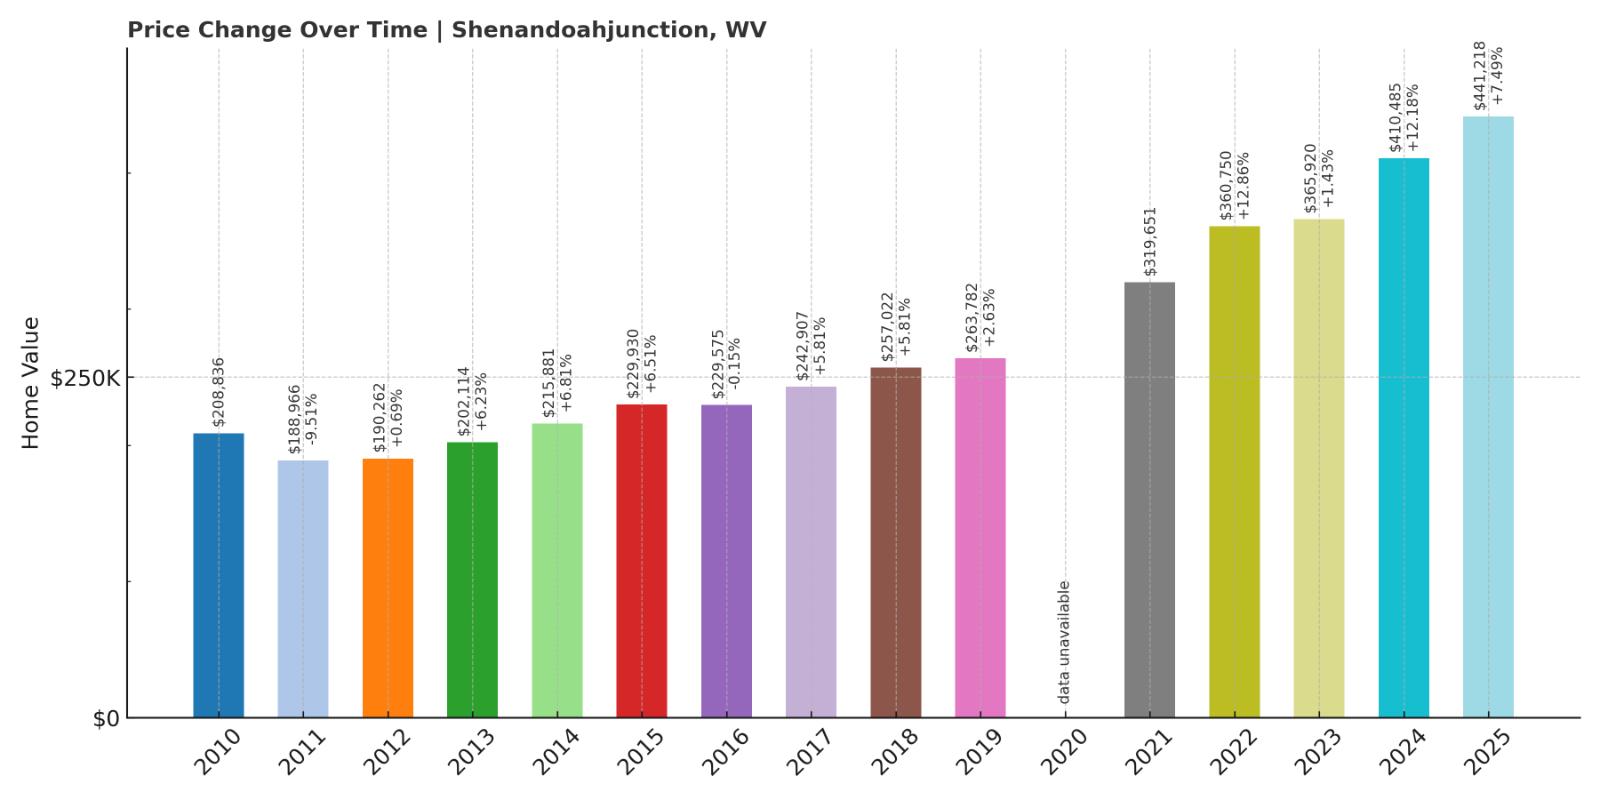
- 2010: $208,836 (-$11,459, -5.20% from previous year)
- 2011: $188,966 (-$19,870, -9.51% from previous year)
- 2012: $190,262 (+$1,296, +0.69% from previous year)
- 2013: $202,114 (+$11,852, +6.23% from previous year)
- 2014: $215,881 (+$13,767, +6.81% from previous year)
- 2015: $229,930 (+$14,048, +6.51% from previous year)
- 2016: $229,575 (-$355, -0.15% from previous year)
- 2017: $242,907 (+$13,332, +5.81% from previous year)
- 2018: $257,022 (+$14,115, +5.81% from previous year)
- 2019: $263,782 (+$6,760, +2.63% from previous year)
- 2020: N/A
- 2021: $319,651
- 2022: $360,750 (+$41,099, +12.86% from previous year)
- 2023: $365,920 (+$5,170, +1.43% from previous year)
- 2024: $410,485 (+$44,565, +12.18% from previous year)
- 2025: $441,218 (+$30,733, +7.49% from previous year)
Home prices in Shenandoah Junction grew from $208,836 in 2010 to $441,218 in 2025—an increase of 111%. The 2010s saw steady gains, but the largest jumps came after 2020, particularly in 2022 and 2024 when home values rose by over 12% in each year. The growth trend has remained strong into 2025.
Shenandoah Junction – Big Gains in a Small Rail Town
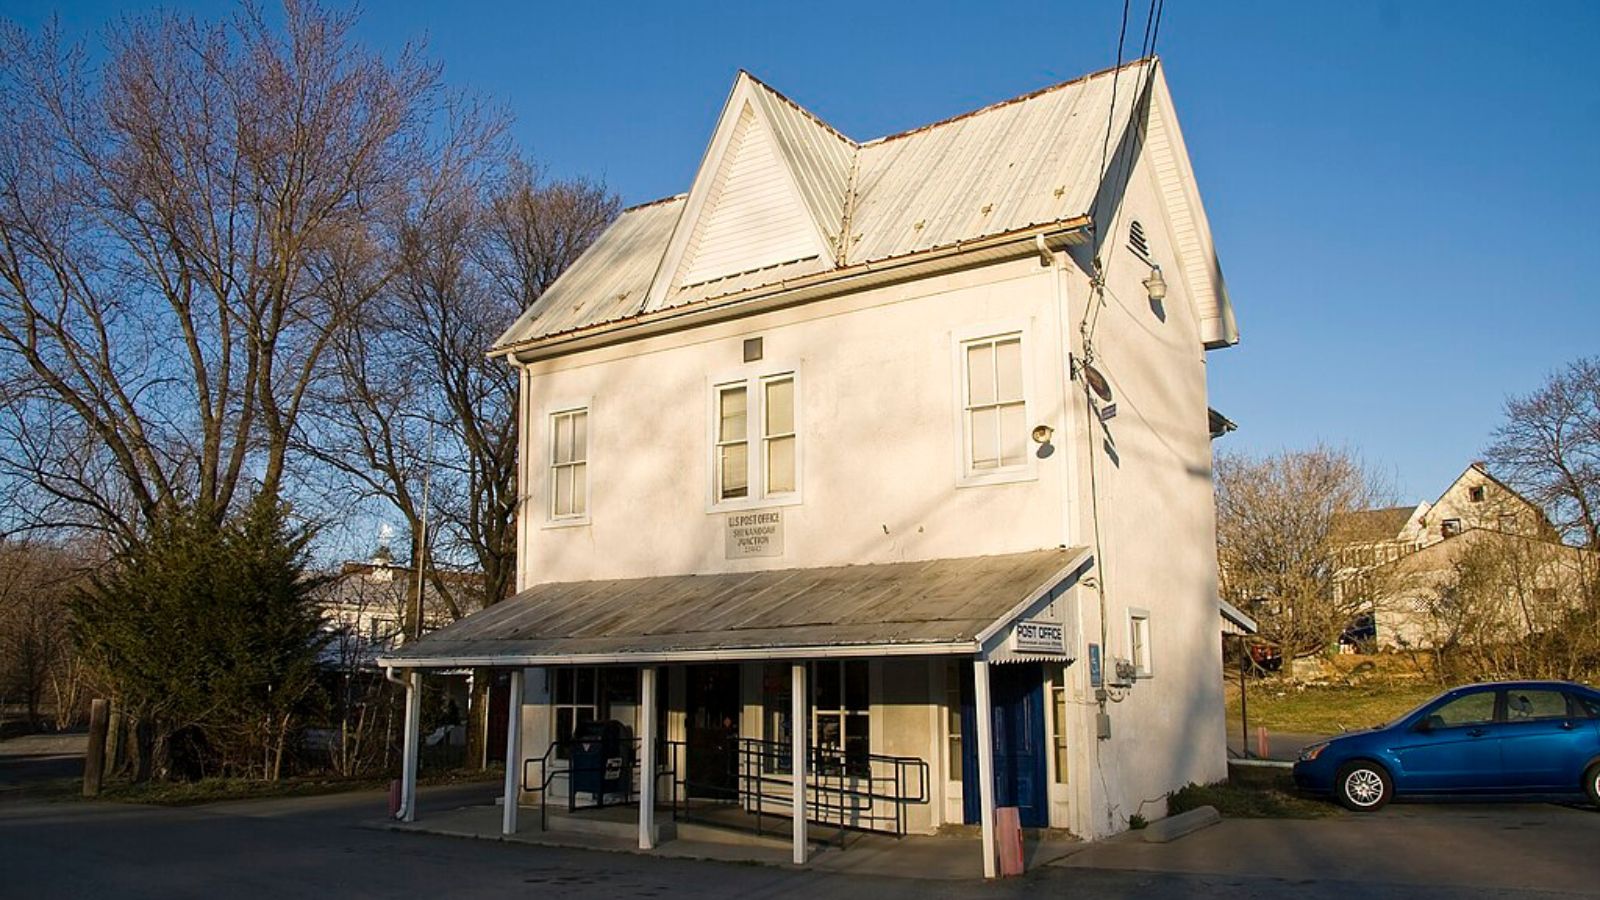
Shenandoah Junction, located in Jefferson County, is a small but strategically placed town known for its rail lines and agricultural roots. It sits just outside Charles Town and Shepherdstown, making it a convenient option for buyers looking for space and proximity to commuter routes. While the town itself is modest in size and amenities, its location has fueled its popularity as the broader Eastern Panhandle region has grown.
In recent years, Shenandoah Junction has experienced a sharp uptick in homebuyer interest. Inventory has remained limited, and the area has attracted attention from both commuters and remote workers alike. With scenic rural surroundings and quick access to Route 9 and MARC train service, this once-overlooked community is now one of the most expensive places to buy a home in West Virginia.
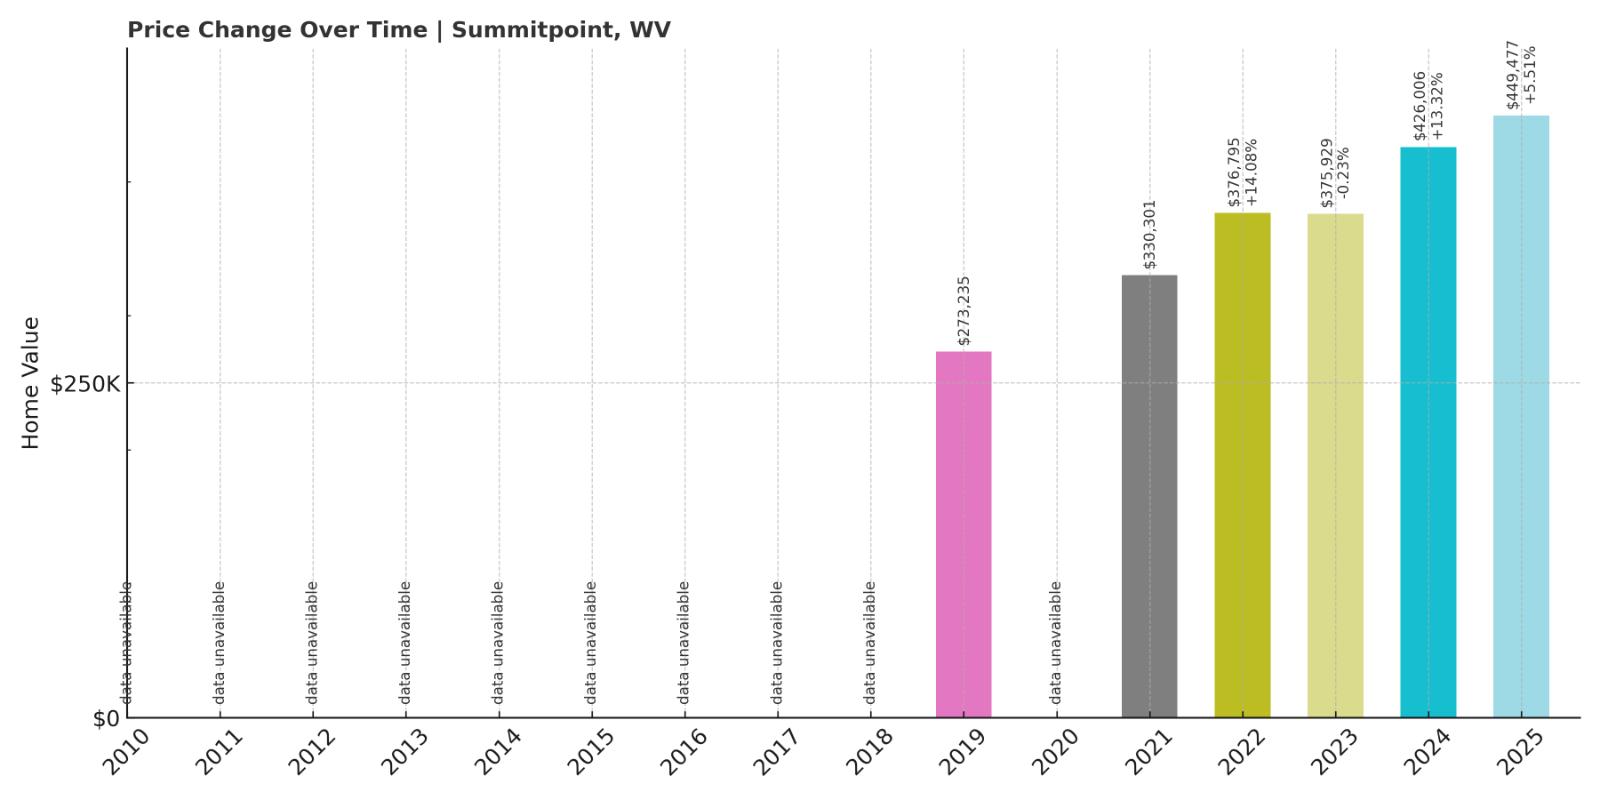
2. Summit Point – 65% Home Price Increase Since 2019
- 2010: N/A
- 2011: N/A
- 2012: N/A
- 2013: N/A
- 2014: N/A
- 2015: N/A
- 2016: N/A
- 2017: N/A
- 2018: N/A
- 2019: $273,235
- 2020: N/A
- 2021: $330,301
- 2022: $376,795 (+$46,494, +14.08% from previous year)
- 2023: $375,929 (-$866, -0.23% from previous year)
- 2024: $426,006 (+$50,077, +13.32% from previous year)
- 2025: $449,477 (+$23,471, +5.51% from previous year)
Summit Point home values increased from $273,235 in 2019 to $449,477 in 2025—a 65% jump in just six years. After a 14% rise in 2022, prices surged again by over 13% in 2024. Despite a slight dip in 2023, the market bounced back strongly.
Summit Point – Rural Appeal with Skyrocketing Prices
Summit Point is a small, unincorporated community in Jefferson County with a rural feel and scenic surroundings. While it lacks the retail infrastructure of nearby towns, its charm lies in its open spaces, farmland, and peaceful setting. The Summit Point Motorsports Park also adds a unique character to the area and draws regional attention.
As buyers expand their searches into more remote areas, Summit Point has emerged as a desirable option for those wanting privacy without sacrificing location. It’s a short drive to Charles Town, and it remains within reach of commuter routes. Limited inventory and increased demand for rural living have helped send prices soaring, firmly placing Summit Point near the top of West Virginia’s priciest markets.
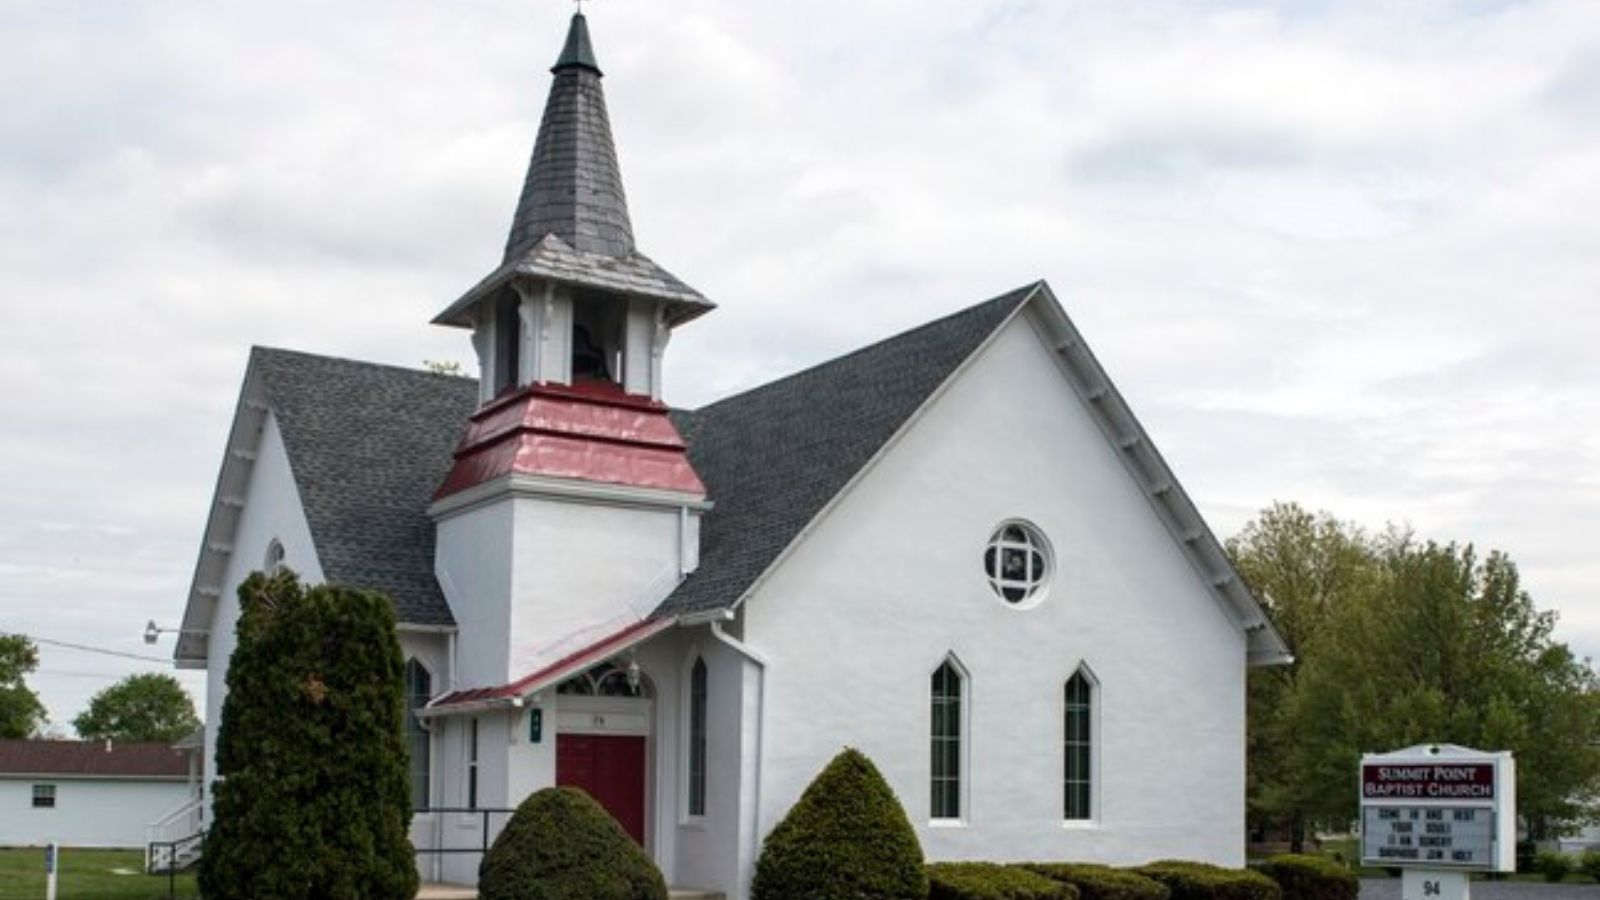
1. Shepherdstown – 85% Home Price Increase Since 2010
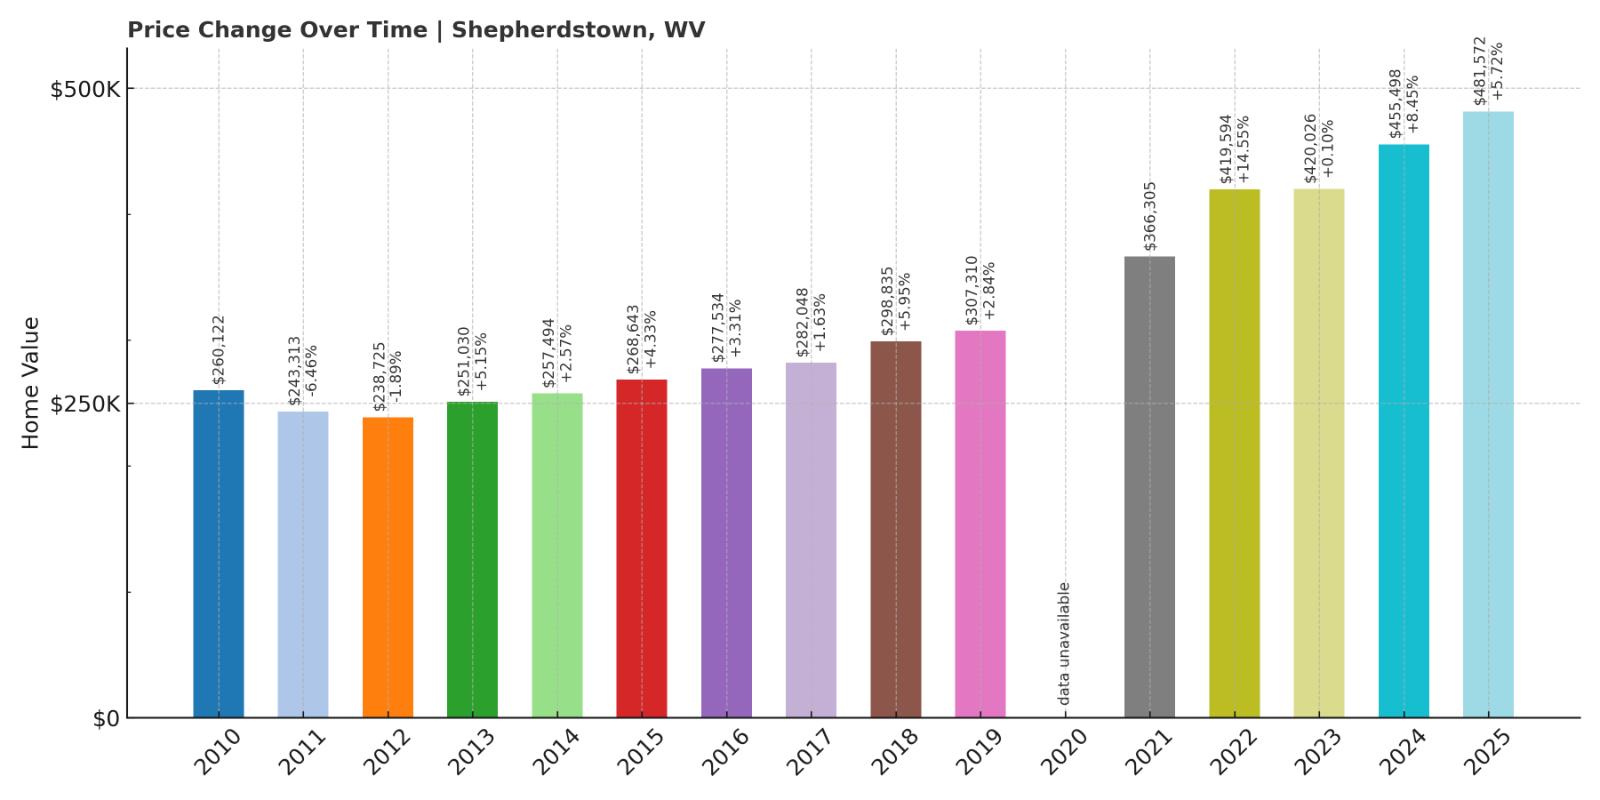
- 2010: $260,122 (-$11,028, -4.07% from previous year)
- 2011: $243,313 (-$16,809, -6.46% from previous year)
- 2012: $238,725 (-$4,588, -1.89% from previous year)
- 2013: $251,030 (+$12,305, +5.15% from previous year)
- 2014: $257,494 (+$6,464, +2.57% from previous year)
- 2015: $268,643 (+$11,150, +4.33% from previous year)
- 2016: $277,534 (+$8,890, +3.31% from previous year)
- 2017: $282,048 (+$4,514, +1.63% from previous year)
- 2018: $298,835 (+$16,787, +5.95% from previous year)
- 2019: $307,310 (+$8,475, +2.84% from previous year)
- 2020: N/A
- 2021: $366,305
- 2022: $419,594 (+$53,289, +14.55% from previous year)
- 2023: $420,026 (+$432, +0.10% from previous year)
- 2024: $455,498 (+$35,472, +8.45% from previous year)
- 2025: $481,572 (+$26,073, +5.72% from previous year)
Home prices in Shepherdstown increased 85% from $260,122 in 2010 to $481,572 in 2025. After a relatively quiet stretch in the early 2010s, appreciation picked up sharply in the post-2020 market. Notably, prices jumped over 14% in 2022 and nearly 9% more in 2024.
Shepherdstown – West Virginia’s Most Expensive Market
Shepherdstown is one of the most charming and historic towns in the state, home to Shepherd University and a thriving arts and culture scene. Located on the banks of the Potomac River, it offers a walkable downtown, well-preserved architecture, and quick access to Maryland and D.C. Its combination of culture, beauty, and location makes it consistently popular with retirees, professionals, and weekenders alike.
That strong demand—combined with limited supply—has steadily pushed prices higher over the years. As remote work has grown and buyers seek small towns with character and connection, Shepherdstown has checked every box. It now stands as the most expensive housing market in West Virginia.
Haven't Seen Yet
Curated from our most popular plans. Click any to explore.