🔥 Would you like to save this?
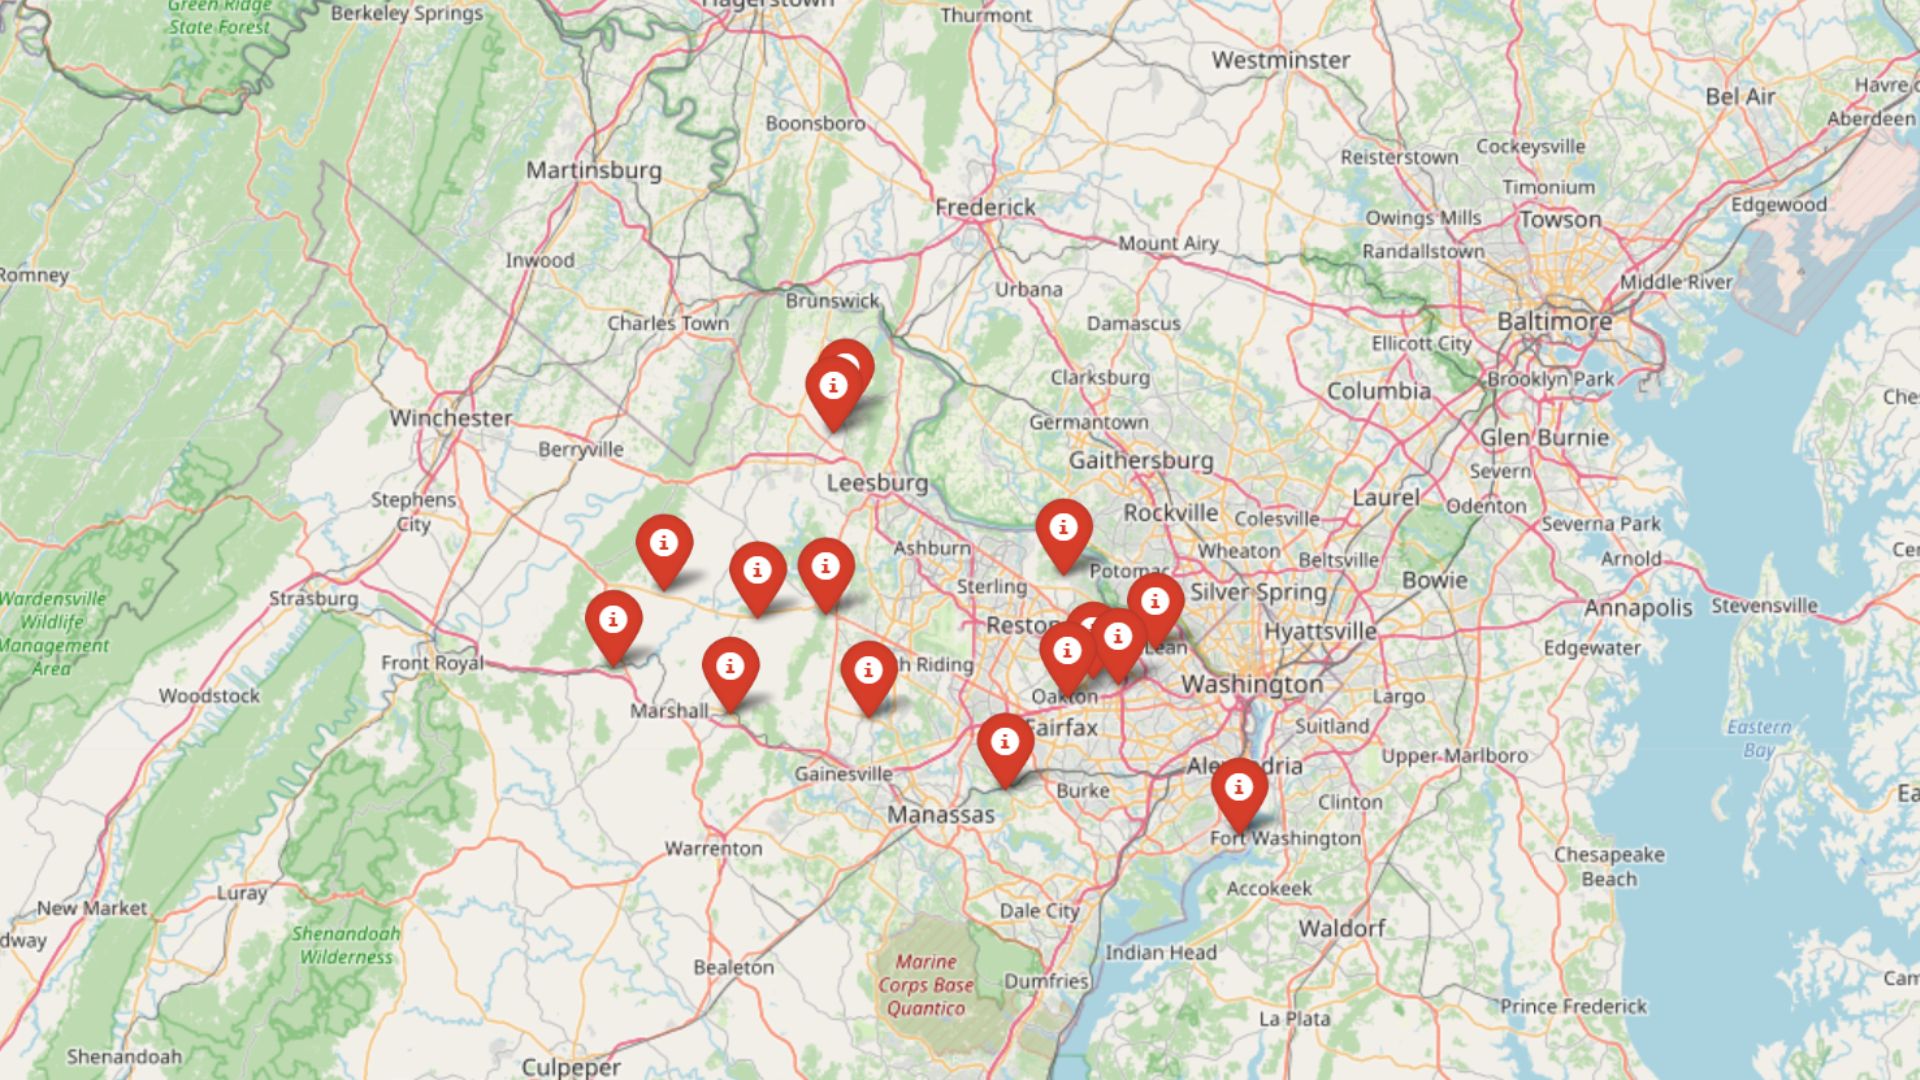
Zillow’s Home Value Index for 2025 reveals just how high home prices have climbed in parts of Virginia. These 15 towns top the list, each with a median home value that far exceeds the state average—and in some cases, has more than doubled since 2010. From upscale suburbs to historic enclaves, these communities reflect strong demand, limited supply, and a growing appetite for luxury or location. Whether you’re watching the market or wondering where Virginia’s wealth is concentrated, these towns tell the story.
15. Paeonian Springs – 14.63% Home Price Increase Since 2022
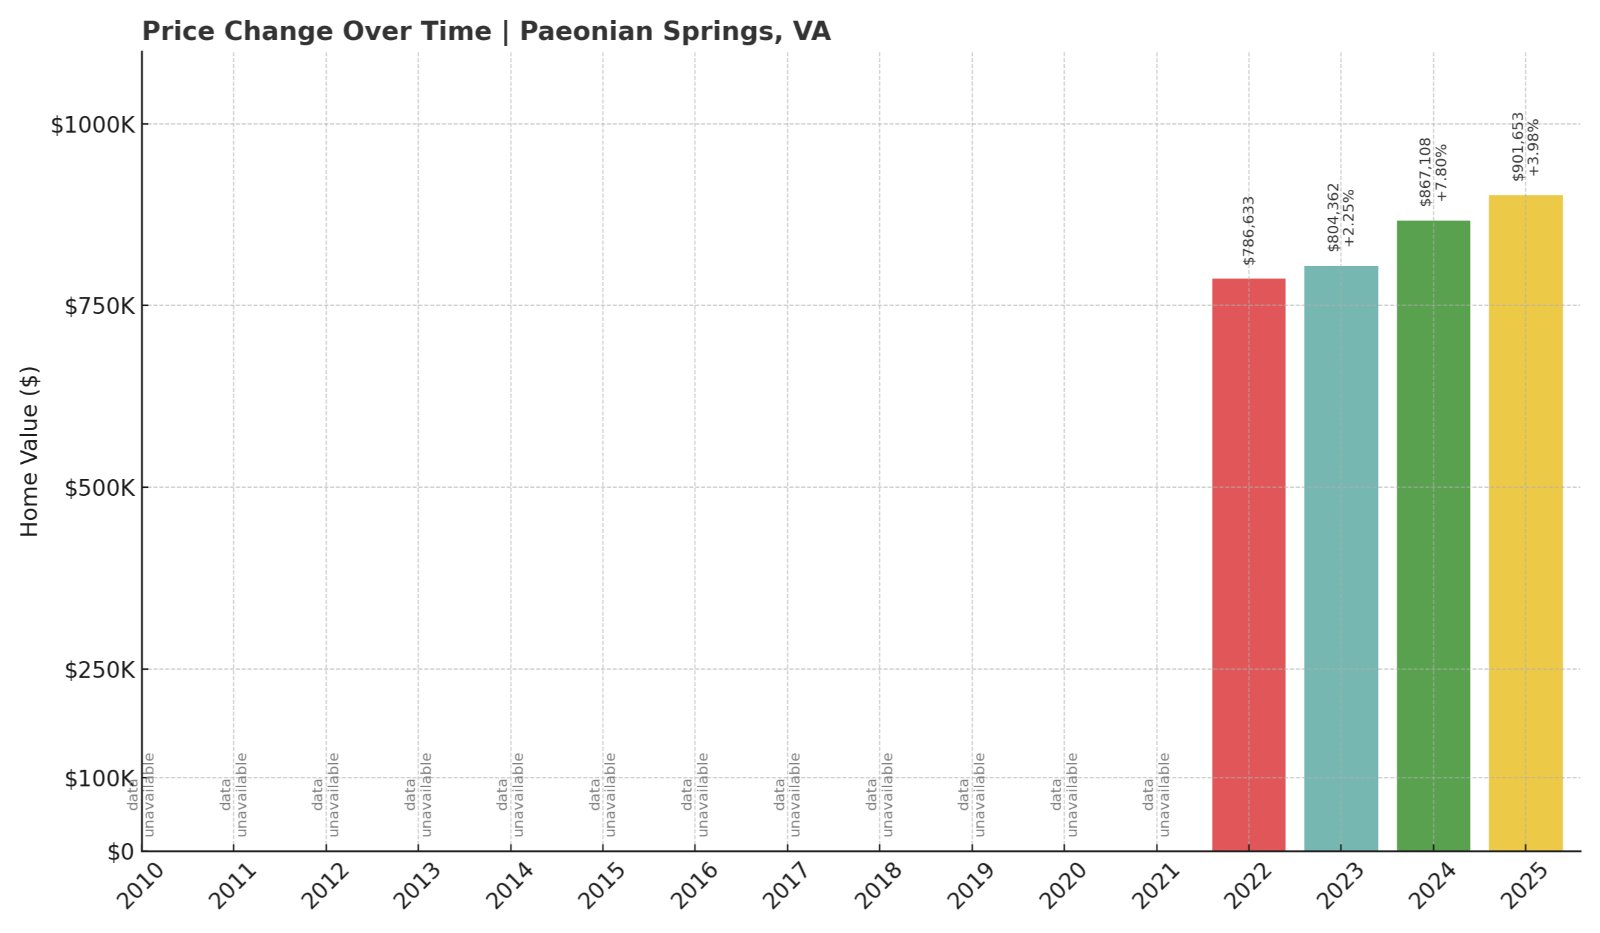
- 2022: $786,633
- 2023: $804,362 (+$17,729, +2.25% from previous year)
- 2024: $867,108 (+$62,745, +7.80% from previous year)
- 2025: $901,653 (+$34,545, +3.98% from previous year)
Paeonian Springs has seen home prices increase by nearly 15% since 2022, with steady year-over-year growth. Though data isn’t available for earlier years, the recent figures show a clear upward trajectory, with homes now pushing past the $900K mark. This trend suggests increasing demand in this small yet sought-after community.
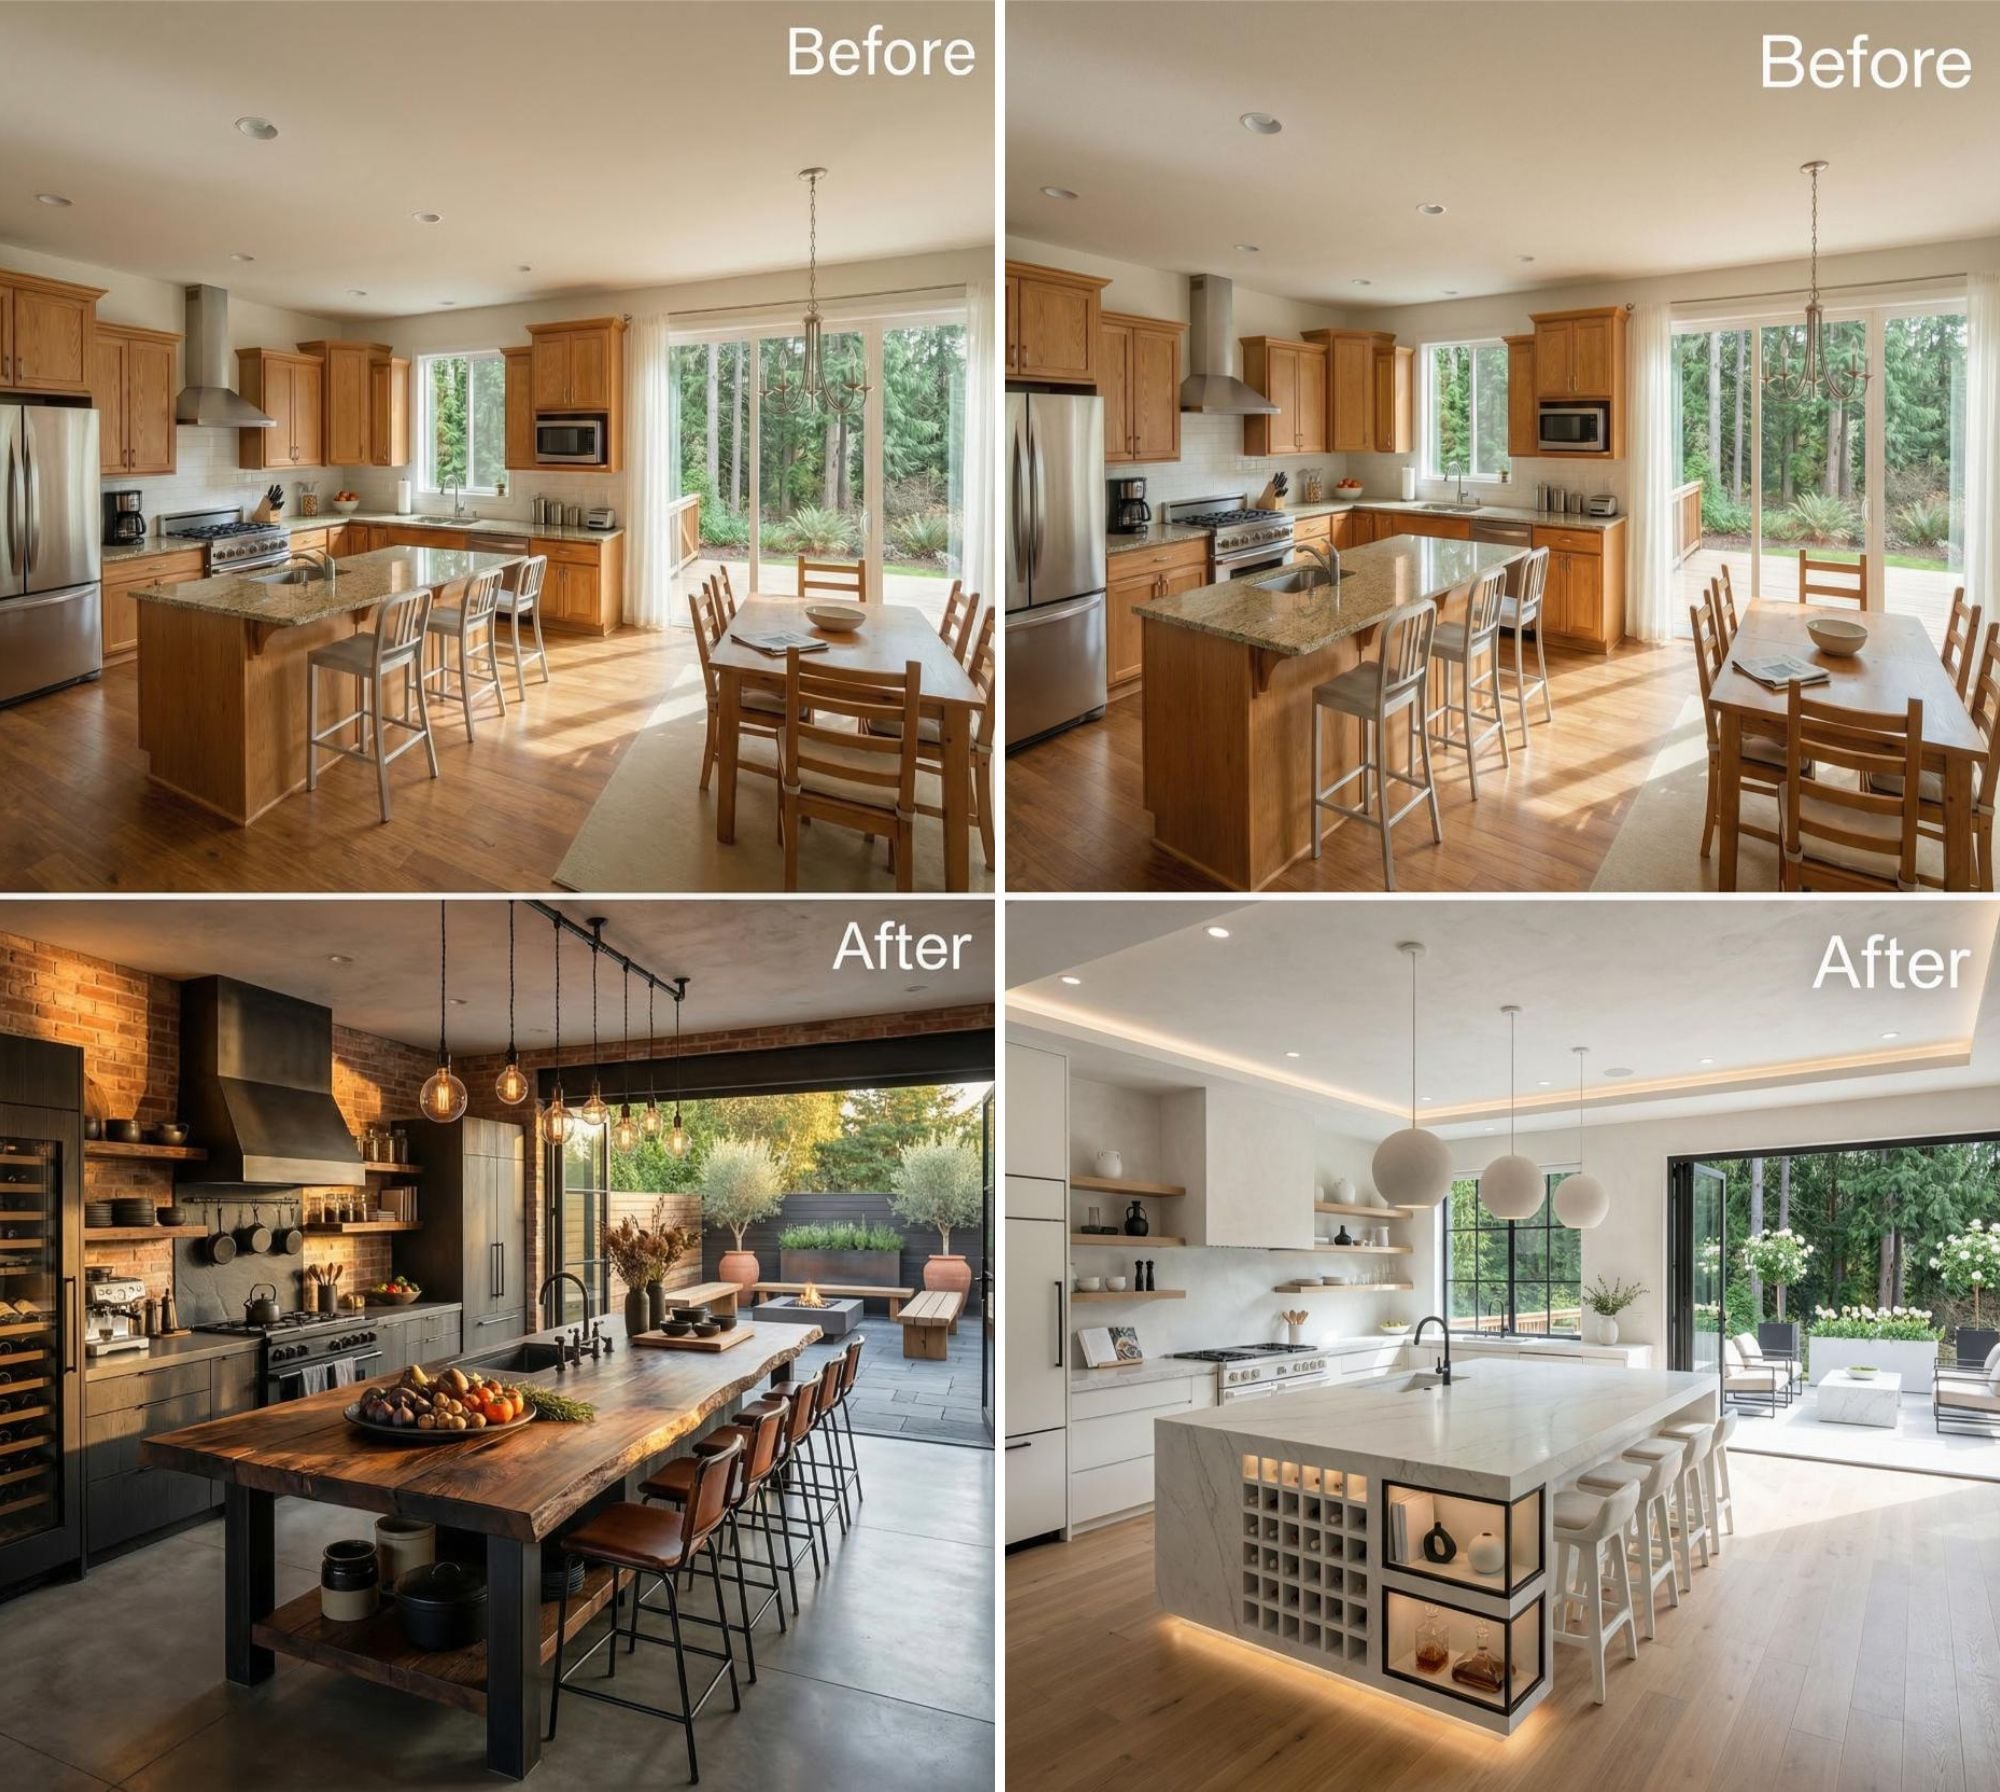
In order to come up with the very specific design ideas, we create most designs with the assistance of state-of-the-art AI interior design software.
Paeonian Springs – Tranquil Living With High Demand
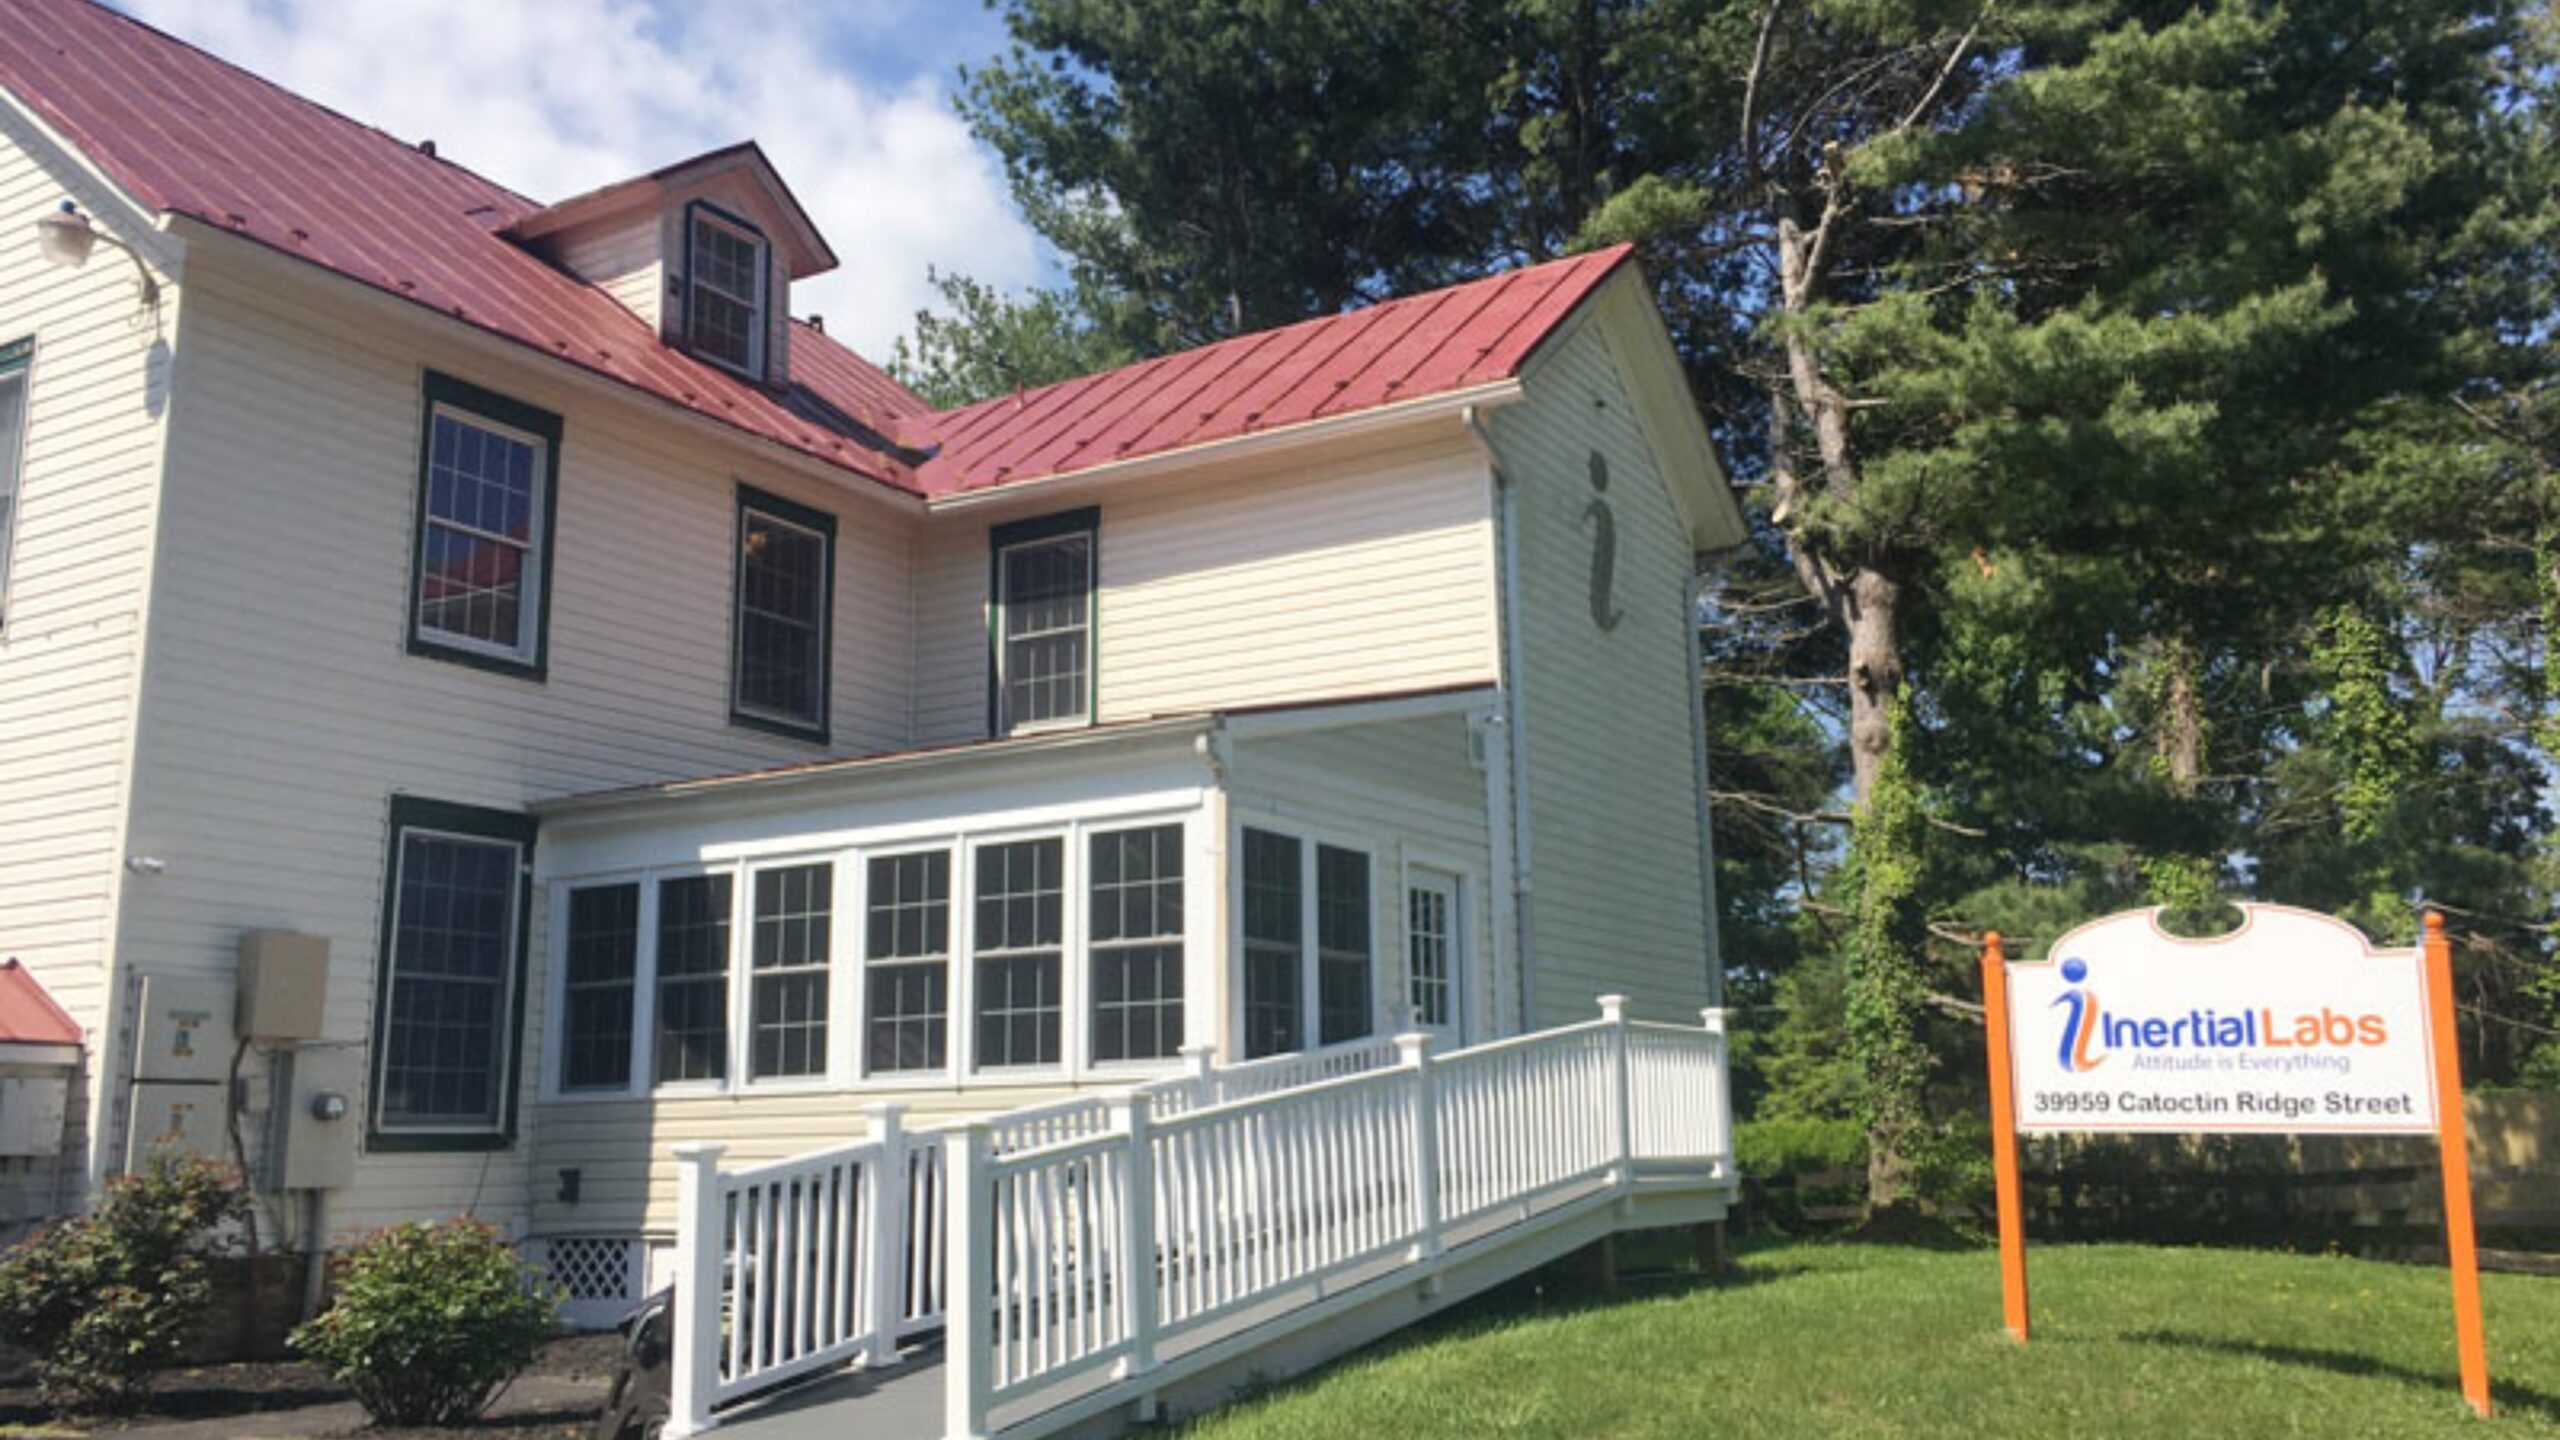
Located in Loudoun County, Paeonian Springs is a quiet hamlet known for its scenic charm and rural atmosphere. With easy access to Leesburg and Route 7, it’s a commuter-friendly spot for those working in Northern Virginia or D.C. The small-town vibe, historic homes, and large lots appeal to buyers looking for privacy and prestige.
The steady price increases in recent years may be tied to limited inventory and increased interest in countryside living, particularly post-2020. With a current home value over $900,000, Paeonian Springs remains a premium destination for those looking for serenity and exclusivity without venturing too far from urban centers.
14. Delaplane – 83.78% Home Price Increase Since 2010

- 2010: $494,789
- 2011: $539,472 (+$44,683, +9.03% from previous year)
- 2012: $536,082 (-$3,390, -0.63% from previous year)
- 2013: $572,184 (+$36,102, +6.73% from previous year)
- 2014: $612,350 (+$40,167, +7.02% from previous year)
- 2015: $612,597 (+$246, +0.04% from previous year)
- 2016: $612,869 (+$273, +0.04% from previous year)
- 2017: $630,943 (+$18,074, +2.95% from previous year)
- 2018: $639,670 (+$8,727, +1.38% from previous year)
- 2019: $656,158 (+$16,487, +2.58% from previous year)
- 2020: $653,246 (-$2,912, -0.44% from previous year)
- 2021: $778,941 (+$125,695, +19.24% from previous year)
- 2022: $880,430 (+$101,490, +13.03% from previous year)
- 2023: $848,171 (-$32,259, -3.66% from previous year)
- 2024: $883,847 (+$35,675, +4.21% from previous year)
- 2025: $909,471 (+$25,624, +2.90% from previous year)
Delaplane’s housing market has grown nearly 84% since 2010. Although the town saw some dips — notably in 2020 and 2023 — the general trend remains upward. Home values now hover just above $900,000, making it one of Virginia’s top-tier real estate markets.
Delaplane – Wine Country Appeal Drives Price Surge
Delaplane sits at the edge of Virginia’s wine and horse country in Fauquier County. Known for its vineyards, rolling hills, and equestrian estates, the area attracts buyers looking for scenic luxury just 50 miles from D.C. The town is also home to Sky Meadows State Park, a popular hiking destination.
Price surges in 2021 and 2022 reflect growing interest in rural high-end living. With its preserved landscapes and low density, Delaplane appeals to those seeking space, charm, and proximity to amenities without the bustle of suburban sprawl. The 2025 average of $909K cements its place as one of the most elite areas in the region.
13. The Plains – 104.15% Home Price Increase Since 2010
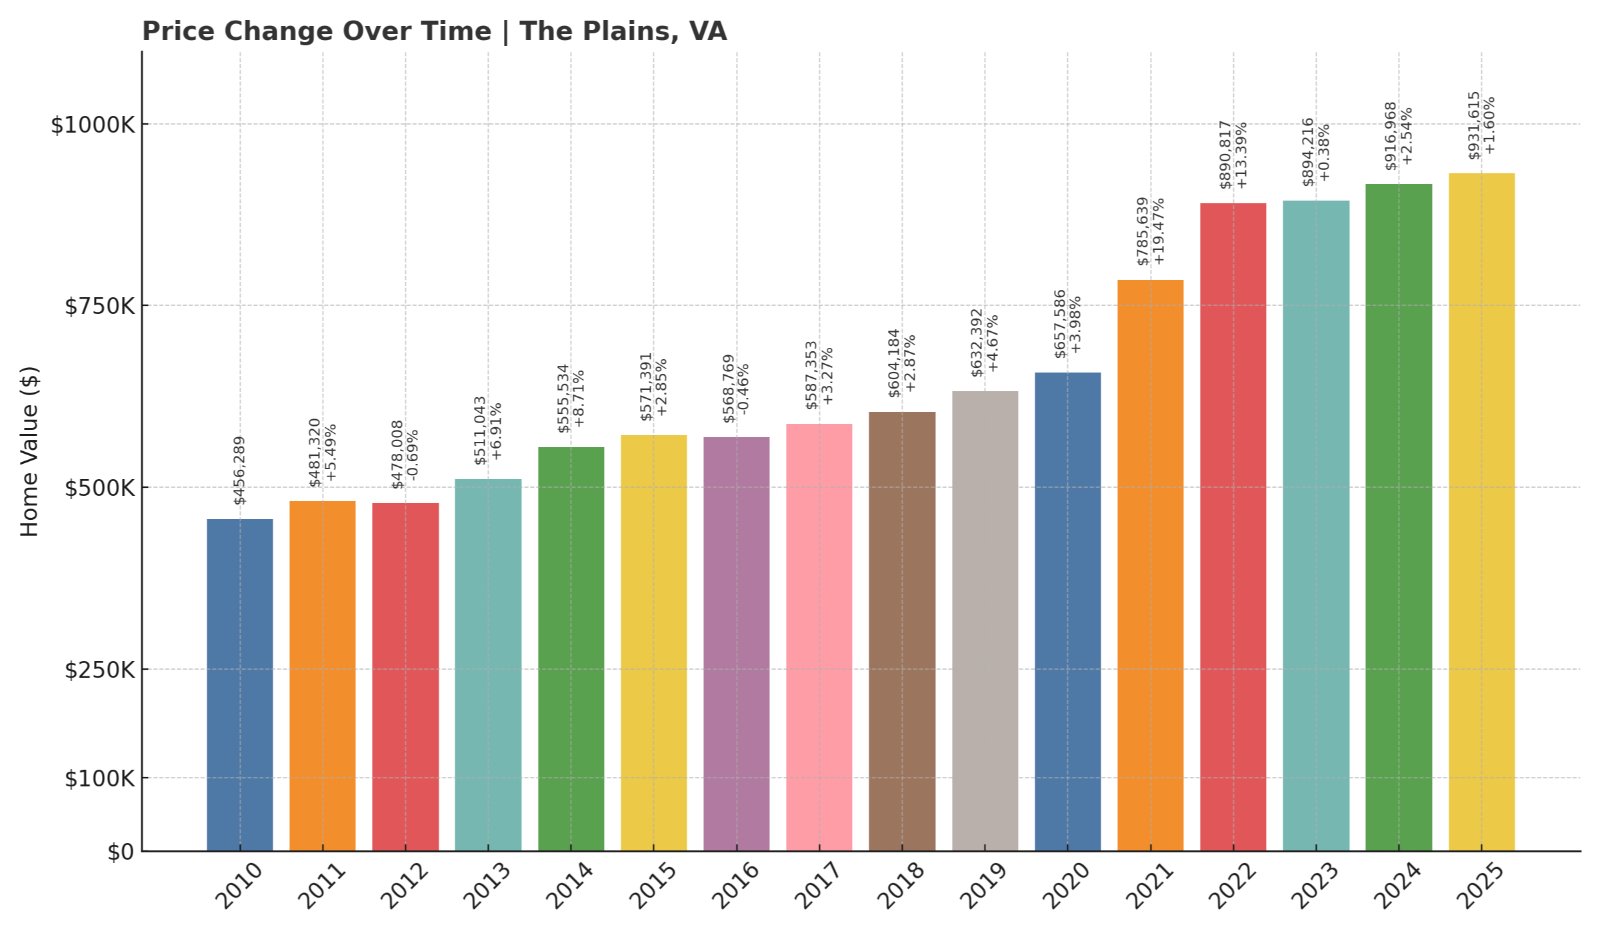
- 2010: $456,289
- 2011: $481,320 (+$25,031, +5.49% from previous year)
- 2012: $478,008 (-$3,312, -0.69% from previous year)
- 2013: $511,043 (+$33,034, +6.91% from previous year)
- 2014: $555,534 (+$44,491, +8.71% from previous year)
- 2015: $571,391 (+$15,857, +2.85% from previous year)
- 2016: $568,769 (-$2,622, -0.46% from previous year)
- 2017: $587,353 (+$18,584, +3.27% from previous year)
- 2018: $604,184 (+$16,831, +2.87% from previous year)
- 2019: $632,392 (+$28,209, +4.67% from previous year)
- 2020: $657,586 (+$25,193, +3.98% from previous year)
- 2021: $785,639 (+$128,053, +19.47% from previous year)
- 2022: $890,817 (+$105,177, +13.39% from previous year)
- 2023: $894,216 (+$3,399, +0.38% from previous year)
- 2024: $916,968 (+$22,752, +2.54% from previous year)
- 2025: $931,615 (+$14,647, +1.60% from previous year)
The Plains has more than doubled in home value since 2010. Though growth has slowed recently, prices continue to tick upward. In 2025, homes average over $930,000, with significant appreciation during the 2020–2022 period especially.
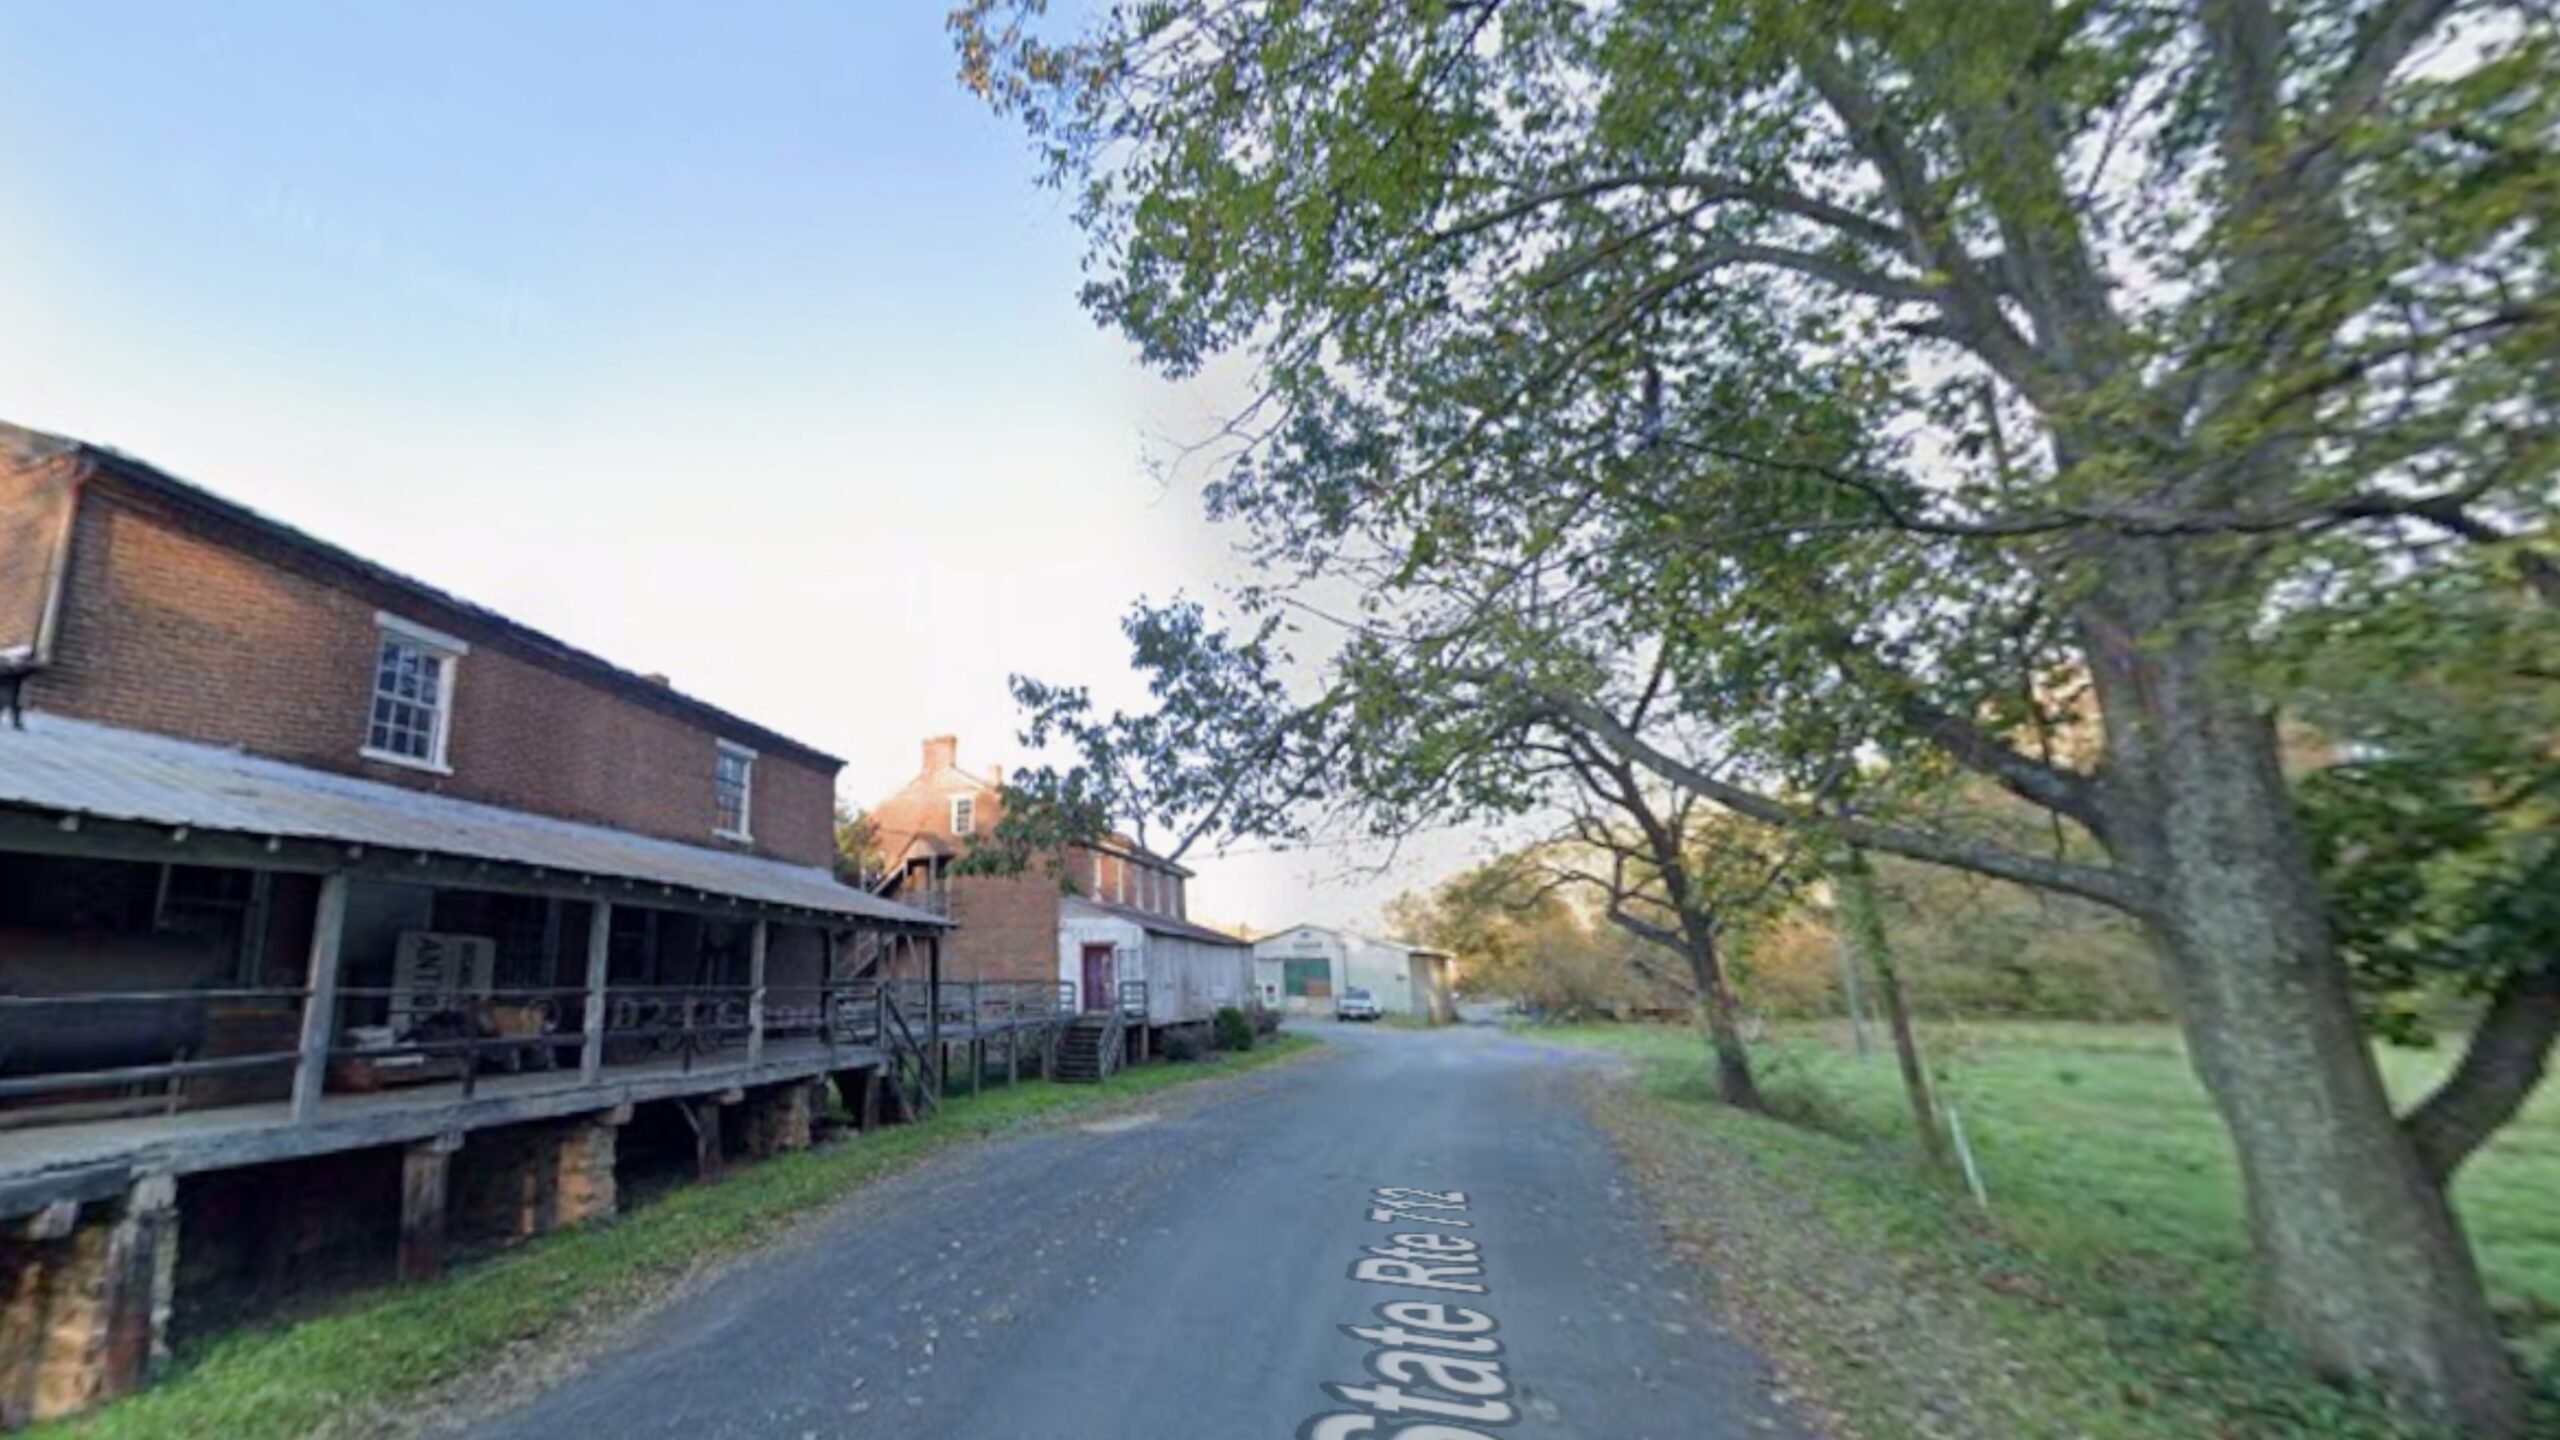
The Plains – Equestrian Living With Historic Charm
A small village in Fauquier County, The Plains is surrounded by horse farms and expansive estates. It’s a popular retreat for affluent buyers from the D.C. area, thanks to its idyllic setting, historic architecture, and access to both Route 66 and I-81.
The dramatic gains in the early 2020s likely reflect both increased interest in spacious rural homes and the town’s growing reputation for refined country living. With a vibrant community that hosts equestrian events and local art fairs, The Plains offers exclusivity and tranquility — and that keeps prices climbing.
12. Fort Hunt – 61.78% Home Price Increase Since 2010
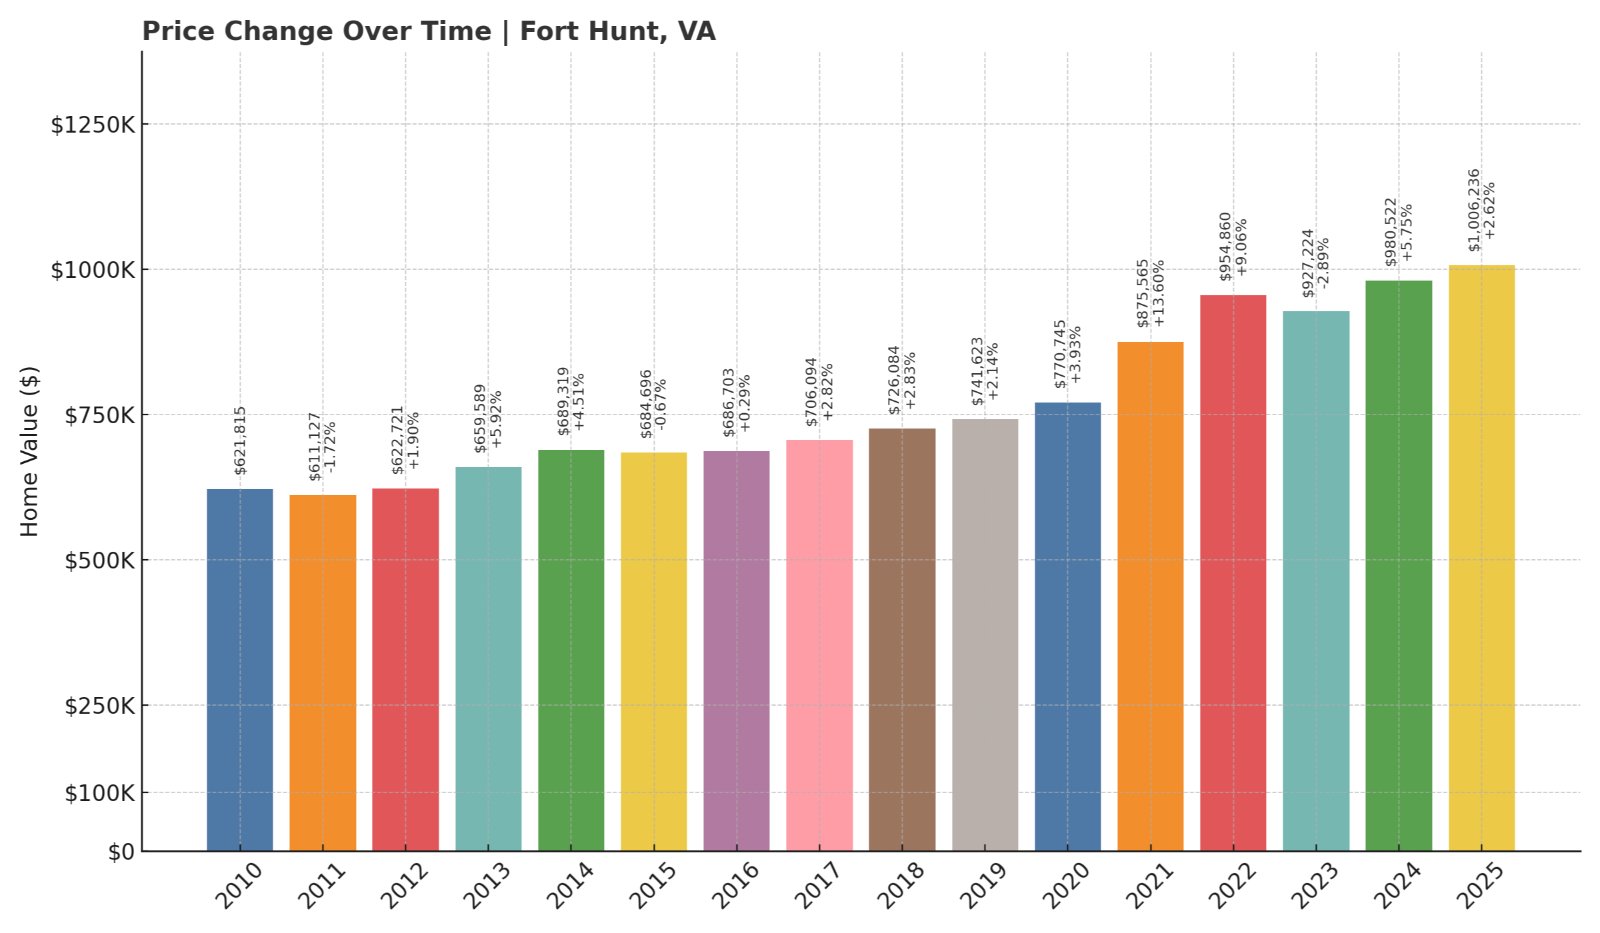
- 2010: $621,815
- 2011: $611,127 (-$10,688, -1.72% from previous year)
- 2012: $622,721 (+$11,594, +1.90% from previous year)
- 2013: $659,589 (+$36,868, +5.92% from previous year)
- 2014: $689,319 (+$29,730, +4.51% from previous year)
- 2015: $684,696 (-$4,622, -0.67% from previous year)
- 2016: $686,703 (+$2,006, +0.29% from previous year)
- 2017: $706,094 (+$19,391, +2.82% from previous year)
- 2018: $726,084 (+$19,990, +2.83% from previous year)
- 2019: $741,623 (+$15,539, +2.14% from previous year)
- 2020: $770,745 (+$29,122, +3.93% from previous year)
- 2021: $875,565 (+$104,820, +13.60% from previous year)
- 2022: $954,860 (+$79,295, +9.06% from previous year)
- 2023: $927,224 (-$27,635, -2.89% from previous year)
- 2024: $980,522 (+$53,298, +5.75% from previous year)
- 2025: $1,006,236 (+$25,714, +2.62% from previous year)
Fort Hunt has seen a consistent climb in home values, growing over 60% since 2010. While there were some brief declines, the general trend is clearly positive. Homes now average just over $1 million in 2025, marking it as one of the most upscale areas in Fairfax County.
Fort Hunt – Historic Neighborhood With Prime Location
Nestled along the Potomac River just south of Alexandria, Fort Hunt is a peaceful suburban community with rich ties to American history. The area boasts tree-lined streets, excellent schools, and quick access to George Washington Parkway.
Fort Hunt’s strong growth may be tied to its unbeatable location — just minutes from D.C. but with a suburban feel. The housing stock includes everything from mid-century homes to elegant rebuilds. With limited space and steady demand, prices in Fort Hunt are likely to stay high.
11. Clifton – 73.07% Home Price Increase Since 2010
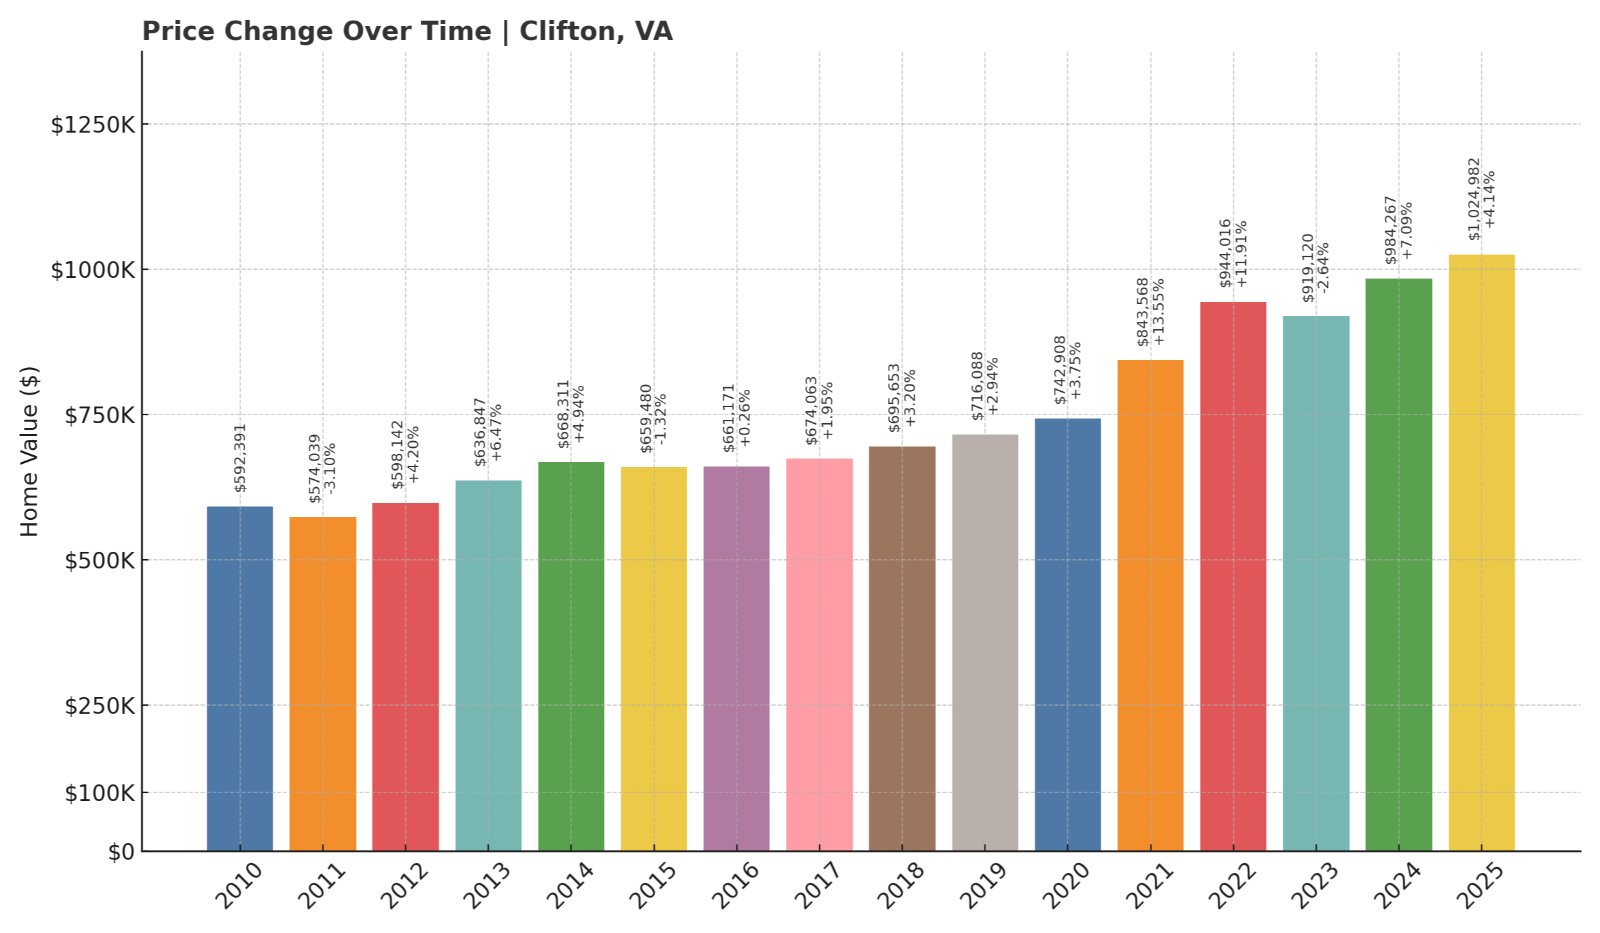
- 2010: $592,391
- 2011: $574,039 (-$18,351, -3.10% from previous year)
- 2012: $598,142 (+$24,103, +4.20% from previous year)
- 2013: $636,847 (+$38,705, +6.47% from previous year)
- 2014: $668,311 (+$31,464, +4.94% from previous year)
- 2015: $659,480 (-$8,831, -1.32% from previous year)
- 2016: $661,171 (+$1,691, +0.26% from previous year)
- 2017: $674,063 (+$12,892, +1.95% from previous year)
- 2018: $695,653 (+$21,589, +3.20% from previous year)
- 2019: $716,088 (+$20,435, +2.94% from previous year)
- 2020: $742,908 (+$26,820, +3.75% from previous year)
- 2021: $843,568 (+$100,660, +13.55% from previous year)
- 2022: $944,016 (+$100,449, +11.91% from previous year)
- 2023: $919,120 (-$24,897, -2.64% from previous year)
- 2024: $984,267 (+$65,148, +7.09% from previous year)
- 2025: $1,024,982 (+$40,715, +4.14% from previous year)
Clifton’s home values have jumped over 73% since 2010, reaching more than $1 million in 2025. Price dips have been minor and temporary, with several strong years, particularly between 2020 and 2022. The town’s charm and limited inventory may be major factors.
Clifton – Small Town Feel With Big-Time Price Tags
Tucked in the woods of Fairfax County, Clifton maintains a preserved, almost storybook charm. The historic downtown features quaint shops, cafes, and a close-knit community spirit. Despite being just 25 miles from D.C., it feels a world apart.
Strong price growth in Clifton reflects its blend of exclusivity and small-town appeal. Development is strictly limited, which keeps housing supply low. As a result, prices remain high and steadily rise — particularly appealing to buyers looking for peace and prestige.
10. Catharpin – 92.84% Home Price Increase Since 2010
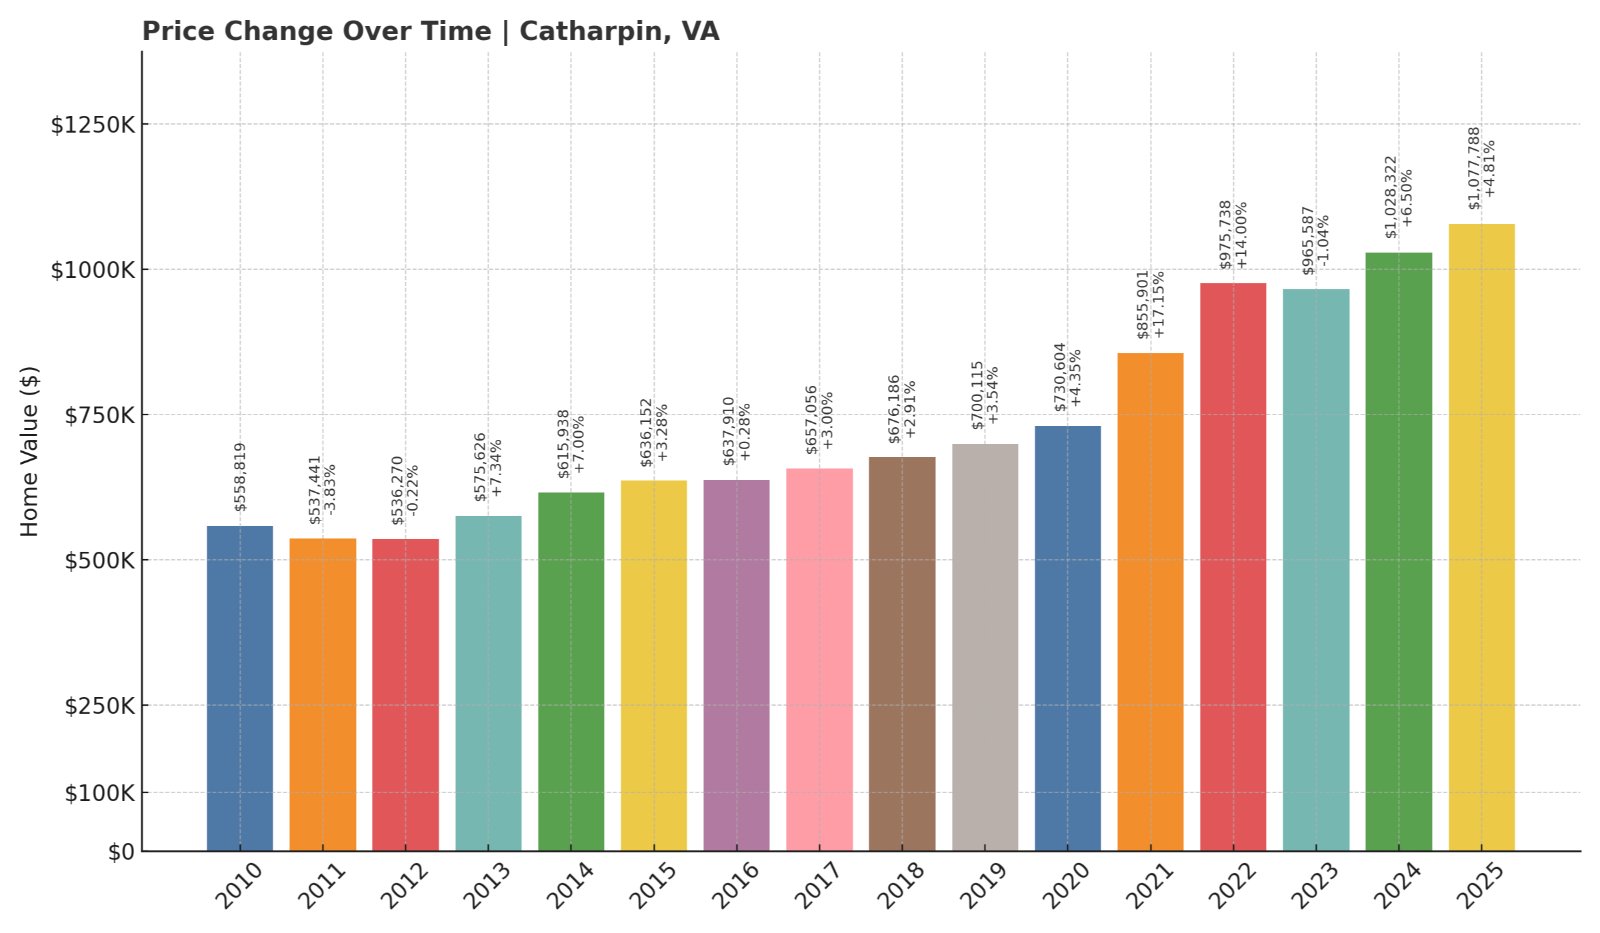
- 2010: $558,819
- 2011: $537,441 (-$21,378, -3.83% from previous year)
- 2012: $536,270 (-$1,171, -0.22% from previous year)
- 2013: $575,626 (+$39,356, +7.34% from previous year)
- 2014: $615,938 (+$40,312, +7.00% from previous year)
- 2015: $636,152 (+$20,214, +3.28% from previous year)
- 2016: $637,910 (+$1,758, +0.28% from previous year)
- 2017: $657,056 (+$19,146, +3.00% from previous year)
- 2018: $676,186 (+$19,130, +2.91% from previous year)
- 2019: $700,115 (+$23,928, +3.54% from previous year)
- 2020: $730,604 (+$30,489, +4.35% from previous year)
- 2021: $855,901 (+$125,298, +17.15% from previous year)
- 2022: $975,738 (+$119,837, +14.00% from previous year)
- 2023: $965,587 (-$10,151, -1.04% from previous year)
- 2024: $1,028,322 (+$62,735, +6.50% from previous year)
- 2025: $1,077,788 (+$49,466, +4.81% from previous year)
Catharpin’s home prices have surged nearly 93% since 2010, with notable spikes in 2021 and 2022. Even after a small drop in 2023, the market rebounded strongly. As of 2025, homes in Catharpin average more than $1.07 million, making it one of the state’s most elite rural markets.
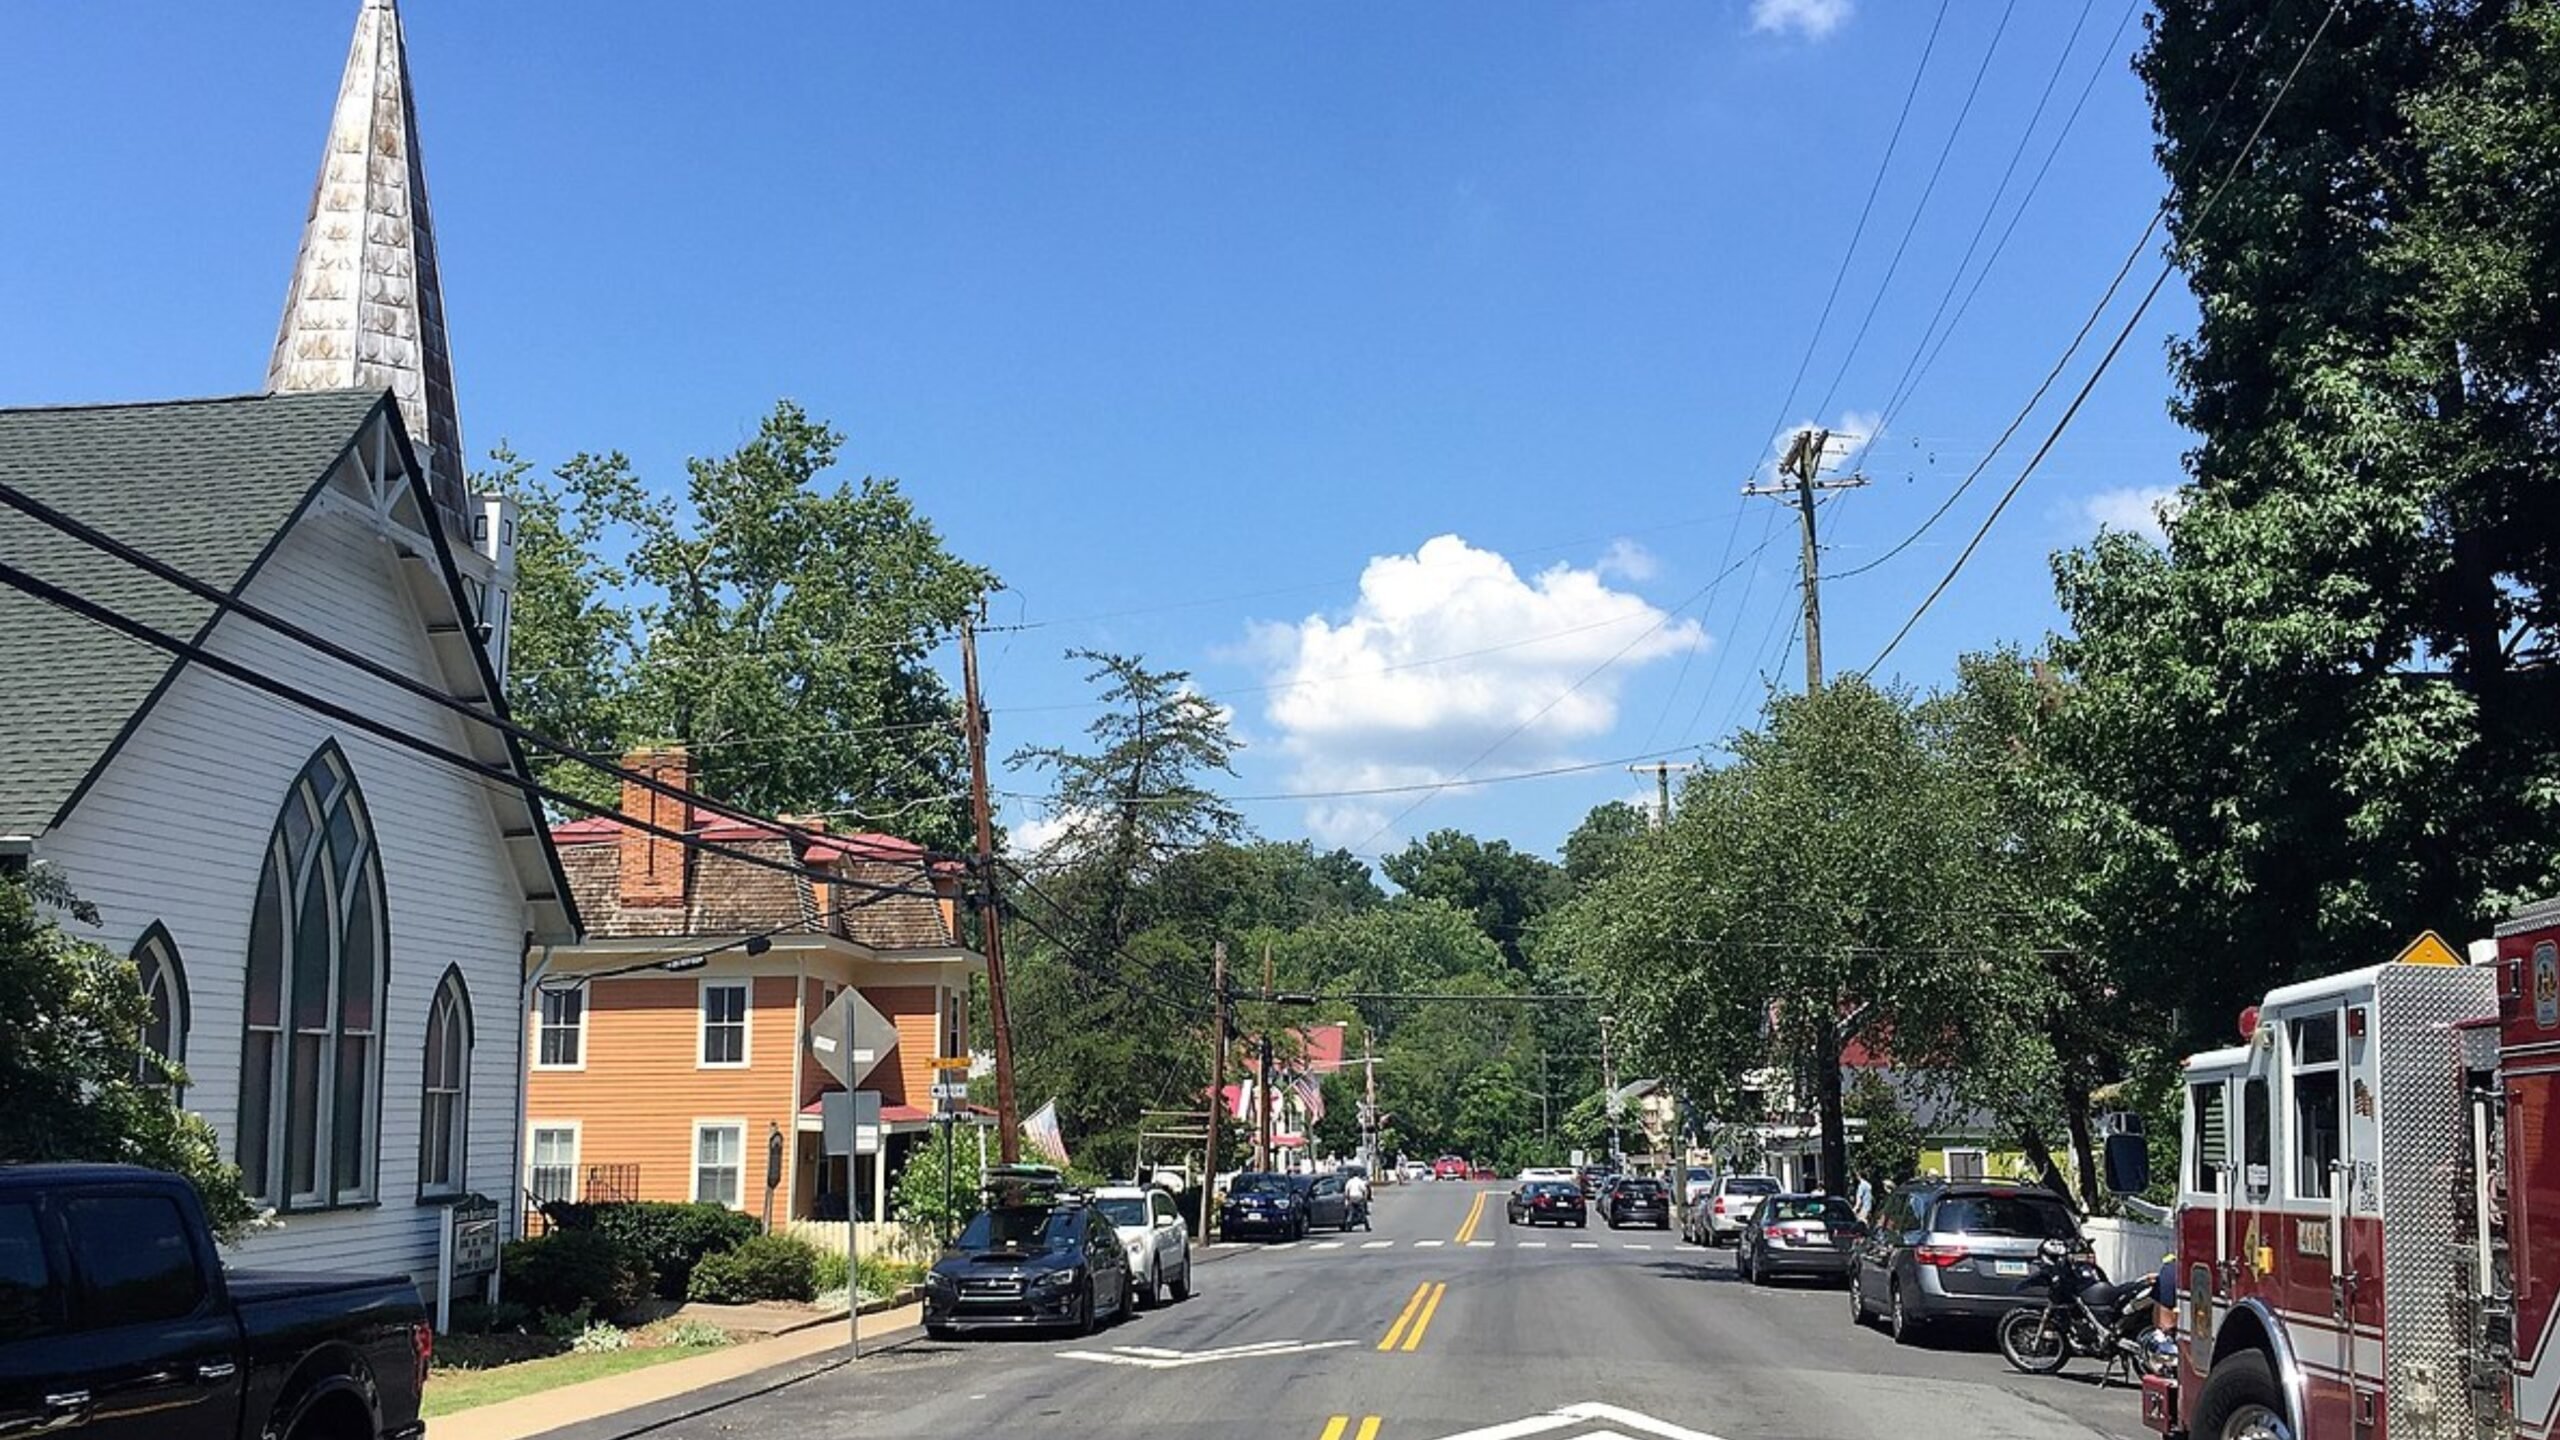
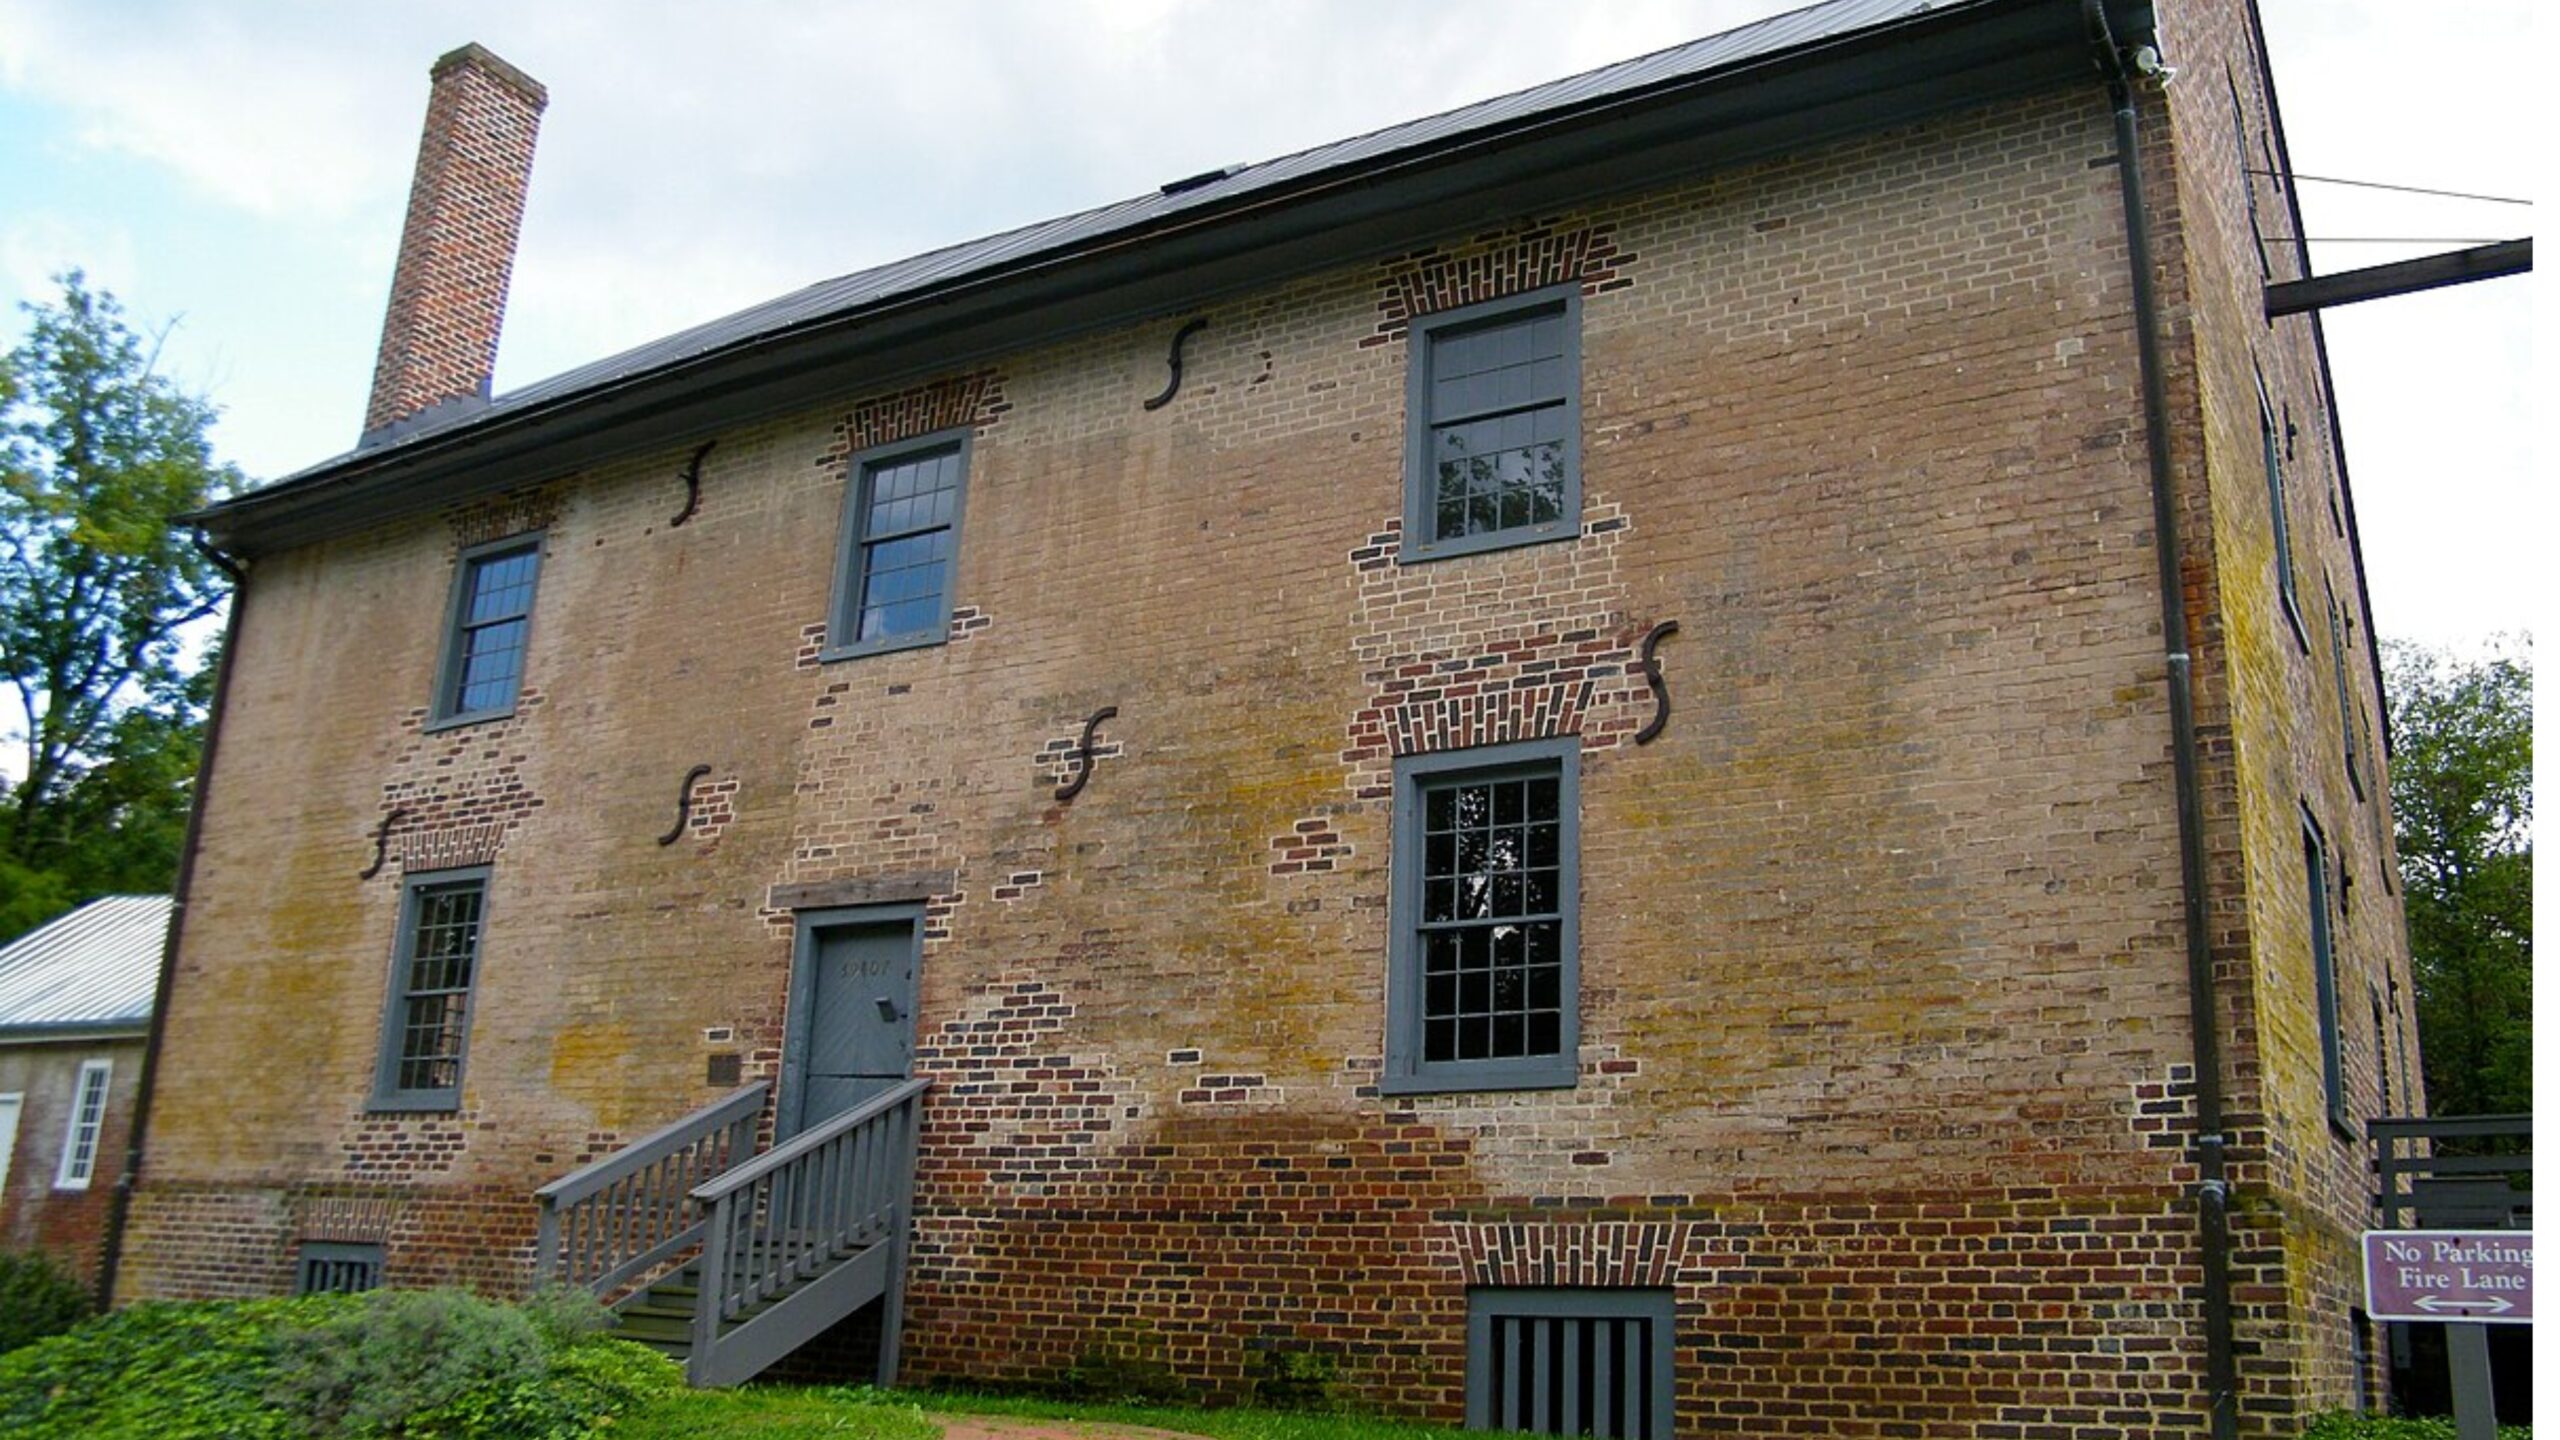
Catharpin – Expansive Estates and Stable Growth
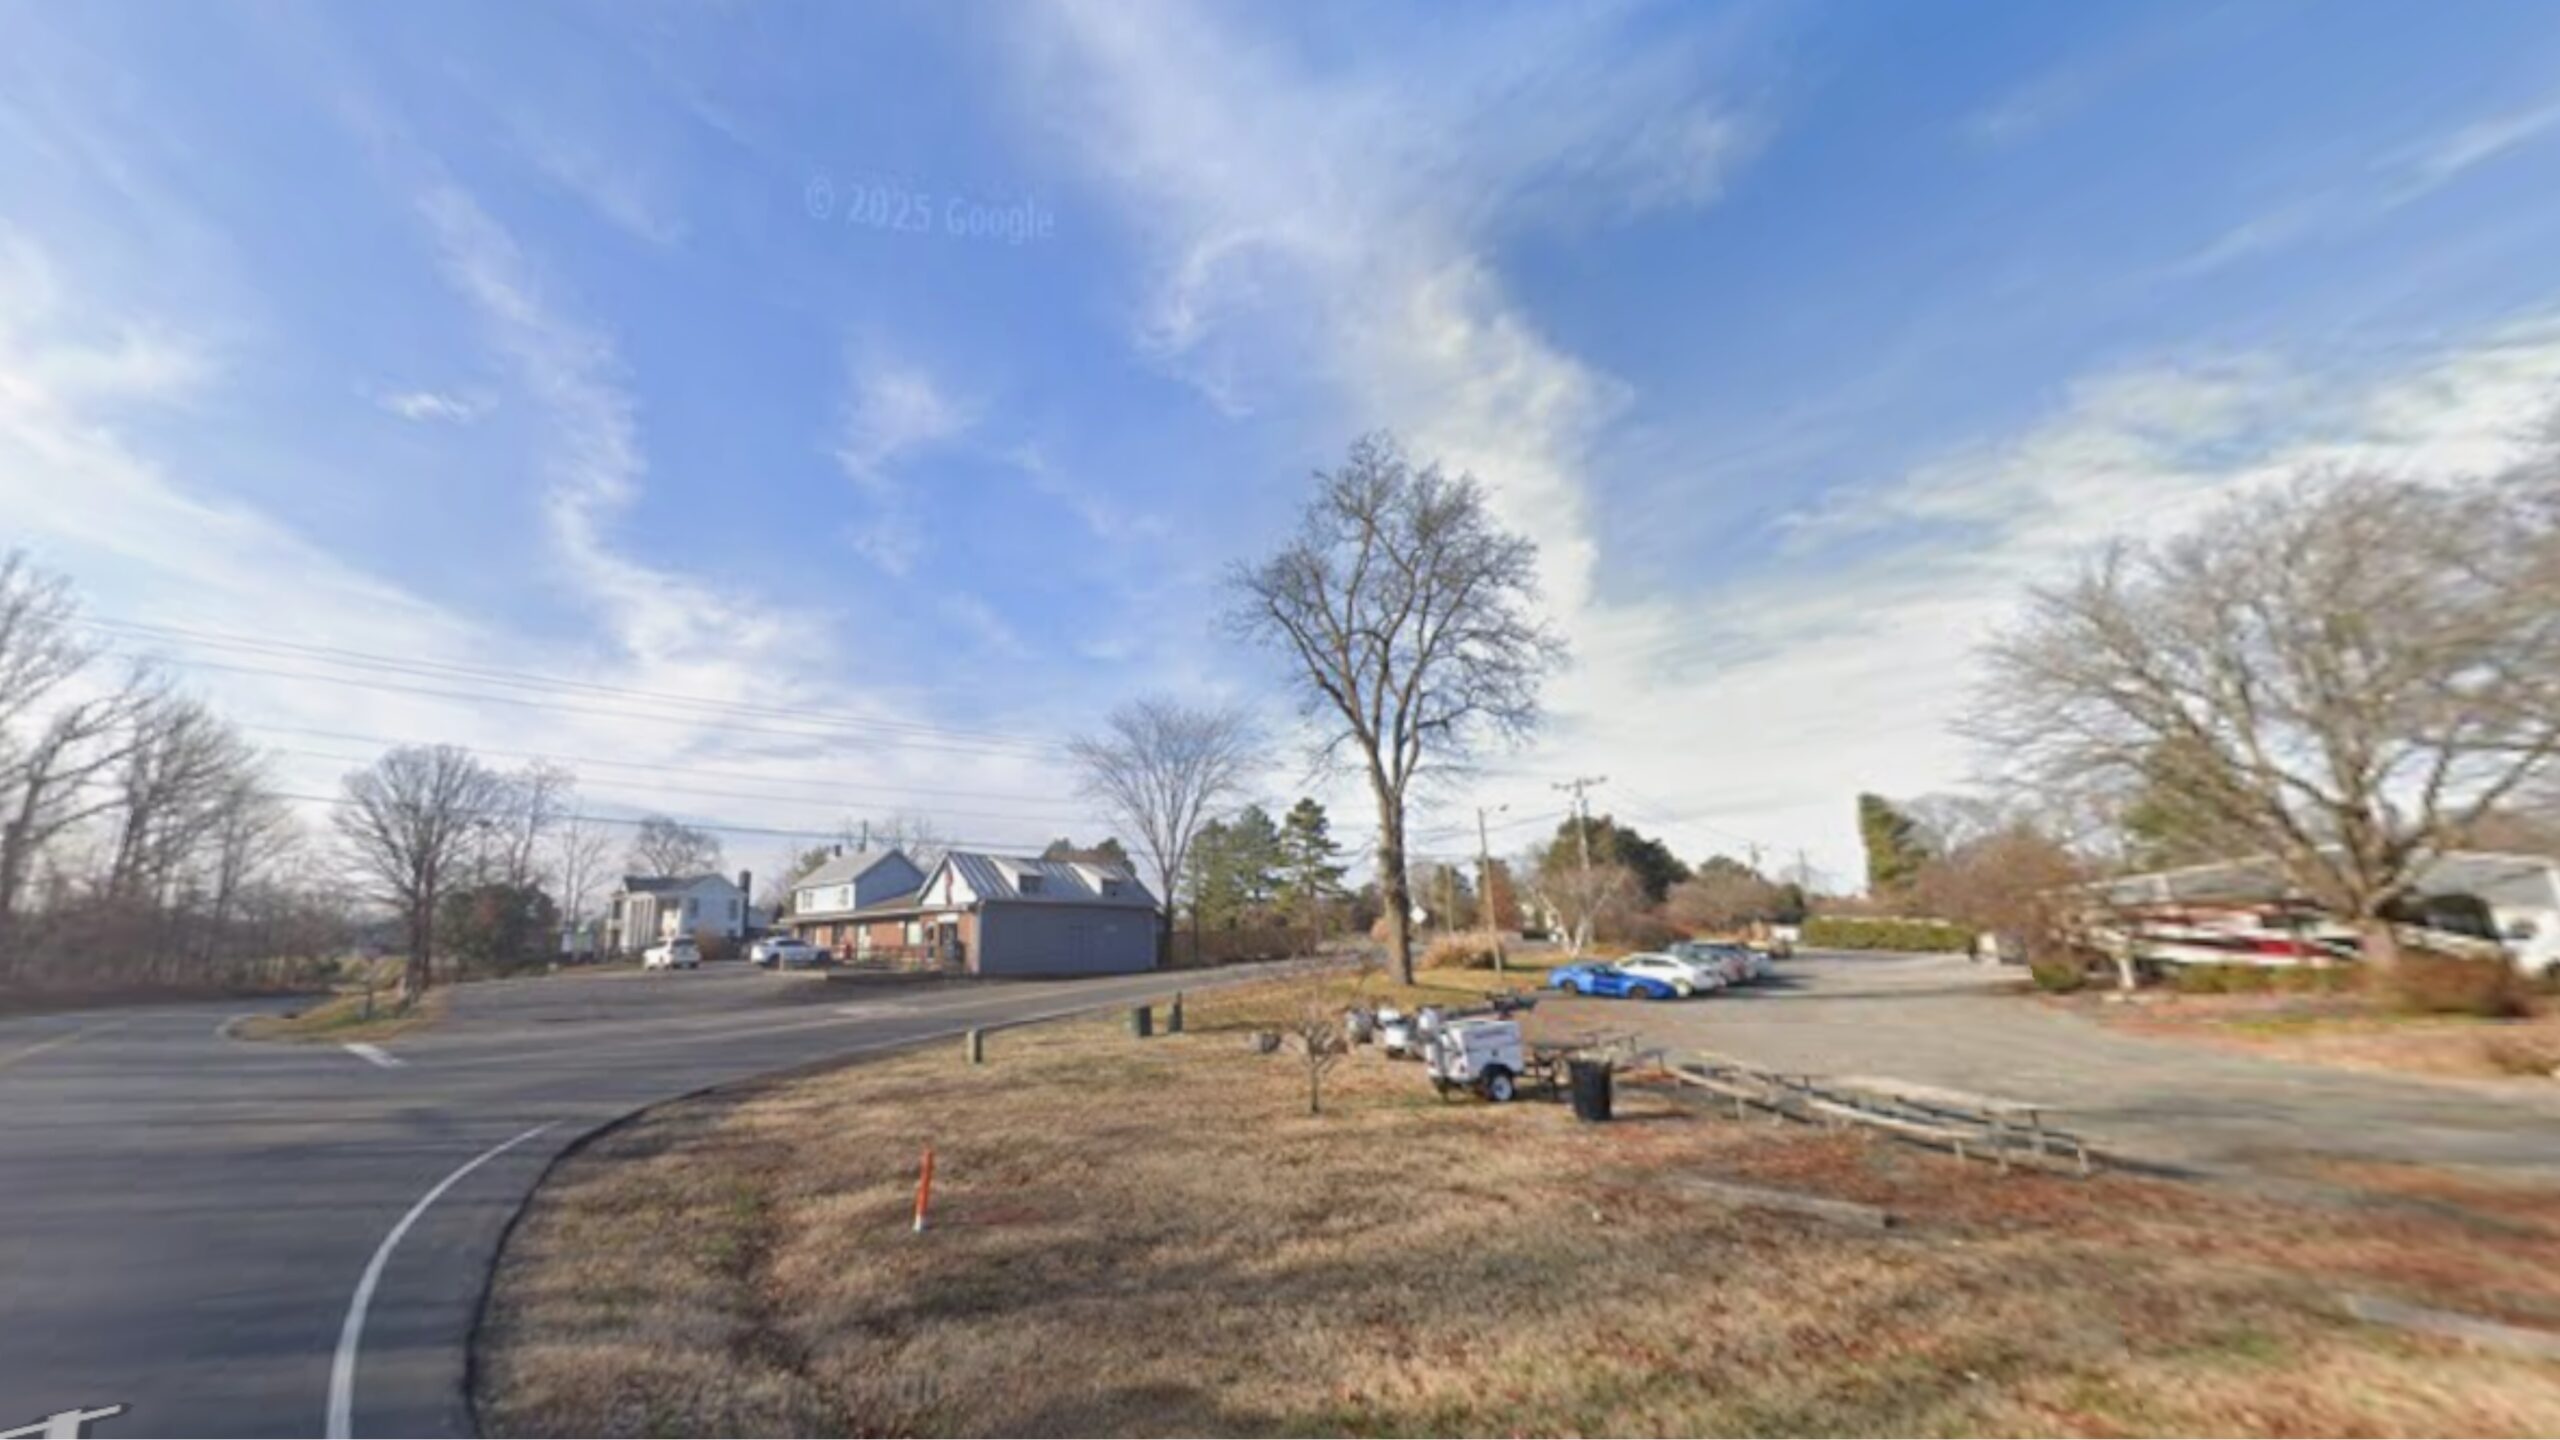
Catharpin is a peaceful enclave in Prince William County, located west of Centreville. Known for its spacious properties, rolling hills, and equestrian trails, it’s a favorite for buyers seeking land and privacy within reach of D.C. and Northern Virginia employment hubs.
The large price jumps during the early 2020s reflect rising demand for space and quiet living during the pandemic era. With limited development and a focus on custom-built homes and estates, Catharpin continues to attract high-end buyers — and that’s keeping its prices on the rise.
9. Aldie – 121.44% Home Price Increase Since 2010

🔥 Would you like to save this?
- 2010: $496,923
- 2011: $501,099 (+$4,176, +0.84% from previous year)
- 2012: $515,018 (+$13,919, +2.78% from previous year)
- 2013: $558,169 (+$43,151, +8.38% from previous year)
- 2014: $598,860 (+$40,691, +7.29% from previous year)
- 2015: $606,694 (+$7,835, +1.31% from previous year)
- 2016: $611,042 (+$4,347, +0.72% from previous year)
- 2017: $629,366 (+$18,324, +3.00% from previous year)
- 2018: $652,377 (+$23,011, +3.66% from previous year)
- 2019: $677,699 (+$25,322, +3.88% from previous year)
- 2020: $716,094 (+$38,395, +5.67% from previous year)
- 2021: $837,393 (+$121,299, +16.94% from previous year)
- 2022: $1,001,684 (+$164,291, +19.62% from previous year)
- 2023: $965,313 (-$36,371, -3.63% from previous year)
- 2024: $1,042,020 (+$76,707, +7.95% from previous year)
- 2025: $1,100,449 (+$58,429, +5.61% from previous year)
Aldie has more than doubled in value since 2010, with a growth rate exceeding 120%. The sharp rise between 2020 and 2022 stands out, followed by a quick recovery from a slight dip in 2023. Home prices are now averaging over $1.1 million.
Aldie – Suburban Luxury Meets Historic Charm
Aldie is a fast-growing area in Loudoun County known for upscale new developments mixed with preserved historic sites. It offers scenic views of the Blue Ridge Mountains, nearby wineries, and access to top-rated schools and amenities. Commuters also benefit from its proximity to Route 50 and Dulles.
The housing market’s explosive growth in recent years can be linked to the area’s expanding neighborhoods and buyer demand for spacious modern homes. While prices softened briefly, Aldie has bounced back, showing strong interest from high-income households across the D.C. metro region.
8. Oakton – 69.12% Home Price Increase Since 2010
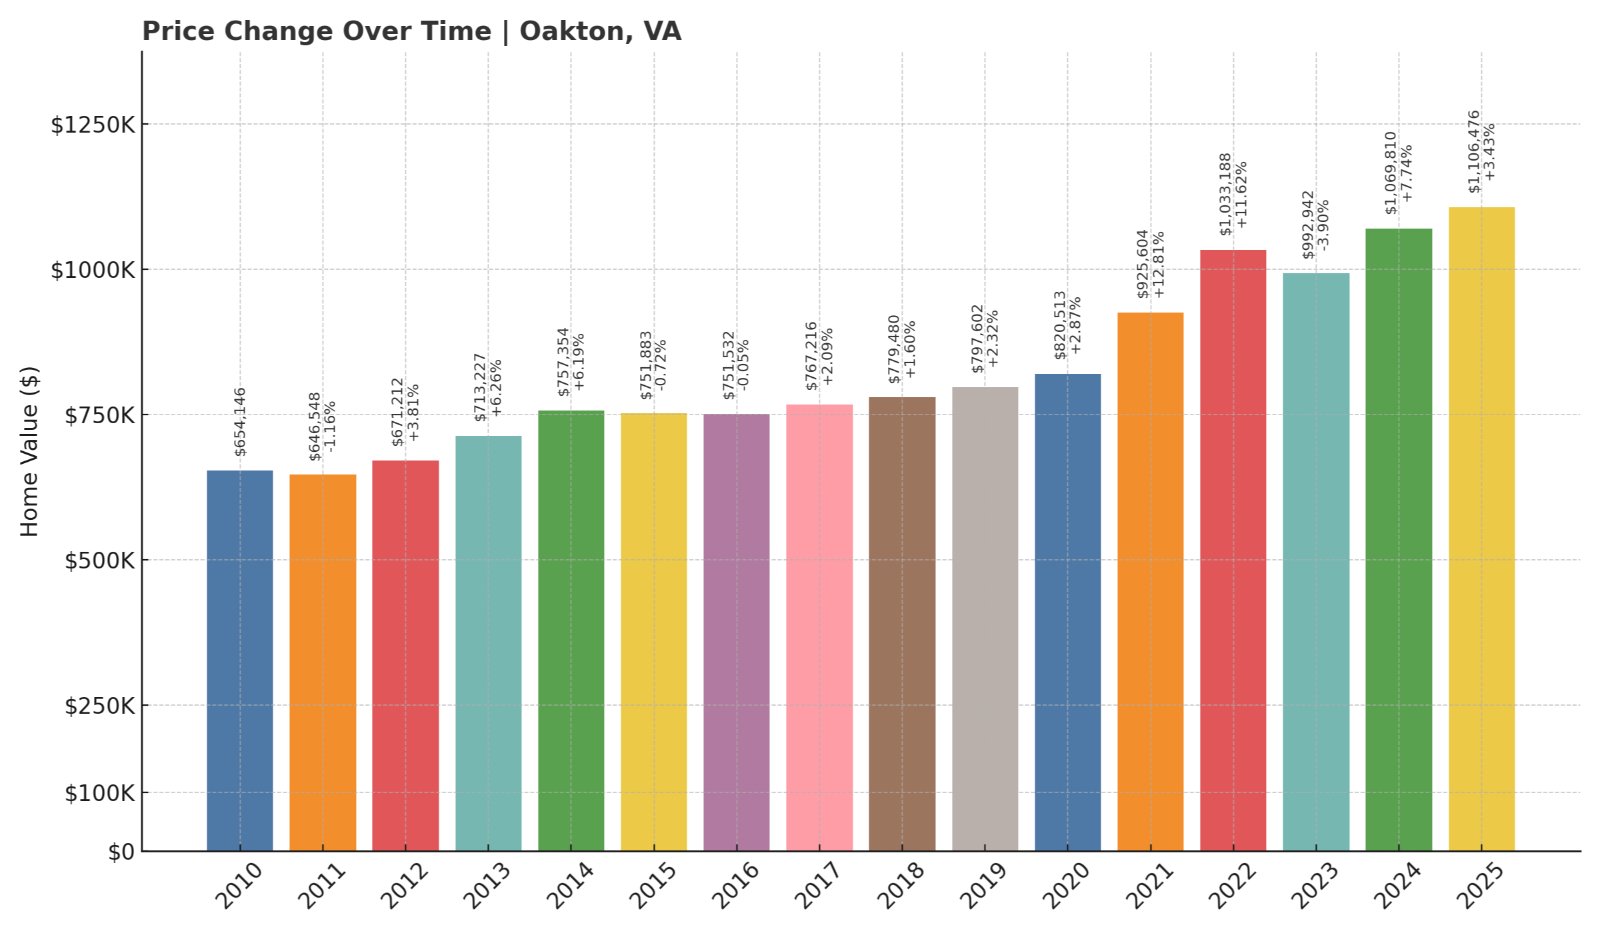
- 2010: $654,146
- 2011: $646,548 (-$7,599, -1.16% from previous year)
- 2012: $671,212 (+$24,664, +3.81% from previous year)
- 2013: $713,227 (+$42,015, +6.26% from previous year)
- 2014: $757,354 (+$44,127, +6.19% from previous year)
- 2015: $751,883 (-$5,471, -0.72% from previous year)
- 2016: $751,532 (-$351, -0.05% from previous year)
- 2017: $767,216 (+$15,684, +2.09% from previous year)
- 2018: $779,480 (+$12,264, +1.60% from previous year)
- 2019: $797,602 (+$18,122, +2.32% from previous year)
- 2020: $820,513 (+$22,910, +2.87% from previous year)
- 2021: $925,604 (+$105,092, +12.81% from previous year)
- 2022: $1,033,188 (+$107,583, +11.62% from previous year)
- 2023: $992,942 (-$40,246, -3.90% from previous year)
- 2024: $1,069,810 (+$76,867, +7.74% from previous year)
- 2025: $1,106,476 (+$36,666, +3.43% from previous year)
Oakton’s housing market has gained over 69% since 2010, with the steepest increases coming between 2020 and 2022. After a dip in 2023, the market quickly recovered, with 2025 values over $1.1 million — solidifying its place among Virginia’s most expensive towns.
Oakton – Well-Connected and Consistently Desirable
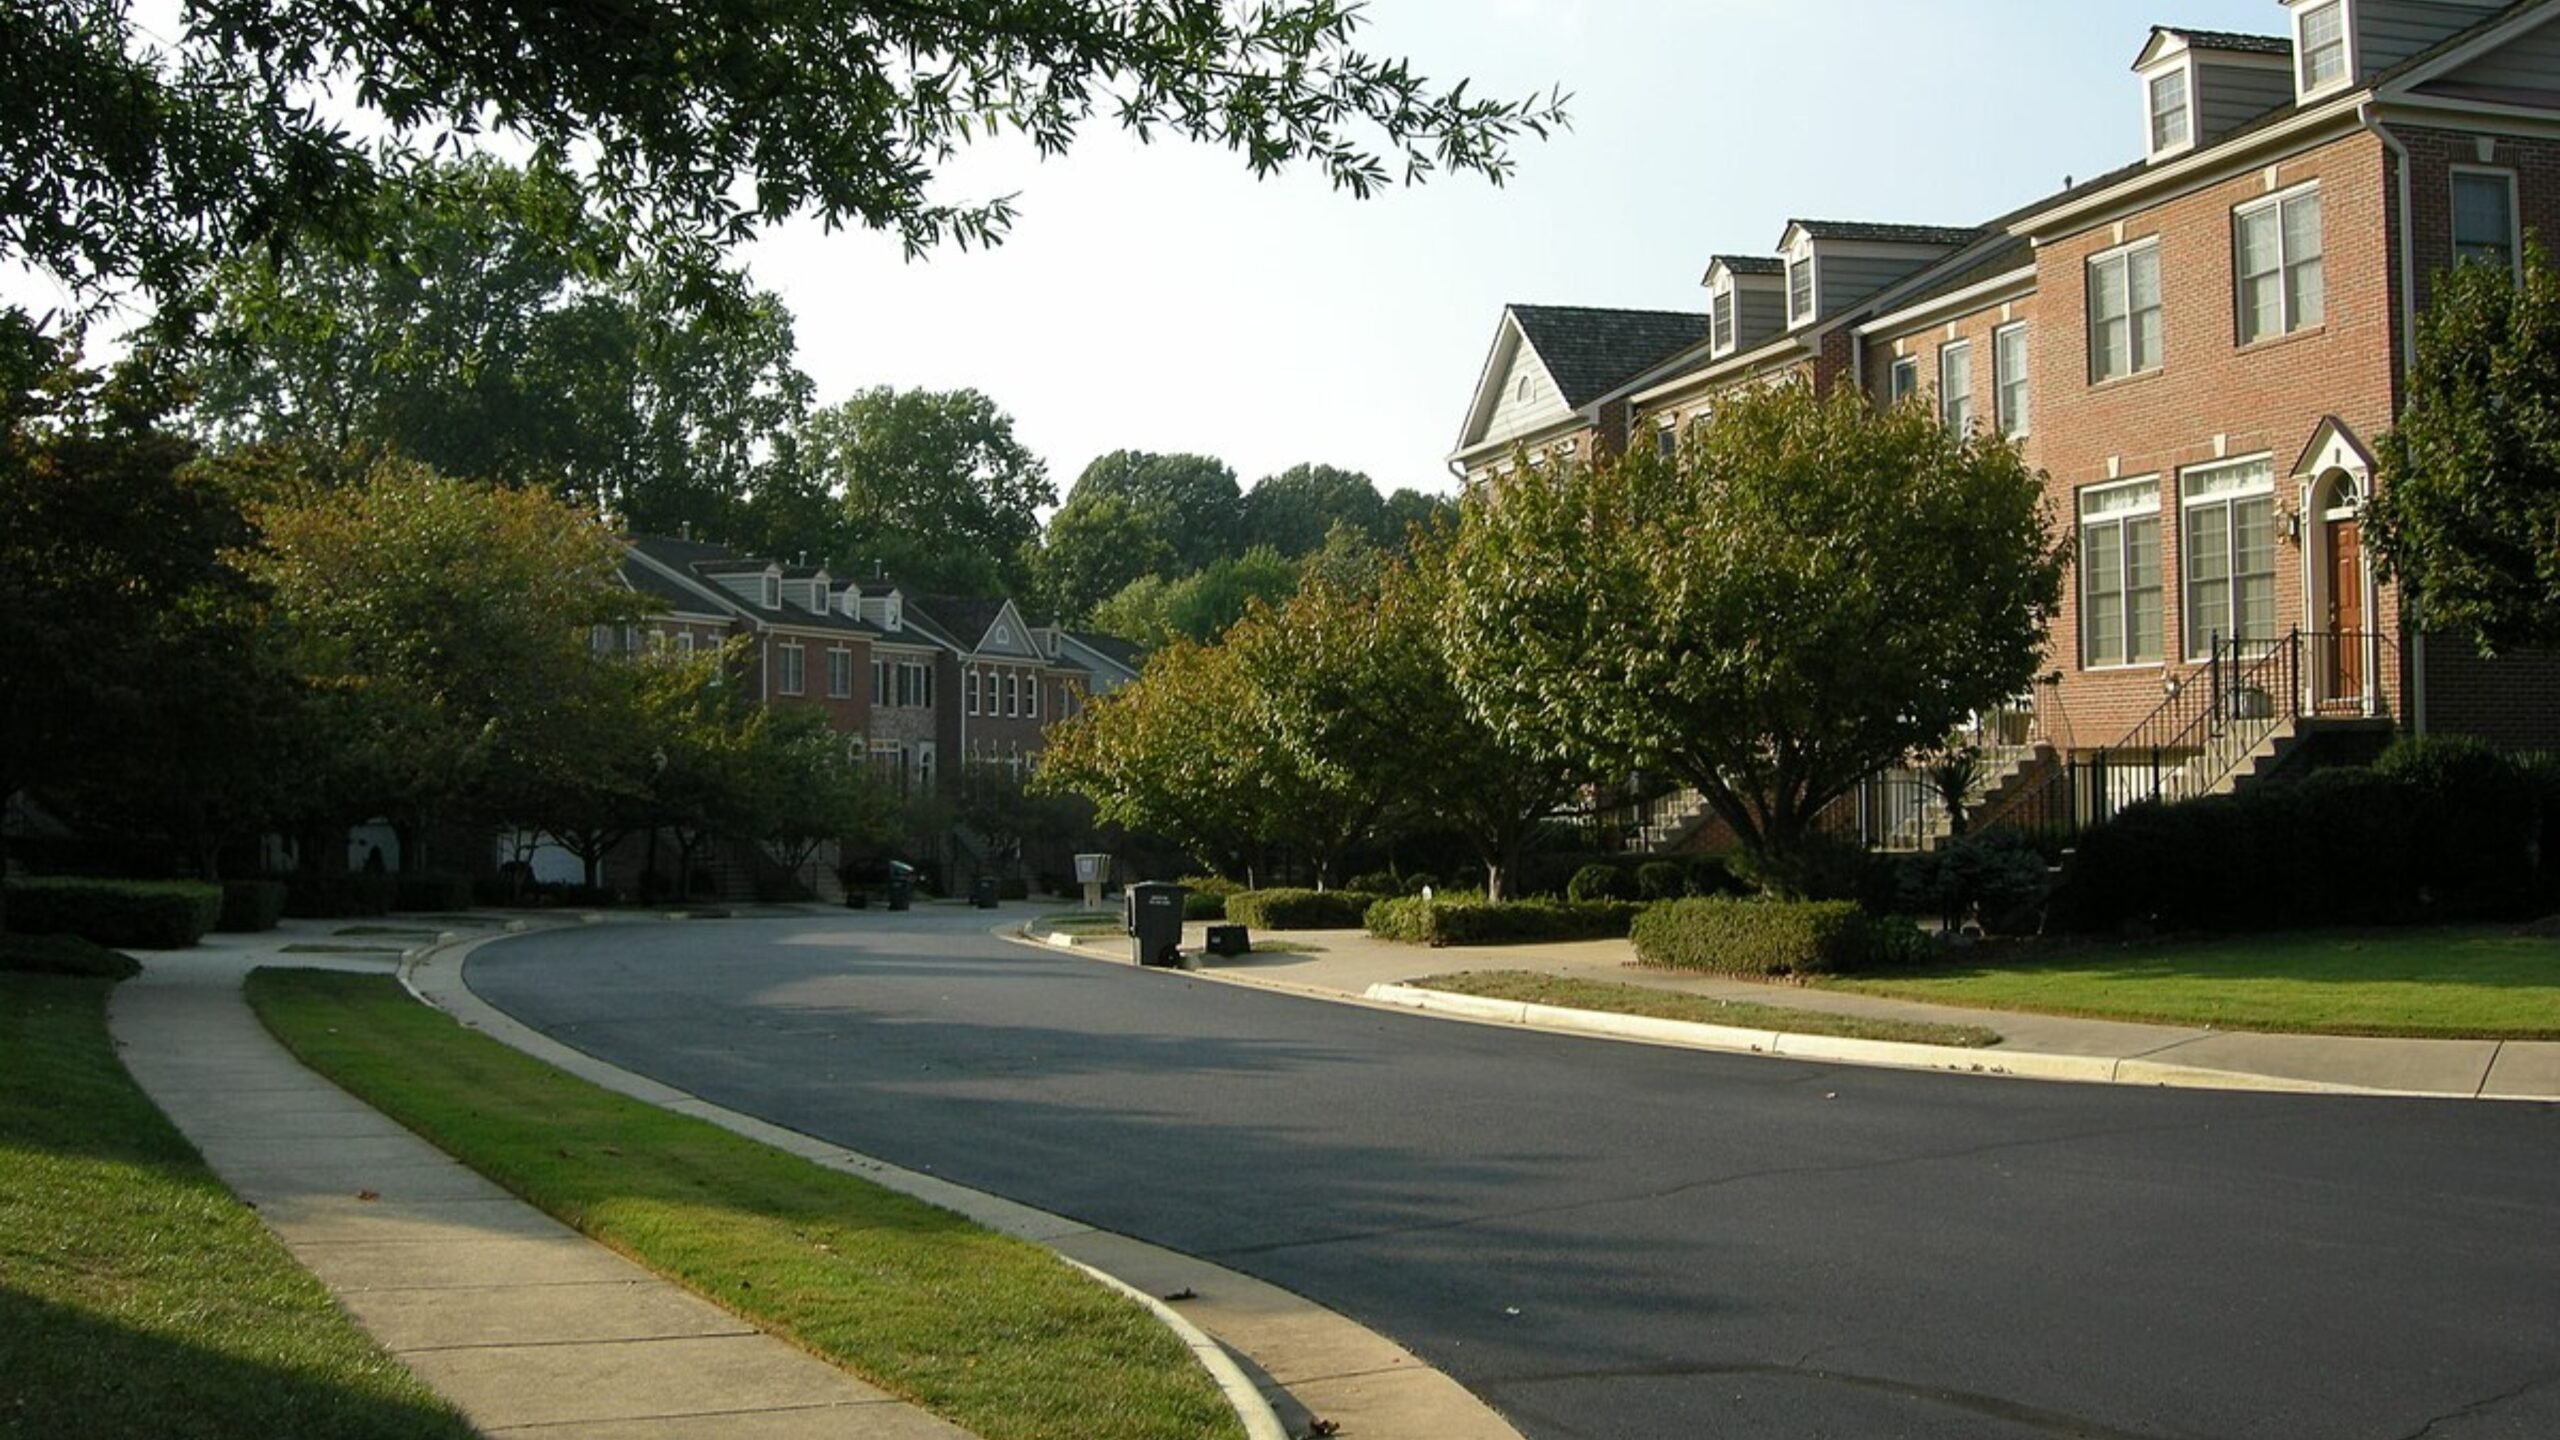
Oakton is an established Fairfax County suburb with a reputation for excellent schools, leafy neighborhoods, and prime location. It offers easy access to the Vienna Metro, I-66, and Tysons Corner, making it ideal for commuters seeking a quiet but connected lifestyle.
Home prices reflect Oakton’s broad appeal — from families seeking top-rated schools to professionals wanting proximity to major job centers. With a stable housing stock and limited land for new development, demand continues to push prices steadily higher.
7. Middleburg – 106.78% Home Price Increase Since 2010
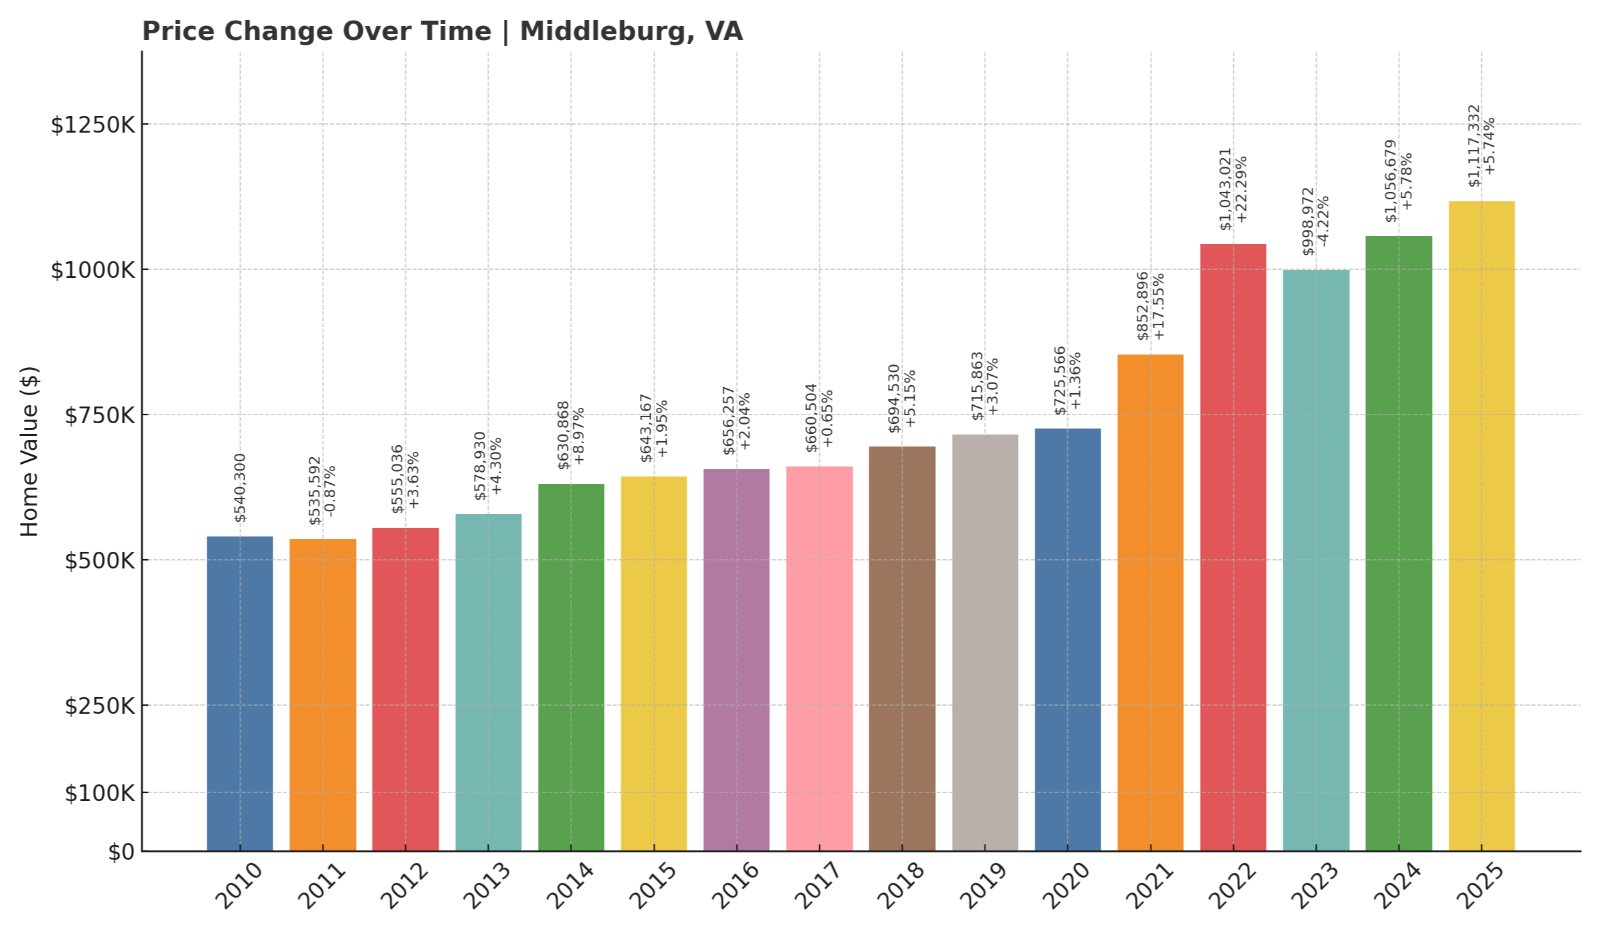
- 2010: $540,300
- 2011: $535,592 (-$4,707, -0.87% from previous year)
- 2012: $555,036 (+$19,444, +3.63% from previous year)
- 2013: $578,930 (+$23,893, +4.30% from previous year)
- 2014: $630,868 (+$51,939, +8.97% from previous year)
- 2015: $643,167 (+$12,299, +1.95% from previous year)
- 2016: $656,257 (+$13,090, +2.04% from previous year)
- 2017: $660,504 (+$4,247, +0.65% from previous year)
- 2018: $694,530 (+$34,026, +5.15% from previous year)
- 2019: $715,863 (+$21,334, +3.07% from previous year)
- 2020: $725,566 (+$9,703, +1.36% from previous year)
- 2021: $852,896 (+$127,330, +17.55% from previous year)
- 2022: $1,043,021 (+$190,125, +22.29% from previous year)
- 2023: $998,972 (-$44,049, -4.22% from previous year)
- 2024: $1,056,679 (+$57,707, +5.78% from previous year)
- 2025: $1,117,332 (+$60,653, +5.74% from previous year)
Middleburg has seen home values more than double since 2010. After peaking in 2022, prices cooled slightly in 2023 but rebounded with two strong years. In 2025, the average home price exceeds $1.1 million, making it one of Virginia’s most luxurious small towns.
Middleburg – Equestrian Hub With a Premium Market
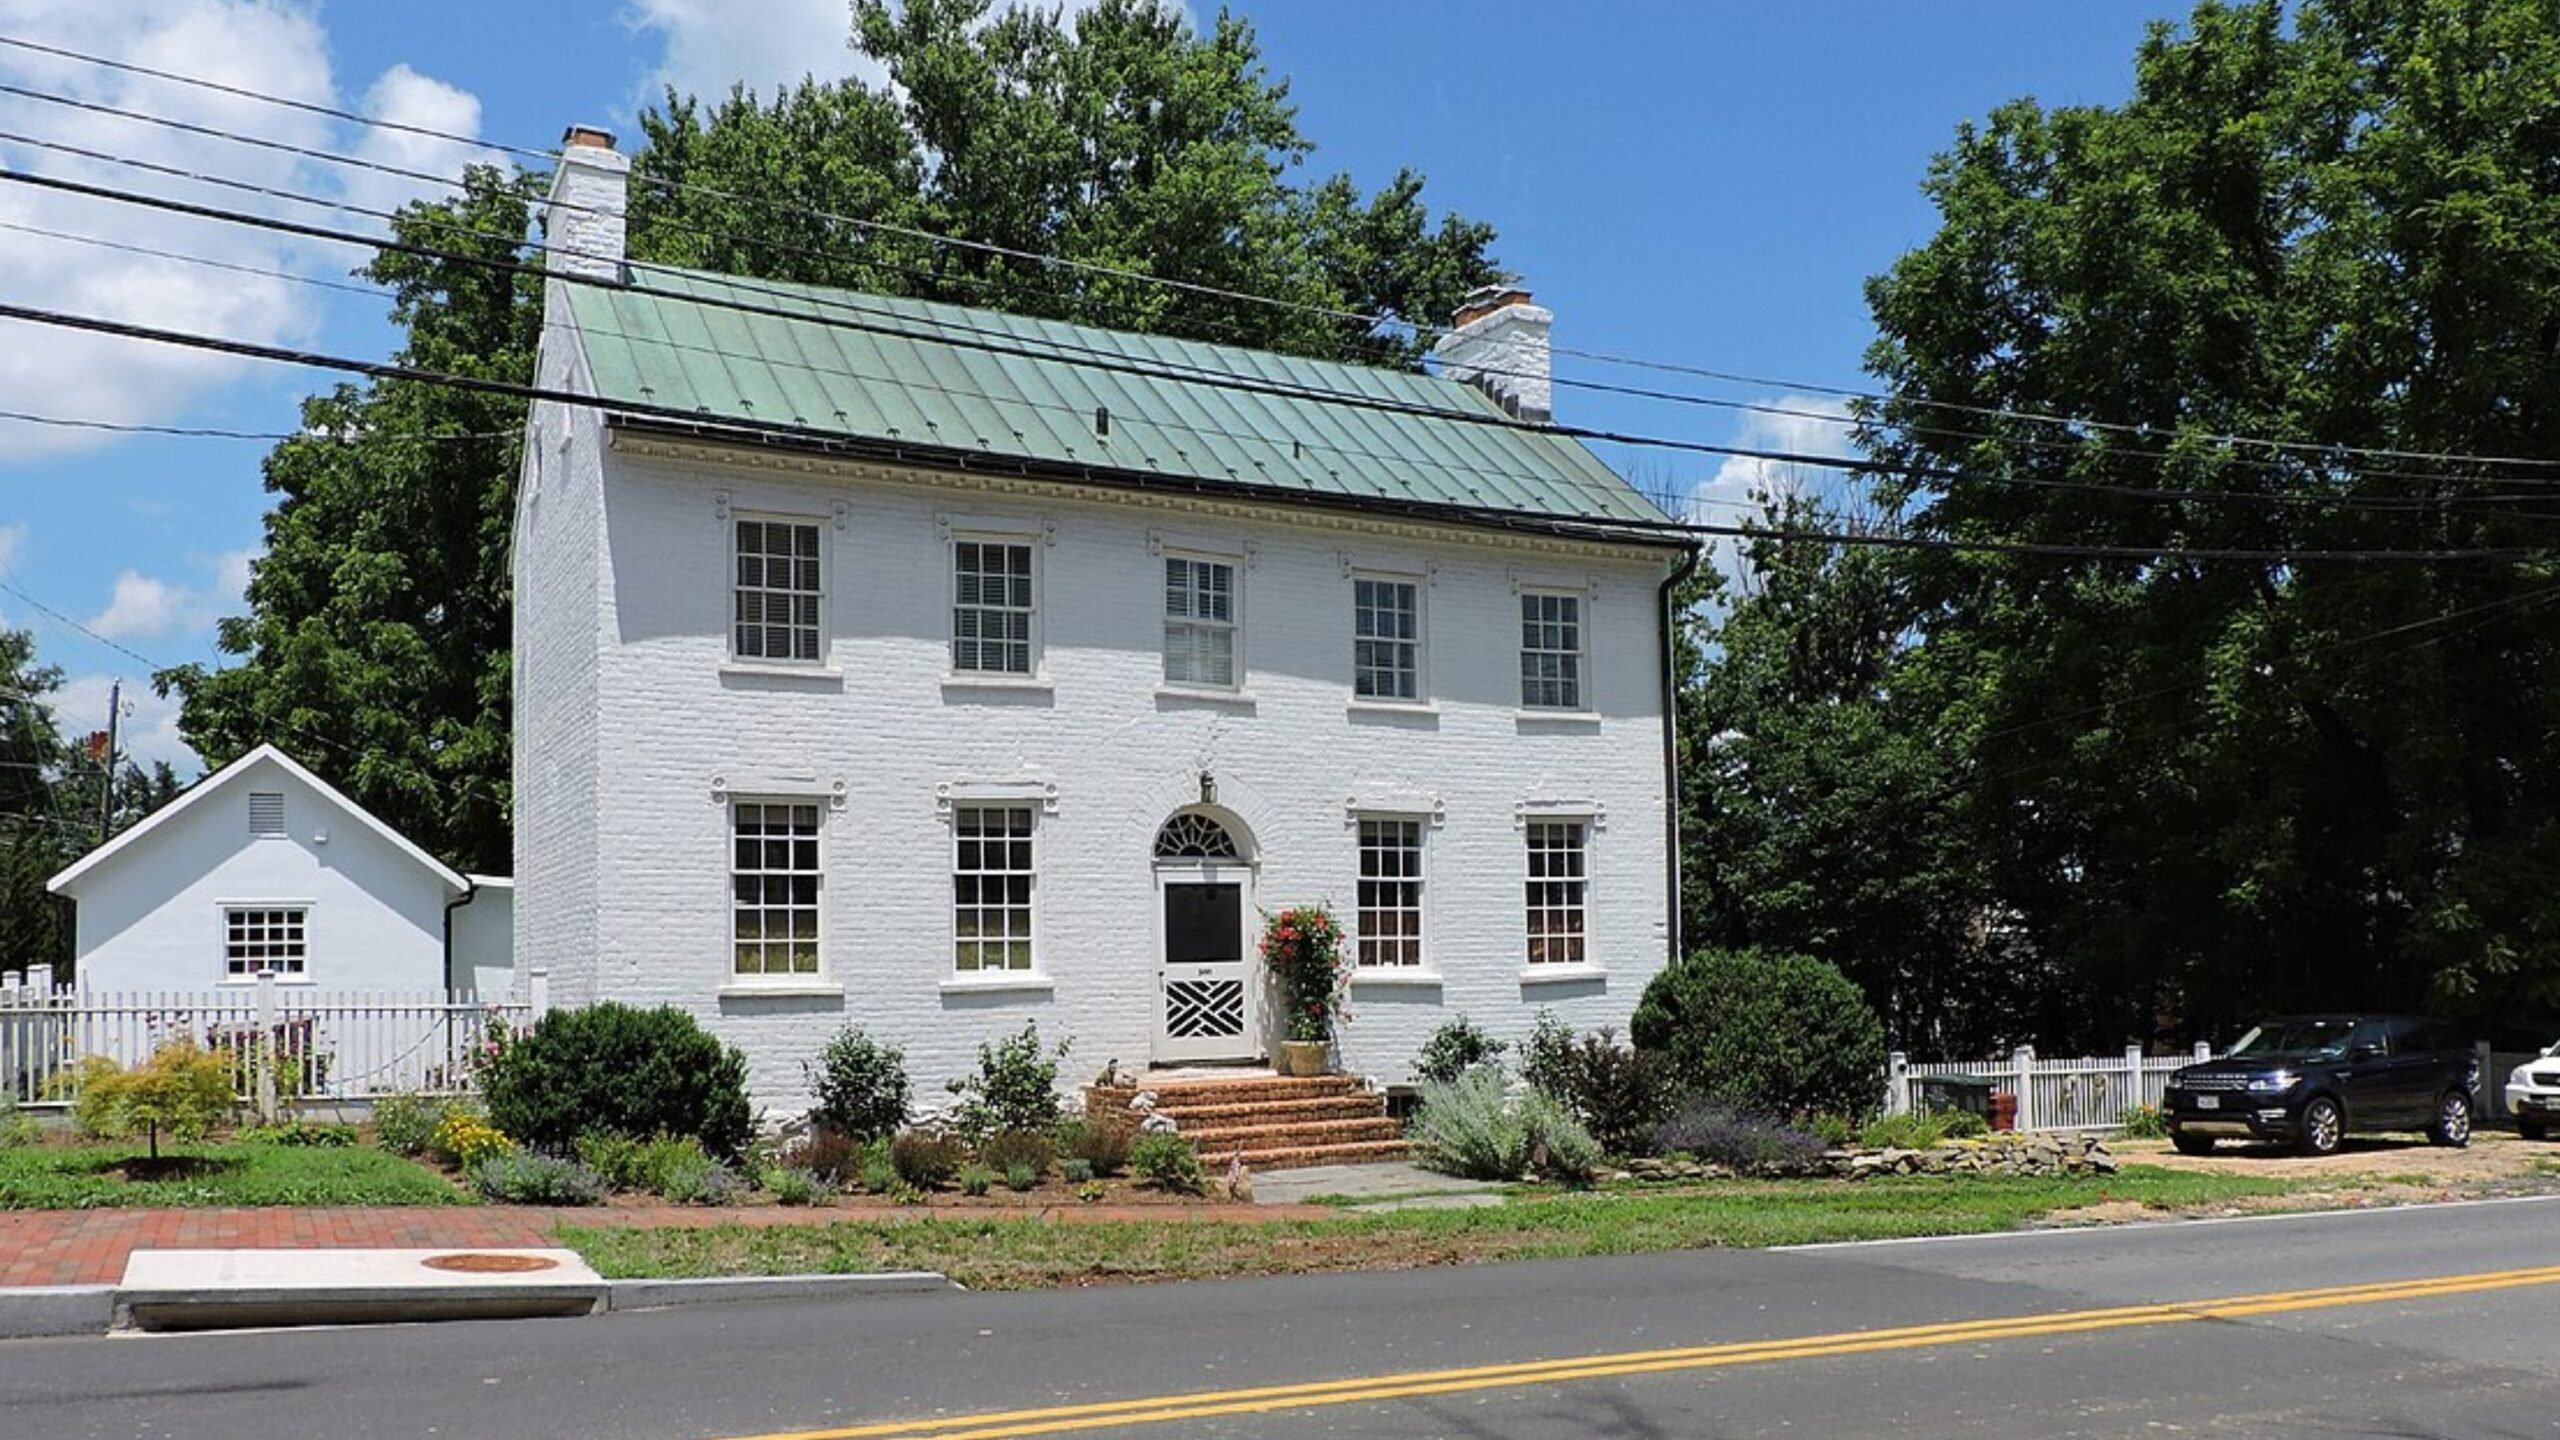
Middleburg is a jewel of Loudoun County, renowned for its horse farms, vineyards, and historic downtown. The town draws wealthy buyers with its upscale charm, refined atmosphere, and commitment to preserving open space and architectural integrity.
Its steep rise in home values, especially during the early 2020s, corresponds with a national trend toward spacious, high-end rural living. Middleburg offers not only exclusivity but a lifestyle centered on tradition, outdoor recreation, and elite social events like steeplechases and fox hunts.
6. Upperville – 65.77% Home Price Increase Since 2010
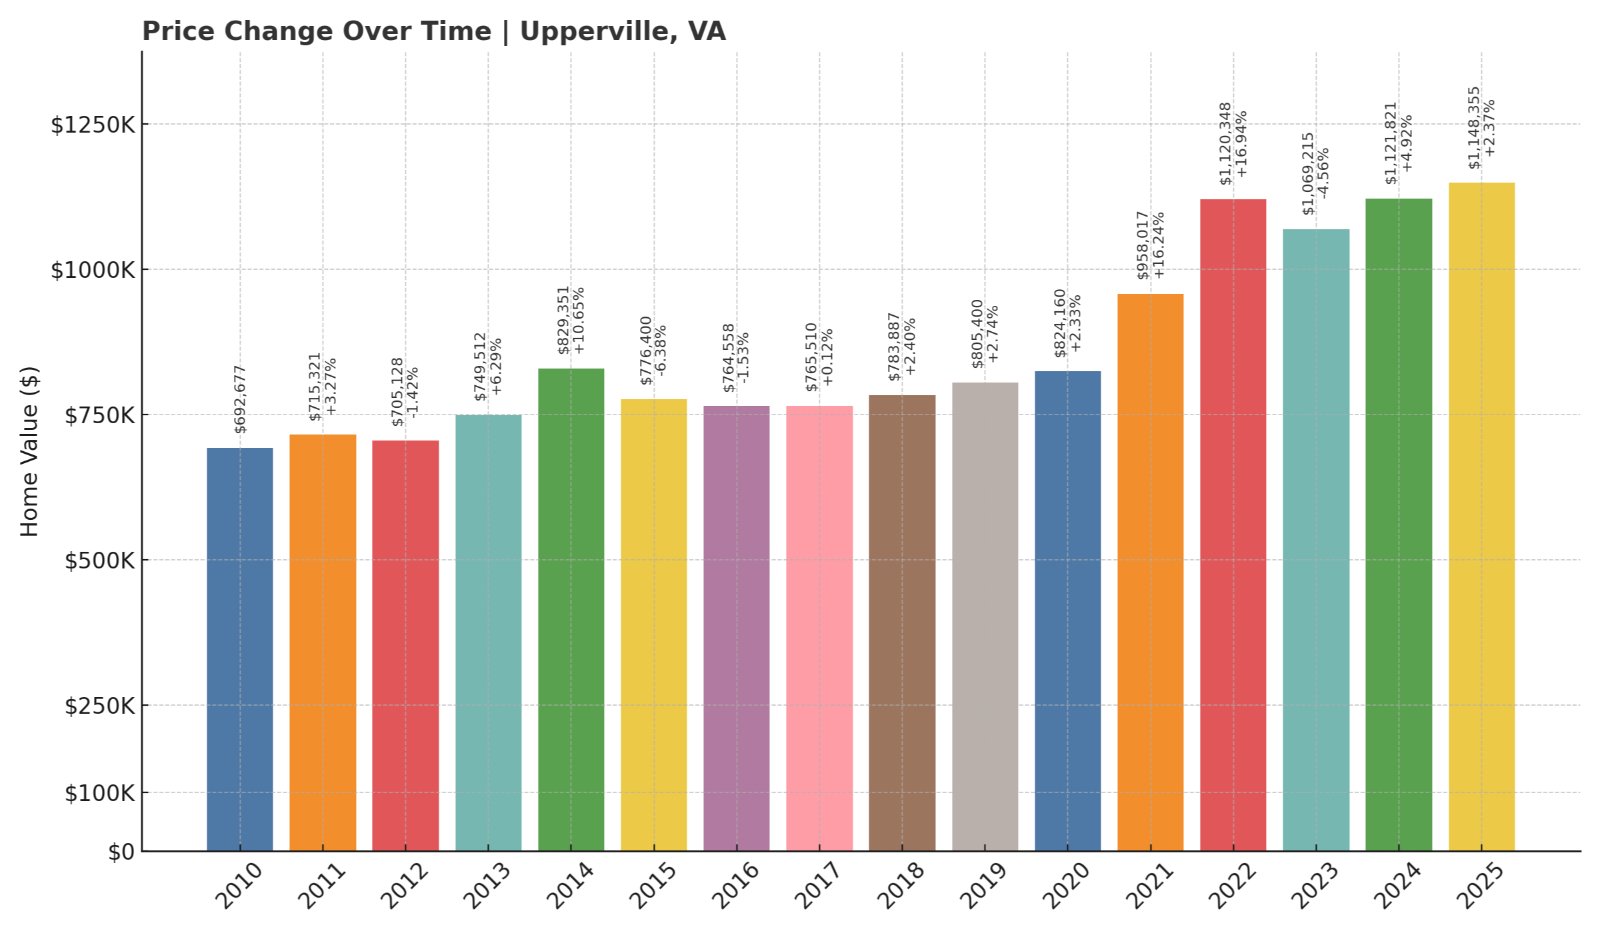
- 2010: $692,677
- 2011: $715,321 (+$22,644, +3.27% from previous year)
- 2012: $705,128 (-$10,193, -1.42% from previous year)
- 2013: $749,512 (+$44,384, +6.29% from previous year)
- 2014: $829,351 (+$79,839, +10.65% from previous year)
- 2015: $776,400 (-$52,952, -6.38% from previous year)
- 2016: $764,558 (-$11,842, -1.53% from previous year)
- 2017: $765,510 (+$952, +0.12% from previous year)
- 2018: $783,887 (+$18,378, +2.40% from previous year)
- 2019: $805,400 (+$21,513, +2.74% from previous year)
- 2020: $824,160 (+$18,760, +2.33% from previous year)
- 2021: $958,017 (+$133,857, +16.24% from previous year)
- 2022: $1,120,348 (+$162,331, +16.94% from previous year)
- 2023: $1,069,215 (-$51,133, -4.56% from previous year)
- 2024: $1,121,821 (+$52,606, +4.92% from previous year)
- 2025: $1,148,355 (+$26,534, +2.37% from previous year)
Upperville’s home prices have risen nearly 66% since 2010, with rapid appreciation between 2020 and 2022. Although prices dipped slightly in 2023, they recovered quickly. In 2025, homes in Upperville average nearly $1.15 million, keeping it among Virginia’s top-tier towns.
Upperville – Historic Elegance in Horse Country
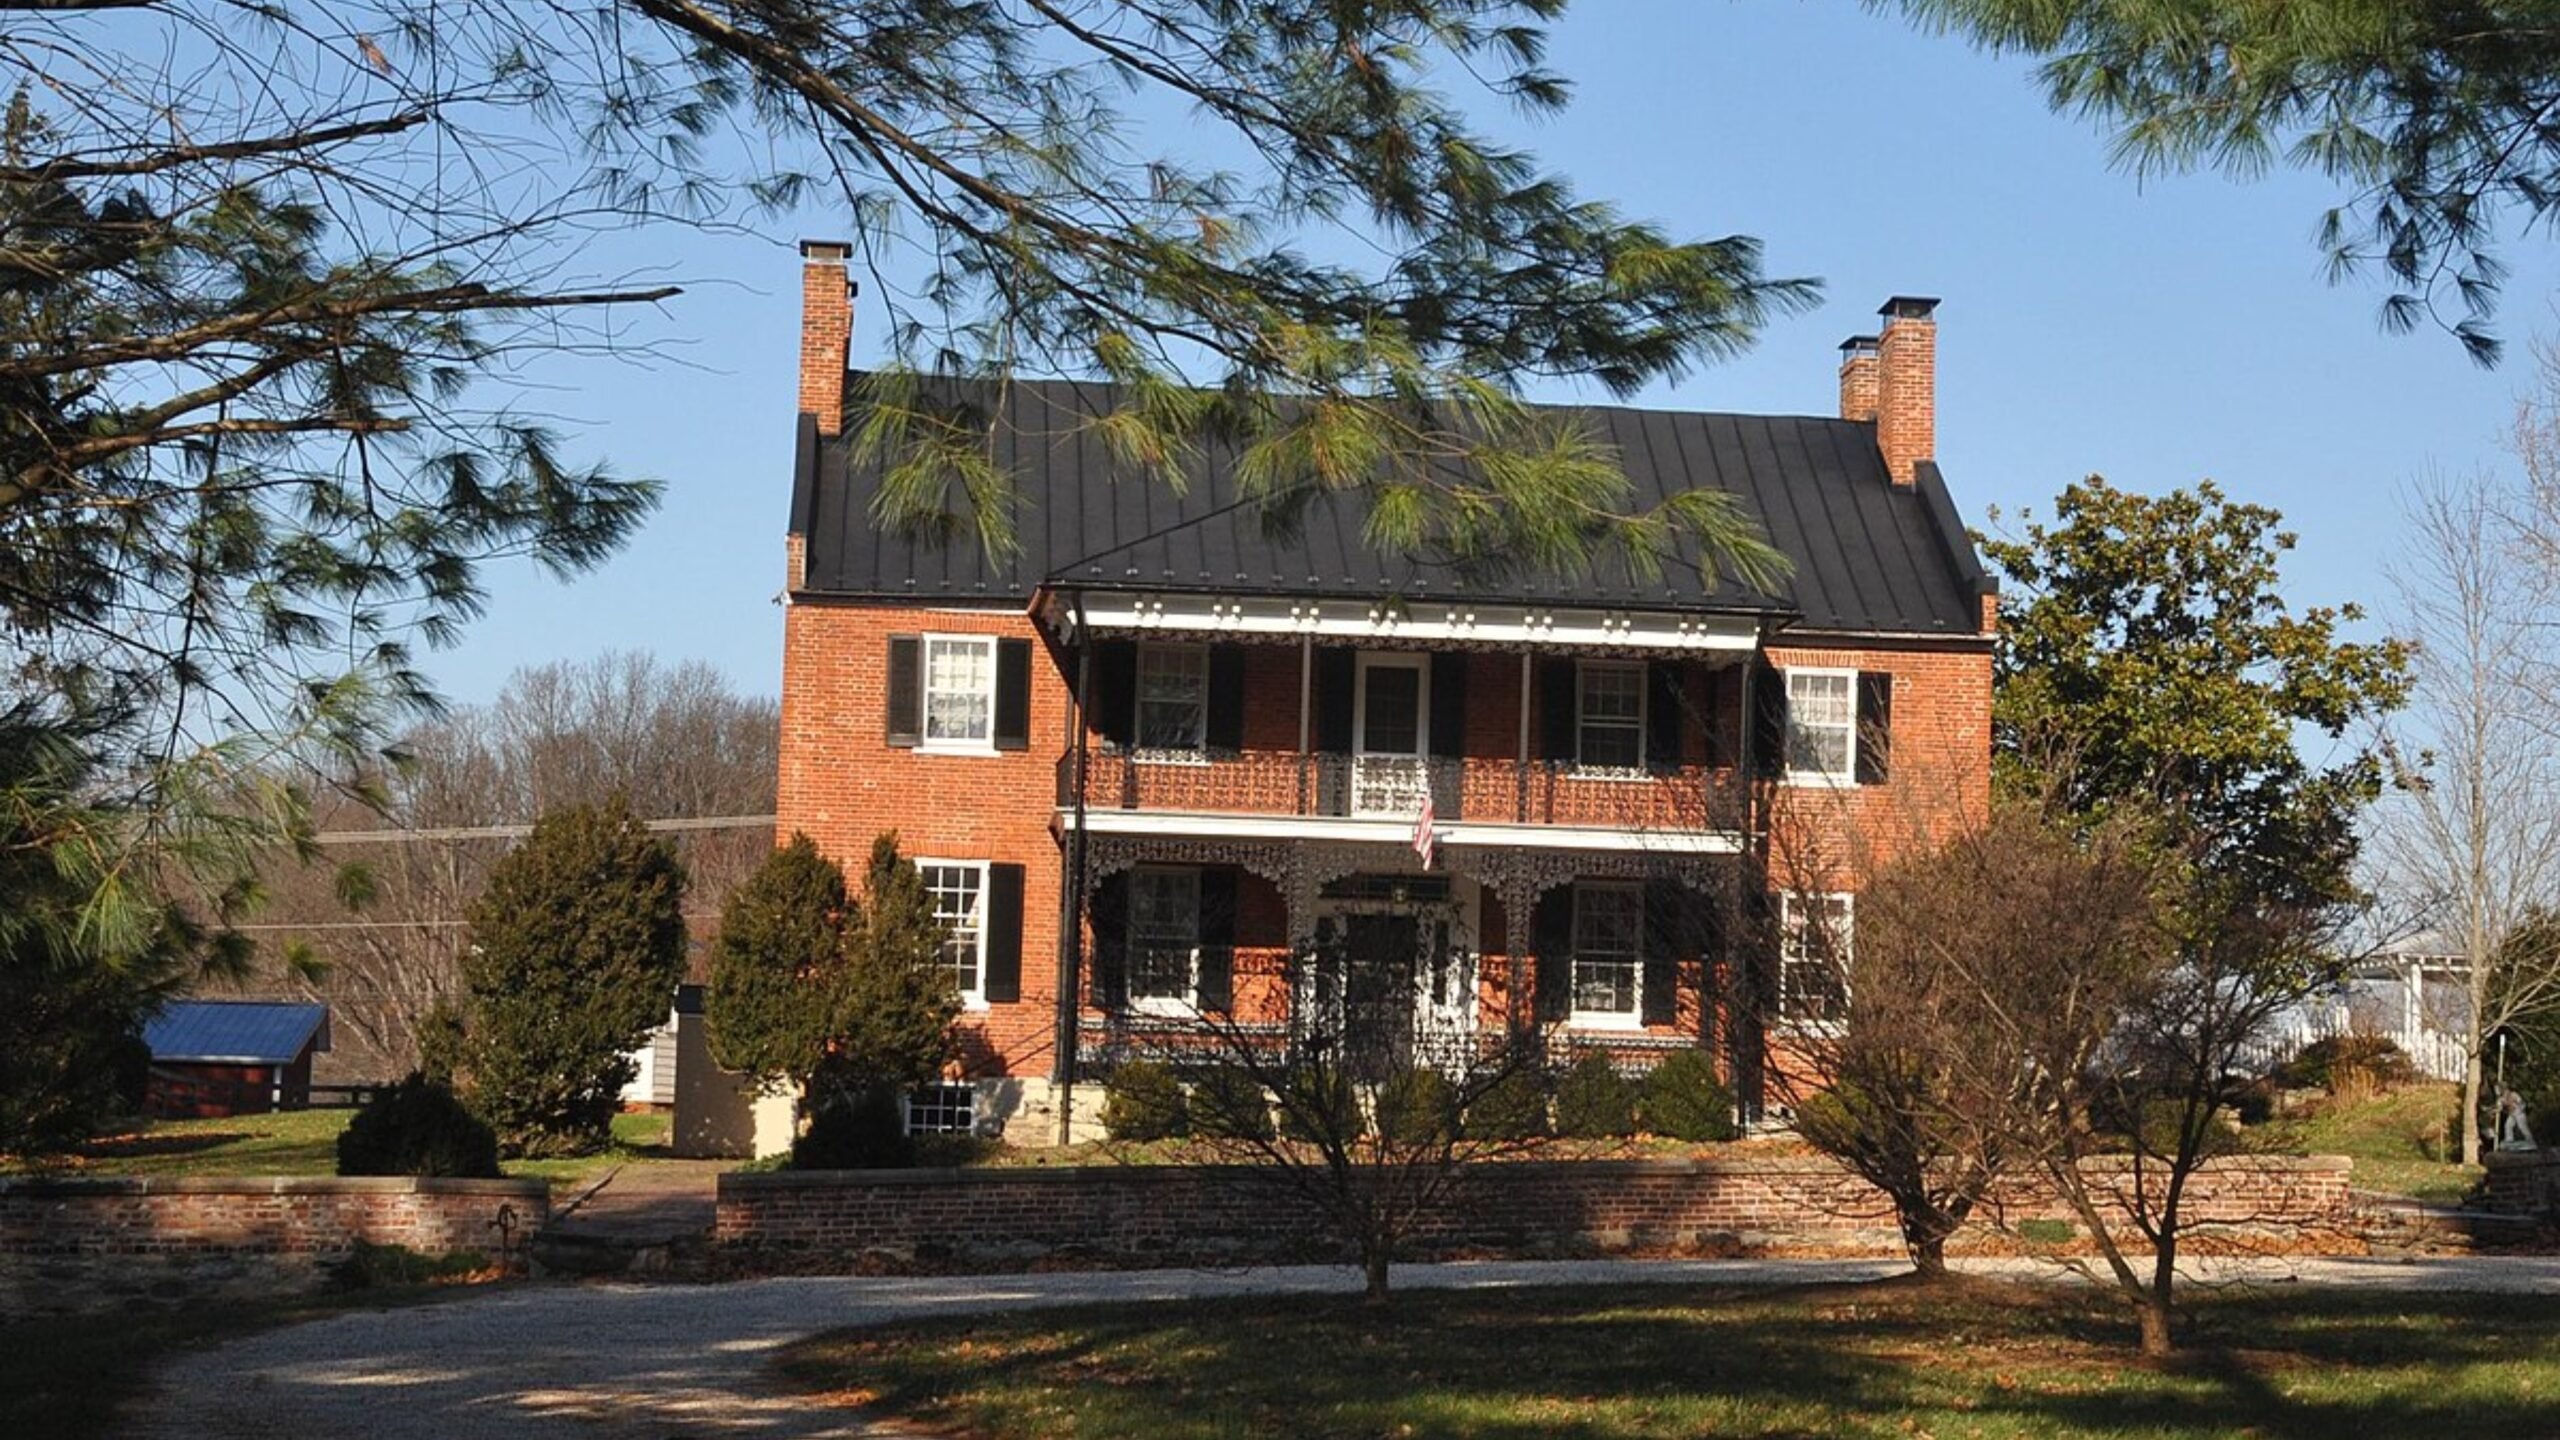
Upperville, nestled at the foot of the Blue Ridge Mountains in Fauquier County, is known for its historic estates, lush pastures, and quiet prestige. The town has a long equestrian tradition and hosts the Upperville Colt & Horse Show, one of the oldest in the country.
The significant price growth in recent years points to strong demand for luxury rural properties. With few new developments and a focus on preservation, Upperville remains a highly exclusive market. Its blend of history, scenery, and privacy continues to attract affluent buyers year after year.
5. Vienna – 82.26% Home Price Increase Since 2010
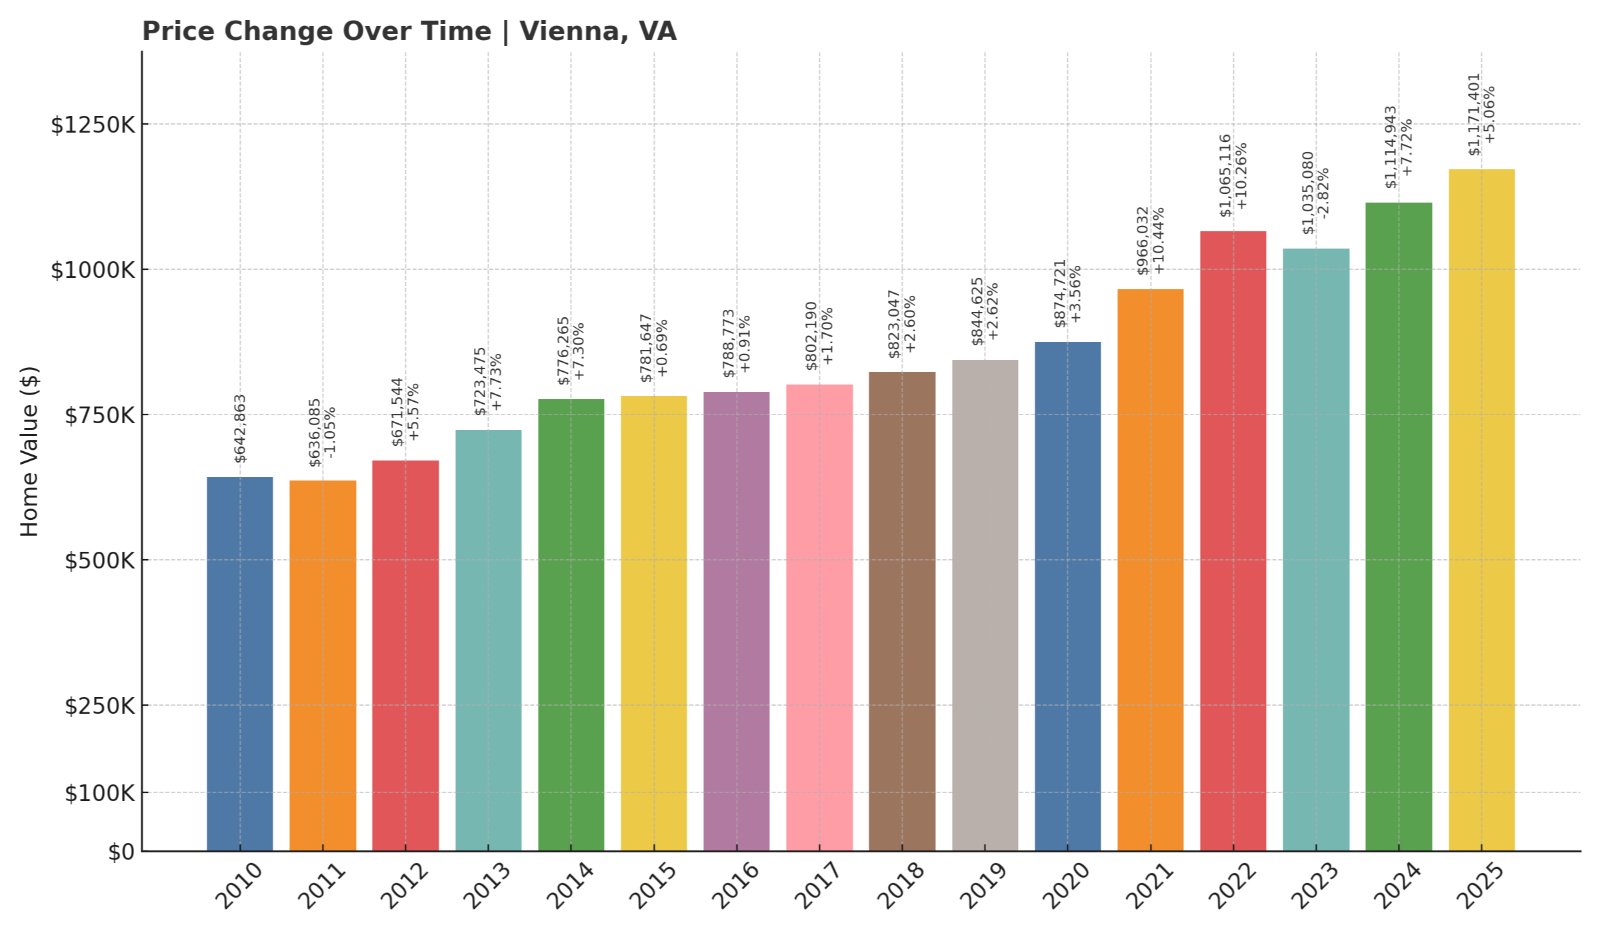
- 2010: $642,863
- 2011: $636,085 (-$6,778, -1.05% from previous year)
- 2012: $671,544 (+$35,460, +5.57% from previous year)
- 2013: $723,475 (+$51,930, +7.73% from previous year)
- 2014: $776,265 (+$52,791, +7.30% from previous year)
- 2015: $781,647 (+$5,382, +0.69% from previous year)
- 2016: $788,773 (+$7,126, +0.91% from previous year)
- 2017: $802,190 (+$13,417, +1.70% from previous year)
- 2018: $823,047 (+$20,857, +2.60% from previous year)
- 2019: $844,625 (+$21,578, +2.62% from previous year)
- 2020: $874,721 (+$30,096, +3.56% from previous year)
- 2021: $966,032 (+$91,311, +10.44% from previous year)
- 2022: $1,065,116 (+$99,085, +10.26% from previous year)
- 2023: $1,035,080 (-$30,037, -2.82% from previous year)
- 2024: $1,114,943 (+$79,864, +7.72% from previous year)
- 2025: $1,171,401 (+$56,458, +5.06% from previous year)
Vienna has posted an 82% increase in home values since 2010. Despite a minor setback in 2023, the market rebounded quickly. With average home values now above $1.17 million, Vienna continues to be one of Northern Virginia’s most consistently desirable places to live.
Vienna – Prime Location With Strong Local Appeal
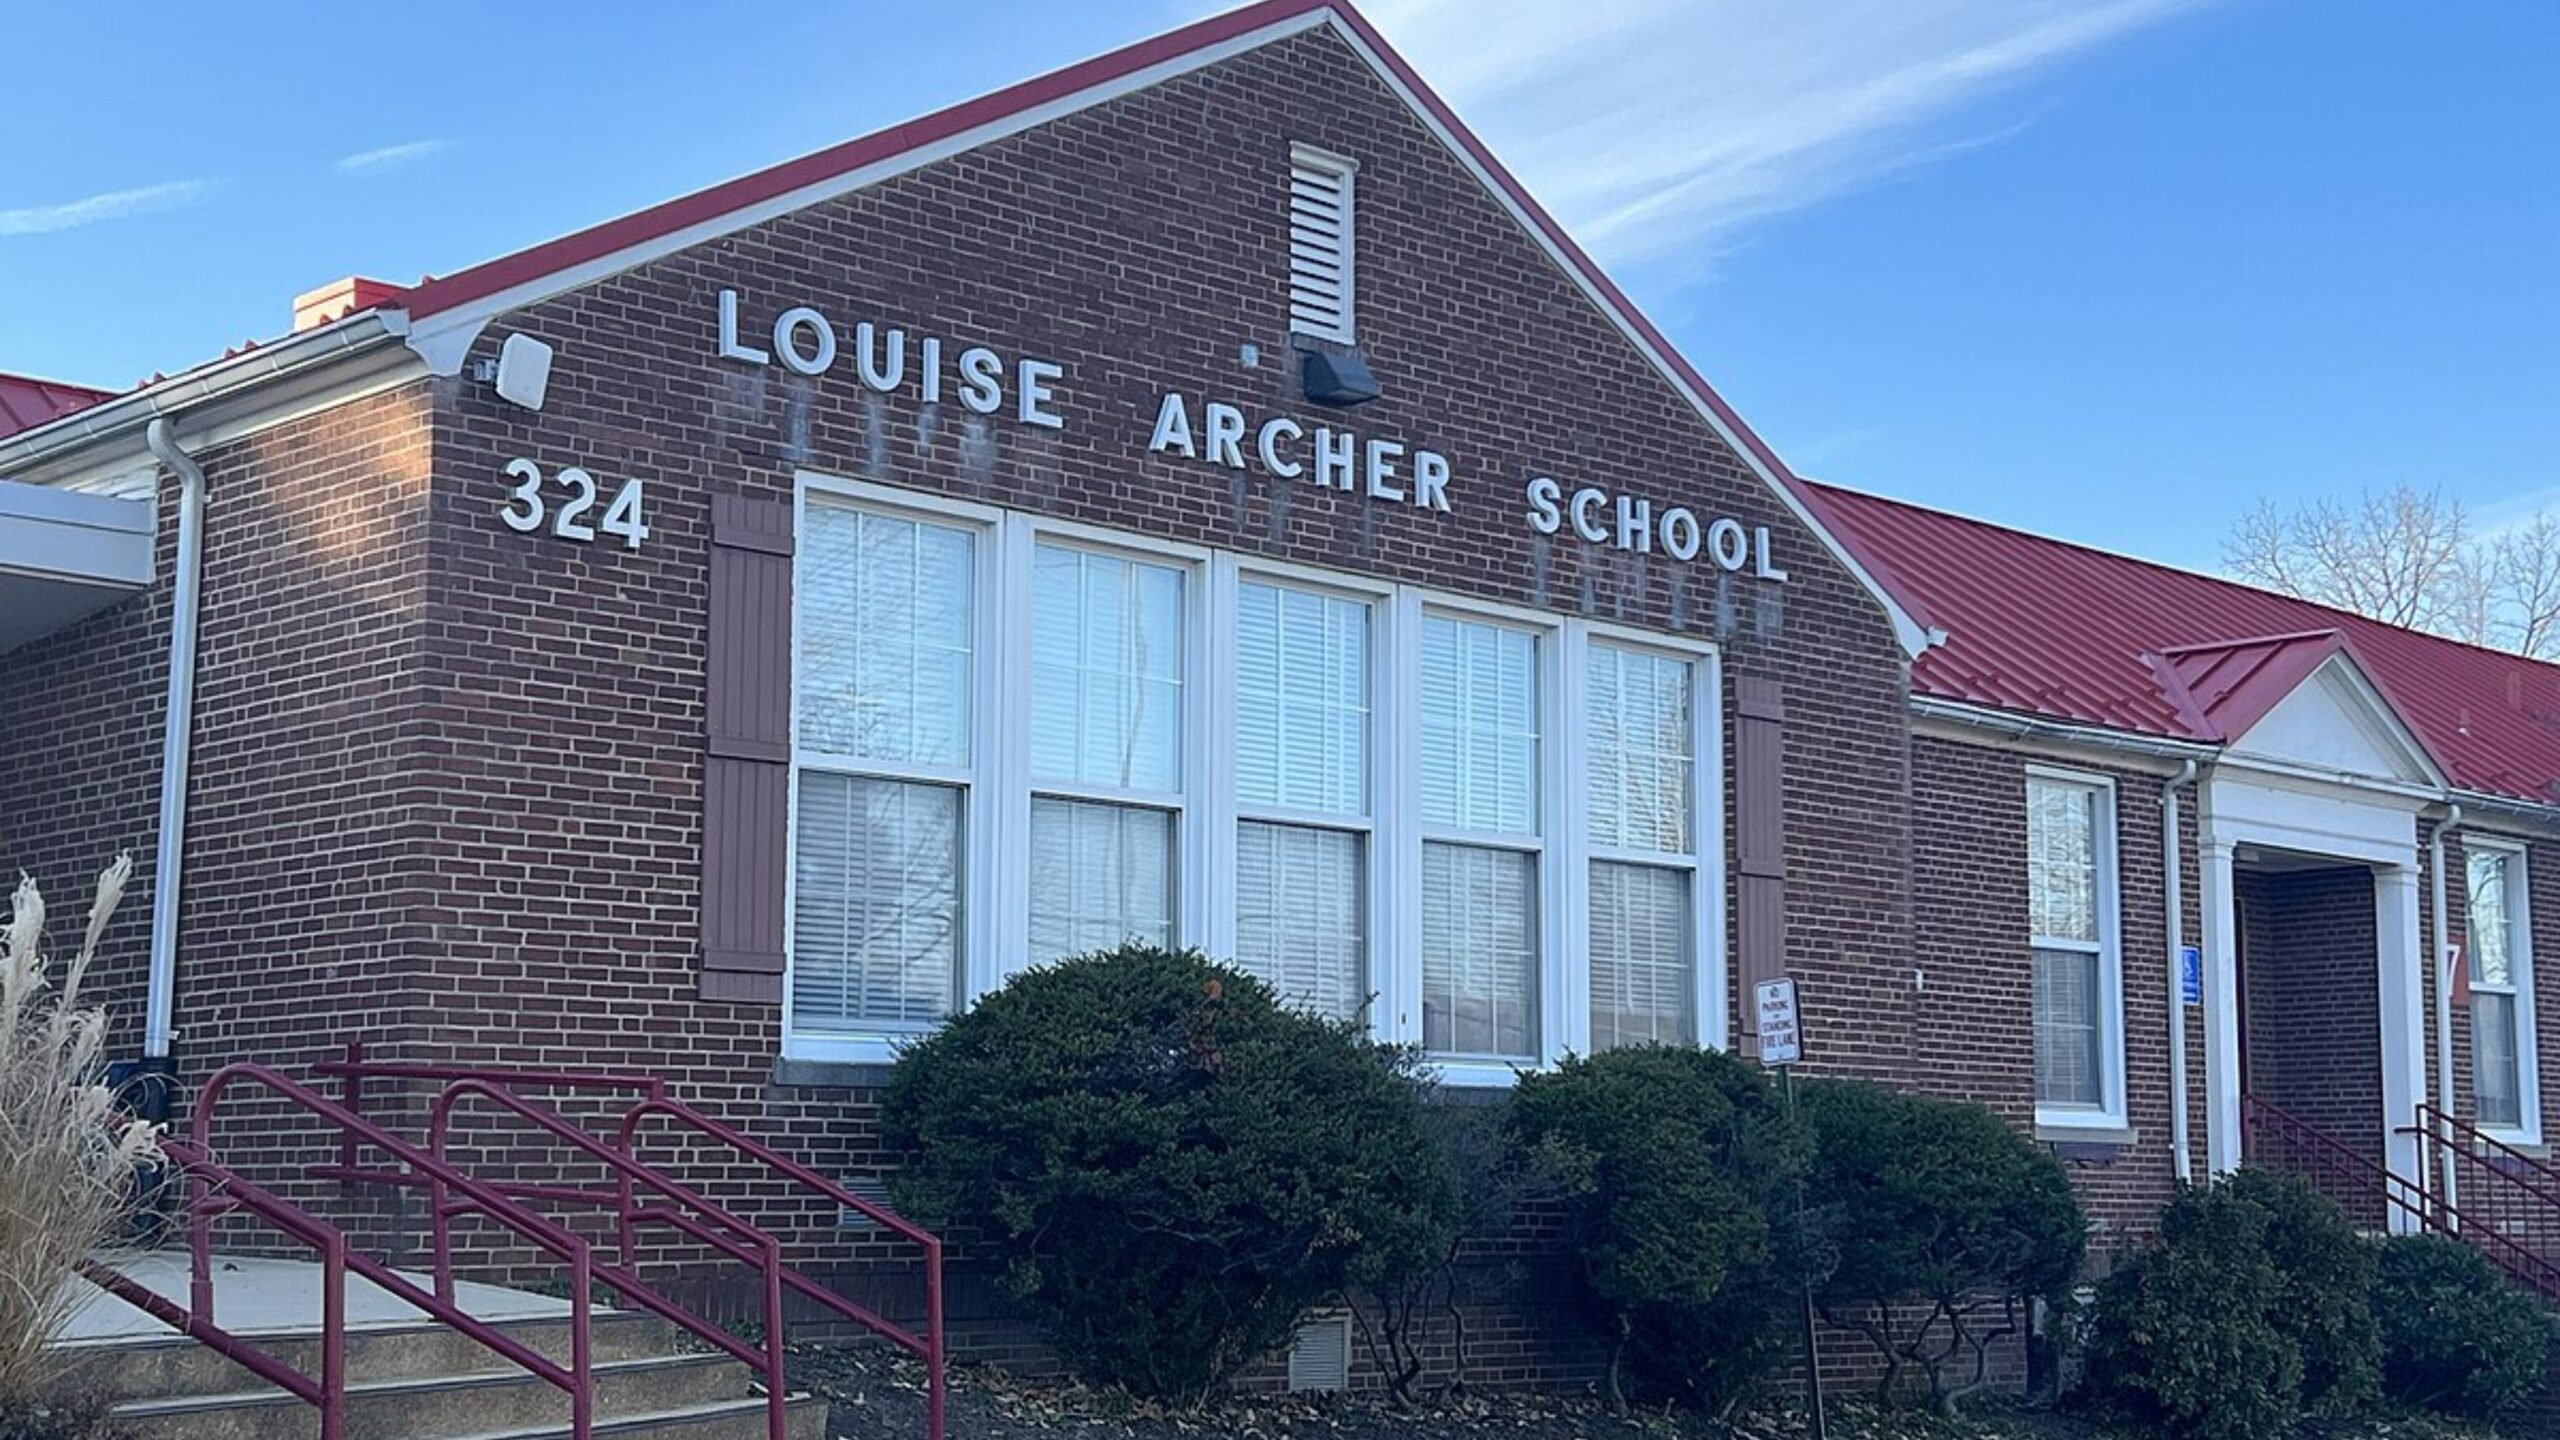
Vienna offers the perfect blend of suburban charm and urban accessibility. Located along the Metro’s Orange Line and close to Tysons Corner, it has long attracted families and professionals alike. The town features a walkable downtown, trails, and excellent schools.
Recent price jumps, particularly between 2020 and 2022, reflect growing demand for single-family homes in well-established communities. Vienna’s mix of older properties and high-end new builds makes it a dynamic market where buyers are willing to pay a premium for convenience and livability.
4. Dunn Loring – 91.59% Home Price Increase Since 2010
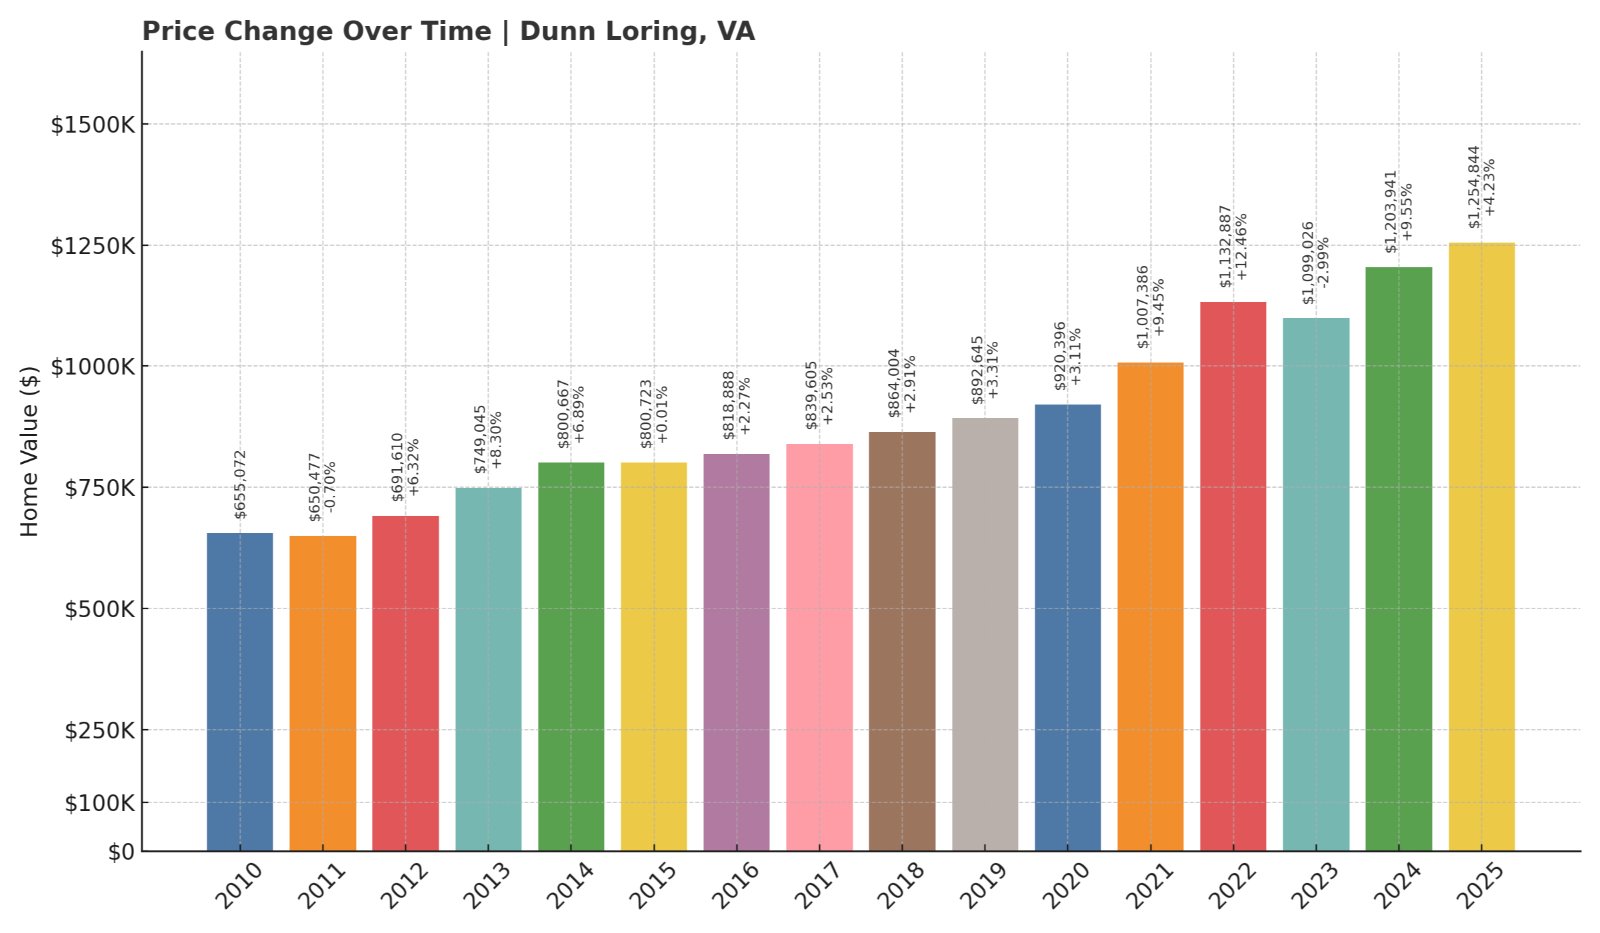
- 2010: $655,072
- 2011: $650,477 (-$4,595, -0.70% from previous year)
- 2012: $691,610 (+$41,133, +6.32% from previous year)
- 2013: $749,045 (+$57,435, +8.30% from previous year)
- 2014: $800,667 (+$51,621, +6.89% from previous year)
- 2015: $800,723 (+$56, +0.01% from previous year)
- 2016: $818,888 (+$18,166, +2.27% from previous year)
- 2017: $839,605 (+$20,717, +2.53% from previous year)
- 2018: $864,004 (+$24,399, +2.91% from previous year)
- 2019: $892,645 (+$28,641, +3.31% from previous year)
- 2020: $920,396 (+$27,752, +3.11% from previous year)
- 2021: $1,007,386 (+$86,990, +9.45% from previous year)
- 2022: $1,132,887 (+$125,501, +12.46% from previous year)
- 2023: $1,099,026 (-$33,861, -2.99% from previous year)
- 2024: $1,203,941 (+$104,915, +9.55% from previous year)
- 2025: $1,254,844 (+$50,903, +4.23% from previous year)
Home prices in Dunn Loring have risen more than 91% since 2010, with strong annual gains and only minor declines. Prices soared past the $1.25 million mark in 2025, fueled by sustained interest and premium location.
Dunn Loring – Quiet Neighborhood in the Heart of It All
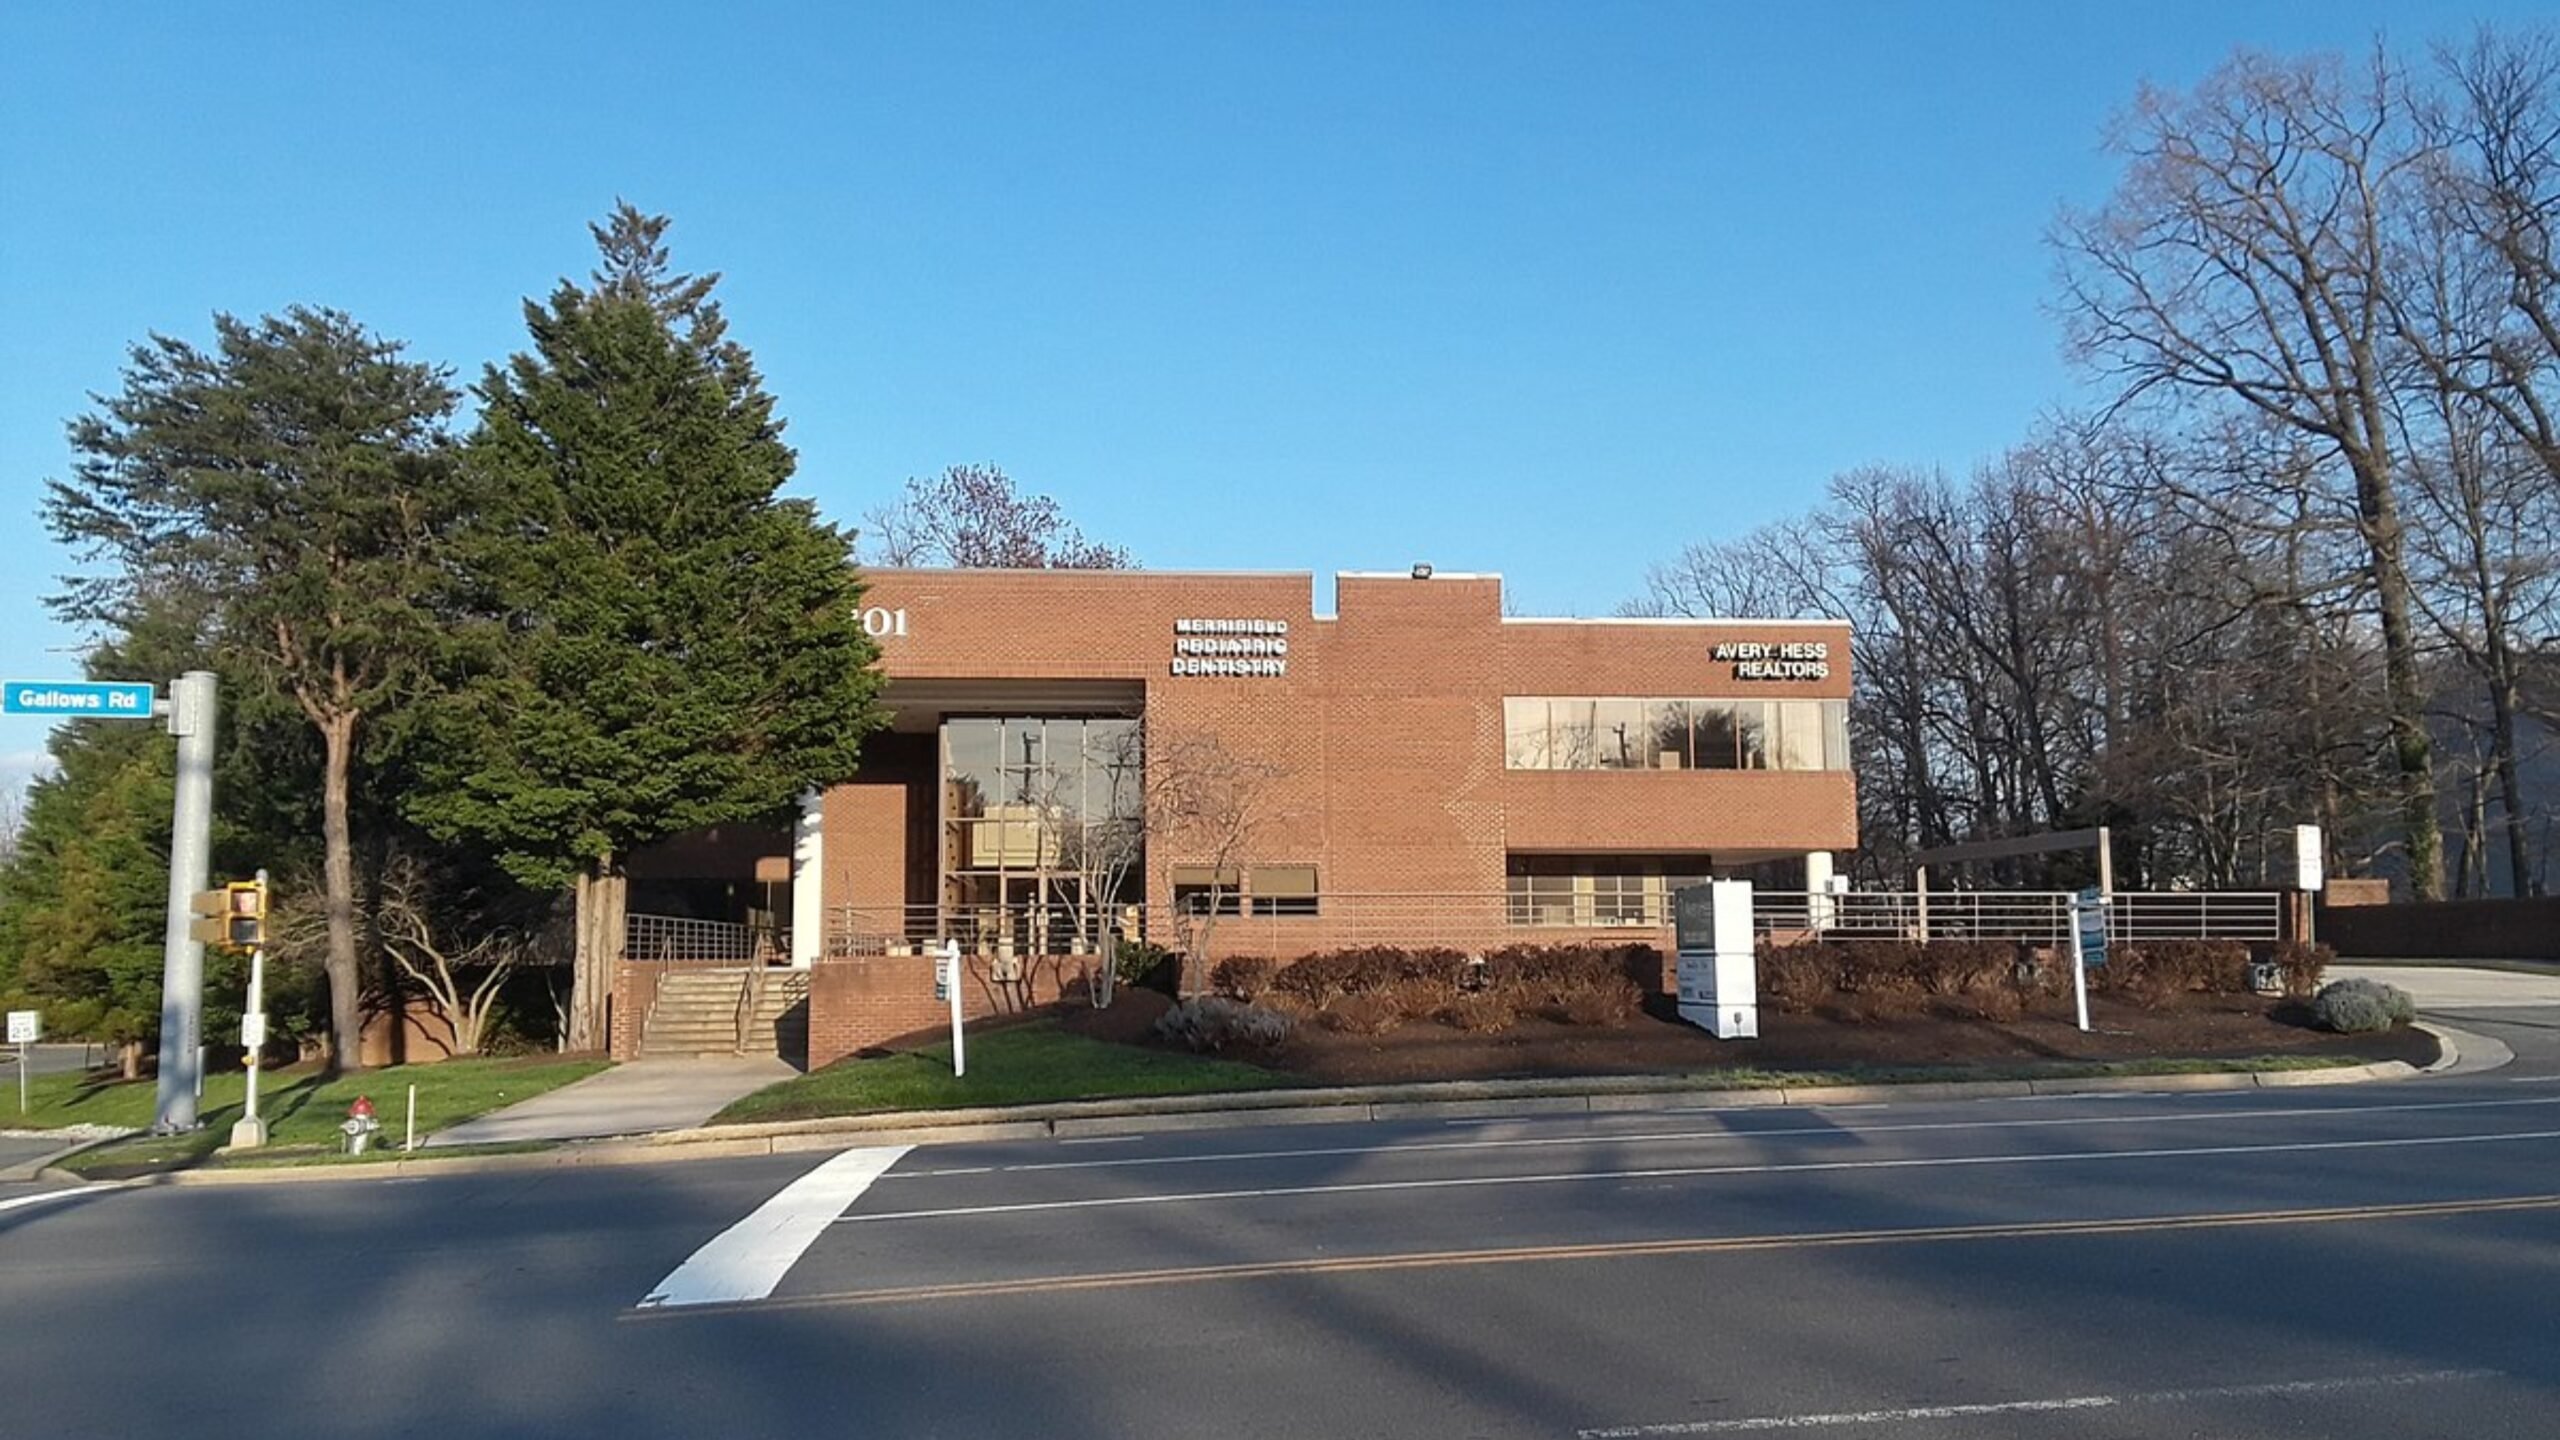
Dunn Loring is a small but strategic community in Fairfax County, bordered by Vienna, Tysons, and Merrifield. It boasts excellent Metro access, newer homes, and proximity to shopping, dining, and major employers.
The area’s housing market benefits from both convenience and quality. Its compact size limits inventory, which keeps prices high. Buyers looking for a high-end suburban lifestyle close to urban hubs continue to see Dunn Loring as a smart — and expensive — choice.
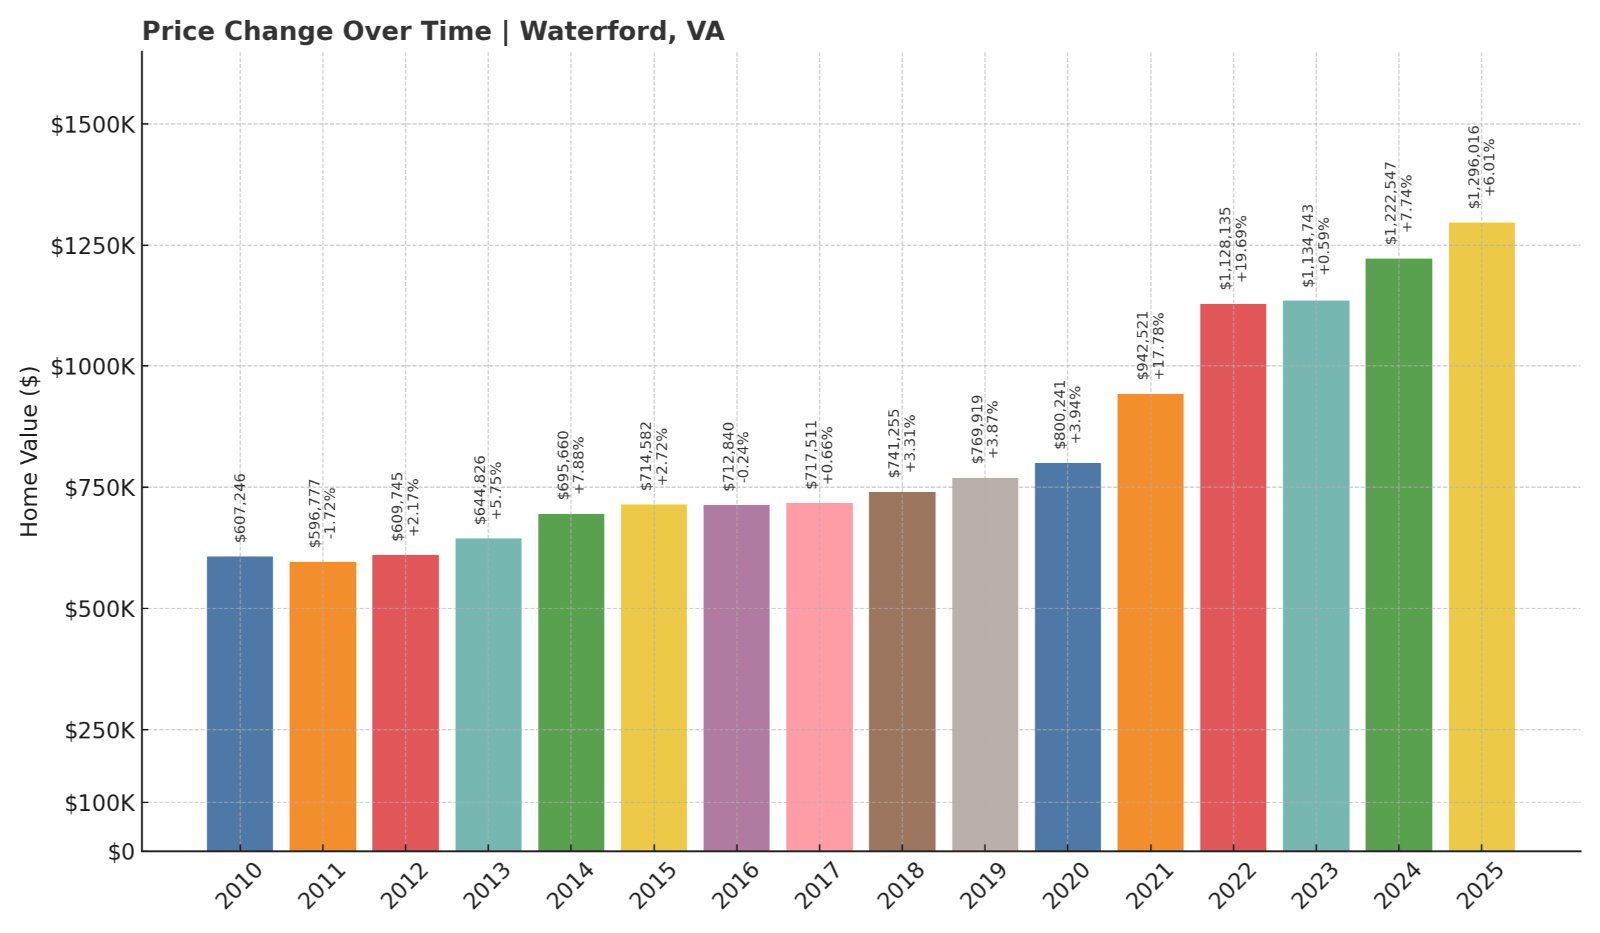
3. Waterford – 113.44% Home Price Increase Since 2010
🔥 Would you like to save this?
- 2010: $607,246
- 2011: $596,777 (-$10,468, -1.72% from previous year)
- 2012: $609,745 (+$12,967, +2.17% from previous year)
- 2013: $644,826 (+$35,082, +5.75% from previous year)
- 2014: $695,660 (+$50,834, +7.88% from previous year)
- 2015: $714,582 (+$18,922, +2.72% from previous year)
- 2016: $712,840 (-$1,742, -0.24% from previous year)
- 2017: $717,511 (+$4,671, +0.66% from previous year)
- 2018: $741,255 (+$23,744, +3.31% from previous year)
- 2019: $769,919 (+$28,664, +3.87% from previous year)
- 2020: $800,241 (+$30,321, +3.94% from previous year)
- 2021: $942,521 (+$142,280, +17.78% from previous year)
- 2022: $1,128,135 (+$185,614, +19.69% from previous year)
- 2023: $1,134,743 (+$6,608, +0.59% from previous year)
- 2024: $1,222,547 (+$87,804, +7.74% from previous year)
- 2025: $1,296,016 (+$73,469, +6.01% from previous year)
Waterford’s home prices have surged over 113% since 2010. The town saw particularly sharp growth between 2020 and 2022, with continued gains through 2025. With average home prices near $1.3 million, Waterford is one of the most expensive places to buy in the state.
Waterford – Historic Preservation Meets Luxury Living
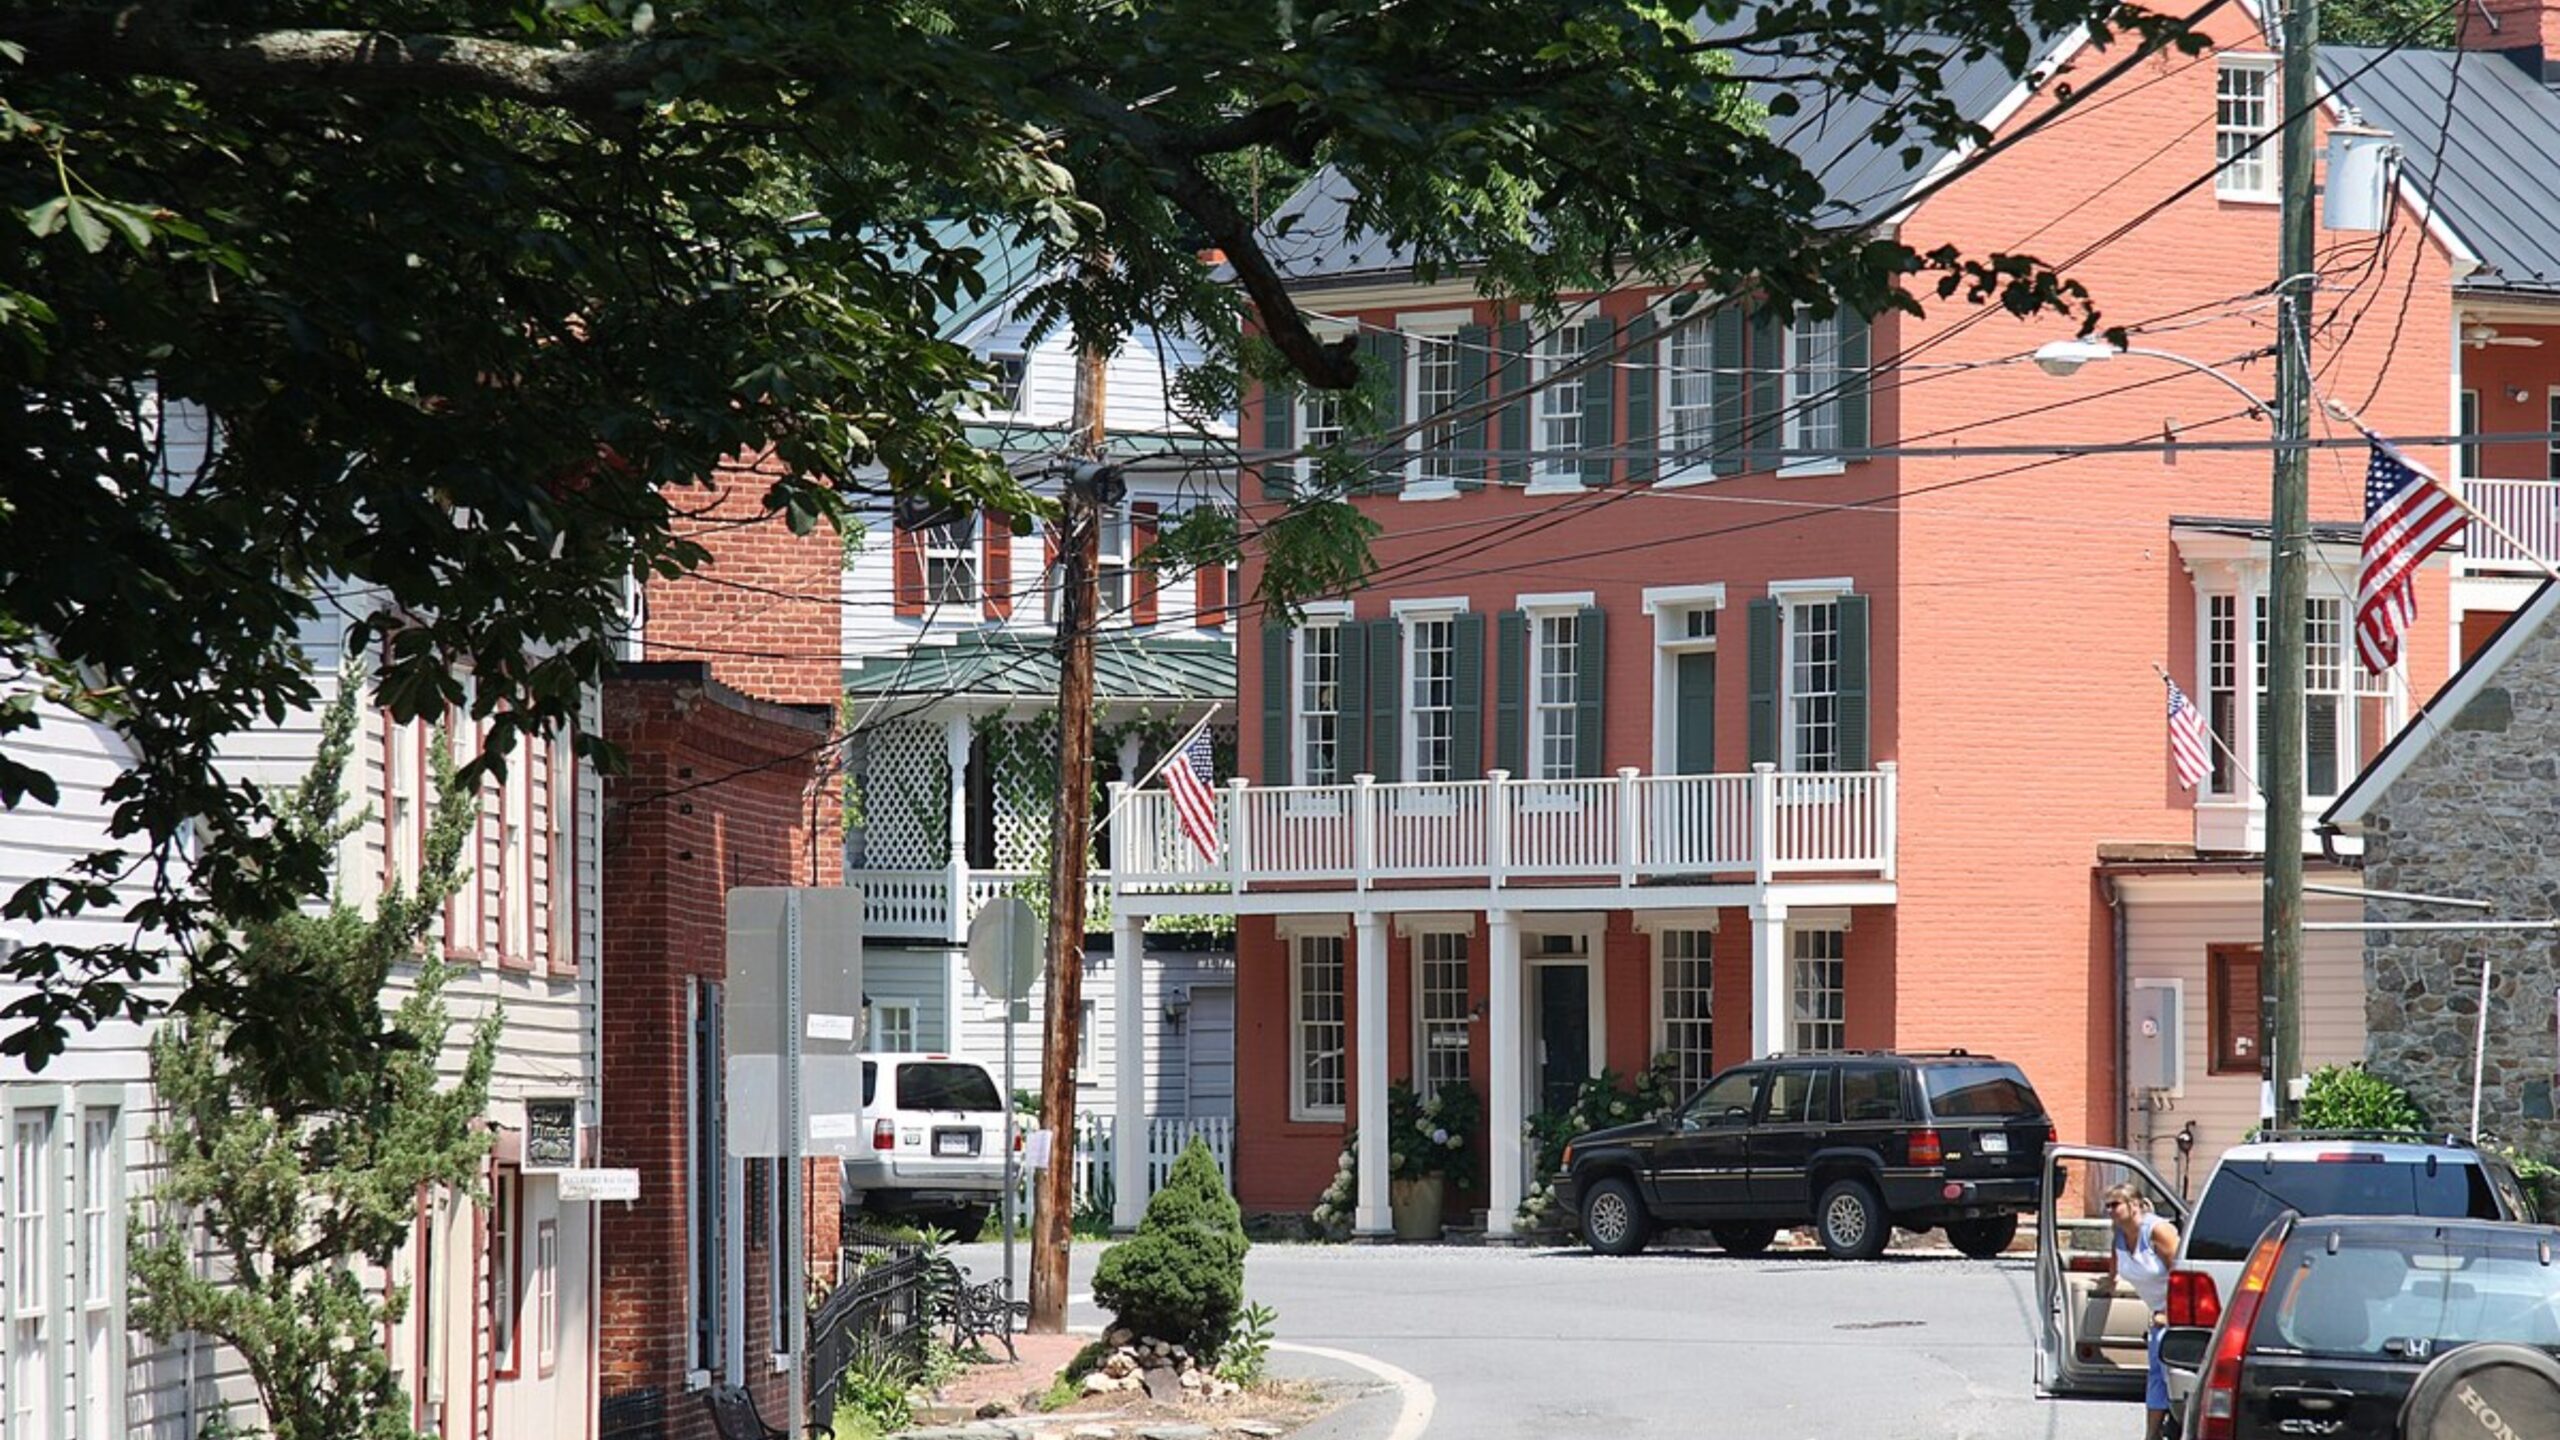
Waterford is a National Historic Landmark village in Loudoun County, renowned for its stone houses, colonial charm, and strict zoning laws that protect its rural character. Its appeal lies in a rare mix of heritage and exclusivity, just an hour from Washington, D.C.
Real estate here is extremely limited, and demand has only grown in recent years. The town’s popularity among heritage-minded buyers and those seeking rural prestige contributes to rising prices. Waterford remains a high-end enclave where history and wealth intersect.
2. McLean – 79.13% Home Price Increase Since 2010
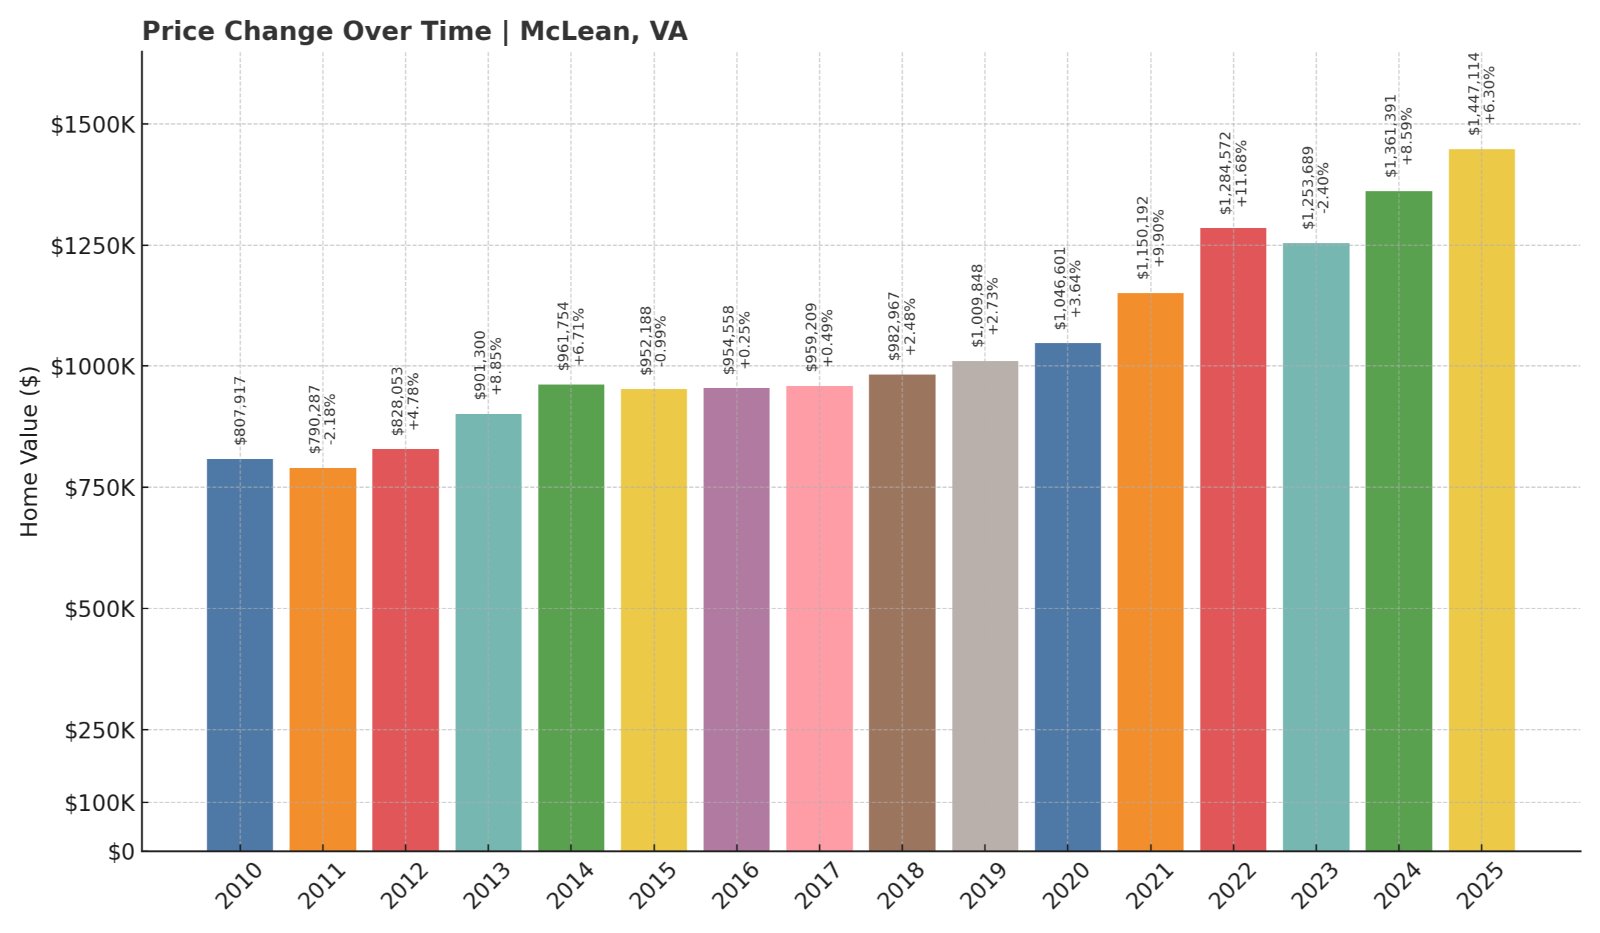
- 2010: $807,917
- 2011: $790,287 (-$17,629, -2.18% from previous year)
- 2012: $828,053 (+$37,766, +4.78% from previous year)
- 2013: $901,300 (+$73,247, +8.85% from previous year)
- 2014: $961,754 (+$60,454, +6.71% from previous year)
- 2015: $952,188 (-$9,566, -0.99% from previous year)
- 2016: $954,558 (+$2,370, +0.25% from previous year)
- 2017: $959,209 (+$4,651, +0.49% from previous year)
- 2018: $982,967 (+$23,758, +2.48% from previous year)
- 2019: $1,009,848 (+$26,882, +2.73% from previous year)
- 2020: $1,046,601 (+$36,753, +3.64% from previous year)
- 2021: $1,150,192 (+$103,591, +9.90% from previous year)
- 2022: $1,284,572 (+$134,380, +11.68% from previous year)
- 2023: $1,253,689 (-$30,883, -2.40% from previous year)
- 2024: $1,361,391 (+$107,702, +8.59% from previous year)
- 2025: $1,447,114 (+$85,724, +6.30% from previous year)
McLean’s home prices have climbed more than 79% since 2010. While price increases have varied slightly year to year, the overall trajectory has been sharply upward. With 2025 values near $1.45 million, McLean ranks among the state’s most elite markets.
McLean – Northern Virginia’s Premier Luxury Market
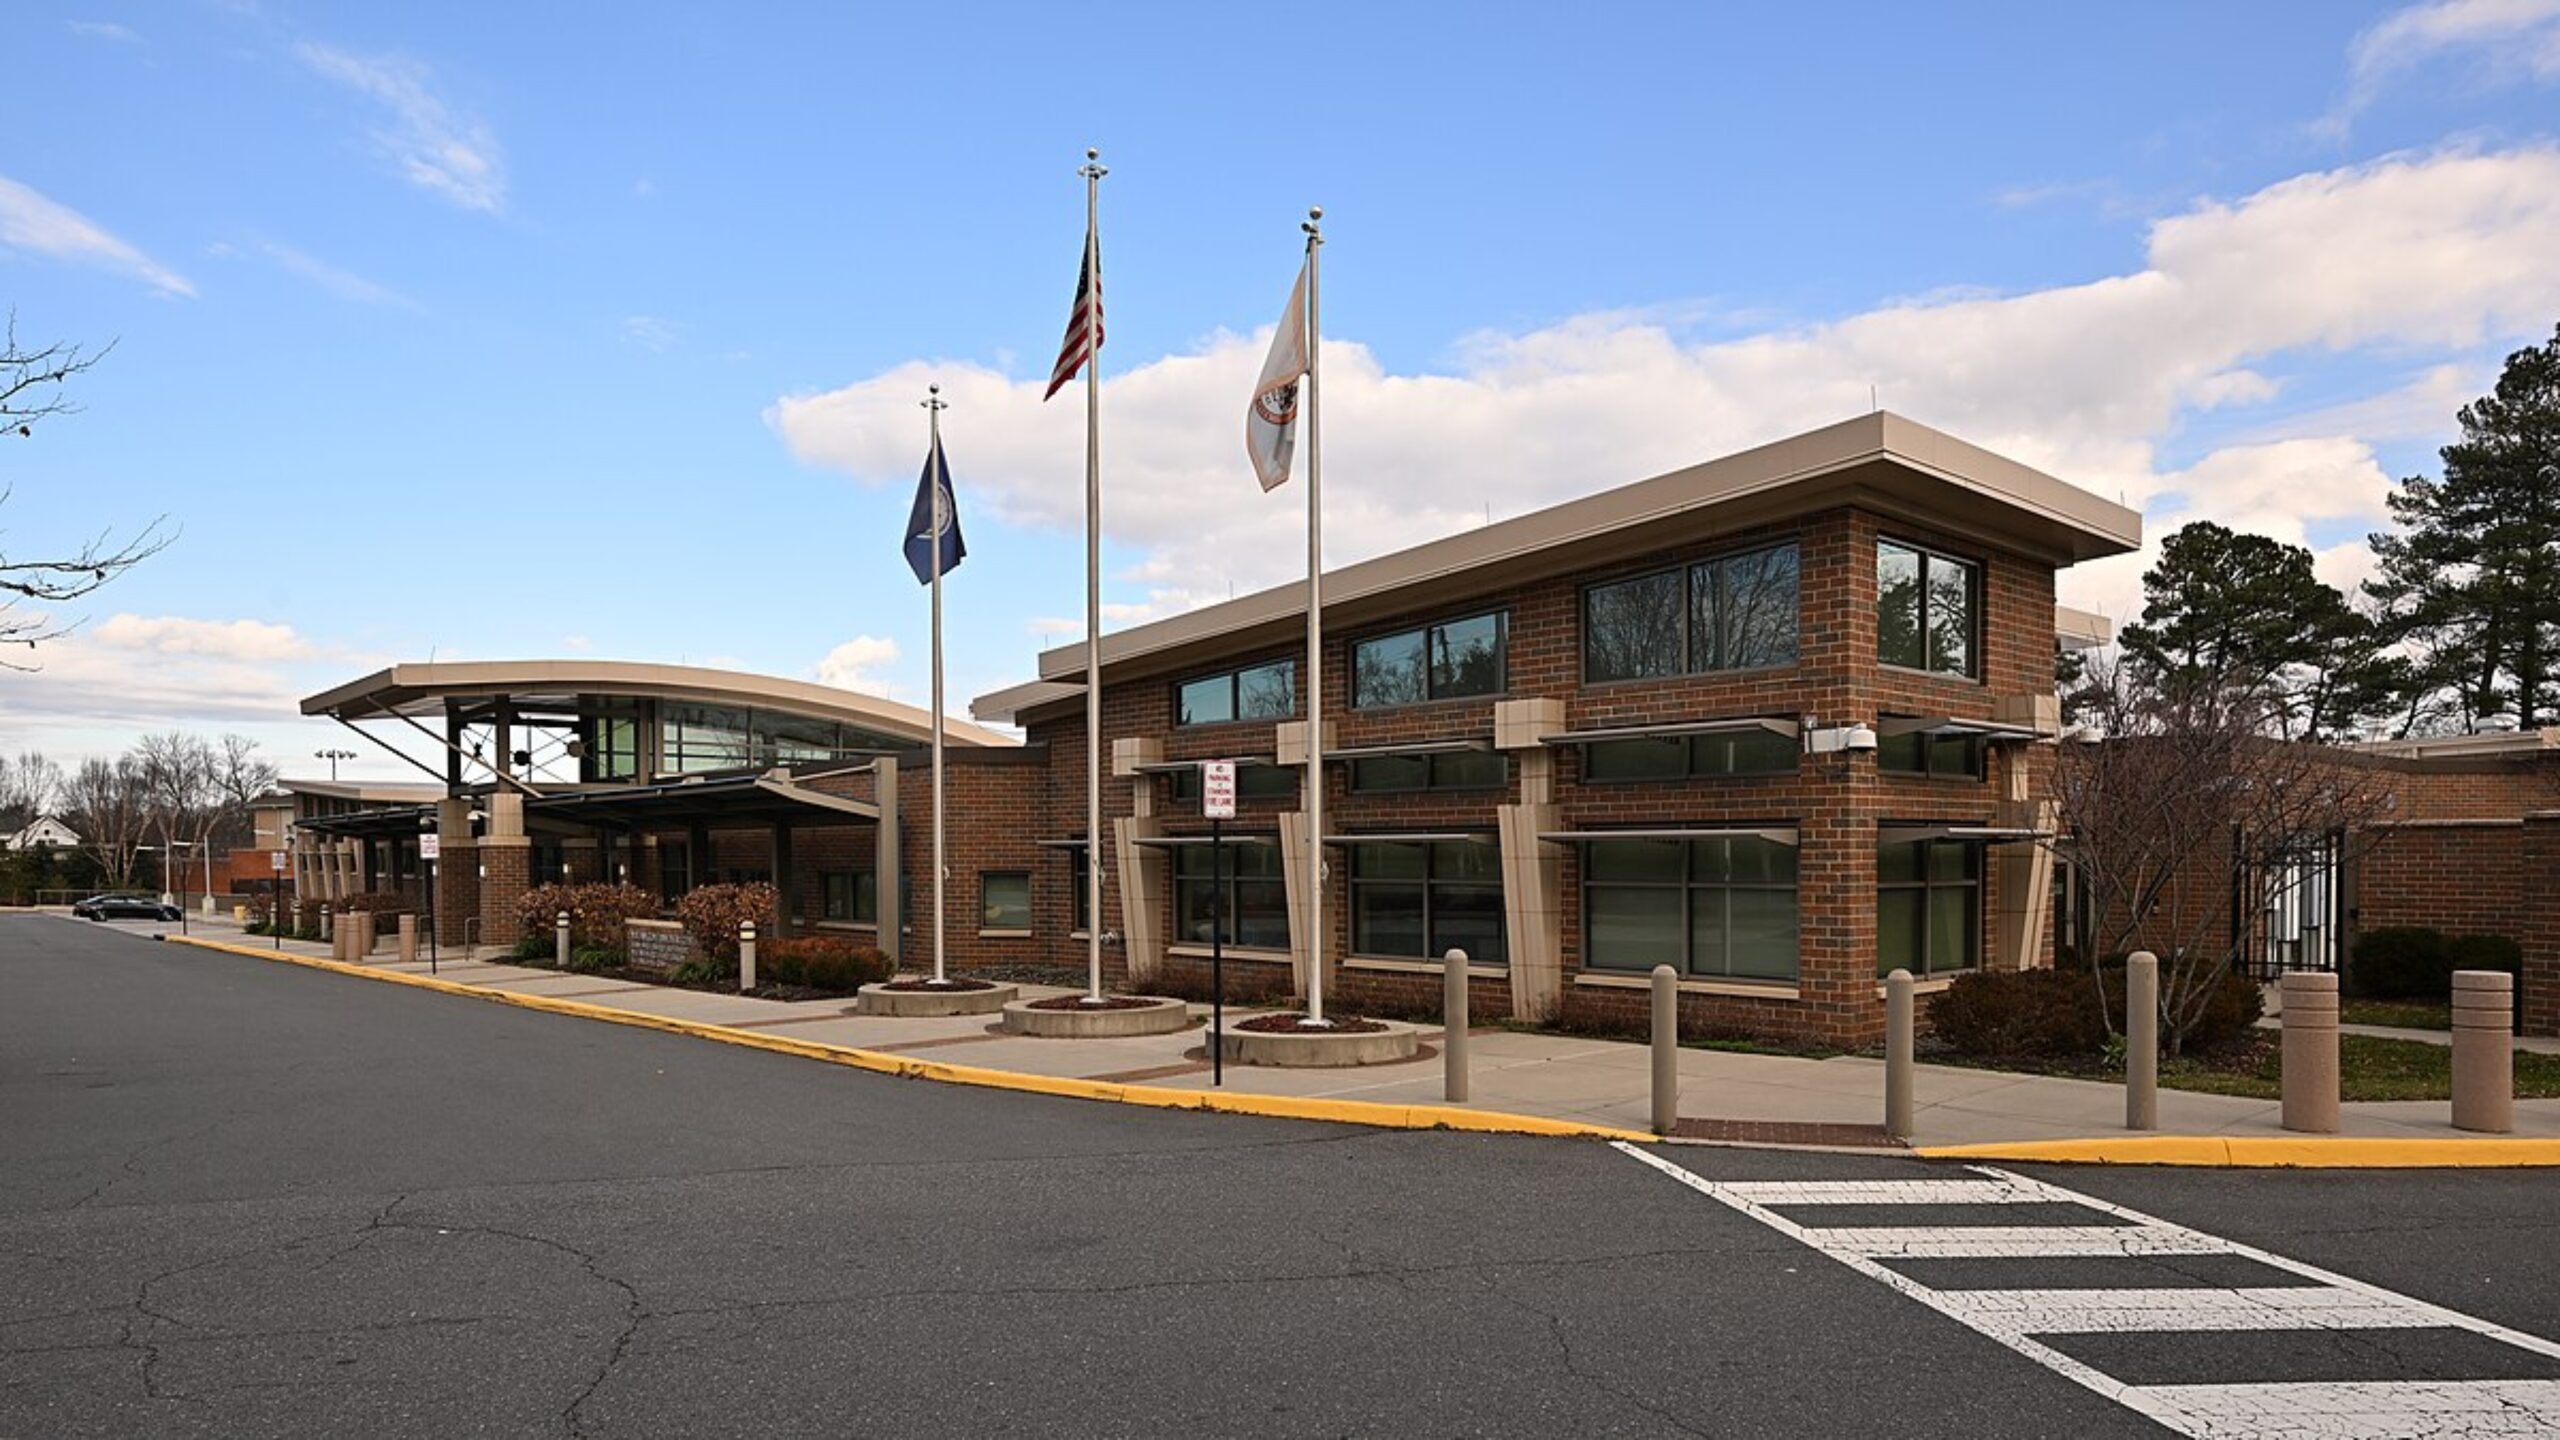
McLean is synonymous with affluence. Situated just across the Potomac from D.C., it’s home to diplomats, CEOs, and political figures. McLean combines stately homes with top-tier schools, boutique shopping, and proximity to Tysons Corner and national power centers.
Large estates, gated communities, and new luxury builds all keep McLean’s housing market red-hot. The sharp jumps in price from 2020 onward suggest sustained demand for exclusive real estate with prime access to Washington’s institutions and amenities.
1. Great Falls – 74.32% Home Price Increase Since 2010
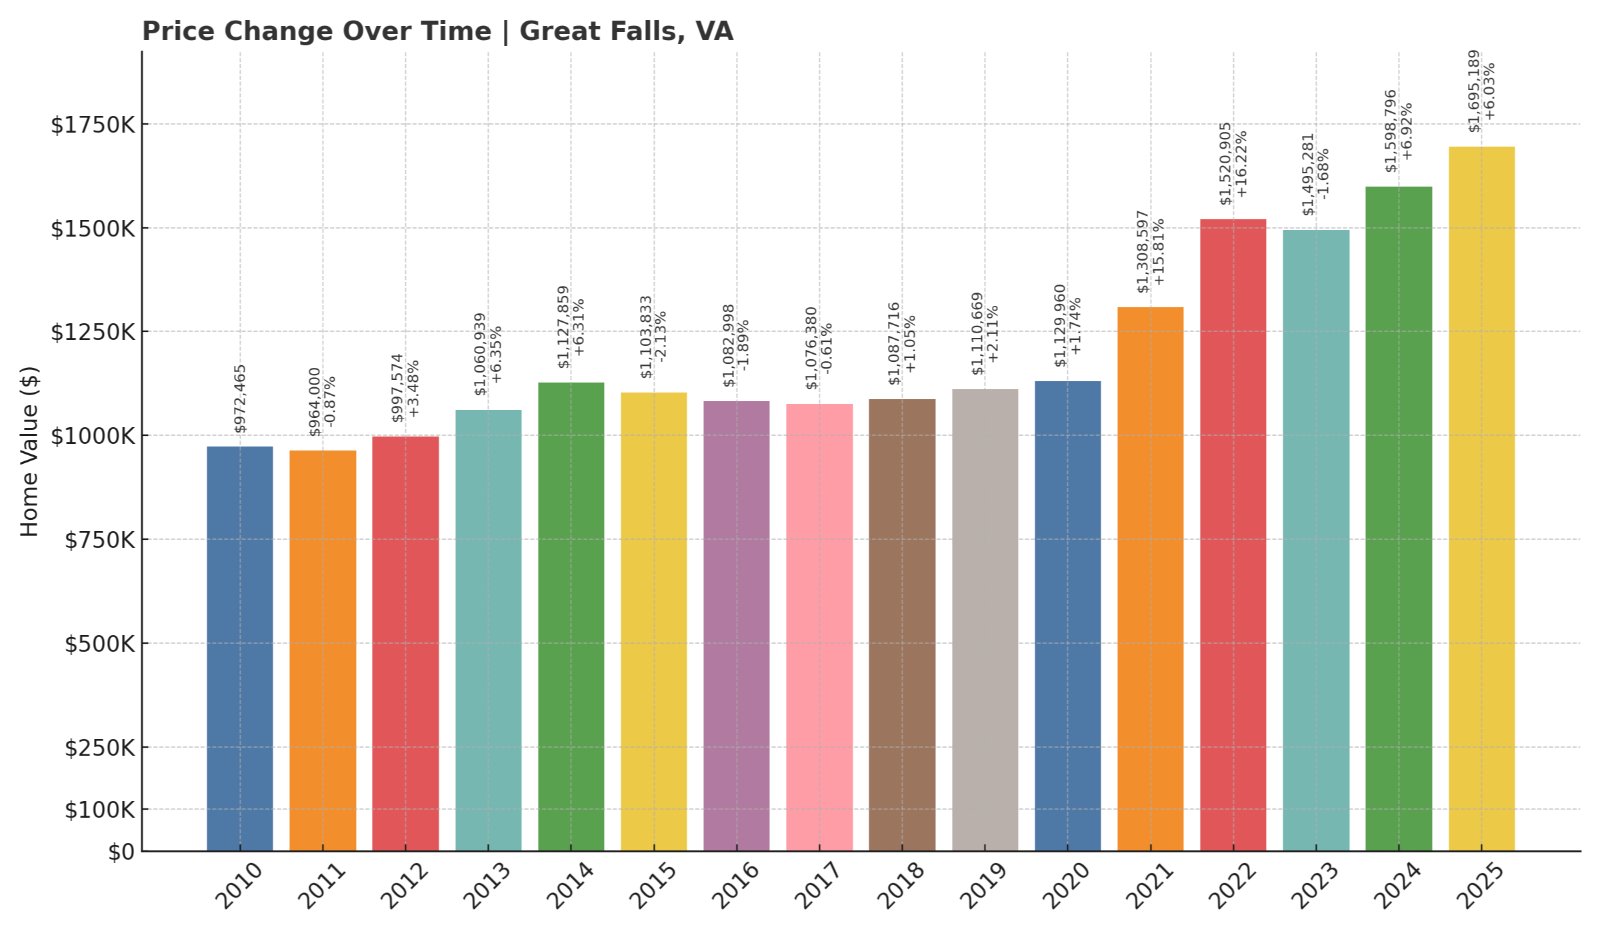
- 2010: $972,465
- 2011: $964,000 (-$8,465, -0.87% from previous year)
- 2012: $997,574 (+$33,574, +3.48% from previous year)
- 2013: $1,060,939 (+$63,365, +6.35% from previous year)
- 2014: $1,127,859 (+$66,920, +6.31% from previous year)
- 2015: $1,103,833 (-$24,026, -2.13% from previous year)
- 2016: $1,082,998 (-$20,834, -1.89% from previous year)
- 2017: $1,076,380 (-$6,618, -0.61% from previous year)
- 2018: $1,087,716 (+$11,336, +1.05% from previous year)
- 2019: $1,110,669 (+$22,953, +2.11% from previous year)
- 2020: $1,129,960 (+$19,291, +1.74% from previous year)
- 2021: $1,308,597 (+$178,637, +15.81% from previous year)
- 2022: $1,520,905 (+$212,308, +16.22% from previous year)
- 2023: $1,495,281 (-$25,624, -1.68% from previous year)
- 2024: $1,598,796 (+$103,515, +6.92% from previous year)
- 2025: $1,695,189 (+$96,392, +6.03% from previous year)
Great Falls tops the list with average home prices approaching $1.7 million in 2025 — a 74% increase from 2010. While some years have seen flat or negative growth, the general trend is steadily upward, especially in the past five years.
Great Falls – Virginia’s Most Expensive Place to Call Home
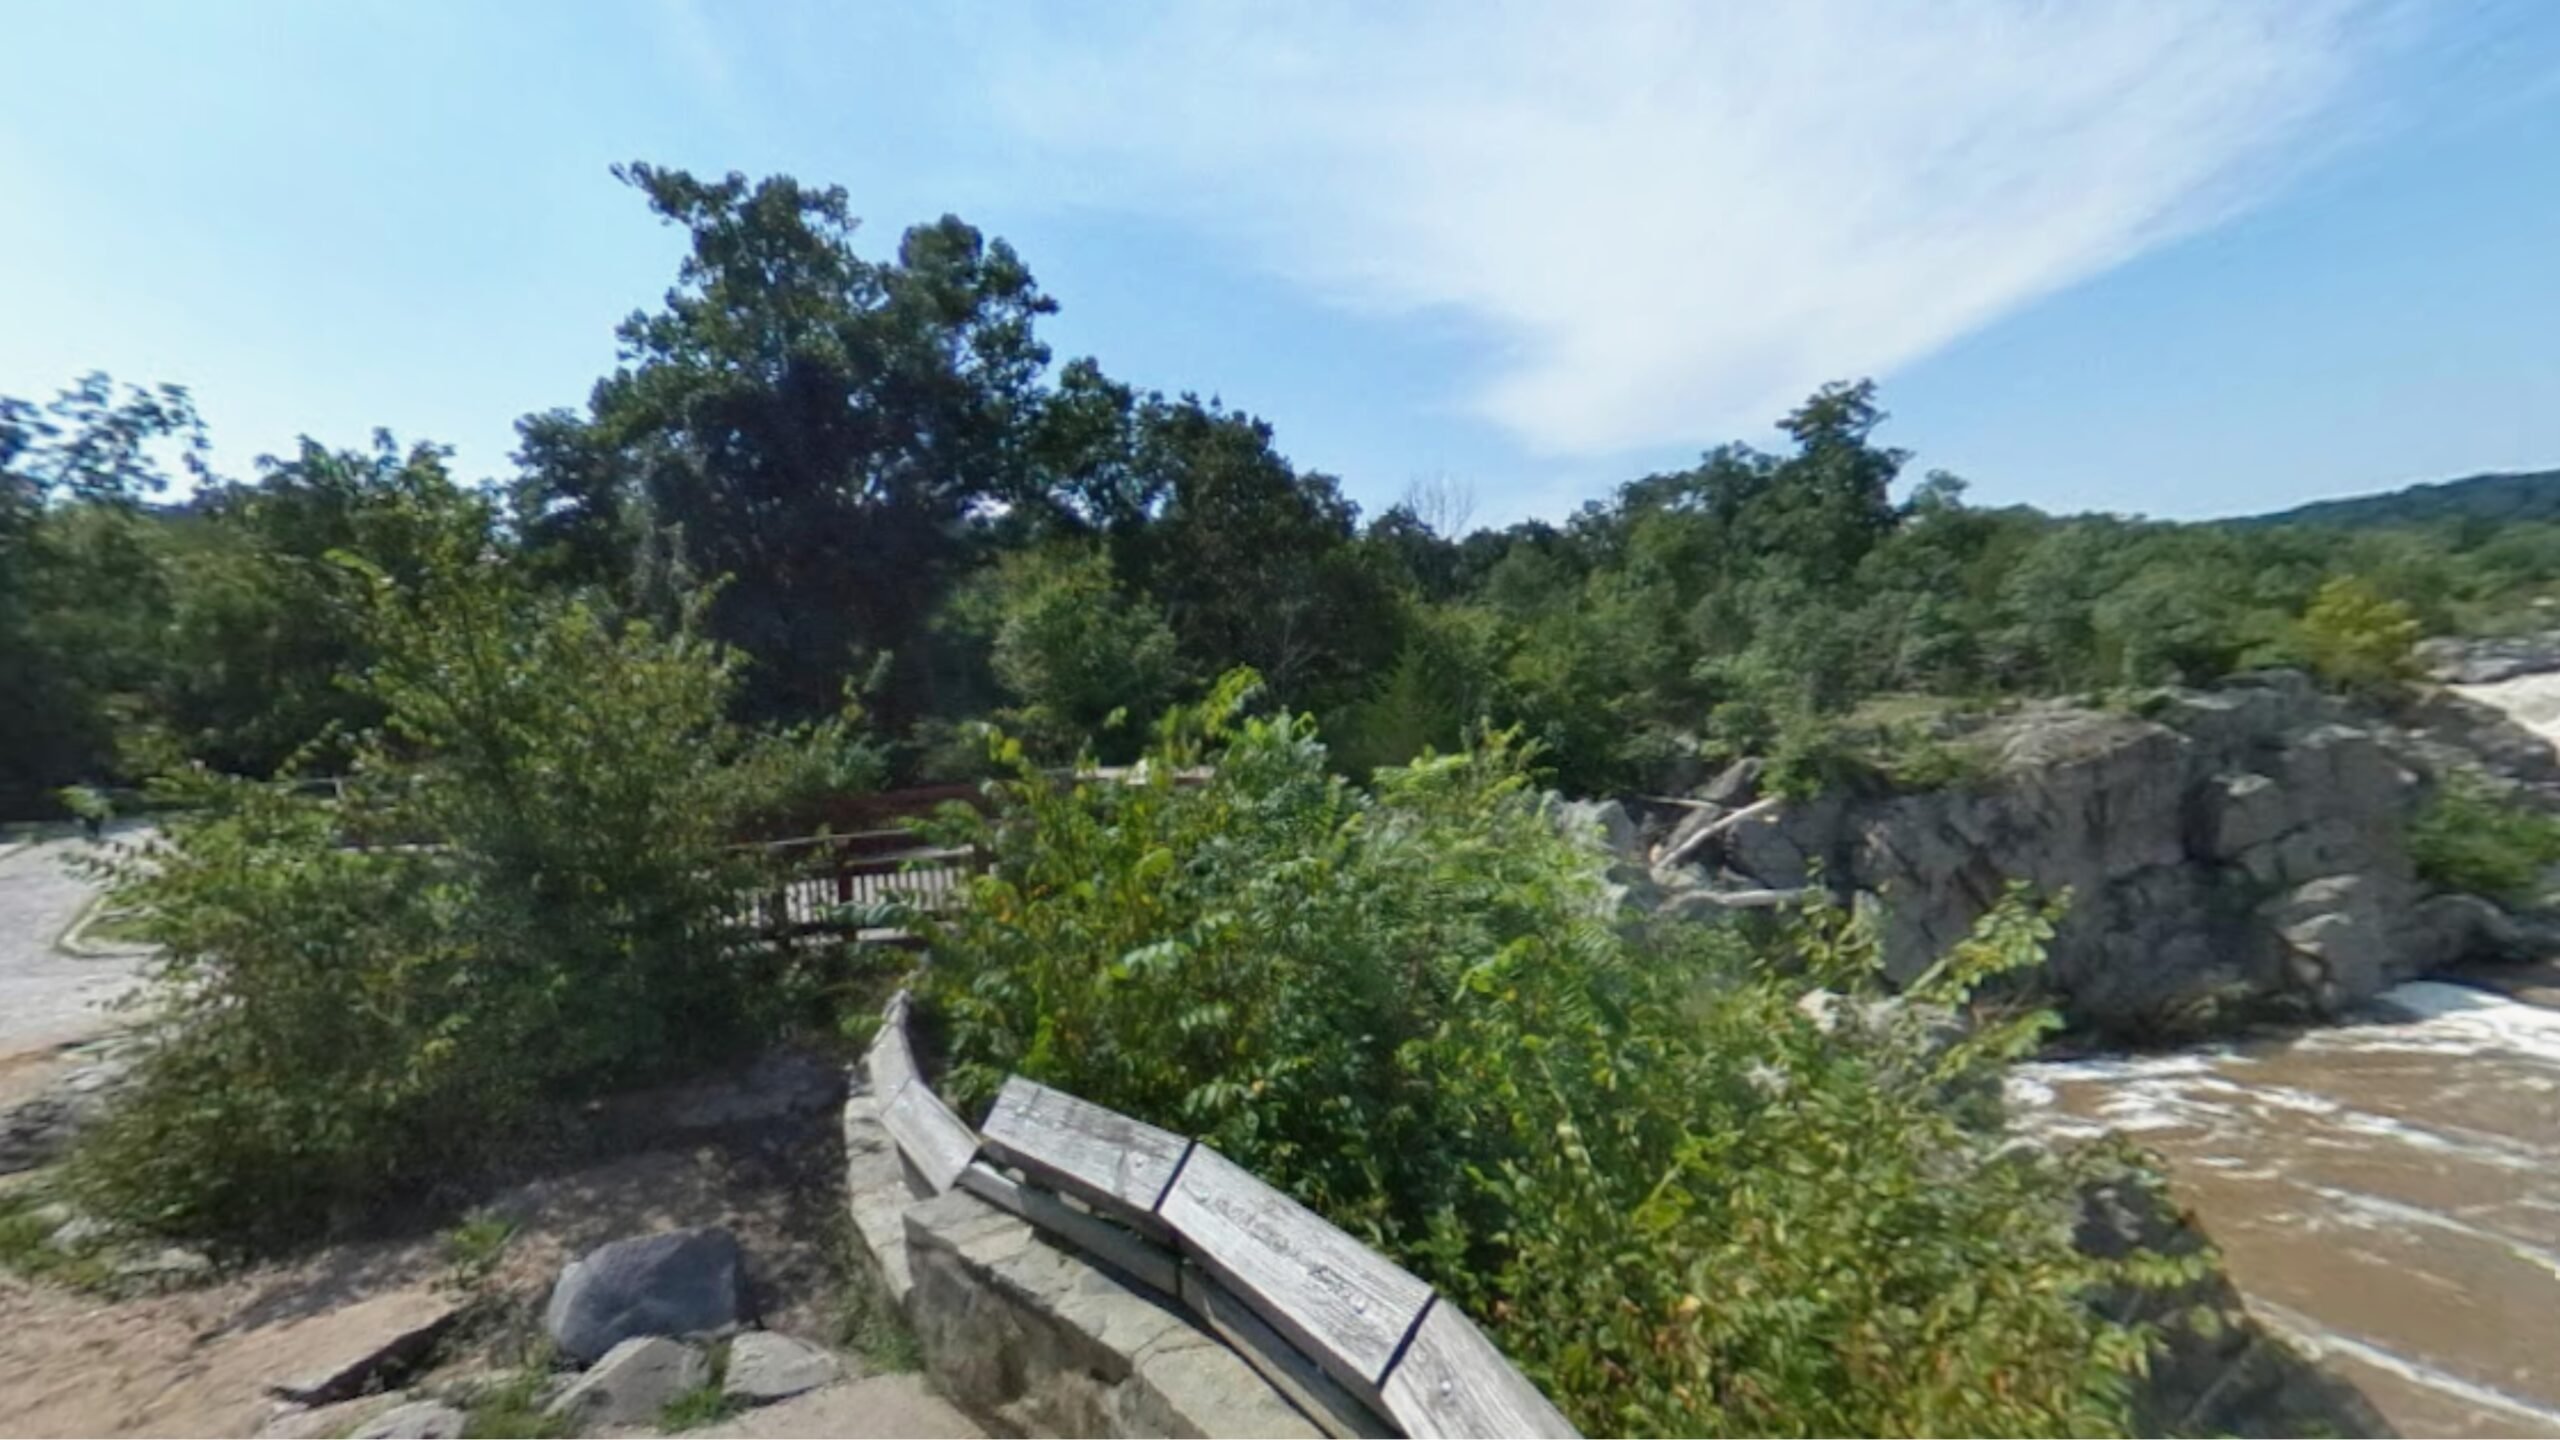
Located along the Potomac River in Fairfax County, Great Falls is known for its grand estates, private drives, and wooded seclusion. The area offers luxury without the density of urban living — a draw for high-net-worth individuals seeking peace within commuting distance to D.C.
Great Falls commands some of the highest real estate prices in the state, thanks to low housing density, scenic surroundings, and prestigious addresses. Recent growth reflects demand for privacy, acreage, and high-end construction — a combination few places can match.