🔥 Would you like to save this?
Massachusetts’ luxury housing scene isn’t just expensive—it’s thriving. According to the latest Zillow Home Value Index, elite towns like Newton, Wellesley, and Edgartown continue to command top dollar in 2025, and in most cases, they earn it. Even with some cooling after record highs in 2022 and 2023, demand remains strong and supply remains tight, keeping prices elevated. These 19 towns blend prestige, prime locations, and lasting value—whether it’s walkable streets in Boston’s wealthiest suburbs or sweeping views from the Cape and Islands. In each one, the price tag comes with serious perks.
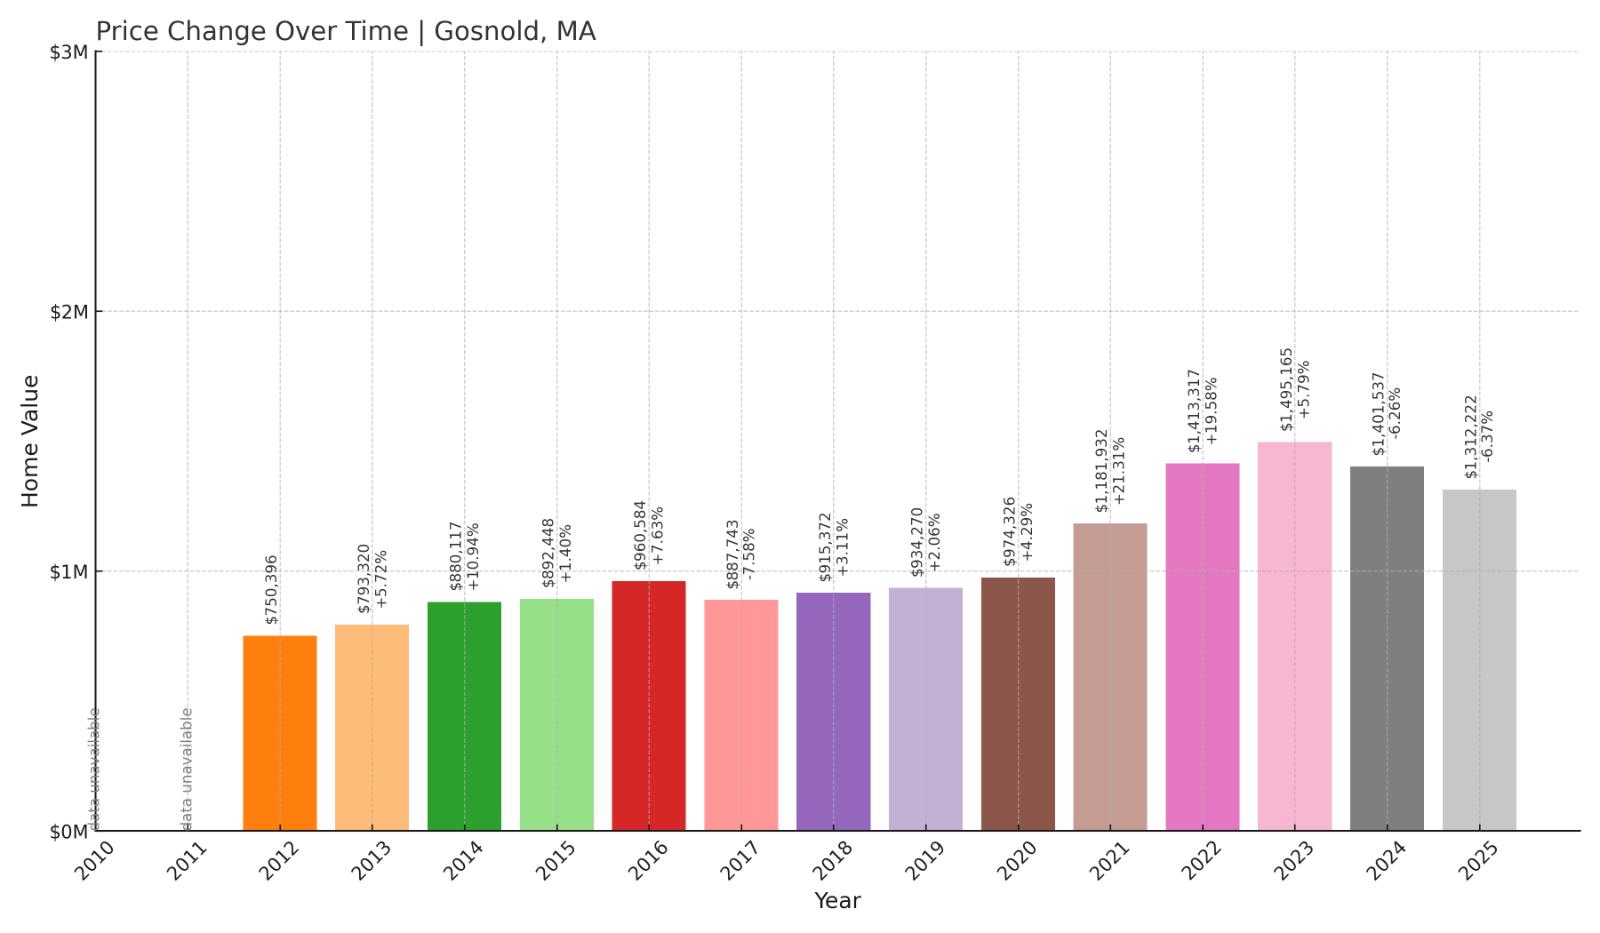
19. Gosnold – 75% Home Price Increase Since 2012
- 2010: N/A
- 2011: N/A
- 2012: $750,396
- 2013: $793,320 (+$42,924, +5.72% from previous year)
- 2014: $880,117 (+$86,797, +10.94% from previous year)
- 2015: $892,448 (+$12,331, +1.40% from previous year)
- 2016: $960,584 (+$68,136, +7.63% from previous year)
- 2017: $887,743 ($-72,841, -7.58% from previous year)
- 2018: $915,372 (+$27,629, +3.11% from previous year)
- 2019: $934,270 (+$18,898, +2.06% from previous year)
- 2020: $974,326 (+$40,056, +4.29% from previous year)
- 2021: $1,181,932 (+$207,606, +21.31% from previous year)
- 2022: $1,413,317 (+$231,385, +19.58% from previous year)
- 2023: $1,495,165 (+$81,848, +5.79% from previous year)
- 2024: $1,401,537 ($-93,628, -6.26% from previous year)
- 2025: $1,312,222 ($-89,315, -6.37% from previous year)
Gosnold’s home prices have climbed dramatically since 2012, increasing by 75% over the period despite recent declines. The town peaked in 2023 at nearly $1.5 million, then dipped two years in a row. The sharp appreciation during the pandemic years contributed significantly to its current average price of $1.31 million in 2025.
In order to come up with the very specific design ideas, we create most designs with the assistance of state-of-the-art AI interior design software.
Gosnold – Remote, Exclusive, and Rapidly Shifting
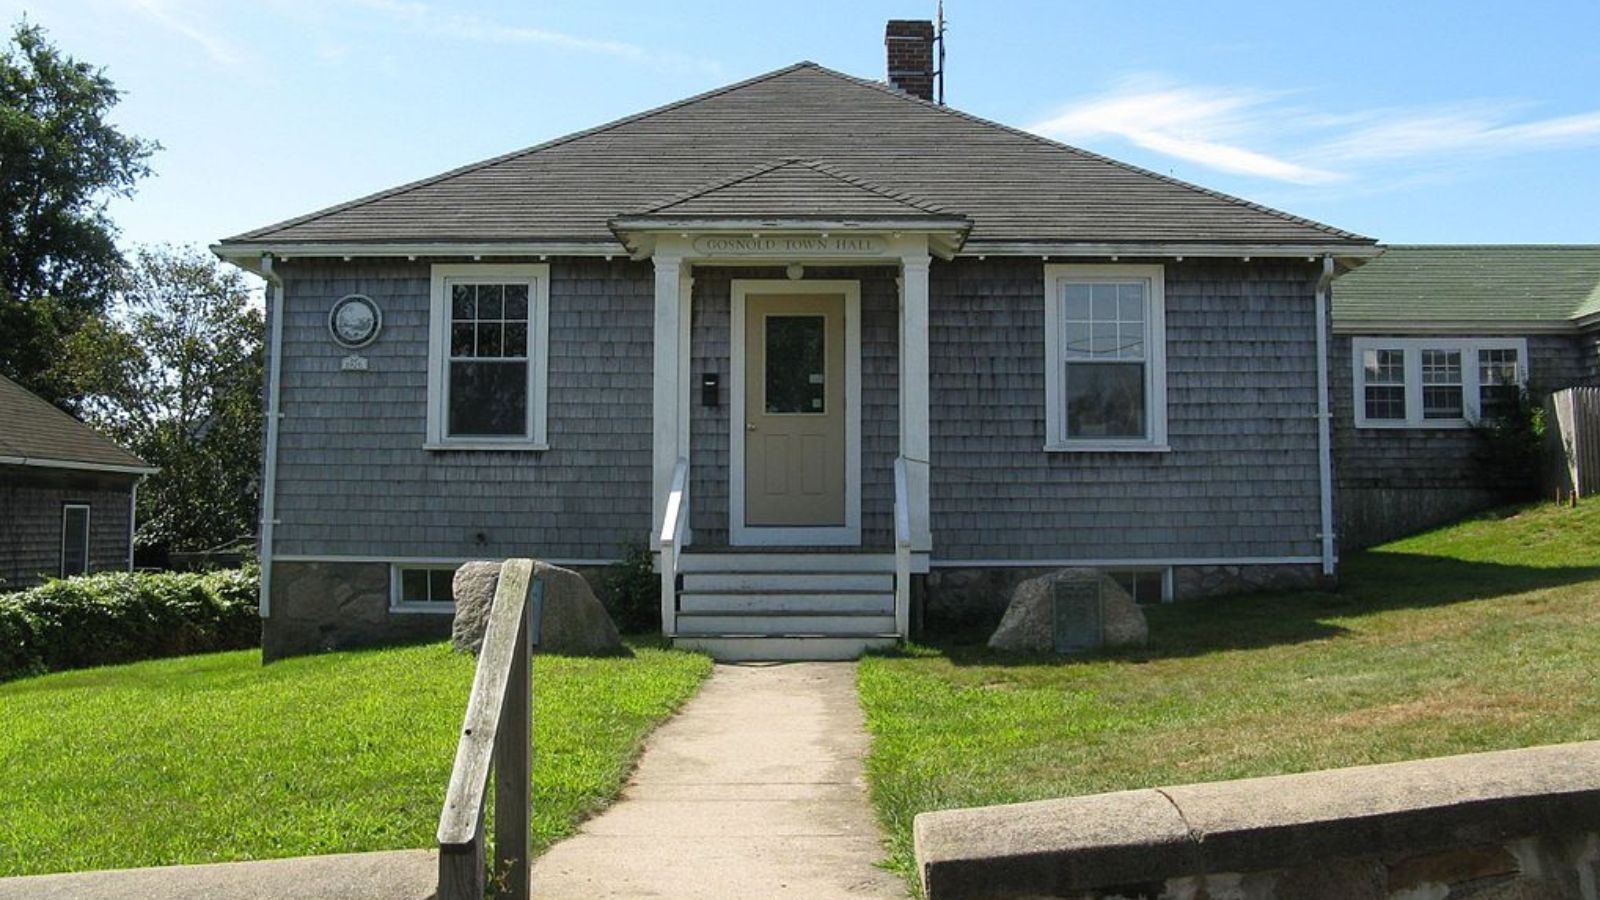
Gosnold is one of the most unique places in Massachusetts, made up of the Elizabeth Islands and accessible only by boat. With a tiny year-round population and virtually no commercial development, this town is about as exclusive and private as it gets in New England. Its limited inventory and oceanfront setting help explain the high price tag.
The town’s volatility in recent years likely reflects the challenges of such a small and seasonal market. A few high-end sales can move averages significantly. Still, the long-term rise is notable, driven by increased demand for remote getaways during the pandemic and a renewed focus on lifestyle-driven purchases.
18. Manchester – 106% Home Price Increase Since 2012
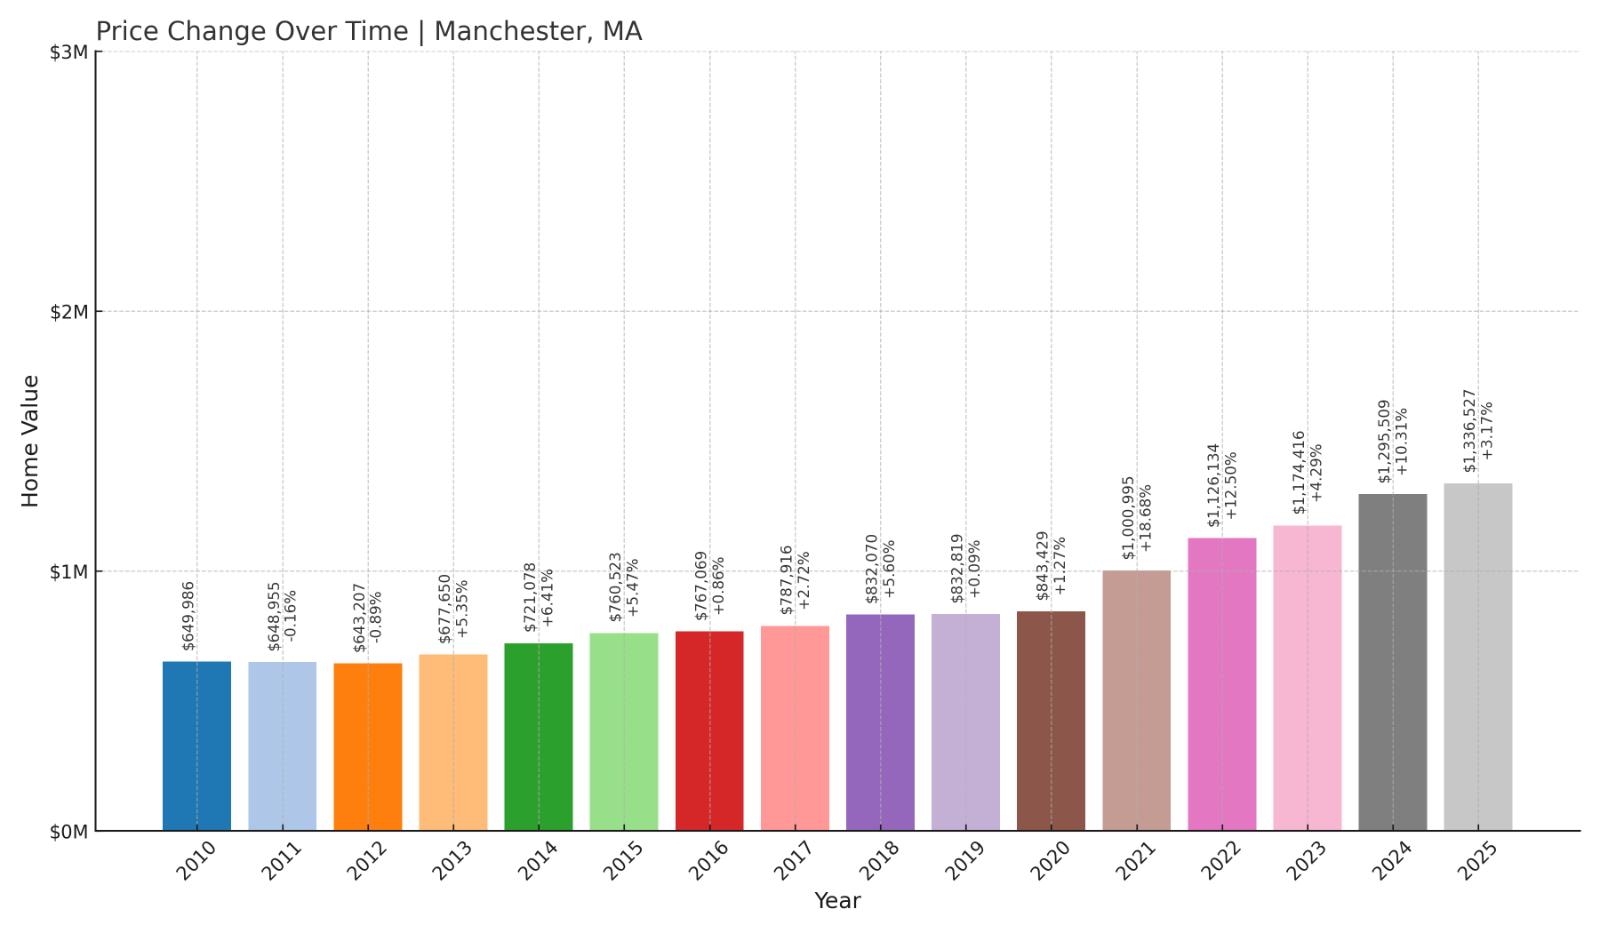
- 2010: $649,986
- 2011: $648,955 ($-1,031, -0.16% from previous year)
- 2012: $643,207 ($-5,748, -0.89% from previous year)
- 2013: $677,650 (+$34,443, +5.35% from previous year)
- 2014: $721,078 (+$43,428, +6.41% from previous year)
- 2015: $760,523 (+$39,445, +5.47% from previous year)
- 2016: $767,069 (+$6,546, +0.86% from previous year)
- 2017: $787,916 (+$20,847, +2.72% from previous year)
- 2018: $832,070 (+$44,154, +5.60% from previous year)
- 2019: $832,819 (+$749, +0.09% from previous year)
- 2020: $843,429 (+$10,610, +1.27% from previous year)
- 2021: $1,000,995 (+$157,566, +18.68% from previous year)
- 2022: $1,126,134 (+$125,139, +12.50% from previous year)
- 2023: $1,174,416 (+$48,282, +4.29% from previous year)
- 2024: $1,295,509 (+$121,093, +10.31% from previous year)
- 2025: $1,336,527 (+$41,018, +3.17% from previous year)
Manchester’s housing market has more than doubled in value since 2012, with the average home now priced at $1.34 million. Steady gains were followed by a pandemic-era surge, with 2021 and 2022 seeing double-digit growth. Unlike some towns, Manchester has sustained its gains with additional increases in 2024 and 2025.
Manchester – Upscale Living on the North Shore

Manchester-by-the-Sea is one of the most coveted coastal towns on Massachusetts’ North Shore. With its picturesque harbor, top-rated schools, and proximity to Boston, the town has attracted affluent buyers for decades. The town’s train access and natural charm continue to support strong demand.
While many towns saw price drops post-pandemic, Manchester bucked the trend. Home values climbed over 3% again in 2025, indicating ongoing strength. Limited inventory and sustained interest from second-home buyers help keep values high in this classic New England seaside town.
17. Carlisle – 101% Home Price Increase Since 2012
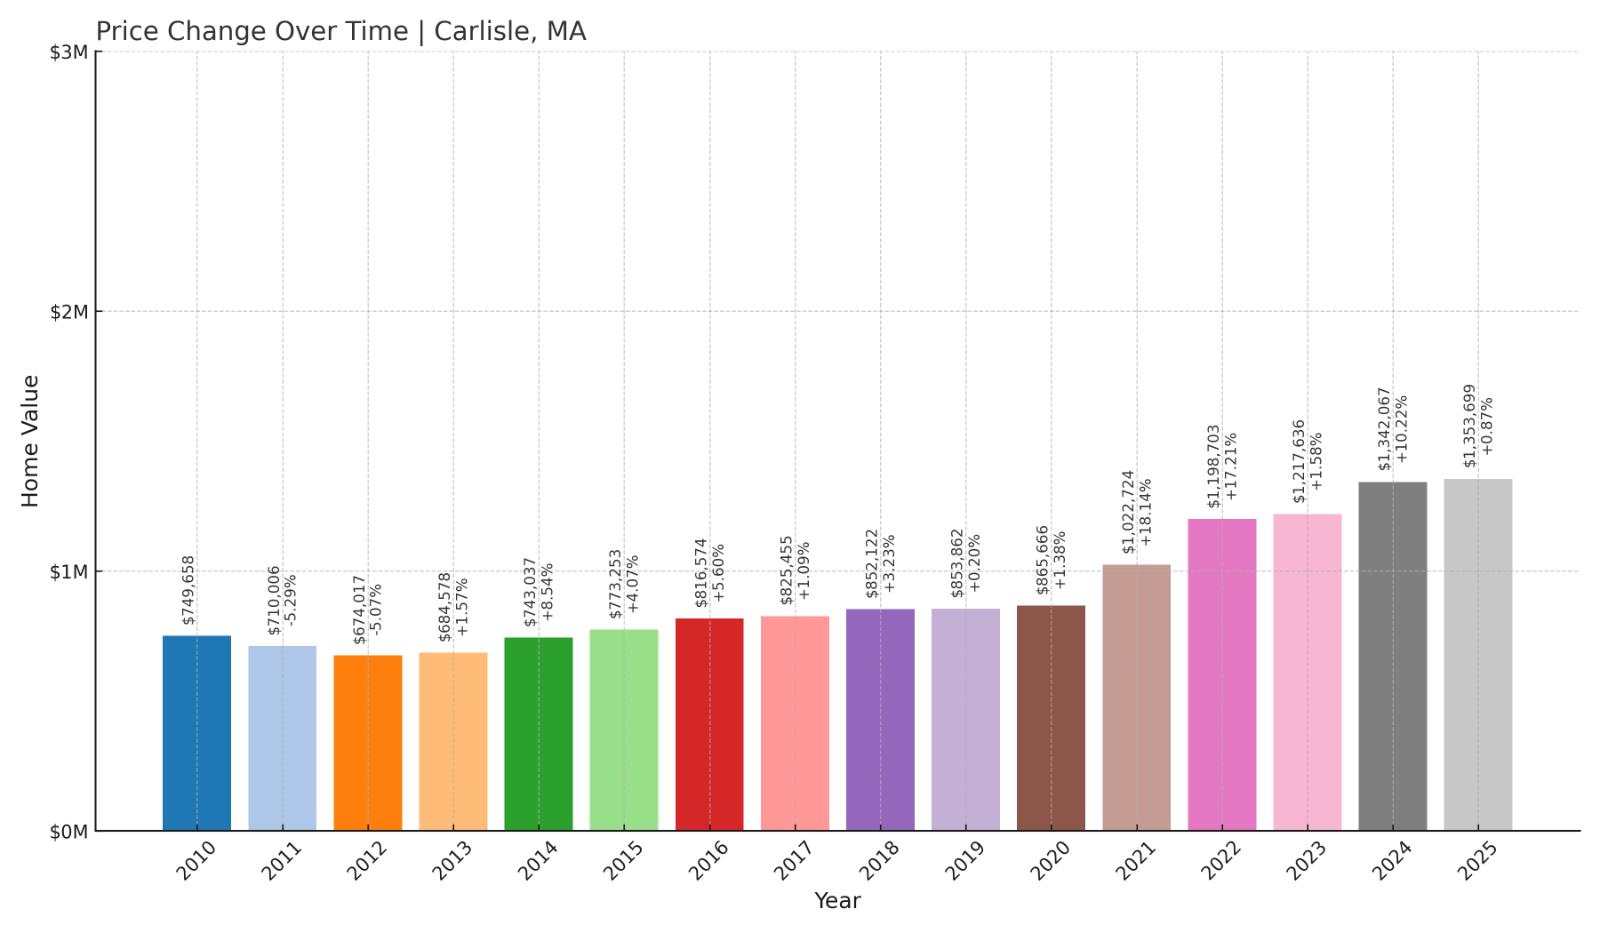
- 2010: $749,658
- 2011: $710,006 ($-39,652, -5.29% from previous year)
- 2012: $674,017 ($-35,989, -5.07% from previous year)
- 2013: $684,578 (+$10,561, +1.57% from previous year)
- 2014: $743,037 (+$58,459, +8.54% from previous year)
- 2015: $773,253 (+$30,216, +4.07% from previous year)
- 2016: $816,574 (+$43,321, +5.60% from previous year)
- 2017: $825,455 (+$8,881, +1.09% from previous year)
- 2018: $852,122 (+$26,667, +3.23% from previous year)
- 2019: $853,862 (+$1,740, +0.20% from previous year)
- 2020: $865,666 (+$11,804, +1.38% from previous year)
- 2021: $1,022,724 (+$157,058, +18.14% from previous year)
- 2022: $1,198,703 (+$175,979, +17.21% from previous year)
- 2023: $1,217,636 (+$18,933, +1.58% from previous year)
- 2024: $1,342,067 (+$124,431, +10.22% from previous year)
- 2025: $1,353,699 (+$11,632, +0.87% from previous year)
Carlisle’s home values have climbed steadily from a low in 2012, more than doubling over that span. The largest jumps came during 2021 and 2022, when buyers sought more space and privacy. The town saw continued, though slower, growth through 2025, closing the year at $1.35 million.
Carlisle – Quiet, Spacious, and Strong
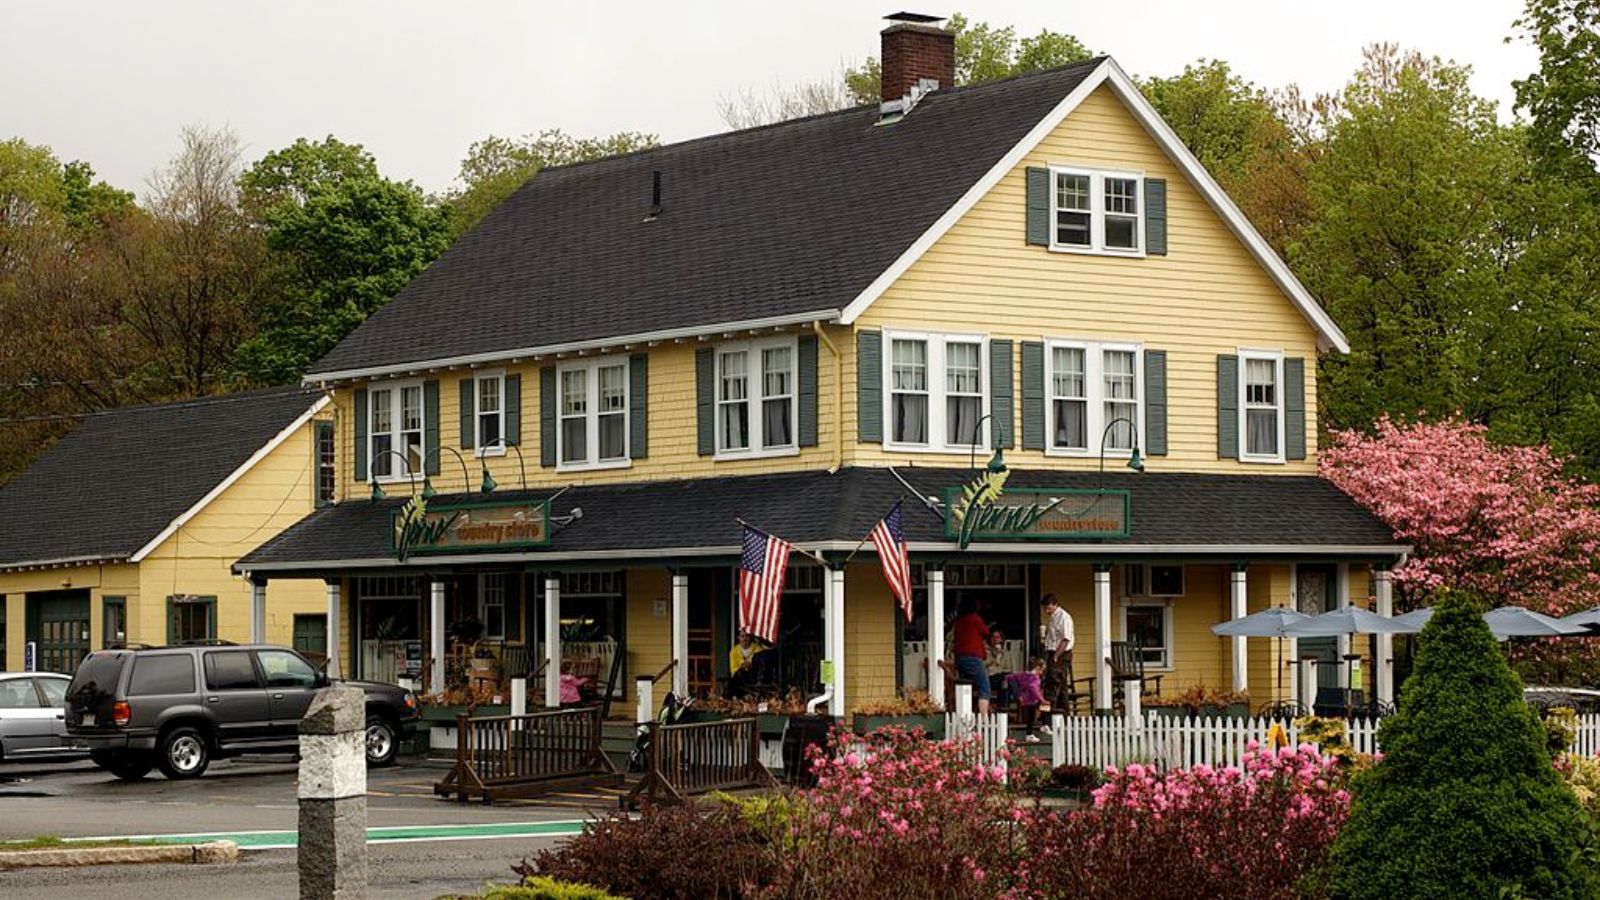
Located northwest of Boston, Carlisle is known for its large homes on generous lots and a strong sense of community. With no major commercial centers, the town attracts residents looking for tranquility and green space within commuting distance to the city.
Its low turnover rate and zoning that limits dense development contribute to sustained demand. While price growth has eased in the last two years, the long-term trajectory remains strong, reflecting Carlisle’s enduring appeal to families and professionals alike.
16. Cohasset – 107% Home Price Increase Since 2012
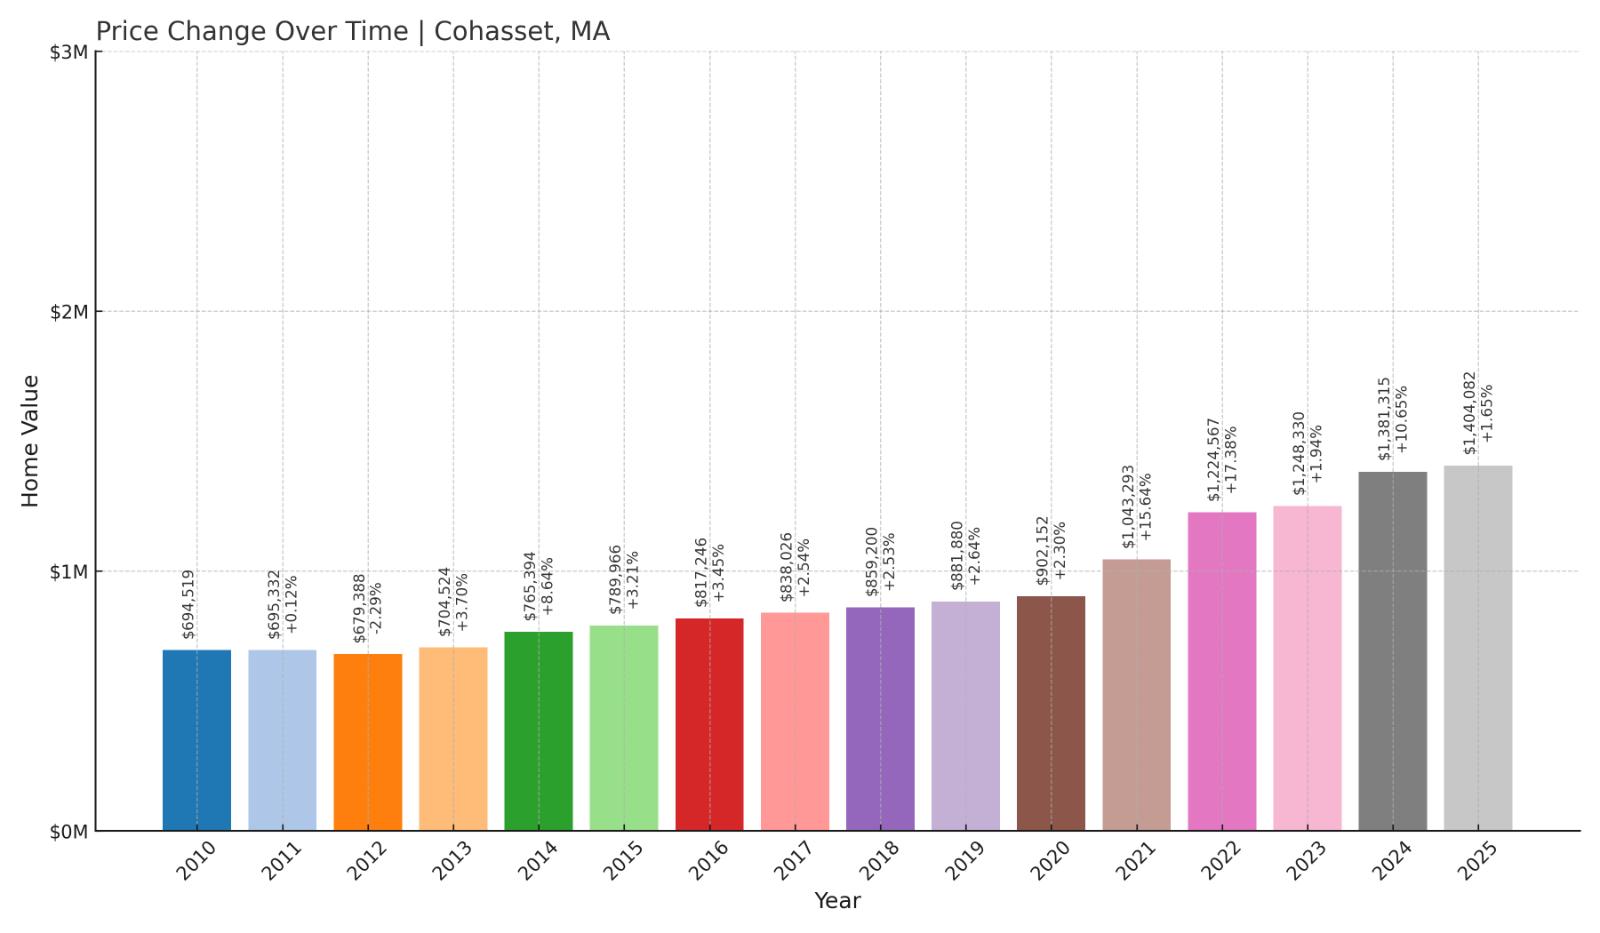
- 2010: $694,519
- 2011: $695,332 (+$813, +0.12% from previous year)
- 2012: $679,388 ($-15,944, -2.29% from previous year)
- 2013: $704,524 (+$25,136, +3.70% from previous year)
- 2014: $765,394 (+$60,870, +8.64% from previous year)
- 2015: $789,966 (+$24,572, +3.21% from previous year)
- 2016: $817,246 (+$27,280, +3.45% from previous year)
- 2017: $838,026 (+$20,780, +2.54% from previous year)
- 2018: $859,200 (+$21,174, +2.53% from previous year)
- 2019: $881,880 (+$22,680, +2.64% from previous year)
- 2020: $902,152 (+$20,272, +2.30% from previous year)
- 2021: $1,043,293 (+$141,141, +15.64% from previous year)
- 2022: $1,224,567 (+$181,274, +17.38% from previous year)
- 2023: $1,248,330 (+$23,763, +1.94% from previous year)
- 2024: $1,381,315 (+$132,985, +10.65% from previous year)
- 2025: $1,404,082 (+$22,767, +1.65% from previous year)
Cohasset’s average home price has climbed over 107% since 2012, ending 2025 at just over $1.4 million. Much of that growth came in 2021 and 2022, but gains have continued every year since. This consistent performance sets Cohasset apart in a market full of ups and downs.
Cohasset – Steady Gains on the South Shore
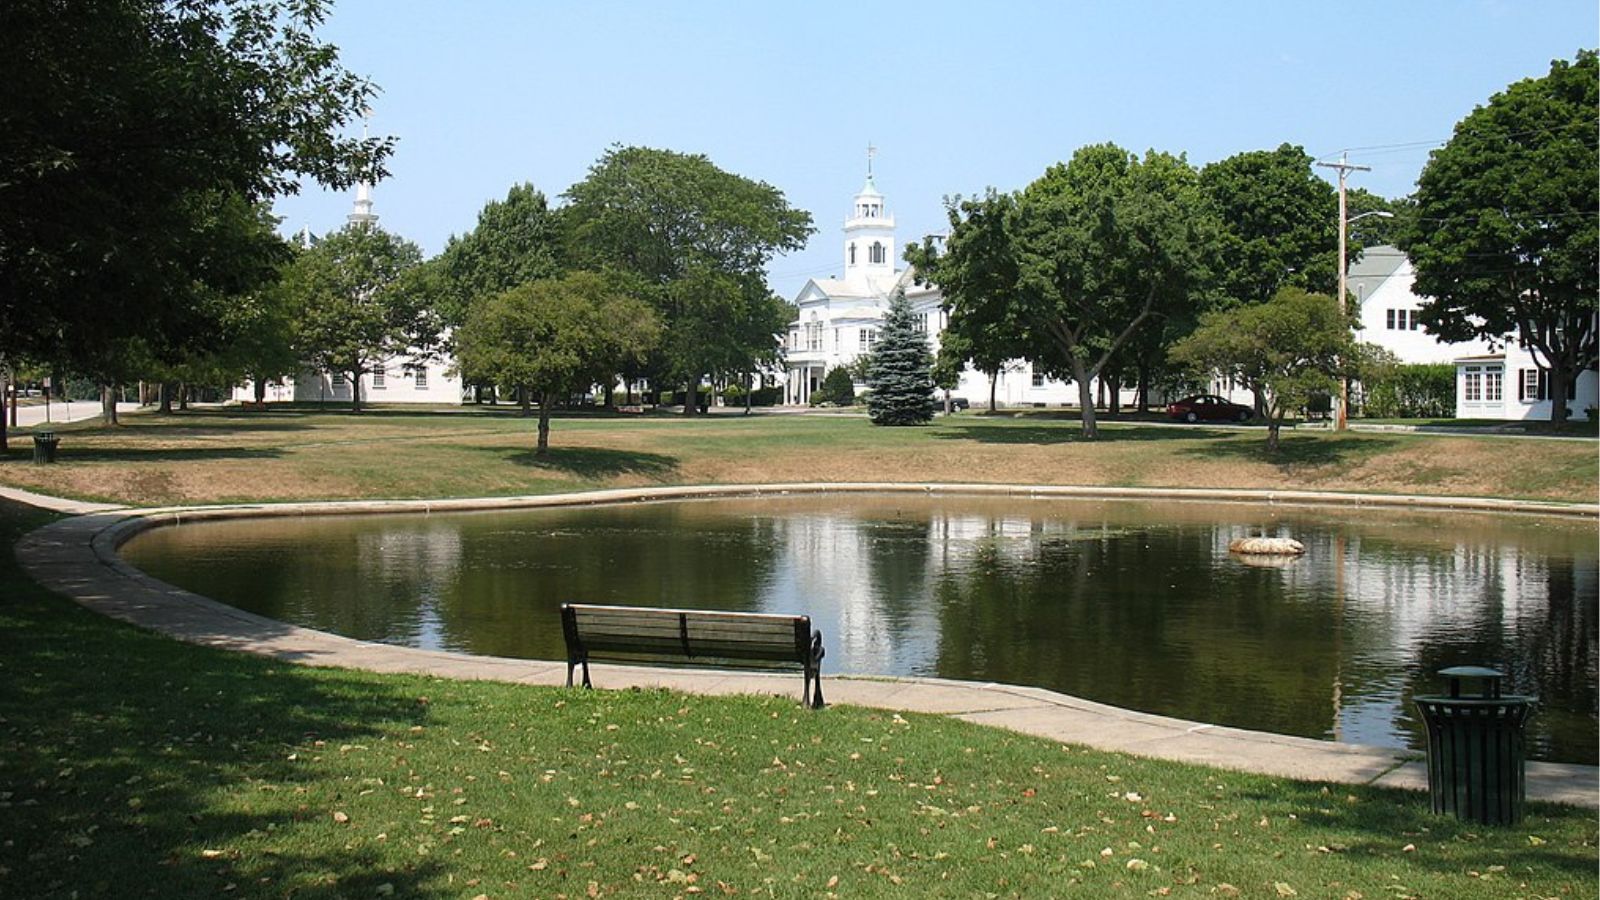
Cohasset offers a rare combination of seaside charm, historic homes, and access to Boston, which has long made it a favorite on the South Shore. Its rocky coastline and scenic harbor add to the appeal. The town has a small, affluent population and a stable housing market.
Strong demand from buyers seeking waterfront living has helped push prices steadily higher. Even in years when other markets softened, Cohasset saw continued appreciation, suggesting a resilient and desirable market that shows little sign of slowing.
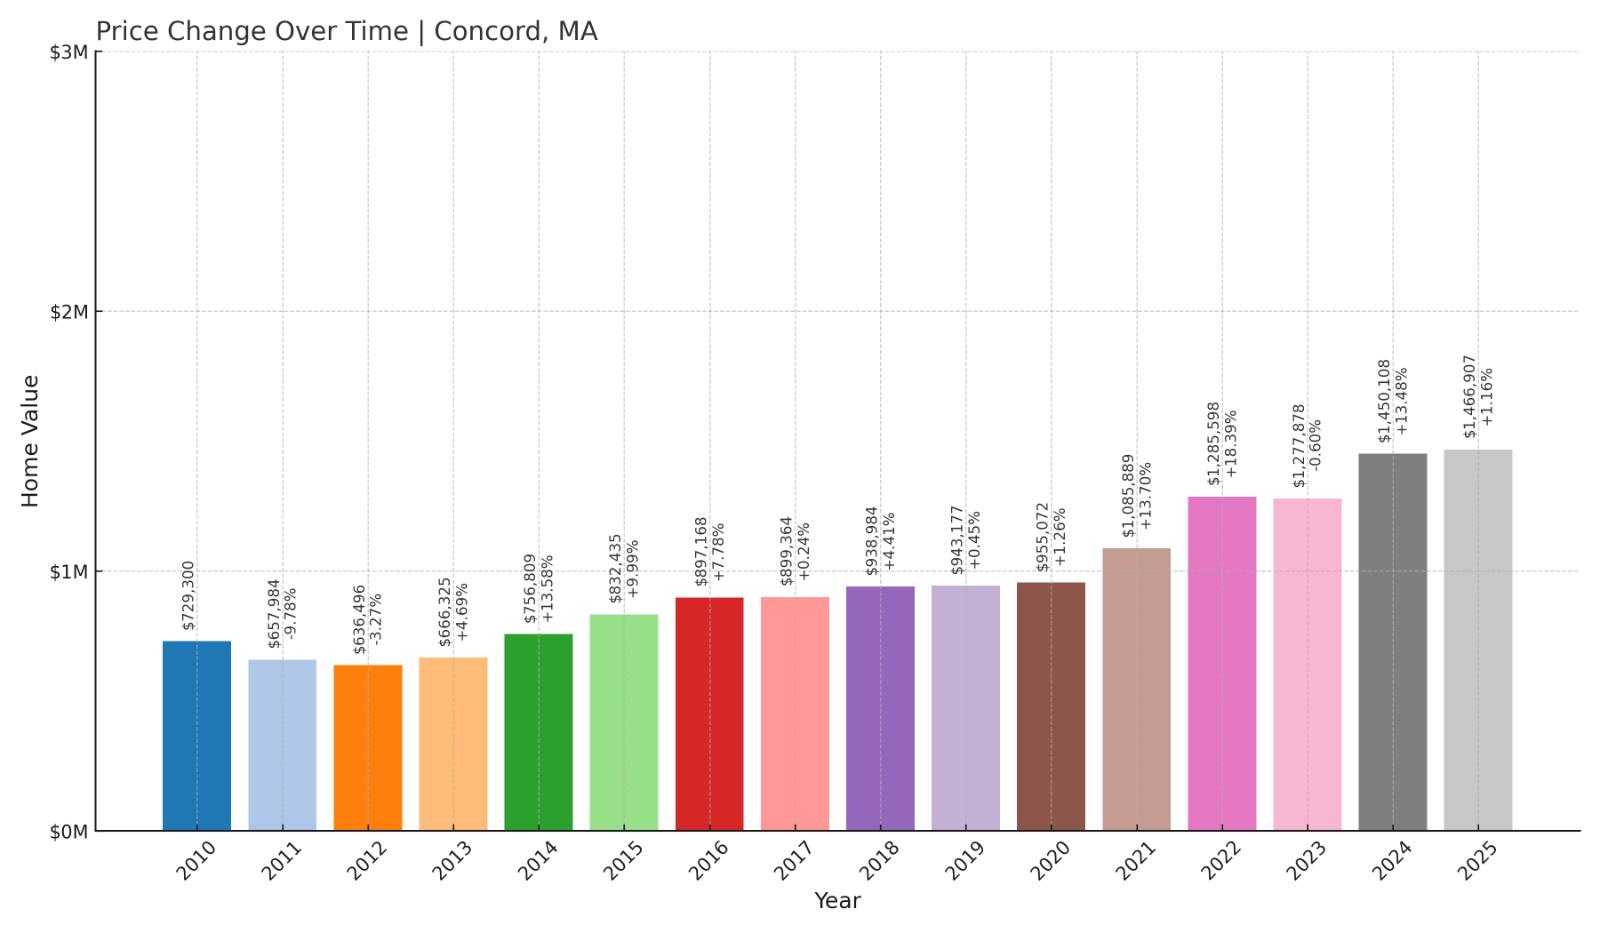
15. Concord – 131% Home Price Increase Since 2012
- 2010: $729,300
- 2011: $657,984 ($-71,316, -9.78% from previous year)
- 2012: $636,496 ($-21,488, -3.27% from previous year)
- 2013: $666,325 (+$29,829, +4.69% from previous year)
- 2014: $756,809 (+$90,484, +13.58% from previous year)
- 2015: $832,435 (+$75,626, +9.99% from previous year)
- 2016: $897,168 (+$64,733, +7.78% from previous year)
- 2017: $899,364 (+$2,196, +0.24% from previous year)
- 2018: $938,984 (+$39,620, +4.41% from previous year)
- 2019: $943,177 (+$4,193, +0.45% from previous year)
- 2020: $955,072 (+$11,895, +1.26% from previous year)
- 2021: $1,085,889 (+$130,817, +13.70% from previous year)
- 2022: $1,285,598 (+$199,709, +18.39% from previous year)
- 2023: $1,277,878 ($-7,720, -0.60% from previous year)
- 2024: $1,450,108 (+$172,230, +13.48% from previous year)
- 2025: $1,466,907 (+$16,799, +1.16% from previous year)
Concord’s home values have risen 131% since 2012, moving from $636,496 to $1.47 million in 2025. The town’s strongest growth came during the early 2020s, with a notable spike in 2022. Despite a brief dip in 2023, values surged again and remain near all-time highs.
Concord – History Meets High Demand
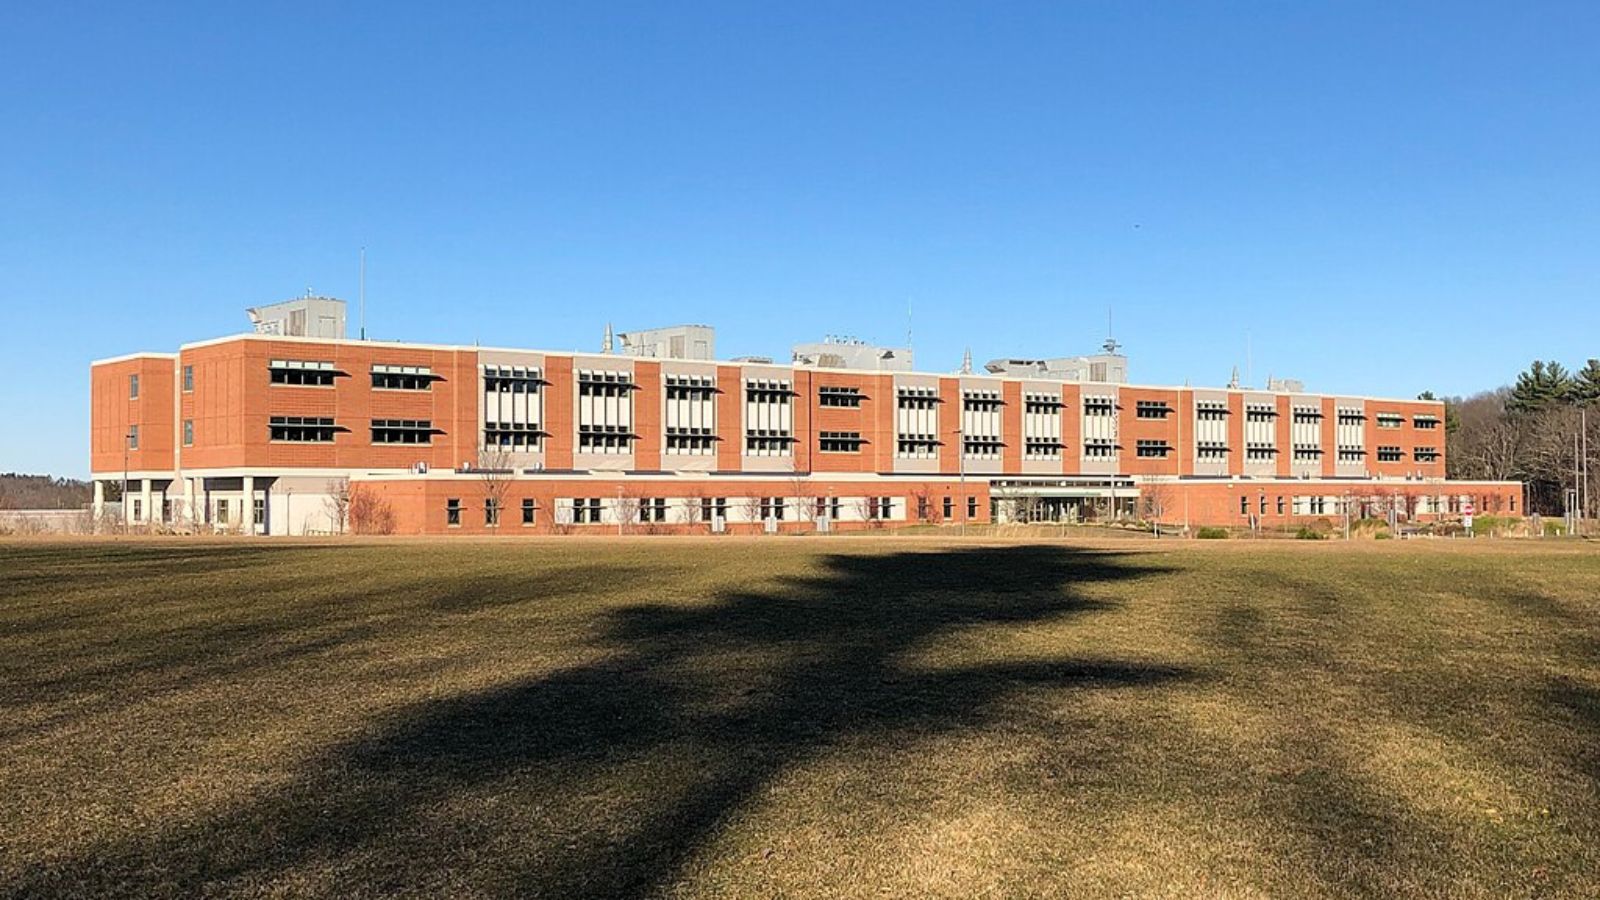
Famous for its Revolutionary War history, Concord is one of the most desirable suburbs west of Boston. The town combines historic character with modern amenities, strong public schools, and access to conservation land and commuter rail.
The market here is driven by both demand and a limited number of high-end properties. Recent price gains reflect this balance. While growth may slow, Concord’s appeal as a residential destination remains exceptionally strong.
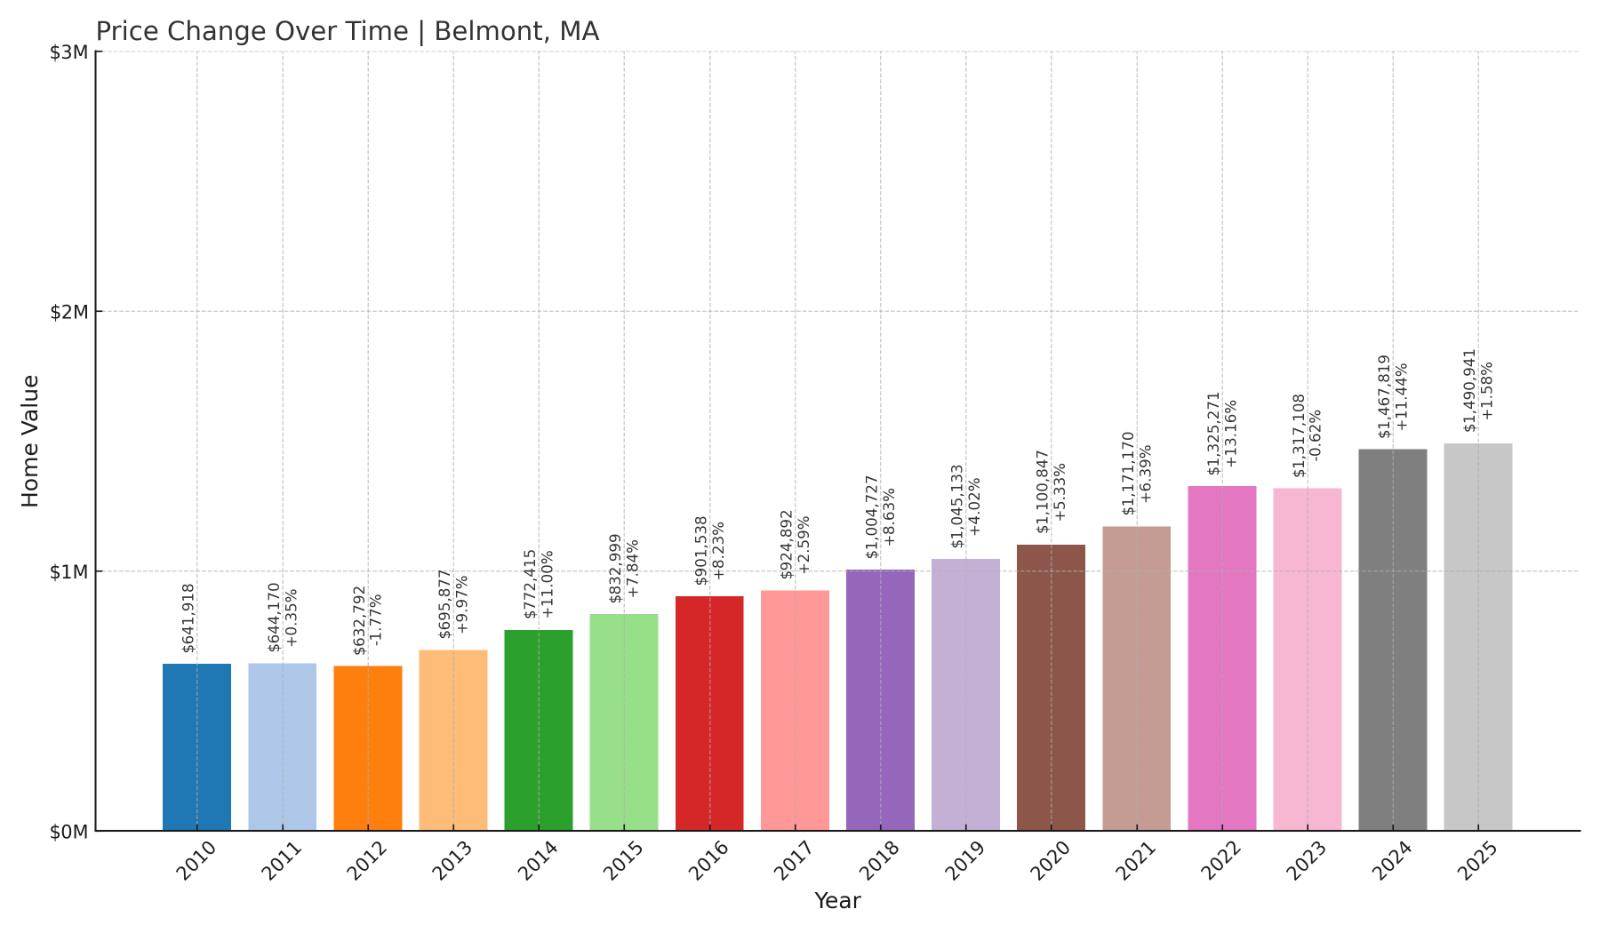
14. Belmont – 135% Home Price Increase Since 2012
- 2010: $641,918
- 2011: $644,170 (+$2,252, +0.35% from previous year)
- 2012: $632,792 ($-11,378, -1.77% from previous year)
- 2013: $695,877 (+$63,085, +9.97% from previous year)
- 2014: $772,415 (+$76,538, +11.00% from previous year)
- 2015: $832,999 (+$60,584, +7.84% from previous year)
- 2016: $901,538 (+$68,539, +8.23% from previous year)
- 2017: $924,892 (+$23,354, +2.59% from previous year)
- 2018: $1,004,727 (+$79,835, +8.63% from previous year)
- 2019: $1,045,133 (+$40,406, +4.02% from previous year)
- 2020: $1,100,847 (+$55,714, +5.33% from previous year)
- 2021: $1,171,170 (+$70,323, +6.39% from previous year)
- 2022: $1,325,271 (+$154,101, +13.16% from previous year)
- 2023: $1,317,108 ($-8,163, -0.62% from previous year)
- 2024: $1,467,819 (+$150,711, +11.44% from previous year)
- 2025: $1,490,941 (+$23,122, +1.58% from previous year)
Belmont’s average home price has surged from $632,792 in 2012 to nearly $1.5 million in 2025, marking a 135% gain. After a small dip in 2023, the market rebounded strongly in 2024 and has continued to climb. This long-term rise reflects Belmont’s growing popularity among Boston-area buyers.
Belmont – A Commuter Favorite With Lasting Appeal
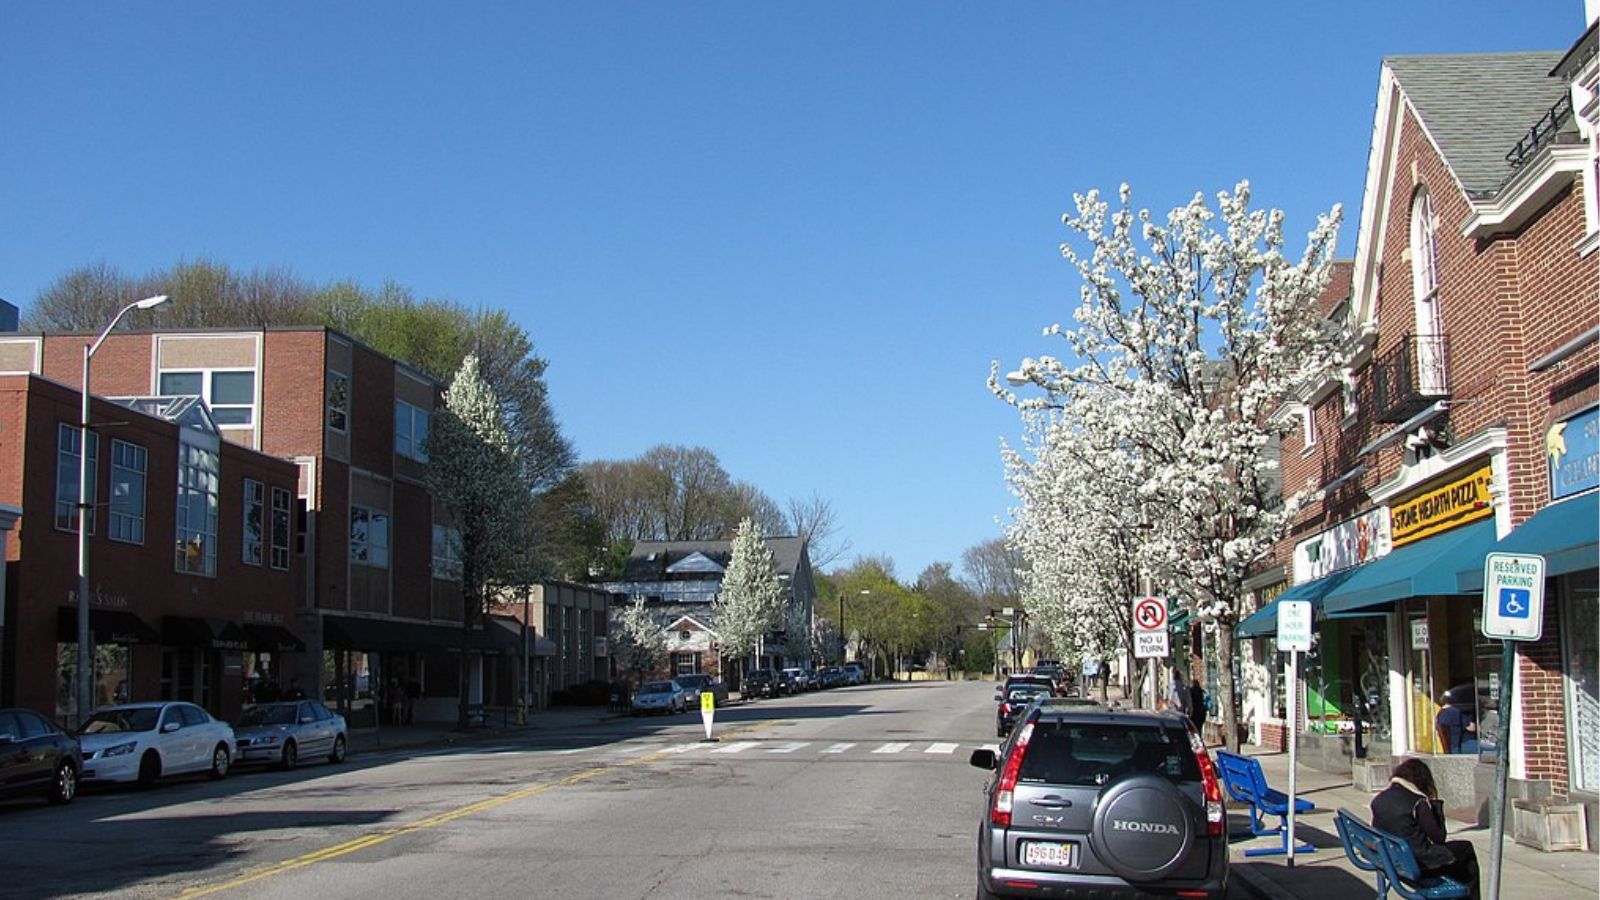
Just west of Cambridge, Belmont is well-known for its excellent public schools, leafy neighborhoods, and convenient access to Boston via the Fitchburg Line. The town’s high quality of life has fueled its transformation from a quiet suburb to a sought-after address for professionals and families.
New development has remained limited, helping drive prices higher. The town also benefits from strong demand for homes near major universities and medical centers. Belmont’s consistent rise in value shows how tightly supply and demand are balanced in Greater Boston’s inner suburbs.
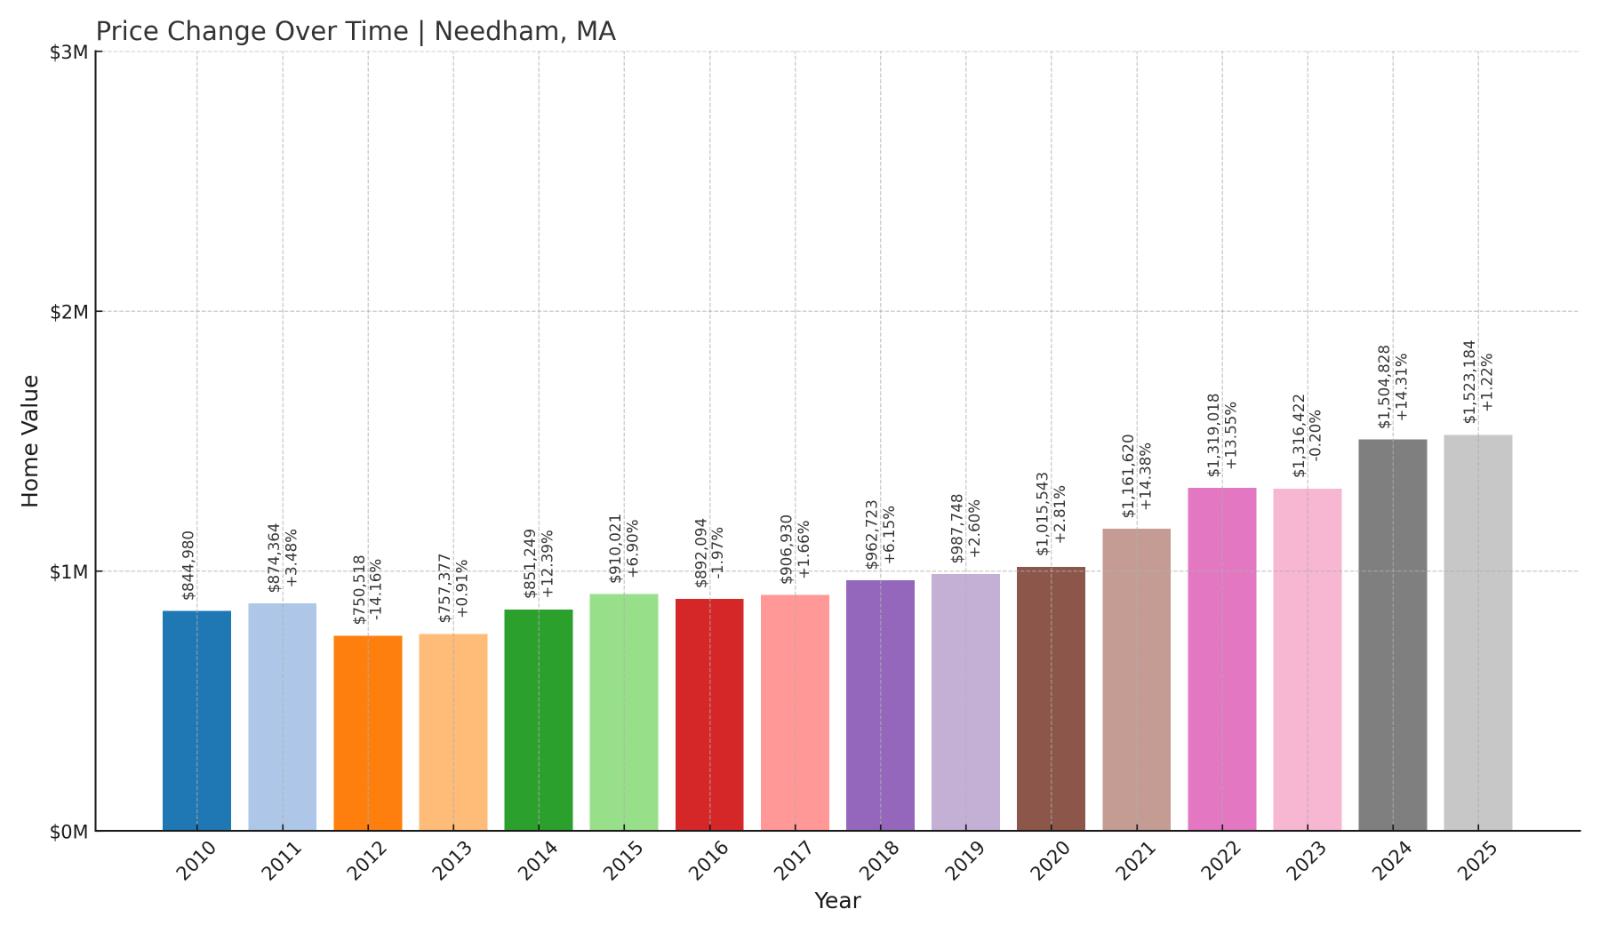
13. Needham – 103% Home Price Increase Since 2012
🔥 Would you like to save this?
- 2010: $844,980
- 2011: $874,364 (+$29,384, +3.48% from previous year)
- 2012: $750,518 ($-123,846, -14.16% from previous year)
- 2013: $757,377 (+$6,859, +0.91% from previous year)
- 2014: $851,249 (+$93,872, +12.39% from previous year)
- 2015: $910,021 (+$58,772, +6.90% from previous year)
- 2016: $892,094 ($-17,927, -1.97% from previous year)
- 2017: $906,930 (+$14,836, +1.66% from previous year)
- 2018: $962,723 (+$55,793, +6.15% from previous year)
- 2019: $987,748 (+$25,025, +2.60% from previous year)
- 2020: $1,015,543 (+$27,795, +2.81% from previous year)
- 2021: $1,161,620 (+$146,077, +14.38% from previous year)
- 2022: $1,319,018 (+$157,398, +13.55% from previous year)
- 2023: $1,316,422 ($-2,596, -0.20% from previous year)
- 2024: $1,504,828 (+$188,406, +14.31% from previous year)
- 2025: $1,523,184 (+$18,356, +1.22% from previous year)
Needham’s home prices have climbed 103% since 2012, from $750,518 to over $1.52 million. After a couple of brief corrections in 2016 and 2023, values quickly rebounded. Growth has been especially strong in the post-2020 period, reflecting ongoing demand for high-quality suburban living.
Needham – Big Demand in Boston’s Western Suburbs
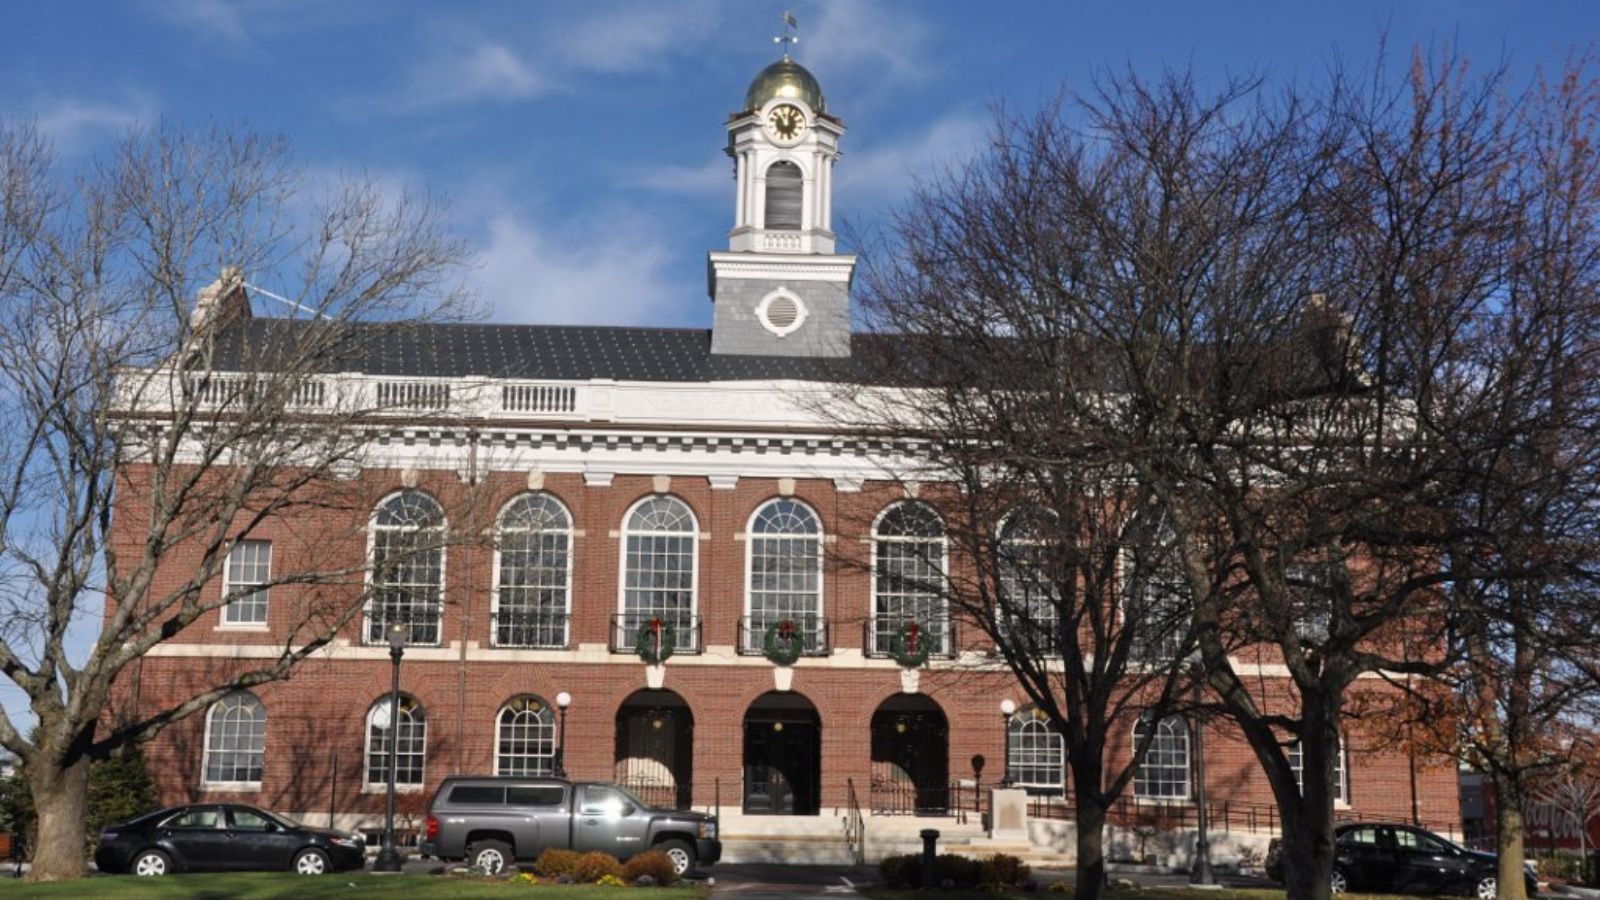
Needham has become one of the most popular suburbs in the western corridor thanks to its strong schools, charming town center, and easy access to Route 128 and commuter rail. Buyers looking for larger homes on generous lots have helped push values higher year after year.
Its location near major employment hubs, including the growing tech belt along I-95, adds to its appeal. Limited housing supply has kept upward pressure on prices. Even as the market cooled in some areas, Needham continued to gain value through 2025.
12. Lincoln – 120% Home Price Increase Since 2012
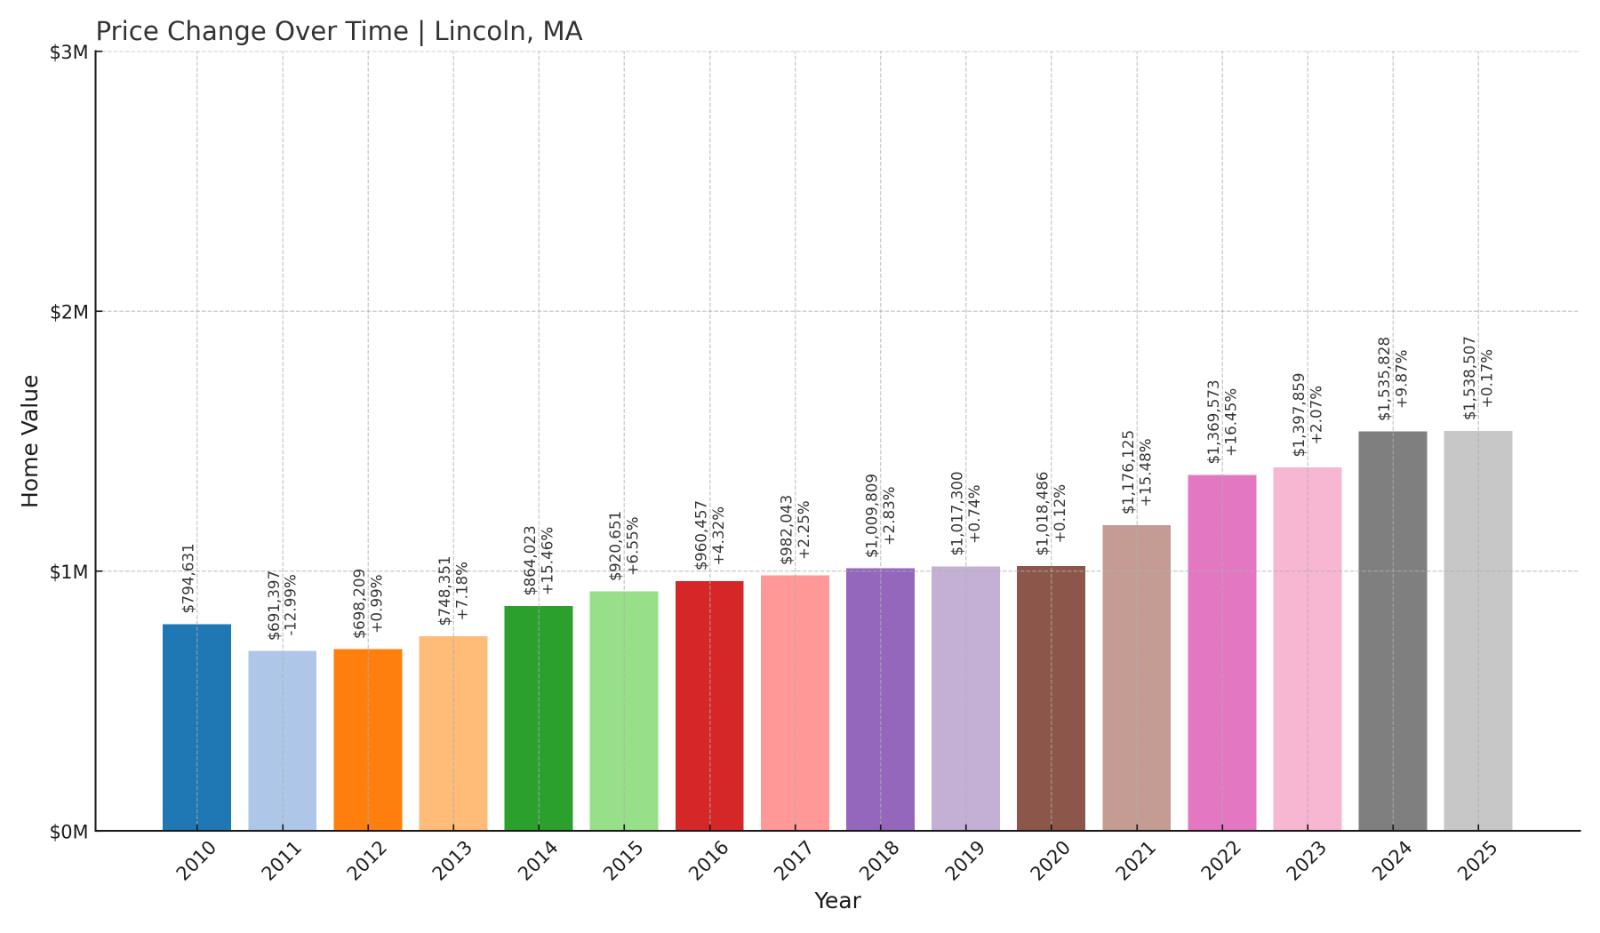
- 2010: $794,631
- 2011: $691,397 ($-103,234, -12.99% from previous year)
- 2012: $698,209 (+$6,812, +0.99% from previous year)
- 2013: $748,351 (+$50,142, +7.18% from previous year)
- 2014: $864,023 (+$115,672, +15.46% from previous year)
- 2015: $920,651 (+$56,628, +6.55% from previous year)
- 2016: $960,457 (+$39,806, +4.32% from previous year)
- 2017: $982,043 (+$21,586, +2.25% from previous year)
- 2018: $1,009,809 (+$27,766, +2.83% from previous year)
- 2019: $1,017,300 (+$7,491, +0.74% from previous year)
- 2020: $1,018,486 (+$1,186, +0.12% from previous year)
- 2021: $1,176,125 (+$157,639, +15.48% from previous year)
- 2022: $1,369,573 (+$193,448, +16.45% from previous year)
- 2023: $1,397,859 (+$28,286, +2.07% from previous year)
- 2024: $1,535,828 (+$137,969, +9.87% from previous year)
- 2025: $1,538,507 (+$2,679, +0.17% from previous year)
Lincoln’s home values have doubled since 2012, now averaging more than $1.53 million. The sharpest price jumps occurred between 2020 and 2022. Price growth has since slowed but remains positive, reflecting the area’s ongoing stability and desirability.
Lincoln – Scenic and Steady in Greater Boston
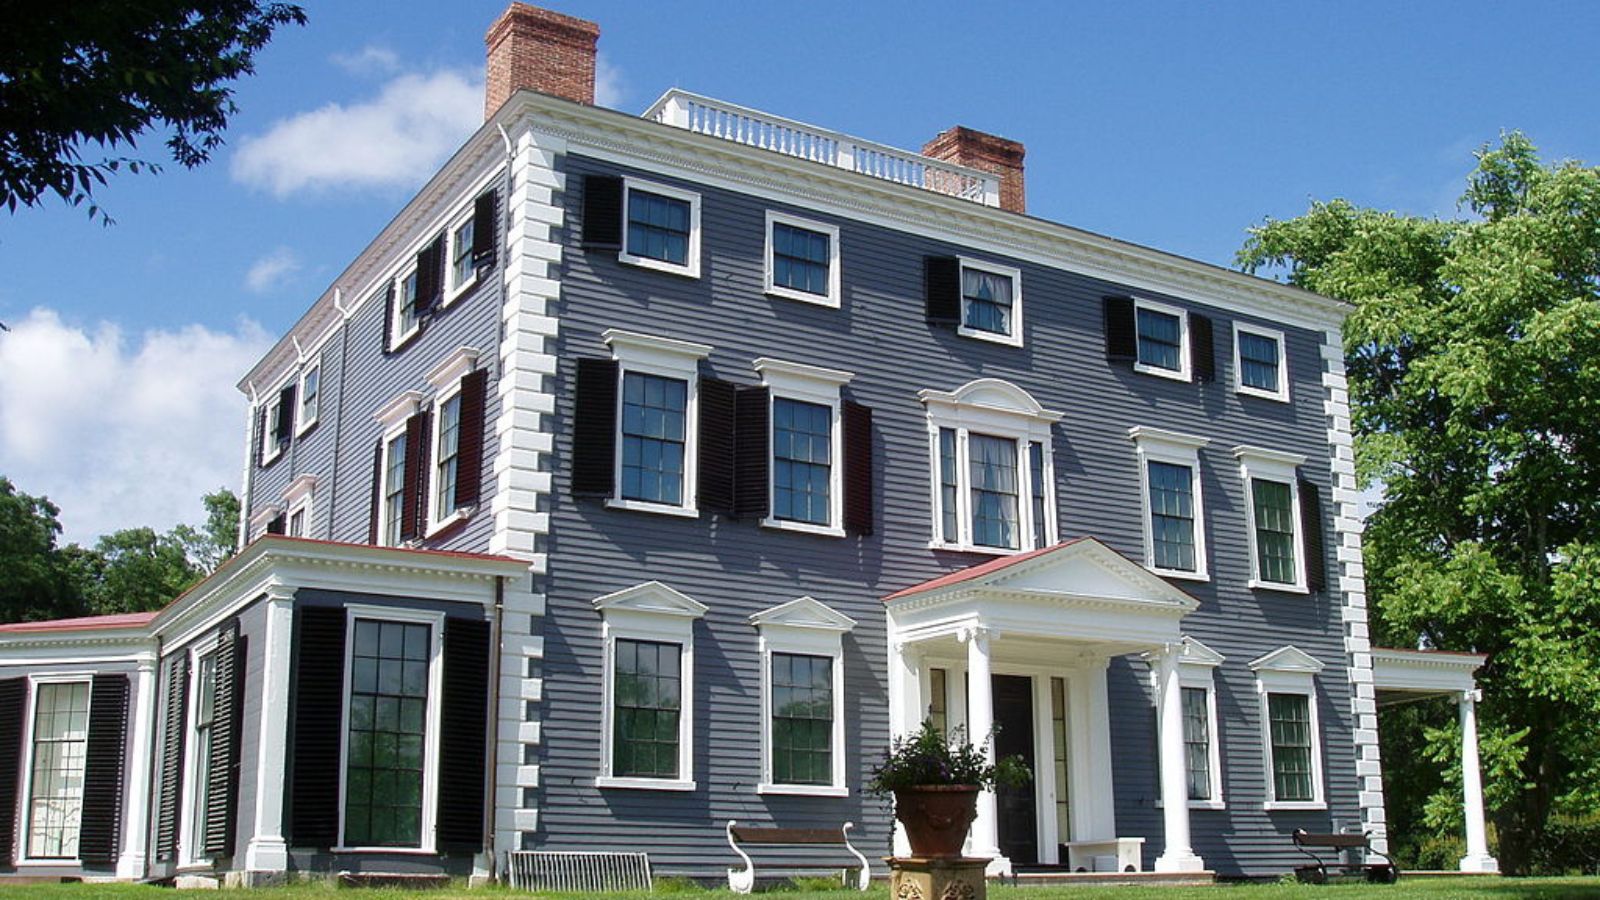
Lincoln is a semi-rural town known for its open space, historic properties, and commitment to conservation. With a commuter rail station and easy access to Cambridge and Boston, it appeals to those looking for privacy and nature without sacrificing convenience.
The town’s deliberate planning policies limit overdevelopment, which in turn sustains high property values. Though 2025 brought only slight growth, Lincoln’s long-term appreciation is clear and shows the enduring value of peaceful, well-preserved communities.
11. Newton – 118% Home Price Increase Since 2012

- 2010: $718,898
- 2011: $712,786 ($-6,112, -0.85% from previous year)
- 2012: $709,054 ($-3,732, -0.52% from previous year)
- 2013: $764,021 (+$54,967, +7.75% from previous year)
- 2014: $850,794 (+$86,773, +11.36% from previous year)
- 2015: $918,947 (+$68,153, +8.01% from previous year)
- 2016: $972,500 (+$53,553, +5.83% from previous year)
- 2017: $1,008,848 (+$36,348, +3.74% from previous year)
- 2018: $1,079,182 (+$70,334, +6.97% from previous year)
- 2019: $1,106,006 (+$26,824, +2.49% from previous year)
- 2020: $1,106,821 (+$815, +0.07% from previous year)
- 2021: $1,207,042 (+$100,221, +9.05% from previous year)
- 2022: $1,359,723 (+$152,681, +12.65% from previous year)
- 2023: $1,362,470 (+$2,747, +0.20% from previous year)
- 2024: $1,527,497 (+$165,027, +12.11% from previous year)
- 2025: $1,554,245 (+$26,748, +1.75% from previous year)
Newton’s housing market has shown remarkable consistency, growing by 118% since 2012. The city saw especially large gains in 2014, 2022, and 2024. It now averages over $1.55 million, reflecting its place as one of Greater Boston’s most in-demand addresses.
Newton – City Services, Suburban Feel
With multiple village centers, strong schools, and easy access to Boston, Newton offers a rare blend of urban convenience and suburban charm. Its strong tax base and robust public services only add to its appeal.
High demand and limited buildable land keep prices climbing. While the city saw only modest growth in 2025, the longer-term picture remains very strong, with home values nearly doubling in the last decade.
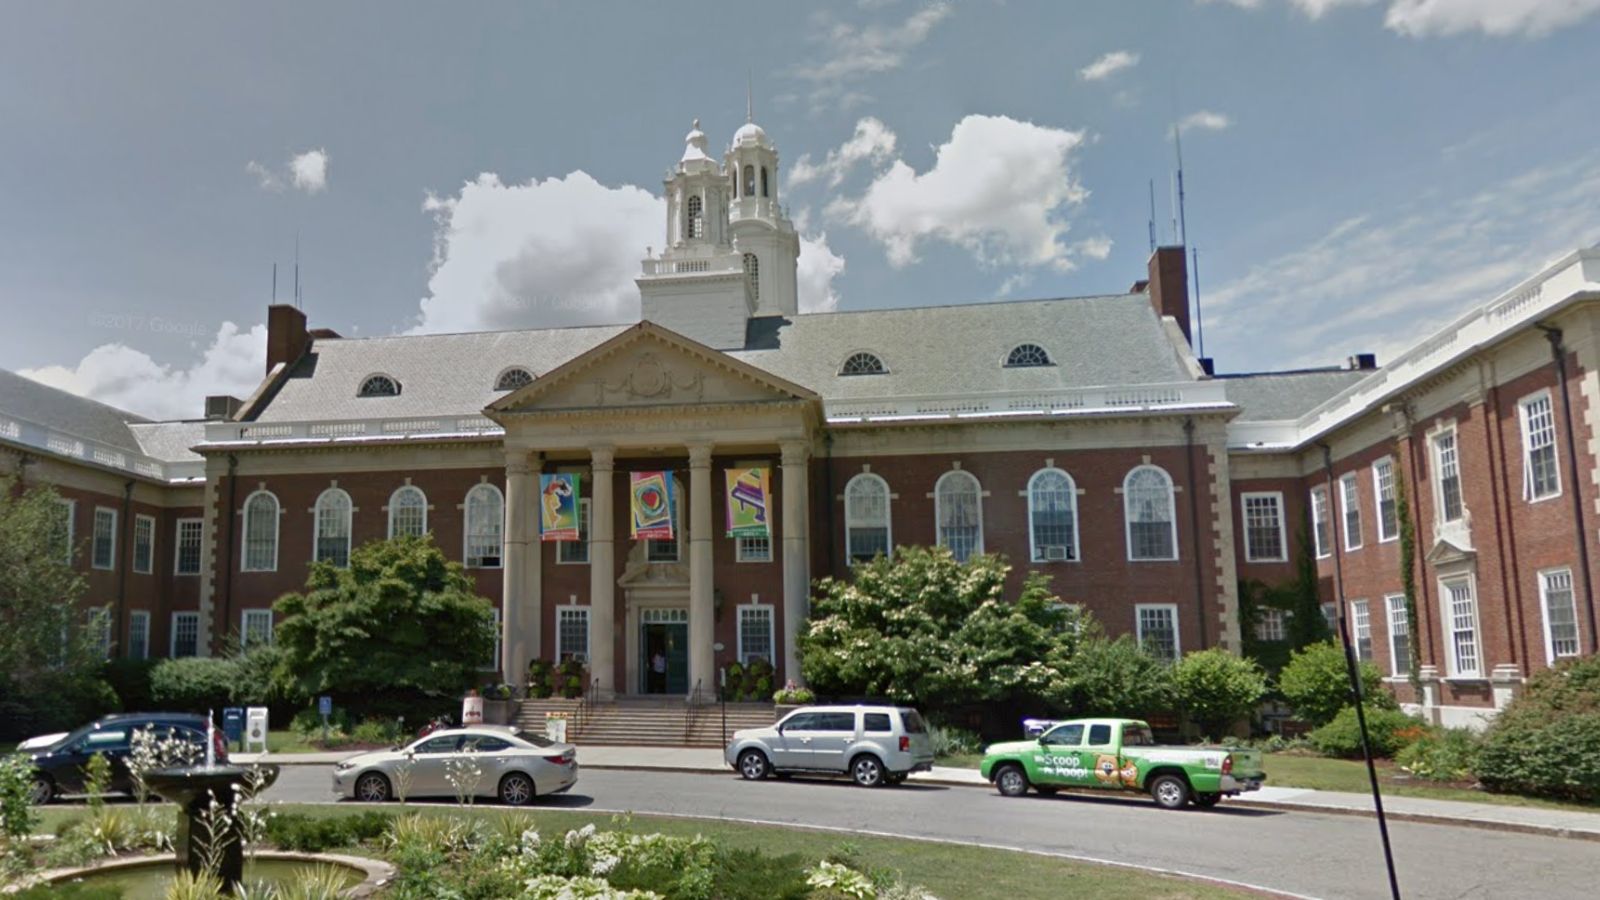
10. Winchester – 118% Home Price Increase Since 2012
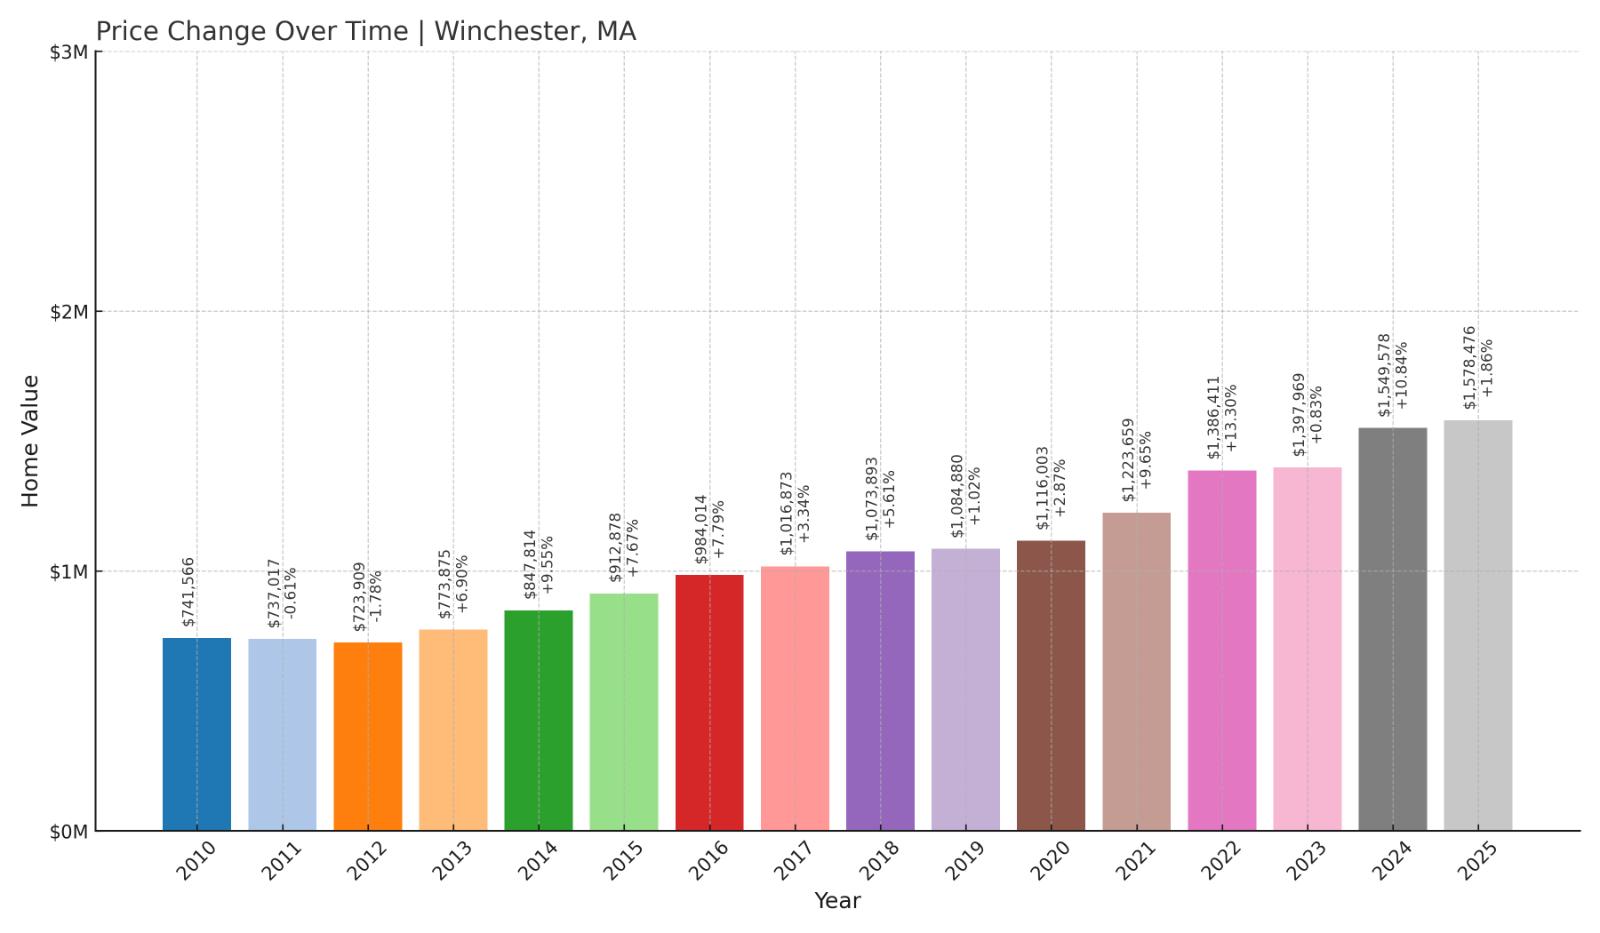
- 2010: $741,566
- 2011: $737,017 ($-4,549, -0.61% from previous year)
- 2012: $723,909 ($-13,108, -1.78% from previous year)
- 2013: $773,875 (+$49,966, +6.90% from previous year)
- 2014: $847,814 (+$73,939, +9.55% from previous year)
- 2015: $912,878 (+$65,064, +7.67% from previous year)
- 2016: $984,014 (+$71,136, +7.79% from previous year)
- 2017: $1,016,873 (+$32,859, +3.34% from previous year)
- 2018: $1,073,893 (+$57,020, +5.61% from previous year)
- 2019: $1,084,880 (+$10,987, +1.02% from previous year)
- 2020: $1,116,003 (+$31,123, +2.87% from previous year)
- 2021: $1,223,659 (+$107,656, +9.65% from previous year)
- 2022: $1,386,411 (+$162,752, +13.30% from previous year)
- 2023: $1,397,969 (+$11,558, +0.83% from previous year)
- 2024: $1,549,578 (+$151,609, +10.84% from previous year)
- 2025: $1,578,476 (+$28,898, +1.86% from previous year)
Winchester’s home prices have more than doubled since 2012, with a total increase of 118% over the period. Growth has been steady year after year, with strong surges in 2022 and 2024 that helped push the average home value to $1.58 million in 2025.
Winchester – Classic Suburb With Consistent Growth
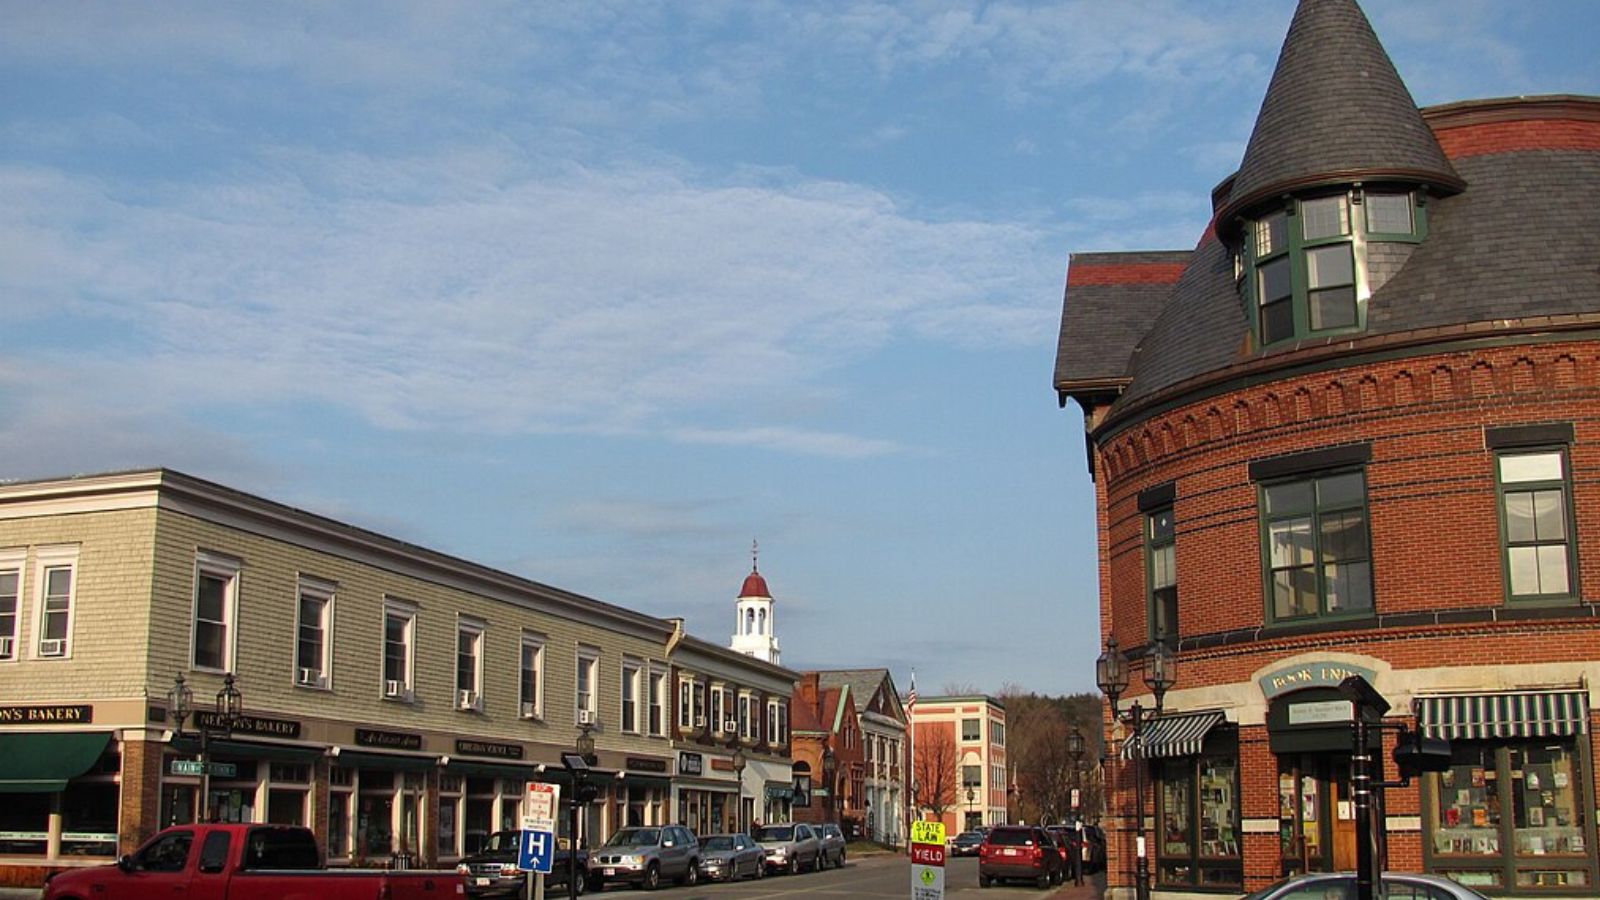
Just eight miles north of Boston, Winchester is a quintessential commuter suburb with a charming downtown, respected public schools, and commuter rail access. Its housing stock is dominated by single-family homes in walkable neighborhoods, which remain in high demand.
The town’s ability to draw affluent buyers has kept home prices climbing. Even in years of economic uncertainty, Winchester has largely avoided price declines, showcasing the stability and desirability of this well-established suburb.
9. Lexington – 124% Home Price Increase Since 2012

- 2010: $725,900
- 2011: $715,572 ($-10,328, -1.42% from previous year)
- 2012: $721,014 (+$5,442, +0.76% from previous year)
- 2013: $777,567 (+$56,553, +7.84% from previous year)
- 2014: $856,295 (+$78,728, +10.12% from previous year)
- 2015: $921,783 (+$65,488, +7.65% from previous year)
- 2016: $979,518 (+$57,735, +6.26% from previous year)
- 2017: $1,011,542 (+$32,024, +3.27% from previous year)
- 2018: $1,064,509 (+$52,967, +5.24% from previous year)
- 2019: $1,093,476 (+$28,967, +2.72% from previous year)
- 2020: $1,093,424 ($-52, -0.00% from previous year)
- 2021: $1,220,627 (+$127,203, +11.63% from previous year)
- 2022: $1,405,319 (+$184,692, +15.13% from previous year)
- 2023: $1,417,886 (+$12,567, +0.89% from previous year)
- 2024: $1,594,266 (+$176,380, +12.44% from previous year)
- 2025: $1,612,879 (+$18,613, +1.17% from previous year)
Home values in Lexington have risen by 124% since 2012, ending 2025 at over $1.6 million. While growth was moderate until 2020, the past five years have brought major price increases, with big gains in 2021, 2022, and 2024 driving the upward trend.
Lexington – Historic Appeal and High-Earning Buyers
Known as the site of the first battle of the American Revolution, Lexington today is a top-tier suburb for professionals seeking excellent schools and proximity to Boston. It has a strong base of biotech and tech executives fueling demand for luxury homes.
The town’s blend of history, education, and affluence keeps it on buyers’ shortlists. With tight inventory and large, updated homes in desirable neighborhoods, Lexington has maintained price growth even as some other suburbs cooled off.
8. West Tisbury – 147% Home Price Increase Since 2012
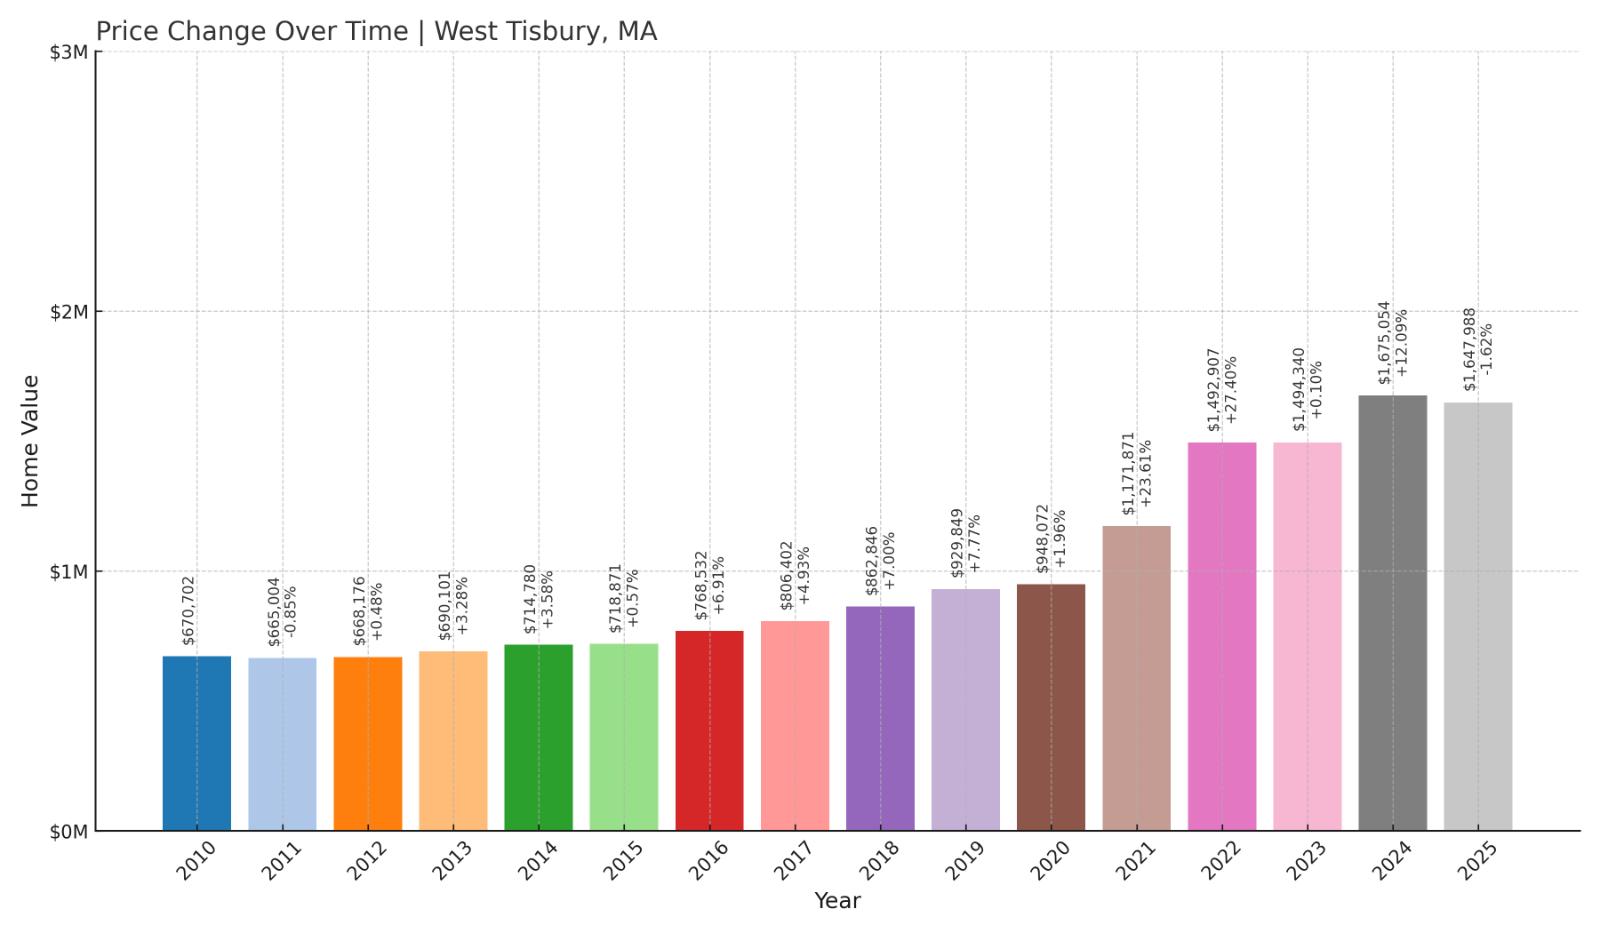
- 2010: $670,702
- 2011: $665,004 ($-5,698, -0.85% from previous year)
- 2012: $668,176 (+$3,172, +0.48% from previous year)
- 2013: $690,101 (+$21,925, +3.28% from previous year)
- 2014: $714,780 (+$24,679, +3.58% from previous year)
- 2015: $718,871 (+$4,091, +0.57% from previous year)
- 2016: $768,532 (+$49,661, +6.91% from previous year)
- 2017: $806,402 (+$37,870, +4.93% from previous year)
- 2018: $862,846 (+$56,444, +7.00% from previous year)
- 2019: $929,849 (+$67,003, +7.77% from previous year)
- 2020: $948,072 (+$18,223, +1.96% from previous year)
- 2021: $1,171,871 (+$223,799, +23.61% from previous year)
- 2022: $1,492,907 (+$321,036, +27.40% from previous year)
- 2023: $1,494,340 (+$1,433, +0.10% from previous year)
- 2024: $1,675,054 (+$180,714, +12.09% from previous year)
- 2025: $1,647,988 ($-27,066, -1.62% from previous year)
West Tisbury’s housing market has surged by 147% since 2012. From modest beginnings just above $668K, values peaked in 2024 before settling at $1.65 million in 2025. Its biggest jumps came during the pandemic years, when interest in island living soared.
West Tisbury – Rustic Charm on Martha’s Vineyard
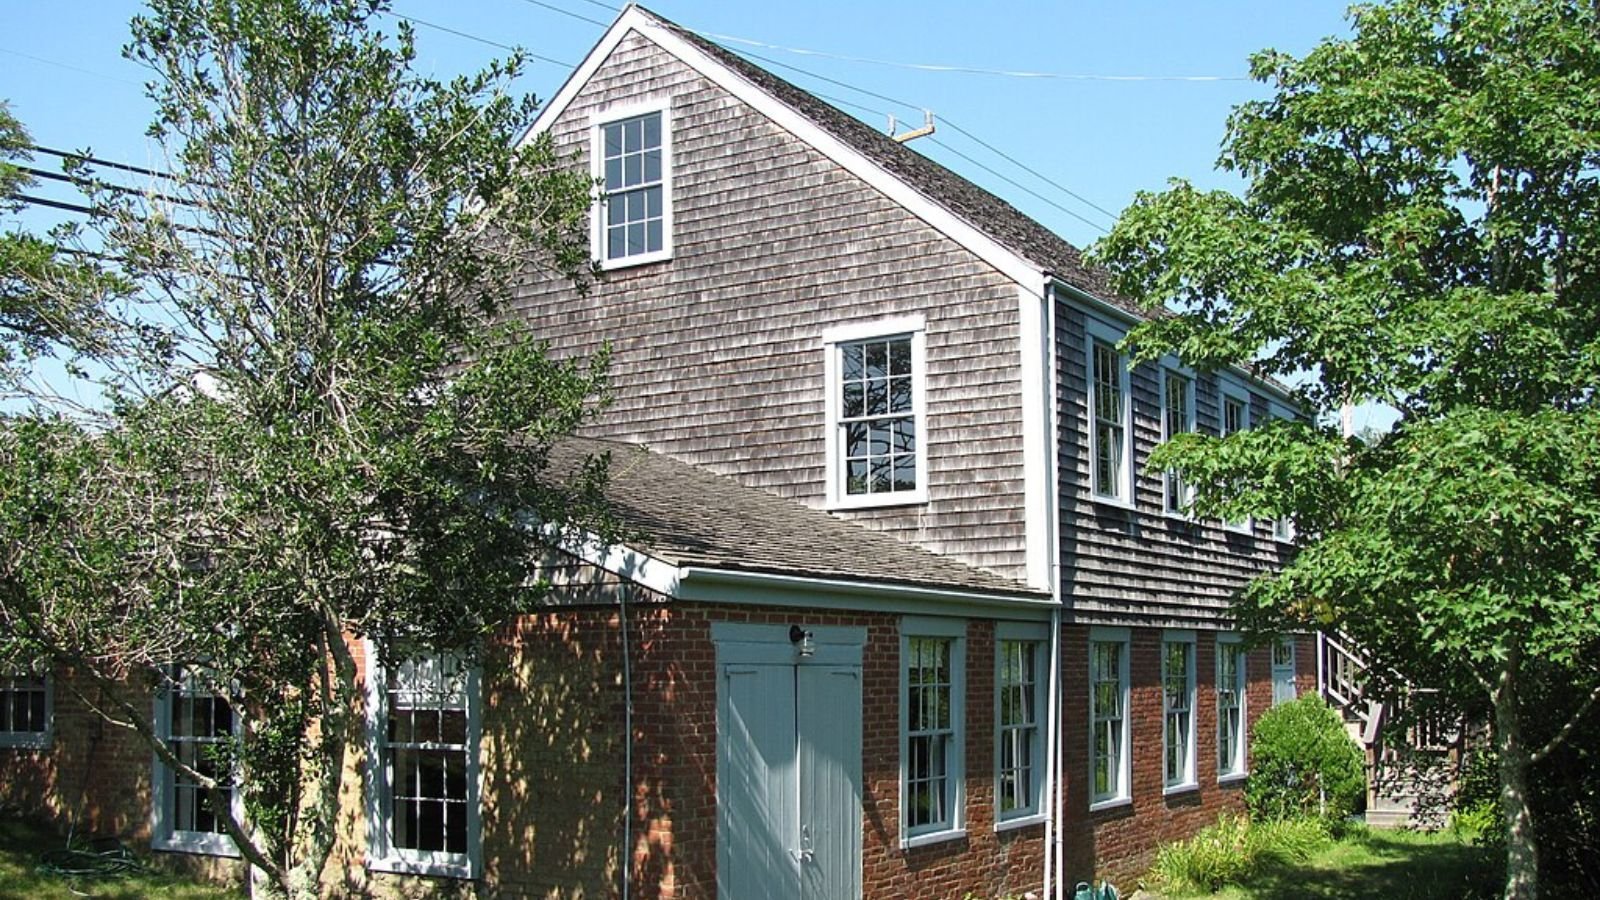
Located in the heart of Martha’s Vineyard, West Tisbury offers a quieter, more rural alternative to the island’s busier towns. With forested landscapes, beaches, and a close-knit community, it has long appealed to artists, retirees, and second-home buyers.
The town’s real estate boom mirrors the post-2020 flight to scenic, less crowded places. Although 2025 brought a small price decline, values remain far higher than a decade ago, supported by the island’s limited land and enduring prestige.
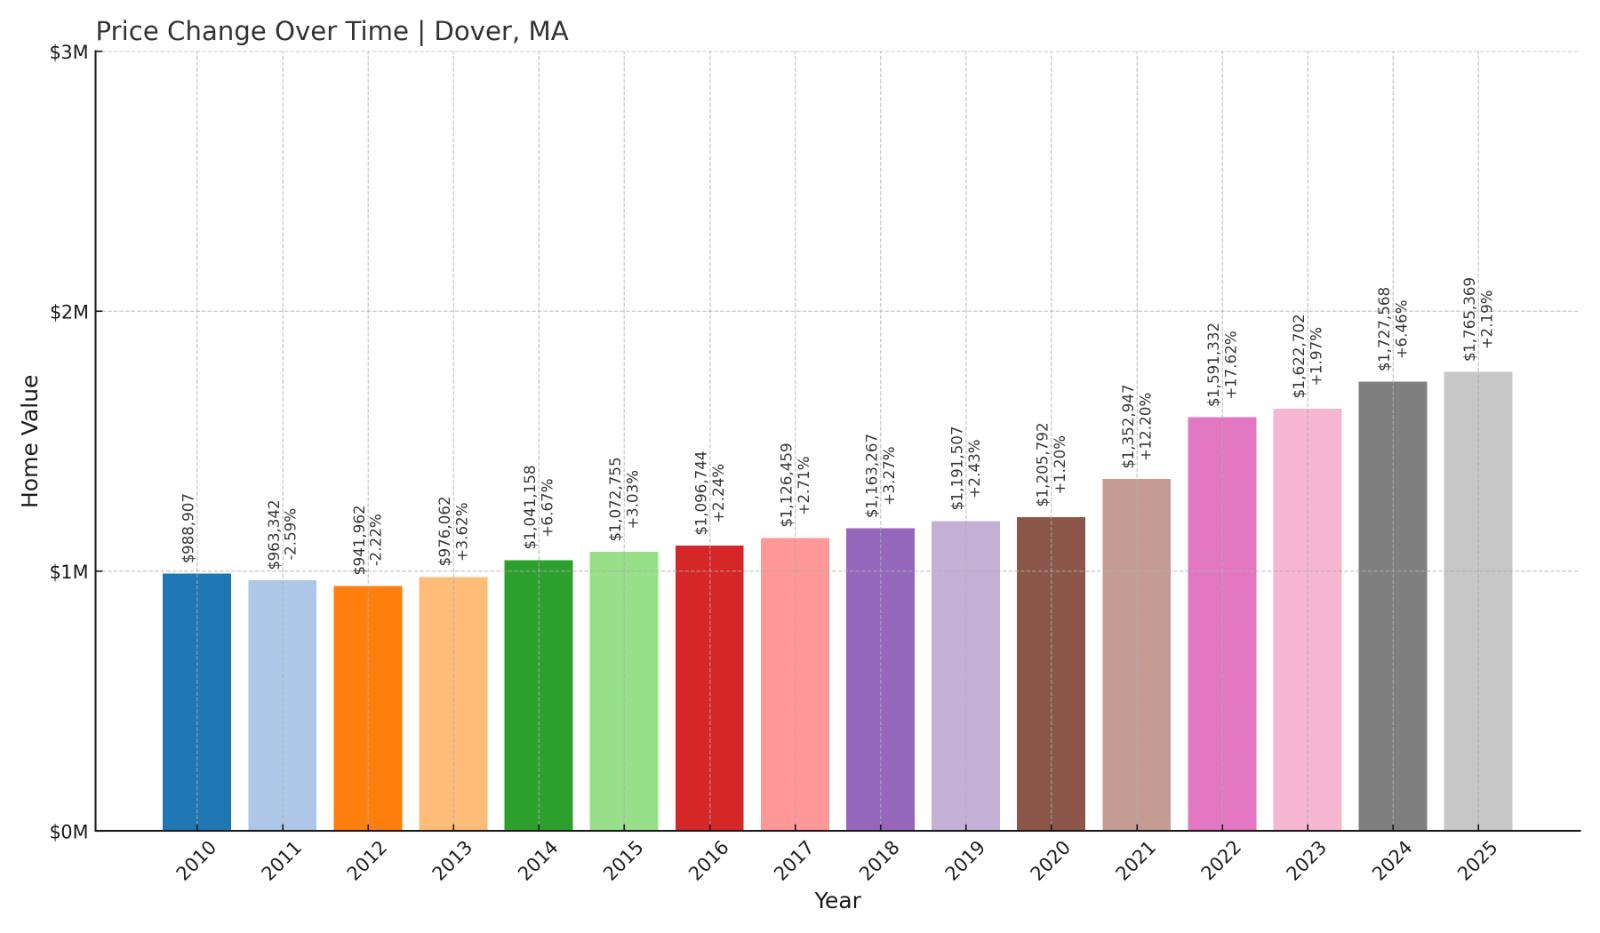
7. Dover – 106% Home Price Increase Since 2012
🔥 Would you like to save this?
- 2010: $988,907
- 2011: $963,342 ($-25,565, -2.59% from previous year)
- 2012: $941,962 ($-21,380, -2.22% from previous year)
- 2013: $976,062 (+$34,100, +3.62% from previous year)
- 2014: $1,041,158 (+$65,096, +6.67% from previous year)
- 2015: $1,072,755 (+$31,597, +3.03% from previous year)
- 2016: $1,096,744 (+$23,989, +2.24% from previous year)
- 2017: $1,126,459 (+$29,715, +2.71% from previous year)
- 2018: $1,163,267 (+$36,808, +3.27% from previous year)
- 2019: $1,191,507 (+$28,240, +2.43% from previous year)
- 2020: $1,205,792 (+$14,285, +1.20% from previous year)
- 2021: $1,352,947 (+$147,155, +12.20% from previous year)
- 2022: $1,591,332 (+$238,385, +17.62% from previous year)
- 2023: $1,622,702 (+$31,370, +1.97% from previous year)
- 2024: $1,727,568 (+$104,866, +6.46% from previous year)
- 2025: $1,765,369 (+$37,801, +2.19% from previous year)
Dover has seen home values increase from $941,962 in 2012 to $1.77 million in 2025—a 106% rise. Its gains were especially strong between 2020 and 2022, followed by moderate but steady appreciation through 2025.
Dover – Large Homes and Leafy Estates
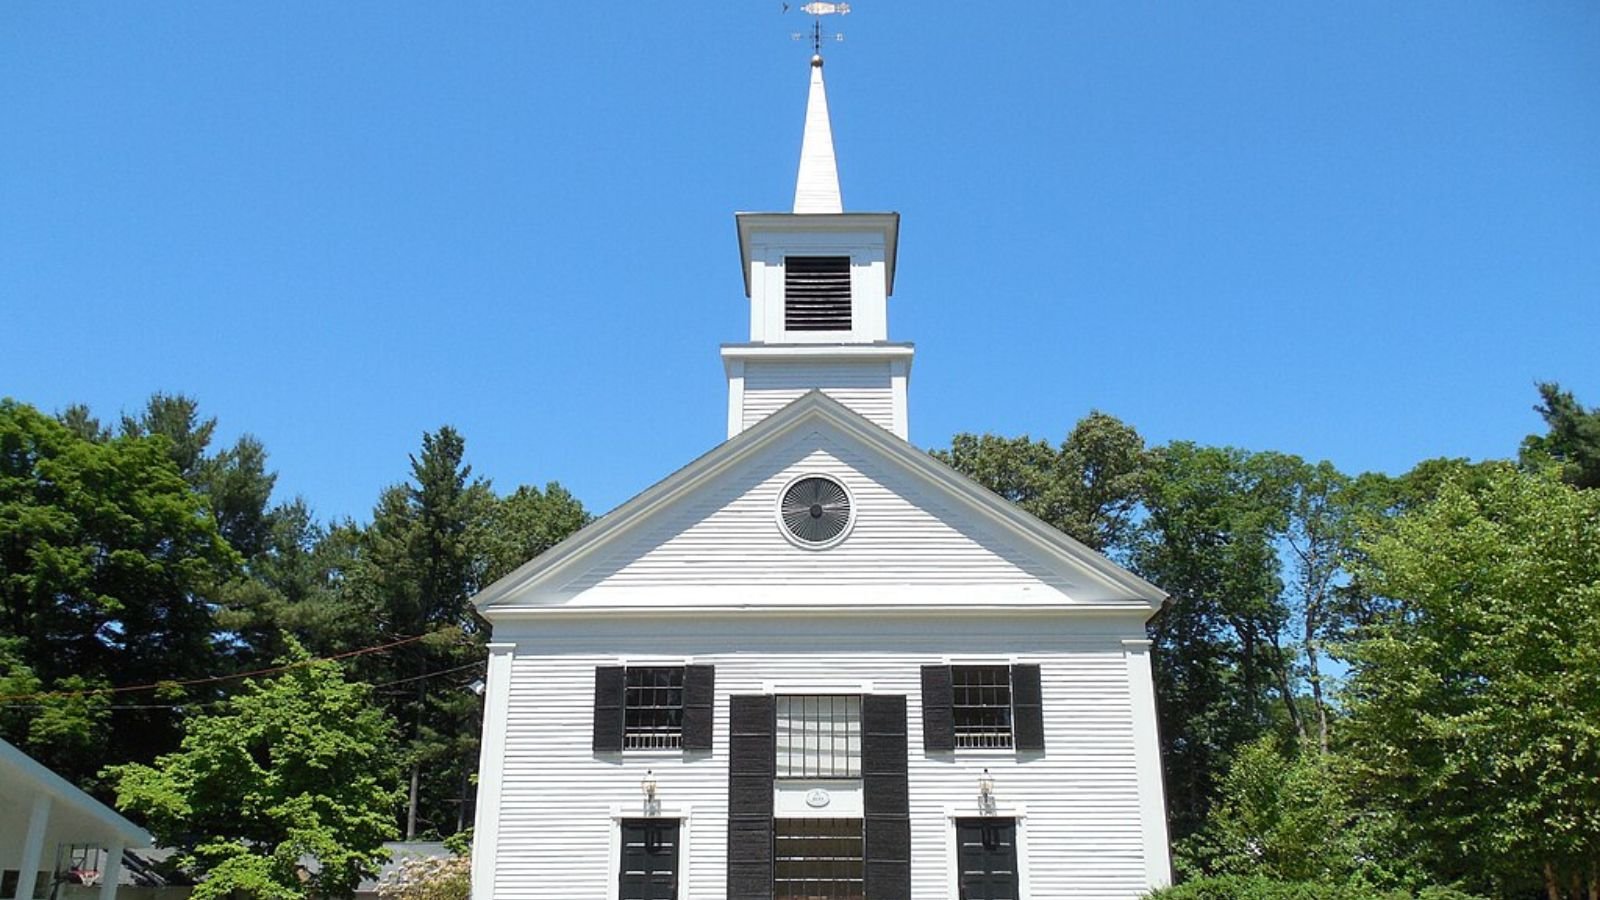
Often ranked among the wealthiest towns in the state, Dover features expansive properties, rural charm, and exceptional public schools. Just 15 miles from Boston, it’s a top choice for families seeking both space and prestige.
With limited new construction and large lot zoning, inventory remains tight. That’s helped keep prices on a consistent upward trajectory, even as other towns saw temporary dips. Dover remains one of Massachusetts’ most desirable—and expensive—suburbs.
6. Edgartown – 172% Home Price Increase Since 2012
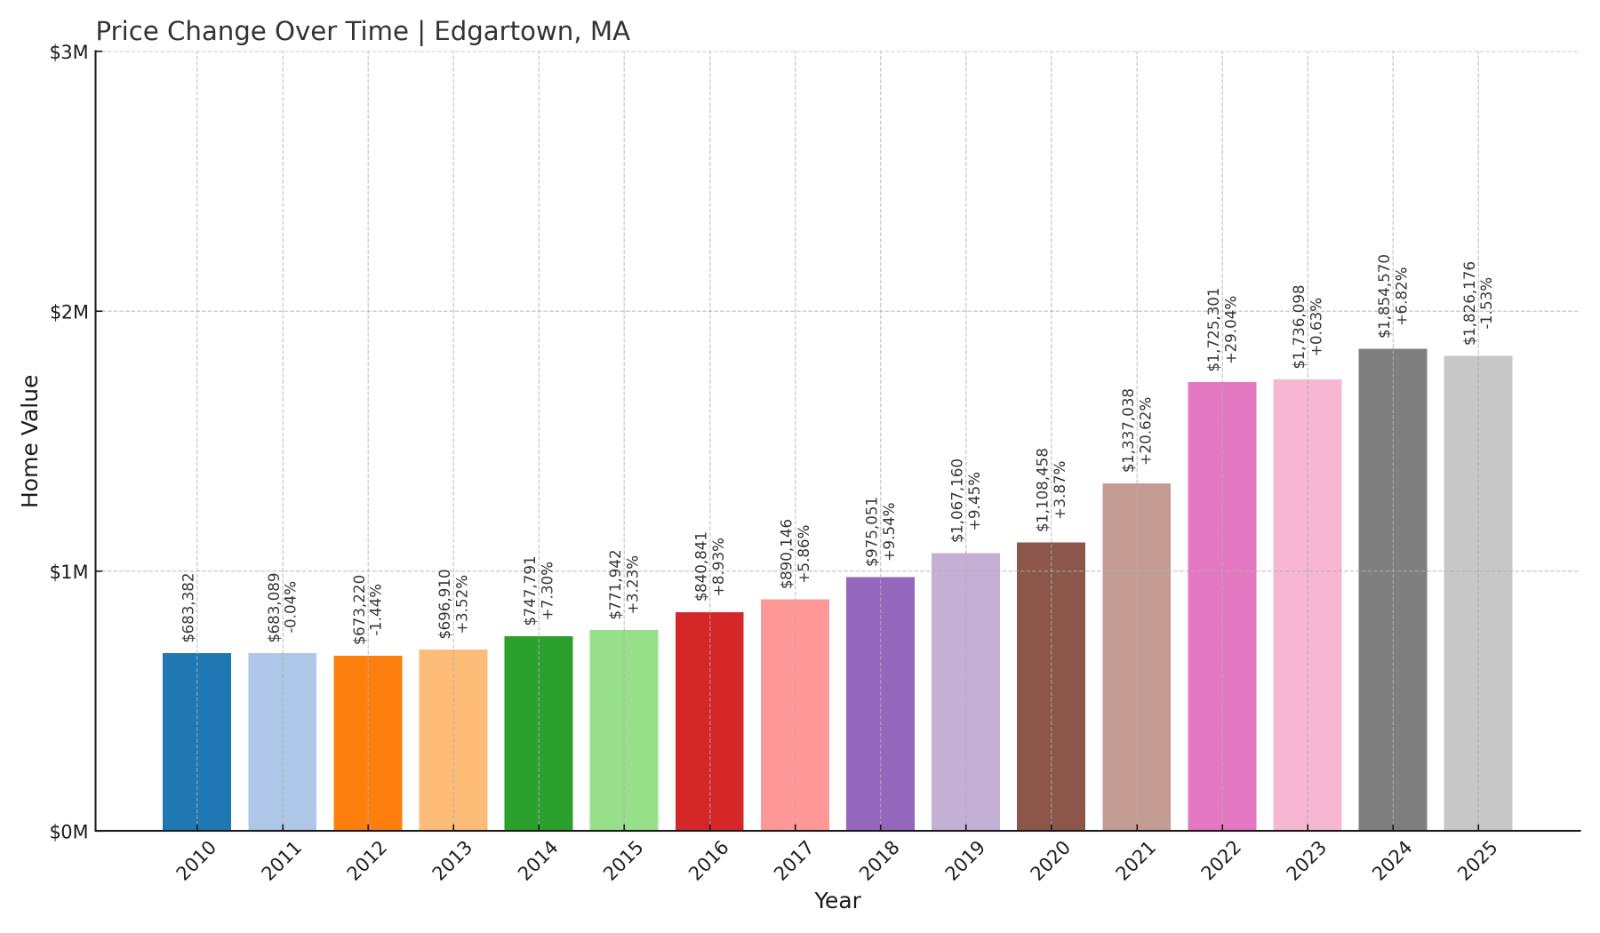
- 2010: $683,382
- 2011: $683,089 ($-293, -0.04% from previous year)
- 2012: $673,220 ($-9,869, -1.44% from previous year)
- 2013: $696,910 (+$23,690, +3.52% from previous year)
- 2014: $747,791 (+$50,881, +7.30% from previous year)
- 2015: $771,942 (+$24,151, +3.23% from previous year)
- 2016: $840,841 (+$68,899, +8.93% from previous year)
- 2017: $890,146 (+$49,305, +5.86% from previous year)
- 2018: $975,051 (+$84,905, +9.54% from previous year)
- 2019: $1,067,160 (+$92,109, +9.45% from previous year)
- 2020: $1,108,458 (+$41,298, +3.87% from previous year)
- 2021: $1,337,038 (+$228,580, +20.62% from previous year)
- 2022: $1,725,301 (+$388,263, +29.04% from previous year)
- 2023: $1,736,098 (+$10,797, +0.63% from previous year)
- 2024: $1,854,570 (+$118,472, +6.82% from previous year)
- 2025: $1,826,176 ($-28,394, -1.53% from previous year)
Edgartown’s housing market has climbed 172% since 2012. After a period of steady growth, prices took off between 2020 and 2022. Though values dipped slightly in 2025, the average home still commands over $1.82 million, among the highest in the state.
Edgartown – Prestige on the Vineyard
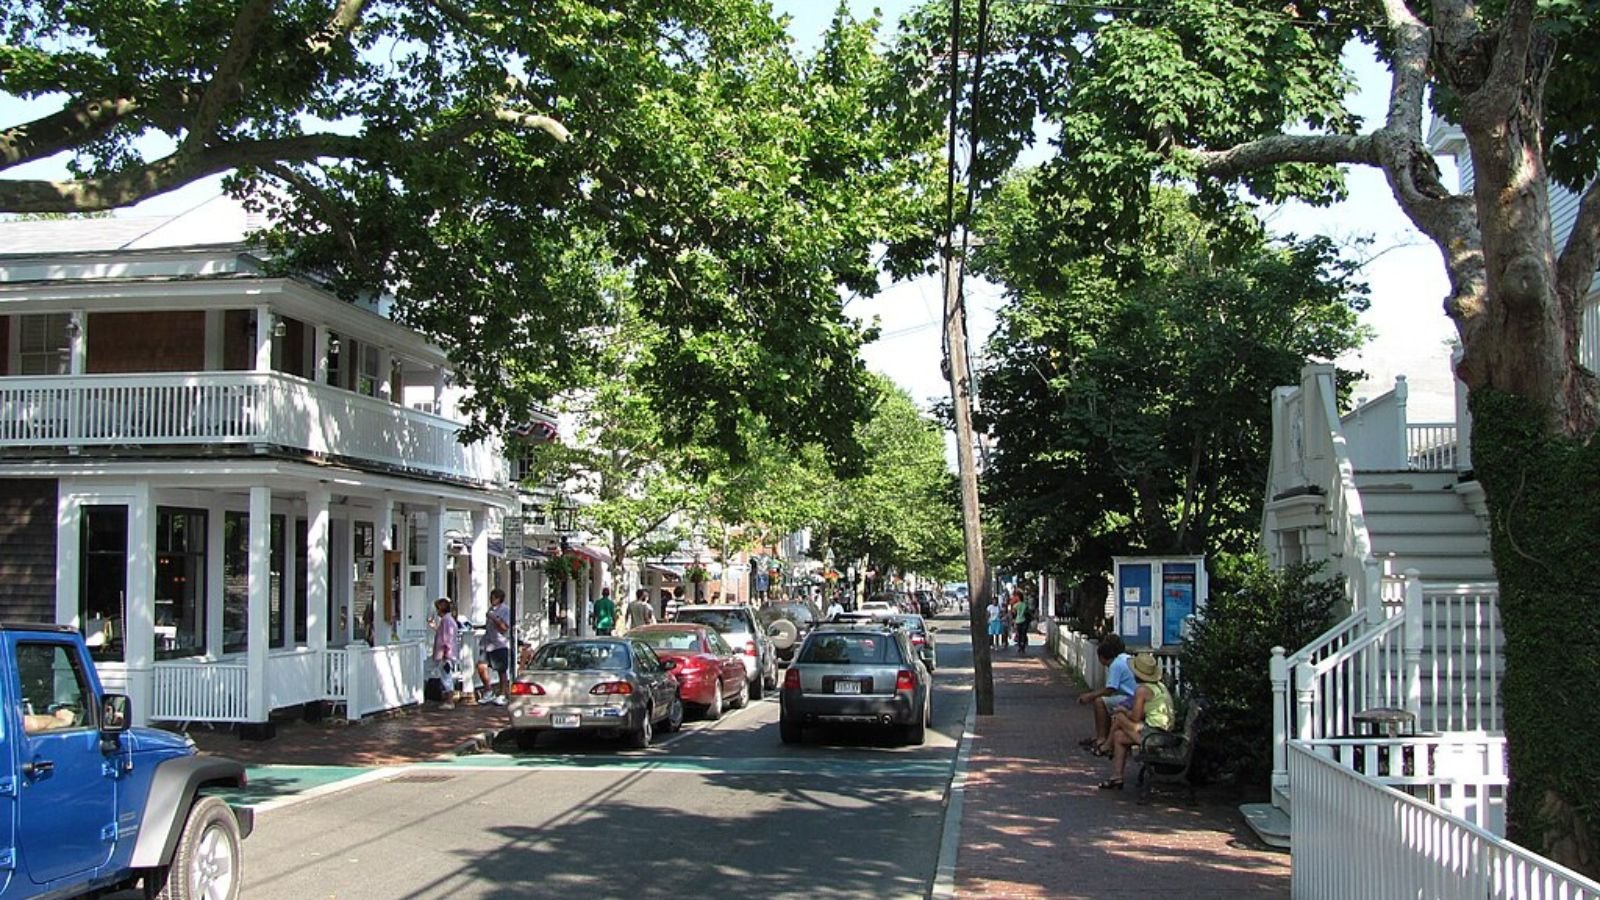
With its picture-perfect harbor, historic architecture, and upscale shops, Edgartown is a longtime favorite for second-home buyers. It’s one of the most exclusive destinations on Martha’s Vineyard, and home prices reflect that stature.
Limited land, a short building season, and strong demand have made big price gains inevitable. While 2025 showed a slight decline, it’s more likely a pause than a reversal for this highly desirable island market.
5. Aquinnah – 99% Home Price Increase Since 2012
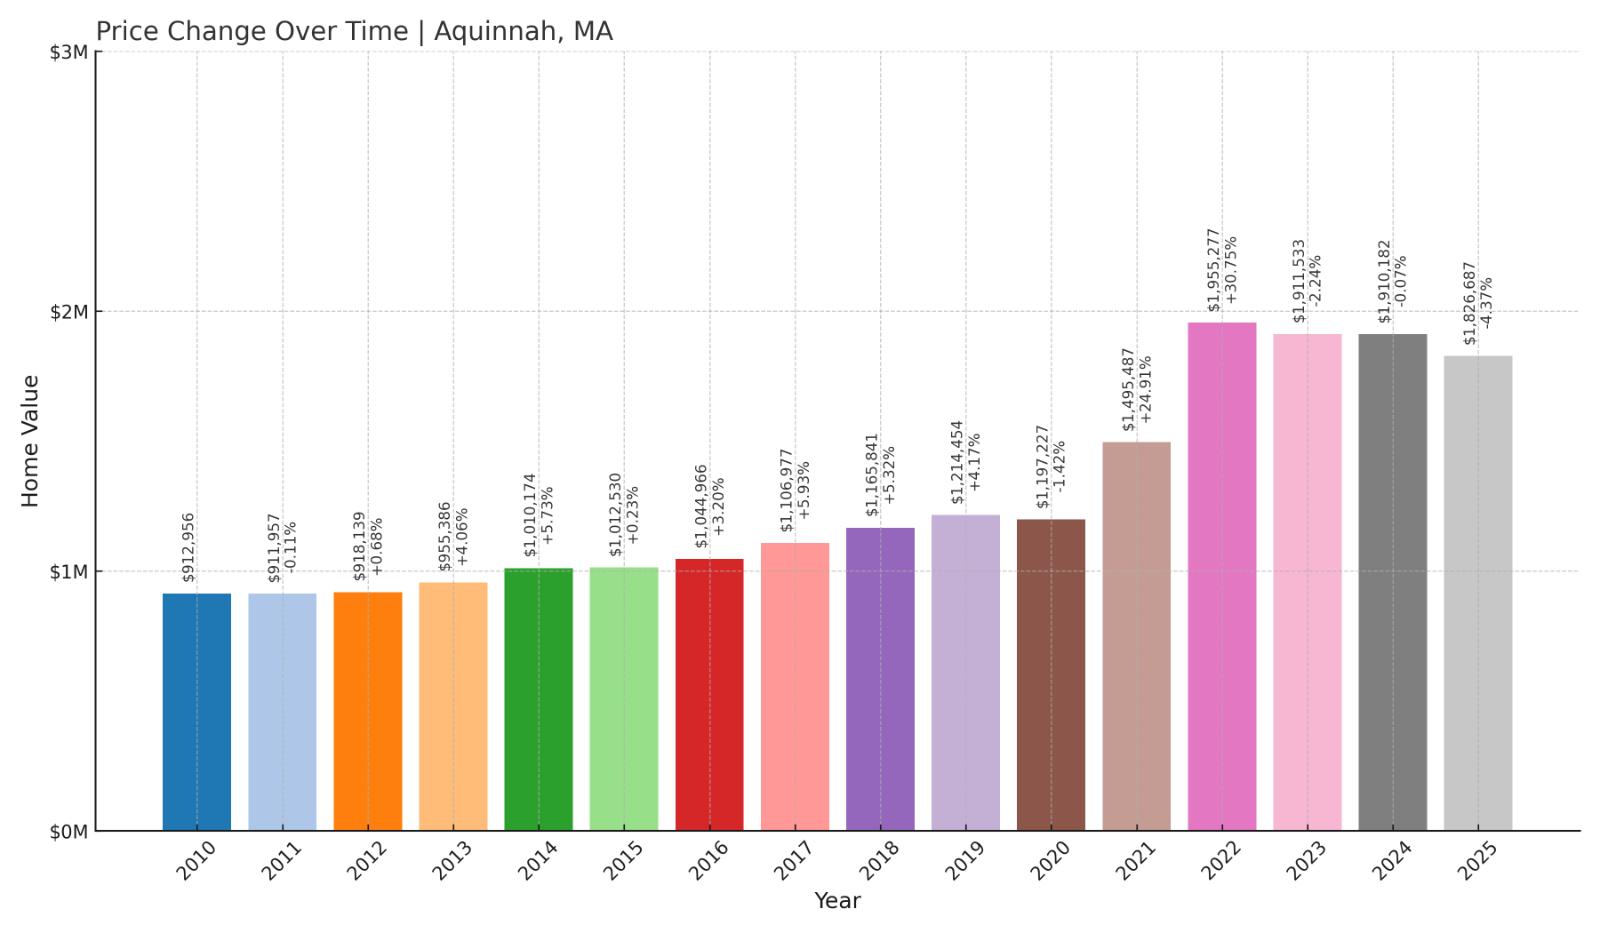
- 2010: $912,956
- 2011: $911,957 ($-999, -0.11% from previous year)
- 2012: $918,139 (+$6,182, +0.68% from previous year)
- 2013: $955,386 (+$37,247, +4.06% from previous year)
- 2014: $1,010,174 (+$54,788, +5.73% from previous year)
- 2015: $1,012,530 (+$2,356, +0.23% from previous year)
- 2016: $1,044,966 (+$32,436, +3.20% from previous year)
- 2017: $1,106,977 (+$62,011, +5.93% from previous year)
- 2018: $1,165,841 (+$58,864, +5.32% from previous year)
- 2019: $1,214,454 (+$48,613, +4.17% from previous year)
- 2020: $1,197,227 ($-17,227, -1.42% from previous year)
- 2021: $1,495,487 (+$298,260, +24.91% from previous year)
- 2022: $1,955,277 (+$459,790, +30.75% from previous year)
- 2023: $1,911,533 ($-43,744, -2.24% from previous year)
- 2024: $1,910,182 ($-1,351, -0.07% from previous year)
- 2025: $1,826,687 ($-83,495, -4.37% from previous year)
Aquinnah’s average home price has nearly doubled since 2012, rising from $918,139 to $1.83 million in 2025. While prices have declined modestly over the past three years, the town’s long-term appreciation remains strong, with massive spikes during the pandemic era fueling its elite ranking.
Aquinnah – Exclusive Cliffs and Island Prestige

Located at the western tip of Martha’s Vineyard, Aquinnah is remote even by island standards. It’s known for its dramatic clay cliffs, conservation land, and unobstructed ocean views. With no commercial center and just a handful of homes on the market at any given time, scarcity drives value here.
The town’s record-breaking growth in 2021 and 2022 was driven by a rush of luxury buyers seeking privacy and open space. Despite a recent pullback, Aquinnah remains one of the priciest markets in Massachusetts, a reflection of its natural beauty and strict development limits.
4. Wellesley – 117% Home Price Increase Since 2012
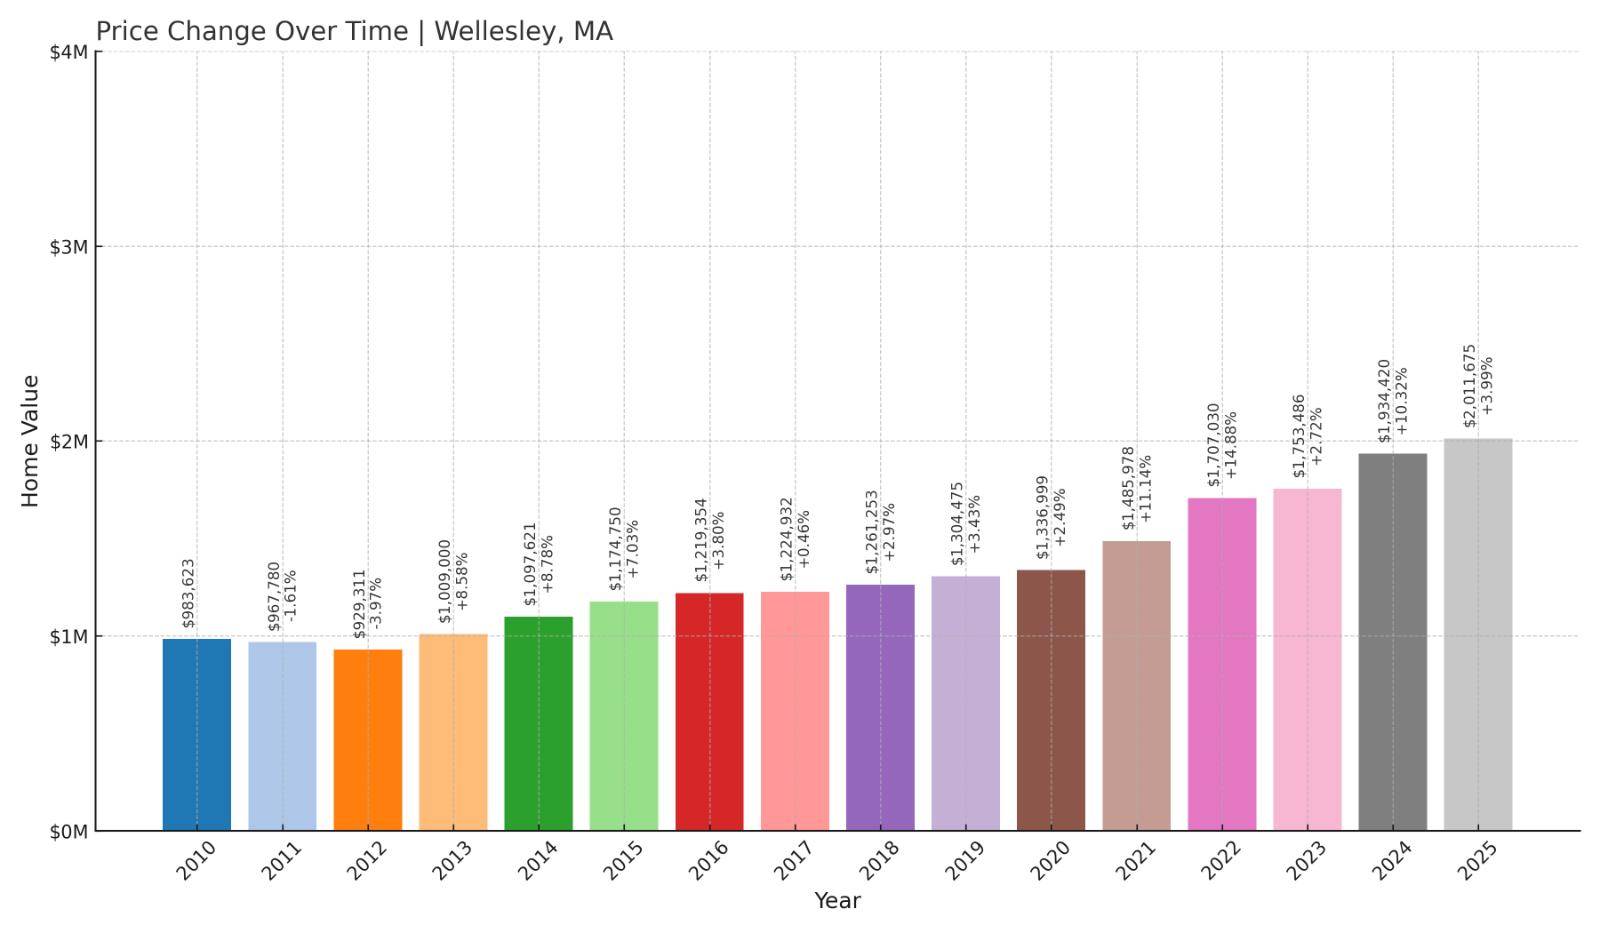
- 2010: $983,623
- 2011: $967,780 ($-15,843, -1.61% from previous year)
- 2012: $929,311 ($-38,469, -3.97% from previous year)
- 2013: $1,009,000 (+$79,689, +8.58% from previous year)
- 2014: $1,097,621 (+$88,621, +8.78% from previous year)
- 2015: $1,174,750 (+$77,129, +7.03% from previous year)
- 2016: $1,219,354 (+$44,604, +3.80% from previous year)
- 2017: $1,224,932 (+$5,578, +0.46% from previous year)
- 2018: $1,261,253 (+$36,321, +2.97% from previous year)
- 2019: $1,304,475 (+$43,222, +3.43% from previous year)
- 2020: $1,336,999 (+$32,524, +2.49% from previous year)
- 2021: $1,485,978 (+$148,979, +11.14% from previous year)
- 2022: $1,707,030 (+$221,052, +14.88% from previous year)
- 2023: $1,753,486 (+$46,456, +2.72% from previous year)
- 2024: $1,934,420 (+$180,934, +10.32% from previous year)
- 2025: $2,011,675 (+$77,255, +3.99% from previous year)
Wellesley’s home prices have risen steadily since 2012, growing 117% to reach just over $2 million in 2025. The town saw its strongest surges between 2020 and 2022, but it’s continued to gain value each year—one of the few towns with no price dips in over a decade.
Wellesley – High-End Suburb With Enduring Demand
Just 15 miles west of Boston, Wellesley is one of the state’s most prestigious suburbs. It’s home to Wellesley College, a walkable downtown, and top-tier public schools. Buyers come here for the classic New England aesthetic paired with modern amenities.
The consistent rise in home prices reflects the town’s limited inventory and deep buyer pool. With new construction often selling well above $3 million, Wellesley’s median price keeps climbing—and shows no signs of slowing.
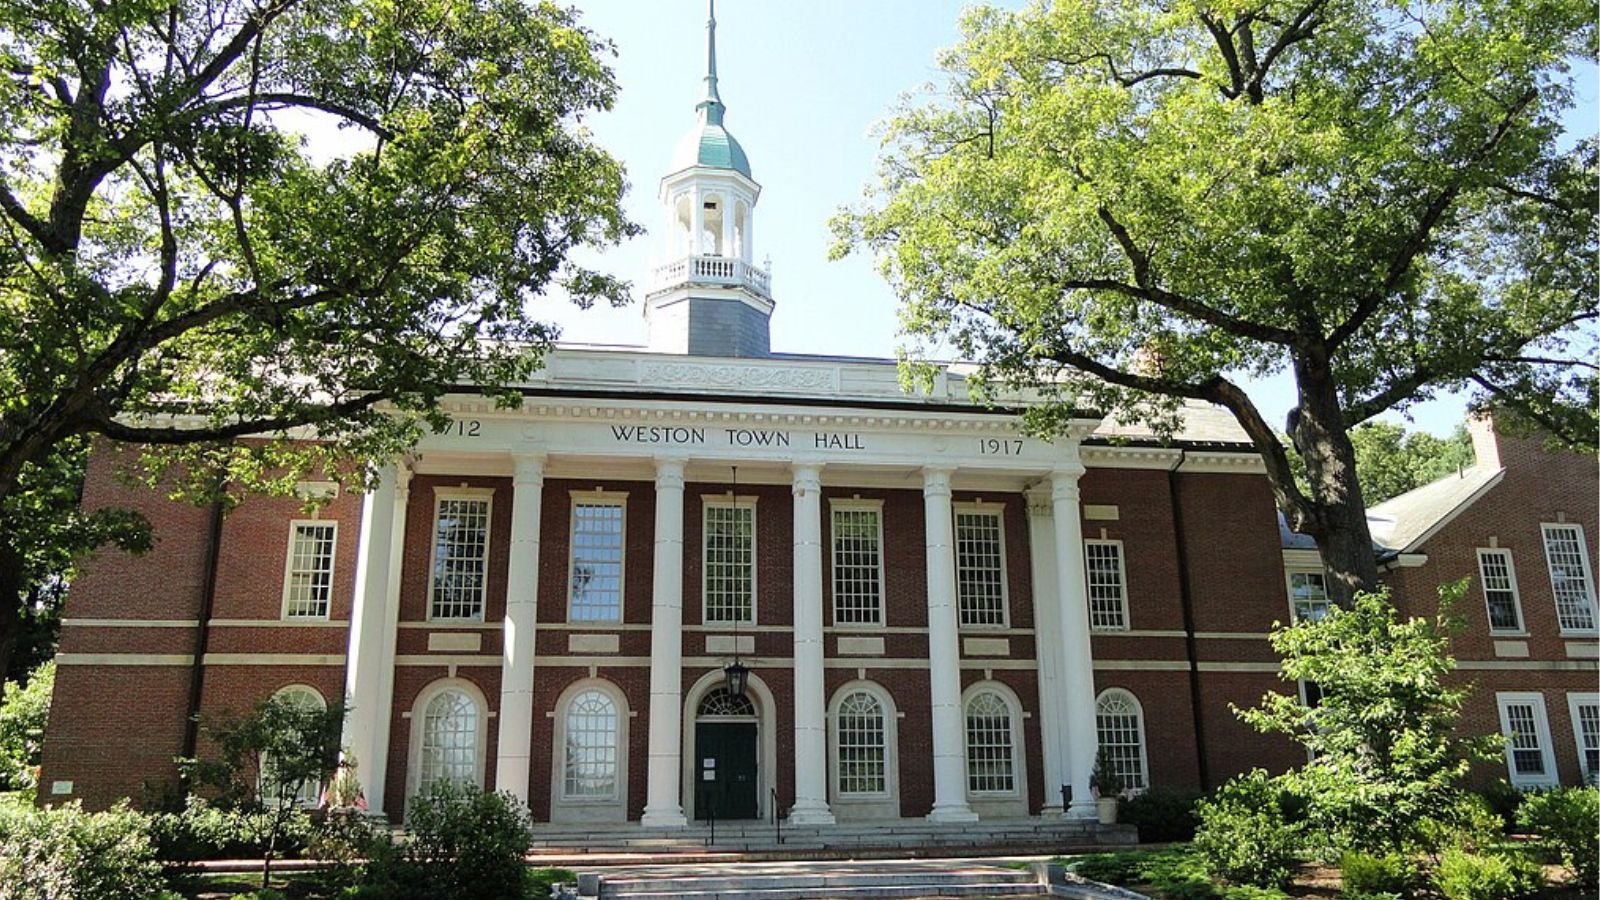
3. Weston – 98% Home Price Increase Since 2012

- 2010: $1,148,246
- 2011: $1,142,788 ($-5,458, -0.48% from previous year)
- 2012: $1,124,432 ($-18,356, -1.61% from previous year)
- 2013: $1,145,523 (+$21,091, +1.88% from previous year)
- 2014: $1,263,668 (+$118,145, +10.31% from previous year)
- 2015: $1,332,184 (+$68,516, +5.42% from previous year)
- 2016: $1,369,939 (+$37,755, +2.83% from previous year)
- 2017: $1,365,715 ($-4,224, -0.31% from previous year)
- 2018: $1,391,326 (+$25,611, +1.88% from previous year)
- 2019: $1,411,808 (+$20,482, +1.47% from previous year)
- 2020: $1,400,981 ($-10,827, -0.77% from previous year)
- 2021: $1,612,767 (+$211,786, +15.12% from previous year)
- 2022: $1,925,332 (+$312,565, +19.38% from previous year)
- 2023: $1,961,092 (+$35,760, +1.86% from previous year)
- 2024: $2,206,716 (+$245,624, +12.52% from previous year)
- 2025: $2,228,396 (+$21,680, +0.98% from previous year)
Weston’s home prices have grown from $1.12 million in 2012 to $2.23 million in 2025—a 98% increase. While not the fastest-growing, it remains one of the state’s most reliably expensive towns, with a steep rise over the past five years especially.
Weston – Where Price Reflects Prestige
🔥 Would you like to save this?
Known for its sprawling estates and wooded lots, Weston is one of Massachusetts’ most exclusive zip codes. It combines privacy, luxury, and top-ranked public schools in a town that strictly limits commercial development.
While year-to-year growth has varied, Weston’s long-term trajectory is clear. The 2024 spike of over 12% shows there’s still momentum, and its average price now edges closer to some of the highest in the Northeast.
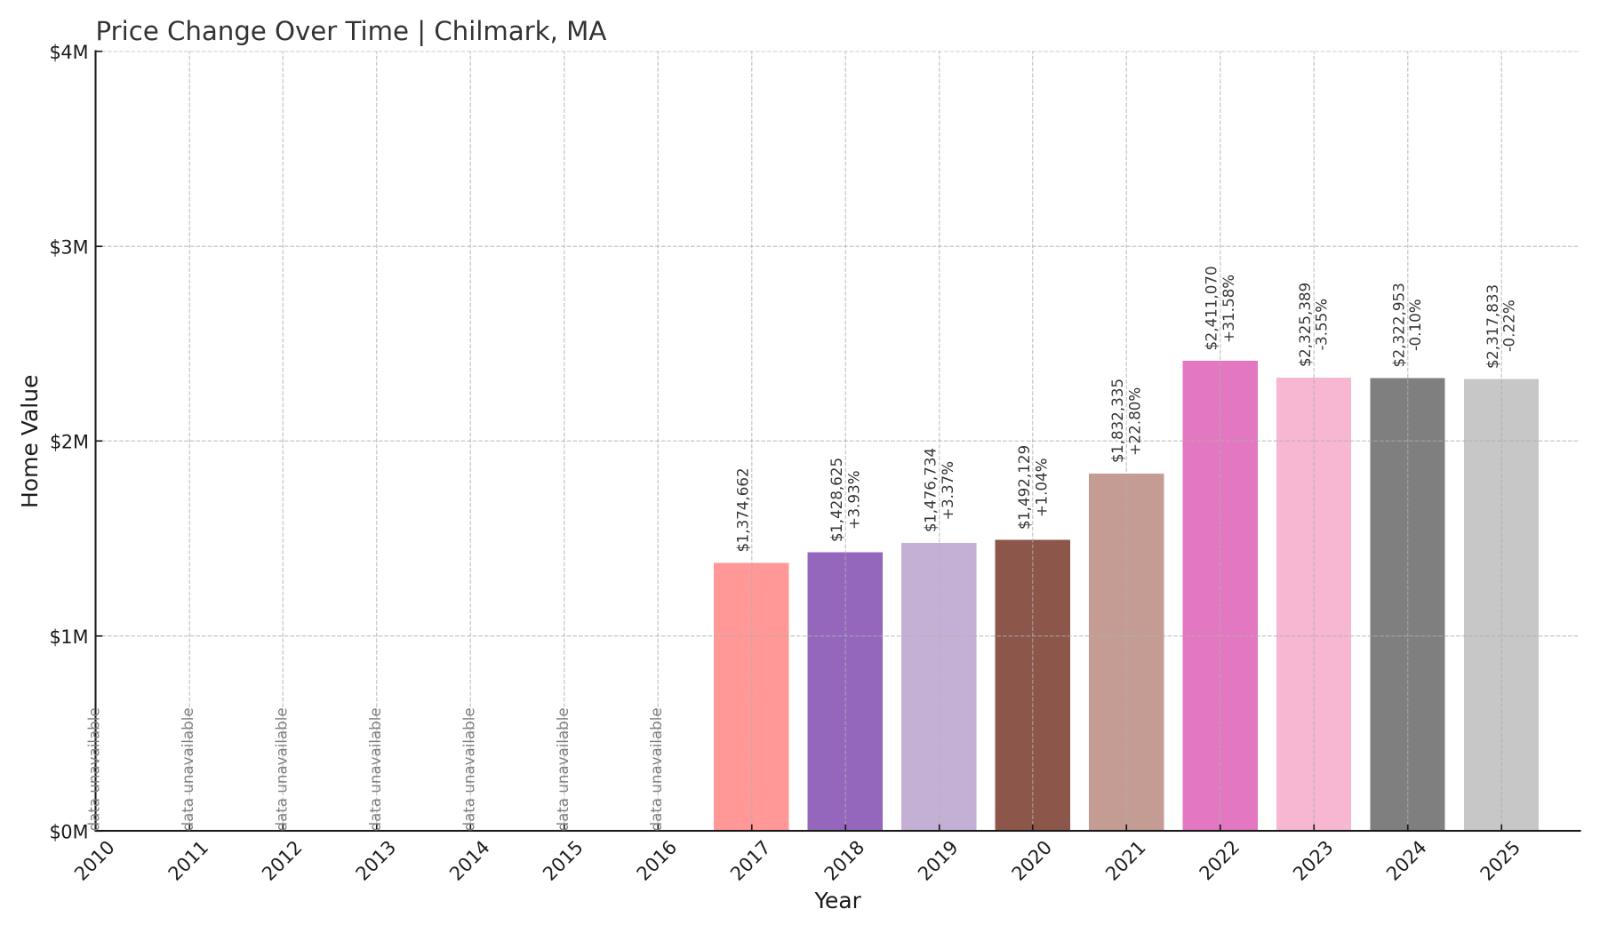
2. Chilmark – 68% Home Price Increase Since 2017
- 2010: N/A
- 2011: N/A
- 2012: N/A
- 2013: N/A
- 2014: N/A
- 2015: N/A
- 2016: N/A
- 2017: $1,374,662
- 2018: $1,428,625 (+$53,963, +3.93% from previous year)
- 2019: $1,476,734 (+$48,109, +3.37% from previous year)
- 2020: $1,492,129 (+$15,395, +1.04% from previous year)
- 2021: $1,832,335 (+$340,206, +22.80% from previous year)
- 2022: $2,411,070 (+$578,735, +31.58% from previous year)
- 2023: $2,325,389 ($-85,681, -3.55% from previous year)
- 2024: $2,322,953 ($-2,436, -0.10% from previous year)
- 2025: $2,317,833 ($-5,120, -0.22% from previous year)
Chilmark’s home prices jumped 68% since 2017, propelled by a meteoric rise during the pandemic. While values have flattened in recent years, it remains one of the most expensive places in the state, ending 2025 with an average home value of $2.32 million.
Chilmark – Vineyard Seclusion With Sky-High Prices
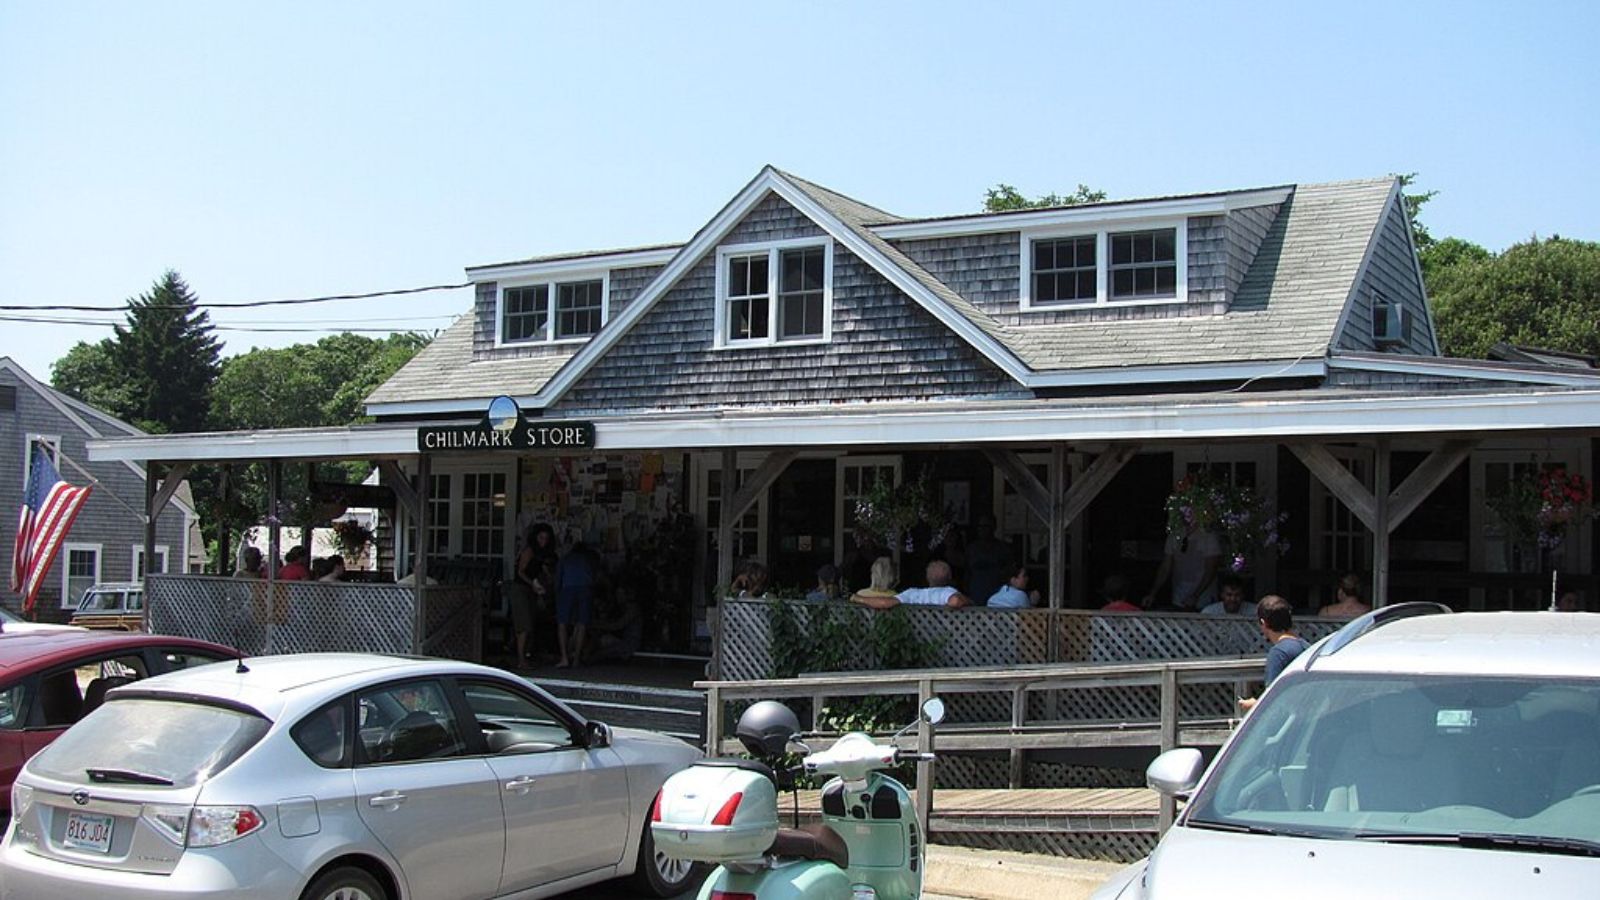
Chilmark is synonymous with exclusivity on Martha’s Vineyard. Known for stone walls, open space, and private beach associations, the town limits commercial development and short-term rentals, further tightening supply.
The result is one of the most expensive housing markets in New England. With few homes available and many off-market deals, public price data likely underestimates just how premium this market really is.
1. Nantucket – 148% Home Price Increase Since 2012
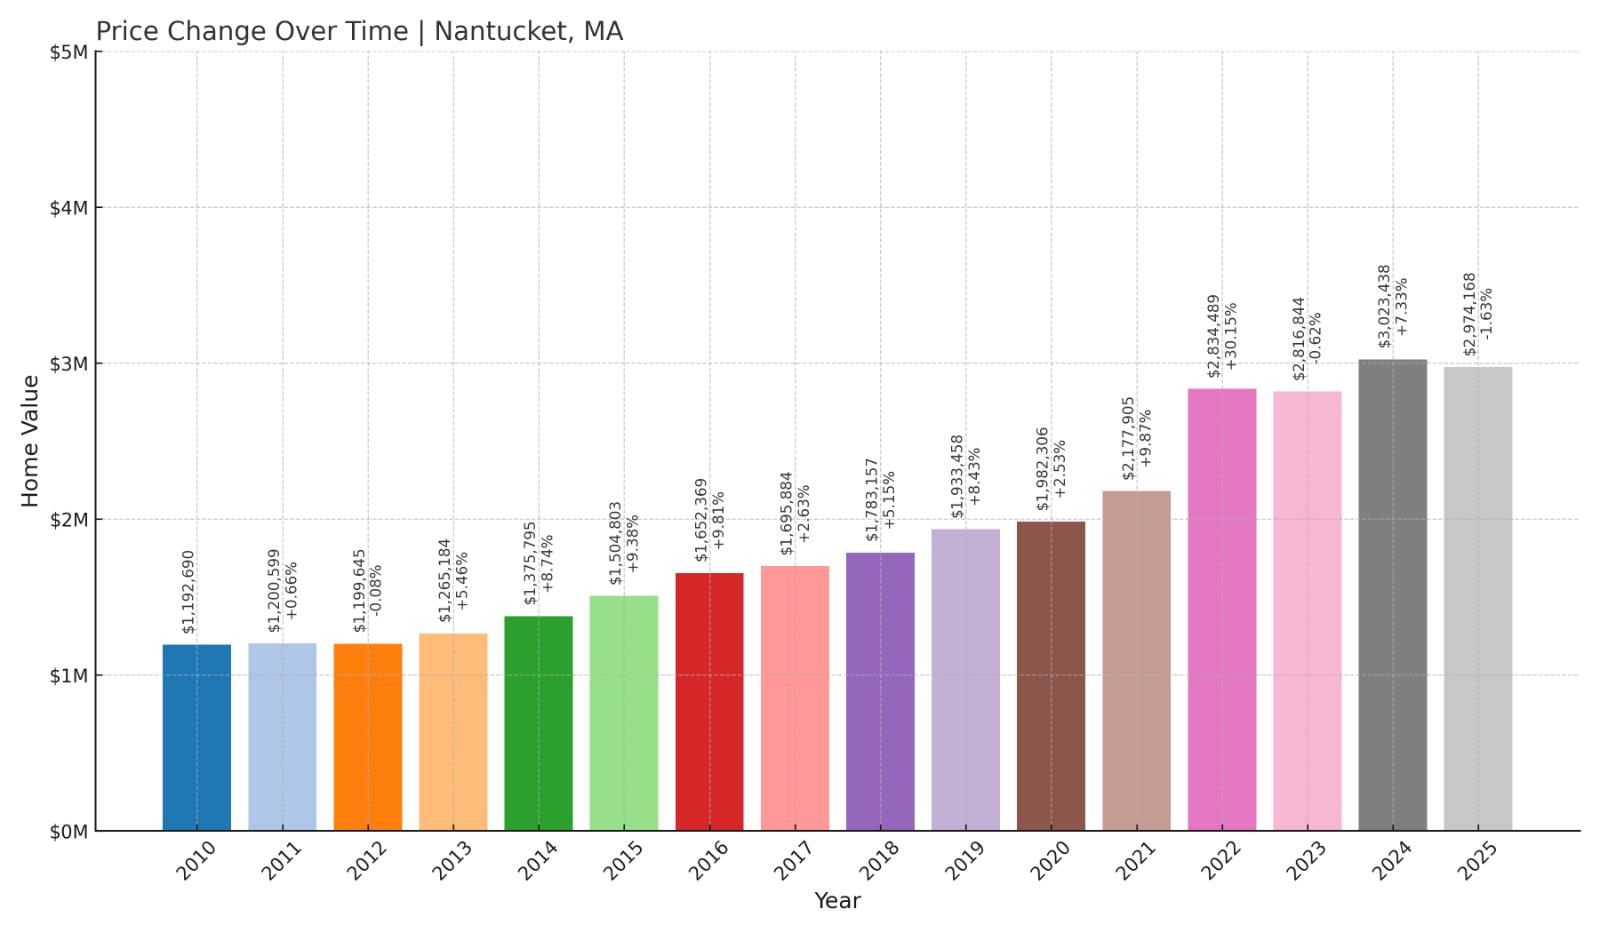
- 2010: $1,192,690
- 2011: $1,200,599 (+$7,909, +0.66% from previous year)
- 2012: $1,199,645 ($-954, -0.08% from previous year)
- 2013: $1,265,184 (+$65,539, +5.46% from previous year)
- 2014: $1,375,795 (+$110,611, +8.74% from previous year)
- 2015: $1,504,803 (+$129,008, +9.38% from previous year)
- 2016: $1,652,369 (+$147,566, +9.81% from previous year)
- 2017: $1,695,884 (+$43,515, +2.63% from previous year)
- 2018: $1,783,157 (+$87,273, +5.15% from previous year)
- 2019: $1,933,458 (+$150,301, +8.43% from previous year)
- 2020: $1,982,306 (+$48,848, +2.53% from previous year)
- 2021: $2,177,905 (+$195,599, +9.87% from previous year)
- 2022: $2,834,489 (+$656,584, +30.15% from previous year)
- 2023: $2,816,844 ($-17,645, -0.62% from previous year)
- 2024: $3,023,438 (+$206,594, +7.33% from previous year)
- 2025: $2,974,168 ($-49,270, -1.63% from previous year)
Nantucket tops the list with a 148% price increase since 2012, finishing 2025 at nearly $3 million. Despite a slight pullback this year, home values remain historically high, bolstered by soaring demand in the 2020–2022 window.
Nantucket – Massachusetts’ Most Expensive Market
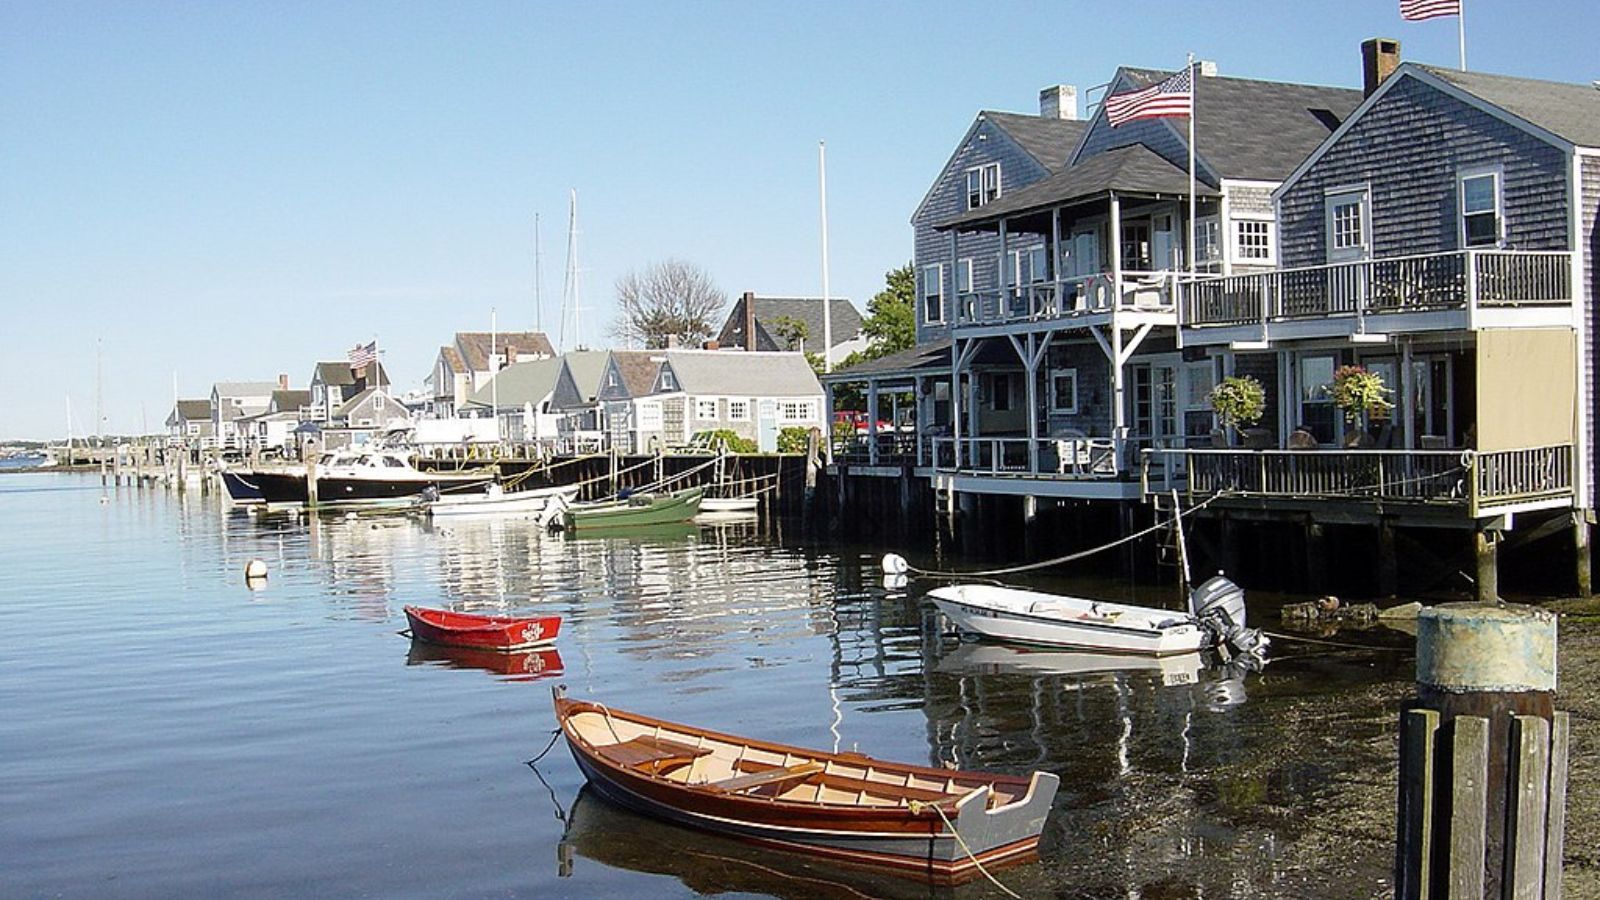
Nantucket’s status as the state’s priciest housing market is no surprise. The island is synonymous with high-end real estate, with historic charm, world-class beaches, and a tight cap on supply all fueling long-term price growth.
While some pandemic gains have cooled, the island remains a top-tier destination for ultra-wealthy buyers. With land scarce and construction tightly regulated, prices are unlikely to drop meaningfully anytime soon.


