
Would you like to save this?
The Zillow Home Value Index shows that home prices in Kentucky aren’t just rising—they’re soaring in some towns. These 18 communities now have the highest average home values in the state as of May 2025, marking them as Kentucky’s priciest places to buy.
But this isn’t just about big numbers. These towns tell deeper stories—of shifting demand, changing neighborhoods, and what buyers are really after right now. Some have grown slowly and steadily. Others took off fast. Either way, these spots are where real estate in the Bluegrass State is officially at a premium.
18. Taylorsville – 123% Home Price Increase Since 2011

- 2010: $171,494
- 2011: $160,814 (-$10,680, -6.23% from previous year)
- 2012: $160,669 (-$145, -0.09% from previous year)
- 2013: $168,970 (+$8,301, +5.17% from previous year)
- 2014: $176,607 (+$7,637, +4.52% from previous year)
- 2015: $185,815 (+$9,208, +5.21% from previous year)
- 2016: $201,452 (+$15,638, +8.42% from previous year)
- 2017: $215,474 (+$14,022, +6.96% from previous year)
- 2018: $229,388 (+$13,914, +6.46% from previous year)
- 2019: $238,853 (+$9,465, +4.13% from previous year)
- 2020: N/A
- 2021: $288,099
- 2022: $325,124 (+$37,026, +12.85% from previous year)
- 2023: $332,031 (+$6,907, +2.12% from previous year)
- 2024: $342,710 (+$10,679, +3.22% from previous year)
- 2025: $358,348 (+$15,637, +4.56% from previous year)
Taylorsville home prices have climbed steadily for over a decade, more than doubling since 2011. Despite a dip in 2011, the town rebounded with strong year-over-year gains. The sharp jump from 2019 to 2021 reflects the same post-pandemic surge seen across many parts of the U.S., even without 2020 data. Recent years show stable, modest increases as the market cools but stays strong.
Taylorsville – Small-Town Feel, Growing Prices
Taylorsville is nestled in Spencer County, about 30 miles southeast of Louisville. Known for its rural charm and access to Taylorsville Lake State Park, the town has become increasingly attractive to families and retirees looking for a slower pace within driving distance of urban amenities. The rise in home prices over time reflects this growing interest.
The 2025 home value of $358,348 marks a 123% increase from its 2011 value, signaling strong long-term growth. While prices have risen more gradually in recent years, the consistency speaks to sustained demand rather than a temporary boom. Taylorsville’s combination of natural beauty, relative affordability, and location helps explain the town’s steady rise on this list.
17. Hebron – 93% Home Price Increase Since 2011

- 2010: $195,394
- 2011: $186,380 (-$9,013, -4.61% from previous year)
- 2012: $188,400 (+$2,019, +1.08% from previous year)
- 2013: $194,043 (+$5,643, +3.00% from previous year)
- 2014: $202,274 (+$8,232, +4.24% from previous year)
- 2015: $206,675 (+$4,401, +2.18% from previous year)
- 2016: $210,248 (+$3,573, +1.73% from previous year)
- 2017: $214,501 (+$4,254, +2.02% from previous year)
- 2018: $230,838 (+$16,337, +7.62% from previous year)
- 2019: $244,273 (+$13,435, +5.82% from previous year)
- 2020: N/A
- 2021: $288,828
- 2022: $333,418 (+$44,590, +15.44% from previous year)
- 2023: $338,810 (+$5,392, +1.62% from previous year)
- 2024: $346,266 (+$7,456, +2.20% from previous year)
- 2025: $359,402 (+$13,136, +3.79% from previous year)
Hebron’s home values nearly doubled between 2011 and 2025. Price appreciation remained modest for much of the 2010s before heating up sharply after 2019. Since 2021, growth has slowed but remained positive, reflecting a maturing market with continued buyer interest.
Hebron – Growing Suburb with Airport Proximity
Located in Boone County, Hebron sits right next to the Cincinnati/Northern Kentucky International Airport. That proximity makes it appealing for commuters and frequent travelers. New subdivisions and retail development in recent years have added to its appeal, all while maintaining a suburban, family-friendly atmosphere.
With a 2025 home value of $359,402, Hebron now ranks among the most expensive towns in the state. Its location, amenities, and job access help explain the persistent price gains, especially the leap after 2019 when remote work and migration trends reshaped demand patterns.
16. Pewee Valley – 97% Home Price Increase Since 2011

- 2010: $184,409
- 2011: $183,305 (-$1,104, -0.60% from previous year)
- 2012: $184,131 (+$826, +0.45% from previous year)
- 2013: $190,706 (+$6,575, +3.57% from previous year)
- 2014: $197,243 (+$6,537, +3.43% from previous year)
- 2015: $204,449 (+$7,206, +3.65% from previous year)
- 2016: $213,541 (+$9,092, +4.45% from previous year)
- 2017: $228,557 (+$15,016, +7.03% from previous year)
- 2018: $245,573 (+$17,016, +7.44% from previous year)
- 2019: $253,739 (+$8,166, +3.33% from previous year)
- 2020: N/A
- 2021: $292,985
- 2022: $326,845 (+$33,860, +11.56% from previous year)
- 2023: $337,534 (+$10,689, +3.27% from previous year)
- 2024: $347,634 (+$10,100, +2.99% from previous year)
- 2025: $361,941 (+$14,308, +4.12% from previous year)
Pewee Valley’s home values have almost doubled since 2011. The town saw steady, healthy appreciation through the 2010s, followed by bigger jumps post-2019. Prices in 2025 remain on an upward trend, suggesting continued demand for this sought-after community.
Pewee Valley – History and Charm Meet High Demand

Would you like to save this?
Pewee Valley sits in Oldham County, just northeast of Louisville. Known for its tree-lined streets and historic homes, the town mixes small-town charm with excellent public schools and quick access to Louisville. These qualities make it especially appealing to families and professionals.
At $361,941, Pewee Valley’s 2025 home values reflect both its heritage and its desirability. While growth has slowed slightly in the last couple of years, consistent demand continues to keep prices moving upward, making it one of Kentucky’s top-tier housing markets.
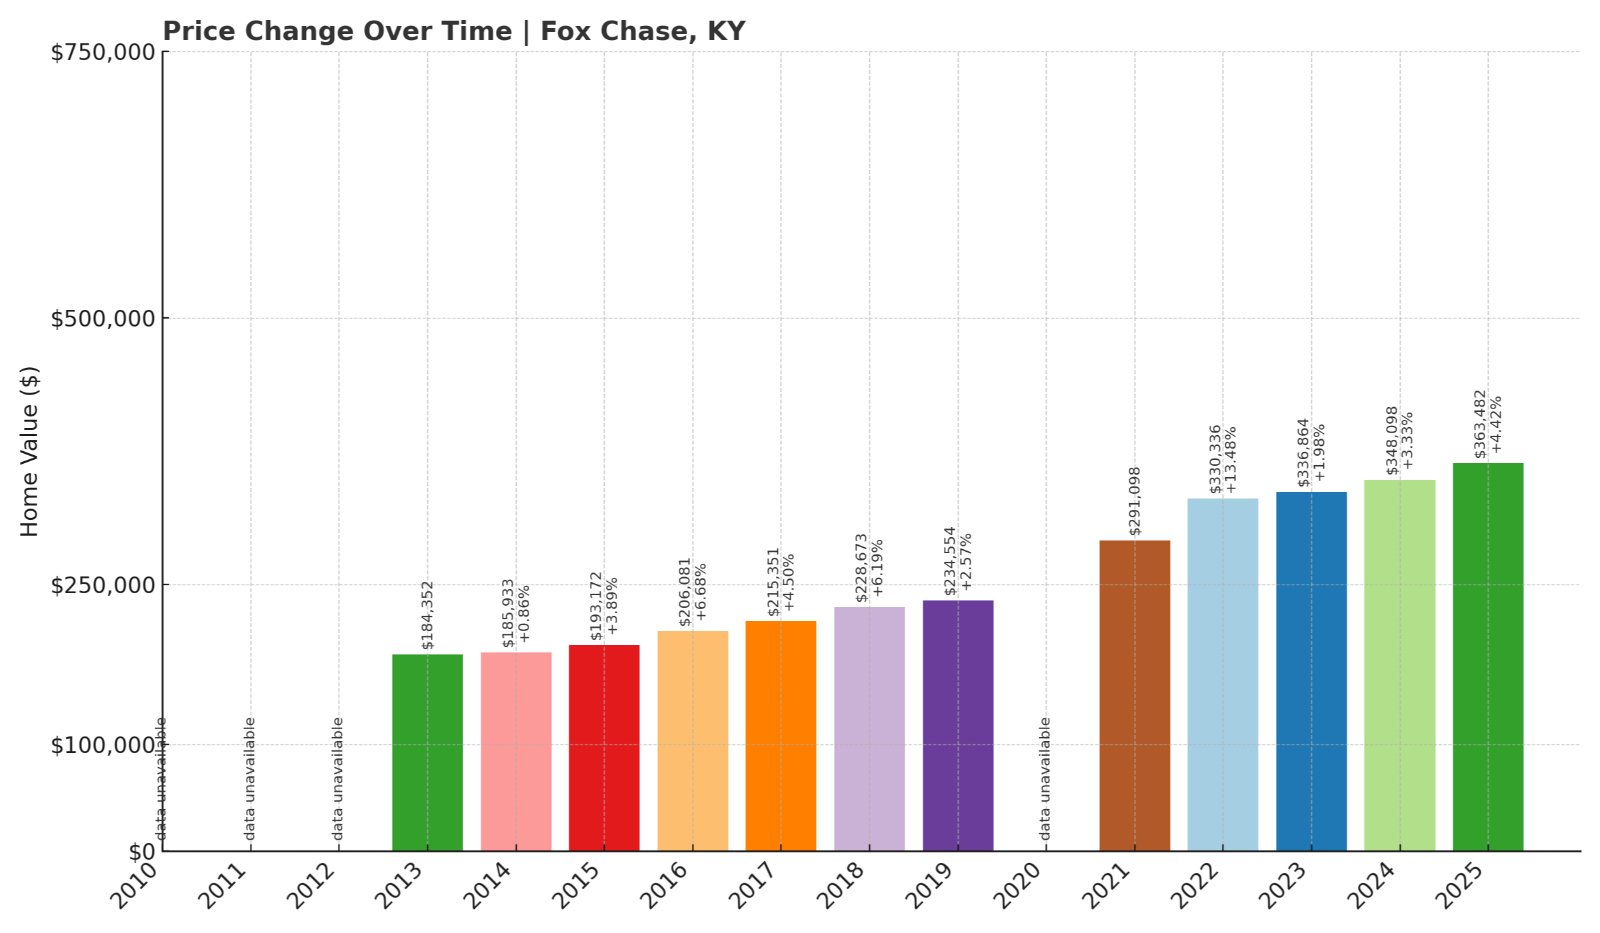
15. Fox Chase – 97% Home Price Increase Since 2013
- 2010: N/A
- 2011: N/A
- 2012: N/A
- 2013: $184,352
- 2014: $185,933 (+$1,581, +0.86% from previous year)
- 2015: $193,172 (+$7,239, +3.89% from previous year)
- 2016: $206,081 (+$12,909, +6.68% from previous year)
- 2017: $215,351 (+$9,270, +4.50% from previous year)
- 2018: $228,673 (+$13,322, +6.19% from previous year)
- 2019: $234,554 (+$5,881, +2.57% from previous year)
- 2020: N/A
- 2021: $291,098
- 2022: $330,336 (+$39,238, +13.48% from previous year)
- 2023: $336,864 (+$6,528, +1.98% from previous year)
- 2024: $348,098 (+$11,235, +3.34% from previous year)
- 2025: $363,482 (+$15,384, +4.42% from previous year)
Fox Chase home prices have nearly doubled since 2013. After steady gains for several years, values surged again after 2019, mirroring broader housing trends. Prices have continued rising through 2025, keeping the market highly competitive.
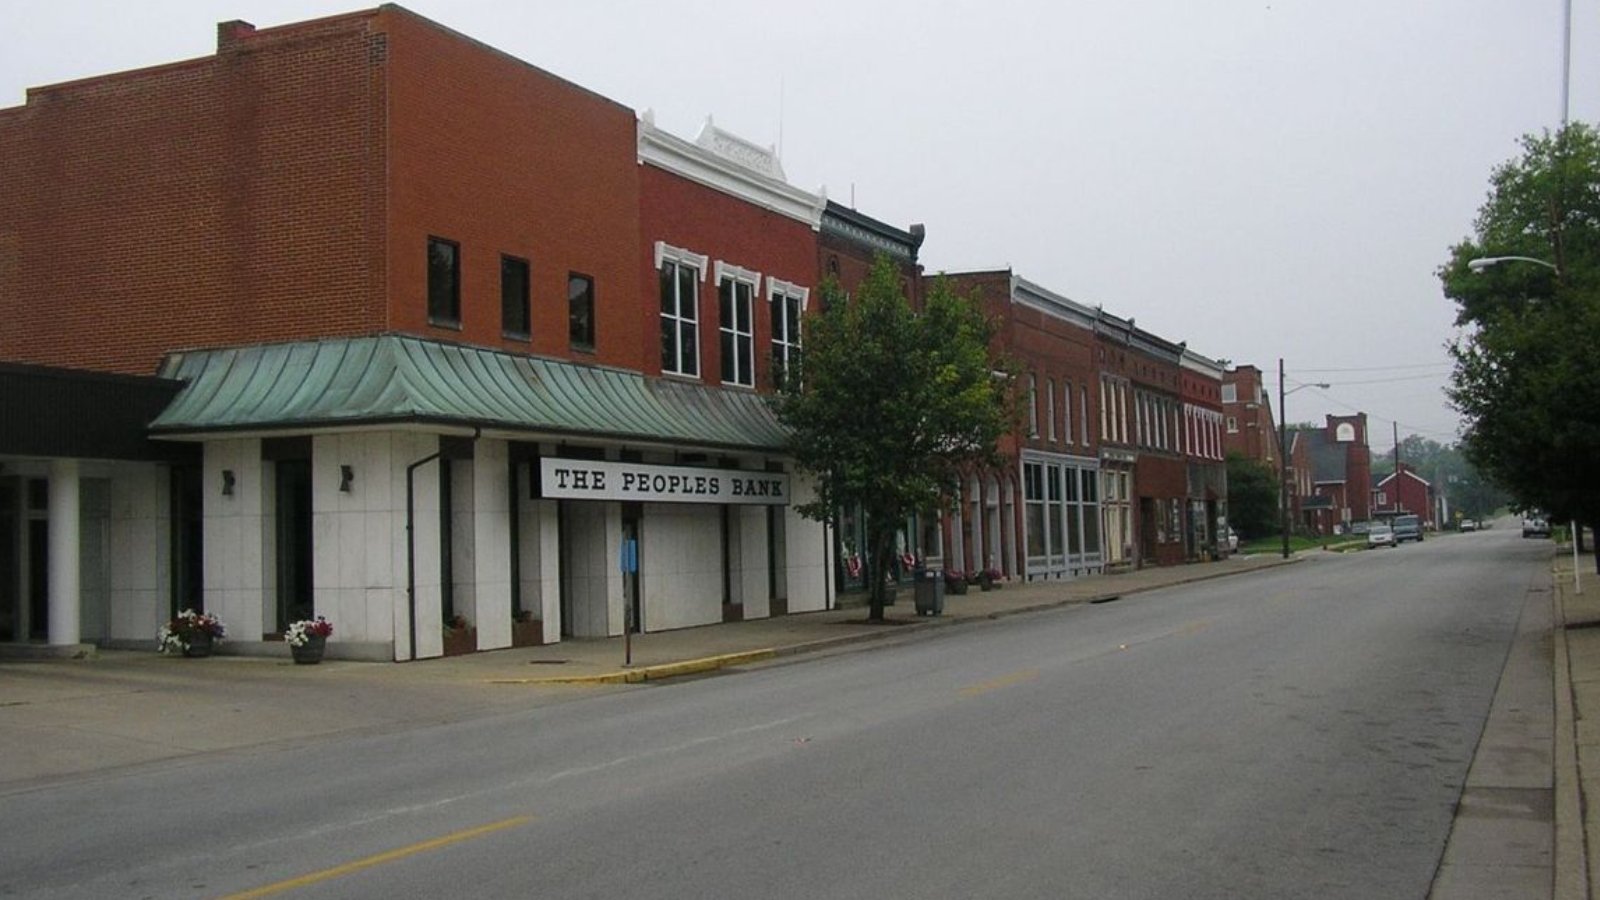
Fox Chase – Quiet Community, Big Price Growth

Fox Chase is a small city in Bullitt County, just south of Louisville. Known for its suburban feel, low crime rates, and quiet neighborhoods, it attracts families looking for space and convenience. While it’s compact in size, home values here have grown significantly.
The 2025 price point of $363,482 shows how desirable this area has become. Fox Chase may fly under the radar, but it’s proven to be a high-return market over the past decade, making it a solid choice for long-term homeowners and investors alike.
14. Park Hills – 95% Home Price Increase Since 2012
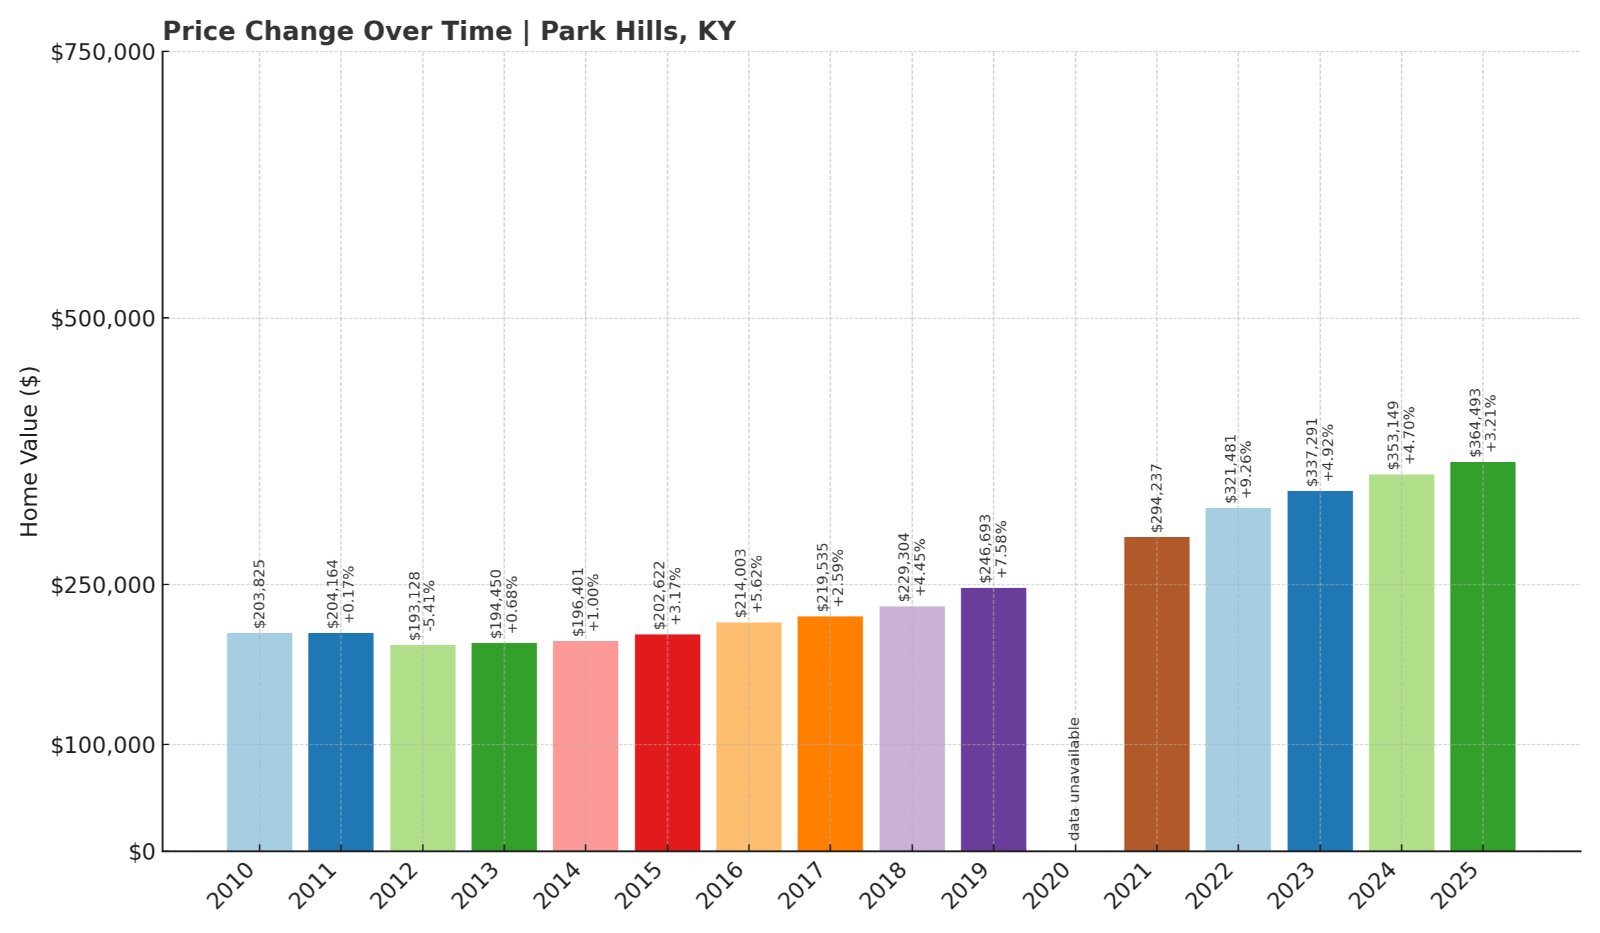
- 2010: $203,825
- 2011: $204,164 (+$339, +0.17% from previous year)
- 2012: $193,128 (-$11,036, -5.41% from previous year)
- 2013: $194,450 (+$1,322, +0.68% from previous year)
- 2014: $196,401 (+$1,952, +1.00% from previous year)
- 2015: $202,622 (+$6,221, +3.17% from previous year)
- 2016: $214,003 (+$11,381, +5.62% from previous year)
- 2017: $219,535 (+$5,532, +2.59% from previous year)
- 2018: $229,304 (+$9,769, +4.45% from previous year)
- 2019: $246,693 (+$17,390, +7.58% from previous year)
- 2020: N/A
- 2021: $294,237
- 2022: $321,481 (+$27,243, +9.26% from previous year)
- 2023: $337,291 (+$15,811, +4.92% from previous year)
- 2024: $353,149 (+$15,857, +4.70% from previous year)
- 2025: $364,493 (+$11,345, +3.21% from previous year)
Park Hills has experienced a near-doubling of home prices since 2012. Early 2010s growth was modest, but the real acceleration began in 2016 and continued into the 2020s. Today, it stands as one of Northern Kentucky’s most valuable markets.
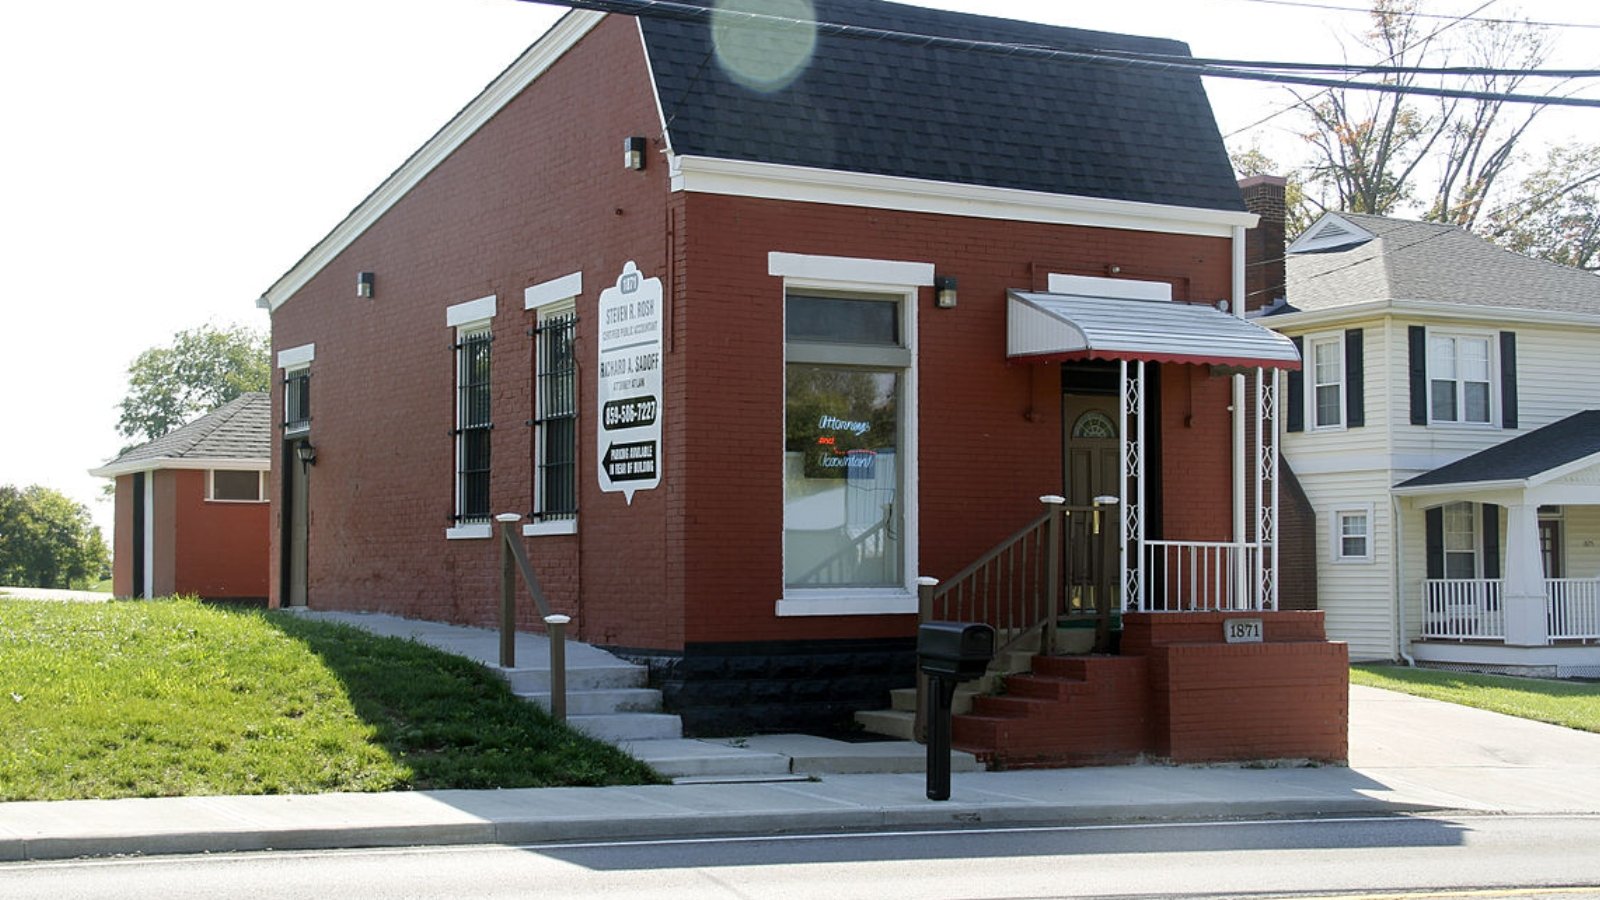
Park Hills – Historic Vibe, Modern Demand
Perched on hills just south of Cincinnati, Park Hills offers beautiful views, historic homes, and a walkable, village-like atmosphere. It’s part of Kenton County and is favored for its character, location, and quick access to urban jobs and amenities.
With home values reaching $364,493 in 2025, Park Hills combines charm with investment appeal. A tight housing supply and strong buyer interest continue to push prices upward, especially for historic homes and renovated properties.
13. Villa Hills – 88% Home Price Increase Since 2012

- 2010: $211,428
- 2011: $202,950 (-$8,478, -4.01% from previous year)
- 2012: $196,613 (-$6,337, -3.12% from previous year)
- 2013: $202,925 (+$6,312, +3.21% from previous year)
- 2014: $205,890 (+$2,965, +1.46% from previous year)
- 2015: $212,679 (+$6,788, +3.30% from previous year)
- 2016: $219,902 (+$7,224, +3.40% from previous year)
- 2017: $235,330 (+$15,428, +7.02% from previous year)
- 2018: $241,407 (+$6,076, +2.58% from previous year)
- 2019: $264,920 (+$23,513, +9.74% from previous year)
- 2020: N/A
- 2021: $306,580
- 2022: $339,104 (+$32,524, +10.61% from previous year)
- 2023: $350,882 (+$11,778, +3.47% from previous year)
- 2024: $367,411 (+$16,528, +4.71% from previous year)
- 2025: $380,969 (+$13,558, +3.69% from previous year)
Villa Hills home prices have risen 88% since 2012, driven by both gradual long-term gains and big jumps in more recent years. The leap from 2019 to 2021 is especially notable. Prices have continued trending upward since then, showing consistent strength in the market.
Villa Hills – River Views and Steady Upscale Growth
Located along the Ohio River in Kenton County, Villa Hills combines upscale housing with scenic beauty. The town is minutes from downtown Cincinnati, offering both suburban tranquility and urban convenience. Known for its well-kept neighborhoods and proximity to top-rated schools, it appeals to professionals and families alike.
Villa Hills’ current home price of $380,969 reflects that sustained demand. While not explosive, its growth pattern shows steady, dependable appreciation, especially from 2019 forward. The area’s riverside charm, limited development, and strong civic planning have helped keep values high and inventory tight.
12. La Grange – 99% Home Price Increase Since 2011
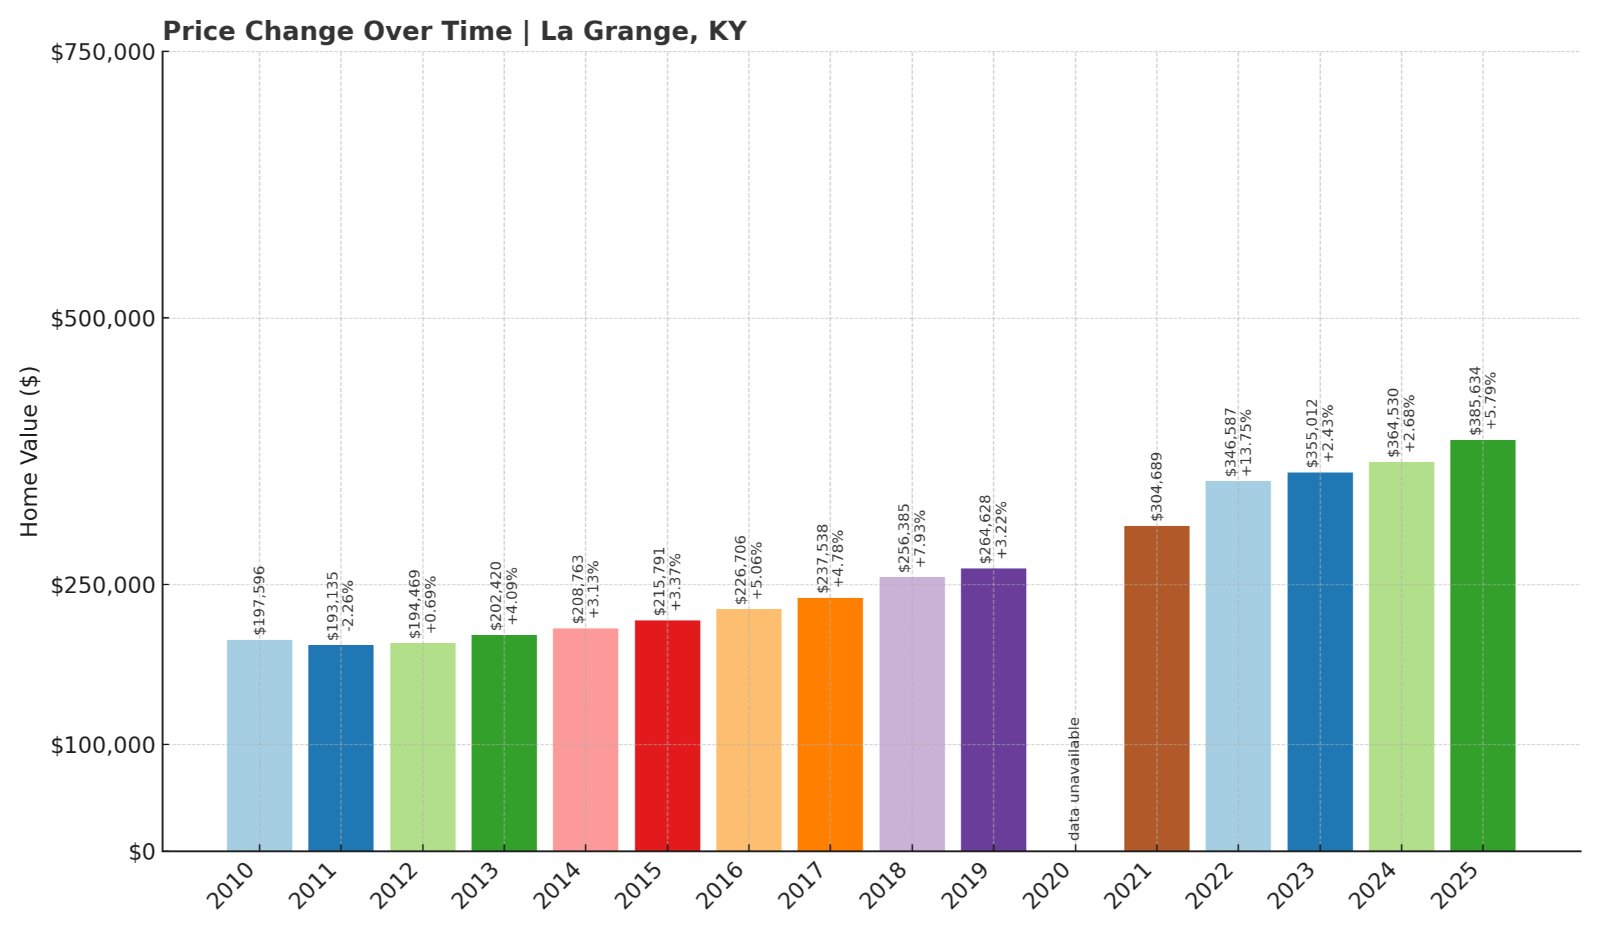
- 2010: $197,596
- 2011: $193,135 (-$4,461, -2.26% from previous year)
- 2012: $194,469 (+$1,333, +0.69% from previous year)
- 2013: $202,420 (+$7,952, +4.09% from previous year)
- 2014: $208,763 (+$6,343, +3.13% from previous year)
- 2015: $215,791 (+$7,029, +3.37% from previous year)
- 2016: $226,706 (+$10,915, +5.06% from previous year)
- 2017: $237,538 (+$10,832, +4.78% from previous year)
- 2018: $256,385 (+$18,847, +7.93% from previous year)
- 2019: $264,628 (+$8,244, +3.22% from previous year)
- 2020: N/A
- 2021: $304,689
- 2022: $346,587 (+$41,898, +13.75% from previous year)
- 2023: $355,012 (+$8,425, +2.43% from previous year)
- 2024: $364,530 (+$9,519, +2.68% from previous year)
- 2025: $385,634 (+$21,104, +5.79% from previous year)
La Grange home prices have doubled since 2011. The town experienced steady growth through the 2010s, followed by a significant jump after 2019. From 2021 through 2025, prices have continued a steady upward trend, signaling a strong and active market.
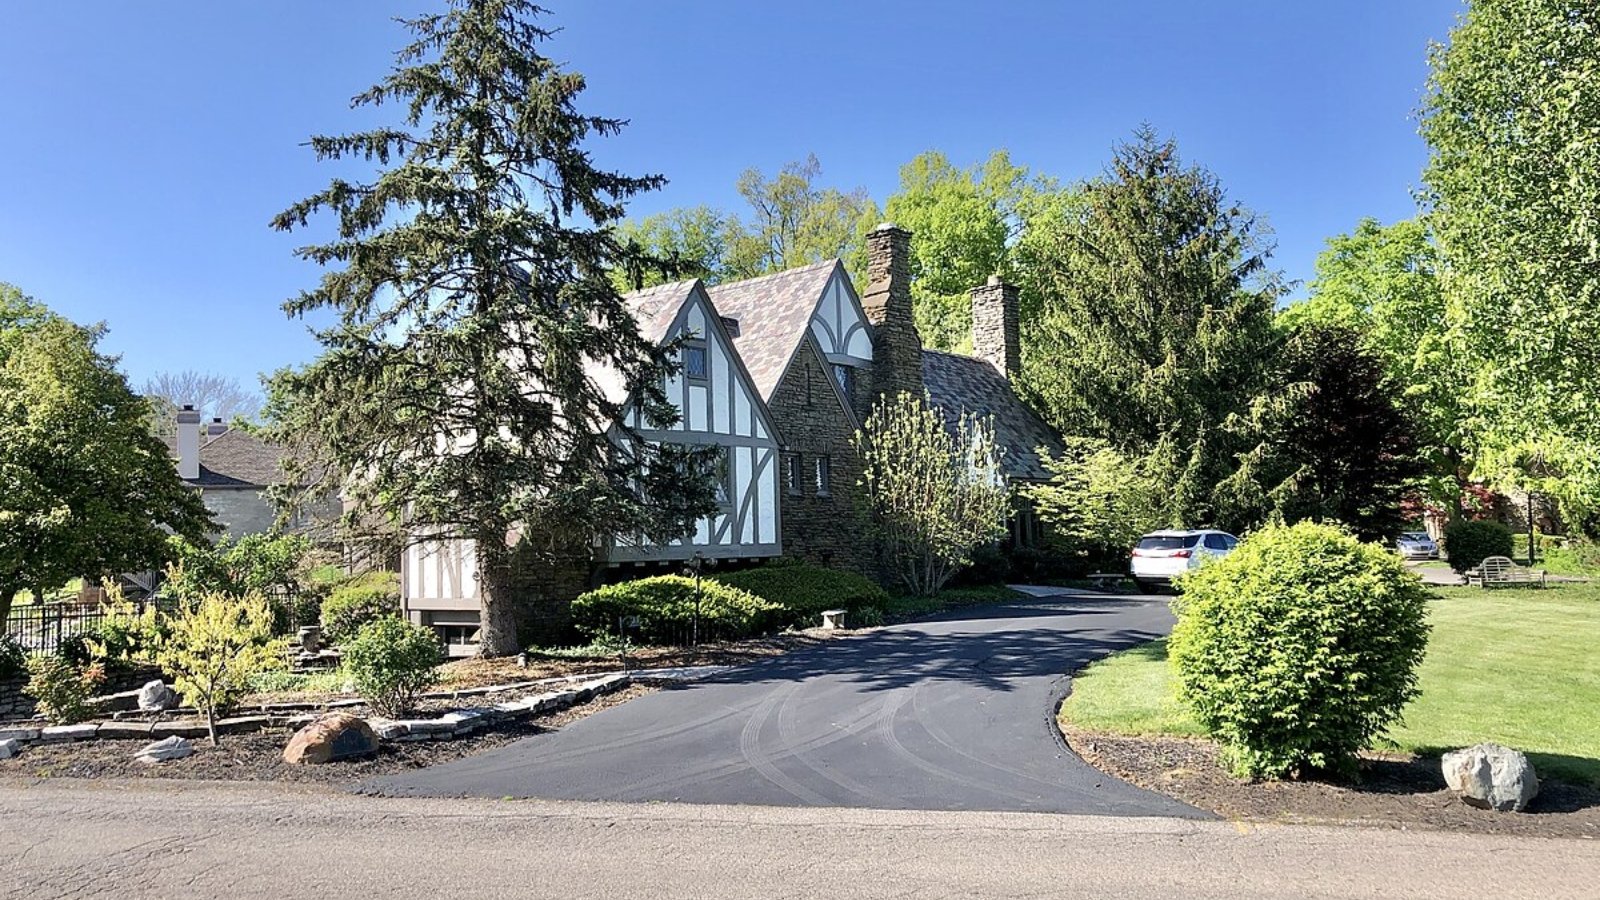
La Grange – Historic Center with Modern Appeal

La Grange is the county seat of Oldham County, and it’s famous for one unique feature—freight trains running right down Main Street. Beyond that novelty, the town is known for its vibrant downtown, good schools, and community events. It blends historic charm with a modern edge, attracting buyers who want character without sacrificing convenience.
The current average home price of $385,634 reflects La Grange’s growing popularity. The jump from 2021 to 2022 in particular points to increasing demand, possibly driven by migration from Louisville and other urban areas. With ample amenities and strong resale potential, it continues to rise in value.
11. Fort Mitchell – 91% Home Price Increase Since 2012

- 2010: $208,732
- 2011: $203,583 (-$5,149, -2.47% from previous year)
- 2012: $199,204 (-$4,379, -2.15% from previous year)
- 2013: $206,653 (+$7,450, +3.74% from previous year)
- 2014: $214,117 (+$7,464, +3.61% from previous year)
- 2015: $229,037 (+$14,920, +6.97% from previous year)
- 2016: $235,735 (+$6,698, +2.92% from previous year)
- 2017: $253,198 (+$17,463, +7.41% from previous year)
- 2018: $255,128 (+$1,929, +0.76% from previous year)
- 2019: $282,747 (+$27,620, +10.83% from previous year)
- 2020: N/A
- 2021: $320,314
- 2022: $347,936 (+$27,621, +8.62% from previous year)
- 2023: $358,224 (+$10,288, +2.96% from previous year)
- 2024: $375,506 (+$17,282, +4.82% from previous year)
- 2025: $387,786 (+$12,280, +3.27% from previous year)
Fort Mitchell home values have increased more than 90% since 2012. After consistent gains throughout the decade, a dramatic post-2019 surge boosted values significantly. The market has remained hot ever since, with home prices still climbing into 2025.
Fort Mitchell – Coveted Schools and Quick Access

Located just across the river from Cincinnati, Fort Mitchell is known for its excellent public schools—especially Beechwood Independent, consistently ranked among Kentucky’s best. The town also boasts quick access to I-75, making it a favorite for commuters who work in the city but want suburban living.
With a current home value of $387,786, Fort Mitchell has proven itself a long-term winner in the Kentucky real estate market. Limited inventory, top-tier schools, and strong community services have created steady upward pressure on home values year after year.
10. Simpsonville – 98% Home Price Increase Since 2011
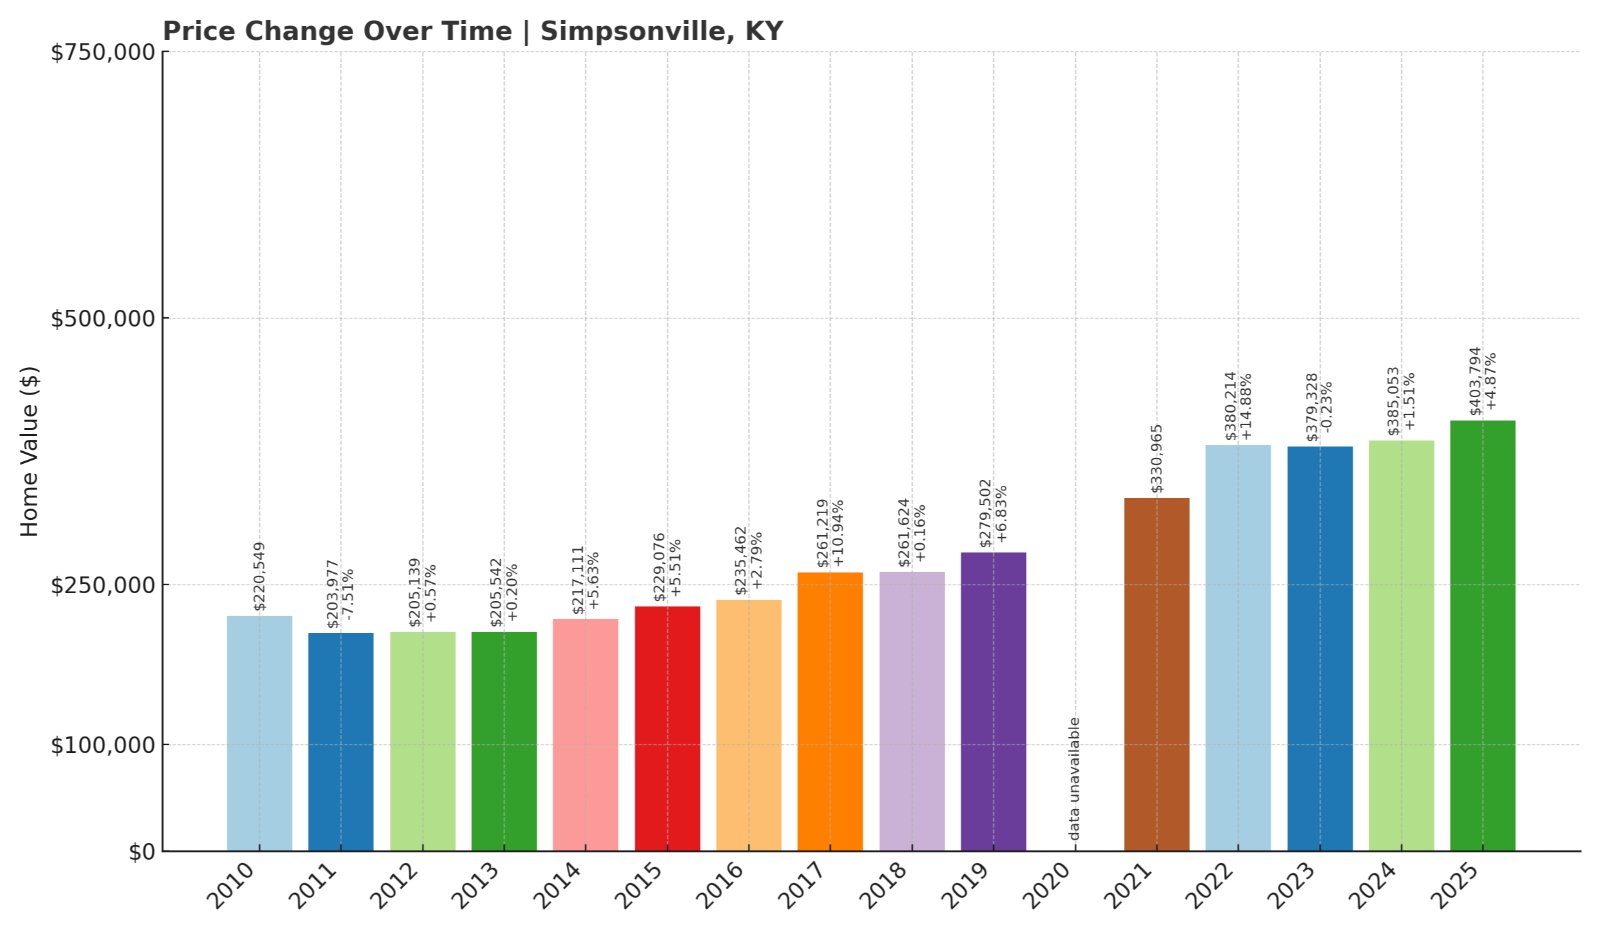
- 2010: $220,549
- 2011: $203,977 (-$16,572, -7.51% from previous year)
- 2012: $205,139 (+$1,162, +0.57% from previous year)
- 2013: $205,542 (+$403, +0.20% from previous year)
- 2014: $217,111 (+$11,568, +5.63% from previous year)
- 2015: $229,076 (+$11,966, +5.51% from previous year)
- 2016: $235,462 (+$6,386, +2.79% from previous year)
- 2017: $261,219 (+$25,757, +10.94% from previous year)
- 2018: $261,624 (+$405, +0.15% from previous year)
- 2019: $279,502 (+$17,879, +6.83% from previous year)
- 2020: N/A
- 2021: $330,965
- 2022: $380,214 (+$49,249, +14.88% from previous year)
- 2023: $379,328 (-$886, -0.23% from previous year)
- 2024: $385,053 (+$5,725, +1.51% from previous year)
- 2025: $403,794 (+$18,741, +4.87% from previous year)
Simpsonville home prices have surged by 98% since 2011, with the strongest increases arriving after 2019. While prices briefly flattened in 2023, the recovery in 2024 and 2025 shows buyer demand is still present and growing again.
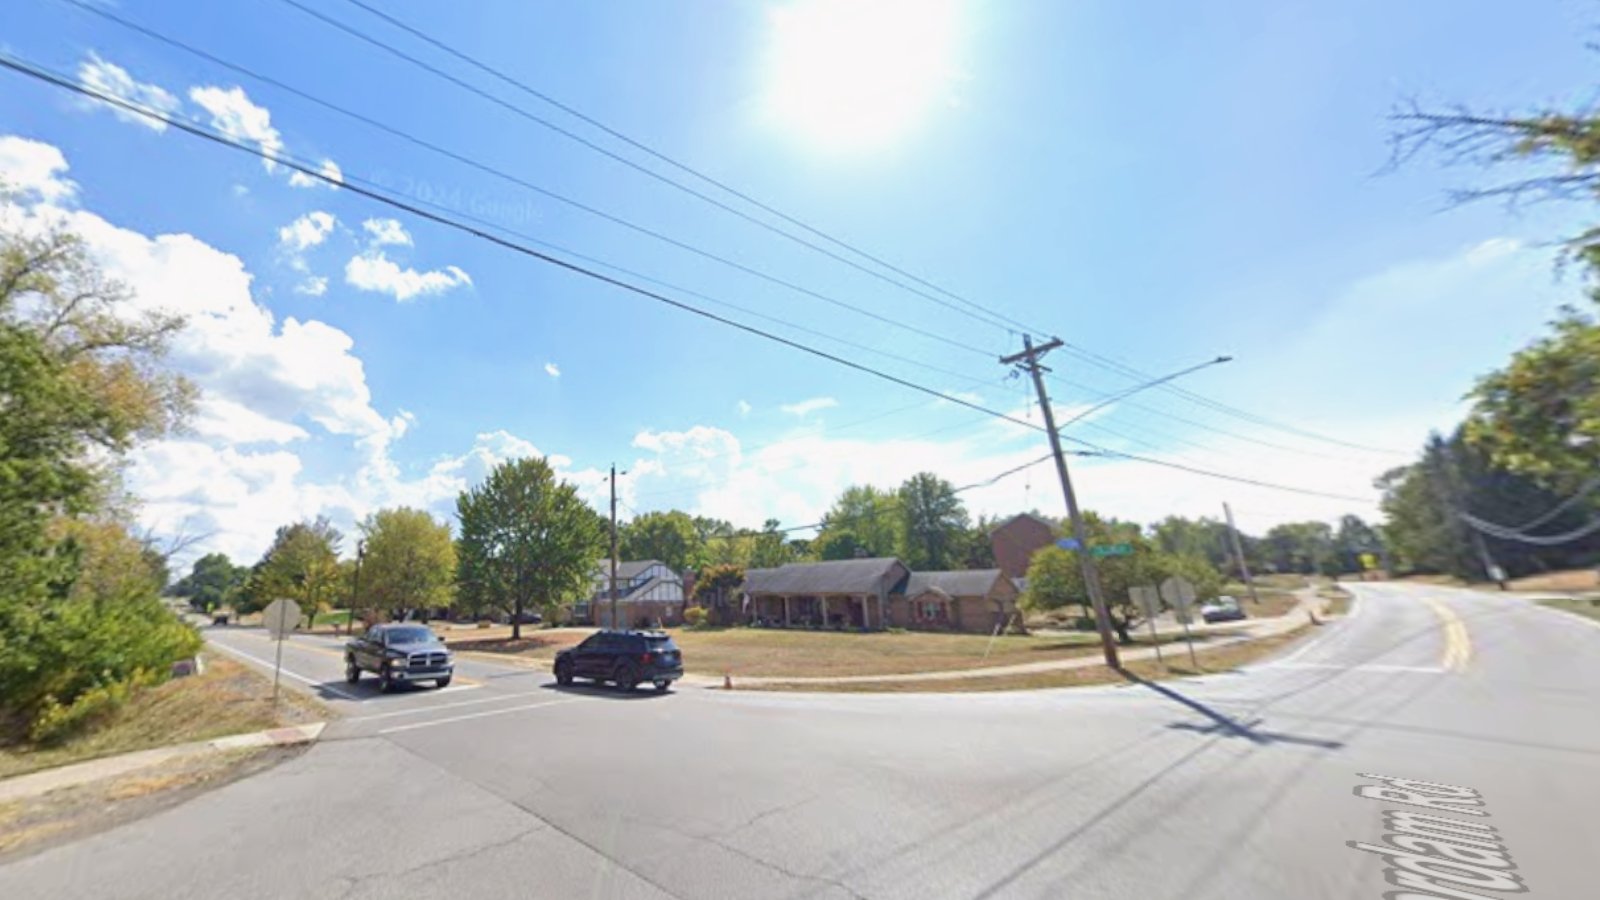
Simpsonville – Retail Hub Meets Rural Luxury

Simpsonville is located in Shelby County, known both for its sprawling horse farms and The Outlet Shoppes of the Bluegrass—one of the state’s largest outlet centers. That mix of rural beauty and retail access has driven residential growth in recent years.
In 2025, with prices reaching $403,794, Simpsonville remains a market on the rise. Buyers are drawn to the area’s spacious properties, proximity to Louisville, and the charm of small-town Kentucky with upscale living. It’s one of the few places where outlet malls and equestrian estates share the same zip code.
9. Alvaton – 126% Home Price Increase Since 2011

Would you like to save this?
- 2010: $189,176
- 2011: $187,017 (-$2,159, -1.14% from previous year)
- 2012: $189,437 (+$2,421, +1.29% from previous year)
- 2013: $197,006 (+$7,569, +4.00% from previous year)
- 2014: $202,719 (+$5,713, +2.90% from previous year)
- 2015: $213,513 (+$10,794, +5.32% from previous year)
- 2016: $226,142 (+$12,629, +5.91% from previous year)
- 2017: $239,981 (+$13,840, +6.12% from previous year)
- 2018: $250,199 (+$10,217, +4.26% from previous year)
- 2019: $258,894 (+$8,695, +3.48% from previous year)
- 2020: N/A
- 2021: $312,292
- 2022: $366,024 (+$53,732, +17.21% from previous year)
- 2023: $382,212 (+$16,188, +4.42% from previous year)
- 2024: $399,994 (+$17,782, +4.65% from previous year)
- 2025: $421,910 (+$21,916, +5.48% from previous year)
Alvaton home prices have soared over 125% since 2011. This consistent upward momentum picked up speed post-2019, with the biggest jumps occurring from 2021 onward. Annual gains in recent years have remained strong, placing Alvaton among Kentucky’s top-tier housing markets.
Alvaton – Rising Values in Warren County
Alvaton sits just outside Bowling Green in Warren County, offering a mix of country living and suburban convenience. Its location has become increasingly attractive to those looking for space, quiet, and access to one of the state’s fastest-growing cities.
The 2025 price point of $421,910 underscores how dramatically the area has changed. Growth in nearby Bowling Green—home to Western Kentucky University and a strong manufacturing base—has lifted Alvaton’s housing demand. New construction and migration from urban areas continue to push values up.
8. Wilsonville – 93% Home Price Increase Since 2011

- 2010: $223,923
- 2011: $205,356 (-$18,567, -8.29% from previous year)
- 2012: $205,794 (+$438, +0.21% from previous year)
- 2013: $216,513 (+$10,719, +5.21% from previous year)
- 2014: $223,648 (+$7,135, +3.30% from previous year)
- 2015: $230,328 (+$6,680, +2.99% from previous year)
- 2016: $247,470 (+$17,141, +7.44% from previous year)
- 2017: $260,179 (+$12,709, +5.14% from previous year)
- 2018: $274,004 (+$13,825, +5.31% from previous year)
- 2019: $289,342 (+$15,338, +5.60% from previous year)
- 2020: N/A
- 2021: $344,825
- 2022: $392,020 (+$47,194, +13.69% from previous year)
- 2023: $402,066 (+$10,047, +2.56% from previous year)
- 2024: $412,436 (+$10,369, +2.58% from previous year)
- 2025: $432,003 (+$19,567, +4.74% from previous year)
Wilsonville has experienced nearly a doubling of home values since 2011. Prices dropped sharply that year, but they’ve rebounded and climbed steadily since. From 2019 onward, prices have grown consistently, especially during the post-2020 demand surge.
Wilsonville – Quiet Growth on the Edge of Louisville

Wilsonville lies in Shelby County, offering a quieter alternative to Louisville’s busier suburbs. With its rolling hills, wide-open lots, and proximity to Simpsonville’s outlet shopping, Wilsonville blends rural aesthetics with suburban access.
In 2025, average home prices reached $432,003, a reflection of limited supply and rising interest from Louisville-area buyers seeking larger properties. Its relatively steady climb, without dramatic spikes or declines, speaks to Wilsonville’s balanced and sustainable market appeal.
7. Buckner – 59% Home Price Increase Since 2017

- 2010: N/A
- 2011: N/A
- 2012: N/A
- 2013: N/A
- 2014: N/A
- 2015: N/A
- 2016: N/A
- 2017: $274,371
- 2018: $288,782 (+$14,410, +5.25% from previous year)
- 2019: $296,228 (+$7,447, +2.58% from previous year)
- 2020: N/A
- 2021: $341,908
- 2022: $389,241 (+$47,334, +13.84% from previous year)
- 2023: $402,766 (+$13,524, +3.47% from previous year)
- 2024: $411,706 (+$8,941, +2.22% from previous year)
- 2025: $436,979 (+$25,273, +6.14% from previous year)
Buckner home values have jumped 59% since 2017. While early-year data is missing, the available trend shows solid year-over-year growth. From 2021 to 2025, the upward climb accelerated, with no signs of major volatility.
Buckner – Family-Friendly with Big Gains

Buckner is part of Oldham County and well-regarded for its highly rated public schools and quiet, residential neighborhoods. It’s a favorite among families seeking a suburban lifestyle within easy commuting distance of Louisville.
The 2025 home price of $436,979 places it among Kentucky’s most expensive towns. Ongoing development, large-lot homes, and school performance continue to drive interest. The town’s low turnover and high demand help maintain its steady price appreciation.
6. Union – 73% Home Price Increase Since 2011

- 2010: $273,377
- 2011: $257,636 (-$15,741, -5.76% from previous year)
- 2012: $255,935 (-$1,701, -0.66% from previous year)
- 2013: $264,361 (+$8,425, +3.29% from previous year)
- 2014: $273,982 (+$9,622, +3.64% from previous year)
- 2015: $283,310 (+$9,328, +3.40% from previous year)
- 2016: $285,100 (+$1,790, +0.63% from previous year)
- 2017: $291,808 (+$6,708, +2.35% from previous year)
- 2018: $312,129 (+$20,321, +6.96% from previous year)
- 2019: $320,477 (+$8,347, +2.67% from previous year)
- 2020: N/A
- 2021: $369,957
- 2022: $424,911 (+$54,953, +14.85% from previous year)
- 2023: $428,607 (+$3,696, +0.87% from previous year)
- 2024: $432,721 (+$4,114, +0.96% from previous year)
- 2025: $445,284 (+$12,564, +2.90% from previous year)
Union’s home prices have risen by nearly three-quarters since 2011. Although early years were modest in growth, the last few have seen faster increases. The post-2019 trend has been especially strong, peaking in 2022 before settling into steady growth.
Union – Boone County’s Suburban Powerhouse

Union is located in Northern Kentucky’s Boone County and has emerged as a major suburb of Cincinnati. Known for its upscale neighborhoods, proximity to top schools, and suburban amenities, Union appeals to high-income households and commuters.
With 2025 prices hitting $445,284, Union remains one of the most stable and in-demand communities in the region. Its blend of modern subdivisions, good infrastructure, and continued growth has made it a stronghold for homebuyers and a consistent performer in real estate.
5. River Bluff – 62% Home Price Increase Since 2017

- 2010: N/A
- 2011: N/A
- 2012: N/A
- 2013: N/A
- 2014: N/A
- 2015: N/A
- 2016: N/A
- 2017: $282,510
- 2018: $303,413 (+$20,903, +7.40% from previous year)
- 2019: $318,597 (+$15,184, +5.00% from previous year)
- 2020: N/A
- 2021: $367,263
- 2022: $417,163 (+$49,900, +13.59% from previous year)
- 2023: $440,733 (+$23,570, +5.65% from previous year)
- 2024: $433,255 (-$7,477, -1.70% from previous year)
- 2025: $457,769 (+$24,514, +5.66% from previous year)
River Bluff has seen a 62% increase in home prices since 2017, with major gains starting after 2020. Although 2024 experienced a rare dip, the strong rebound in 2025 brought prices to new highs, demonstrating the market’s underlying resilience.
River Bluff – Exclusive Living Along the Ohio

Located in Oldham County, River Bluff is a small, affluent community perched above the Ohio River. With large homes, quiet streets, and scenic views, it’s one of the most exclusive residential areas in the region. Access to top-rated schools and proximity to Louisville make it a desirable spot for high-income buyers.
The 2025 home value of $457,769 reflects both the limited supply and strong demand. Despite a brief decline in 2024, the town’s prestige and location ensure that real estate here continues to command a premium. Buyers who seek privacy and luxury often end up in River Bluff.
4. Finchville – 107% Home Price Increase Since 2011

- 2010: $222,500
- 2011: $221,538 (-$962, -0.43% from previous year)
- 2012: $225,325 (+$3,787, +1.71% from previous year)
- 2013: $231,104 (+$5,779, +2.56% from previous year)
- 2014: $237,397 (+$6,293, +2.72% from previous year)
- 2015: $258,564 (+$21,167, +8.92% from previous year)
- 2016: $277,445 (+$18,881, +7.30% from previous year)
- 2017: $296,733 (+$19,289, +6.95% from previous year)
- 2018: $297,023 (+$289, +0.10% from previous year)
- 2019: $318,189 (+$21,166, +7.13% from previous year)
- 2020: N/A
- 2021: $377,502
- 2022: $433,530 (+$56,028, +14.84% from previous year)
- 2023: $426,931 (-$6,599, -1.52% from previous year)
- 2024: $422,399 (-$4,531, -1.06% from previous year)
- 2025: $458,784 (+$36,384, +8.61% from previous year)
Finchville’s home values have more than doubled since 2011. After a minor dip in 2023 and 2024, values came roaring back in 2025 with an impressive 8.6% gain. This bounce-back reflects the area’s ongoing desirability and resilience in changing markets.
Finchville – Equestrian Elegance and Rural Appeal

Finchville is a small unincorporated community in Shelby County, known for its wide-open spaces and horse country character. With a rural vibe just minutes from Shelbyville, it has become an attractive spot for buyers wanting land and privacy without being too remote.
The 2025 home value of $458,784 shows strong long-term growth. Even after two years of slight declines, Finchville proved its strength with one of the biggest single-year increases on this list. Large parcels, newer homes, and limited inventory all contribute to rising values.
3. Crestwood – 95% Home Price Increase Since 2011

- 2010: $239,803
- 2011: $238,319 (-$1,483, -0.62% from previous year)
- 2012: $239,950 (+$1,631, +0.68% from previous year)
- 2013: $250,189 (+$10,239, +4.27% from previous year)
- 2014: $259,797 (+$9,608, +3.84% from previous year)
- 2015: $268,220 (+$8,423, +3.24% from previous year)
- 2016: $279,803 (+$11,583, +4.32% from previous year)
- 2017: $292,335 (+$12,532, +4.48% from previous year)
- 2018: $308,385 (+$16,050, +5.49% from previous year)
- 2019: $320,609 (+$12,224, +3.96% from previous year)
- 2020: N/A
- 2021: $367,713
- 2022: $417,791 (+$50,077, +13.62% from previous year)
- 2023: $434,286 (+$16,495, +3.95% from previous year)
- 2024: $443,655 (+$9,369, +2.16% from previous year)
- 2025: $467,109 (+$23,454, +5.29% from previous year)
Home prices in Crestwood have climbed 95% since 2011, with consistently strong growth over the years. After a particularly strong jump in 2022, prices have continued to edge higher each year, reflecting ongoing demand.
Crestwood – Top Schools and Consistent Gains
Crestwood, located in Oldham County, is consistently ranked as one of the best places to live in Kentucky. Excellent schools, safe neighborhoods, and a mix of modern and historic homes make it a top choice for families and professionals alike.
At $467,109 in 2025, Crestwood’s home values reflect both stability and long-term upside. Growth here has been orderly and sustained, with minimal volatility—a hallmark of a strong, reliable market.
2. Goshen – 94% Home Price Increase Since 2011

- 2010: $247,981
- 2011: $246,149 (-$1,832, -0.74% from previous year)
- 2012: $247,989 (+$1,840, +0.75% from previous year)
- 2013: $259,225 (+$11,236, +4.53% from previous year)
- 2014: $270,935 (+$11,710, +4.52% from previous year)
- 2015: $281,115 (+$10,180, +3.76% from previous year)
- 2016: $292,142 (+$11,026, +3.92% from previous year)
- 2017: $306,087 (+$13,946, +4.77% from previous year)
- 2018: $322,138 (+$16,050, +5.24% from previous year)
- 2019: $332,944 (+$10,807, +3.35% from previous year)
- 2020: N/A
- 2021: $380,869
- 2022: $433,591 (+$52,722, +13.84% from previous year)
- 2023: $455,347 (+$21,756, +5.02% from previous year)
- 2024: $462,651 (+$7,305, +1.60% from previous year)
- 2025: $481,629 (+$18,978, +4.10% from previous year)
Goshen home prices have risen nearly 94% since 2011, with much of that growth happening after 2020. From 2021 forward, price increases have remained steady, even as growth slowed across some other markets.
Goshen – Elegant Living and Natural Beauty

Goshen is a scenic town along the Ohio River in Oldham County, offering a peaceful setting and access to excellent schools, including North Oldham High School. It’s known for its tree-lined streets, spacious properties, and commitment to maintaining a small-town feel.
In 2025, home values reached $481,629—proof that Goshen remains a highly desirable place to live. As the demand for serene and high-quality communities grows, Goshen’s consistent price appreciation shows no signs of slowing.
1. Prospect – 82% Home Price Increase Since 2011

- 2010: $351,730
- 2011: $334,691 (-$17,040, -4.84% from previous year)
- 2012: $334,696 (+$6, +0.00% from previous year)
- 2013: $348,750 (+$14,054, +4.20% from previous year)
- 2014: $364,055 (+$15,305, +4.39% from previous year)
- 2015: $374,486 (+$10,431, +2.87% from previous year)
- 2016: $386,172 (+$11,686, +3.12% from previous year)
- 2017: $397,302 (+$11,130, +2.88% from previous year)
- 2018: $403,830 (+$6,528, +1.64% from previous year)
- 2019: $419,039 (+$15,209, +3.77% from previous year)
- 2020: N/A
- 2021: $468,223
- 2022: $538,574 (+$70,351, +15.03% from previous year)
- 2023: $567,867 (+$29,292, +5.44% from previous year)
- 2024: $582,204 (+$14,337, +2.52% from previous year)
- 2025: $608,158 (+$25,955, +4.46% from previous year)
Prospect tops the list with the highest home values in Kentucky—up 82% since 2011. Prices have climbed consistently, with a major leap in 2022. Even with some cooling since, values remain on a firm upward trend through 2025.
Prospect – Kentucky’s Luxury Market Leader

Prospect spans Jefferson and Oldham counties and is home to some of Kentucky’s most luxurious properties. With golf communities, riverfront views, and expansive estates, it’s long been a magnet for affluent buyers.
Now averaging $608,158, Prospect’s real estate reflects its reputation. Strong schools, access to downtown Louisville, and limited land for development all contribute to high demand and rising prices. This is the top end of Kentucky’s housing market—and it shows.


