
Would you like to save this?
According to the Zillow Home Value Index, home prices in parts of Kansas have soared to eye-popping highs. These aren’t just bedroom communities or college towns—they’re places where demand, location, and long-term growth have pushed values to the top of the charts. From suburbs on the rise to quiet towns with premium price tags, these 21 places now rank as the most expensive in the state. We’ve tracked prices from 2010 to 2025 to show just how fast things have changed.
21. Andale – 89.4% Home Price Increase Since 2012
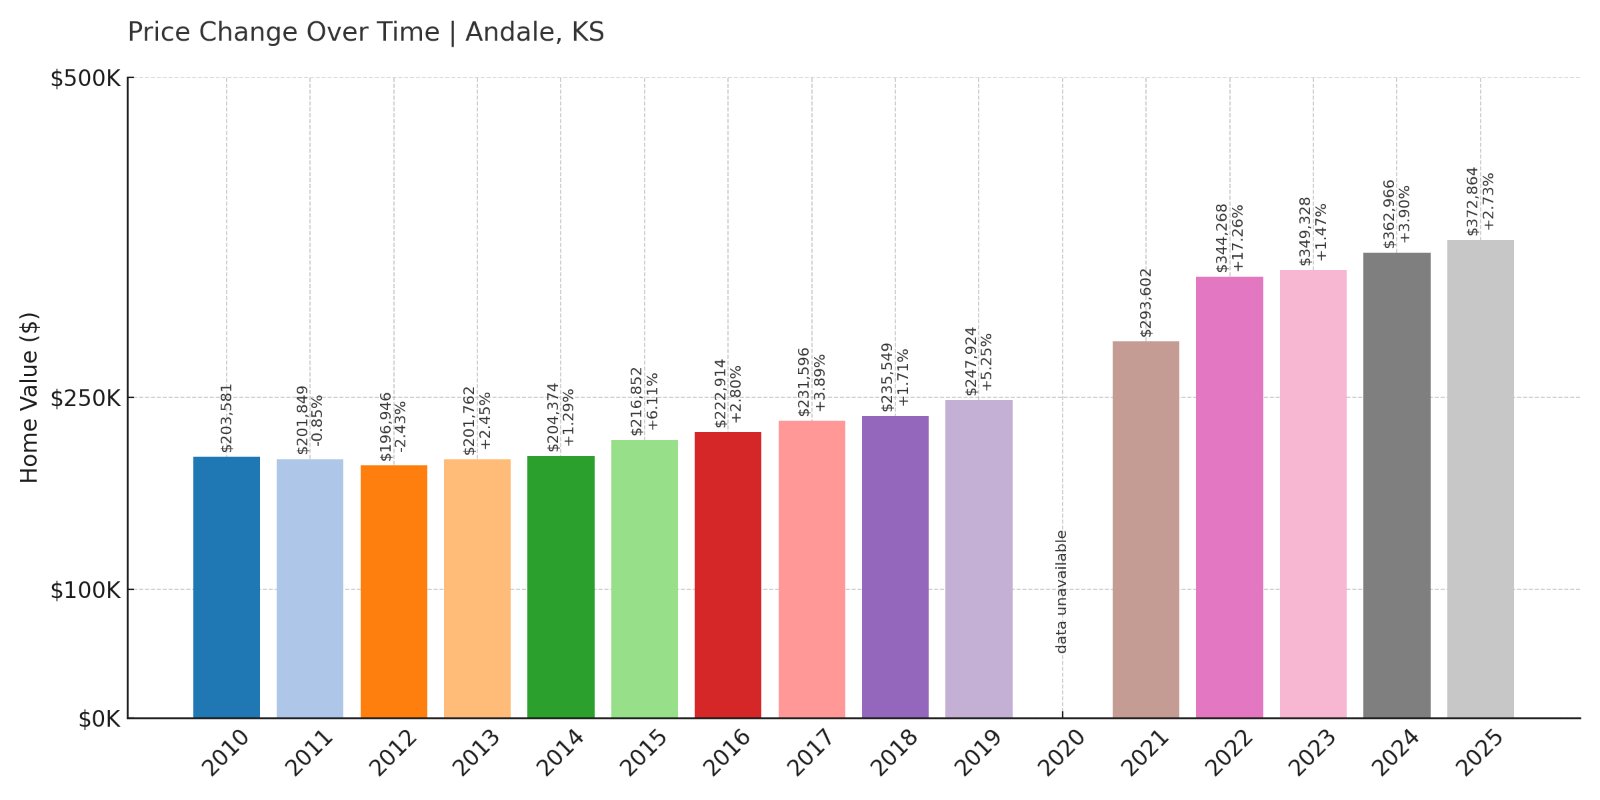
- 2010: $203,581
- 2011: $201,849 (-$1,732, -0.85% from previous year)
- 2012: $196,946 (-$4,903, -2.43% from previous year)
- 2013: $201,762 (+$4,817, +2.45% from previous year)
- 2014: $204,374 (+$2,611, +1.29% from previous year)
- 2015: $216,852 (+$12,478, +6.11% from previous year)
- 2016: $222,914 (+$6,062, +2.80% from previous year)
- 2017: $231,596 (+$8,682, +3.89% from previous year)
- 2018: $235,549 (+$3,953, +1.71% from previous year)
- 2019: $247,924 (+$12,376, +5.25% from previous year)
- 2020: N/A
- 2021: $293,602
- 2022: $344,268 (+$50,666, +17.26% from previous year)
- 2023: $349,328 (+$5,060, +1.47% from previous year)
- 2024: $362,966 (+$13,638, +3.90% from previous year)
- 2025: $372,864 (+$9,898, +2.73% from previous year)
Andale’s home prices have risen significantly since 2012, growing nearly 90% over that time. The town saw moderate increases year after year until 2021, when values jumped from $247K to nearly $294K, following broader market trends. While price growth slowed slightly after 2022, values have remained high and continue to climb.
Andale – Steady Growth in a Small Town Setting
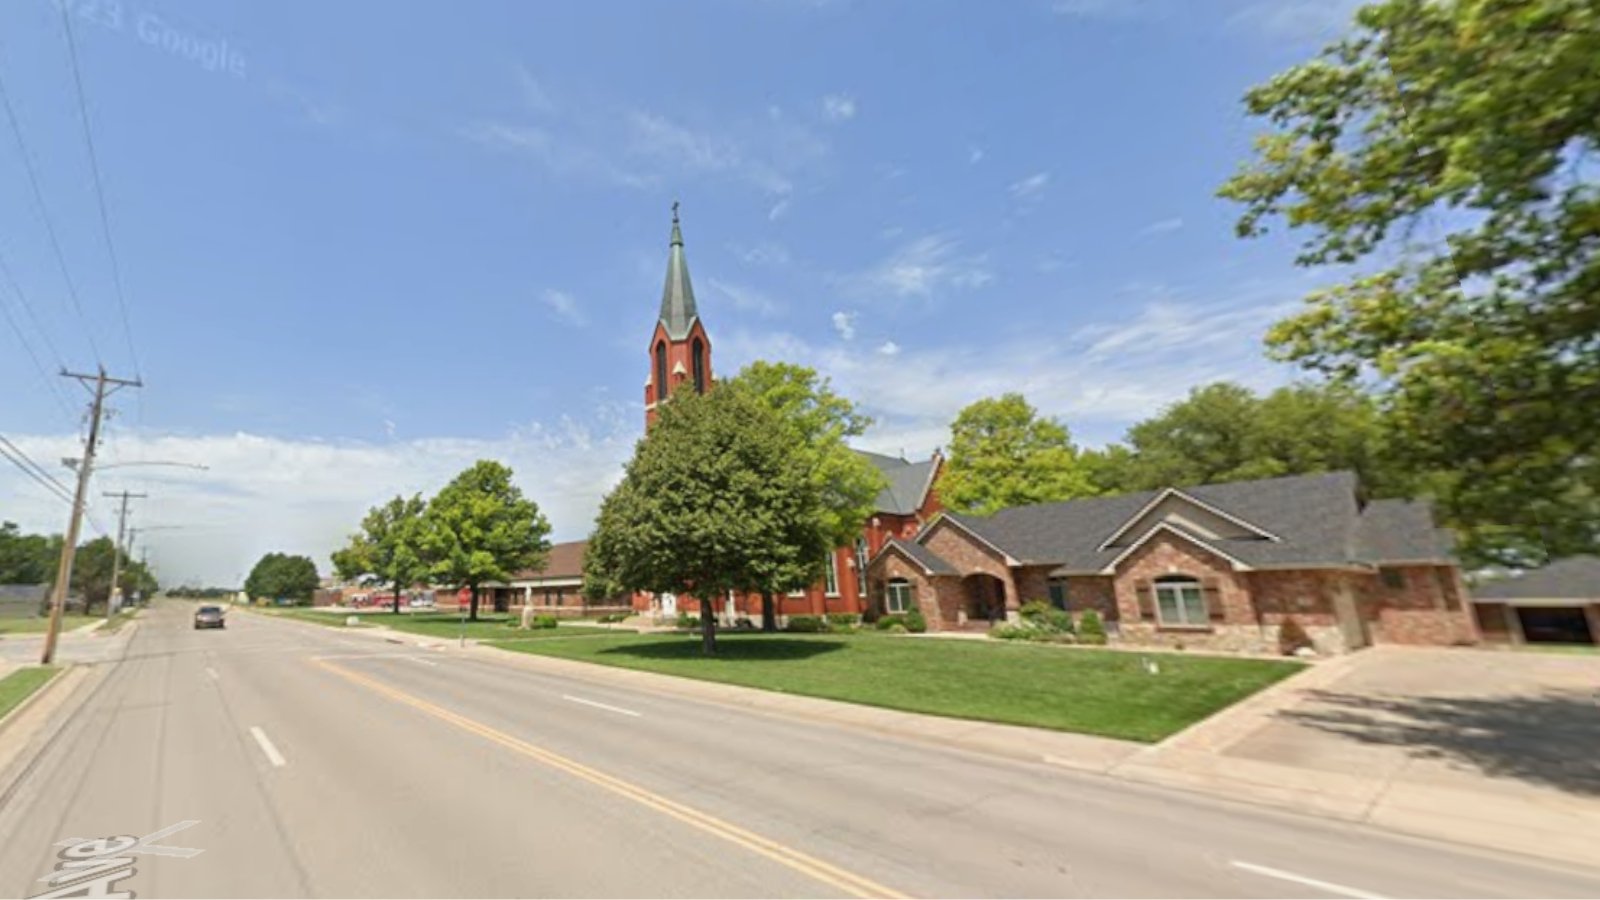
Andale is a small town in Sedgwick County, about 20 miles northwest of Wichita. Despite its modest population, it has seen solid home price appreciation over the years, especially in the past half-decade. The jump in 2021 followed a statewide pattern of suburban expansion as remote work gained traction and buyers looked for space outside of metro cores.
With a quiet, family-friendly vibe and access to larger city amenities within a half-hour drive, Andale has grown more appealing to buyers priced out of Wichita. Its consistent growth—even with missing 2020 data—makes it one of the more expensive smaller towns in the state. Public schools in the Renwick USD 267 district and community-oriented values have helped maintain demand.
20. Easton – 181.5% Home Price Increase Since 2010
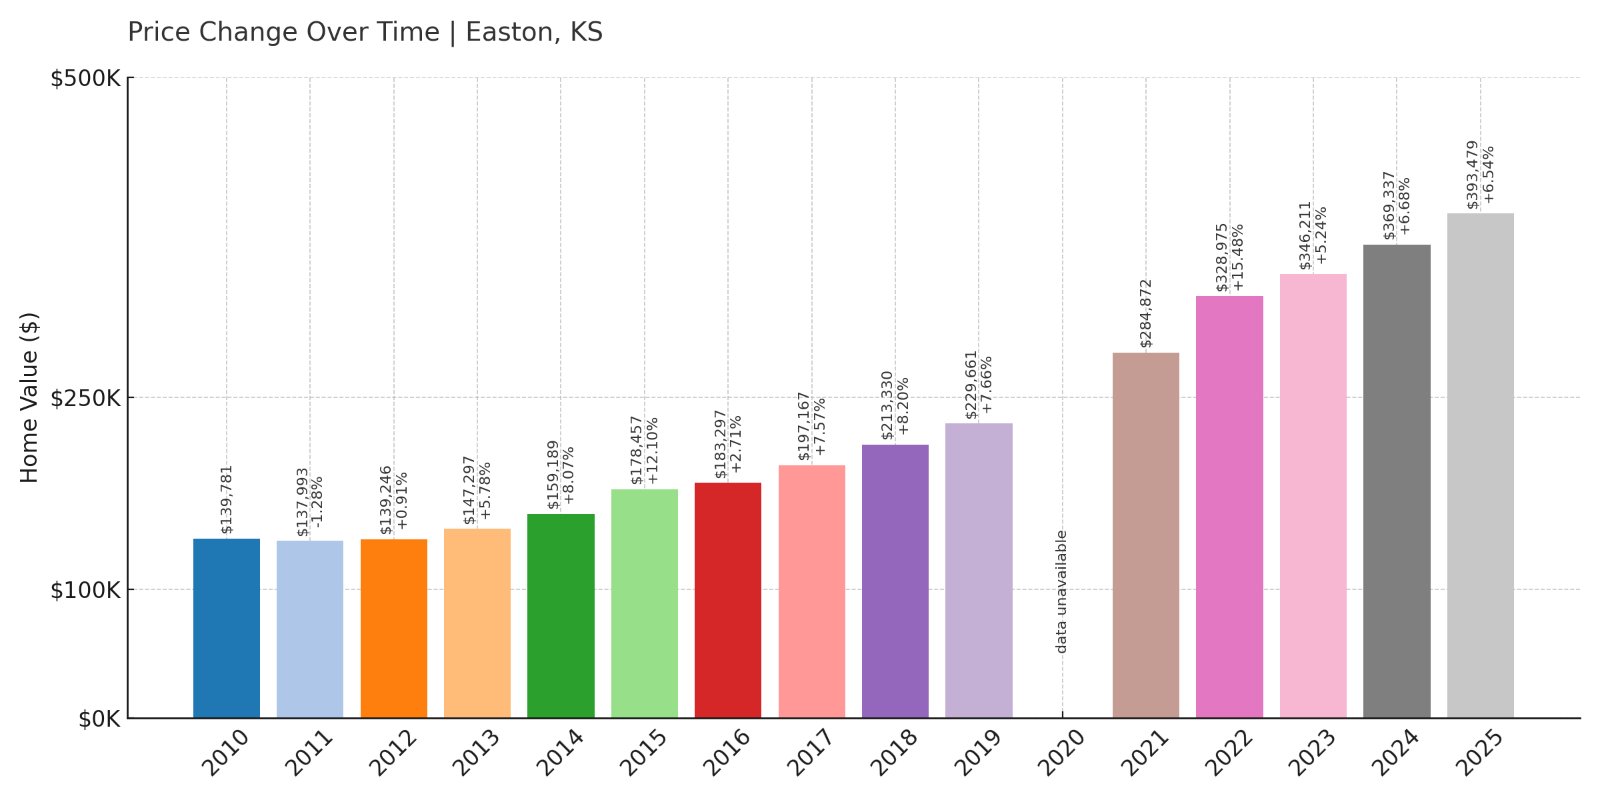
- 2010: $139,781
- 2011: $137,993 (-$1,788, -1.28% from previous year)
- 2012: $139,246 (+$1,253, +0.91% from previous year)
- 2013: $147,297 (+$8,051, +5.78% from previous year)
- 2014: $159,189 (+$11,892, +8.07% from previous year)
- 2015: $178,457 (+$19,267, +12.10% from previous year)
- 2016: $183,297 (+$4,840, +2.71% from previous year)
- 2017: $197,167 (+$13,871, +7.57% from previous year)
- 2018: $213,330 (+$16,163, +8.20% from previous year)
- 2019: $229,661 (+$16,331, +7.66% from previous year)
- 2020: N/A
- 2021: $284,872
- 2022: $328,975 (+$44,103, +15.48% from previous year)
- 2023: $346,211 (+$17,236, +5.24% from previous year)
- 2024: $369,337 (+$23,127, +6.68% from previous year)
- 2025: $393,479 (+$24,142, +6.54% from previous year)
Easton has more than doubled in home value since 2010, with a remarkable 181.5% increase over 15 years. The steepest jumps happened between 2021 and 2025, signaling a major upswing in buyer interest and property demand. Even without 2020 data, the trend clearly shows rapid growth over time, particularly in the post-pandemic market.
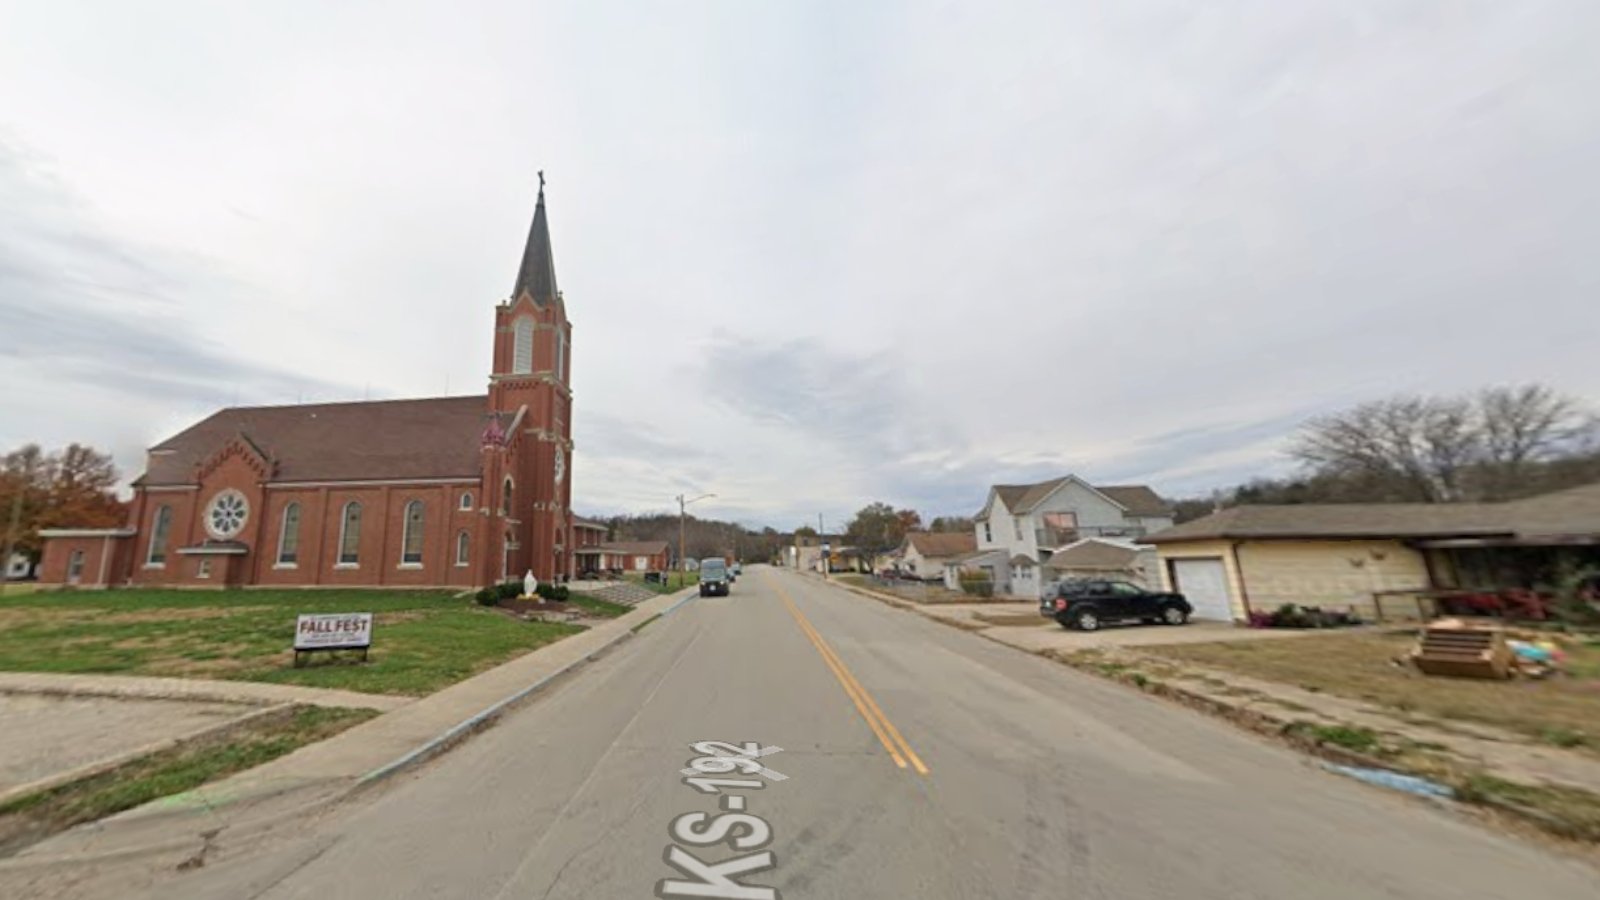
Easton – Quiet Growth in Northeast Kansas
Kitchen Style?
Located in Leavenworth County, Easton is a small rural town near Fort Leavenworth and within an hour of Kansas City. Its location makes it appealing to military families and commuters seeking quieter surroundings. The jump in home values over the past few years reflects the spillover effect from urban areas and greater interest in outlying communities.
Easton benefits from proximity to U.S. Route 73 and strong community ties. Home buyers are drawn to its affordable starting points and room for growth, which likely contributed to its sharp rise in property values since 2021. For a town of its size, Easton’s market has shown notable strength and resilience in recent years.
19. Louisburg – 136.2% Home Price Increase Since 2010
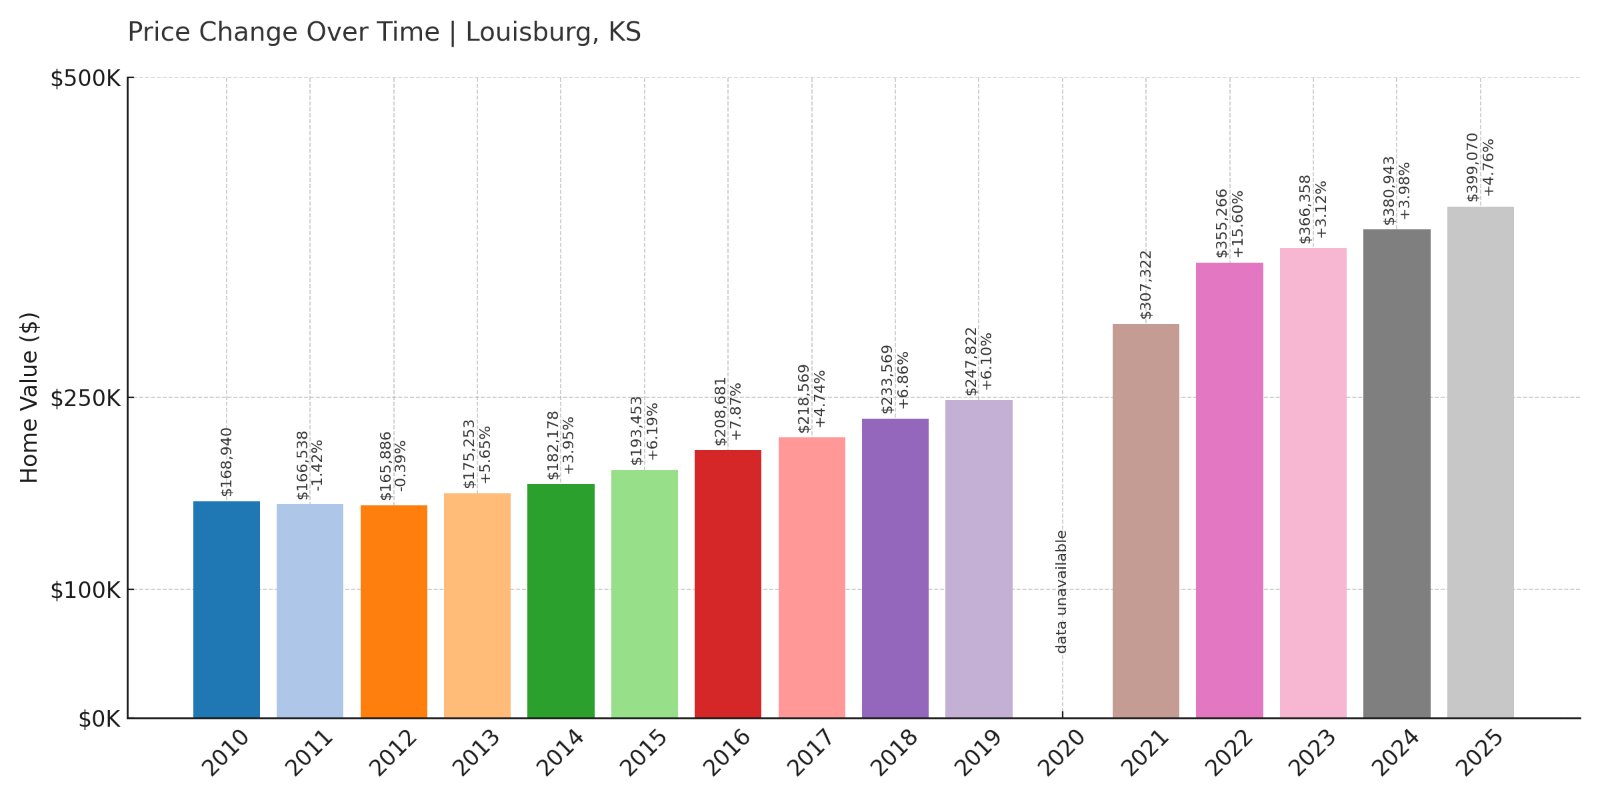
- 2010: $168,940
- 2011: $166,538 (-$2,402, -1.42% from previous year)
- 2012: $165,886 (-$653, -0.39% from previous year)
- 2013: $175,253 (+$9,367, +5.65% from previous year)
- 2014: $182,178 (+$6,925, +3.95% from previous year)
- 2015: $193,453 (+$11,275, +6.19% from previous year)
- 2016: $208,681 (+$15,227, +7.87% from previous year)
- 2017: $218,569 (+$9,888, +4.74% from previous year)
- 2018: $233,569 (+$15,000, +6.86% from previous year)
- 2019: $247,822 (+$14,253, +6.10% from previous year)
- 2020: N/A
- 2021: $307,322
- 2022: $355,266 (+$47,944, +15.60% from previous year)
- 2023: $366,358 (+$11,092, +3.12% from previous year)
- 2024: $380,943 (+$14,584, +3.98% from previous year)
- 2025: $399,070 (+$18,127, +4.76% from previous year)
Louisburg’s home prices have climbed steadily for over a decade, with a total growth rate of over 136% since 2010. Major gains occurred after 2020, when the median price jumped by nearly $60,000 in a single year. The trend shows steady demand in this southeastern Kansas City suburb.
Louisburg – Southern Suburb on the Rise
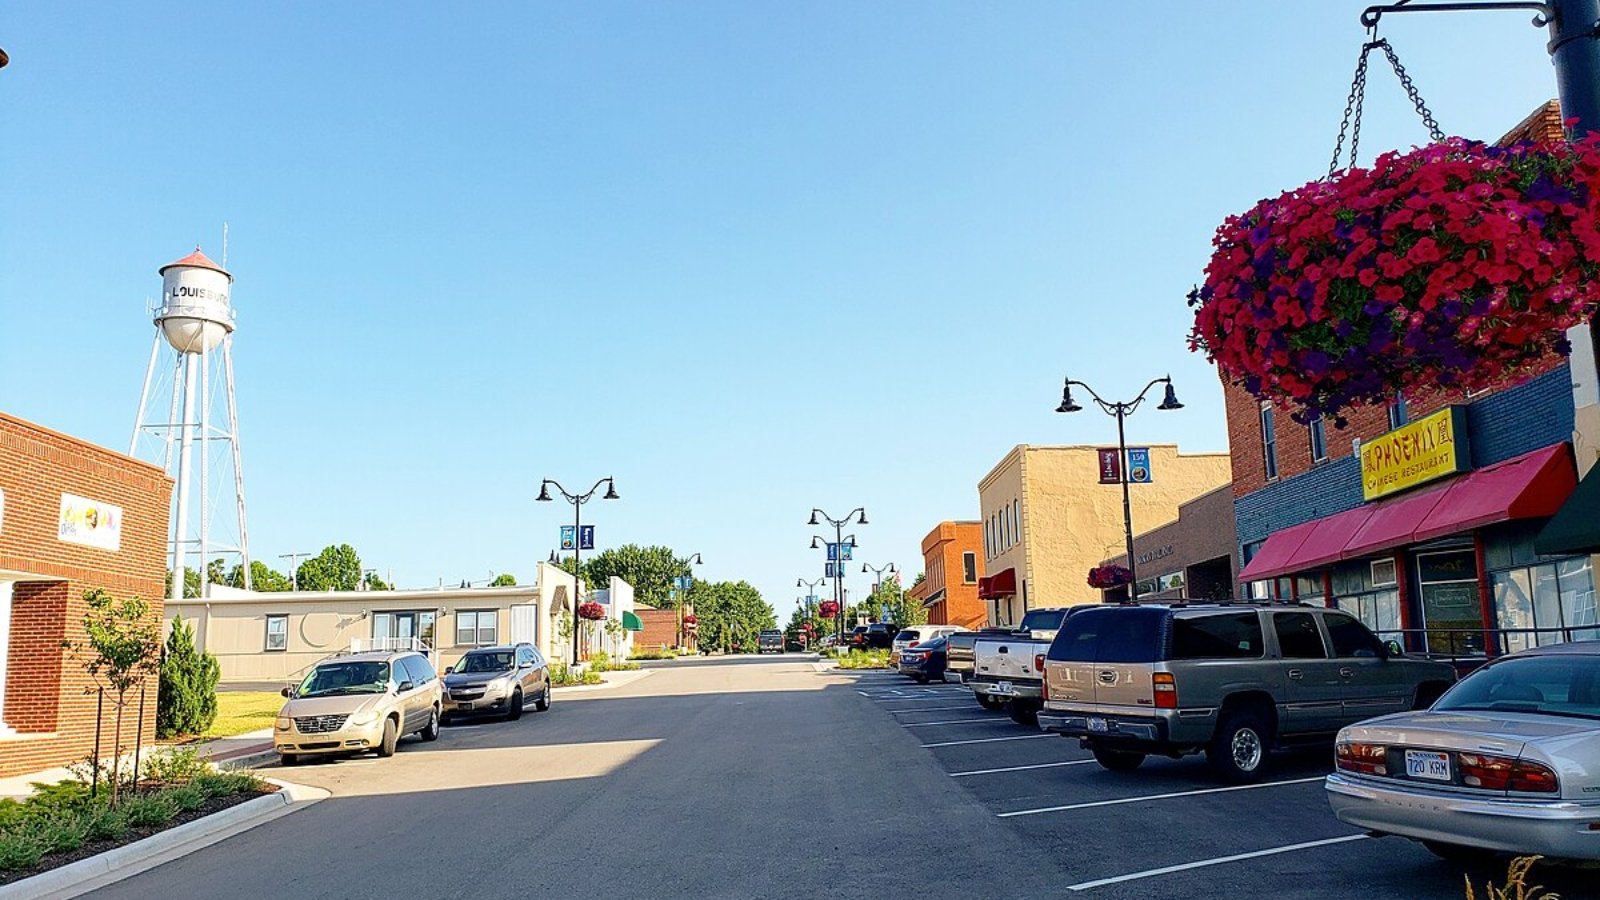
Just a 30-minute drive south of downtown Kansas City, Louisburg in Miami County is a classic example of suburban growth feeding home value spikes. Its blend of local charm, decent commute times, and proximity to outdoor spaces like Lewis-Young Park and Middle Creek Lake makes it a desirable spot for families.
Louisburg also hosts annual events like the Cider Fest, which helps build community identity. Combined with its access to U.S. Highway 69 and solid school ratings, it’s no surprise that demand—and prices—have increased dramatically, especially during the recent housing boom.
18. Shawnee – 98.3% Home Price Increase Since 2010
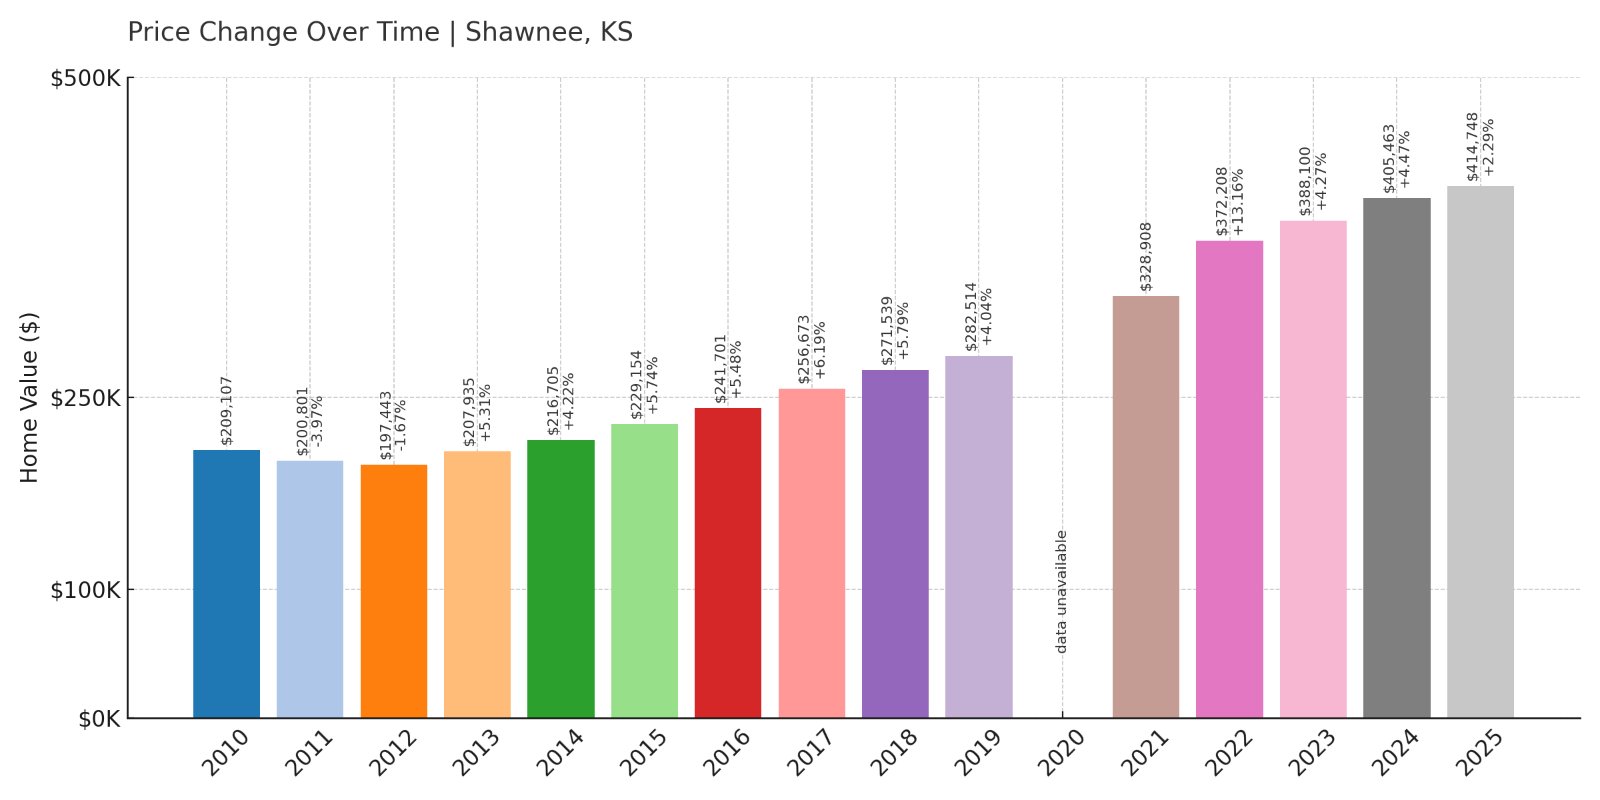

- 2010: $209,107
- 2011: $200,801 (-$8,306, -3.97% from previous year)
- 2012: $197,443 (-$3,359, -1.67% from previous year)
- 2013: $207,935 (+$10,492, +5.31% from previous year)
- 2014: $216,705 (+$8,770, +4.22% from previous year)
- 2015: $229,154 (+$12,449, +5.74% from previous year)
- 2016: $241,701 (+$12,546, +5.48% from previous year)
- 2017: $256,673 (+$14,972, +6.19% from previous year)
- 2018: $271,539 (+$14,866, +5.79% from previous year)
- 2019: $282,514 (+$10,974, +4.04% from previous year)
- 2020: N/A
- 2021: $328,908
- 2022: $372,208 (+$43,300, +13.16% from previous year)
- 2023: $388,100 (+$15,892, +4.27% from previous year)
- 2024: $405,463 (+$17,363, +4.47% from previous year)
- 2025: $414,748 (+$9,285, +2.29% from previous year)
Shawnee has seen home prices nearly double since 2010, rising from just over $209,000 to almost $415,000. The price surge started slowly but gained momentum after 2020, with especially strong annual growth in 2021 and 2022. The town remains a strong market thanks to location and livability.
Shawnee – A Suburban Powerhouse with Room to Grow
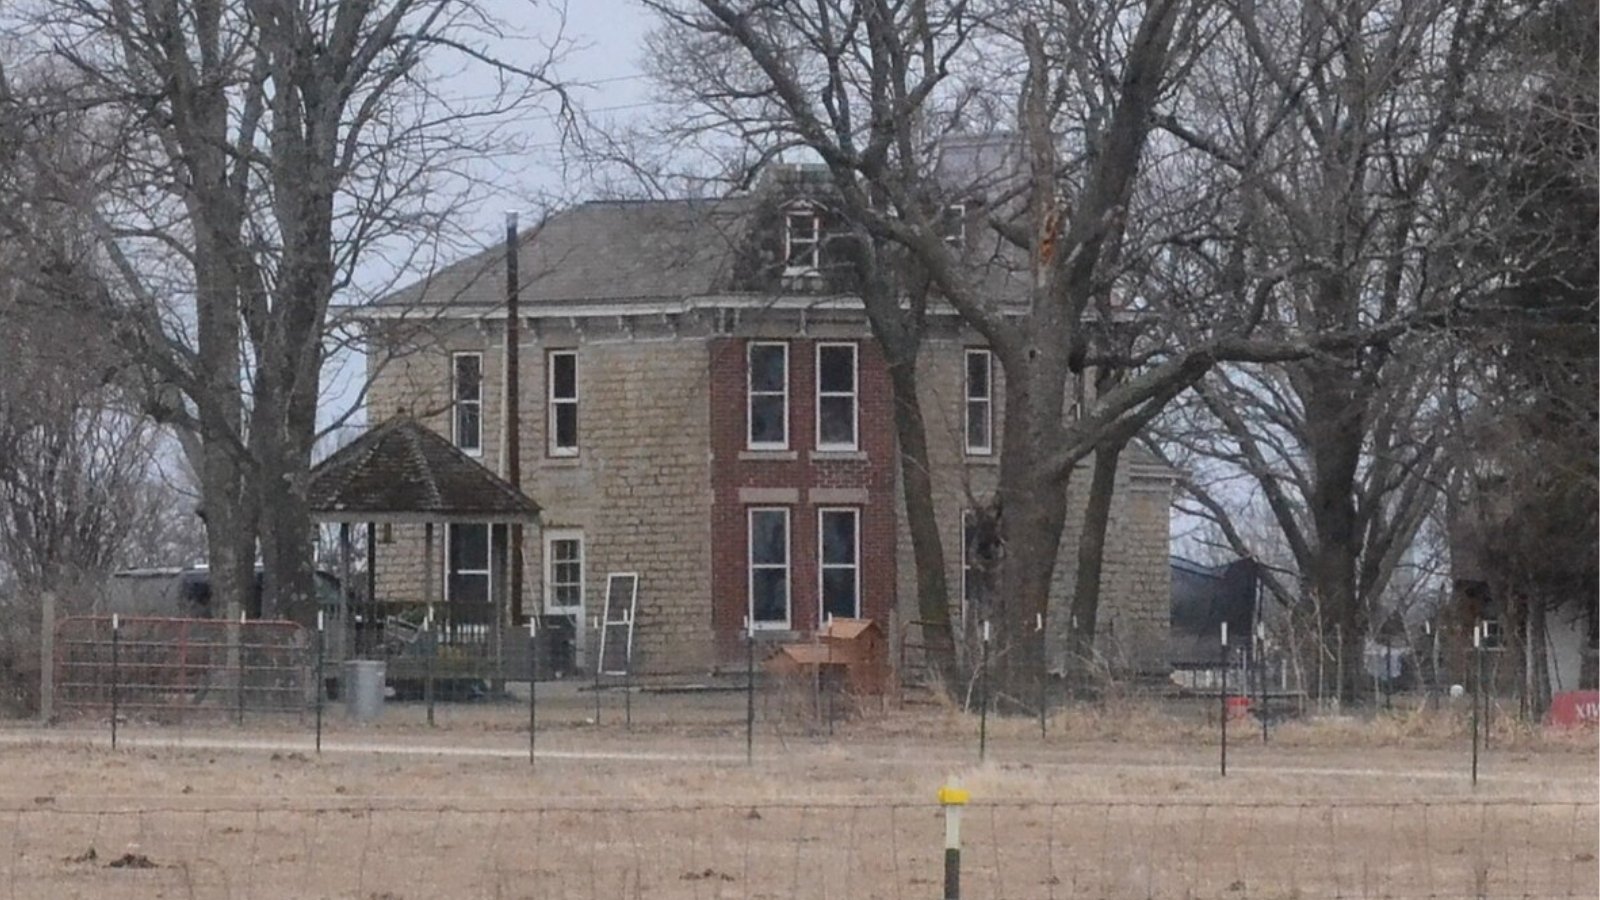
Located in Johnson County, Shawnee is one of the larger suburbs of Kansas City and continues to attract residents with its mix of older neighborhoods, new developments, and park systems. It’s known for great access to highways, good schools, and large recreation areas like Shawnee Mission Park.
The town’s price growth aligns with the larger metro area’s real estate trends but also reflects Shawnee’s own investments in infrastructure and community resources. In recent years, infill development and demand for homes in the $300K–$400K range have contributed to its price increases.
17. Westwood – 120.4% Home Price Increase Since 2010
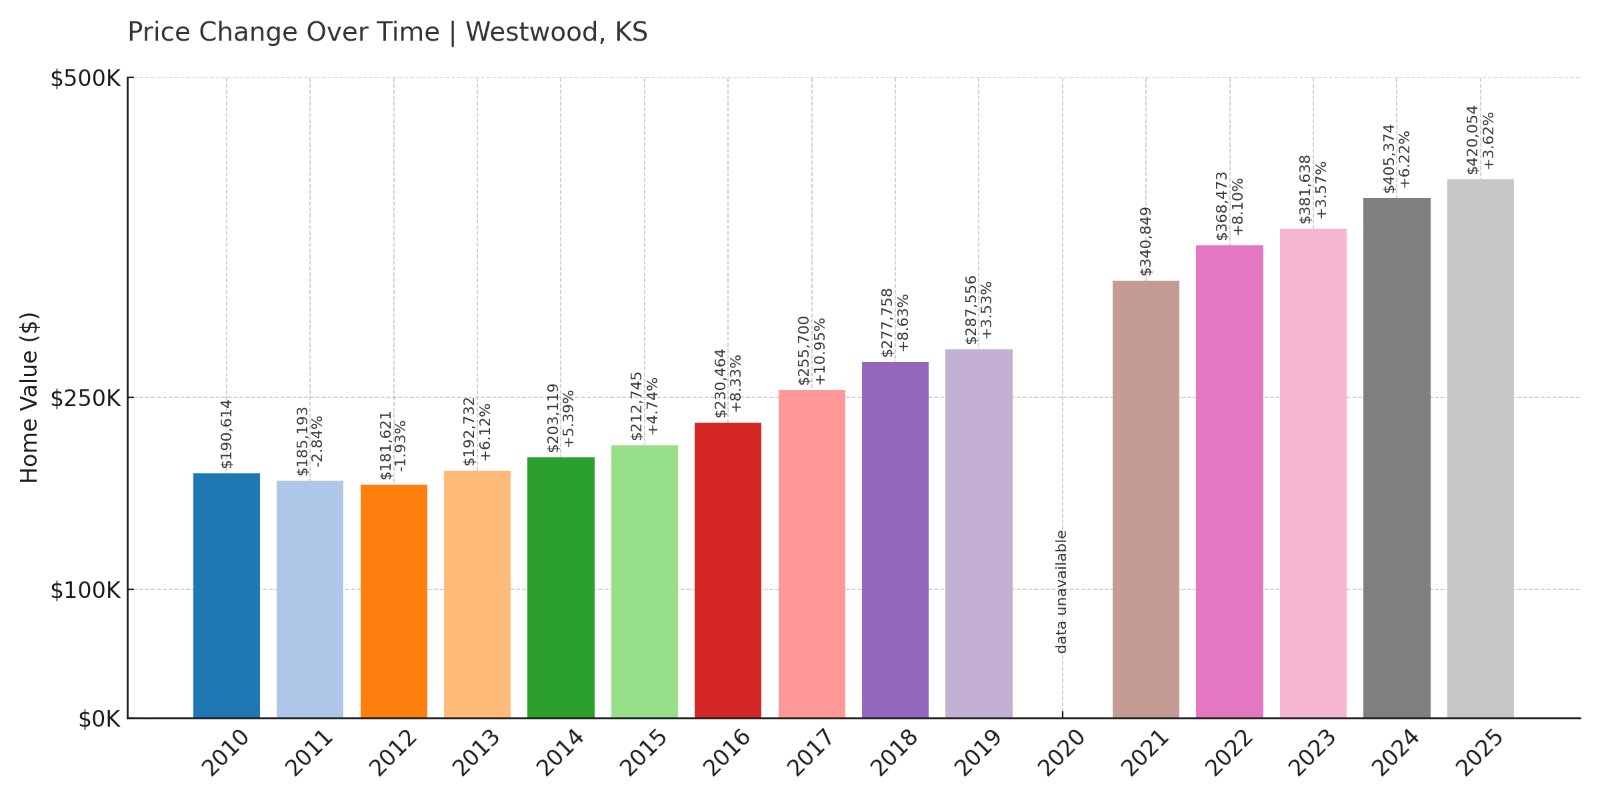
- 2010: $190,614
- 2011: $185,193 (-$5,421, -2.84% from previous year)
- 2012: $181,621 (-$3,572, -1.93% from previous year)
- 2013: $192,732 (+$11,111, +6.12% from previous year)
- 2014: $203,119 (+$10,387, +5.39% from previous year)
- 2015: $212,745 (+$9,626, +4.74% from previous year)
- 2016: $230,464 (+$17,719, +8.33% from previous year)
- 2017: $255,700 (+$25,236, +10.95% from previous year)
- 2018: $277,758 (+$22,058, +8.63% from previous year)
- 2019: $287,556 (+$9,799, +3.53% from previous year)
- 2020: N/A
- 2021: $340,849
- 2022: $368,473 (+$27,624, +8.10% from previous year)
- 2023: $381,638 (+$13,165, +3.57% from previous year)
- 2024: $405,374 (+$23,736, +6.22% from previous year)
- 2025: $420,054 (+$14,680, +3.62% from previous year)
Home values in Westwood have climbed over 120% since 2010, with growth accelerating after 2020. In a town of less than 2,000 residents, those gains reflect strong demand in a tight market, where available homes are limited and competition is high.
Westwood – Small Size, Big Demand

Westwood sits in Johnson County, tucked just inside the Kansas state line and surrounded by Kansas City metro suburbs. Its compact size, quiet neighborhoods, and short drive to downtown Kansas City make it a favorite for those who want convenience without urban density.
Due to its small geographic footprint and few available properties, demand tends to outpace supply—driving up values. Its parks, schools, and tree-lined streets add to the appeal. Westwood is one of those towns where location alone can explain the premium.
16. Olathe – 102.2% Home Price Increase Since 2010

- 2010: $208,227
- 2011: $199,103 (-$9,124, -4.38% from previous year)
- 2012: $196,937 (-$2,166, -1.09% from previous year)
- 2013: $206,878 (+$9,941, +5.05% from previous year)
- 2014: $217,196 (+$10,318, +4.99% from previous year)
- 2015: $228,601 (+$11,405, +5.25% from previous year)
- 2016: $243,150 (+$14,550, +6.36% from previous year)
- 2017: $259,921 (+$16,771, +6.90% from previous year)
- 2018: $273,684 (+$13,763, +5.30% from previous year)
- 2019: $284,830 (+$11,146, +4.07% from previous year)
- 2020: N/A
- 2021: $332,849
- 2022: $379,017 (+$46,167, +13.87% from previous year)
- 2023: $396,762 (+$17,745, +4.68% from previous year)
- 2024: $414,285 (+$17,524, +4.42% from previous year)
- 2025: $421,151 (+$6,866, +1.66% from previous year)
Olathe has more than doubled in home value since 2010, with steady appreciation and a significant bump in 2021 following national housing trends. Growth has continued, though at a more modest pace since 2023, signaling a maturing market that remains strong.
Olathe – Suburban Hub with Strong Appeal
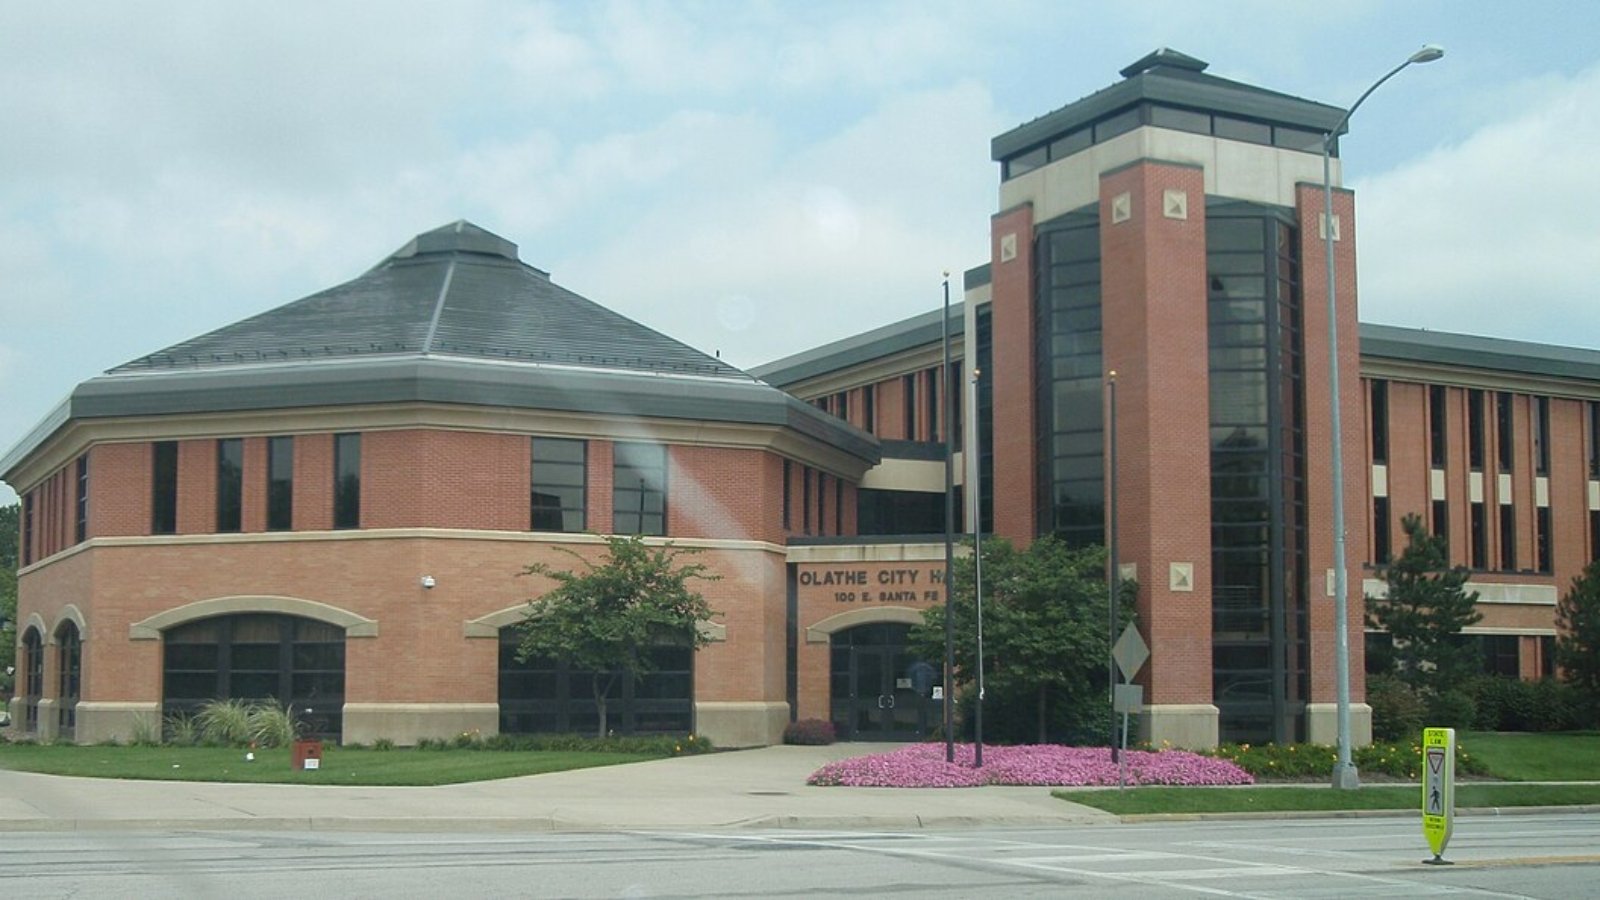
Olathe is one of the largest and fastest-growing cities in Kansas, located in the southwestern portion of the Kansas City metro. It’s a major economic center in Johnson County with a diverse housing stock, respected school districts, and access to multiple highways. These assets have made it a favorite for homebuyers over the past decade.
The city’s population has expanded significantly, helping to drive demand for homes. New subdivisions, mixed-use developments, and corporate relocations have all contributed to the housing price growth. Even with a recent slowdown, Olathe remains a top-tier market in Kansas.
15. De Soto – 117.6% Home Price Increase Since 2010

- 2010: $194,136
- 2011: $185,840 (-$8,296, -4.27% from previous year)
- 2012: $178,628 (-$7,212, -3.88% from previous year)
- 2013: $188,523 (+$9,895, +5.54% from previous year)
- 2014: $204,184 (+$15,661, +8.31% from previous year)
- 2015: $220,393 (+$16,209, +7.94% from previous year)
- 2016: $230,942 (+$10,549, +4.79% from previous year)
- 2017: $248,172 (+$17,230, +7.46% from previous year)
- 2018: $265,107 (+$16,935, +6.82% from previous year)
- 2019: $279,181 (+$14,074, +5.31% from previous year)
- 2020: N/A
- 2021: $328,995
- 2022: $377,872 (+$48,877, +14.86% from previous year)
- 2023: $392,857 (+$14,985, +3.97% from previous year)
- 2024: $411,204 (+$18,346, +4.67% from previous year)
- 2025: $422,370 (+$11,166, +2.72% from previous year)
De Soto’s home values have grown by over 117% since 2010, driven by strong post-2020 price increases. A sharp rise in 2021 helped push the town onto this list, followed by continued—if slightly slower—appreciation in the years since.
De Soto – Small Town, Big Momentum
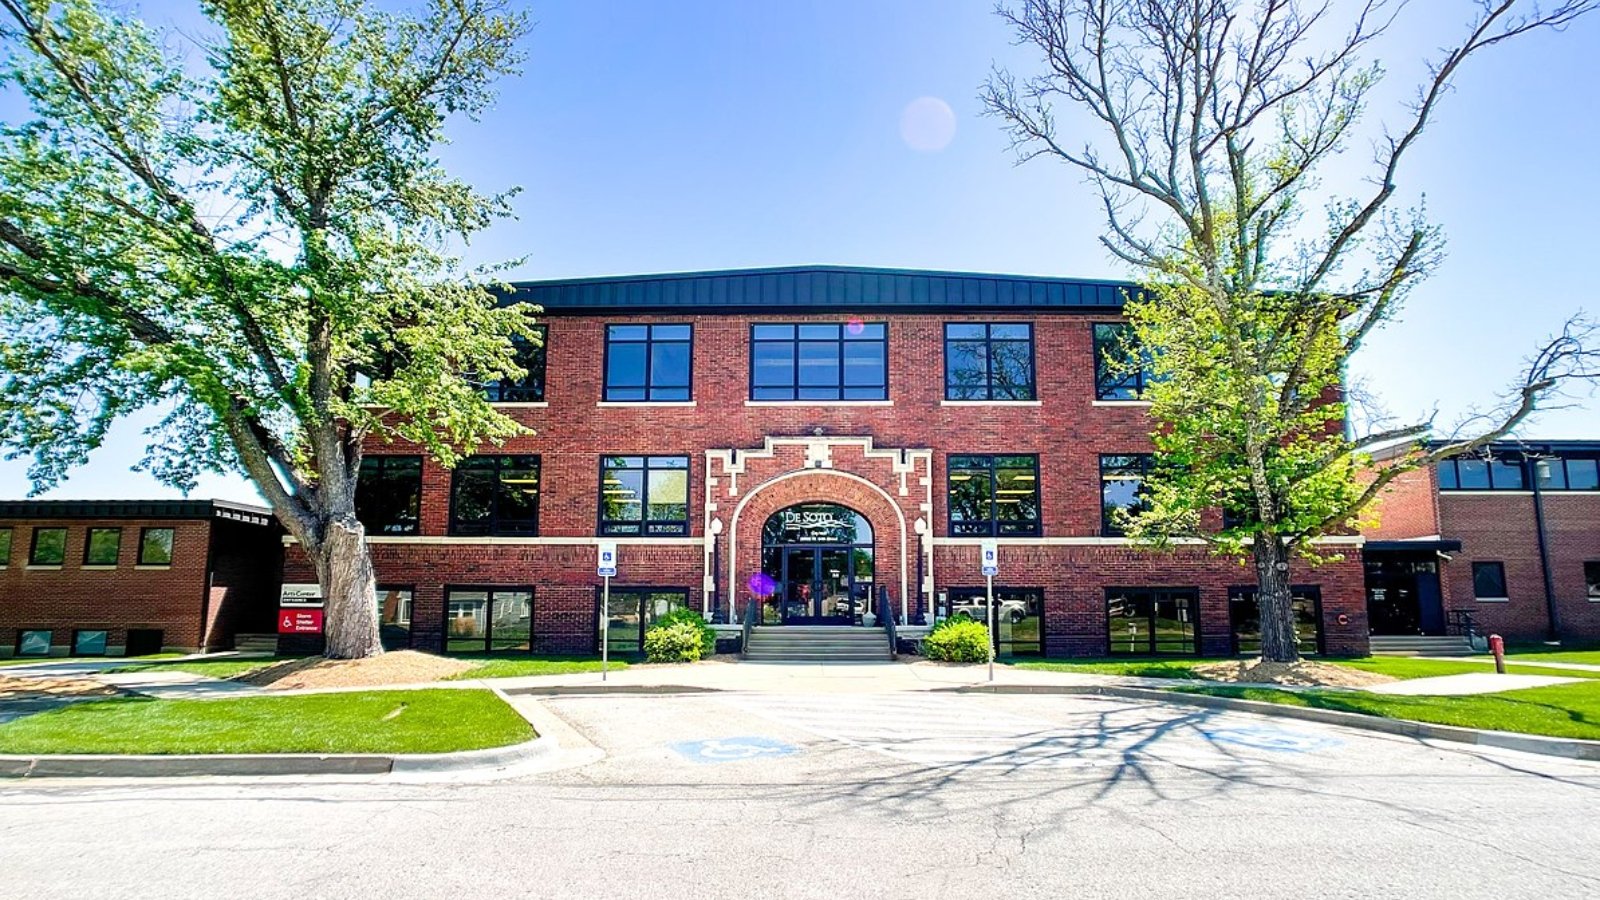
De Soto, situated along the Kansas River in Johnson County, is a small but growing town that’s seen an uptick in housing demand. Recent developments and proximity to major job centers in Olathe and Lawrence make it attractive for commuters seeking more space and quieter surroundings.
New interest in De Soto is also tied to infrastructure improvements and long-term planning, including land set aside for future industrial and tech development. The town’s growth is less about flash and more about smart positioning and sustained demand, especially among families.
14. Spring Hill – 123.2% Home Price Increase Since 2010


- 2010: $192,351
- 2011: $187,474 (-$4,877, -2.54% from previous year)
- 2012: $186,186 (-$1,288, -0.69% from previous year)
- 2013: $195,066 (+$8,880, +4.77% from previous year)
- 2014: $203,616 (+$8,550, +4.38% from previous year)
- 2015: $217,666 (+$14,050, +6.90% from previous year)
- 2016: $232,623 (+$14,957, +6.87% from previous year)
- 2017: $248,023 (+$15,401, +6.62% from previous year)
- 2018: $263,320 (+$15,297, +6.17% from previous year)
- 2019: $278,415 (+$15,095, +5.73% from previous year)
- 2020: N/A
- 2021: $331,125
- 2022: $381,960 (+$50,835, +15.35% from previous year)
- 2023: $395,825 (+$13,865, +3.63% from previous year)
- 2024: $420,637 (+$24,812, +6.27% from previous year)
- 2025: $429,347 (+$8,710, +2.07% from previous year)
Spring Hill’s housing market has surged since 2010, with prices more than doubling thanks to consistent growth and a sharp leap after 2020. The town’s affordability in earlier years set the stage for today’s higher values.
Spring Hill – Southern Expansion Success Story

Spring Hill straddles Johnson and Miami Counties and is one of the southernmost suburbs of the Kansas City metro area. Its affordable housing stock, newer developments, and local amenities have turned it into a high-demand location over the past decade.
The town continues to benefit from suburban expansion and new families moving in. School quality, family-friendly neighborhoods, and steady infrastructure investment are helping keep demand high—even as prices rise. Recent trends suggest Spring Hill still has runway left for future growth.
13. Basehor – 104.8% Home Price Increase Since 2010
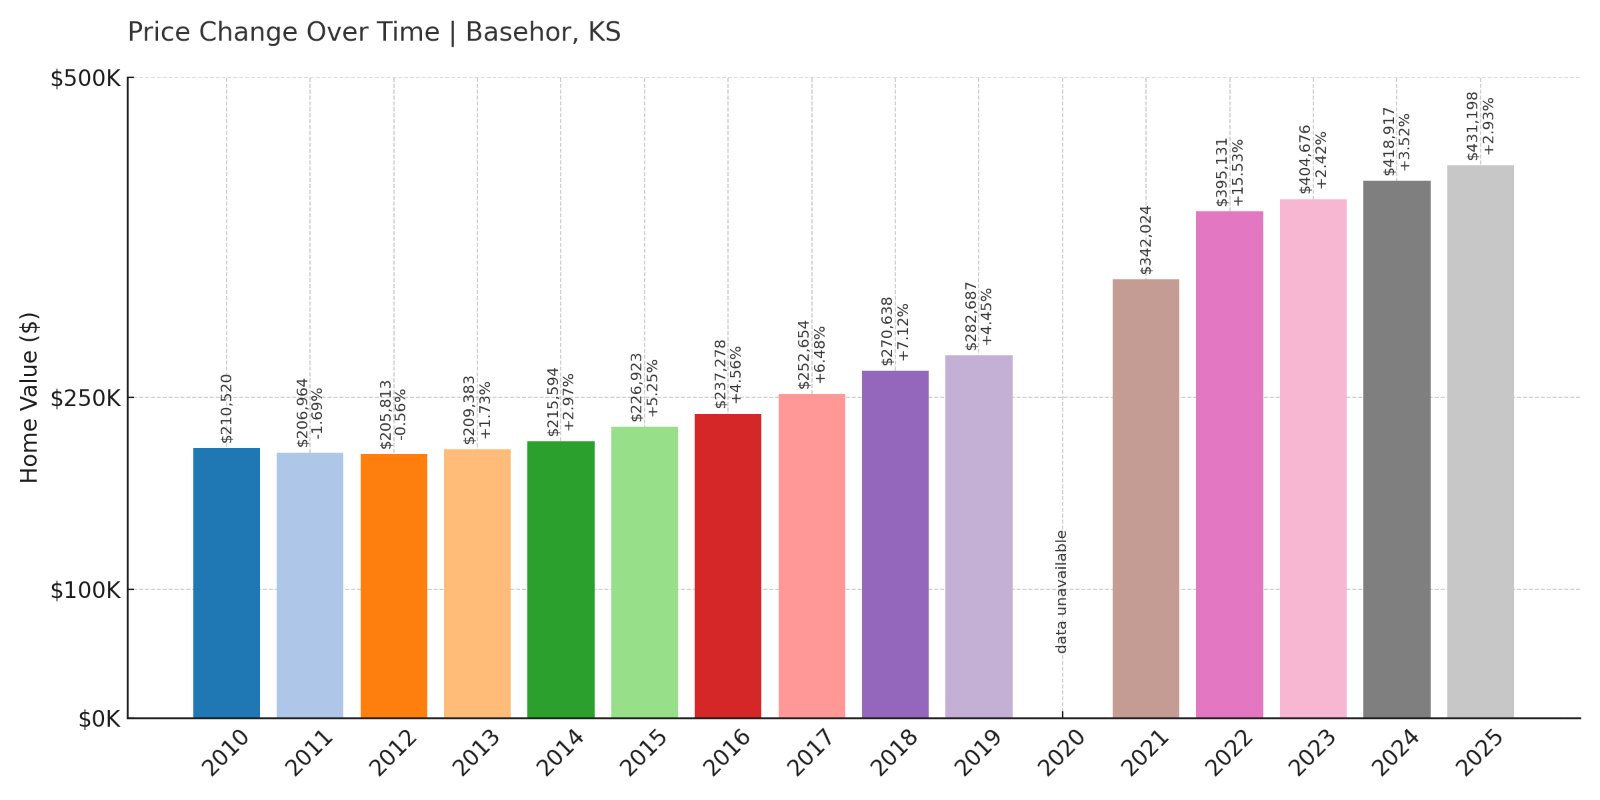
- 2010: $210,520
- 2011: $206,964 (-$3,556, -1.69% from previous year)
- 2012: $205,813 (-$1,151, -0.56% from previous year)
- 2013: $209,383 (+$3,570, +1.73% from previous year)
- 2014: $215,594 (+$6,211, +2.97% from previous year)
- 2015: $226,923 (+$11,329, +5.25% from previous year)
- 2016: $237,278 (+$10,355, +4.56% from previous year)
- 2017: $252,654 (+$15,376, +6.48% from previous year)
- 2018: $270,638 (+$17,983, +7.12% from previous year)
- 2019: $282,687 (+$12,049, +4.45% from previous year)
- 2020: N/A
- 2021: $342,024
- 2022: $395,131 (+$53,107, +15.53% from previous year)
- 2023: $404,676 (+$9,545, +2.42% from previous year)
- 2024: $418,917 (+$14,241, +3.52% from previous year)
- 2025: $431,198 (+$12,281, +2.93% from previous year)
Basehor’s home values have risen over 100% since 2010, thanks to solid annual growth and major increases between 2021 and 2022. Even as growth has slowed recently, the upward trend remains clear.
Basehor – Popular with Commuters and Families
Located in Leavenworth County, Basehor is a rapidly developing suburb northwest of Kansas City. It offers a quieter setting with quick access to both I-70 and I-435, making it attractive to commuters. Families are drawn to the Basehor-Linwood school district and nearby parks.
The housing market here has benefited from a mix of new construction and existing home turnover. Prices jumped in 2022 as demand surged, and the town continues to add residents steadily. With room to grow and access to metro-area conveniences, Basehor remains a top pick for buyers in northeast Kansas.
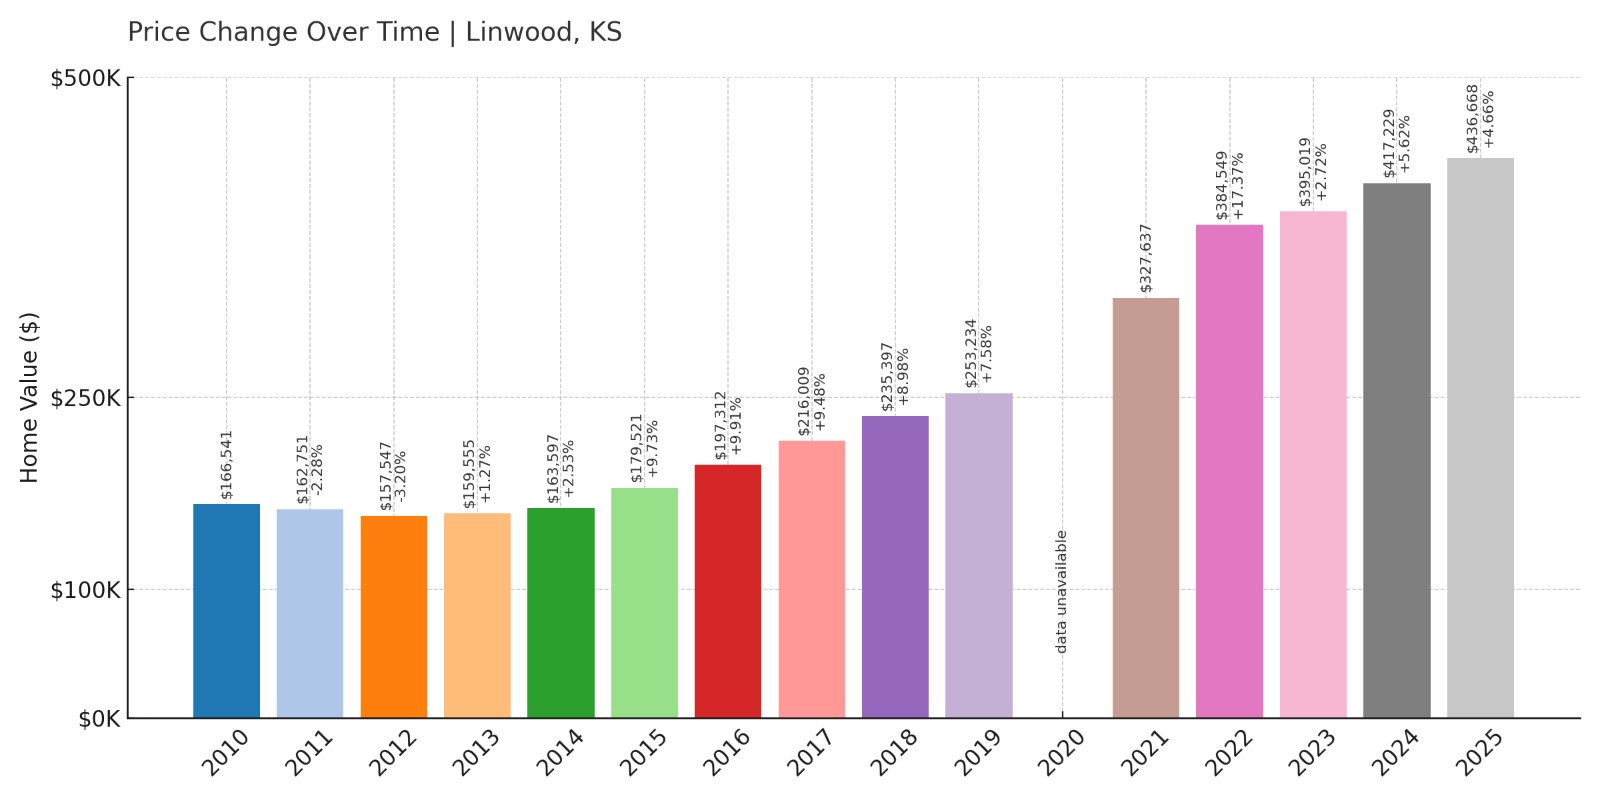
12. Linwood – 162.3% Home Price Increase Since 2010
Would you like to save this?
- 2010: $166,541
- 2011: $162,751 (-$3,789, -2.28% from previous year)
- 2012: $157,547 (-$5,204, -3.20% from previous year)
- 2013: $159,555 (+$2,008, +1.27% from previous year)
- 2014: $163,597 (+$4,042, +2.53% from previous year)
- 2015: $179,521 (+$15,924, +9.73% from previous year)
- 2016: $197,312 (+$17,791, +9.91% from previous year)
- 2017: $216,009 (+$18,697, +9.48% from previous year)
- 2018: $235,397 (+$19,388, +8.98% from previous year)
- 2019: $253,234 (+$17,837, +7.58% from previous year)
- 2020: N/A
- 2021: $327,637
- 2022: $384,549 (+$56,912, +17.37% from previous year)
- 2023: $395,019 (+$10,470, +2.72% from previous year)
- 2024: $417,229 (+$22,210, +5.62% from previous year)
- 2025: $436,668 (+$19,439, +4.66% from previous year)
Linwood’s home prices have increased more than 160% since 2010, with large annual gains throughout the late 2010s and a sharp post-2020 surge. The town has become significantly more expensive in just a few years, particularly since 2021.
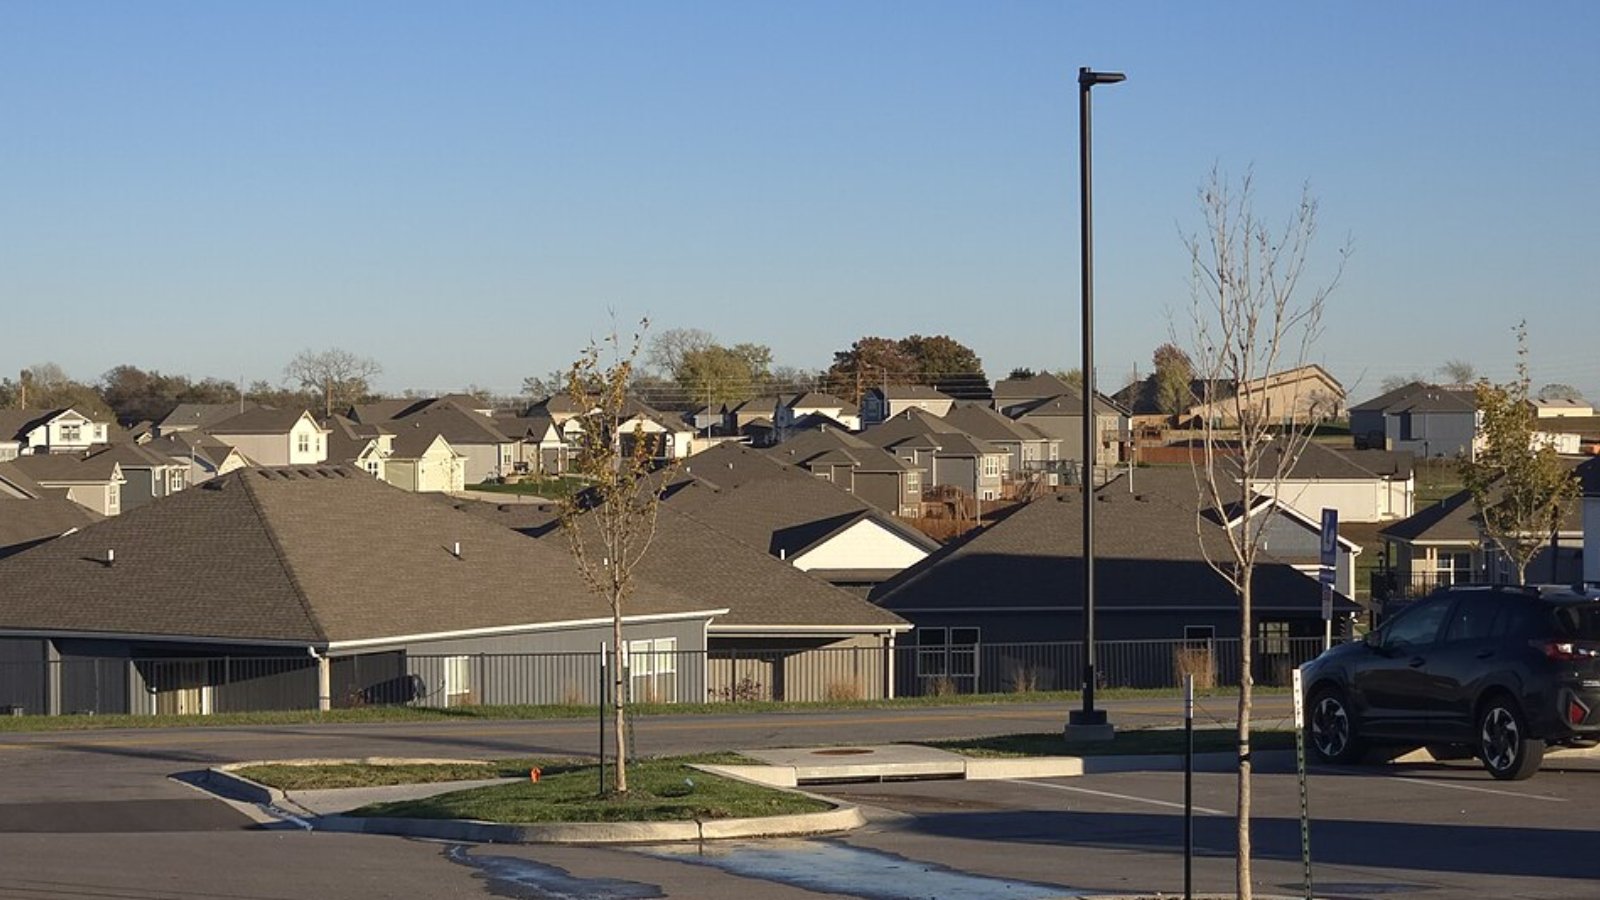
Linwood – Big Growth in a Small Community
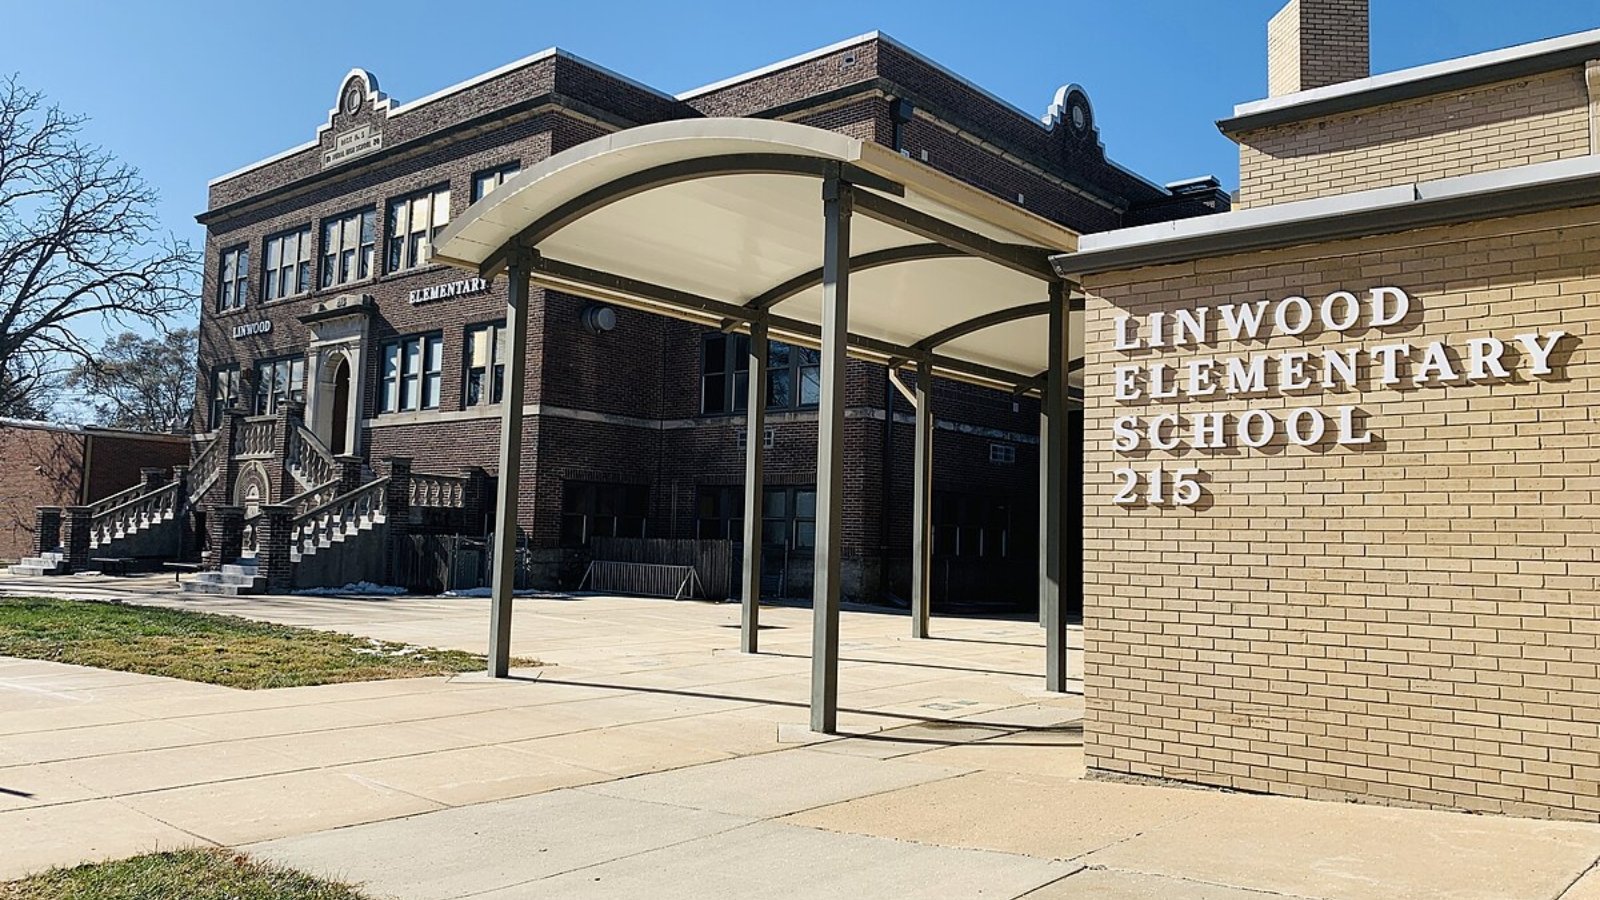
Linwood is a rural town in Leavenworth County, situated between Lawrence and Kansas City. Once a quiet agricultural hub, Linwood has experienced surprising price appreciation as development pushes westward from the metro suburbs. The small population and limited housing inventory add to the upward pressure on home prices.
Buyers are increasingly drawn to the balance of privacy and proximity—residents can commute to either city while enjoying a slower pace of life. The growth is particularly notable given Linwood’s size and history, suggesting a broader trend of outward migration from dense metro areas.
11. Lenexa – 99.3% Home Price Increase Since 2010
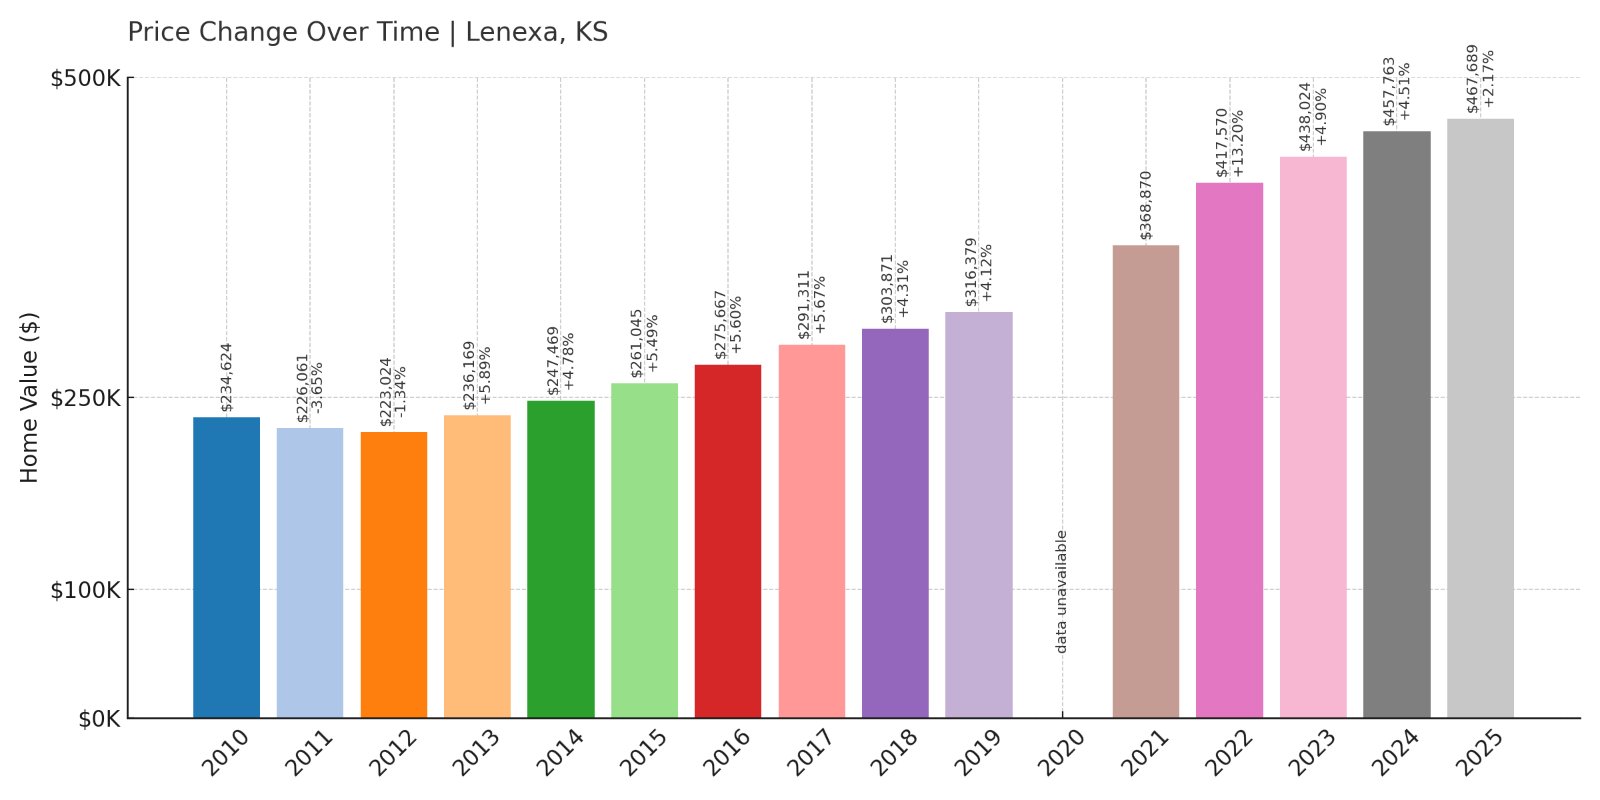
- 2010: $234,624
- 2011: $226,061 (-$8,563, -3.65% from previous year)
- 2012: $223,024 (-$3,037, -1.34% from previous year)
- 2013: $236,169 (+$13,145, +5.89% from previous year)
- 2014: $247,469 (+$11,300, +4.78% from previous year)
- 2015: $261,045 (+$13,575, +5.49% from previous year)
- 2016: $275,667 (+$14,622, +5.60% from previous year)
- 2017: $291,311 (+$15,644, +5.68% from previous year)
- 2018: $303,871 (+$12,560, +4.31% from previous year)
- 2019: $316,379 (+$12,508, +4.12% from previous year)
- 2020: N/A
- 2021: $368,870
- 2022: $417,570 (+$48,699, +13.20% from previous year)
- 2023: $438,024 (+$20,454, +4.90% from previous year)
- 2024: $457,763 (+$19,739, +4.51% from previous year)
- 2025: $467,689 (+$9,926, +2.17% from previous year)
Lenexa’s home values have nearly doubled since 2010, thanks to steady, moderate gains through the 2010s and a major leap from 2020 to 2022. Even with recent growth slowing, the trend remains solidly upward in this western Kansas City suburb.
Lenexa – Consistency and Convenience
Lenexa is one of the most well-established cities in Johnson County. Known for its business parks, family-friendly neighborhoods, and trail systems, it offers a balance of suburban calm and economic opportunity. Proximity to I-435 and I-35 makes commuting across the metro area easy.
Its home values have risen steadily without extreme volatility, which reflects its reputation as a stable and desirable place to live. Lenexa also benefits from continued development, including restaurants, schools, and the Lenexa City Center—a mixed-use district that has helped boost appeal.
10. Overland Park – 103.6% Home Price Increase Since 2010

- 2010: $230,138
- 2011: $222,392 (-$7,745, -3.37% from previous year)
- 2012: $220,787 (-$1,606, -0.72% from previous year)
- 2013: $236,301 (+$15,514, +7.03% from previous year)
- 2014: $248,874 (+$12,573, +5.32% from previous year)
- 2015: $263,058 (+$14,184, +5.70% from previous year)
- 2016: $277,581 (+$14,523, +5.52% from previous year)
- 2017: $292,819 (+$15,238, +5.49% from previous year)
- 2018: $307,303 (+$14,484, +4.95% from previous year)
- 2019: $319,426 (+$12,123, +3.95% from previous year)
- 2020: N/A
- 2021: $370,004
- 2022: $416,328 (+$46,324, +12.52% from previous year)
- 2023: $436,958 (+$20,631, +4.96% from previous year)
- 2024: $461,604 (+$24,646, +5.64% from previous year)
- 2025: $468,777 (+$7,173, +1.55% from previous year)
Overland Park has posted more than 100% growth in home values since 2010. Prices increased steadily year after year and then jumped sharply after 2020, reflecting strong demand for housing in one of Kansas’s largest cities.
Overland Park – The Gold Standard in Kansas Suburbs
Overland Park consistently ranks among the best places to live in the U.S., and its home prices reflect that. The city is the second most populous in Kansas and has a mix of excellent public schools, shopping districts, parks, and job opportunities.
Its strong market appeal spans generations—from young families to retirees—and includes both upscale neighborhoods and accessible starter homes. With large employers, good schools, and constant reinvestment in infrastructure, Overland Park remains a real estate powerhouse.
9. Prairie Village – 124.0% Home Price Increase Since 2010
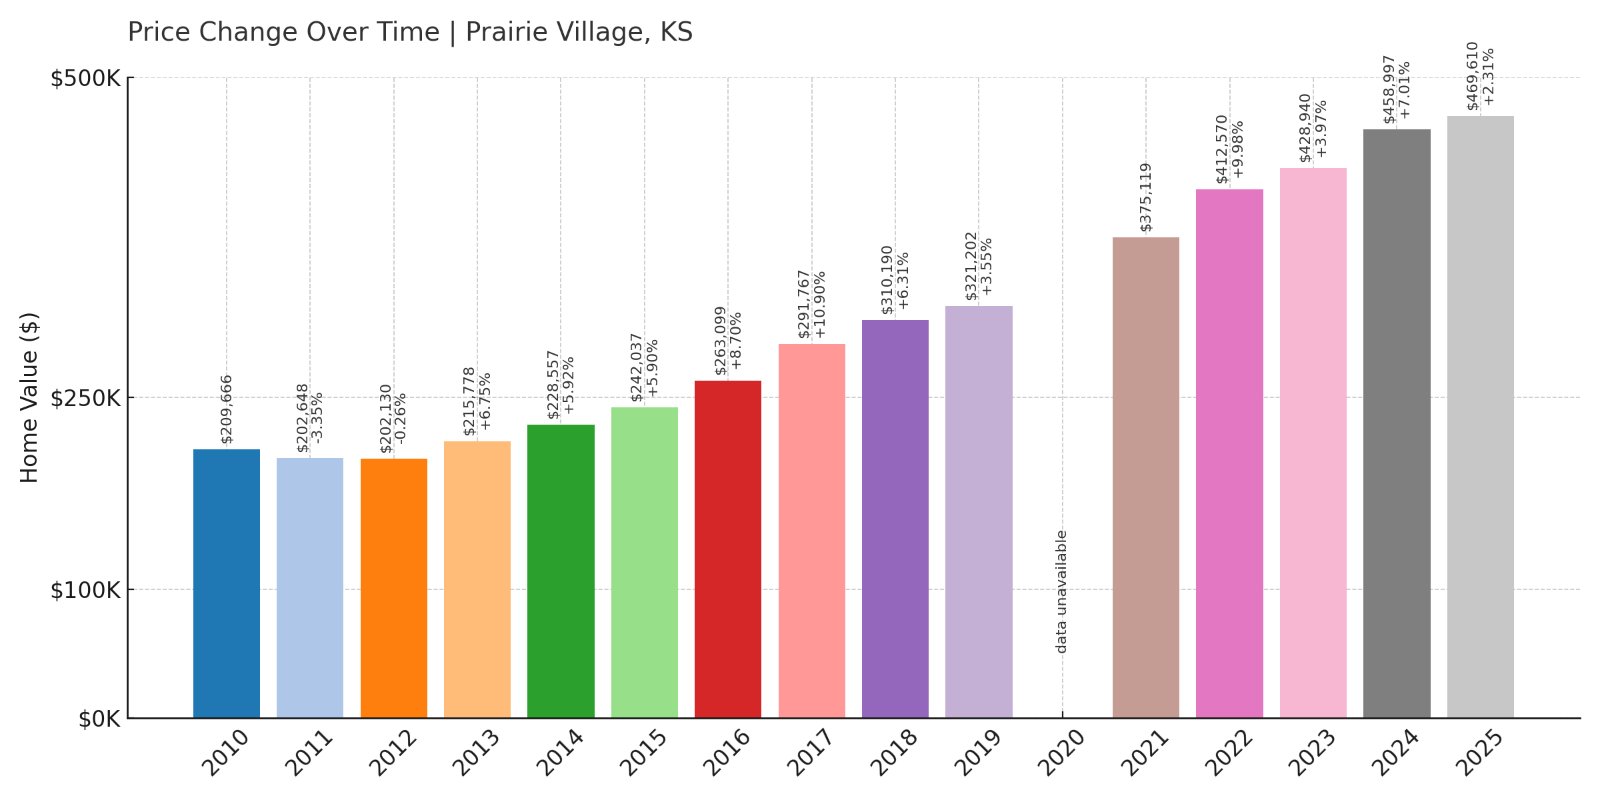
- 2010: $209,666
- 2011: $202,648 (-$7,018, -3.35% from previous year)
- 2012: $202,130 (-$518, -0.26% from previous year)
- 2013: $215,778 (+$13,648, +6.75% from previous year)
- 2014: $228,557 (+$12,779, +5.92% from previous year)
- 2015: $242,037 (+$13,480, +5.90% from previous year)
- 2016: $263,099 (+$21,062, +8.70% from previous year)
- 2017: $291,767 (+$28,669, +10.90% from previous year)
- 2018: $310,190 (+$18,423, +6.31% from previous year)
- 2019: $321,202 (+$11,012, +3.55% from previous year)
- 2020: N/A
- 2021: $375,119
- 2022: $412,570 (+$37,451, +9.98% from previous year)
- 2023: $428,940 (+$16,370, +3.97% from previous year)
- 2024: $458,997 (+$30,057, +7.01% from previous year)
- 2025: $469,610 (+$10,613, +2.31% from previous year)
Prairie Village has seen more than a 120% increase in home values since 2010, reflecting consistent and accelerating demand. Price growth surged especially after 2020, with three straight years of solid gains pushing average prices near the half-million-dollar mark.
Prairie Village – A Classic Neighborhood with Strong Demand
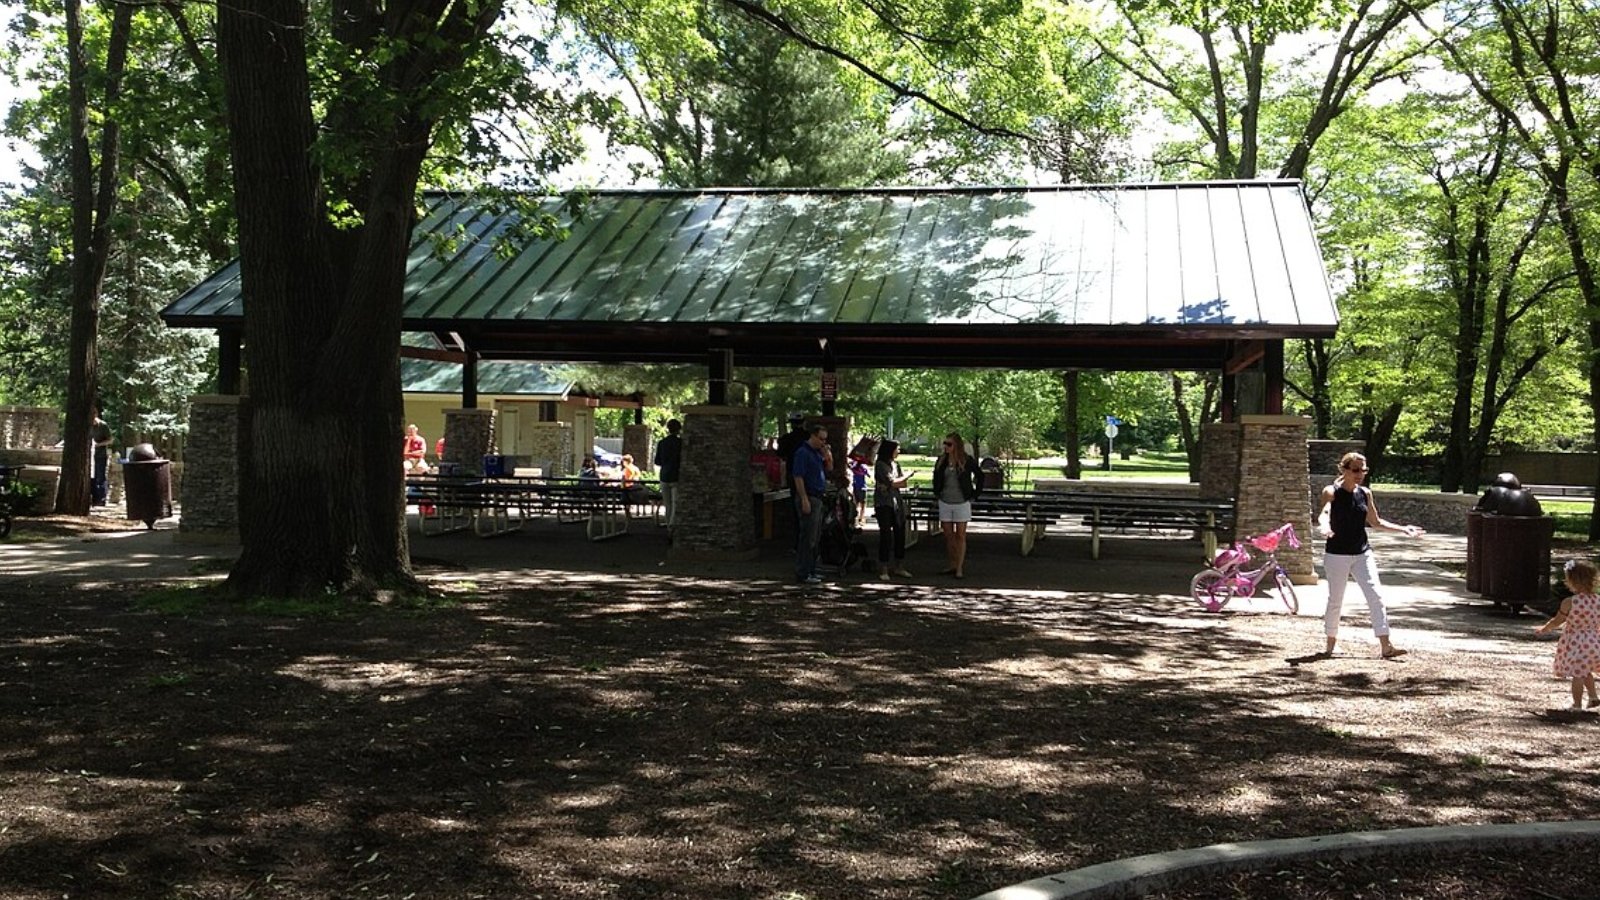
Prairie Village sits just west of the Kansas-Missouri state line and is known for its charming mid-century homes, walkable neighborhoods, and high-performing schools. Its location offers quick access to both downtown Kansas City and Overland Park, making it ideal for commuters and families alike.
Many homes in the area have undergone updates and remodels, adding value in an already popular market. The appeal of mature trees, local shops, and tight-knit community character has made Prairie Village one of the most desirable—and expensive—towns in the state.
8. Eastborough – 84.2% Home Price Increase Since 2010
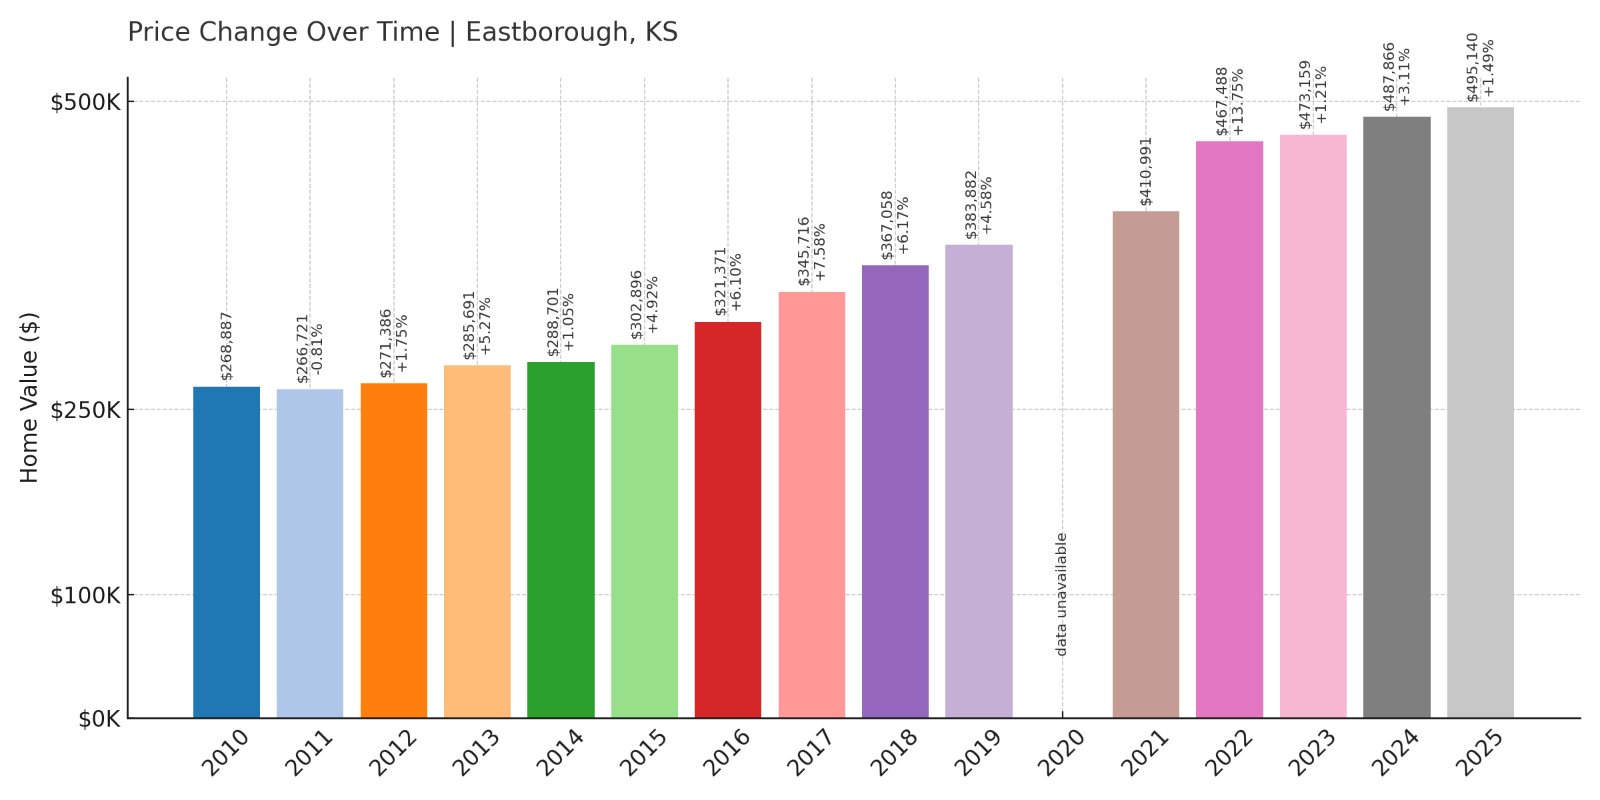
- 2010: $268,887
- 2011: $266,721 (-$2,166, -0.81% from previous year)
- 2012: $271,386 (+$4,664, +1.75% from previous year)
- 2013: $285,691 (+$14,305, +5.27% from previous year)
- 2014: $288,701 (+$3,010, +1.05% from previous year)
- 2015: $302,896 (+$14,195, +4.92% from previous year)
- 2016: $321,371 (+$18,475, +6.10% from previous year)
- 2017: $345,716 (+$24,345, +7.58% from previous year)
- 2018: $367,058 (+$21,342, +6.17% from previous year)
- 2019: $383,882 (+$16,825, +4.58% from previous year)
- 2020: N/A
- 2021: $410,991
- 2022: $467,488 (+$56,498, +13.75% from previous year)
- 2023: $473,159 (+$5,671, +1.21% from previous year)
- 2024: $487,866 (+$14,707, +3.11% from previous year)
- 2025: $495,140 (+$7,274, +1.49% from previous year)
Eastborough has experienced an 84% rise in home values since 2010. A standout year in 2022 saw a jump of over $56,000, while subsequent years brought smaller but steady gains that reinforced its elite status.
Eastborough – Old Wichita Charm with Premium Price Tags
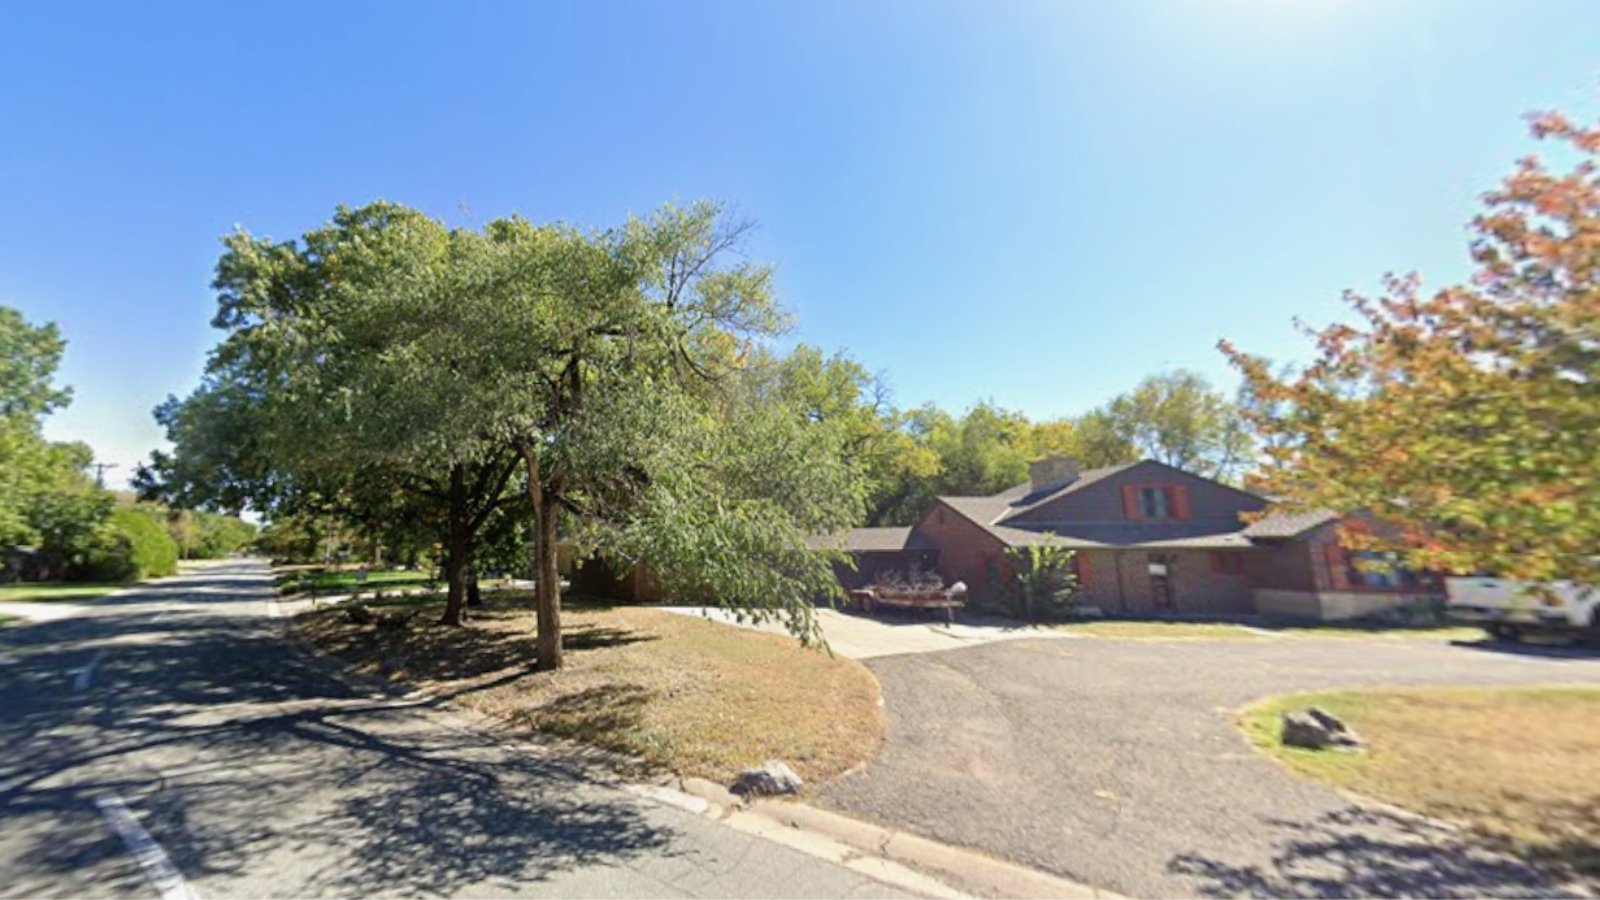
Eastborough is an enclave entirely surrounded by Wichita, known for its quiet, tree-lined streets and well-kept, architecturally distinct homes. Originally developed in the early 20th century, the neighborhood has held its prestige for generations.
Buyers seeking classic homes on large lots in a peaceful setting are drawn here despite higher-than-average price tags. The town’s character and proximity to Wichita’s core business and shopping districts help maintain its steady demand and solid appreciation rate.
7. Fairway – 102.9% Home Price Increase Since 2010

- 2010: $299,611
- 2011: $282,503 (-$17,107, -5.71% from previous year)
- 2012: $284,991 (+$2,487, +0.88% from previous year)
- 2013: $313,735 (+$28,744, +10.09% from previous year)
- 2014: $330,600 (+$16,865, +5.38% from previous year)
- 2015: $349,107 (+$18,507, +5.60% from previous year)
- 2016: $369,354 (+$20,247, +5.80% from previous year)
- 2017: $395,956 (+$26,602, +7.20% from previous year)
- 2018: $417,328 (+$21,372, +5.40% from previous year)
- 2019: $434,573 (+$17,245, +4.13% from previous year)
- 2020: N/A
- 2021: $478,494
- 2022: $532,863 (+$54,369, +11.36% from previous year)
- 2023: $551,925 (+$19,062, +3.58% from previous year)
- 2024: $586,960 (+$35,035, +6.35% from previous year)
- 2025: $608,074 (+$21,114, +3.60% from previous year)
Fairway’s housing prices have more than doubled since 2010, driven by consistent demand and a standout leap in 2022. It’s now one of the most desirable—and priciest—places to live in the Kansas City metro area.
Fairway – Intimate, Upscale, and Close to Everything
Often called “The City of Trees,” Fairway is a small residential town in Johnson County. Its location just minutes from the Country Club Plaza and downtown Kansas City makes it extremely convenient, while its quiet streets and classic homes add significant charm.
The town’s real estate is dominated by updated mid-century homes and newer infill builds, with lots of curb appeal. Prices reflect the desirability and limited supply—this is a small town where listings often sell quickly and well above average for the region.
6. Westwood Hills – 96.8% Home Price Increase Since 2010
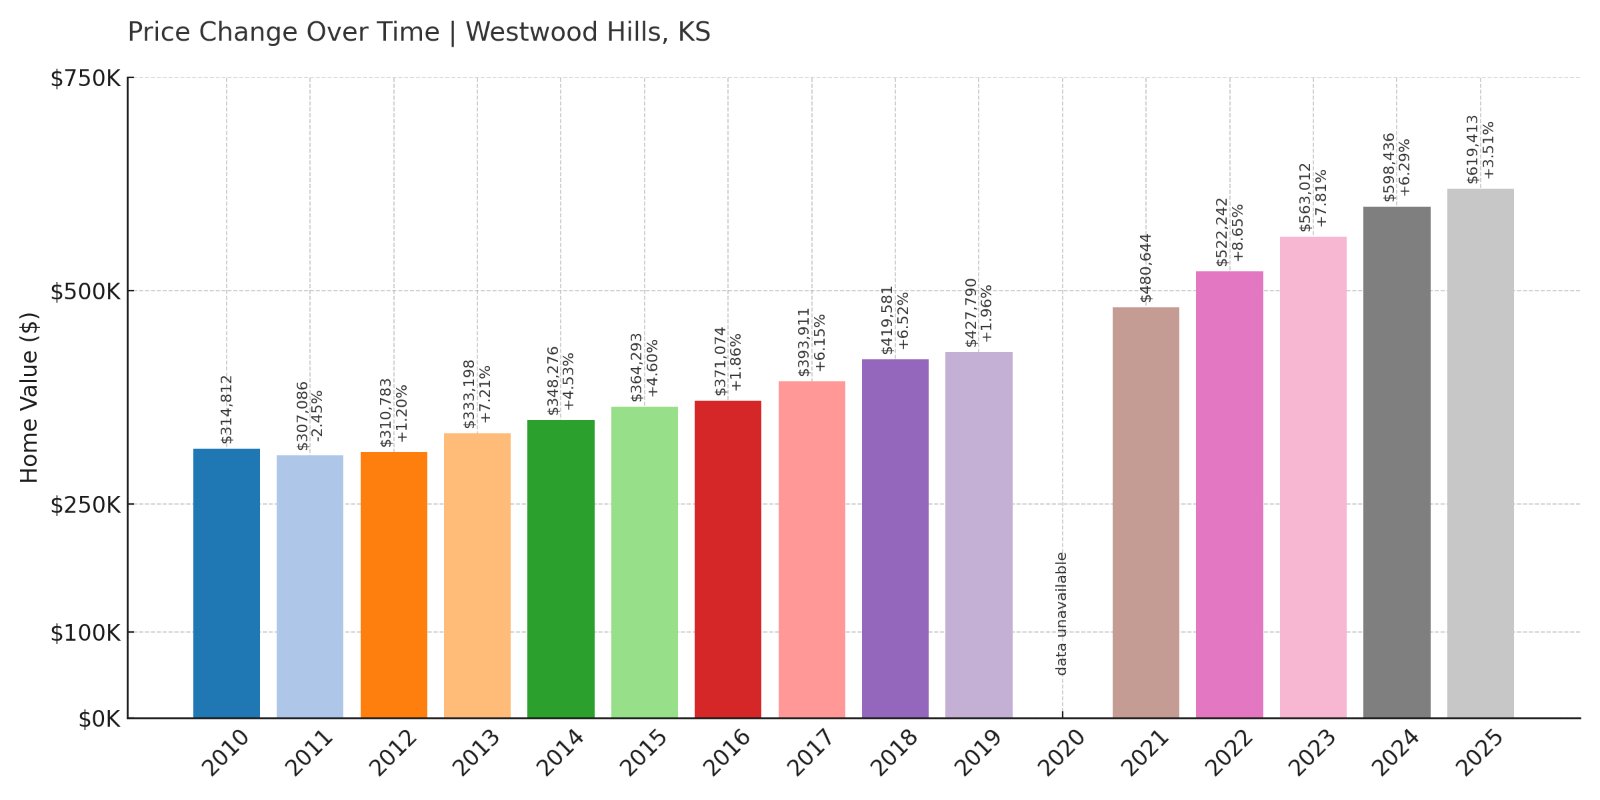
- 2010: $314,812
- 2011: $307,086 (-$7,725, -2.45% from previous year)
- 2012: $310,783 (+$3,697, +1.20% from previous year)
- 2013: $333,198 (+$22,416, +7.21% from previous year)
- 2014: $348,276 (+$15,078, +4.53% from previous year)
- 2015: $364,293 (+$16,017, +4.60% from previous year)
- 2016: $371,074 (+$6,780, +1.86% from previous year)
- 2017: $393,911 (+$22,837, +6.15% from previous year)
- 2018: $419,581 (+$25,671, +6.52% from previous year)
- 2019: $427,790 (+$8,209, +1.96% from previous year)
- 2020: N/A
- 2021: $480,644
- 2022: $522,242 (+$41,598, +8.65% from previous year)
- 2023: $563,012 (+$40,770, +7.81% from previous year)
- 2024: $598,436 (+$35,424, +6.29% from previous year)
- 2025: $619,413 (+$20,978, +3.51% from previous year)
Westwood Hills has seen a nearly 97% increase in home prices since 2010. The town’s compact size, high property values, and architectural beauty continue to attract buyers, driving sustained price growth across the board.
Westwood Hills – One of Kansas’s Most Exclusive Enclaves

Westwood Hills is a tiny, historic town with fewer than 500 residents, known for its Tudor-style homes, winding lanes, and picturesque charm. It borders the Kansas City metro and offers a unique blend of exclusivity and accessibility.
Its limited housing stock and consistent demand keep prices high, and the community’s appeal continues to grow. With some of the highest per-square-foot values in the region, Westwood Hills stands out as one of the most expensive places to live in the state.
5. Bucyrus – 140.2% Home Price Increase Since 2010
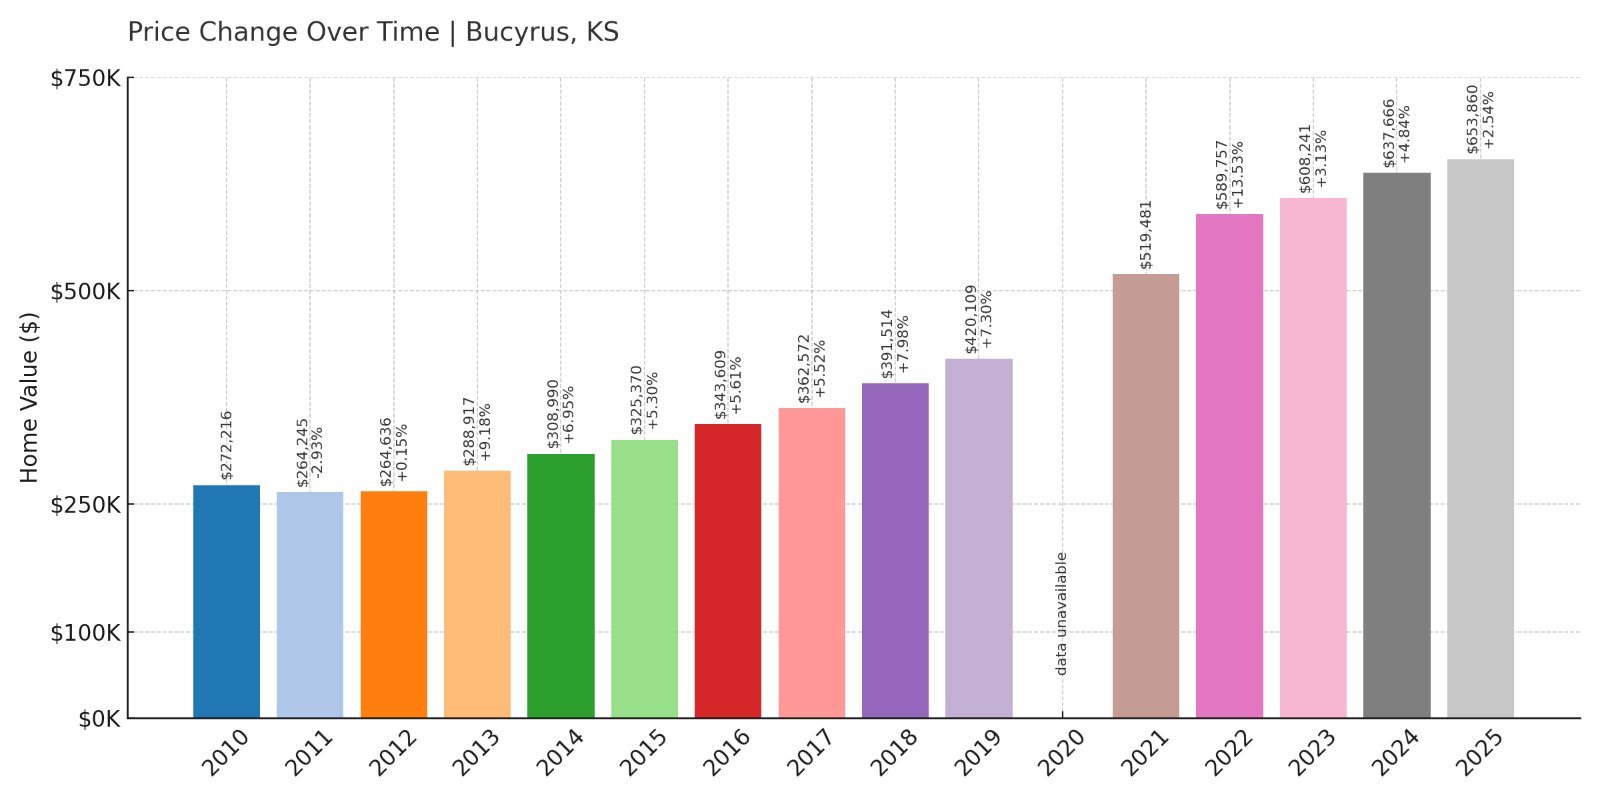
- 2010: $272,216
- 2011: $264,245 (-$7,970, -2.93% from previous year)
- 2012: $264,636 (+$391, +0.15% from previous year)
- 2013: $288,917 (+$24,281, +9.18% from previous year)
- 2014: $308,990 (+$20,074, +6.95% from previous year)
- 2015: $325,370 (+$16,380, +5.30% from previous year)
- 2016: $343,609 (+$18,239, +5.61% from previous year)
- 2017: $362,572 (+$18,963, +5.52% from previous year)
- 2018: $391,514 (+$28,942, +7.98% from previous year)
- 2019: $420,109 (+$28,595, +7.30% from previous year)
- 2020: N/A
- 2021: $519,481
- 2022: $589,757 (+$70,277, +13.53% from previous year)
- 2023: $608,241 (+$18,484, +3.13% from previous year)
- 2024: $637,666 (+$29,425, +4.84% from previous year)
- 2025: $653,860 (+$16,194, +2.54% from previous year)
Bucyrus home values have risen over 140% since 2010, with large year-over-year increases across the board—especially between 2020 and 2022. It stands out as one of the most expensive rural communities in the state, driven by high-end development and large lots.
Bucyrus – Upscale Country Living
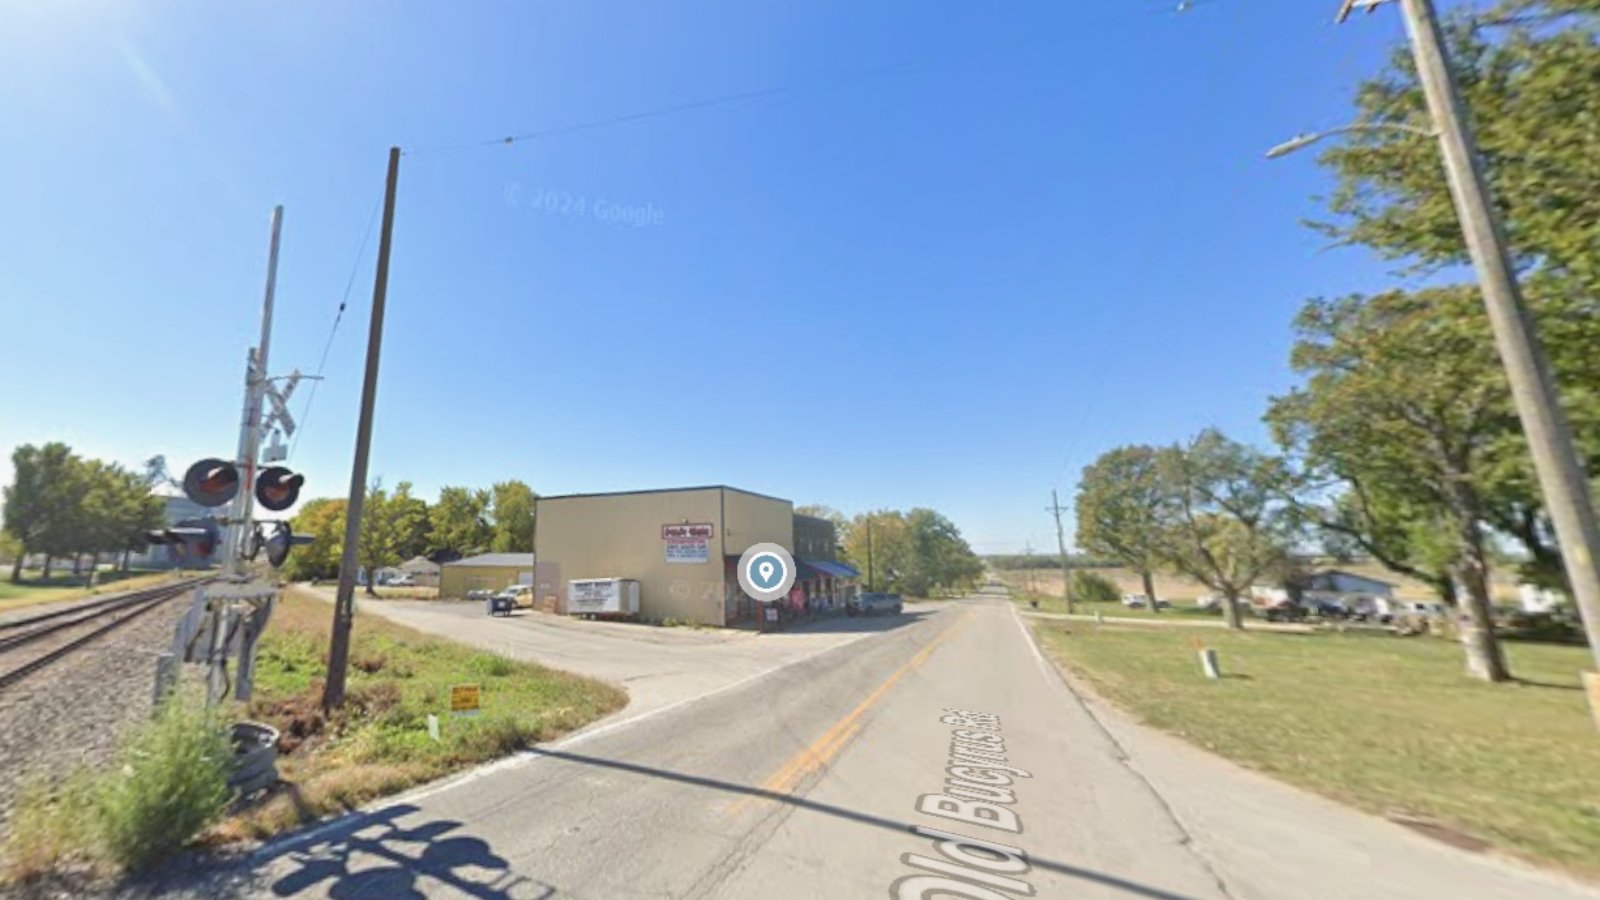
Located in Miami County just south of Overland Park, Bucyrus offers a unique blend of rural serenity and luxury living. It’s a destination for custom homes on acreage, making it popular among affluent buyers looking for space, privacy, and exclusivity within commuting distance of Kansas City.
The area is dotted with estate-style properties and new luxury construction, contributing to its rapid price appreciation. Bucyrus benefits from its location near top-rated school districts and the natural appeal of open landscapes, helping drive demand even as prices have soared.
4. Leawood – 90.6% Home Price Increase Since 2010
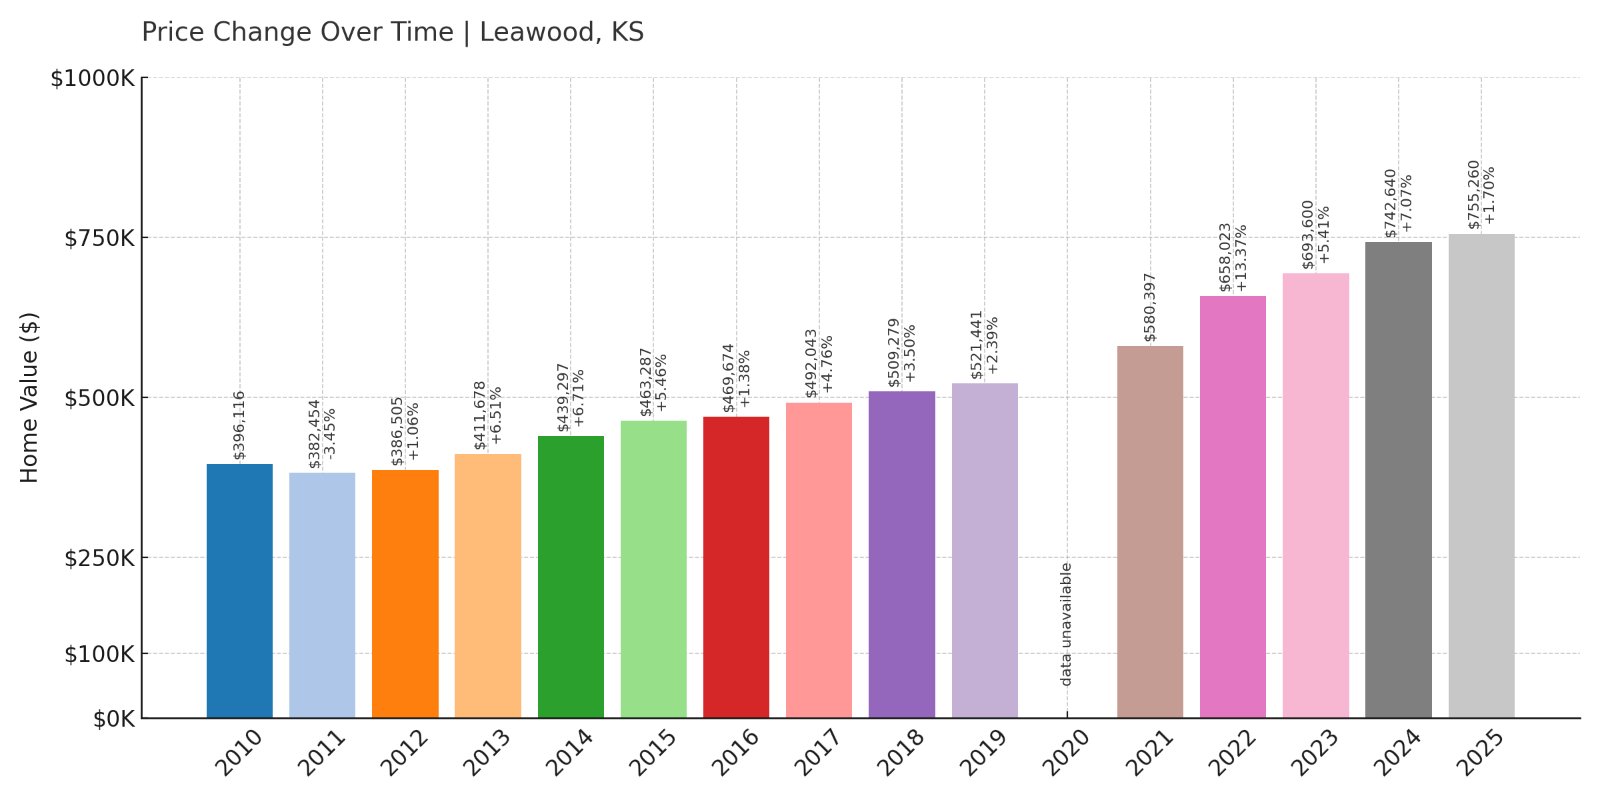
- 2010: $396,116
- 2011: $382,454 (-$13,662, -3.45% from previous year)
- 2012: $386,505 (+$4,051, +1.06% from previous year)
- 2013: $411,678 (+$25,173, +6.51% from previous year)
- 2014: $439,297 (+$27,619, +6.71% from previous year)
- 2015: $463,287 (+$23,991, +5.46% from previous year)
- 2016: $469,674 (+$6,386, +1.38% from previous year)
- 2017: $492,043 (+$22,370, +4.76% from previous year)
- 2018: $509,279 (+$17,236, +3.50% from previous year)
- 2019: $521,441 (+$12,162, +2.39% from previous year)
- 2020: N/A
- 2021: $580,397
- 2022: $658,023 (+$77,626, +13.37% from previous year)
- 2023: $693,600 (+$35,577, +5.41% from previous year)
- 2024: $742,640 (+$49,040, +7.07% from previous year)
- 2025: $755,260 (+$12,621, +1.70% from previous year)
Leawood has seen home values increase by over 90% since 2010. The luxury suburb saw modest but consistent gains early in the decade, then posted massive growth from 2021 to 2024, pushing median values above $750,000 by 2025.
Leawood – High-End Living in Johnson County
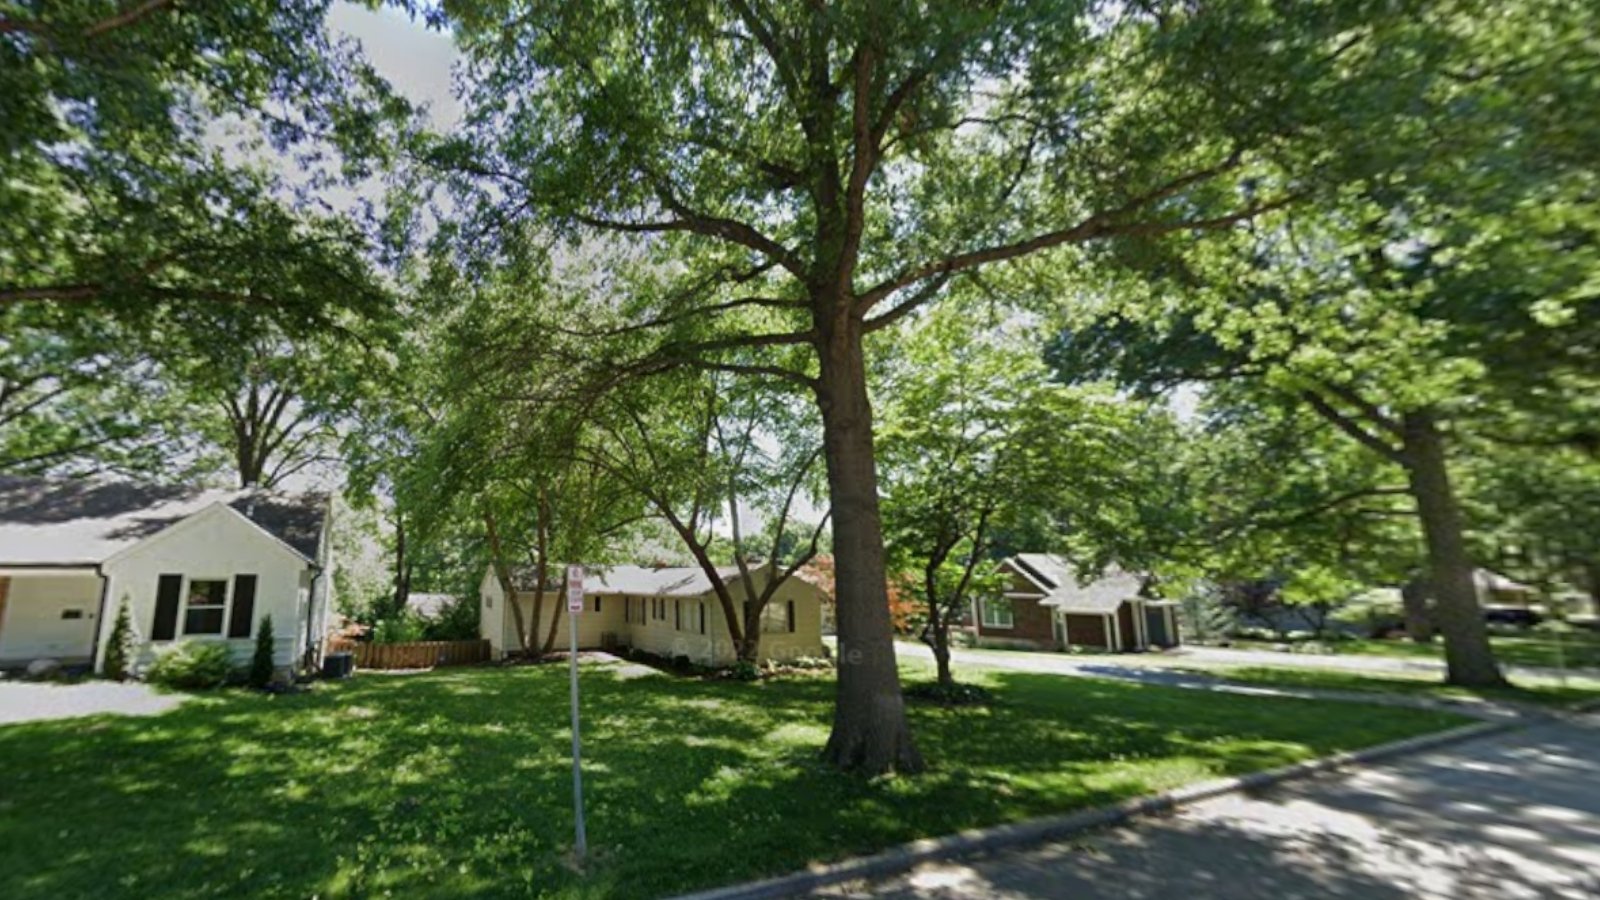
Leawood is one of Kansas’s wealthiest communities, offering upscale shopping, restaurants, and pristine neighborhoods. Known for luxury homes, excellent schools, and access to premier golf courses, it’s a prime destination for buyers who want it all without crossing into Missouri.
The city has maintained high property values through limited housing stock, architectural standards, and new high-end developments. It’s a hub for executives, retirees, and families looking for status and comfort—and it shows in the home prices.
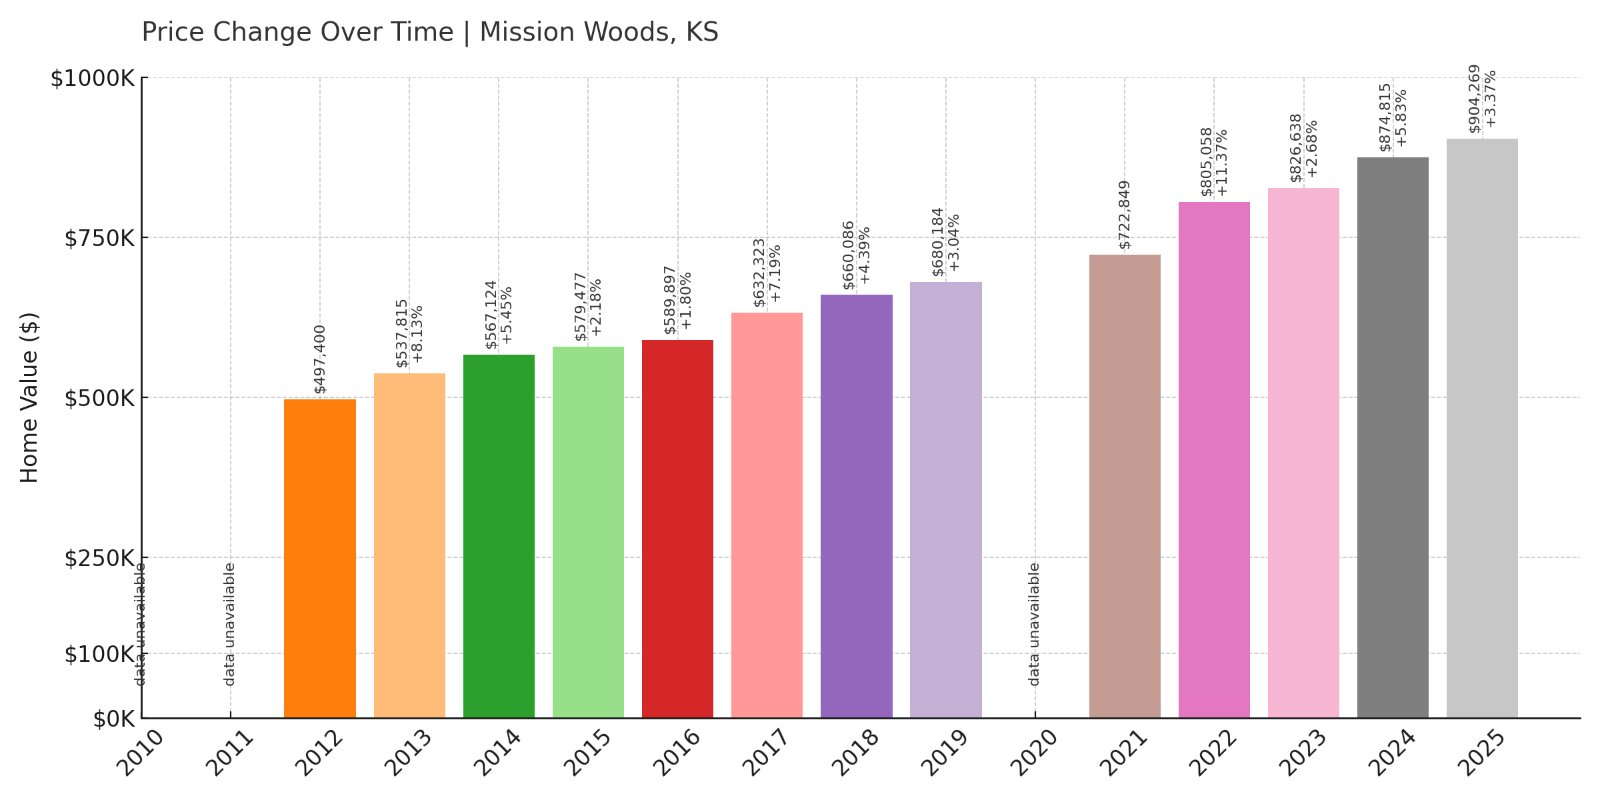
3. Mission Woods – 81.8% Home Price Increase Since 2012
Would you like to save this?
- 2010: N/A
- 2011: N/A
- 2012: $497,400
- 2013: $537,815 (+$40,415, +8.13% from previous year)
- 2014: $567,124 (+$29,309, +5.45% from previous year)
- 2015: $579,477 (+$12,353, +2.18% from previous year)
- 2016: $589,897 (+$10,421, +1.80% from previous year)
- 2017: $632,323 (+$42,425, +7.19% from previous year)
- 2018: $660,086 (+$27,763, +4.39% from previous year)
- 2019: $680,184 (+$20,099, +3.04% from previous year)
- 2020: N/A
- 2021: $722,849
- 2022: $805,058 (+$82,209, +11.37% from previous year)
- 2023: $826,638 (+$21,581, +2.68% from previous year)
- 2024: $874,815 (+$48,177, +5.83% from previous year)
- 2025: $904,269 (+$29,454, +3.37% from previous year)
Mission Woods has posted an 81.8% increase in home prices since 2012. Price growth has remained steady, with impressive spikes in 2022 and 2024. This tiny city has quickly become one of the most expensive places to live in Kansas.
Mission Woods – Kansas’s Smallest and Priciest
Mission Woods is a hidden, upscale pocket nestled in Johnson County. With a population of fewer than 200 residents, it’s technically the smallest city in Kansas by population—but one of the most affluent by far.
The community consists of just a few blocks of stately homes with meticulously kept lawns, all within easy reach of the Country Club Plaza and KU Medical Center. Mission Woods is quiet, exclusive, and highly sought after—making its high home prices no surprise.
2. Lake Quivira – 70.8% Home Price Increase Since 2010
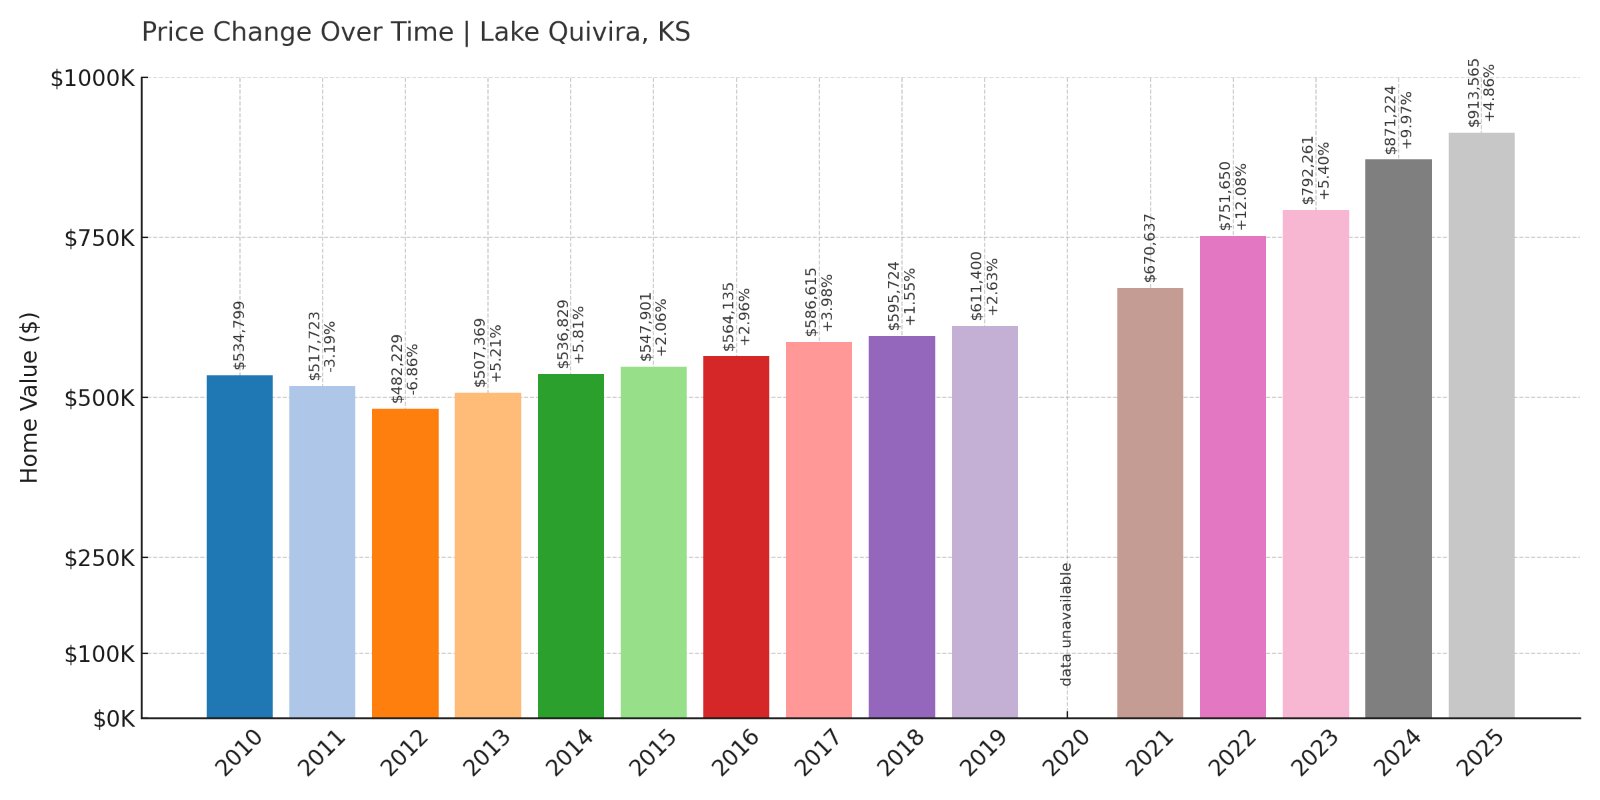
- 2010: $534,799
- 2011: $517,723 (-$17,076, -3.19% from previous year)
- 2012: $482,229 (-$35,494, -6.86% from previous year)
- 2013: $507,369 (+$25,140, +5.21% from previous year)
- 2014: $536,829 (+$29,460, +5.81% from previous year)
- 2015: $547,901 (+$11,072, +2.06% from previous year)
- 2016: $564,135 (+$16,234, +2.96% from previous year)
- 2017: $586,615 (+$22,480, +3.98% from previous year)
- 2018: $595,724 (+$9,109, +1.55% from previous year)
- 2019: $611,400 (+$15,676, +2.63% from previous year)
- 2020: N/A
- 2021: $670,637
- 2022: $751,650 (+$81,013, +12.08% from previous year)
- 2023: $792,261 (+$40,611, +5.40% from previous year)
- 2024: $871,224 (+$78,963, +9.97% from previous year)
- 2025: $913,565 (+$42,341, +4.86% from previous year)
Lake Quivira home prices have increased by more than 70% since 2010. With dramatic appreciation between 2021 and 2024, this private lakeside community now ranks as one of Kansas’s most exclusive real estate markets.
Lake Quivira – Resort-Style Living in the Heart of Kansas
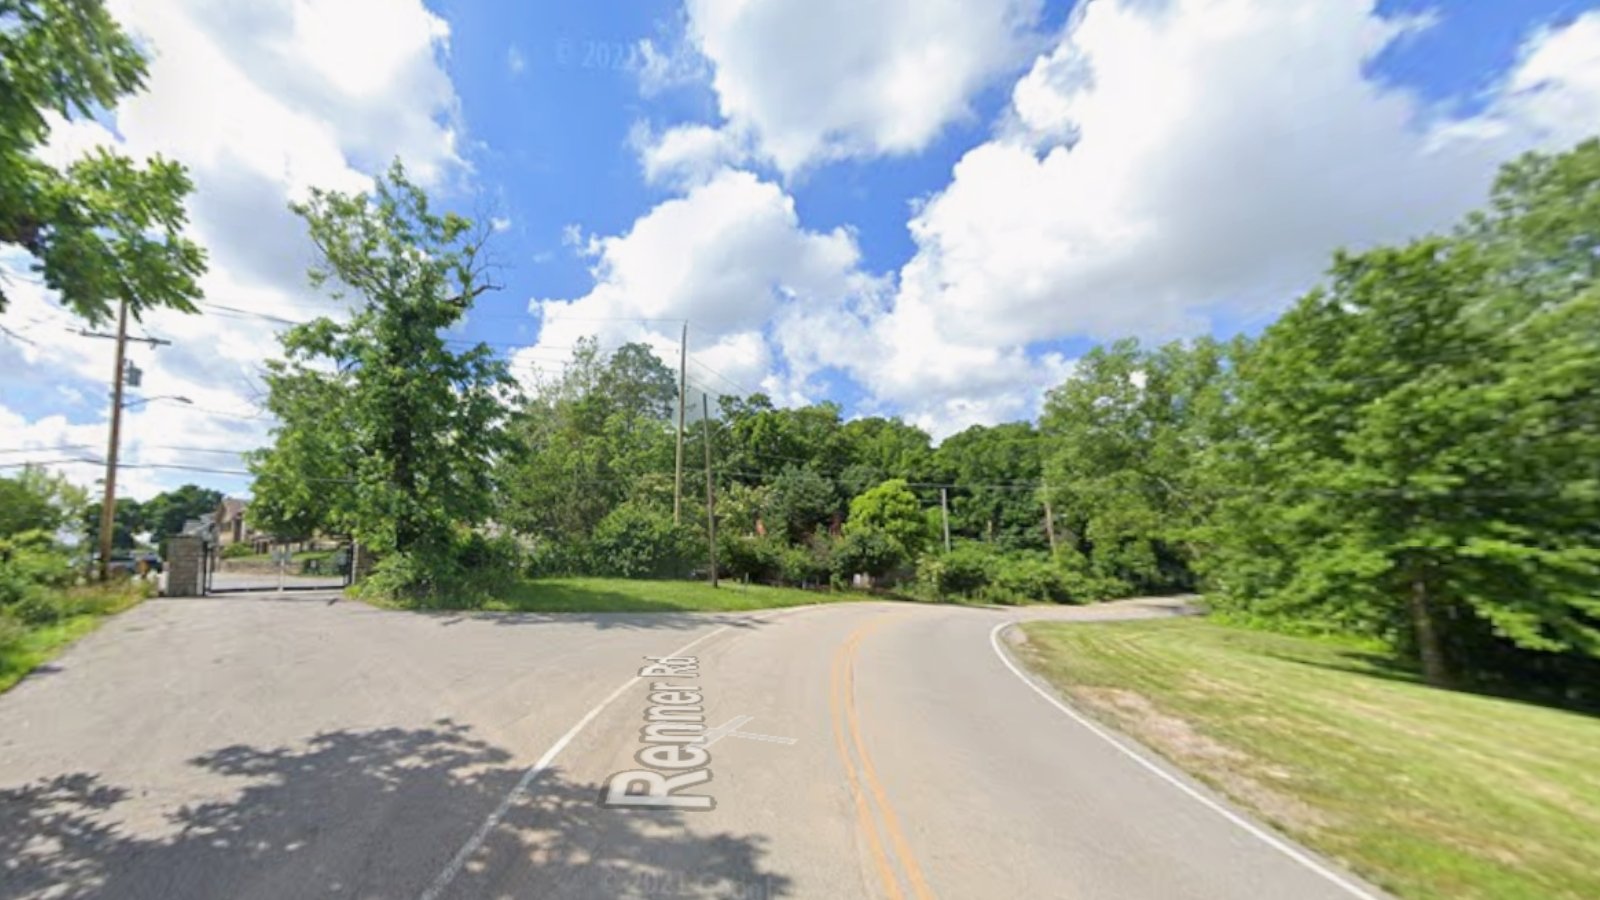
Lake Quivira is a private, gated community that wraps around a spring-fed lake in Johnson and Wyandotte counties. It’s not just a neighborhood—it’s a lifestyle. Residents have access to a private beach, marina, golf course, and clubhouse, giving the area a country club feel.
Home prices have surged as inventory remains tight and demand stays strong. With only around 400 homes, Lake Quivira offers prestige, privacy, and proximity to Kansas City. It’s an ideal place for affluent buyers seeking luxury and nature in one package.
1. Mission Hills – 85.4% Home Price Increase Since 2010
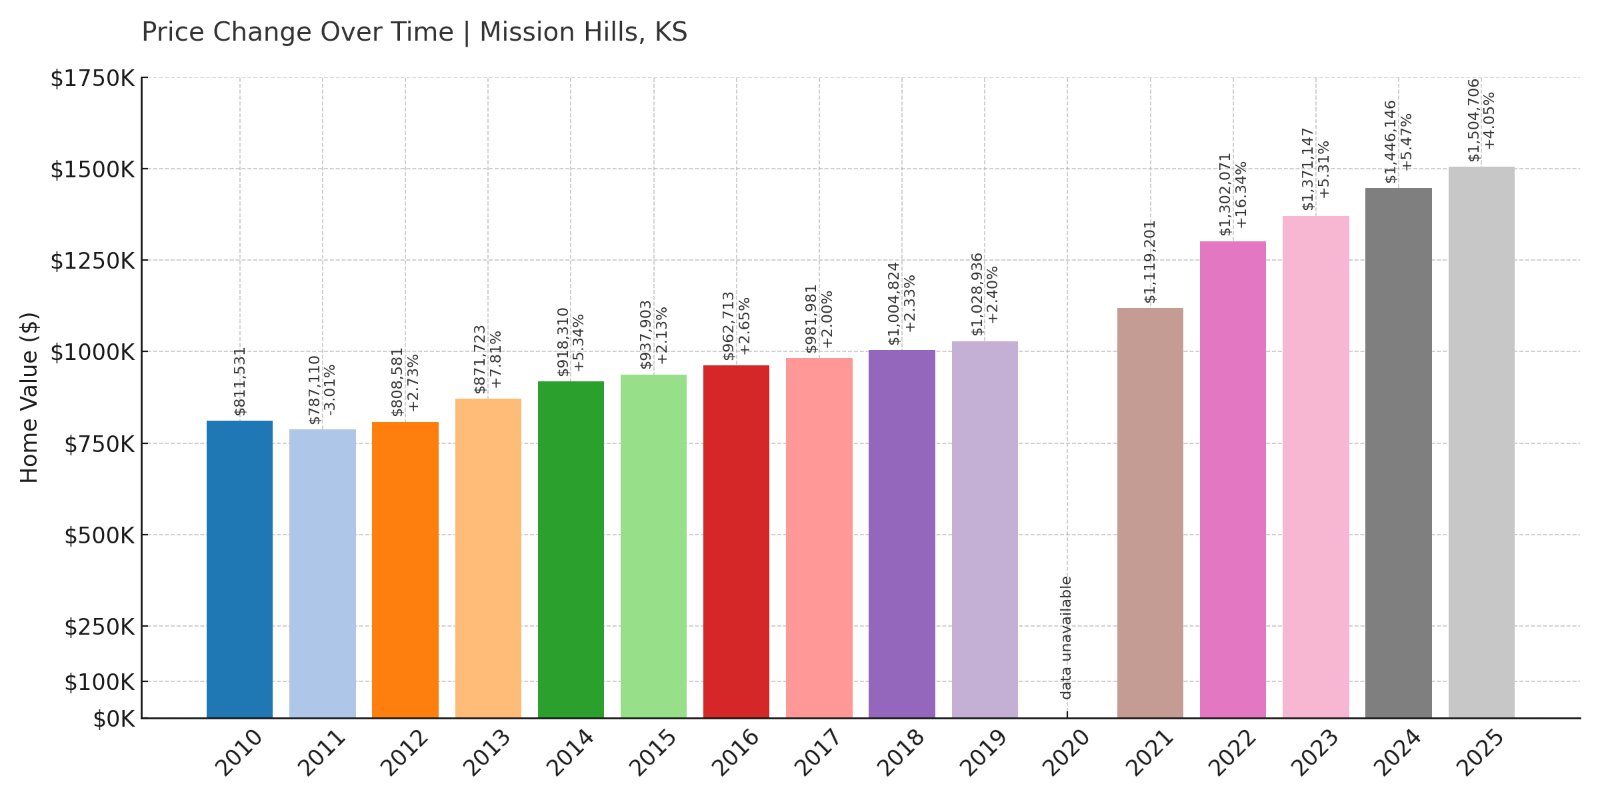
- 2010: $811,531
- 2011: $787,110 (-$24,421, -3.01% from previous year)
- 2012: $808,581 (+$21,471, +2.73% from previous year)
- 2013: $871,723 (+$63,142, +7.81% from previous year)
- 2014: $918,310 (+$46,587, +5.34% from previous year)
- 2015: $937,903 (+$19,593, +2.13% from previous year)
- 2016: $962,713 (+$24,810, +2.65% from previous year)
- 2017: $981,981 (+$19,268, +2.00% from previous year)
- 2018: $1,004,824 (+$22,844, +2.33% from previous year)
- 2019: $1,028,936 (+$24,112, +2.40% from previous year)
- 2020: N/A
- 2021: $1,119,201
- 2022: $1,302,071 (+$182,870, +16.34% from previous year)
- 2023: $1,371,147 (+$69,076, +5.31% from previous year)
- 2024: $1,446,146 (+$74,999, +5.47% from previous year)
- 2025: $1,504,706 (+$58,560, +4.05% from previous year)
Mission Hills remains Kansas’s most expensive housing market, with home values increasing over 85% since 2010. Prices surpassed $1.5 million in 2025, a clear sign of the community’s enduring prestige and tight inventory.
Mission Hills – Kansas’s Pinnacle of Wealth and Status

Mission Hills, located in northeast Johnson County, is a symbol of old money and timeless luxury. The town was designed in the 1910s by J.C. Nichols, and it continues to feature stunning mansions, manicured estates, and tree-lined boulevards.
Its central location near Kansas City Country Club and Mission Hills Country Club draws executives, professionals, and generational wealth. The city’s zoning, historic character, and exclusivity help keep prices sky-high. It’s no surprise Mission Hills ranks #1 for home values in the state of Kansas.
Haven't Seen Yet
Curated from our most popular plans. Click any to explore.