🔥 Would you like to save this?
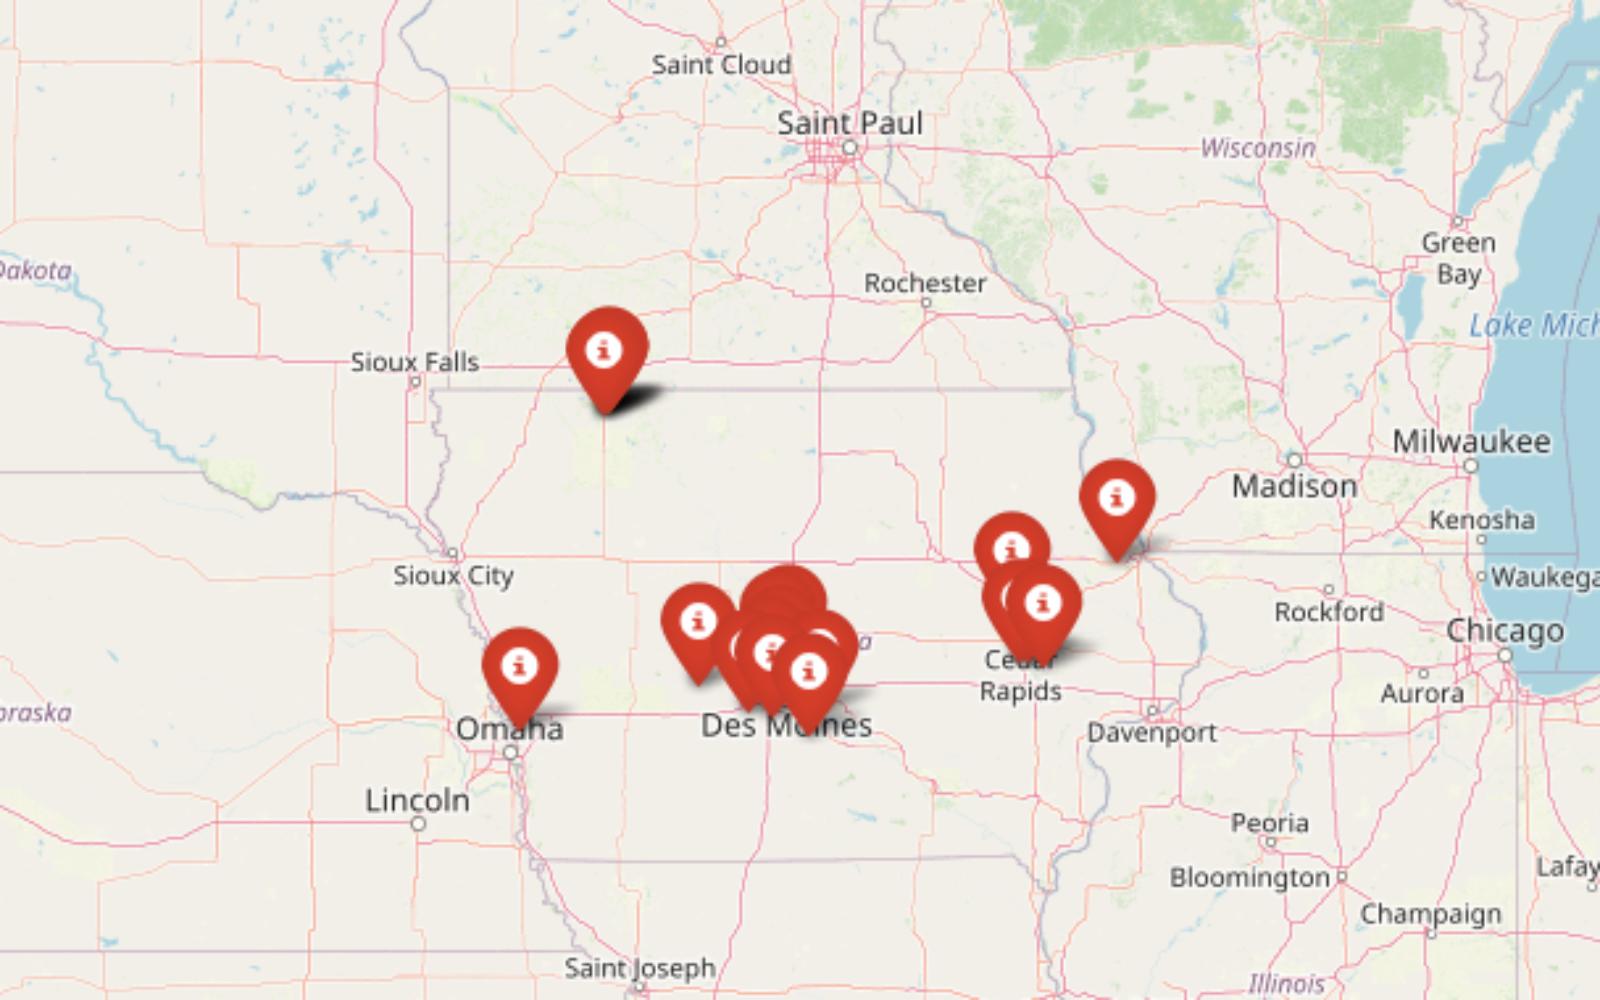
The Zillow Home Value Index shows steady gains across Iowa—but in some towns, home prices have leapt into luxury territory. These 20 communities now rank among the most expensive places to buy in the state, with many pushing past $400,000 in median value as of April 2025.
But this list isn’t just about big numbers. It reveals where buyers are chasing lake views, small-town polish, or prime proximity to urban centers. From exclusive pockets near Des Moines to quiet corners with unexpected demand, each town reflects what’s fueling Iowa’s high-end housing surge.
In order to come up with the very specific design ideas, we create most designs with the assistance of state-of-the-art AI interior design software. Also, assume links that take you off the site are affiliate links such as links to Amazon. this means we may earn a commission if you buy something.
20. Alleman – 96% Home Price Increase Since 2012
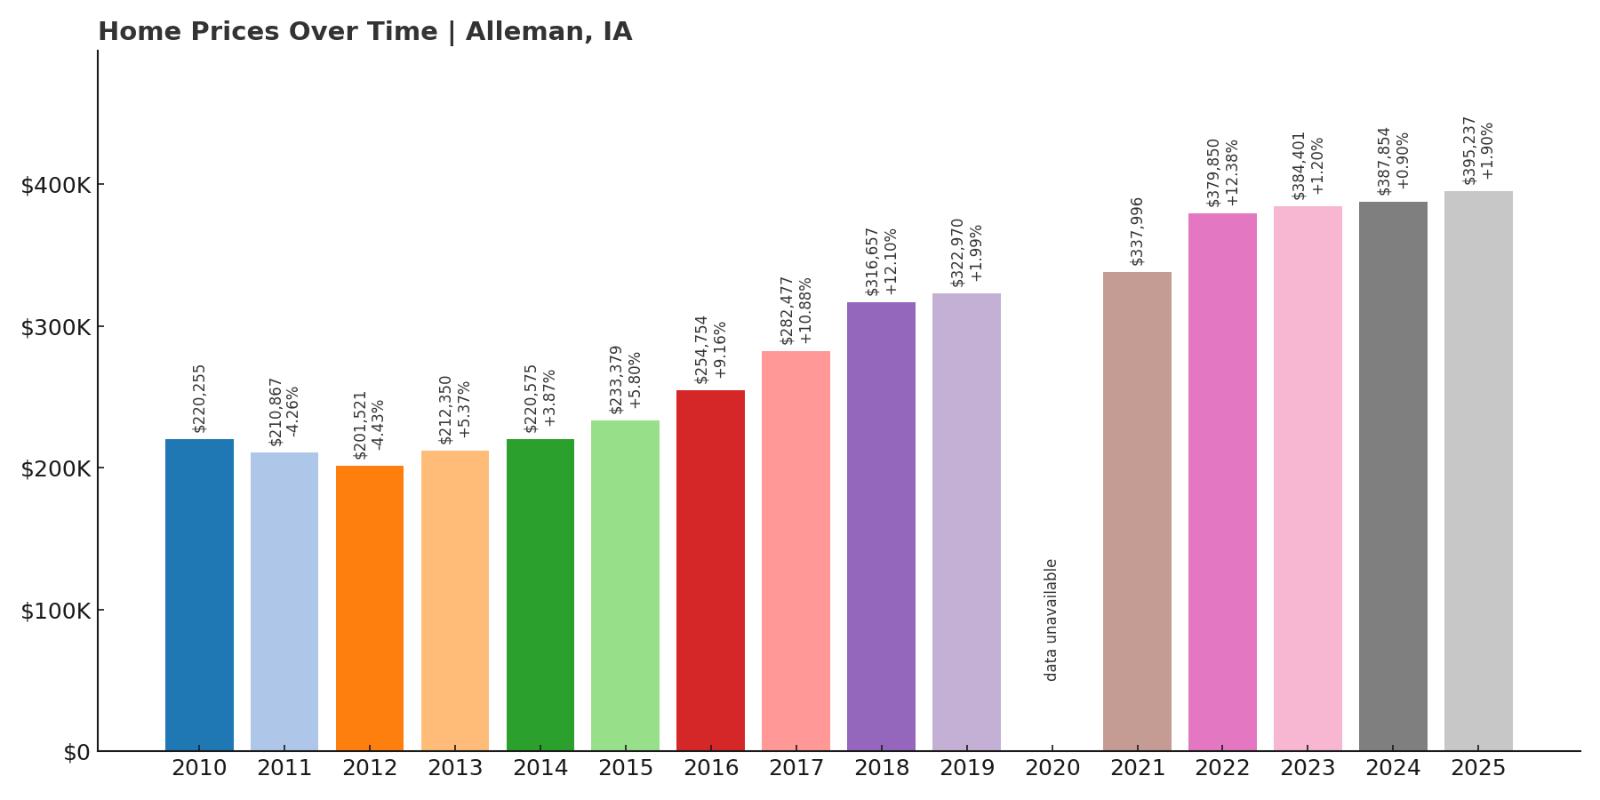
- 2010: $220,255
- 2011: $210,867 (-$9,388, -4.26% from previous year)
- 2012: $201,521 (-$9,346, -4.43% from previous year)
- 2013: $212,350 (+$10,829, +5.37% from previous year)
- 2014: $220,575 (+$8,225, +3.87% from previous year)
- 2015: $233,379 (+$12,804, +5.80% from previous year)
- 2016: $254,754 (+$21,375, +9.16% from previous year)
- 2017: $282,477 (+$27,723, +10.88% from previous year)
- 2018: $316,657 (+$34,180, +12.10% from previous year)
- 2019: $322,970 (+$6,312, +1.99% from previous year)
- 2020: N/A
- 2021: $337,996
- 2022: $379,850 (+$41,854, +12.38% from previous year)
- 2023: $384,401 (+$4,550, +1.20% from previous year)
- 2024: $387,854 (+$3,453, +0.90% from previous year)
- 2025: $395,237 (+$7,383, +1.90% from previous year)
Alleman’s home values have risen 96% since 2012, driven by steady gains year over year. While prices have cooled slightly in recent years, the town has shown one of the most consistent long-term appreciation curves on the list. Its affordability relative to some neighboring towns also helped support continued demand, particularly post-2020.
Alleman – Steady Growth Amidst Rural Simplicity
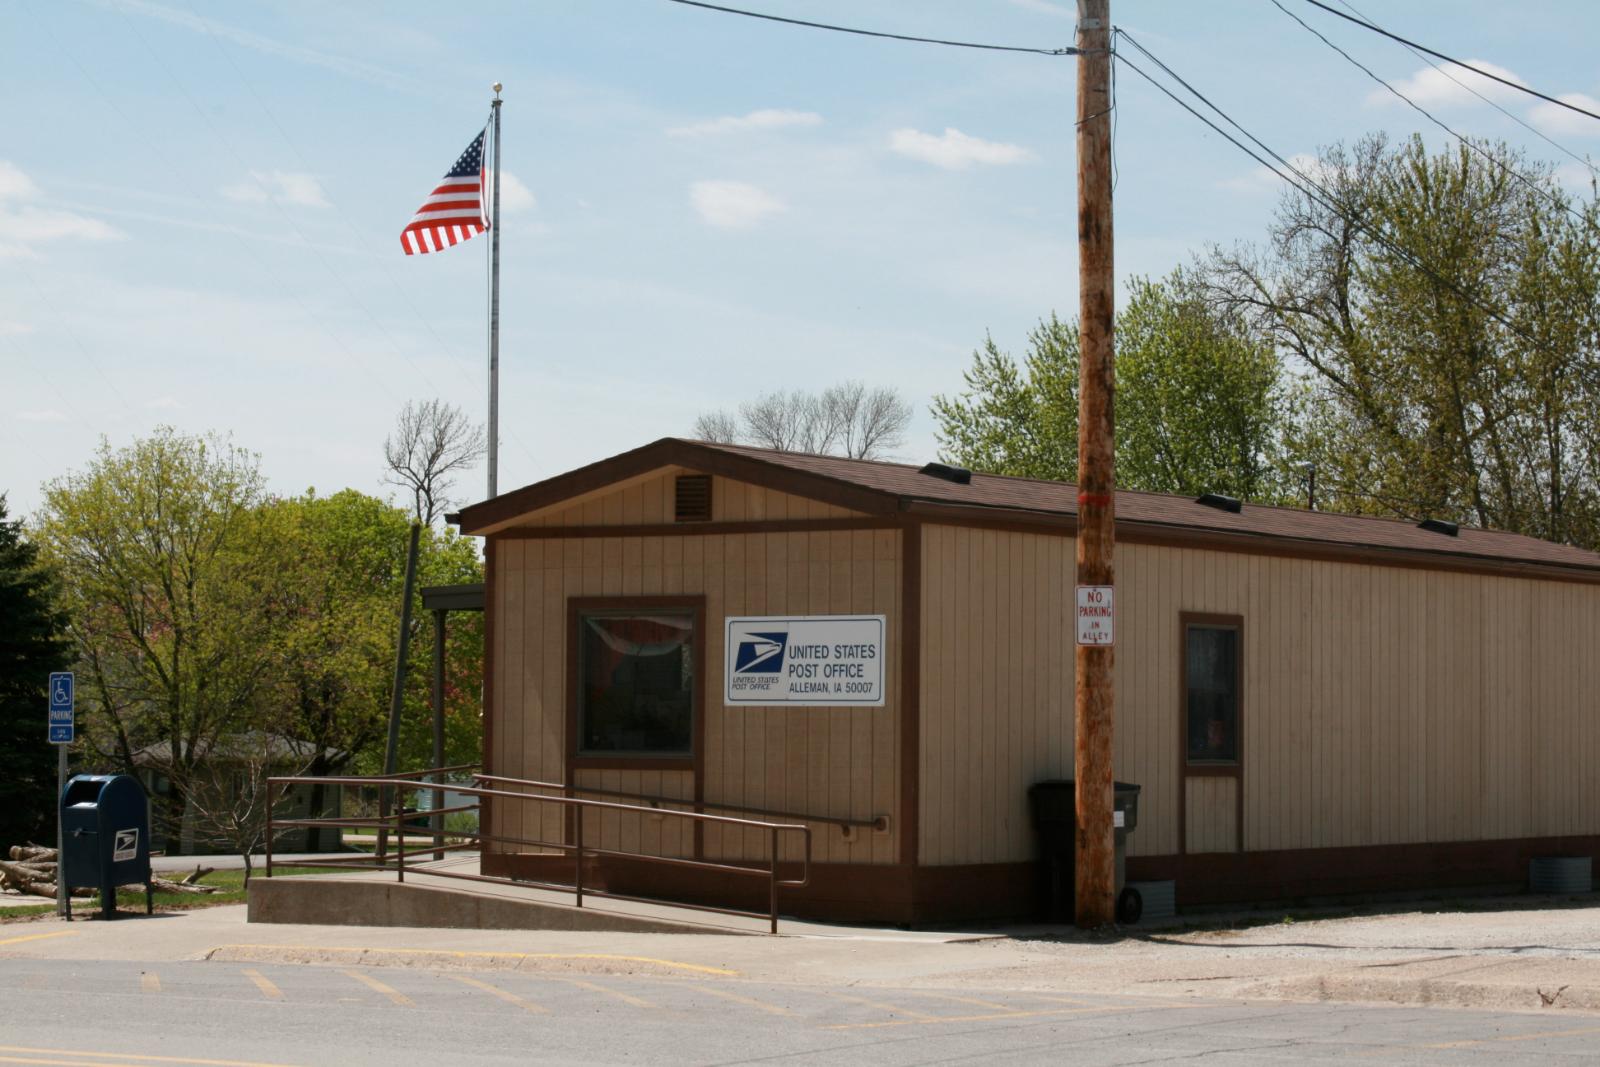
Located in Polk County, Alleman sits just north of the Des Moines metro and serves as a peaceful, commuter-friendly town. With its open spaces, low crime, and access to the North Polk Community School District, the area appeals to families looking for a slower pace while remaining close to the city. Though Alleman is small, its proximity to major highways has helped sustain demand and gradual price appreciation over the past decade.
The biggest jumps in home values came between 2015 and 2018, with double-digit annual increases that helped push Alleman up the ranks of Iowa’s most expensive communities. While newer housing has emerged slowly, the limited inventory in a high-demand corridor has played a role in the town’s price trajectory.
19. Johnston – 80% Home Price Increase Since 2012

- 2010: $231,396
- 2011: $223,202 (-$8,194, -3.54% from previous year)
- 2012: $221,767 (-$1,435, -0.64% from previous year)
- 2013: $233,907 (+$12,140, +5.47% from previous year)
- 2014: $244,096 (+$10,189, +4.36% from previous year)
- 2015: $254,613 (+$10,517, +4.31% from previous year)
- 2016: $267,912 (+$13,299, +5.22% from previous year)
- 2017: $279,751 (+$11,839, +4.42% from previous year)
- 2018: $288,428 (+$8,677, +3.10% from previous year)
- 2019: $295,329 (+$6,900, +2.39% from previous year)
- 2020: N/A
- 2021: $325,845
- 2022: $365,913 (+$40,067, +12.30% from previous year)
- 2023: $378,638 (+$12,725, +3.48% from previous year)
- 2024: $392,710 (+$14,072, +3.72% from previous year)
- 2025: $399,572 (+$6,862, +1.75% from previous year)
Johnston has experienced a solid 80% increase in home prices since 2012, reflecting sustained demand and consistent year-over-year appreciation. While the city has avoided large spikes, its steady growth and strong finish in recent years have helped it rank among Iowa’s priciest markets.
Johnston – A Des Moines Suburb With Long-Term Appeal
Part of the Des Moines metropolitan area, Johnston combines suburban convenience with green space and excellent schools. It’s home to corporate campuses, trails, and well-maintained neighborhoods that attract both families and professionals. New developments and improved infrastructure have made Johnston increasingly popular, pushing prices upward over the past decade.
Despite lacking the dramatic jumps seen in other towns, Johnston’s home values show the power of consistent growth. Its high livability and investment in public amenities keep it in demand. The most significant gains came between 2021 and 2022, when the median price surged by over $40,000 in a single year.
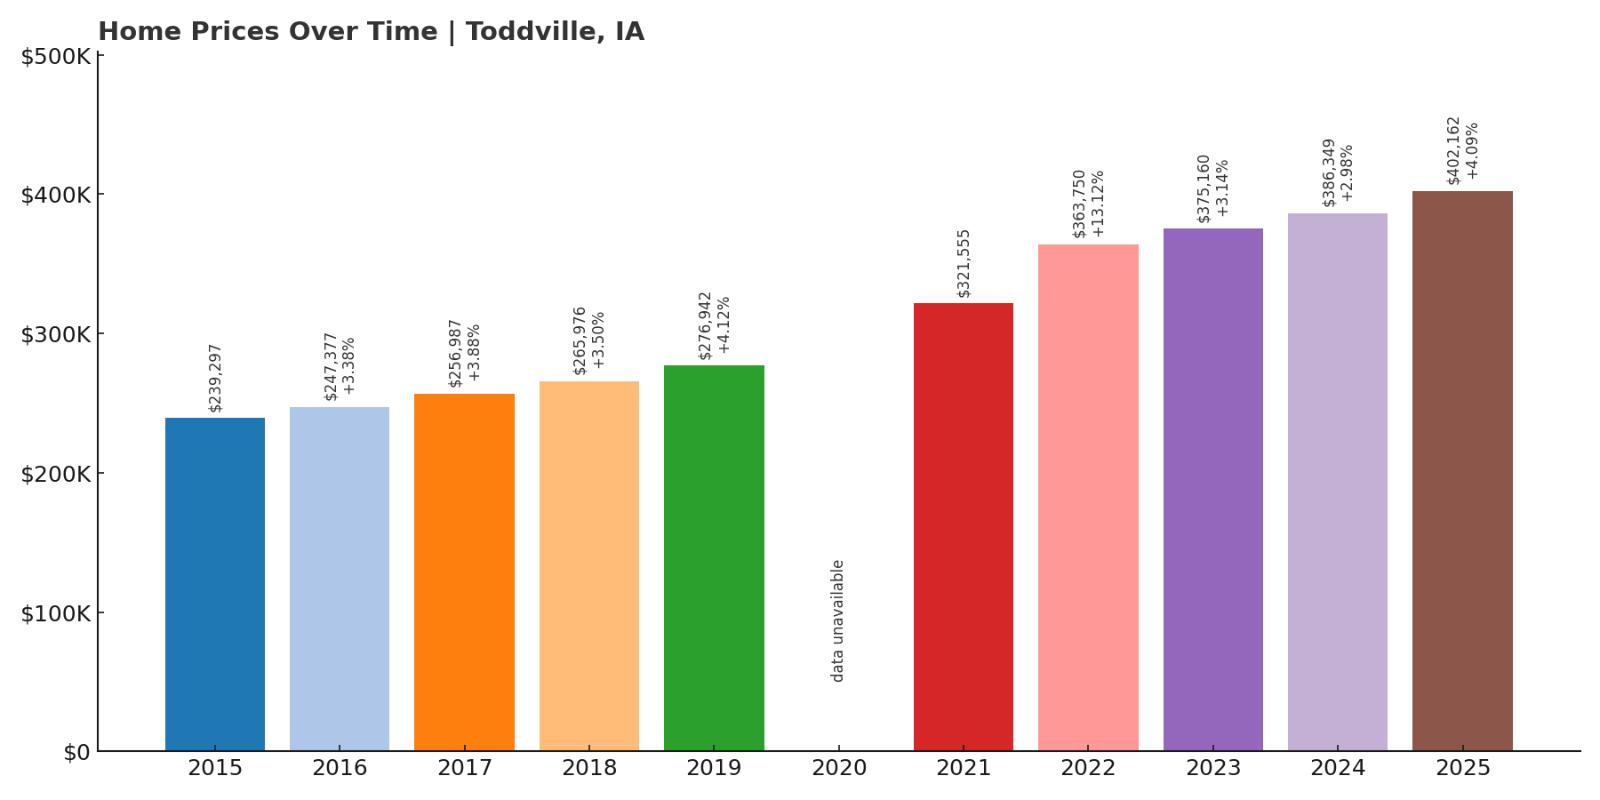
18. Toddville – 68% Home Price Increase Since 2015
- 2010: N/A
- 2011: N/A
- 2012: N/A
- 2013: N/A
- 2014: N/A
- 2015: $239,297
- 2016: $247,377 (+$8,081, +3.38% from previous year)
- 2017: $256,987 (+$9,610, +3.88% from previous year)
- 2018: $265,976 (+$8,988, +3.50% from previous year)
- 2019: $276,942 (+$10,966, +4.12% from previous year)
- 2020: N/A
- 2021: $321,555
- 2022: $363,750 (+$42,195, +13.12% from previous year)
- 2023: $375,160 (+$11,409, +3.14% from previous year)
- 2024: $386,349 (+$11,189, +2.98% from previous year)
- 2025: $402,162 (+$15,813, +4.09% from previous year)
Since 2015, Toddville has seen a 68% jump in home values, with particularly strong growth after 2020. The biggest leap occurred in 2022, when prices rose over $42,000 in just one year—evidence of increased attention and investment in this Linn County community.
Toddville – Quiet Growth Just Outside Cedar Rapids
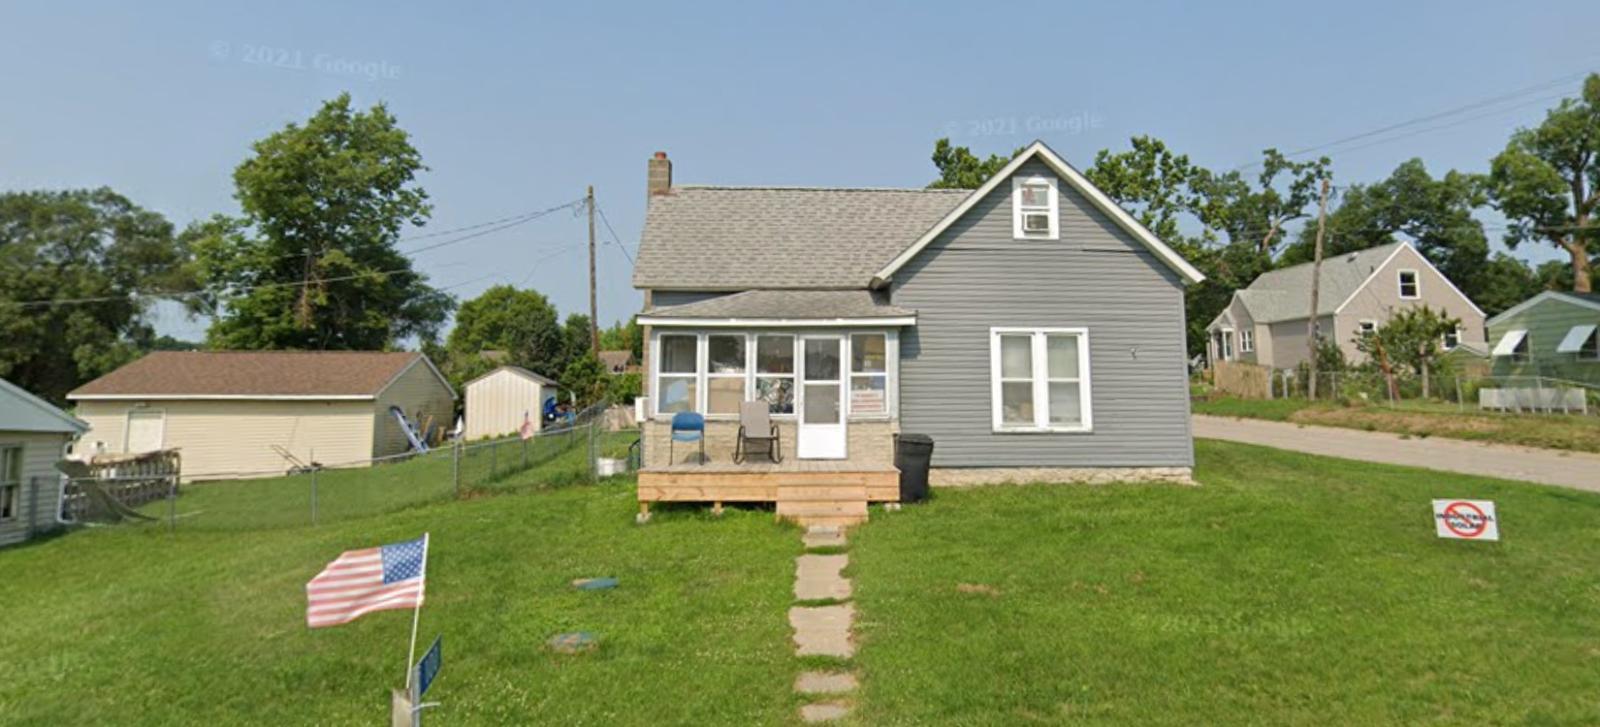
Located northwest of Cedar Rapids, Toddville is a small unincorporated community that’s increasingly being noticed for its balance of rural calm and suburban accessibility. While it has limited commercial infrastructure, its appeal lies in peaceful neighborhoods and larger lot sizes.
Home price growth has been gradual but persistent, with a sharper uptick after 2020. The town’s relative affordability, when compared to neighboring suburbs, helped fuel interest among buyers looking for space without sacrificing convenience. Toddville’s rise reflects a broader trend of rural areas gaining value as urban expansion reaches their borders.
17. Van Meter – 105% Home Price Increase Since 2012
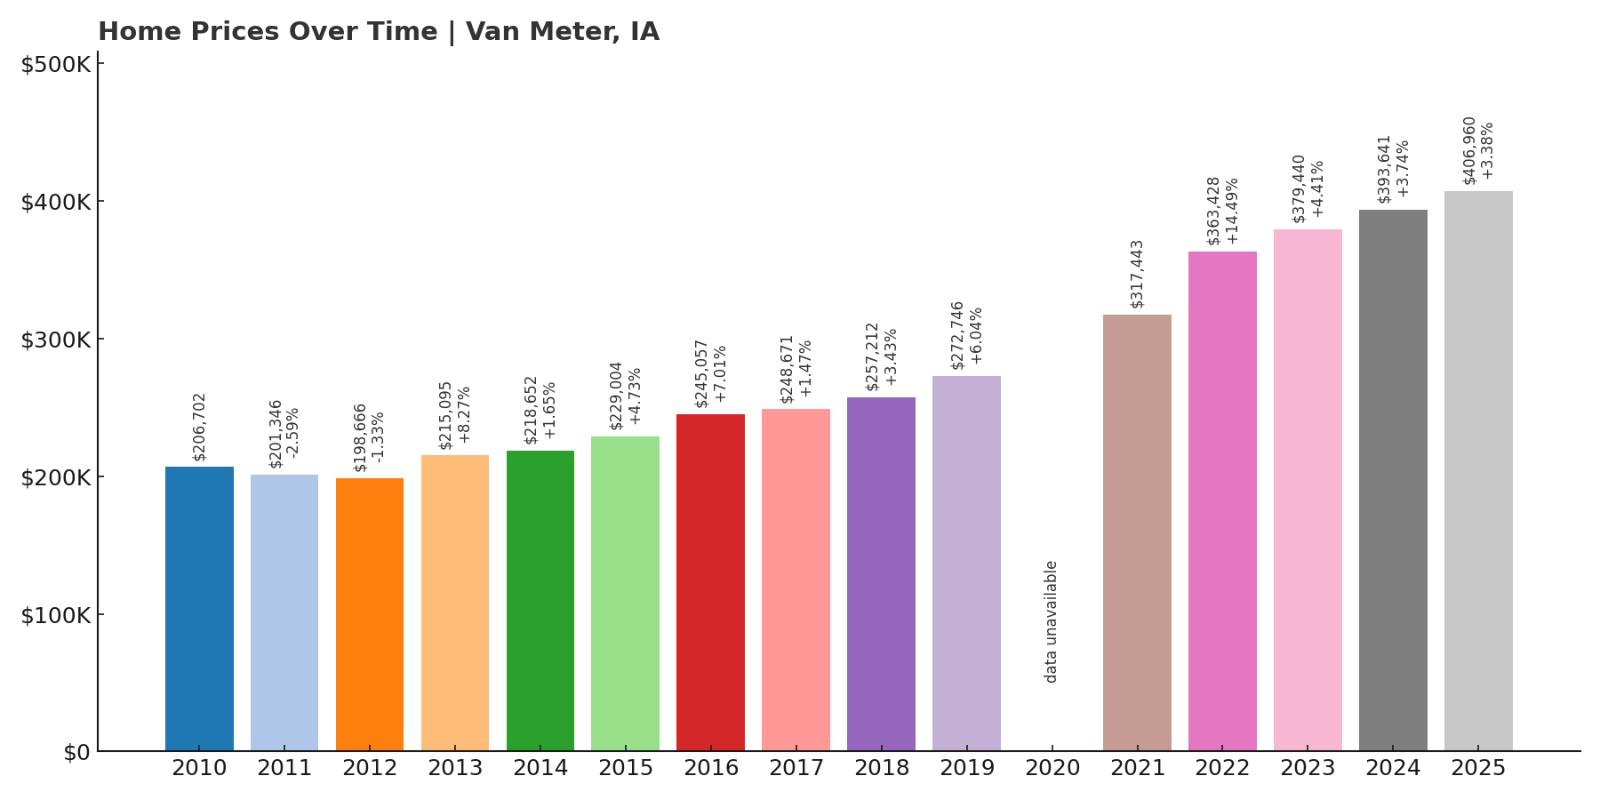
- 2010: $206,702
- 2011: $201,346 (-$5,356, -2.59% from previous year)
- 2012: $198,666 (-$2,679, -1.33% from previous year)
- 2013: $215,095 (+$16,429, +8.27% from previous year)
- 2014: $218,652 (+$3,557, +1.65% from previous year)
- 2015: $229,004 (+$10,352, +4.73% from previous year)
- 2016: $245,057 (+$16,053, +7.01% from previous year)
- 2017: $248,671 (+$3,614, +1.47% from previous year)
- 2018: $257,212 (+$8,541, +3.43% from previous year)
- 2019: $272,746 (+$15,534, +6.04% from previous year)
- 2020: N/A
- 2021: $317,443
- 2022: $363,428 (+$45,985, +14.49% from previous year)
- 2023: $379,440 (+$16,012, +4.41% from previous year)
- 2024: $393,641 (+$14,200, +3.74% from previous year)
- 2025: $406,960 (+$13,320, +3.38% from previous year)
Van Meter’s home prices have more than doubled since 2012, with consistent gains that accelerated sharply after 2020. The town recorded a standout surge in 2022, jumping nearly $46,000 in a single year. This rise pushed Van Meter well into Iowa’s top 20 most expensive markets.
Van Meter – Rising Prices in a Growing Dallas County Town
Van Meter lies southwest of Des Moines in Dallas County, a region experiencing some of the fastest growth in Iowa. Known for its quiet neighborhoods, school quality, and local pride, the town attracts both young families and longtime residents. It balances small-town feel with modern amenities.
Housing demand here has risen steadily as more people relocate from the metro area for space and peace of mind. With land availability tightening, newer builds and limited turnover have contributed to the town’s price escalation—especially since the early 2020s.
16. Peosta – 84% Home Price Increase Since 2010
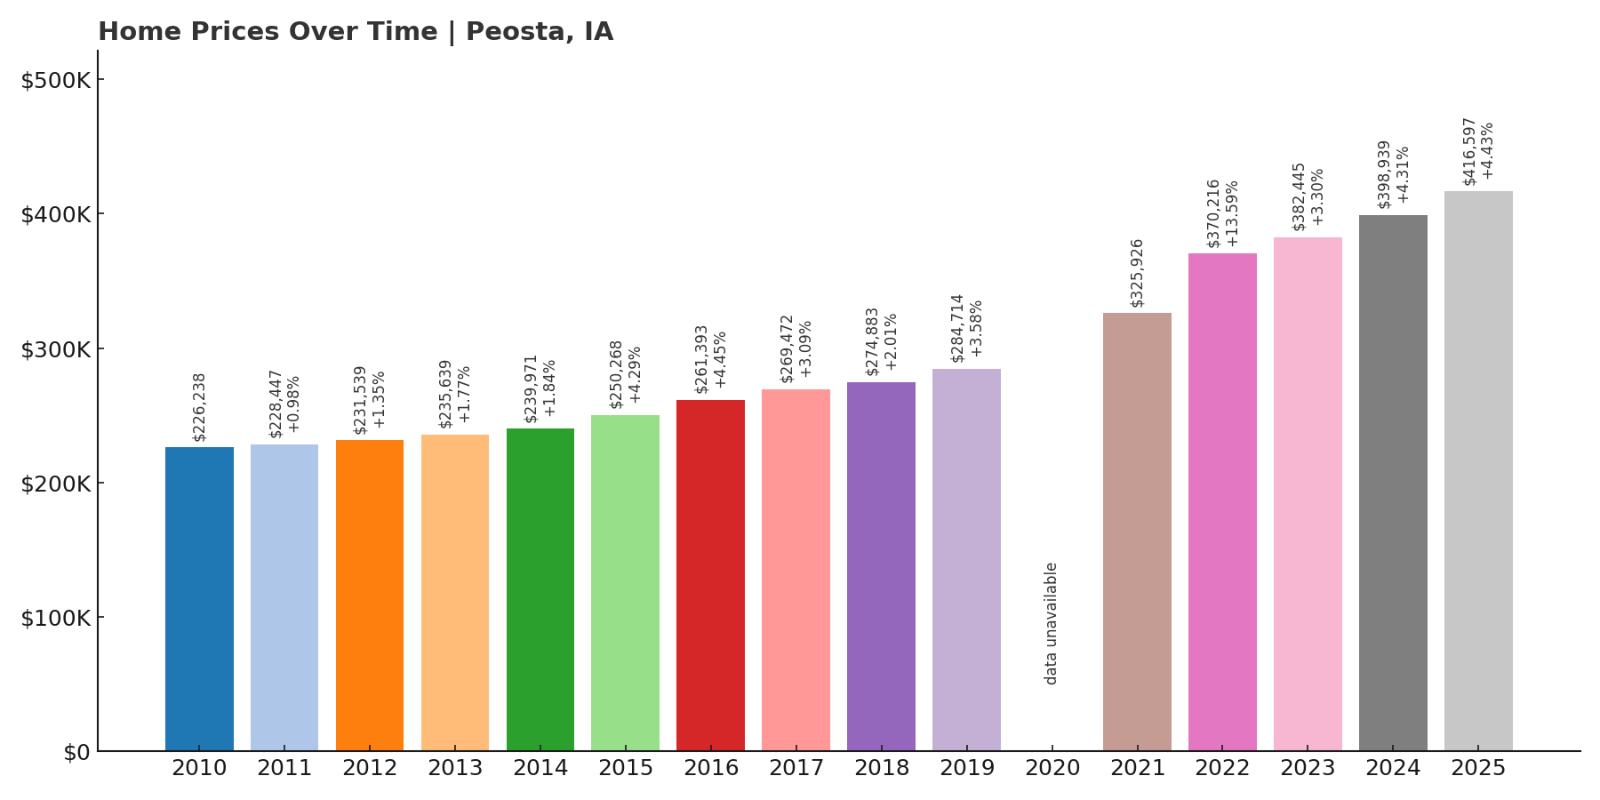
- 2010: $226,238
- 2011: $228,447 (+$2,209, +0.98% from previous year)
- 2012: $231,539 (+$3,092, +1.35% from previous year)
- 2013: $235,639 (+$4,100, +1.77% from previous year)
- 2014: $239,971 (+$4,332, +1.84% from previous year)
- 2015: $250,268 (+$10,297, +4.29% from previous year)
- 2016: $261,393 (+$11,124, +4.44% from previous year)
- 2017: $269,472 (+$8,079, +3.09% from previous year)
- 2018: $274,883 (+$5,412, +2.01% from previous year)
- 2019: $284,714 (+$9,831, +3.58% from previous year)
- 2020: N/A
- 2021: $325,926
- 2022: $370,216 (+$44,290, +13.59% from previous year)
- 2023: $382,445 (+$12,229, +3.30% from previous year)
- 2024: $398,939 (+$16,495, +4.31% from previous year)
- 2025: $416,597 (+$17,657, +4.43% from previous year)
Peosta’s home prices have risen steadily since 2010, gaining 84% over the 15-year span. Moderate yearly increases gave way to steeper jumps post-2021, marking a new phase of growth and demand in this Dubuque County community.
Peosta – Dubuque’s Fast-Developing Neighbor
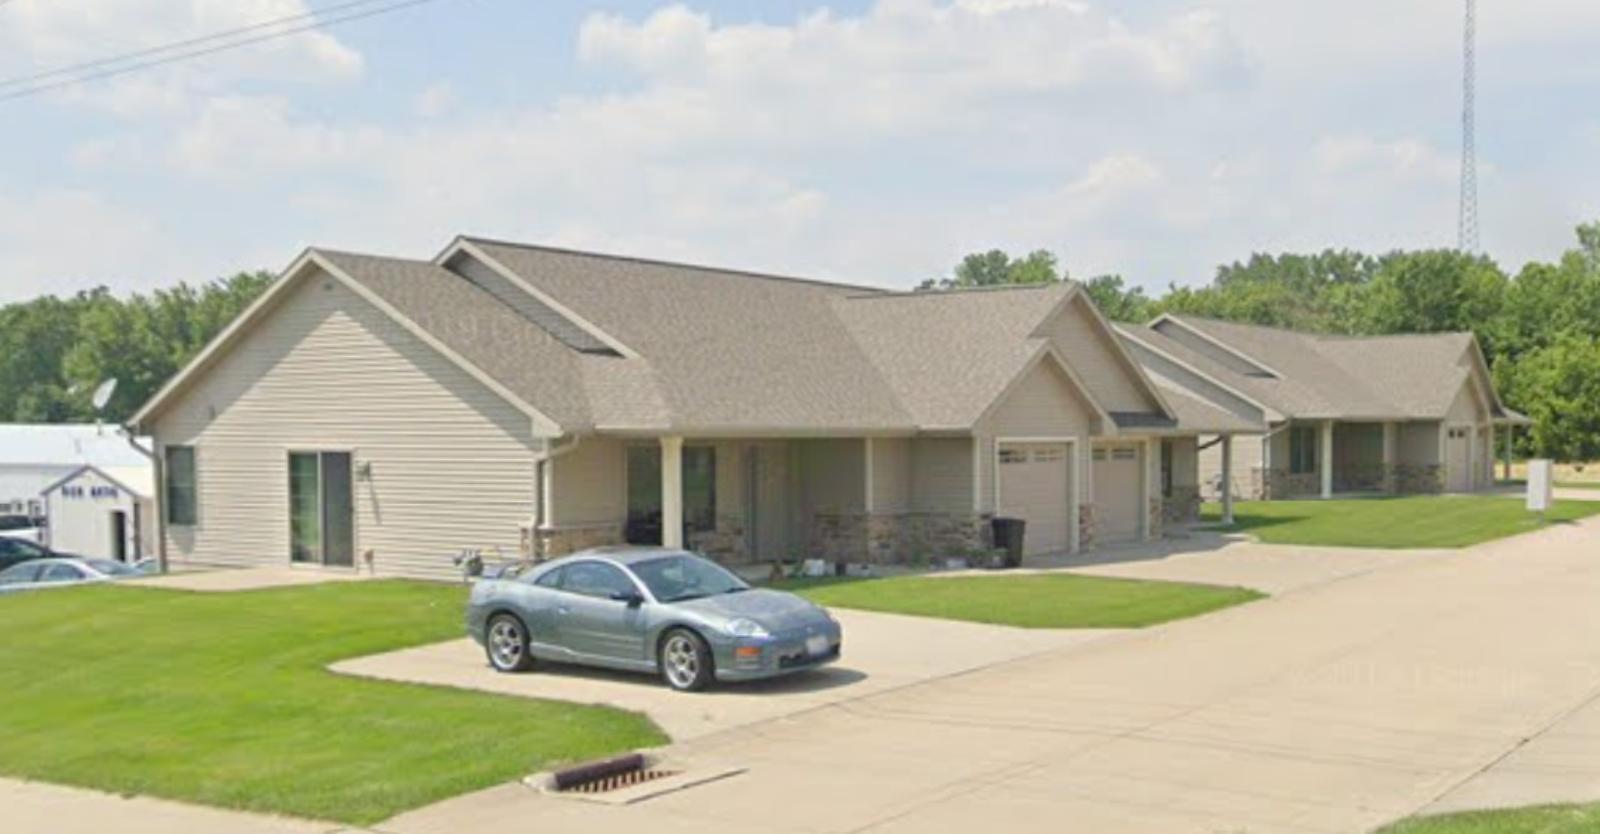
Peosta has emerged as one of the Dubuque area’s fastest-growing suburbs, thanks in part to its blend of small-town charm and industrial development. The town hosts a range of employers, educational centers, and commuter links to Dubuque, making it a desirable location for professionals and families alike.
With the area’s expansion and infrastructure investment, Peosta has experienced consistent value growth, capped by a sharp price rise in 2022. The town’s appeal lies in its relative affordability compared to Dubuque proper, combined with its reputation for safety, schools, and space.
15. Arnolds Park – 139% Home Price Increase Since 2010
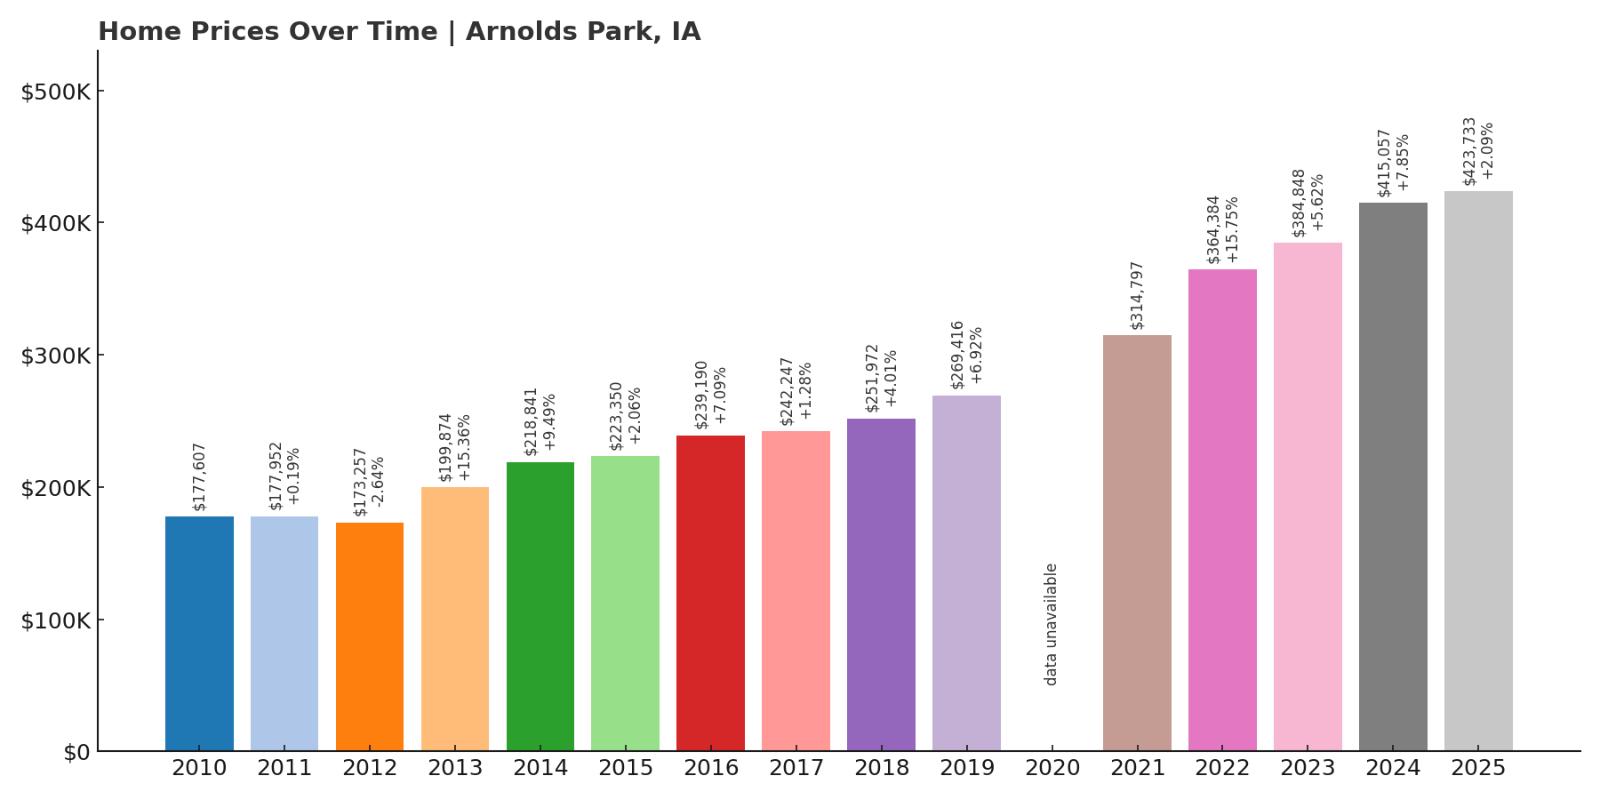
- 2010: $177,607
- 2011: $177,952 (+$345, +0.19% from previous year)
- 2012: $173,257 (-$4,695, -2.64% from previous year)
- 2013: $199,874 (+$26,617, +15.36% from previous year)
- 2014: $218,841 (+$18,967, +9.49% from previous year)
- 2015: $223,350 (+$4,509, +2.06% from previous year)
- 2016: $239,190 (+$15,840, +7.09% from previous year)
- 2017: $242,247 (+$3,058, +1.28% from previous year)
- 2018: $251,972 (+$9,724, +4.01% from previous year)
- 2019: $269,416 (+$17,444, +6.92% from previous year)
- 2020: N/A
- 2021: $314,797
- 2022: $364,384 (+$49,587, +15.75% from previous year)
- 2023: $384,848 (+$20,464, +5.62% from previous year)
- 2024: $415,057 (+$30,208, +7.85% from previous year)
- 2025: $423,733 (+$8,677, +2.09% from previous year)
Home prices in Arnolds Park have surged nearly 139% since 2010, with massive gains starting in 2013 and continuing through the 2020s. This popular lakeside town has consistently ranked among Iowa’s highest-value destinations.
Arnolds Park – Lake Life Drives Real Estate Demand
Located along the banks of West Okoboji Lake, Arnolds Park is a prime summer destination in the Iowa Great Lakes region. Known for its waterfront properties, amusement park, and vibrant seasonal tourism, demand for homes here has pushed values into the high range.
Inventory remains tight and prices continue to climb as buyers compete for rare listings near the lake. The largest value jump came in 2022, driven by post-pandemic demand for vacation properties. That trend hasn’t slowed, keeping Arnolds Park firmly on the luxury housing map in Iowa.
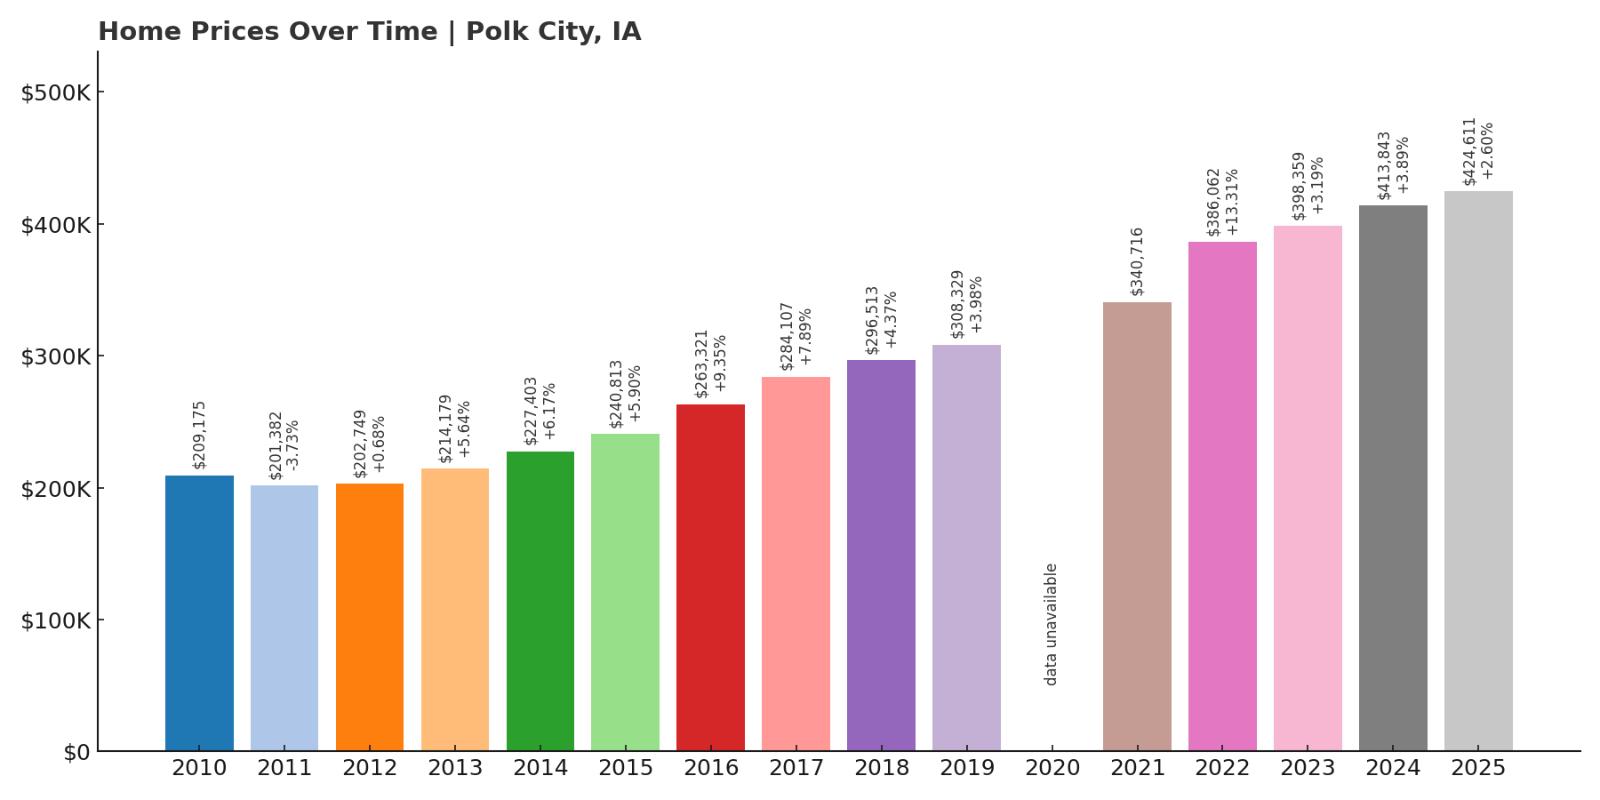
14. Polk City – 103% Home Price Increase Since 2010
🔥 Would you like to save this?
- 2010: $209,175
- 2011: $201,382 (-$7,793, -3.73% from previous year)
- 2012: $202,749 (+$1,368, +0.68% from previous year)
- 2013: $214,179 (+$11,430, +5.64% from previous year)
- 2014: $227,403 (+$13,224, +6.17% from previous year)
- 2015: $240,813 (+$13,410, +5.90% from previous year)
- 2016: $263,321 (+$22,508, +9.35% from previous year)
- 2017: $284,107 (+$20,786, +7.89% from previous year)
- 2018: $296,513 (+$12,406, +4.37% from previous year)
- 2019: $308,329 (+$11,816, +3.98% from previous year)
- 2020: N/A
- 2021: $340,716
- 2022: $386,062 (+$45,346, +13.31% from previous year)
- 2023: $398,359 (+$12,297, +3.19% from previous year)
- 2024: $413,843 (+$15,484, +3.89% from previous year)
- 2025: $424,611 (+$10,768, +2.60% from previous year)
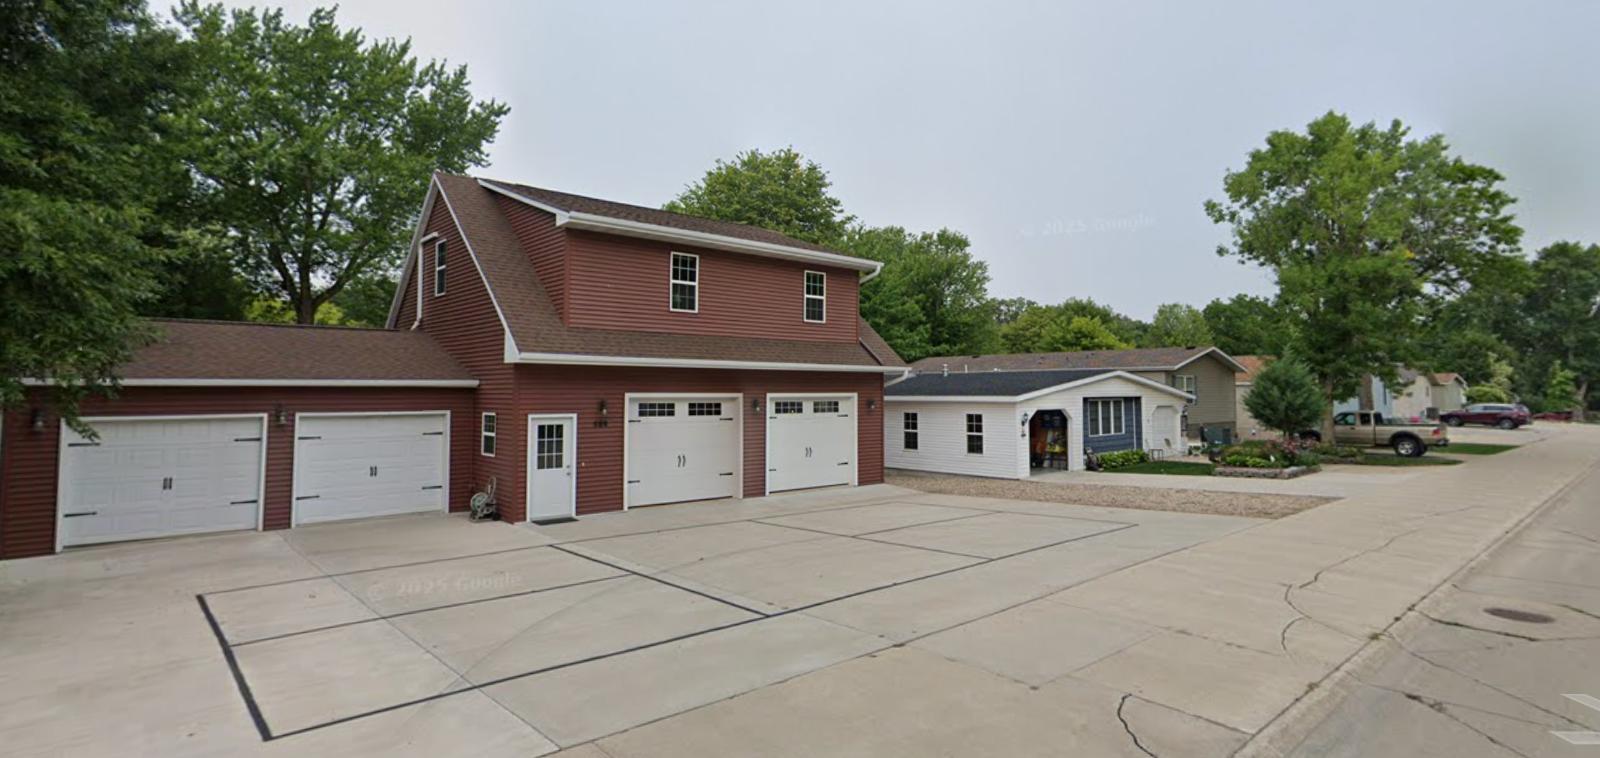
Polk City’s home values have more than doubled since 2010, with strong gains particularly after 2016. Growth in the metro area and Polk City’s strategic location have made it one of Iowa’s top-tier housing markets.
Polk City – Suburban Comfort Near Big City Access
Just north of Des Moines, Polk City offers easy access to both Ankeny and Ames while retaining its small-town feel. With nearby Saylorville Lake, recreational amenities, and new housing developments, the town has grown rapidly.
Infrastructure improvements and a growing population have made Polk City a top choice for buyers priced out of more urban neighborhoods. Real estate demand peaked in 2022, with prices rising over $45,000 in a single year—a reflection of growing pressure on supply.
13. Okoboji – 117% Home Price Increase Since 2010
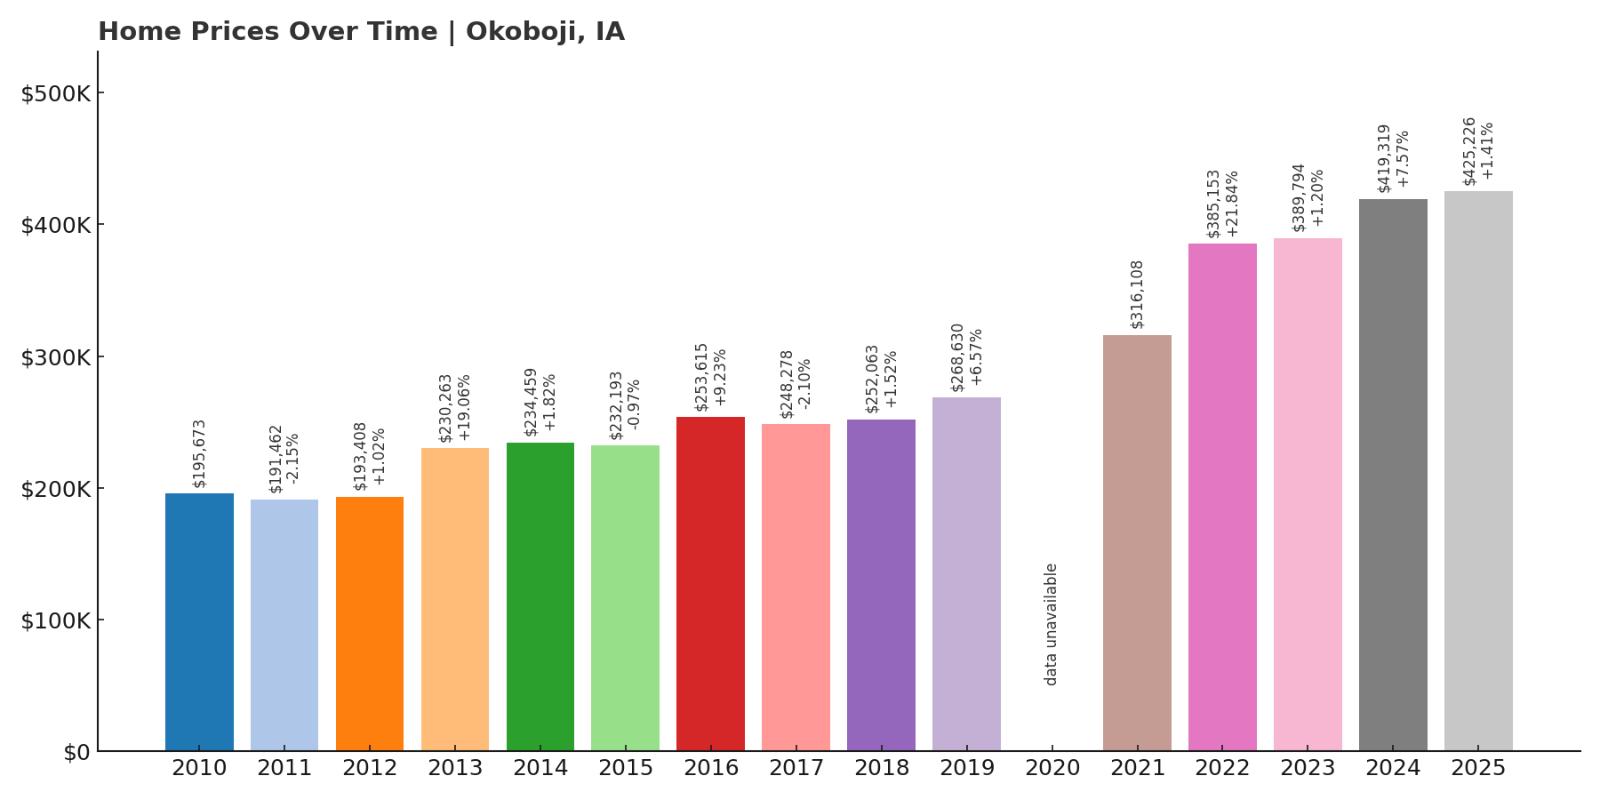
- 2010: $195,673
- 2011: $191,462 (-$4,211, -2.15% from previous year)
- 2012: $193,408 (+$1,946, +1.02% from previous year)
- 2013: $230,263 (+$36,855, +19.06% from previous year)
- 2014: $234,459 (+$4,196, +1.82% from previous year)
- 2015: $232,193 (-$2,266, -0.97% from previous year)
- 2016: $253,615 (+$21,423, +9.23% from previous year)
- 2017: $248,278 (-$5,337, -2.10% from previous year)
- 2018: $252,063 (+$3,785, +1.52% from previous year)
- 2019: $268,630 (+$16,567, +6.57% from previous year)
- 2020: N/A
- 2021: $316,108
- 2022: $385,153 (+$69,045, +21.84% from previous year)
- 2023: $389,794 (+$4,641, +1.20% from previous year)
- 2024: $419,319 (+$29,525, +7.57% from previous year)
- 2025: $425,226 (+$5,907, +1.41% from previous year)
Okoboji’s home prices have jumped 117% since 2010, boosted by tourism, lake access, and seasonal demand. The sharpest growth came in 2022, when prices surged by nearly $70,000 year-over-year.
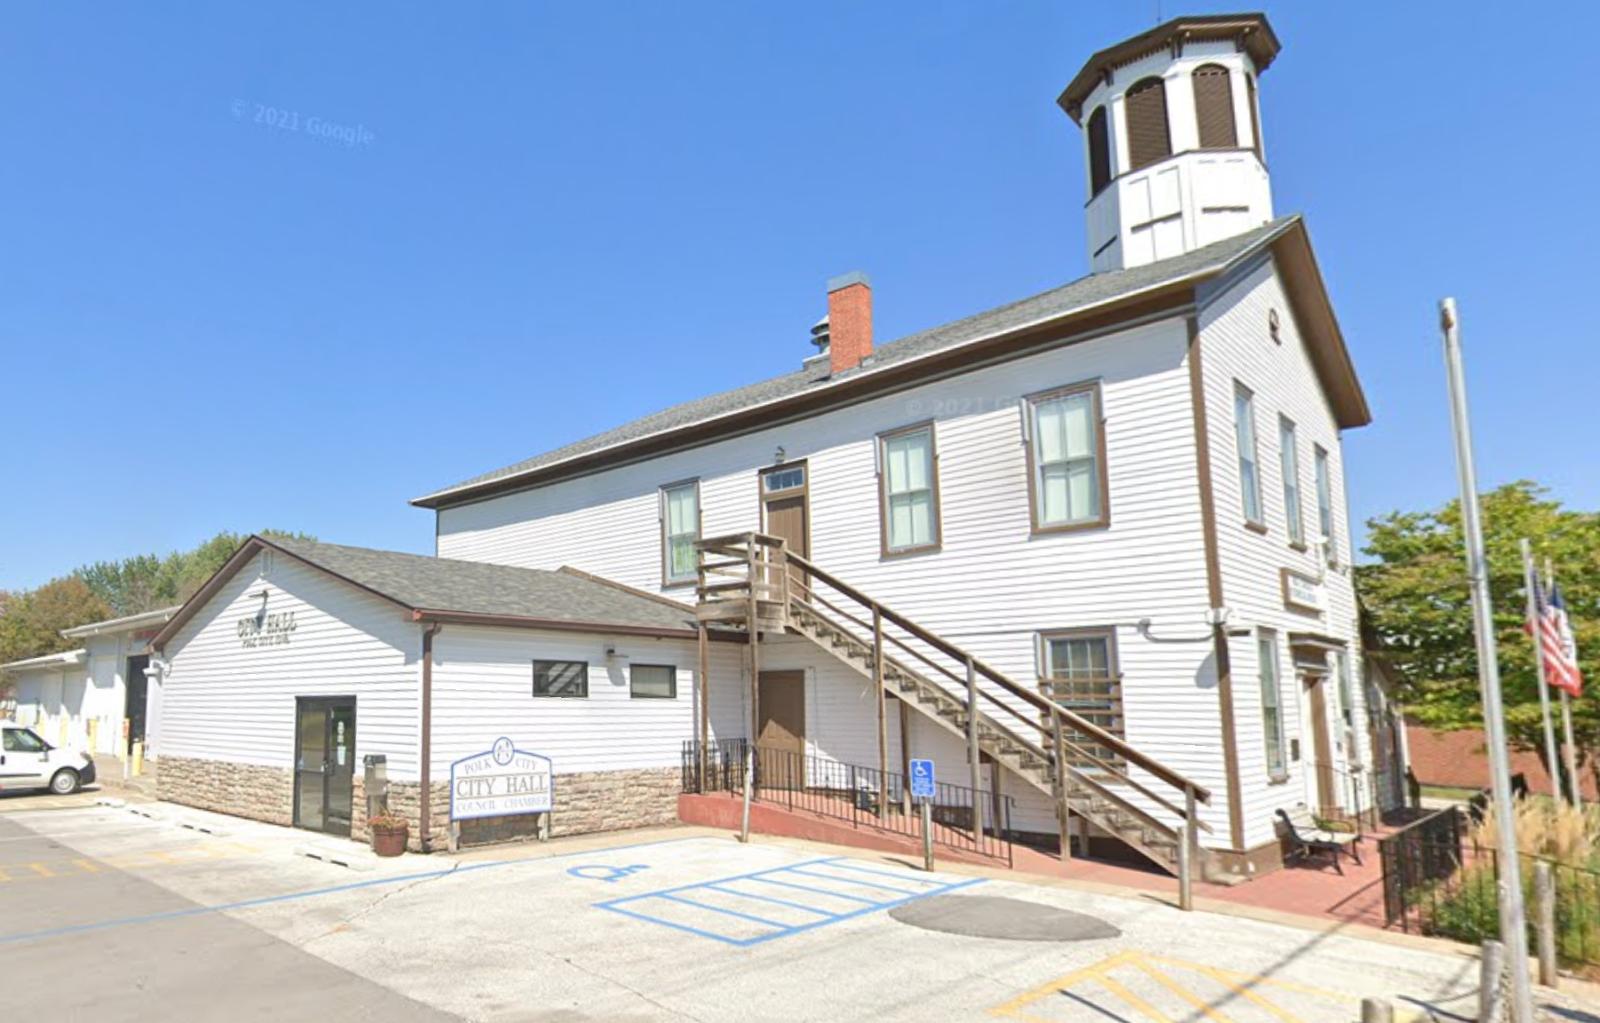
Okoboji – Lakefront Demand Continues to Drive Growth
Situated along the West Okoboji Lake shoreline, Okoboji is synonymous with vacation living in Iowa. The area draws seasonal buyers, investors, and retirees alike, many seeking lakeside properties or income-generating rentals.
With limited land and high appeal, real estate values here have risen steadily, particularly since 2021. Okoboji’s charm and status as a luxury destination keep demand strong—even as inventory remains scarce. That mix continues to drive its position high on this list.
12. Runnells – 113% Home Price Increase Since 2010
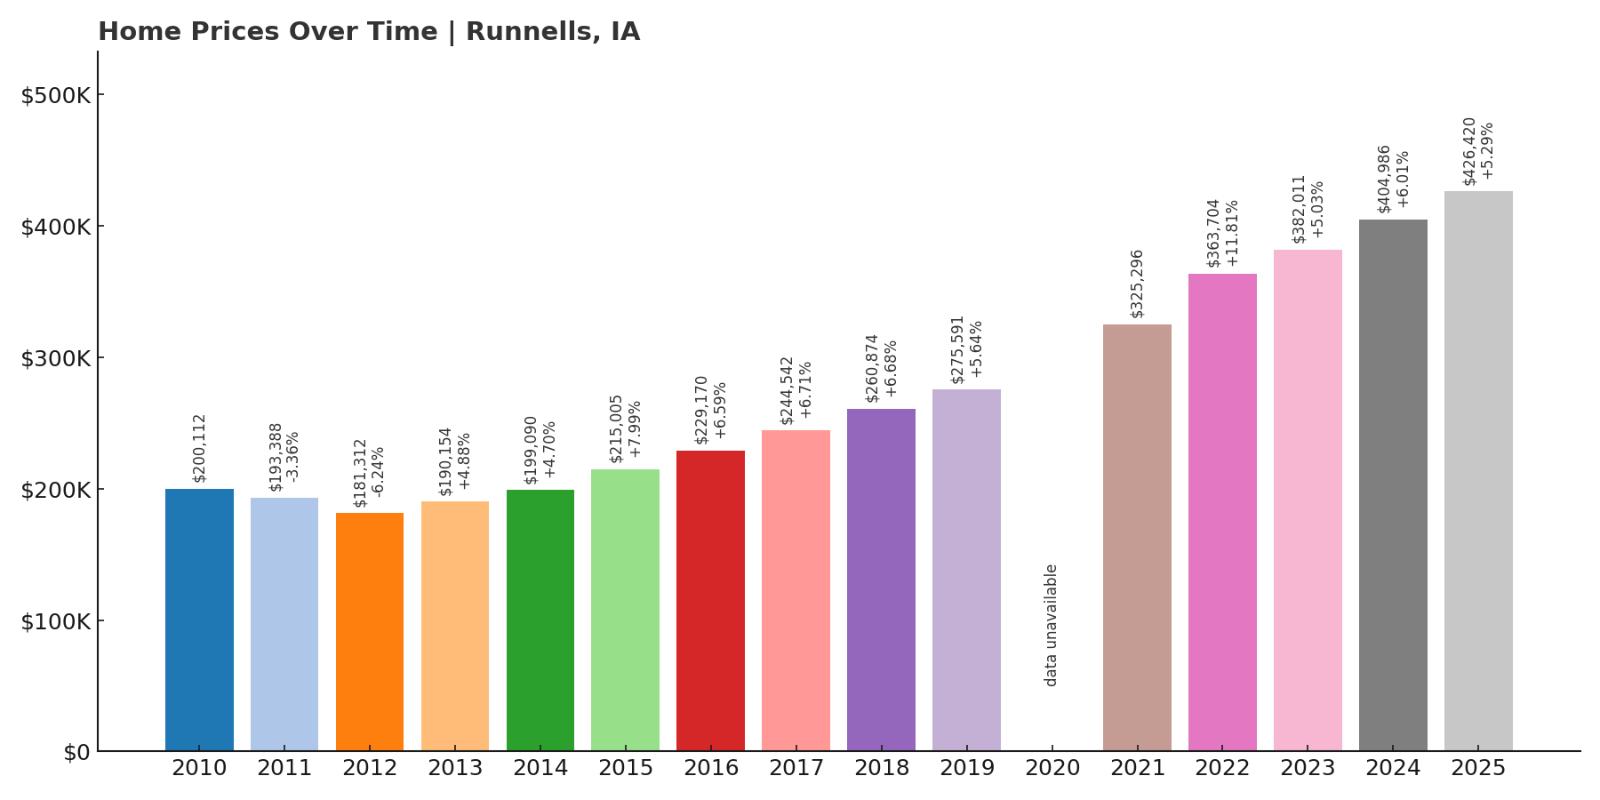
- 2010: $200,112
- 2011: $193,388 (-$6,724, -3.36% from previous year)
- 2012: $181,312 (-$12,076, -6.24% from previous year)
- 2013: $190,154 (+$8,842, +4.88% from previous year)
- 2014: $199,090 (+$8,935, +4.70% from previous year)
- 2015: $215,005 (+$15,915, +7.99% from previous year)
- 2016: $229,170 (+$14,165, +6.59% from previous year)
- 2017: $244,542 (+$15,371, +6.71% from previous year)
- 2018: $260,874 (+$16,332, +6.68% from previous year)
- 2019: $275,591 (+$14,717, +5.64% from previous year)
- 2020: N/A
- 2021: $325,296
- 2022: $363,704 (+$38,409, +11.81% from previous year)
- 2023: $382,011 (+$18,307, +5.03% from previous year)
- 2024: $404,986 (+$22,975, +6.01% from previous year)
- 2025: $426,420 (+$21,434, +5.29% from previous year)
Home values in Runnells have more than doubled since 2010, increasing by 113%. The growth has been both steady and resilient, with major gains emerging between 2021 and 2025. Prices have climbed over $100,000 in just the past five years alone, showing no signs of major slowdowns. Located in southeast Polk County, Runnells offers rural charm and open space that have become increasingly attractive to homebuyers seeking distance from metro congestion. Despite its modest size, the town’s proximity to Des Moines allows residents to enjoy a manageable commute while preserving a quiet lifestyle. The post-pandemic housing surge amplified demand here, especially for properties on large lots or acreage. Runnells also benefits from a sense of community and low crime, which has supported long-term housing stability. The consistent upward trend in home prices positions Runnells as a valuable market for both primary homebuyers and long-term investors.
Runnells – Small Town Living With Metro Access
Runnells is the kind of place where life moves a little slower, but access to big-city convenience is still within reach. The town is surrounded by farmland and natural beauty, creating a peaceful environment just 20 miles from downtown Des Moines. Its appeal lies in its simplicity: quiet neighborhoods, low property taxes, and a tight-knit population. Unlike more built-up suburbs, Runnells hasn’t been overdeveloped, and that’s part of the reason demand has pushed prices so high. Buyers are drawn to the open land and privacy, and as central Iowa grows outward, Runnells has reaped the benefits. Schools in the surrounding area have strong reputations, and the lack of commercial clutter adds to the residential appeal. As more families and retirees seek peaceful alternatives to dense suburbs, Runnells stands out as a high-value destination with room to grow.
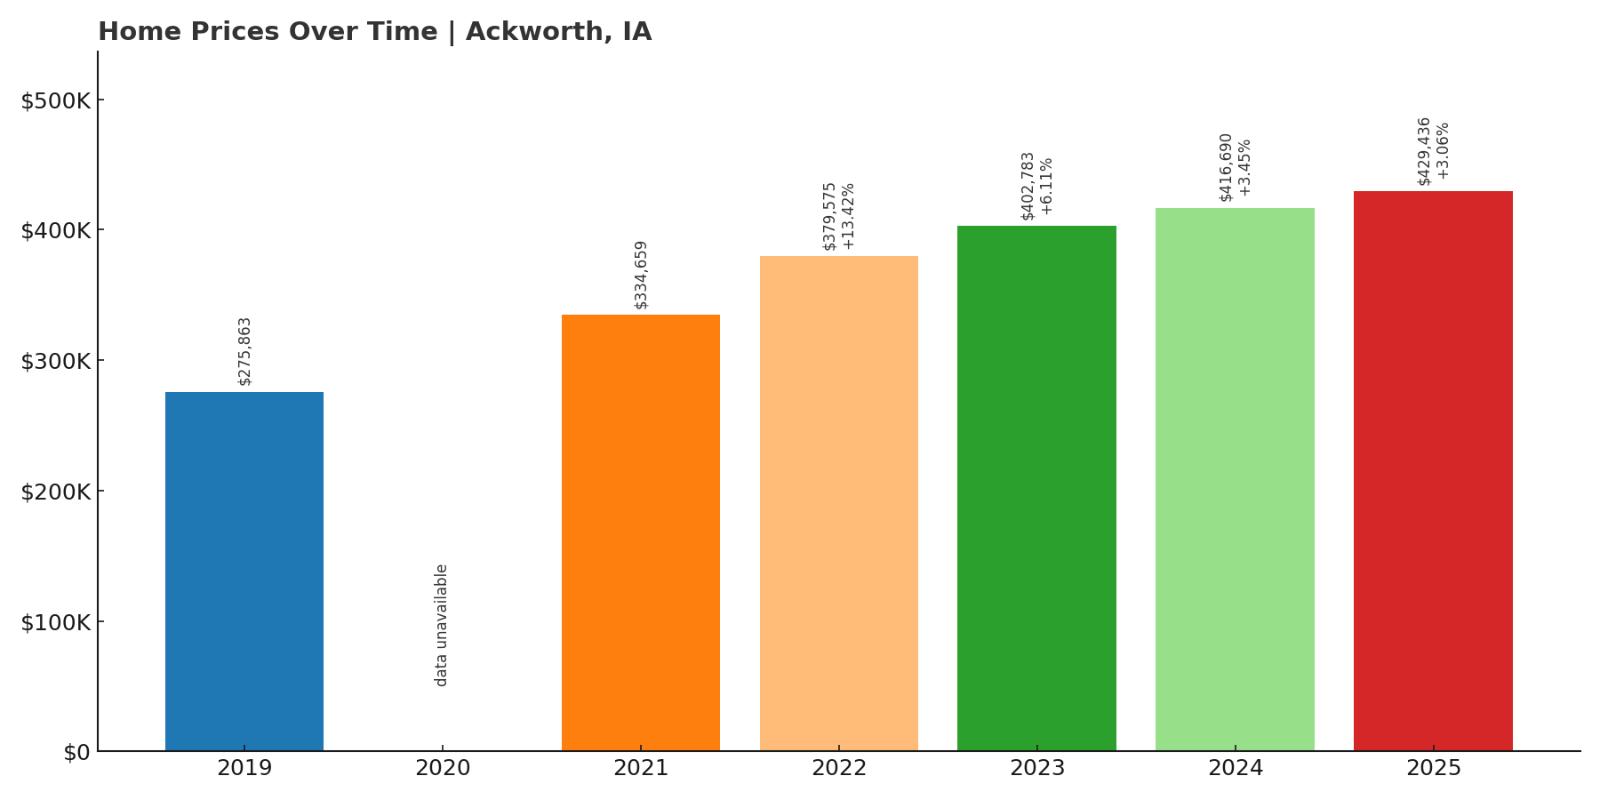
11. Ackworth – 56% Home Price Increase Since 2019
- 2010: N/A
- 2011: N/A
- 2012: N/A
- 2013: N/A
- 2014: N/A
- 2015: N/A
- 2016: N/A
- 2017: N/A
- 2018: N/A
- 2019: $275,863
- 2020: N/A
- 2021: $334,659
- 2022: $379,575 (+$44,916, +13.42% from previous year)
- 2023: $402,783 (+$23,208, +6.11% from previous year)
- 2024: $416,690 (+$13,908, +3.45% from previous year)
- 2025: $429,436 (+$12,745, +3.06% from previous year)
Ackworth has posted a 56% price increase since 2019, a notable achievement considering how few years of data are available. Growth has been particularly strong from 2021 onward, reflecting broader price acceleration across rural Iowa. The town may be small and quiet, but buyers have clearly taken notice. Ackworth’s appeal lies in its affordability compared to nearby towns, yet its prices now rival larger communities thanks to recent spikes. Located in Warren County, it sits within a commutable distance to Des Moines, allowing residents to blend rural living with job access. Price jumps of more than $40,000 in 2022 alone pushed Ackworth into Iowa’s top tier of expensive markets. For investors and early buyers, this rapid increase signals strong return potential. The town’s price trajectory suggests continued appreciation as demand grows for homes in smaller, less-developed locations.
Ackworth – Rapid Growth in a Rural Setting
Ackworth is a village in every sense of the word—tiny, tranquil, and tucked into the rolling countryside of south-central Iowa. Despite its size, it’s becoming increasingly valuable thanks to its proximity to Indianola and access to Des Moines jobs via Highway 92. Most homes here sit on generous lots, and there’s little traffic or noise to worry about. These lifestyle perks have made it more attractive to families and retirees looking for peace without total isolation. The recent home price surge suggests that even the smallest towns aren’t immune to the forces shaping Iowa’s housing market. With few homes on the market at any given time, limited supply is a key reason for rising prices. People who discover Ackworth often choose to stay, which adds to the tight inventory. As more buyers widen their search radius, places like Ackworth are likely to see continued growth in both interest and value.
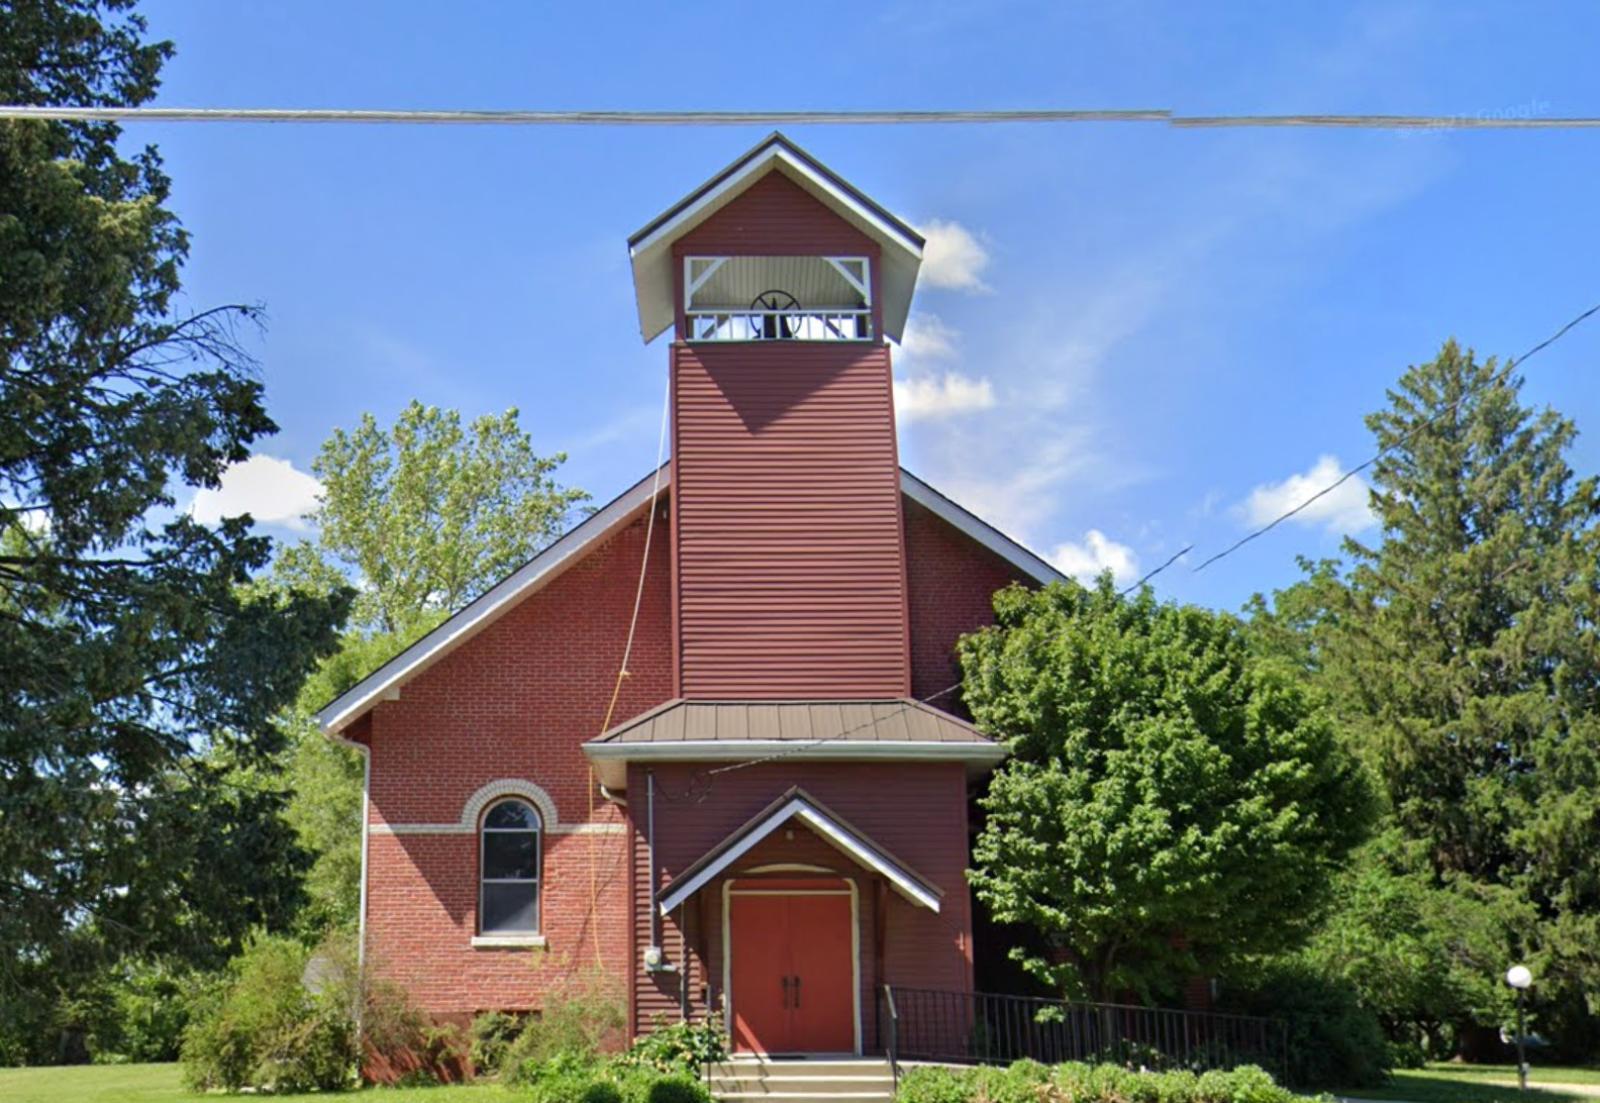
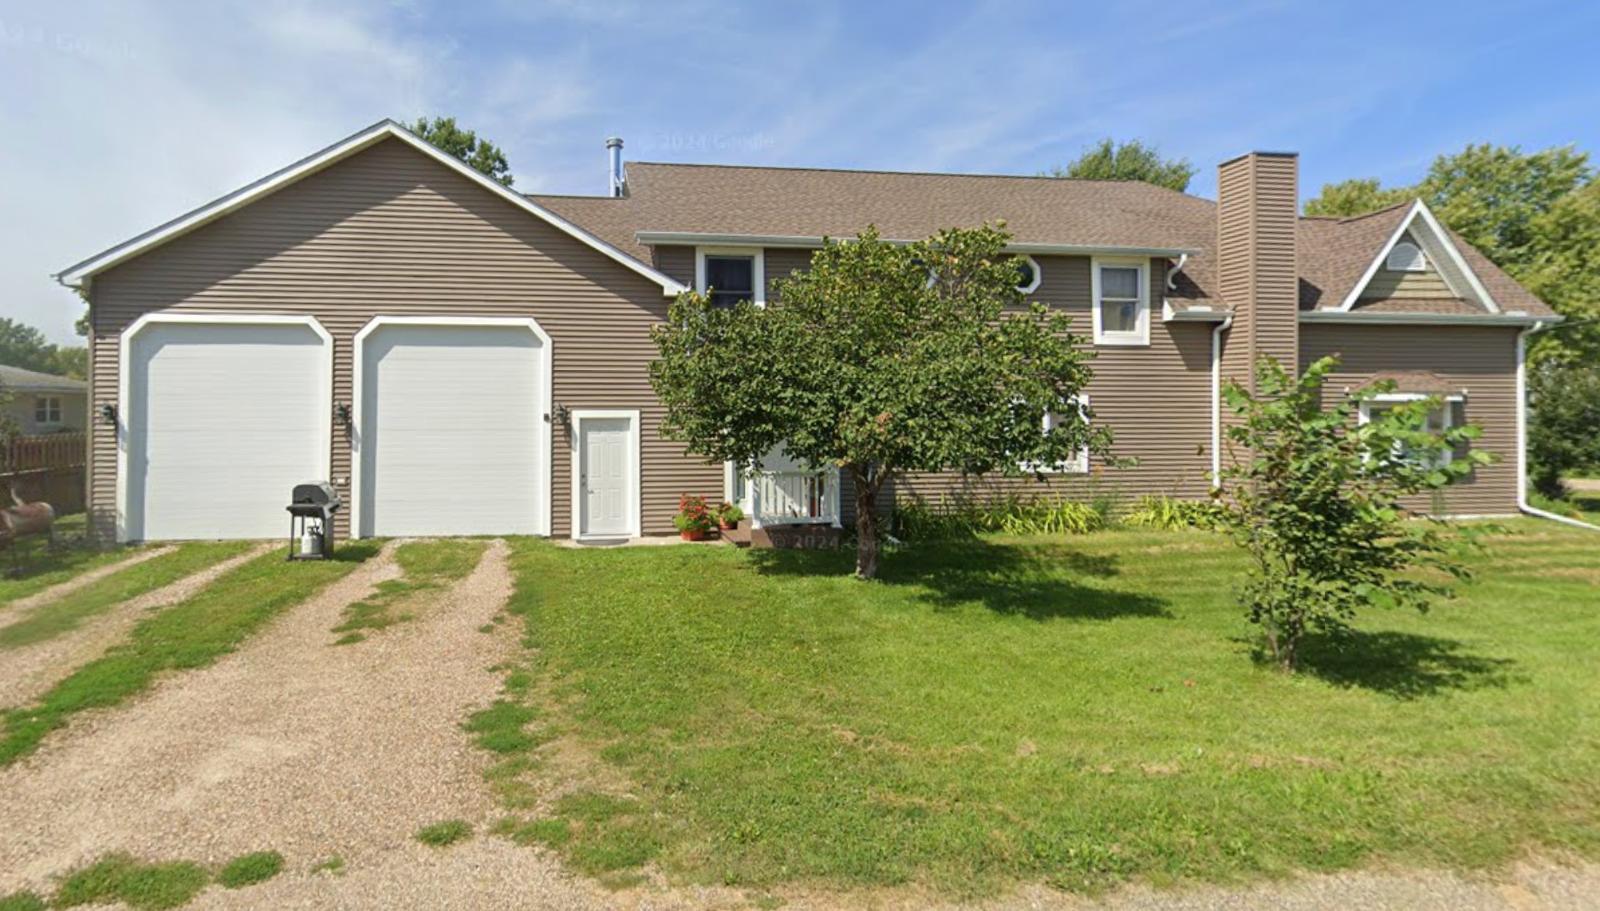
10. Clive – 73% Home Price Increase Since 2010
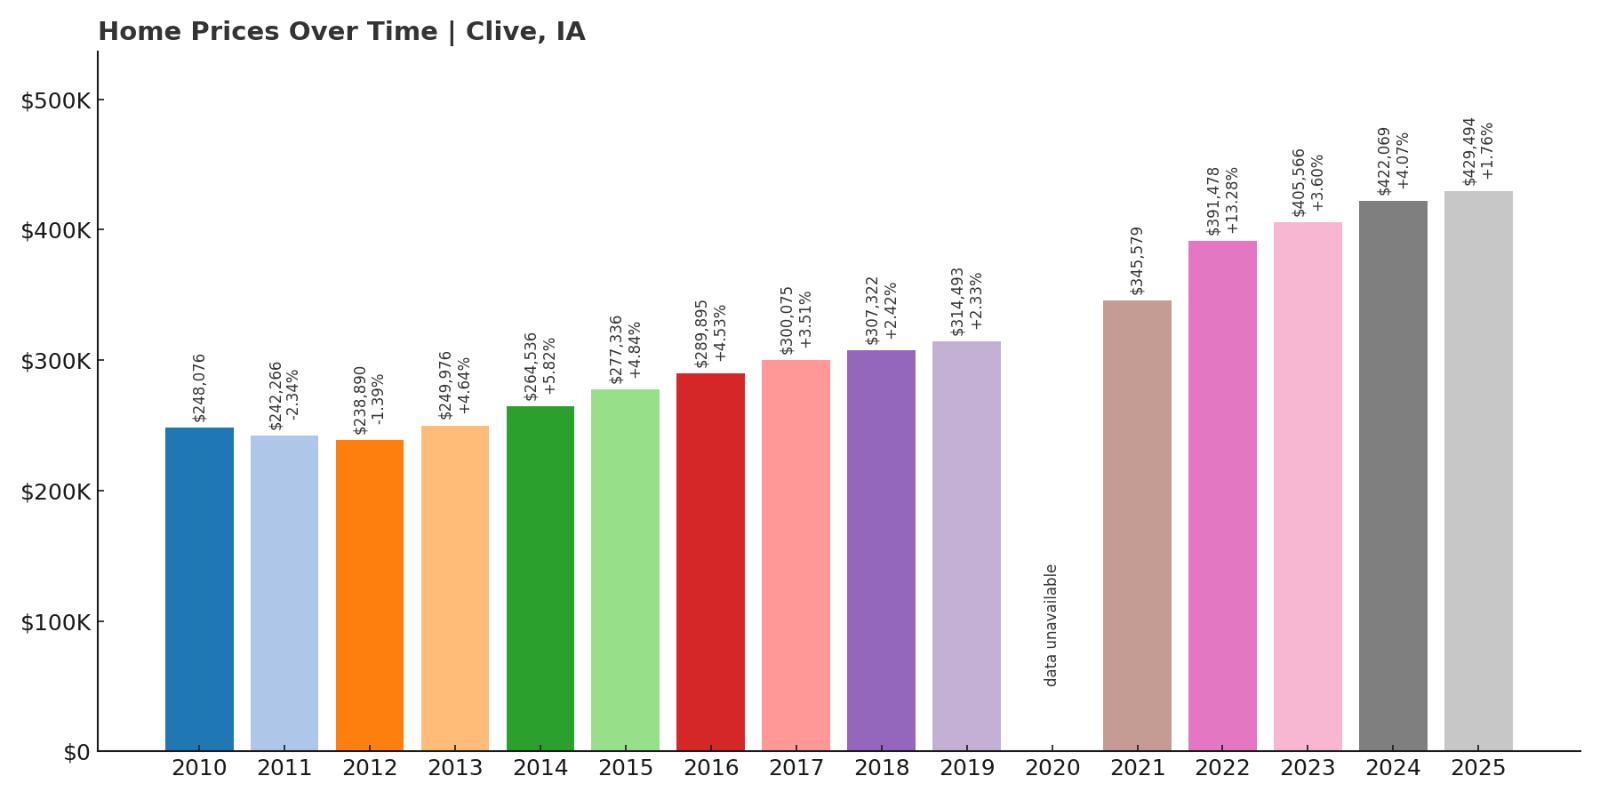
- 2010: $248,076
- 2011: $242,266 (-$5,810, -2.34% from previous year)
- 2012: $238,890 (-$3,377, -1.39% from previous year)
- 2013: $249,976 (+$11,086, +4.64% from previous year)
- 2014: $264,536 (+$14,560, +5.82% from previous year)
- 2015: $277,336 (+$12,800, +4.84% from previous year)
- 2016: $289,895 (+$12,559, +4.53% from previous year)
- 2017: $300,075 (+$10,180, +3.51% from previous year)
- 2018: $307,322 (+$7,247, +2.41% from previous year)
- 2019: $314,493 (+$7,171, +2.33% from previous year)
- 2020: N/A
- 2021: $345,579
- 2022: $391,478 (+$45,899, +13.28% from previous year)
- 2023: $405,566 (+$14,088, +3.60% from previous year)
- 2024: $422,069 (+$16,502, +4.07% from previous year)
- 2025: $429,494 (+$7,426, +1.76% from previous year)
Clive’s home values have climbed 73% since 2010, reflecting its long-standing position as a premier suburb of Des Moines. Even during slower periods, the town avoided major declines and continued to attract new homeowners. The largest gains occurred between 2021 and 2022, when prices rose nearly $46,000. Clive is well-known for its strong school systems, green spaces, and quiet neighborhoods, which contribute to its desirability. The city also benefits from a strong commercial corridor and easy access to Interstates 35 and 80. Clive’s housing stock includes both newer developments and upscale, established subdivisions. These factors, combined with low crime and access to amenities, continue to drive prices higher. Clive is a steady, reliable housing market with excellent long-term growth potential.
Clive – Des Moines Suburban Favorite With Lasting Appeal
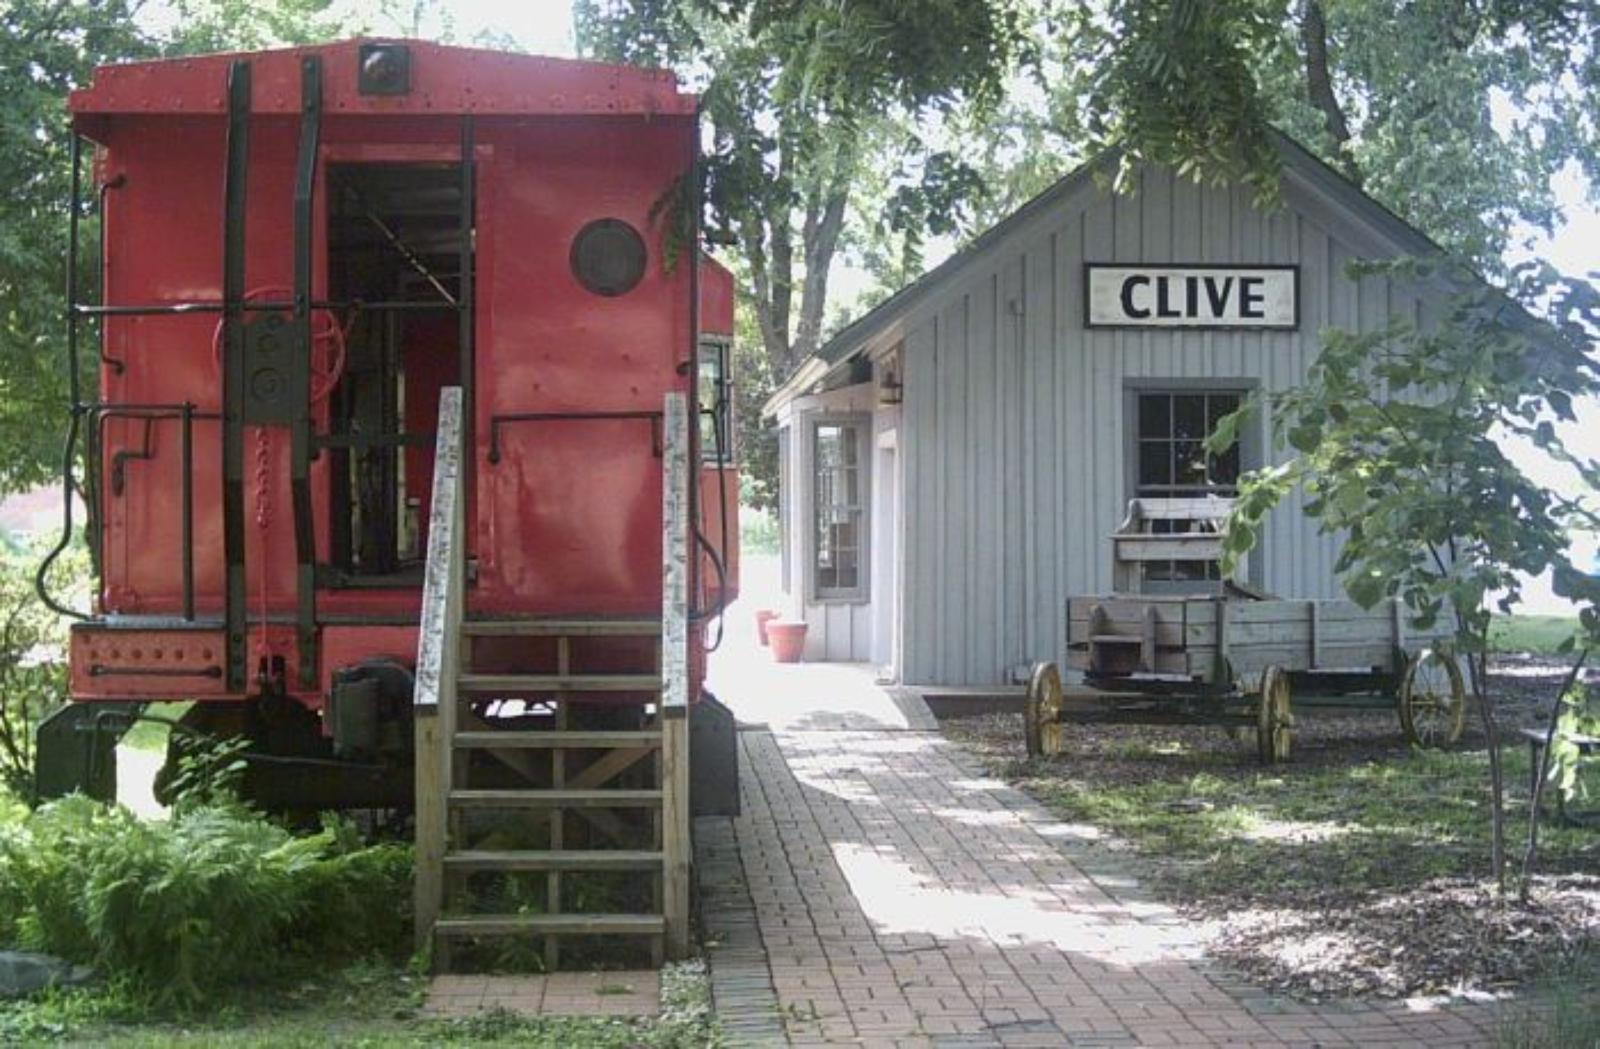
Clive offers a polished, well-maintained atmosphere that consistently draws in families and professionals. Located on the western edge of Des Moines, it provides easy access to downtown while retaining a peaceful suburban vibe. Its extensive trail system, public parks, and well-ranked schools contribute to its reputation as one of the metro’s most livable areas. Homebuyers value the town’s blend of natural beauty and modern convenience. With ongoing development and strong civic planning, Clive is positioned to grow without losing its appeal. Demand here rarely dips, even during economic downturns, thanks to its reputation for stability. That stability has translated into higher home values, and those gains continue to hold. For buyers looking for security in their investment, Clive offers both comfort and consistent appreciation.
9. Swisher – 62% Home Price Increase Since 2010

- 2010: $265,800
- 2011: $267,150 (+$1,351, +0.51% from previous year)
- 2012: $264,386 (-$2,765, -1.03% from previous year)
- 2013: $266,815 (+$2,429, +0.92% from previous year)
- 2014: $271,733 (+$4,919, +1.84% from previous year)
- 2015: $278,223 (+$6,490, +2.39% from previous year)
- 2016: $293,311 (+$15,087, +5.42% from previous year)
- 2017: $301,403 (+$8,092, +2.76% from previous year)
- 2018: $316,596 (+$15,193, +5.04% from previous year)
- 2019: $325,910 (+$9,314, +2.94% from previous year)
- 2020: N/A
- 2021: $363,215
- 2022: $403,695 (+$40,480, +11.14% from previous year)
- 2023: $405,637 (+$1,942, +0.48% from previous year)
- 2024: $416,796 (+$11,159, +2.75% from previous year)
- 2025: $430,189 (+$13,393, +3.21% from previous year)
Home prices in Swisher have risen by nearly 62% since 2010, with the most significant leap coming in 2022. That year alone saw values spike over $40,000, a clear signal of surging demand in this Johnson County town. Located between Cedar Rapids and Iowa City, Swisher has become a magnet for commuters looking for a quieter place to call home. The appeal of small-town living with convenient access to major cities has helped drive consistent growth. In recent years, as inventory tightened statewide, Swisher stood out for offering a mix of rural charm and accessibility. Even modest year-over-year gains have added up, propelling this community into Iowa’s top 10 most expensive markets. As families and professionals continue relocating to areas that provide both space and access, Swisher’s housing market is likely to remain hot. The town’s price growth is both a reflection of its quality of life and its strategic location.
Swisher – Quiet Living Between Two Cities
Swisher sits almost equidistant from Cedar Rapids and Iowa City, making it a highly desirable spot for professionals who work in either location. Despite this, the town retains a rural, almost pastoral feel that many buyers crave. The community is tight-knit, with local events, small businesses, and a strong sense of identity. Swisher’s zoning and planning have kept growth modest, which helps protect property values. Most homes come with larger lots, and there’s a blend of older homes and newer custom builds. Residents enjoy a peaceful pace of life without sacrificing modern conveniences. The corridor between Cedar Rapids and Iowa City continues to grow, and Swisher is directly in the path of that expansion. This ensures that demand—and prices—are likely to keep climbing.
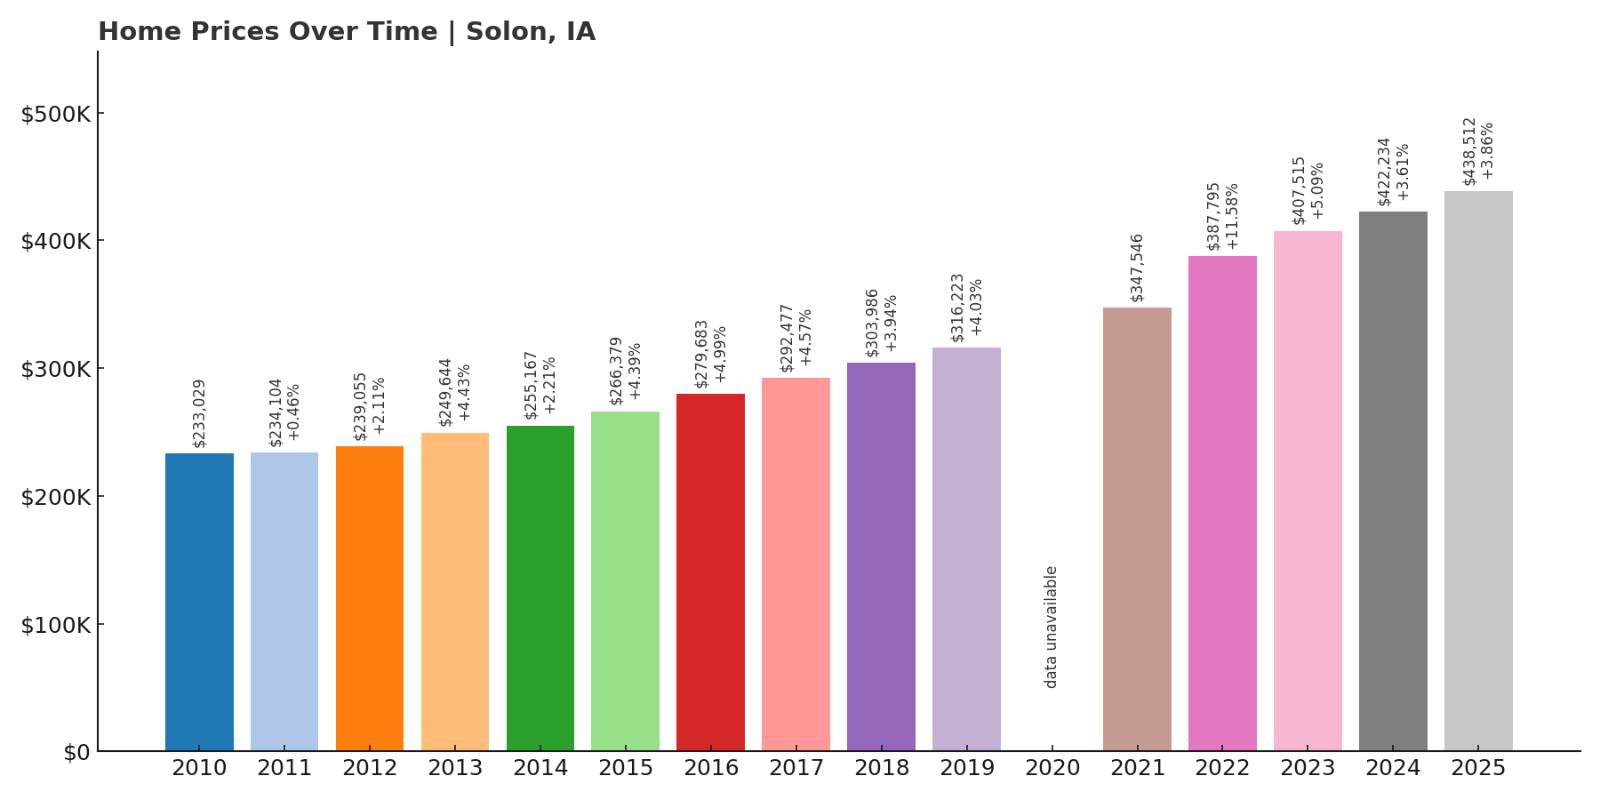
8. Solon – 88% Home Price Increase Since 2010
🔥 Would you like to save this?
- 2010: $233,029
- 2011: $234,104 (+$1,075, +0.46% from previous year)
- 2012: $239,055 (+$4,950, +2.11% from previous year)
- 2013: $249,644 (+$10,589, +4.43% from previous year)
- 2014: $255,167 (+$5,523, +2.21% from previous year)
- 2015: $266,379 (+$11,212, +4.39% from previous year)
- 2016: $279,683 (+$13,304, +4.99% from previous year)
- 2017: $292,477 (+$12,794, +4.57% from previous year)
- 2018: $303,986 (+$11,509, +3.94% from previous year)
- 2019: $316,223 (+$12,237, +4.03% from previous year)
- 2020: N/A
- 2021: $347,546
- 2022: $387,795 (+$40,249, +11.58% from previous year)
- 2023: $407,515 (+$19,720, +5.09% from previous year)
- 2024: $422,234 (+$14,719, +3.61% from previous year)
- 2025: $438,512 (+$16,277, +3.86% from previous year)
Solon’s home prices have surged 88% since 2010, with no significant declines across the years. It’s one of Iowa’s most stable housing markets, showing reliable annual growth. Solon’s largest leap came in 2022, when the median home value increased by over $40,000 in a single year. Located in Johnson County, it serves as a quiet bedroom community for Iowa City but is increasingly known in its own right. The town’s well-ranked schools and family-friendly vibe attract a steady stream of new residents. With continued residential development and an expanding school district, demand remains high. Newer homes and subdivisions have helped fuel appreciation without flooding the market. As surrounding urban areas become more crowded and expensive, Solon remains a top pick for buyers seeking a blend of peace, space, and upward value momentum.
Solon – A Reliable Market With Strong Schools
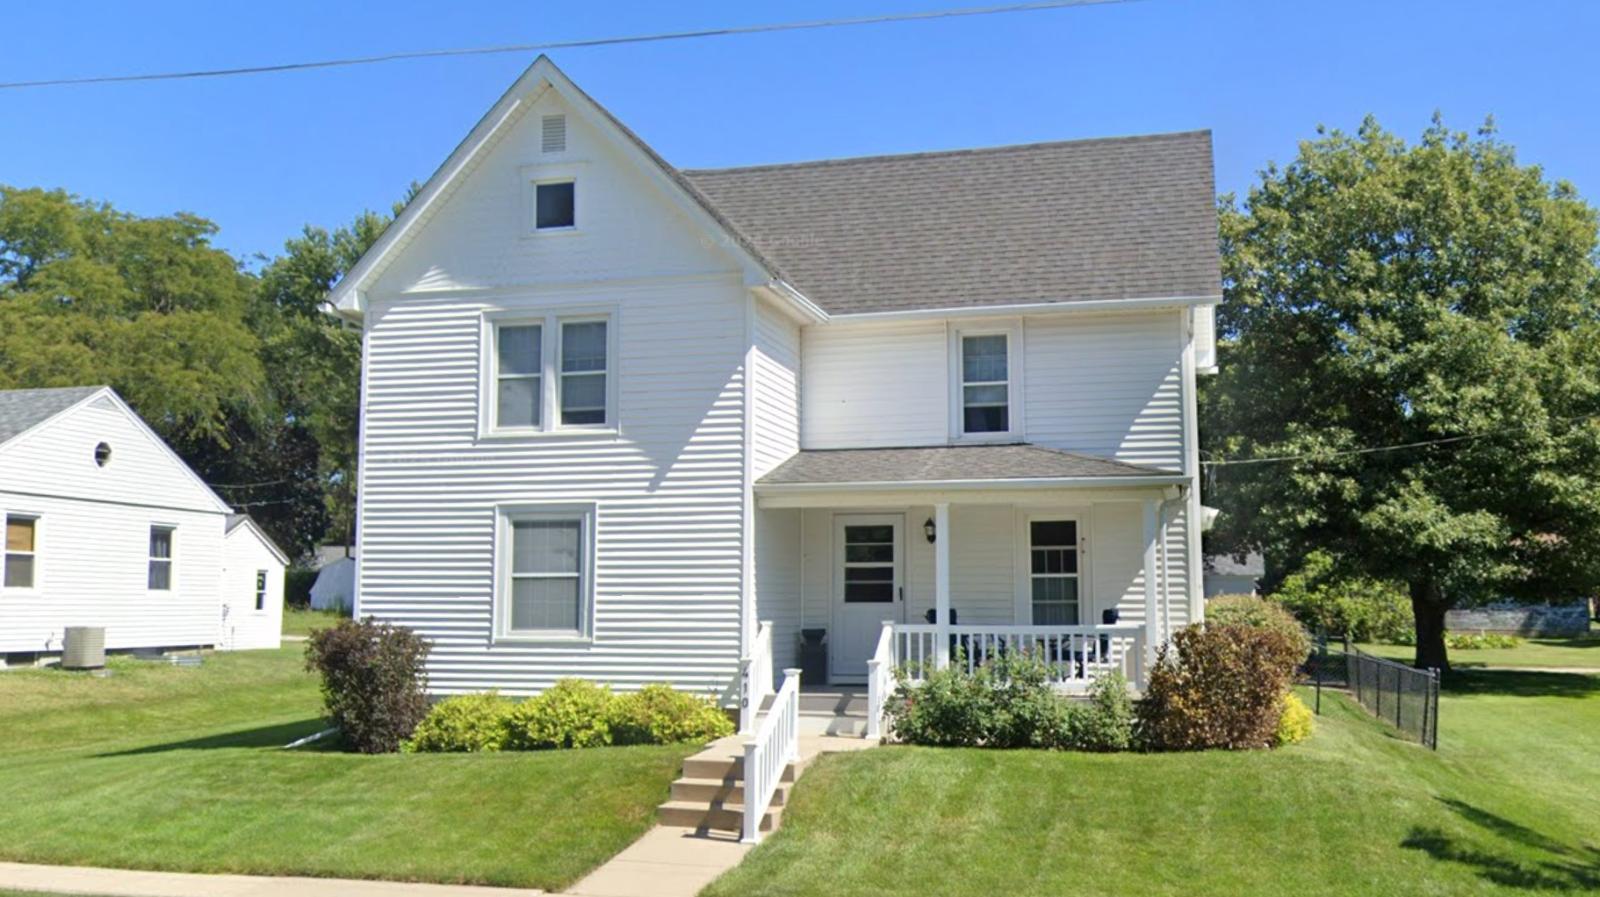
Solon offers a mix of new development and small-town charm that has proven irresistible to families. It boasts one of the region’s most respected school systems, a key factor in rising home prices. Situated just 15 minutes from both Iowa City and Coralville, it benefits from a wide commuter base. Solon also offers parks, trails, and recreational access to Lake Macbride, which further boosts its lifestyle appeal. The town has seen controlled, thoughtful growth that supports rising values without sacrificing character. New builds are common but well-spaced, and there’s a strong sense of civic pride among residents. For homebuyers looking for investment-grade stability and quality of life, Solon checks nearly every box. Its spot on this list reflects both its desirability and long-term investment value.
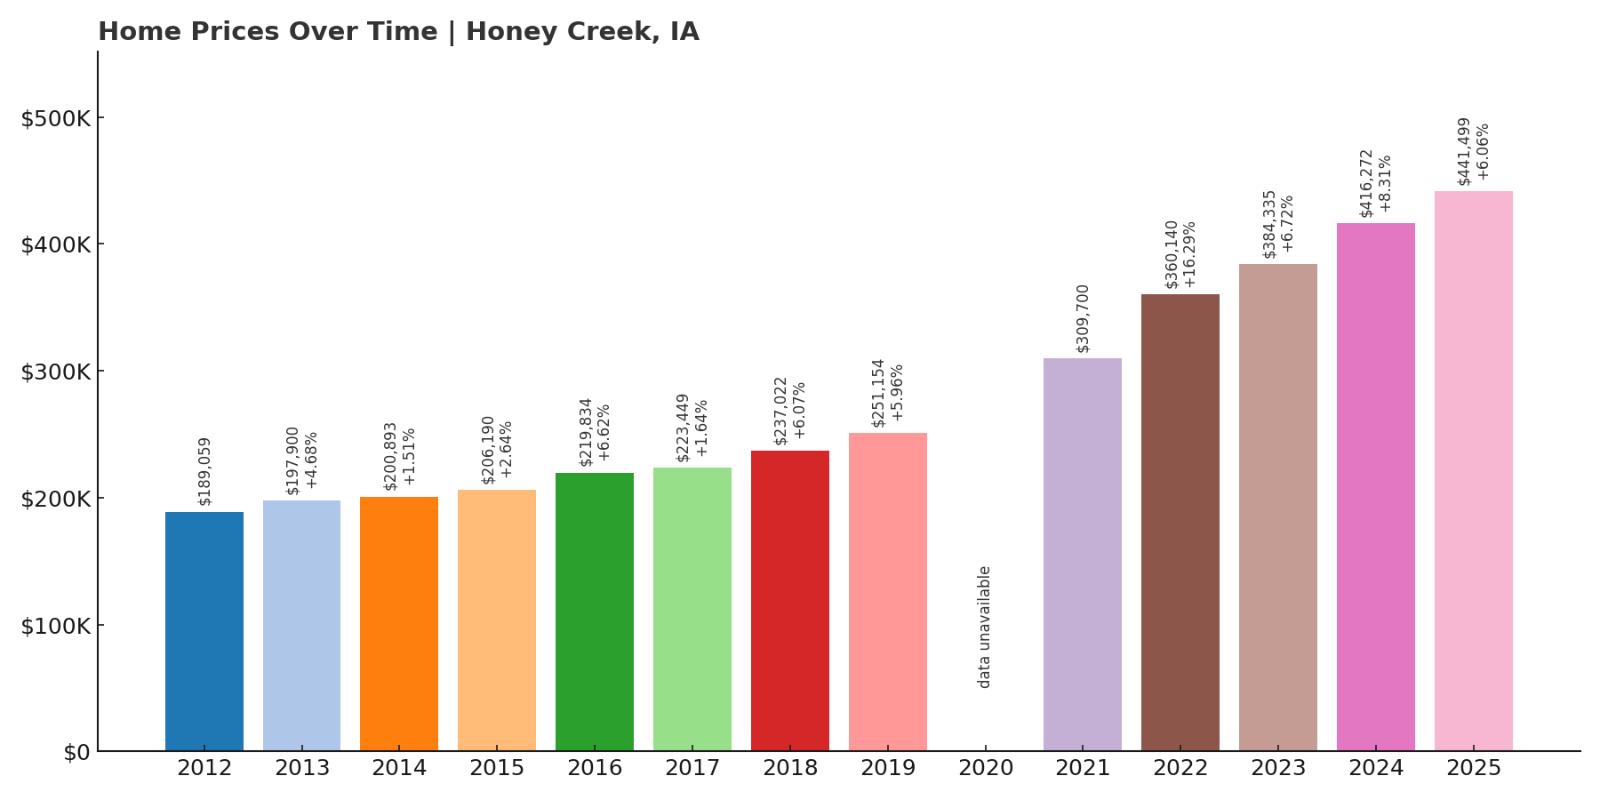
7. Honey Creek – 134% Home Price Increase Since 2012
- 2010: N/A
- 2011: N/A
- 2012: $189,059
- 2013: $197,900 (+$8,841, +4.68% from previous year)
- 2014: $200,893 (+$2,993, +1.51% from previous year)
- 2015: $206,190 (+$5,297, +2.64% from previous year)
- 2016: $219,834 (+$13,644, +6.62% from previous year)
- 2017: $223,449 (+$3,615, +1.64% from previous year)
- 2018: $237,022 (+$13,574, +6.07% from previous year)
- 2019: $251,154 (+$14,132, +5.96% from previous year)
- 2020: N/A
- 2021: $309,700
- 2022: $360,140 (+$50,440, +16.29% from previous year)
- 2023: $384,335 (+$24,195, +6.72% from previous year)
- 2024: $416,272 (+$31,937, +8.31% from previous year)
- 2025: $441,499 (+$25,227, +6.06% from previous year)
Honey Creek’s home values have grown by an astonishing 134% since 2012. Growth was steady for most of the past decade, then exploded in the early 2020s. Between 2021 and 2025, prices jumped more than $130,000—easily making it one of the state’s top gainers. The market here reflects a combination of rural land scarcity, proximity to Council Bluffs, and rising interest in small communities near metro areas. Buyers looking for larger homes or property with acreage often look to Honey Creek as a compelling alternative. Limited supply has added pressure, while lifestyle seekers from across western Iowa and Nebraska are helping to drive demand. Despite its rural feel, the town is just minutes from shopping, employment, and schools in Council Bluffs. The price growth here is impressive and seems poised to continue.
Honey Creek – Western Iowa’s Rural Hotspot
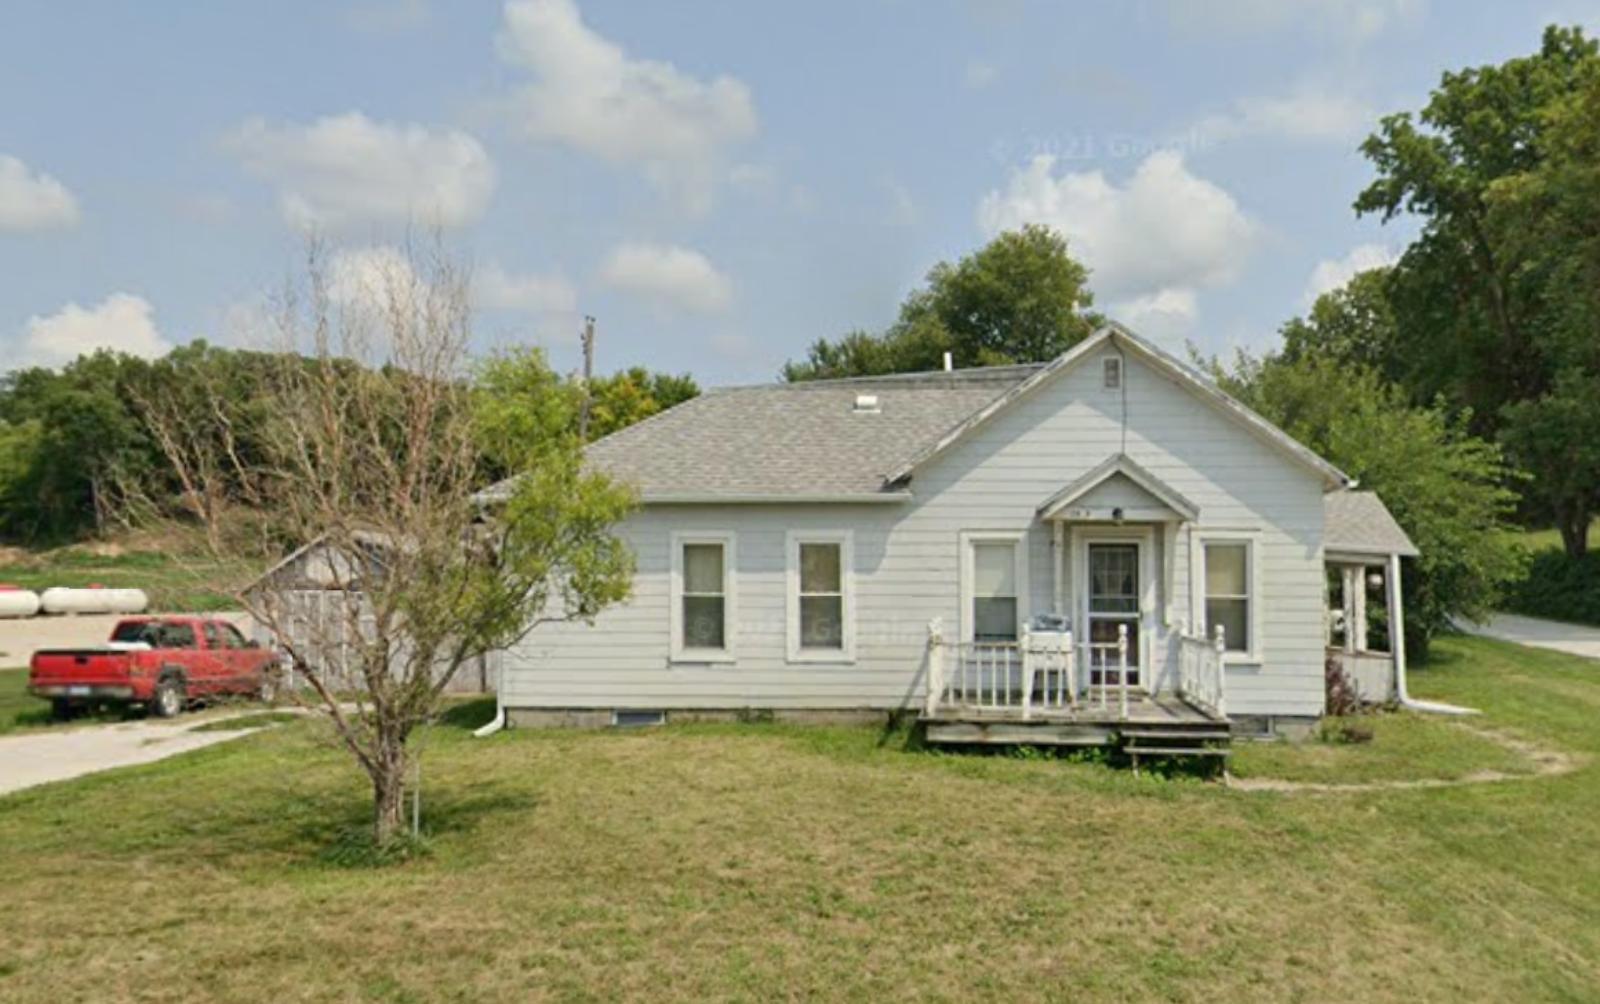
Honey Creek is tucked into the Loess Hills of western Iowa, offering scenic views, large lots, and proximity to outdoor recreation. The town has remained small and peaceful, but it benefits from being within a short drive of Council Bluffs and even Omaha. For buyers who want elbow room without sacrificing convenience, Honey Creek is hard to beat. Its elevation and landscape make for unique home sites, which is another draw for those seeking something different. Despite its size, the area has seen high demand in the past five years, especially for custom homes or land-based properties. The price trajectory suggests long-term strength, supported by both local buyers and metro transplants. As development slowly spreads into western Iowa, Honey Creek’s real estate is only becoming more desirable. Investors and homeowners alike are keeping a close eye on this hidden-value town.
6. Panora – 151% Home Price Increase Since 2010
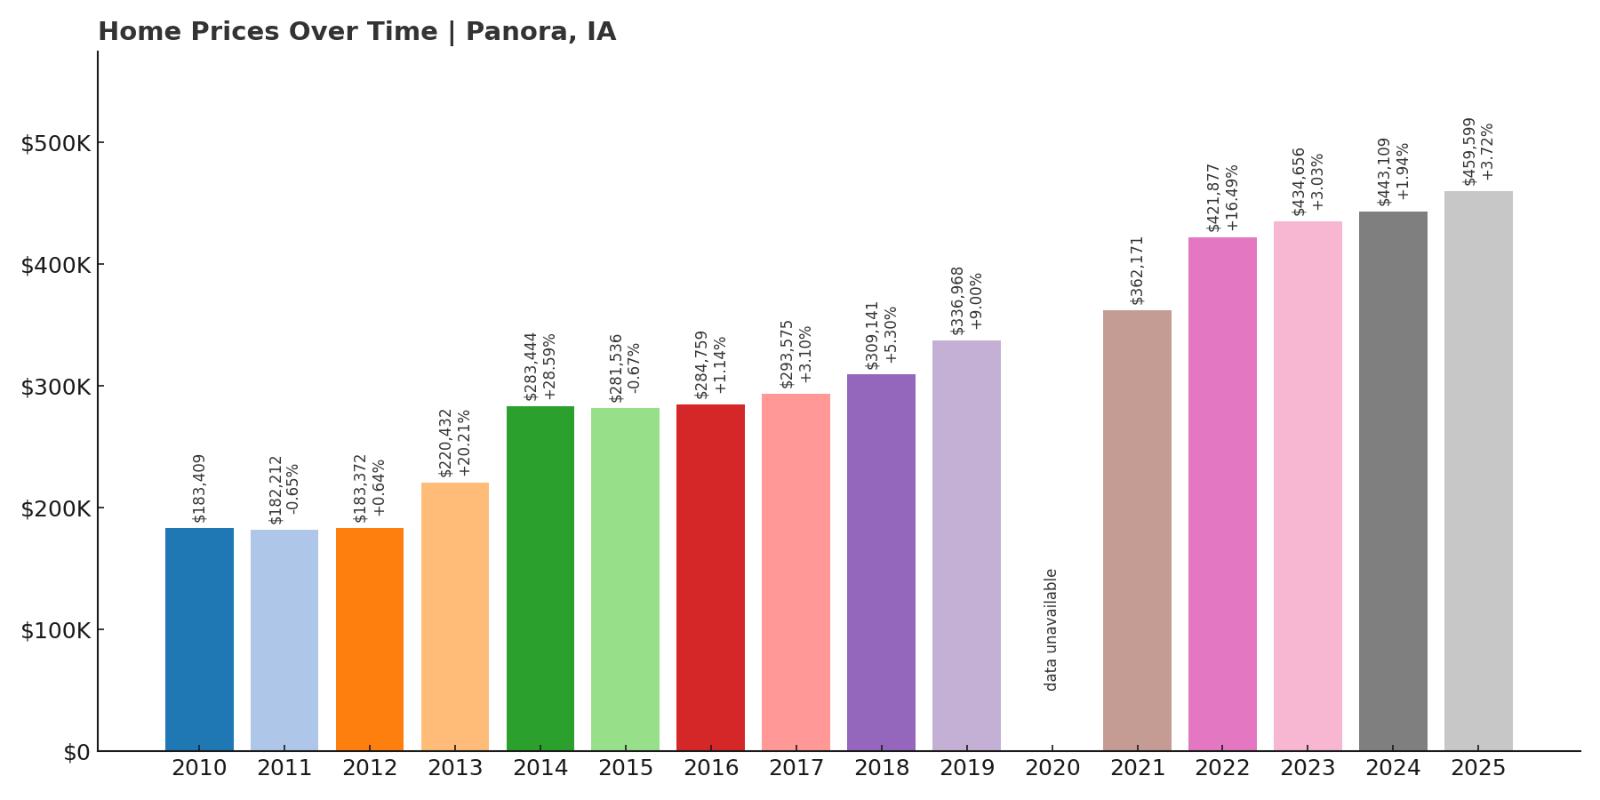
- 2010: $183,409
- 2011: $182,212 (-$1,197, -0.65% from previous year)
- 2012: $183,372 (+$1,159, +0.64% from previous year)
- 2013: $220,432 (+$37,060, +20.21% from previous year)
- 2014: $283,444 (+$63,012, +28.59% from previous year)
- 2015: $281,536 (-$1,907, -0.67% from previous year)
- 2016: $284,759 (+$3,223, +1.14% from previous year)
- 2017: $293,575 (+$8,815, +3.10% from previous year)
- 2018: $309,141 (+$15,566, +5.30% from previous year)
- 2019: $336,968 (+$27,828, +9.00% from previous year)
- 2020: N/A
- 2021: $362,171
- 2022: $421,877 (+$59,706, +16.49% from previous year)
- 2023: $434,656 (+$12,779, +3.03% from previous year)
- 2024: $443,109 (+$8,453, +1.94% from previous year)
- 2025: $459,599 (+$16,489, +3.72% from previous year)
Panora’s home prices have exploded since 2010, increasing by more than 150% over that span. The town saw enormous growth early in the decade, with a $63,000 jump between 2013 and 2014 alone. Price appreciation continued steadily through 2025, with only minor fluctuations. Much of this surge is tied to Panora’s lakeside location on Lake Panorama, a major draw for recreation-minded buyers. As Iowa’s outdoor appeal has grown, Panora has become a popular second-home destination and a desirable spot for residents seeking year-round water access. Strong demand and limited lakefront inventory have driven a consistently upward trend. The town’s largest gains came during the pandemic years, when buyers sought scenic and spacious retreats. Even as other towns cooled, Panora stayed hot, cementing its place in the top 10 most expensive markets in Iowa.
Panora – Lake Panorama’s Market Leader
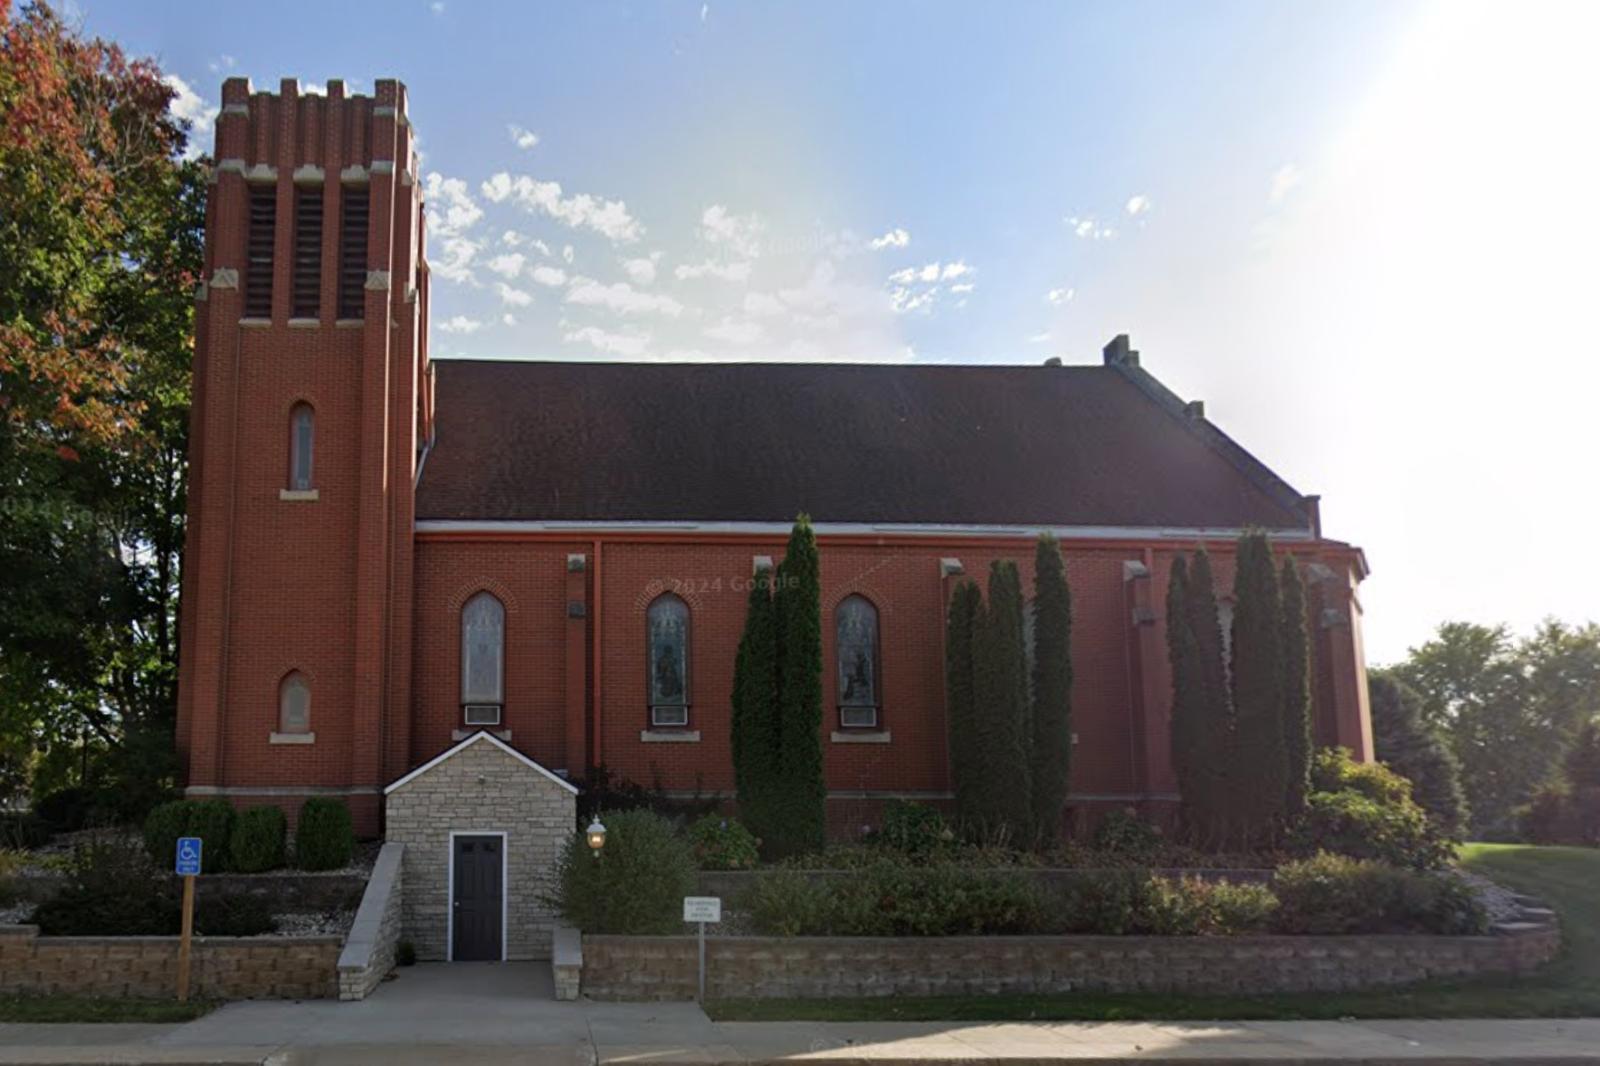
Panora benefits from being home to Lake Panorama, one of Iowa’s largest private lakes. The town blends rural quiet with resort-like amenities, making it popular for both full-time residents and vacationers. It has a small but lively downtown, golf courses, and ample waterfront properties. Buyers range from retirees and remote workers to investors looking for high-end rentals. As housing demand statewide has shifted to quality-of-life locations, Panora has outperformed expectations. Lakefront homes command top dollar, and even properties off the water have seen major appreciation. The blend of scenic value, recreation, and a tight-knit community gives Panora lasting appeal. It’s not just a seasonal market—it’s a year-round investment with strong fundamentals.
5. Cumming – 121% Home Price Increase Since 2010
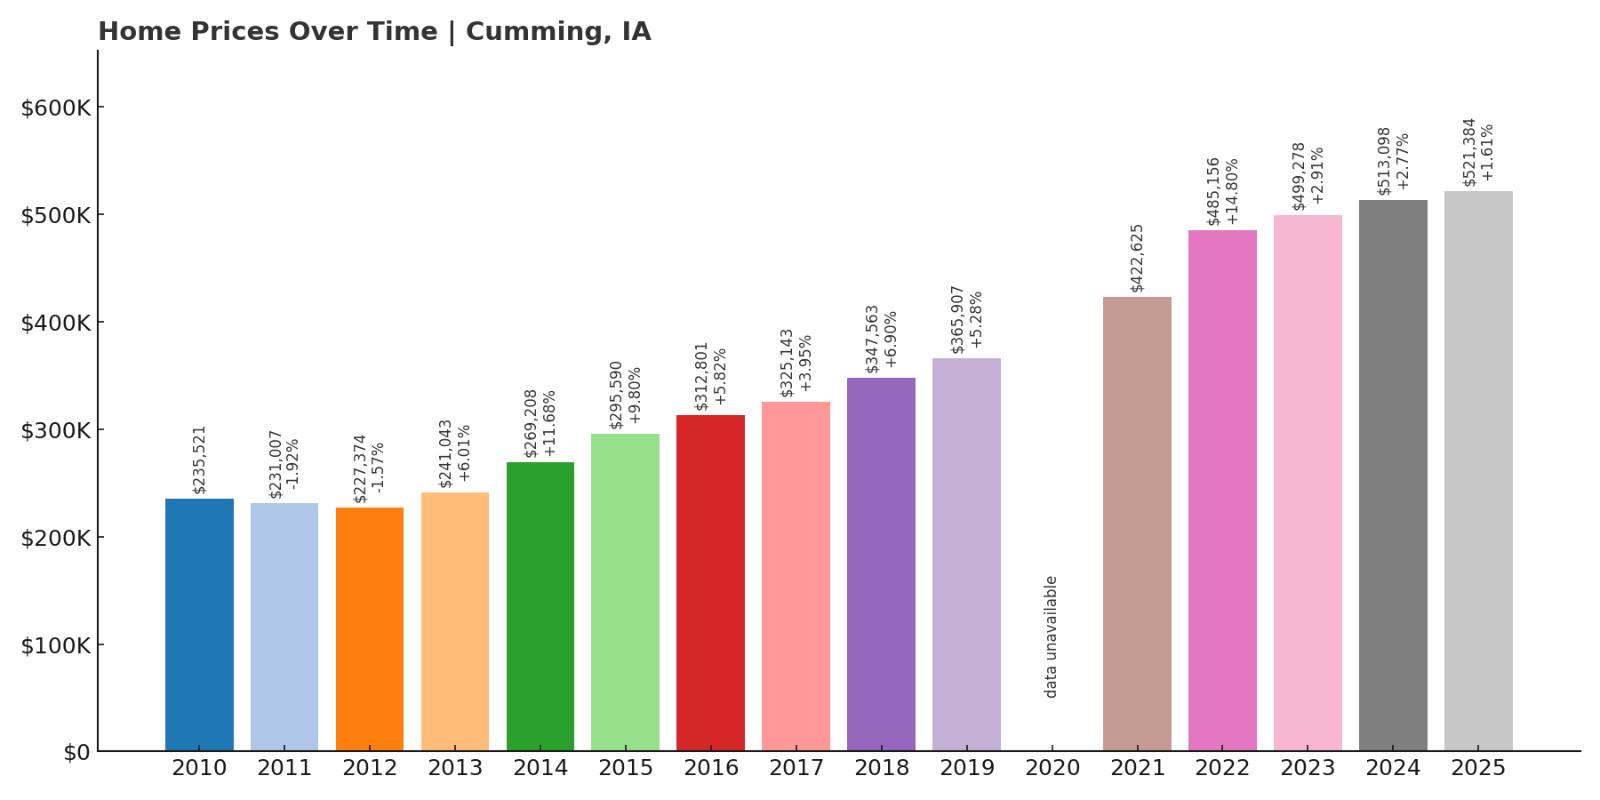
- 2010: $235,521
- 2011: $231,007 (-$4,515, -1.92% from previous year)
- 2012: $227,374 (-$3,633, -1.57% from previous year)
- 2013: $241,043 (+$13,670, +6.01% from previous year)
- 2014: $269,208 (+$28,164, +11.68% from previous year)
- 2015: $295,590 (+$26,383, +9.80% from previous year)
- 2016: $312,801 (+$17,211, +5.82% from previous year)
- 2017: $325,143 (+$12,342, +3.95% from previous year)
- 2018: $347,563 (+$22,420, +6.90% from previous year)
- 2019: $365,907 (+$18,344, +5.28% from previous year)
- 2020: N/A
- 2021: $422,625
- 2022: $485,156 (+$62,531, +14.80% from previous year)
- 2023: $499,278 (+$14,122, +2.91% from previous year)
- 2024: $513,098 (+$13,820, +2.77% from previous year)
- 2025: $521,384 (+$8,286, +1.61% from previous year)
Cumming has quietly become one of Iowa’s fastest-appreciating housing markets, with home values jumping 121% since 2010. Located just southwest of Des Moines, the town offers open land, custom homes, and easy access to I-35. It’s popular among professionals and families who want space while staying close to the metro area. The most explosive growth occurred between 2020 and 2022, when home prices increased by over $60,000 in a single year. Demand continues to rise thanks to new residential development, a scenic setting, and access to top school districts. Buyers are drawn to the mix of new construction, privacy, and trail systems that connect directly to West Des Moines. It’s no longer just a bedroom community—it’s a destination in its own right. With growth showing no signs of slowing, Cumming now firmly ranks among Iowa’s top five most expensive towns.
Cumming – Rural Appeal Meets Metro Access
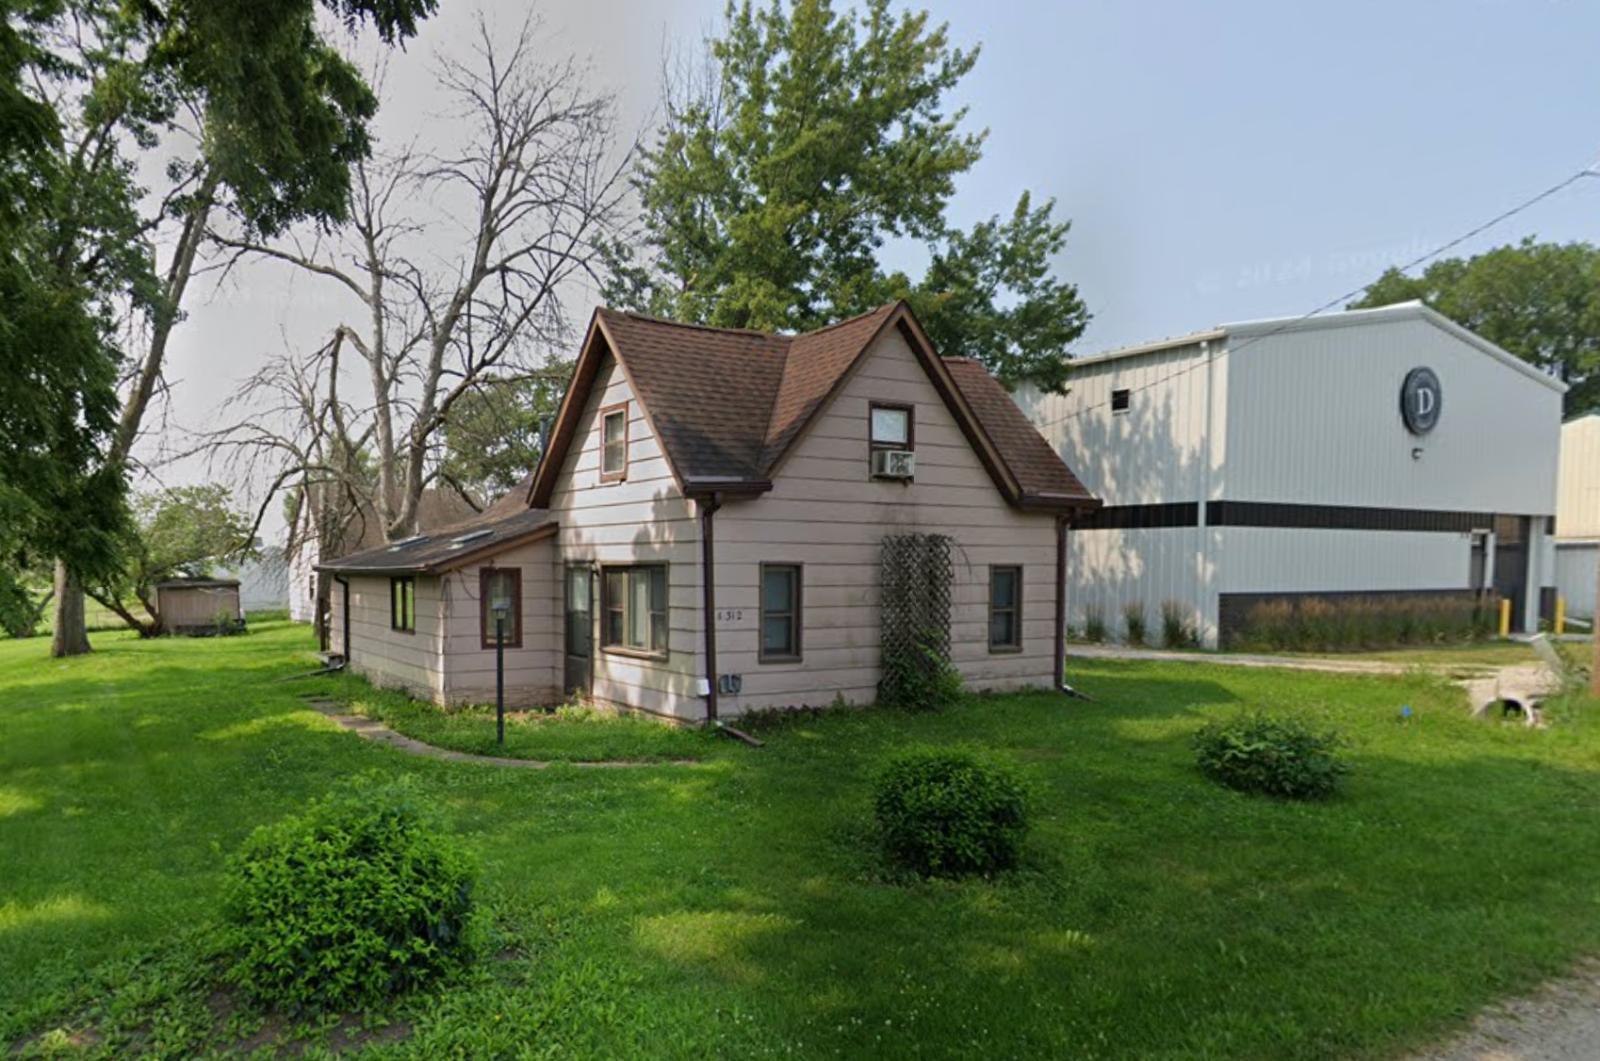
Cumming is a small town with a big advantage: location. It sits just minutes from the Des Moines metro, offering the benefits of rural living without sacrificing convenience. The town has become a favorite among builders and buyers seeking modern homes with land. Cumming also benefits from its position along the Great Western Trail, which appeals to outdoor enthusiasts. Despite its growth, the town maintains a close-knit feel and community-driven culture. Its infrastructure and planning are designed to support long-term value without sacrificing charm. Homes here tend to be newer, custom-built, and often sit on larger lots than what’s available closer to the city. With rising prices and stable demand, Cumming continues to draw attention as a top-tier housing market with staying power.
4. Shueyville – 67% Home Price Increase Since 2010
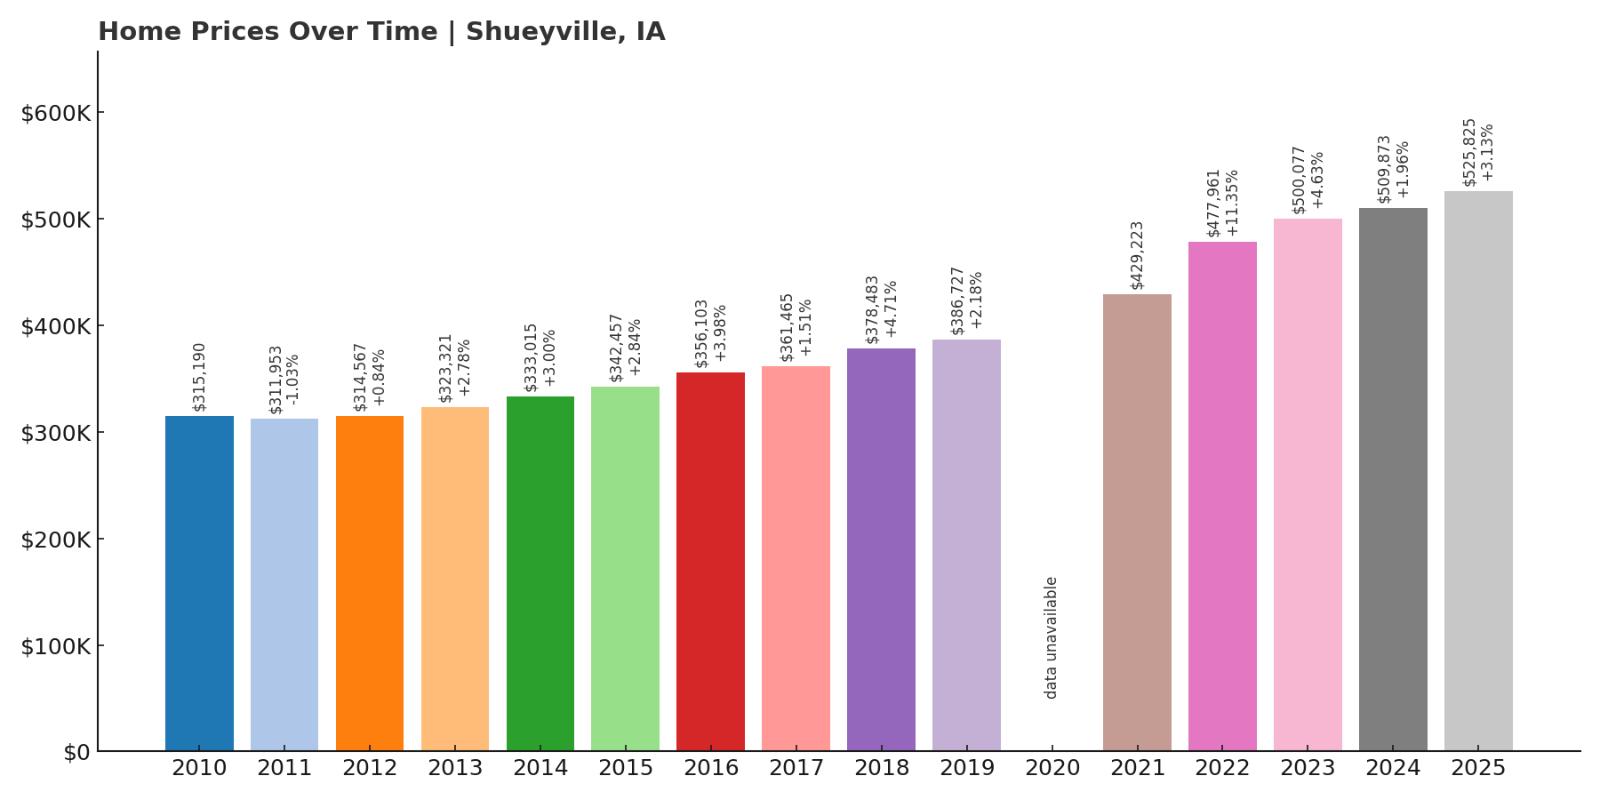
- 2010: $315,190
- 2011: $311,953 (-$3,237, -1.03% from previous year)
- 2012: $314,567 (+$2,615, +0.84% from previous year)
- 2013: $323,321 (+$8,753, +2.78% from previous year)
- 2014: $333,015 (+$9,694, +3.00% from previous year)
- 2015: $342,457 (+$9,442, +2.84% from previous year)
- 2016: $356,103 (+$13,646, +3.98% from previous year)
- 2017: $361,465 (+$5,362, +1.51% from previous year)
- 2018: $378,483 (+$17,018, +4.71% from previous year)
- 2019: $386,727 (+$8,244, +2.18% from previous year)
- 2020: N/A
- 2021: $429,223
- 2022: $477,961 (+$48,738, +11.35% from previous year)
- 2023: $500,077 (+$22,116, +4.63% from previous year)
- 2024: $509,873 (+$9,796, +1.96% from previous year)
- 2025: $525,825 (+$15,953, +3.13% from previous year)
Shueyville’s home values have risen nearly 67% since 2010, with steady appreciation every year. While the growth may seem modest compared to lake towns, the consistency here is remarkable. Between 2021 and 2025 alone, prices grew by nearly $100,000. The town has become a highly desirable enclave for professionals working in nearby Cedar Rapids or Iowa City. Known for its privacy, acreage, and upscale properties, Shueyville has developed a reputation as an ideal spot for custom homes. Inventory remains tight, and zoning regulations help maintain the spacious, low-density environment that buyers crave. The largest annual gain came in 2022, marking it as a breakout year for this upscale town. With high demand and limited supply, Shueyville continues to climb the ranks of Iowa’s priciest places to live.
Shueyville – Upscale Suburban Growth Outside Cedar Rapids
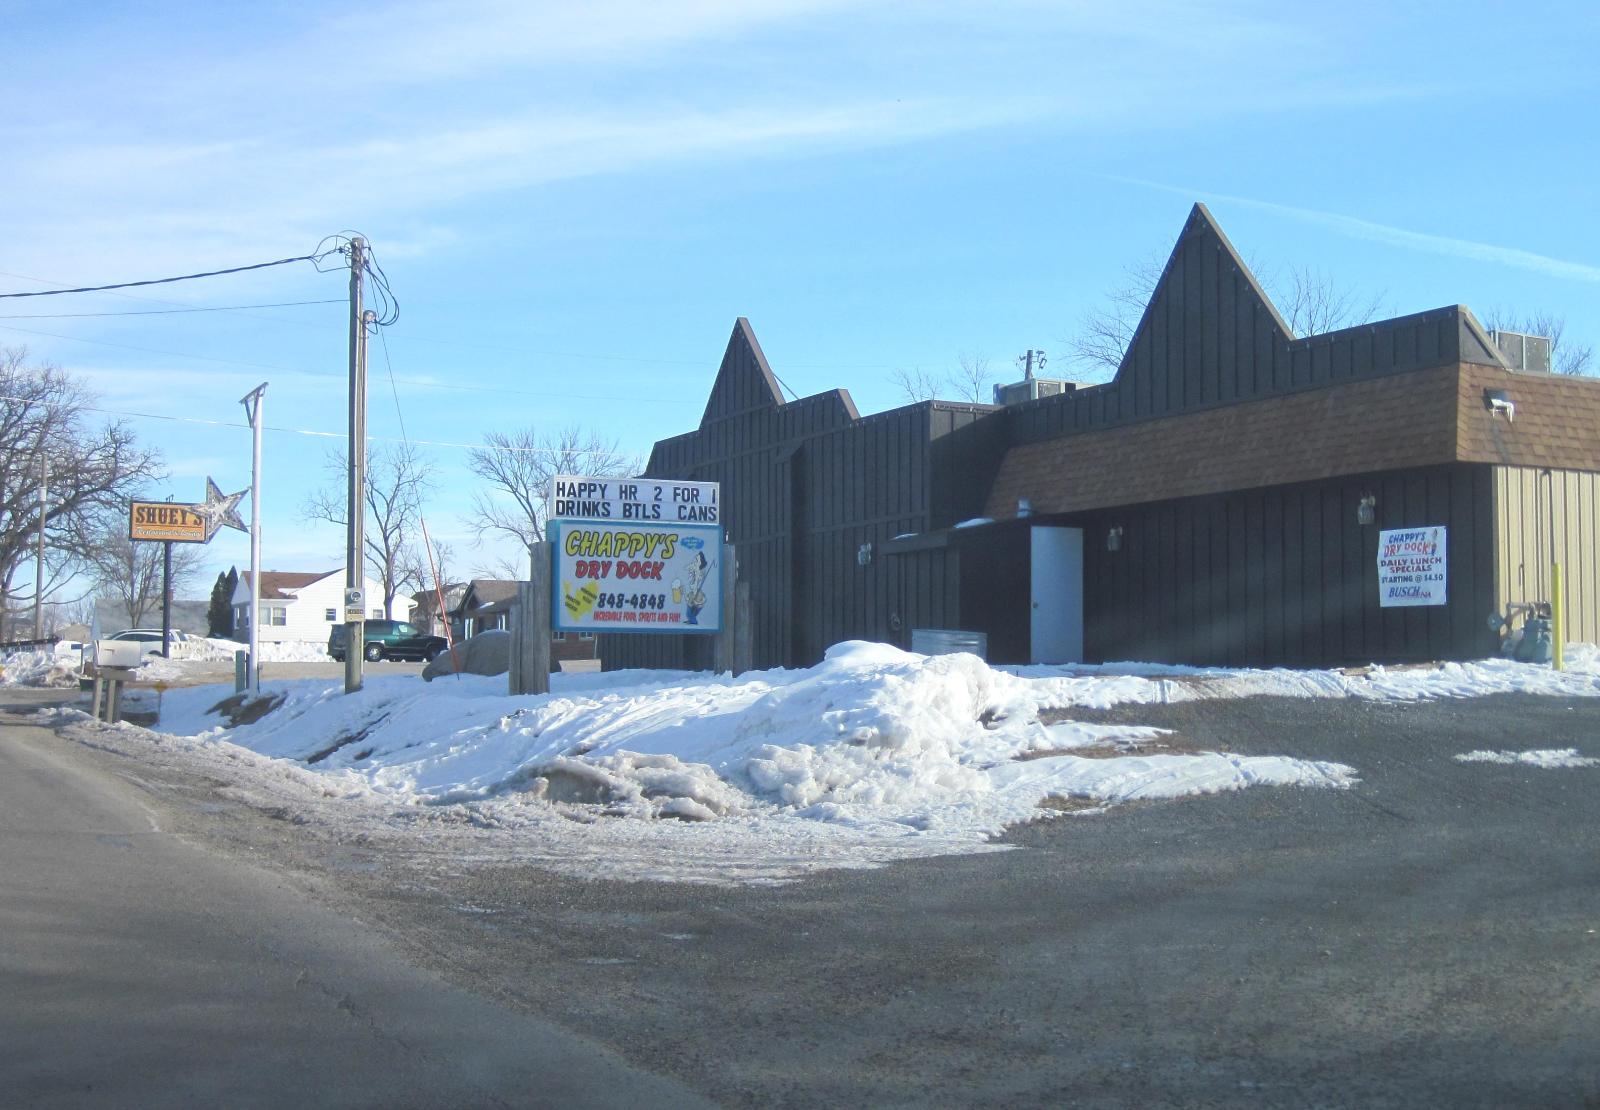
🔥 Would you like to save this?
Shueyville is one of the Cedar Rapids area’s most desirable residential communities, especially for those looking to escape dense suburban sprawl. With large homes, tree-lined lots, and proximity to major highways, it attracts families who want space without sacrificing access to city amenities. The town is served by top-rated schools and offers an appealing mix of privacy and community involvement. Real estate development here has been thoughtful and controlled, helping preserve long-term property values. Most homes in Shueyville are on custom lots, many with wooded acreage or large open fields. With few homes on the market at any time, competition can be fierce. That’s part of what has driven values so steadily upward over the past decade. It’s not a flashy town, but Shueyville is exactly what many buyers are looking for: peace, space, and security.
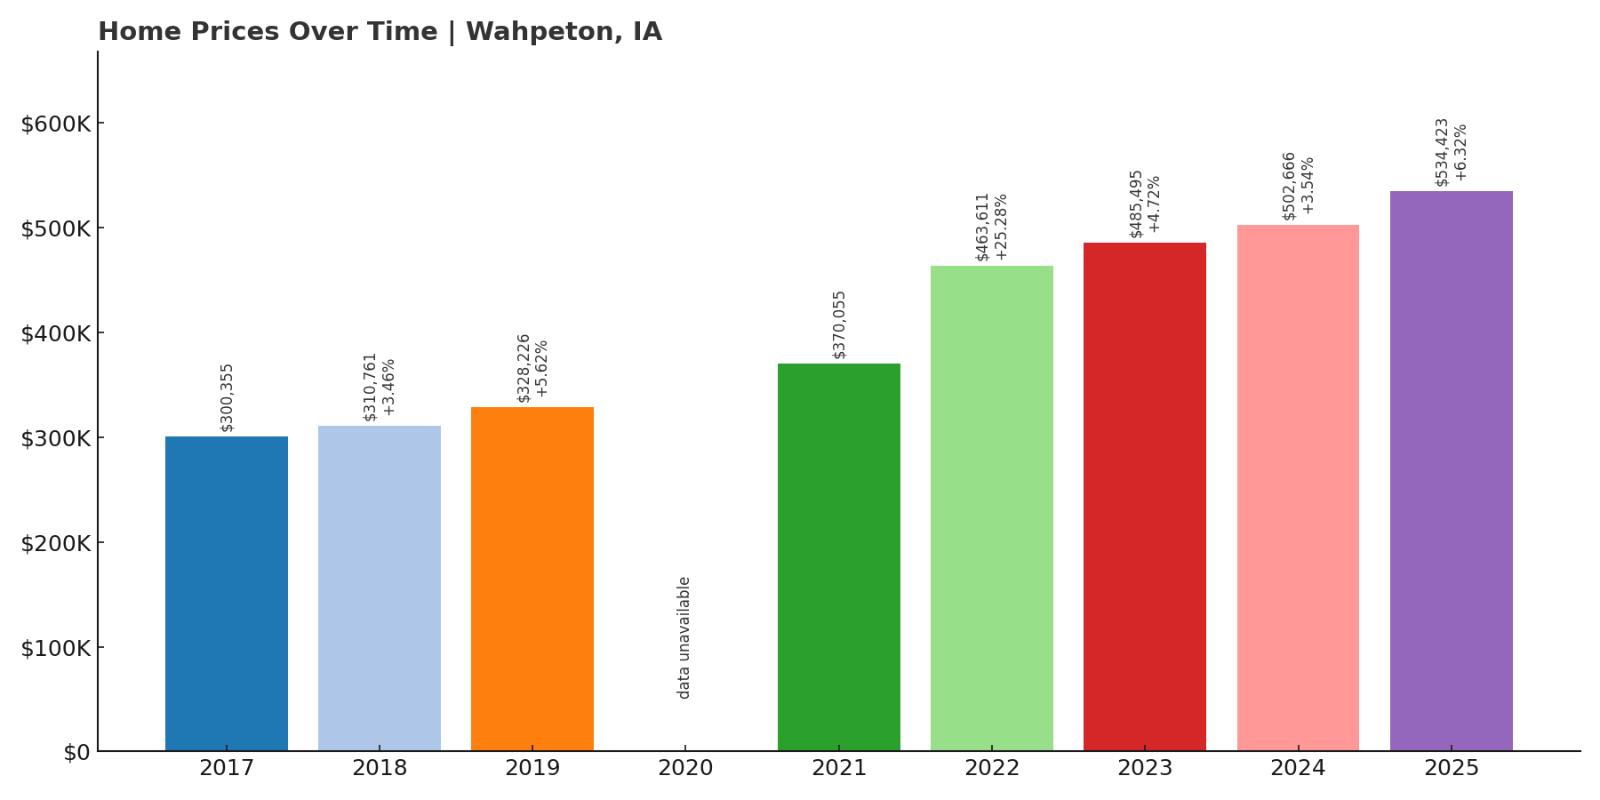
3. Wahpeton – 78% Home Price Increase Since 2017
- 2010: N/A
- 2011: N/A
- 2012: N/A
- 2013: N/A
- 2014: N/A
- 2015: N/A
- 2016: N/A
- 2017: $300,355
- 2018: $310,761 (+$10,406, +3.46% from previous year)
- 2019: $328,226 (+$17,465, +5.62% from previous year)
- 2020: N/A
- 2021: $370,055
- 2022: $463,611 (+$93,557, +25.28% from previous year)
- 2023: $485,495 (+$21,884, +4.72% from previous year)
- 2024: $502,666 (+$17,171, +3.54% from previous year)
- 2025: $534,423 (+$31,757, +6.32% from previous year)
Since 2017, Wahpeton’s home values have grown 78%, with some of the sharpest gains recorded between 2021 and 2022. Located in the Iowa Great Lakes region, Wahpeton attracts affluent buyers looking for lakefront properties, second homes, and vacation rentals. The $93,000 jump in 2022 is among the largest one-year increases on this entire list. What makes Wahpeton stand out is its blend of seasonal luxury and year-round living potential. With beautiful water access and quiet streets, it’s a go-to destination for buyers who want premium real estate with limited competition. Supply is low, especially for waterfront homes, which helps prices remain high even as markets fluctuate elsewhere. Buyers are typically willing to pay top dollar to live on or near the lake. Wahpeton’s presence in the top three confirms its status as one of Iowa’s elite housing markets.
Wahpeton – Elite Lakefront Living in Dickinson County
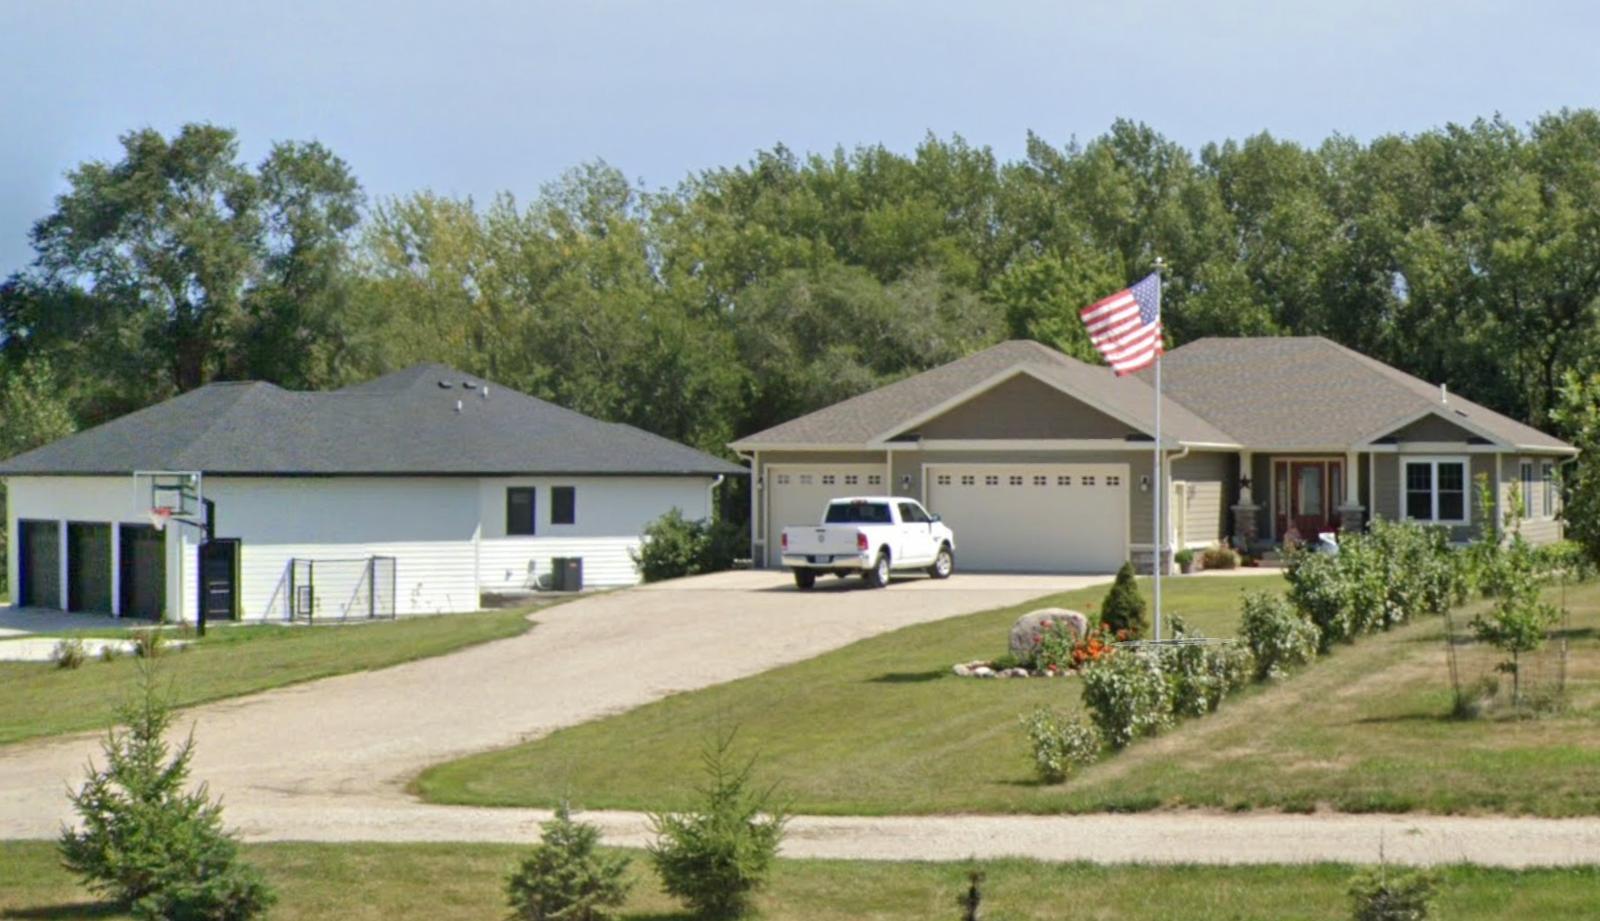
Wahpeton is a small town with an outsized reputation in Iowa’s luxury housing scene. Located on the western edge of West Okoboji Lake, it offers scenic views, boating access, and a calm pace of life. Despite its small population, real estate values here rival or surpass some urban neighborhoods due to location and exclusivity. There’s very little turnover, which drives competition whenever a home becomes available. Many buyers hold onto their properties for generations, especially those near the water. Custom homes, well-maintained properties, and privacy features are common throughout the town. The mix of local pride and seasonal appeal has helped Wahpeton maintain strong pricing even during housing slowdowns. If you’re looking to buy in one of Iowa’s top-tier locations, Wahpeton stands firmly near the top.
2. Orleans – 249% Home Price Increase Since 2010
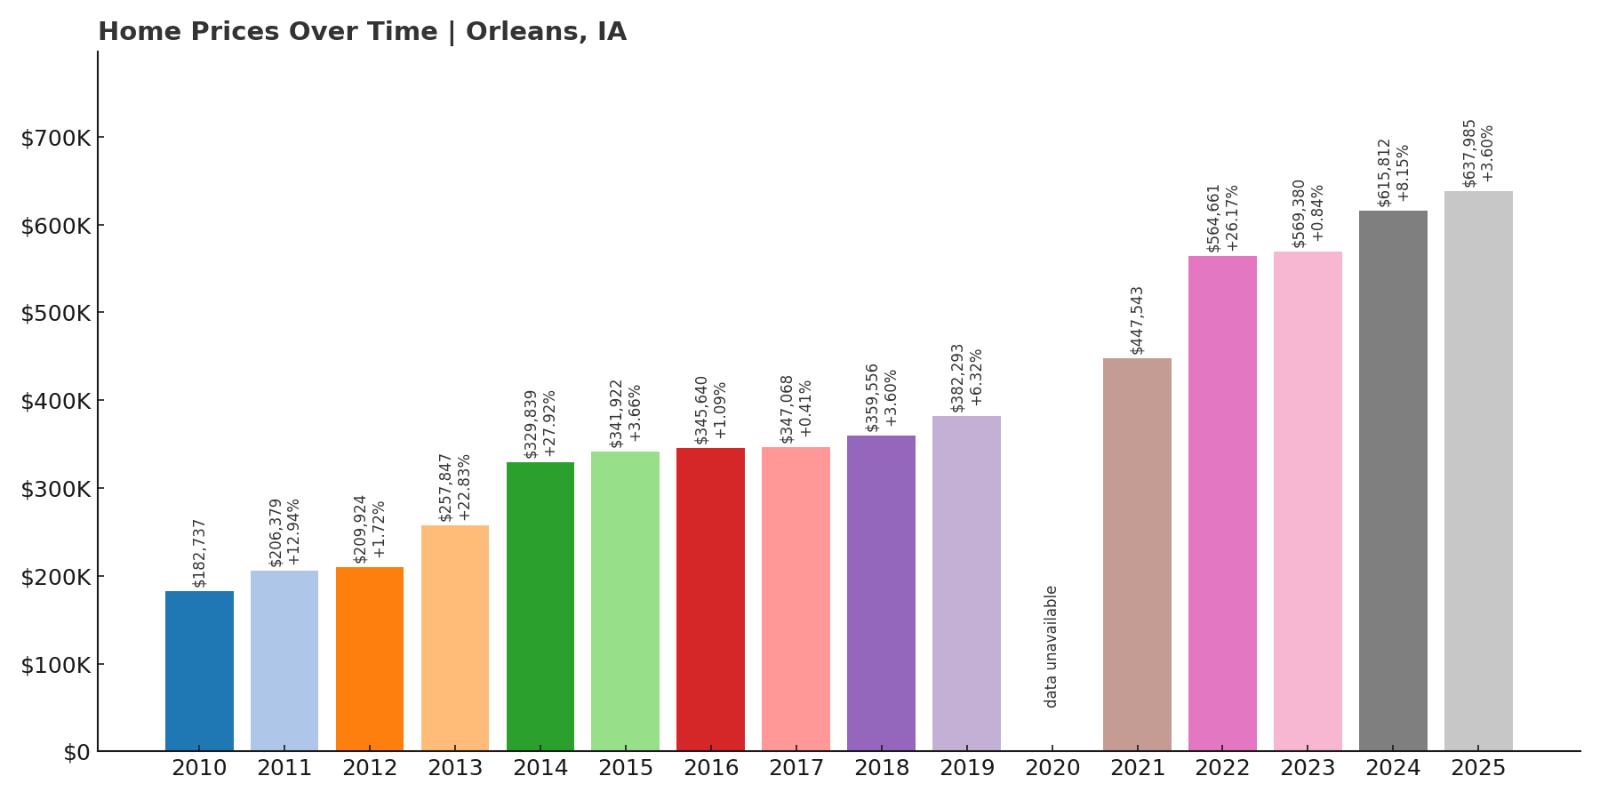
- 2010: $182,737
- 2011: $206,379 (+$23,642, +12.94% from previous year)
- 2012: $209,924 (+$3,545, +1.72% from previous year)
- 2013: $257,847 (+$47,922, +22.83% from previous year)
- 2014: $329,839 (+$71,992, +27.92% from previous year)
- 2015: $341,922 (+$12,083, +3.66% from previous year)
- 2016: $345,640 (+$3,718, +1.09% from previous year)
- 2017: $347,068 (+$1,428, +0.41% from previous year)
- 2018: $359,556 (+$12,487, +3.60% from previous year)
- 2019: $382,293 (+$22,737, +6.32% from previous year)
- 2020: N/A
- 2021: $447,543
- 2022: $564,661 (+$117,119, +26.17% from previous year)
- 2023: $569,380 (+$4,719, +0.84% from previous year)
- 2024: $615,812 (+$46,432, +8.15% from previous year)
- 2025: $637,985 (+$22,173, +3.60% from previous year)
Orleans has experienced a staggering 249% increase in home values since 2010—by far the largest gain on this list. What began as a modest lakeside town has become one of Iowa’s premier real estate hotspots. The most dramatic jumps occurred in the early 2010s and again post-2020, with annual increases of $70,000 or more in some years. Located on the eastern shores of Spirit Lake, Orleans offers prime lake access, resort-style amenities, and a calm residential atmosphere. As Iowa’s vacation culture boomed, so did interest in towns like Orleans, especially among second-home buyers and retirees. Limited building lots, strong resale values, and seasonal rental potential all add to its pricing power. The recent $117K jump in 2022 alone propelled it to near the top of the state’s market. For those seeking scenic living and investment potential, Orleans is tough to beat.
Orleans – Soaring Prices Along Spirit Lake
Orleans sits right along the shoreline of Spirit Lake and has quietly evolved into one of the state’s most desirable communities. Known for its quiet streets and panoramic lake views, the town blends recreational appeal with year-round livability. Properties here are often snapped up quickly, whether they’re used as vacation homes, investment rentals, or retirement properties. As the broader Spirit Lake region has grown in popularity, Orleans has consistently led the way in price appreciation. Local ordinances help preserve the scenic nature of the town, protecting values and limiting overdevelopment. Residents enjoy boating, fishing, and access to parks—all just steps from home. Whether you’re a lifelong Iowan or an out-of-state buyer, Orleans delivers lakefront living with major financial upside. Its real estate market has outpaced nearly every other town in Iowa, and the trend doesn’t appear to be slowing.
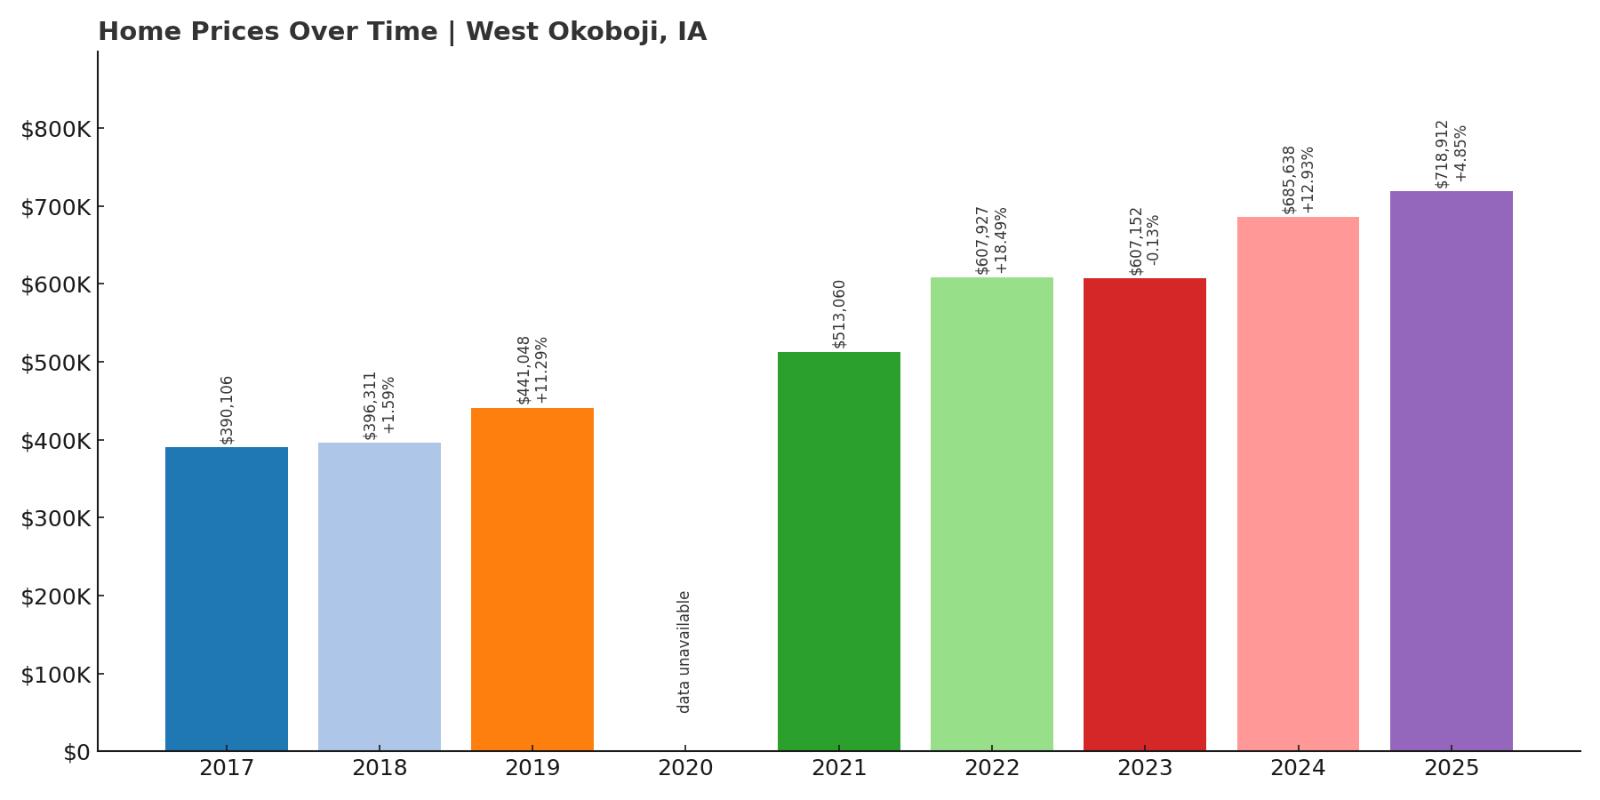
1. West Okoboji – 84% Home Price Increase Since 2017
- 2010: N/A
- 2011: N/A
- 2012: N/A
- 2013: N/A
- 2014: N/A
- 2015: N/A
- 2016: N/A
- 2017: $390,106
- 2018: $396,311 (+$6,205, +1.59% from previous year)
- 2019: $441,048 (+$44,737, +11.29% from previous year)
- 2020: N/A
- 2021: $513,060
- 2022: $607,927 (+$94,868, +18.49% from previous year)
- 2023: $607,152 (-$775, -0.13% from previous year)
- 2024: $685,638 (+$78,485, +12.93% from previous year)
- 2025: $718,912 (+$33,275, +4.85% from previous year)
West Okoboji tops the list as the most expensive town in Iowa as of 2025, with home values reaching nearly $720,000. Since 2017, values have risen 84%, fueled by the town’s exclusive lakefront setting and extreme scarcity of available property. The biggest jump occurred in 2022, when prices skyrocketed by almost $95,000 in just one year. West Okoboji is home to some of the state’s most luxurious real estate, with custom lake homes and limited inventory. Even small dips, like the slight decline in 2023, are quickly reversed by renewed demand. With consistent multi-year gains, the town has become a benchmark for high-end housing in Iowa. The growth here isn’t driven by speculation—it’s driven by people who genuinely want to live or vacation in one of the state’s most scenic areas. For those who can afford it, West Okoboji delivers elite lakefront living at its finest.
West Okoboji – Iowa’s Most Exclusive Waterfront Market
West Okoboji represents the pinnacle of Iowa real estate. Located on the shores of West Okoboji Lake, it draws buyers from across the Midwest and beyond. The town’s homes offer direct lake access, sweeping views, and proximity to marinas, parks, and recreation. Its population is small, but the real estate values are unmatched. With only a few homes available each year, competition is intense and prices reflect that scarcity. Many properties are generational, meaning they rarely enter the market, and when they do, they command top dollar. Whether used as primary residences or seasonal escapes, West Okoboji homes carry unmatched prestige. For luxury buyers, there’s no question: this is the most exclusive place to own a home in Iowa.