🔥 Would you like to save this?
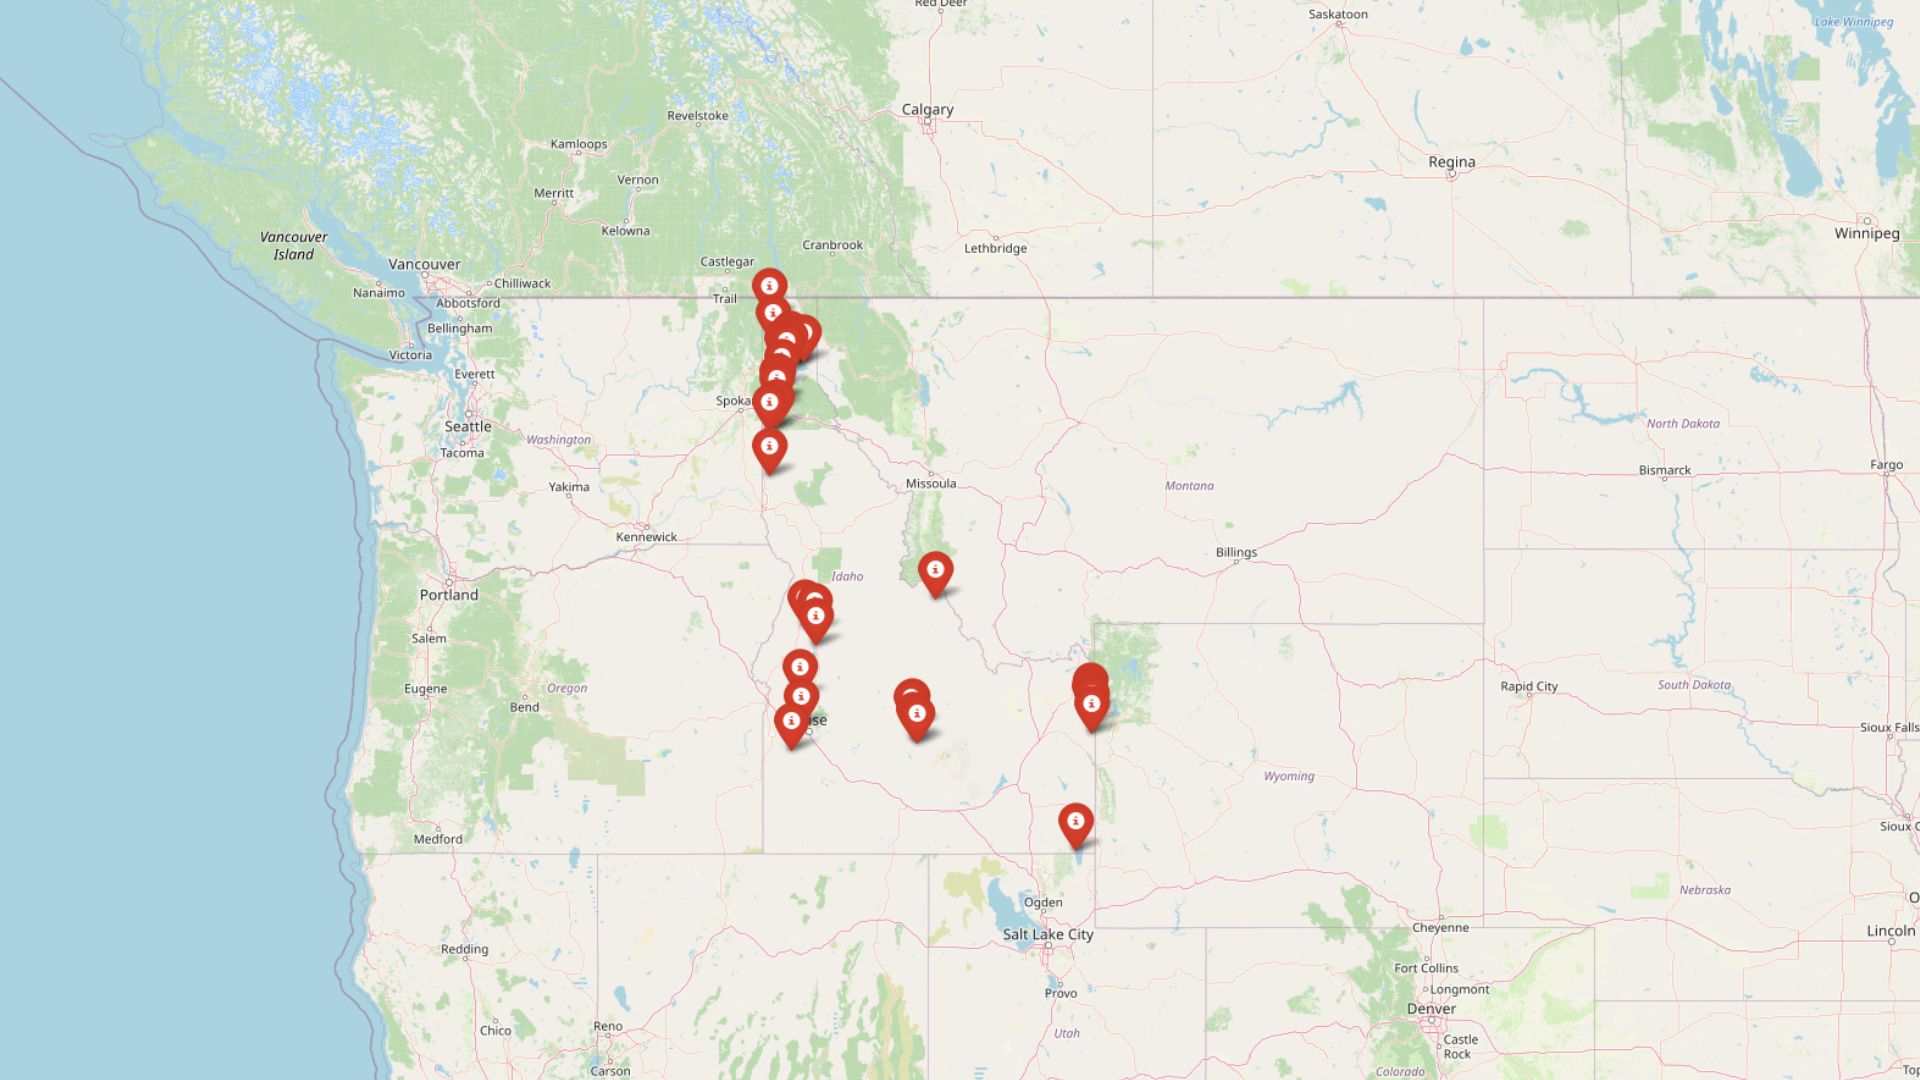
Home prices have reached jaw-dropping levels in dozens of Idaho towns, fueled by years of steady demand and limited supply. According to the Zillow Home Value Index, median home values in the state’s most expensive communities now often top $500,000 — and in some places, the million-dollar mark is within reach.
From alpine ski hubs to scenic lake towns, these 31 high-priced destinations reflect more than just beauty and lifestyle perks. The pandemic-era real estate surge supercharged Idaho’s housing market, with some towns seeing 30% jumps in a single year. While a few areas have cooled slightly, these elite markets remain at the top — showcasing just how much Idaho’s property landscape has transformed.
In order to come up with the very specific design ideas, we create most designs with the assistance of state-of-the-art AI interior design software.
31. Coeur d’Alene – 200% Home Price Increase Since 2010

- 2010: $198,534
- 2011: $174,893 (−$23,642, −11.91% from previous year)
- 2012: $180,899 (+$6,006, +3.43% from previous year)
- 2013: $196,270 (+$15,371, +8.50% from previous year)
- 2014: $214,798 (+$18,528, +9.44% from previous year)
- 2015: $232,669 (+$17,870, +8.32% from previous year)
- 2016: $250,700 (+$18,032, +7.75% from previous year)
- 2017: $277,428 (+$26,728, +10.66% from previous year)
- 2018: $310,167 (+$32,739, +11.80% from previous year)
- 2019: $342,432 (+$32,265, +10.40% from previous year)
- 2020: $385,067 (+$42,635, +12.45% from previous year)
- 2021: $523,954 (+$138,888, +36.07% from previous year)
- 2022: $615,917 (+$91,962, +17.55% from previous year)
- 2023: $599,738 (−$16,179, −2.63% from previous year)
- 2024: $597,759 (−$1,979, −0.33% from previous year)
- 2025: $596,644 (−$1,115, −0.19% from previous year)
Coeur d’Alene shows steady growth from $198,534 in 2010 to nearly $600,000 by 2025, representing a remarkable 200% increase over 15 years. The most dramatic surge occurred during 2021 when prices jumped 36%, followed by another 17.5% increase in 2022. The market has since stabilized, with slight decreases in recent years bringing current values to $596,644.
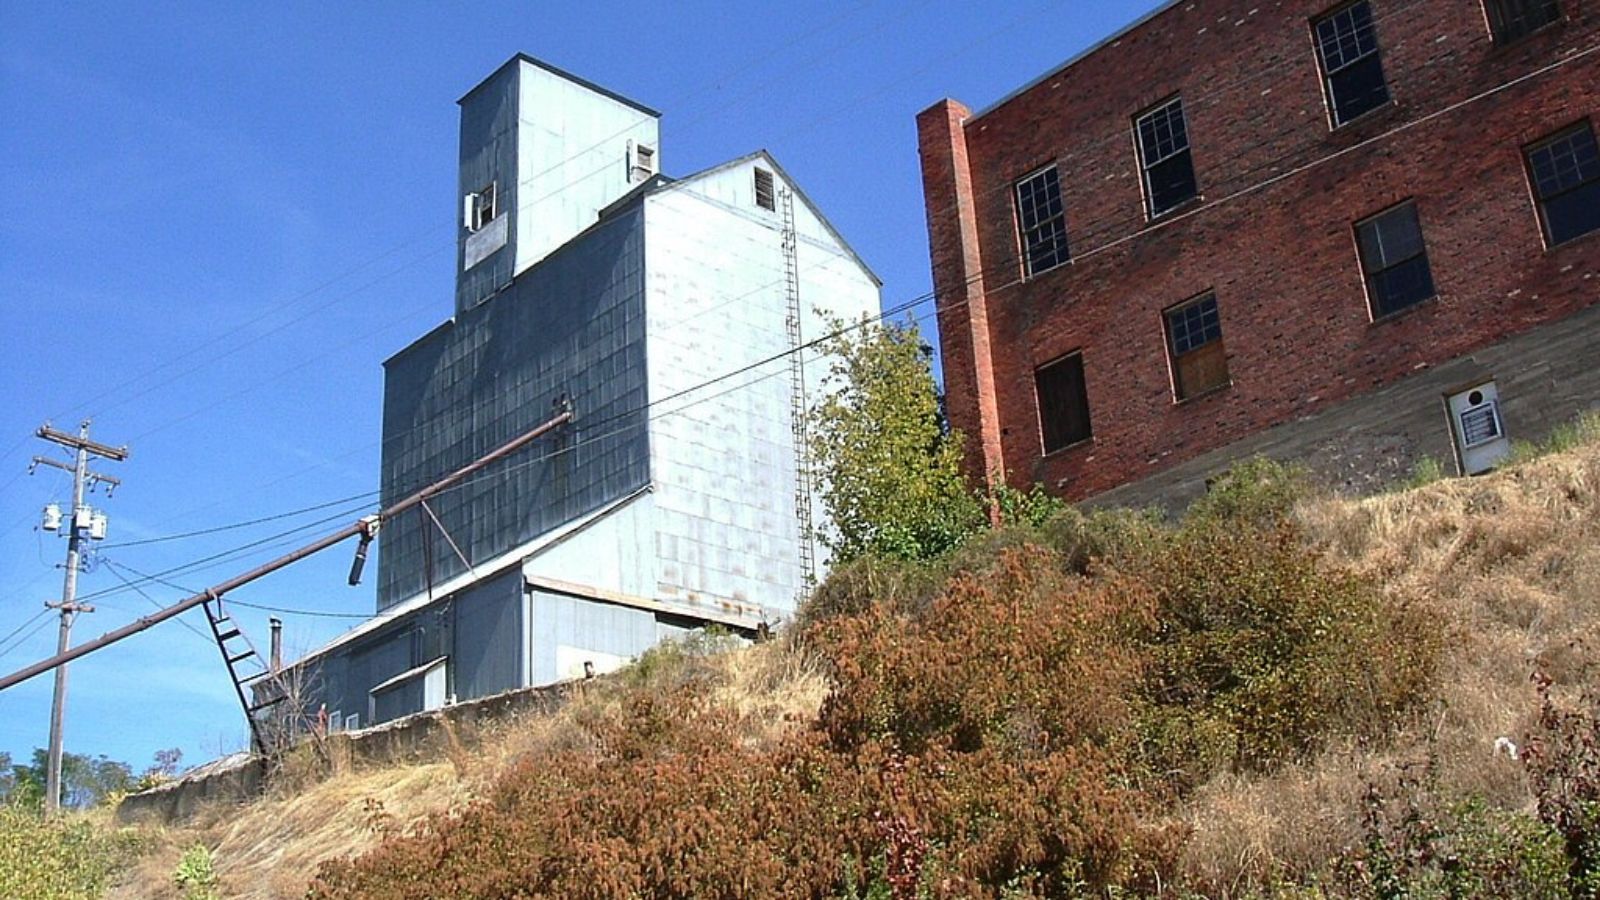
Coeur d’Alene – Lakefront Living Drives Premium Pricing

Located in northern Idaho along the shores of Lake Coeur d’Alene, this resort city has become one of the state’s most desirable destinations. The combination of stunning lake views, recreational opportunities, and proximity to Spokane, Washington has attracted both retirees and remote workers seeking a higher quality of life. The city’s marina, golf courses, and vibrant downtown district add to its appeal as a year-round destination.
The dramatic price increases during 2021-2022 reflect the nationwide trend of people relocating to scenic, smaller cities during the pandemic. Coeur d’Alene’s limited buildable land along the lakeshore creates natural constraints on housing supply, supporting higher property values. The recent price stabilization suggests the market may be finding equilibrium after the extraordinary growth period.
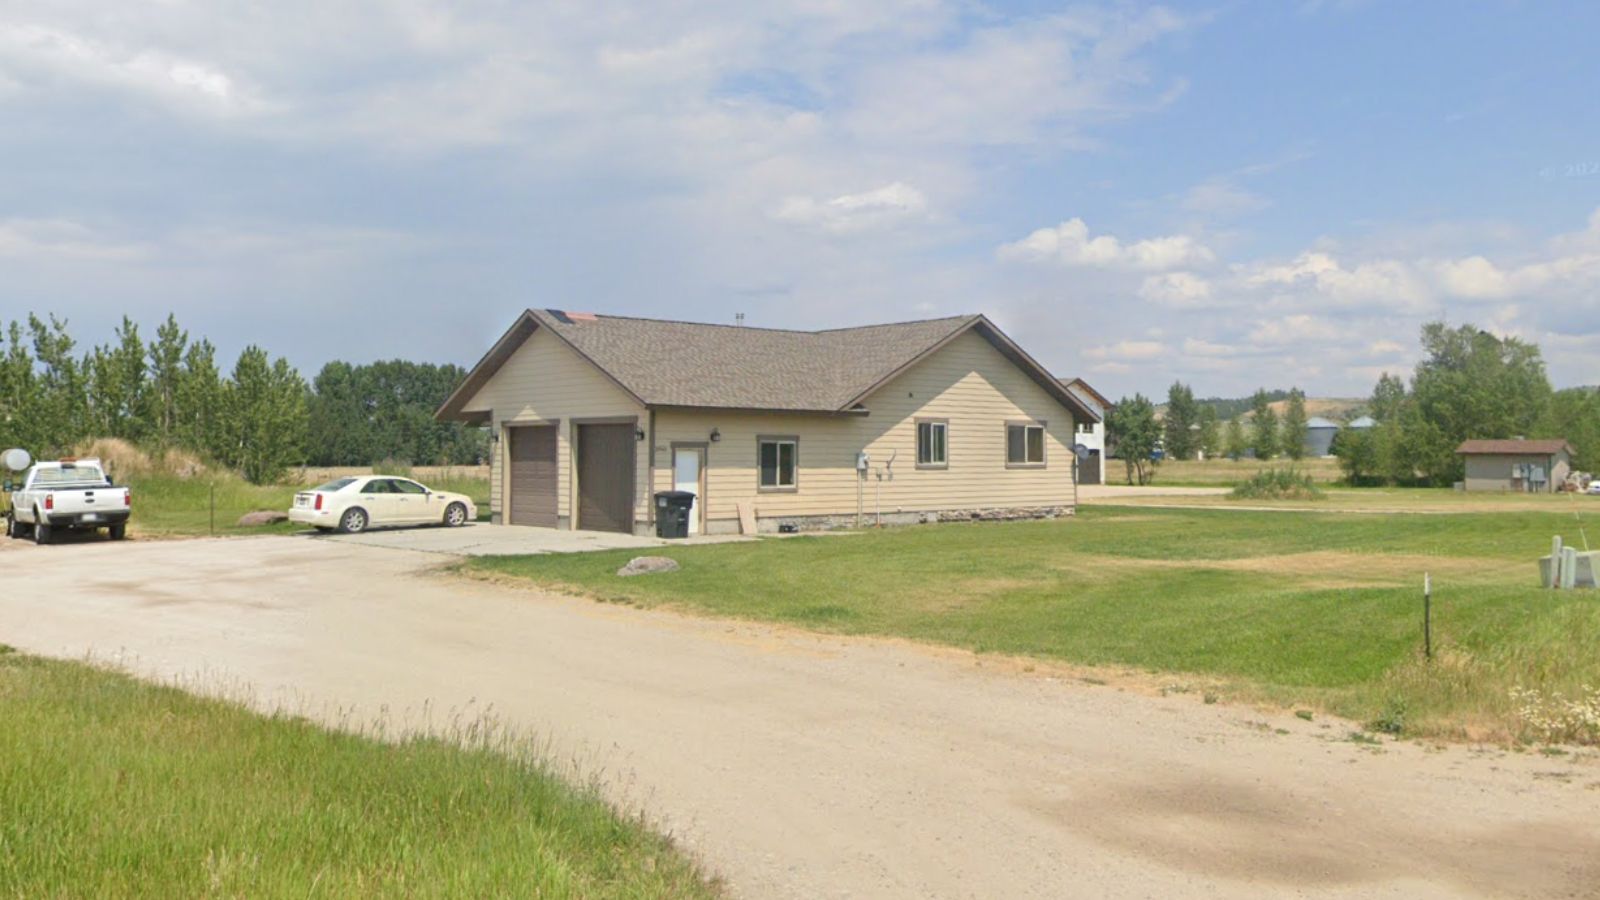
30. Carmen – 195% Home Price Increase Since 2010

- 2010: $206,794
- 2011: $178,735 (−$28,059, −13.57% from previous year)
- 2012: $187,473 (+$8,738, +4.89% from previous year)
- 2013: $191,207 (+$3,734, +1.99% from previous year)
- 2014: $199,029 (+$7,822, +4.09% from previous year)
- 2015: $214,937 (+$15,908, +7.99% from previous year)
- 2016: $229,437 (+$14,499, +6.75% from previous year)
- 2017: $246,042 (+$16,605, +7.24% from previous year)
- 2018: $265,113 (+$19,071, +7.75% from previous year)
- 2019: $291,424 (+$26,311, +9.92% from previous year)
- 2020: $314,899 (+$23,474, +8.06% from previous year)
- 2021: $435,079 (+$120,180, +38.16% from previous year)
- 2022: $547,638 (+$112,559, +25.87% from previous year)
- 2023: $558,927 (+$11,288, +2.06% from previous year)
- 2024: $583,540 (+$24,614, +4.40% from previous year)
- 2025: $609,433 (+$25,893, +4.44% from previous year)
Carmen demonstrates consistent upward momentum from $206,794 in 2010 to $609,433 in 2025, marking a substantial 195% increase. The town experienced explosive growth during the pandemic years, with a 38% jump in 2021 followed by nearly 26% growth in 2022. Unlike many markets that cooled afterward, Carmen has continued posting solid gains of 4-5% annually through 2025.
Carmen – Mountain Community Shows Sustained Growth

Situated in Valley County within the Payette National Forest, Carmen offers residents access to pristine wilderness and outdoor recreation opportunities. This small mountain community benefits from its proximity to popular destinations like McCall and Brundage Mountain ski area, making it attractive to both seasonal residents and outdoor enthusiasts. The area’s natural beauty and recreational access have increasingly drawn buyers seeking mountain lifestyle properties.
The steady price appreciation reflects growing demand for rural mountain properties that accelerated significantly during the pandemic. Carmen’s continued strong performance through 2024-2025, even as many markets cooled, suggests robust underlying demand for properties in this scenic region. The town’s location along the Payette River adds to its appeal for fishing and water sports enthusiasts.
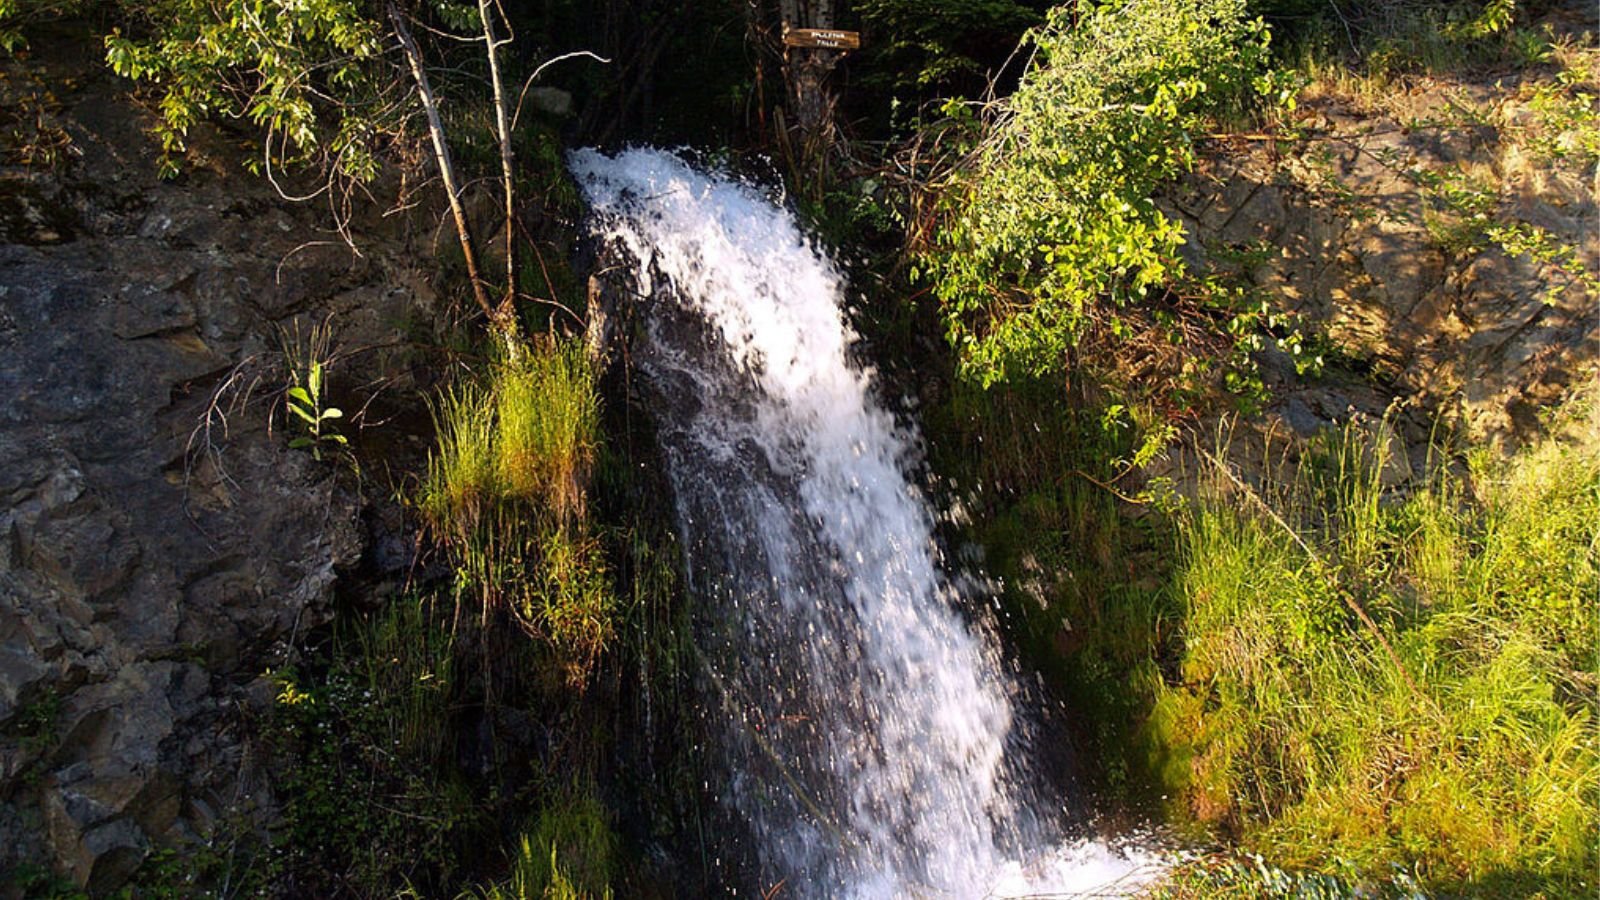
29. New Meadows – 258% Home Price Increase Since 2012

- 2010: N/A
- 2011: N/A
- 2012: $170,238
- 2013: $192,925 (+$22,687, +13.33% from previous year)
- 2014: $207,823 (+$14,898, +7.72% from previous year)
- 2015: $229,365 (+$21,542, +10.37% from previous year)
- 2016: $254,977 (+$25,612, +11.17% from previous year)
- 2017: $278,150 (+$23,172, +9.09% from previous year)
- 2018: $287,832 (+$9,683, +3.48% from previous year)
- 2019: $324,126 (+$36,294, +12.61% from previous year)
- 2020: $371,992 (+$47,866, +14.77% from previous year)
- 2021: $501,097 (+$129,105, +34.71% from previous year)
- 2022: $657,629 (+$156,532, +31.24% from previous year)
- 2023: $580,689 (−$76,940, −11.70% from previous year)
- 2024: $593,139 (+$12,450, +2.14% from previous year)
- 2025: $610,054 (+$16,915, +2.85% from previous year)
New Meadows showcases remarkable growth from $170,238 in 2012 to $610,054 in 2025, representing a 258% increase over 13 years. The community experienced particularly strong acceleration from 2019 onward, culminating in massive gains of 34.7% in 2021 and 31.2% in 2022. After a significant correction in 2023 that brought prices down nearly 12%, the market has resumed modest growth.
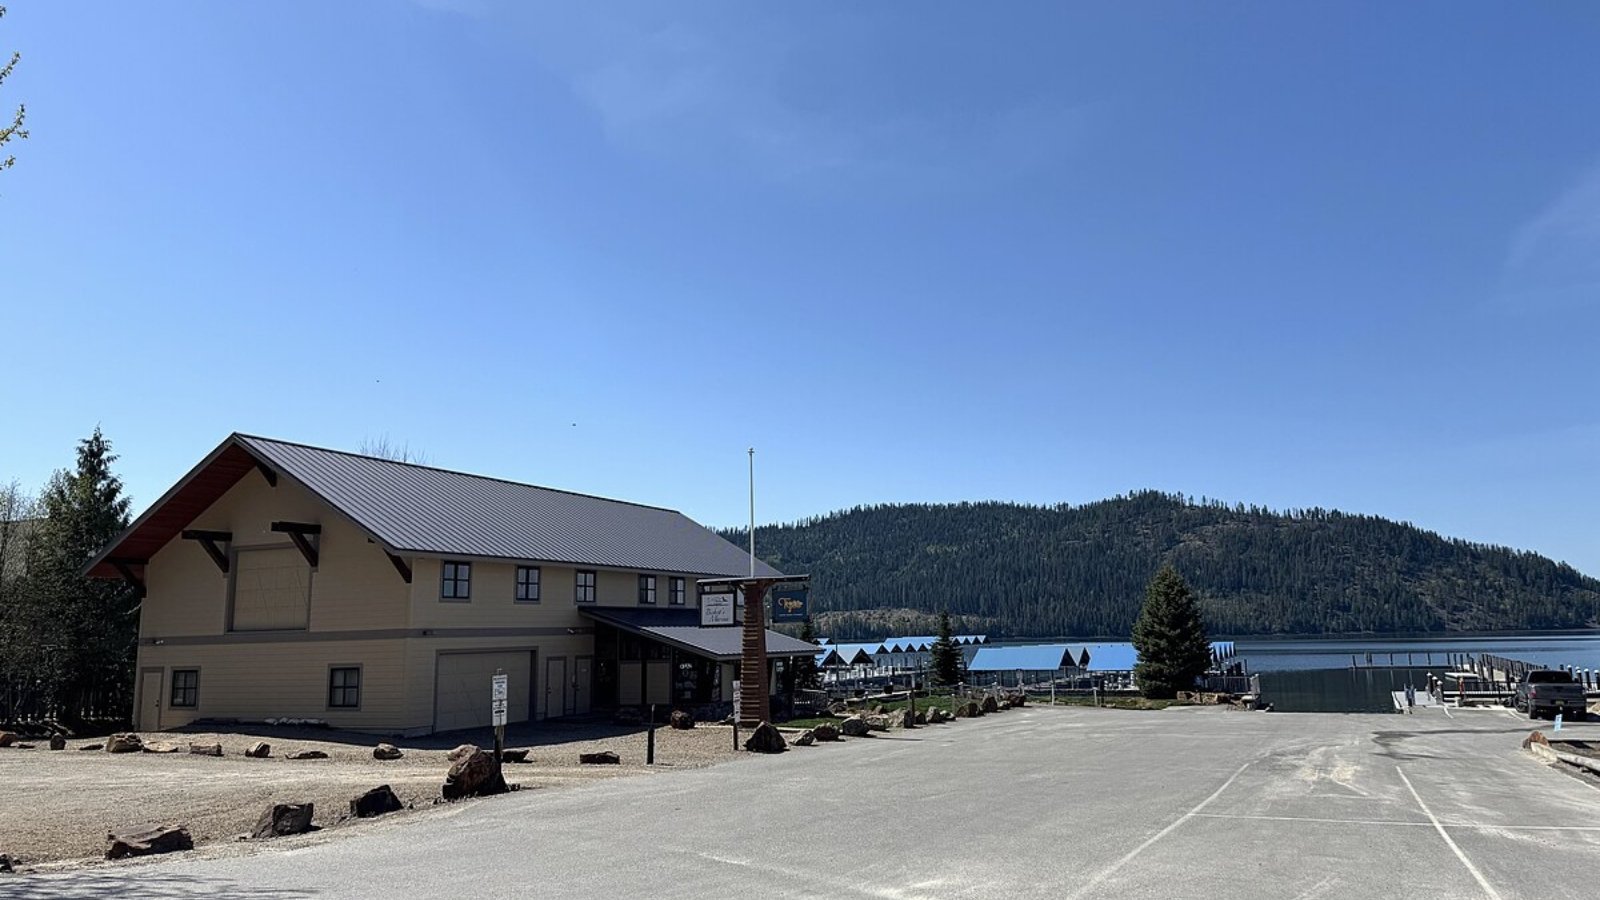
New Meadows – Gateway Location Fuels Demand

Located in Adams County along Highway 95, New Meadows serves as a gateway community to some of Idaho’s most popular recreational destinations. The town sits at the intersection of routes leading to McCall, Riggins, and the Salmon River country, making it strategically positioned for outdoor enthusiasts. Its location provides easier access to urban amenities while maintaining a small-town mountain atmosphere.
The dramatic price surge through 2022 reflects the broader trend of rural communities experiencing unprecedented demand during the pandemic housing boom. New Meadows benefited from buyers seeking more affordable alternatives to resort towns like McCall while still maintaining access to outdoor recreation. The 2023 price correction suggests some normalization after the extreme growth period, though continued gains in 2024-2025 indicate sustained interest in the area.
28. Sandpoint – 173% Home Price Increase Since 2010

- 2010: $227,632
- 2011: $203,232 (−$24,400, −10.72% from previous year)
- 2012: $202,262 (−$970, −0.48% from previous year)
- 2013: $214,325 (+$12,064, +5.96% from previous year)
- 2014: $232,416 (+$18,091, +8.44% from previous year)
- 2015: $247,265 (+$14,849, +6.39% from previous year)
- 2016: $274,251 (+$26,986, +10.91% from previous year)
- 2017: $292,151 (+$17,900, +6.53% from previous year)
- 2018: $316,170 (+$24,019, +8.22% from previous year)
- 2019: $339,551 (+$23,381, +7.40% from previous year)
- 2020: $376,864 (+$37,313, +10.99% from previous year)
- 2021: $525,415 (+$148,551, +39.42% from previous year)
- 2022: $671,130 (+$145,714, +27.73% from previous year)
- 2023: $600,851 (−$70,278, −10.47% from previous year)
- 2024: $610,923 (+$10,072, +1.68% from previous year)
- 2025: $622,781 (+$11,858, +1.94% from previous year)
Sandpoint displays steady appreciation from $227,632 in 2010 to $622,781 in 2025, achieving a 173% increase over 15 years. The town experienced explosive growth during 2021 with a 39% price jump, followed by another 28% gain in 2022. A significant 10.5% correction in 2023 has given way to modest recovery in recent years.
Sandpoint – Lake Pend Oreille’s Premier Destination

Nestled on the shores of Lake Pend Oreille in northern Idaho, Sandpoint combines small-town charm with big-lake recreation opportunities. The city serves as the commercial and cultural hub of Bonner County, offering amenities like the historic Panida Theater, local festivals, and a thriving arts scene. Schweitzer Mountain Resort, located just 11 miles away, provides world-class skiing and year-round mountain activities.
The dramatic price increases during 2021-2022 reflect Sandpoint’s growing reputation as a destination for both seasonal residents and permanent relocations. The combination of lake access, mountain recreation, and small-town amenities created perfect conditions for the pandemic-era housing boom. Lake Pend Oreille’s status as Idaho’s largest lake, offering everything from fishing to sailing, continues to attract buyers willing to pay premium prices for waterfront or water-view properties.
27. Hayden – 198% Home Price Increase Since 2010

- 2010: $212,429
- 2011: $189,153 (−$23,276, −10.96% from previous year)
- 2012: $192,633 (+$3,480, +1.84% from previous year)
- 2013: $211,499 (+$18,866, +9.79% from previous year)
- 2014: $231,067 (+$19,568, +9.25% from previous year)
- 2015: $248,259 (+$17,192, +7.44% from previous year)
- 2016: $267,041 (+$18,782, +7.57% from previous year)
- 2017: $294,321 (+$27,280, +10.22% from previous year)
- 2018: $325,967 (+$31,646, +10.75% from previous year)
- 2019: $355,375 (+$29,407, +9.02% from previous year)
- 2020: $400,076 (+$44,701, +12.58% from previous year)
- 2021: $539,905 (+$139,829, +34.95% from previous year)
- 2022: $627,704 (+$87,799, +16.26% from previous year)
- 2023: $617,717 (−$9,987, −1.59% from previous year)
- 2024: $622,529 (+$4,812, +0.78% from previous year)
- 2025: $632,973 (+$10,444, +1.68% from previous year)
Hayden shows remarkable consistency in its upward trajectory from $212,429 in 2010 to $632,973 in 2025, representing a 198% increase. The community maintained steady growth throughout the 2010s before experiencing a 35% surge in 2021 and continued strong performance in 2022. The market has stabilized in recent years with modest single-digit growth.
Hayden – Suburban Appeal Near Coeur d’Alene

Located just north of Coeur d’Alene in Kootenai County, Hayden offers residents a suburban lifestyle with easy access to both lake recreation and urban amenities. The city has experienced significant residential development over the past decade, attracting families seeking newer homes and planned communities. Hayden Lake, a separate but nearby community, adds to the area’s recreational appeal with additional water access opportunities.
The steady price appreciation reflects Hayden’s role as a growing suburban community that benefits from proximity to Coeur d’Alene while offering more affordable housing options. The 2021 price surge aligns with broader regional trends as the greater Coeur d’Alene area became increasingly popular with relocating residents. Hayden’s planned communities and newer housing stock continue to attract buyers seeking modern amenities in a small-town setting.
26. Melba – 274% Home Price Increase Since 2010

- 2010: $171,120
- 2011: $140,398 (−$30,722, −17.95% from previous year)
- 2012: $148,965 (+$8,567, +6.10% from previous year)
- 2013: $174,466 (+$25,501, +17.12% from previous year)
- 2014: $192,702 (+$18,235, +10.45% from previous year)
- 2015: $212,744 (+$20,043, +10.40% from previous year)
- 2016: $233,239 (+$20,495, +9.63% from previous year)
- 2017: $251,732 (+$18,493, +7.93% from previous year)
- 2018: $291,236 (+$39,504, +15.69% from previous year)
- 2019: $334,345 (+$43,109, +14.80% from previous year)
- 2020: $382,106 (+$47,762, +14.29% from previous year)
- 2021: $569,467 (+$187,360, +49.03% from previous year)
- 2022: $690,097 (+$120,630, +21.18% from previous year)
- 2023: $616,496 (−$73,601, −10.67% from previous year)
- 2024: $633,264 (+$16,769, +2.72% from previous year)
- 2025: $640,200 (+$6,936, +1.10% from previous year)
Melba demonstrates extraordinary growth from $171,120 in 2010 to $640,200 in 2025, achieving a remarkable 274% increase over 15 years. The community maintained strong double-digit growth throughout the late 2010s before experiencing an explosive 49% jump in 2021. After reaching peak values in 2022, the market corrected by nearly 11% in 2023 but has since resumed modest growth.
Melba – Small Town Charm Near Boise Metro

Located in Canyon County approximately 30 miles southwest of Boise, Melba offers rural tranquility within commuting distance of Idaho’s capital city. This small agricultural community has attracted buyers seeking larger properties and lower-density living while maintaining access to urban employment opportunities. The town’s location along the Snake River plain provides fertile farmland and scenic rural landscapes.
The dramatic price increases reflect Melba’s emergence as an affordable alternative for Boise-area workers seeking more space and rural lifestyle. The community’s agricultural heritage and small-town atmosphere became particularly appealing during the pandemic as remote work options expanded. Despite the 2023 correction, current values remain well above historical norms, indicating sustained demand for rural properties in the greater Boise region.
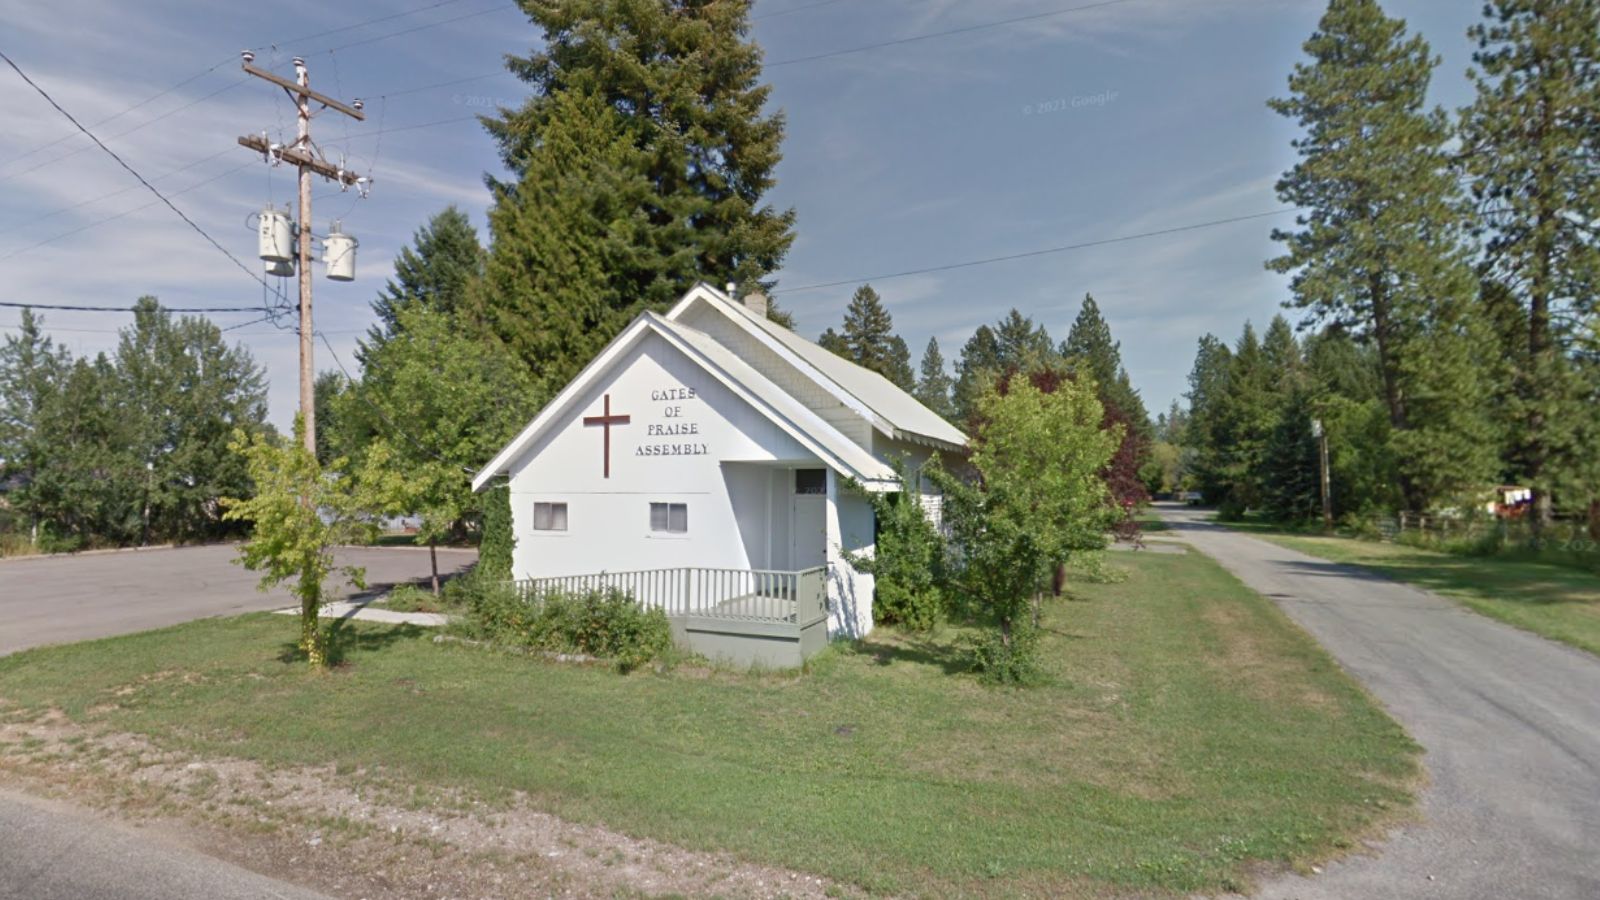
25. Viola – 5% Home Price Increase Since 2022

🔥 Would you like to save this?
- 2010: N/A
- 2011: N/A
- 2012: N/A
- 2013: N/A
- 2014: N/A
- 2015: N/A
- 2016: N/A
- 2017: N/A
- 2018: N/A
- 2019: N/A
- 2020: N/A
- 2021: N/A
- 2022: $611,779
- 2023: $594,414 (−$17,366, −2.84% from previous year)
- 2024: $619,309 (+$24,896, +4.19% from previous year)
- 2025: $642,090 (+$22,781, +3.68% from previous year)
Viola shows limited available data starting from 2022 at $611,779, with current values reaching $642,090 in 2025 for a modest 5% increase over three years. The market experienced a brief dip in 2023 before recovering with solid gains in 2024 and 2025. Despite the short data timeline, the high baseline value suggests this community commands premium pricing.
Viola – Mountain Community With Limited Market Data

Located in Latah County in northern Idaho, Viola represents a small mountain community with limited housing stock and transaction volume. The high median home values despite the rural location suggest properties in this area may include larger acreages or unique characteristics that command premium pricing. The community’s location in the Palouse region provides access to both agricultural lands and forested areas.
The limited data availability indicates a very small housing market with infrequent sales, which can create volatility in median price calculations. The recovery following the 2023 dip and continued growth through 2025 suggests underlying demand remains strong despite the remote location. Properties in this area likely appeal to buyers seeking privacy and extensive land holdings in a scenic mountain setting.
24. Bellevue – 213% Home Price Increase Since 2010

- 2010: $205,819
- 2011: $185,282 (−$20,538, −9.98% from previous year)
- 2012: $183,161 (−$2,121, −1.14% from previous year)
- 2013: $201,604 (+$18,443, +10.07% from previous year)
- 2014: $241,300 (+$39,696, +19.69% from previous year)
- 2015: $260,508 (+$19,208, +7.96% from previous year)
- 2016: $285,028 (+$24,521, +9.41% from previous year)
- 2017: $306,836 (+$21,807, +7.65% from previous year)
- 2018: $338,455 (+$31,619, +10.30% from previous year)
- 2019: $368,347 (+$29,892, +8.83% from previous year)
- 2020: $405,430 (+$37,083, +10.07% from previous year)
- 2021: $538,083 (+$132,653, +32.72% from previous year)
- 2022: $645,151 (+$107,068, +19.90% from previous year)
- 2023: $613,434 (−$31,717, −4.92% from previous year)
- 2024: $625,717 (+$12,283, +2.00% from previous year)
- 2025: $643,398 (+$17,681, +2.83% from previous year)
Bellevue showcases consistent upward momentum from $205,819 in 2010 to $643,398 in 2025, representing a substantial 213% increase over 15 years. The community maintained steady growth throughout the 2010s before experiencing significant acceleration during the pandemic years with gains of 33% in 2021 and 20% in 2022. A modest correction in 2023 has been followed by renewed growth.
Bellevue – Wood River Valley’s Affordable Alternative

Located in Blaine County along the Big Wood River, Bellevue serves as a more affordable option within the prestigious Wood River Valley that includes Sun Valley and Ketchum. The town provides access to world-class skiing, hiking, and outdoor recreation while offering lower housing costs than its famous neighbors. Bellevue’s location along Highway 75 provides easy access to both Sun Valley Resort and the broader recreational opportunities of central Idaho.
The steady price appreciation reflects Bellevue’s role as a bedroom community for workers in the resort economy and as an entry point for buyers seeking Wood River Valley lifestyle at more accessible price points. The significant gains during 2021-2022 mirror the broader trend in resort communities as pandemic-driven demand intensified competition for mountain properties. Despite recent stabilization, current values remain well above historical norms, indicating sustained appeal for this scenic valley location.
23. Fish Haven – 131% Home Price Increase Since 2010

- 2010: $280,573
- 2011: $259,824 (−$20,749, −7.40% from previous year)
- 2012: $261,843 (+$2,019, +0.78% from previous year)
- 2013: $278,233 (+$16,390, +6.26% from previous year)
- 2014: $286,777 (+$8,544, +3.07% from previous year)
- 2015: $298,817 (+$12,039, +4.20% from previous year)
- 2016: $347,537 (+$48,720, +16.30% from previous year)
- 2017: $307,921 (−$39,616, −11.40% from previous year)
- 2018: $333,546 (+$25,625, +8.32% from previous year)
- 2019: $371,260 (+$37,713, +11.31% from previous year)
- 2020: $395,160 (+$23,900, +6.44% from previous year)
- 2021: $551,825 (+$156,665, +39.65% from previous year)
- 2022: $715,850 (+$164,026, +29.72% from previous year)
- 2023: $673,777 (−$42,073, −5.88% from previous year)
- 2024: $660,644 (−$13,133, −1.95% from previous year)
- 2025: $648,514 (−$12,130, −1.84% from previous year)
Fish Haven displays a volatile but ultimately successful trajectory from $280,573 in 2010 to $648,514 in 2025, achieving a 131% increase despite recent declines. The community experienced dramatic growth during 2021-2022 with consecutive years of nearly 40% and 30% gains respectively. However, unlike many markets that stabilized, Fish Haven has continued declining since its 2022 peak.
Fish Haven – Bear Lake’s Seasonal Appeal Shows Cooling

Located on the shores of Bear Lake in southeastern Idaho near the Utah border, Fish Haven serves as a popular destination for seasonal residents and recreational property owners. The community benefits from Bear Lake’s unique turquoise waters and sandy beaches, earning it the nickname “Caribbean of the Rockies.” The area attracts visitors for boating, fishing, and summer recreation activities.
The dramatic price surge during 2021-2022 reflected intense demand for recreational properties as pandemic-era buyers sought vacation homes and remote-friendly locations. However, the continued decline through 2025 suggests this seasonal market may be experiencing a correction as interest rates rose and recreational property demand normalized. The ongoing price decreases indicate Fish Haven may be more sensitive to broader economic conditions than year-round residential communities.
22. Cocolalla – 185% Home Price Increase Since 2010

- 2010: $236,674
- 2011: $214,346 (−$22,328, −9.43% from previous year)
- 2012: $211,697 (−$2,649, −1.24% from previous year)
- 2013: $218,476 (+$6,779, +3.20% from previous year)
- 2014: $242,997 (+$24,521, +11.22% from previous year)
- 2015: $261,791 (+$18,794, +7.73% from previous year)
- 2016: $279,354 (+$17,564, +6.71% from previous year)
- 2017: $296,761 (+$17,406, +6.23% from previous year)
- 2018: $323,193 (+$26,432, +8.91% from previous year)
- 2019: $364,304 (+$41,111, +12.72% from previous year)
- 2020: $400,396 (+$36,092, +9.91% from previous year)
- 2021: $565,979 (+$165,583, +41.35% from previous year)
- 2022: $715,291 (+$149,312, +26.38% from previous year)
- 2023: $635,059 (−$80,232, −11.22% from previous year)
- 2024: $647,184 (+$12,125, +1.91% from previous year)
- 2025: $674,247 (+$27,063, +4.18% from previous year)
Cocolalla demonstrates strong appreciation from $236,674 in 2010 to $674,247 in 2025, representing an impressive 185% increase over 15 years. The community maintained steady single-digit growth through most of the 2010s before accelerating significantly during the pandemic years with a 41% surge in 2021 and 26% gain in 2022. After a notable correction in 2023, the market has resumed positive growth.
Cocolalla – Lakefront Community Rebounds From Correction

Located in Bonner County near Lake Pend Oreille, Cocolalla offers residents access to one of Idaho’s premier recreational lakes while maintaining a rural, residential character. The community benefits from its proximity to both Sandpoint and Coeur d’Alene, providing access to urban amenities while preserving a quieter lakeside lifestyle. The area’s natural beauty and water access make it particularly attractive to retirees and second-home buyers.
The dramatic growth during 2021-2022 reflects the broader trend of lakefront communities experiencing unprecedented demand during the pandemic housing boom. The significant 11% correction in 2023 suggests some normalization after the extreme growth period, but renewed gains in 2024-2025 indicate underlying demand remains strong. Cocolalla’s combination of lake access and relative affordability compared to premium lakefront areas continues to attract buyers seeking waterfront lifestyle opportunities.
21. Sweet – 97% Home Price Increase Since 2019

- 2010: N/A
- 2011: N/A
- 2012: N/A
- 2013: N/A
- 2014: N/A
- 2015: N/A
- 2016: N/A
- 2017: N/A
- 2018: N/A
- 2019: $342,571
- 2020: $398,259 (+$55,688, +16.26% from previous year)
- 2021: $592,743 (+$194,484, +48.83% from previous year)
- 2022: $719,608 (+$126,864, +21.40% from previous year)
- 2023: $637,458 (−$82,150, −11.42% from previous year)
- 2024: $646,492 (+$9,034, +1.42% from previous year)
- 2025: $675,610 (+$29,118, +4.50% from previous year)
Sweet shows explosive growth from its first recorded value of $342,571 in 2019 to $675,610 in 2025, representing a remarkable 97% increase in just six years. The community experienced extraordinary gains during the pandemic years, including a massive 49% jump in 2021 followed by another 21% increase in 2022. After a significant correction in 2023, the market has resumed upward momentum with accelerating growth through 2025.
Sweet – Rural Community Shows Dramatic Pandemic-Era Growth

Located in Gem County in southwestern Idaho, Sweet represents a small rural community that experienced dramatic transformation during the pandemic housing boom. The area’s agricultural character and rural setting became increasingly attractive to buyers seeking more space and lower-density living. Sweet’s location provides access to outdoor recreation opportunities while maintaining the rural Idaho lifestyle many buyers sought during the pandemic.
The extraordinary price increases from 2019-2022 reflect the intense demand for rural properties as remote work expanded housing options for many buyers. The 49% gain in 2021 represents one of the most dramatic single-year increases seen across Idaho communities. While the 2023 correction brought some normalization, renewed growth in 2024-2025 suggests continued interest in rural properties, though at more sustainable rates than the initial pandemic surge.
20. Nordman – 104% Home Price Increase Since 2017

- 2010: N/A
- 2011: N/A
- 2012: N/A
- 2013: N/A
- 2014: N/A
- 2015: N/A
- 2016: N/A
- 2017: $332,833
- 2018: $357,495 (+$24,662, +7.41% from previous year)
- 2019: $381,484 (+$23,989, +6.71% from previous year)
- 2020: $418,144 (+$36,660, +9.61% from previous year)
- 2021: $585,275 (+$167,131, +39.97% from previous year)
- 2022: $730,305 (+$145,030, +24.78% from previous year)
- 2023: $664,385 (−$65,920, −9.03% from previous year)
- 2024: $680,533 (+$16,149, +2.43% from previous year)
- 2025: $678,256 (−$2,277, −0.33% from previous year)
Nordman demonstrates strong growth from $332,833 in 2017 to $678,256 in 2025, achieving a 104% increase over eight years. The community maintained steady single-digit growth through 2020 before experiencing dramatic acceleration with a 40% surge in 2021 and 25% gain in 2022. After peaking in 2022, the market has shown some volatility with correction and modest recovery.
Nordman – Remote Location Commands Premium Pricing

Located in Bonner County in the far northern reaches of Idaho near the Canadian border, Nordman offers buyers an extremely remote and pristine mountain setting. The community provides access to the Selkirk Mountains and Priest Lake area, making it attractive to buyers seeking ultimate privacy and wilderness access. The area’s natural beauty and recreational opportunities appeal to outdoor enthusiasts and those seeking escape from urban environments.
The dramatic price increases during 2021-2022 reflect the pandemic-era trend of buyers seeking remote properties with extensive privacy and natural settings. Nordman’s extreme rural location, which once limited its appeal, became a selling point for buyers seeking isolation and self-sufficiency. The recent price stabilization and slight decline suggest this remote market may be sensitive to broader economic conditions, though values remain well above pre-pandemic levels.
19. Donnelly – 241% Home Price Increase Since 2010

🔥 Would you like to save this?
- 2010: $198,941
- 2011: $180,410 (−$18,531, −9.31% from previous year)
- 2012: $183,474 (+$3,064, +1.70% from previous year)
- 2013: $192,000 (+$8,526, +4.65% from previous year)
- 2014: $219,180 (+$27,180, +14.16% from previous year)
- 2015: $247,193 (+$28,014, +12.78% from previous year)
- 2016: $264,981 (+$17,788, +7.20% from previous year)
- 2017: $283,302 (+$18,320, +6.91% from previous year)
- 2018: $300,761 (+$17,460, +6.16% from previous year)
- 2019: $325,776 (+$25,014, +8.32% from previous year)
- 2020: $381,038 (+$55,262, +16.96% from previous year)
- 2021: $563,721 (+$182,683, +47.94% from previous year)
- 2022: $768,275 (+$204,554, +36.29% from previous year)
- 2023: $669,830 (−$98,445, −12.81% from previous year)
- 2024: $663,624 (−$6,205, −0.93% from previous year)
- 2025: $678,584 (+$14,960, +2.25% from previous year)
Donnelly showcases remarkable transformation from $198,941 in 2010 to $678,584 in 2025, representing an exceptional 241% increase over 15 years. The community maintained steady growth through the 2010s before experiencing explosive gains during the pandemic years with a 48% jump in 2021 and 36% increase in 2022. A significant correction in 2023 has been followed by stabilization and modest recovery.
Donnelly – McCall’s Neighbor Benefits From Resort Proximity

Located in Valley County adjacent to the popular resort town of McCall, Donnelly offers buyers access to recreation and amenities while providing more affordable housing options than its famous neighbor. The community sits along Payette Lake and provides direct access to skiing at Brundage Mountain, year-round outdoor recreation, and the vibrant McCall social scene. Donnelly’s location makes it an attractive alternative for those seeking mountain lifestyle at more accessible price points.
The extraordinary price appreciation reflects Donnelly’s emergence as a bedroom community for McCall-area recreation and employment. The massive gains during 2021-2022 mirror trends seen throughout mountain resort regions as pandemic-driven demand intensified competition for mountain properties. Despite recent corrections bringing values down from peak levels, current prices remain well above historical norms, indicating sustained demand for properties in the greater McCall area.
18. Felt – 85% Home Price Increase Since 2019

- 2010: N/A
- 2011: N/A
- 2012: N/A
- 2013: N/A
- 2014: N/A
- 2015: N/A
- 2016: N/A
- 2017: N/A
- 2018: N/A
- 2019: $384,870
- 2020: $417,934 (+$33,063, +8.59% from previous year)
- 2021: $588,922 (+$170,988, +40.91% from previous year)
- 2022: $743,237 (+$154,315, +26.20% from previous year)
- 2023: $696,285 (−$46,951, −6.32% from previous year)
- 2024: $701,247 (+$4,961, +0.71% from previous year)
- 2025: $712,765 (+$11,519, +1.64% from previous year)
Felt demonstrates strong growth from $384,870 in 2019 to $712,765 in 2025, achieving an 85% increase over six years. The community experienced dramatic acceleration during the pandemic years with a 41% surge in 2021 and 26% gain in 2022. After a modest correction in 2023, the market has stabilized with gradual recovery through 2025.
Felt – Mountain Community Shows Steady Recovery
Located in Teton County near the Wyoming border, Felt represents a small mountain community that benefits from proximity to world-class recreational opportunities in both Idaho and Wyoming. The area provides access to Grand Teton National Park, Jackson Hole skiing, and the Greater Yellowstone ecosystem while offering more affordable housing than resort communities just across the state line. Felt’s location appeals to outdoor enthusiasts seeking mountain lifestyle with reasonable access to employment centers.
The significant price increases during 2021-2022 reflect the broader trend of mountain communities experiencing unprecedented demand as pandemic-era buyers sought recreational properties and remote-friendly locations. Felt’s position near the Wyoming border allowed it to capture spillover demand from the extremely expensive Jackson Hole market. The market’s stability since 2023, with modest but consistent growth, suggests underlying demand remains solid for this mountain location.
17. Laclede – 117% Home Price Increase Since 2017

- 2010: N/A
- 2011: N/A
- 2012: N/A
- 2013: N/A
- 2014: N/A
- 2015: N/A
- 2016: N/A
- 2017: $331,274
- 2018: $363,599 (+$32,324, +9.76% from previous year)
- 2019: $385,291 (+$21,692, +5.97% from previous year)
- 2020: $424,703 (+$39,412, +10.23% from previous year)
- 2021: $601,478 (+$176,775, +41.62% from previous year)
- 2022: $720,934 (+$119,456, +19.86% from previous year)
- 2023: $650,040 (−$70,894, −9.83% from previous year)
- 2024: $709,105 (+$59,066, +9.09% from previous year)
- 2025: $717,401 (+$8,295, +1.17% from previous year)
Laclede shows impressive growth from $331,274 in 2017 to $717,401 in 2025, representing a solid 117% increase over eight years. The community maintained steady single-digit growth through 2020 before experiencing dramatic acceleration with a 42% surge in 2021 and 20% gain in 2022. After a notable correction in 2023, the market rebounded strongly in 2024 before moderating in 2025.
Laclede – Small Community Shows Strong Market Recovery

Located in Bonner County in northern Idaho, Laclede represents a small rural community that has experienced significant transformation over recent years. The area’s natural setting and access to outdoor recreation opportunities have made it increasingly attractive to buyers seeking rural properties with mountain access. Laclede’s location provides privacy and natural beauty while maintaining reasonable access to larger communities in the region.
The dramatic price increases during 2021-2022 reflect the pandemic-era trend of rural communities experiencing unprecedented demand as buyers sought more space and natural settings. The strong recovery in 2024 following the 2023 correction suggests underlying demand remains robust for rural mountain properties. Laclede’s continued appeal appears to stem from its combination of natural beauty, privacy, and relative affordability compared to more developed mountain communities.
16. Hope – 152% Home Price Increase Since 2010

- 2010: $292,010
- 2011: $268,296 (−$23,714, −8.12% from previous year)
- 2012: $282,573 (+$14,276, +5.32% from previous year)
- 2013: $300,099 (+$17,527, +6.20% from previous year)
- 2014: $315,972 (+$15,873, +5.29% from previous year)
- 2015: $336,848 (+$20,876, +6.61% from previous year)
- 2016: $365,924 (+$29,076, +8.63% from previous year)
- 2017: $387,938 (+$22,014, +6.02% from previous year)
- 2018: $412,472 (+$24,534, +6.32% from previous year)
- 2019: $432,951 (+$20,479, +4.96% from previous year)
- 2020: $466,563 (+$33,612, +7.76% from previous year)
- 2021: $664,703 (+$198,140, +42.47% from previous year)
- 2022: $805,376 (+$140,673, +21.16% from previous year)
- 2023: $733,689 (−$71,688, −8.90% from previous year)
- 2024: $750,032 (+$16,343, +2.23% from previous year)
- 2025: $735,710 (−$14,322, −1.91% from previous year)
Hope demonstrates solid appreciation from $292,010 in 2010 to $735,710 in 2025, representing a 152% increase over 15 years. The community maintained consistent single-digit growth throughout the 2010s before experiencing dramatic acceleration with a 42% surge in 2021 and 21% gain in 2022. After reaching peak values in 2022, the market has shown some volatility with corrections in both 2023 and 2025.
Hope – Lake Pend Oreille Community Shows Market Volatility
Located in Bonner County along the shores of Lake Pend Oreille, Hope offers residents direct access to one of Idaho’s most scenic and recreational lakes. The small community provides a quieter alternative to nearby Sandpoint while maintaining access to the same lake recreation opportunities. Hope’s lakefront location and mountain views make it particularly attractive to buyers seeking waterfront properties and outdoor recreation access.
The dramatic price increases during 2021-2022 reflect the intense demand for lakefront properties during the pandemic housing boom. Hope’s combination of water access and relative seclusion became particularly appealing to buyers seeking retreat-style properties. The recent market volatility, including the 2025 decline, suggests this smaller lakefront community may be more sensitive to broader economic conditions than larger population centers, though values remain well above historical levels.
15. Athol – 295% Home Price Increase Since 2010

- 2010: $196,262
- 2011: $175,640 (−$20,621, −10.51% from previous year)
- 2012: $184,483 (+$8,843, +5.03% from previous year)
- 2013: $206,243 (+$21,759, +11.79% from previous year)
- 2014: $231,800 (+$25,558, +12.39% from previous year)
- 2015: $255,040 (+$23,240, +10.03% from previous year)
- 2016: $281,144 (+$26,104, +10.24% from previous year)
- 2017: $308,109 (+$26,965, +9.59% from previous year)
- 2018: $342,252 (+$34,143, +11.08% from previous year)
- 2019: $386,740 (+$44,488, +13.00% from previous year)
- 2020: $441,752 (+$55,012, +14.22% from previous year)
- 2021: $622,981 (+$181,229, +41.02% from previous year)
- 2022: $767,503 (+$144,522, +23.20% from previous year)
- 2023: $747,893 (−$19,610, −2.55% from previous year)
- 2024: $761,469 (+$13,576, +1.82% from previous year)
- 2025: $774,459 (+$12,990, +1.71% from previous year)
Athol showcases exceptional growth from $196,262 in 2010 to $774,459 in 2025, achieving a remarkable 295% increase over 15 years. The community maintained strong double-digit growth throughout most of the 2010s, accelerating to 14% annually by 2020 before experiencing explosive gains of 41% in 2021 and 23% in 2022. Unlike many markets that corrected significantly, Athol has shown remarkable stability since 2023.
Athol – Sustained Growth in North Idaho
🔥 Would you like to save this?
Located in Kootenai County between Coeur d’Alene and Sandpoint, Athol occupies a strategic position in northern Idaho’s lake country. The community provides access to both Lake Coeur d’Alene and Lake Pend Oreille recreation while offering more affordable housing than waterfront communities. Athol’s location along Highway 95 provides convenient access to employment centers while maintaining a rural, small-town character.
The consistent strong performance throughout the data period reflects Athol’s appeal as a residential community for northern Idaho’s growing population. The community’s ability to maintain double-digit growth even before the pandemic suggests strong underlying demand fundamentals. The market’s stability since 2022, with continued modest growth rather than correction, indicates Athol may represent a more balanced market compared to resort or seasonal communities that experienced more volatile swings.
14. McCall – 209% Home Price Increase Since 2010

- 2010: $250,850
- 2011: $216,488 (−$34,362, −13.70% from previous year)
- 2012: $216,264 (−$224, −0.10% from previous year)
- 2013: $220,795 (+$4,531, +2.10% from previous year)
- 2014: $256,865 (+$36,070, +16.34% from previous year)
- 2015: $279,605 (+$22,740, +8.85% from previous year)
- 2016: $306,225 (+$26,621, +9.52% from previous year)
- 2017: $331,344 (+$25,119, +8.20% from previous year)
- 2018: $360,374 (+$29,030, +8.76% from previous year)
- 2019: $401,190 (+$40,816, +11.33% from previous year)
- 2020: $447,830 (+$46,640, +11.63% from previous year)
- 2021: $638,914 (+$191,084, +42.67% from previous year)
- 2022: $868,952 (+$230,038, +36.00% from previous year)
- 2023: $741,951 (−$127,001, −14.62% from previous year)
- 2024: $759,869 (+$17,918, +2.42% from previous year)
- 2025: $776,155 (+$16,285, +2.14% from previous year)
McCall demonstrates impressive transformation from $250,850 in 2010 to $776,155 in 2025, representing a substantial 209% increase over 15 years. The renowned resort town maintained consistent growth throughout the 2010s before experiencing extraordinary acceleration with a 43% surge in 2021 and 36% gain in 2022. A significant correction in 2023 brought prices down nearly 15%, followed by steady recovery.
McCall – Idaho’s Premier Mountain Resort Shows Recovery

Located in Valley County on the shores of Payette Lake, McCall stands as one of Idaho’s most prestigious mountain resort communities. The town offers year-round recreation including skiing at nearby Brundage Mountain, lake activities, hiking, and mountain biking. McCall’s combination of natural beauty, recreational amenities, and resort-town atmosphere has made it a premier destination for both seasonal residents and vacation home buyers throughout the region.
The dramatic price increases during 2021-2022 reflect McCall’s status as a top-tier resort market that experienced intense demand during the pandemic housing boom. The 43% increase in 2021 represents one of the largest single-year gains among Idaho’s premium communities. While the 2023 correction was significant, bringing values down from peak levels, the steady recovery through 2024-2025 demonstrates the underlying strength of demand for properties in this premier mountain location.
13. Dover – 141% Home Price Increase Since 2010

- 2010: $322,003
- 2011: $302,764 (−$19,239, −5.97% from previous year)
- 2012: $302,129 (−$635, −0.21% from previous year)
- 2013: $316,011 (+$13,883, +4.59% from previous year)
- 2014: $342,208 (+$26,197, +8.29% from previous year)
- 2015: $350,246 (+$8,037, +2.35% from previous year)
- 2016: $368,396 (+$18,150, +5.18% from previous year)
- 2017: $390,479 (+$22,083, +5.99% from previous year)
- 2018: $405,716 (+$15,237, +3.90% from previous year)
- 2019: $425,662 (+$19,946, +4.92% from previous year)
- 2020: $461,022 (+$35,360, +8.31% from previous year)
- 2021: $625,697 (+$164,675, +35.72% from previous year)
- 2022: $785,645 (+$159,947, +25.56% from previous year)
- 2023: $739,861 (−$45,784, −5.83% from previous year)
- 2024: $775,486 (+$35,625, +4.82% from previous year)
- 2025: $776,581 (+$1,095, +0.14% from previous year)
Dover shows steady appreciation from $322,003 in 2010 to $776,581 in 2025, achieving a solid 141% increase over 15 years. The community maintained modest single-digit growth through most of the 2010s before experiencing significant acceleration with a 36% surge in 2021 and 26% gain in 2022. After a modest correction in 2023, the market has largely stabilized with minimal growth in 2025.
Dover – Northern Idaho Community Stabilizes After Pandemic Surge

Located in Bonner County in northern Idaho, Dover represents a small community that has benefited from the broader growth trends affecting the region’s lake country. The area provides access to outdoor recreation opportunities while maintaining a rural character that appeals to buyers seeking privacy and natural settings. Dover’s location offers proximity to both Sandpoint and the broader Lake Pend Oreille region.
The significant price increases during 2021-2022 reflect the pandemic-era trend of rural communities experiencing unprecedented demand as buyers sought properties with more space and natural amenities. Dover’s relatively modest correction in 2023 compared to some markets, followed by stability in 2024-2025, suggests the community may have found a sustainable price level. The current values represent a dramatic shift from the historically modest housing costs typical of rural Idaho communities.
12. Sagle – 193% Home Price Increase Since 2010

- 2010: $265,434
- 2011: $251,413 (−$14,021, −5.28% from previous year)
- 2012: $254,384 (+$2,971, +1.18% from previous year)
- 2013: $271,771 (+$17,386, +6.83% from previous year)
- 2014: $298,827 (+$27,056, +9.96% from previous year)
- 2015: $311,842 (+$13,015, +4.36% from previous year)
- 2016: $331,020 (+$19,178, +6.15% from previous year)
- 2017: $357,487 (+$26,467, +8.00% from previous year)
- 2018: $385,047 (+$27,560, +7.71% from previous year)
- 2019: $415,155 (+$30,108, +7.82% from previous year)
- 2020: $461,793 (+$46,637, +11.23% from previous year)
- 2021: $661,111 (+$199,318, +43.16% from previous year)
- 2022: $842,653 (+$181,542, +27.46% from previous year)
- 2023: $740,737 (−$101,916, −12.09% from previous year)
- 2024: $777,004 (+$36,267, +4.90% from previous year)
- 2025: $778,520 (+$1,516, +0.20% from previous year)
Sagle demonstrates strong growth from $265,434 in 2010 to $778,520 in 2025, representing an impressive 193% increase over 15 years. The community maintained consistent single-digit growth throughout most of the 2010s before experiencing dramatic acceleration with a 43% surge in 2021 and 27% gain in 2022. After a significant 12% correction in 2023, the market has stabilized with modest recovery.
Sagle – Lake Pend Oreille Access Drives Long-Term Growth
Located in Bonner County along the southern shores of Lake Pend Oreille, Sagle offers residents direct access to one of the West’s premier recreational lakes while maintaining a more residential character than resort communities. The area provides excellent fishing, boating, and water sports opportunities, making it particularly attractive to outdoor enthusiasts and retirees. Sagle’s location offers privacy and natural beauty while remaining accessible to Sandpoint and regional amenities.
The consistent appreciation throughout the data period reflects Sagle’s appeal as a lakefront residential community rather than a seasonal resort market. The dramatic gains during 2021-2022 mirror trends seen throughout northern Idaho’s lake communities as pandemic-driven demand intensified competition for waterfront properties. The market’s stabilization since 2023, with minimal growth in 2025, suggests prices may have reached a sustainable level for this residential lakefront community.
11. Driggs – 297% Home Price Increase Since 2011

- 2010: N/A
- 2011: $196,775
- 2012: $209,250 (+$12,474, +6.34% from previous year)
- 2013: $235,998 (+$26,748, +12.78% from previous year)
- 2014: $264,779 (+$28,781, +12.20% from previous year)
- 2015: $294,307 (+$29,529, +11.15% from previous year)
- 2016: $335,845 (+$41,538, +14.11% from previous year)
- 2017: $389,547 (+$53,702, +15.99% from previous year)
- 2018: $427,718 (+$38,171, +9.80% from previous year)
- 2019: $415,301 (−$12,417, −2.90% from previous year)
- 2020: $441,343 (+$26,042, +6.27% from previous year)
- 2021: $614,428 (+$173,086, +39.22% from previous year)
- 2022: $795,497 (+$181,069, +29.47% from previous year)
- 2023: $751,303 (−$44,194, −5.56% from previous year)
- 2024: $777,064 (+$25,762, +3.43% from previous year)
- 2025: $781,920 (+$4,855, +0.62% from previous year)
Driggs showcases extraordinary growth from $196,775 in 2011 to $781,920 in 2025, achieving a remarkable 297% increase over 14 years. The community maintained strong double-digit growth through most of the 2010s before experiencing explosive gains of 39% in 2021 and 29% in 2022. After a modest correction in 2023, the market has shown steady but slowing recovery through 2025.
Driggs – Teton Valley’s Gateway to Jackson Hole

Located in Teton County on the western slope of the Teton Range, Driggs serves as the commercial center of Idaho’s Teton Valley and offers more affordable access to world-class recreation than neighboring Jackson Hole, Wyoming. The town provides stunning mountain views, direct access to Grand Targhee Resort, and serves as a bedroom community for workers in the Jackson Hole area. Driggs has evolved from a small farming community into a recreational destination while maintaining its small-town character.
The consistent strong performance throughout the data period reflects Driggs’ strategic position as an affordable alternative to the extremely expensive Jackson Hole market just over Teton Pass. The dramatic gains during 2021-2022 intensified as pandemic-era buyers sought mountain properties with resort access at more reasonable prices. Despite recent stabilization, Driggs continues to benefit from its proximity to world-class skiing and outdoor recreation while offering significantly lower housing costs than comparable Wyoming resort communities.
10. Eagle – 185% Home Price Increase Since 2010

- 2010: $285,238
- 2011: $259,516 (−$25,723, −9.02% from previous year)
- 2012: $272,160 (+$12,645, +4.87% from previous year)
- 2013: $308,562 (+$36,402, +13.38% from previous year)
- 2014: $331,420 (+$22,858, +7.41% from previous year)
- 2015: $339,019 (+$7,599, +2.29% from previous year)
- 2016: $361,197 (+$22,178, +6.54% from previous year)
- 2017: $388,503 (+$27,306, +7.56% from previous year)
- 2018: $425,141 (+$36,638, +9.43% from previous year)
- 2019: $470,898 (+$45,757, +10.76% from previous year)
- 2020: $520,711 (+$49,813, +10.58% from previous year)
- 2021: $778,747 (+$258,036, +49.55% from previous year)
- 2022: $894,020 (+$115,273, +14.80% from previous year)
- 2023: $769,732 (−$124,288, −13.90% from previous year)
- 2024: $802,768 (+$33,036, +4.29% from previous year)
- 2025: $813,705 (+$10,937, +1.36% from previous year)
Eagle demonstrates strong appreciation from $285,238 in 2010 to $813,705 in 2025, representing a solid 185% increase over 15 years. The community maintained consistent growth throughout the 2010s, accelerating to double-digit annual gains by 2019 before experiencing an extraordinary 50% surge in 2021. After a significant correction in 2023, the market has resumed steady upward momentum.
Eagle – Boise Suburb Commands Premium Pricing

Located in Ada County just northwest of Boise, Eagle has established itself as one of Idaho’s most prestigious suburban communities. The city offers upscale neighborhoods, excellent schools, and golf course communities while maintaining easy access to downtown Boise employment centers. Eagle’s combination of newer developments, higher-end amenities, and proximity to outdoor recreation in the Boise Foothills has made it a preferred destination for affluent families and professionals.
The remarkable 50% price increase in 2021 reflects Eagle’s position as a premium suburb that attracted intense buyer interest during the pandemic housing boom. The community’s reputation for quality schools and upscale amenities made it particularly attractive to relocating families and remote workers. Despite the 2023 correction bringing some normalization, Eagle’s values remain well above historical levels, reflecting its established status as one of the Boise area’s most desirable residential communities.
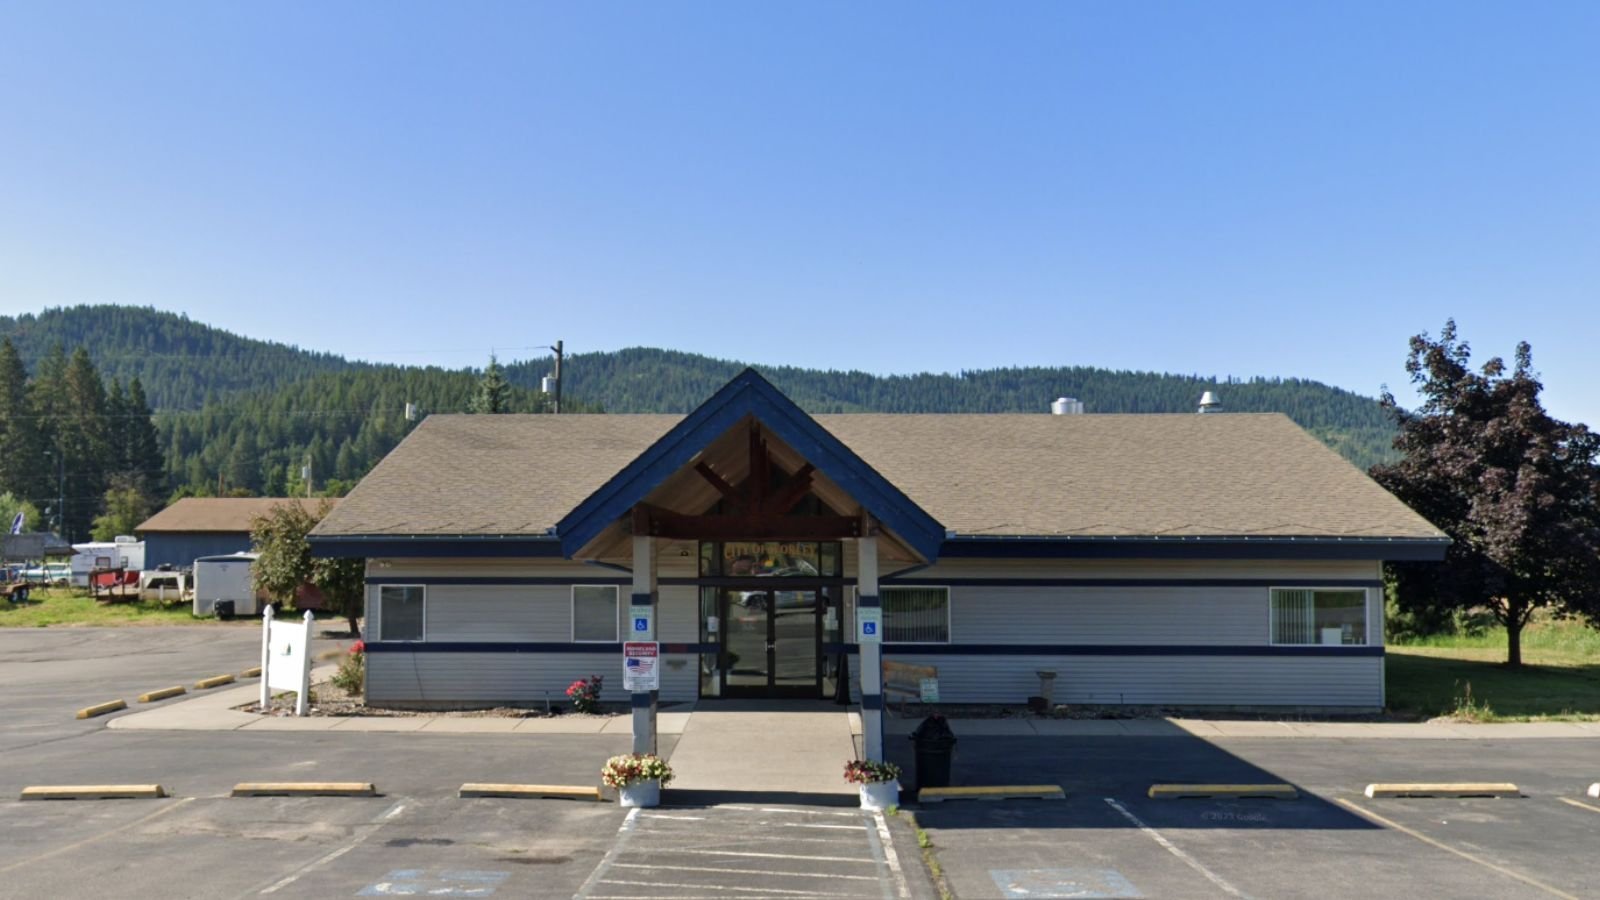
9. Worley – 201% Home Price Increase Since 2010

- 2010: $274,039
- 2011: $277,310 (+$3,272, +1.19% from previous year)
- 2012: $267,992 (−$9,318, −3.36% from previous year)
- 2013: $272,512 (+$4,520, +1.69% from previous year)
- 2014: $301,436 (+$28,924, +10.61% from previous year)
- 2015: $325,294 (+$23,858, +7.91% from previous year)
- 2016: $342,906 (+$17,613, +5.41% from previous year)
- 2017: $364,634 (+$21,728, +6.34% from previous year)
- 2018: $400,459 (+$35,825, +9.83% from previous year)
- 2019: $429,789 (+$29,330, +7.32% from previous year)
- 2020: $456,605 (+$26,816, +6.24% from previous year)
- 2021: $629,964 (+$173,358, +37.97% from previous year)
- 2022: $780,182 (+$150,218, +23.85% from previous year)
- 2023: $762,426 (−$17,756, −2.28% from previous year)
- 2024: $807,684 (+$45,258, +5.94% from previous year)
- 2025: $824,018 (+$16,333, +2.02% from previous year)
Worley shows impressive growth from $274,039 in 2010 to $824,018 in 2025, achieving a substantial 201% increase over 15 years. The community maintained steady single-digit growth through most of the 2010s before experiencing dramatic acceleration with a 38% surge in 2021 and 24% gain in 2022. Unlike many markets that corrected significantly, Worley has shown remarkable resilience with continued strong growth through 2025.
Worley – Coeur d’Alene Area Benefits From Regional Growth
Located in Kootenai County south of Coeur d’Alene, Worley represents a small community that has benefited significantly from the broader growth trends affecting northern Idaho’s lake region. The area provides rural residential opportunities while maintaining reasonable access to Coeur d’Alene’s amenities and employment opportunities. Worley’s location offers buyers more space and privacy while remaining connected to the region’s recreational and economic centers.
The consistent appreciation throughout the data period, particularly the sustained growth since 2021, reflects Worley’s emergence as an attractive residential option for the greater Coeur d’Alene area. The community’s ability to maintain strong performance even after the initial pandemic surge suggests solid underlying demand fundamentals. Worley’s continued growth through 2024-2025, when many markets have cooled, indicates this area may represent one of the more stable and sustainable markets in northern Idaho’s rapidly changing housing landscape.
8. Hailey – 195% Home Price Increase Since 2010

- 2010: $281,998
- 2011: $252,028 (−$29,970, −10.63% from previous year)
- 2012: $246,249 (−$5,779, −2.29% from previous year)
- 2013: $271,999 (+$25,750, +10.46% from previous year)
- 2014: $312,500 (+$40,501, +14.89% from previous year)
- 2015: $336,624 (+$24,124, +7.72% from previous year)
- 2016: $359,827 (+$23,203, +6.89% from previous year)
- 2017: $375,917 (+$16,090, +4.47% from previous year)
- 2018: $413,369 (+$37,452, +9.96% from previous year)
- 2019: $429,043 (+$15,674, +3.79% from previous year)
- 2020: $478,822 (+$49,778, +11.60% from previous year)
- 2021: $620,936 (+$142,114, +29.68% from previous year)
- 2022: $780,656 (+$159,720, +25.72% from previous year)
- 2023: $753,811 (−$26,845, −3.44% from previous year)
- 2024: $802,319 (+$48,507, +6.43% from previous year)
- 2025: $831,046 (+$28,727, +3.58% from previous year)
Hailey demonstrates strong appreciation from $281,998 in 2010 to $831,046 in 2025, representing a solid 195% increase over 15 years. The community maintained steady growth throughout the 2010s before experiencing significant acceleration with a 30% surge in 2021 and 26% gain in 2022. After a modest correction in 2023, the market has resumed strong upward momentum with accelerating growth through 2025.
Hailey – Wood River Valley’s Service Hub Shows Resilience

Located in Blaine County as the county seat, Hailey serves as the service and government center for the Wood River Valley that includes the famous resort communities of Sun Valley and Ketchum. The town provides essential services, local government functions, and more affordable housing options for workers in the region’s resort economy. Hailey’s airport serves as the gateway to the Wood River Valley, making it crucial infrastructure for the area’s tourism and seasonal resident population.
The steady appreciation reflects Hailey’s essential role in supporting the broader Wood River Valley economy while offering more accessible housing costs than the premium resort communities. The strong recovery following the modest 2023 correction, with accelerating growth through 2025, demonstrates the town’s resilience and continued demand. Hailey’s combination of practical amenities, regional importance, and relative affordability continues to attract both permanent residents and those seeking access to the Wood River Valley lifestyle.
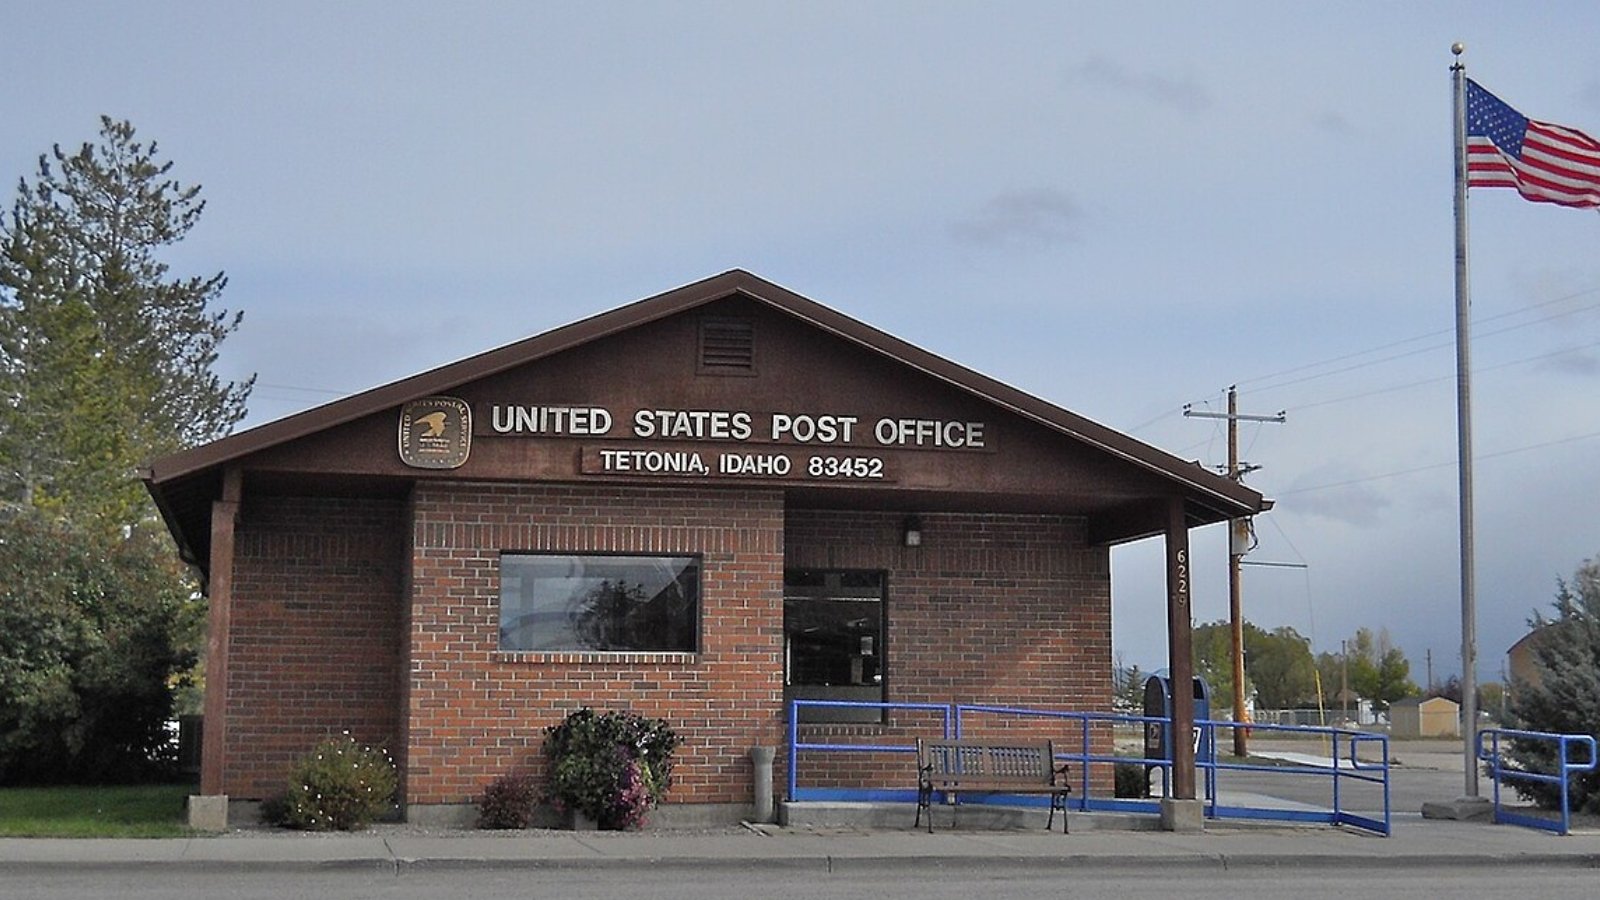
7. Tetonia – 282% Home Price Increase Since 2011

- 2010: N/A
- 2011: $220,174
- 2012: $236,342 (+$16,168, +7.34% from previous year)
- 2013: $263,068 (+$26,726, +11.31% from previous year)
- 2014: $279,415 (+$16,347, +6.21% from previous year)
- 2015: $294,730 (+$15,314, +5.48% from previous year)
- 2016: $339,956 (+$45,226, +15.34% from previous year)
- 2017: $388,462 (+$48,506, +14.27% from previous year)
- 2018: $427,077 (+$38,615, +9.94% from previous year)
- 2019: $434,224 (+$7,147, +1.67% from previous year)
- 2020: $472,112 (+$37,888, +8.73% from previous year)
- 2021: $672,427 (+$200,315, +42.43% from previous year)
- 2022: $843,795 (+$171,367, +25.48% from previous year)
- 2023: $770,966 (−$72,829, −8.63% from previous year)
- 2024: $823,896 (+$52,930, +6.87% from previous year)
- 2025: $841,917 (+$18,021, +2.19% from previous year)
Tetonia showcases exceptional growth from $220,174 in 2011 to $841,917 in 2025, achieving a remarkable 282% increase over 14 years. The community maintained strong double-digit growth through the mid-2010s before experiencing explosive gains of 42% in 2021 and 25% in 2022. After a notable correction in 2023, the market has shown strong recovery with continued upward momentum through 2025.
Tetonia – Teton Valley’s Rural Appeal Drives Premium Pricing
Located in Teton County in Idaho’s Teton Valley, Tetonia offers residents spectacular mountain views and rural character while providing access to world-class recreation in both Idaho and neighboring Wyoming. The small agricultural community has attracted buyers seeking larger properties and mountain lifestyle while maintaining proximity to Grand Targhee Resort and Jackson Hole area recreation. Tetonia’s rural setting appeals to those wanting privacy and space in one of the West’s most scenic valleys.
The extraordinary price appreciation reflects Tetonia’s emergence as a premium rural residential area during the pandemic-era housing boom. The community’s combination of agricultural heritage, mountain views, and recreation access became particularly appealing to buyers seeking retreat-style properties. The strong recovery following the 2023 correction demonstrates continued demand for rural mountain properties in this scenic valley, though at more moderate growth rates than the initial surge period.
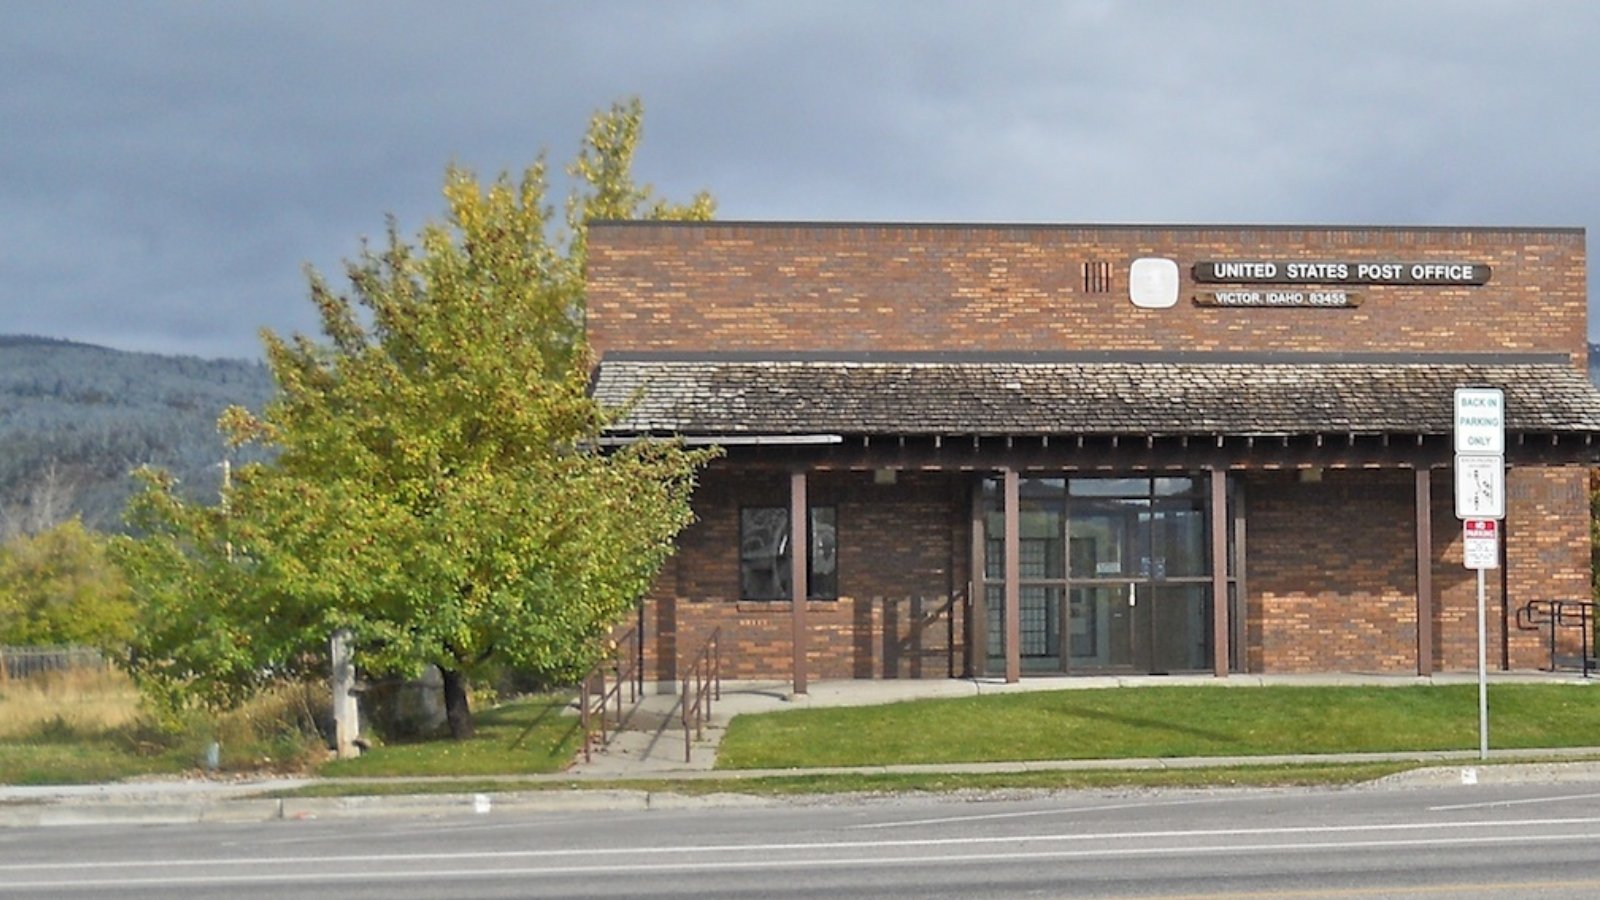
6. Victor – 250% Home Price Increase Since 2011

- 2010: N/A
- 2011: $247,880
- 2012: $260,301 (+$12,421, +5.01% from previous year)
- 2013: $291,787 (+$31,486, +12.10% from previous year)
- 2014: $310,677 (+$18,890, +6.47% from previous year)
- 2015: $345,165 (+$34,488, +11.10% from previous year)
- 2016: $388,118 (+$42,953, +12.44% from previous year)
- 2017: $450,574 (+$62,456, +16.09% from previous year)
- 2018: $477,102 (+$26,528, +5.89% from previous year)
- 2019: $470,406 (−$6,695, −1.40% from previous year)
- 2020: $502,736 (+$32,330, +6.87% from previous year)
- 2021: $710,011 (+$207,275, +41.23% from previous year)
- 2022: $894,899 (+$184,888, +26.04% from previous year)
- 2023: $813,038 (−$81,861, −9.15% from previous year)
- 2024: $860,596 (+$47,559, +5.85% from previous year)
- 2025: $868,472 (+$7,876, +0.92% from previous year)
Victor demonstrates exceptional growth from $247,880 in 2011 to $868,472 in 2025, achieving a remarkable 250% increase over 14 years. The community maintained strong double-digit growth through most of the 2010s before experiencing explosive gains of 41% in 2021 and 26% in 2022. After a significant correction in 2023, the market has shown steady recovery, though growth has slowed considerably by 2025.
Victor – Teton Valley’s Crown Jewel Commands Premium
Located in Teton County at the heart of Idaho’s Teton Valley, Victor serves as the area’s primary residential community with stunning views of the Teton Range. The town has evolved from a small farming community into a sought-after destination for those seeking mountain lifestyle with world-class recreation access. Victor’s proximity to Grand Targhee Resort, Jackson Hole, and Grand Teton National Park makes it an ideal base for outdoor enthusiasts and seasonal residents.
The extraordinary price appreciation reflects Victor’s emergence as the premier residential community in Teton Valley, offering more affordable access to Teton Range recreation than Jackson Hole while maintaining small-town character. The massive gains during 2021-2022 intensified as pandemic-era buyers discovered this scenic valley as an alternative to Wyoming’s expensive resort markets. Despite recent moderation in growth, Victor’s current values reflect its established status as one of Idaho’s most desirable mountain communities.
5. Harrison – 104% Home Price Increase Since 2010

- 2010: $464,956
- 2011: $353,531 (−$111,426, −23.96% from previous year)
- 2012: $339,760 (−$13,771, −3.90% from previous year)
- 2013: $353,910 (+$14,151, +4.16% from previous year)
- 2014: $365,930 (+$12,020, +3.40% from previous year)
- 2015: $393,940 (+$28,010, +7.65% from previous year)
- 2016: $403,792 (+$9,852, +2.50% from previous year)
- 2017: $411,168 (+$7,375, +1.83% from previous year)
- 2018: $449,991 (+$38,823, +9.44% from previous year)
- 2019: $484,207 (+$34,216, +7.60% from previous year)
- 2020: $535,867 (+$51,660, +10.67% from previous year)
- 2021: $737,239 (+$201,372, +37.58% from previous year)
- 2022: $889,221 (+$151,982, +20.61% from previous year)
- 2023: $930,002 (+$40,782, +4.59% from previous year)
- 2024: $964,594 (+$34,592, +3.72% from previous year)
- 2025: $949,696 (−$14,898, −1.54% from previous year)
Harrison shows a volatile but ultimately successful journey from $464,956 in 2010 to $949,696 in 2025, representing a 104% increase over 15 years despite significant early losses. The community experienced dramatic declines through 2012 before beginning steady recovery that accelerated significantly during the pandemic years with a 38% surge in 2021. Unlike many markets, Harrison continued growing through 2024 before showing its first decline in 2025.
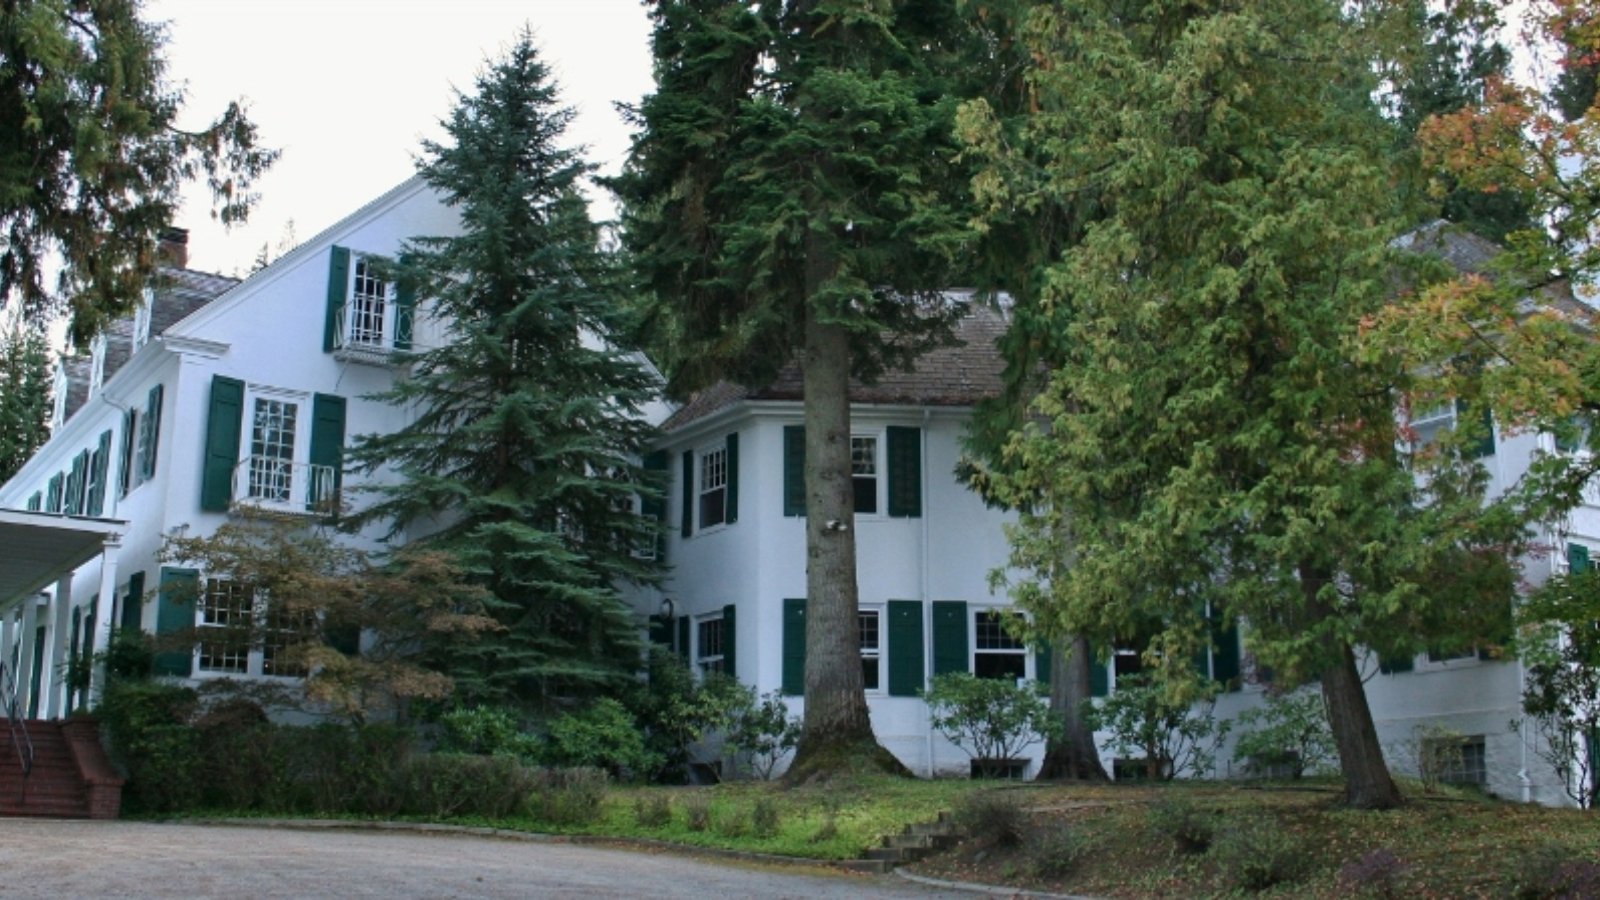
Harrison – Lake Coeur d’Alene’s Premium Enclave
Located in Kootenai County on the southern shores of Lake Coeur d’Alene, Harrison represents one of the lake’s most exclusive residential communities. The small town offers direct lake access, marina facilities, and upscale waterfront properties that attract affluent buyers seeking premier lakefront lifestyle. Harrison’s location provides stunning lake views and water recreation opportunities while maintaining an intimate community atmosphere.
The dramatic recovery from early 2010s lows followed by extraordinary pandemic-era gains reflects Harrison’s emergence as a premium lakefront destination. The community’s exclusive character and limited housing stock create natural price support, leading to continued appreciation even as other markets cooled in 2023-2024. The slight decline in 2025 may represent market normalization after several years of exceptional growth, though values remain at historically high levels for this premium lakefront enclave.
4. Coolin – 217% Home Price Increase Since 2010

- 2010: $317,295
- 2011: $305,356 (−$11,939, −3.76% from previous year)
- 2012: $342,184 (+$36,828, +12.06% from previous year)
- 2013: $353,644 (+$11,460, +3.35% from previous year)
- 2014: $381,893 (+$28,249, +7.99% from previous year)
- 2015: $436,535 (+$54,642, +14.31% from previous year)
- 2016: $483,721 (+$47,186, +10.81% from previous year)
- 2017: $497,414 (+$13,693, +2.83% from previous year)
- 2018: $540,341 (+$42,927, +8.63% from previous year)
- 2019: $556,970 (+$16,629, +3.08% from previous year)
- 2020: $590,487 (+$33,516, +6.02% from previous year)
- 2021: $844,807 (+$254,321, +43.07% from previous year)
- 2022: $1,057,344 (+$212,536, +25.16% from previous year)
- 2023: $940,188 (−$117,156, −11.08% from previous year)
- 2024: $1,004,868 (+$64,680, +6.88% from previous year)
- 2025: $1,006,050 (+$1,183, +0.12% from previous year)
Coolin demonstrates impressive growth from $317,295 in 2010 to $1,006,050 in 2025, representing a substantial 217% increase over 15 years. The community maintained steady appreciation through the 2010s before experiencing extraordinary acceleration with a 43% surge in 2021 and 25% gain in 2022, pushing values above the million-dollar mark. After a significant correction in 2023, the market has largely stabilized at premium levels.
Coolin – Priest Lake’s Exclusive Million-Dollar Market
Located in Bonner County on the shores of pristine Priest Lake in far northern Idaho, Coolin represents one of the state’s most exclusive lakefront communities. The remote location and limited development around Priest Lake create a premium market for buyers seeking ultimate privacy and pristine natural settings. Coolin’s properties often feature extensive lake frontage and forested acreage, appealing to affluent buyers seeking retreat-style estates.
The dramatic appreciation reflects Coolin’s emergence as a million-dollar lakefront market during the pandemic housing boom. The community’s combination of pristine lake access, wilderness setting, and extreme privacy became particularly appealing to high-net-worth buyers seeking escape properties. Despite the 2023 correction, values have stabilized above the million-dollar threshold, establishing Coolin as one of Idaho’s premier luxury lakefront destinations alongside more famous resort communities.
3. Hayden Lake – 167% Home Price Increase Since 2010

- 2010: $390,451
- 2011: $313,457 (−$76,994, −19.72% from previous year)
- 2012: $330,397 (+$16,941, +5.40% from previous year)
- 2013: $352,471 (+$22,073, +6.68% from previous year)
- 2014: $383,405 (+$30,935, +8.78% from previous year)
- 2015: $401,377 (+$17,971, +4.69% from previous year)
- 2016: $425,979 (+$24,602, +6.13% from previous year)
- 2017: $465,843 (+$39,864, +9.36% from previous year)
- 2018: $513,653 (+$47,810, +10.26% from previous year)
- 2019: $543,951 (+$30,298, +5.90% from previous year)
- 2020: $581,117 (+$37,166, +6.83% from previous year)
- 2021: $805,314 (+$224,197, +38.58% from previous year)
- 2022: $1,001,852 (+$196,538, +24.41% from previous year)
- 2023: $1,001,685 (−$167, −0.02% from previous year)
- 2024: $1,023,813 (+$22,129, +2.21% from previous year)
- 2025: $1,044,074 (+$20,261, +1.98% from previous year)
Hayden Lake shows strong recovery and growth from $390,451 in 2010 to $1,044,074 in 2025, achieving a 167% increase over 15 years despite early significant losses. The community experienced a dramatic decline in 2011 before beginning steady recovery that accelerated significantly during the pandemic years. Unlike many markets that corrected after 2022, Hayden Lake has maintained remarkable stability with continued modest growth through 2025.
Hayden Lake – Established Luxury Market Shows Resilience
Located in Kootenai County on the shores of Hayden Lake, this exclusive community has long been recognized as one of northern Idaho’s premier lakefront destinations. The area features upscale waterfront estates, private docks, and exclusive residential developments that attract affluent buyers seeking luxury lakefront lifestyle. Hayden Lake’s reputation as a high-end residential enclave predates the recent housing boom, establishing it as a consistently premium market.
The community’s ability to maintain values above the million-dollar mark since 2022, with continued steady growth through 2025, demonstrates the resilience of established luxury markets. Hayden Lake’s combination of lake access, upscale amenities, and proximity to Coeur d’Alene creates sustained demand among high-net-worth buyers. The market’s stability compared to more volatile resort communities suggests mature luxury markets may be less susceptible to dramatic corrections, maintaining their premium positioning even as broader markets fluctuate.
2. Sun Valley – 157% Home Price Increase Since 2010

- 2010: $494,282
- 2011: $432,636 (−$61,646, −12.47% from previous year)
- 2012: $428,318 (−$4,317, −1.00% from previous year)
- 2013: $471,126 (+$42,807, +9.99% from previous year)
- 2014: $535,743 (+$64,617, +13.72% from previous year)
- 2015: $556,247 (+$20,504, +3.83% from previous year)
- 2016: $568,249 (+$12,002, +2.16% from previous year)
- 2017: $584,453 (+$16,204, +2.85% from previous year)
- 2018: $612,954 (+$28,501, +4.88% from previous year)
- 2019: $616,590 (+$3,636, +0.59% from previous year)
- 2020: $681,449 (+$64,859, +10.52% from previous year)
- 2021: $938,224 (+$256,776, +37.68% from previous year)
- 2022: $1,332,572 (+$394,348, +42.03% from previous year)
- 2023: $1,174,682 (−$157,890, −11.85% from previous year)
- 2024: $1,206,462 (+$31,780, +2.71% from previous year)
- 2025: $1,269,281 (+$62,819, +5.21% from previous year)
Sun Valley demonstrates solid appreciation from $494,282 in 2010 to $1,269,281 in 2025, representing a 157% increase over 15 years. The world-famous resort community maintained modest growth through most of the 2010s before experiencing extraordinary acceleration with a 38% surge in 2021 and remarkable 42% gain in 2022. After a significant correction in 2023, the market has resumed upward momentum with accelerating growth through 2025.
Sun Valley – America’s Original Destination Resort Maintains Elite Status
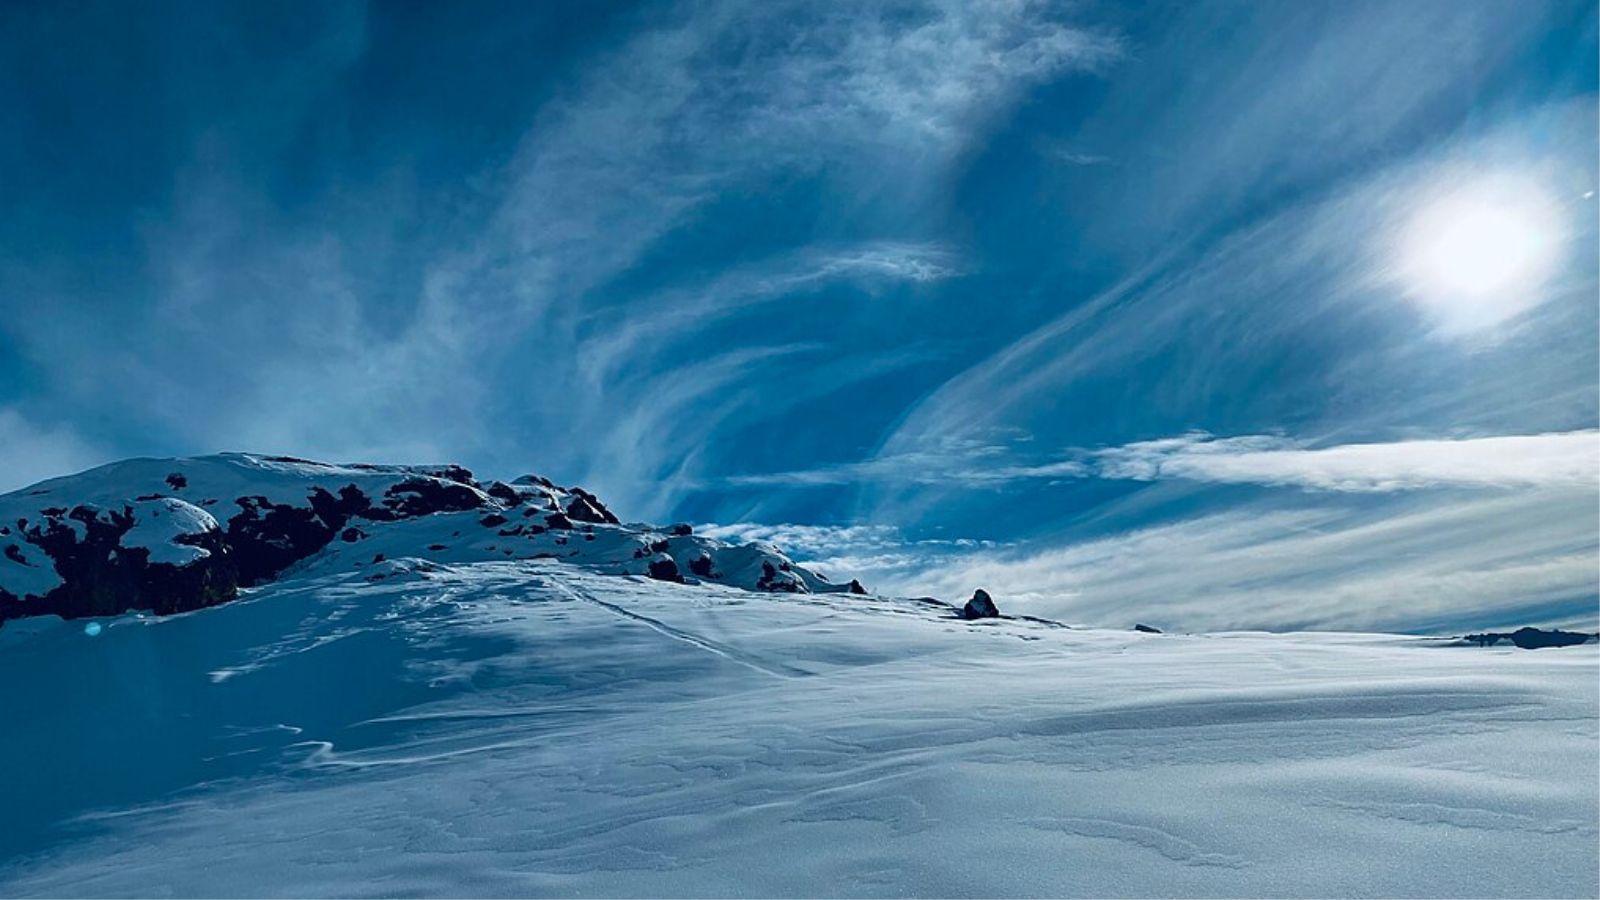
Located in Blaine County in central Idaho’s Wood River Valley, Sun Valley stands as one of America’s most prestigious mountain resort destinations. Founded in 1936 as the nation’s first destination ski resort, Sun Valley continues to attract celebrities, business leaders, and affluent families seeking world-class recreation and luxury amenities. The resort offers championship skiing, golf courses, luxury accommodations, and year-round cultural events that maintain its status as a premier destination.
The dramatic price increases during 2021-2022, culminating in values exceeding $1.3 million, reflect Sun Valley’s position at the apex of luxury resort markets. The community’s international reputation and limited housing supply create intense competition among high-net-worth buyers. Despite the 2023 correction, renewed growth through 2024-2025 demonstrates the enduring appeal of this iconic resort destination. Sun Valley’s ability to command premium pricing reflects its established brand recognition and continued investment in maintaining world-class amenities and recreational opportunities.
1. Ketchum – 144% Home Price Increase Since 2010

- 2010: $639,125
- 2011: $543,000 (−$96,125, −15.04% from previous year)
- 2012: $529,667 (−$13,333, −2.46% from previous year)
- 2013: $565,243 (+$35,576, +6.72% from previous year)
- 2014: $620,612 (+$55,369, +9.80% from previous year)
- 2015: $662,106 (+$41,494, +6.69% from previous year)
- 2016: $686,029 (+$23,923, +3.61% from previous year)
- 2017: $718,957 (+$32,928, +4.80% from previous year)
- 2018: $771,000 (+$52,043, +7.24% from previous year)
- 2019: $759,541 (−$11,459, −1.49% from previous year)
- 2020: $818,321 (+$58,780, +7.74% from previous year)
- 2021: $1,114,690 (+$296,369, +36.22% from previous year)
- 2022: $1,537,018 (+$422,328, +37.89% from previous year)
- 2023: $1,406,194 (−$130,825, −8.51% from previous year)
- 2024: $1,532,867 (+$126,673, +9.01% from previous year)
- 2025: $1,556,144 (+$23,277, +1.52% from previous year)
Ketchum showcases remarkable transformation from $639,125 in 2010 to $1,556,144 in 2025, representing a 144% increase over 15 years and claiming the title of Idaho’s most expensive town. The resort community maintained steady growth through most of the 2010s before experiencing explosive acceleration with consecutive years of 36% and 38% gains in 2021-2022. After a modest correction in 2023, the market rebounded strongly in 2024 before moderating in 2025.
Ketchum – Idaho’s Most Expensive Town Reaches New Heights
Located in Blaine County adjacent to Sun Valley Resort, Ketchum serves as the commercial and residential heart of Idaho’s most famous resort destination. The town combines world-class skiing at Sun Valley Resort with vibrant dining, shopping, and cultural amenities that attract an international clientele. Ketchum’s compact downtown, surrounded by dramatic mountain scenery, creates an intimate yet sophisticated atmosphere that appeals to affluent buyers seeking both luxury and authenticity.
The extraordinary price appreciation, culminating in median values exceeding $1.5 million, establishes Ketchum as Idaho’s most expensive residential market. The community’s unique combination of resort amenities, year-round recreation, and small-town character creates exceptional demand among high-net-worth buyers seeking mountain lifestyle properties. Despite representing Idaho’s priciest market, continued growth through 2024-2025 demonstrates sustained appetite for luxury mountain real estate in this world-renowned destination, cementing Ketchum’s position at the pinnacle of Idaho’s housing market.