🔥 Would you like to save this?
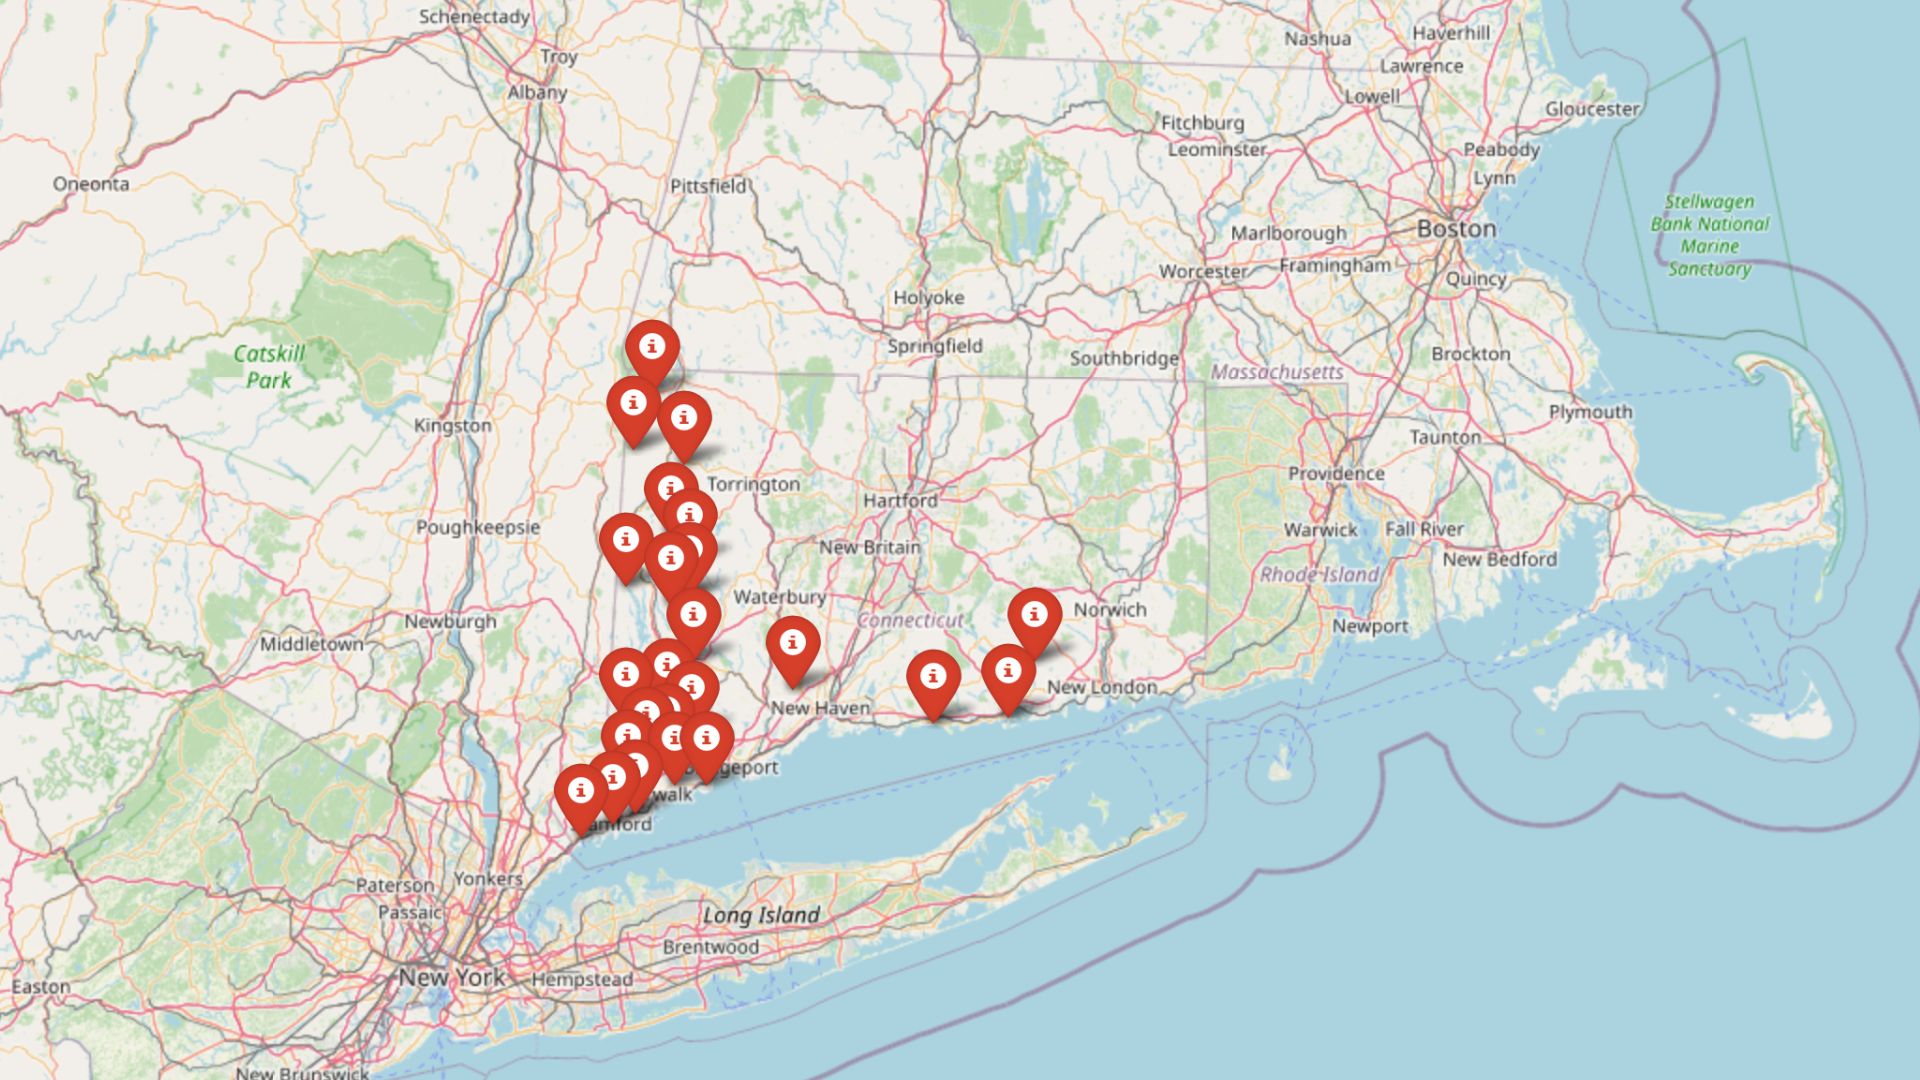
Connecticut’s real estate elite are pulling serious numbers in 2025. According to the latest Zillow Home Value Index, 24 towns across the state have reached sky-high price levels, making them some of the most expensive places to live on the East Coast. Whether it’s waterfront charm, historic estates, or easy access to NYC, these towns aren’t just pricey—they’re powerfully positioned. Some surged during the pandemic; others have quietly built value for decades. Together, they form a map of where money moves and property values soar in the Constitution State.
24. Newtown – 8% Home Price Increase Since 2010
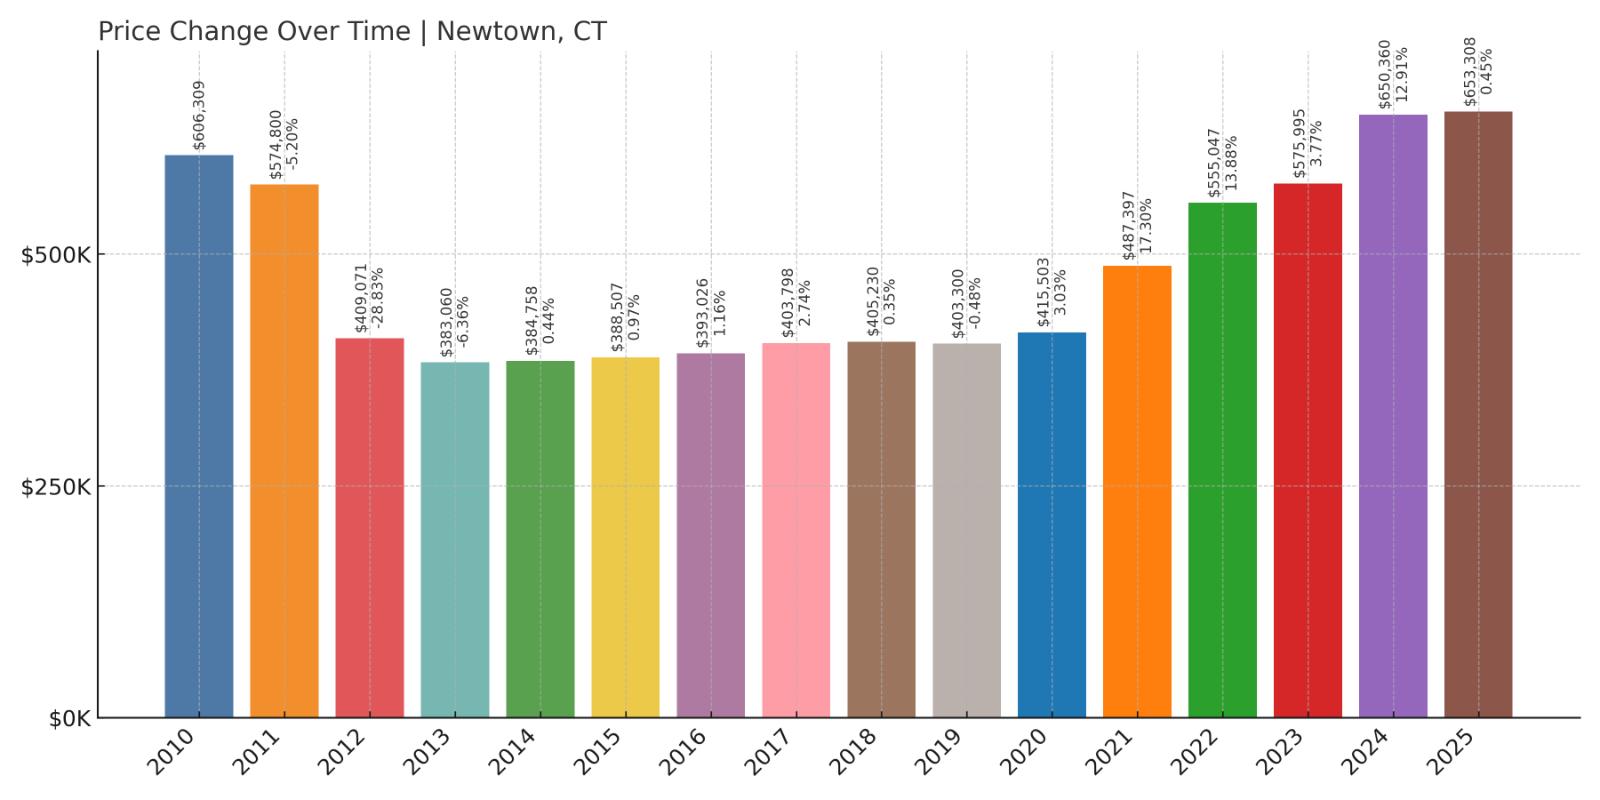
- 2010: $606,309
- 2011: $574,800 (-$31,509, -5.20% from previous year)
- 2012: $409,071 (-$165,730, -28.83% from previous year)
- 2013: $383,060 (-$26,010, -6.36% from previous year)
- 2014: $384,758 (+$1,698, +0.44% from previous year)
- 2015: $388,507 (+$3,748, +0.97% from previous year)
- 2016: $393,026 (+$4,519, +1.16% from previous year)
- 2017: $403,798 (+$10,772, +2.74% from previous year)
- 2018: $405,230 (+$1,432, +0.35% from previous year)
- 2019: $403,300 (-$1,930, -0.48% from previous year)
- 2020: $415,503 (+$12,204, +3.03% from previous year)
- 2021: $487,397 (+$71,893, +17.30% from previous year)
- 2022: $555,047 (+$67,650, +13.88% from previous year)
- 2023: $575,995 (+$20,947, +3.77% from previous year)
- 2024: $650,360 (+$74,366, +12.91% from previous year)
- 2025: $653,308 (+$2,948, +0.45% from previous year)
Newtown’s home values have climbed from $606,309 in 2010 to $653,308 in 2025, an 8% increase over 15 years. While the early 2010s brought sharp declines—especially the 28.8% drop in 2012—recent years saw a strong rebound. The biggest recovery years came between 2020 and 2024, where double-digit annual gains pushed prices to current levels.
In order to come up with the very specific design ideas, we create most designs with the assistance of state-of-the-art AI interior design software.
Newtown – Gradual Climb After Early Dips
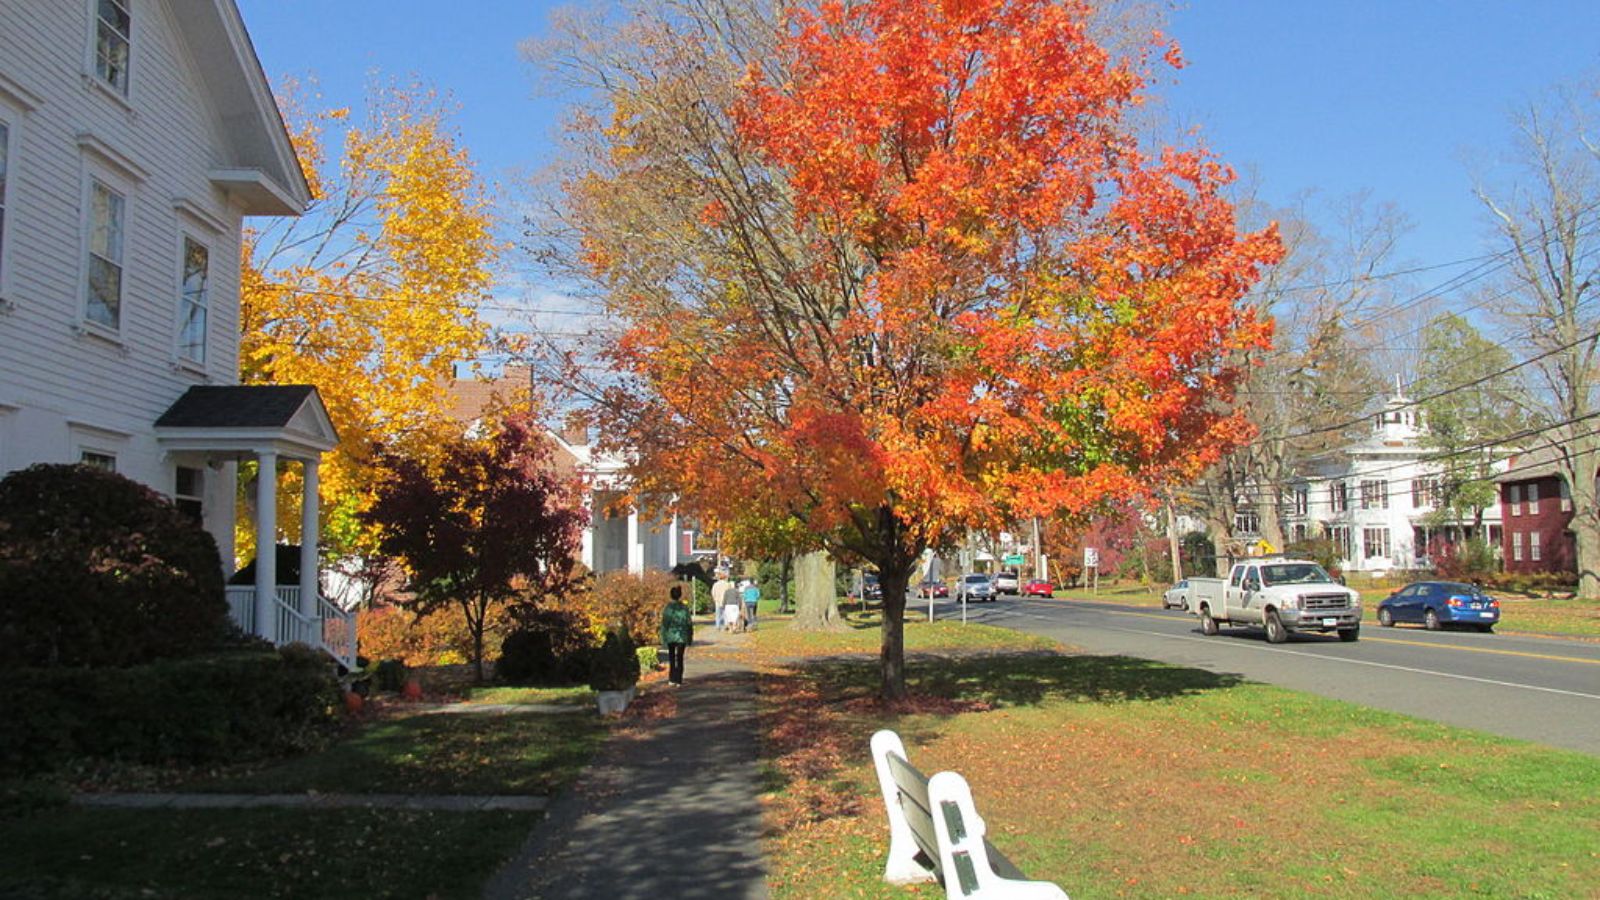
Located in Fairfield County, Newtown combines scenic landscapes with classic New England charm. The town faced steep post-recession drops in the early 2010s, but values began rising steadily after 2015. A notable surge came during the pandemic housing boom, with home values jumping by more than 60% between 2020 and 2024 alone. The town’s schools, safety, and historic feel have helped sustain demand, particularly among families looking to move inland from more crowded markets.
Newtown’s relatively moderate pricing for Fairfield County still places it among Connecticut’s top-tier markets. Buyers are drawn to its community atmosphere, open space, and well-maintained colonial homes. Though growth slowed in 2025, the long-term trend remains upward.
23. Woodbridge – 54% Home Price Increase Since 2010
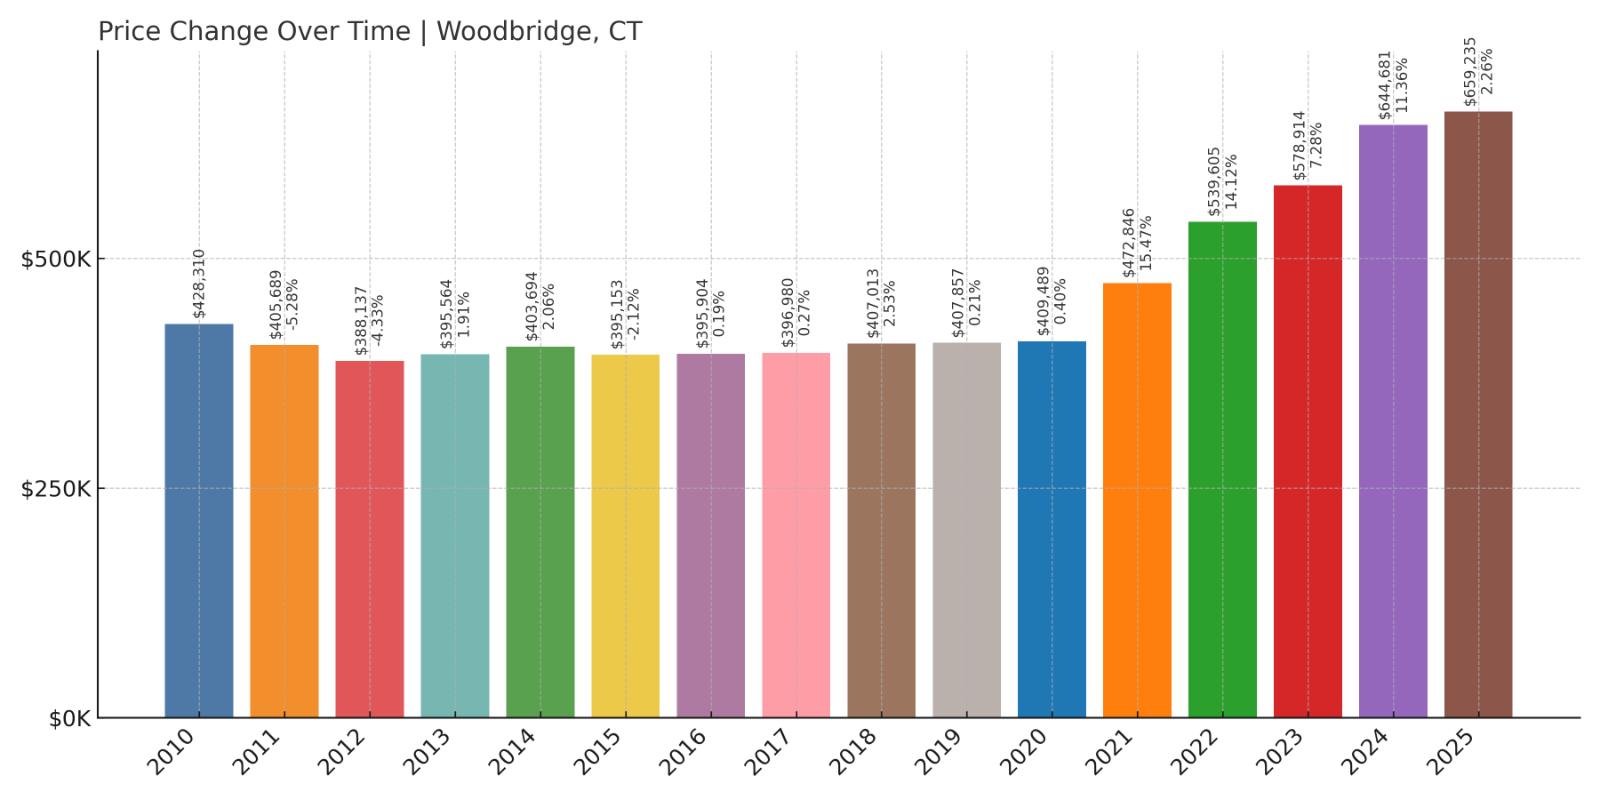
- 2010: $428,310
- 2011: $405,689 (-$22,621, -5.28% from previous year)
- 2012: $388,137 (-$17,552, -4.33% from previous year)
- 2013: $395,564 (+$7,427, +1.91% from previous year)
- 2014: $403,694 (+$8,129, +2.06% from previous year)
- 2015: $395,153 (-$8,540, -2.12% from previous year)
- 2016: $395,904 (+$751, +0.19% from previous year)
- 2017: $396,980 (+$1,076, +0.27% from previous year)
- 2018: $407,013 (+$10,033, +2.53% from previous year)
- 2019: $407,857 (+$845, +0.21% from previous year)
- 2020: $409,489 (+$1,632, +0.40% from previous year)
- 2021: $472,846 (+$63,357, +15.47% from previous year)
- 2022: $539,605 (+$66,758, +14.12% from previous year)
- 2023: $578,914 (+$39,309, +7.28% from previous year)
- 2024: $644,681 (+$65,767, +11.36% from previous year)
- 2025: $659,235 (+$14,554, +2.26% from previous year)
Woodbridge home prices rose from $428,310 in 2010 to $659,235 in 2025, a 54% increase. Growth was sluggish through most of the 2010s, with prices hovering just above $400,000. A sharp uptick began in 2021, with three consecutive double-digit gains that pushed the town into the top 25.
Woodbridge – Late Blooming Upscale Appeal
Woodbridge, just west of New Haven, has long been known for its excellent schools and quiet suburban feel. Despite this, home prices stagnated for years before accelerating sharply starting in 2021. That boom reflects heightened demand from remote workers and professionals seeking more space while staying near urban hubs.
The town’s large lots, wooded areas, and low-density neighborhoods attract buyers looking for tranquility without sacrificing proximity to amenities. With a strong school district and a median price now approaching $660,000, Woodbridge has carved out a solid spot among Connecticut’s priciest towns.
22. Cornwall – 53% Home Price Increase Since 2010

- 2010: $432,440
- 2011: $430,981 (-$1,459, -0.34% from previous year)
- 2012: $401,258 (-$29,723, -6.90% from previous year)
- 2013: $378,820 (-$22,439, -5.59% from previous year)
- 2014: $401,256 (+$22,436, +5.92% from previous year)
- 2015: $403,402 (+$2,147, +0.54% from previous year)
- 2016: $398,836 (-$4,567, -1.13% from previous year)
- 2017: $396,529 (-$2,306, -0.58% from previous year)
- 2018: $401,127 (+$4,597, +1.16% from previous year)
- 2019: $405,379 (+$4,252, +1.06% from previous year)
- 2020: $427,986 (+$22,607, +5.58% from previous year)
- 2021: $542,739 (+$114,753, +26.81% from previous year)
- 2022: $601,077 (+$58,338, +10.75% from previous year)
- 2023: $599,538 (-$1,539, -0.26% from previous year)
- 2024: $676,158 (+$76,620, +12.78% from previous year)
- 2025: $662,281 (-$13,877, -2.05% from previous year)
Between 2010 and 2025, home prices in Cornwall climbed from $432,440 to $662,281—an increase of 53%. Much of this gain occurred post-2020, particularly during the 2021 spike of nearly 27%. Although prices dipped slightly in 2023 and 2025, they remain well above pre-pandemic levels.
Cornwall – Rural Luxury in Litchfield County
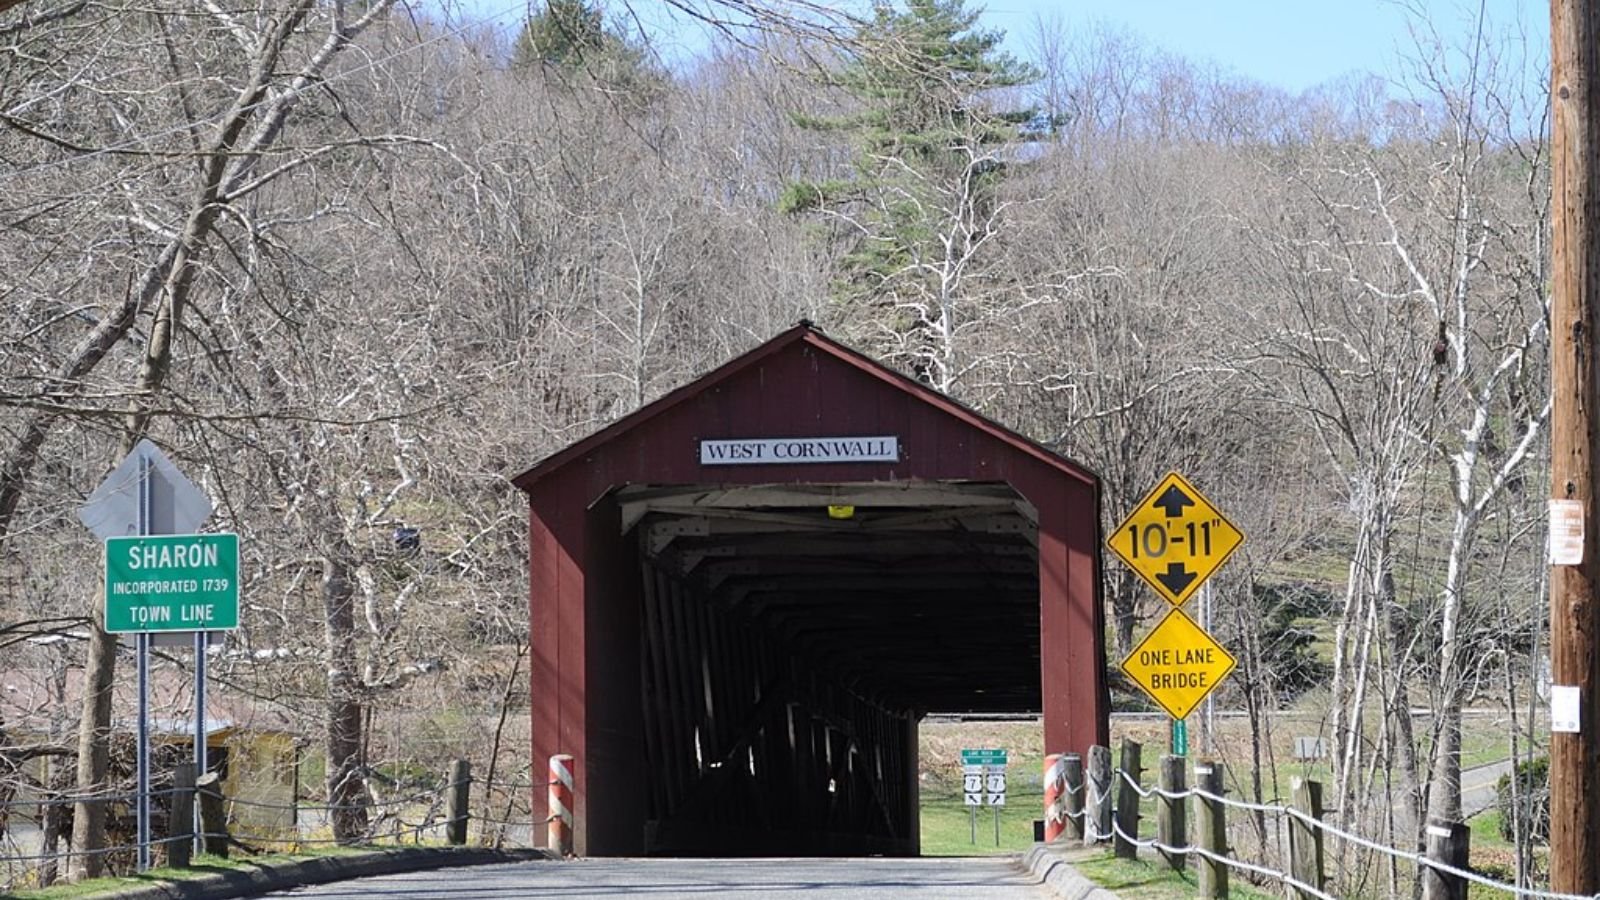
Cornwall offers sweeping rural views and a peaceful atmosphere in northwestern Connecticut. Known for its covered bridge and rolling hills, the town’s appeal soared during the pandemic as buyers sought open space. With its charming setting and limited inventory, competition pushed home values upward sharply through 2024.
Despite a slight pullback in 2025, Cornwall remains a high-value market relative to its size and remoteness. Weekend homes and seasonal demand have also played a role, contributing to price gains and solidifying Cornwall’s place among Connecticut’s most expensive destinations.
21. Old Saybrook – 74% Home Price Increase Since 2010
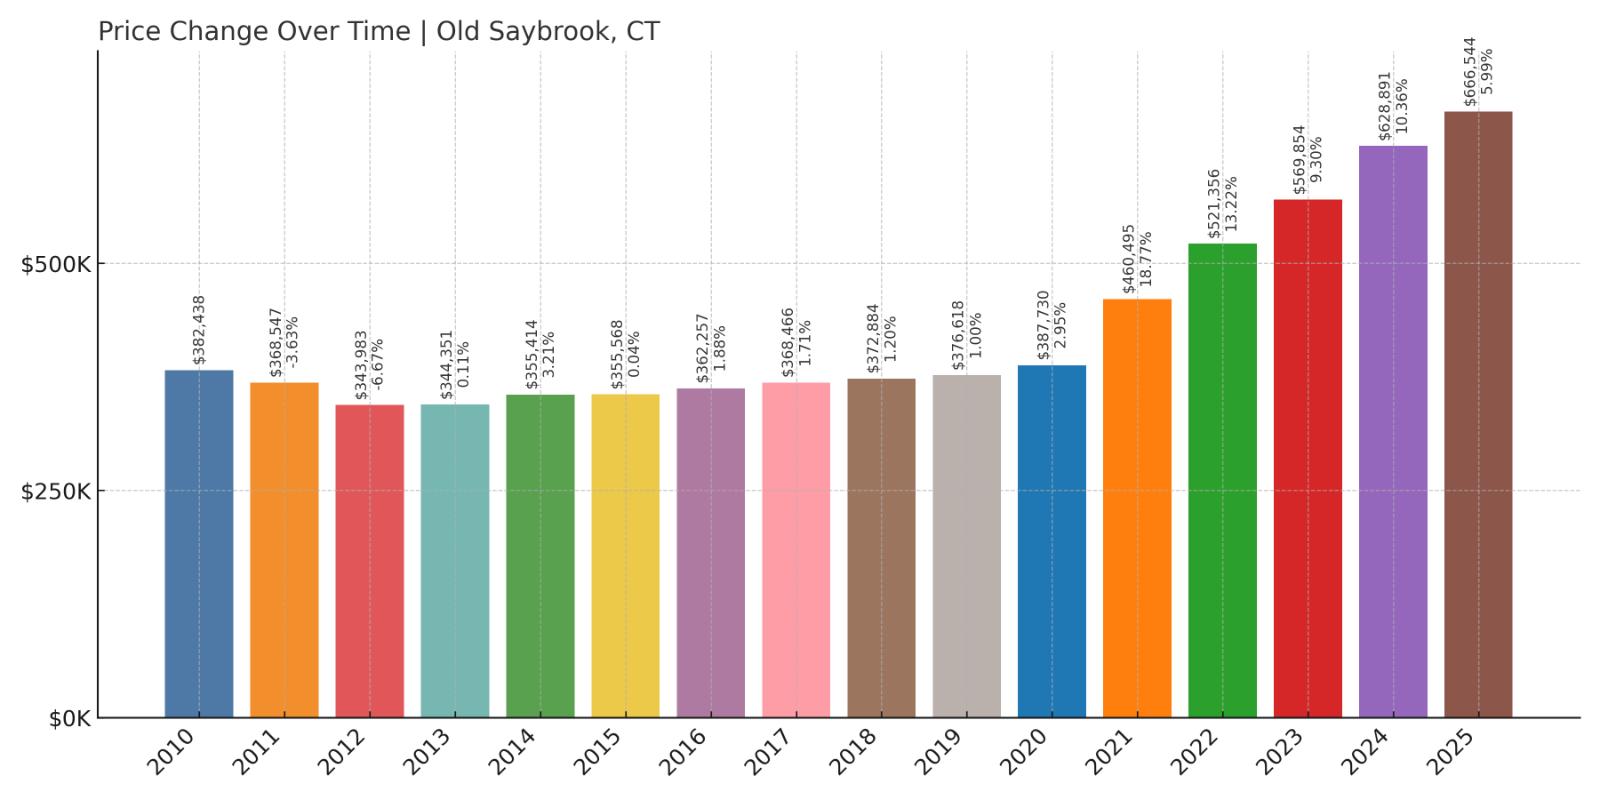
- 2010: $382,438
- 2011: $368,547 (-$13,891, -3.63% from previous year)
- 2012: $343,983 (-$24,564, -6.67% from previous year)
- 2013: $344,351 (+$368, +0.11% from previous year)
- 2014: $355,414 (+$11,063, +3.21% from previous year)
- 2015: $355,568 (+$153, +0.04% from previous year)
- 2016: $362,257 (+$6,689, +1.88% from previous year)
- 2017: $368,466 (+$6,209, +1.71% from previous year)
- 2018: $372,884 (+$4,418, +1.20% from previous year)
- 2019: $376,618 (+$3,734, +1.00% from previous year)
- 2020: $387,730 (+$11,112, +2.95% from previous year)
- 2021: $460,495 (+$72,766, +18.77% from previous year)
- 2022: $521,356 (+$60,861, +13.22% from previous year)
- 2023: $569,854 (+$48,498, +9.30% from previous year)
- 2024: $628,891 (+$59,037, +10.36% from previous year)
- 2025: $666,544 (+$37,653, +5.99% from previous year)
Old Saybrook saw home prices grow by 74% from $382,438 in 2010 to $666,544 in 2025. Most of the increase came after 2020, with double-digit percentage gains continuing through 2024. The market has remained strong, with steady growth into 2025.
Old Saybrook – Coastal Growth Fueled by Demand
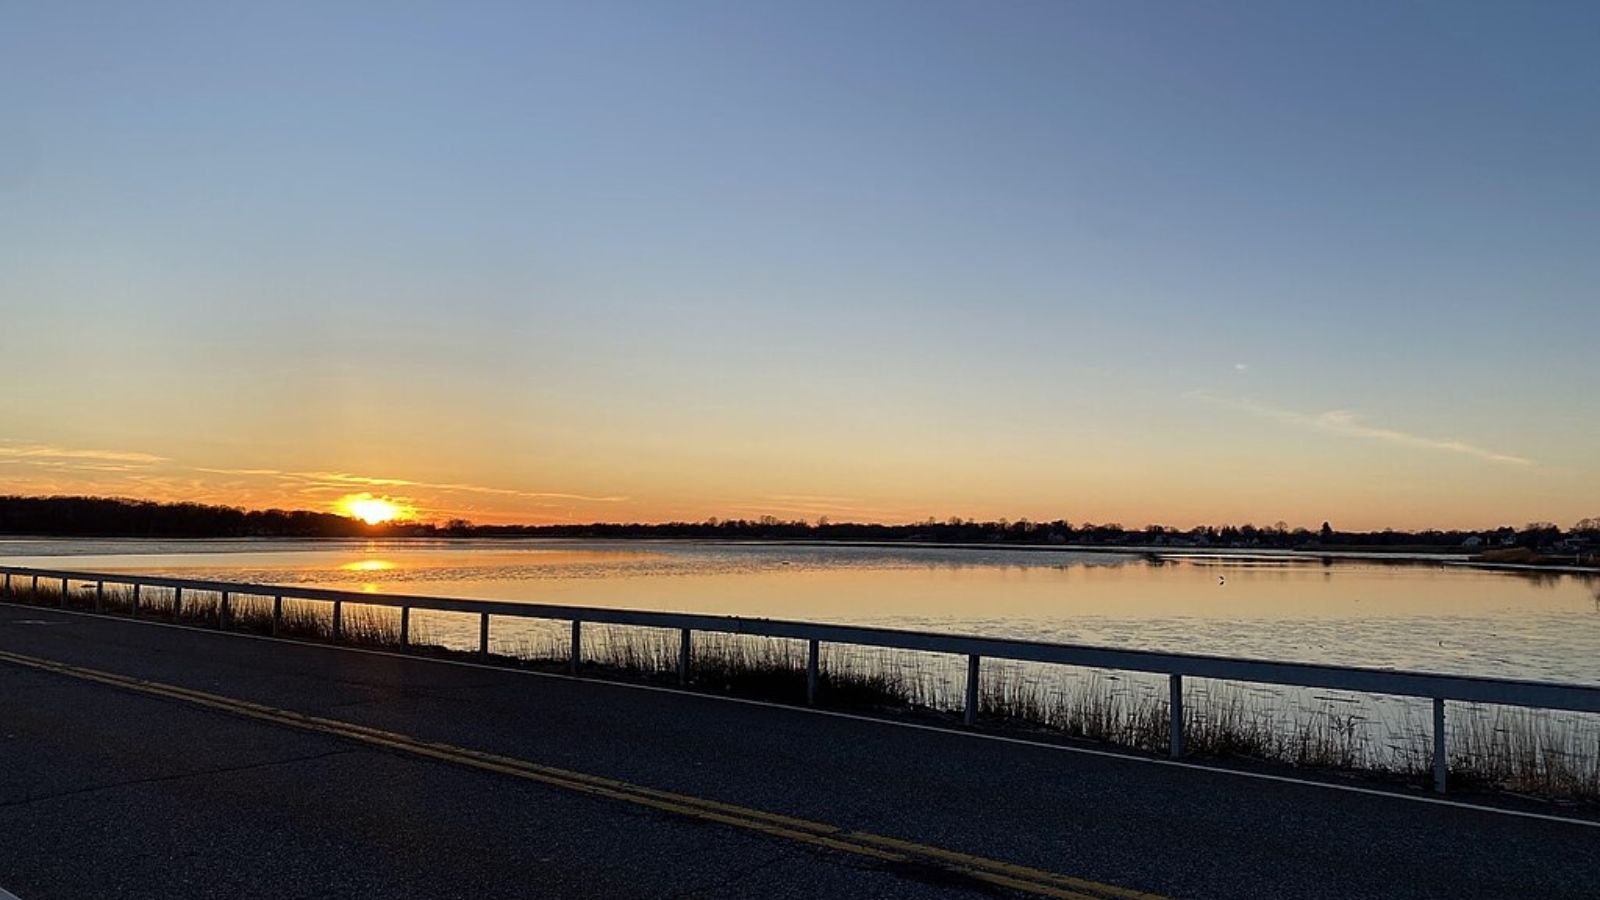
Sitting at the mouth of the Connecticut River, Old Saybrook is a coastal town with longstanding appeal. Water access, a quaint Main Street, and proximity to I-95 make it a desirable place for both year-round residents and vacation homeowners. The town’s post-2020 price acceleration mirrors national trends in seaside markets.
Old Saybrook’s combination of lifestyle, shoreline access, and historic architecture continues to attract buyers. With home values now nearing $670,000, the town has firmly established itself among Connecticut’s elite real estate markets.
20. New Preston – 74% Home Price Increase Since 2010
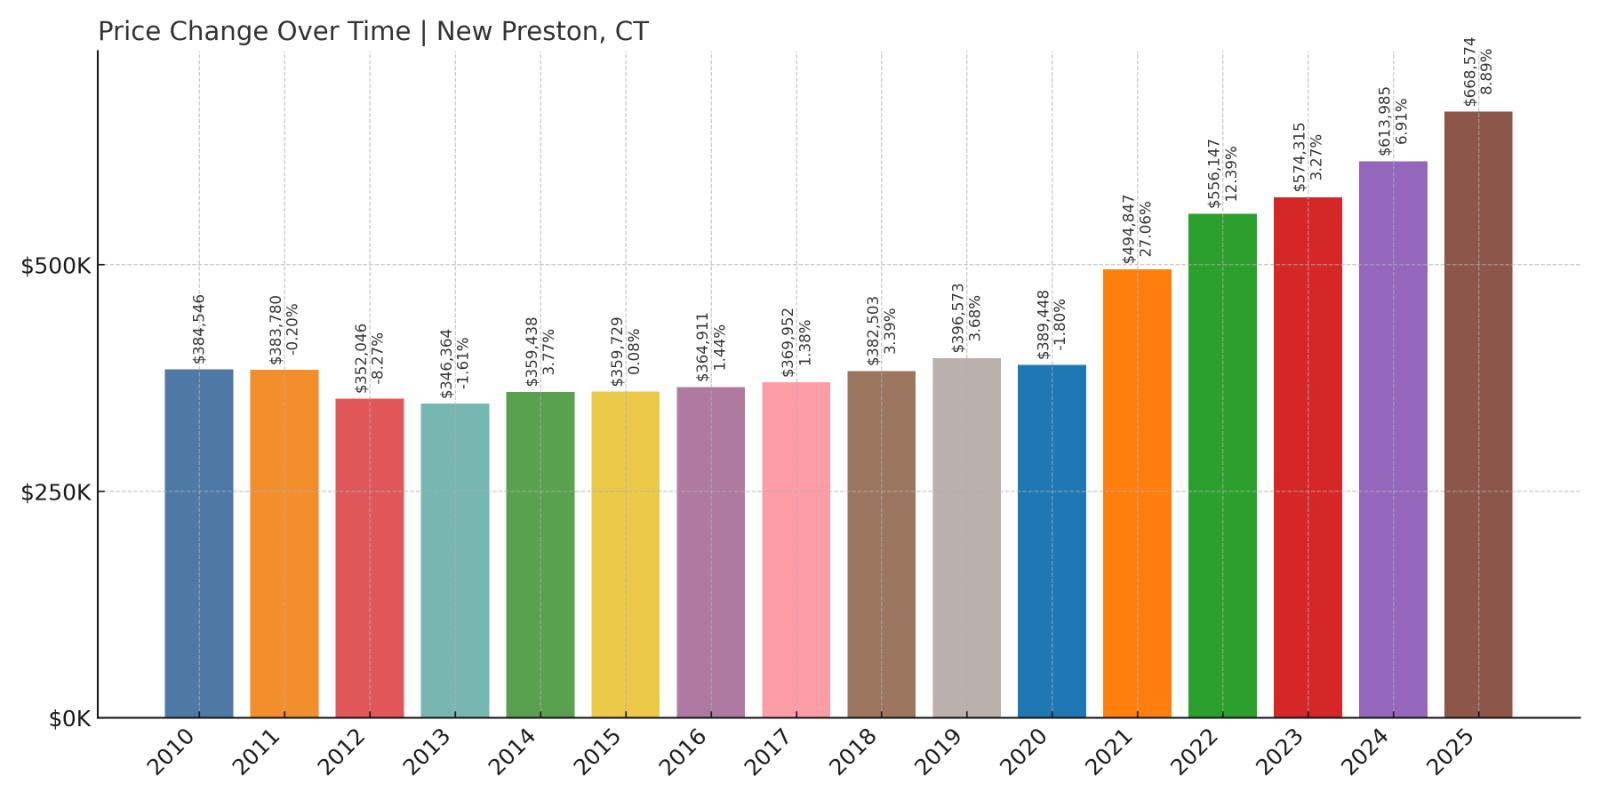
- 2010: $384,546
- 2011: $383,780 (-$766, -0.20% from previous year)
- 2012: $352,046 (-$31,734, -8.27% from previous year)
- 2013: $346,364 (-$5,682, -1.61% from previous year)
- 2014: $359,438 (+$13,074, +3.77% from previous year)
- 2015: $359,729 (+$291, +0.08% from previous year)
- 2016: $364,911 (+$5,182, +1.44% from previous year)
- 2017: $369,952 (+$5,041, +1.38% from previous year)
- 2018: $382,503 (+$12,551, +3.39% from previous year)
- 2019: $396,573 (+$14,070, +3.68% from previous year)
- 2020: $389,448 (-$7,125, -1.80% from previous year)
- 2021: $494,847 (+$105,399, +27.06% from previous year)
- 2022: $556,147 (+$61,300, +12.39% from previous year)
- 2023: $574,315 (+$18,168, +3.27% from previous year)
- 2024: $613,985 (+$39,670, +6.91% from previous year)
- 2025: $668,574 (+$54,588, +8.89% from previous year)
New Preston’s home values surged from $384,546 in 2010 to $668,574 in 2025—an increase of nearly 74%. After a slow start in the 2010s, growth accelerated sharply after 2020, with 2021 bringing a huge 27% gain. The momentum has continued through 2025.
New Preston – Luxury Lakeside Living

Part of the town of Washington, New Preston overlooks Lake Waramaug and features a mix of antique homes and upscale properties. The area is favored by second-home buyers and weekenders from New York City, especially since the remote work boom began. Inventory is limited, and demand has grown steadily since the pandemic.
With prices approaching $670,000, New Preston stands out among rural lake towns for its consistent value increases. Its blend of privacy, natural beauty, and refined charm continues to draw high-end buyers.
19. Stamford – 78% Home Price Increase Since 2012

- 2010: N/A
- 2011: N/A
- 2012: $382,020
- 2013: $403,424 (+$21,404, +5.60% from previous year)
- 2014: $430,730 (+$27,306, +6.77% from previous year)
- 2015: $440,298 (+$9,568, +2.22% from previous year)
- 2016: $456,526 (+$16,228, +3.69% from previous year)
- 2017: $468,041 (+$11,515, +2.52% from previous year)
- 2018: $476,579 (+$8,538, +1.82% from previous year)
- 2019: $470,738 (-$5,842, -1.23% from previous year)
- 2020: $468,219 (-$2,519, -0.54% from previous year)
- 2021: $525,025 (+$56,806, +12.13% from previous year)
- 2022: $566,795 (+$41,770, +7.96% from previous year)
- 2023: $586,222 (+$19,427, +3.43% from previous year)
- 2024: $660,028 (+$73,806, +12.59% from previous year)
- 2025: $680,580 (+$20,552, +3.11% from previous year)
Home values in Stamford have jumped from $382,020 in 2012 to $680,580 in 2025, a 78% increase. The city experienced a strong and fairly steady climb, with only minor dips in 2019 and 2020. Its biggest single-year gain came in 2021, when prices rose more than 12%.
Stamford – Coastal City With Urban Energy

As Connecticut’s third-largest city and a key part of the New York metro area, Stamford offers a dynamic mix of city amenities and suburban space. Its housing market has gained steadily thanks to a strong local economy, a growing tech scene, and continued investment in downtown infrastructure. While more affordable than nearby Greenwich or Darien, Stamford is catching up fast.
The city’s mix of condos, high-rises, and single-family homes allows it to appeal to a range of buyers. Stamford’s commuter access to Manhattan via Metro-North has remained a major selling point, particularly during and after the remote work boom, when many sought balance between space and city proximity.
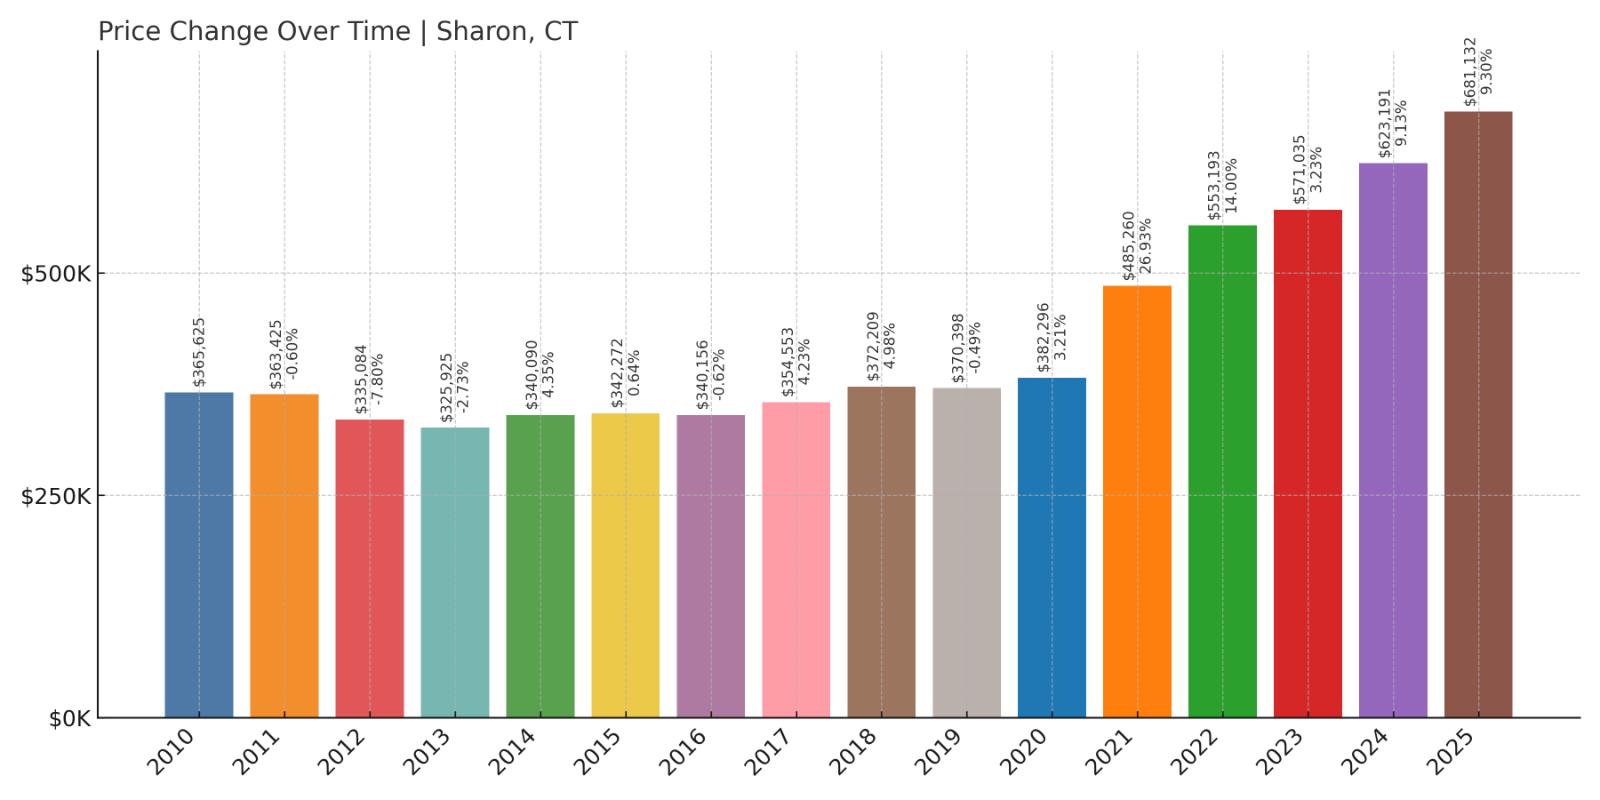
18. Sharon – 86% Home Price Increase Since 2010
🔥 Would you like to save this?
- 2010: $365,625
- 2011: $363,425 (-$2,200, -0.60% from previous year)
- 2012: $335,084 (-$28,342, -7.80% from previous year)
- 2013: $325,925 (-$9,158, -2.73% from previous year)
- 2014: $340,090 (+$14,164, +4.35% from previous year)
- 2015: $342,272 (+$2,183, +0.64% from previous year)
- 2016: $340,156 (-$2,116, -0.62% from previous year)
- 2017: $354,553 (+$14,397, +4.23% from previous year)
- 2018: $372,209 (+$17,656, +4.98% from previous year)
- 2019: $370,398 (-$1,812, -0.49% from previous year)
- 2020: $382,296 (+$11,898, +3.21% from previous year)
- 2021: $485,260 (+$102,964, +26.93% from previous year)
- 2022: $553,193 (+$67,934, +14.00% from previous year)
- 2023: $571,035 (+$17,842, +3.23% from previous year)
- 2024: $623,191 (+$52,156, +9.13% from previous year)
- 2025: $681,132 (+$57,941, +9.30% from previous year)
Sharon home values have grown from $365,625 in 2010 to $681,132 in 2025—an 86% increase. Prices remained fairly flat until 2021, when a wave of new demand drove massive gains. Each year since has continued that upward momentum.
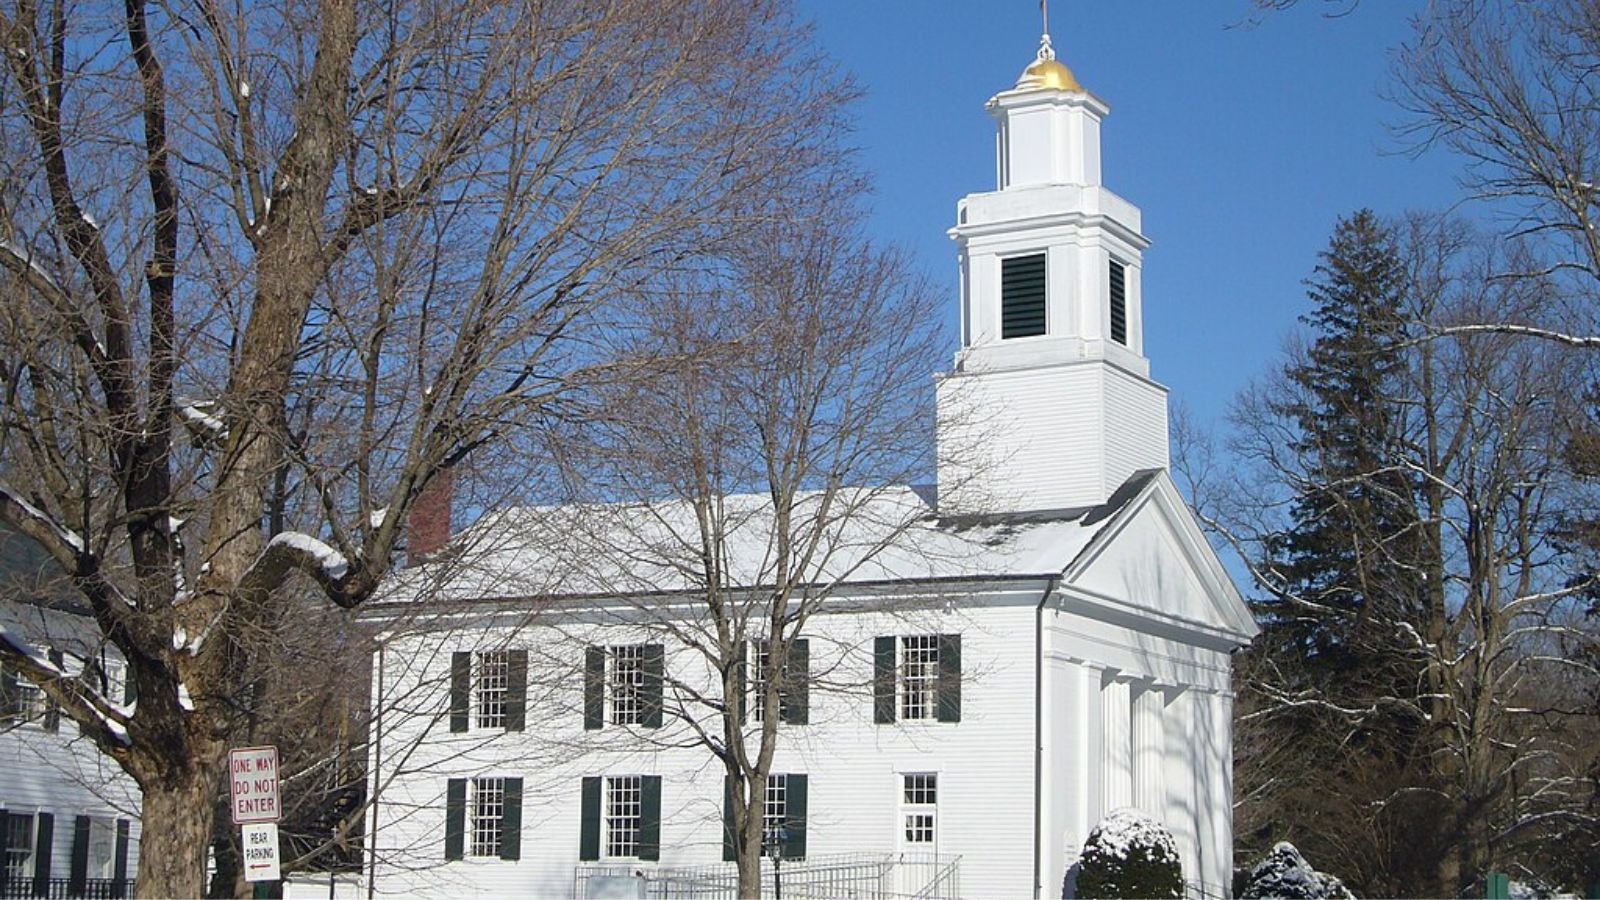
Sharon – Quiet, Historic, and Increasingly Expensive

Nestled in the northwest corner of Litchfield County, Sharon is a quiet town known for its Colonial-era buildings, scenic farmland, and cultural institutions. While it flew under the radar for years, the town has seen intense interest from buyers seeking privacy, natural beauty, and charm without crowds.
The pandemic triggered a steep jump in interest and prices, especially in 2021. With large properties and low density, Sharon has become a favorite among remote workers and retirees. That demand has helped drive home values to new highs year after year.
17. Sherman – 62% Home Price Increase Since 2010
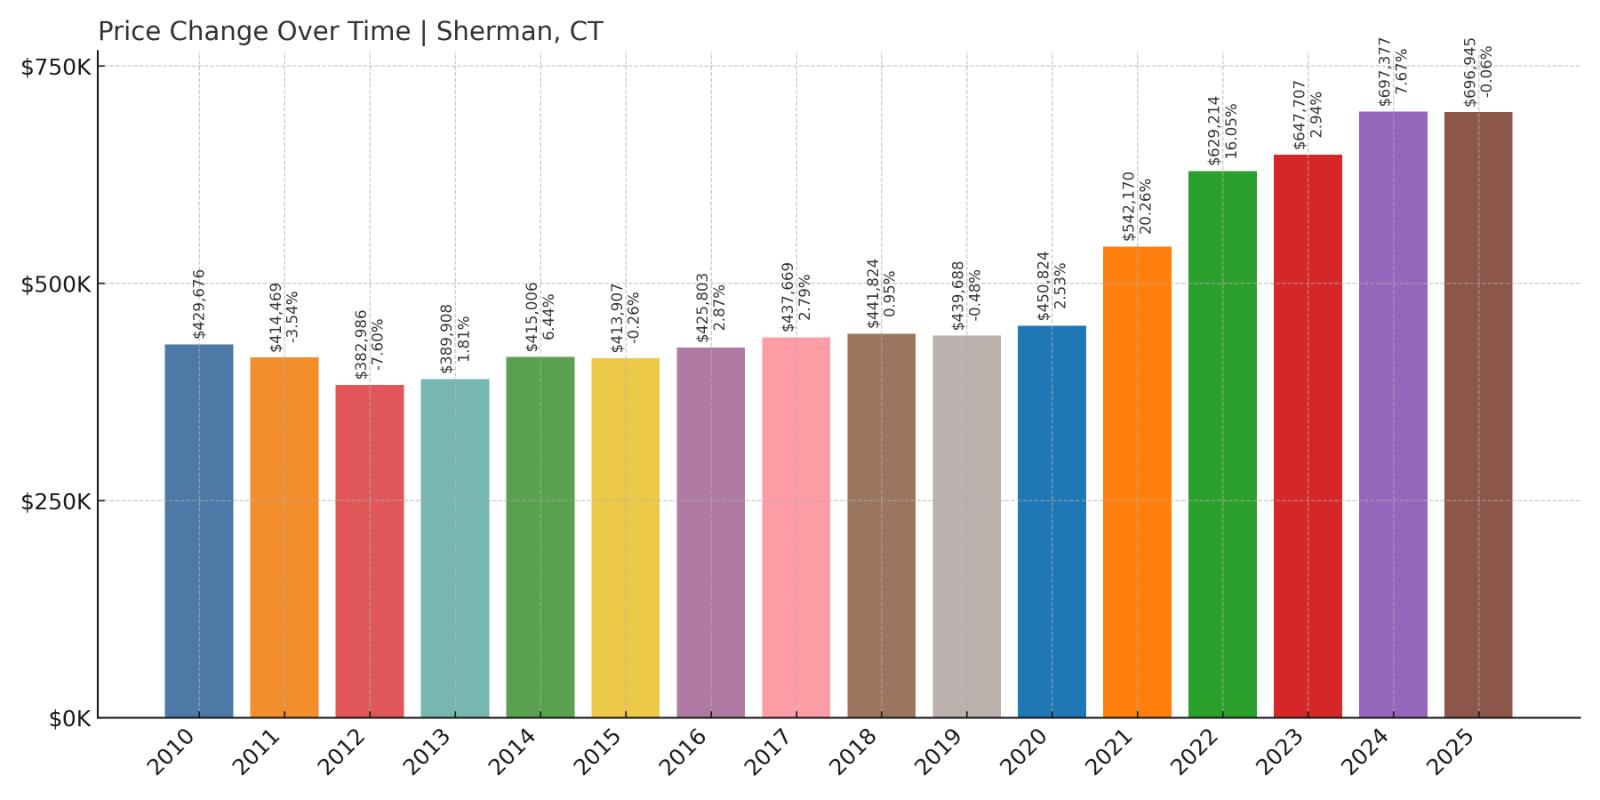
- 2010: $429,676
- 2011: $414,469 (-$15,207, -3.54% from previous year)
- 2012: $382,986 (-$31,483, -7.60% from previous year)
- 2013: $389,908 (+$6,922, +1.81% from previous year)
- 2014: $415,006 (+$25,098, +6.44% from previous year)
- 2015: $413,907 (-$1,099, -0.26% from previous year)
- 2016: $425,803 (+$11,896, +2.87% from previous year)
- 2017: $437,669 (+$11,867, +2.79% from previous year)
- 2018: $441,824 (+$4,155, +0.95% from previous year)
- 2019: $439,688 (-$2,136, -0.48% from previous year)
- 2020: $450,824 (+$11,136, +2.53% from previous year)
- 2021: $542,170 (+$91,346, +20.26% from previous year)
- 2022: $629,214 (+$87,044, +16.05% from previous year)
- 2023: $647,707 (+$18,494, +2.94% from previous year)
- 2024: $697,377 (+$49,670, +7.67% from previous year)
- 2025: $696,945 (-$433, -0.06% from previous year)
From 2010 to 2025, home prices in Sherman rose from $429,676 to $696,945—an increase of 62%. While growth in the early 2010s was modest, the market took off post-2020. The most dramatic surge happened between 2020 and 2022, with prices rising more than 39% in just two years.
Sherman – Gaining Ground on the High-End Market

Sherman, located along the northern edge of Fairfield County, offers a quiet, small-town vibe with proximity to Candlewood Lake and natural preserves. Once a low-profile location, Sherman is increasingly on the radar of buyers looking for rural serenity near the New York border.
While 2025 saw a slight dip, the long-term growth reflects sustained interest and limited supply. With its charming town center and scenic surroundings, Sherman is emerging as a sought-after corner of Connecticut’s luxury market.
16. Madison – 58% Home Price Increase Since 2010

- 2010: $444,172
- 2011: $421,339 (-$22,833, -5.14% from previous year)
- 2012: $400,735 (-$20,604, -4.89% from previous year)
- 2013: $404,674 (+$3,939, +0.98% from previous year)
- 2014: $415,663 (+$10,989, +2.72% from previous year)
- 2015: $414,577 (-$1,087, -0.26% from previous year)
- 2016: $397,015 (-$17,562, -4.24% from previous year)
- 2017: $401,794 (+$4,779, +1.20% from previous year)
- 2018: $403,850 (+$2,057, +0.51% from previous year)
- 2019: $408,208 (+$4,358, +1.08% from previous year)
- 2020: $408,732 (+$524, +0.13% from previous year)
- 2021: $488,550 (+$79,818, +19.53% from previous year)
- 2022: $554,483 (+$65,932, +13.50% from previous year)
- 2023: $595,308 (+$40,825, +7.36% from previous year)
- 2024: $657,427 (+$62,120, +10.43% from previous year)
- 2025: $703,818 (+$46,391, +7.06% from previous year)
Madison’s home prices rose from $444,172 in 2010 to $703,818 in 2025, an increase of 58%. For most of the 2010s, growth was slow and steady, but things changed in 2021 with a nearly 20% leap. Price increases have remained strong through 2025.
Madison – Shoreline Sophistication

Madison, a coastal town along Long Island Sound, blends beach access with upscale living. Its charming downtown, good schools, and cultural offerings make it a perennial favorite for buyers seeking shoreline property without the extreme prices of Greenwich or Westport.
The town’s value has appreciated sharply in the last five years, particularly as remote workers seek lifestyle upgrades. With prices now topping $700,000, Madison has proven to be one of the strongest performers among Connecticut’s shorefront towns.
15. Bridgewater – 40% Home Price Increase Since 2010
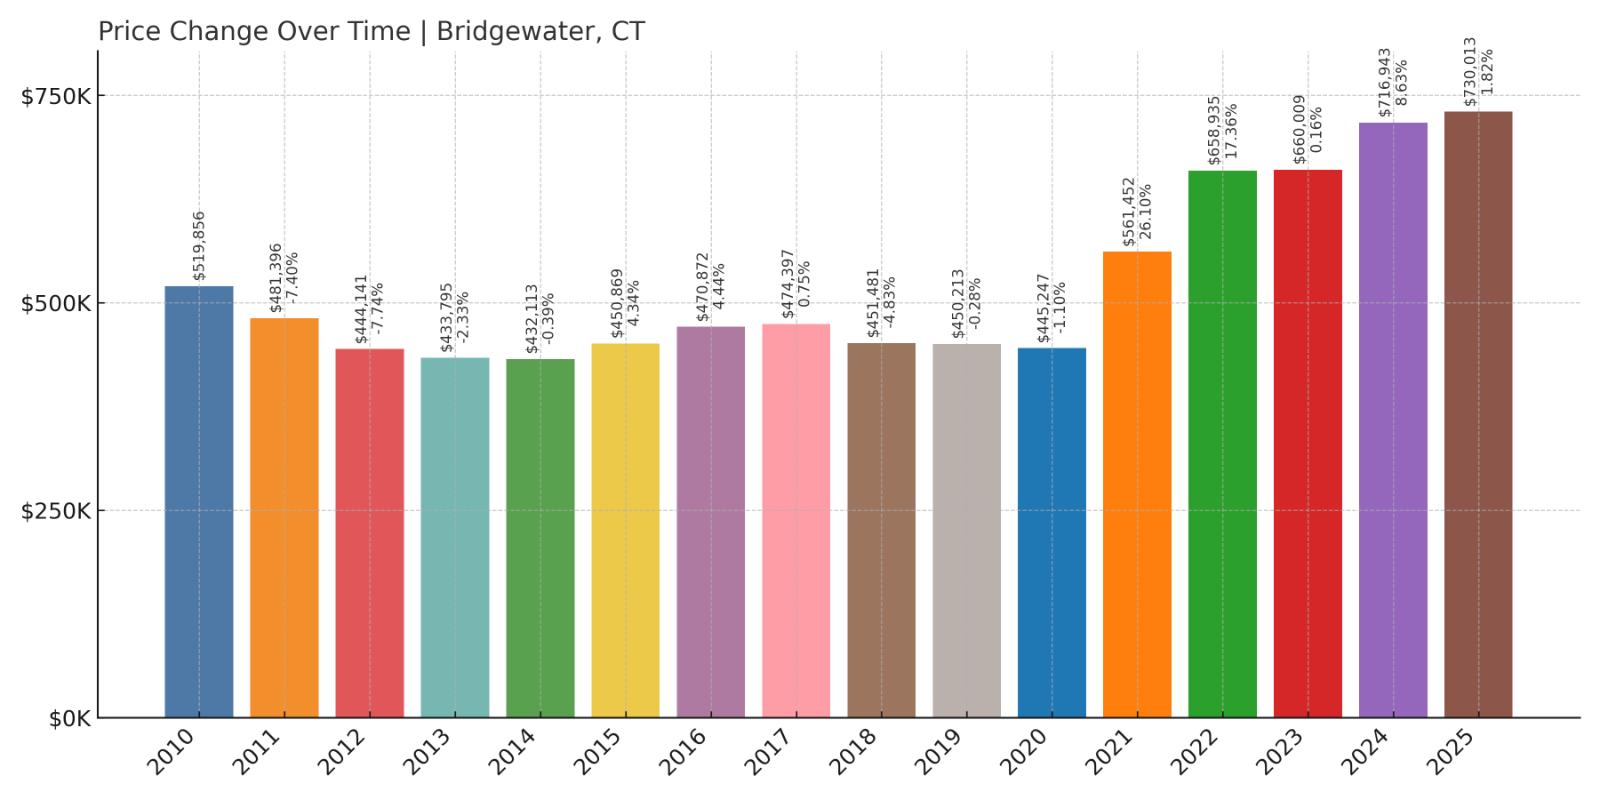
- 2010: $519,856
- 2011: $481,396 (-$38,460, -7.40% from previous year)
- 2012: $444,141 (-$37,254, -7.74% from previous year)
- 2013: $433,795 (-$10,347, -2.33% from previous year)
- 2014: $432,113 (-$1,681, -0.39% from previous year)
- 2015: $450,869 (+$18,756, +4.34% from previous year)
- 2016: $470,872 (+$20,003, +4.44% from previous year)
- 2017: $474,397 (+$3,525, +0.75% from previous year)
- 2018: $451,481 (-$22,916, -4.83% from previous year)
- 2019: $450,213 (-$1,268, -0.28% from previous year)
- 2020: $445,247 (-$4,966, -1.10% from previous year)
- 2021: $561,452 (+$116,205, +26.10% from previous year)
- 2022: $658,935 (+$97,483, +17.36% from previous year)
- 2023: $660,009 (+$1,074, +0.16% from previous year)
- 2024: $716,943 (+$56,935, +8.63% from previous year)
- 2025: $730,013 (+$13,070, +1.82% from previous year)
Bridgewater’s home prices rose from $519,856 in 2010 to $730,013 in 2025—a 40% increase. Much of that gain came in a short window between 2020 and 2022, where prices soared more than 48%. The rest of the decade saw smaller, uneven shifts with declines and modest gains.
Bridgewater – A Small Town With Big Demand

Bridgewater is the only dry town left in Connecticut, but that hasn’t dampened buyer interest. Nestled in Litchfield County, it has a rural, low-density charm and a history of high-profile weekenders. Limited housing stock and scenic surroundings make it especially appealing to buyers seeking privacy and natural beauty.
The post-2020 jump in prices reflects the town’s surge in appeal during the remote work era. While recent gains have cooled, Bridgewater remains one of Connecticut’s most expensive rural markets and a top destination for luxury seekers in western Connecticut.
14. Lyme – 46% Home Price Increase Since 2010
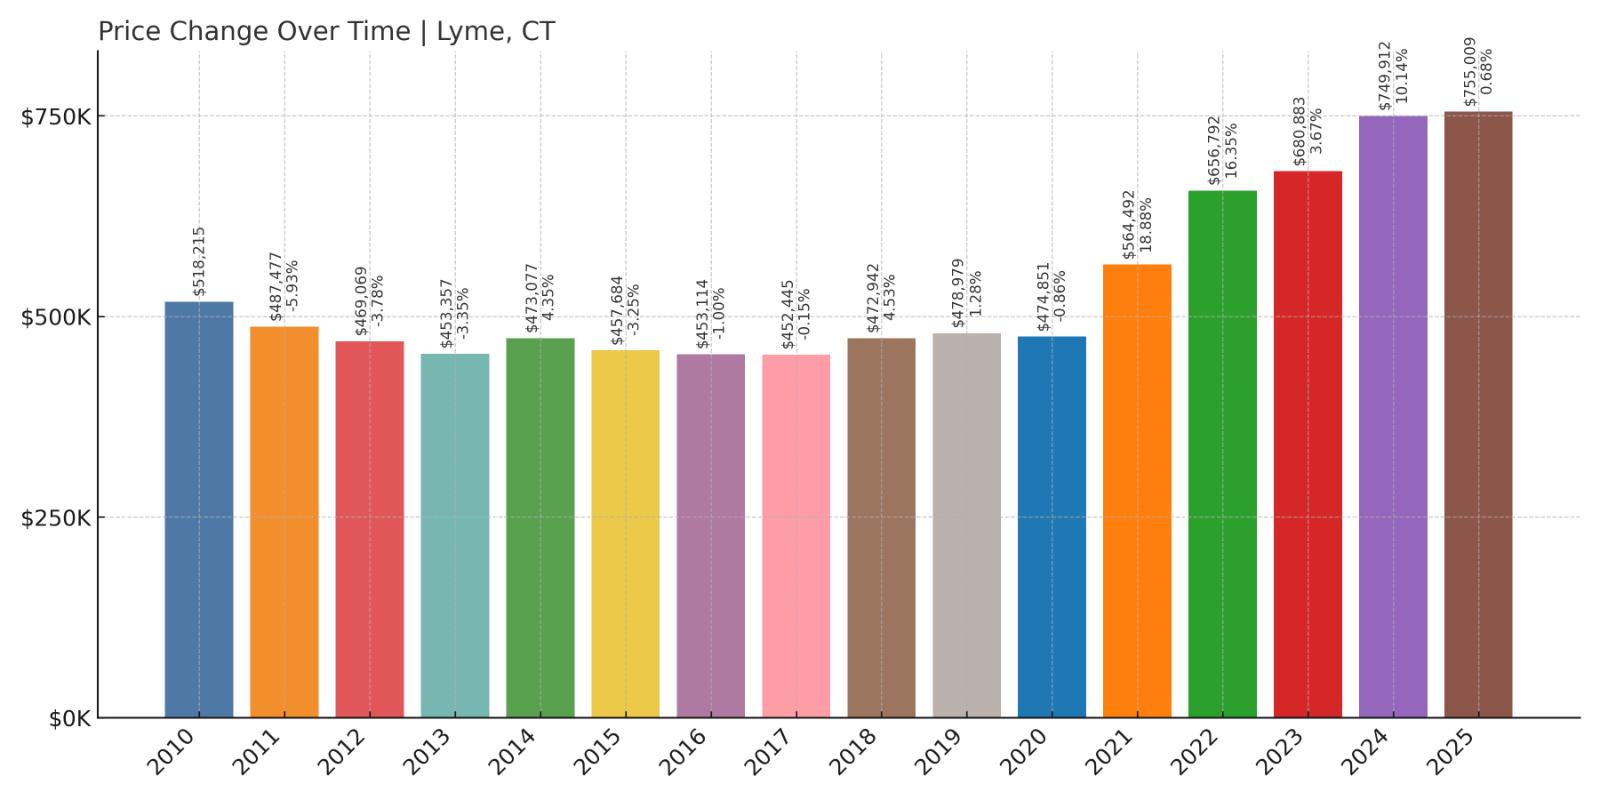
- 2010: $518,215
- 2011: $487,477 (-$30,737, -5.93% from previous year)
- 2012: $469,069 (-$18,408, -3.78% from previous year)
- 2013: $453,357 (-$15,712, -3.35% from previous year)
- 2014: $473,077 (+$19,720, +4.35% from previous year)
- 2015: $457,684 (-$15,393, -3.25% from previous year)
- 2016: $453,114 (-$4,570, -1.00% from previous year)
- 2017: $452,445 (-$669, -0.15% from previous year)
- 2018: $472,942 (+$20,497, +4.53% from previous year)
- 2019: $478,979 (+$6,037, +1.28% from previous year)
- 2020: $474,851 (-$4,128, -0.86% from previous year)
- 2021: $564,492 (+$89,641, +18.88% from previous year)
- 2022: $656,792 (+$92,300, +16.35% from previous year)
- 2023: $680,883 (+$24,091, +3.67% from previous year)
- 2024: $749,912 (+$69,029, +10.14% from previous year)
- 2025: $755,009 (+$5,097, +0.68% from previous year)
Lyme’s home prices climbed from $518,215 in 2010 to $755,009 in 2025—an increase of 46%. After a flat and even declining stretch through much of the 2010s, prices surged after 2020, with strong annual gains continuing through 2024.
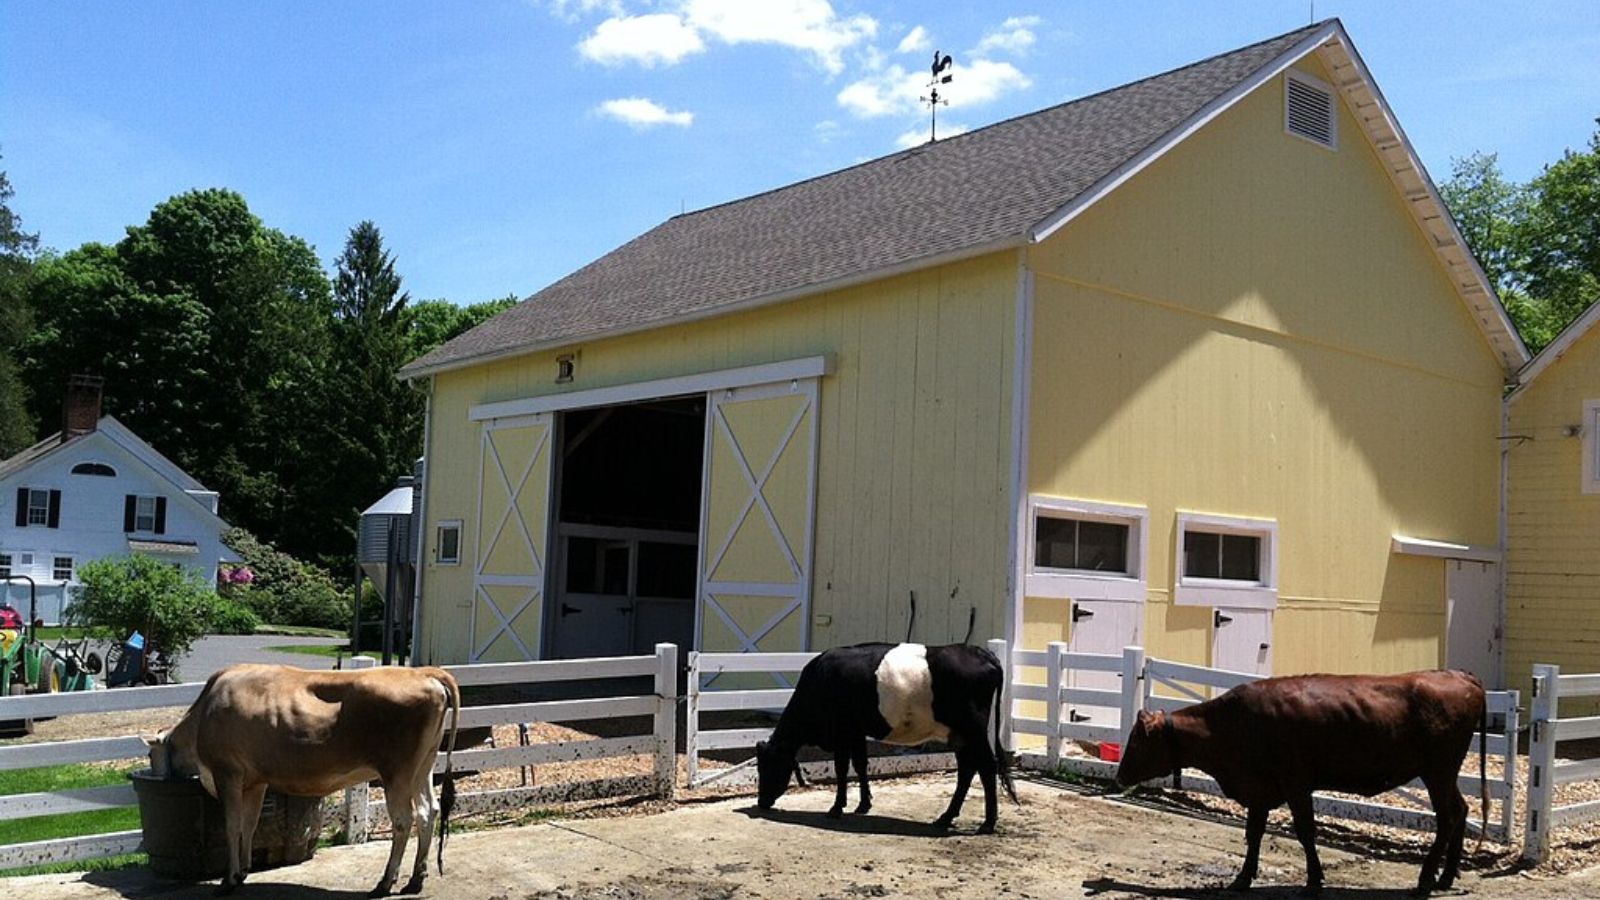
Lyme – Tranquility With a Rising Price Tag

John Phelan, CC BY-SA 4.0, via Wikimedia Commons
Famous for the Lyme Art Colony and scenic Connecticut River frontage, Lyme is a quiet coastal town with deep historical roots. Its limited development and preserved natural lands give it enduring appeal to buyers looking for peace, beauty, and privacy.
The town’s recent price jumps have coincided with a broader push for rural and semi-rural homes. As buyers value space and natural settings more, Lyme’s classic countryside atmosphere has translated directly into rising demand—and rising prices.
13. Redding – 28% Home Price Increase Since 2010
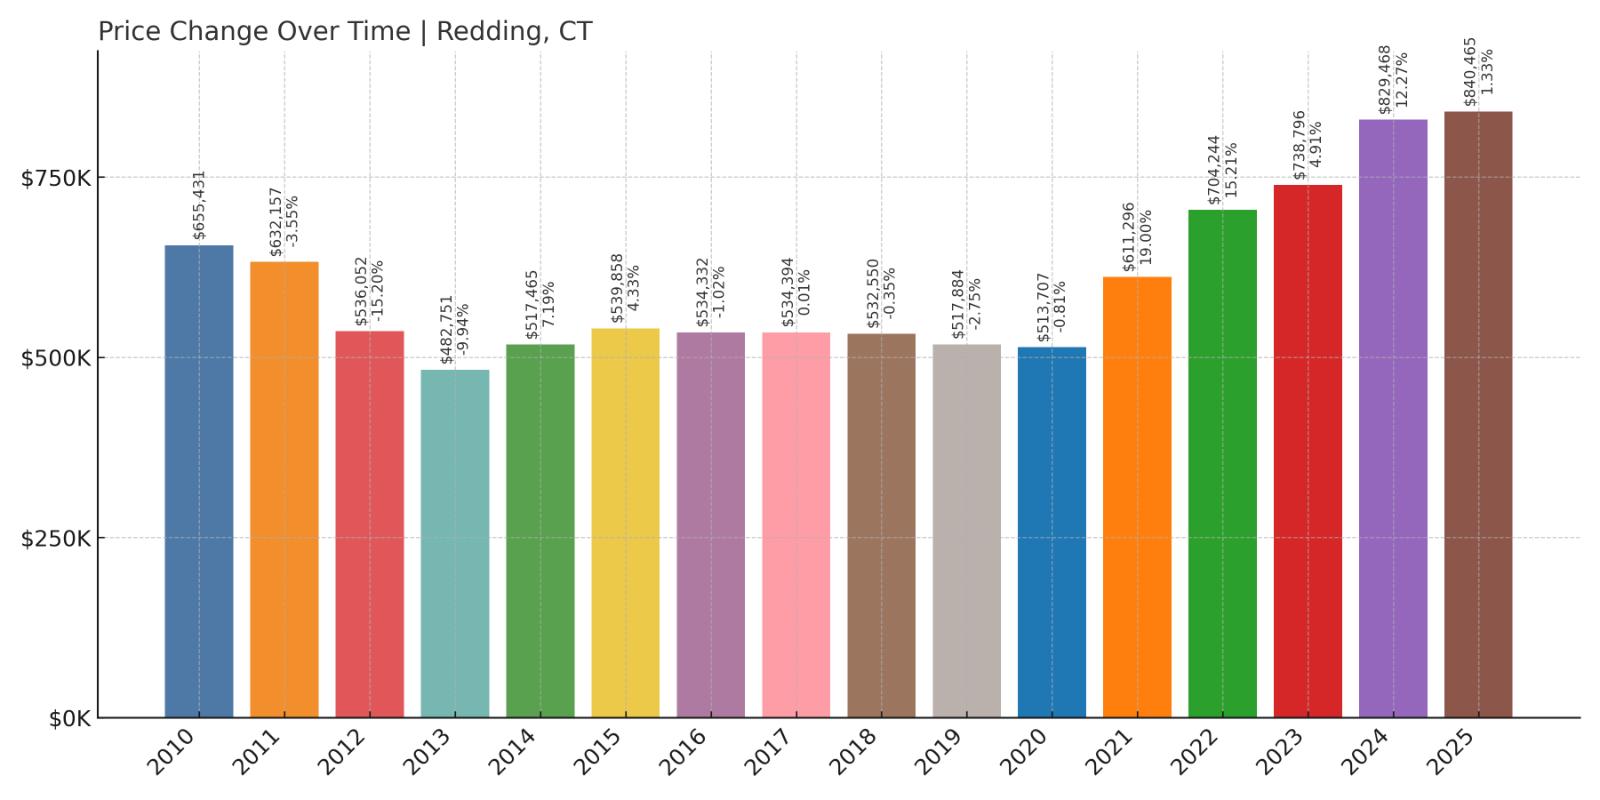
- 2010: $655,431
- 2011: $632,157 (-$23,274, -3.55% from previous year)
- 2012: $536,052 (-$96,105, -15.20% from previous year)
- 2013: $482,751 (-$53,301, -9.94% from previous year)
- 2014: $517,465 (+$34,714, +7.19% from previous year)
- 2015: $539,858 (+$22,393, +4.33% from previous year)
- 2016: $534,332 (-$5,526, -1.02% from previous year)
- 2017: $534,394 (+$62, +0.01% from previous year)
- 2018: $532,550 (-$1,844, -0.35% from previous year)
- 2019: $517,884 (-$14,666, -2.75% from previous year)
- 2020: $513,707 (-$4,177, -0.81% from previous year)
- 2021: $611,296 (+$97,589, +19.00% from previous year)
- 2022: $704,244 (+$92,948, +15.21% from previous year)
- 2023: $738,796 (+$34,552, +4.91% from previous year)
- 2024: $829,468 (+$90,672, +12.27% from previous year)
- 2025: $840,465 (+$10,997, +1.33% from previous year)
Redding’s home values increased from $655,431 in 2010 to $840,465 in 2025—a 28% gain. The town struggled through the early and mid-2010s, bottoming out in 2013. But prices bounced back sharply after 2020, with double-digit growth continuing through 2024.
Redding – Rebounding From a Decade of Decline
Redding, often called “the Vermont of Connecticut,” blends a rural landscape with sophisticated charm. Once known for its sluggish price trends, the town has recently benefited from a wave of interest in more secluded and scenic communities within commuting distance of New York City.
Redding’s strong rebound reflects that changing perception. With increasing demand and a well-preserved natural environment, this quiet town has become one of the state’s pricier and more desirable locations once again.
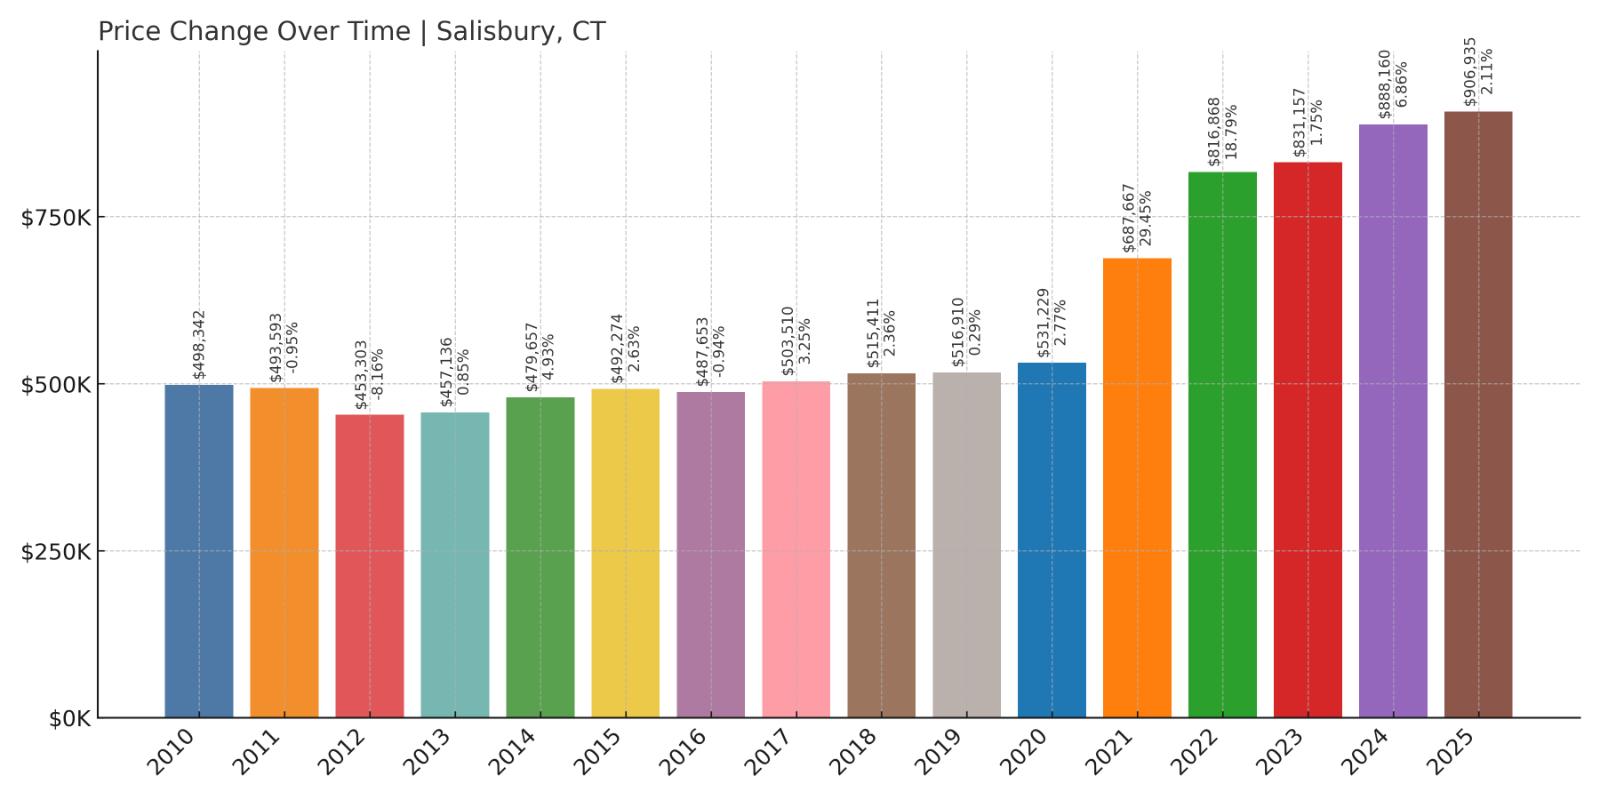
12. Salisbury – 82% Home Price Increase Since 2010
🔥 Would you like to save this?
- 2010: $498,342
- 2011: $493,593 (-$4,749, -0.95% from previous year)
- 2012: $453,303 (-$40,290, -8.16% from previous year)
- 2013: $457,136 (+$3,833, +0.85% from previous year)
- 2014: $479,657 (+$22,522, +4.93% from previous year)
- 2015: $492,274 (+$12,616, +2.63% from previous year)
- 2016: $487,653 (-$4,621, -0.94% from previous year)
- 2017: $503,510 (+$15,858, +3.25% from previous year)
- 2018: $515,411 (+$11,901, +2.36% from previous year)
- 2019: $516,910 (+$1,499, +0.29% from previous year)
- 2020: $531,229 (+$14,319, +2.77% from previous year)
- 2021: $687,667 (+$156,439, +29.45% from previous year)
- 2022: $816,868 (+$129,201, +18.79% from previous year)
- 2023: $831,157 (+$14,289, +1.75% from previous year)
- 2024: $888,160 (+$57,003, +6.86% from previous year)
- 2025: $906,935 (+$18,776, +2.11% from previous year)
Salisbury’s home prices increased from $498,342 in 2010 to $906,935 in 2025—a significant 82% gain. The biggest leap came in 2021, with prices jumping nearly 30%. That growth continued strongly into 2022 and beyond.
Salisbury – Upscale Living in the Northwest Hills
Salisbury offers a rare blend of rural charm, cultural sophistication, and access to lakes and trails. Nestled in Connecticut’s northwest corner, it’s long attracted second-home owners and weekenders from New York and Boston, but the pandemic accelerated that demand dramatically.
With a strong market and limited inventory, Salisbury has seen home prices climb fast. Its appeal shows no signs of slowing, especially as more buyers prioritize privacy, nature, and high-end homes in a peaceful setting.
11. Fairfield – 77% Home Price Increase Since 2012
- 2010: N/A
- 2011: N/A
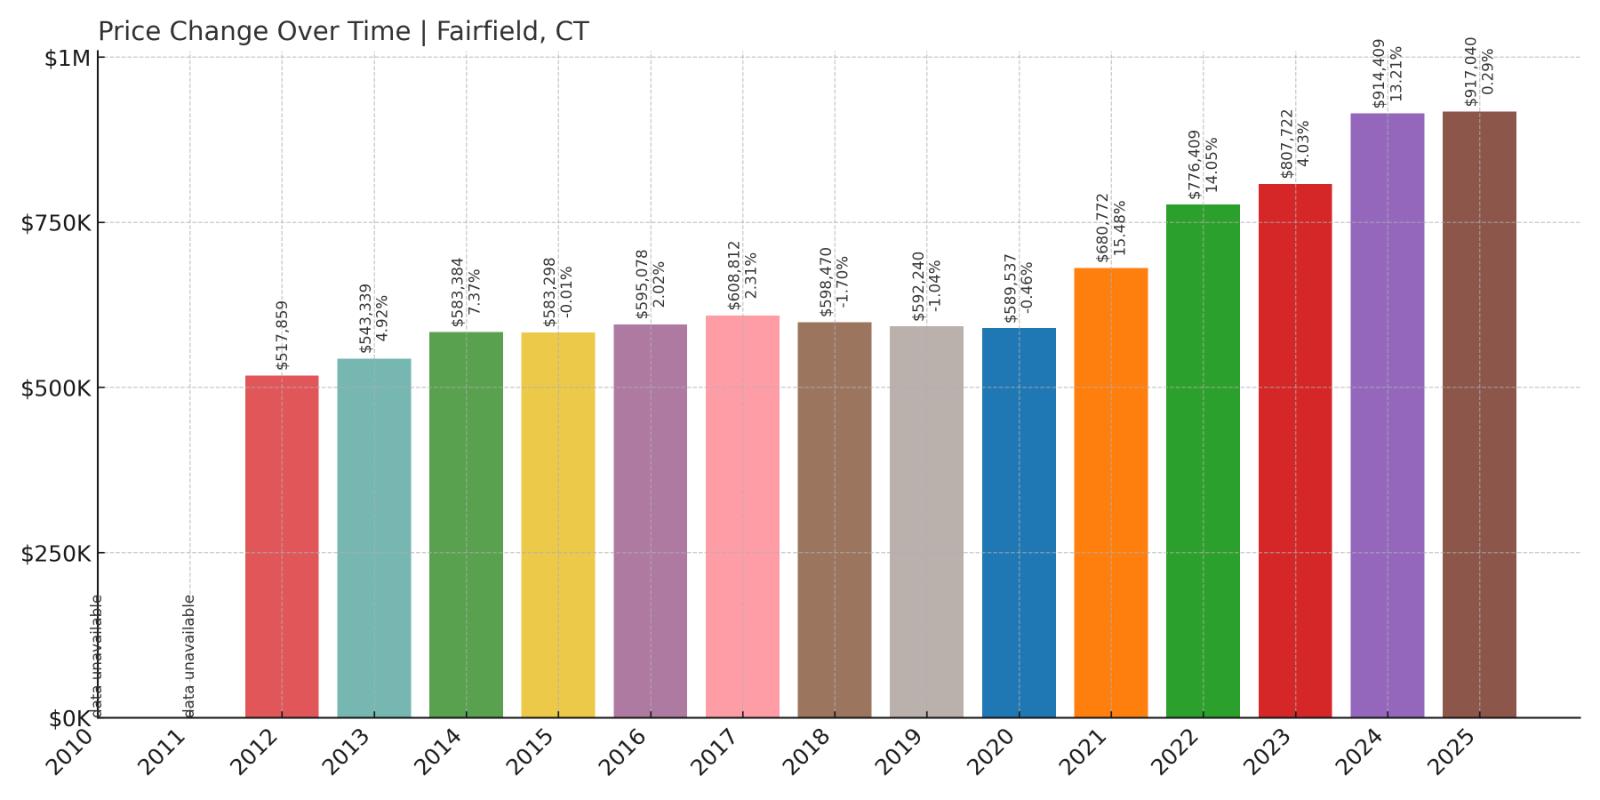
- 2012: $517,859
- 2013: $543,339 (+$25,480, +4.92% from previous year)
- 2014: $583,384 (+$40,045, +7.37% from previous year)
- 2015: $583,298 (-$86, -0.01% from previous year)
- 2016: $595,078 (+$11,780, +2.02% from previous year)
- 2017: $608,812 (+$13,734, +2.31% from previous year)
- 2018: $598,470 (-$10,342, -1.70% from previous year)
- 2019: $592,240 (-$6,230, -1.04% from previous year)
- 2020: $589,537 (-$2,703, -0.46% from previous year)
- 2021: $680,772 (+$91,235, +15.48% from previous year)
- 2022: $776,409 (+$95,637, +14.05% from previous year)
- 2023: $807,722 (+$31,313, +4.03% from previous year)
- 2024: $914,409 (+$106,688, +13.21% from previous year)
- 2025: $917,040 (+$2,630, +0.29% from previous year)
Fairfield’s home values climbed from $517,859 in 2012 to $917,040 in 2025—a 77% increase. After a stretch of slow growth, prices accelerated rapidly beginning in 2021, with double-digit gains in three of the next four years.
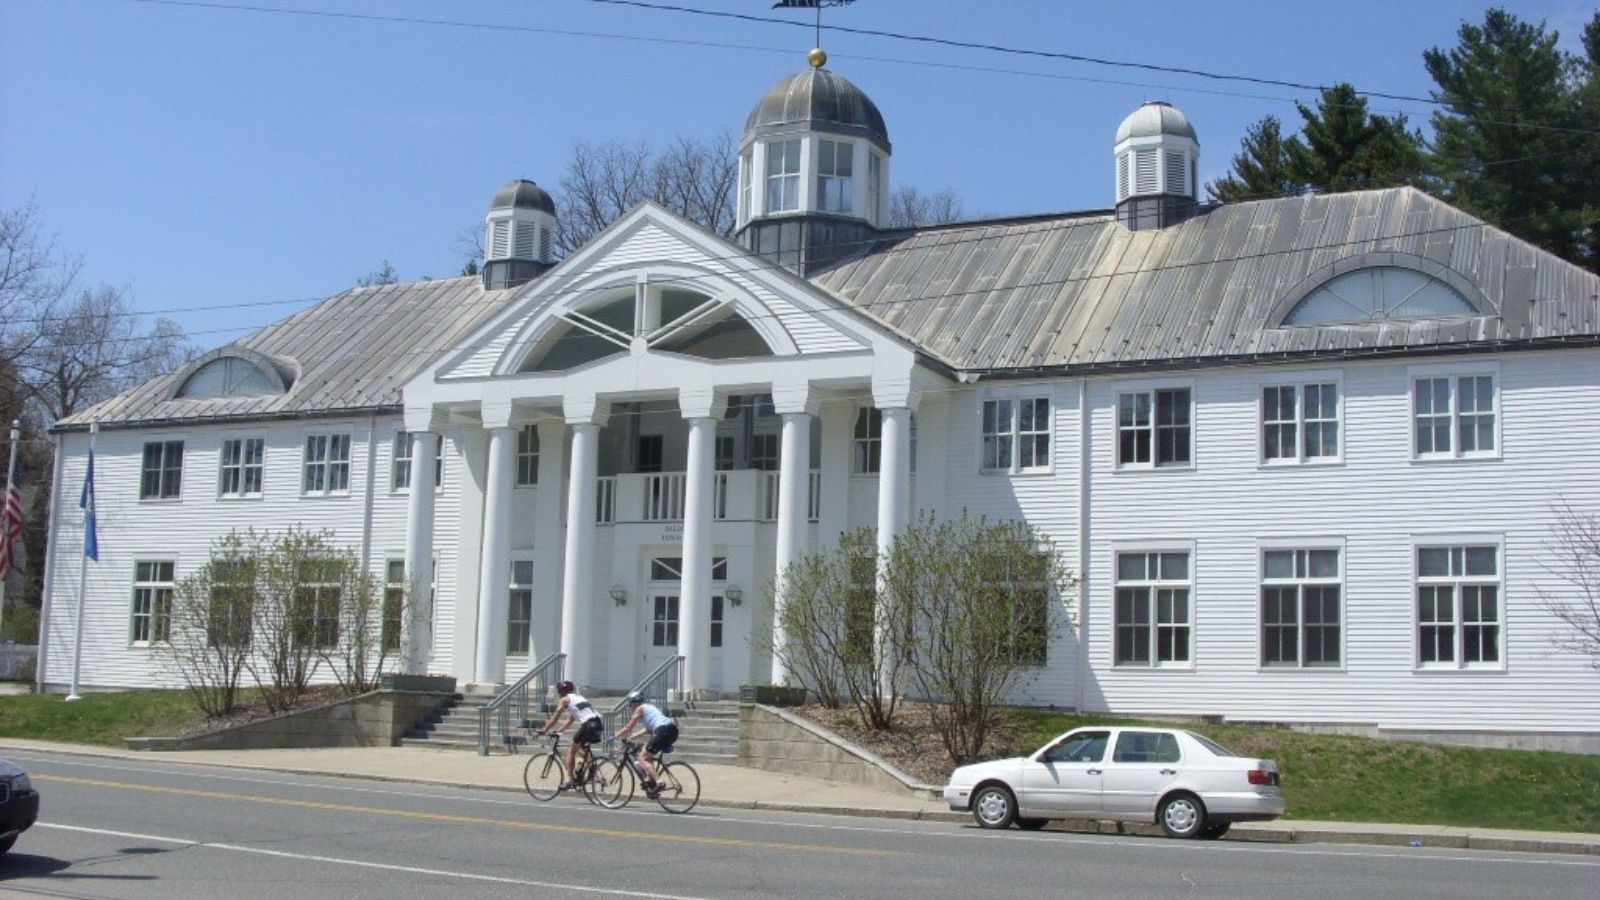
Fairfield – A Suburban Powerhouse
Fairfield is one of Connecticut’s most recognizable towns, offering beaches, top-rated schools, and a vibrant downtown. Located along the Metro-North line, it balances shoreline living with suburban convenience, making it attractive to a wide range of buyers.
The sharp rise in values since 2020 reflects its growing popularity among remote workers and city transplants. With strong fundamentals and high-quality amenities, Fairfield continues to be one of the state’s most expensive and desirable towns.
10. Roxbury – 61% Home Price Increase Since 2012
- 2010: N/A
- 2011: N/A
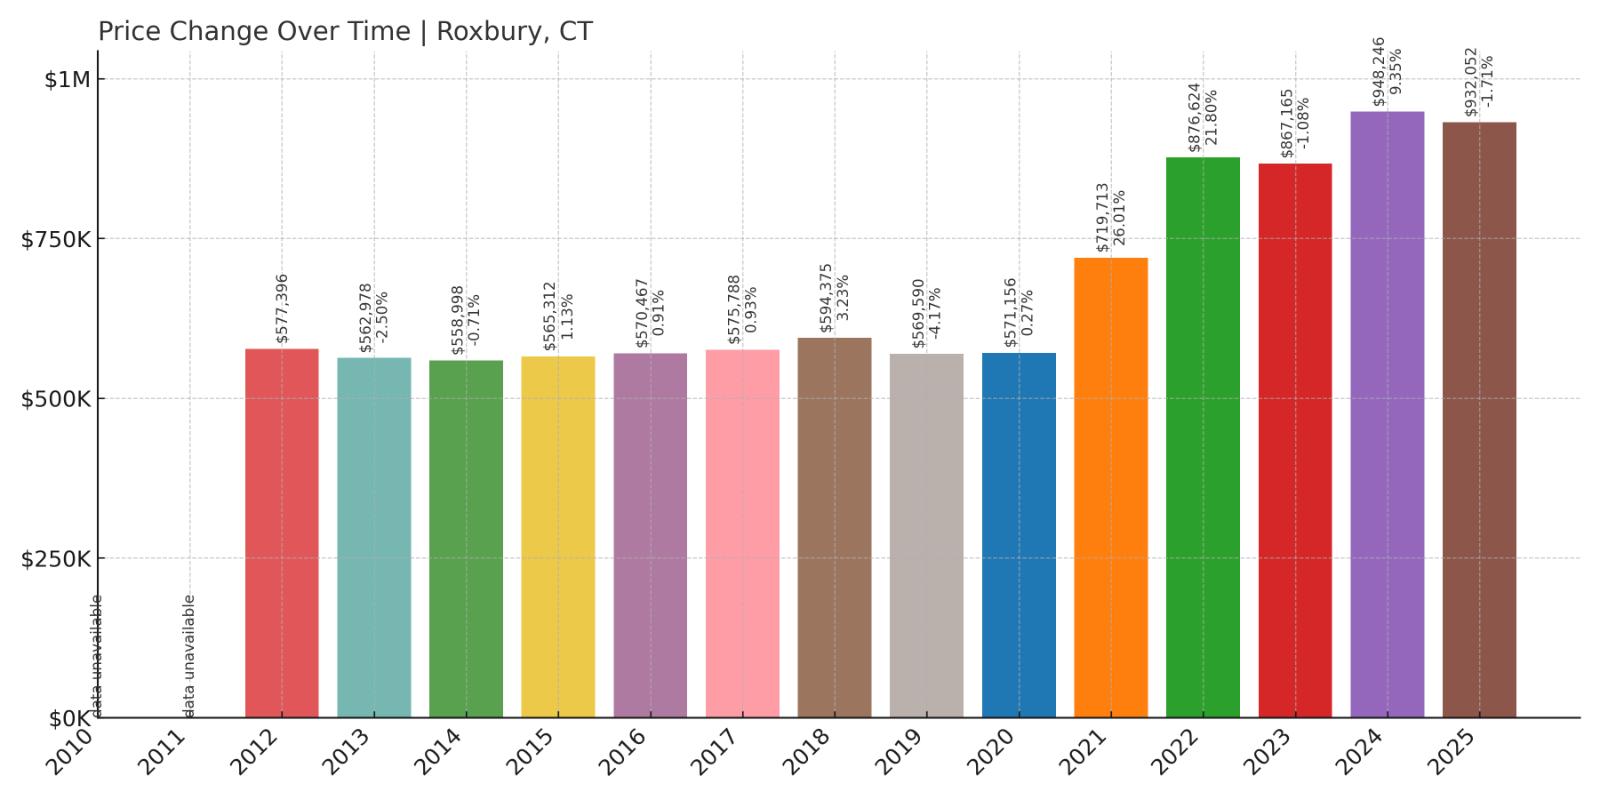
- 2012: $577,396
- 2013: $562,978 (-$14,418, -2.50% from previous year)
- 2014: $558,998 (-$3,979, -0.71% from previous year)
- 2015: $565,312 (+$6,314, +1.13% from previous year)
- 2016: $570,467 (+$5,155, +0.91% from previous year)
- 2017: $575,788 (+$5,320, +0.93% from previous year)
- 2018: $594,375 (+$18,588, +3.23% from previous year)
- 2019: $569,590 (-$24,785, -4.17% from previous year)
- 2020: $571,156 (+$1,566, +0.27% from previous year)
- 2021: $719,713 (+$148,557, +26.01% from previous year)
- 2022: $876,624 (+$156,911, +21.80% from previous year)
- 2023: $867,165 (-$9,459, -1.08% from previous year)
- 2024: $948,246 (+$81,081, +9.35% from previous year)
- 2025: $932,052 (-$16,194, -1.71% from previous year)
Roxbury’s home prices grew from $577,396 in 2012 to $932,052 in 2025, a 61% increase. While there were minor dips in 2013 and again in 2023 and 2025, the years 2021 and 2022 delivered extraordinary growth, with prices skyrocketing by over 53% combined.
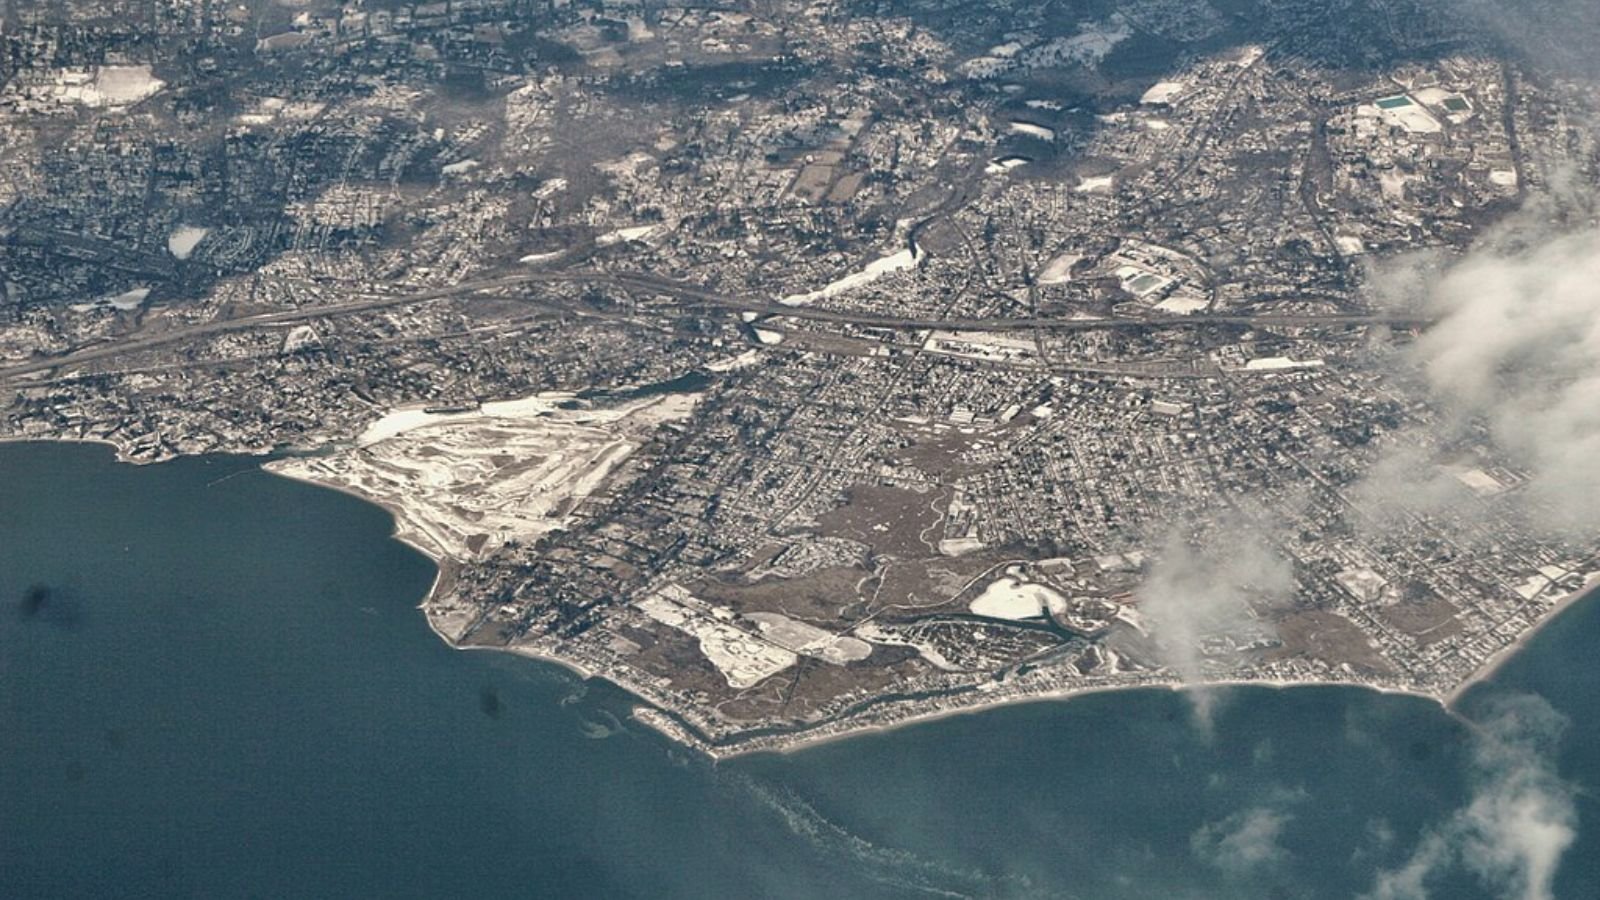
Roxbury – Elite Country Living With Soaring Prices
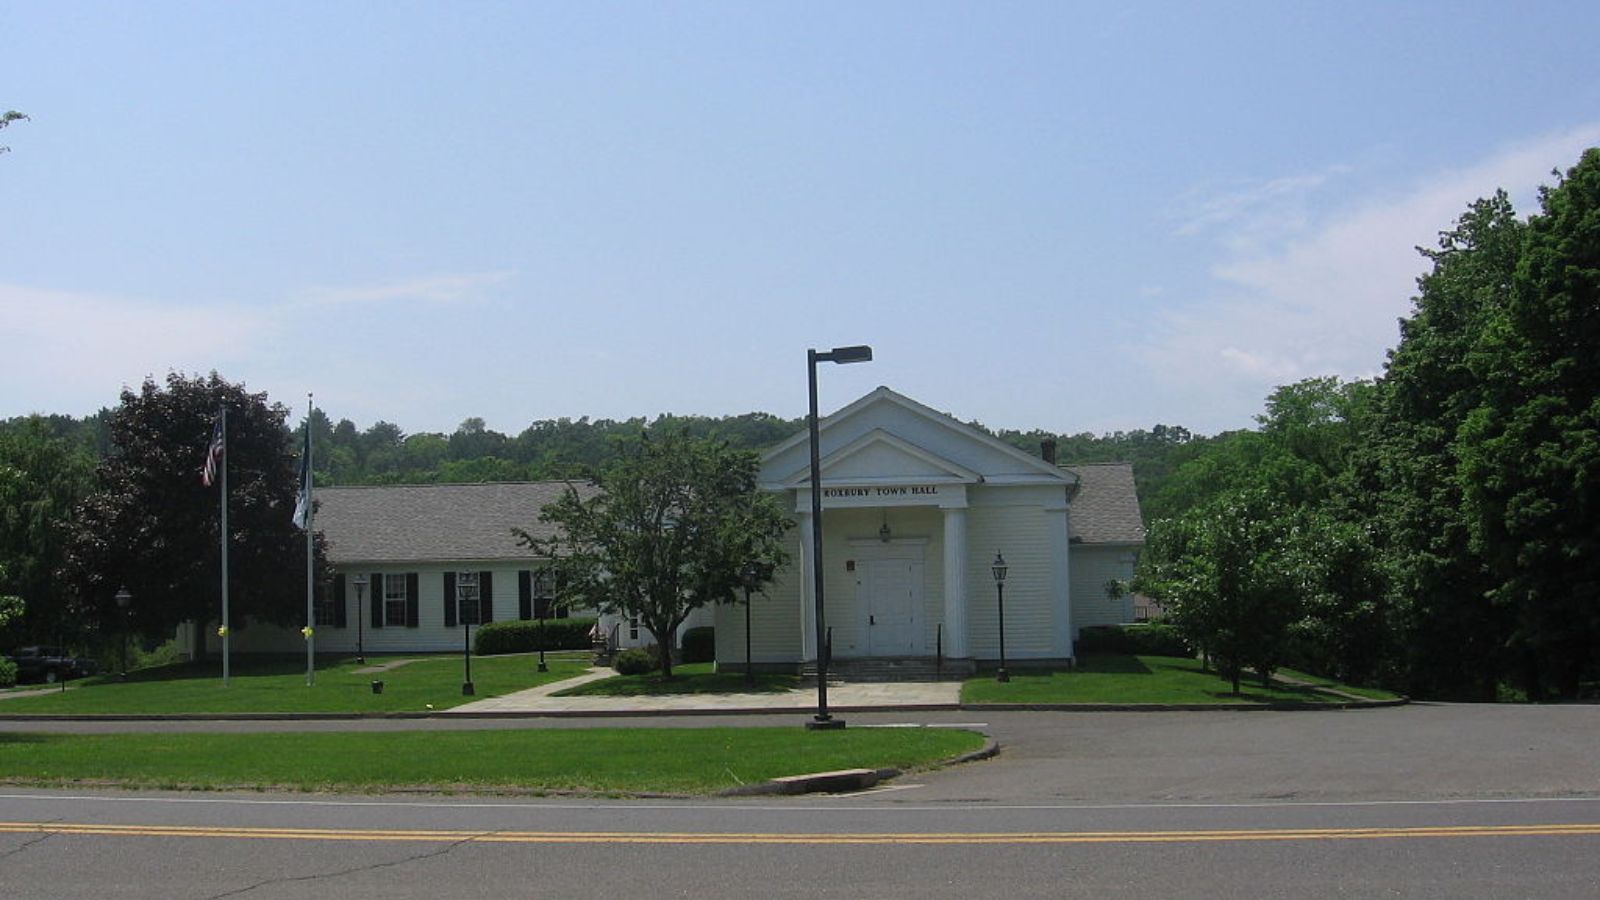
Roxbury is one of Litchfield County’s most exclusive enclaves, a quiet town that has attracted writers, actors, and artists for decades. With strict zoning and a small housing inventory, the market here is tight and intensely competitive. Homes are typically set on sprawling lots with scenic views, which adds to the town’s desirability and high price tag.
The sharp increases in 2021 and 2022 reflect a rush of wealthy buyers fleeing urban areas in search of space and seclusion. Even with recent fluctuations, Roxbury’s long-term price trajectory keeps it firmly in Connecticut’s top 10 for home values.
9. Easton – 46% Home Price Increase Since 2010
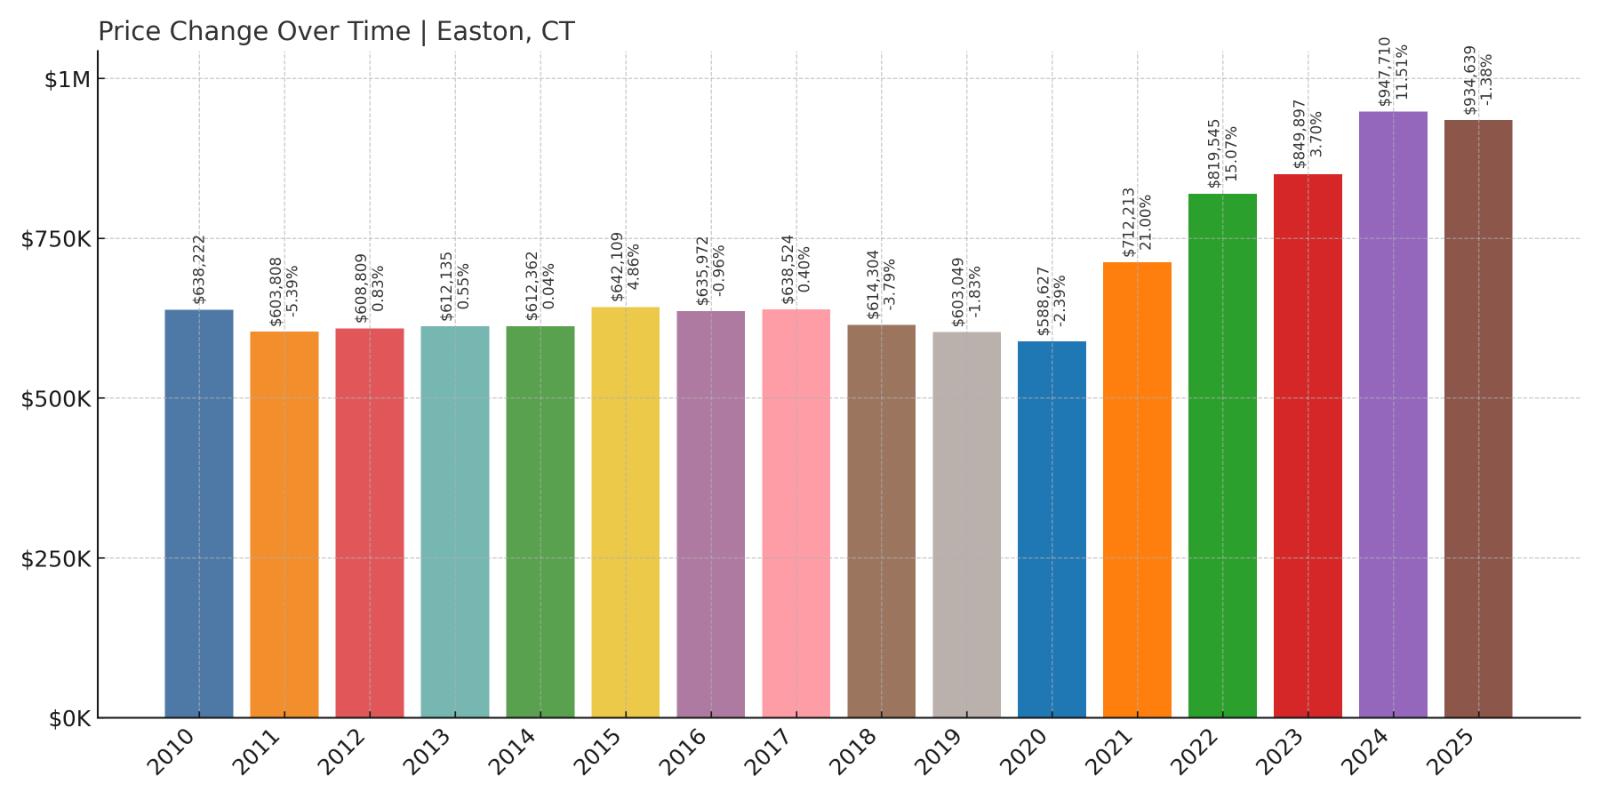
- 2010: $638,222
- 2011: $603,808 (-$34,414, -5.39% from previous year)
- 2012: $608,809 (+$5,002, +0.83% from previous year)
- 2013: $612,135 (+$3,326, +0.55% from previous year)
- 2014: $612,362 (+$226, +0.04% from previous year)
- 2015: $642,109 (+$29,748, +4.86% from previous year)
- 2016: $635,972 (-$6,137, -0.96% from previous year)
- 2017: $638,524 (+$2,552, +0.40% from previous year)
- 2018: $614,304 (-$24,220, -3.79% from previous year)
- 2019: $603,049 (-$11,255, -1.83% from previous year)
- 2020: $588,627 (-$14,422, -2.39% from previous year)
- 2021: $712,213 (+$123,586, +21.00% from previous year)
- 2022: $819,545 (+$107,333, +15.07% from previous year)
- 2023: $849,897 (+$30,352, +3.70% from previous year)
- 2024: $947,710 (+$97,813, +11.51% from previous year)
- 2025: $934,639 (-$13,071, -1.38% from previous year)
From $638,222 in 2010 to $934,639 in 2025, Easton saw a 46% rise in home prices. The most explosive growth came after 2020, with three consecutive double-digit gains that pushed prices into the high $900,000s. The slight pullback in 2025 hasn’t erased years of rapid growth.
Easton – Room to Breathe, Close to It All
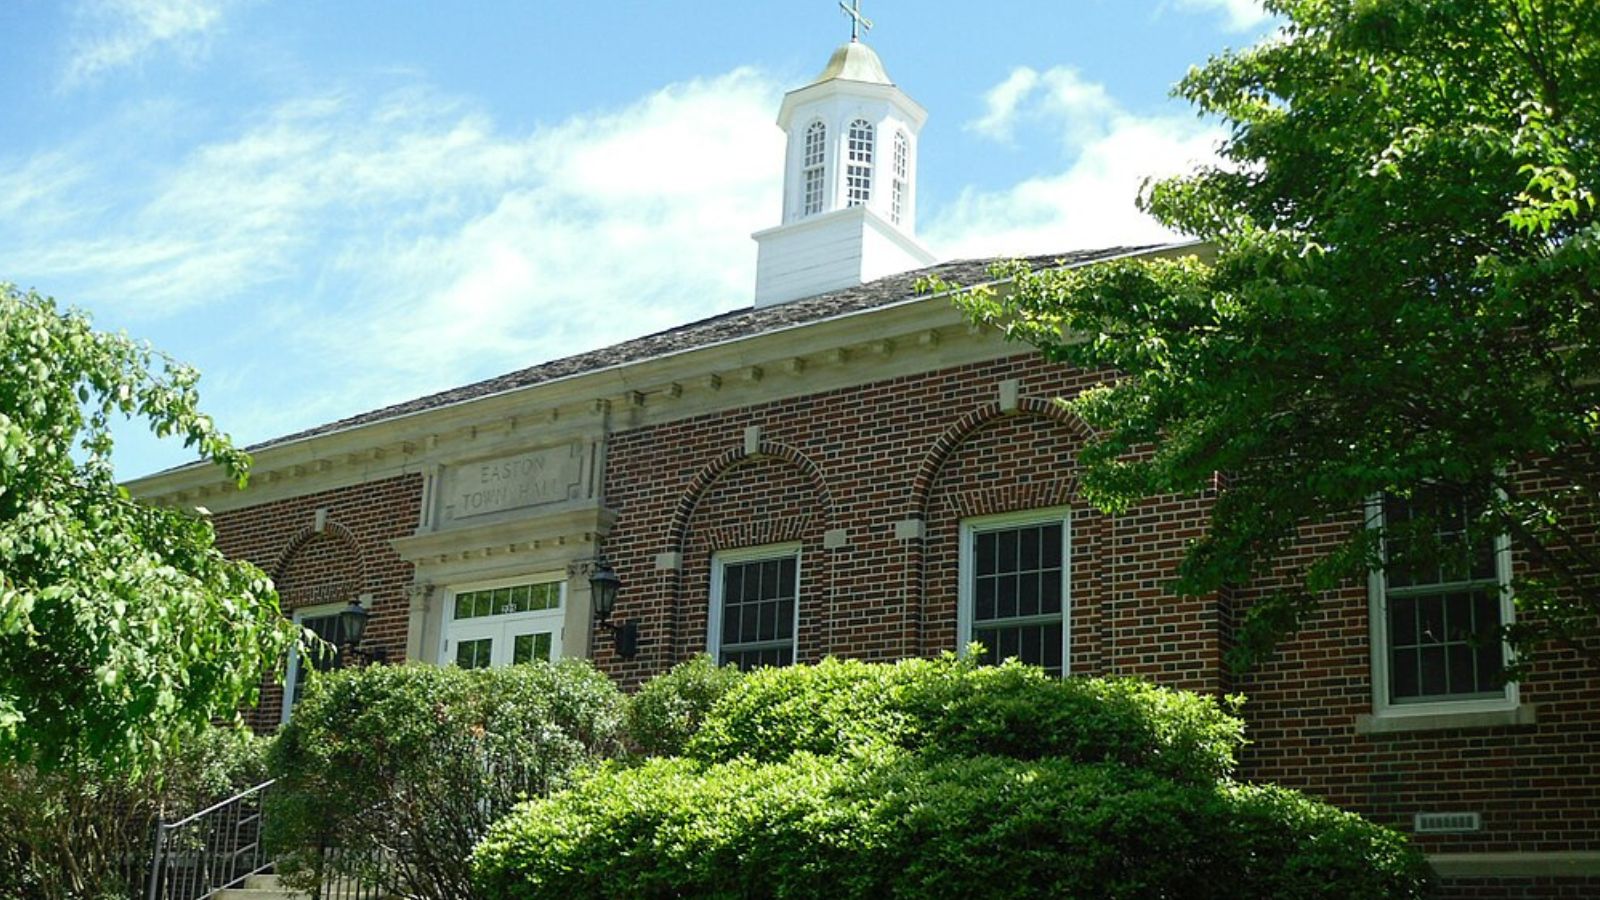
Easton is a unique market in Fairfield County—heavily wooded, sparsely developed, and committed to maintaining its rural character. Yet it’s only minutes from larger towns like Fairfield and Westport. That contrast of privacy and proximity is exactly what today’s buyers are after, especially in the work-from-home era.
Easton’s agricultural heritage, excellent schools, and large properties have made it especially attractive to families and professionals looking for a quieter lifestyle without sacrificing access to city conveniences. With inventory still tight, Easton’s place in the top 10 is well earned.
8. Ridgefield – 54% Home Price Increase Since 2010
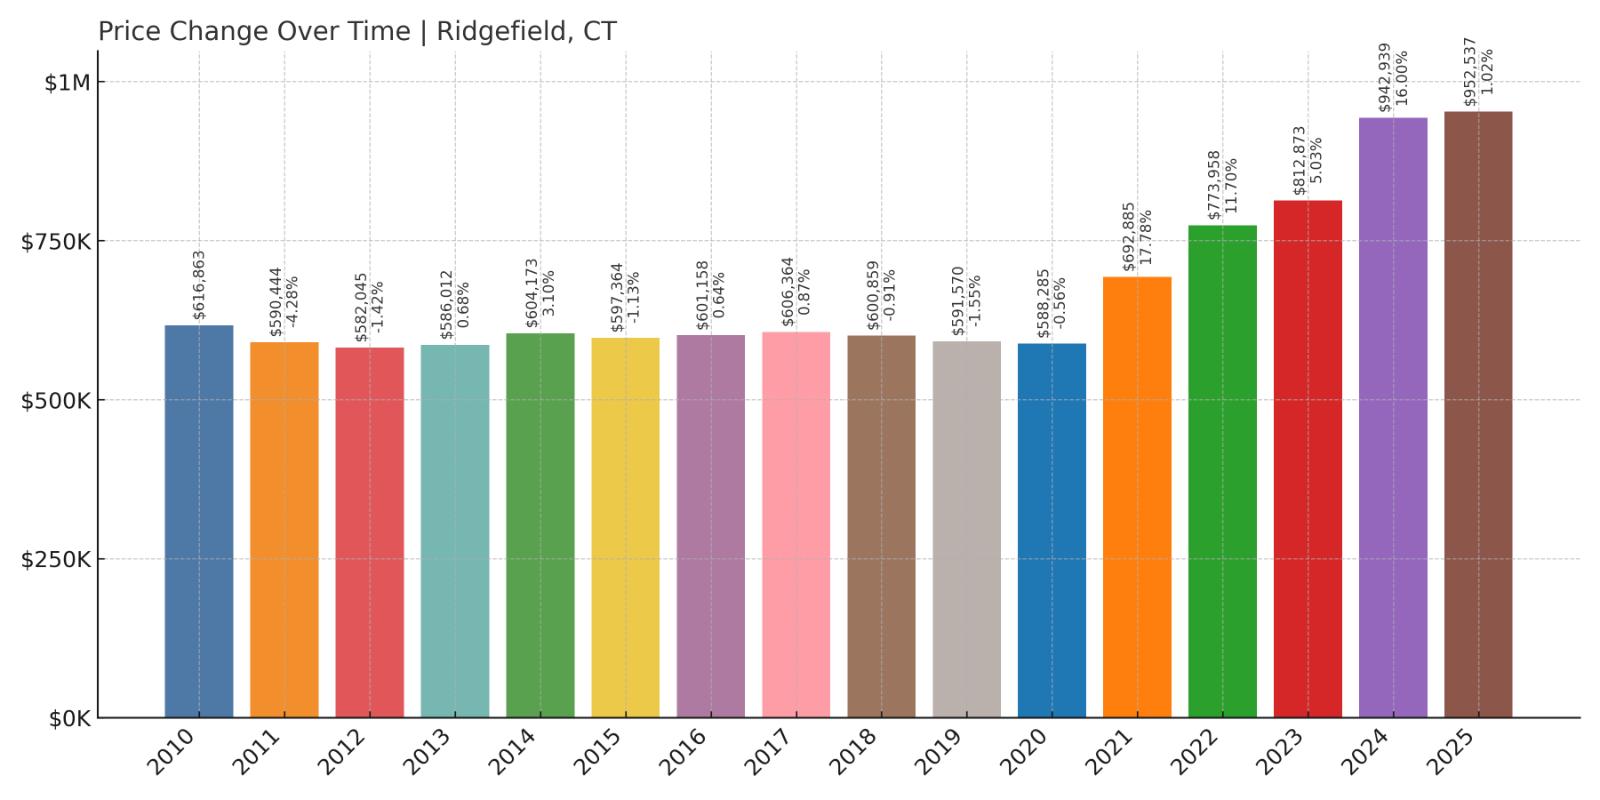
- 2010: $616,863
- 2011: $590,444 (-$26,419, -4.28% from previous year)
- 2012: $582,045 (-$8,399, -1.42% from previous year)
- 2013: $586,012 (+$3,967, +0.68% from previous year)
- 2014: $604,173 (+$18,161, +3.10% from previous year)
- 2015: $597,364 (-$6,809, -1.13% from previous year)
- 2016: $601,158 (+$3,794, +0.64% from previous year)
- 2017: $606,364 (+$5,206, +0.87% from previous year)
- 2018: $600,859 (-$5,505, -0.91% from previous year)
- 2019: $591,570 (-$9,289, -1.55% from previous year)
- 2020: $588,285 (-$3,285, -0.56% from previous year)
- 2021: $692,885 (+$104,600, +17.78% from previous year)
- 2022: $773,958 (+$81,072, +11.70% from previous year)
- 2023: $812,873 (+$38,916, +5.03% from previous year)
- 2024: $942,939 (+$130,066, +16.00% from previous year)
- 2025: $952,537 (+$9,598, +1.02% from previous year)
Ridgefield’s home values rose 54% over 15 years, from $616,863 in 2010 to $952,537 in 2025. A slow start in the 2010s gave way to rapid growth after 2020, particularly in 2021 and 2024, when values jumped by 17.8% and 16%, respectively.
Ridgefield – Steady Climber With Cultural Cachet
🔥 Would you like to save this?
Ridgefield combines small-town warmth with cultural sophistication. Its walkable downtown, performing arts venues, and highly ranked schools make it one of the most livable and attractive towns in Fairfield County. That combination has powered its rise in home values, especially in the past five years.
With prices nearing the $1 million mark, Ridgefield stands out for offering a more balanced mix of charm, amenities, and access. It’s become a favorite for families priced out of Westport or Greenwich, while still delivering a high-quality lifestyle and strong investment potential.
7. Washington – 66% Home Price Increase Since 2010
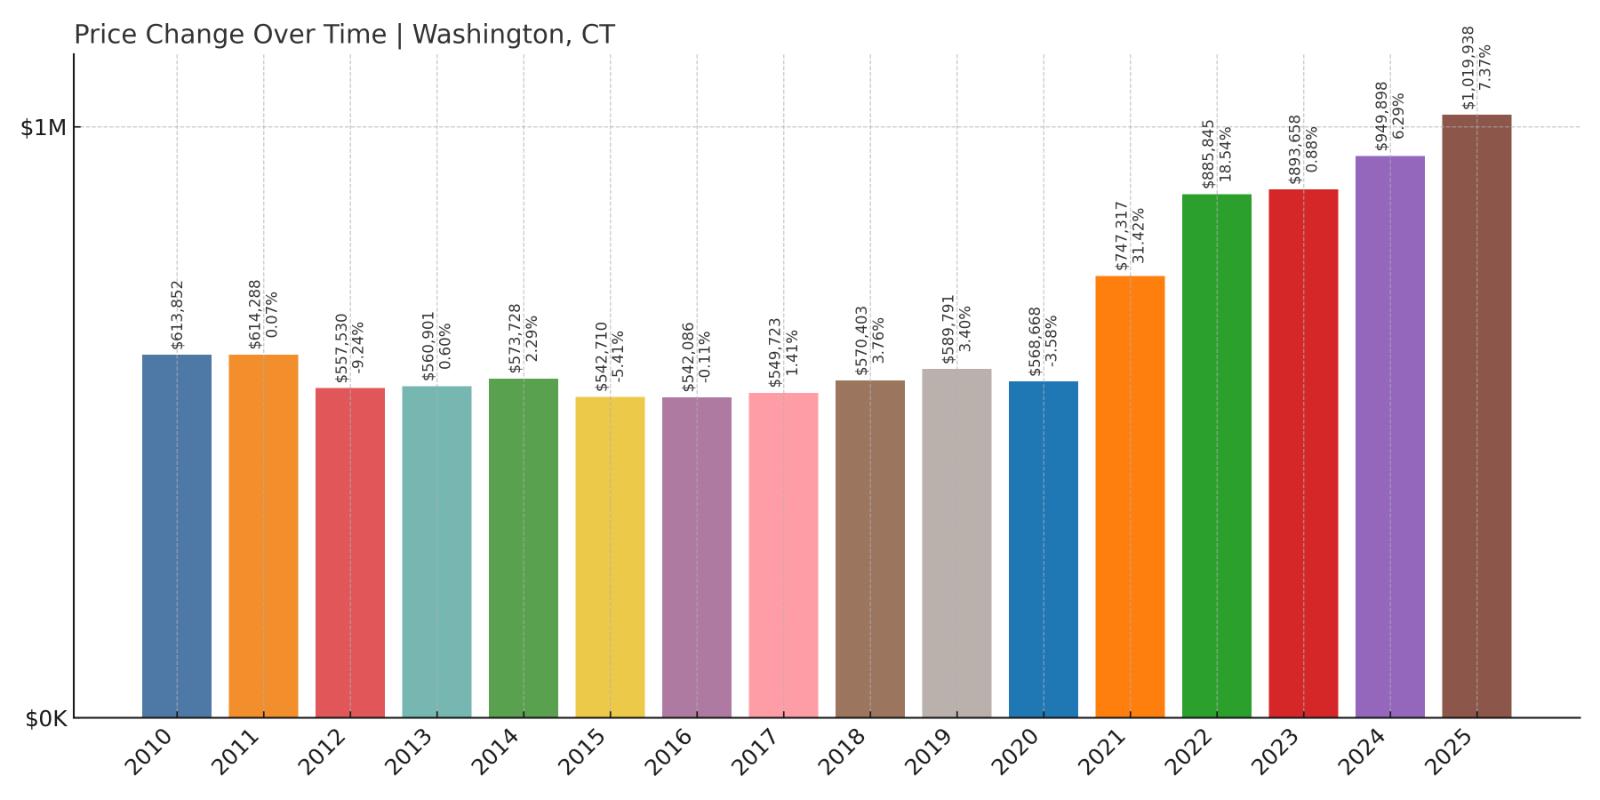
- 2010: $613,852
- 2011: $614,288 (+$435, +0.07% from previous year)
- 2012: $557,530 (-$56,758, -9.24% from previous year)
- 2013: $560,901 (+$3,371, +0.60% from previous year)
- 2014: $573,728 (+$12,827, +2.29% from previous year)
- 2015: $542,710 (-$31,018, -5.41% from previous year)
- 2016: $542,086 (-$624, -0.12% from previous year)
- 2017: $549,723 (+$7,637, +1.41% from previous year)
- 2018: $570,403 (+$20,680, +3.76% from previous year)
- 2019: $589,791 (+$19,388, +3.40% from previous year)
- 2020: $568,668 (-$21,123, -3.58% from previous year)
- 2021: $747,317 (+$178,648, +31.42% from previous year)
- 2022: $885,845 (+$138,528, +18.54% from previous year)
- 2023: $893,658 (+$7,813, +0.88% from previous year)
- 2024: $949,898 (+$56,240, +6.29% from previous year)
- 2025: $1,019,938 (+$70,040, +7.37% from previous year)
Home prices in Washington rose from $613,852 in 2010 to $1,019,938 in 2025, an impressive 66% increase. While early years showed ups and downs, the market shifted dramatically after 2020. The 2021 surge alone added over $178,000 in value.
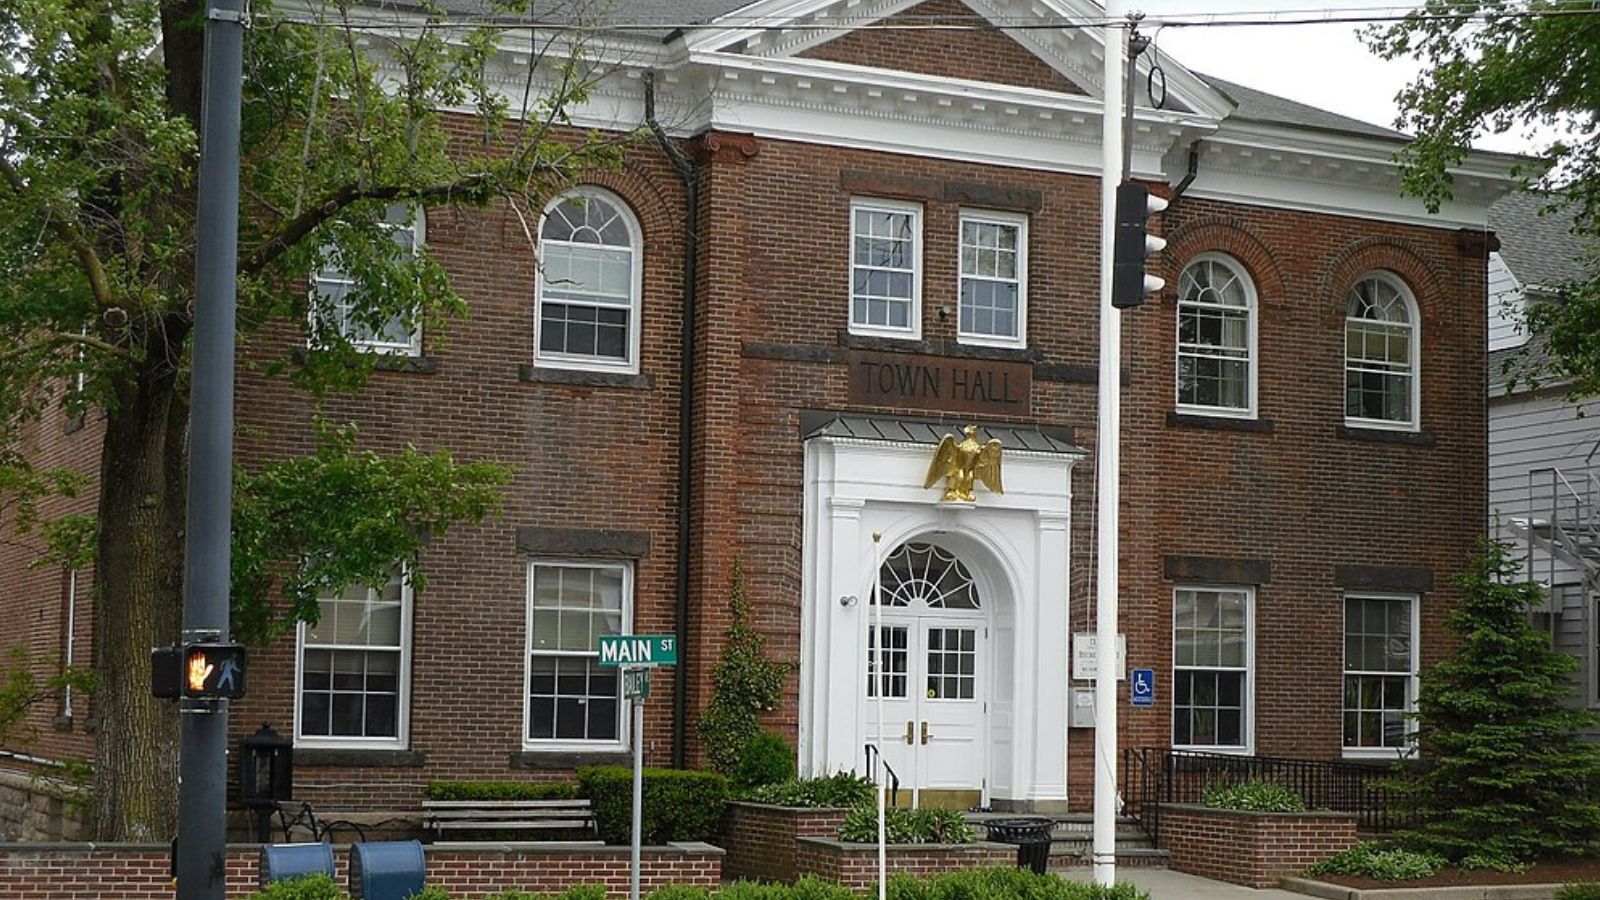
Washington – Artistic Legacy and High-End Homes
Washington is one of Litchfield County’s most celebrated towns, home to the prestigious Gunnery School, the renowned Mayflower Inn, and a long list of well-heeled seasonal residents. Its blend of pastoral beauty, cultural depth, and architectural character is unmatched in rural Connecticut.
The town’s property values have surged as luxury buyers flocked to western Connecticut. Recent years have brought consistent six-figure gains, pushing Washington’s average home well past the $1 million threshold for the first time in 2025.
6. Wilton – 47% Home Price Increase Since 2010
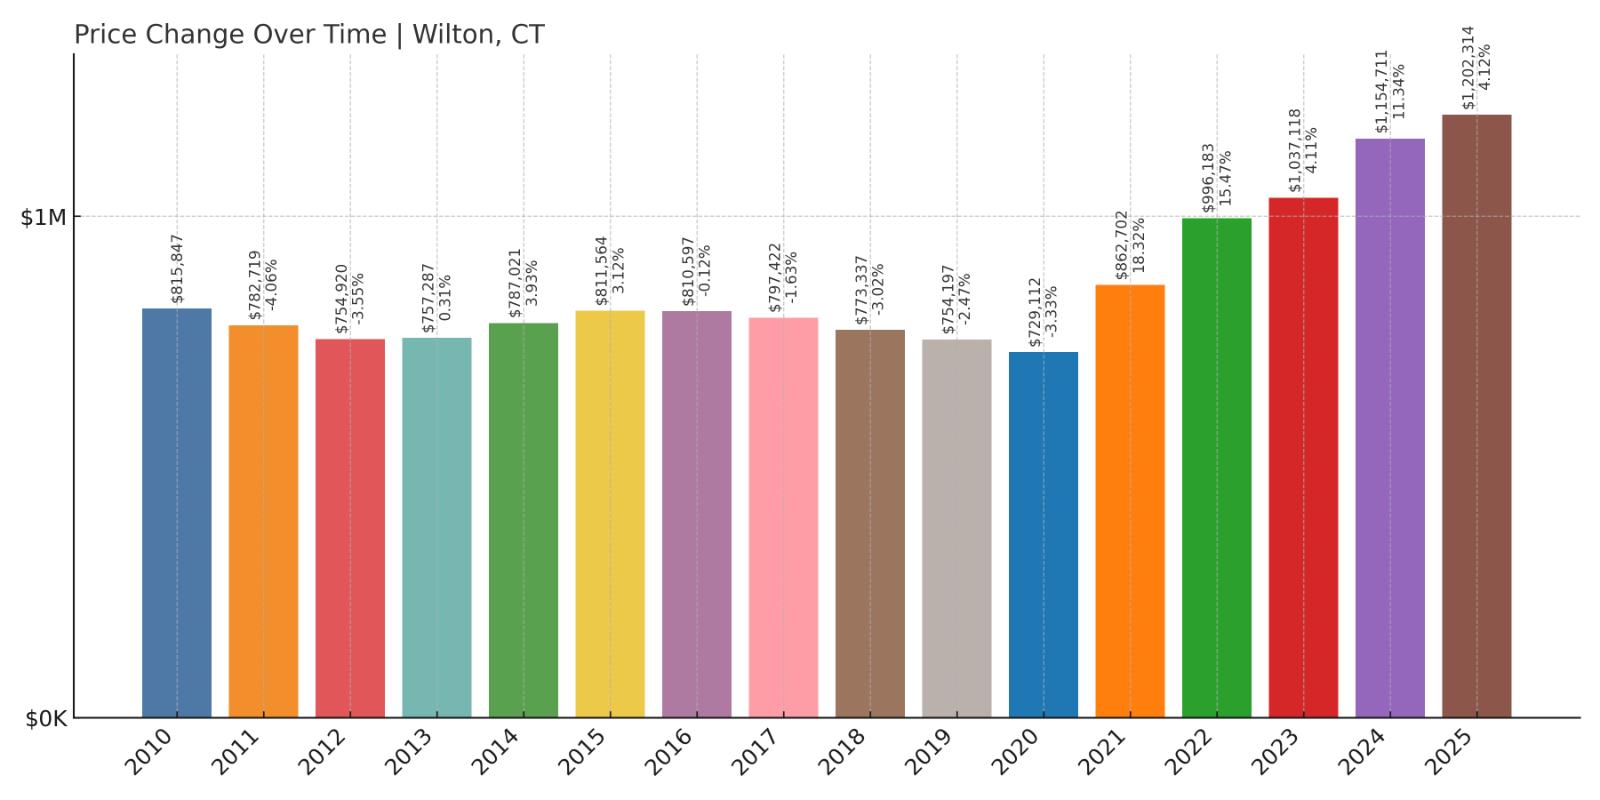
- 2010: $815,847
- 2011: $782,719 (-$33,128, -4.06% from previous year)
- 2012: $754,920 (-$27,799, -3.55% from previous year)
- 2013: $757,287 (+$2,366, +0.31% from previous year)
- 2014: $787,021 (+$29,735, +3.93% from previous year)
- 2015: $811,564 (+$24,543, +3.12% from previous year)
- 2016: $810,597 (-$968, -0.12% from previous year)
- 2017: $797,422 (-$13,175, -1.63% from previous year)
- 2018: $773,337 (-$24,085, -3.02% from previous year)
- 2019: $754,197 (-$19,140, -2.47% from previous year)
- 2020: $729,112 (-$25,085, -3.33% from previous year)
- 2021: $862,702 (+$133,589, +18.32% from previous year)
- 2022: $996,183 (+$133,481, +15.47% from previous year)
- 2023: $1,037,118 (+$40,935, +4.11% from previous year)
- 2024: $1,154,711 (+$117,593, +11.34% from previous year)
- 2025: $1,202,314 (+$47,603, +4.12% from previous year)
Wilton’s home values climbed from $815,847 in 2010 to $1,202,314 in 2025—a 47% increase. After a decade of volatility and modest declines, the market turned dramatically upward in 2021. The town saw back-to-back years of more than 15% growth in 2021 and 2022, followed by steady increases through 2025.
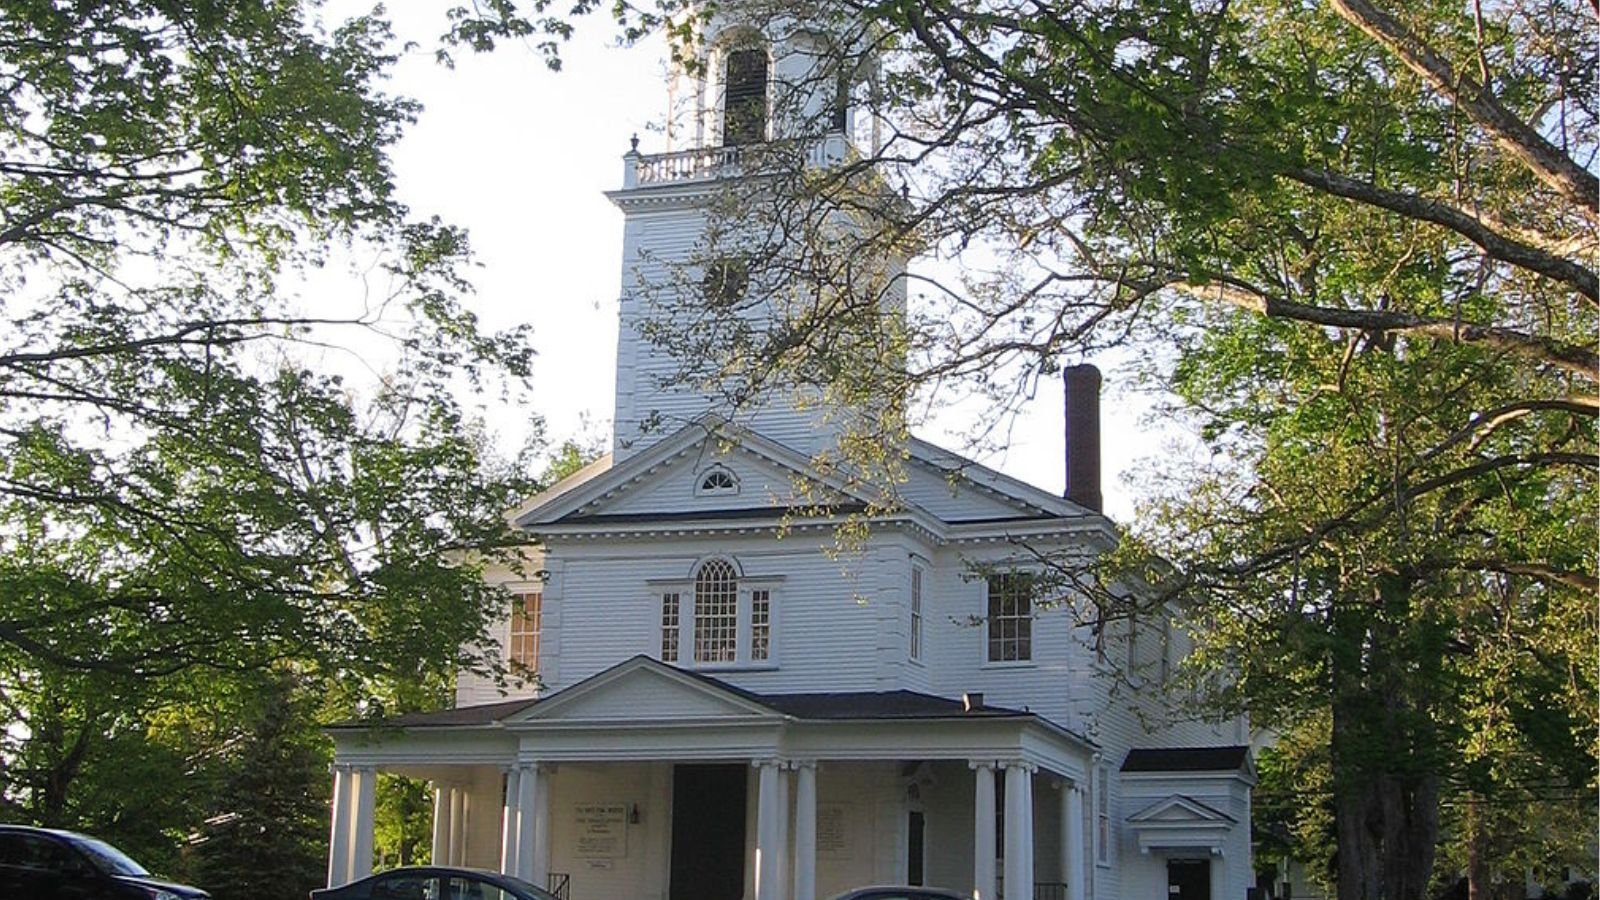
Wilton – A Comeback Story in Fairfield County
Wilton offers large lots, top-ranked schools, and a well-planned town center, making it a staple of Fairfield County living. The town underperformed for much of the 2010s, but that changed abruptly post-2020 as remote workers reevaluated where—and how—they wanted to live.
Its strong rebound is driven by new demand from buyers seeking space, quiet, and access to both nature and commuter rail. Wilton’s current values reflect its re-emergence as a high-demand suburb with lasting appeal for families and professionals alike.
5. Weston – 56% Home Price Increase Since 2010
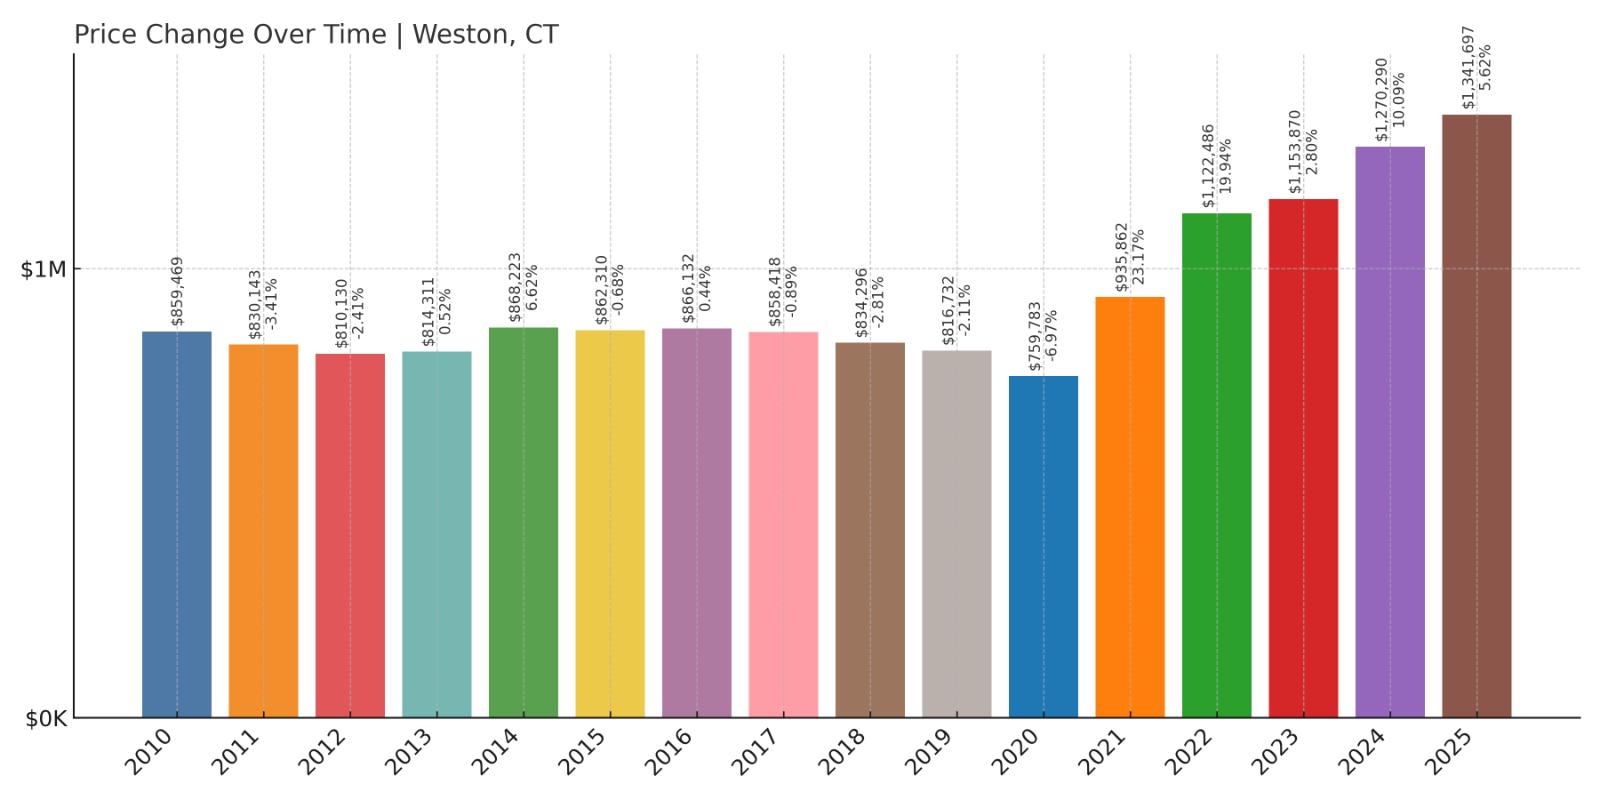
- 2010: $859,469
- 2011: $830,143 (-$29,326, -3.41% from previous year)
- 2012: $810,130 (-$20,012, -2.41% from previous year)
- 2013: $814,311 (+$4,181, +0.52% from previous year)
- 2014: $868,223 (+$53,912, +6.62% from previous year)
- 2015: $862,310 (-$5,912, -0.68% from previous year)
- 2016: $866,132 (+$3,822, +0.44% from previous year)
- 2017: $858,418 (-$7,714, -0.89% from previous year)
- 2018: $834,296 (-$24,122, -2.81% from previous year)
- 2019: $816,732 (-$17,564, -2.11% from previous year)
- 2020: $759,783 (-$56,949, -6.97% from previous year)
- 2021: $935,862 (+$176,078, +23.17% from previous year)
- 2022: $1,122,486 (+$186,625, +19.94% from previous year)
- 2023: $1,153,870 (+$31,384, +2.80% from previous year)
- 2024: $1,270,290 (+$116,419, +10.09% from previous year)
- 2025: $1,341,697 (+$71,408, +5.62% from previous year)
Home prices in Weston have risen from $859,469 in 2010 to $1,341,697 in 2025—a 56% increase. Prices were relatively flat for much of the decade before exploding in 2021 and 2022, with combined gains exceeding $360,000 in just two years.
Weston – Quiet Prestige and Explosive Growth
Weston has long been known for its low density, large homes, and excellent public schools. It has no downtown to speak of, and that’s exactly how residents like it. The town offers seclusion and serenity without sacrificing access to major hubs like Westport and Norwalk.
The dramatic appreciation post-2020 speaks to Weston’s niche appeal. The rise of remote work and demand for more space transformed it from a sleepy suburb into one of the fastest-rising luxury markets in the state.
4. Westport – 79% Home Price Increase Since 2012
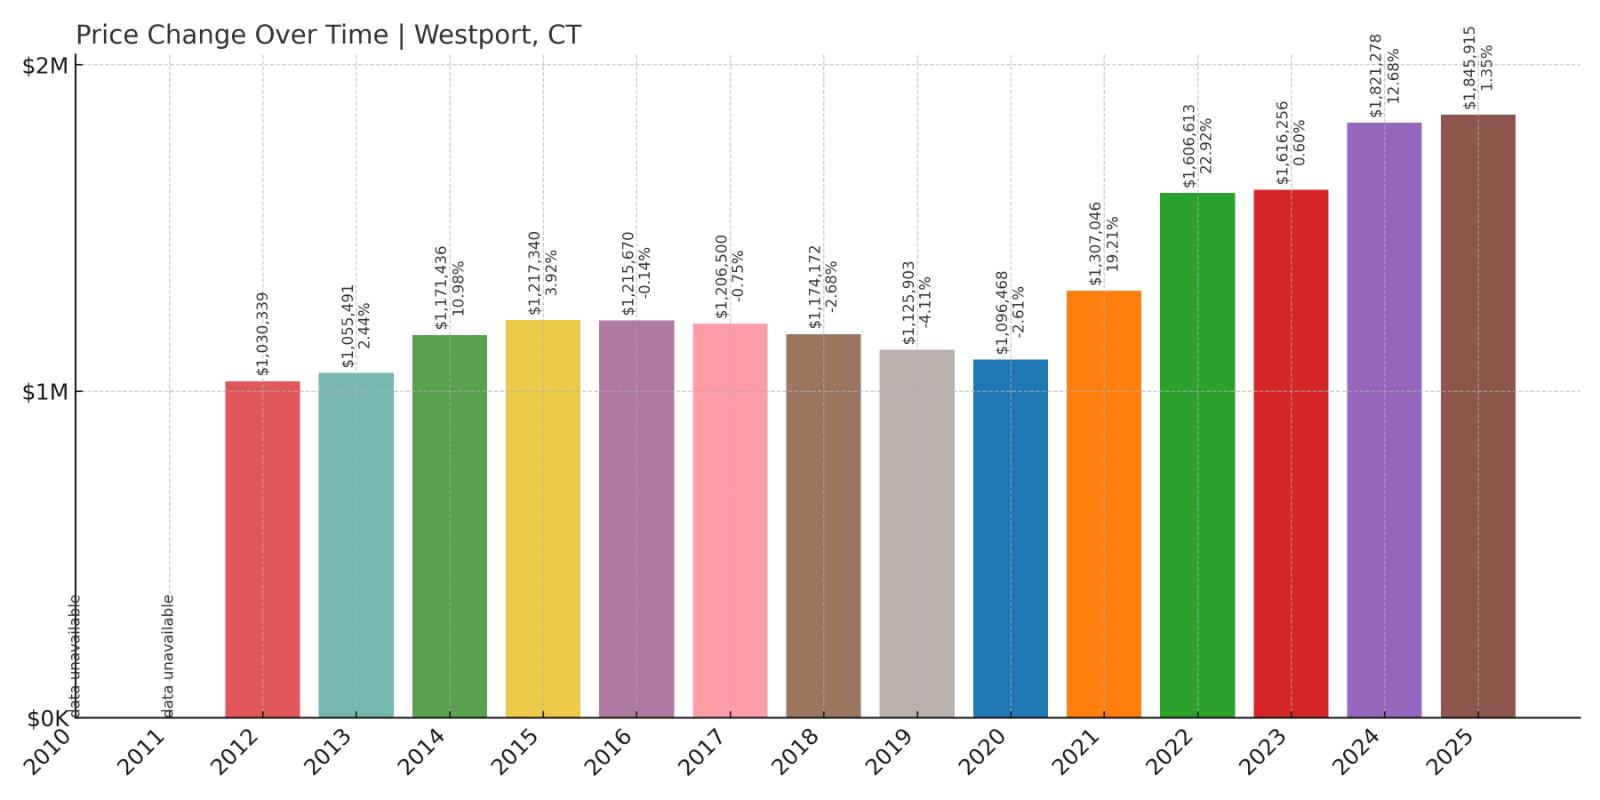
- 2010: N/A
- 2011: N/A
- 2012: $1,030,339
- 2013: $1,055,491 (+$25,152, +2.44% from previous year)
- 2014: $1,171,436 (+$115,946, +10.98% from previous year)
- 2015: $1,217,340 (+$45,904, +3.92% from previous year)
- 2016: $1,215,670 (-$1,670, -0.14% from previous year)
- 2017: $1,206,500 (-$9,170, -0.75% from previous year)
- 2018: $1,174,172 (-$32,328, -2.68% from previous year)
- 2019: $1,125,903 (-$48,269, -4.11% from previous year)
- 2020: $1,096,468 (-$29,435, -2.61% from previous year)
- 2021: $1,307,046 (+$210,578, +19.21% from previous year)
- 2022: $1,606,613 (+$299,567, +22.92% from previous year)
- 2023: $1,616,256 (+$9,643, +0.60% from previous year)
- 2024: $1,821,278 (+$205,022, +12.68% from previous year)
- 2025: $1,845,915 (+$24,637, +1.35% from previous year)
Westport’s prices grew from $1,030,339 in 2012 to $1,845,915 in 2025—a 79% increase. Though the market softened between 2016 and 2020, it came roaring back in 2021 and 2022, gaining over $500,000 in just two years.
Westport – Connecticut’s Coastal Luxury Leader
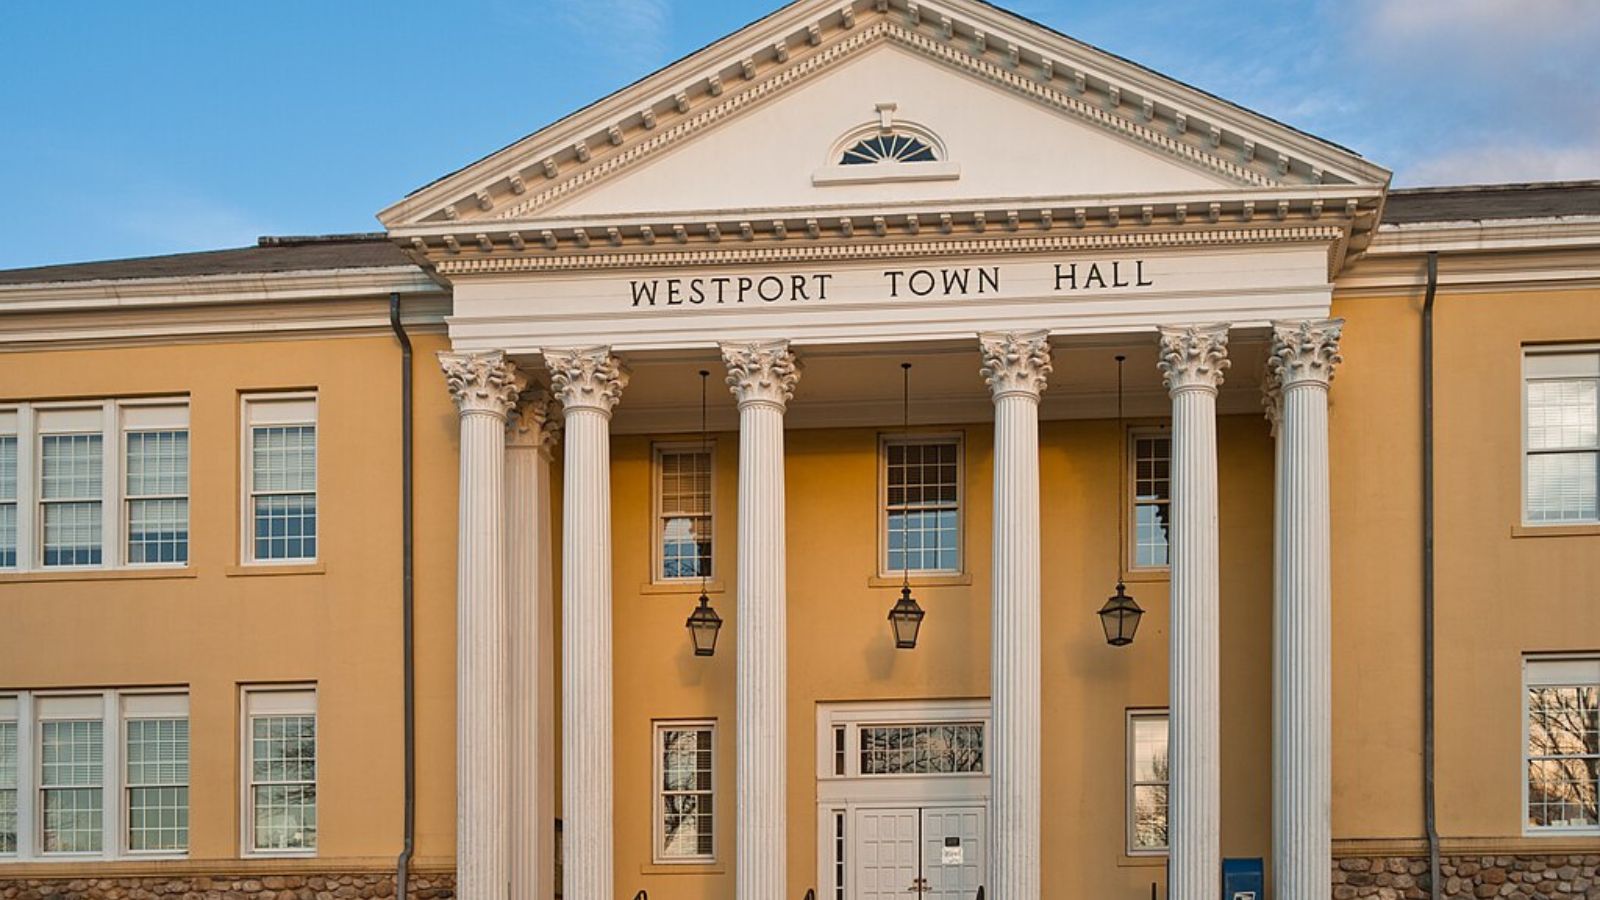
Westport has long defined Connecticut coastal affluence. With beaches, a vibrant downtown, top-rated schools, and quick train access to Manhattan, it’s one of the most desirable places to live in the tri-state area. The town’s recent gains confirm its enduring appeal, especially among finance and tech professionals.
The post-pandemic market supercharged demand for homes offering both lifestyle and location, and Westport delivered on both counts. While price growth has cooled, values remain elevated, keeping Westport firmly among the state’s most elite markets.
3. New Canaan – 58% Home Price Increase Since 2010
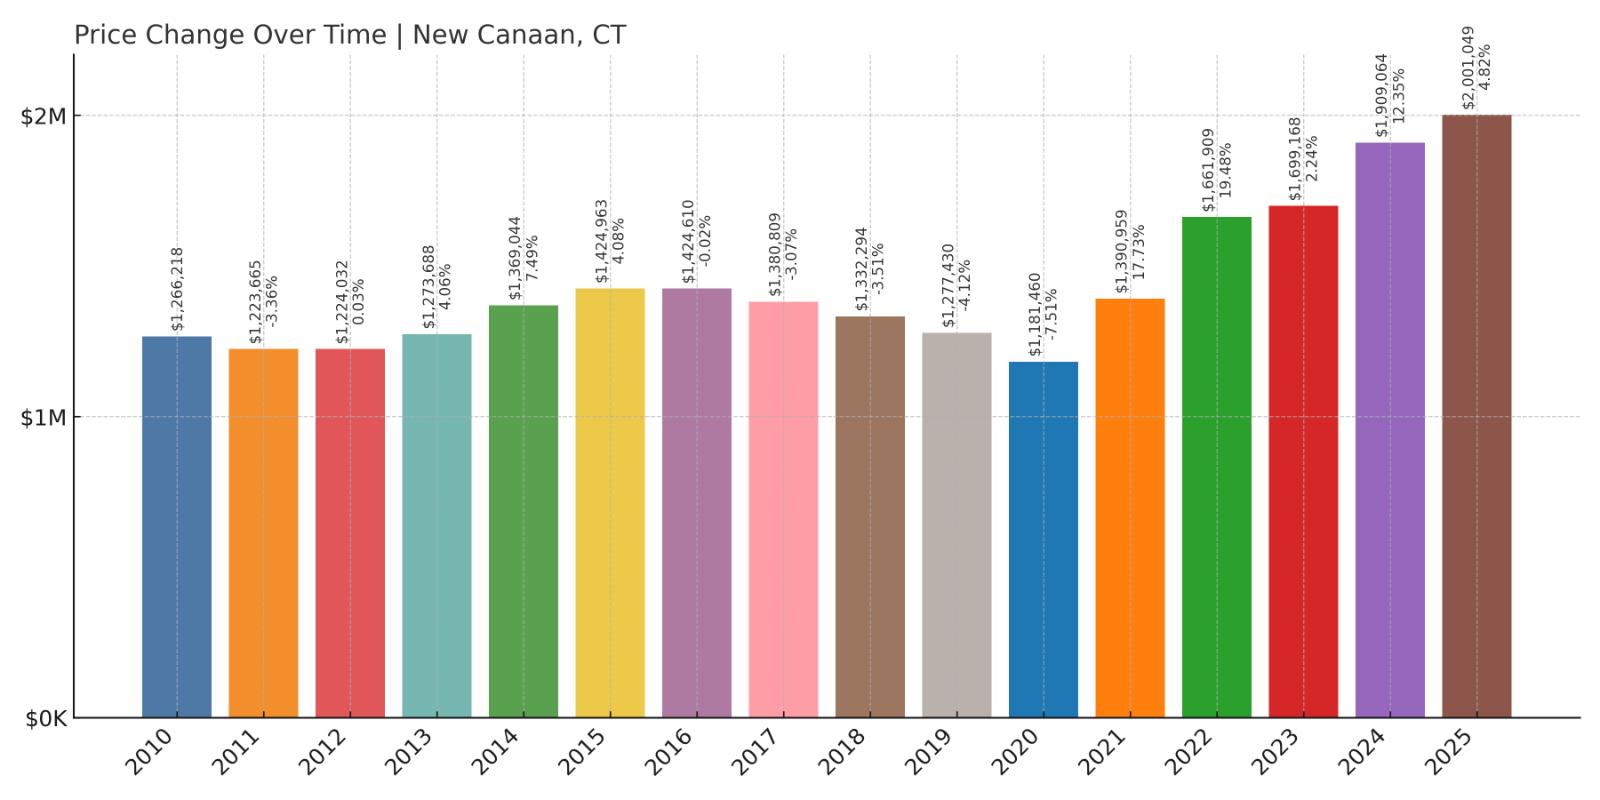
- 2010: $1,266,218
- 2011: $1,223,665 (-$42,553, -3.36% from previous year)
- 2012: $1,224,032 (+$367, +0.03% from previous year)
- 2013: $1,273,688 (+$49,656, +4.06% from previous year)
- 2014: $1,369,044 (+$95,356, +7.49% from previous year)
- 2015: $1,424,963 (+$55,919, +4.08% from previous year)
- 2016: $1,424,610 (-$354, -0.02% from previous year)
- 2017: $1,380,809 (-$43,801, -3.07% from previous year)
- 2018: $1,332,294 (-$48,515, -3.51% from previous year)
- 2019: $1,277,430 (-$54,864, -4.12% from previous year)
- 2020: $1,181,460 (-$95,970, -7.51% from previous year)
- 2021: $1,390,959 (+$209,498, +17.73% from previous year)
- 2022: $1,661,909 (+$270,951, +19.48% from previous year)
- 2023: $1,699,168 (+$37,259, +2.24% from previous year)
- 2024: $1,909,064 (+$209,896, +12.35% from previous year)
- 2025: $2,001,049 (+$91,985, +4.82% from previous year)
New Canaan’s home values rose from $1,266,218 in 2010 to $2,001,049 in 2025—a 58% increase. After a bumpy 2010s, the town came back with force, adding over $700,000 in value from 2020 onward.
New Canaan – High Design Meets High Value
New Canaan is famous for its mid-century modern homes, prestigious schools, and vibrant village center. It’s a top-tier destination for buyers seeking elegance, community, and easy train access to Manhattan. Even during slowdowns, it has remained resilient.
The sharp gains of the past four years have cemented its elite status. With average values crossing $2 million, New Canaan stands tall among Connecticut’s most luxurious housing markets.
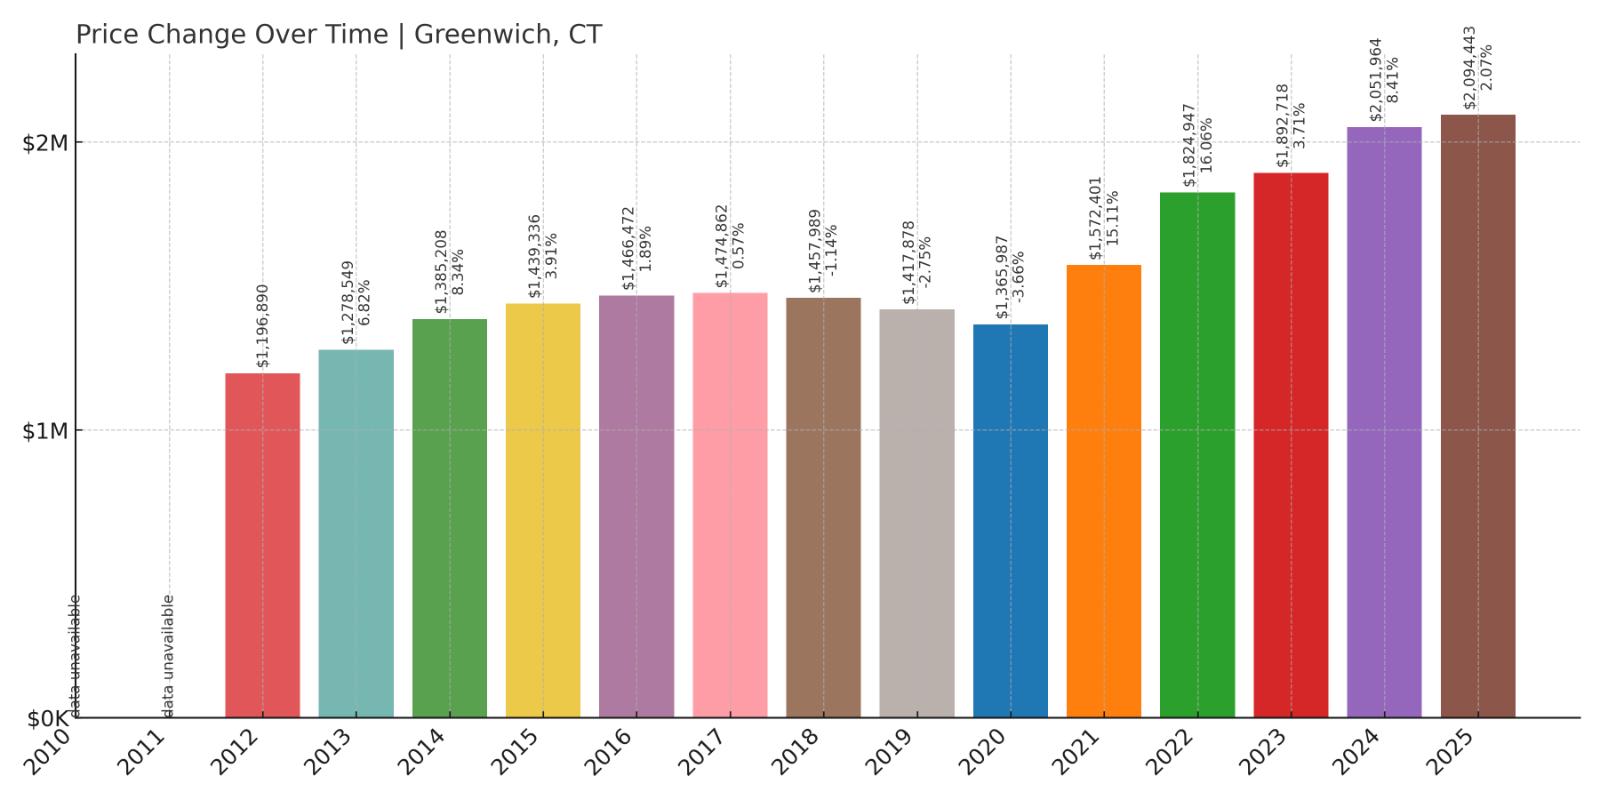
2. Greenwich – 75% Home Price Increase Since 2012
- 2010: N/A
- 2011: N/A
- 2012: $1,196,890
- 2013: $1,278,549 (+$81,659, +6.82% from previous year)
- 2014: $1,385,208 (+$106,659, +8.34% from previous year)
- 2015: $1,439,336 (+$54,128, +3.91% from previous year)
- 2016: $1,466,472 (+$27,136, +1.89% from previous year)
- 2017: $1,474,862 (+$8,391, +0.57% from previous year)
- 2018: $1,457,989 (-$16,873, -1.14% from previous year)
- 2019: $1,417,878 (-$40,111, -2.75% from previous year)
- 2020: $1,365,987 (-$51,891, -3.66% from previous year)
- 2021: $1,572,401 (+$206,414, +15.11% from previous year)
- 2022: $1,824,947 (+$252,546, +16.06% from previous year)
- 2023: $1,892,718 (+$67,771, +3.71% from previous year)
- 2024: $2,051,964 (+$159,246, +8.41% from previous year)
- 2025: $2,094,443 (+$42,479, +2.07% from previous year)
Greenwich home values climbed 75% between 2012 and 2025, growing from just under $1.2 million to over $2 million. While the early 2020s brought minor dips, the rebound in 2021 and 2022 was extraordinary, pushing prices up by nearly half a million in two years. Growth has since cooled but continues steadily.
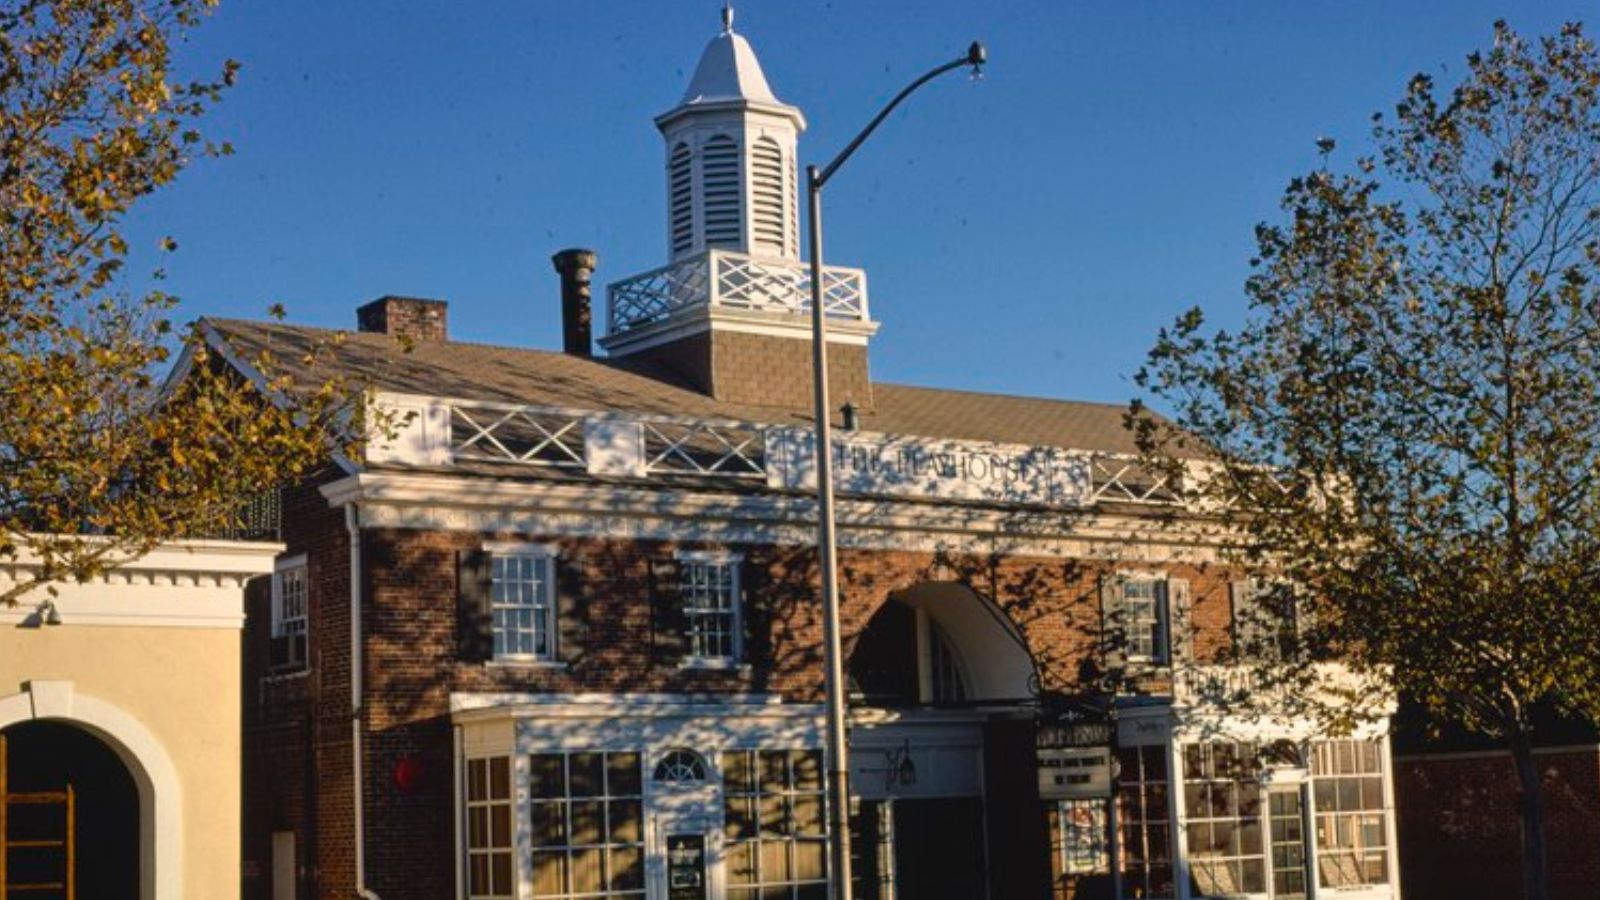
Greenwich – Connecticut’s Premier Power Address
Greenwich has long been synonymous with wealth and prestige. As the closest town in Connecticut to New York City, it offers both commuter convenience and exclusivity. Its neighborhoods—like Belle Haven, Cos Cob, and Old Greenwich—have some of the highest concentrations of luxury homes in the country.
The town’s combination of private beaches, elite schools, and robust amenities makes it perennially attractive to high-net-worth buyers. Even as the market has leveled nationally, Greenwich continues to see strong demand, keeping home values well above $2 million in 2025 and securing its place near the top of the state’s most expensive markets.
1. Darien – 71% Home Price Increase Since 2012
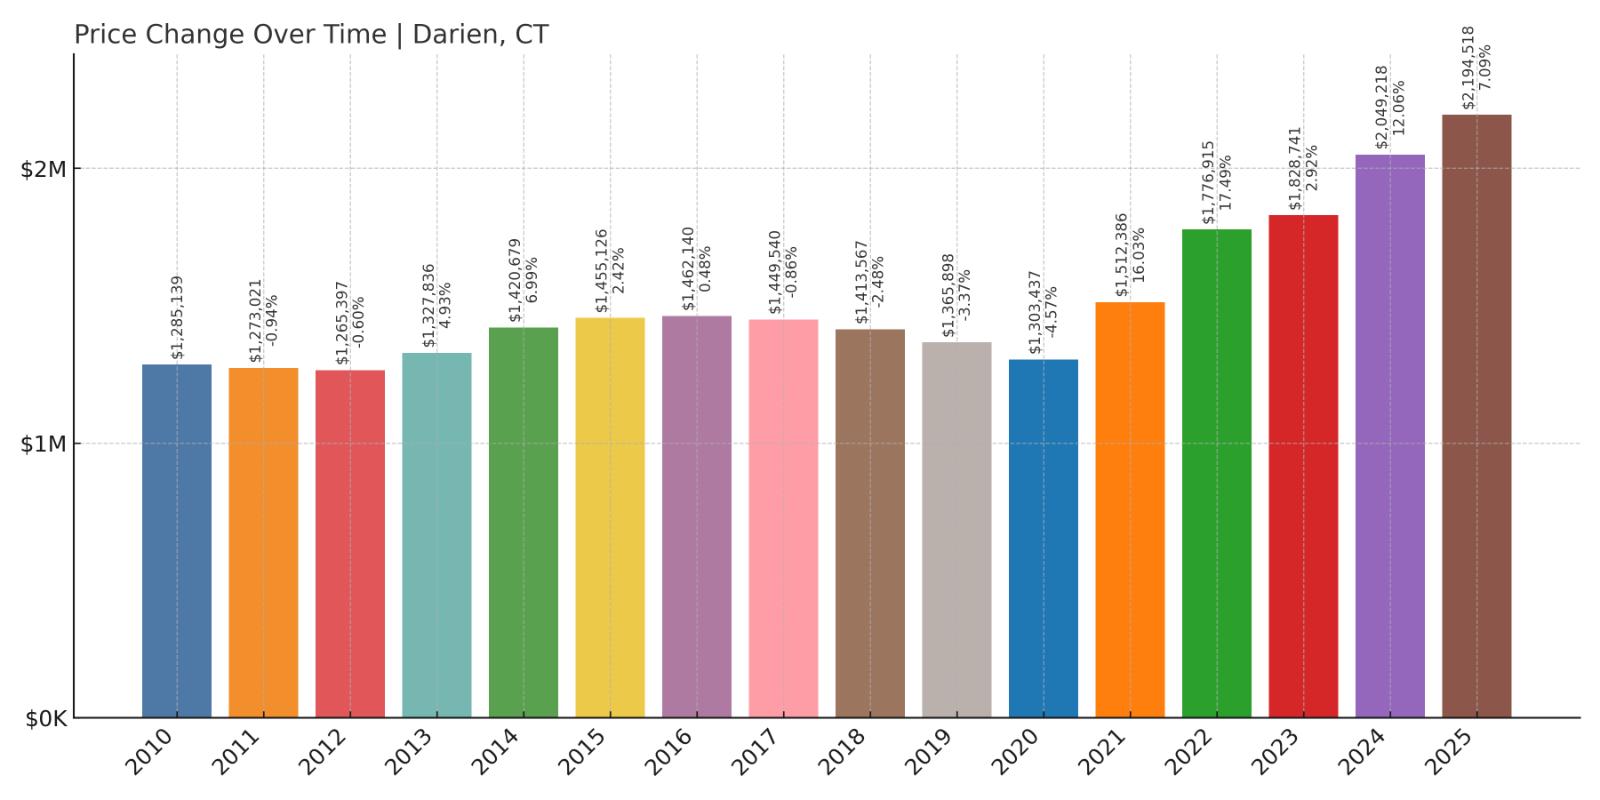
- 2010: $1,285,139
- 2011: $1,273,021 (-$12,118, -0.94% from previous year)
- 2012: $1,265,397 (-$7,624, -0.60% from previous year)
- 2013: $1,327,836 (+$62,438, +4.93% from previous year)
- 2014: $1,420,679 (+$92,844, +6.99% from previous year)
- 2015: $1,455,126 (+$34,447, +2.42% from previous year)
- 2016: $1,462,140 (+$7,014, +0.48% from previous year)
- 2017: $1,449,540 (-$12,600, -0.86% from previous year)
- 2018: $1,413,567 (-$35,973, -2.48% from previous year)
- 2019: $1,365,898 (-$47,669, -3.37% from previous year)
- 2020: $1,303,437 (-$62,461, -4.57% from previous year)
- 2021: $1,512,386 (+$208,948, +16.03% from previous year)
- 2022: $1,776,915 (+$264,529, +17.49% from previous year)
- 2023: $1,828,741 (+$51,826, +2.92% from previous year)
- 2024: $2,049,218 (+$220,477, +12.06% from previous year)
- 2025: $2,194,518 (+$145,300, +7.09% from previous year)
Darien’s home prices have grown 71% since 2012, climbing from $1,265,397 to $2,194,518 in 2025. After some volatility during the late 2010s, values exploded starting in 2021. The 2020s brought consistent double-digit percentage gains, culminating in a new high of nearly $2.2 million.
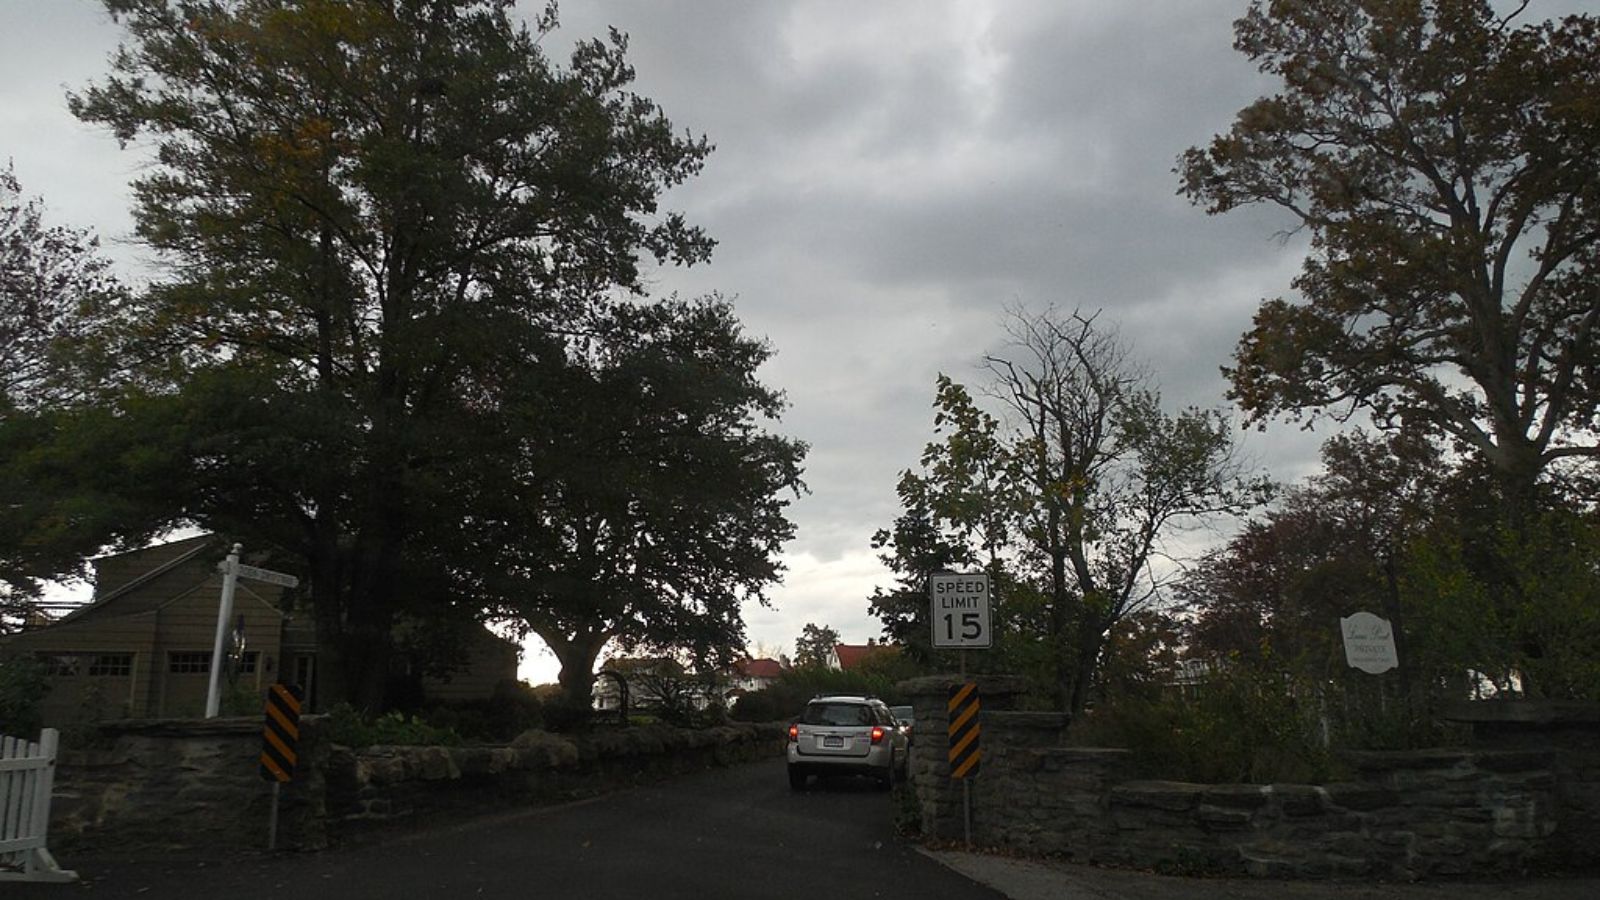
Darien – Connecticut’s Fastest-Rising Luxury Market
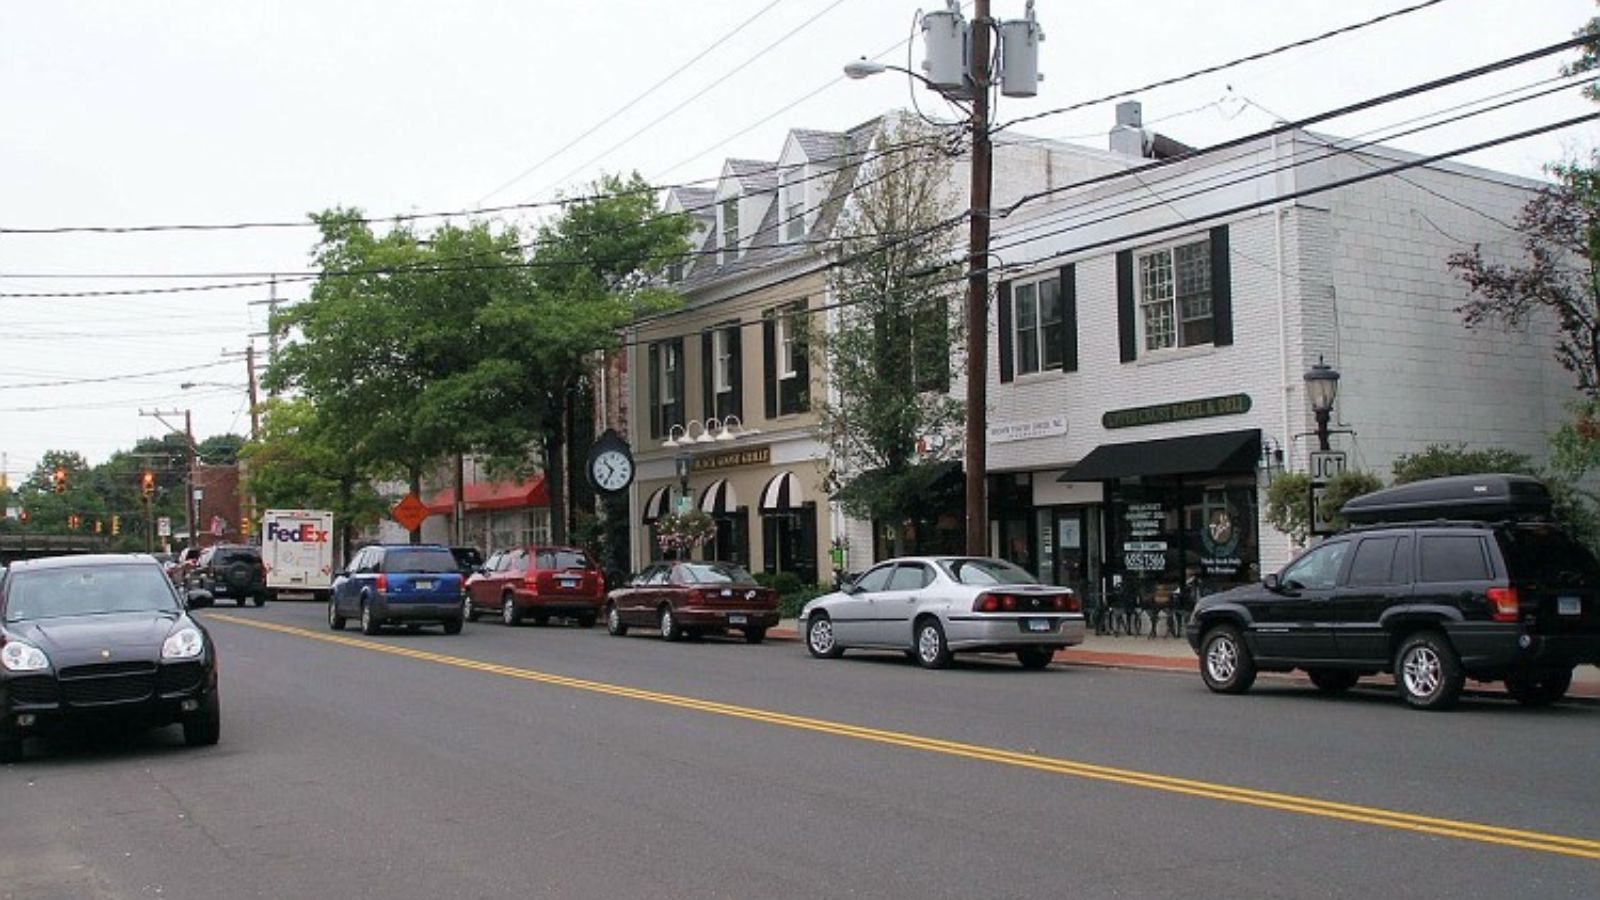
With its highly rated public schools, scenic shoreline, and fast rail access to Manhattan, Darien has cemented its place as Connecticut’s premier residential address. Its leafy neighborhoods and small-town atmosphere are matched by an abundance of luxury homes and estates.
The recent surge in prices reflects how deeply desirable Darien has become, especially among families relocating from New York City. It now tops the state with the highest median home value—an elite status backed by strong fundamentals, limited inventory, and sustained buyer demand.


