Would you like to save this?
Alaska’s scenery might be free, but buying a house in some of its most desirable towns definitely isn’t. According to the Zillow Home Value Index, median home prices in parts of Alaska are climbing fast—and in some places, they’ve already hit the stratosphere. These 24 towns top the list for highest home values in the state as of June 2025.
Whether it’s a remote fishing village with limited inventory, a suburban boomtown near Anchorage, or a tourist hub along the coast, each of these places has something that keeps prices high. Some markets are shaped by military presence or oil jobs. Others are driven by lifestyle appeal or tight housing stock. No matter what’s fueling the trend, these towns show how rugged living and real estate wealth are mixing in unexpected ways across Alaska.
24. Kenai – 57% Home Price Increase Since 2010
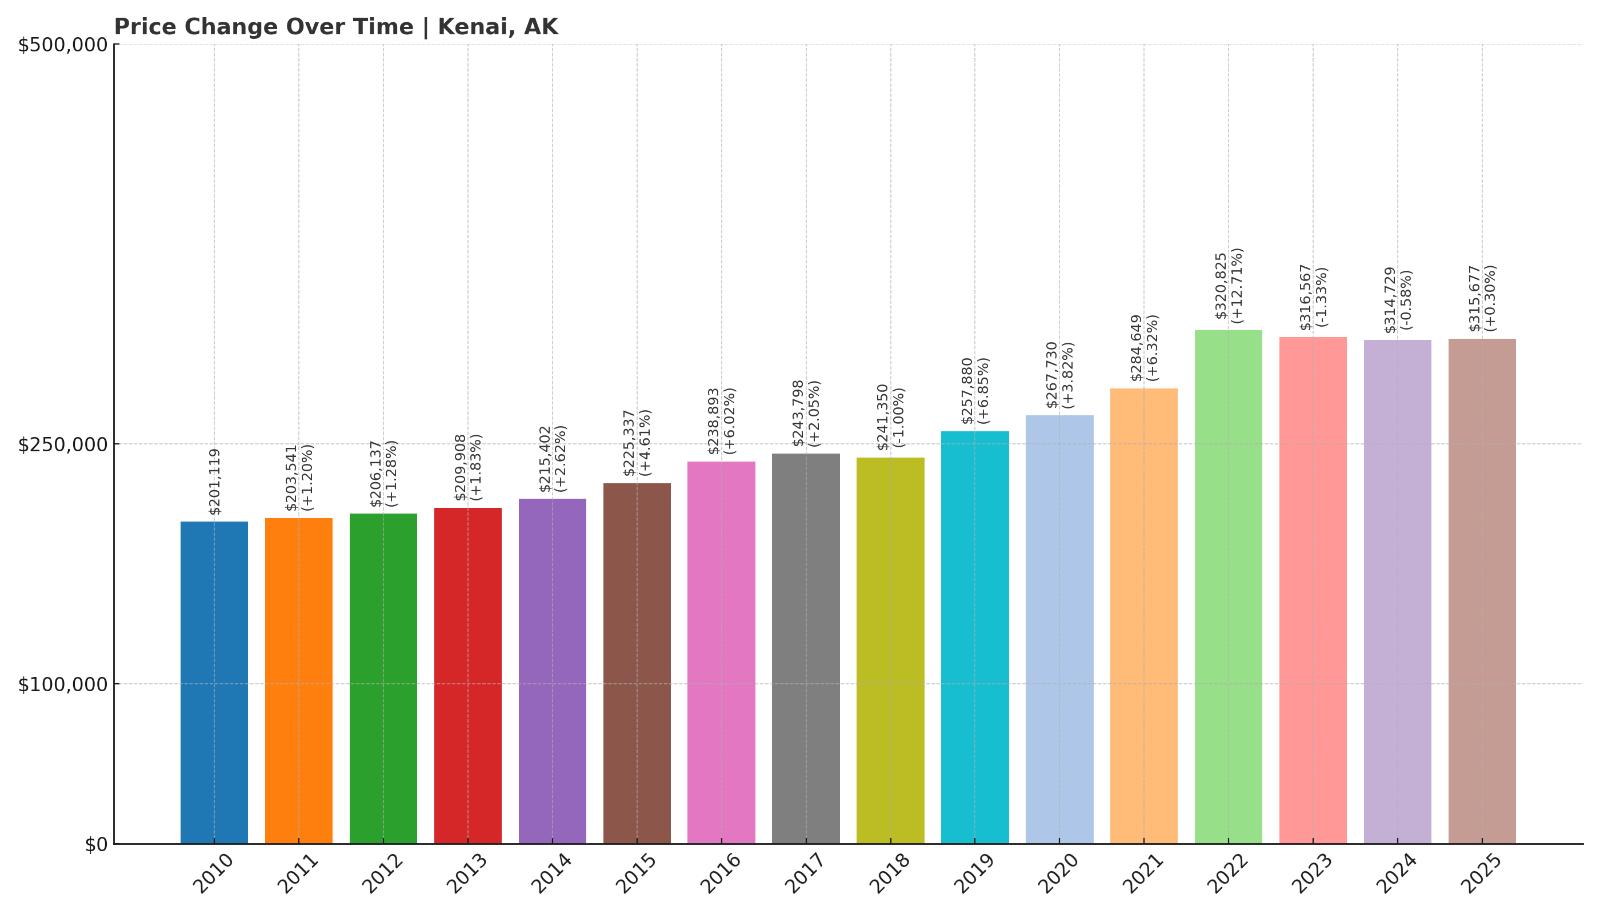
- 2010: $201,119
- 2011: $203,541 (+$2,422, +1.20% from previous year)
- 2012: $206,137 (+$2,596, +1.28% from previous year)
- 2013: $209,908 (+$3,771, +1.83% from previous year)
- 2014: $215,402 (+$5,494, +2.62% from previous year)
- 2015: $225,337 (+$9,935, +4.61% from previous year)
- 2016: $238,893 (+$13,557, +6.02% from previous year)
- 2017: $243,798 (+$4,905, +2.05% from previous year)
- 2018: $241,350 (-$2,448, -1.00% from previous year)
- 2019: $257,880 (+$16,529, +6.85% from previous year)
- 2020: $267,730 (+$9,850, +3.82% from previous year)
- 2021: $284,649 (+$16,919, +6.32% from previous year)
- 2022: $320,825 (+$36,176, +12.71% from previous year)
- 2023: $316,567 (-$4,258, -1.33% from previous year)
- 2024: $314,729 (-$1,838, -0.58% from previous year)
- 2025: $315,677 (+$948, +0.30% from previous year)
Home prices in Kenai have risen by 57% since 2010, with the current median value sitting just under $316,000. The town experienced its sharpest increase between 2020 and 2022, when prices jumped over $53,000. Growth has since cooled, with small declines in 2023 and 2024 before a slight uptick this year.
Kenai – Oil Influence and Ocean Access
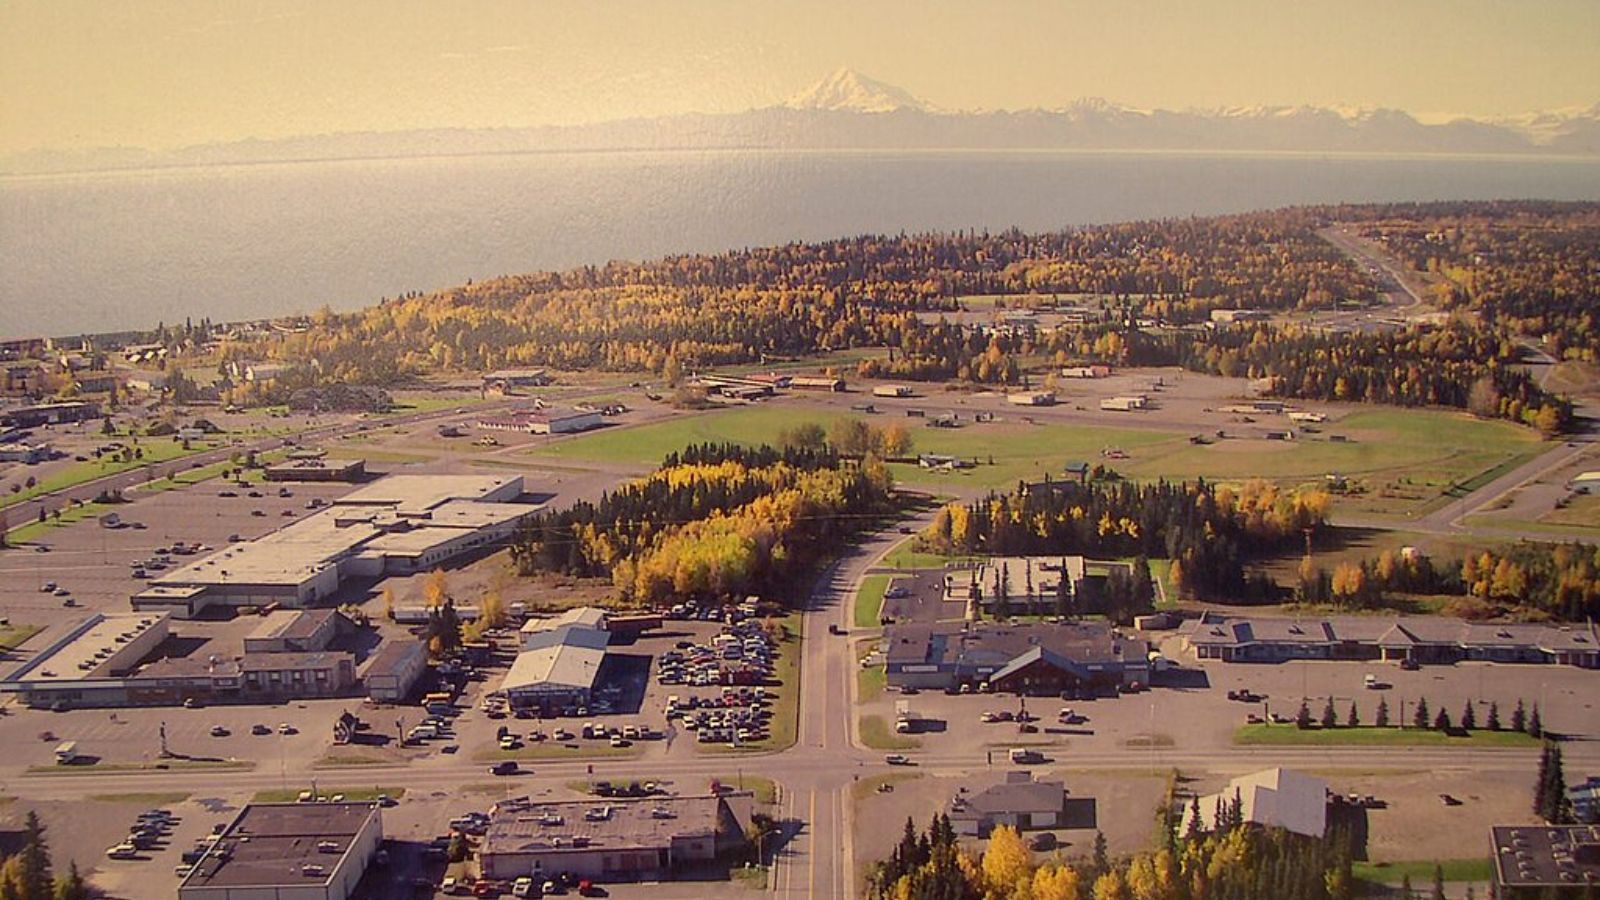
Located on the western side of the Kenai Peninsula, Kenai benefits from a combination of natural resources and outdoor tourism. It’s one of Alaska’s older settlements, known for its commercial fishing, proximity to Cook Inlet oil fields, and access to the Kenai River—famous for king salmon runs. Those industries likely helped support housing demand even during broader statewide market volatility.
Kenai’s economy is closely tied to both energy and seasonal tourism, which may explain the steadier gains through the 2010s and the rapid rise during the national housing boom of 2021–2022. With a strong infrastructure base and regional services hub status, Kenai remains one of the more established—and increasingly expensive—markets in this part of Alaska.
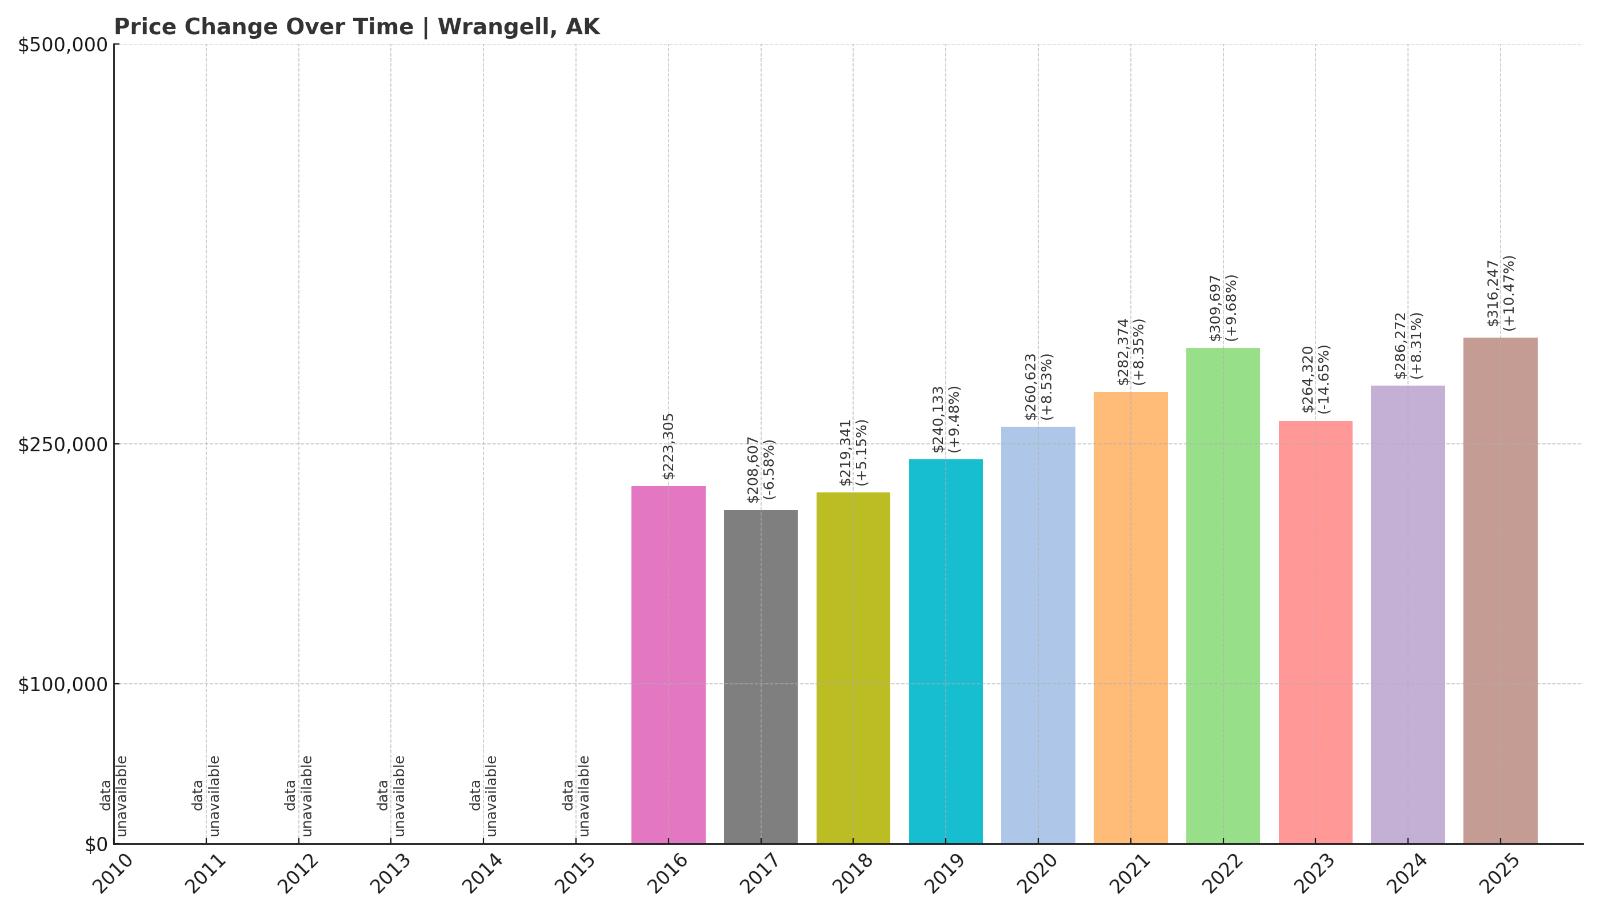
23. Wrangell – 42% Home Price Increase Since 2016
- 2010: N/A
- 2011: N/A
- 2012: N/A
- 2013: N/A
- 2014: N/A
- 2015: N/A
- 2016: $223,305
- 2017: $208,607 (-$14,699, -6.58% from previous year)
- 2018: $219,341 (+$10,734, +5.15% from previous year)
- 2019: $240,133 (+$20,792, +9.48% from previous year)
- 2020: $260,623 (+$20,491, +8.53% from previous year)
- 2021: $282,374 (+$21,751, +8.35% from previous year)
- 2022: $309,697 (+$27,322, +9.68% from previous year)
- 2023: $264,320 (-$45,377, -14.65% from previous year)
- 2024: $286,272 (+$21,952, +8.31% from previous year)
- 2025: $316,247 (+$29,975, +10.47% from previous year)
Home values in Wrangell have grown by 42% since 2016, though the path hasn’t been smooth. After peaking in 2022, values plummeted in 2023, dropping over $45,000 in a single year. However, the market quickly rebounded with two years of double-digit growth, bringing the 2025 median price to $316,247.
Wrangell – Volatile but Rebounding Market

Wrangell, located in Southeast Alaska on Wrangell Island, has a small population and a tight housing inventory. Like many island communities, its prices can be especially sensitive to economic swings and supply limitations. The sharp drop in 2023 likely reflected a correction following an overheated pandemic-era market.
Still, Wrangell bounced back quickly. Recent surges may reflect renewed demand driven by cruise tourism and local development efforts. Its scenic location along the Inside Passage and modest housing stock help keep values elevated despite occasional dips.
22. North Pole – 35% Home Price Increase Since 2010
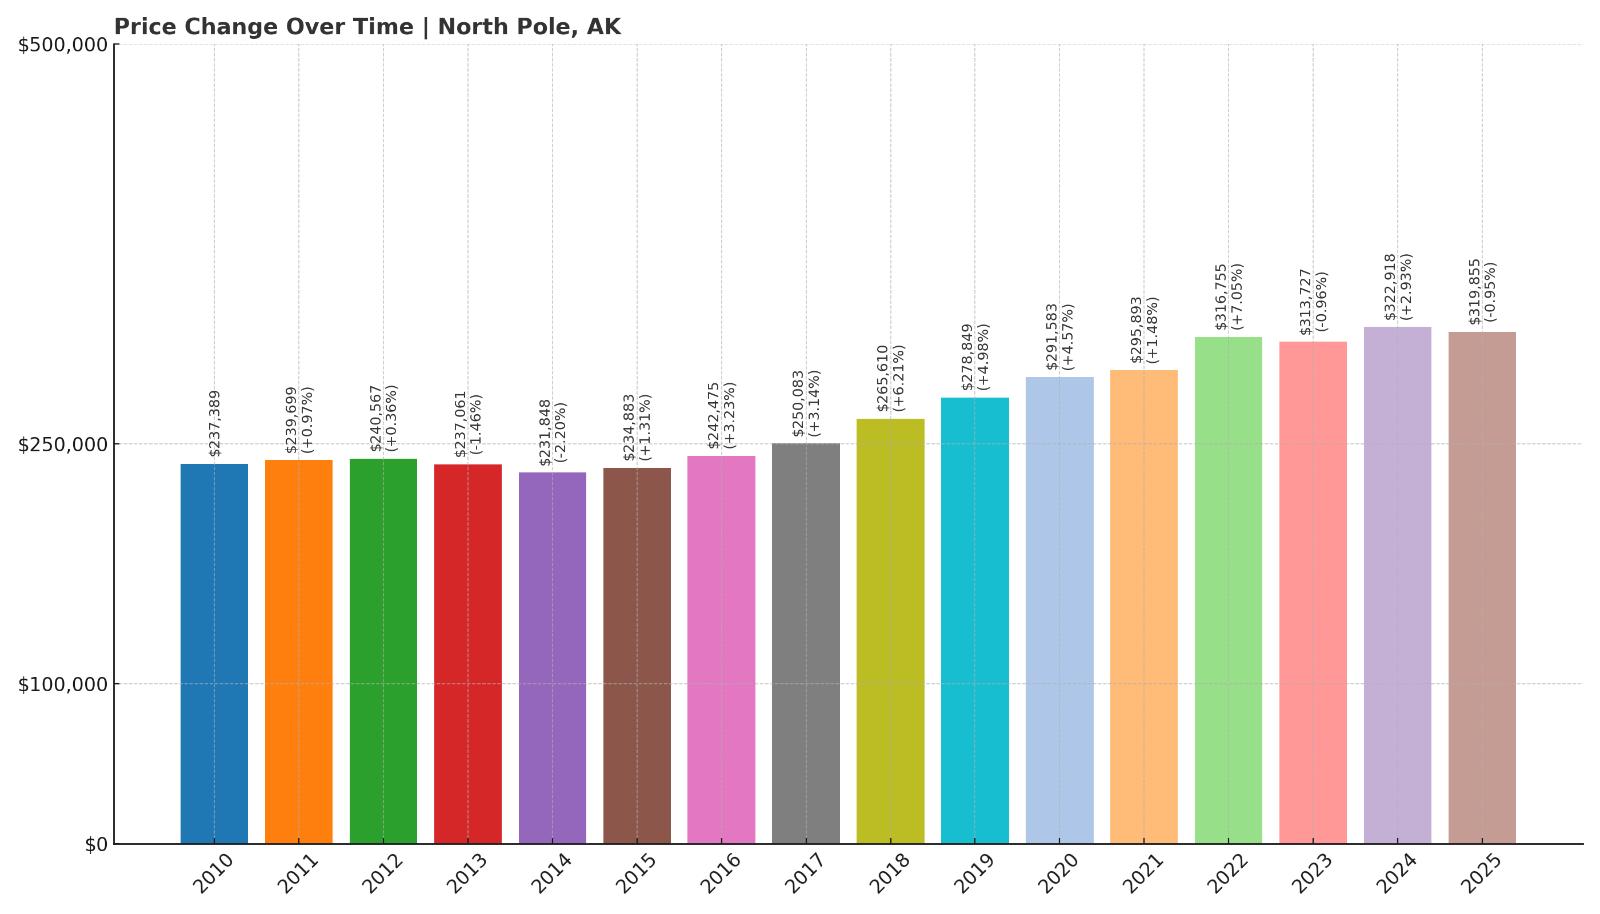
- 2010: $237,389
- 2011: $239,699 (+$2,310, +0.97% from previous year)
- 2012: $240,567 (+$868, +0.36% from previous year)
- 2013: $237,061 (-$3,506, -1.46% from previous year)
- 2014: $231,848 (-$5,213, -2.20% from previous year)
- 2015: $234,883 (+$3,035, +1.31% from previous year)
- 2016: $242,475 (+$7,592, +3.23% from previous year)
- 2017: $250,083 (+$7,608, +3.14% from previous year)
- 2018: $265,610 (+$15,527, +6.21% from previous year)
- 2019: $278,849 (+$13,239, +4.98% from previous year)
- 2020: $291,583 (+$12,734, +4.57% from previous year)
- 2021: $295,893 (+$4,310, +1.48% from previous year)
- 2022: $316,755 (+$20,862, +7.05% from previous year)
- 2023: $313,727 (-$3,028, -0.96% from previous year)
- 2024: $322,918 (+$9,191, +2.93% from previous year)
- 2025: $319,855 (-$3,064, -0.95% from previous year)
North Pole has seen home values rise steadily by 35% over the last 15 years. The market grew consistently between 2015 and 2022, hitting a peak of $316,755. A slight dip followed in 2023, and values have hovered near that level since.
North Pole – Steady Gains Near Fairbanks

Would you like to save this?
Located just southeast of Fairbanks, North Pole has become a popular residential area for military families and workers at Eielson Air Force Base. Its proximity to regional employers and a slightly more affordable market than Fairbanks itself has helped support long-term value increases.
While its holiday-themed branding draws some tourism, North Pole’s housing market is more influenced by consistent demand from year-round residents. Modest price swings suggest a market that’s growing steadily rather than overheating, even as much of Alaska saw rapid price hikes in the early 2020s.
21. Sterling – 73% Home Price Increase Since 2010
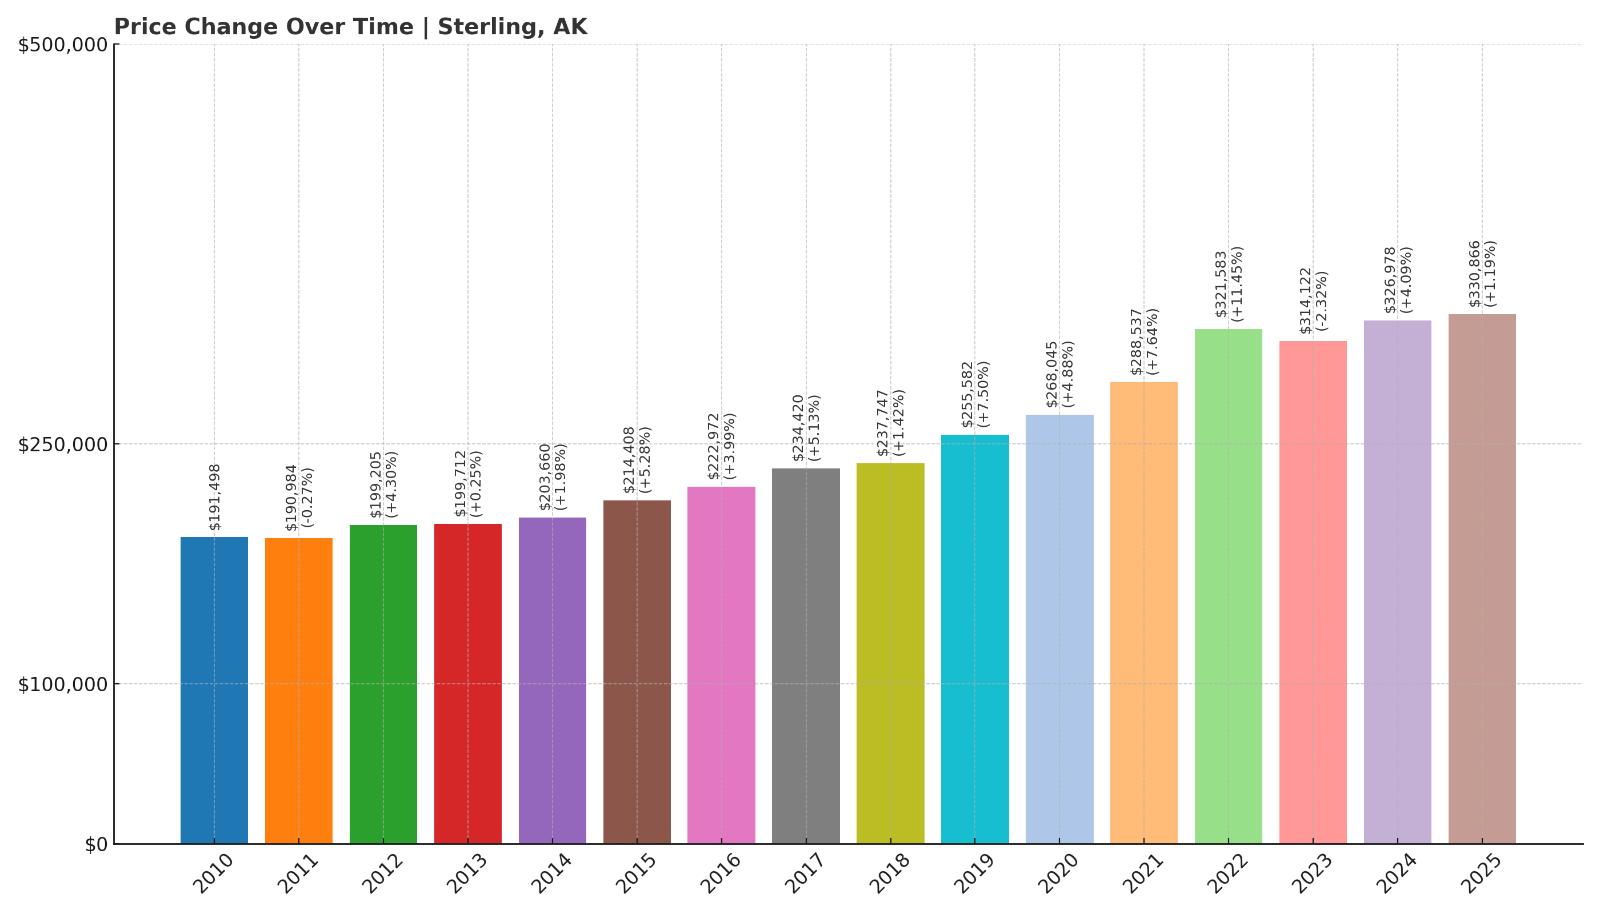
- 2010: $191,498
- 2011: $190,984 (-$513, -0.27% from previous year)
- 2012: $199,205 (+$8,221, +4.30% from previous year)
- 2013: $199,712 (+$507, +0.25% from previous year)
- 2014: $203,660 (+$3,948, +1.98% from previous year)
- 2015: $214,408 (+$10,748, +5.28% from previous year)
- 2016: $222,972 (+$8,563, +3.99% from previous year)
- 2017: $234,420 (+$11,448, +5.13% from previous year)
- 2018: $237,747 (+$3,327, +1.42% from previous year)
- 2019: $255,582 (+$17,835, +7.50% from previous year)
- 2020: $268,045 (+$12,462, +4.88% from previous year)
- 2021: $288,537 (+$20,493, +7.65% from previous year)
- 2022: $321,583 (+$33,046, +11.45% from previous year)
- 2023: $314,122 (-$7,461, -2.32% from previous year)
- 2024: $326,978 (+$12,856, +4.09% from previous year)
- 2025: $330,866 (+$3,888, +1.19% from previous year)
Sterling has added nearly $140,000 in median home value since 2010—a 73% gain. Like many Alaska towns, it saw its biggest growth from 2020 to 2022. After a brief decline in 2023, values have edged up again, with the current median sitting at $330,866.
Sterling – Growing Demand Along the Kenai

Sterling is located in the heart of the Kenai Peninsula, offering access to rivers, lakes, and hiking trails. It’s become increasingly popular with second-home buyers and retirees who want access to the outdoors without the higher prices of towns like Homer or Seward.
Its home prices mirror those of neighboring towns—steady growth through the 2010s, then rapid gains during the pandemic housing boom. The slight dip in 2023 wasn’t unique to Sterling, and the market has shown signs of regaining traction since then.
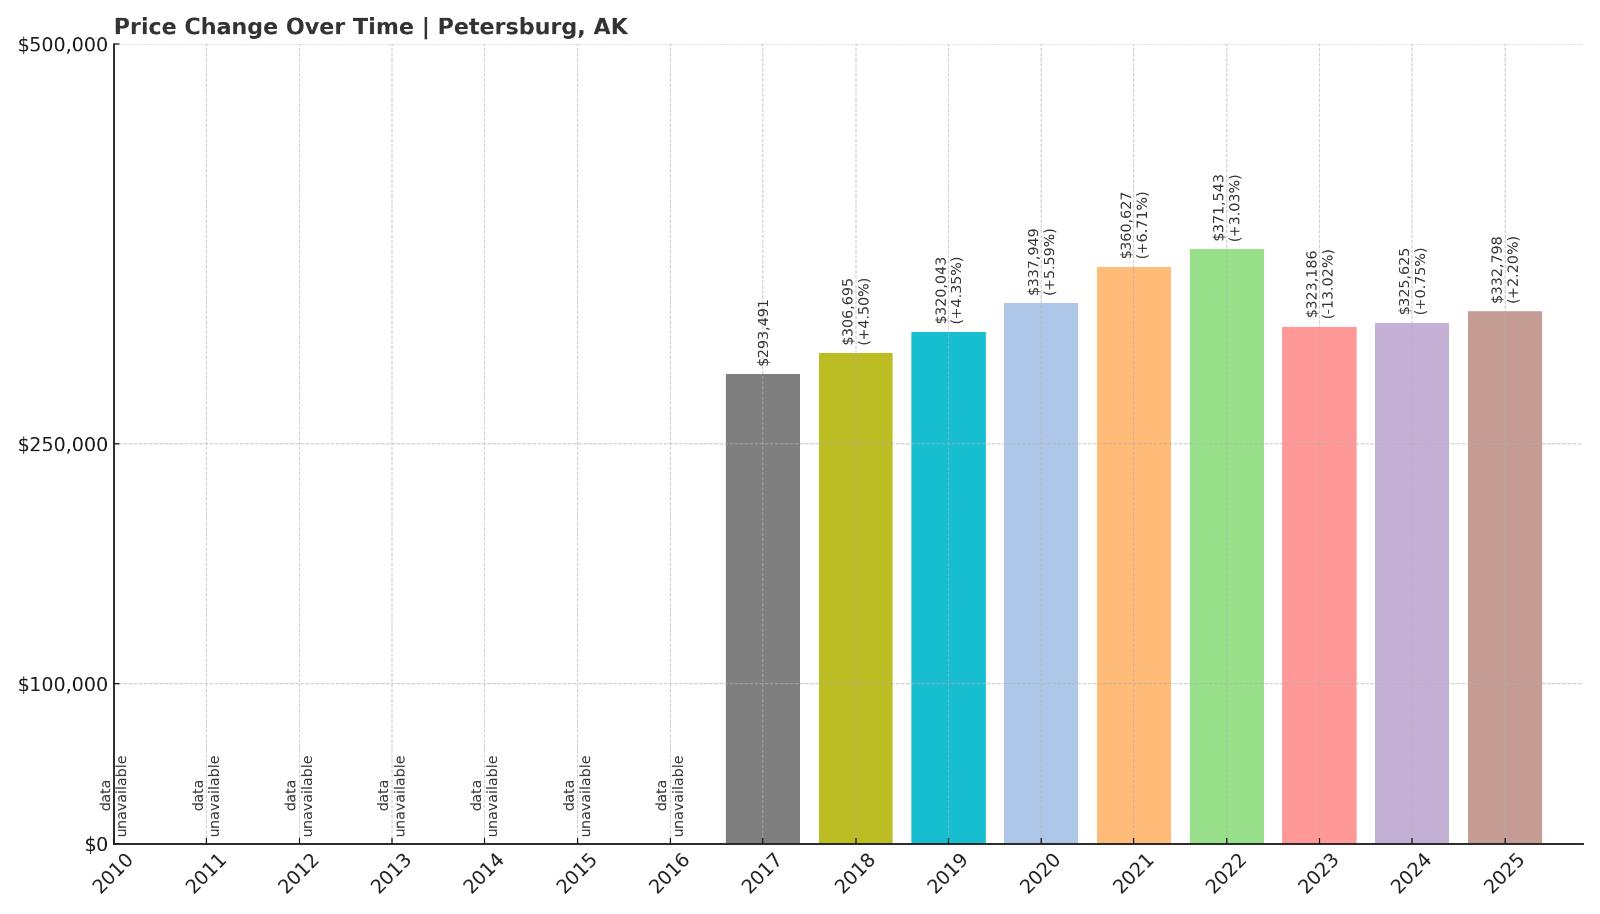
20. Petersburg – 13% Home Price Increase Since 2017
- 2010: N/A
- 2011: N/A
- 2012: N/A
- 2013: N/A
- 2014: N/A
- 2015: N/A
- 2016: N/A
- 2017: $293,491
- 2018: $306,695 (+$13,204, +4.50% from previous year)
- 2019: $320,043 (+$13,347, +4.35% from previous year)
- 2020: $337,949 (+$17,906, +5.60% from previous year)
- 2021: $360,627 (+$22,678, +6.71% from previous year)
- 2022: $371,543 (+$10,916, +3.03% from previous year)
- 2023: $323,186 (-$48,357, -13.02% from previous year)
- 2024: $325,625 (+$2,439, +0.75% from previous year)
- 2025: $332,798 (+$7,173, +2.20% from previous year)
Petersburg’s home values have increased 13% since 2017, though not without some major swings. The 2023 drop shaved off over $48,000 in value, but prices have slowly crept back up over the last two years.
Petersburg – Scenic Island Town With Price Whiplash

Set on Mitkof Island in Southeast Alaska, Petersburg has long attracted buyers with its fishing heritage and small-town charm. The town boomed in the early 2020s, with nearly $80,000 in gains from 2019 to 2022. That spike was followed by one of the steepest declines on this list.
Petersburg’s recent volatility may be tied to limited housing inventory and its dependence on seasonal industries. As the market stabilizes, 2025’s modest increase could suggest buyers are cautiously returning to the area.
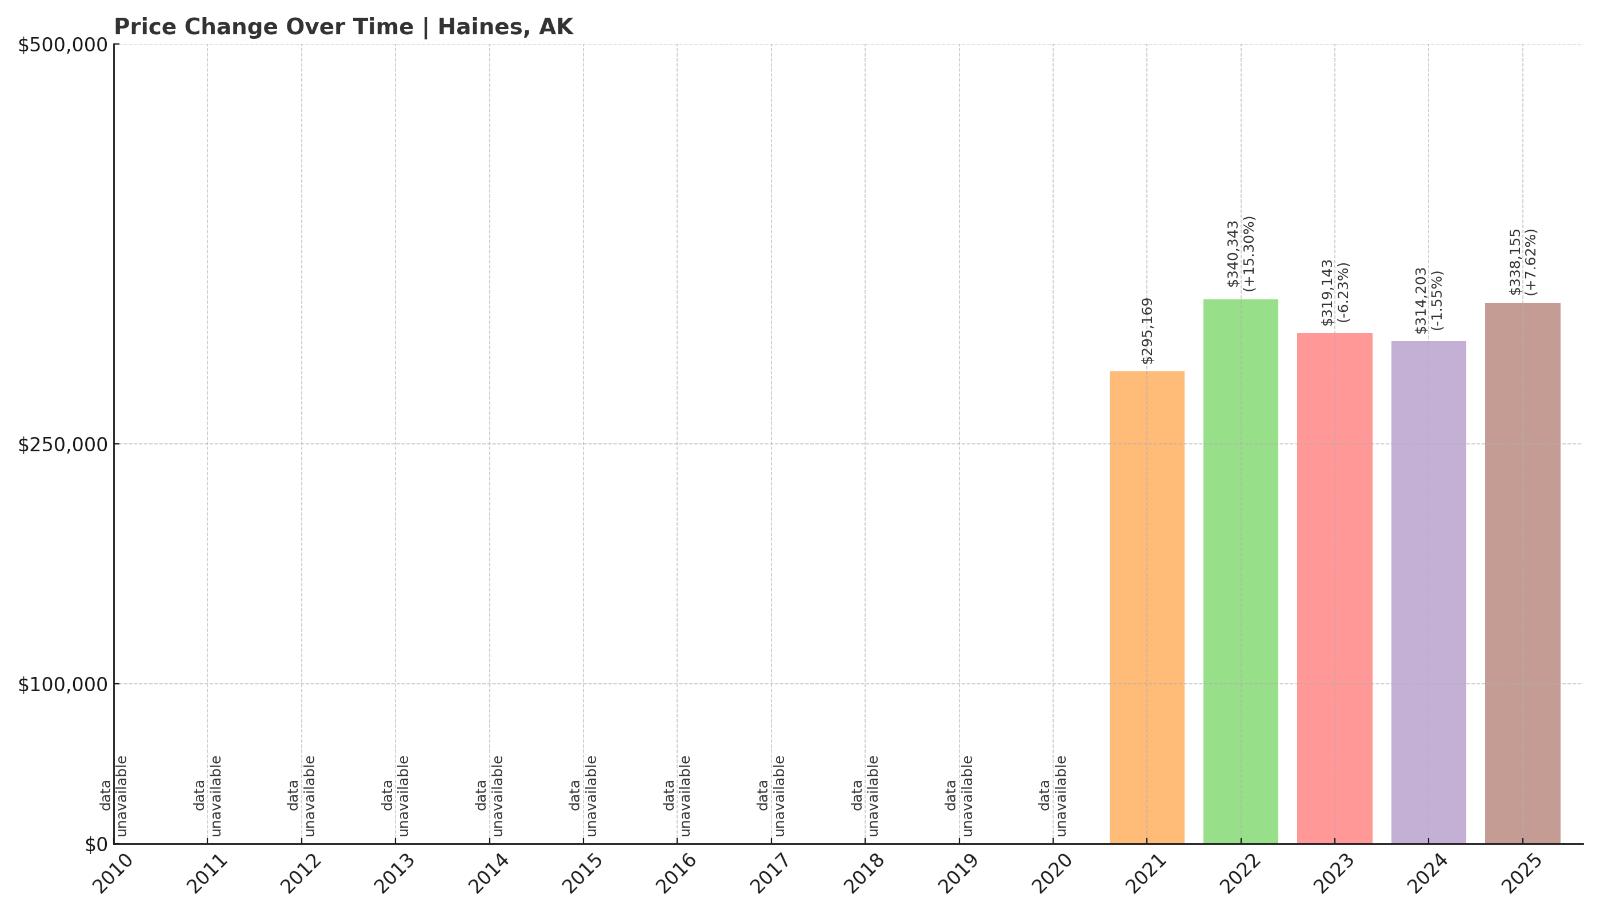
19. Haines – 15% Home Price Increase Since 2021
- 2010: N/A
- 2011: N/A
- 2012: N/A
- 2013: N/A
- 2014: N/A
- 2015: N/A
- 2016: N/A
- 2017: N/A
- 2018: N/A
- 2019: N/A
- 2020: N/A
- 2021: $295,169
- 2022: $340,343 (+$45,174, +15.30% from previous year)
- 2023: $319,143 (-$21,200, -6.23% from previous year)
- 2024: $314,203 (-$4,939, -1.55% from previous year)
- 2025: $338,155 (+$23,951, +7.62% from previous year)
Haines home prices have risen 15% since 2021, despite a bumpy ride. After a sharp jump in 2022, values dropped for two consecutive years before rebounding in 2025. The current median price sits at $338,155.
Haines – Priced for the Views and Solitude

Nestled between mountains and ocean, Haines draws in residents and second-home owners with its dramatic scenery and quiet pace of life. Though smaller than many towns on this list, it punches above its weight in home values, boosted by limited housing stock and a unique lifestyle appeal.
The rollercoaster pricing may reflect that volatility—especially with tourism-dependent economies. The 2025 rebound shows Haines hasn’t lost its allure, even if the past few years brought hesitation for some buyers.
18. Seward – 84% Home Price Increase Since 2010
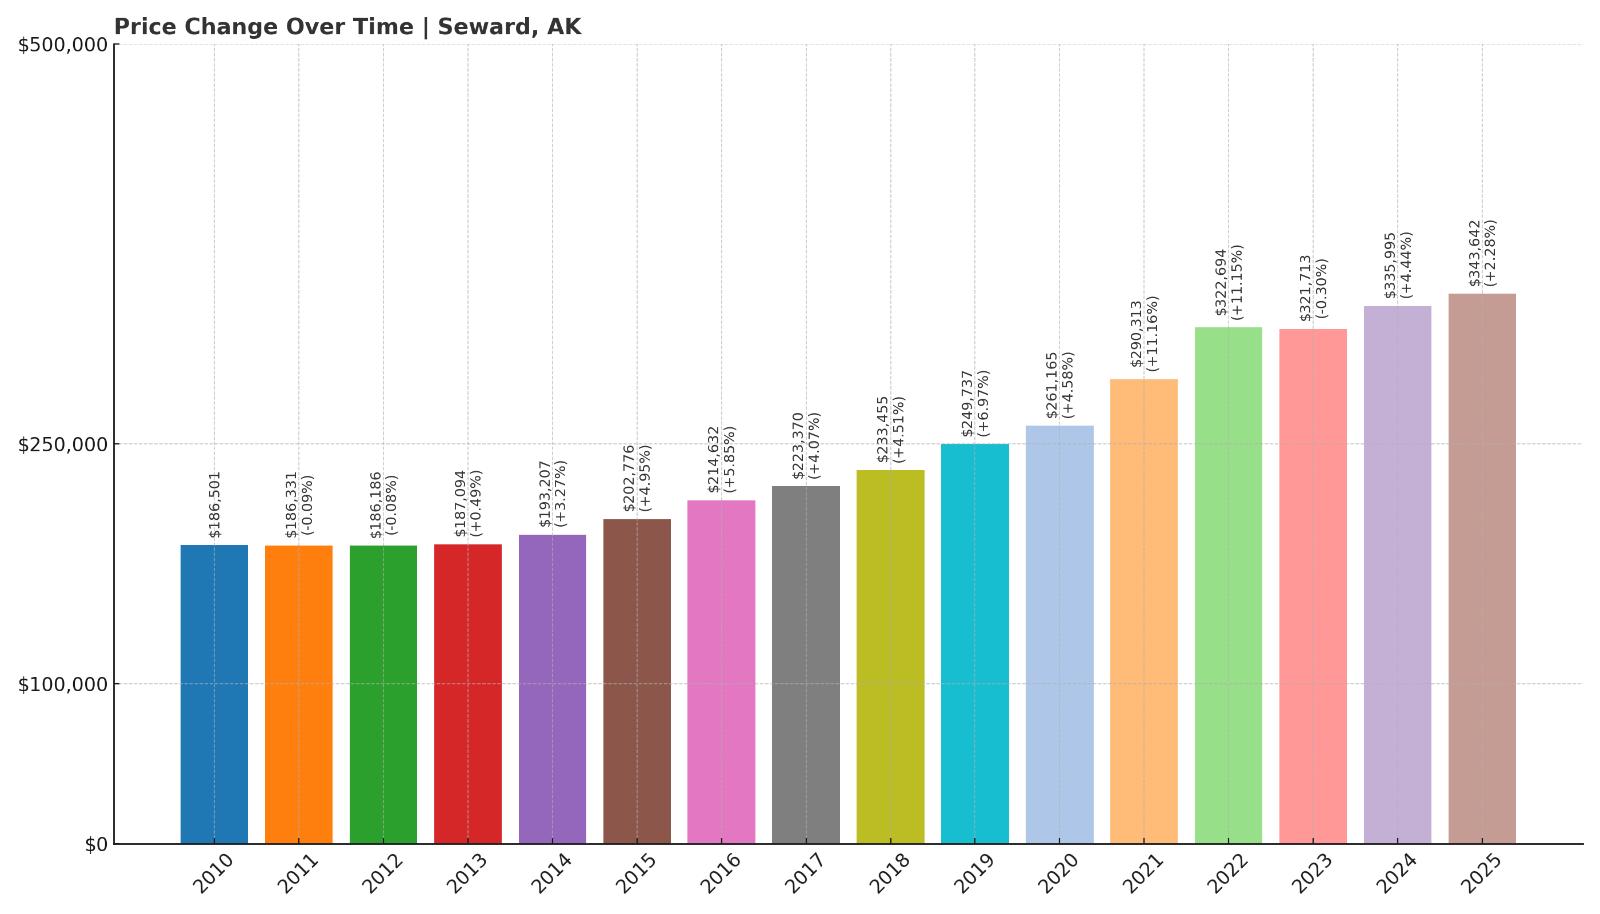
- 2010: $186,501
- 2011: $186,331 (-$170, -0.09% from previous year)
- 2012: $186,186 (-$145, -0.08% from previous year)
- 2013: $187,094 (+$908, +0.49% from previous year)
- 2014: $193,207 (+$6,114, +3.27% from previous year)
- 2015: $202,776 (+$9,568, +4.95% from previous year)
- 2016: $214,632 (+$11,856, +5.85% from previous year)
- 2017: $223,370 (+$8,738, +4.07% from previous year)
- 2018: $233,455 (+$10,085, +4.52% from previous year)
- 2019: $249,737 (+$16,282, +6.97% from previous year)
- 2020: $261,165 (+$11,429, +4.58% from previous year)
- 2021: $290,313 (+$29,147, +11.16% from previous year)
- 2022: $322,694 (+$32,381, +11.15% from previous year)
- 2023: $321,713 (-$981, -0.30% from previous year)
- 2024: $335,995 (+$14,282, +4.44% from previous year)
- 2025: $343,642 (+$7,647, +2.28% from previous year)
Seward has seen an 84% jump in home values since 2010. Most of that growth came after 2015, with especially steep gains during the housing boom of 2020 to 2022. Prices have remained high since, with a current median of $343,642.
Seward – Gateway to Adventure and Rising Values

Seward is a major port town on the Kenai Peninsula and a key jumping-off point for visitors to Kenai Fjords National Park. That exposure, paired with its limited inventory and rising tourist economy, has helped drive prices steadily upward over the years.
Its strong appreciation in the last five years mirrors the broader trend of migration to more remote, scenic locales. The brief dip in 2023 didn’t deter long-term demand, as prices resumed their climb in 2024 and 2025.
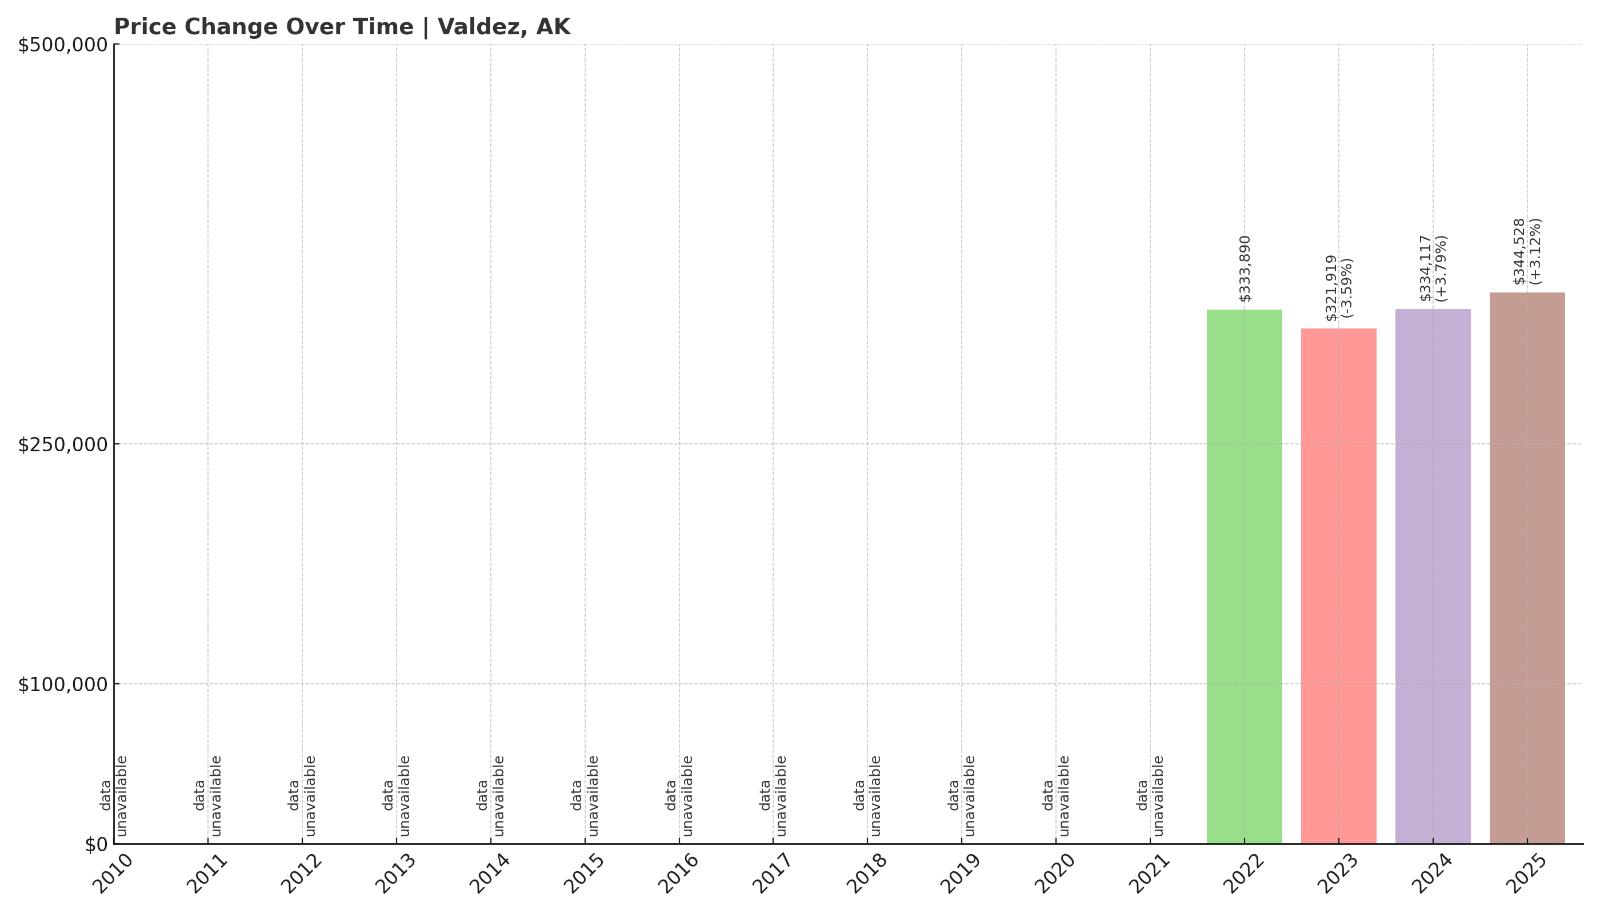
17. Valdez – 3% Home Price Increase Since 2022
- 2010: N/A
- 2011: N/A
- 2012: N/A
- 2013: N/A
- 2014: N/A
- 2015: N/A
- 2016: N/A
- 2017: N/A
- 2018: N/A
- 2019: N/A
- 2020: N/A
- 2021: N/A
- 2022: $333,890
- 2023: $321,919 (-$11,971, -3.59% from previous year)
- 2024: $334,117 (+$12,198, +3.79% from previous year)
- 2025: $344,528 (+$10,411, +3.12% from previous year)
Valdez home prices have risen modestly by 3% since 2022. The town saw a dip in 2023 but bounced back over the following two years, reaching $344,528 in 2025.
Valdez – Remote, Rugged, and Pricey

Valdez sits along Prince William Sound and is well-known for its deepwater port and its role in Alaska’s oil transport system. The town’s economy is a mix of shipping, oil infrastructure, and tourism, all of which support a housing market that remains relatively strong despite isolation.
Its rebound after the 2023 price dip suggests confidence in its long-term value, possibly driven by economic stability from the pipeline terminal and a growing interest in backcountry adventure travel.
16. Soldotna – 56% Home Price Increase Since 2010
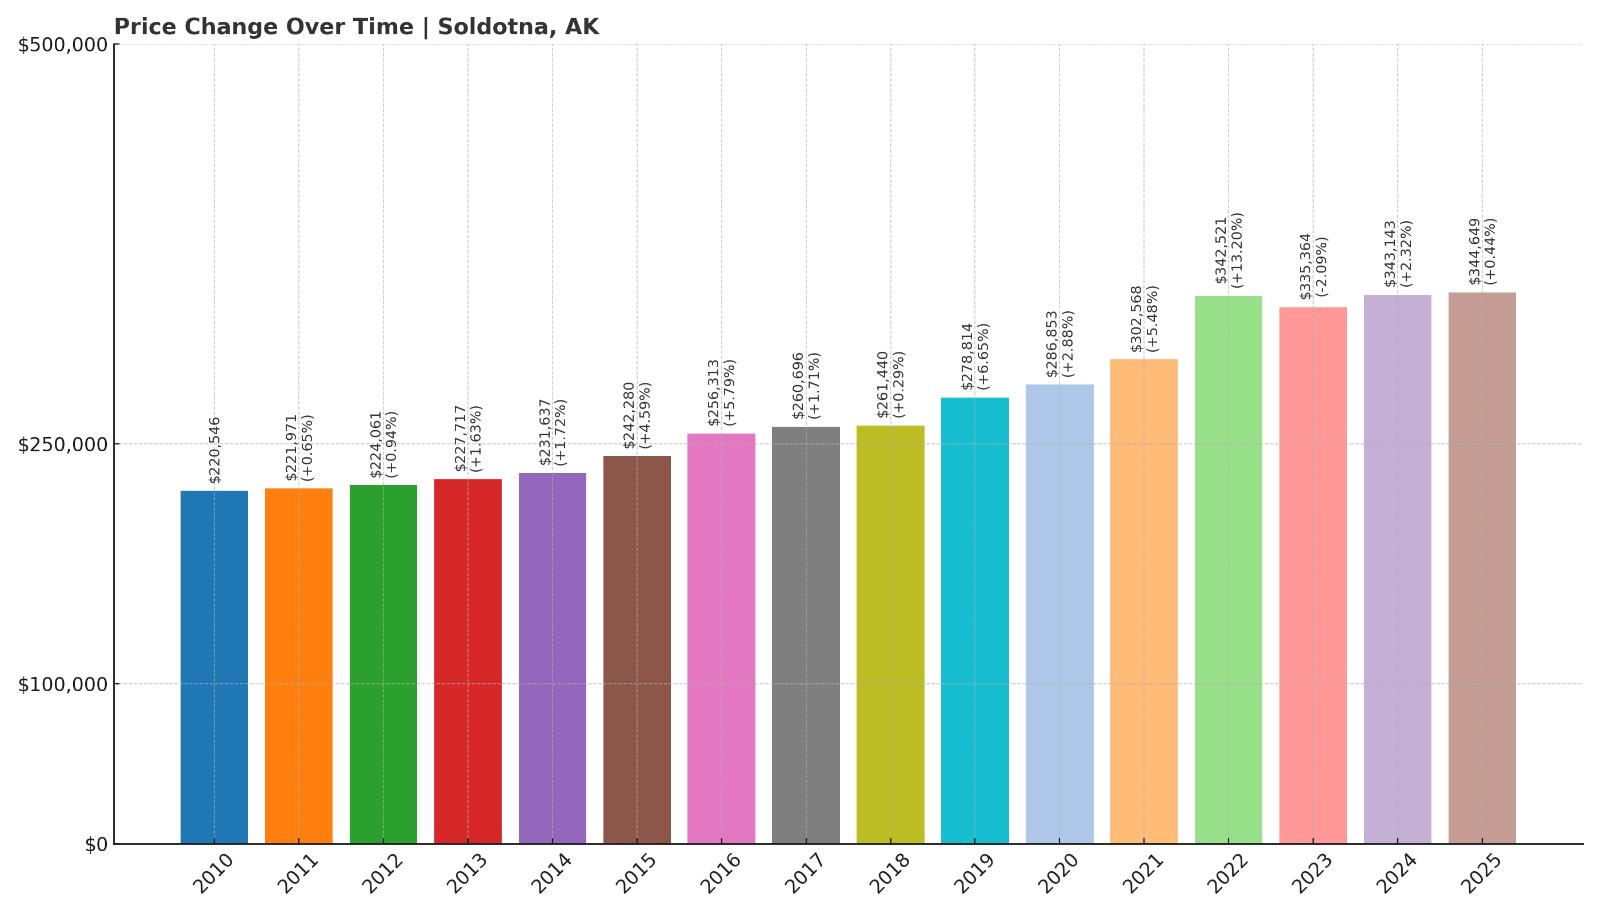
- 2010: $220,546
- 2011: $221,971 (+$1,424, +0.65% from previous year)
- 2012: $224,061 (+$2,090, +0.94% from previous year)
- 2013: $227,717 (+$3,656, +1.63% from previous year)
- 2014: $231,637 (+$3,920, +1.72% from previous year)
- 2015: $242,280 (+$10,644, +4.60% from previous year)
- 2016: $256,313 (+$14,033, +5.79% from previous year)
- 2017: $260,696 (+$4,383, +1.71% from previous year)
- 2018: $261,440 (+$744, +0.29% from previous year)
- 2019: $278,814 (+$17,374, +6.65% from previous year)
- 2020: $286,853 (+$8,039, +2.88% from previous year)
- 2021: $302,568 (+$15,716, +5.48% from previous year)
- 2022: $342,521 (+$39,953, +13.20% from previous year)
- 2023: $335,364 (-$7,157, -2.09% from previous year)
- 2024: $343,143 (+$7,779, +2.32% from previous year)
- 2025: $344,649 (+$1,506, +0.44% from previous year)
Soldotna’s home values have climbed 56% since 2010, with the largest growth happening between 2020 and 2022. Although appreciation has slowed, prices continue to trend upward, ending 2025 at $344,649.
Soldotna – A Central Hub on the Kenai

Often seen as the commercial heart of the Kenai Peninsula, Soldotna benefits from strong local infrastructure, shopping, and healthcare facilities that draw both residents and seasonal visitors. Its appeal lies in offering more services than neighboring towns without sacrificing proximity to rivers, mountains, and wildlife.
That balance of access and livability helped fuel its housing surge during the pandemic. While prices have steadied, the area remains one of the region’s key real estate markets with ongoing upward pressure.
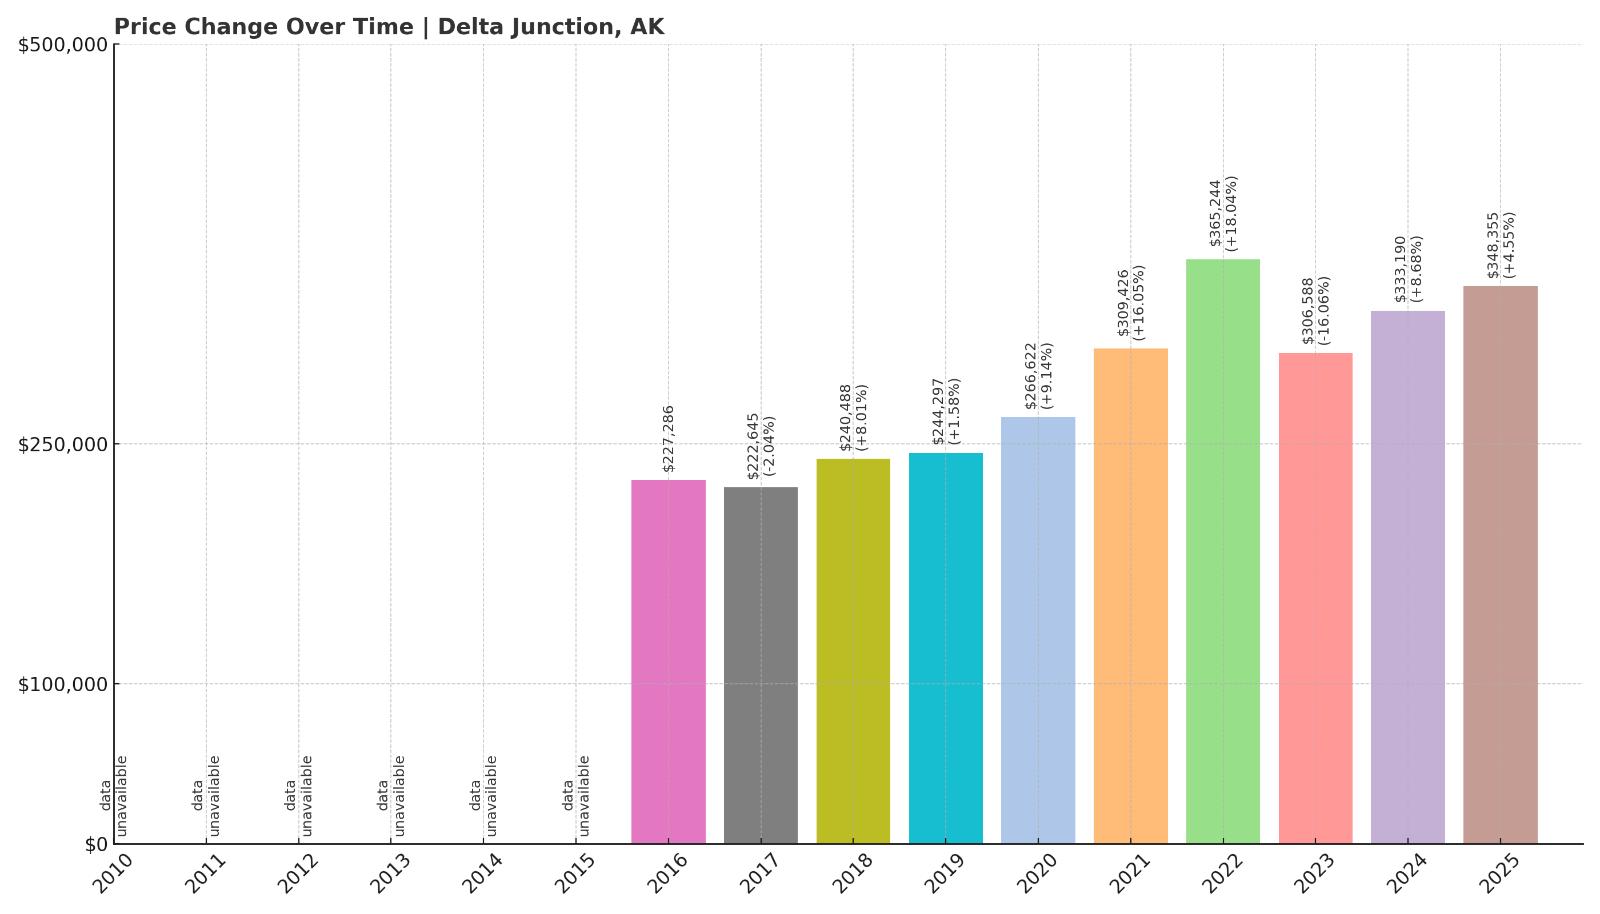
15. Delta Junction – 53% Home Price Increase Since 2016
Would you like to save this?
- 2010: N/A
- 2011: N/A
- 2012: N/A
- 2013: N/A
- 2014: N/A
- 2015: N/A
- 2016: $227,286
- 2017: $222,645 (-$4,641, -2.04% from previous year)
- 2018: $240,488 (+$17,844, +8.01% from previous year)
- 2019: $244,297 (+$3,808, +1.58% from previous year)
- 2020: $266,622 (+$22,325, +9.14% from previous year)
- 2021: $309,426 (+$42,805, +16.05% from previous year)
- 2022: $365,244 (+$55,818, +18.04% from previous year)
- 2023: $306,588 (-$58,657, -16.06% from previous year)
- 2024: $333,190 (+$26,602, +8.68% from previous year)
- 2025: $348,355 (+$15,164, +4.55% from previous year)
Home prices in Delta Junction have grown by 53% since 2016. After a steep drop in 2023, the market has bounced back, regaining $41,000 over the past two years to reach a median of $348,355 in 2025.
Delta Junction – Military Proximity and Big Swings

Southeast of Fairbanks, Delta Junction is shaped by its proximity to Fort Greely and associated defense-related activity. The sharp rise from 2020 to 2022 pushed prices skyward, likely due to housing shortages and infrastructure expansion in the region.
The correction in 2023 was dramatic, but recent gains suggest renewed confidence. Delta Junction’s remote setting and limited supply could mean continued volatility—but also long-term potential.
14. Meadow Lakes – 80% Home Price Increase Since 2010
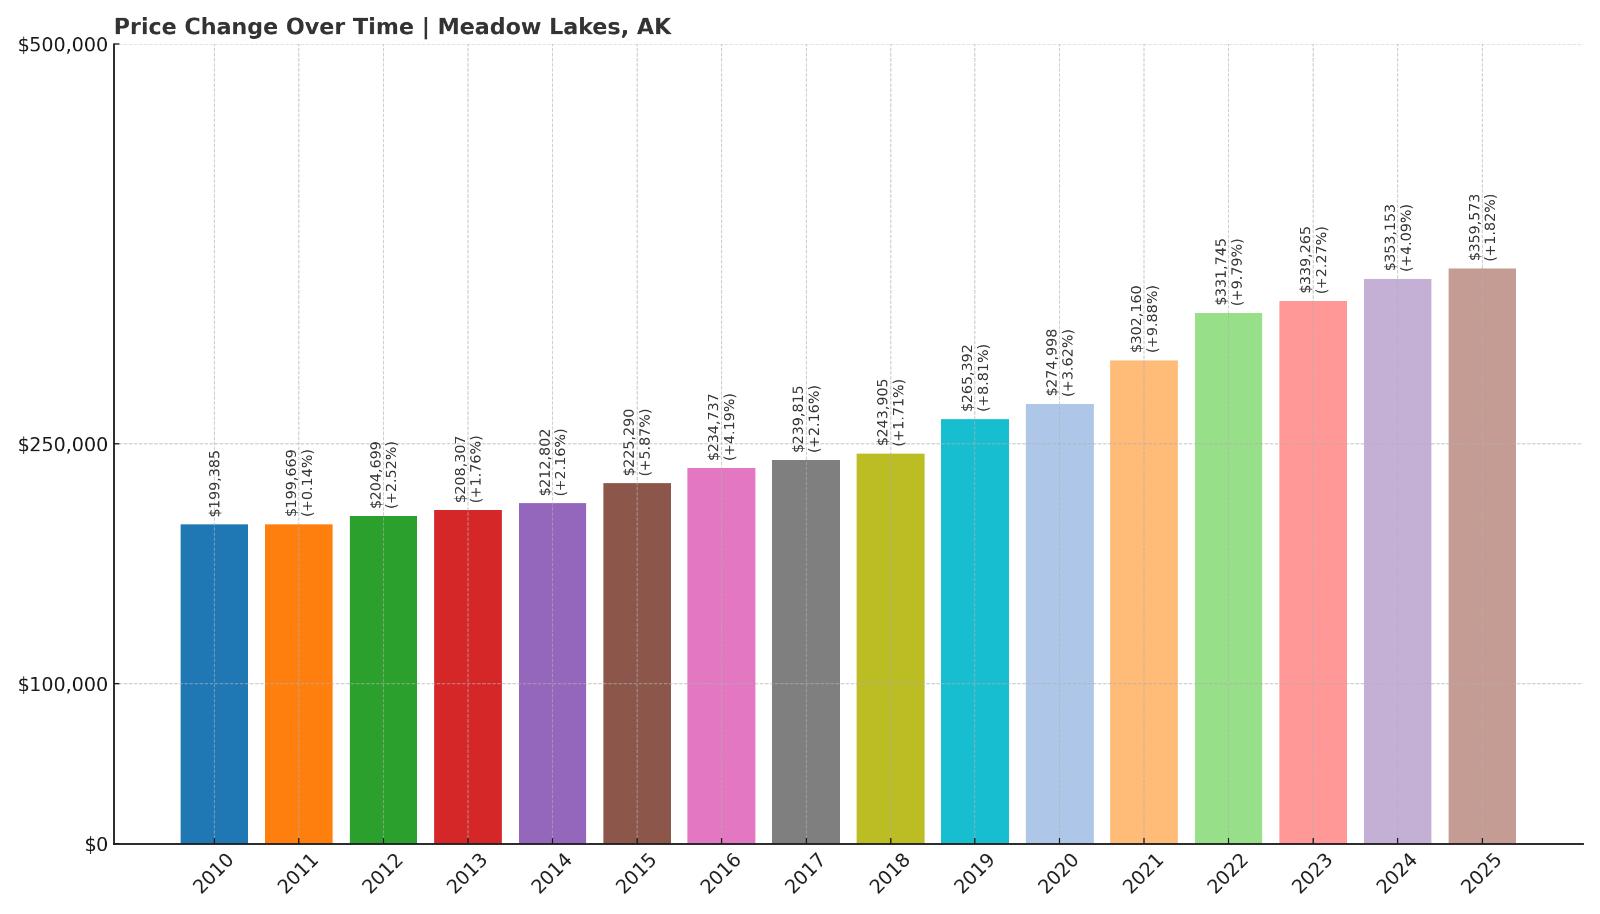
- 2010: $199,385
- 2011: $199,669 (+$284, +0.14% from previous year)
- 2012: $204,699 (+$5,030, +2.52% from previous year)
- 2013: $208,307 (+$3,608, +1.76% from previous year)
- 2014: $212,802 (+$4,495, +2.16% from previous year)
- 2015: $225,290 (+$12,488, +5.87% from previous year)
- 2016: $234,737 (+$9,448, +4.19% from previous year)
- 2017: $239,815 (+$5,078, +2.16% from previous year)
- 2018: $243,905 (+$4,090, +1.71% from previous year)
- 2019: $265,392 (+$21,487, +8.81% from previous year)
- 2020: $274,998 (+$9,606, +3.62% from previous year)
- 2021: $302,160 (+$27,162, +9.88% from previous year)
- 2022: $331,745 (+$29,586, +9.79% from previous year)
- 2023: $339,265 (+$7,519, +2.27% from previous year)
- 2024: $353,153 (+$13,888, +4.09% from previous year)
- 2025: $359,573 (+$6,420, +1.82% from previous year)
Meadow Lakes has seen home prices rise by 80% since 2010, with steady and mostly uninterrupted growth. The largest jumps came between 2019 and 2022, when values increased by more than $66,000 over just three years. Prices continue to inch upward, reaching nearly $360,000 in 2025.
Meadow Lakes – Growth Just Outside Wasilla

Meadow Lakes is part of the Matanuska-Susitna Borough, located just northwest of Wasilla. It’s a fast-growing residential area for commuters heading into Wasilla or even Anchorage. With plenty of space for new construction and lower prices than the nearby core towns, Meadow Lakes has attracted buyers over the past decade.
The area’s consistent growth suggests it’s transitioning from a rural outpost into a more developed community. That upward trend has been sustained by rising demand for housing outside urban centers, especially during and after the pandemic.
13. Homer – 68% Home Price Increase Since 2010
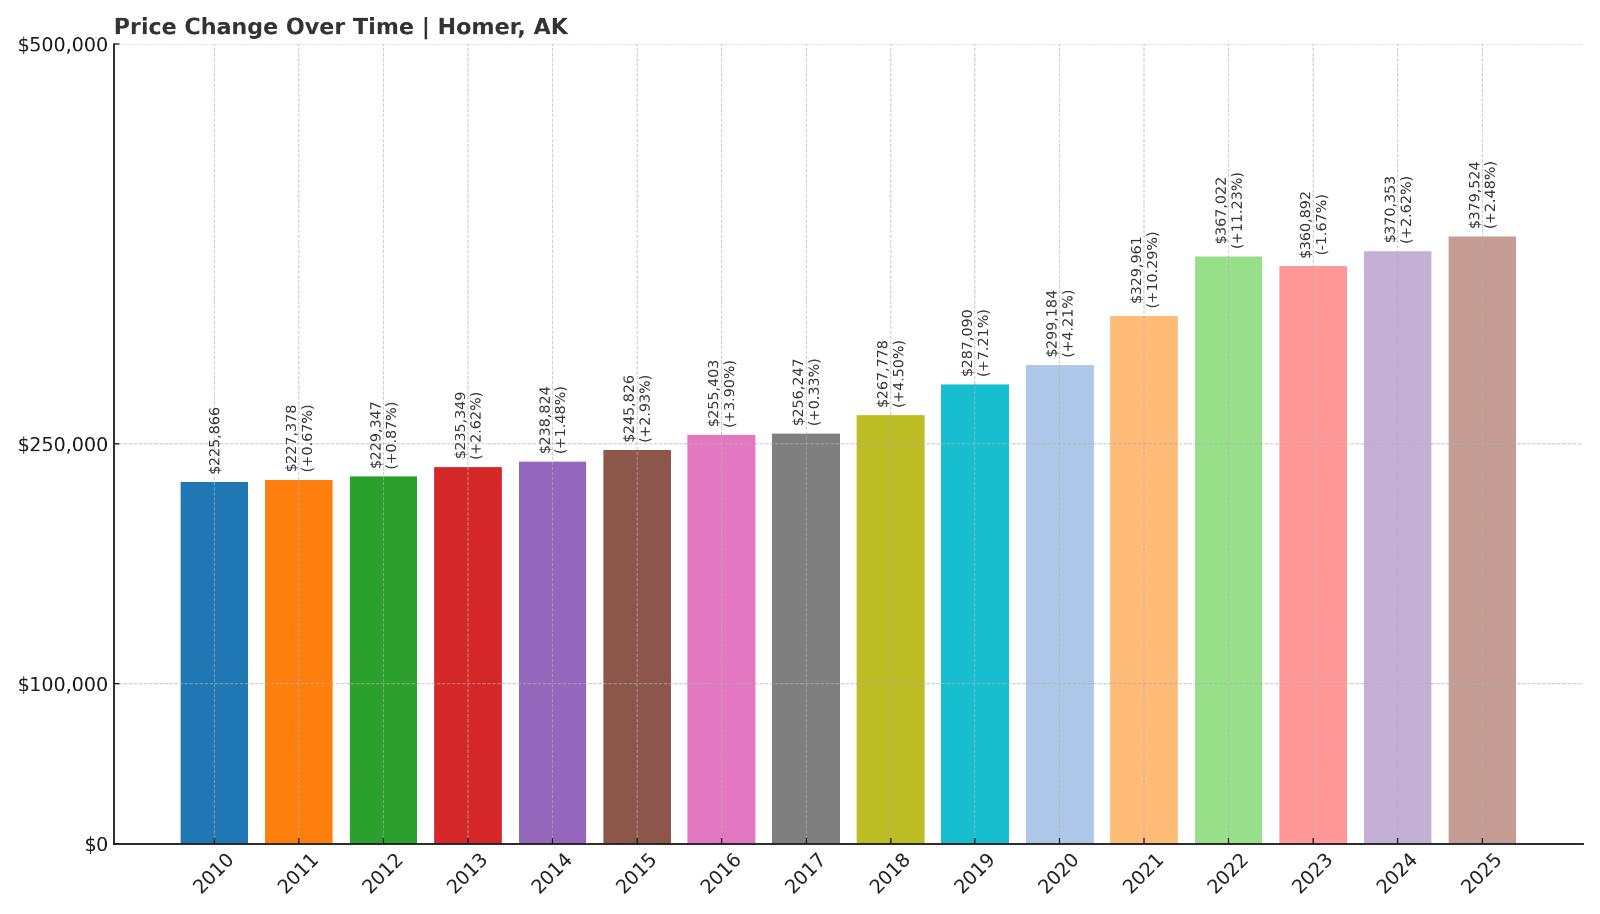
- 2010: $225,866
- 2011: $227,378 (+$1,512, +0.67% from previous year)
- 2012: $229,347 (+$1,969, +0.87% from previous year)
- 2013: $235,349 (+$6,002, +2.62% from previous year)
- 2014: $238,824 (+$3,474, +1.48% from previous year)
- 2015: $245,826 (+$7,002, +2.93% from previous year)
- 2016: $255,403 (+$9,577, +3.90% from previous year)
- 2017: $256,247 (+$844, +0.33% from previous year)
- 2018: $267,778 (+$11,531, +4.50% from previous year)
- 2019: $287,090 (+$19,312, +7.21% from previous year)
- 2020: $299,184 (+$12,094, +4.21% from previous year)
- 2021: $329,961 (+$30,777, +10.29% from previous year)
- 2022: $367,022 (+$37,061, +11.23% from previous year)
- 2023: $360,892 (-$6,130, -1.67% from previous year)
- 2024: $370,353 (+$9,460, +2.62% from previous year)
- 2025: $379,524 (+$9,171, +2.48% from previous year)
Home prices in Homer have increased by 68% since 2010. A strong growth phase between 2018 and 2022 added nearly $100,000 in value. Prices dipped slightly in 2023 but have since resumed their upward momentum.
Homer – A Popular Coastal Destination

Perched on the edge of Kachemak Bay, Homer is one of Alaska’s most picturesque towns. Its combination of arts culture, fishing industry, and ocean views keeps it popular with tourists and long-term residents alike. That demand has steadily pushed home values upward over the past 15 years.
The 2023 pause in growth appears to have been temporary. With limited land for new construction and ongoing interest in coastal Alaska living, Homer remains a reliable high-value market in the state.
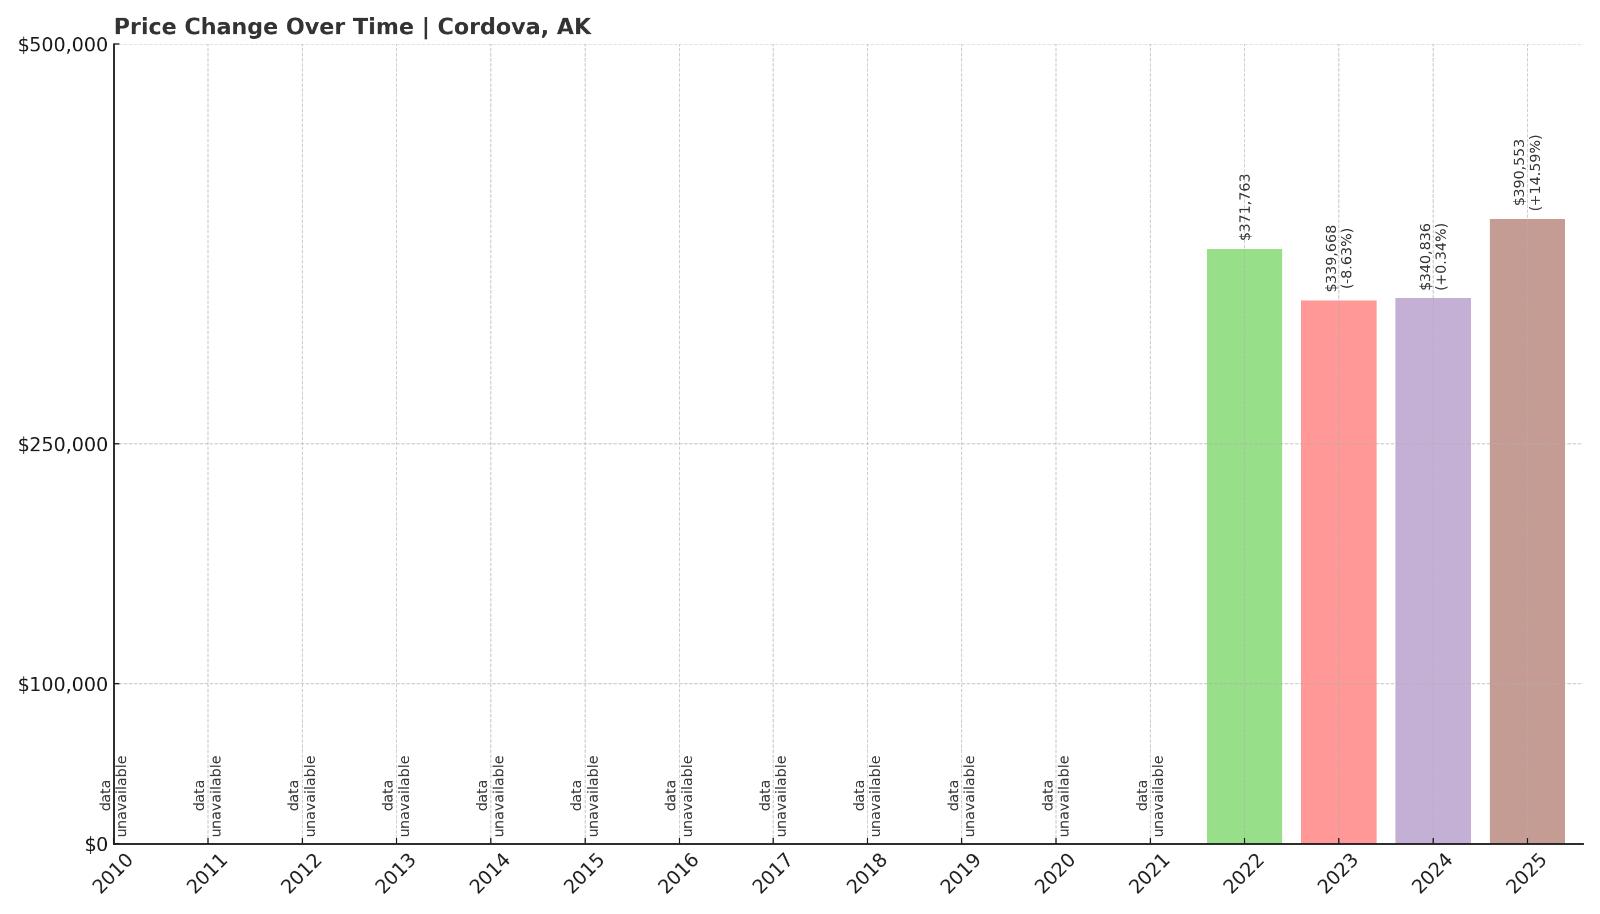
12. Cordova – 5% Home Price Increase Since 2022
- 2010: N/A
- 2011: N/A
- 2012: N/A
- 2013: N/A
- 2014: N/A
- 2015: N/A
- 2016: N/A
- 2017: N/A
- 2018: N/A
- 2019: N/A
- 2020: N/A
- 2021: N/A
- 2022: $371,763
- 2023: $339,668 (-$32,095, -8.63% from previous year)
- 2024: $340,836 (+$1,167, +0.34% from previous year)
- 2025: $390,553 (+$49,718, +14.59% from previous year)
Since 2022, Cordova home values have risen about 5% overall, though the journey has been uneven. A major dip in 2023 was erased by a strong rebound in 2025, pushing the median value to $390,553—its highest point yet.
Cordova – A Fishing Port With Big Swings

Cordova is a coastal community tucked into Prince William Sound, accessible only by air or sea. It’s best known for its commercial fishing industry and remote location. That isolation makes prices vulnerable to big year-to-year shifts depending on economic and population trends.
The large jump in 2025 suggests renewed interest or a tightening market, despite the challenges of distance. For those seeking a true off-the-grid lifestyle in a working port town, Cordova continues to attract a specific and steady pool of buyers.
11. Anchorage – 45% Home Price Increase Since 2010
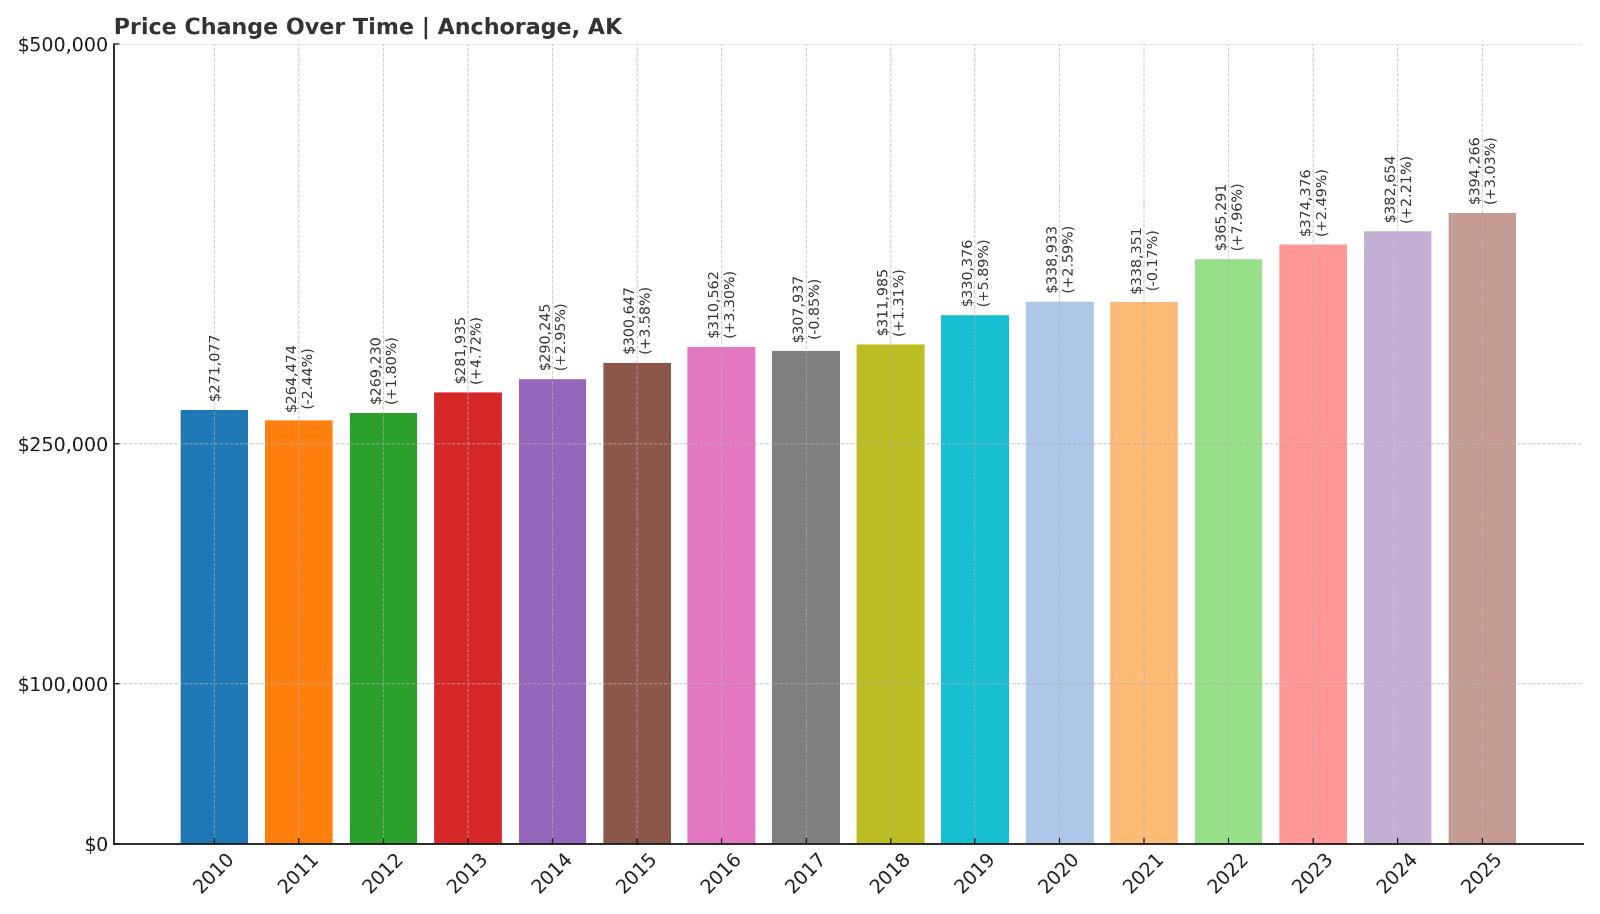
- 2010: $271,077
- 2011: $264,474 (-$6,604, -2.44% from previous year)
- 2012: $269,230 (+$4,757, +1.80% from previous year)
- 2013: $281,935 (+$12,704, +4.72% from previous year)
- 2014: $290,245 (+$8,311, +2.95% from previous year)
- 2015: $300,647 (+$10,402, +3.58% from previous year)
- 2016: $310,562 (+$9,915, +3.30% from previous year)
- 2017: $307,937 (-$2,625, -0.85% from previous year)
- 2018: $311,985 (+$4,047, +1.31% from previous year)
- 2019: $330,376 (+$18,391, +5.89% from previous year)
- 2020: $338,933 (+$8,557, +2.59% from previous year)
- 2021: $338,351 (-$582, -0.17% from previous year)
- 2022: $365,291 (+$26,939, +7.96% from previous year)
- 2023: $374,376 (+$9,085, +2.49% from previous year)
- 2024: $382,654 (+$8,278, +2.21% from previous year)
- 2025: $394,266 (+$11,612, +3.03% from previous year)
Anchorage has seen a 45% increase in median home prices since 2010. The city posted modest yearly gains until 2022, when values jumped nearly $27,000. Since then, growth has remained steady, reaching just under $395,000 in 2025.
Anchorage – Alaska’s Urban Anchor

As the state’s largest city, Anchorage plays a central role in Alaska’s economy and housing market. It offers the most amenities, jobs, and infrastructure, which helps support a relatively stable real estate environment. Unlike smaller towns, Anchorage doesn’t experience wild year-to-year swings but still benefits from long-term appreciation.
That slow-and-steady rise was interrupted in 2022 by a stronger-than-usual jump, likely driven by pandemic demand and tight supply. Since then, growth has returned to its typical pace, keeping Anchorage firmly among Alaska’s most expensive markets.
10. Wasilla – 70% Home Price Increase Since 2010
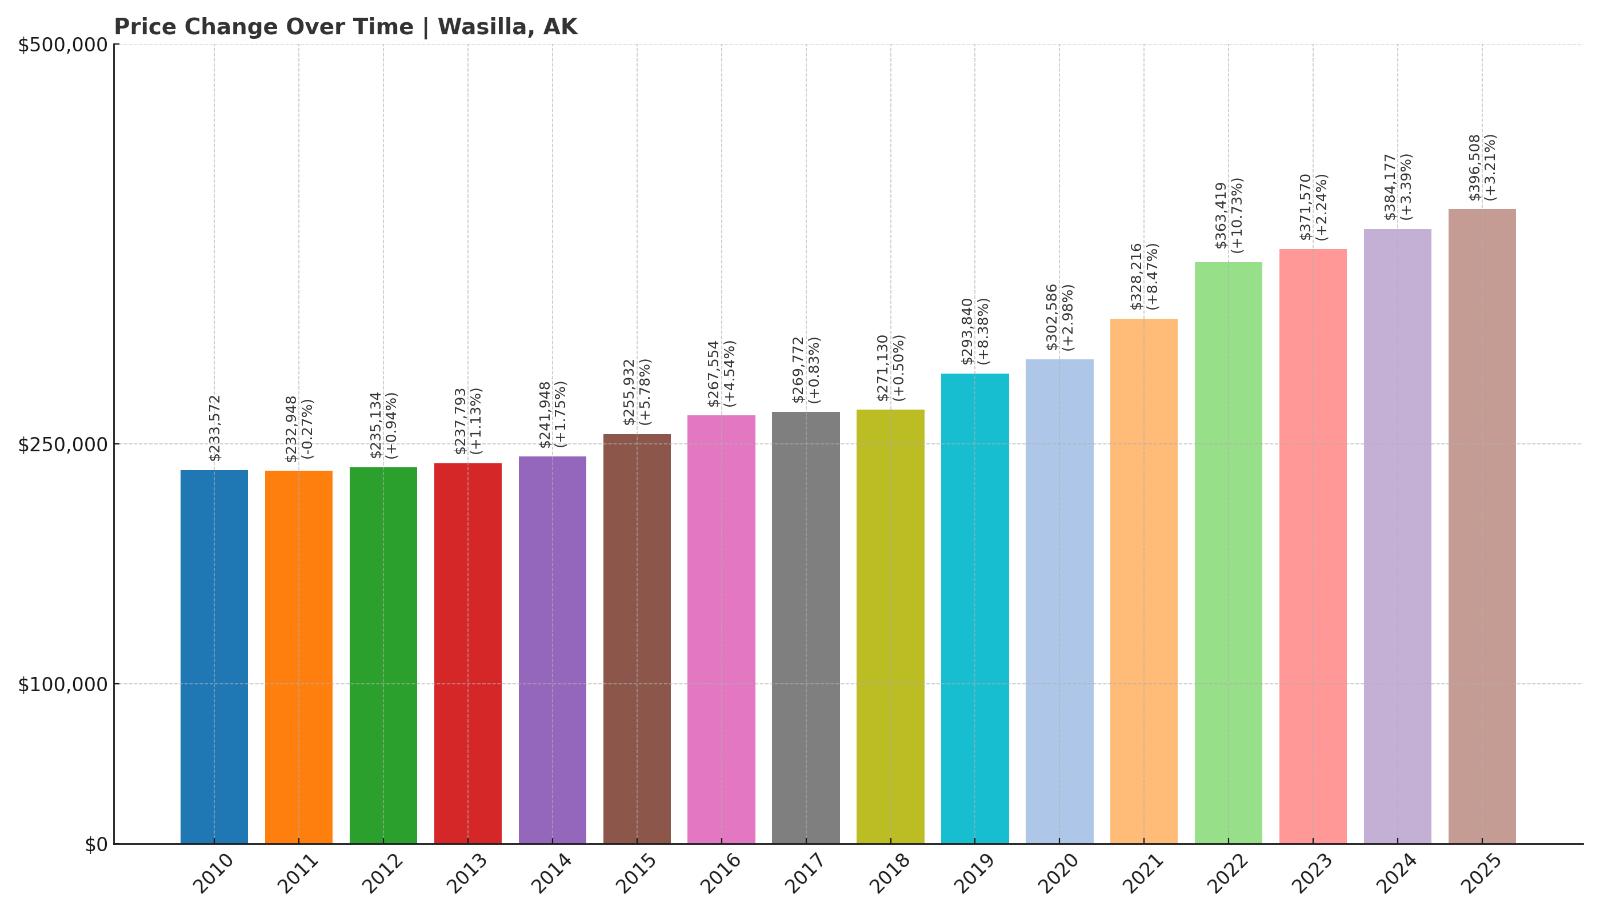
- 2010: $233,572
- 2011: $232,948 (-$624, -0.27% from previous year)
- 2012: $235,134 (+$2,186, +0.94% from previous year)
- 2013: $237,793 (+$2,659, +1.13% from previous year)
- 2014: $241,948 (+$4,155, +1.75% from previous year)
- 2015: $255,932 (+$13,984, +5.78% from previous year)
- 2016: $267,554 (+$11,622, +4.54% from previous year)
- 2017: $269,772 (+$2,218, +0.83% from previous year)
- 2018: $271,130 (+$1,358, +0.50% from previous year)
- 2019: $293,840 (+$22,710, +8.38% from previous year)
- 2020: $302,586 (+$8,746, +2.98% from previous year)
- 2021: $328,216 (+$25,630, +8.47% from previous year)
- 2022: $363,419 (+$35,203, +10.73% from previous year)
- 2023: $371,570 (+$8,151, +2.24% from previous year)
- 2024: $384,177 (+$12,607, +3.39% from previous year)
- 2025: $396,508 (+$12,331, +3.21% from previous year)
Wasilla has grown by 70% since 2010, making it one of the most consistently appreciating markets in Alaska. Prices rose sharply between 2019 and 2022 and have continued to climb since, reaching $396,508 in 2025.
Wasilla – Fast-Growing Hub in the Mat-Su Valley

Wasilla has evolved from a small town into a major residential center for Alaskans commuting to Anchorage. As the Mat-Su Borough’s population has surged, so has demand for homes in Wasilla. The town offers more space, newer construction, and lower costs than Anchorage, driving long-term price gains.
Wasilla’s growth doesn’t appear to be slowing. With infrastructure improvements and new subdivisions under way, it remains one of the state’s most active housing markets—and among its most expensive.
9. Ketchikan – 70% Home Price Increase Since 2010
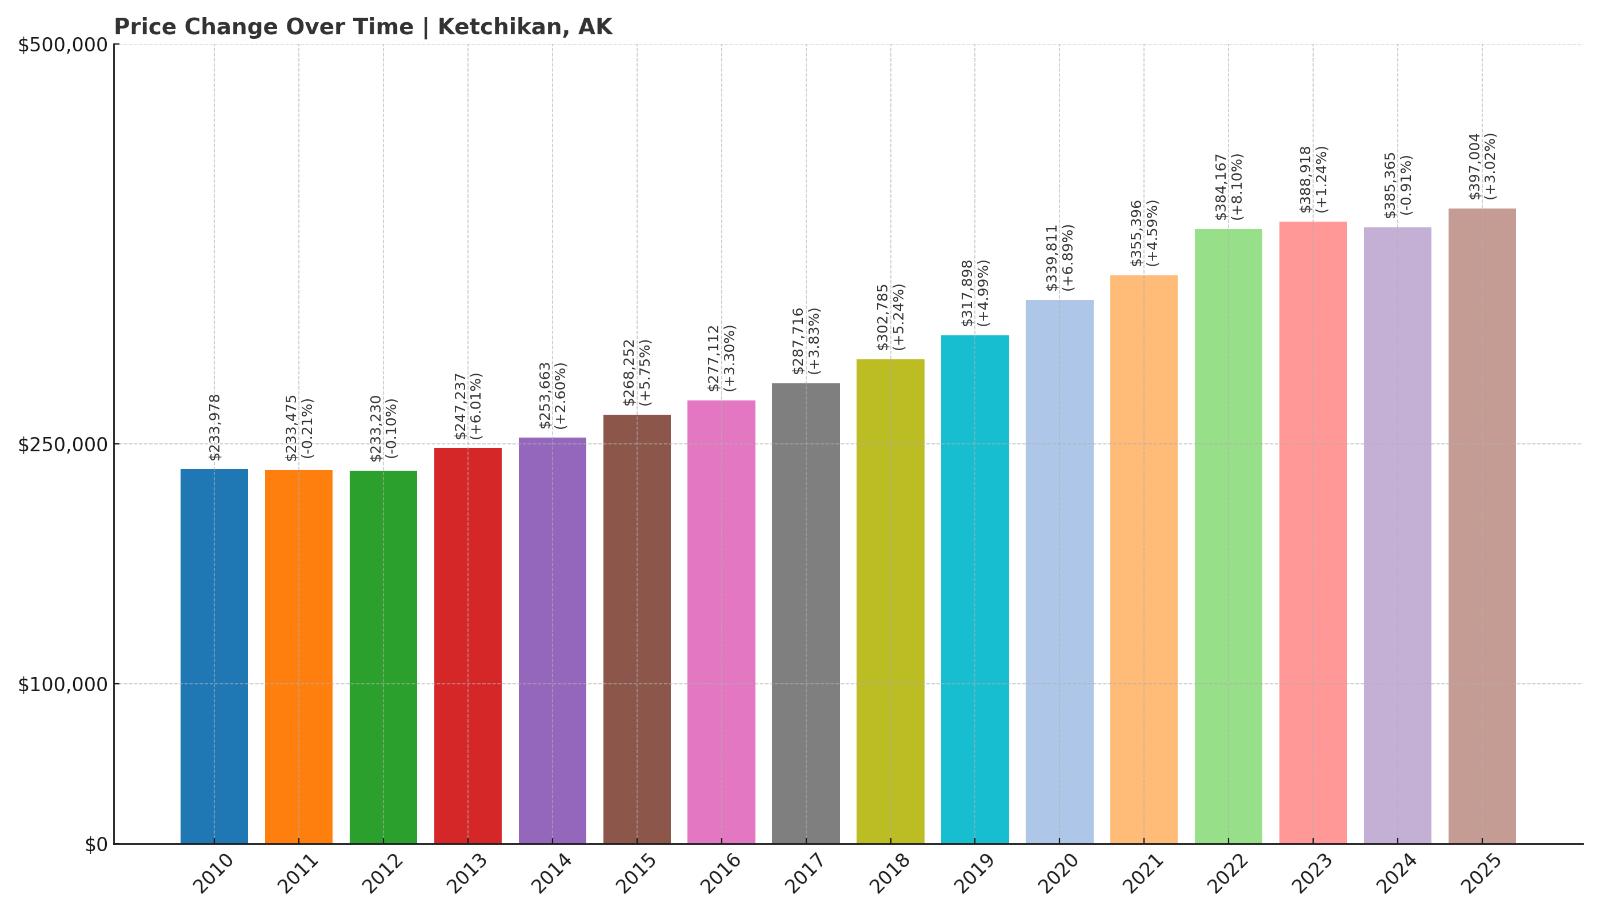
- 2010: $233,978
- 2011: $233,475 (-$503, -0.21% from previous year)
- 2012: $233,230 (-$245, -0.11% from previous year)
- 2013: $247,237 (+$14,007, +6.01% from previous year)
- 2014: $253,663 (+$6,427, +2.60% from previous year)
- 2015: $268,252 (+$14,589, +5.75% from previous year)
- 2016: $277,112 (+$8,860, +3.30% from previous year)
- 2017: $287,716 (+$10,604, +3.83% from previous year)
- 2018: $302,785 (+$15,069, +5.24% from previous year)
- 2019: $317,898 (+$15,113, +4.99% from previous year)
- 2020: $339,811 (+$21,913, +6.89% from previous year)
- 2021: $355,396 (+$15,585, +4.59% from previous year)
- 2022: $384,167 (+$28,771, +8.10% from previous year)
- 2023: $388,918 (+$4,752, +1.24% from previous year)
- 2024: $385,365 (-$3,553, -0.91% from previous year)
- 2025: $397,004 (+$11,639, +3.02% from previous year)
Ketchikan home prices have climbed 70% since 2010, reflecting steady demand over the years. Though there was a brief dip in 2024, the market rebounded again in 2025, bringing values to nearly $400,000.
Ketchikan – Popular Port with Steady Climb

As one of the main entry points for cruise tourism in Southeast Alaska, Ketchikan plays a unique role in the state’s economy. Its island setting and limited space for new development have kept housing inventory tight. This scarcity, paired with a consistent influx of visitors and seasonal workers, has supported long-term value increases.
Ketchikan’s relatively stable market shows that it hasn’t been subject to the extreme price swings seen elsewhere in Alaska. The consistent growth makes it one of the most reliable high-value towns in the state.
8. Palmer – 72% Home Price Increase Since 2010

- 2010: $232,278
- 2011: $233,128 (+$851, +0.37% from previous year)
- 2012: $233,799 (+$671, +0.29% from previous year)
- 2013: $237,232 (+$3,432, +1.47% from previous year)
- 2014: $242,725 (+$5,493, +2.32% from previous year)
- 2015: $257,738 (+$15,013, +6.19% from previous year)
- 2016: $268,838 (+$11,100, +4.31% from previous year)
- 2017: $272,997 (+$4,159, +1.55% from previous year)
- 2018: $273,071 (+$73, +0.03% from previous year)
- 2019: $294,601 (+$21,530, +7.88% from previous year)
- 2020: $305,716 (+$11,115, +3.77% from previous year)
- 2021: $334,300 (+$28,584, +9.35% from previous year)
- 2022: $364,886 (+$30,586, +9.15% from previous year)
- 2023: $376,250 (+$11,365, +3.11% from previous year)
- 2024: $390,258 (+$14,007, +3.72% from previous year)
- 2025: $398,908 (+$8,650, +2.22% from previous year)
Palmer home values have risen more than 72% since 2010, with a notable surge in the early 2020s. The town continues to experience solid year-over-year increases, bringing the current median to just under $400,000.
Palmer – Agriculture Roots Meet Suburban Growth

Located in the Matanuska-Susitna Valley, Palmer has transformed from a quiet agricultural town into a rapidly growing residential area. Its location, roughly 45 minutes northeast of Anchorage, makes it an attractive option for commuters and families seeking more space for less cost.
Recent growth has been fueled by new developments and Palmer’s reputation for community charm and scenic beauty. As the Mat-Su Valley continues to expand, Palmer remains a key part of the region’s housing market.
7. Kodiak – 77% Home Price Increase Since 2010
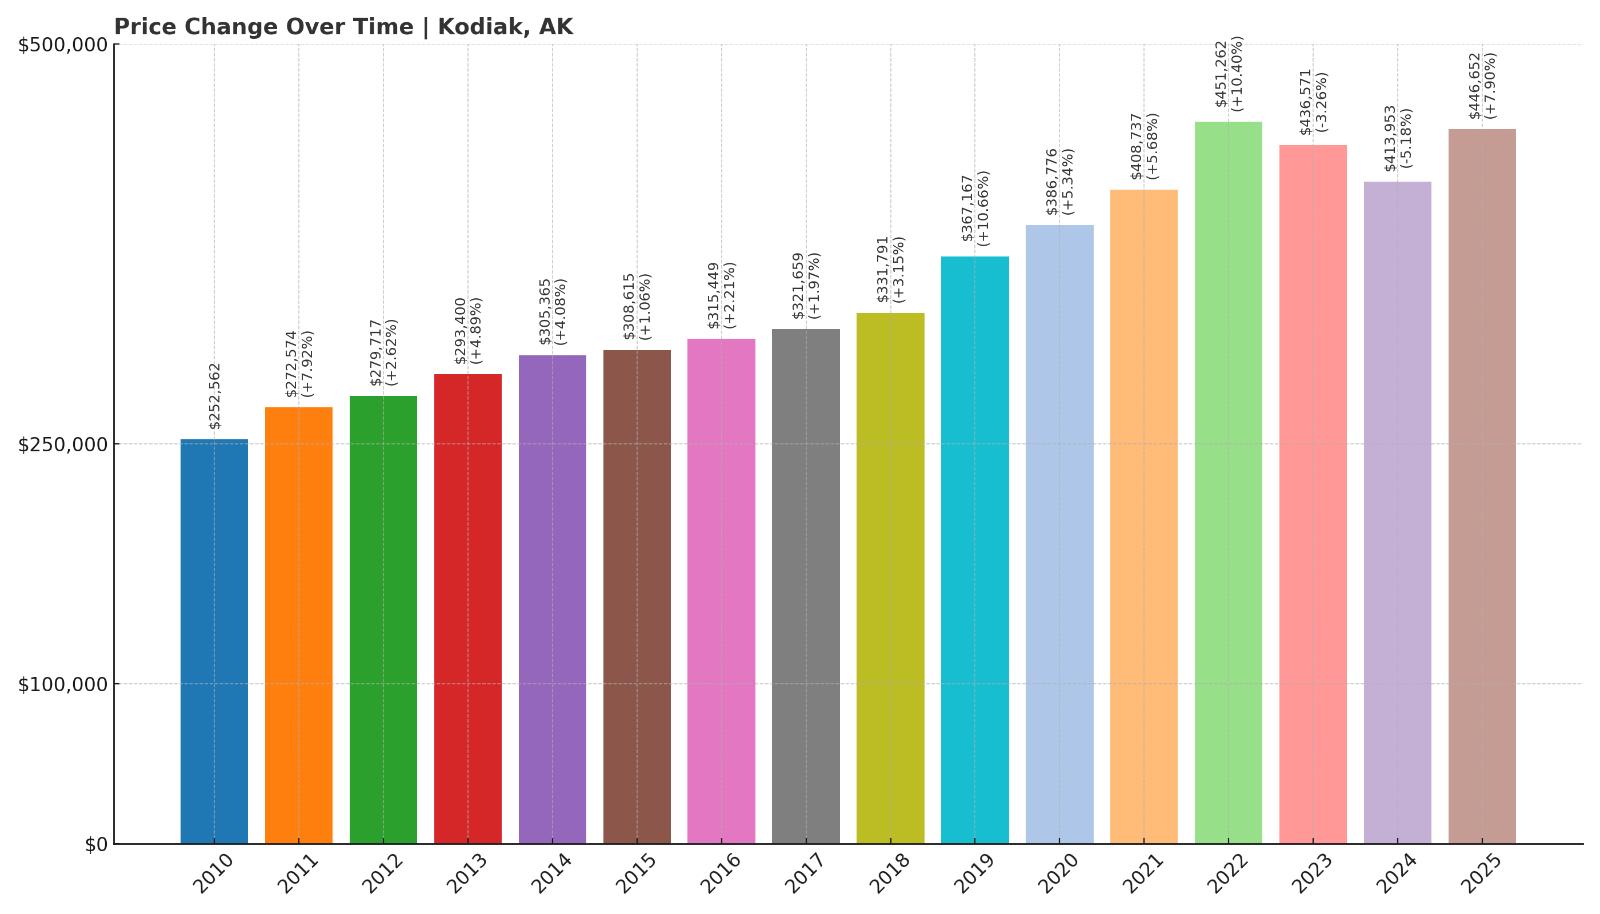
- 2010: $252,562
- 2011: $272,574 (+$20,011, +7.92% from previous year)
- 2012: $279,717 (+$7,143, +2.62% from previous year)
- 2013: $293,400 (+$13,683, +4.89% from previous year)
- 2014: $305,365 (+$11,965, +4.08% from previous year)
- 2015: $308,615 (+$3,250, +1.06% from previous year)
- 2016: $315,449 (+$6,834, +2.21% from previous year)
- 2017: $321,659 (+$6,210, +1.97% from previous year)
- 2018: $331,791 (+$10,132, +3.15% from previous year)
- 2019: $367,167 (+$35,376, +10.66% from previous year)
- 2020: $386,776 (+$19,609, +5.34% from previous year)
- 2021: $408,737 (+$21,961, +5.68% from previous year)
- 2022: $451,262 (+$42,525, +10.40% from previous year)
- 2023: $436,571 (-$14,691, -3.26% from previous year)
- 2024: $413,953 (-$22,618, -5.18% from previous year)
- 2025: $446,652 (+$32,699, +7.90% from previous year)
Kodiak’s home prices have increased by 77% since 2010. After a slight retreat in 2023 and 2024, values jumped again in 2025, adding over $32,000 in a single year and pushing the median to nearly $447,000.
Kodiak – Fishing Hub with Big Rebounds

As the largest island community in Alaska, Kodiak is vital to the state’s commercial fishing industry. Housing demand is supported by a mix of permanent residents, seasonal workers, and Coast Guard personnel. That demand can cause big swings—as seen in the recent dip and recovery.
Kodiak’s 2025 price surge suggests strong buyer confidence has returned. While its remote location makes logistics tricky, its economic base and limited inventory keep prices resilient in the long run.
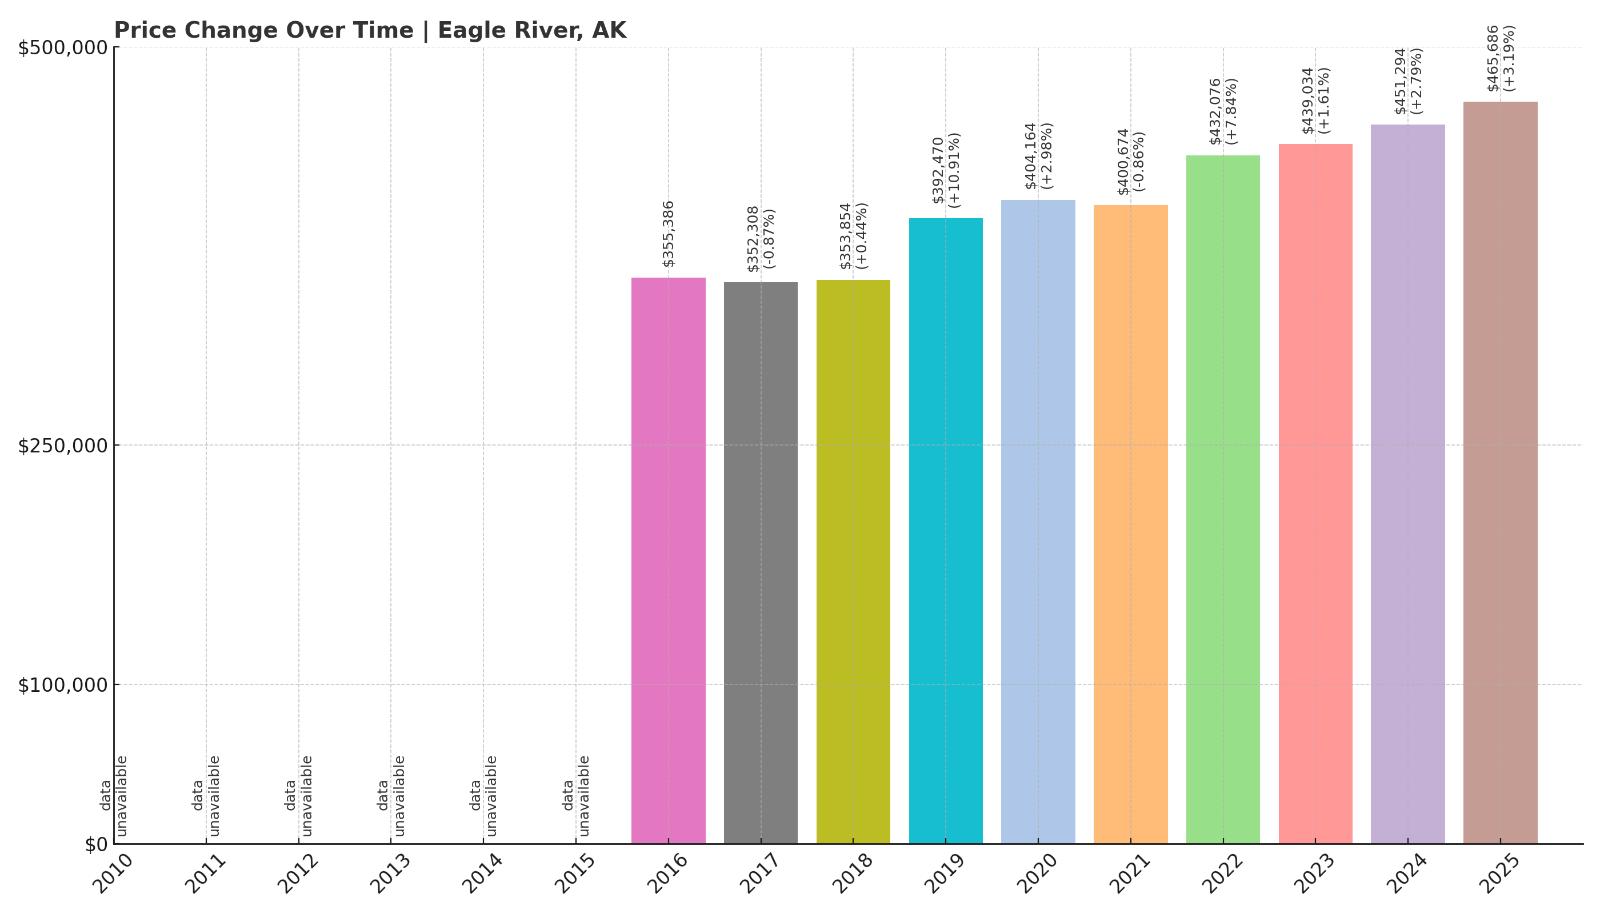
6. Eagle River – 31% Home Price Increase Since 2016
- 2010: N/A
- 2011: N/A
- 2012: N/A
- 2013: N/A
- 2014: N/A
- 2015: N/A
- 2016: $355,386
- 2017: $352,308 (-$3,078, -0.87% from previous year)
- 2018: $353,854 (+$1,546, +0.44% from previous year)
- 2019: $392,470 (+$38,616, +10.91% from previous year)
- 2020: $404,164 (+$11,694, +2.98% from previous year)
- 2021: $400,674 (-$3,491, -0.86% from previous year)
- 2022: $432,076 (+$31,402, +7.84% from previous year)
- 2023: $439,034 (+$6,958, +1.61% from previous year)
- 2024: $451,294 (+$12,260, +2.79% from previous year)
- 2025: $465,686 (+$14,391, +3.19% from previous year)
Since 2016, home prices in Eagle River have increased by 31%, reaching $465,686 in 2025. The town saw a dramatic rise in 2019 and has continued to post gains almost every year since.
Eagle River – Anchorage Adjacent with High Demand

Situated between Anchorage and the Mat-Su Valley, Eagle River has become one of the most desirable commuter communities in Southcentral Alaska. Its mix of suburban feel and mountain scenery appeals to both families and professionals seeking proximity to the city without living downtown.
Limited land and newer construction have kept prices higher than many other Anchorage suburbs. With demand staying strong, Eagle River continues to post consistent, inflation-beating home value increases.
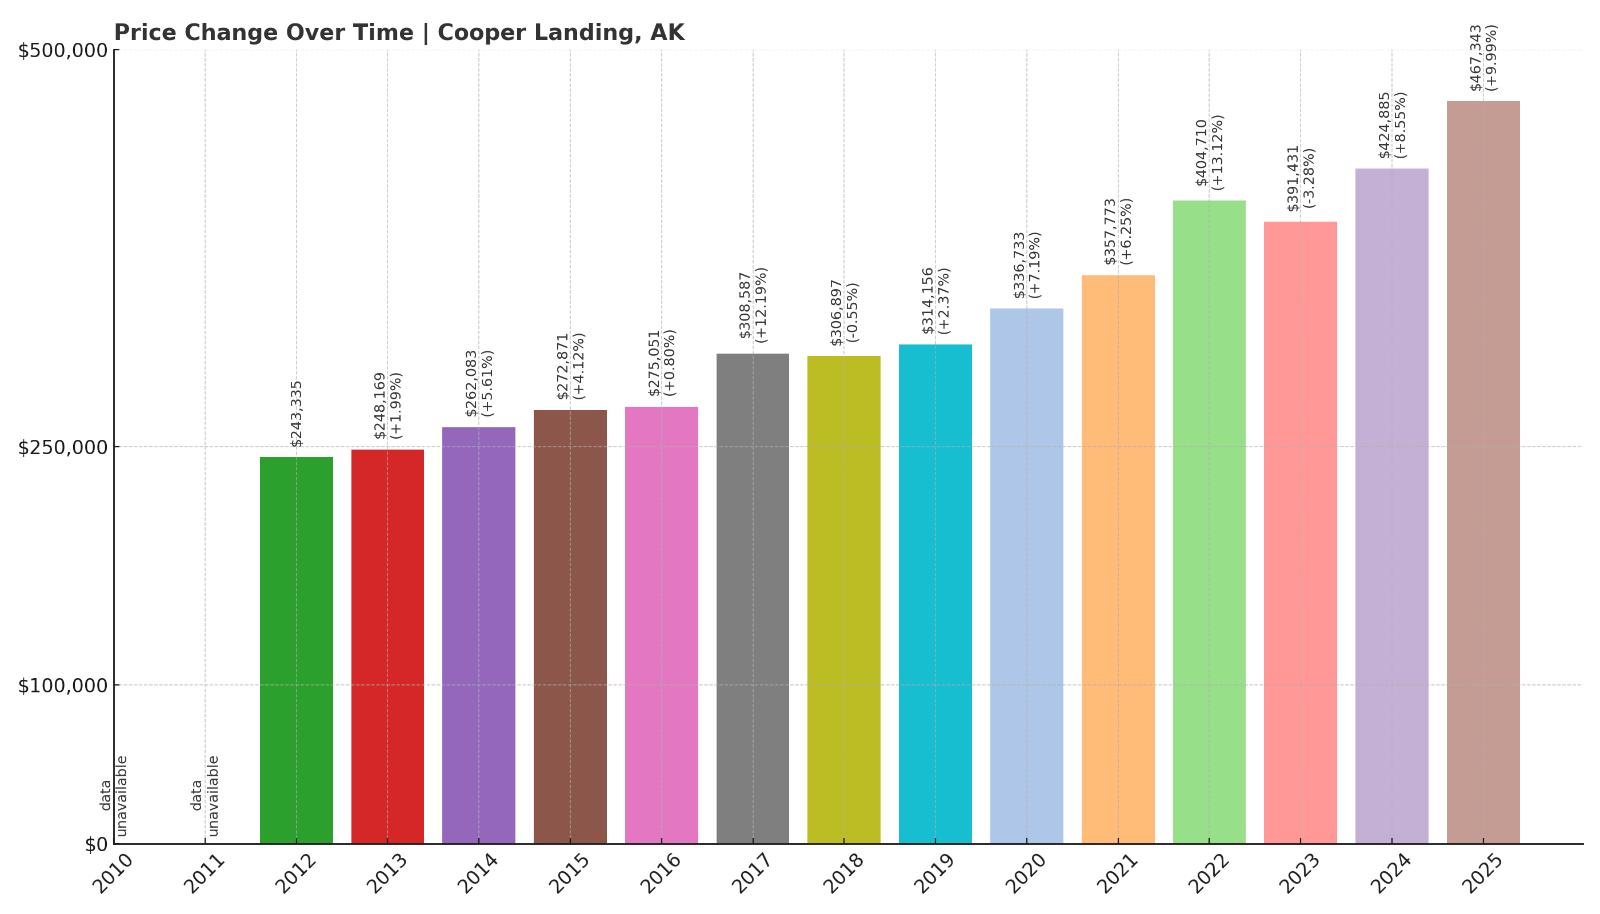
5. Cooper Landing – 92% Home Price Increase Since 2012
- 2010: N/A
- 2011: N/A
- 2012: $243,335
- 2013: $248,169 (+$4,834, +1.99% from previous year)
- 2014: $262,083 (+$13,914, +5.61% from previous year)
- 2015: $272,871 (+$10,787, +4.12% from previous year)
- 2016: $275,051 (+$2,180, +0.80% from previous year)
- 2017: $308,587 (+$33,536, +12.19% from previous year)
- 2018: $306,897 (-$1,690, -0.55% from previous year)
- 2019: $314,156 (+$7,260, +2.37% from previous year)
- 2020: $336,733 (+$22,577, +7.19% from previous year)
- 2021: $357,773 (+$21,040, +6.25% from previous year)
- 2022: $404,710 (+$46,937, +13.12% from previous year)
- 2023: $391,431 (-$13,278, -3.28% from previous year)
- 2024: $424,885 (+$33,454, +8.55% from previous year)
- 2025: $467,343 (+$42,457, +9.99% from previous year)
Cooper Landing home prices have surged 92% since 2012, with a huge jump in 2025 adding over $42,000. The town has consistently remained one of the most expensive rural communities in the state.
Cooper Landing – Scenic and In Demand

Cooper Landing is a small community nestled at the intersection of the Kenai and Russian rivers, famous for trout fishing and stunning alpine views. Its isolated charm and recreational opportunities have made it a top destination for both tourists and seasonal homeowners.
Inventory in Cooper Landing is extremely tight, and demand has only intensified in recent years. The nearly 10% gain in 2025 is a continuation of its long-term trajectory toward becoming one of Alaska’s priciest places to live.
4. Kachemak City – 72% Home Price Increase Since 2010
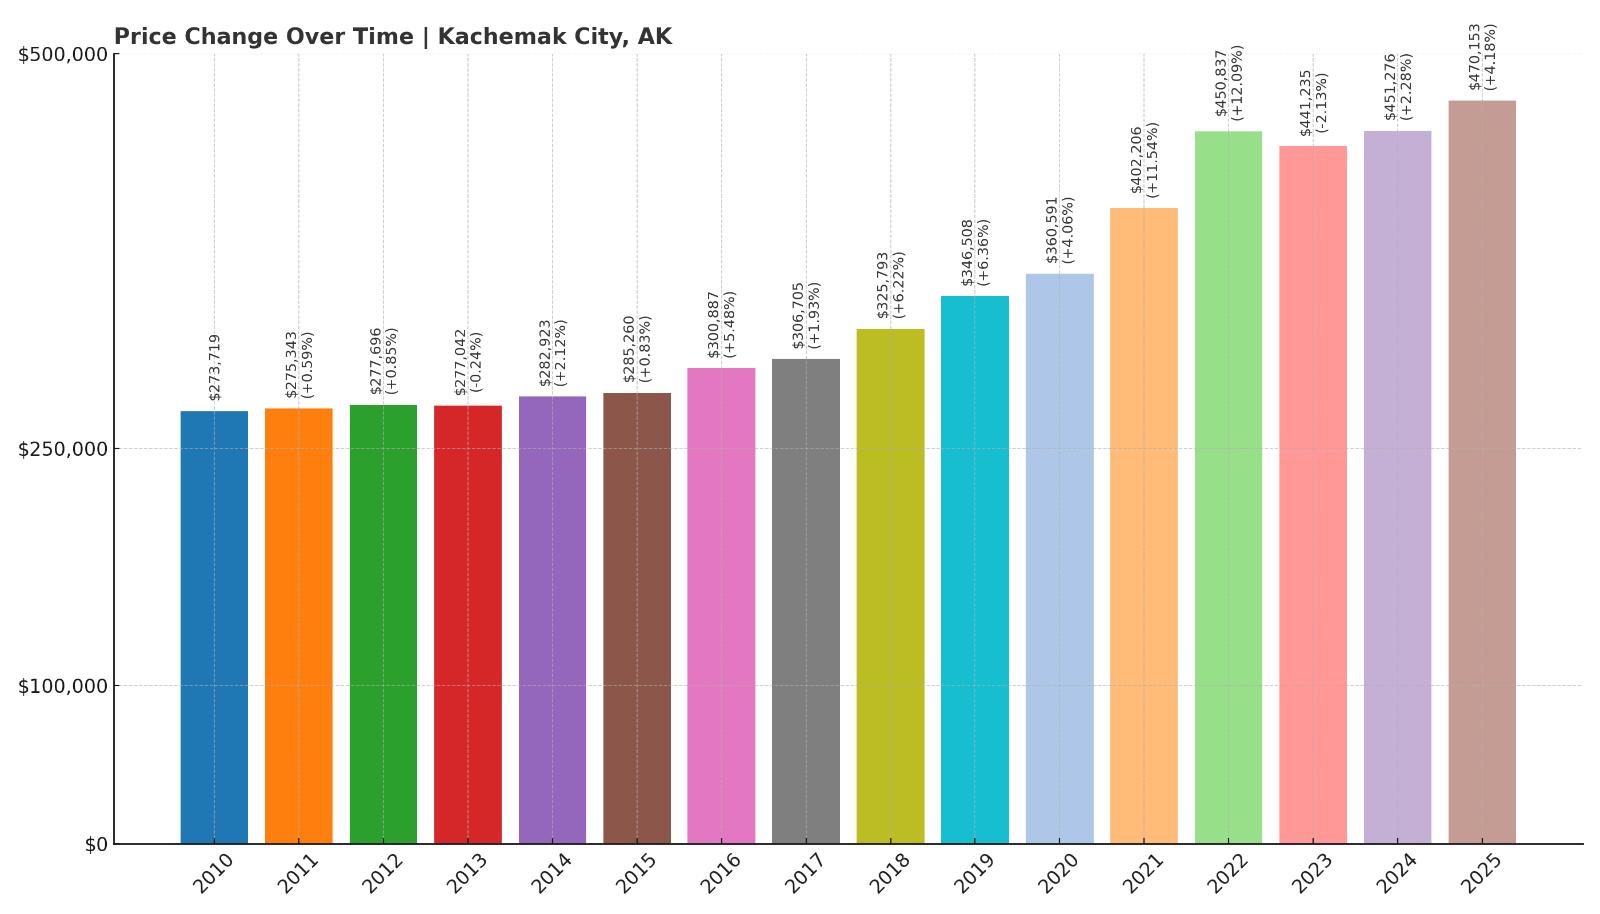
- 2010: $273,719
- 2011: $275,343 (+$1,623, +0.59% from previous year)
- 2012: $277,696 (+$2,354, +0.85% from previous year)
- 2013: $277,042 (-$655, -0.24% from previous year)
- 2014: $282,923 (+$5,881, +2.12% from previous year)
- 2015: $285,260 (+$2,337, +0.83% from previous year)
- 2016: $300,887 (+$15,627, +5.48% from previous year)
- 2017: $306,705 (+$5,818, +1.93% from previous year)
- 2018: $325,793 (+$19,088, +6.22% from previous year)
- 2019: $346,508 (+$20,714, +6.36% from previous year)
- 2020: $360,591 (+$14,084, +4.06% from previous year)
- 2021: $402,206 (+$41,615, +11.54% from previous year)
- 2022: $450,837 (+$48,630, +12.09% from previous year)
- 2023: $441,235 (-$9,602, -2.13% from previous year)
- 2024: $451,276 (+$10,041, +2.28% from previous year)
- 2025: $470,153 (+$18,877, +4.18% from previous year)
Kachemak City has posted a 72% increase in home values since 2010, climbing from the low $270,000s to over $470,000 in 2025. The strongest growth occurred from 2018 through 2022, with gains continuing into 2025 despite a minor dip in 2023.
Kachemak City – Small Footprint, Big Prices

Just northeast of Homer, Kachemak City is a tiny incorporated area with a population under 500. What it lacks in size, it makes up for in stunning views, proximity to Kachemak Bay, and access to the amenities of nearby Homer. That blend has helped drive up property values, especially among those looking for privacy and scenic waterfront lots.
With limited housing stock and essentially no room for large-scale development, prices have remained high. The 2025 uptick continues a decade-long trend that has placed this small city squarely in Alaska’s most expensive tier.
3. Juneau – 60% Home Price Increase Since 2010
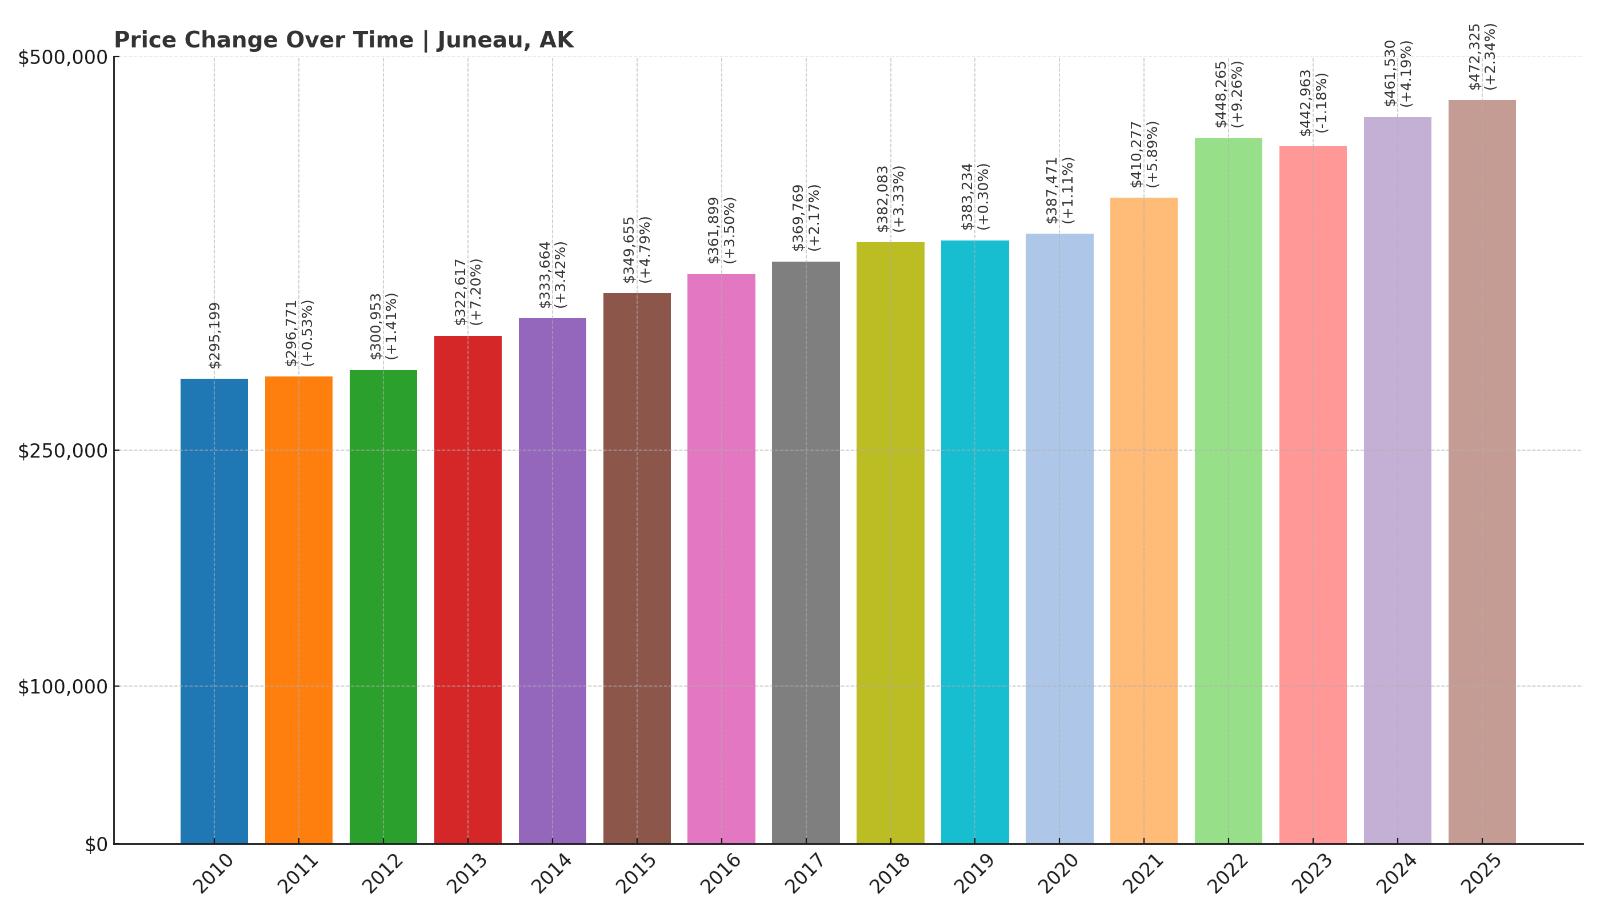
- 2010: $295,199
- 2011: $296,771 (+$1,571, +0.53% from previous year)
- 2012: $300,953 (+$4,182, +1.41% from previous year)
- 2013: $322,617 (+$21,664, +7.20% from previous year)
- 2014: $333,664 (+$11,047, +3.42% from previous year)
- 2015: $349,655 (+$15,991, +4.79% from previous year)
- 2016: $361,899 (+$12,244, +3.50% from previous year)
- 2017: $369,769 (+$7,870, +2.17% from previous year)
- 2018: $382,083 (+$12,314, +3.33% from previous year)
- 2019: $383,234 (+$1,152, +0.30% from previous year)
- 2020: $387,471 (+$4,237, +1.11% from previous year)
- 2021: $410,277 (+$22,806, +5.89% from previous year)
- 2022: $448,265 (+$37,988, +9.26% from previous year)
- 2023: $442,963 (-$5,302, -1.18% from previous year)
- 2024: $461,530 (+$18,566, +4.19% from previous year)
- 2025: $472,325 (+$10,795, +2.34% from previous year)
Juneau’s home prices have jumped 60% since 2010, with the median value hitting $472,325 in 2025. Growth has been largely consistent, with only minor corrections along the way.
Juneau – Alaska’s Capital, Consistent and Costly

As the capital city of Alaska, Juneau benefits from a stable government employment base and an unmatched setting between mountains and sea. Its geographic isolation—reachable only by air or water—has kept inventory tight and land development limited.
Juneau’s housing market tends to avoid the wild swings seen in smaller communities. With a strong local economy and limited space for expansion, prices are likely to remain high for the foreseeable future.
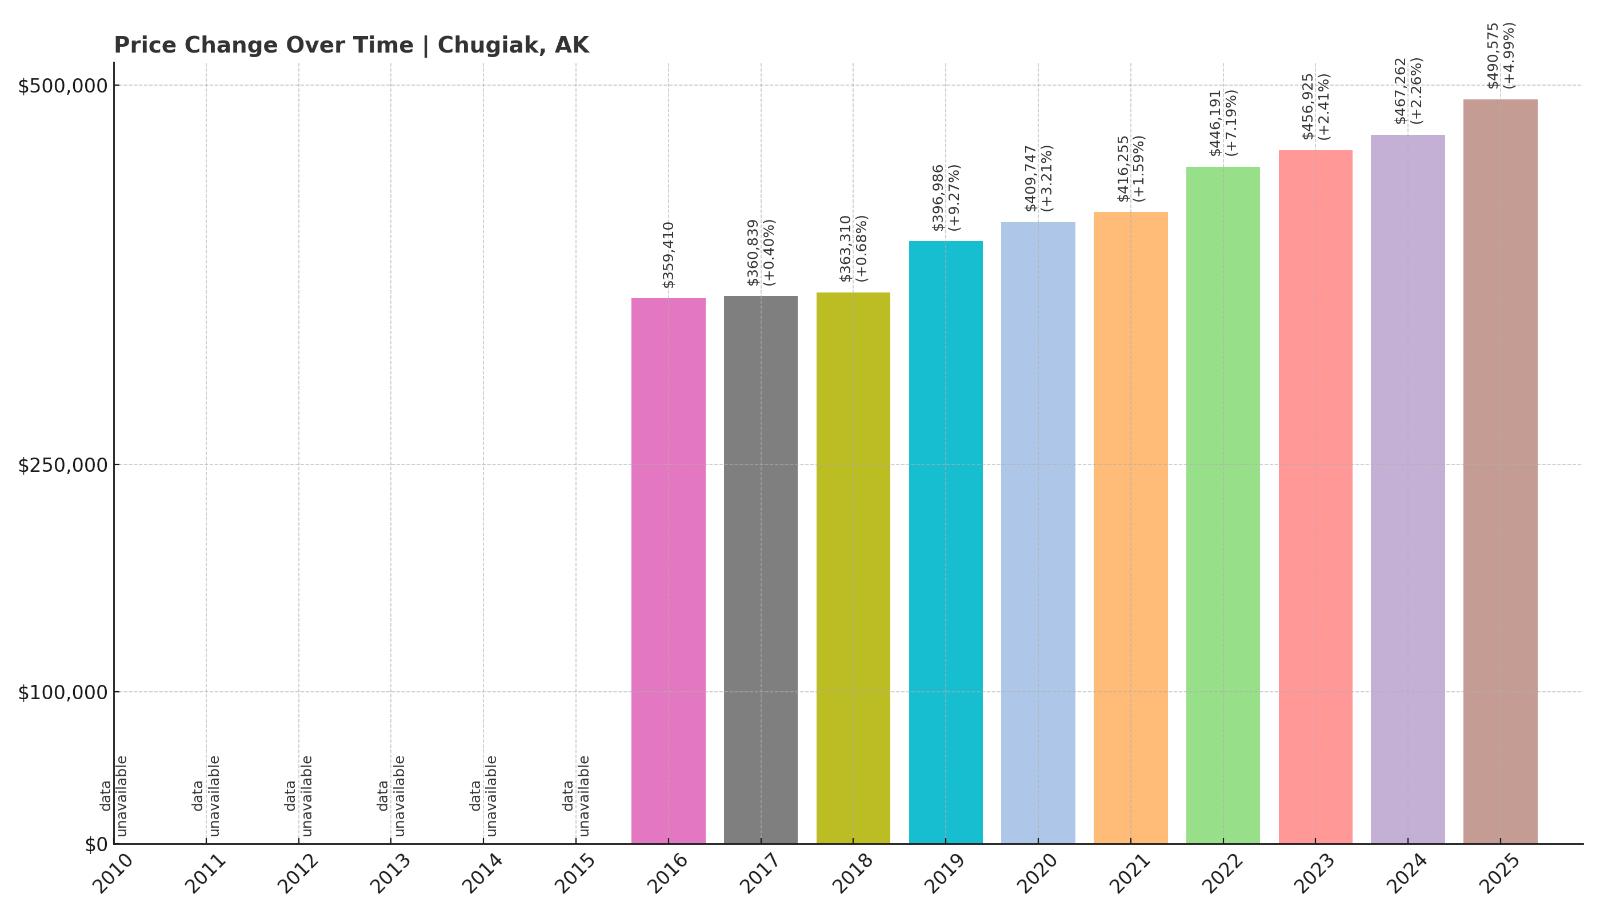
2. Chugiak – 36% Home Price Increase Since 2016
- 2010: N/A
- 2011: N/A
- 2012: N/A
- 2013: N/A
- 2014: N/A
- 2015: N/A
- 2016: $359,410
- 2017: $360,839 (+$1,428, +0.40% from previous year)
- 2018: $363,310 (+$2,471, +0.68% from previous year)
- 2019: $396,986 (+$33,676, +9.27% from previous year)
- 2020: $409,747 (+$12,761, +3.21% from previous year)
- 2021: $416,255 (+$6,508, +1.59% from previous year)
- 2022: $446,191 (+$29,936, +7.19% from previous year)
- 2023: $456,925 (+$10,734, +2.41% from previous year)
- 2024: $467,262 (+$10,337, +2.26% from previous year)
- 2025: $490,575 (+$23,313, +4.99% from previous year)
Chugiak home prices have grown 36% since 2016, and the latest jump in 2025 pushed values just over $490,000. It’s now the second most expensive town in Alaska.
Chugiak – Anchorage Suburb with a Country Feel

Located along the Glenn Highway north of Anchorage, Chugiak offers a quieter, semi-rural lifestyle within easy driving distance of the city. That mix of convenience and seclusion has made it increasingly popular with homebuyers looking for more space without giving up access to jobs and services.
Chugiak’s growth has accelerated since 2019, and the 2025 gain of over $23,000 is one of the largest in the state. With continued demand and limited land for new homes, its prices remain among the highest in Alaska.
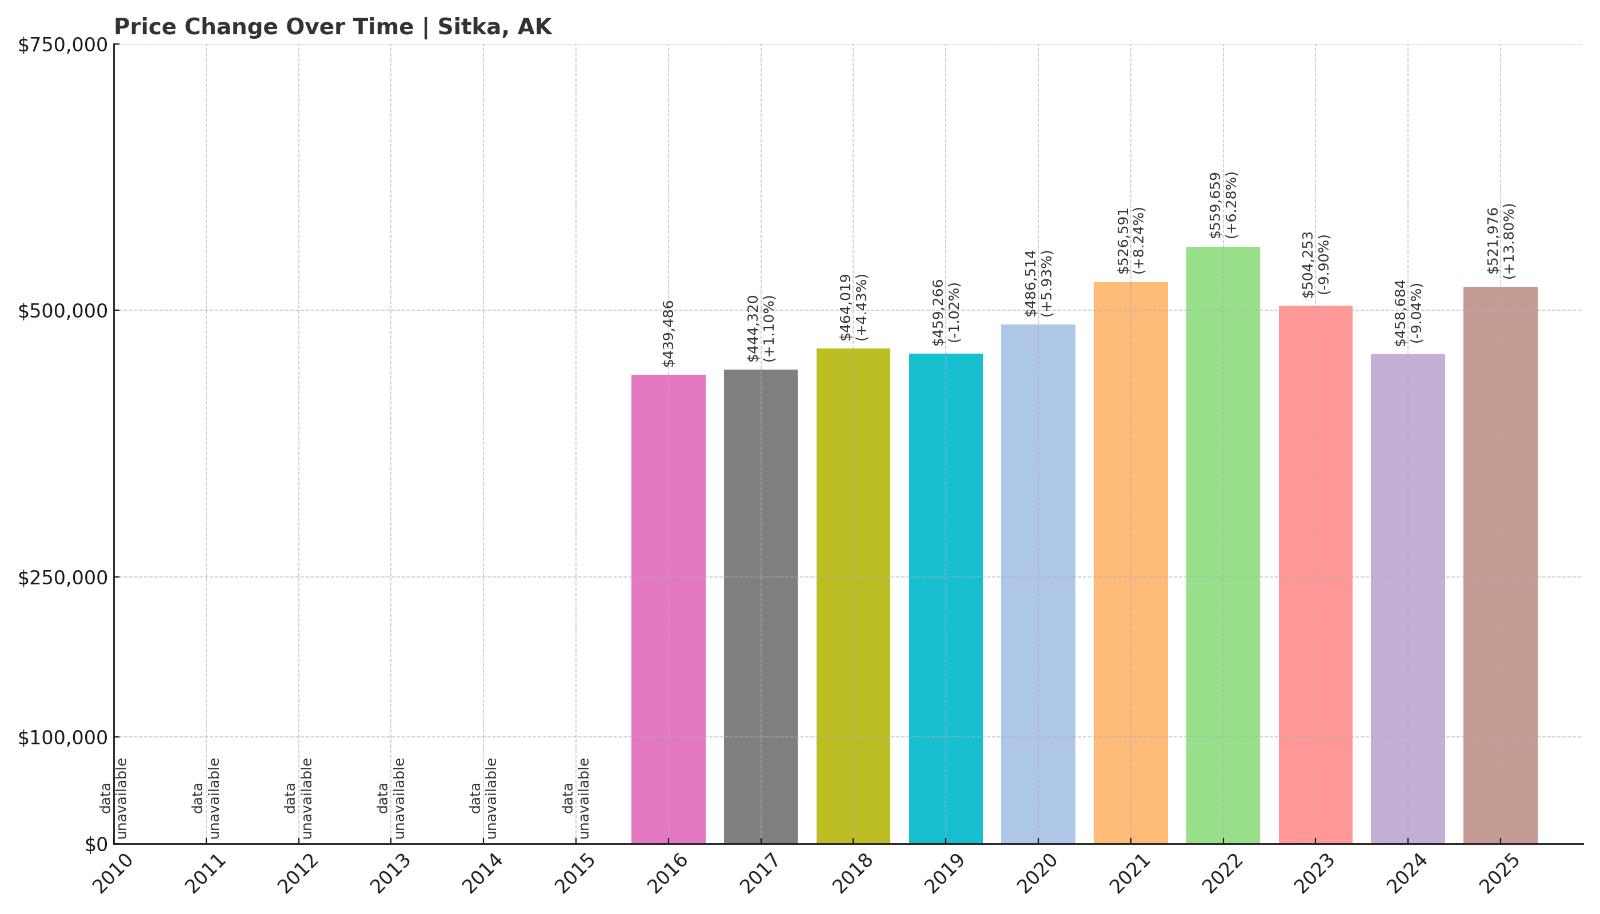
1. Sitka – 19% Home Price Increase Since 2016
- 2010: N/A
- 2011: N/A
- 2012: N/A
- 2013: N/A
- 2014: N/A
- 2015: N/A
- 2016: $439,486
- 2017: $444,320 (+$4,834, +1.10% from previous year)
- 2018: $464,019 (+$19,699, +4.43% from previous year)
- 2019: $459,266 (-$4,753, -1.02% from previous year)
- 2020: $486,514 (+$27,248, +5.93% from previous year)
- 2021: $526,591 (+$40,078, +8.24% from previous year)
- 2022: $559,659 (+$33,068, +6.28% from previous year)
- 2023: $504,253 (-$55,406, -9.90% from previous year)
- 2024: $458,684 (-$45,569, -9.04% from previous year)
- 2025: $521,976 (+$63,292, +13.80% from previous year)
Sitka tops the list with a median home value of $521,976 in 2025. While it experienced major drops in 2023 and 2024, the 13.8% gain this year brought prices roaring back to the top spot. Since 2016, Sitka has seen a 19% overall increase in value.
Sitka – A Pricey Return to the Peak

Spread across a group of islands in Southeast Alaska, Sitka combines history, scenery, and isolation. Once the capital of Russian America, today it’s known for its fishing fleet, wildlife, and arts scene. The town’s unique geography means homes are limited and land is at a premium.
Even after two sharp downturns, Sitka rebounded dramatically in 2025—adding over $63,000 in value. That recovery solidified its place at the top of the state’s real estate rankings, with prices well above the rest of Alaska.


