🔥 Would you like to save this?
Zillow’s Home Value Index shows home prices are still marching upward across Rhode Island—but there are still pockets where buying a house won’t drain your soul or your savings. These 15 towns have managed to stay (relatively) sane, even in 2025. You’ll find former mill villages with fixer-upper potential, sleepy suburbs with solid schools, and coastal corners that haven’t been fully discovered—yet. They’re not the flashiest zip codes, but that’s kind of the point. If you’re looking for a place with character, possibility, and a price tag that doesn’t feel like a prank, start here.
15. Hopkinton – 105% Home Price Increase Since 2012
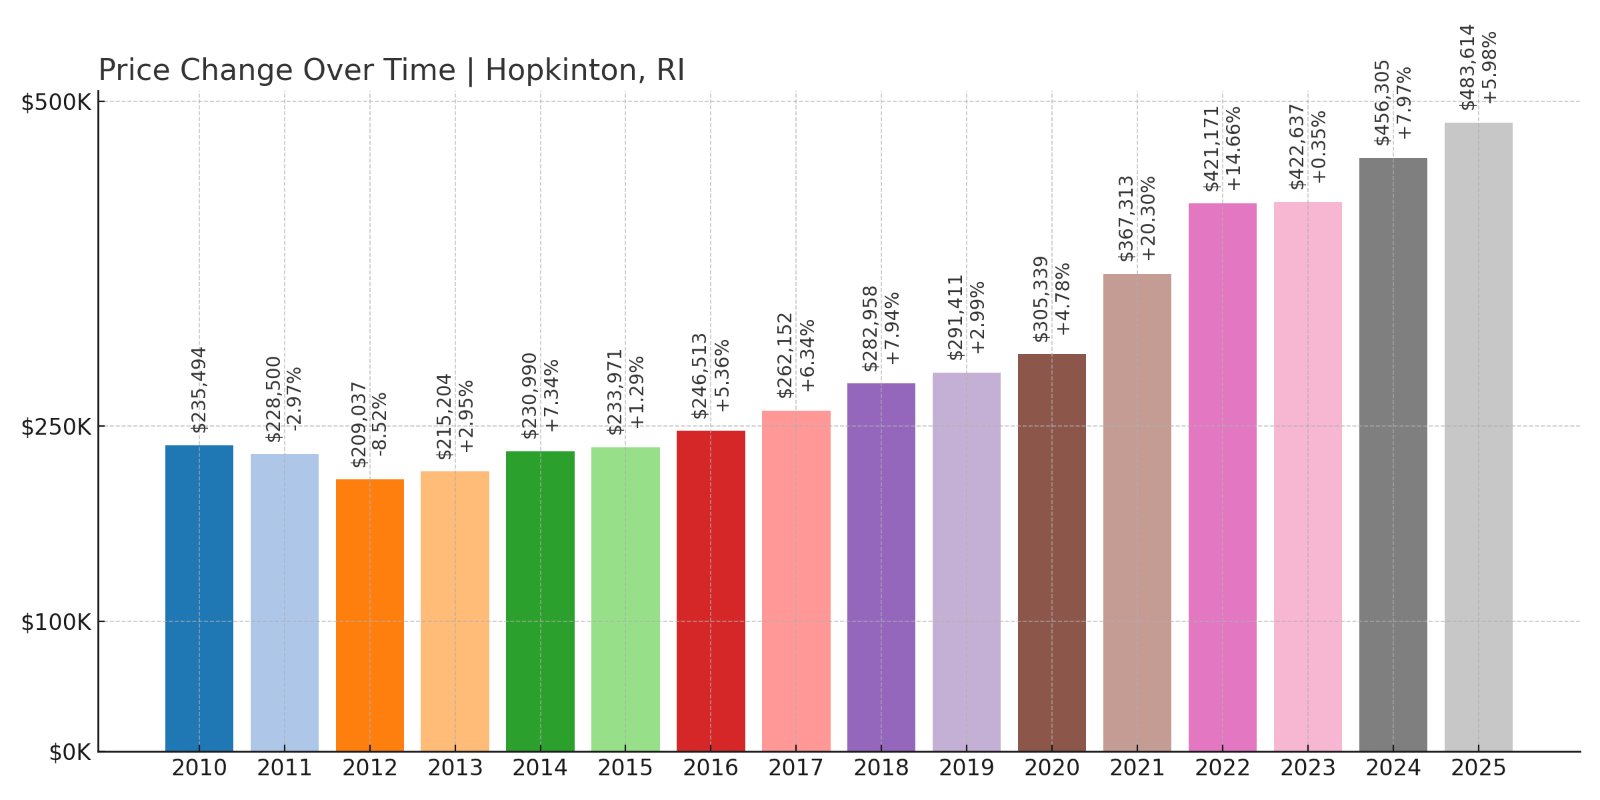
- 2010: $235,494
- 2011: $228,500 (-$6,994, -2.97% from previous year)
- 2012: $209,037 (-$19,463, -8.52% from previous year)
- 2013: $215,204 (+$6,167, +2.95% from previous year)
- 2014: $230,990 (+$15,786, +7.34% from previous year)
- 2015: $233,971 (+$2,981, +1.29% from previous year)
- 2016: $246,513 (+$12,543, +5.36% from previous year)
- 2017: $262,152 (+$15,639, +6.34% from previous year)
- 2018: $282,958 (+$20,806, +7.94% from previous year)
- 2019: $291,411 (+$8,453, +2.99% from previous year)
- 2020: $305,339 (+$13,927, +4.78% from previous year)
- 2021: $367,313 (+$61,974, +20.30% from previous year)
- 2022: $421,171 (+$53,858, +14.66% from previous year)
- 2023: $422,637 (+$1,466, +0.35% from previous year)
- 2024: $456,305 (+$33,668, +7.97% from previous year)
- 2025: $483,614 (+$27,309, +5.98% from previous year)
Hopkinton’s home values have more than doubled since 2012, a strong indication of long-term growth. While the town saw a dip during the early 2010s, prices recovered steadily and saw a particularly sharp jump in 2021. Despite that acceleration, Hopkinton still offers relatively affordable prices by Rhode Island standards.
In order to come up with the very specific design ideas, we create most designs with the assistance of state-of-the-art AI interior design software.
Hopkinton – Small Town Growth with Scenic Appeal
Located in the southwestern corner of Rhode Island near the Connecticut border, Hopkinton is known for its rural charm and close-knit community. It’s home to miles of forest, conservation land, and access to the Pawcatuck River, making it attractive to outdoor enthusiasts. Despite its tranquil setting, the town has shown steady home price growth, especially since 2020, with values rising nearly 6% in the last year alone.
Hopkinton remains one of the more budget-friendly options in the state, with its 2025 median home price at $483,614—well below the statewide average. Its appeal lies in offering a peaceful lifestyle with practical commuting options via nearby I-95, making it a strategic choice for remote workers or those employed in nearby cities like Westerly or Norwich.
14. Burrillville – 93% Home Price Increase Since 2012
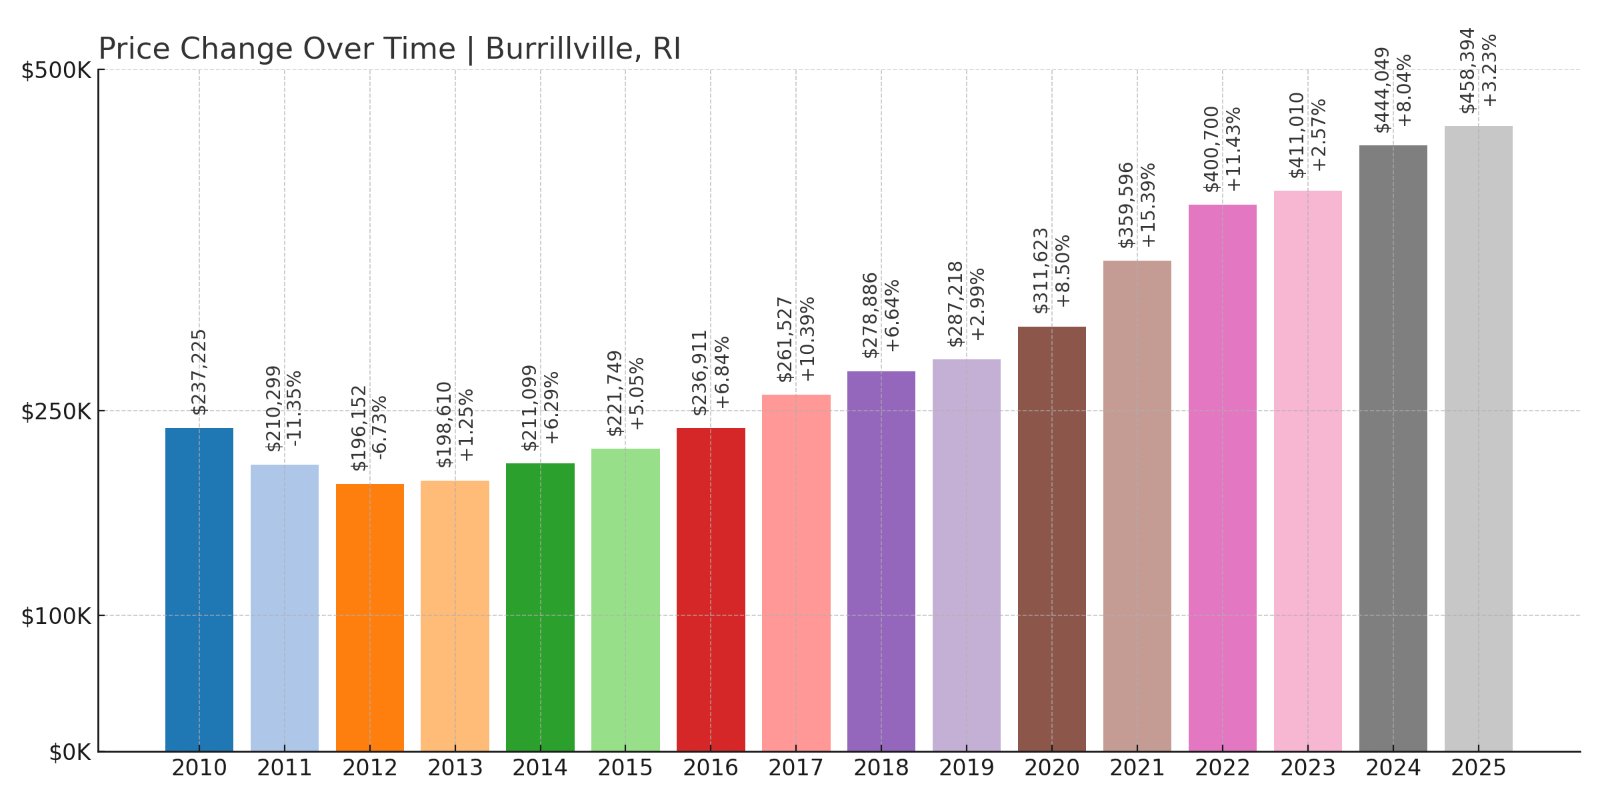
- 2010: $237,225
- 2011: $210,299 (-$26,926, -11.35% from previous year)
- 2012: $196,152 (-$14,147, -6.73% from previous year)
- 2013: $198,610 (+$2,458, +1.25% from previous year)
- 2014: $211,099 (+$12,488, +6.29% from previous year)
- 2015: $221,749 (+$10,650, +5.05% from previous year)
- 2016: $236,911 (+$15,162, +6.84% from previous year)
- 2017: $261,527 (+$24,615, +10.39% from previous year)
- 2018: $278,886 (+$17,359, +6.64% from previous year)
- 2019: $287,218 (+$8,333, +2.99% from previous year)
- 2020: $311,623 (+$24,405, +8.50% from previous year)
- 2021: $359,596 (+$47,972, +15.39% from previous year)
- 2022: $400,700 (+$41,105, +11.43% from previous year)
- 2023: $411,010 (+$10,310, +2.57% from previous year)
- 2024: $444,049 (+$33,039, +8.04% from previous year)
- 2025: $458,394 (+$14,345, +3.23% from previous year)
Burrillville home prices have nearly doubled since 2012, driven by steady gains and strong momentum in the years following the pandemic. While the pace has cooled slightly since 2022, the town remains a popular option for buyers looking for space and affordability in northwestern Rhode Island.
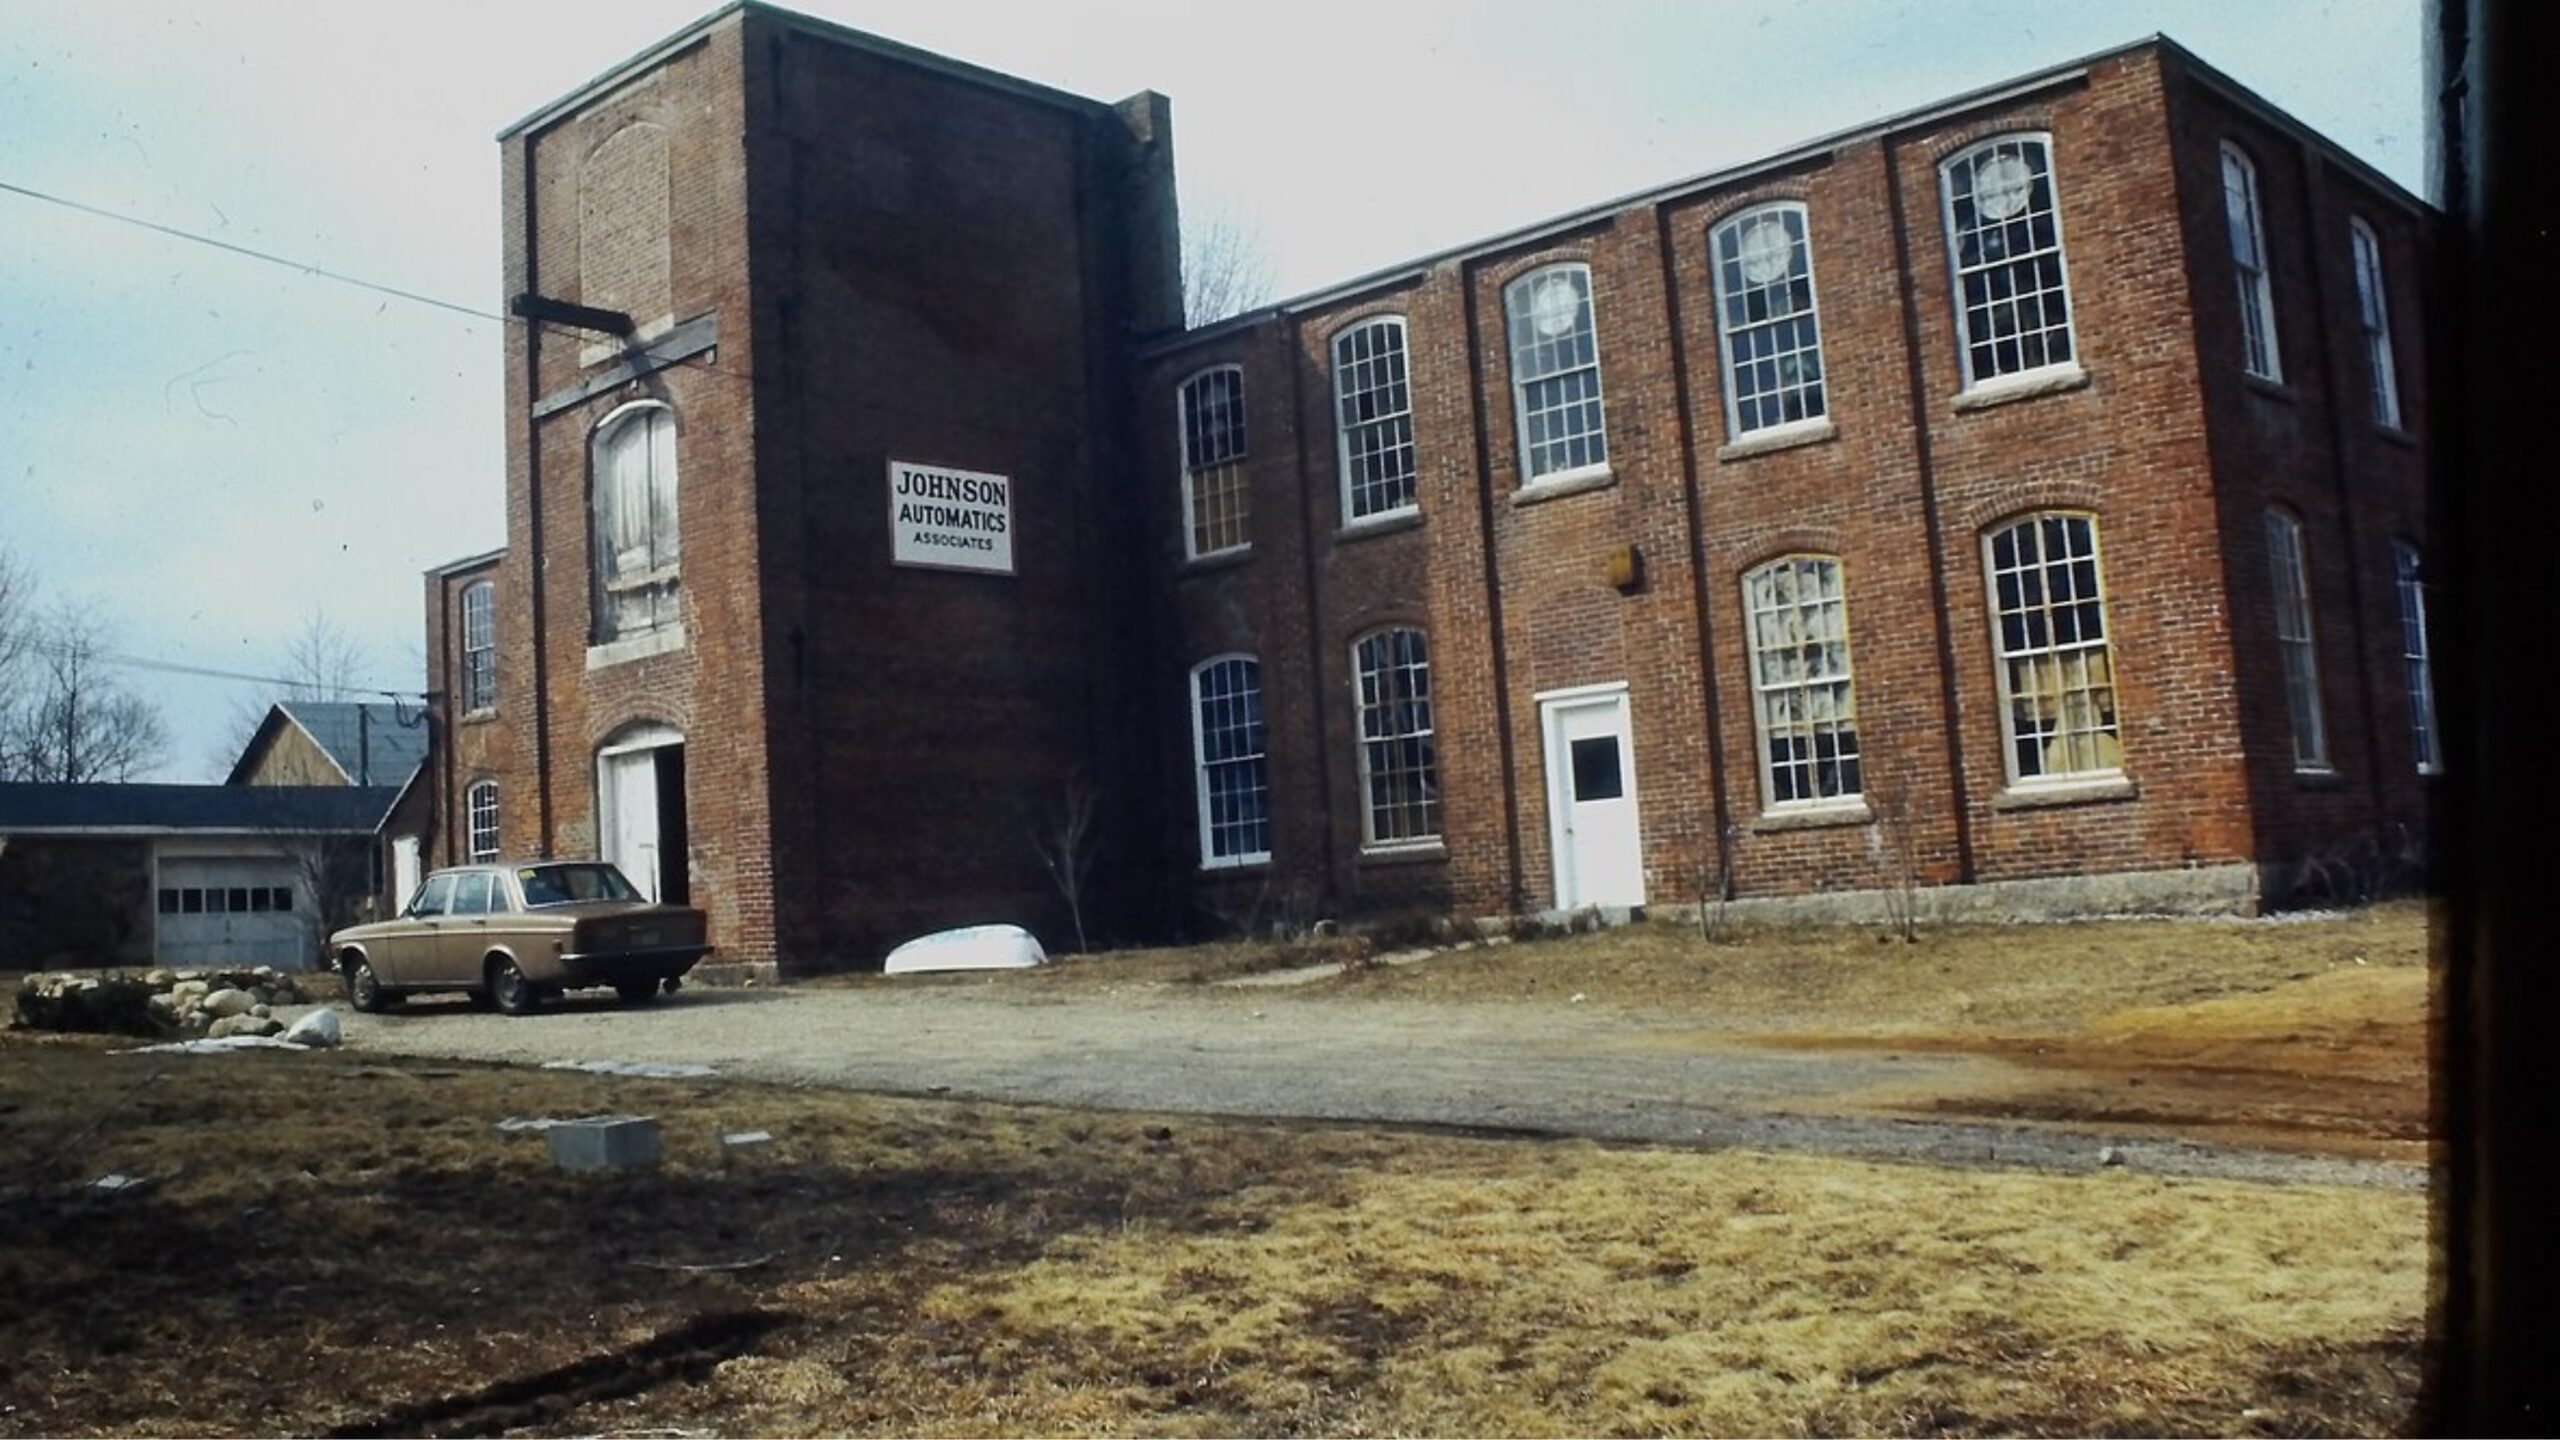
Burrillville – Forested Retreats and Family Living

Positioned near the Massachusetts border, Burrillville blends suburban comforts with scenic backdrops. The town includes several villages like Pascoag and Harrisville, each with their own character and amenities. This area appeals to families who prefer quieter settings without being too far from Providence or Worcester.
With a 2025 median home value of $458,394, Burrillville stands out for offering more house for the dollar than many neighboring towns. The availability of historic homes, newer developments, and ample green space makes it a well-rounded and appealing location, particularly for those priced out of the Providence metro area.
13. Coventry – 125% Home Price Increase Since 2012
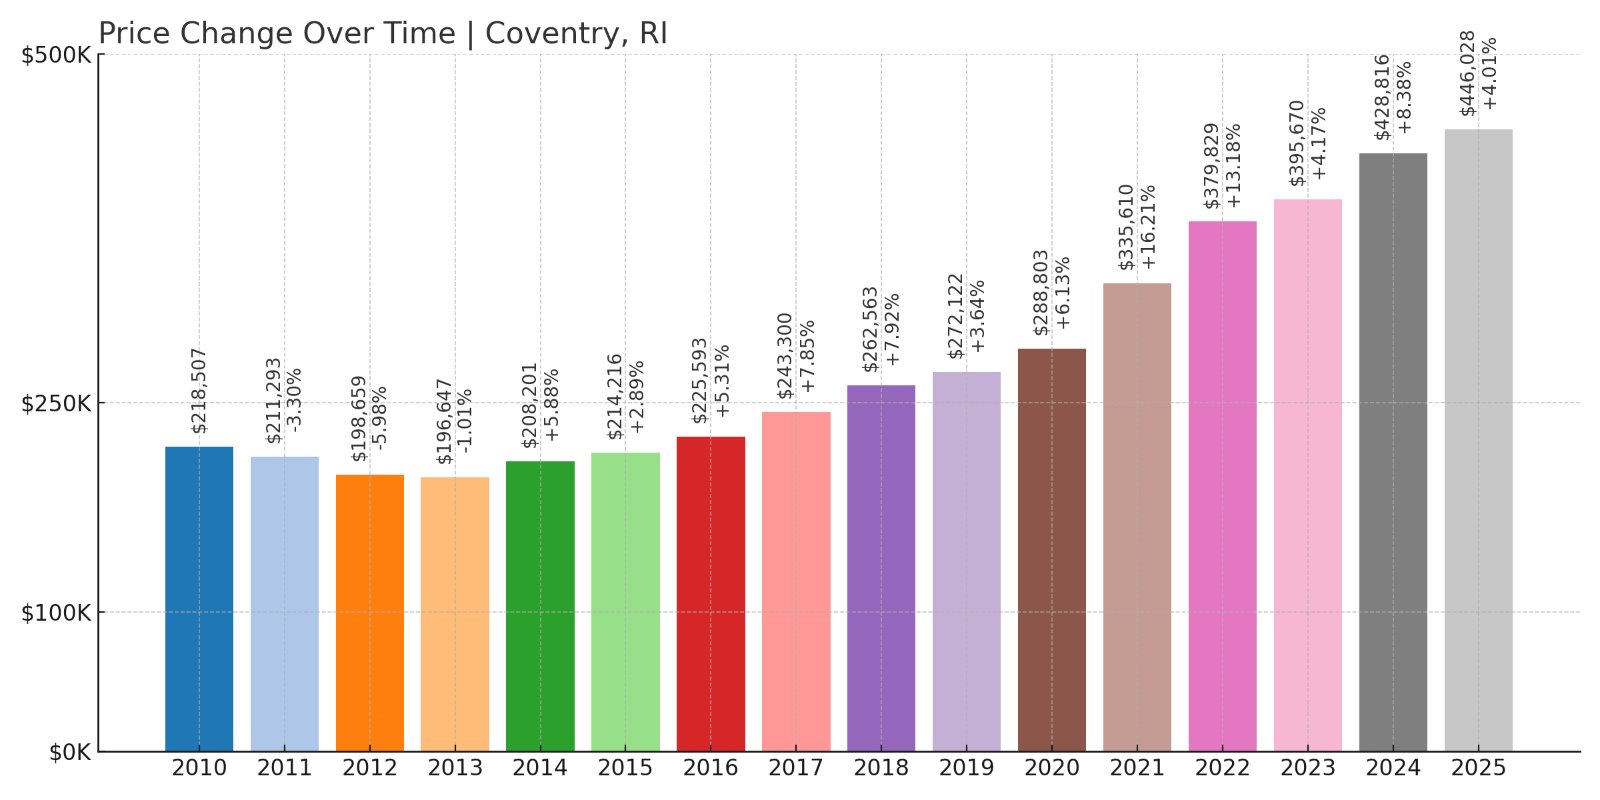
- 2010: $218,507
- 2011: $211,293 (-$7,214, -3.30% from previous year)
- 2012: $198,659 (-$12,634, -5.98% from previous year)
- 2013: $196,647 (-$2,012, -1.01% from previous year)
- 2014: $208,201 (+$11,554, +5.88% from previous year)
- 2015: $214,216 (+$6,015, +2.89% from previous year)
- 2016: $225,593 (+$11,377, +5.31% from previous year)
- 2017: $243,300 (+$17,707, +7.85% from previous year)
- 2018: $262,563 (+$19,263, +7.92% from previous year)
- 2019: $272,122 (+$9,560, +3.64% from previous year)
- 2020: $288,803 (+$16,681, +6.13% from previous year)
- 2021: $335,610 (+$46,806, +16.21% from previous year)
- 2022: $379,829 (+$44,219, +13.18% from previous year)
- 2023: $395,670 (+$15,842, +4.17% from previous year)
- 2024: $428,816 (+$33,146, +8.38% from previous year)
- 2025: $446,028 (+$17,212, +4.01% from previous year)
Coventry’s home prices have risen significantly since 2012, with some of the most dramatic increases occurring in the post-2020 era. Despite the surge, the town remains one of the more affordable places in central Rhode Island, providing a mix of accessibility and value.
Coventry – Value Living in the Heart of Rhode Island
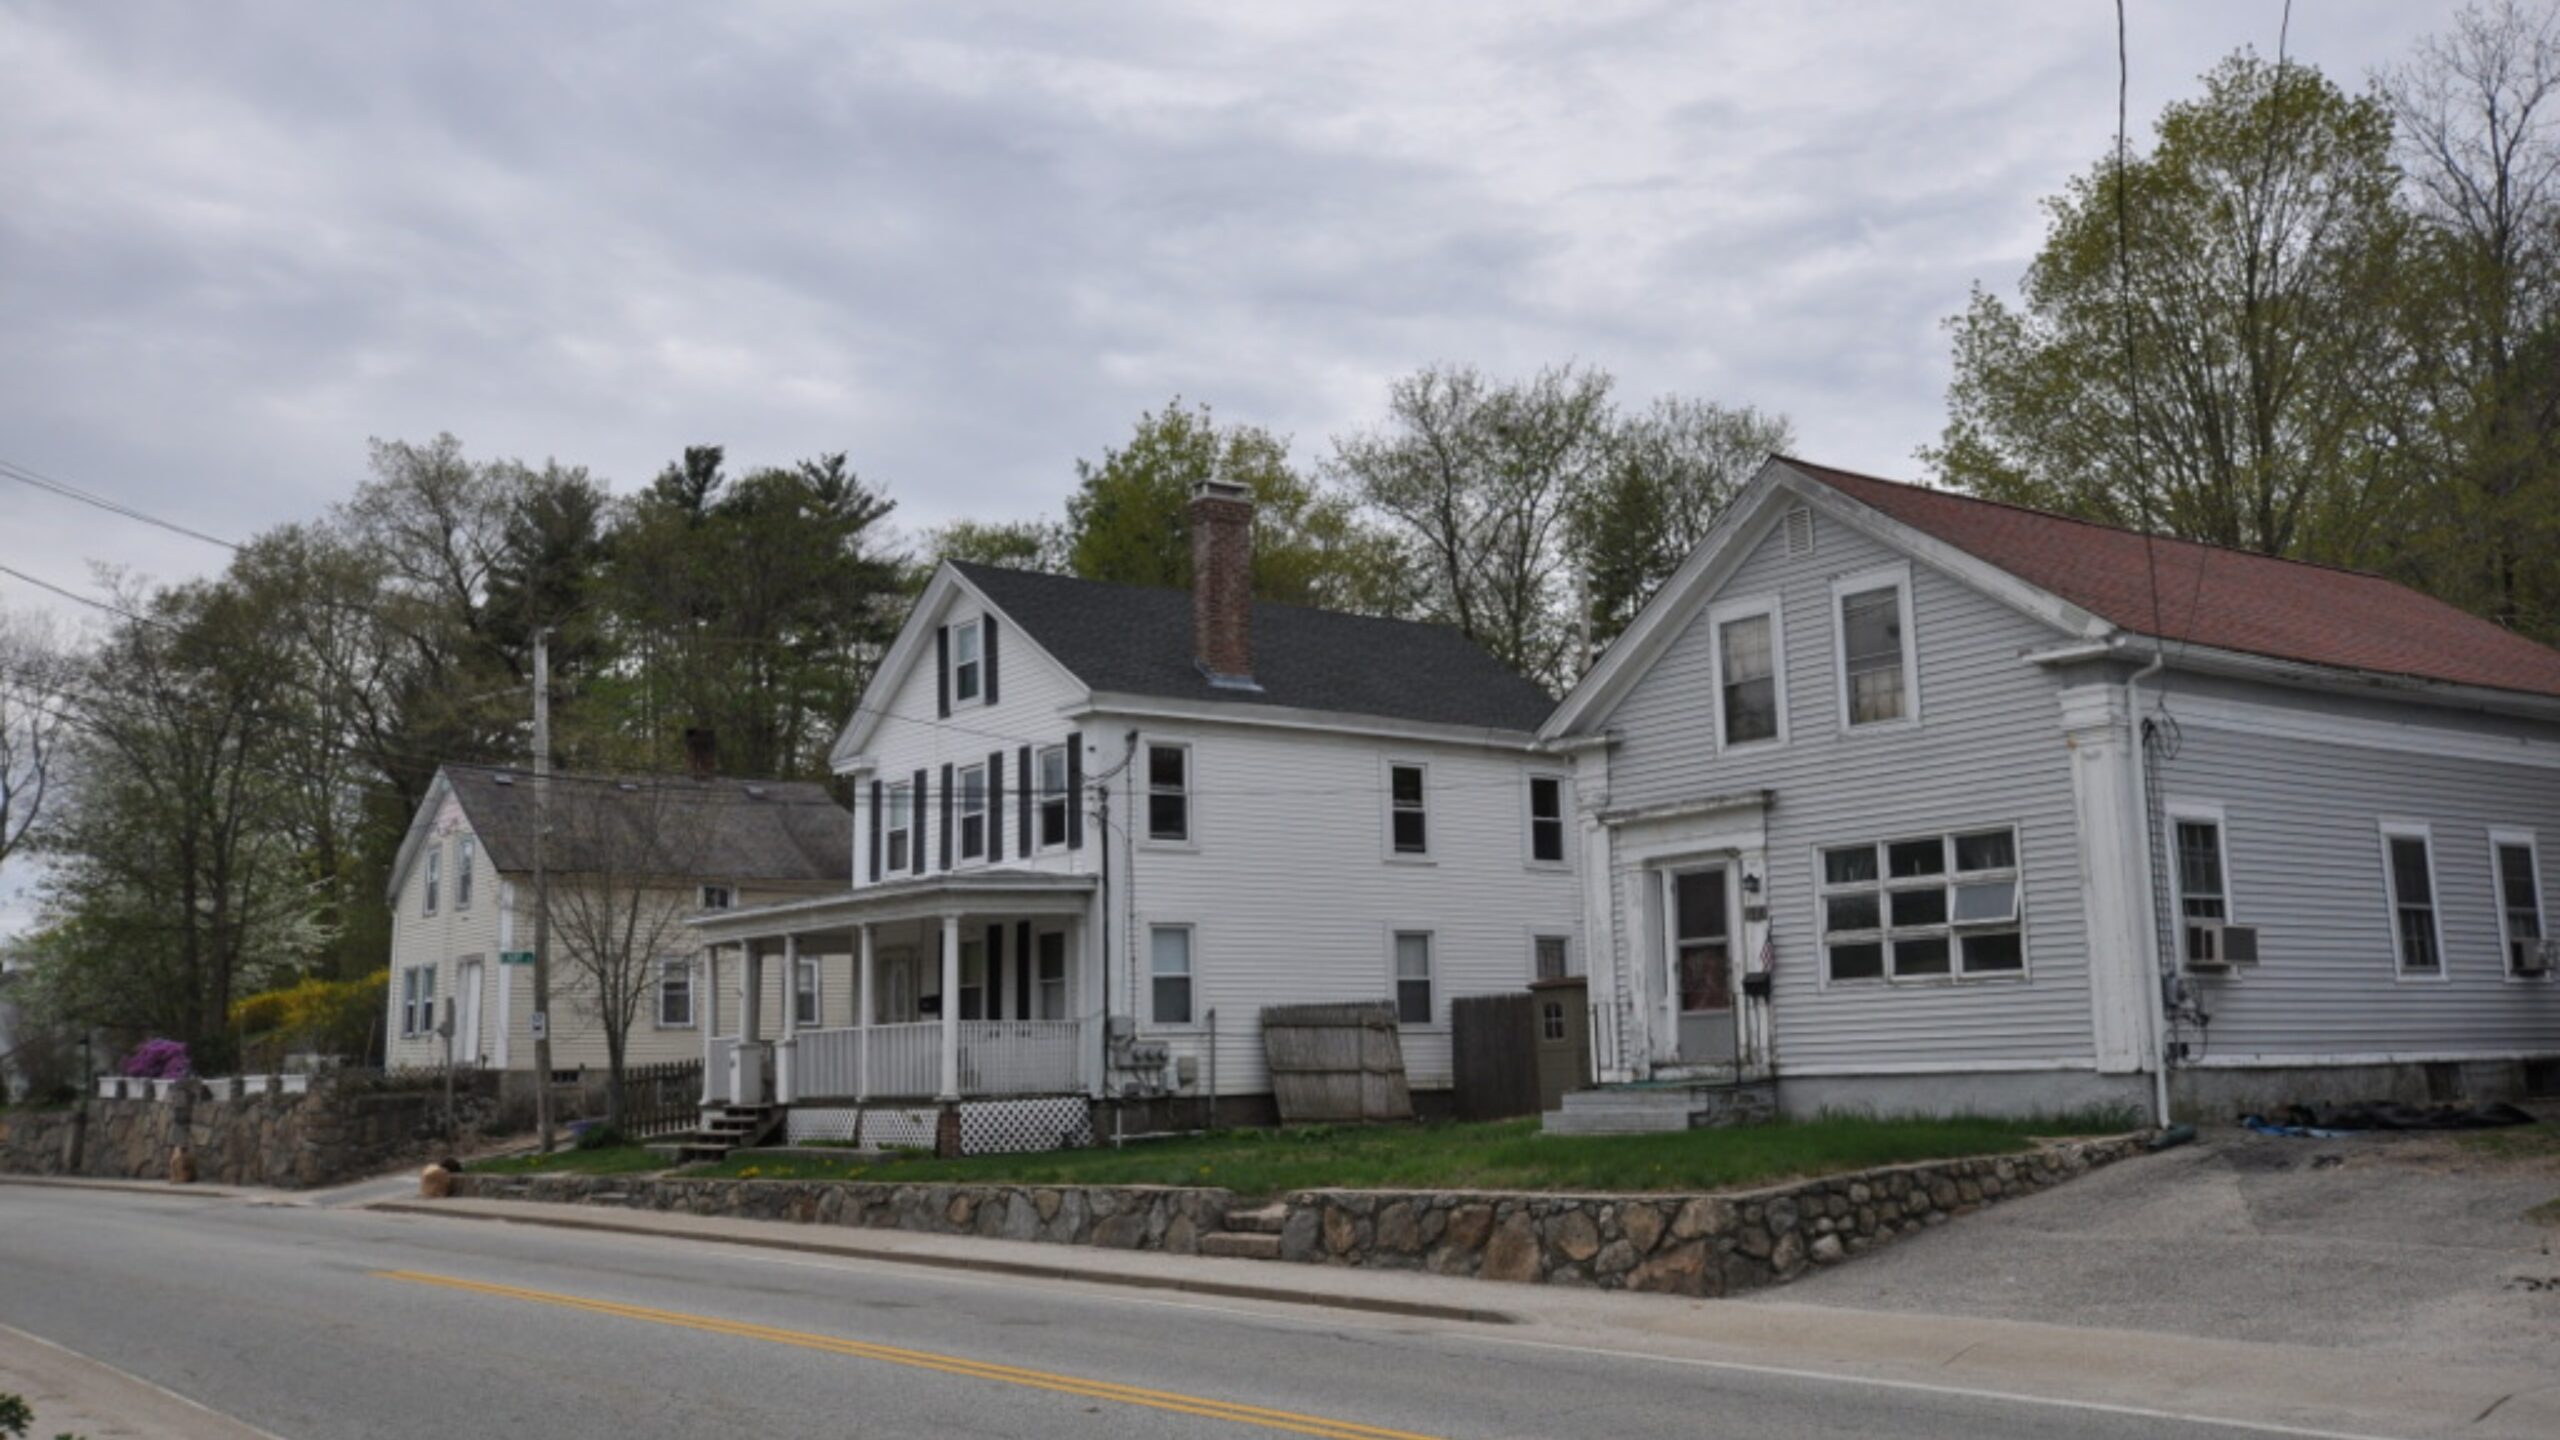
Coventry is the largest town in Rhode Island by land area and offers a variety of neighborhoods, from rural stretches to suburban developments. Its central location makes it convenient for commuters working in Providence or Warwick. Key amenities include Tiogue Lake, walking trails, and family-friendly parks.
With a 2025 home value of $446,028, Coventry is a standout for those looking for steady appreciation without paying Providence prices. A diverse housing stock and balanced market conditions have made it a consistent choice for homebuyers over the last decade.
12. Johnston – 159% Home Price Increase Since 2012
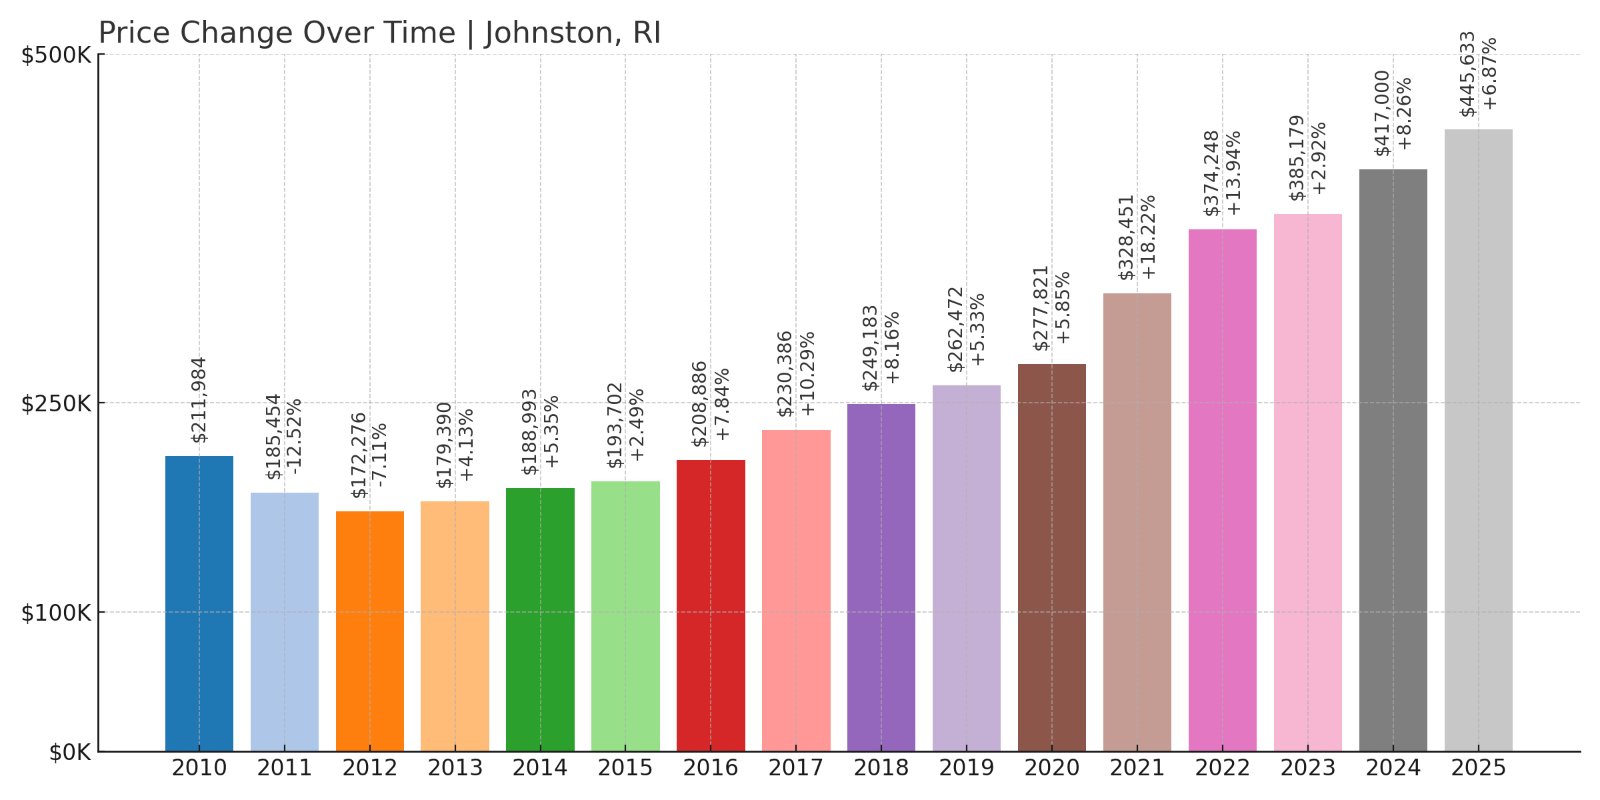
- 2010: $211,984
- 2011: $185,454 (-$26,529, -12.51% from previous year)
- 2012: $172,276 (-$13,178, -7.11% from previous year)
- 2013: $179,390 (+$7,114, +4.13% from previous year)
- 2014: $188,993 (+$9,603, +5.35% from previous year)
- 2015: $193,702 (+$4,709, +2.49% from previous year)
- 2016: $208,886 (+$15,184, +7.84% from previous year)
- 2017: $230,386 (+$21,500, +10.29% from previous year)
- 2018: $249,183 (+$18,797, +8.16% from previous year)
- 2019: $262,472 (+$13,289, +5.33% from previous year)
- 2020: $277,821 (+$15,348, +5.85% from previous year)
- 2021: $328,451 (+$50,631, +18.22% from previous year)
- 2022: $374,248 (+$45,797, +13.94% from previous year)
- 2023: $385,179 (+$10,931, +2.92% from previous year)
- 2024: $417,000 (+$31,822, +8.26% from previous year)
- 2025: $445,633 (+$28,632, +6.87% from previous year)
Johnston’s home prices have climbed quickly since the early 2010s, fueled by its convenient location and modest starting prices. The growth accelerated after 2020, with gains continuing into 2025, yet homes remain relatively affordable compared to nearby urban centers.
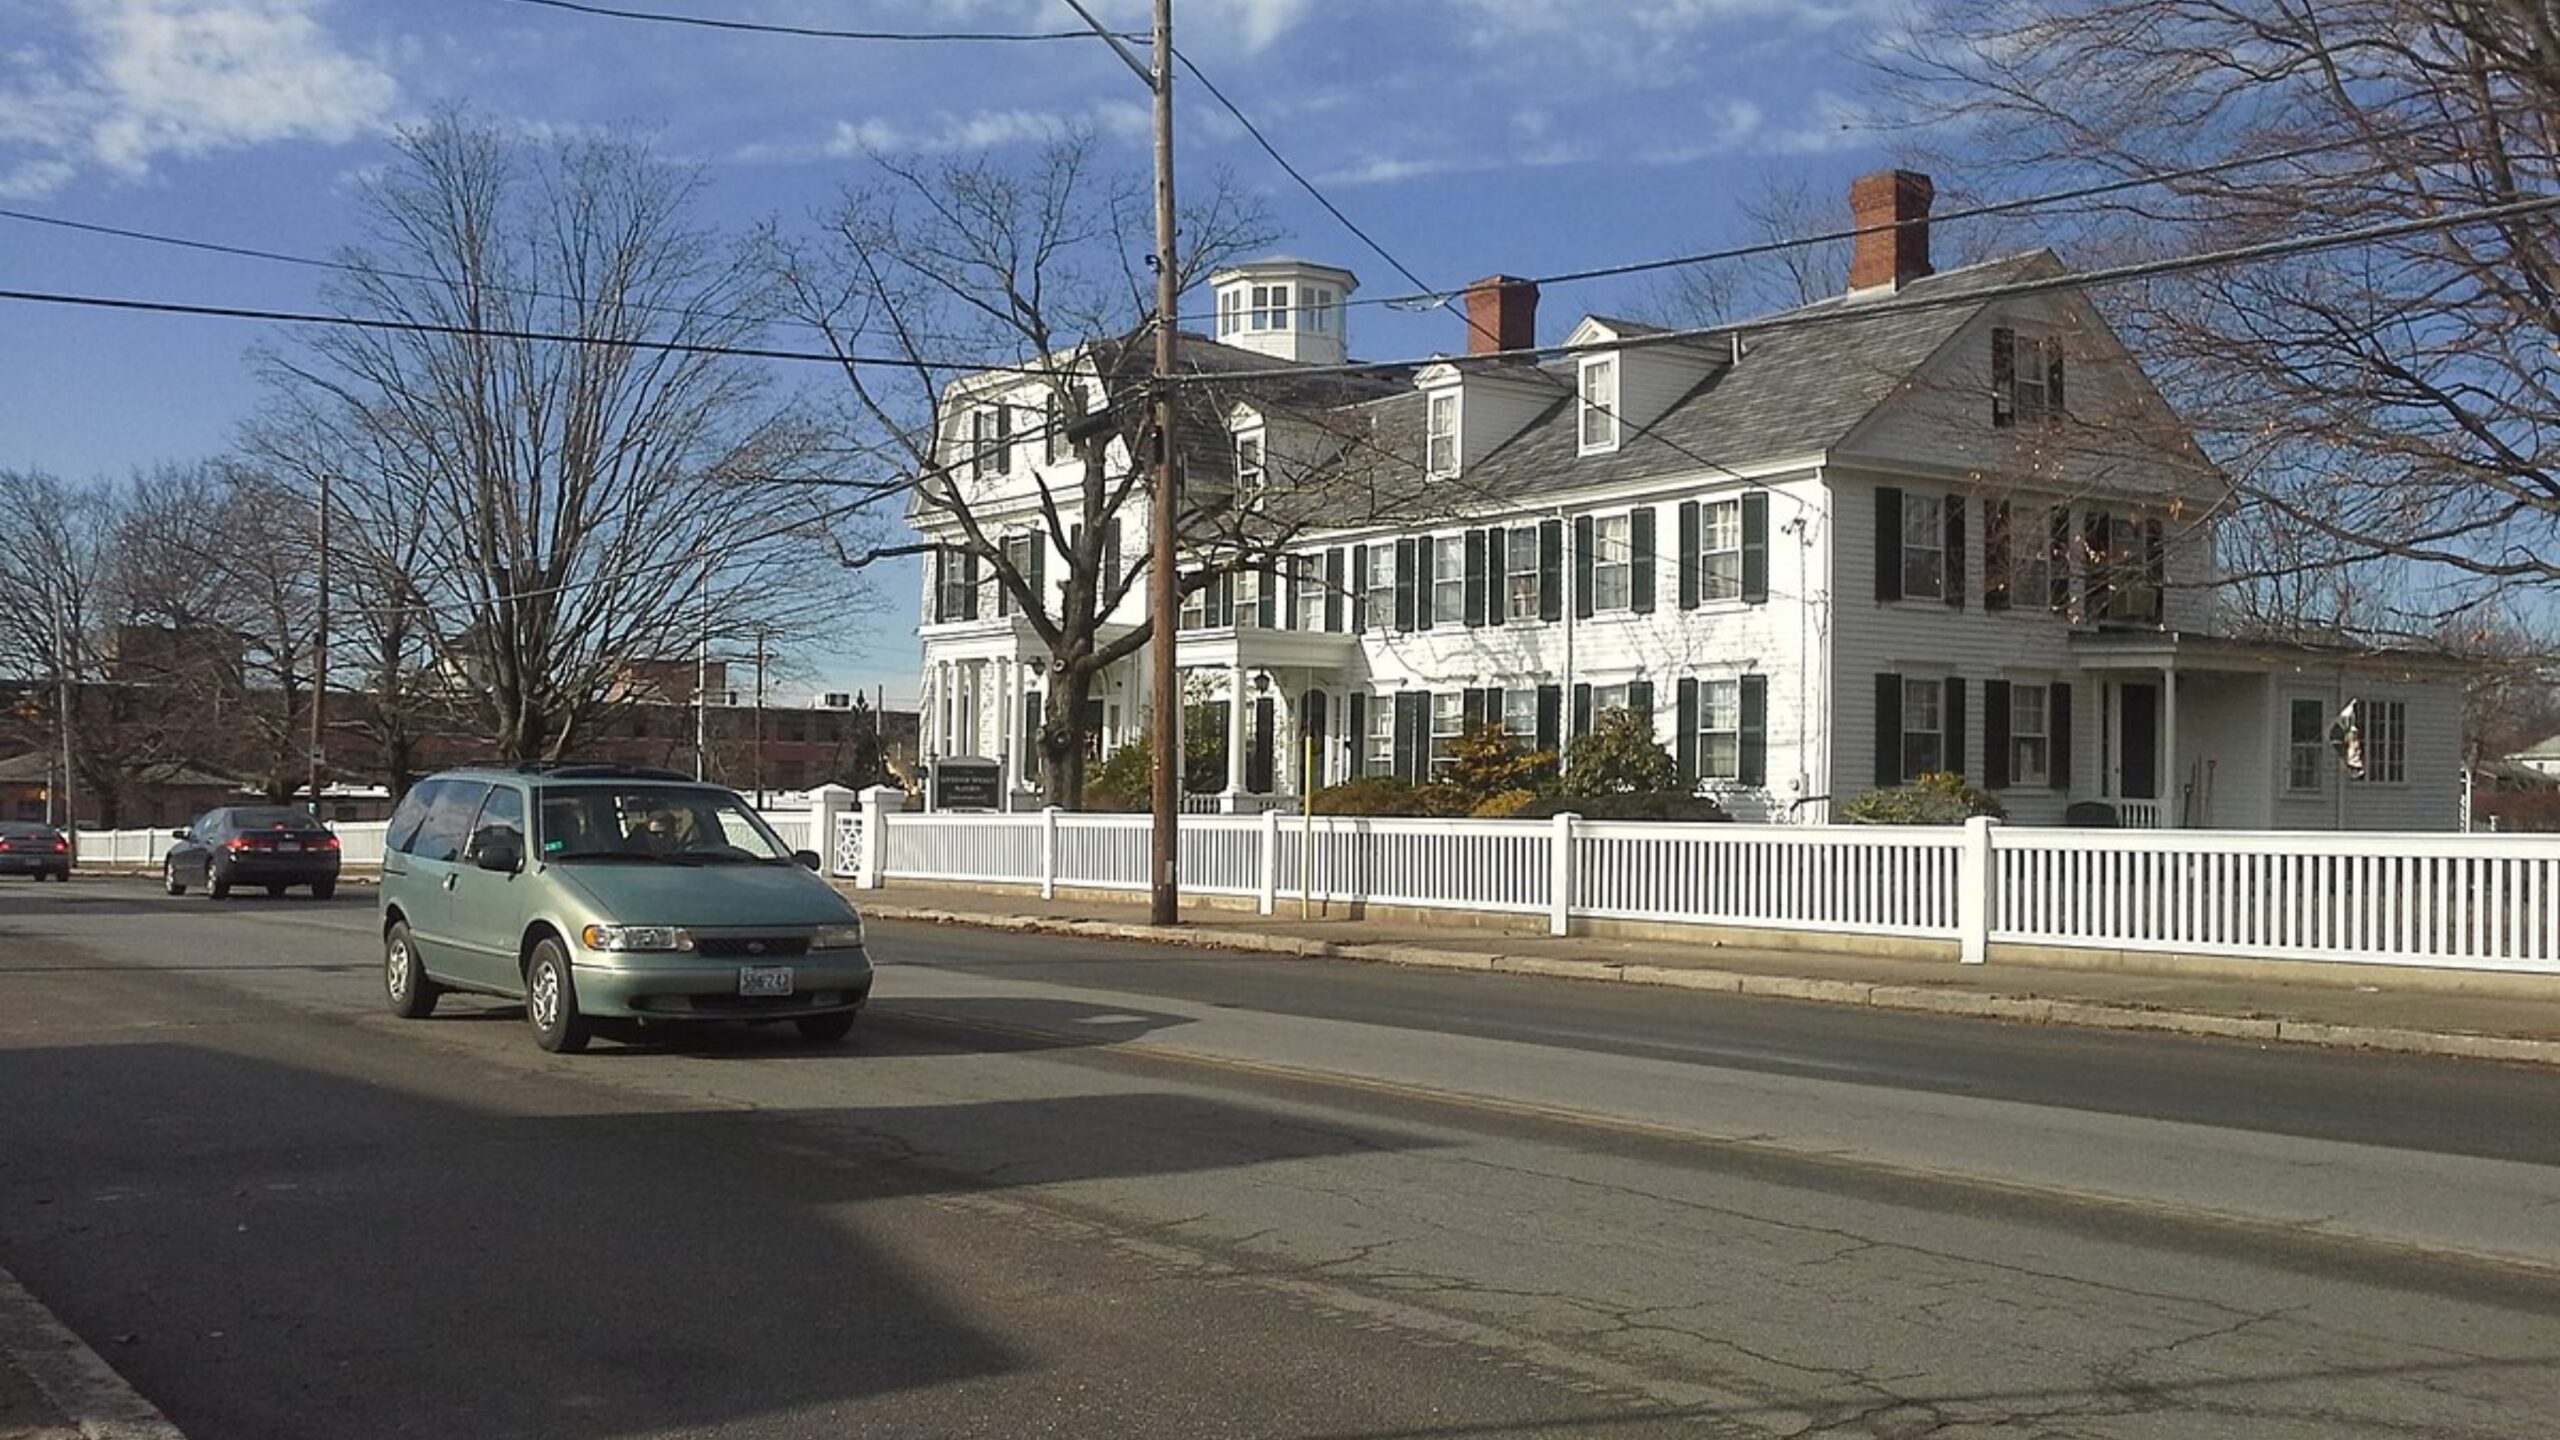
Johnston – Rapid Appreciation Close to the Capital

Bordering the city of Providence, Johnston provides easy access to downtown while retaining its own suburban identity. The town is known for its well-rated schools, strong community services, and access to Routes 6 and 295. Recent commercial development has added jobs and new amenities.
With a median home value of $445,633 in 2025, Johnston still represents a lower-cost alternative to city living. The steady price climb points to ongoing demand, and its combination of location and infrastructure suggests continued interest from buyers seeking value and proximity.
11. Cranston – 142% Home Price Increase Since 2012

- 2010: $205,718
- 2011: $196,658 (-$9,061, -4.40% from previous year)
- 2012: $180,621 (-$16,037, -8.15% from previous year)
- 2013: $181,941 (+$1,320, +0.73% from previous year)
- 2014: $191,981 (+$10,039, +5.52% from previous year)
- 2015: $198,921 (+$6,940, +3.62% from previous year)
- 2016: $214,846 (+$15,925, +8.01% from previous year)
- 2017: $230,853 (+$16,007, +7.45% from previous year)
- 2018: $252,527 (+$21,674, +9.39% from previous year)
- 2019: $267,041 (+$14,514, +5.75% from previous year)
- 2020: $278,044 (+$11,003, +4.12% from previous year)
- 2021: $326,717 (+$48,673, +17.51% from previous year)
- 2022: $369,787 (+$43,070, +13.18% from previous year)
- 2023: $382,716 (+$12,928, +3.50% from previous year)
- 2024: $412,722 (+$30,006, +7.84% from previous year)
- 2025: $436,971 (+$24,249, +5.88% from previous year)
From 2012 to 2025, Cranston saw a dramatic 142% increase in home prices, signaling robust demand. Despite rising values, the city still offers more affordable housing than many parts of the Providence metro, making it attractive to buyers looking for balance between price and access.
Cranston – Affordability in a Bustling Suburban City
As one of Rhode Island’s largest cities, Cranston offers a mix of urban convenience and suburban peace. Located just south of Providence, it’s a popular choice for commuters and families alike. Garden City Center, a bustling outdoor shopping district, adds retail appeal to the area.
Cranston’s housing market continues to attract attention due to its varied neighborhoods, ranging from historic Pawtuxet Village to newer suburban subdivisions. At a 2025 median price of $436,971, it still offers relatively good value for a city with excellent schools, access to highways, and robust public services.
10. East Providence – 142% Home Price Increase Since 2012

- 2010: $214,865
- 2011: $193,873 (-$20,991, -9.77% from previous year)
- 2012: $180,289 (-$13,585, -7.01% from previous year)
- 2013: $180,016 (-$272, -0.15% from previous year)
- 2014: $186,268 (+$6,252, +3.47% from previous year)
- 2015: $193,232 (+$6,964, +3.74% from previous year)
- 2016: $208,275 (+$15,043, +7.78% from previous year)
- 2017: $225,805 (+$17,530, +8.42% from previous year)
- 2018: $245,491 (+$19,686, +8.72% from previous year)
- 2019: $255,625 (+$10,134, +4.13% from previous year)
- 2020: $278,493 (+$22,869, +8.95% from previous year)
- 2021: $323,889 (+$45,396, +16.30% from previous year)
- 2022: $362,895 (+$39,005, +12.04% from previous year)
- 2023: $378,499 (+$15,604, +4.30% from previous year)
- 2024: $422,330 (+$43,831, +11.58% from previous year)
- 2025: $435,254 (+$12,924, +3.06% from previous year)
East Providence has more than doubled in home value since 2012, driven by proximity to Providence and steady development. Its blend of affordability and convenience has made it a standout for young professionals and longtime residents alike.
East Providence – Riverfront Value Close to Downtown
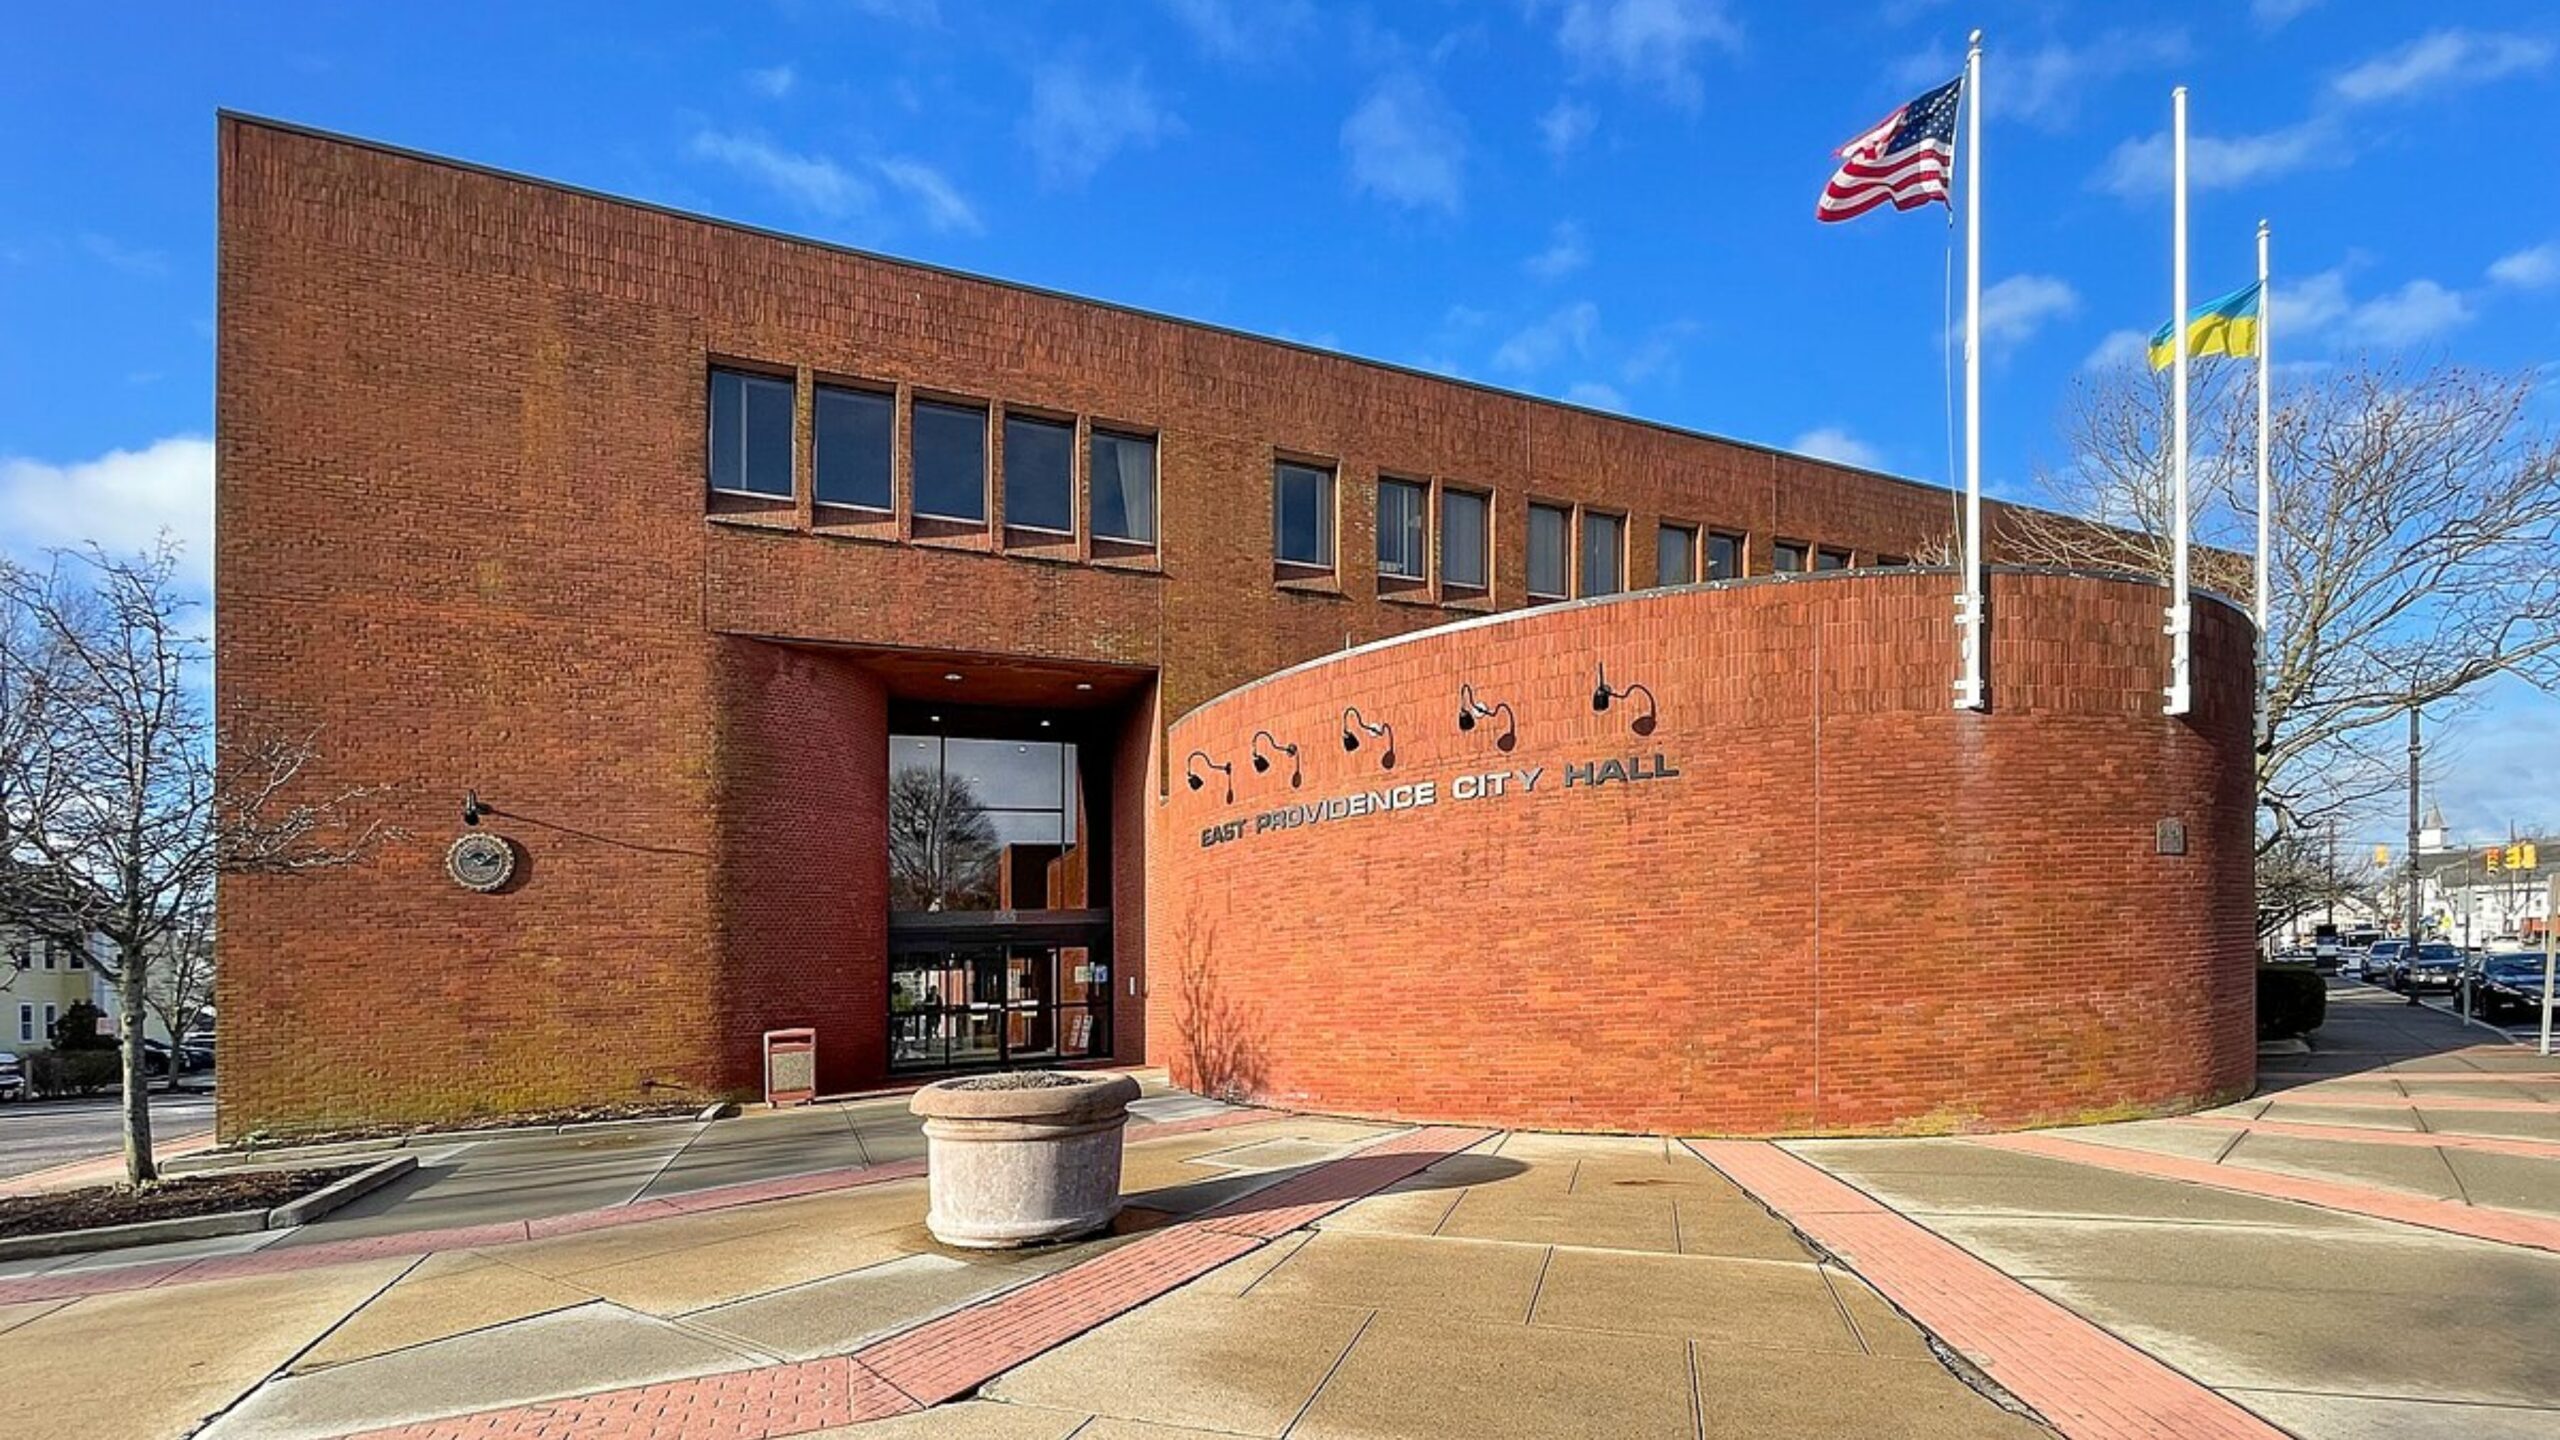
Situated directly across the Seekonk River from downtown Providence, East Providence combines scenic waterfront neighborhoods with urban access. The town offers varied housing stock—from colonial homes to condos—at prices below the capital city’s average.
With a 2025 median price of $435,254, East Providence provides a strategic mix of location, amenities, and affordability. Infrastructure investments, such as improvements to the Henderson Bridge and the expansion of the East Bay Bike Path, have only strengthened its residential appeal in recent years.
9. Manville – 154% Home Price Increase Since 2012

🔥 Would you like to save this?
- 2010: $190,478
- 2011: $178,128 (-$12,349, -6.48% from previous year)
- 2012: $170,866 (-$7,262, -4.08% from previous year)
- 2013: $167,119 (-$3,747, -2.19% from previous year)
- 2014: $189,803 (+$22,684, +13.57% from previous year)
- 2015: $193,712 (+$3,909, +2.06% from previous year)
- 2016: $203,880 (+$10,168, +5.25% from previous year)
- 2017: $224,540 (+$20,660, +10.13% from previous year)
- 2018: $245,384 (+$20,844, +9.28% from previous year)
- 2019: $255,782 (+$10,398, +4.24% from previous year)
- 2020: $272,024 (+$16,242, +6.35% from previous year)
- 2021: $328,378 (+$56,354, +20.72% from previous year)
- 2022: $361,388 (+$33,011, +10.05% from previous year)
- 2023: $374,303 (+$12,915, +3.57% from previous year)
- 2024: $412,495 (+$38,192, +10.20% from previous year)
- 2025: $433,878 (+$21,383, +5.18% from previous year)
Manville has seen dramatic appreciation since 2012, fueled by strong demand and steady price increases nearly every year. Despite this growth, its prices remain below the state average, making it an appealing location for cost-conscious buyers.
Manville – Quiet Village with Rising Appeal
Manville is a village in the town of Lincoln, known for its residential neighborhoods and proximity to natural spots like the Blackstone River. It offers a quieter pace while being just a short drive from Pawtucket, Providence, and Woonsocket.
As of 2025, the average home price is $433,878, reflecting strong increases in value, especially over the last five years. With access to Route 146 and the nearby Lincoln Woods State Park, Manville continues to grow in popularity for buyers who want suburban living at a manageable price.
8. Providence – 187% Home Price Increase Since 2012
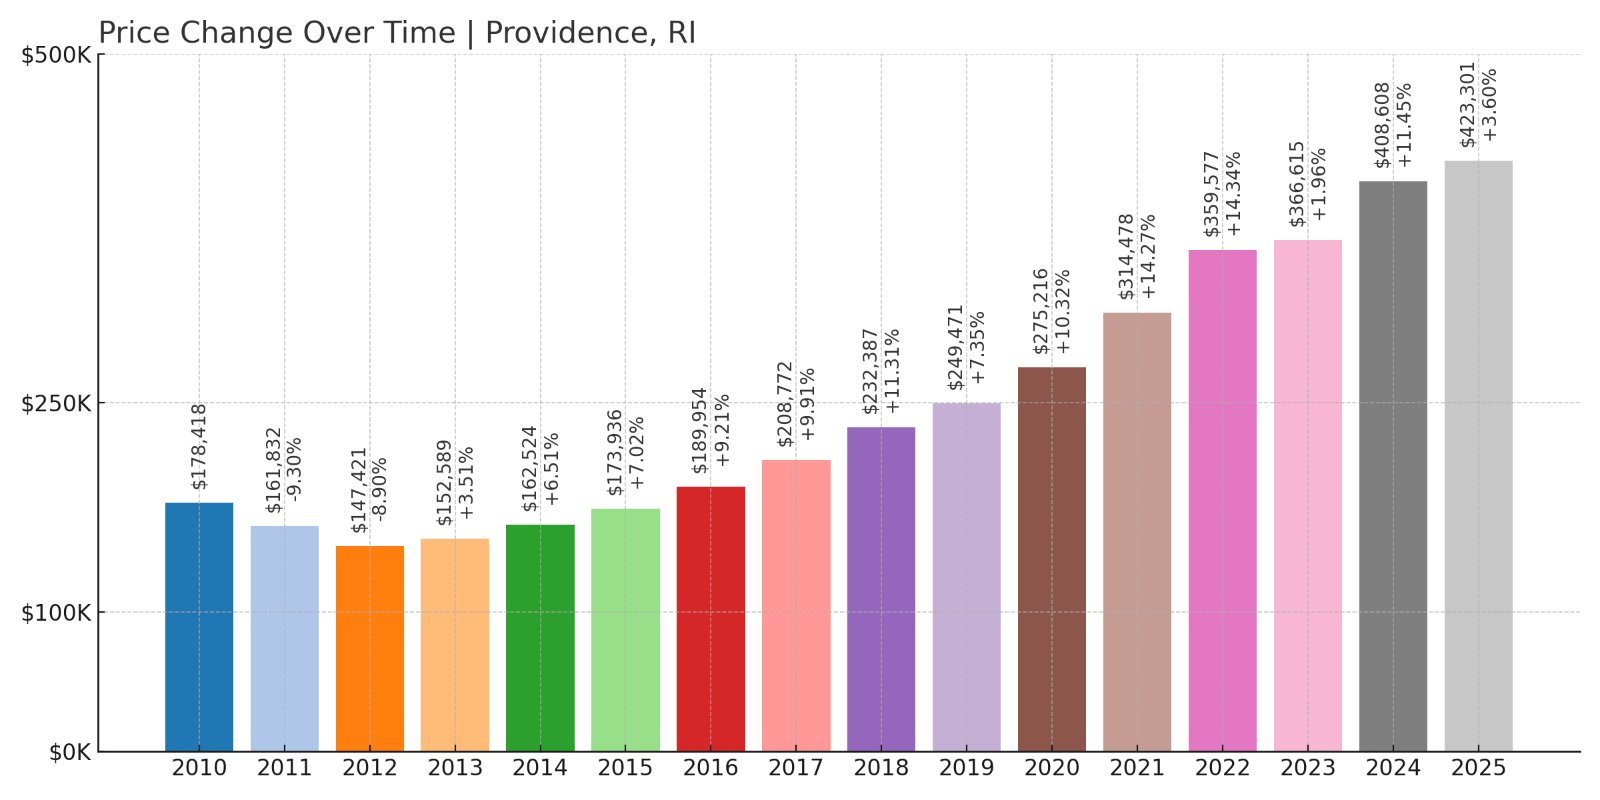
- 2010: $178,418
- 2011: $161,832 (-$16,586, -9.30% from previous year)
- 2012: $147,421 (-$14,411, -8.90% from previous year)
- 2013: $152,589 (+$5,168, +3.51% from previous year)
- 2014: $162,524 (+$9,935, +6.51% from previous year)
- 2015: $173,936 (+$11,412, +7.02% from previous year)
- 2016: $189,954 (+$16,018, +9.21% from previous year)
- 2017: $208,772 (+$18,818, +9.91% from previous year)
- 2018: $232,387 (+$23,615, +11.31% from previous year)
- 2019: $249,471 (+$17,084, +7.35% from previous year)
- 2020: $275,216 (+$25,745, +10.32% from previous year)
- 2021: $314,478 (+$39,262, +14.27% from previous year)
- 2022: $359,577 (+$45,099, +14.34% from previous year)
- 2023: $366,615 (+$7,038, +1.96% from previous year)
- 2024: $408,608 (+$41,993, +11.45% from previous year)
- 2025: $423,301 (+$14,693, +3.60% from previous year)
Providence leads the way with nearly 190% growth since 2012, reflecting both market demand and revitalization efforts. Yet its average home value remains relatively attainable compared to other East Coast cities, placing it squarely on this list.
Providence – The Capital’s Affordable Comeback
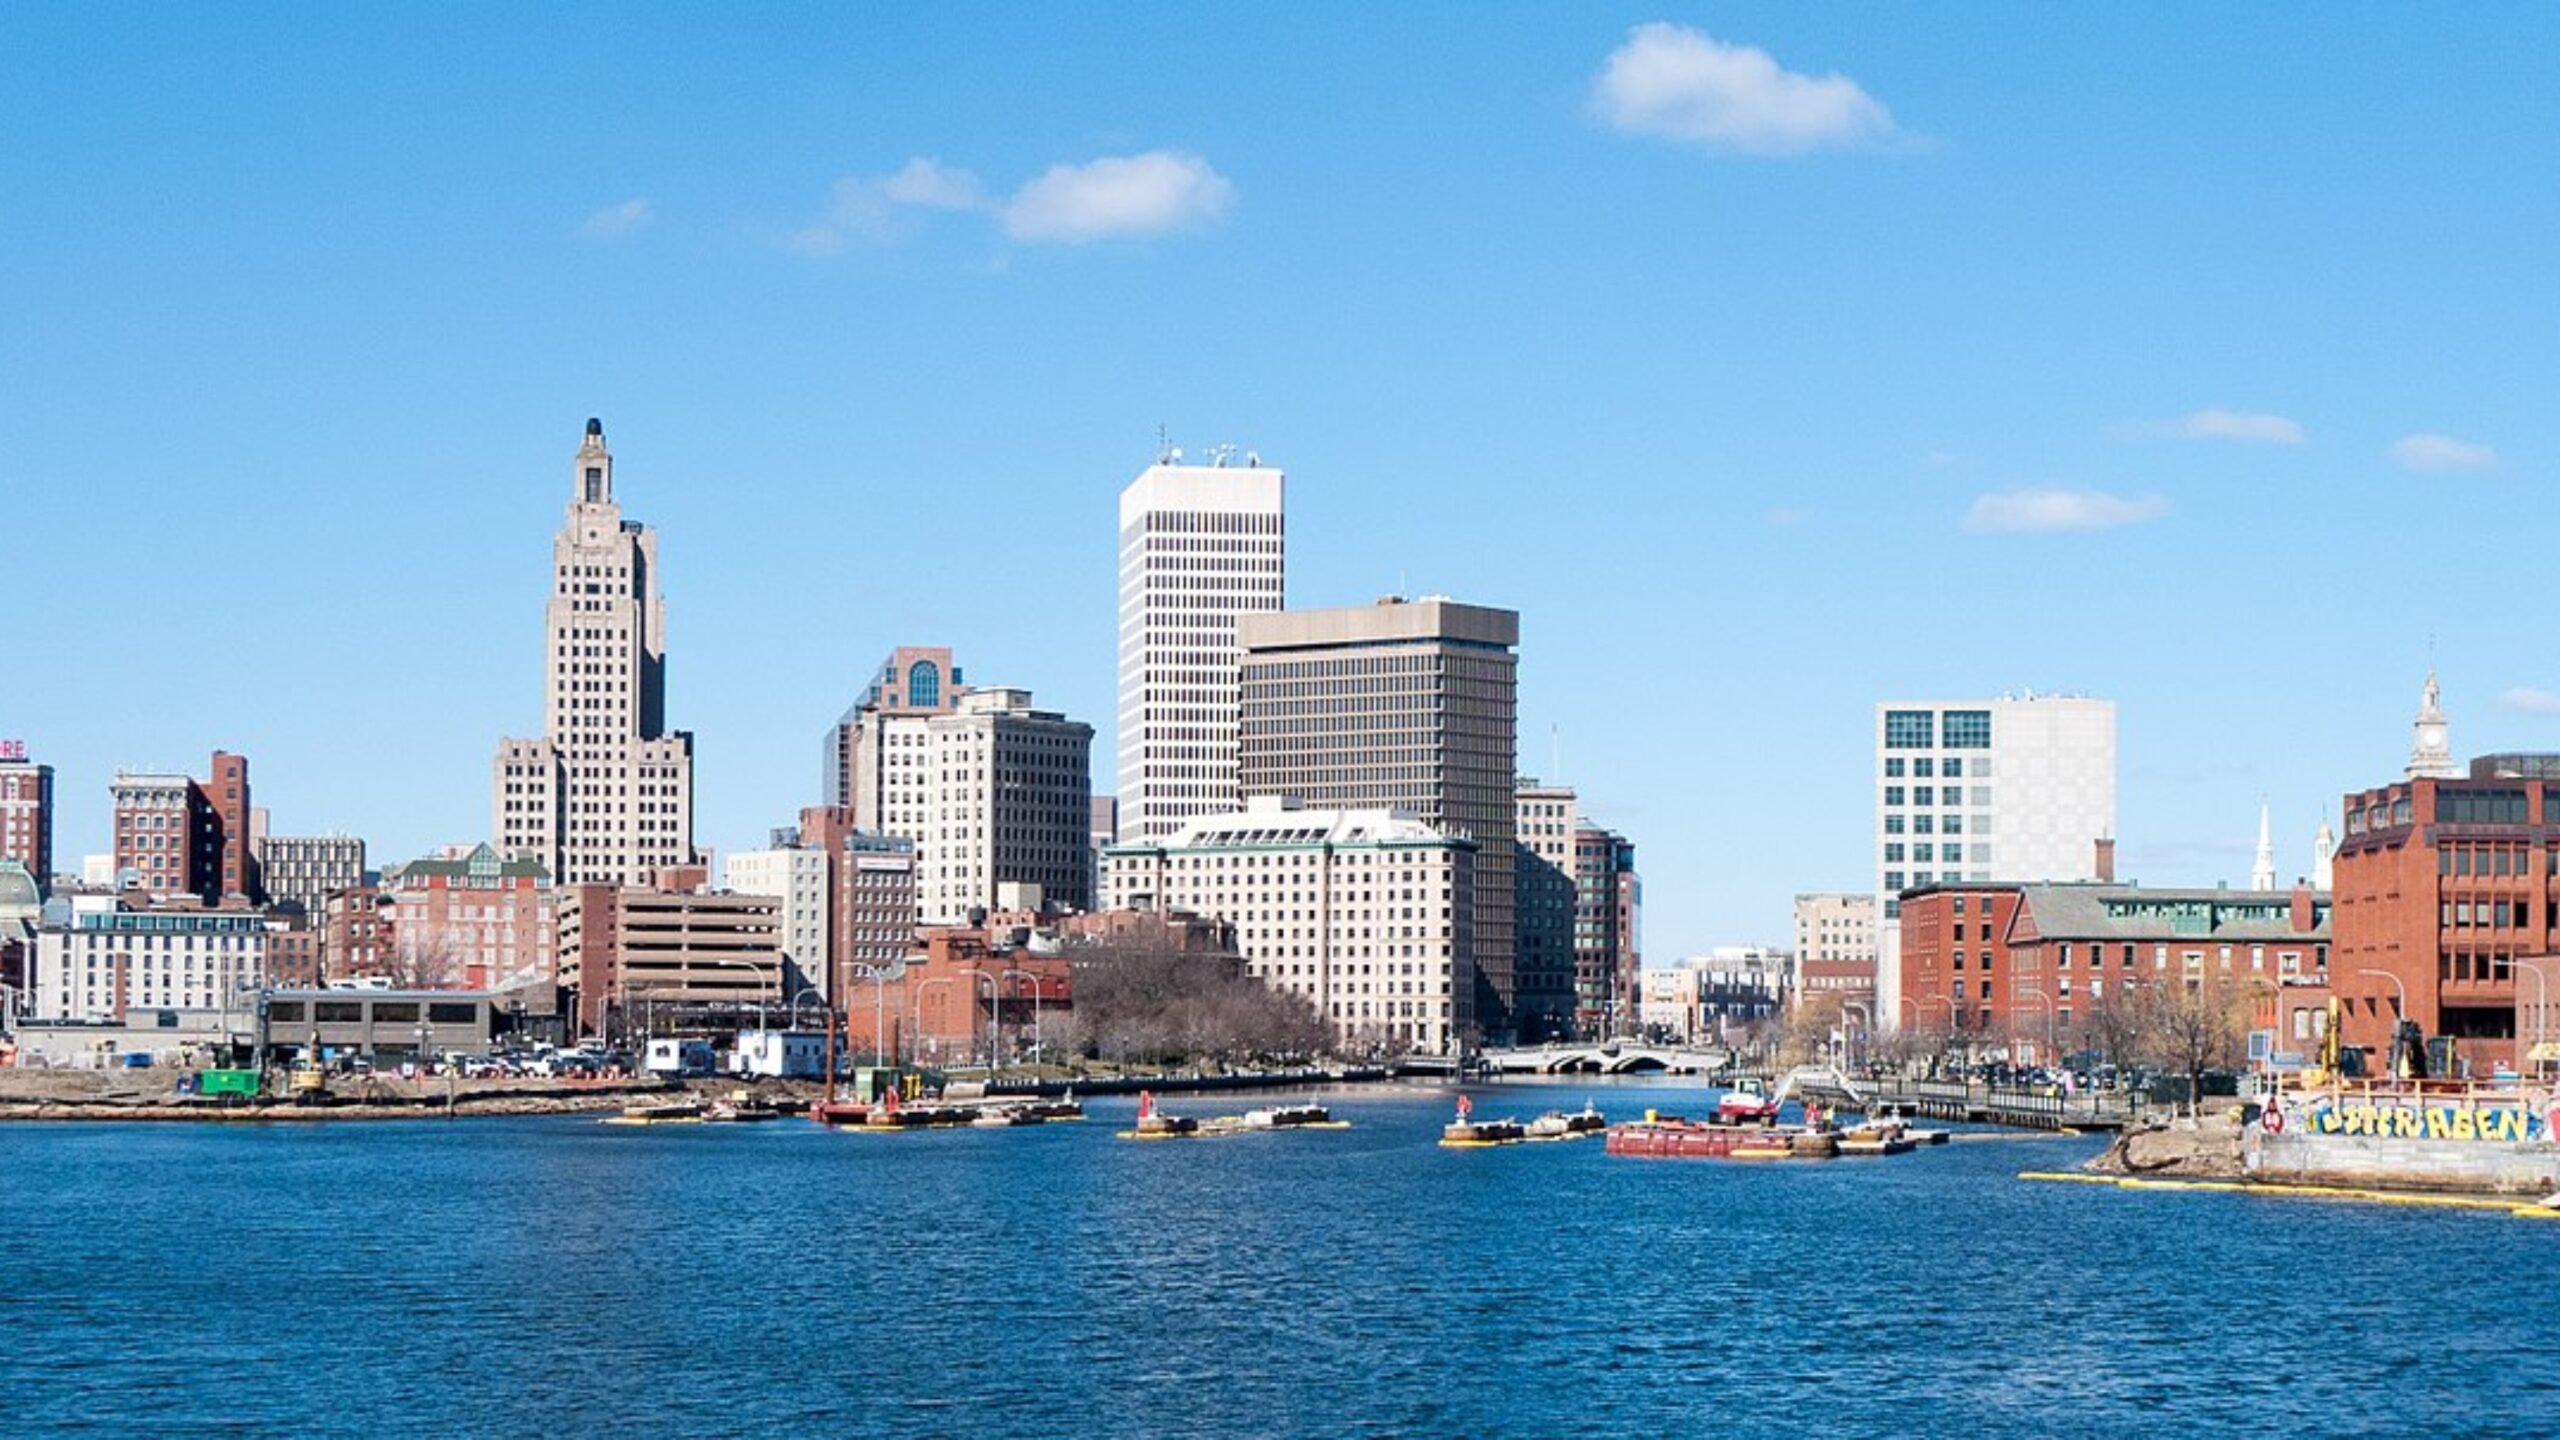
Rhode Island’s capital is a hub of education, art, and business. With universities like Brown and RISD, as well as a growing tech and healthcare sector, Providence attracts a steady influx of residents. Neighborhoods such as Elmwood and Mount Pleasant offer some of the most affordable options in the city.
With a 2025 home price of $423,301, Providence remains one of the few capital cities where ownership is still accessible to many. Investments in infrastructure and a walkable downtown have supported long-term appreciation, while the city maintains a rich cultural and economic life that continues to appeal to buyers statewide and beyond.
7. Bradford – 131% Home Price Increase Since 2012

- 2010: $191,713
- 2011: $182,073 (-$9,641, -5.03% from previous year)
- 2012: $181,141 (-$932, -0.51% from previous year)
- 2013: $193,438 (+$12,297, +6.79% from previous year)
- 2014: $204,912 (+$11,474, +5.93% from previous year)
- 2015: $207,755 (+$2,842, +1.39% from previous year)
- 2016: $222,604 (+$14,849, +7.15% from previous year)
- 2017: $240,485 (+$17,881, +8.03% from previous year)
- 2018: $255,500 (+$15,015, +6.24% from previous year)
- 2019: $260,971 (+$5,470, +2.14% from previous year)
- 2020: $278,678 (+$17,708, +6.79% from previous year)
- 2021: $323,415 (+$44,737, +16.05% from previous year)
- 2022: $364,296 (+$40,881, +12.64% from previous year)
- 2023: $371,771 (+$7,475, +2.05% from previous year)
- 2024: $397,365 (+$25,594, +6.88% from previous year)
- 2025: $418,309 (+$20,944, +5.27% from previous year)
Since 2012, Bradford has experienced a 131% jump in home values, with a particularly strong performance during the years 2020–2022. Despite these gains, Bradford remains one of the more affordable areas in the state, offering good value for price-conscious buyers.
Bradford – Small-Town Charm in Southern Rhode Island
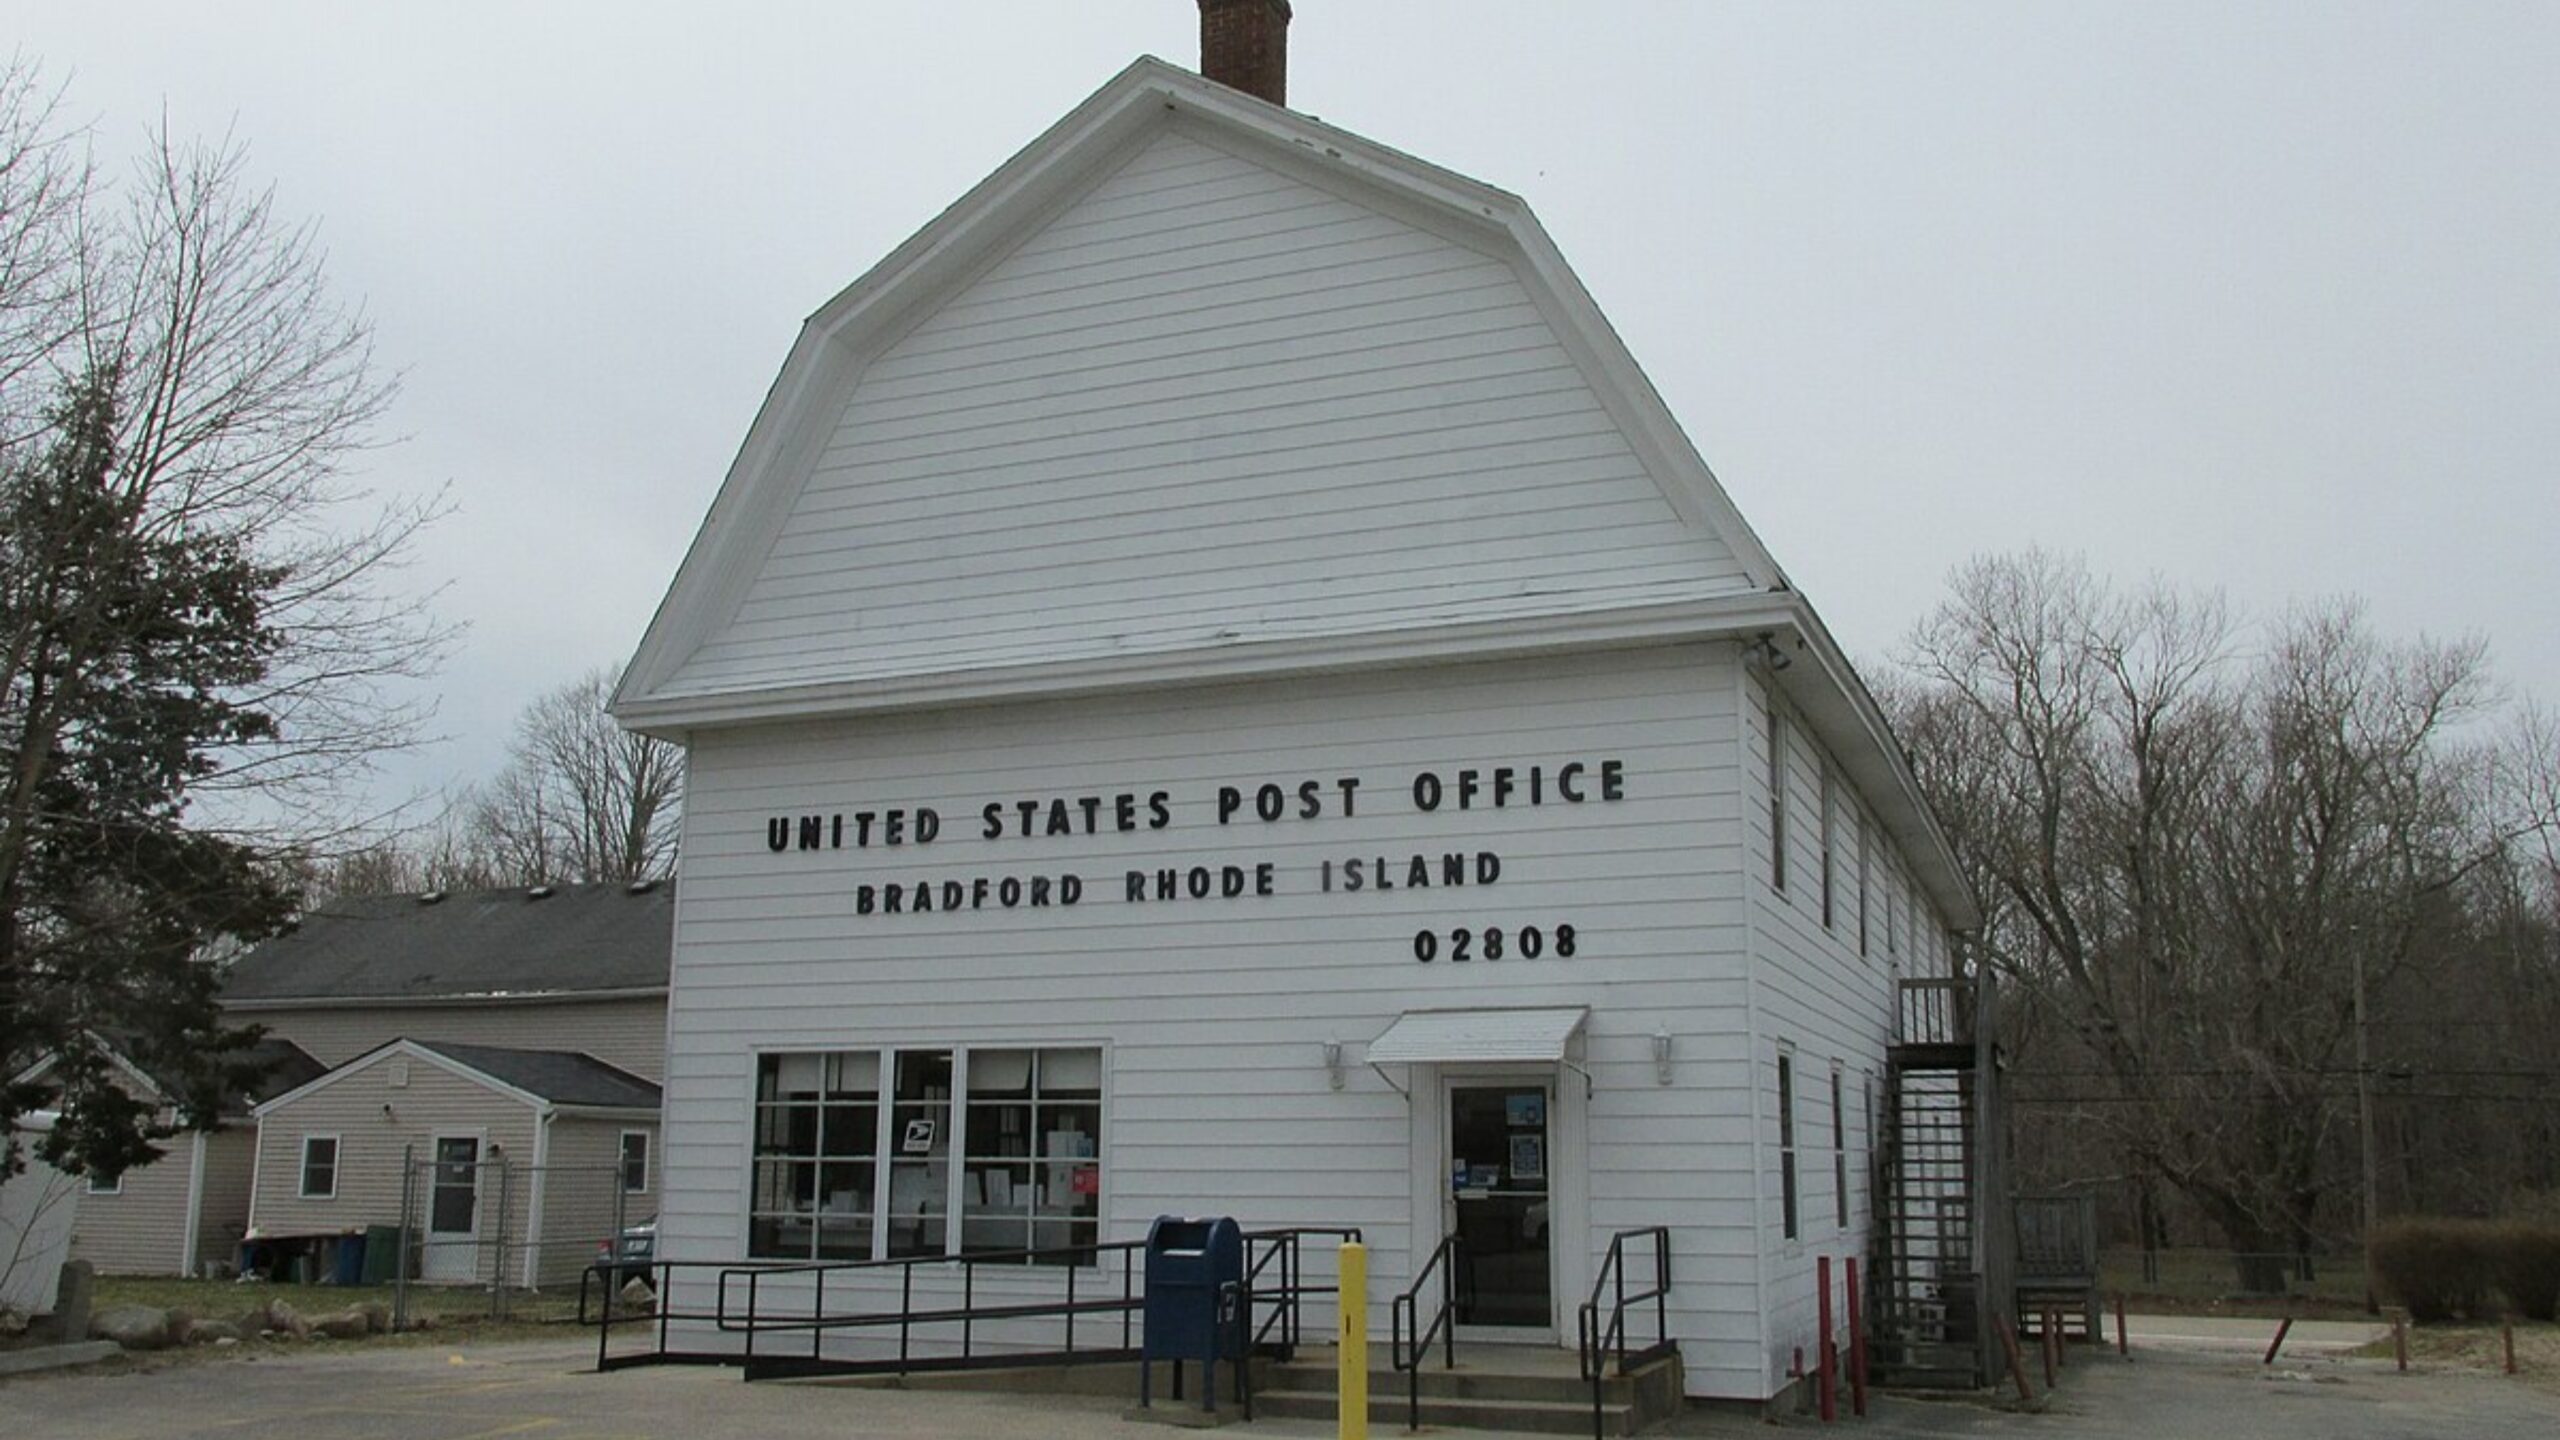
Bradford is a village in the town of Westerly, nestled along the southwestern edge of Rhode Island. Its location offers close proximity to beaches, nature preserves, and the Connecticut border. While more low-key than central Westerly, Bradford’s growth has been steady and impressive.
With a 2025 median price of $418,309, Bradford’s housing market remains accessible, especially given its coastal proximity. The area has benefited from Westerly’s broader appeal, including revitalization of town centers, strong schools, and access to seasonal tourism. It’s an ideal spot for those seeking a balance of seclusion and shoreline access.
6. North Providence – 154% Home Price Increase Since 2012
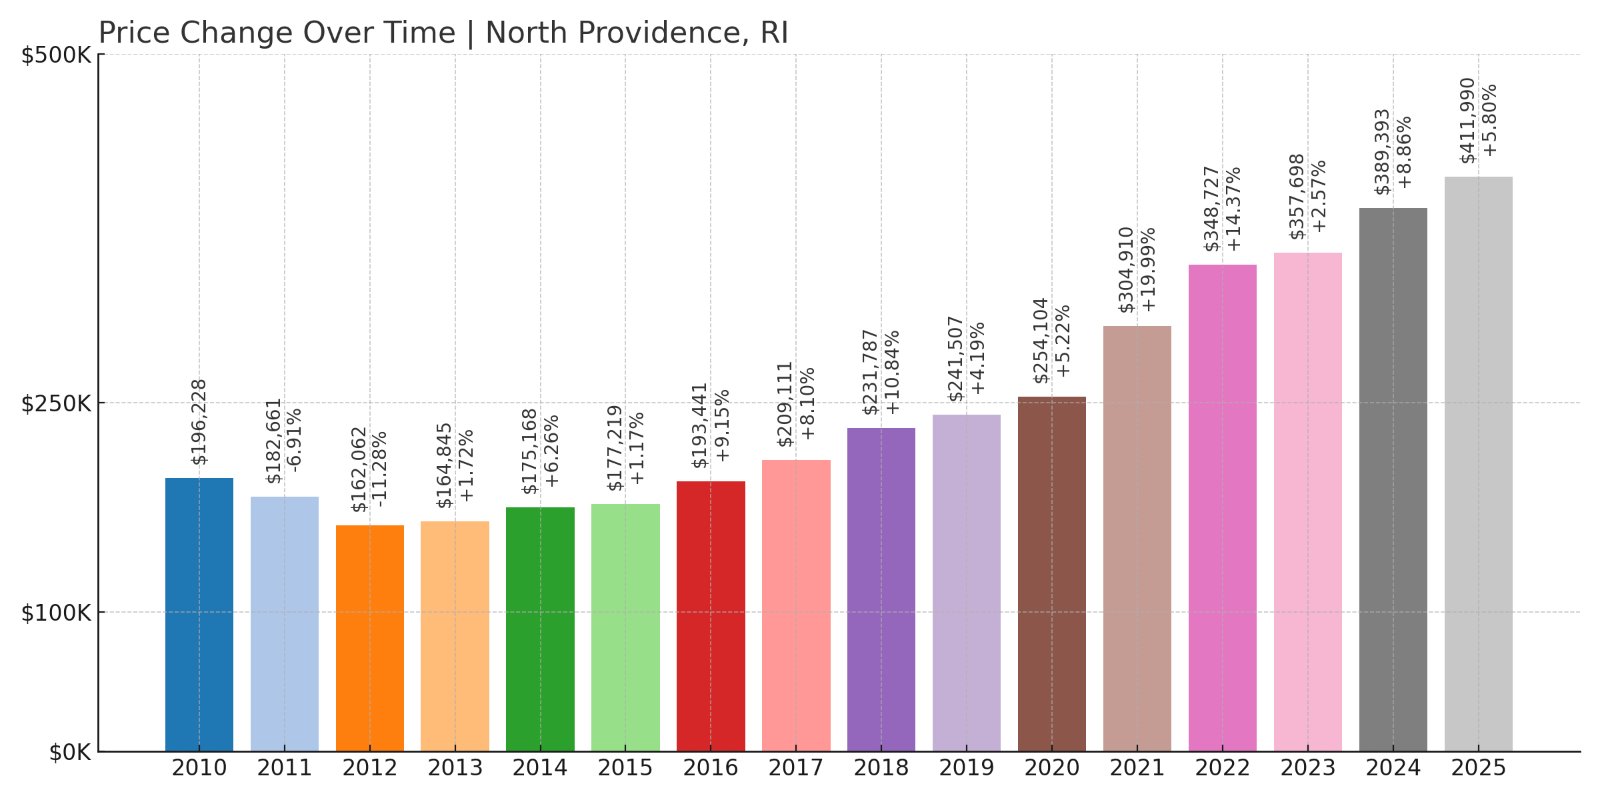
- 2010: $196,228
- 2011: $182,661 (-$13,567, -6.91% from previous year)
- 2012: $162,062 (-$20,599, -11.28% from previous year)
- 2013: $164,845 (+$2,783, +1.72% from previous year)
- 2014: $175,168 (+$10,323, +6.26% from previous year)
- 2015: $177,219 (+$2,051, +1.17% from previous year)
- 2016: $193,441 (+$16,222, +9.15% from previous year)
- 2017: $209,111 (+$15,670, +8.10% from previous year)
- 2018: $231,787 (+$22,676, +10.84% from previous year)
- 2019: $241,507 (+$9,720, +4.19% from previous year)
- 2020: $254,104 (+$12,598, +5.22% from previous year)
- 2021: $304,910 (+$50,806, +19.99% from previous year)
- 2022: $348,727 (+$43,817, +14.37% from previous year)
- 2023: $357,698 (+$8,971, +2.57% from previous year)
- 2024: $389,393 (+$31,695, +8.86% from previous year)
- 2025: $411,990 (+$22,597, +5.80% from previous year)
North Providence has seen a significant 154% rise in home prices since 2012. With values climbing consistently each year—especially from 2020 onward—it reflects strong buyer demand and development activity.
North Providence – Affordability Just Outside the City

Located immediately north of the state capital, North Providence provides convenient access to Providence while offering more residential charm. With well-established neighborhoods and strong local services, it’s a preferred area for commuters, young families, and retirees alike.
North Providence’s median 2025 home price sits at $411,990, underscoring its appeal as a value-focused alternative to city living. Local amenities like Notte Park, the Wenscott Reservoir, and local dining options contribute to its popularity. The town has remained competitive as nearby urban prices rise, helping it retain its spot among Rhode Island’s most affordable markets.
5. Warwick – 147% Home Price Increase Since 2012
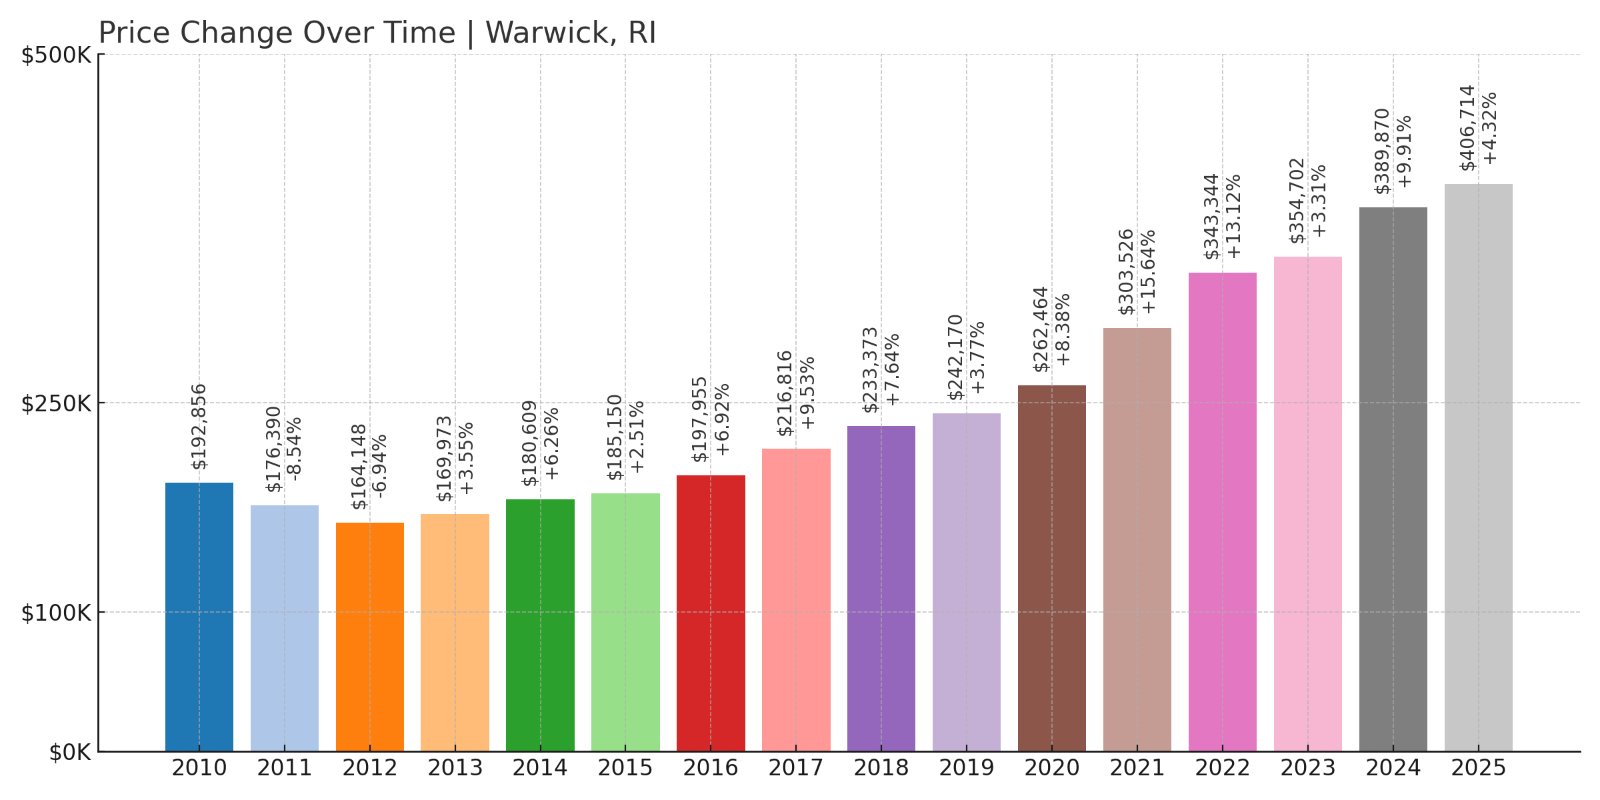
- 2010: $192,856
- 2011: $176,390 (-$16,465, -8.54% from previous year)
- 2012: $164,148 (-$12,243, -6.94% from previous year)
- 2013: $169,973 (+$5,825, +3.55% from previous year)
- 2014: $180,609 (+$10,636, +6.26% from previous year)
- 2015: $185,150 (+$4,541, +2.51% from previous year)
- 2016: $197,955 (+$12,805, +6.92% from previous year)
- 2017: $216,816 (+$18,861, +9.53% from previous year)
- 2018: $233,373 (+$16,557, +7.64% from previous year)
- 2019: $242,170 (+$8,797, +3.77% from previous year)
- 2020: $262,464 (+$20,293, +8.38% from previous year)
- 2021: $303,526 (+$41,063, +15.65% from previous year)
- 2022: $343,344 (+$39,818, +13.12% from previous year)
- 2023: $354,702 (+$11,358, +3.31% from previous year)
- 2024: $389,870 (+$35,168, +9.91% from previous year)
- 2025: $406,714 (+$16,845, +4.32% from previous year)
Home prices in Warwick have climbed 147% since 2012. Much of this increase took place in the past five years, driven by its coastal appeal, highway access, and availability of single-family homes with generous lots.
Warwick – Budget-Friendly Coastal Living
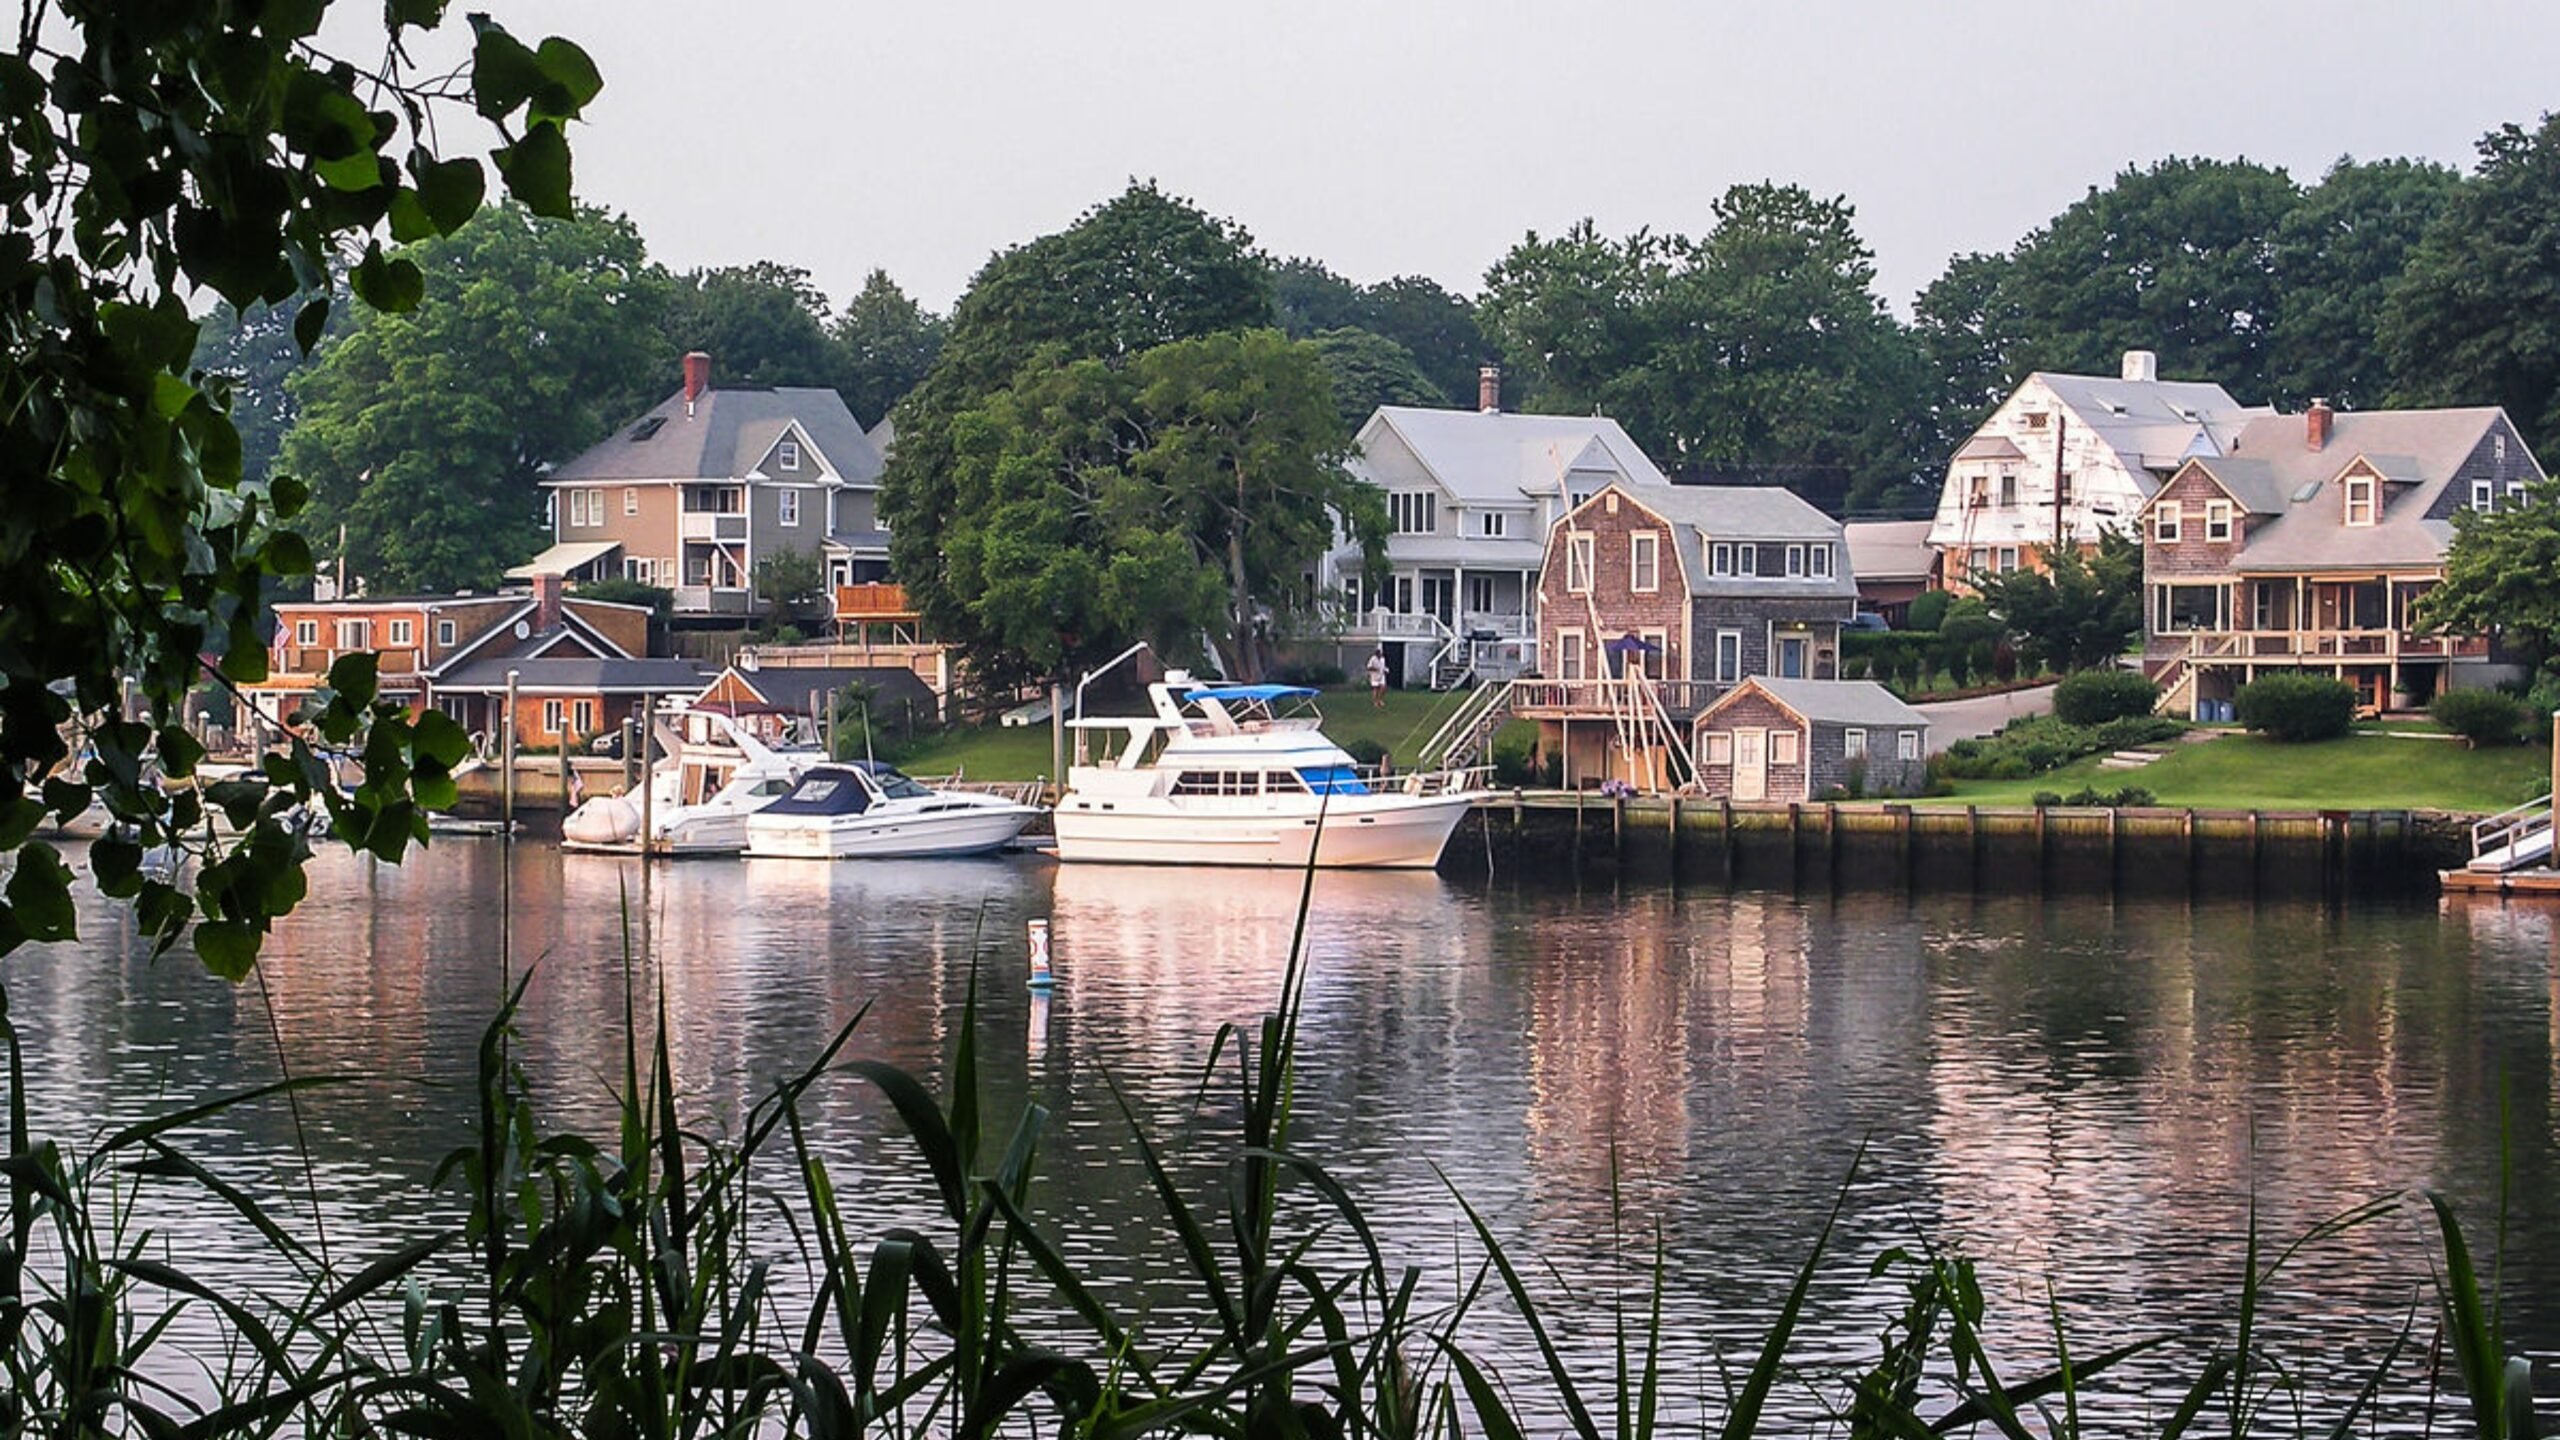
As Rhode Island’s second-largest city, Warwick offers a diverse housing stock, coastline views, and convenient access to both Providence and T.F. Green International Airport. Despite these features, it remains one of the more affordable coastal areas in the state.
In 2025, Warwick’s average home price stands at $406,714. The city’s neighborhoods—like Cowesett, Apponaug, and Oakland Beach—cater to a range of buyers. Continued investment in local infrastructure and redevelopment projects has contributed to its consistent growth, while still offering approachable entry points for new homeowners.
4. Pawtucket – 181% Home Price Increase Since 2012
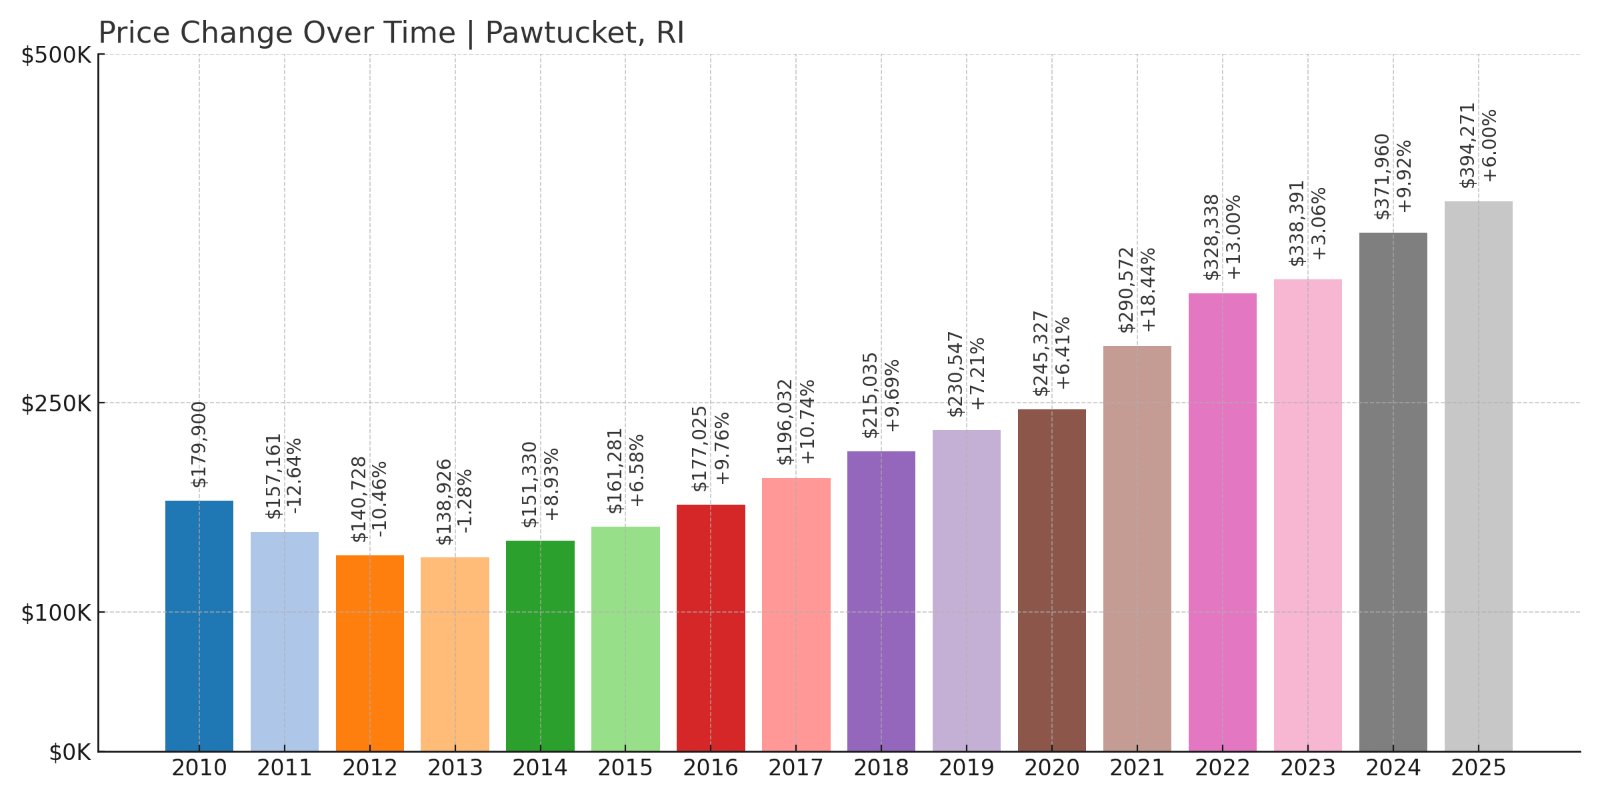
- 2010: $179,900
- 2011: $157,161 (-$22,739, -12.64% from previous year)
- 2012: $140,728 (-$16,433, -10.46% from previous year)
- 2013: $138,926 (-$1,802, -1.28% from previous year)
- 2014: $151,330 (+$12,404, +8.93% from previous year)
- 2015: $161,281 (+$9,952, +6.58% from previous year)
- 2016: $177,025 (+$15,744, +9.76% from previous year)
- 2017: $196,032 (+$19,006, +10.74% from previous year)
- 2018: $215,035 (+$19,004, +9.69% from previous year)
- 2019: $230,547 (+$15,512, +7.21% from previous year)
- 2020: $245,327 (+$14,781, +6.41% from previous year)
- 2021: $290,572 (+$45,244, +18.44% from previous year)
- 2022: $328,338 (+$37,766, +13.00% from previous year)
- 2023: $338,391 (+$10,053, +3.06% from previous year)
- 2024: $371,960 (+$33,569, +9.92% from previous year)
- 2025: $394,271 (+$22,311, +6.00% from previous year)
Pawtucket home prices have jumped 181% since 2012, marking one of the strongest long-term gains among Rhode Island towns. The city’s affordability, combined with major redevelopment efforts, has kept buyer interest high.
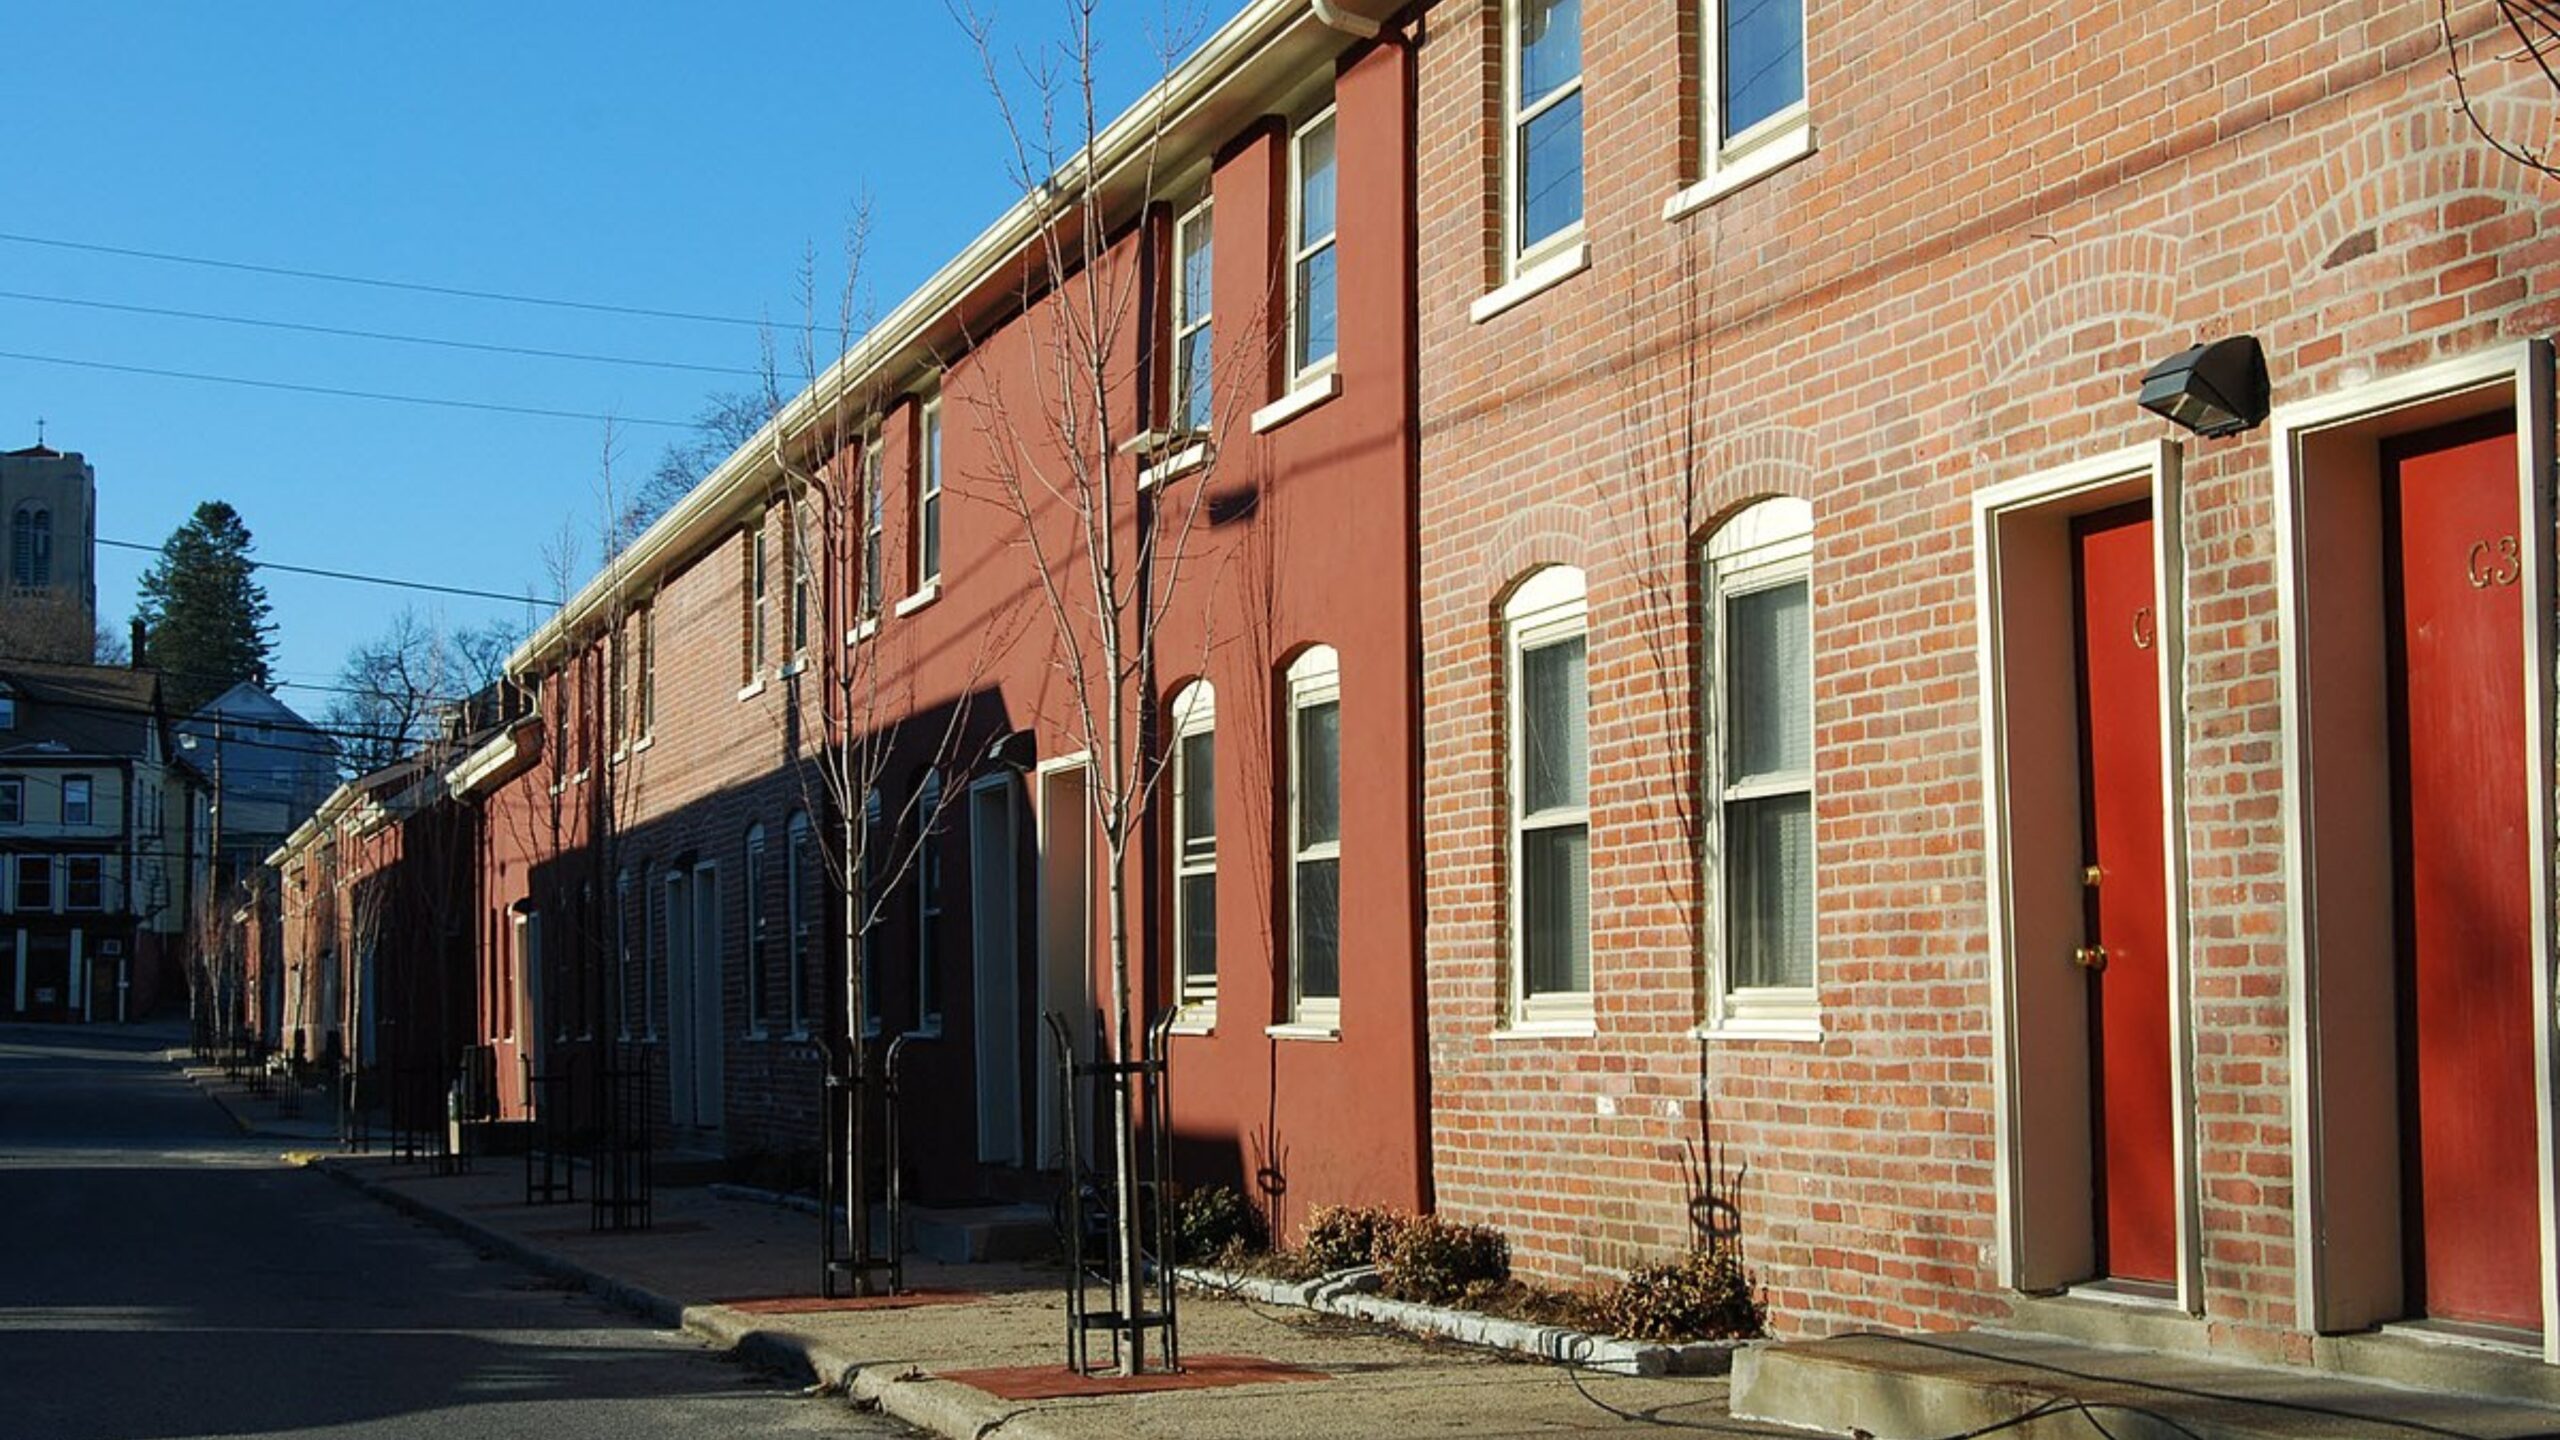
Pawtucket – Big Growth in a Once-Overlooked Market

Bordering Providence, Pawtucket has evolved from its industrial roots into an increasingly sought-after residential destination. Projects like the Conant Thread District revitalization and the incoming Pawtucket-Central Falls train station have transformed its profile dramatically.
With a 2025 median home value of $394,271, Pawtucket remains one of the most budget-friendly cities in the Northeast with commuter rail access. Arts venues, breweries, and easy I-95 access add to its appeal, and recent growth suggests its upward trend is far from over.
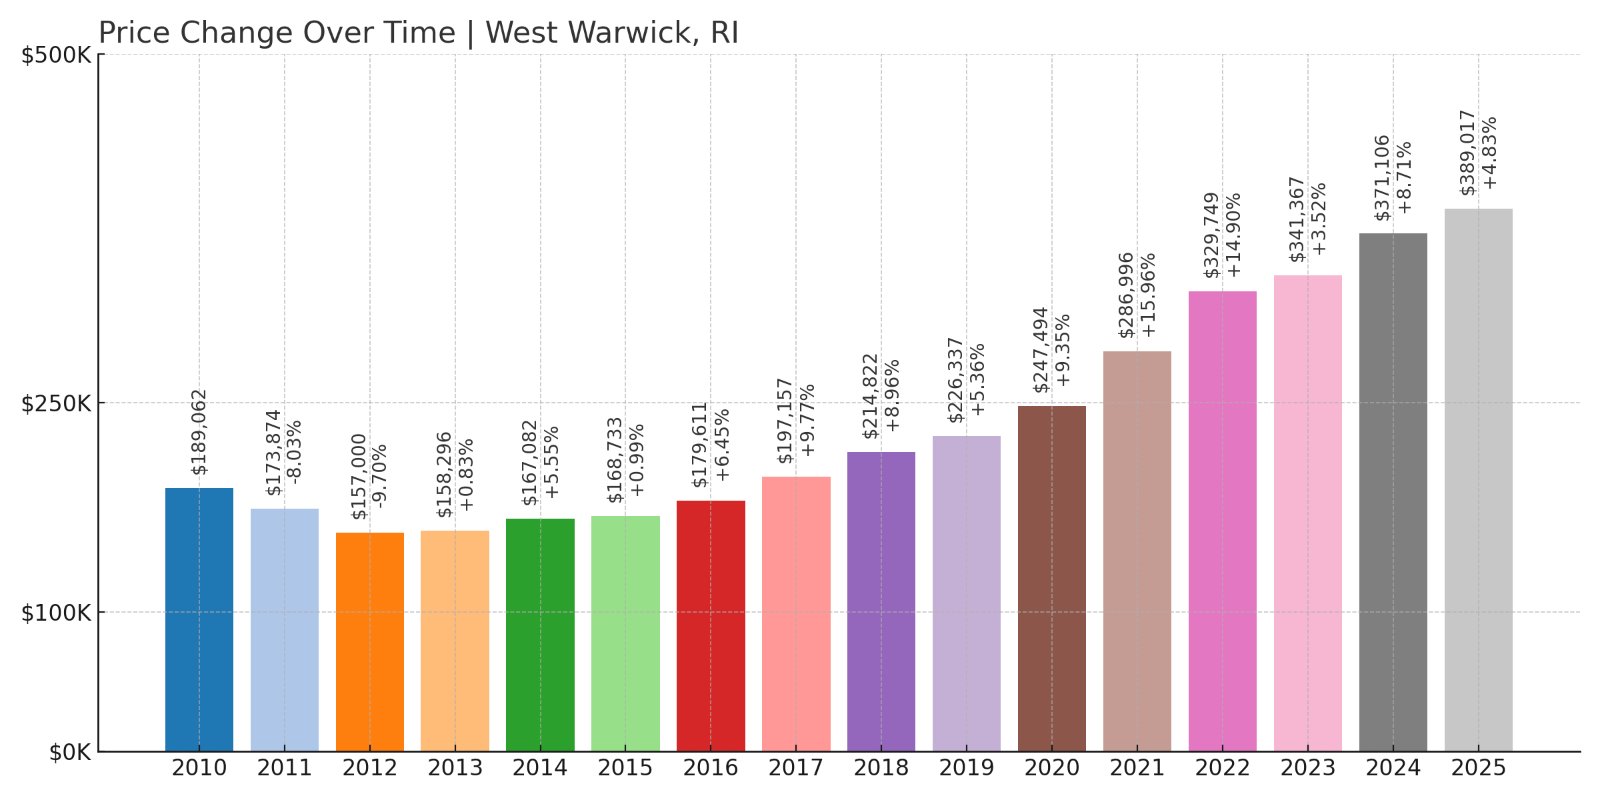
3. West Warwick – 147% Home Price Increase Since 2012
🔥 Would you like to save this?
- 2010: $189,062
- 2011: $173,874 (-$15,189, -8.03% from previous year)
- 2012: $157,000 (-$16,874, -9.70% from previous year)
- 2013: $158,296 (+$1,296, +0.83% from previous year)
- 2014: $167,082 (+$8,786, +5.55% from previous year)
- 2015: $168,733 (+$1,650, +0.99% from previous year)
- 2016: $179,611 (+$10,879, +6.45% from previous year)
- 2017: $197,157 (+$17,546, +9.77% from previous year)
- 2018: $214,822 (+$17,665, +8.96% from previous year)
- 2019: $226,337 (+$11,515, +5.36% from previous year)
- 2020: $247,494 (+$21,158, +9.35% from previous year)
- 2021: $286,996 (+$39,502, +15.96% from previous year)
- 2022: $329,749 (+$42,753, +14.90% from previous year)
- 2023: $341,367 (+$11,618, +3.52% from previous year)
- 2024: $371,106 (+$29,740, +8.71% from previous year)
- 2025: $389,017 (+$17,911, +4.83% from previous year)
West Warwick’s home prices have soared 147% since 2012. While increases have moderated recently, the market remains one of Rhode Island’s most accessible for homebuyers looking for strong value and solid infrastructure.
West Warwick – Community Convenience at a Lower Cost

Located just west of Warwick and Cranston, West Warwick is a smaller community with a strong mill-town heritage. It has increasingly attracted buyers priced out of higher-demand markets while still offering easy access to Providence and the southern part of the state.
The town’s 2025 median price of $389,017 is reflective of its affordability and potential. New retail centers, schools, and local business growth continue to add appeal, and its compact layout makes day-to-day life convenient for families and older residents alike.
2. Woonsocket – 171% Home Price Increase Since 2012
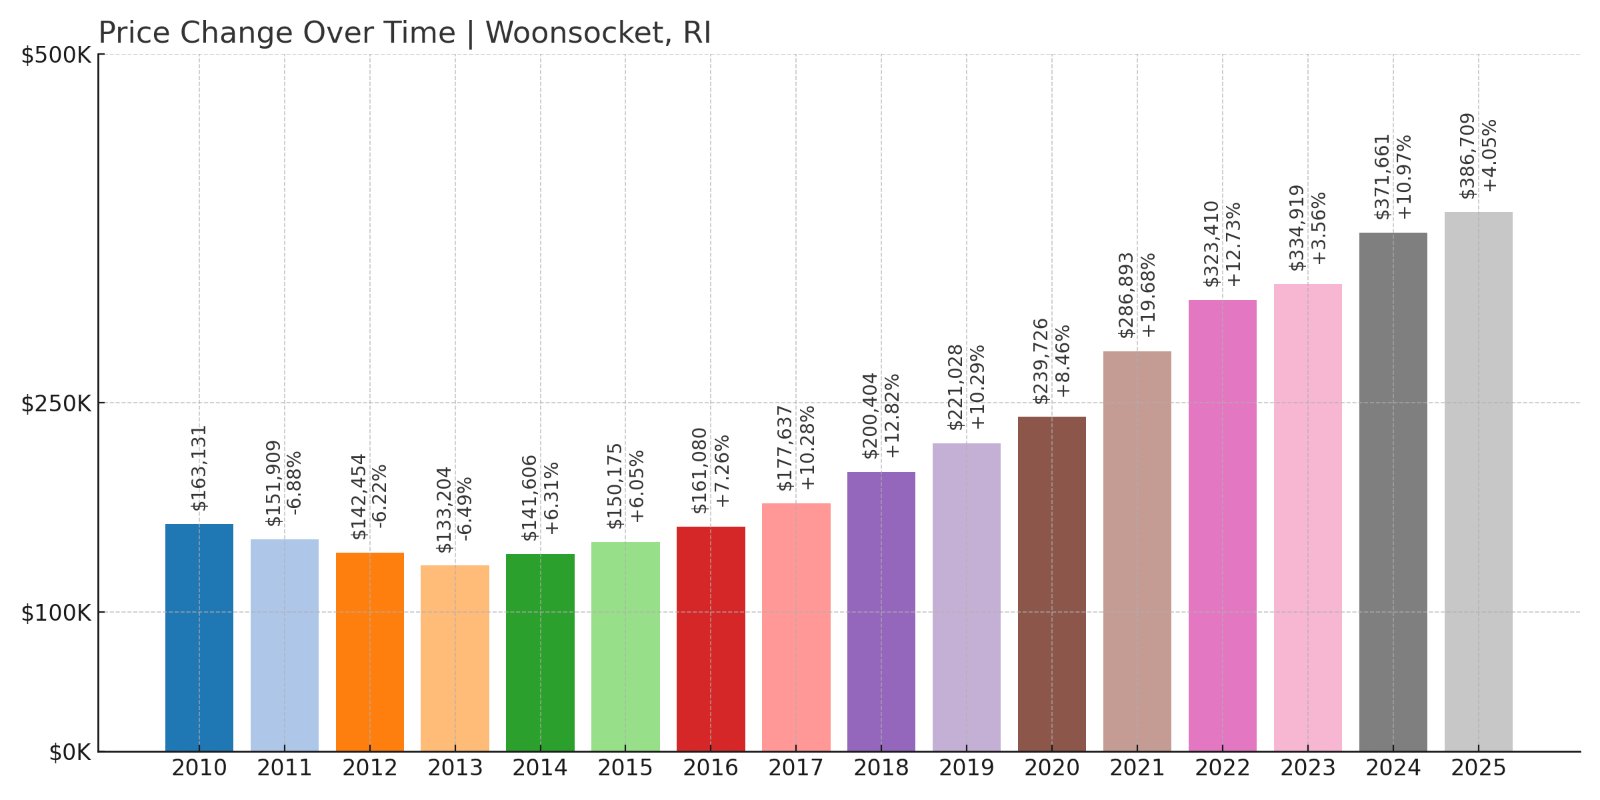
- 2010: $163,131
- 2011: $151,909 (-$11,222, -6.88% from previous year)
- 2012: $142,454 (-$9,455, -6.22% from previous year)
- 2013: $133,204 (-$9,250, -6.49% from previous year)
- 2014: $141,606 (+$8,402, +6.31% from previous year)
- 2015: $150,175 (+$8,569, +6.05% from previous year)
- 2016: $161,080 (+$10,905, +7.26% from previous year)
- 2017: $177,637 (+$16,557, +10.28% from previous year)
- 2018: $200,404 (+$22,767, +12.82% from previous year)
- 2019: $221,028 (+$20,624, +10.29% from previous year)
- 2020: $239,726 (+$18,698, +8.46% from previous year)
- 2021: $286,893 (+$47,168, +19.68% from previous year)
- 2022: $323,410 (+$36,517, +12.73% from previous year)
- 2023: $334,919 (+$11,509, +3.56% from previous year)
- 2024: $371,661 (+$36,742, +10.97% from previous year)
- 2025: $386,709 (+$15,048, +4.05% from previous year)
Woonsocket’s housing market has increased by over 170% since 2012. Despite the sharp growth, it still ranks as one of the most affordable cities in Rhode Island—an increasingly rare combination.
Woonsocket – Historic Character with Budget Appeal
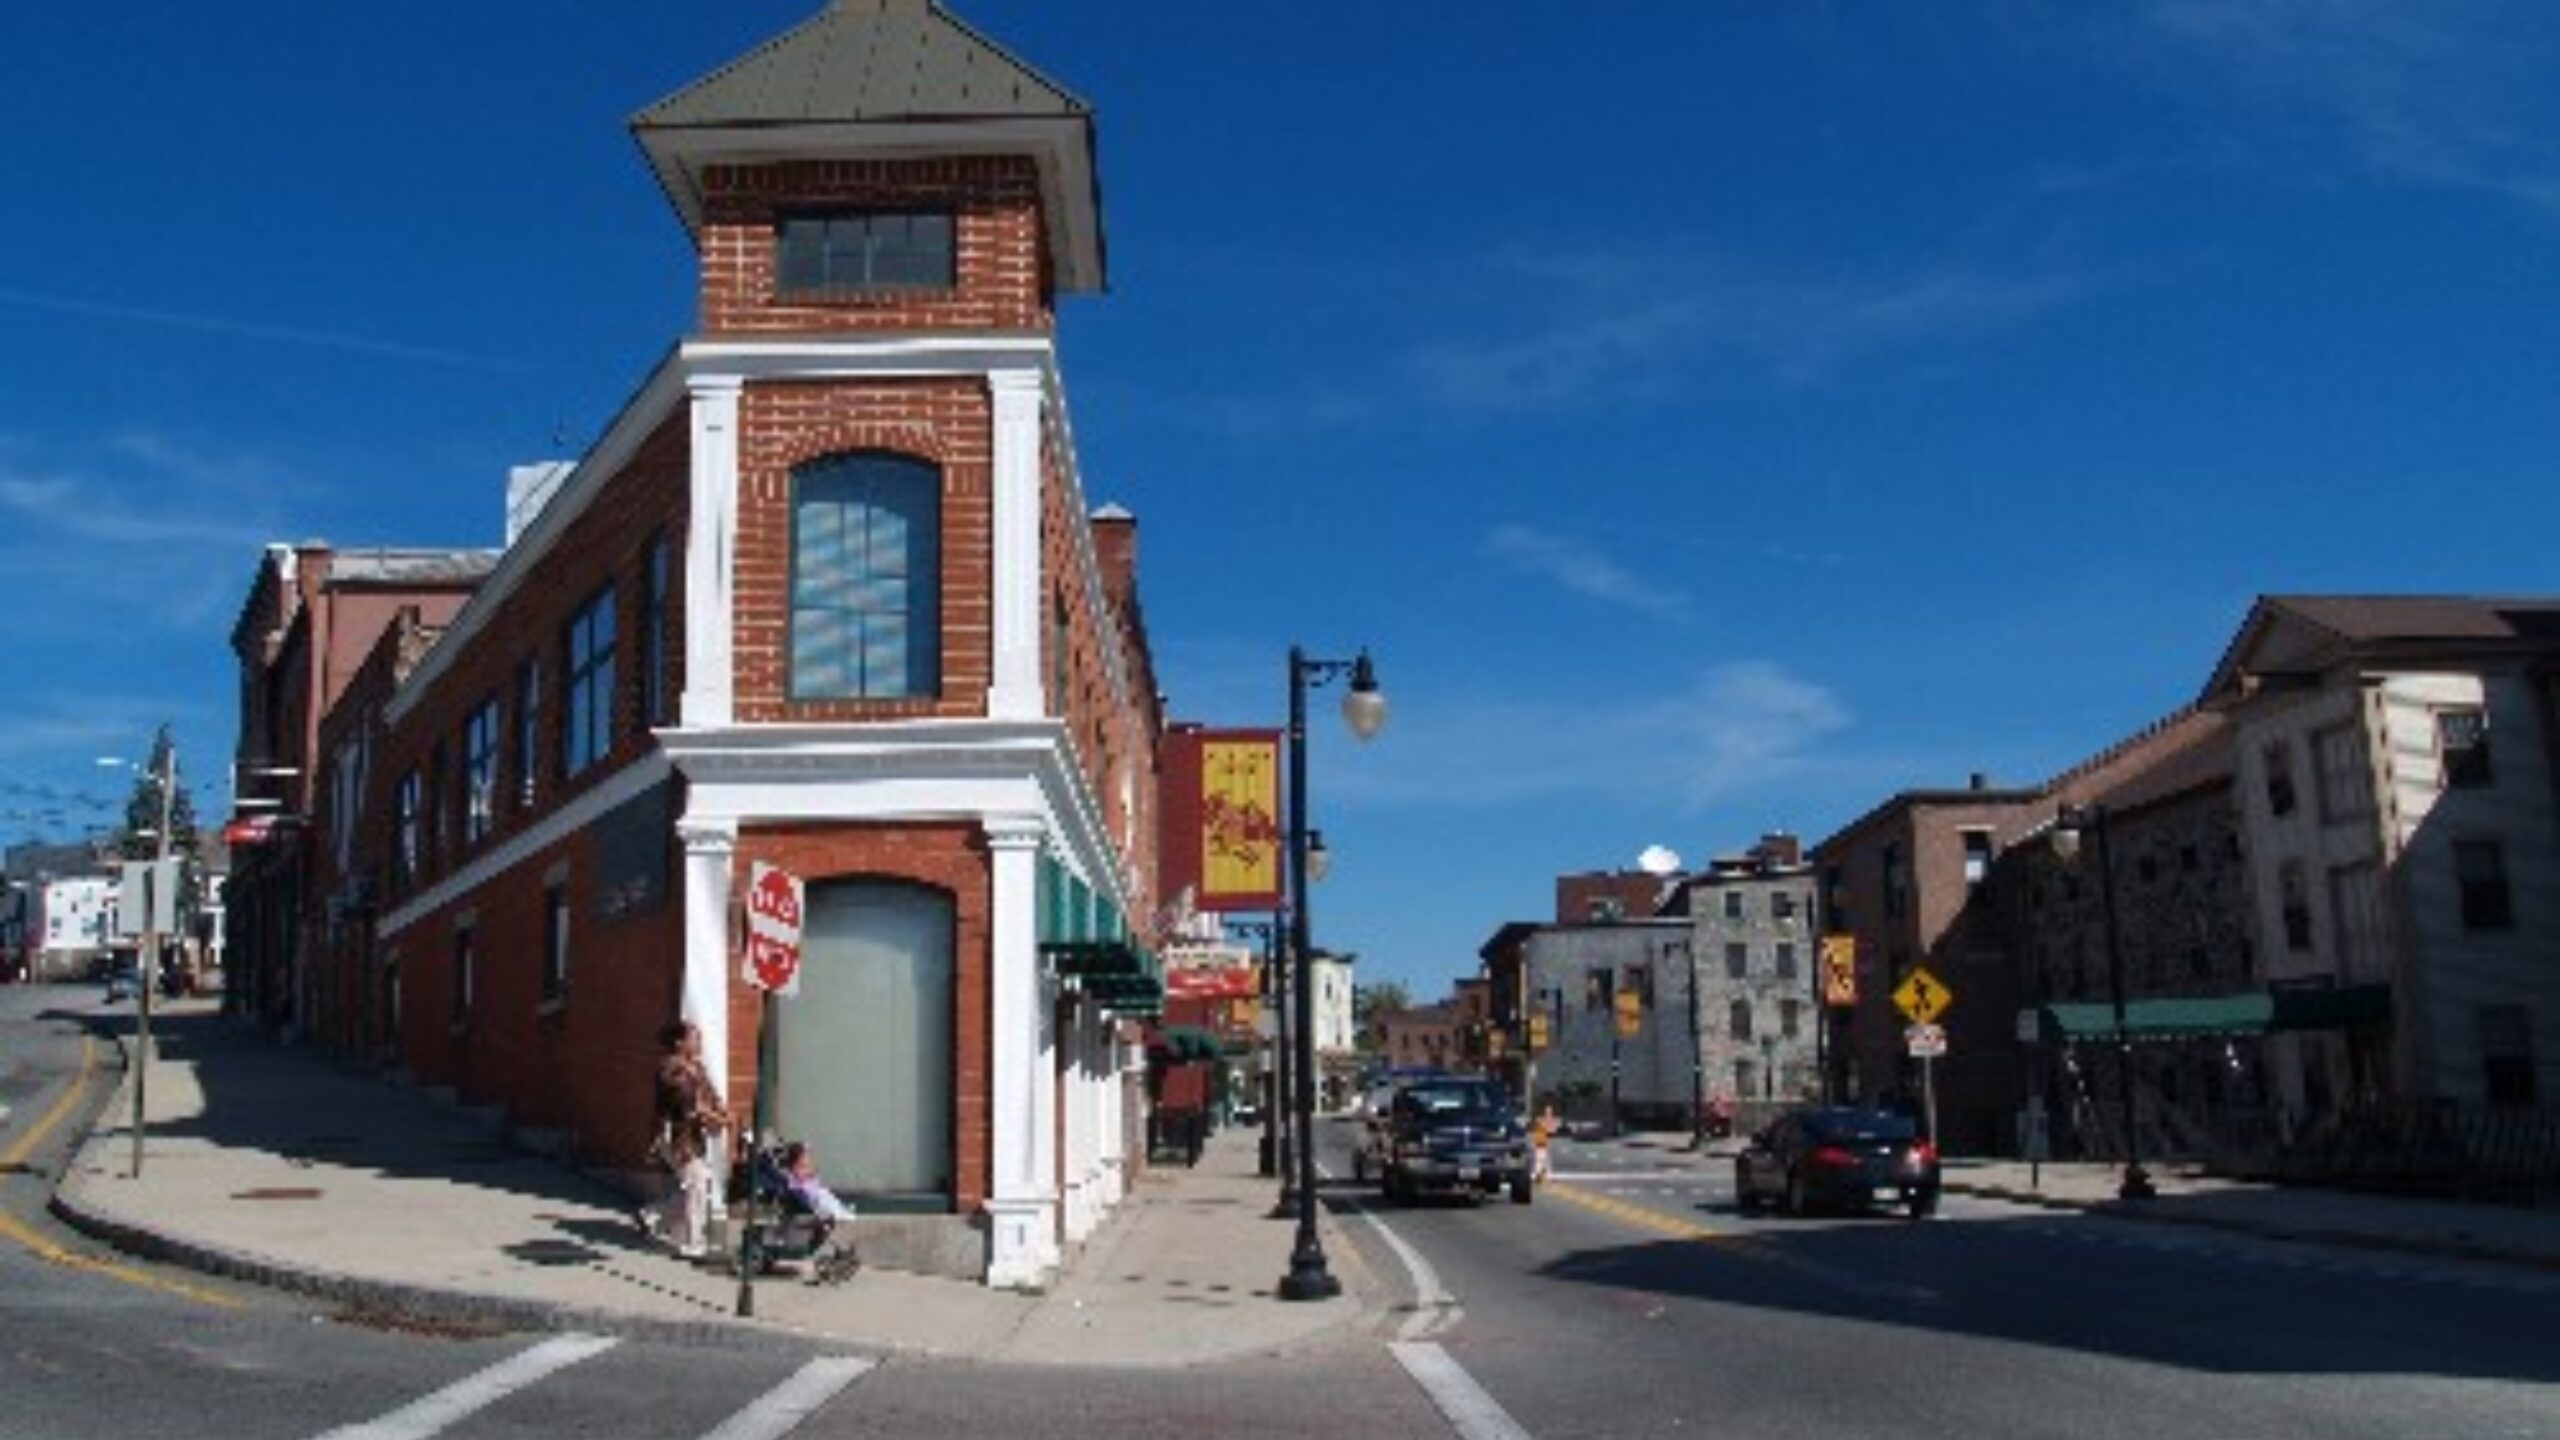
Sitting along the Blackstone River in northern Rhode Island, Woonsocket offers historic architecture, rich cultural diversity, and industrial charm. It’s home to several heritage sites, including the Museum of Work and Culture and the old mill districts that are gradually being redeveloped into housing and commercial use.
At $386,709 in 2025, Woonsocket’s median home price is still within reach for many first-time buyers. Investment in downtown revitalization and improved transit connectivity to Providence and Massachusetts has contributed to steady, long-term demand and value growth.
1. Central Falls – 167% Home Price Increase Since 2012
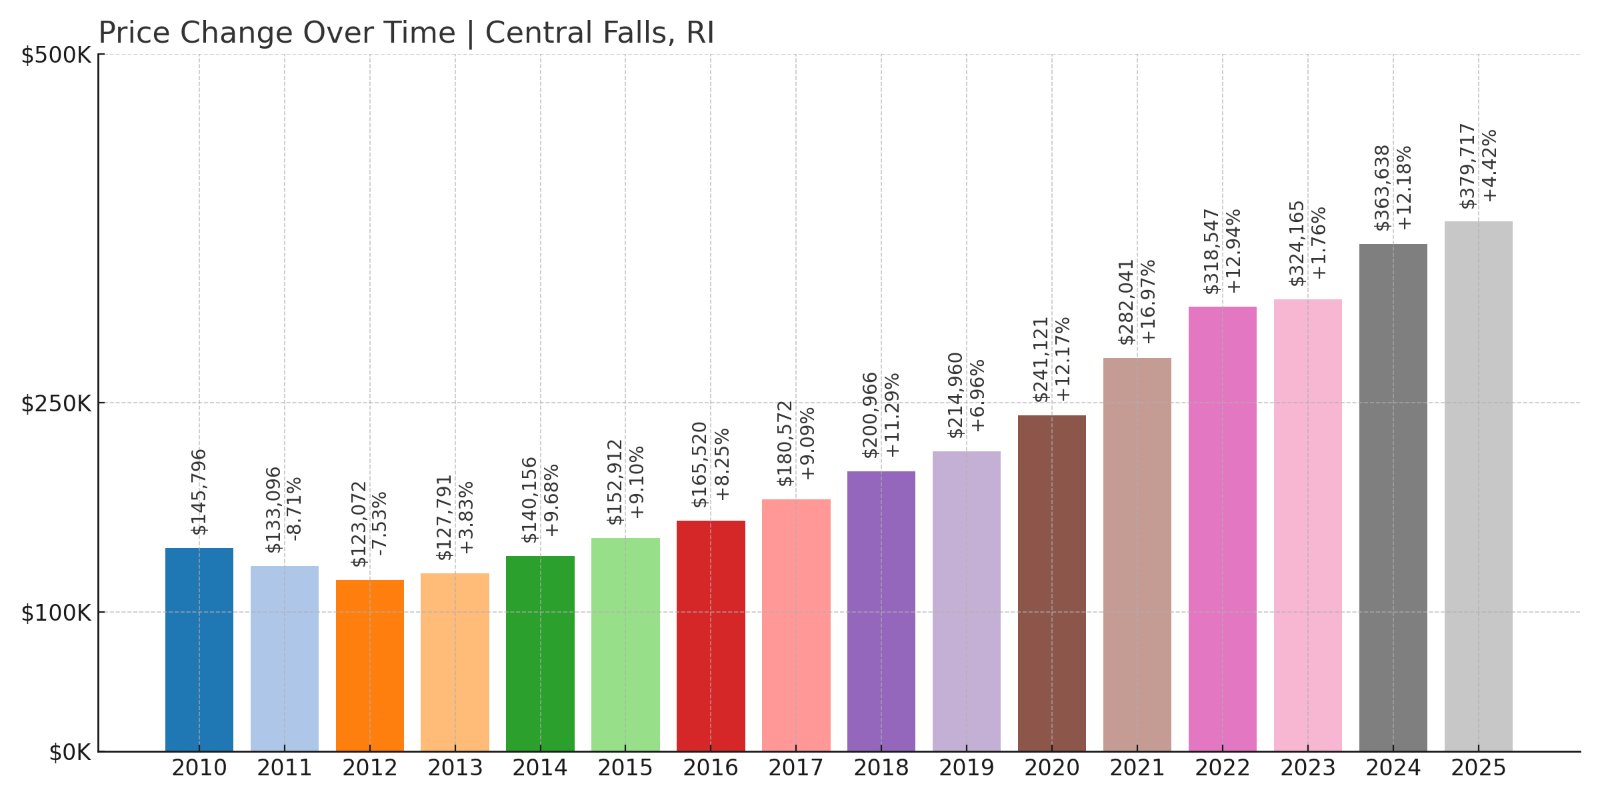
- 2010: $145,796
- 2011: $133,096 (-$12,699, -8.71% from previous year)
- 2012: $123,072 (-$10,024, -7.53% from previous year)
- 2013: $127,791 (+$4,719, +3.83% from previous year)
- 2014: $140,156 (+$12,365, +9.68% from previous year)
- 2015: $152,912 (+$12,756, +9.10% from previous year)
- 2016: $165,520 (+$12,608, +8.25% from previous year)
- 2017: $180,572 (+$15,052, +9.09% from previous year)
- 2018: $200,966 (+$20,394, +11.29% from previous year)
- 2019: $214,960 (+$13,994, +6.96% from previous year)
- 2020: $241,121 (+$26,161, +12.17% from previous year)
- 2021: $282,041 (+$40,920, +16.97% from previous year)
- 2022: $318,547 (+$36,506, +12.94% from previous year)
- 2023: $324,165 (+$5,617, +1.76% from previous year)
- 2024: $363,638 (+$39,474, +12.18% from previous year)
- 2025: $379,717 (+$16,078, +4.42% from previous year)
Central Falls tops the list with a 167% increase in home values since 2012. Even with this remarkable rise, it remains the most affordable market in the state based on 2025 median prices.
Central Falls – Rhode Island’s Most Affordable City
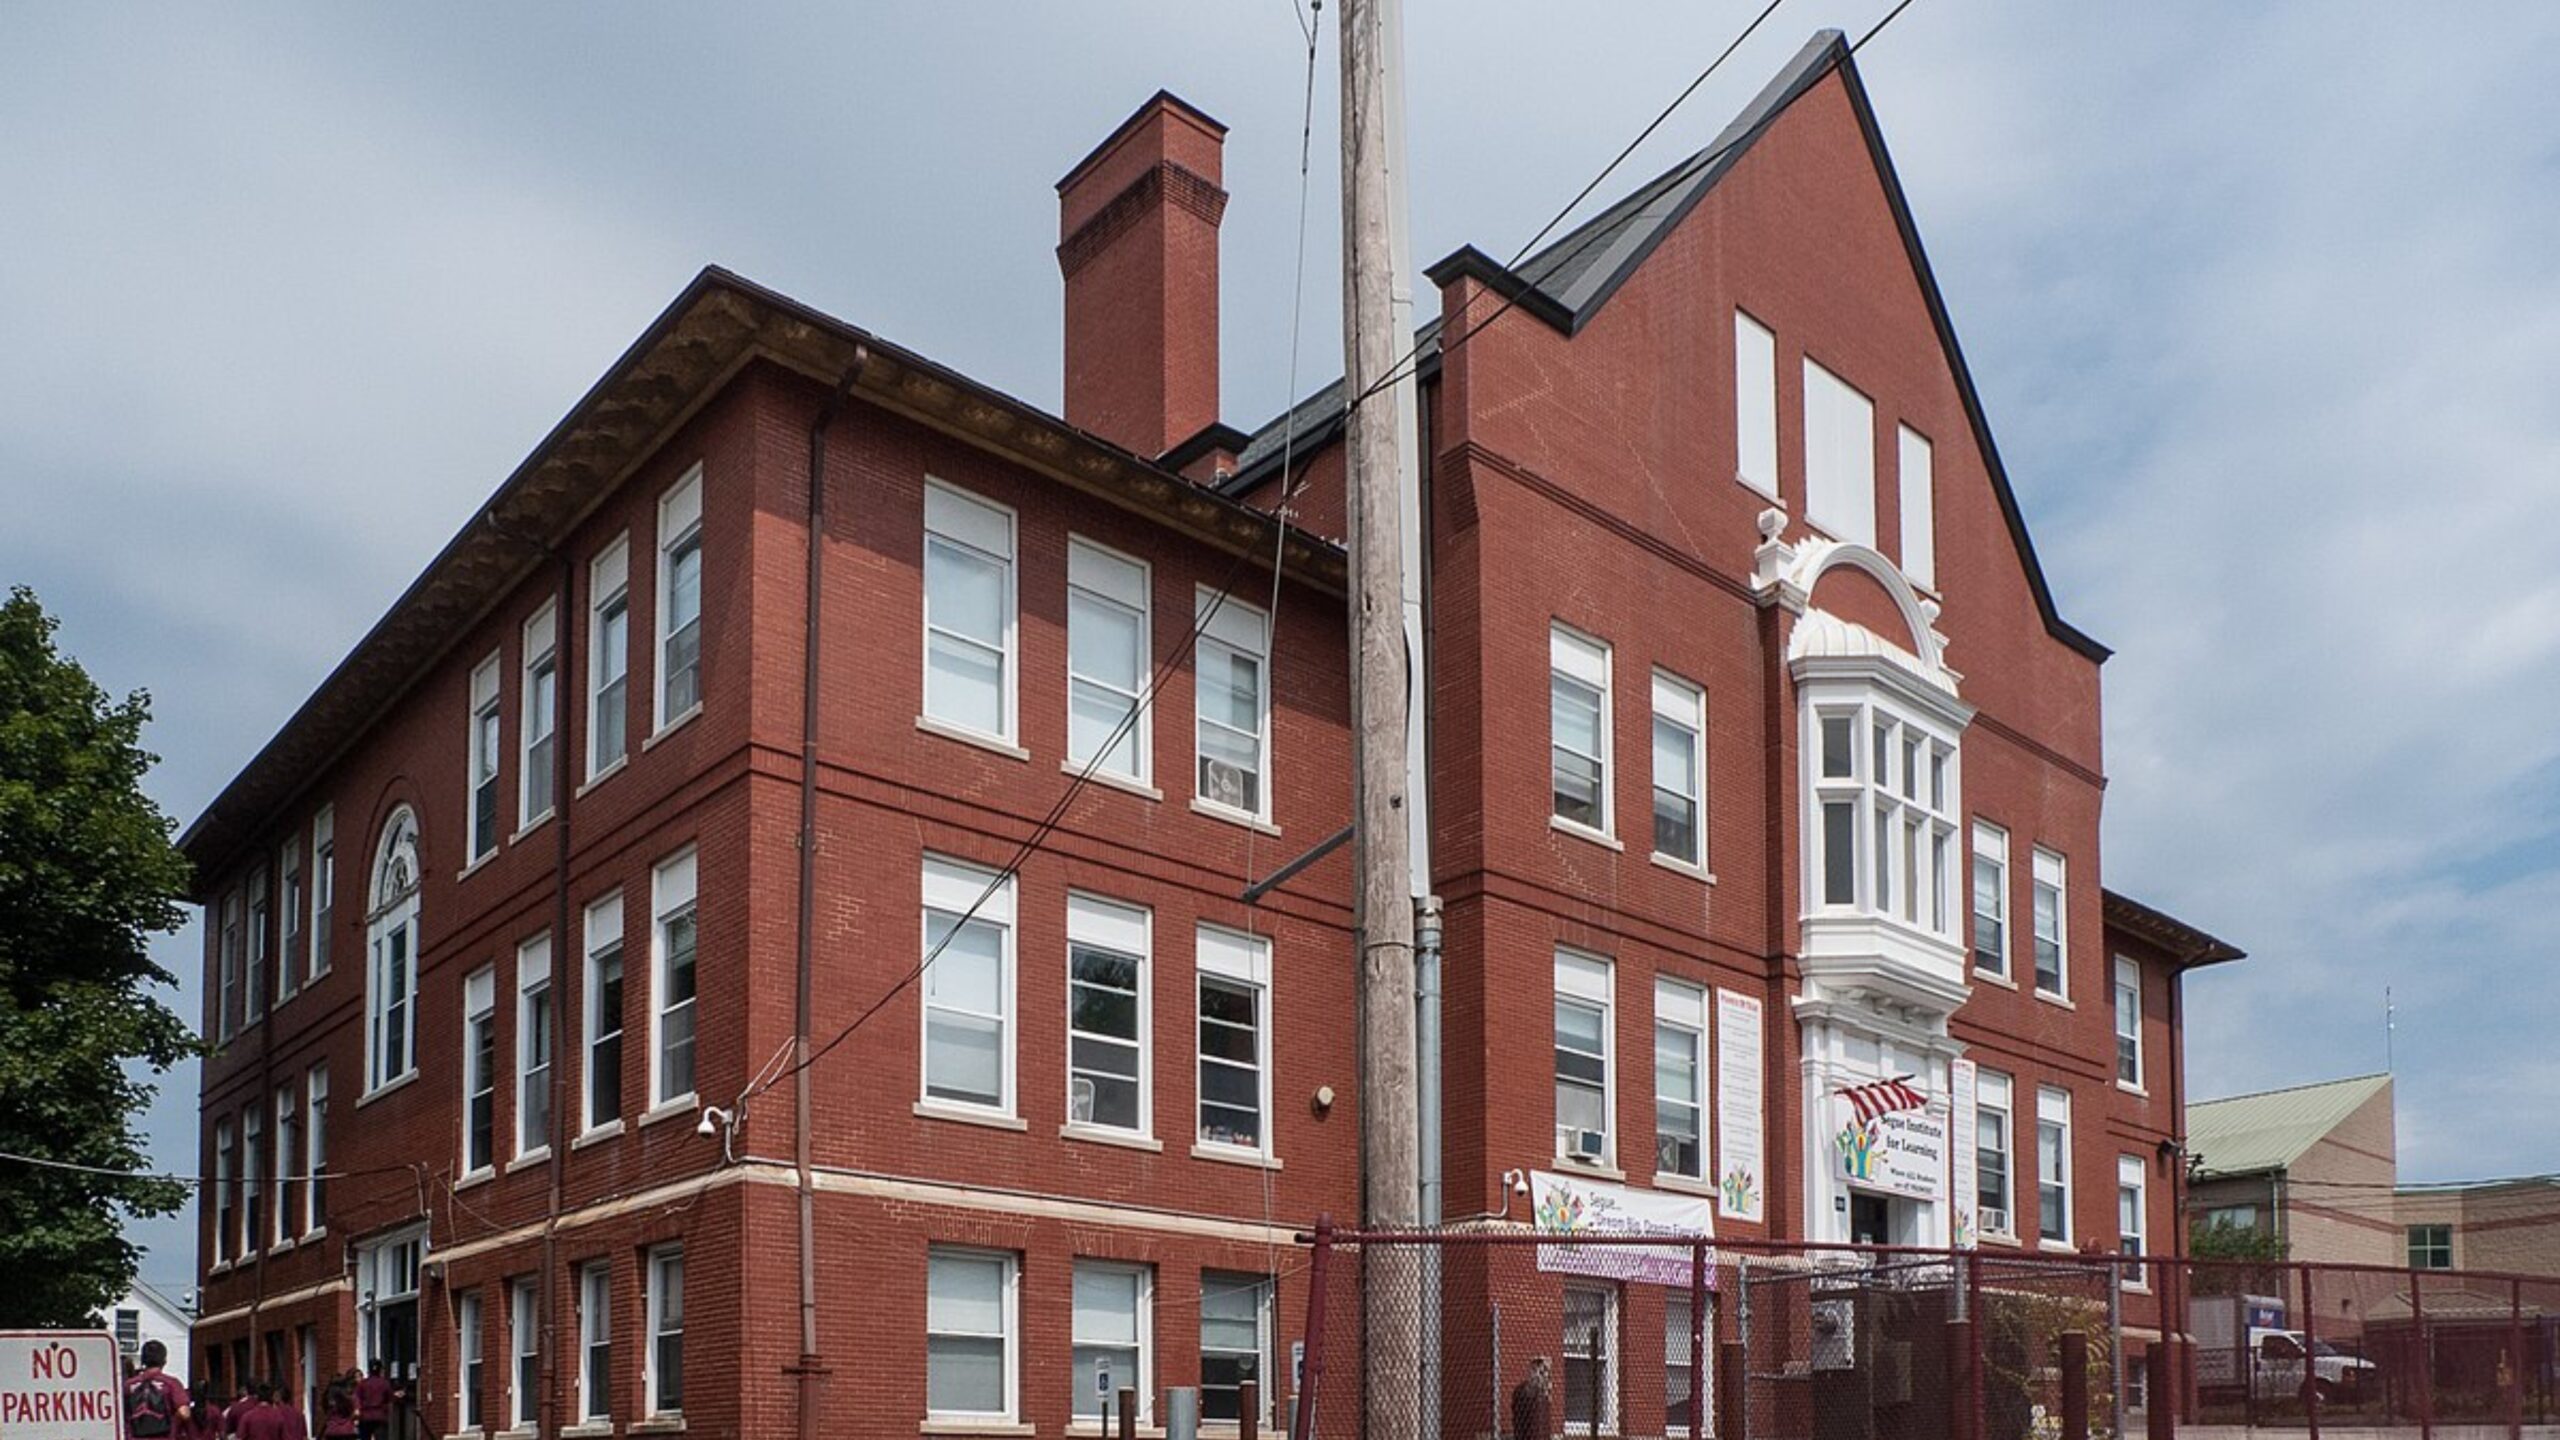
Central Falls, the smallest city by area in Rhode Island, packs a lot of community into just one square mile. Known for its vibrant cultural scene and tight-knit neighborhoods, it has seen reinvestment in schools, infrastructure, and housing over the last decade.
With a median home price of $379,717 in 2025, Central Falls remains highly affordable despite rapid appreciation. New housing developments and its location next to Pawtucket and the commuter rail corridor make it an increasingly attractive option for buyers priced out of surrounding cities.