Would you like to save this?
New York’s real estate scene may be dominated by eye-watering prices, but step outside the metro bubble and you’ll find a very different market. According to the Zillow Home Value Index, there are still 21 towns across the state where homeownership is surprisingly affordable—even dipping below $120,000 in some spots. These hidden pockets of value stretch from reinvented Rust Belt communities to peaceful hamlets that haven’t changed much in decades. If you’re looking for space, charm, and a break from big-city prices, these places deliver.
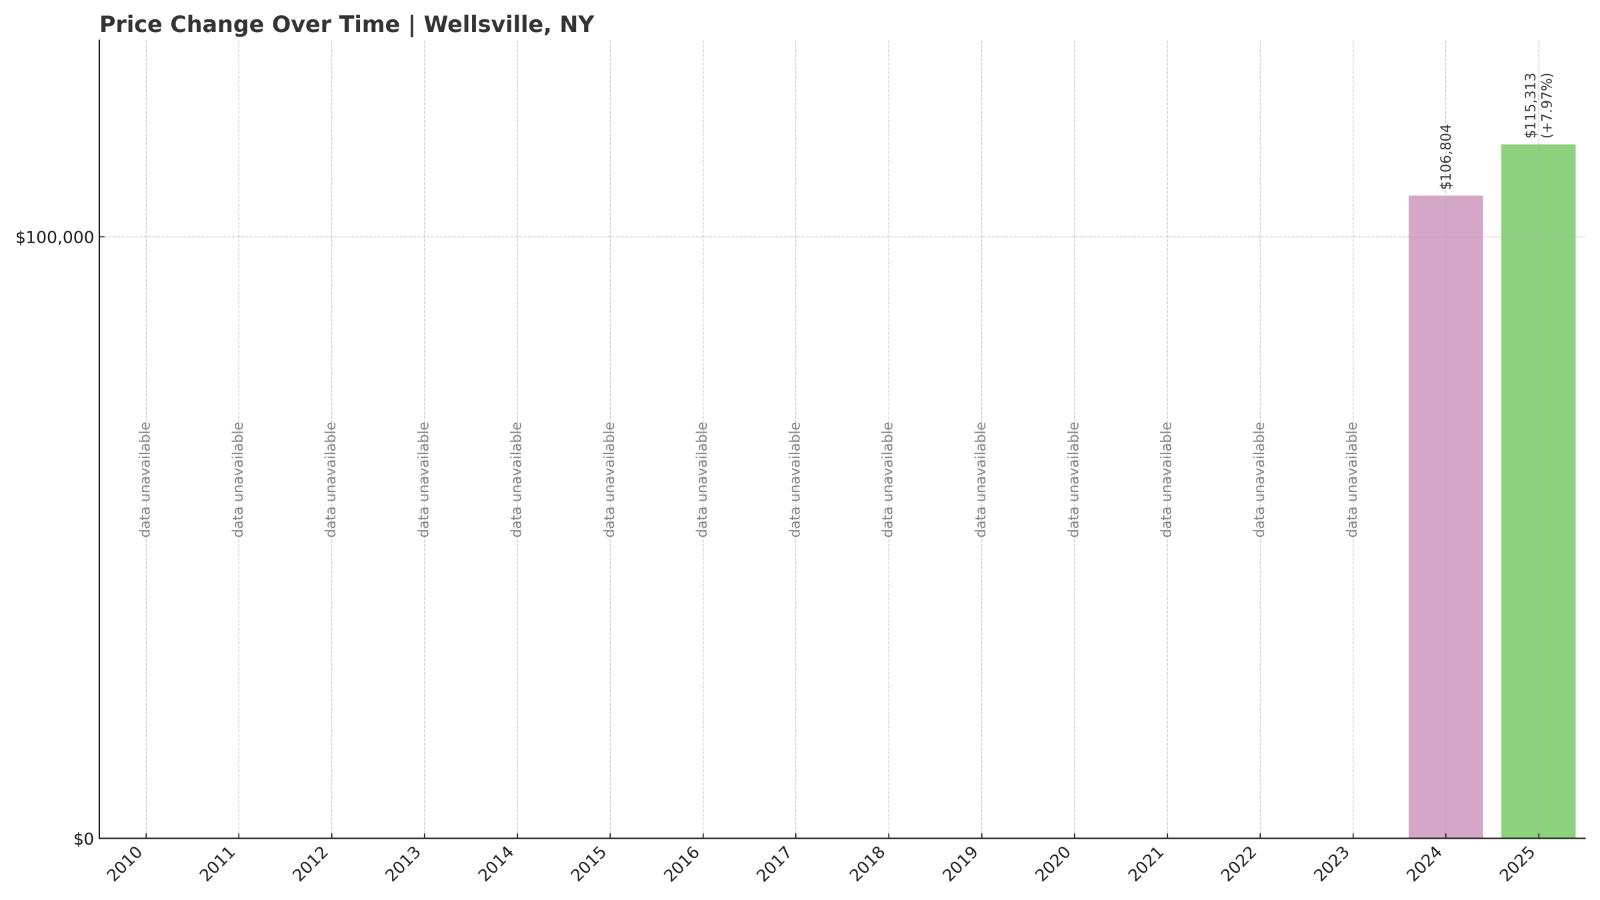
21. Wellsville – 7.97% Home Price Increase Since 2024
- 2010: N/A
- 2011: N/A
- 2012: N/A
- 2013: N/A
- 2014: N/A
- 2015: N/A
- 2016: N/A
- 2017: N/A
- 2018: N/A
- 2019: N/A
- 2020: N/A
- 2021: N/A
- 2022: N/A
- 2023: N/A
- 2024: $106,804
- 2025: $115,313 (+$8,509, +7.97% from previous year)
Wellsville’s home prices have only recently started showing up in the data, but they already place the town among the most affordable in New York. The average home value in 2025 sits at $115,313, up just under 8% from 2024. That’s still significantly lower than the state median, suggesting that affordability remains strong despite modest upward movement.
Wellsville – Low Prices in New York’s Southern Tier
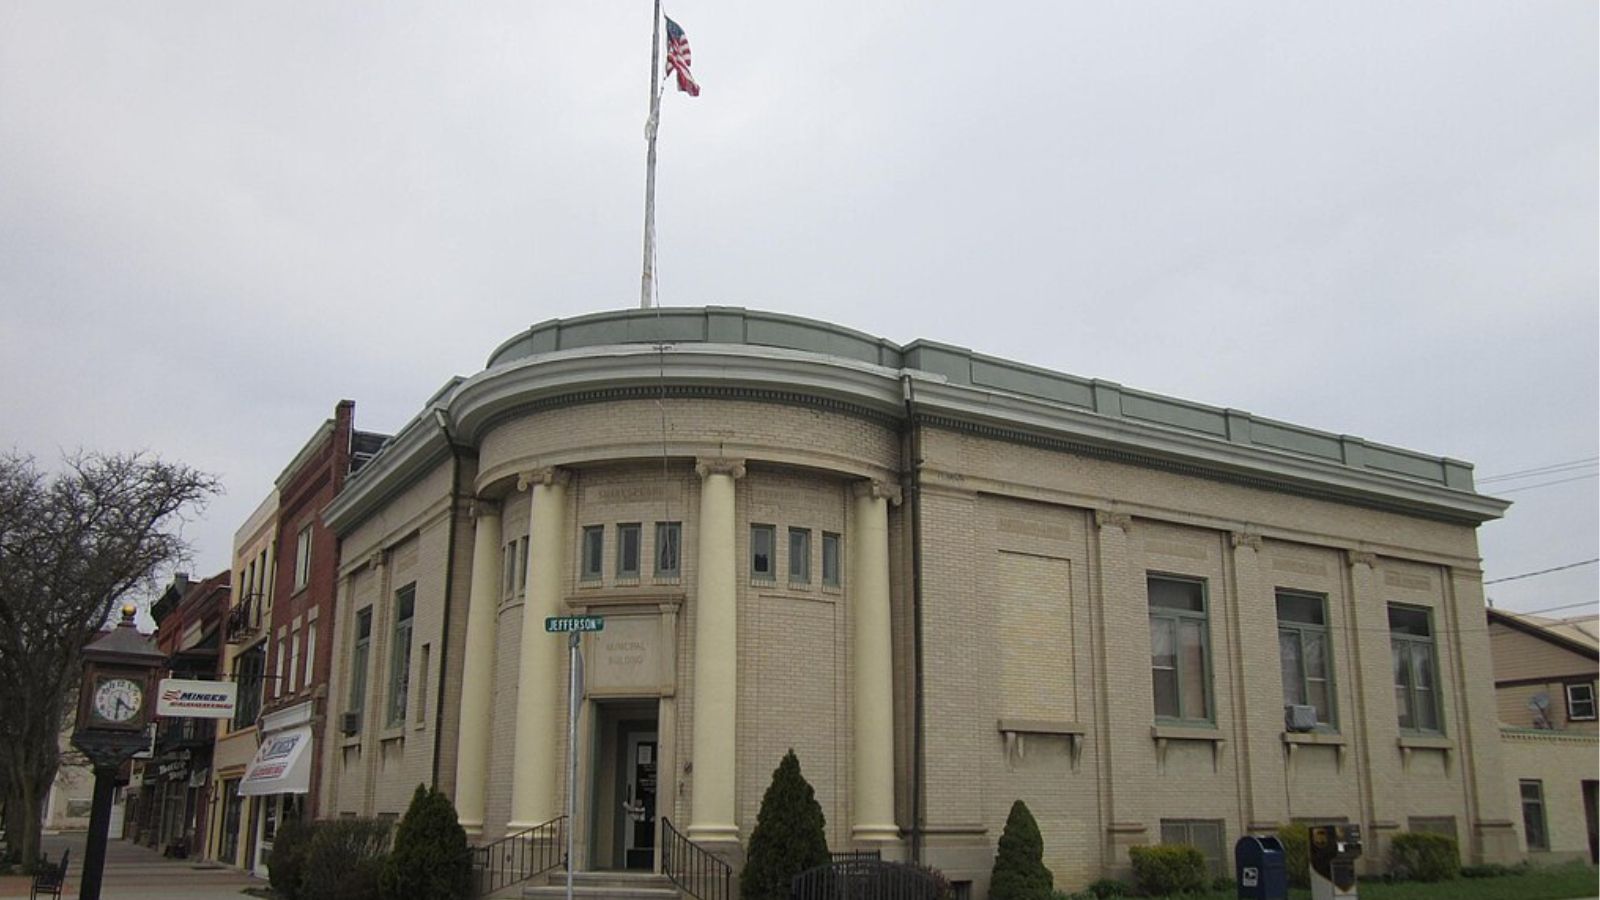
Located in Allegany County near the Pennsylvania border, Wellsville is a quiet town with a mix of historic homes and modest mid-century builds. It’s known for its small-town charm, access to outdoor recreation in the nearby Allegany State Park, and the presence of Alfred State College’s School of Applied Technology. The local economy is driven by healthcare, education, and manufacturing.
Wellsville’s housing market has remained calm in comparison to many parts of New York, and that’s partly due to limited demand from outside investors and its relative distance from major cities. The increase in home prices between 2024 and 2025 might be tied to general inflation or small-scale local interest, but the overall affordability here continues to make it a solid option for buyers seeking value.
20. Massena – 71.16% Home Price Increase Since 2010
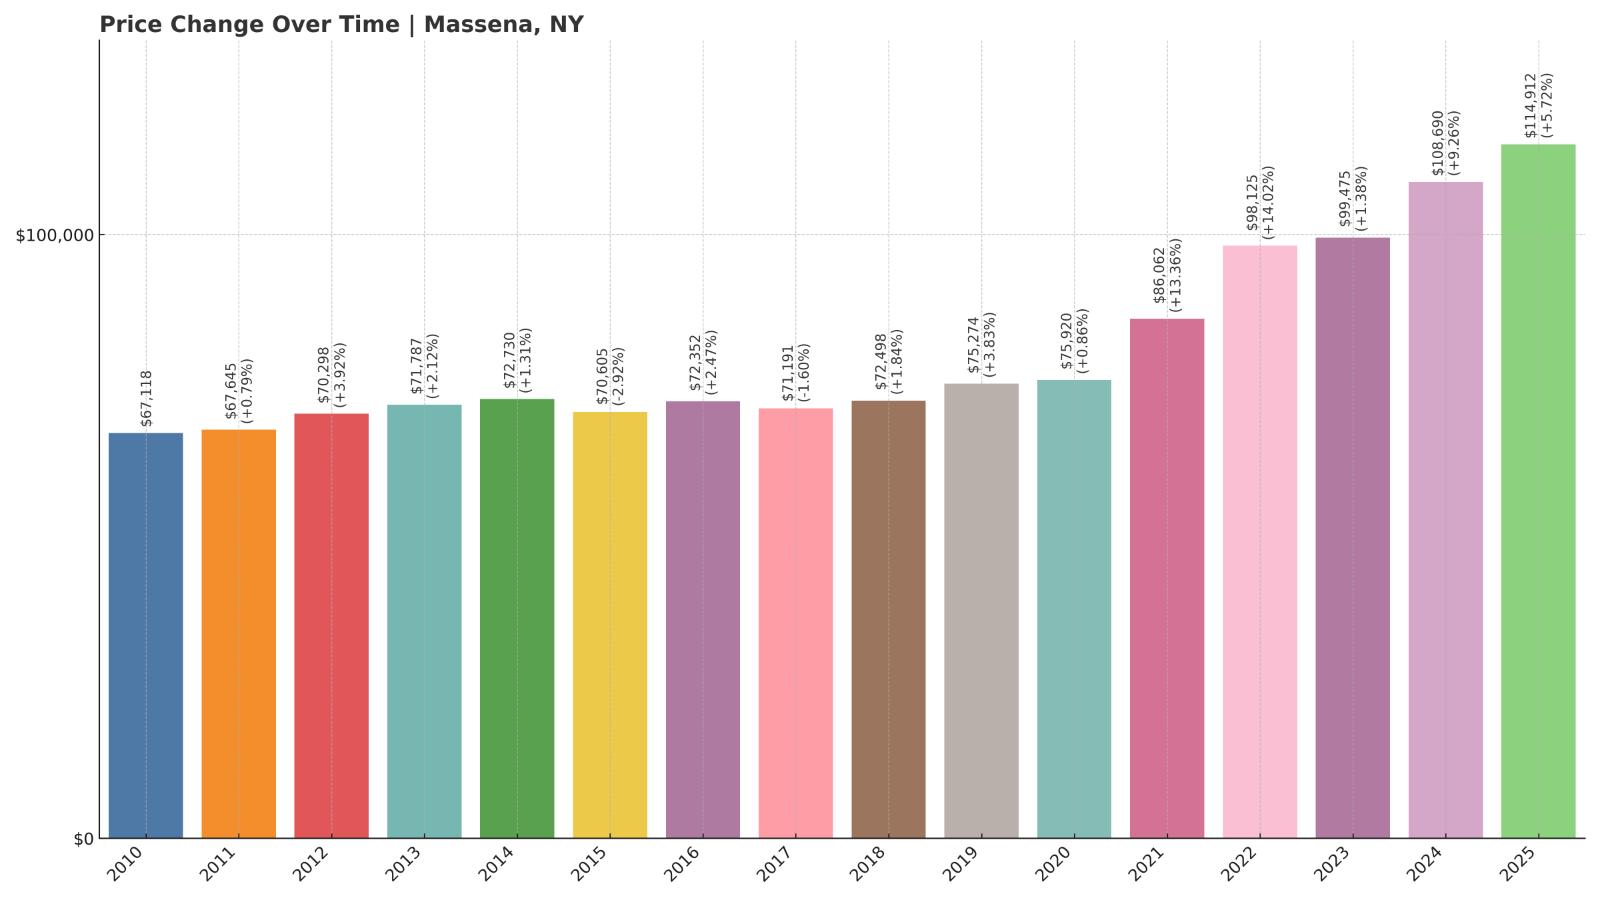
- 2010: $67,118
- 2011: $67,645 (+$528, +0.79% from previous year)
- 2012: $70,298 (+$2,652, +3.92% from previous year)
- 2013: $71,787 (+$1,489, +2.12% from previous year)
- 2014: $72,730 (+$943, +1.31% from previous year)
- 2015: $70,605 (-$2,125, -2.92% from previous year)
- 2016: $72,352 (+$1,747, +2.47% from previous year)
- 2017: $71,191 (-$1,161, -1.60% from previous year)
- 2018: $72,498 (+$1,308, +1.84% from previous year)
- 2019: $75,274 (+$2,776, +3.83% from previous year)
- 2020: $75,920 (+$645, +0.86% from previous year)
- 2021: $86,062 (+$10,143, +13.36% from previous year)
- 2022: $98,125 (+$12,063, +14.02% from previous year)
- 2023: $99,475 (+$1,351, +1.38% from previous year)
- 2024: $108,690 (+$9,214, +9.26% from previous year)
- 2025: $114,912 (+$6,222, +5.72% from previous year)
Massena’s home values have climbed steadily over the past decade, with only a few dips along the way. From $67,118 in 2010 to $114,912 in 2025, the increase has been notable, though the town still ranks among the most affordable in the state. A 5.72% rise in the past year suggests a warming market, but prices remain accessible.
Massena – Border Town with Industrial Roots

Massena, in St. Lawrence County, sits along the northern border near the St. Lawrence River and the Canadian town of Cornwall, Ontario. Once a hub for aluminum production and hydroelectric power, the area has seen economic transitions in recent decades. The town still benefits from the nearby Massena International Airport and waterway shipping routes.
Massena’s affordability is helped by its distance from major urban centers and its legacy housing stock. The housing market here is slowly gaining attention as remote workers and retirees explore cost-effective communities with good infrastructure. Continued growth could push values higher, but for now, Massena remains a reliable option for budget-conscious buyers.
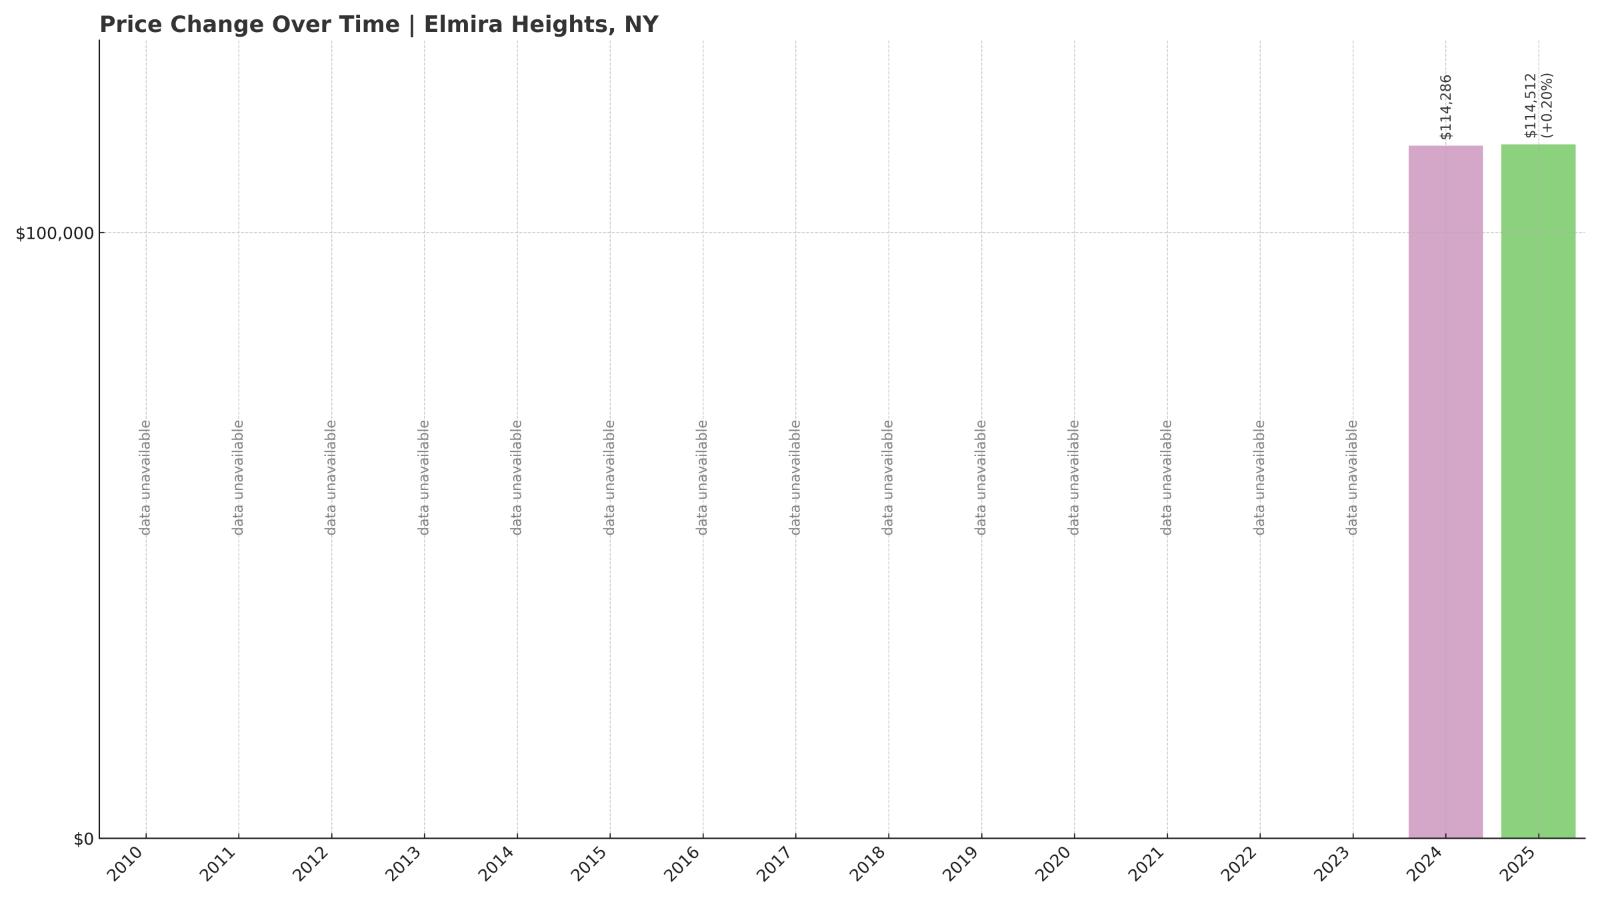
19. Elmira Heights – 0.20% Home Price Increase Since 2024
- 2010: N/A
- 2011: N/A
- 2012: N/A
- 2013: N/A
- 2014: N/A
- 2015: N/A
- 2016: N/A
- 2017: N/A
- 2018: N/A
- 2019: N/A
- 2020: N/A
- 2021: N/A
- 2022: N/A
- 2023: N/A
- 2024: $114,286
- 2025: $114,512 (+$226, +0.20% from previous year)
Elmira Heights has barely moved in terms of home price appreciation over the last year, with a marginal increase of just 0.20%. The current average home value is $114,512—unchanged in any practical sense—making this village a stable and affordable choice in the Southern Tier.
Elmira Heights – Steady Prices in a Compact Community

Located between the city of Elmira and the town of Horseheads in Chemung County, Elmira Heights offers small-town living with access to regional amenities. It has a walkable downtown, several public parks, and ties to local industries, including healthcare and education. Elmira College and Corning Incorporated are both nearby.
The market here has been flat, and that’s not necessarily a bad thing. Stability in pricing can be appealing for first-time buyers and retirees looking for predictability. With no dramatic spikes or dips, Elmira Heights represents one of the steadier markets in this list, and its affordability remains a key selling point.
18. Ogdensburg – 79.97% Home Price Increase Since 2010
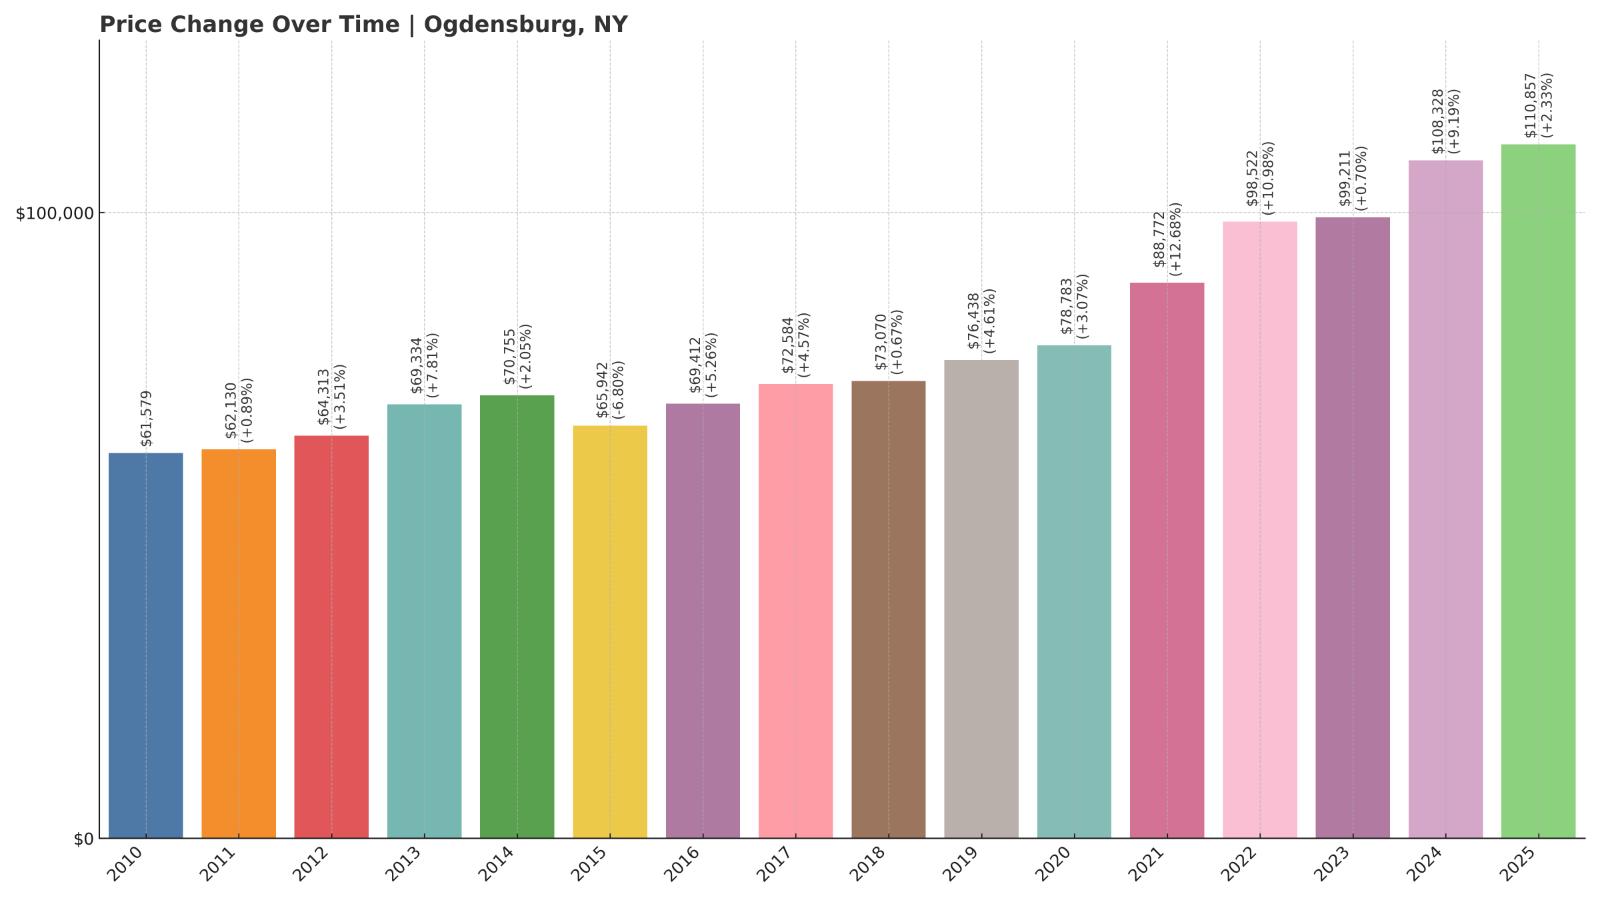
- 2010: $61,579
- 2011: $62,130 (+$550, +0.89% from previous year)
- 2012: $64,313 (+$2,184, +3.51% from previous year)
- 2013: $69,334 (+$5,020, +7.81% from previous year)
- 2014: $70,755 (+$1,422, +2.05% from previous year)
- 2015: $65,942 (-$4,813, -6.80% from previous year)
- 2016: $69,412 (+$3,470, +5.26% from previous year)
- 2017: $72,584 (+$3,172, +4.57% from previous year)
- 2018: $73,070 (+$486, +0.67% from previous year)
- 2019: $76,438 (+$3,368, +4.61% from previous year)
- 2020: $78,783 (+$2,346, +3.07% from previous year)
- 2021: $88,772 (+$9,989, +12.68% from previous year)
- 2022: $98,522 (+$9,750, +10.98% from previous year)
- 2023: $99,211 (+$689, +0.70% from previous year)
- 2024: $108,328 (+$9,118, +9.19% from previous year)
- 2025: $110,857 (+$2,529, +2.33% from previous year)
Home values in Ogdensburg have risen nearly 80% since 2010, but they’re still modest. At $110,857 in 2025, homes remain among the cheapest statewide. Annual gains have cooled from the surges seen in 2021 and 2022, with a more typical 2.33% uptick this year.
Ogdensburg – Riverside Affordability with Historic Character

Ogdensburg sits along the banks of the St. Lawrence River in the state’s far north. Its historic downtown, scenic waterfront, and proximity to Canada make it unique among New York towns. Though its economy has faced challenges, especially with manufacturing loss, housing prices have stayed remarkably low.
The town has seen recent efforts to revitalize its downtown and attract tourism through cultural offerings like the Frederic Remington Art Museum. Affordable home values and a strong sense of place keep Ogdensburg on the radar for those who don’t mind cold winters and want a riverside home without the high price tag.
17. Fort Jackson – 71.39% Home Price Increase Since 2010
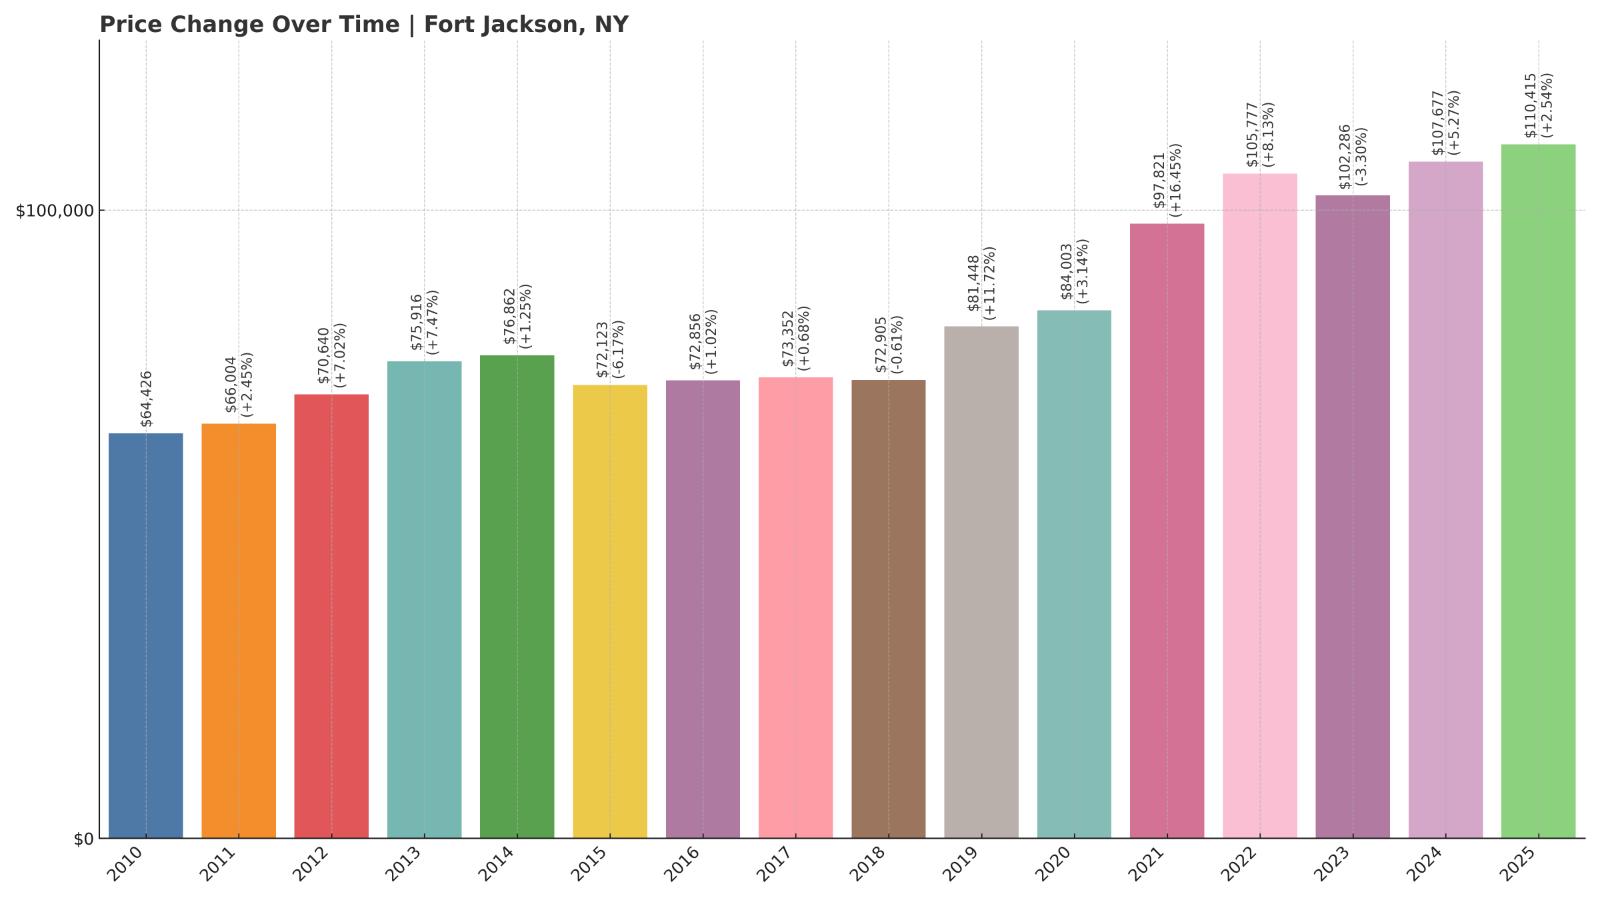
- 2010: $64,426
- 2011: $66,004 (+$1,579, +2.45% from previous year)
- 2012: $70,640 (+$4,636, +7.02% from previous year)
- 2013: $75,916 (+$5,275, +7.47% from previous year)
- 2014: $76,862 (+$946, +1.25% from previous year)
- 2015: $72,123 (-$4,739, -6.17% from previous year)
- 2016: $72,856 (+$733, +1.02% from previous year)
- 2017: $73,352 (+$496, +0.68% from previous year)
- 2018: $72,905 (-$447, -0.61% from previous year)
- 2019: $81,448 (+$8,543, +11.72% from previous year)
- 2020: $84,003 (+$2,555, +3.14% from previous year)
- 2021: $97,821 (+$13,818, +16.45% from previous year)
- 2022: $105,777 (+$7,956, +8.13% from previous year)
- 2023: $102,286 (-$3,491, -3.30% from previous year)
- 2024: $107,677 (+$5,391, +5.27% from previous year)
- 2025: $110,415 (+$2,738, +2.54% from previous year)
Fort Jackson’s home values have seen a bumpy ride, but overall prices have risen by more than 70% since 2010. Despite that, the average home now sits at just $110,415. Moderate growth this year follows a small dip in 2023, reflecting a return to steadier conditions.
Fort Jackson – Tucked Away in the North Country

Fort Jackson is a quiet hamlet in St. Lawrence County, not far from Potsdam and the Adirondack foothills. With little commercial development and a primarily residential character, it offers peace and simplicity. Many homes are older farmhouses or modest single-family builds.
The area has seen fluctuating home values in the past decade, likely tied to broader economic shifts and limited housing stock. Prices rebounded in 2024 and 2025, keeping Fort Jackson in the affordable category. Its appeal lies in its seclusion and slow pace, ideal for those seeking space and solitude on a tight budget.
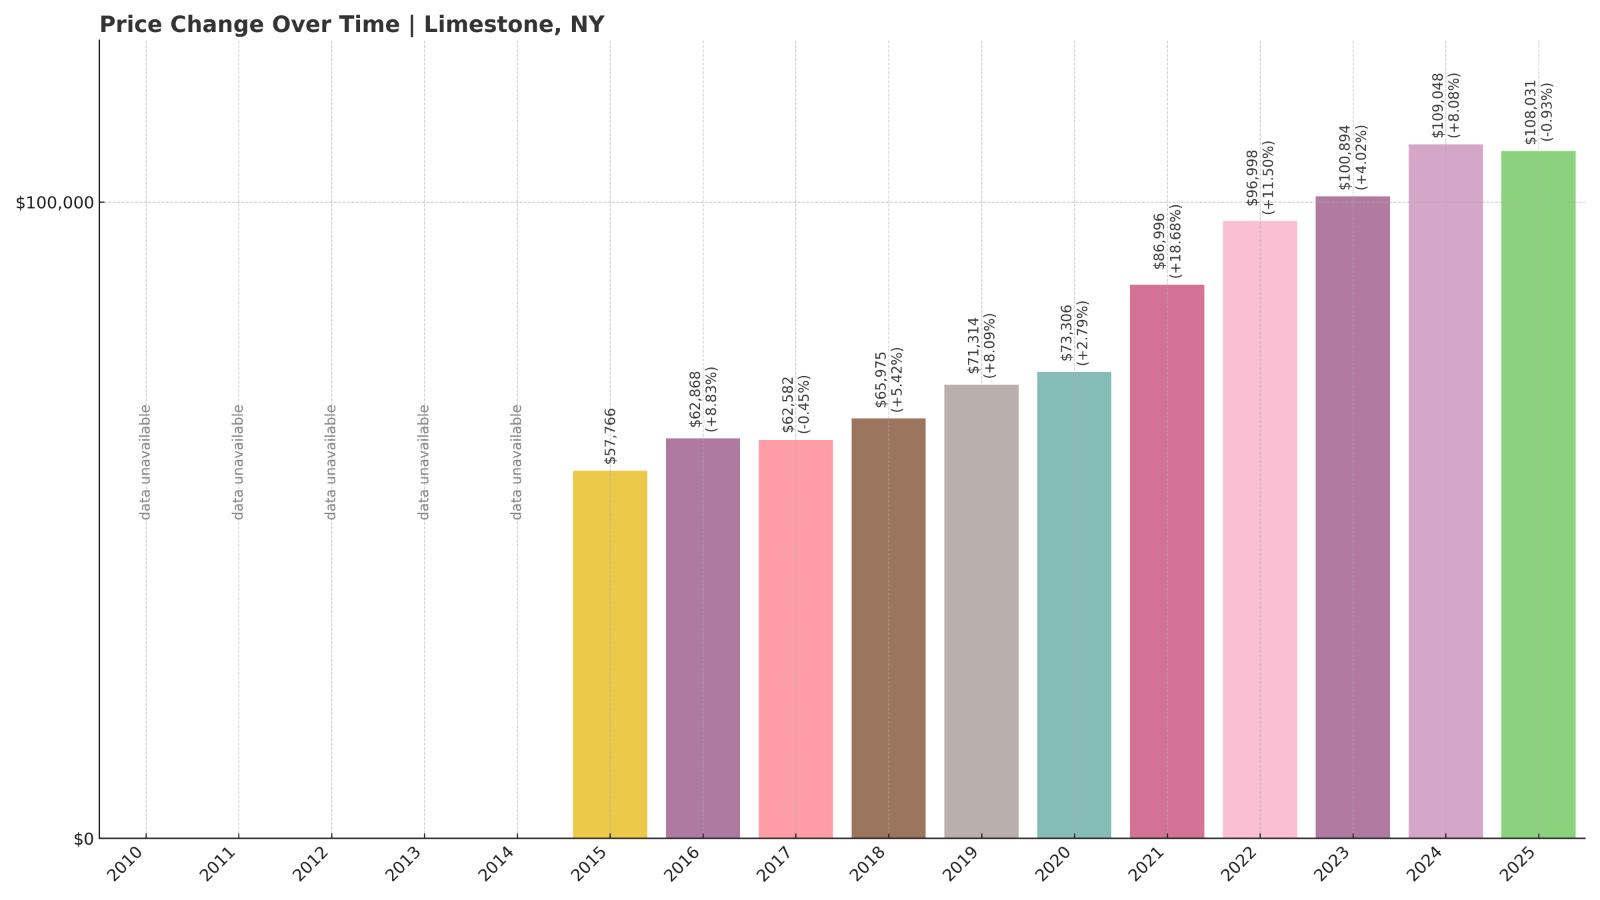
16. Limestone – 86.93% Home Price Increase Since 2015
- 2010: N/A
- 2011: N/A
- 2012: N/A
- 2013: N/A
- 2014: N/A
- 2015: $57,766
- 2016: $62,868 (+$5,102, +8.83% from previous year)
- 2017: $62,582 (-$287, -0.46% from previous year)
- 2018: $65,975 (+$3,394, +5.42% from previous year)
- 2019: $71,314 (+$5,338, +8.09% from previous year)
- 2020: $73,306 (+$1,992, +2.79% from previous year)
- 2021: $86,996 (+$13,690, +18.67% from previous year)
- 2022: $96,998 (+$10,002, +11.50% from previous year)
- 2023: $100,894 (+$3,897, +4.02% from previous year)
- 2024: $109,048 (+$8,154, +8.08% from previous year)
- 2025: $108,031 (-$1,017, -0.93% from previous year)
Limestone’s home values have surged nearly 87% since 2015, though the most recent year saw a slight decline of just under 1%. With a 2025 average home value of $108,031, the town remains firmly in the affordable bracket, even after years of steady appreciation.
Limestone – Small Village with Big Value

Just north of the Pennsylvania border, Limestone is a quiet hamlet in Cattaraugus County that borders the Allegheny National Forest. The village is rural, with an economy largely rooted in agriculture and local services. Its location provides access to outdoor recreation while remaining far removed from city sprawl.
Recent increases in home values appear to be leveling off, suggesting that the local market may be reaching a plateau. Still, affordability remains a key trait, and the relatively low price point combined with access to nature could make Limestone attractive for buyers seeking a peaceful setting without the price premium of nearby resort areas.
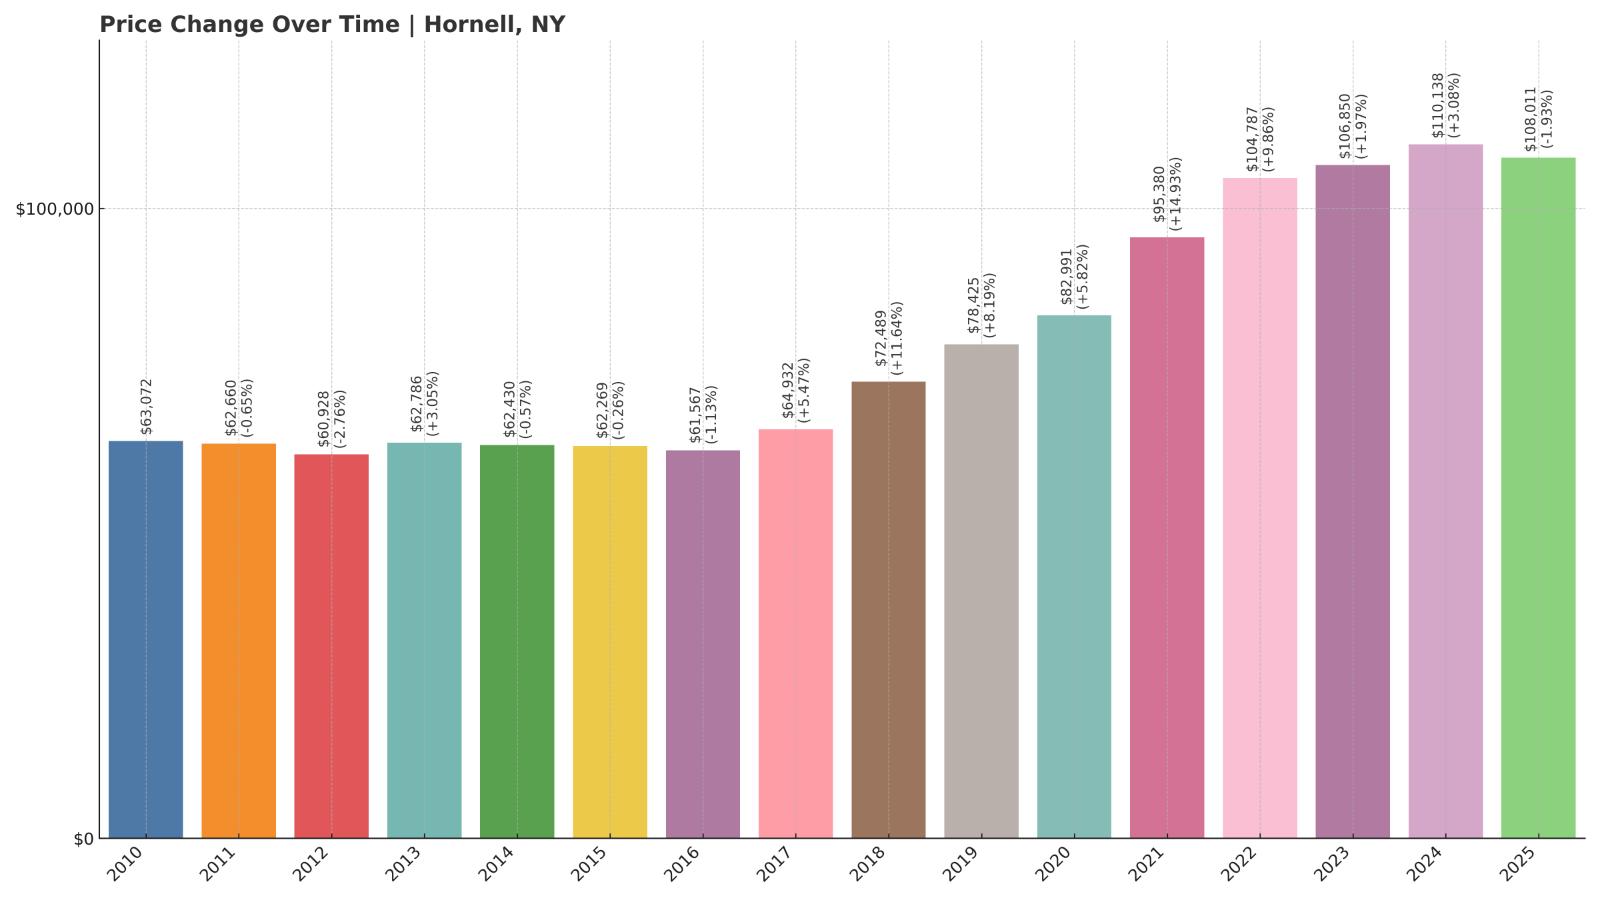
15. Hornell – 71.23% Home Price Increase Since 2010
Would you like to save this?
- 2010: $63,072
- 2011: $62,660 (-$412, -0.65% from previous year)
- 2012: $60,928 (-$1,732, -2.76% from previous year)
- 2013: $62,786 (+$1,858, +3.05% from previous year)
- 2014: $62,430 (-$356, -0.57% from previous year)
- 2015: $62,269 (-$161, -0.26% from previous year)
- 2016: $61,567 (-$702, -1.13% from previous year)
- 2017: $64,932 (+$3,365, +5.47% from previous year)
- 2018: $72,489 (+$7,557, +11.64% from previous year)
- 2019: $78,425 (+$5,935, +8.19% from previous year)
- 2020: $82,991 (+$4,567, +5.82% from previous year)
- 2021: $95,380 (+$12,389, +14.93% from previous year)
- 2022: $104,787 (+$9,407, +9.86% from previous year)
- 2023: $106,850 (+$2,063, +1.97% from previous year)
- 2024: $110,138 (+$3,288, +3.08% from previous year)
- 2025: $108,011 (-$2,127, -1.93% from previous year)
Hornell has seen more than 70% growth in home values since 2010, with particularly sharp increases in the late 2010s and early 2020s. However, prices dipped slightly in 2025, landing at $108,011. That minor retreat doesn’t overshadow the long-term trend, which has been steadily upward.
Hornell – Southern Tier Affordability with Urban Perks

Hornell is a small city in Steuben County with a history rooted in the railroad industry. While those days are long gone, the town has remained relevant thanks to its proximity to Alfred University and continued investment in downtown revitalization. Local employers include Alstom, which operates a train manufacturing facility.
Despite being classified as a city, Hornell offers very affordable housing compared to statewide norms. Its combination of infrastructure, public transportation access, and walkable neighborhoods makes it a rare find for budget-conscious buyers seeking urban conveniences without urban prices.
14. Friendship – 11.43% Home Price Increase Since 2024

- 2010: N/A
- 2011: N/A
- 2012: N/A
- 2013: N/A
- 2014: N/A
- 2015: N/A
- 2016: N/A
- 2017: N/A
- 2018: N/A
- 2019: N/A
- 2020: N/A
- 2021: N/A
- 2022: N/A
- 2023: N/A
- 2024: $96,373
- 2025: $107,393 (+$11,020, +11.43% from previous year)
Friendship experienced a sizable jump in home prices between 2024 and 2025, rising more than 11%. Even with that increase, the average value remains low at just over $107,000, keeping it in reach for many homebuyers looking for affordability.
Friendship – A Fitting Name for a Welcoming Town

Nestled in Allegany County along Interstate 86, Friendship is a small rural town with a strong sense of local identity. It’s surrounded by farmland and forested hills, and it has historically drawn residents looking for quiet, community-focused living. The area is known for its low crime rates and slow pace of life.
Home prices have stayed relatively stable here until recently. The double-digit increase may be due to increased interest from remote workers and retirees seeking low-cost property in peaceful locations. Despite this uptick, Friendship continues to offer strong value for buyers who prioritize affordability over proximity to major cities.
13. Whitesville – 6.93% Home Price Increase Since 2024

- 2010: N/A
- 2011: N/A
- 2012: N/A
- 2013: N/A
- 2014: N/A
- 2015: N/A
- 2016: N/A
- 2017: N/A
- 2018: N/A
- 2019: N/A
- 2020: N/A
- 2021: N/A
- 2022: N/A
- 2023: N/A
- 2024: $99,910
- 2025: $106,834 (+$6,924, +6.93% from previous year)
Whitesville’s home values increased by nearly 7% in 2025, bringing the average value to $106,834. Although price data is limited to the past two years, the town is clearly trending upward while remaining affordable compared to most parts of the state.
Whitesville – A Quiet Community in the Allegheny Foothills

Whitesville, located in the southeastern corner of Allegany County, is a tiny hamlet with fewer than 1,000 residents. It lies near the Pennsylvania border and offers secluded living surrounded by rolling hills and scenic countryside. The town is largely residential, with a handful of small businesses and essential services.


The relatively low home prices and minimal commercial development suggest a stable, slow-moving real estate market. The recent jump in values could be driven by out-of-area interest or increased sales activity, but prices remain low enough to appeal to first-time buyers or those seeking a rural second home.
12. Canaseraga – 52.32% Home Price Increase Since 2010
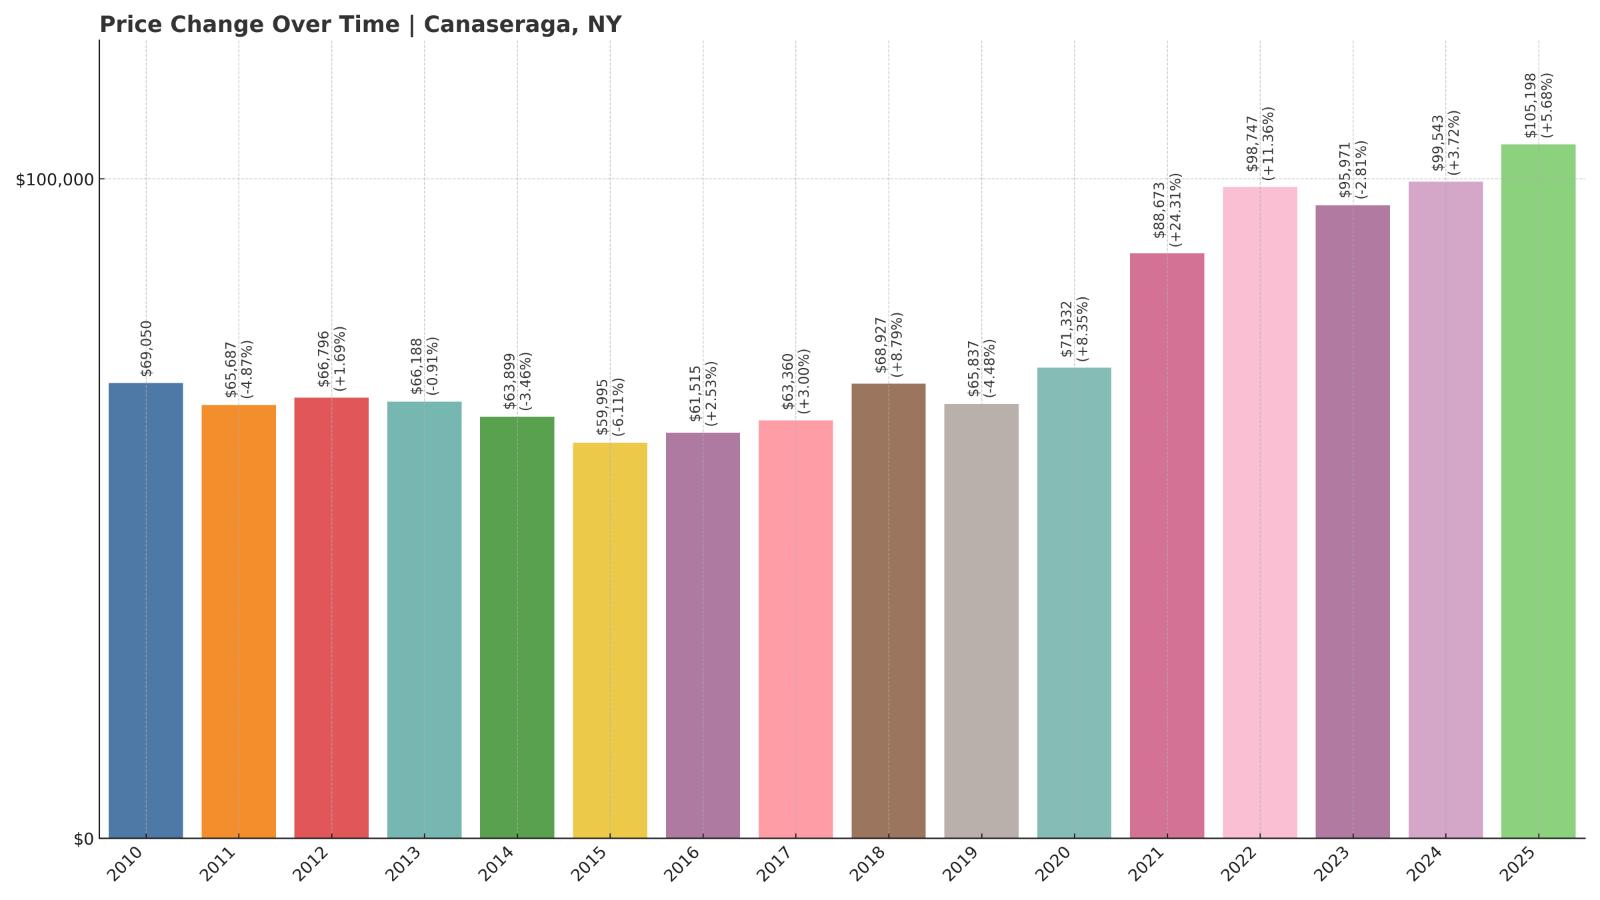
- 2010: $69,050
- 2011: $65,687 (-$3,364, -4.87% from previous year)
- 2012: $66,796 (+$1,110, +1.69% from previous year)
- 2013: $66,188 (-$608, -0.91% from previous year)
- 2014: $63,899 (-$2,289, -3.46% from previous year)
- 2015: $59,995 (-$3,904, -6.11% from previous year)
- 2016: $61,515 (+$1,520, +2.53% from previous year)
- 2017: $63,360 (+$1,845, +3.00% from previous year)
- 2018: $68,927 (+$5,567, +8.79% from previous year)
- 2019: $65,837 (-$3,090, -4.48% from previous year)
- 2020: $71,332 (+$5,496, +8.35% from previous year)
- 2021: $88,673 (+$17,341, +24.31% from previous year)
- 2022: $98,747 (+$10,074, +11.36% from previous year)
- 2023: $95,971 (-$2,776, -2.81% from previous year)
- 2024: $99,543 (+$3,572, +3.72% from previous year)
- 2025: $105,198 (+$5,654, +5.68% from previous year)
Canaseraga’s home values have climbed steadily since 2010, with notable gains during the early 2020s. The average price in 2025 is $105,198, still highly affordable despite an overall increase of more than 50% since the start of the data period.
Canaseraga – Affordable Homes in a Tightly Knit Hamlet

Located in Allegany County, Canaseraga is a small village that has long remained off the radar of investors and developers. With fewer than 600 residents, the community is small but cohesive, offering essential amenities and easy access to the western edge of the Finger Lakes region.
The housing stock consists mostly of older single-family homes, many of which have remained in families for generations. While prices have risen recently, they still lag far behind state averages, making Canaseraga an excellent option for those who want a quiet village lifestyle at a fraction of the cost found elsewhere.
11. Celoron – 105.10% Home Price Increase Since 2010

- 2010: $47,160
- 2011: $44,830 (-$2,330, -4.94% from previous year)
- 2012: $36,376 (-$8,454, -18.86% from previous year)
- 2013: $35,270 (-$1,105, -3.04% from previous year)
- 2014: $34,719 (-$551, -1.56% from previous year)
- 2015: $35,286 (+$567, +1.63% from previous year)
- 2016: $36,587 (+$1,301, +3.69% from previous year)
- 2017: $40,264 (+$3,677, +10.05% from previous year)
- 2018: $39,424 (-$840, -2.09% from previous year)
- 2019: $42,172 (+$2,748, +6.97% from previous year)
- 2020: $48,578 (+$6,406, +15.19% from previous year)
- 2021: $60,442 (+$11,865, +24.42% from previous year)
- 2022: $73,129 (+$12,686, +20.99% from previous year)
- 2023: $74,451 (+$1,323, +1.81% from previous year)
- 2024: $92,239 (+$17,788, +23.89% from previous year)
- 2025: $96,723 (+$4,483, +4.86% from previous year)
Home values in Celoron have more than doubled since 2010, even with a few early dips. The most recent gain of nearly 5% brings the 2025 average to $96,723—still highly affordable for New York. Growth in the past five years has been especially strong, indicating rising demand.
Celoron – Lakeside Living on a Budget
Celoron sits on the southern tip of Chautauqua Lake, just west of Jamestown. It’s known as the birthplace of Lucille Ball and has a deep connection to regional tourism. The village offers access to the water, marinas, and parks, making it an appealing spot for recreation-focused buyers who still want affordable prices.
Recent increases in home values may reflect Celoron’s lakeside location and its proximity to Jamestown’s amenities. Despite the uptick, the market remains among the least expensive in the state. Continued growth is possible, but for now, the balance between location and value is hard to beat.
10. Edwards – 110.76% Home Price Increase Since 2010
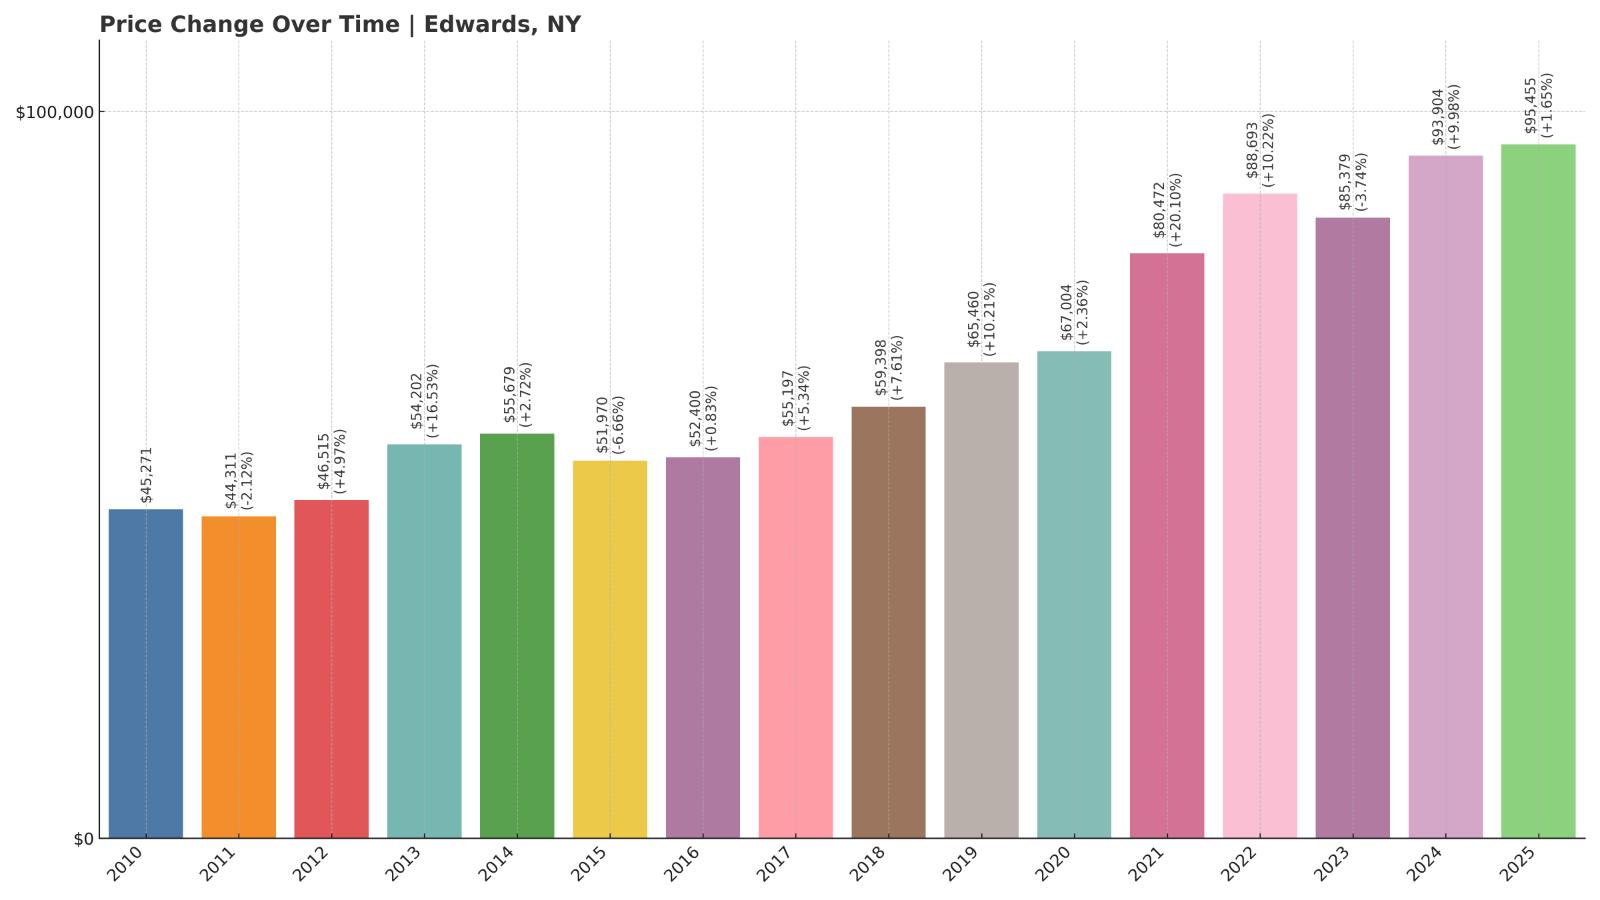
- 2010: $45,271
- 2011: $44,311 (-$960, -2.12% from previous year)
- 2012: $46,515 (+$2,204, +4.97% from previous year)
- 2013: $54,202 (+$7,687, +16.53% from previous year)
- 2014: $55,679 (+$1,477, +2.73% from previous year)
- 2015: $51,970 (-$3,709, -6.66% from previous year)
- 2016: $52,400 (+$430, +0.83% from previous year)
- 2017: $55,197 (+$2,796, +5.34% from previous year)
- 2018: $59,398 (+$4,201, +7.61% from previous year)
- 2019: $65,460 (+$6,062, +10.21% from previous year)
- 2020: $67,004 (+$1,545, +2.36% from previous year)
- 2021: $80,472 (+$13,468, +20.10% from previous year)
- 2022: $88,693 (+$8,222, +10.22% from previous year)
- 2023: $85,379 (-$3,315, -3.74% from previous year)
- 2024: $93,904 (+$8,526, +9.99% from previous year)
- 2025: $95,455 (+$1,551, +1.65% from previous year)
Edwards has seen home prices more than double since 2010, reaching $95,455 in 2025. That dramatic growth came mostly during the past decade, with recent years showing smaller and steadier gains. It’s one of the few towns on this list with both strong long-term appreciation and continued affordability.
Edwards – Long-Term Growth in a Tiny Town

Located in the northwest corner of St. Lawrence County, Edwards is a small rural community with fewer than 1,200 residents. The town has historically relied on farming, forestry, and mining, though its economy is now primarily local services and commuting to nearby towns like Gouverneur.
Edwards’ growth in home values may reflect its appeal to buyers seeking large lots and privacy, especially during the pandemic-era shift toward rural living. Even after recent increases, prices are well below statewide averages. Edwards offers a compelling mix of affordability and potential for further appreciation.
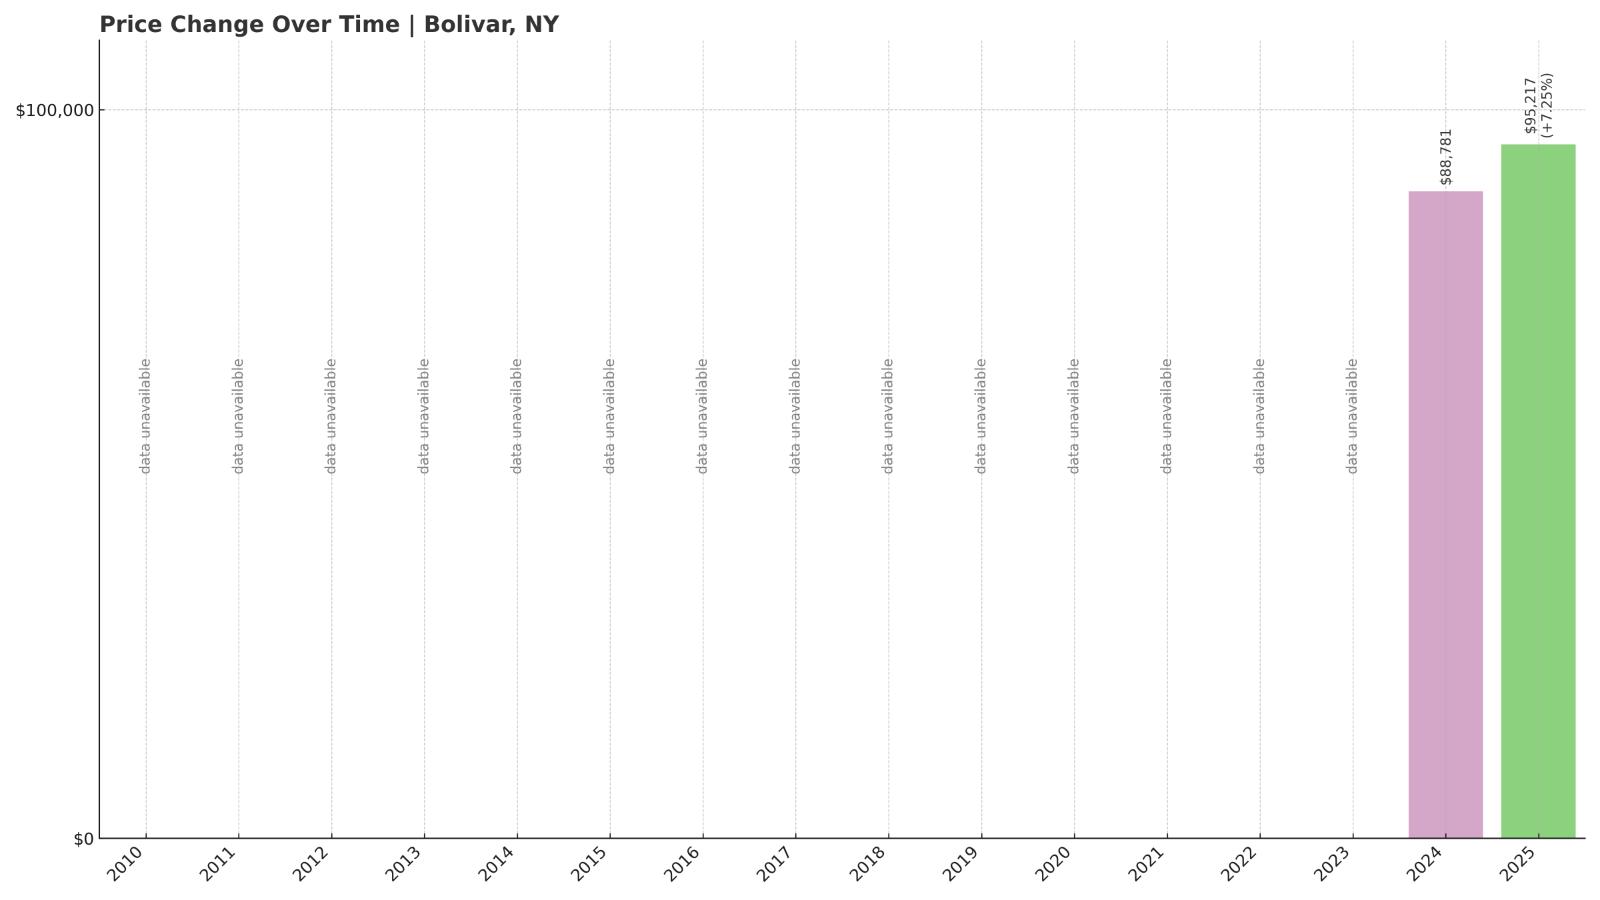
9. Bolivar – 7.25% Home Price Increase Since 2024
Would you like to save this?
- 2010: N/A
- 2011: N/A
- 2012: N/A
- 2013: N/A
- 2014: N/A
- 2015: N/A
- 2016: N/A
- 2017: N/A
- 2018: N/A
- 2019: N/A
- 2020: N/A
- 2021: N/A
- 2022: N/A
- 2023: N/A
- 2024: $88,781
- 2025: $95,217 (+$6,436, +7.25% from previous year)
Bolivar has seen a healthy 7.25% rise in home prices between 2024 and 2025, moving to an average of $95,217. While there’s no earlier Zillow data to compare, the town’s current pricing ranks it comfortably among New York’s most affordable communities.
Bolivar – A Rural Bargain Near the Pennsylvania Line

Bolivar is tucked into the southwestern corner of Allegany County, just a few miles from the Pennsylvania border. It’s a former oil boom town that has settled into a quiet, residential identity with small shops, churches, and family-run businesses. Today, it’s better known for its affordability and wide open spaces than energy development.
Housing here is mostly modest single-family homes, many built in the early to mid-20th century. The recent price bump suggests some renewed interest, possibly from budget-minded buyers or retirees. But even after that increase, Bolivar remains one of the cheapest housing markets in the state.
8. Saint Regis Falls – 65.99% Home Price Increase Since 2010
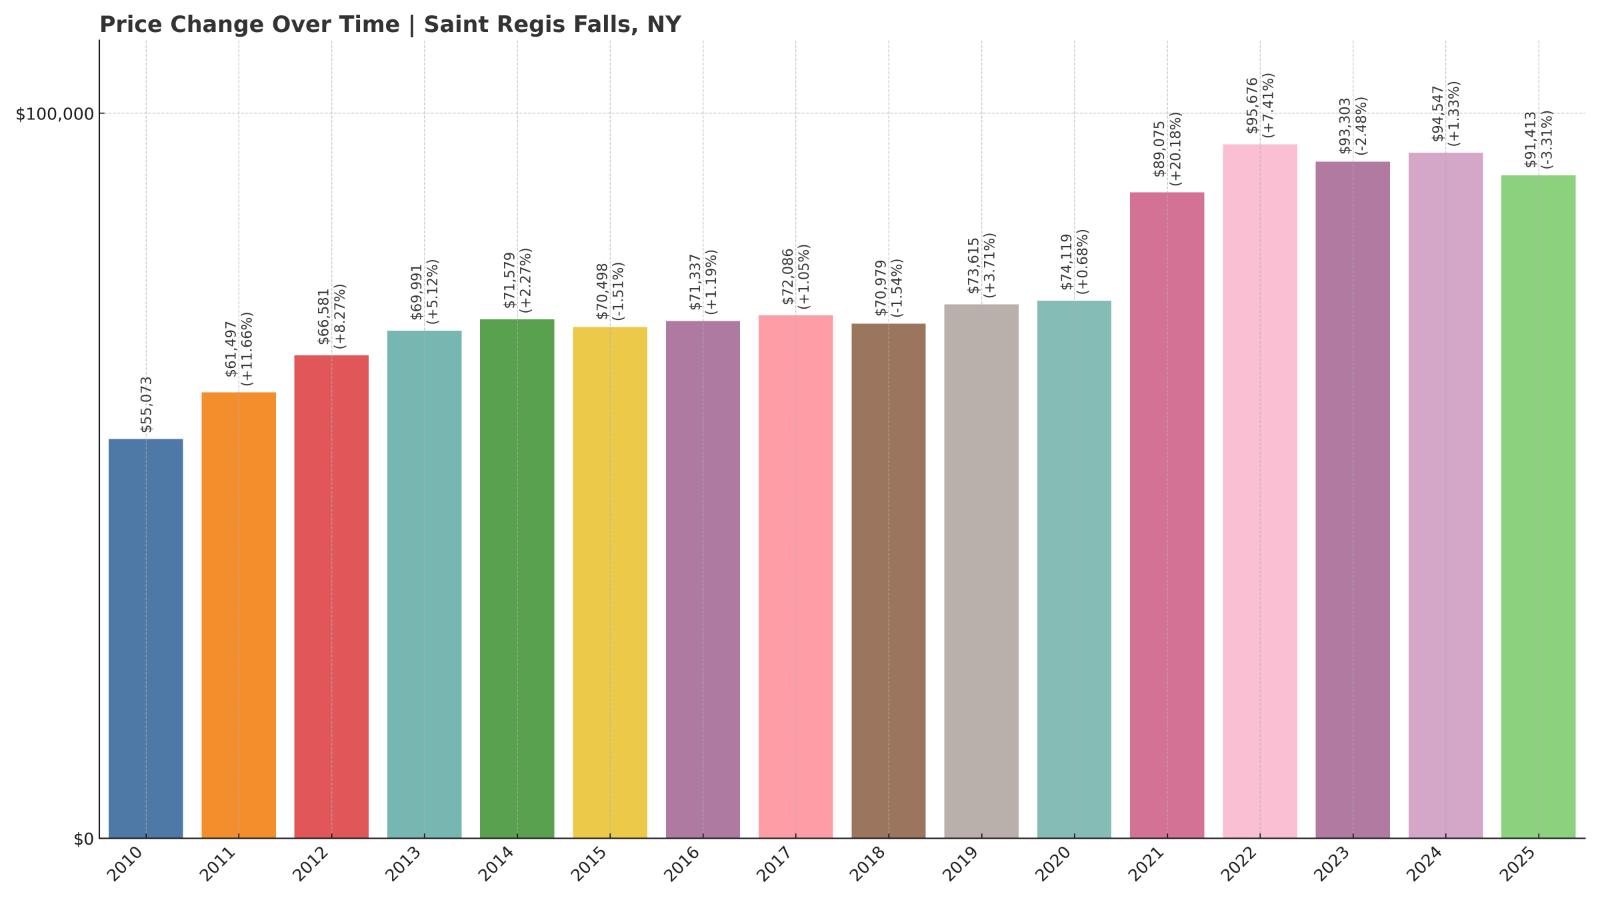
- 2010: $55,073
- 2011: $61,497 (+$6,423, +11.66% from previous year)
- 2012: $66,581 (+$5,084, +8.27% from previous year)
- 2013: $69,991 (+$3,411, +5.12% from previous year)
- 2014: $71,579 (+$1,588, +2.27% from previous year)
- 2015: $70,498 (-$1,081, -1.51% from previous year)
- 2016: $71,337 (+$839, +1.19% from previous year)
- 2017: $72,086 (+$749, +1.05% from previous year)
- 2018: $70,979 (-$1,107, -1.54% from previous year)
- 2019: $73,615 (+$2,636, +3.71% from previous year)
- 2020: $74,119 (+$504, +0.68% from previous year)
- 2021: $89,075 (+$14,956, +20.18% from previous year)
- 2022: $95,676 (+$6,601, +7.41% from previous year)
- 2023: $93,303 (-$2,373, -2.48% from previous year)
- 2024: $94,547 (+$1,244, +1.33% from previous year)
- 2025: $91,413 (-$3,134, -3.32% from previous year)
Saint Regis Falls saw a 66% increase in home values since 2010, but prices declined slightly in 2025, dipping by 3.32%. At $91,413, it’s still a top-tier pick for buyers searching for affordable housing in scenic surroundings.
Saint Regis Falls – Natural Beauty at a Low Cost

Located in Franklin County, Saint Regis Falls is surrounded by rivers, forests, and trails in the northern Adirondack foothills. It’s a favorite for anglers and nature lovers who enjoy proximity to the Saint Regis River. The community itself is small, with a few stores and services but plenty of rural charm.
Prices rose sharply during the early 2020s, possibly due to increased interest in remote-friendly areas. But the recent drop hints at stabilization or a pause in speculative buying. For those willing to live off the beaten path, Saint Regis Falls offers natural splendor at a fraction of the typical New York price.
7. Star Lake – 74.89% Home Price Increase Since 2010
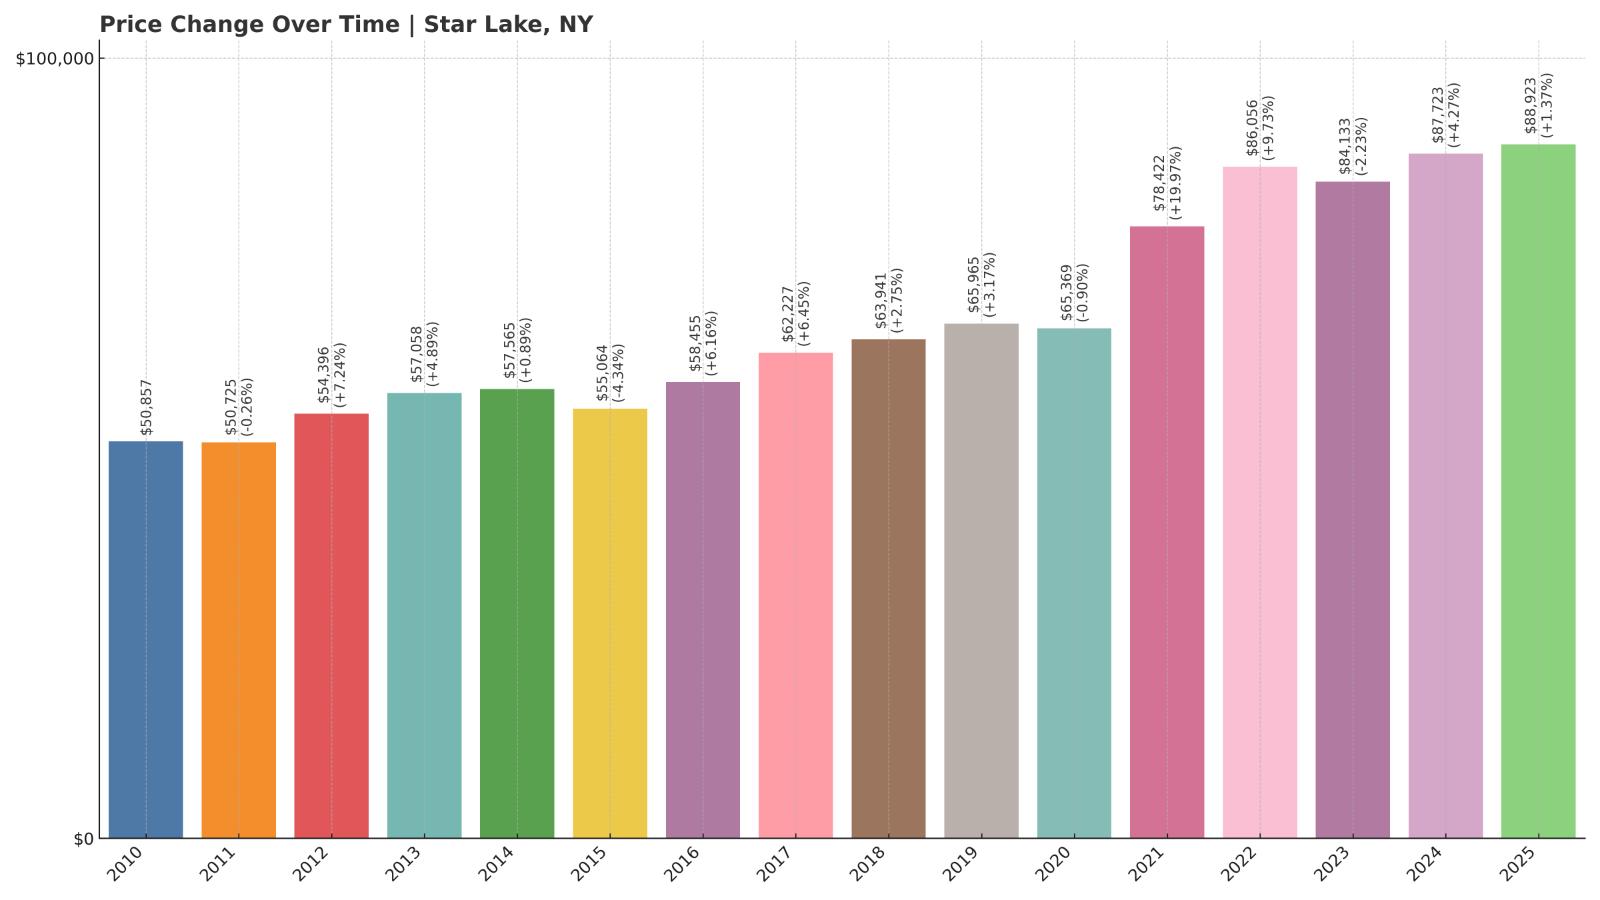
- 2010: $50,857
- 2011: $50,725 (-$132, -0.26% from previous year)
- 2012: $54,396 (+$3,671, +7.24% from previous year)
- 2013: $57,058 (+$2,663, +4.90% from previous year)
- 2014: $57,565 (+$507, +0.89% from previous year)
- 2015: $55,064 (-$2,501, -4.34% from previous year)
- 2016: $58,455 (+$3,390, +6.16% from previous year)
- 2017: $62,227 (+$3,772, +6.45% from previous year)
- 2018: $63,941 (+$1,714, +2.75% from previous year)
- 2019: $65,965 (+$2,024, +3.17% from previous year)
- 2020: $65,369 (-$596, -0.90% from previous year)
- 2021: $78,422 (+$13,053, +19.97% from previous year)
- 2022: $86,056 (+$7,635, +9.74% from previous year)
- 2023: $84,133 (-$1,923, -2.23% from previous year)
- 2024: $87,723 (+$3,589, +4.27% from previous year)
- 2025: $88,923 (+$1,201, +1.37% from previous year)
Star Lake has posted a nearly 75% increase in home values since 2010, though much of that growth came in recent years. The current 2025 average home value stands at $88,923, after a modest rise of 1.37% over the past year. It’s a market that appears to be entering a steadier phase after more dramatic earlier gains.
Star Lake – A Remote Hamlet with Steady Demand

Star Lake is a remote community in southern St. Lawrence County, near the western edge of the Adirondack Park. The town has long attracted outdoor enthusiasts and retirees seeking solitude, scenic surroundings, and budget-friendly housing. There are few commercial services, but the natural beauty is a significant draw.
The area saw sharp price increases during the pandemic as remote work opened up more rural markets. Though recent growth has slowed, Star Lake remains an appealing option for those looking for a quiet home base near lakes, trails, and protected lands—without the steep prices found in more tourist-heavy areas.
6. Richburg – 85.49% Home Price Increase Since 2010
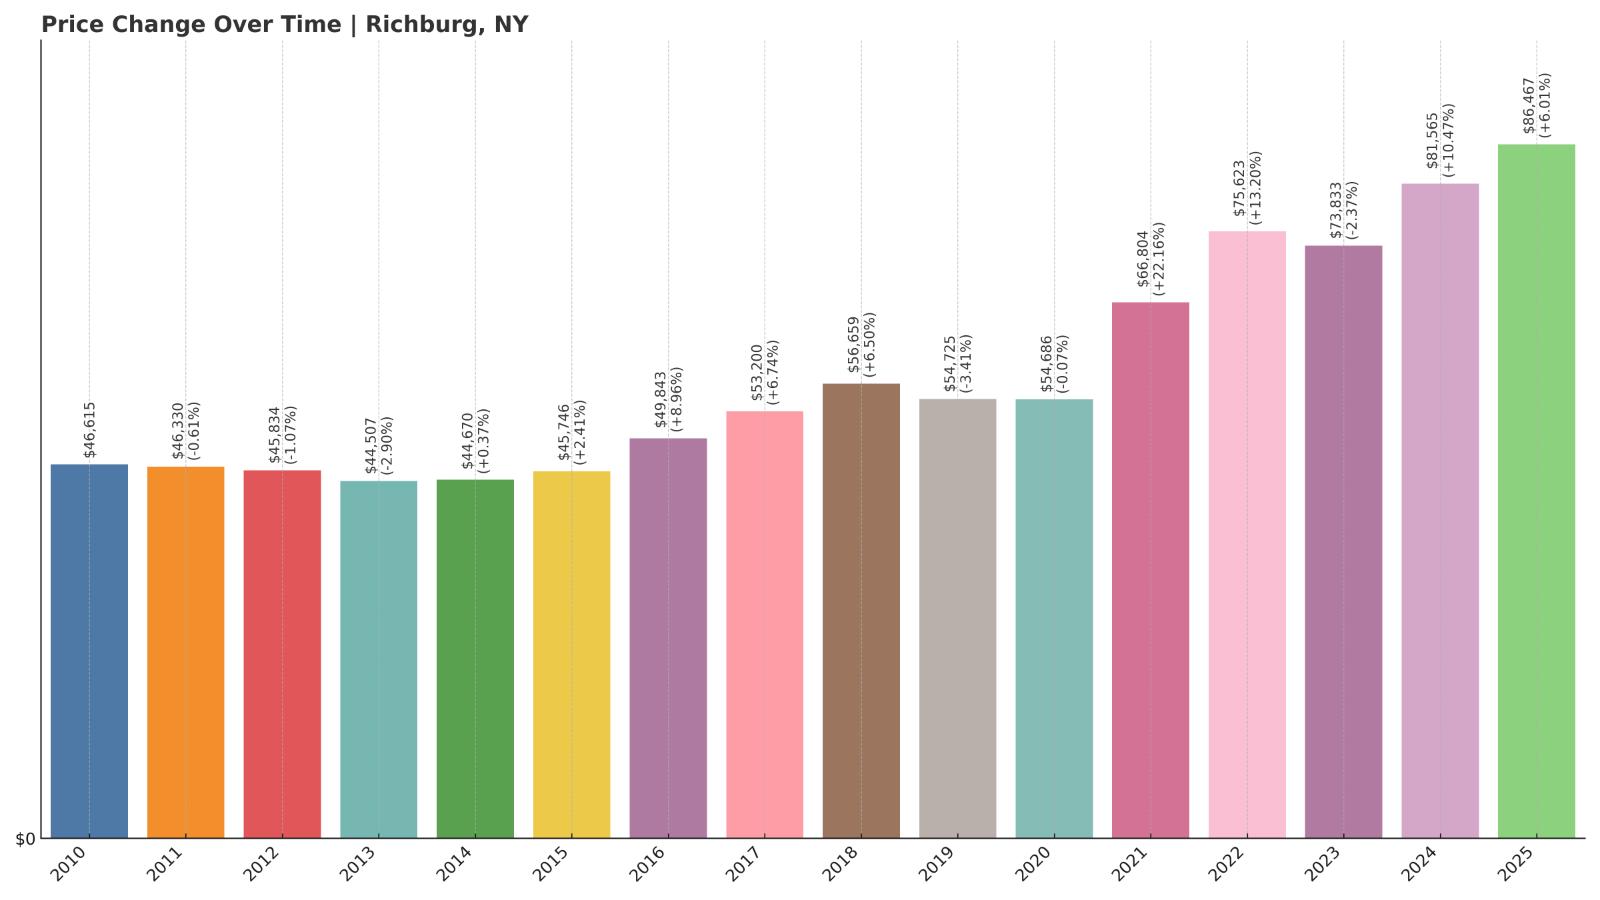
- 2010: $46,615
- 2011: $46,330 (-$285, -0.61% from previous year)
- 2012: $45,834 (-$496, -1.07% from previous year)
- 2013: $44,507 (-$1,327, -2.89% from previous year)
- 2014: $44,670 (+$163, +0.37% from previous year)
- 2015: $45,746 (+$1,076, +2.41% from previous year)
- 2016: $49,843 (+$4,097, +8.96% from previous year)
- 2017: $53,200 (+$3,357, +6.74% from previous year)
- 2018: $56,659 (+$3,459, +6.50% from previous year)
- 2019: $54,725 (-$1,934, -3.41% from previous year)
- 2020: $54,686 (-$39, -0.07% from previous year)
- 2021: $66,804 (+$12,118, +22.16% from previous year)
- 2022: $75,623 (+$8,819, +13.20% from previous year)
- 2023: $73,833 (-$1,790, -2.37% from previous year)
- 2024: $81,565 (+$7,732, +10.47% from previous year)
- 2025: $86,467 (+$4,901, +6.01% from previous year)
Home prices in Richburg have grown by more than 85% since 2010, with particularly strong gains in the early 2020s. The 2025 average is $86,467—still low by statewide standards, even after a 6% increase this year. It’s a market with room for growth that hasn’t yet priced out budget-conscious buyers.
Richburg – Tiny Town, Big Value

Richburg is a very small village in Allegany County, located between Wellsville and Cuba. It’s a former oil town, and while its boom years are long past, the community remains anchored by low home prices and rural surroundings. The village spans less than one square mile and is home to fewer than 500 people.
Given its small size and limited housing inventory, price fluctuations here can be sharper than in larger markets. Still, the long-term trend has been up. Richburg continues to offer solid value to buyers seeking affordability and privacy in western New York.
5. Oswegatchie – 99.70% Home Price Increase Since 2010

- 2010: $42,789
- 2011: $42,060 (-$729, -1.70% from previous year)
- 2012: $45,436 (+$3,376, +8.03% from previous year)
- 2013: $49,694 (+$4,258, +9.37% from previous year)
- 2014: $50,494 (+$800, +1.61% from previous year)
- 2015: $48,637 (-$1,857, -3.68% from previous year)
- 2016: $52,620 (+$3,983, +8.19% from previous year)
- 2017: $53,531 (+$910, +1.73% from previous year)
- 2018: $55,789 (+$2,259, +4.22% from previous year)
- 2019: $58,580 (+$2,791, +5.00% from previous year)
- 2020: $60,137 (+$1,557, +2.66% from previous year)
- 2021: $77,823 (+$17,686, +29.41% from previous year)
- 2022: $85,068 (+$7,245, +9.31% from previous year)
- 2023: $80,730 (-$4,338, -5.10% from previous year)
- 2024: $83,519 (+$2,789, +3.45% from previous year)
- 2025: $85,466 (+$1,948, +2.33% from previous year)
Oswegatchie has nearly doubled in value since 2010, with current 2025 home prices averaging $85,466. While prices dipped in 2023, the past two years have brought renewed gains, suggesting resilience in this small St. Lawrence County town.
Oswegatchie – Affordable Real Estate Near the River

Would you like to save this?
Oswegatchie lies just west of Ogdensburg and borders the St. Lawrence River. It’s a largely rural town with scattered hamlets and low-density housing. Many properties include large lots, and there’s a mix of historic homes and newer builds, mostly serving full-time residents and seasonal owners.
The town’s appeal is in its riverside location, low property taxes, and relaxed pace. With home prices still hovering under $90,000, Oswegatchie offers one of the best affordability-to-scenery ratios in the state. Modest annual price increases in recent years suggest a stable, low-pressure market.
4. Witherbee – 89.65% Home Price Increase Since 2010
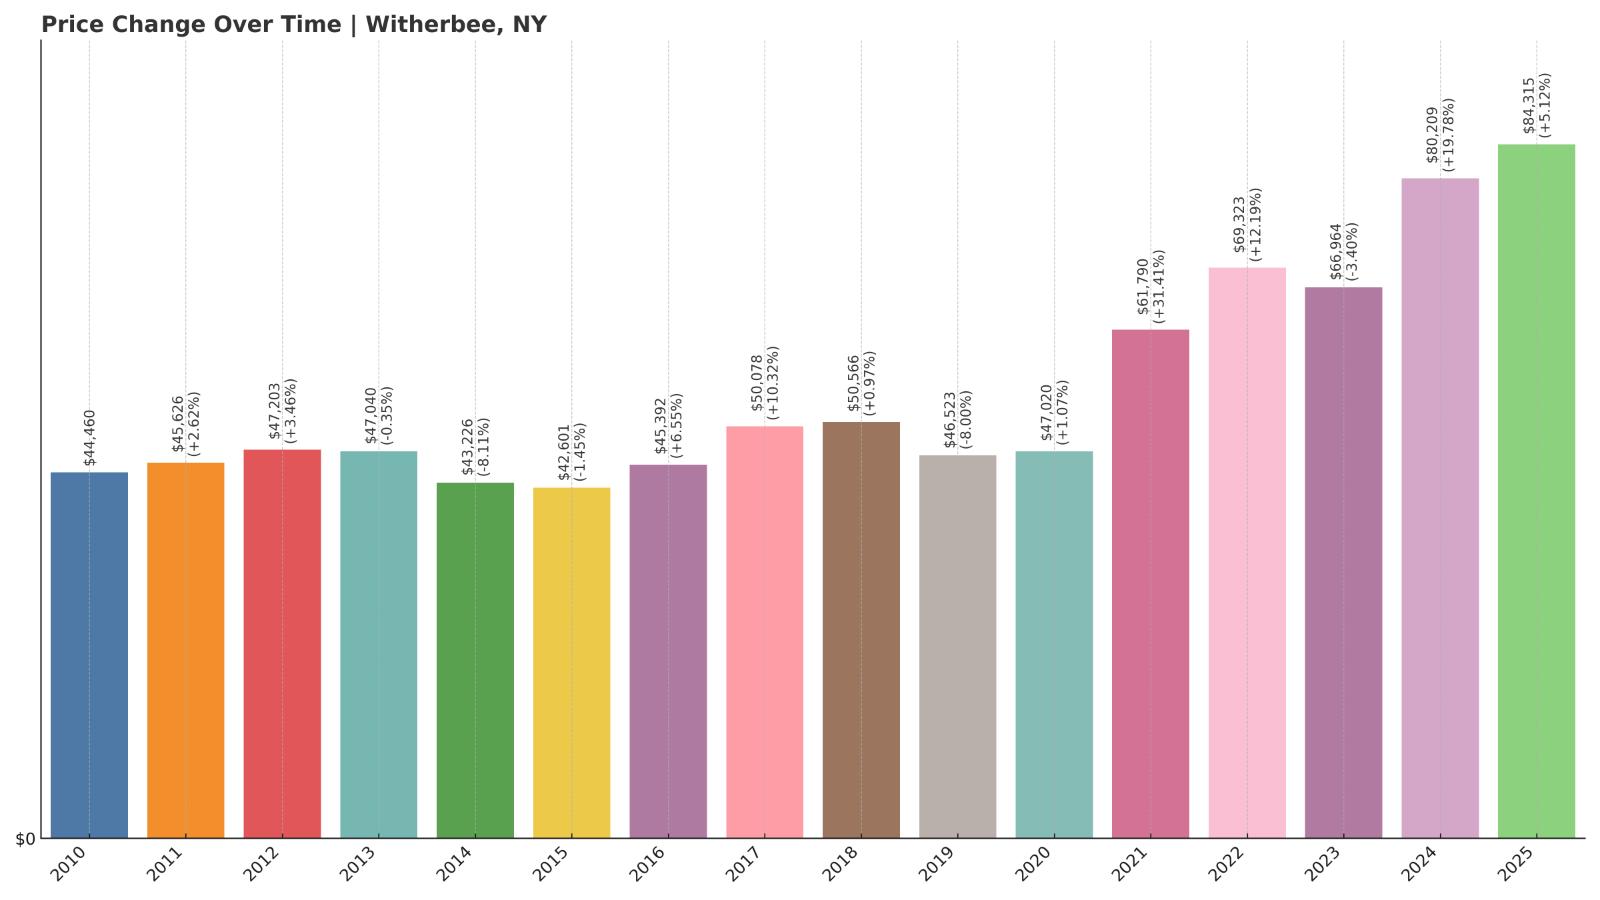
- 2010: $44,460
- 2011: $45,626 (+$1,166, +2.62% from previous year)
- 2012: $47,203 (+$1,577, +3.46% from previous year)
- 2013: $47,040 (-$163, -0.35% from previous year)
- 2014: $43,226 (-$3,814, -8.11% from previous year)
- 2015: $42,601 (-$625, -1.45% from previous year)
- 2016: $45,392 (+$2,791, +6.55% from previous year)
- 2017: $50,078 (+$4,686, +10.32% from previous year)
- 2018: $50,566 (+$487, +0.97% from previous year)
- 2019: $46,523 (-$4,042, -7.99% from previous year)
- 2020: $47,020 (+$497, +1.07% from previous year)
- 2021: $61,790 (+$14,770, +31.41% from previous year)
- 2022: $69,323 (+$7,533, +12.19% from previous year)
- 2023: $66,964 (-$2,360, -3.40% from previous year)
- 2024: $80,209 (+$13,245, +19.78% from previous year)
- 2025: $84,315 (+$4,107, +5.12% from previous year)
Witherbee has seen nearly 90% appreciation since 2010, with big jumps in recent years. Prices rose another 5% in 2025, bringing the average home value to $84,315. It’s one of the most affordable towns in the North Country, even after these gains.
Witherbee – Rebounding Affordability in the Adirondack Foothills

420Traveler, CC BY-SA 4.0, via Wikimedia Commons
Witherbee is a hamlet within the town of Moriah in Essex County, near Lake Champlain and the Adirondack Park. Once a mining community, it now offers low-cost housing in a picturesque, remote setting. The area is popular with outdoor enthusiasts and those looking for quiet, rural living.
Although housing demand remains relatively low compared to downstate areas, price increases in the past five years suggest renewed attention. Witherbee’s affordability, proximity to natural attractions, and small-town environment make it a sleeper pick for buyers exploring the North Country.
3. Lily Dale – 0.62% Home Price Increase Since 2024

- 2010: N/A
- 2011: N/A
- 2012: N/A
- 2013: N/A
- 2014: N/A
- 2015: N/A
- 2016: N/A
- 2017: N/A
- 2018: N/A
- 2019: N/A
- 2020: N/A
- 2021: N/A
- 2022: N/A
- 2023: N/A
- 2024: $70,337
- 2025: $70,775 (+$439, +0.62% from previous year)
Home prices in Lily Dale have barely budged in the past year, increasing by just 0.62%. At $70,775 in 2025, the average home remains among the cheapest in all of New York. It’s a market marked by stability and low entry cost.
Lily Dale – One-of-a-Kind Hamlet with Unbeatable Prices

Lily Dale, located in Chautauqua County, is internationally recognized as a center for spiritualism. The gated village is home to mediums, spiritualists, and seasonal visitors who attend workshops, services, and retreats. While its population is small, its identity is distinct, and its community is tight-knit.
Housing here is unique—many properties are modest, older homes with historical charm. Because Lily Dale is a private community open only to members and visitors during parts of the year, real estate turnover is low. Still, for those with interest in alternative lifestyles or peaceful seclusion, Lily Dale’s affordability is unmatched.
2. Lyon Mountain – 127.75% Home Price Increase Since 2010
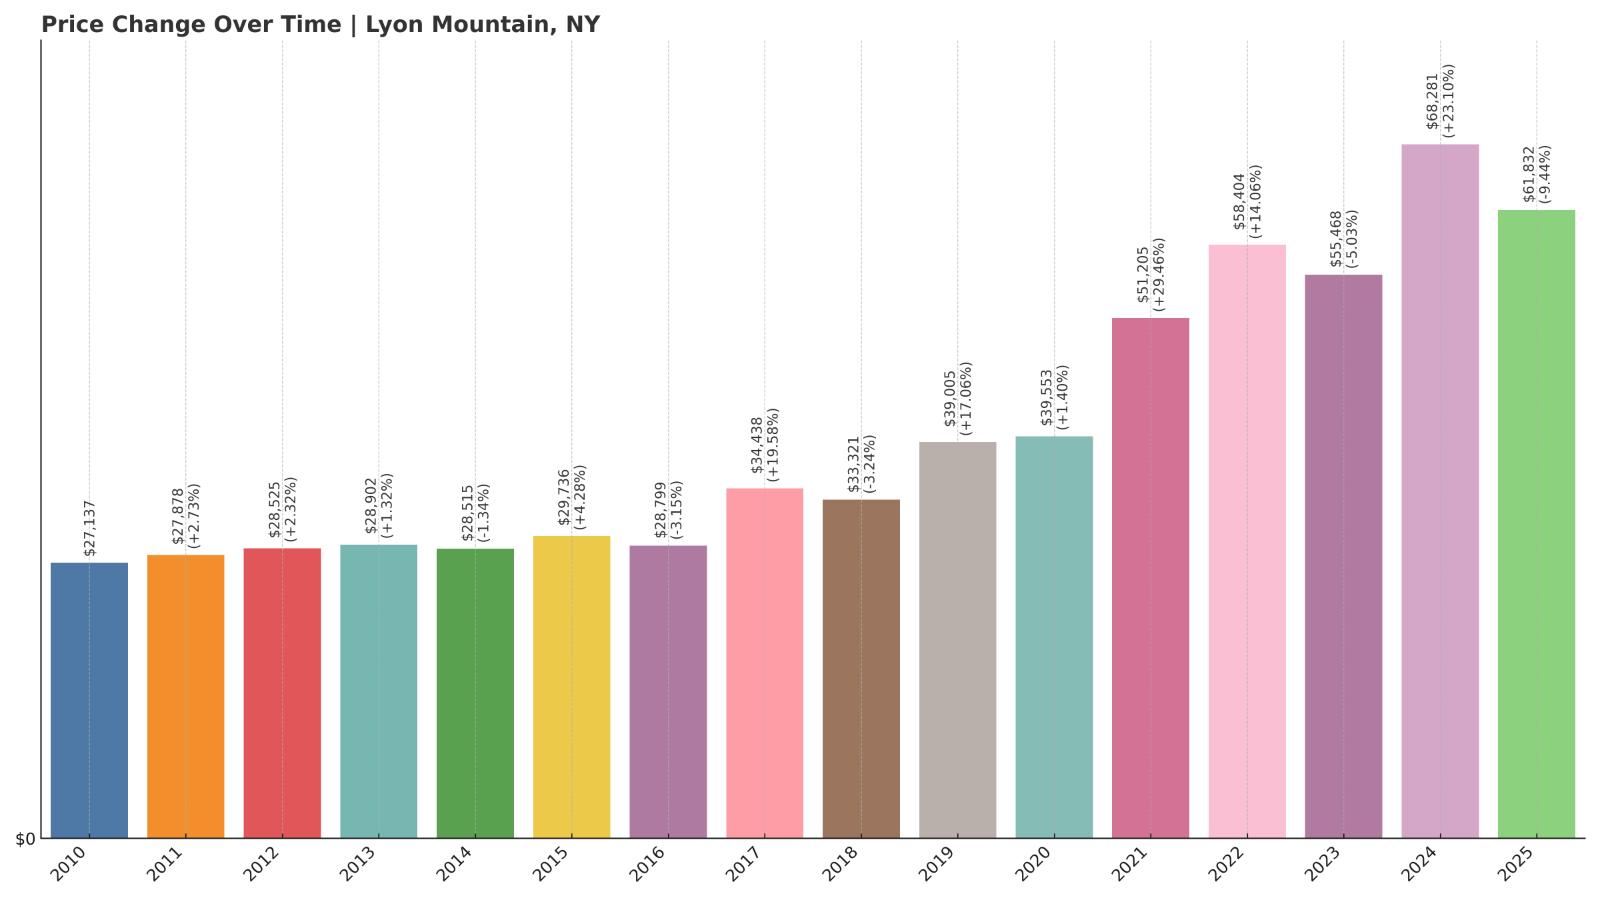
- 2010: $27,137
- 2011: $27,878 (+$741, +2.73% from previous year)
- 2012: $28,525 (+$647, +2.32% from previous year)
- 2013: $28,902 (+$377, +1.32% from previous year)
- 2014: $28,515 (-$387, -1.34% from previous year)
- 2015: $29,736 (+$1,221, +4.28% from previous year)
- 2016: $28,799 (-$937, -3.15% from previous year)
- 2017: $34,438 (+$5,640, +19.58% from previous year)
- 2018: $33,321 (-$1,117, -3.24% from previous year)
- 2019: $39,005 (+$5,684, +17.06% from previous year)
- 2020: $39,553 (+$548, +1.40% from previous year)
- 2021: $51,205 (+$11,652, +29.46% from previous year)
- 2022: $58,404 (+$7,199, +14.06% from previous year)
- 2023: $55,468 (-$2,936, -5.03% from previous year)
- 2024: $68,281 (+$12,813, +23.10% from previous year)
- 2025: $61,832 (-$6,449, -9.44% from previous year)
Lyon Mountain’s home prices have soared over the past 15 years, more than doubling since 2010. That said, values dropped sharply in 2025—down 9.44%—bringing the average to $61,832. It’s still one of the cheapest housing markets in the state, with volatility tied to its remote location and small housing stock.
Lyon Mountain – Rugged Setting, Rock-Bottom Prices

In the northeastern corner of the Adirondacks lies Lyon Mountain, a former mining hamlet in Clinton County. It’s a remote, forested area known for outdoor recreation, including hiking the peak it’s named after. The community is small, and the economy limited, with most amenities found in nearby towns like Plattsburgh.
Sharp price swings reflect a market with few sales and low inventory. While the 2025 drop might concern some, it likely signals normalization after a major run-up in 2024. For buyers who value privacy and can handle winter weather, Lyon Mountain offers rare access to Adirondack real estate at rock-bottom prices.
1. Newton Falls – 111.74% Home Price Increase Since 2010
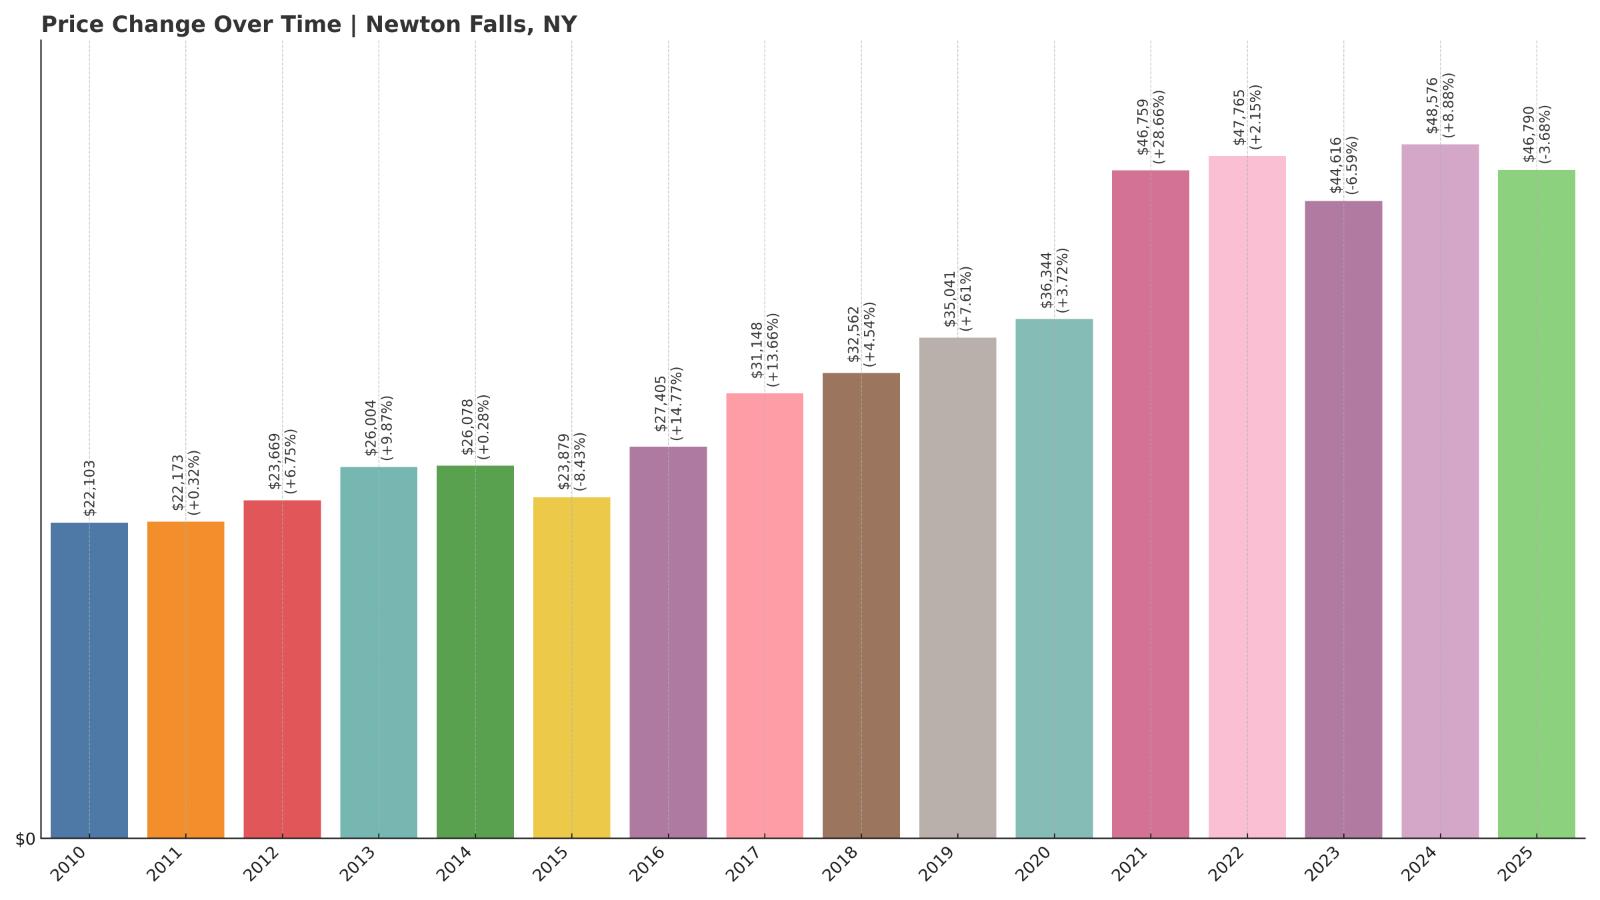
- 2010: $22,103
- 2011: $22,173 (+$70, +0.32% from previous year)
- 2012: $23,669 (+$1,496, +6.75% from previous year)
- 2013: $26,004 (+$2,335, +9.87% from previous year)
- 2014: $26,078 (+$73, +0.28% from previous year)
- 2015: $23,879 (-$2,198, -8.43% from previous year)
- 2016: $27,405 (+$3,525, +14.76% from previous year)
- 2017: $31,148 (+$3,744, +13.66% from previous year)
- 2018: $32,562 (+$1,414, +4.54% from previous year)
- 2019: $35,041 (+$2,479, +7.61% from previous year)
- 2020: $36,344 (+$1,302, +3.72% from previous year)
- 2021: $46,759 (+$10,415, +28.66% from previous year)
- 2022: $47,765 (+$1,006, +2.15% from previous year)
- 2023: $44,616 (-$3,149, -6.59% from previous year)
- 2024: $48,576 (+$3,959, +8.87% from previous year)
- 2025: $46,790 (-$1,786, -3.68% from previous year)
Even after more than doubling in value since 2010, Newton Falls remains the most affordable housing market in New York, with an average home price of just $46,790 in 2025. Despite a small dip this year, the long-term trend reflects growth from an extremely low base.
Newton Falls – The Cheapest Homes in New York

Newton Falls is a tiny hamlet in St. Lawrence County, tucked deep in the western Adirondacks. Once a paper mill town, it now consists of quiet streets and a handful of remaining businesses. Its remote location means few buyers, but for those seeking extreme affordability, it tops the list.
Its isolation limits demand and price growth, but that’s exactly what makes Newton Falls notable. In a state where median home values regularly top $300,000, Newton Falls stands as a dramatic outlier—proof that even in 2025, it’s still possible to own property in New York for under $50,000.