Would you like to save this?
Maryland may be known for its sky-high listings near D.C. and Baltimore, but not every town is playing that game. According to the latest Zillow Home Value Index, these 21 places offer some of the most affordable homes in the state as of June 2025—often thousands below the state median. They’re quiet, often overlooked spots: fishing villages along the Chesapeake, mountain towns tucked into the Appalachians, and slow-growth communities that never chased the boom. Some are recovering, others just stayed grounded—but all of them prove you don’t need a six-figure income to own a little piece of Maryland.
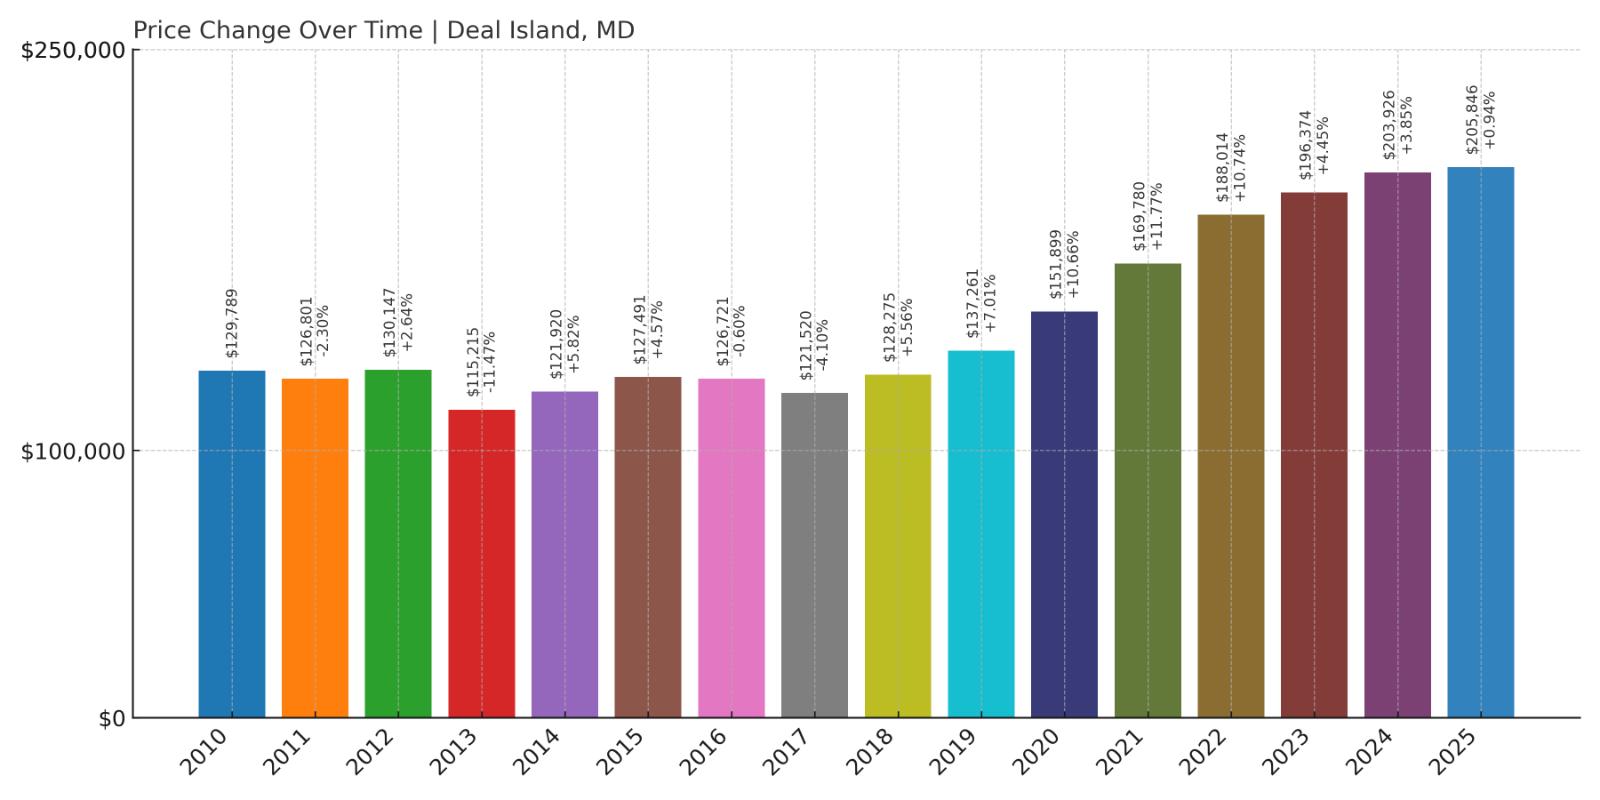
21. Deal Island – 59% Home Price Increase Since 2010
Would you like to save this?
- 2010: $129,789
- 2011: $126,801 (-$2,988, -2.30% from previous year)
- 2012: $130,147 (+$3,346, +2.64% from previous year)
- 2013: $115,215 (-$14,932, -11.47% from previous year)
- 2014: $121,920 (+$6,705, +5.82% from previous year)
- 2015: $127,491 (+$5,571, +4.57% from previous year)
- 2016: $126,721 (-$770, -0.60% from previous year)
- 2017: $121,520 (-$5,201, -4.10% from previous year)
- 2018: $128,275 (+$6,755, +5.56% from previous year)
- 2019: $137,261 (+$8,986, +7.01% from previous year)
- 2020: $151,899 (+$14,638, +10.66% from previous year)
- 2021: $169,780 (+$17,881, +11.77% from previous year)
- 2022: $188,014 (+$18,234, +10.74% from previous year)
- 2023: $196,374 (+$8,360, +4.45% from previous year)
- 2024: $203,926 (+$7,553, +3.85% from previous year)
- 2025: $205,846 (+$1,919, +0.94% from previous year)
Deal Island’s home values have climbed nearly 60% since 2010, despite a few years of price dips. The town has seen particularly strong growth since 2019, with consistent single-digit and double-digit annual gains through the pandemic years and beyond. As of June 2025, the typical home price in Deal Island stands just over $205,000, still well below Maryland’s statewide median.
Deal Island – A Chesapeake Bay Outpost with Steady Gains
Located in Somerset County, Deal Island is a remote community with deep roots in crabbing and watermen culture. It’s part of a region that has remained off the radar for most homebuyers, which helps explain its relatively low price tag. The town’s isolation may have kept demand modest, but that has slowly changed with an uptick in interest from second-home buyers and retirees looking for a quiet, waterfront retreat.
Deal Island’s home prices show a blend of volatility and long-term appreciation, which may reflect both seasonal demand and occasional flooding concerns. Even so, values have risen consistently since 2018. The area’s charm — along with its affordability — makes it one of the last places on the Eastern Shore where buyers can still find water views at a fraction of the price elsewhere in the state.
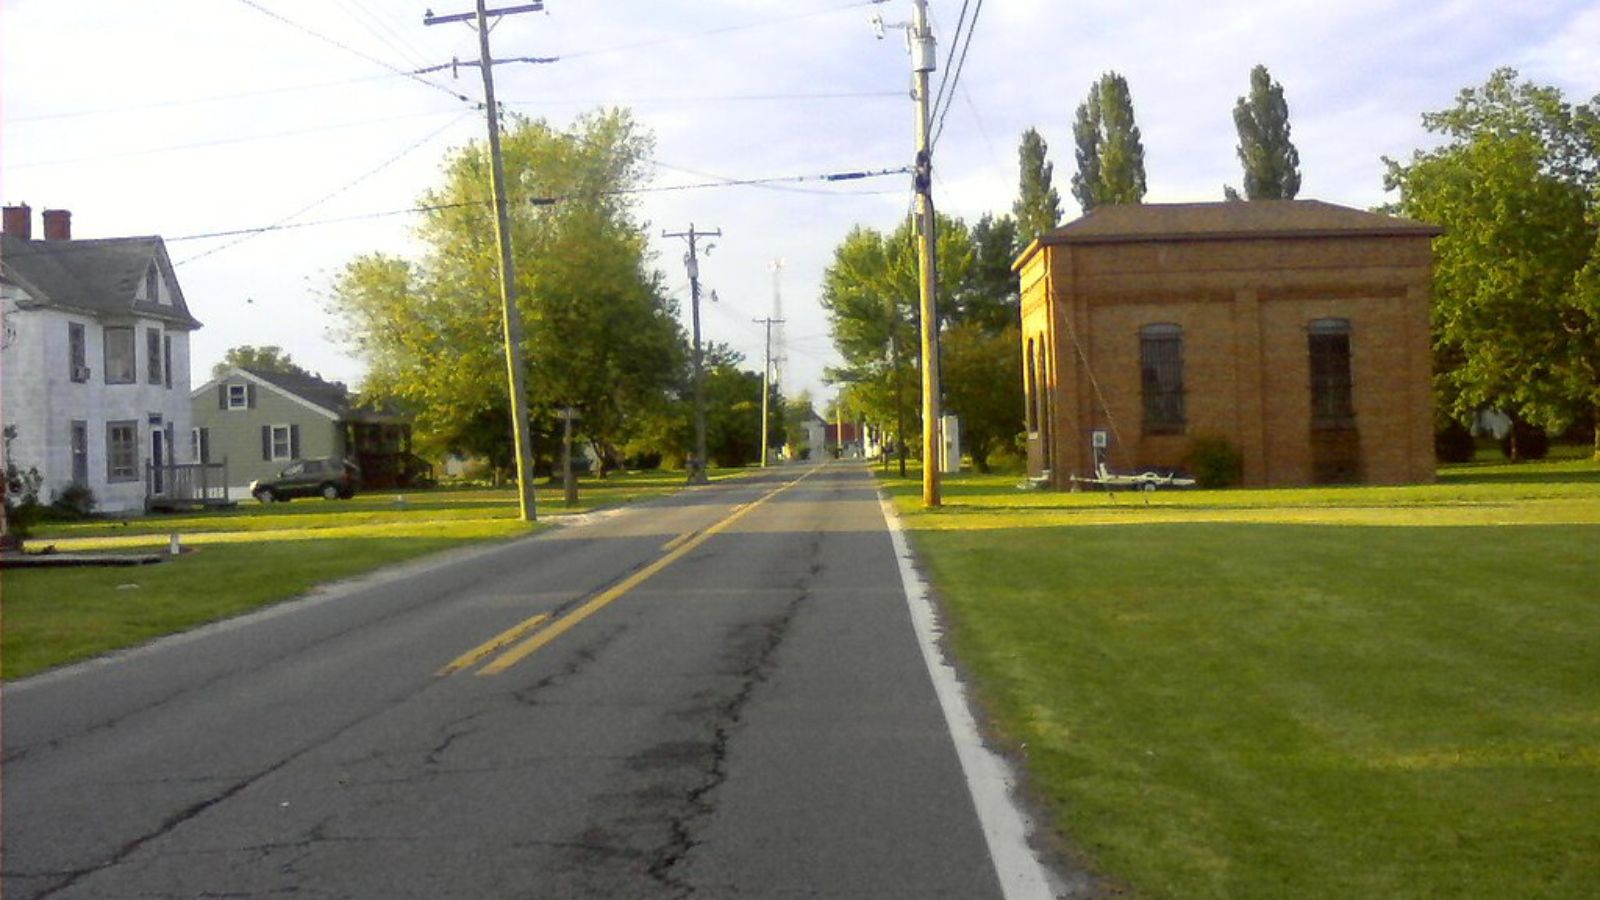
20. Marion Station – 83% Home Price Increase Since 2010
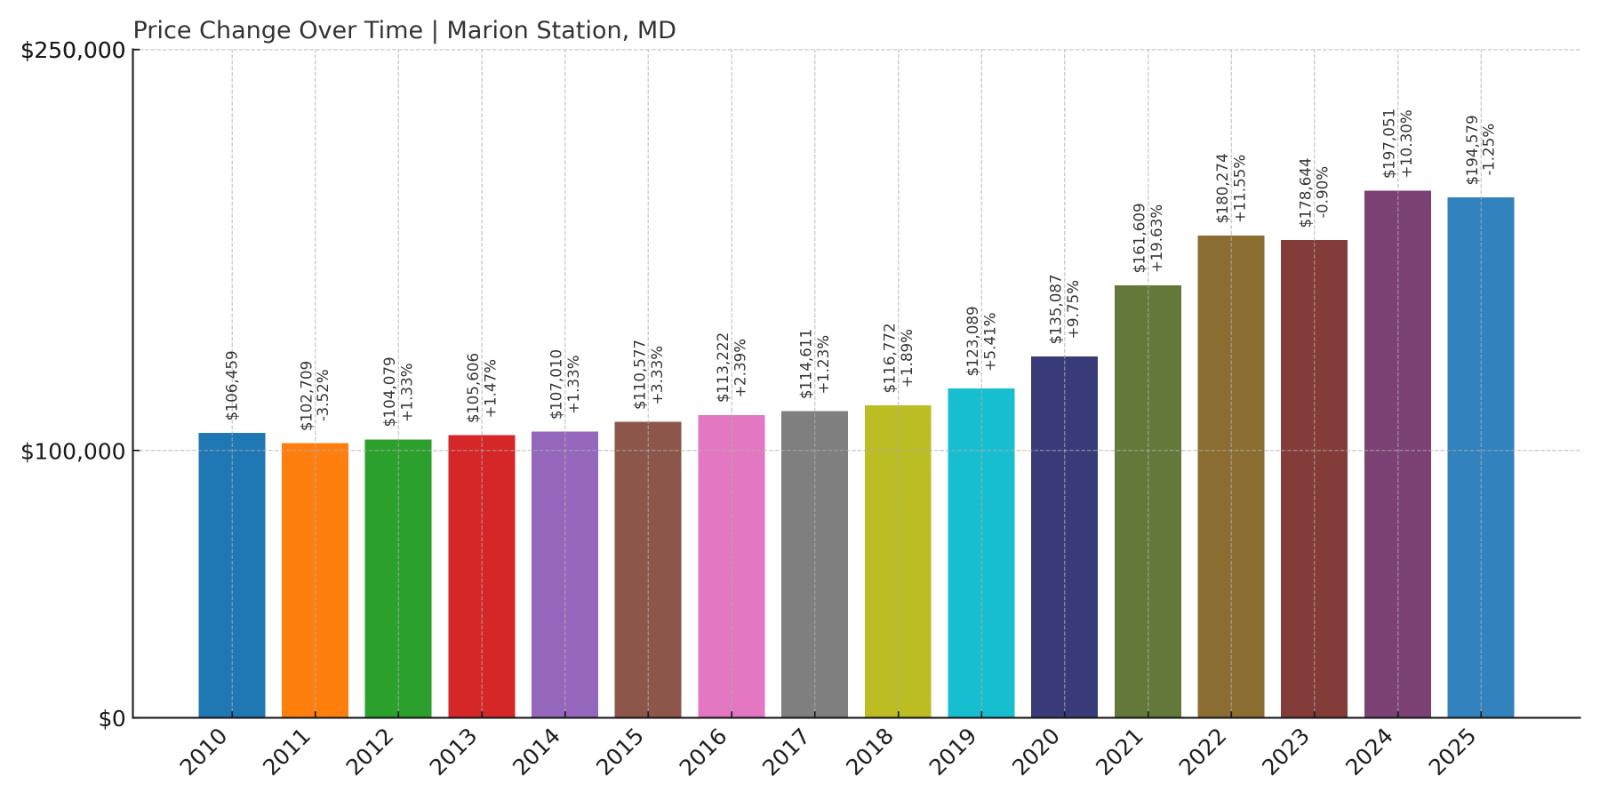
- 2010: $106,459
- 2011: $102,709 (-$3,750, -3.52% from previous year)
- 2012: $104,079 (+$1,370, +1.33% from previous year)
- 2013: $105,606 (+$1,527, +1.47% from previous year)
- 2014: $107,010 (+$1,404, +1.33% from previous year)
- 2015: $110,577 (+$3,567, +3.33% from previous year)
- 2016: $113,222 (+$2,645, +2.39% from previous year)
- 2017: $114,611 (+$1,389, +1.23% from previous year)
- 2018: $116,772 (+$2,162, +1.89% from previous year)
- 2019: $123,089 (+$6,317, +5.41% from previous year)
- 2020: $135,087 (+$11,997, +9.75% from previous year)
- 2021: $161,609 (+$26,522, +19.63% from previous year)
- 2022: $180,274 (+$18,665, +11.55% from previous year)
- 2023: $178,644 (-$1,630, -0.90% from previous year)
- 2024: $197,051 (+$18,407, +10.30% from previous year)
- 2025: $194,579 (-$2,473, -1.25% from previous year)
Home prices in Marion Station have nearly doubled since 2010, climbing from just over $106,000 to nearly $195,000. The sharpest gains occurred between 2020 and 2022, with annual increases exceeding 10% in some years. While 2023 and 2025 brought mild declines, the long-term trend remains upward.
Marion Station – Quiet Eastern Shore Living with Big Gains
Marion Station is another Eastern Shore community that’s seen major price appreciation in recent years. Known historically for its strawberry industry, this quiet town now attracts homebuyers seeking privacy, land, and affordability. It’s still one of the cheapest places to buy in Maryland, but that could change if upward trends continue.
Despite being far from job centers, Marion Station has benefited from pandemic-era shifts and remote work flexibility. Home values saw particularly steep jumps in 2021 and 2022. Though recent years have shown more variability, the town’s affordability and rural charm continue to draw interest.
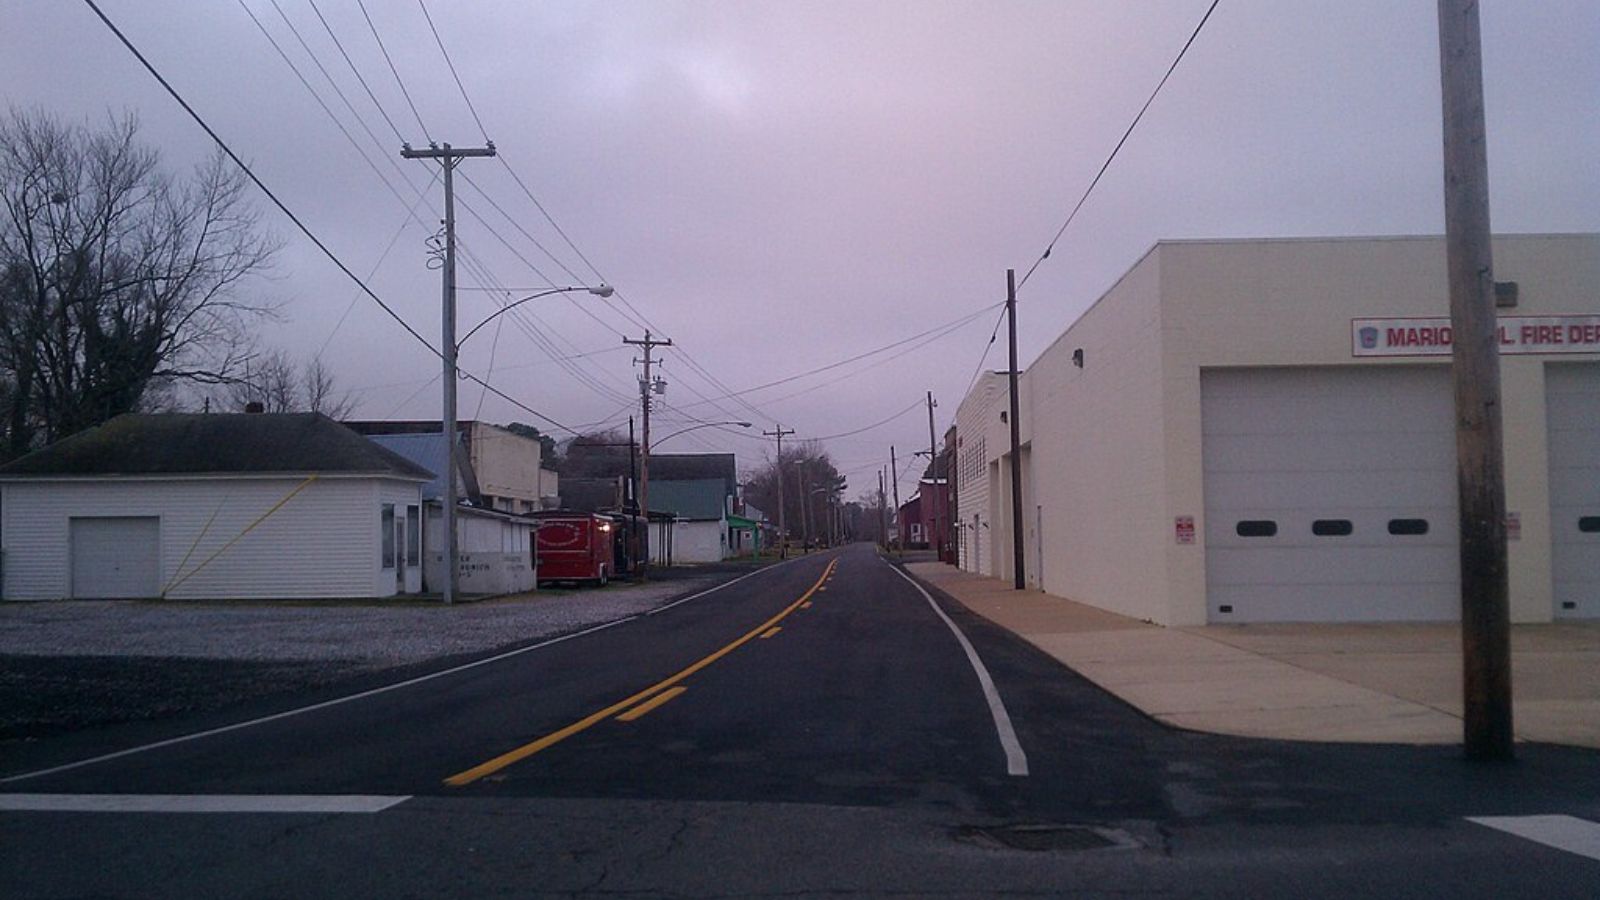
19. Oldtown – 62% Home Price Increase Since 2010
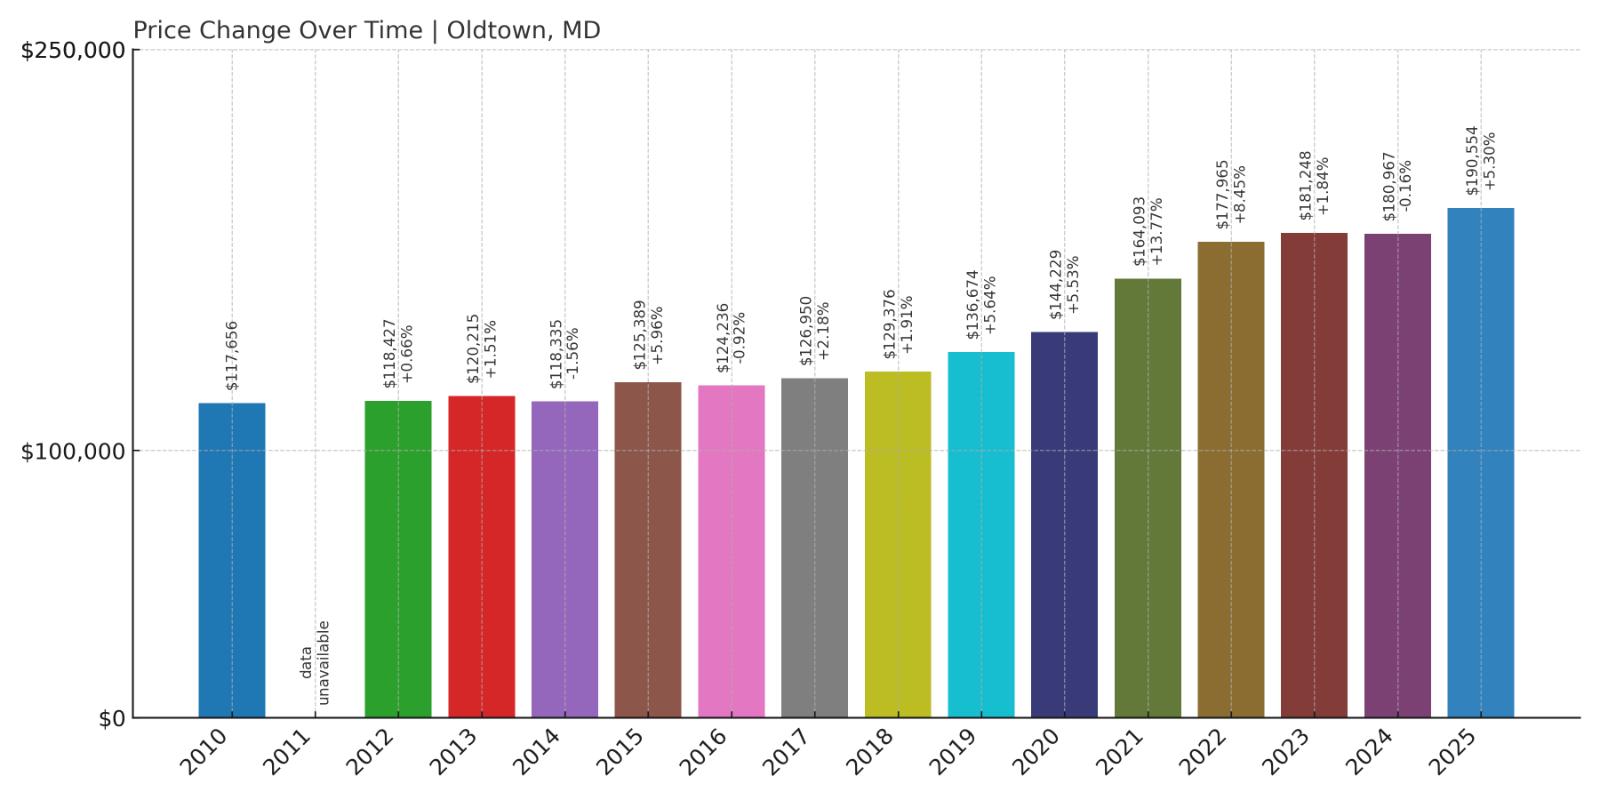
- 2010: $117,656
- 2011: N/A
- 2012: $118,427 (+$771, +0.66% from previous year)
- 2013: $120,215 (+$1,788, +1.51% from previous year)
- 2014: $118,335 (-$1,881, -1.56% from previous year)
- 2015: $125,389 (+$7,055, +5.96% from previous year)
- 2016: $124,236 (-$1,153, -0.92% from previous year)
- 2017: $126,950 (+$2,714, +2.18% from previous year)
- 2018: $129,376 (+$2,426, +1.91% from previous year)
- 2019: $136,674 (+$7,298, +5.64% from previous year)
- 2020: $144,229 (+$7,555, +5.53% from previous year)
- 2021: $164,093 (+$19,865, +13.77% from previous year)
- 2022: $177,965 (+$13,871, +8.45% from previous year)
- 2023: $181,248 (+$3,283, +1.84% from previous year)
- 2024: $180,967 (-$281, -0.15% from previous year)
- 2025: $190,554 (+$9,587, +5.30% from previous year)
Oldtown has seen home values climb more than 60% since 2010. The town experienced steady annual increases, especially from 2015 onward, and more recent years have kept that momentum with only minor volatility. Prices reached nearly $191,000 in 2025, well below state averages but significantly above early-2010s levels.
Oldtown – Appalachian Affordability with Modest Appreciation
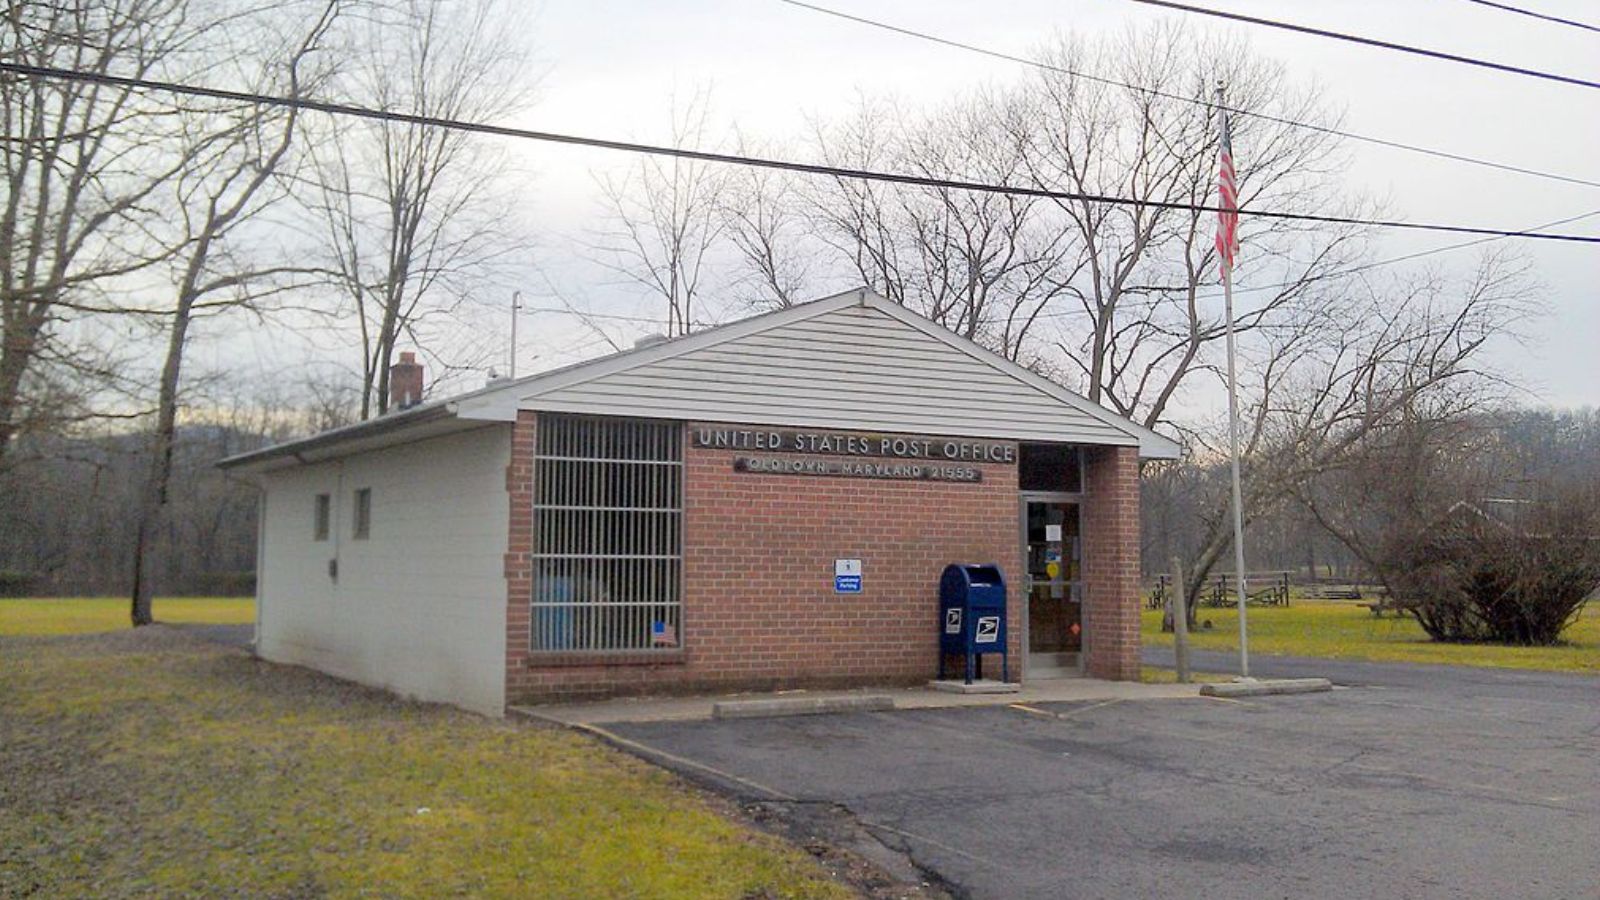
Located in Allegany County, Oldtown is nestled near the Potomac River and surrounded by forested hills. Its remote setting has kept prices low, but appreciation in recent years suggests growing interest. Outdoor enthusiasts are drawn to the area’s hiking and biking trails, and its quiet character makes it attractive to retirees and long-distance commuters.
The town’s home prices rose particularly sharply during the 2020–2022 stretch, mirroring rural market trends nationwide. Though Oldtown remains one of Maryland’s cheapest places to live, its gradual upward trend may appeal to budget-conscious buyers looking for long-term value.
18. Baltimore – 66% Home Price Increase Since 2010
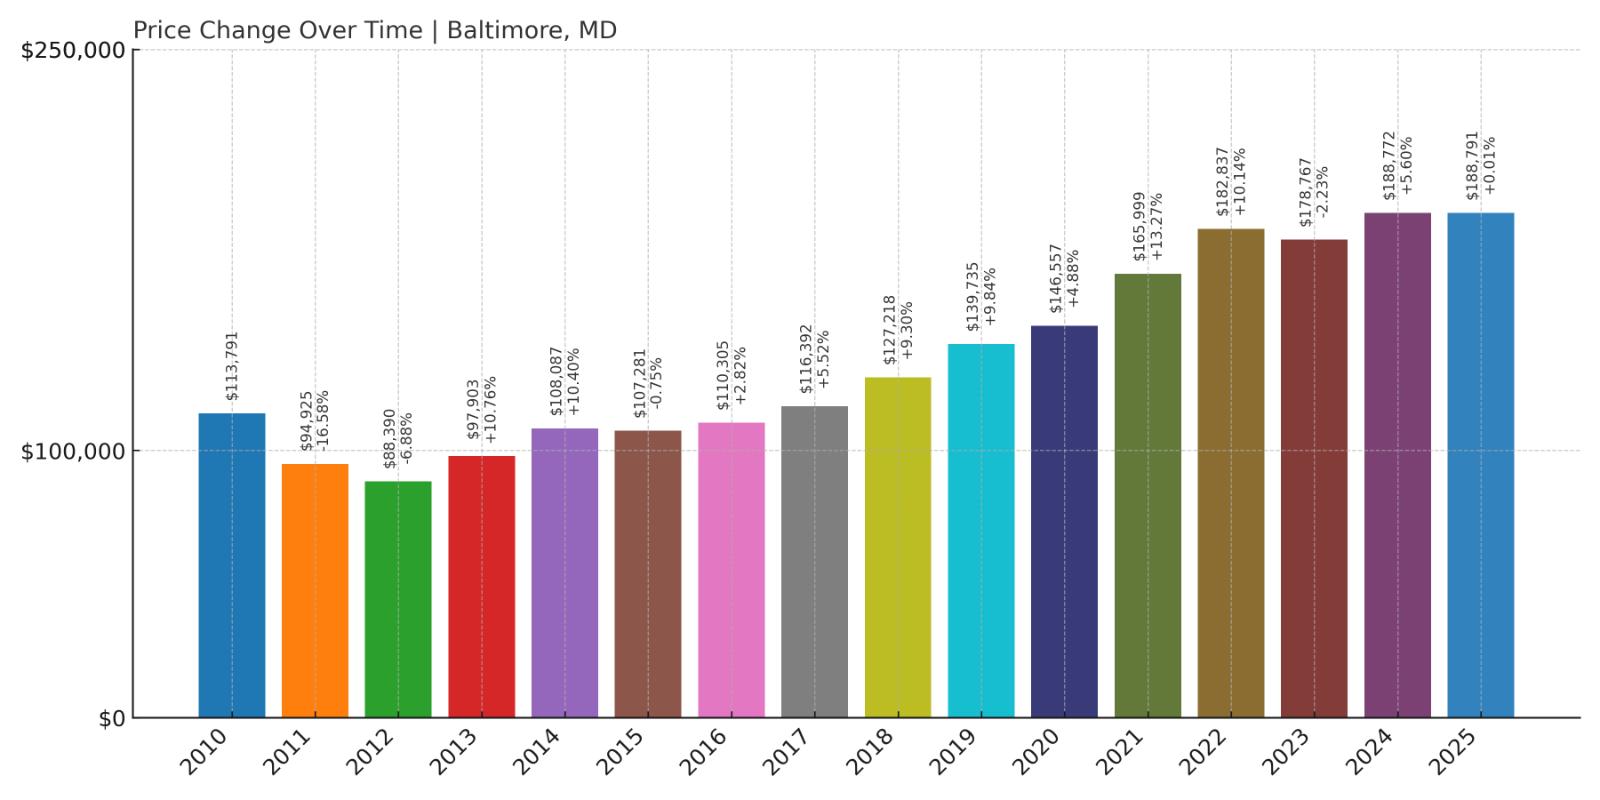
- 2010: $113,791
- 2011: $94,925 (-$18,865, -16.58% from previous year)
- 2012: $88,390 (-$6,536, -6.89% from previous year)
- 2013: $97,903 (+$9,514, +10.76% from previous year)
- 2014: $108,087 (+$10,184, +10.40% from previous year)
- 2015: $107,281 (-$806, -0.75% from previous year)
- 2016: $110,305 (+$3,024, +2.82% from previous year)
- 2017: $116,392 (+$6,087, +5.52% from previous year)
- 2018: $127,218 (+$10,826, +9.30% from previous year)
- 2019: $139,735 (+$12,517, +9.84% from previous year)
- 2020: $146,557 (+$6,822, +4.88% from previous year)
- 2021: $165,999 (+$19,443, +13.27% from previous year)
- 2022: $182,837 (+$16,838, +10.14% from previous year)
- 2023: $178,767 (-$4,071, -2.23% from previous year)
- 2024: $188,772 (+$10,005, +5.60% from previous year)
- 2025: $188,791 (+$19, +0.01% from previous year)
Baltimore’s home prices are up 66% since 2010, despite some dramatic early declines in the wake of the housing crisis. Prices surged between 2017 and 2022, then leveled off. As of 2025, values have largely plateaued just under $189,000, which remains one of the lowest median prices for any major U.S. city.
Baltimore – Big City Affordability with Uneven Growth
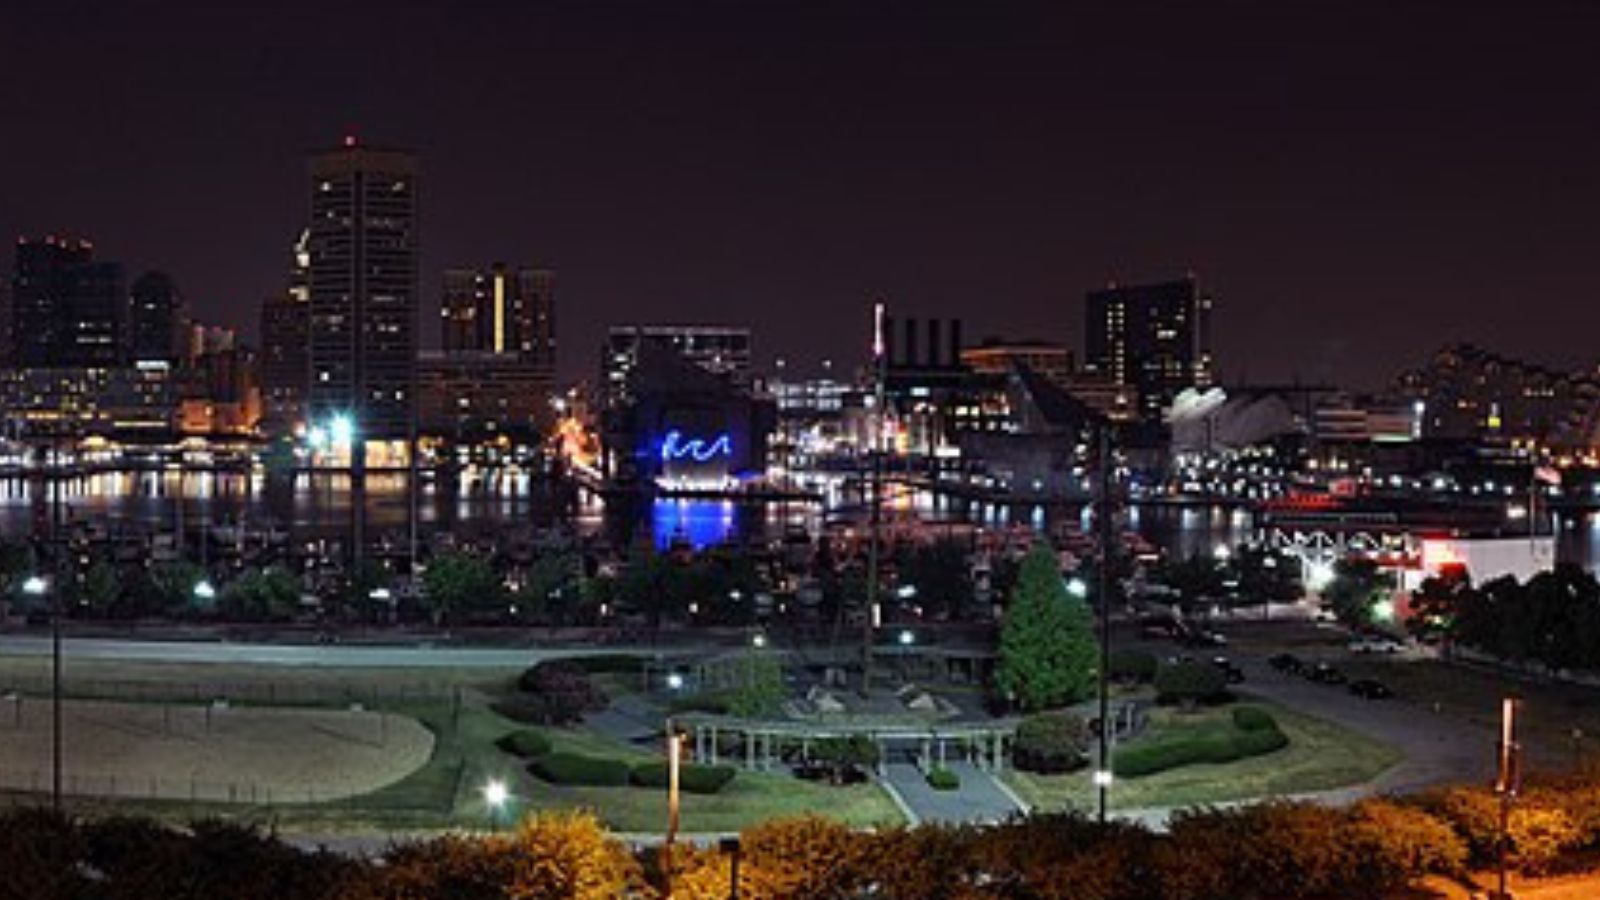
Baltimore is an outlier among large East Coast cities — its home values remain low by national standards. Neighborhood dynamics vary widely, but even popular areas can be surprisingly affordable. While the city has seen revitalization in some corridors, large swaths still face disinvestment, which contributes to the overall affordability picture.
The city’s home values saw some of their biggest jumps during the pandemic, but prices have remained mostly flat since 2023. That could signal a cooling market or simple stabilization after years of sharp growth. For buyers looking for urban amenities without sky-high prices, Baltimore remains an appealing — if complex — option.
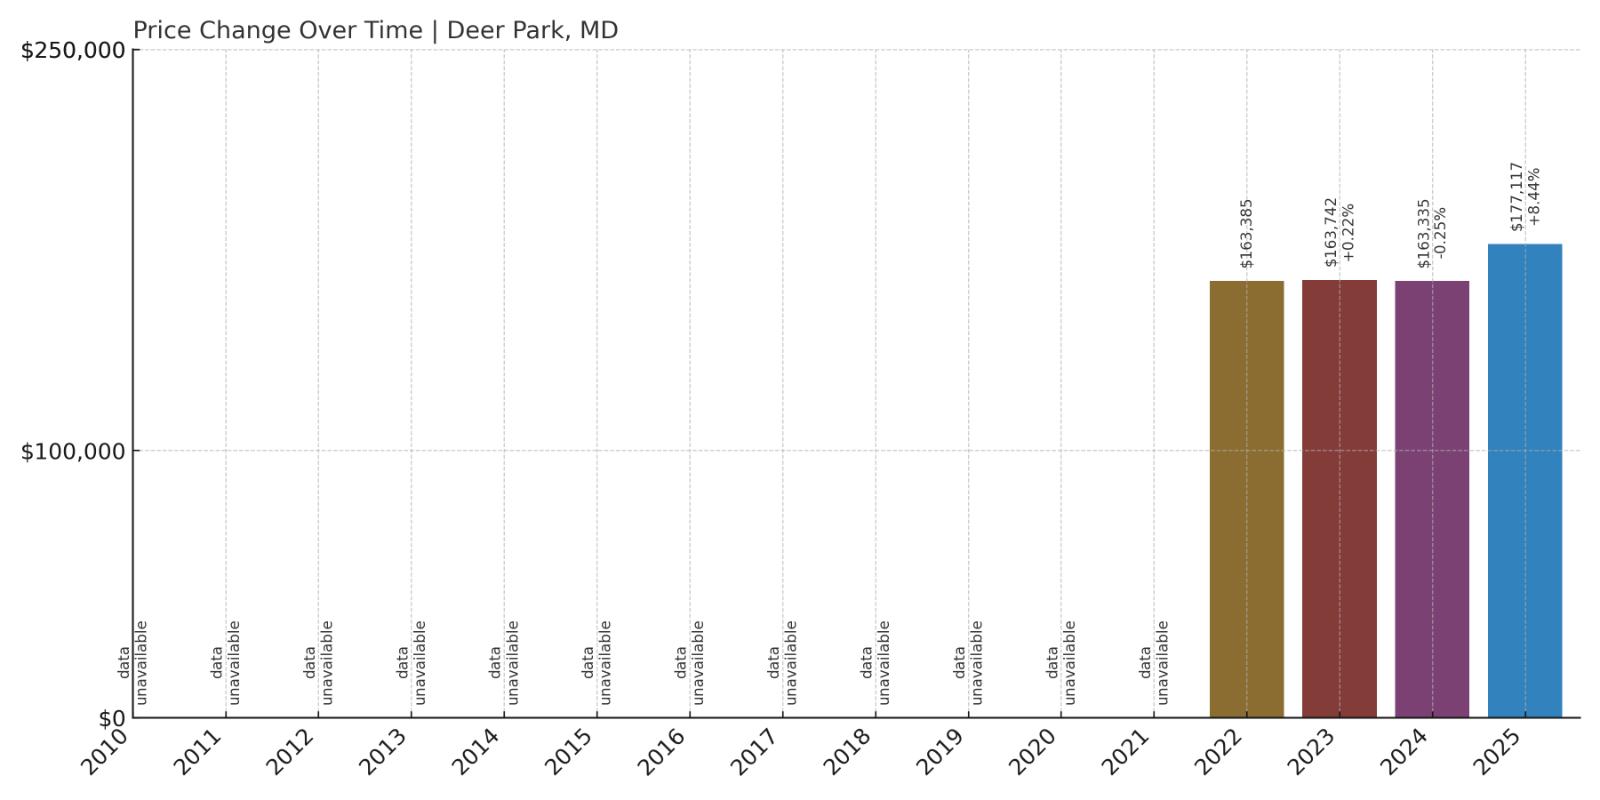
17. Deer Park – 8% Home Price Increase Since 2022
- 2010: N/A
- 2011: N/A
- 2012: N/A
- 2013: N/A
- 2014: N/A
- 2015: N/A
- 2016: N/A
- 2017: N/A
- 2018: N/A
- 2019: N/A
- 2020: N/A
- 2021: N/A
- 2022: $163,385
- 2023: $163,742 (+$358, +0.22% from previous year)
- 2024: $163,335 (-$407, -0.25% from previous year)
- 2025: $177,117 (+$13,782, +8.44% from previous year)
While complete historical data isn’t available, Deer Park’s recent home price trends suggest a quiet market with modest fluctuation. Prices remained nearly flat from 2022 through 2024, before jumping over 8% in the past year. As of June 2025, the typical home price is $177,117 — still well below Maryland’s median.
Deer Park – Small Town Prices with Room to Grow
Deer Park is a rural town in Garrett County, deep in western Maryland near the West Virginia state line. It’s surrounded by wooded hills and not far from Deep Creek Lake, one of the region’s main recreational draws. With no major urban centers nearby, housing here remains some of the most affordable in the state.
Even with limited year-over-year data, the latest increase suggests growing demand — possibly from remote workers or those priced out of other areas. Deer Park offers a laid-back pace and scenic backdrop, making it attractive to buyers seeking peace, land, and small-town community life at a fraction of Maryland’s typical home prices.
16. Frostburg – 67% Home Price Increase Since 2010
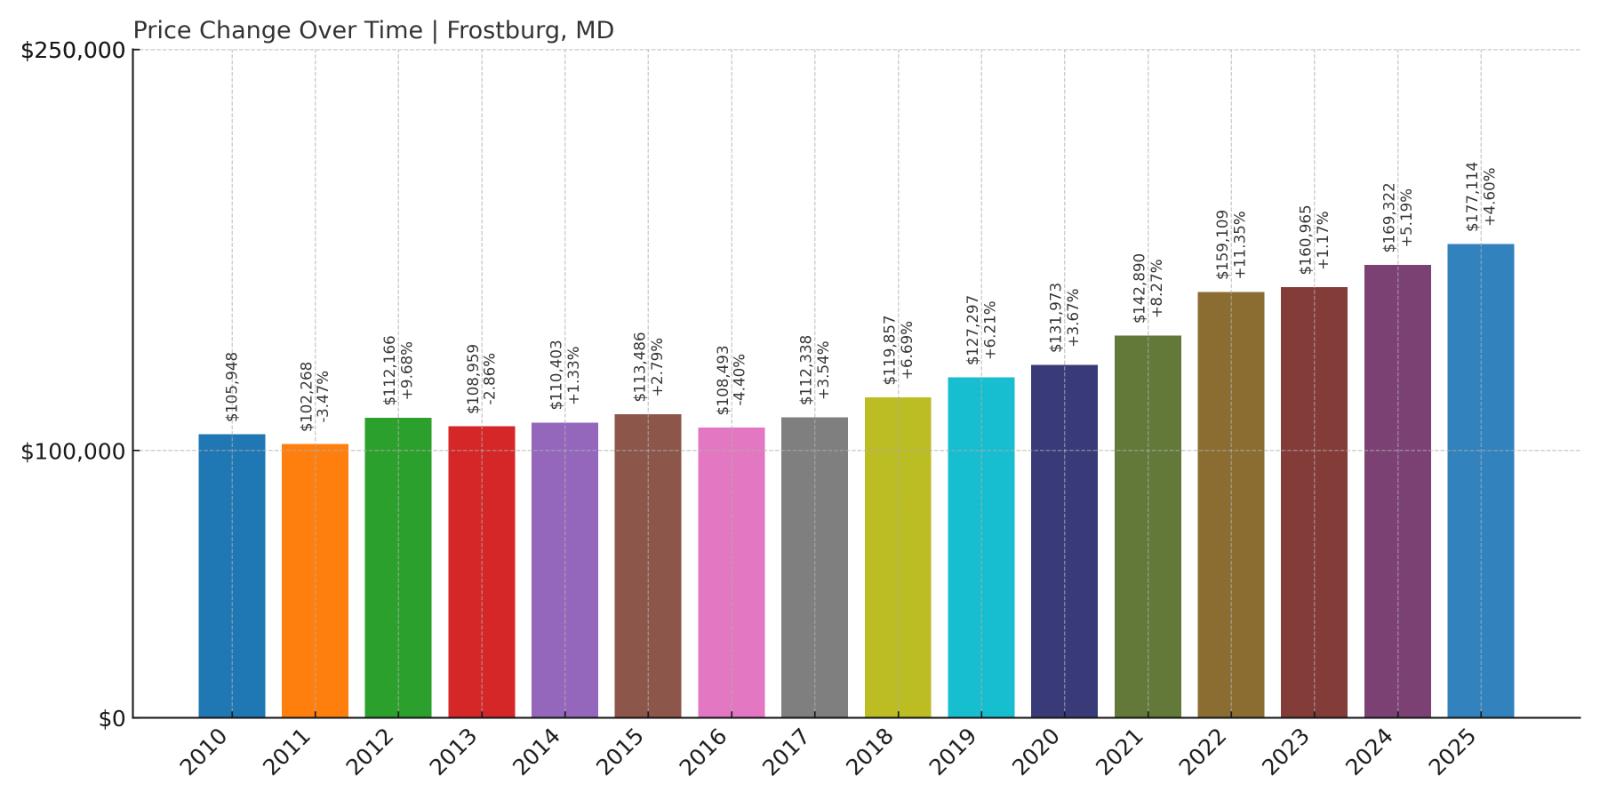
- 2010: $105,948
- 2011: $102,268 (-$3,680, -3.47% from previous year)
- 2012: $112,166 (+$9,898, +9.68% from previous year)
- 2013: $108,959 (-$3,207, -2.86% from previous year)
- 2014: $110,403 (+$1,444, +1.33% from previous year)
- 2015: $113,486 (+$3,083, +2.79% from previous year)
- 2016: $108,493 (-$4,993, -4.40% from previous year)
- 2017: $112,338 (+$3,845, +3.54% from previous year)
- 2018: $119,857 (+$7,519, +6.69% from previous year)
- 2019: $127,297 (+$7,440, +6.21% from previous year)
- 2020: $131,973 (+$4,676, +3.67% from previous year)
- 2021: $142,890 (+$10,916, +8.27% from previous year)
- 2022: $159,109 (+$16,219, +11.35% from previous year)
- 2023: $160,965 (+$1,856, +1.17% from previous year)
- 2024: $169,322 (+$8,357, +5.19% from previous year)
- 2025: $177,114 (+$7,793, +4.60% from previous year)
Frostburg’s home values have risen steadily over the past 15 years, increasing by 67% since 2010. After some small dips earlier in the decade, values picked up speed around 2018 and have continued climbing since. As of 2025, the typical home is priced at just over $177,000 — a figure that remains affordable statewide but shows consistent appreciation.
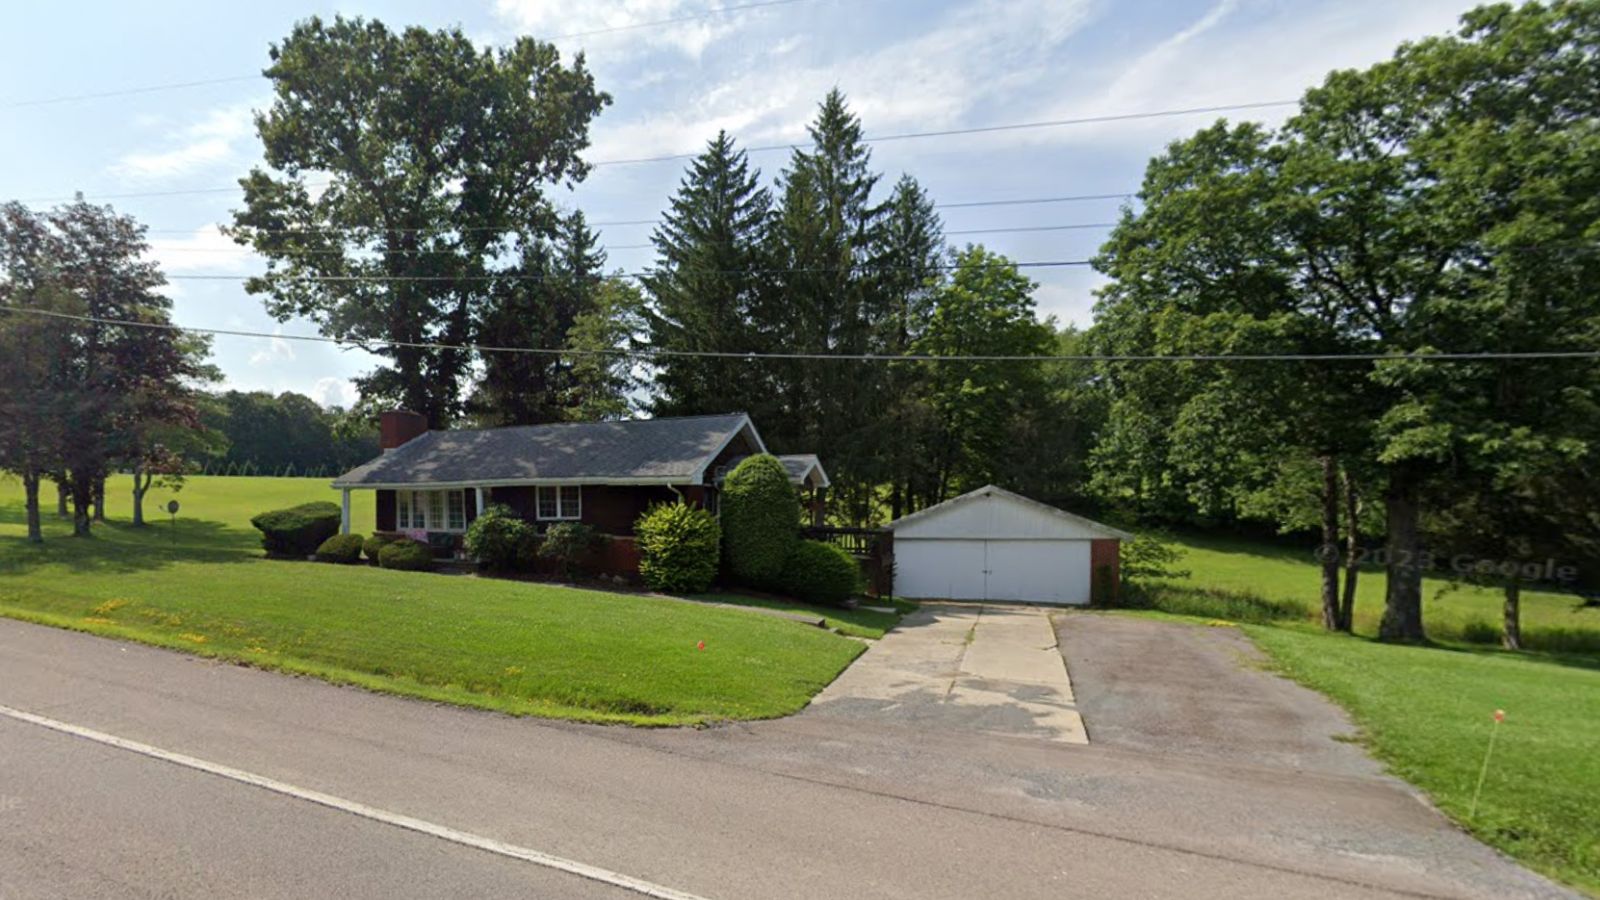
Frostburg – A College Town with Growing Appeal
Home to Frostburg State University, this mountain town in Allegany County blends a youthful energy with a small-town vibe. The local housing market benefits from steady rental demand thanks to student housing, but it’s also become attractive to families and remote workers looking for budget-friendly options.
Frostburg’s market has remained relatively stable, with recent years showing healthy year-over-year gains. The town’s proximity to outdoor attractions like Savage River State Forest and its historic downtown add to its livability. For buyers looking to invest in a college town with long-term affordability, Frostburg is one to watch.
15. Rawlings – 102% Home Price Increase Since 2010
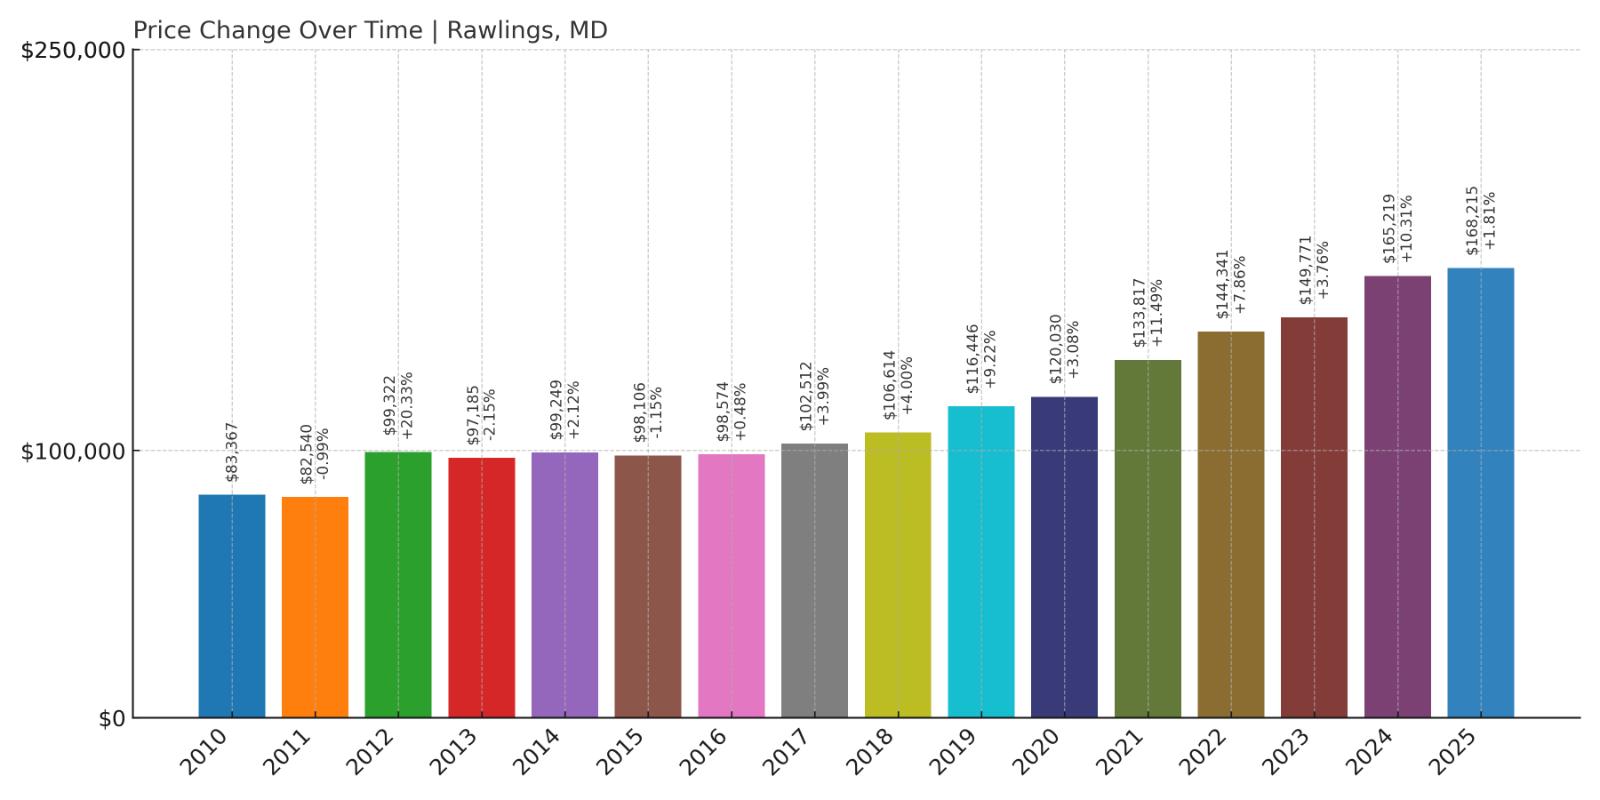
- 2010: $83,367
- 2011: $82,540 (-$827, -0.99% from previous year)
- 2012: $99,322 (+$16,783, +20.33% from previous year)
- 2013: $97,185 (-$2,138, -2.15% from previous year)
- 2014: $99,249 (+$2,064, +2.12% from previous year)
- 2015: $98,106 (-$1,143, -1.15% from previous year)
- 2016: $98,574 (+$468, +0.48% from previous year)
- 2017: $102,512 (+$3,938, +4.00% from previous year)
- 2018: $106,614 (+$4,101, +4.00% from previous year)
- 2019: $116,446 (+$9,832, +9.22% from previous year)
- 2020: $120,030 (+$3,584, +3.08% from previous year)
- 2021: $133,817 (+$13,787, +11.49% from previous year)
- 2022: $144,341 (+$10,525, +7.87% from previous year)
- 2023: $149,771 (+$5,429, +3.76% from previous year)
- 2024: $165,219 (+$15,449, +10.31% from previous year)
- 2025: $168,215 (+$2,995, +1.81% from previous year)
Rawlings has seen home values more than double since 2010, increasing from roughly $83,000 to over $168,000. Growth was especially strong in the early 2010s and again during the pandemic years. Although appreciation slowed slightly in 2025, the market remains on an upward trend.
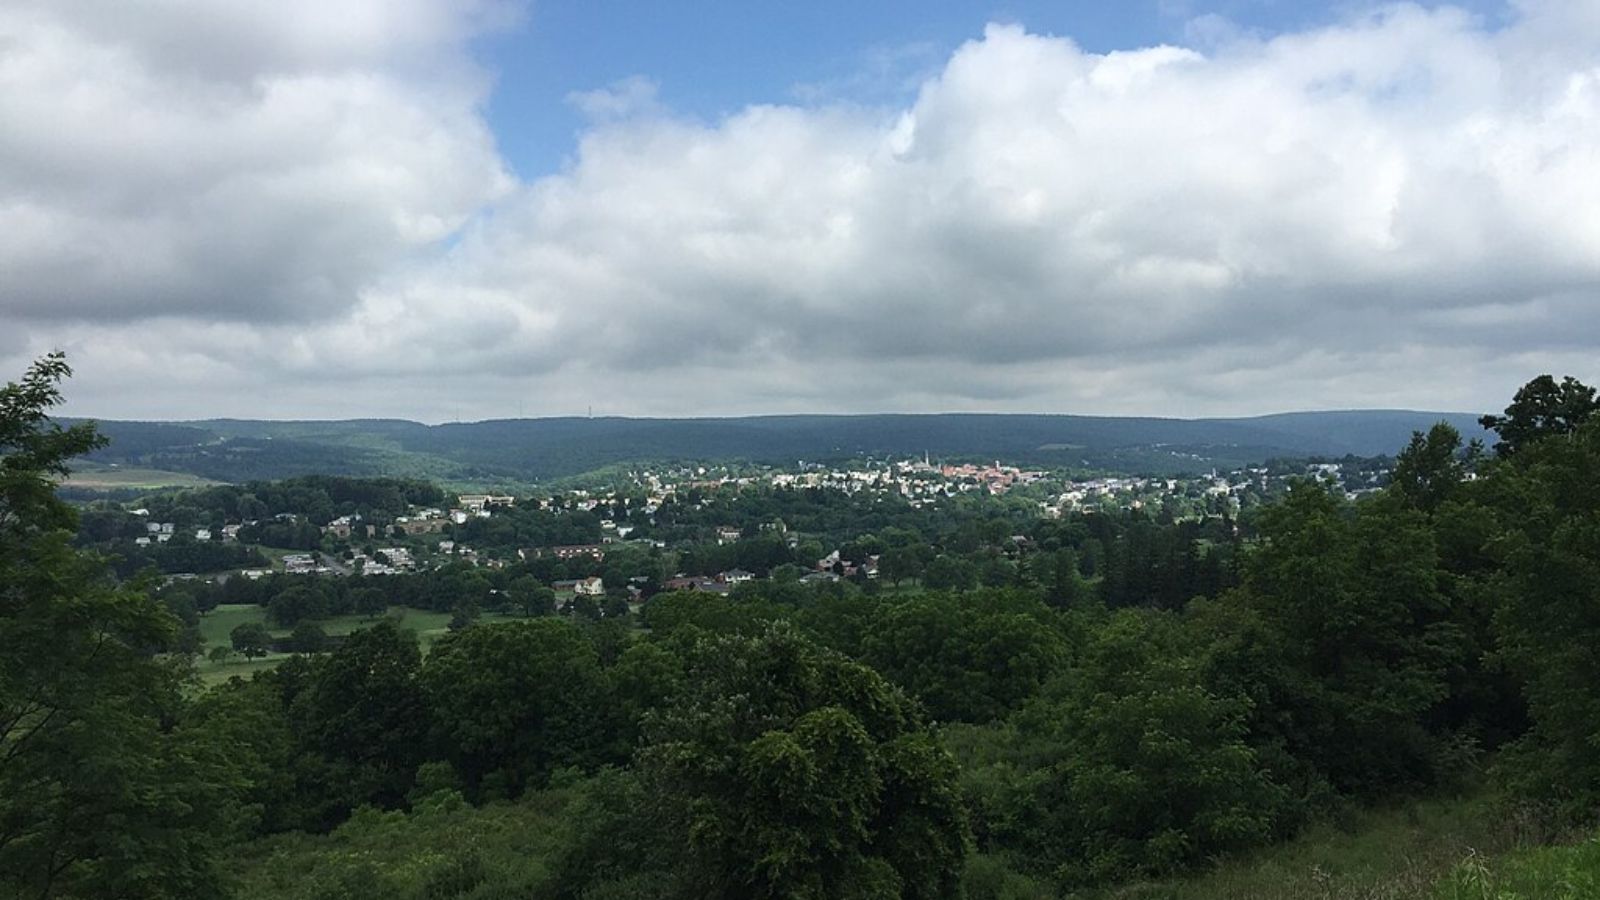
Rawlings – Quiet Country Living with Long-Term Growth

Located just south of Cumberland, Rawlings offers a rural feel with easy access to Route 220 and the Potomac River. Its setting is ideal for buyers who want space and scenery without straying far from basic amenities. Despite its small size, the town has managed to draw interest thanks to its affordability and proximity to public lands.
The market here reflects a pattern of long-term appreciation with a few plateaus. Continued price growth suggests buyer interest hasn’t waned, especially as housing remains tight in nearby cities. For those wanting space, peace, and a low entry point, Rawlings continues to offer good value.
14. Crisfield – 68% Home Price Increase Since 2010
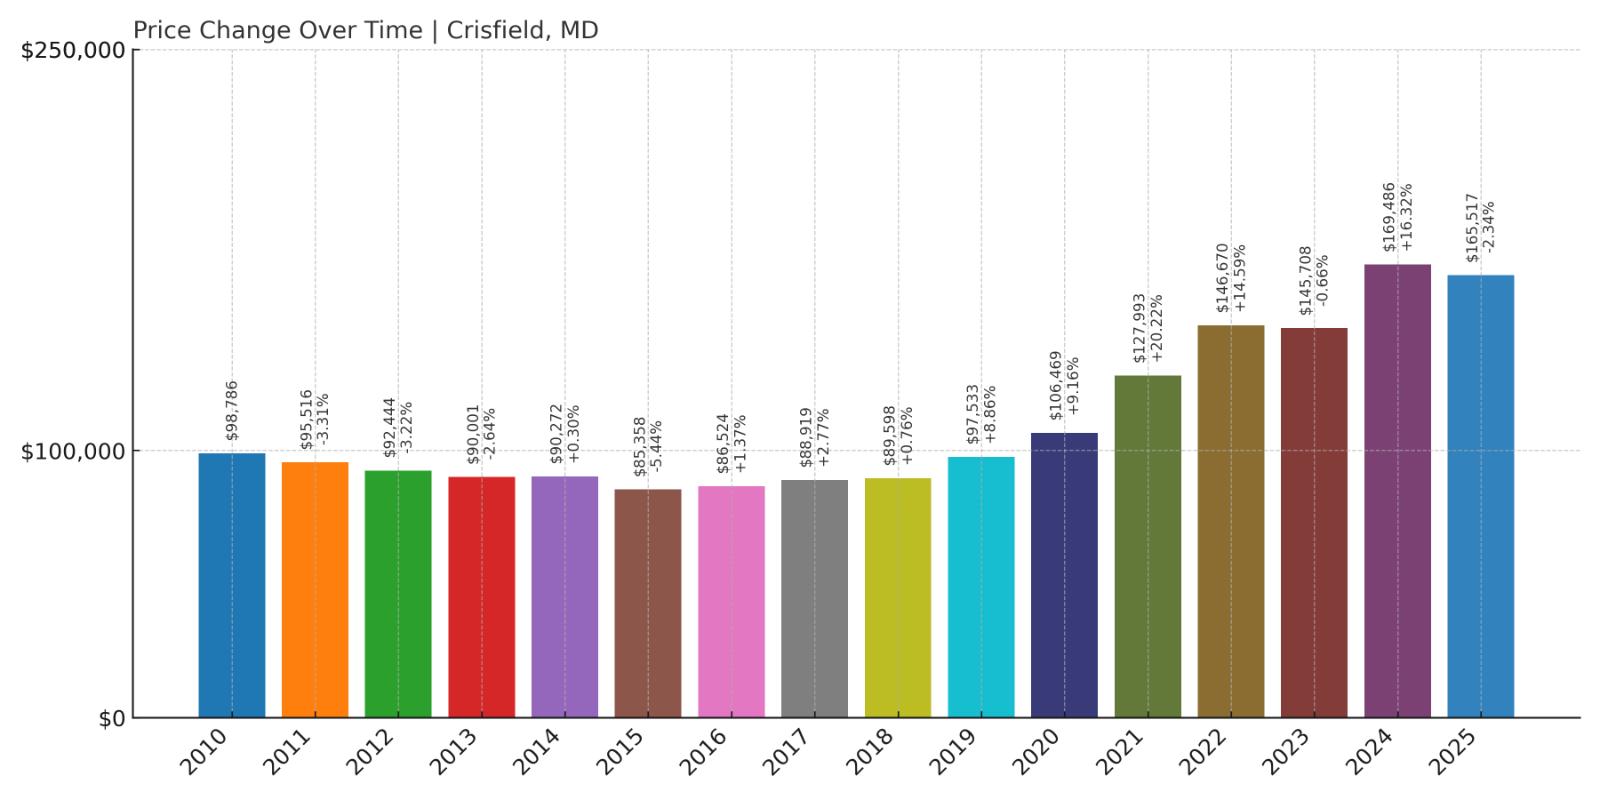
- 2010: $98,786
- 2011: $95,516 (-$3,269, -3.31% from previous year)
- 2012: $92,444 (-$3,072, -3.22% from previous year)
- 2013: $90,001 (-$2,443, -2.64% from previous year)
- 2014: $90,272 (+$271, +0.30% from previous year)
- 2015: $85,358 (-$4,914, -5.44% from previous year)
- 2016: $86,524 (+$1,166, +1.37% from previous year)
- 2017: $88,919 (+$2,395, +2.77% from previous year)
- 2018: $89,598 (+$679, +0.76% from previous year)
- 2019: $97,533 (+$7,935, +8.86% from previous year)
- 2020: $106,469 (+$8,936, +9.16% from previous year)
- 2021: $127,993 (+$21,524, +20.22% from previous year)
- 2022: $146,670 (+$18,677, +14.59% from previous year)
- 2023: $145,708 (-$963, -0.66% from previous year)
- 2024: $169,486 (+$23,778, +16.32% from previous year)
- 2025: $165,517 (-$3,969, -2.34% from previous year)
Crisfield’s home values have increased by 68% since 2010. After years of sluggish performance, prices began rising rapidly starting in 2019, with double-digit gains in multiple years. While 2025 brought a small decline, overall prices remain well above pre-pandemic levels.
Crisfield – A Waterfront Town on the Rise
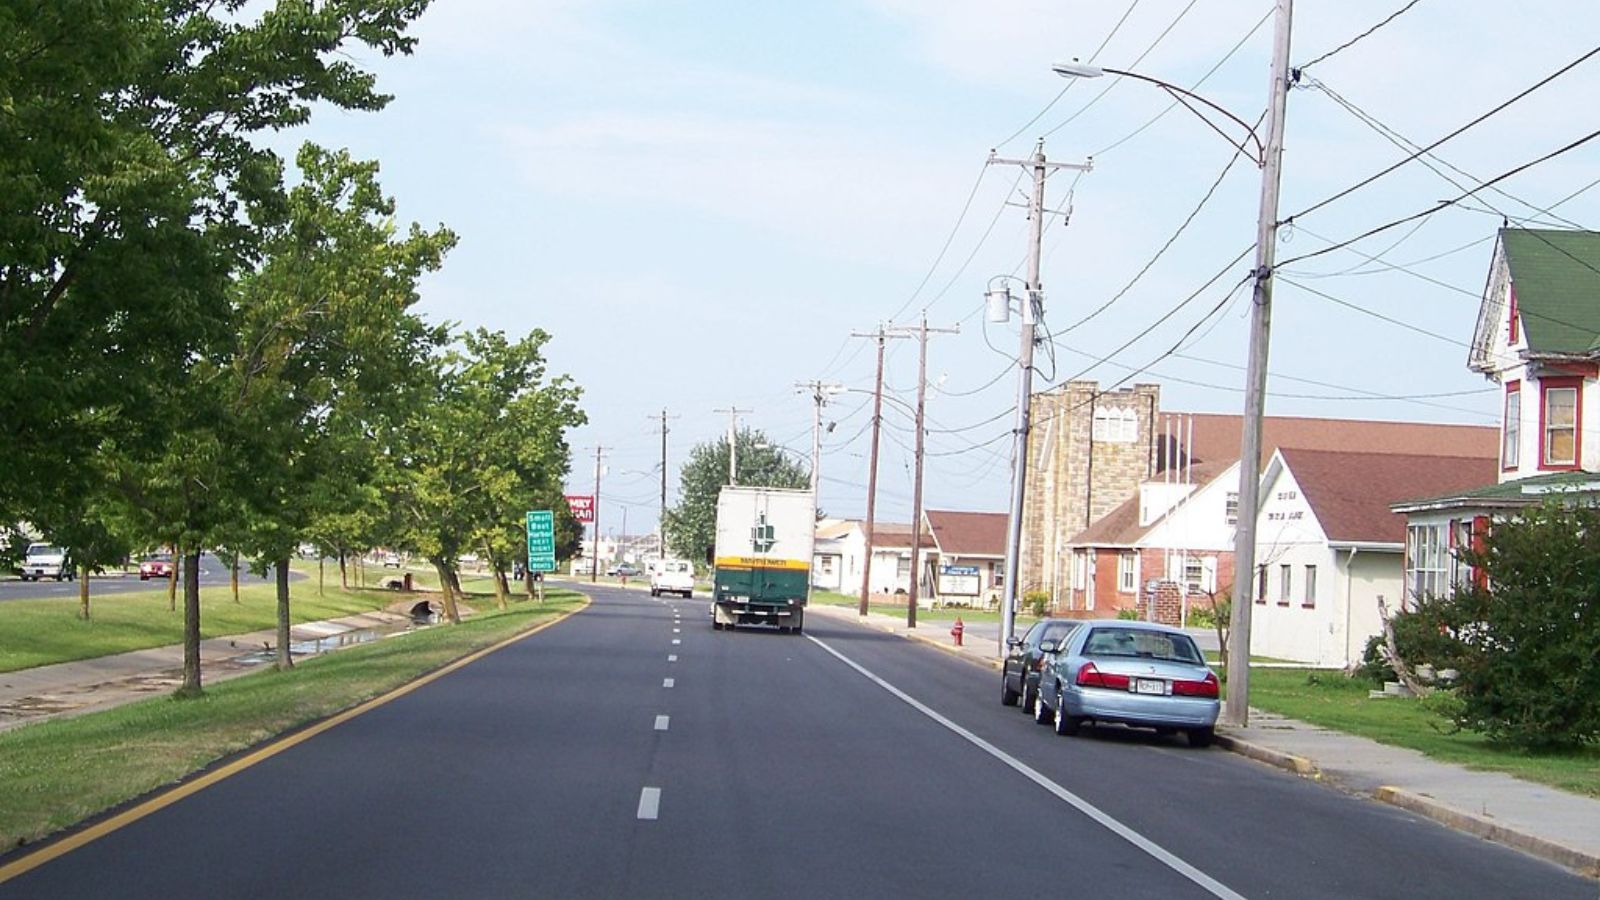
Situated on Maryland’s Eastern Shore, Crisfield is a historic seafood port with views of Tangier Sound. The town has long been known for its blue crabs and maritime heritage, and it’s one of the most affordable coastal communities on the East Coast. Its distance from major metros helps keep prices low — for now.
Renewed interest in waterfront property and remote-friendly living boosted prices in recent years. The sharp appreciation from 2020 to 2024 reflects that momentum. Though 2025 saw a slight pullback, Crisfield’s waterfront access and small-town feel continue to attract new buyers and investors.
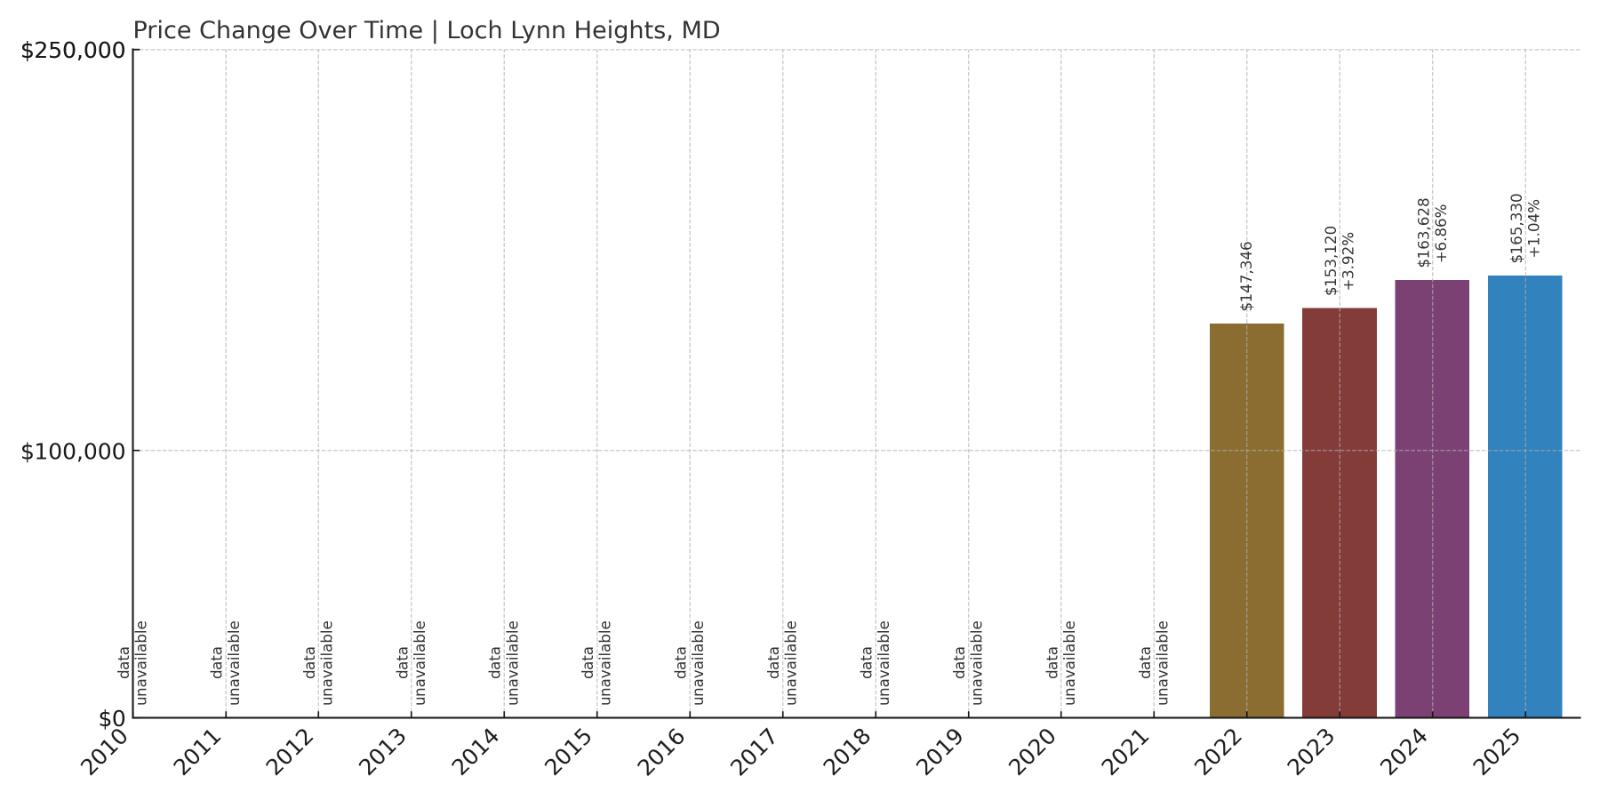
13. Loch Lynn Heights – 12% Home Price Increase Since 2022
- 2010: N/A
- 2011: N/A
- 2012: N/A
- 2013: N/A
- 2014: N/A
- 2015: N/A
- 2016: N/A
- 2017: N/A
- 2018: N/A
- 2019: N/A
- 2020: N/A
- 2021: N/A
- 2022: $147,346
- 2023: $153,120 (+$5,774, +3.92% from previous year)
- 2024: $163,628 (+$10,509, +6.86% from previous year)
- 2025: $165,330 (+$1,701, +1.04% from previous year)
Loch Lynn Heights has limited historical data, but recent years show a stable upward trajectory. From 2022 to 2025, home values increased by 12%, with consistent year-over-year growth. As of this year, the average home value sits just over $165,000.
Loch Lynn Heights – A Growing Spot in Western Maryland
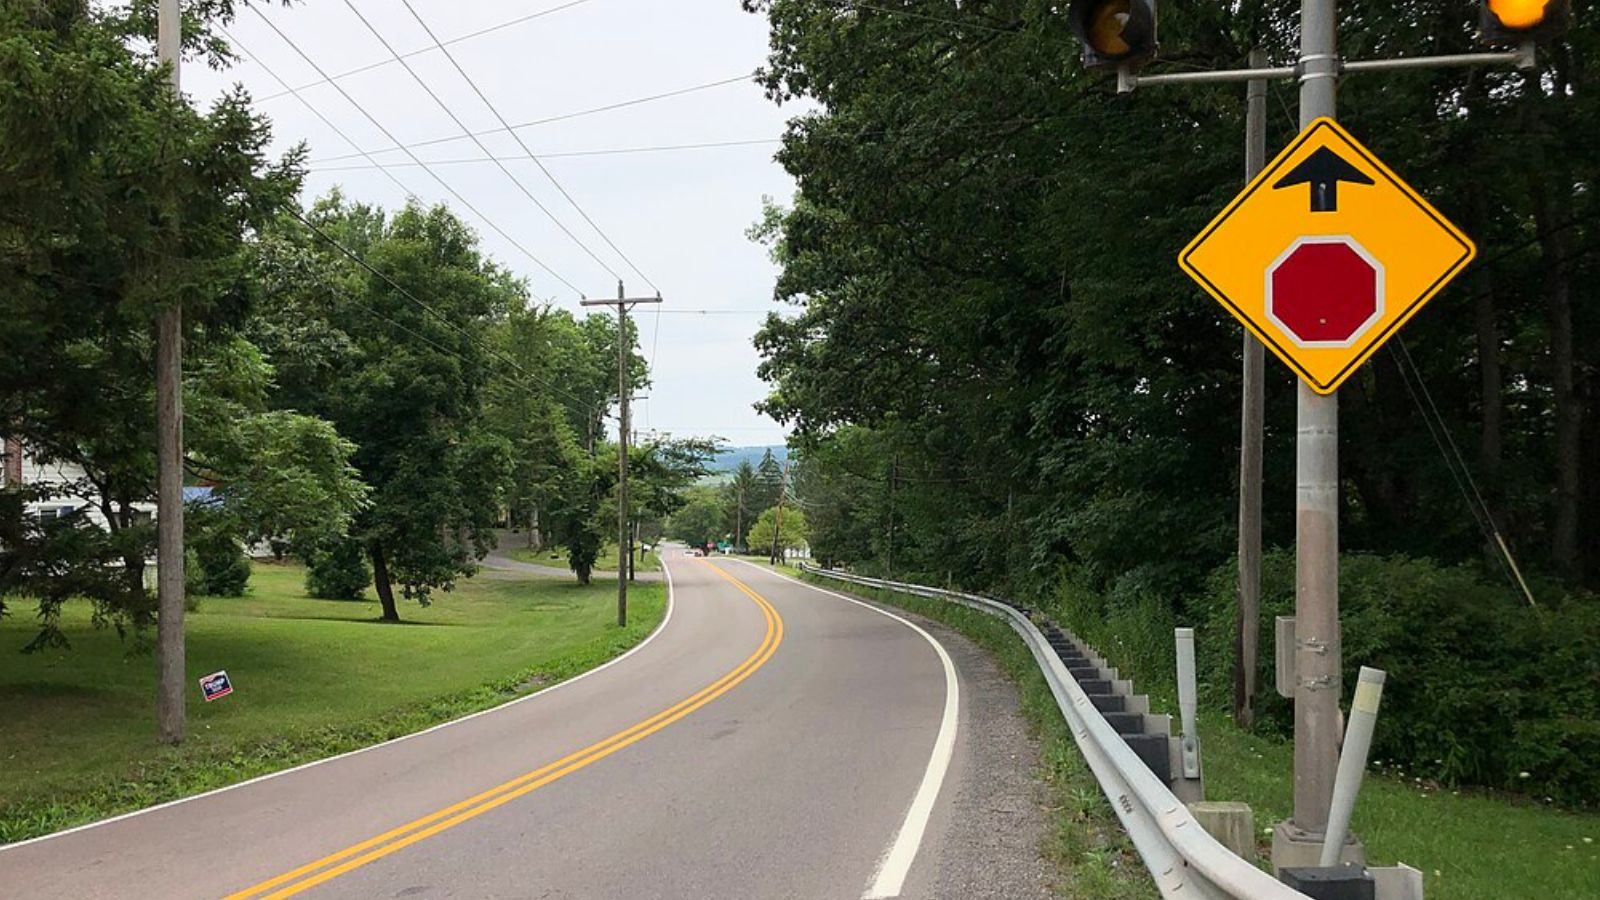
This small town is located near Oakland in Garrett County, surrounded by state parks, lakes, and mountain views. While it’s largely residential and low-key, it offers easy access to Deep Creek Lake and other recreational attractions. The affordable price point is a draw for families and first-time buyers alike.
With no data prior to 2022, it’s difficult to trace long-term trends, but recent growth suggests an active market. Loch Lynn Heights appears to be gaining momentum — and for buyers priced out of Deep Creek and Oakland, this could be the next best bet.
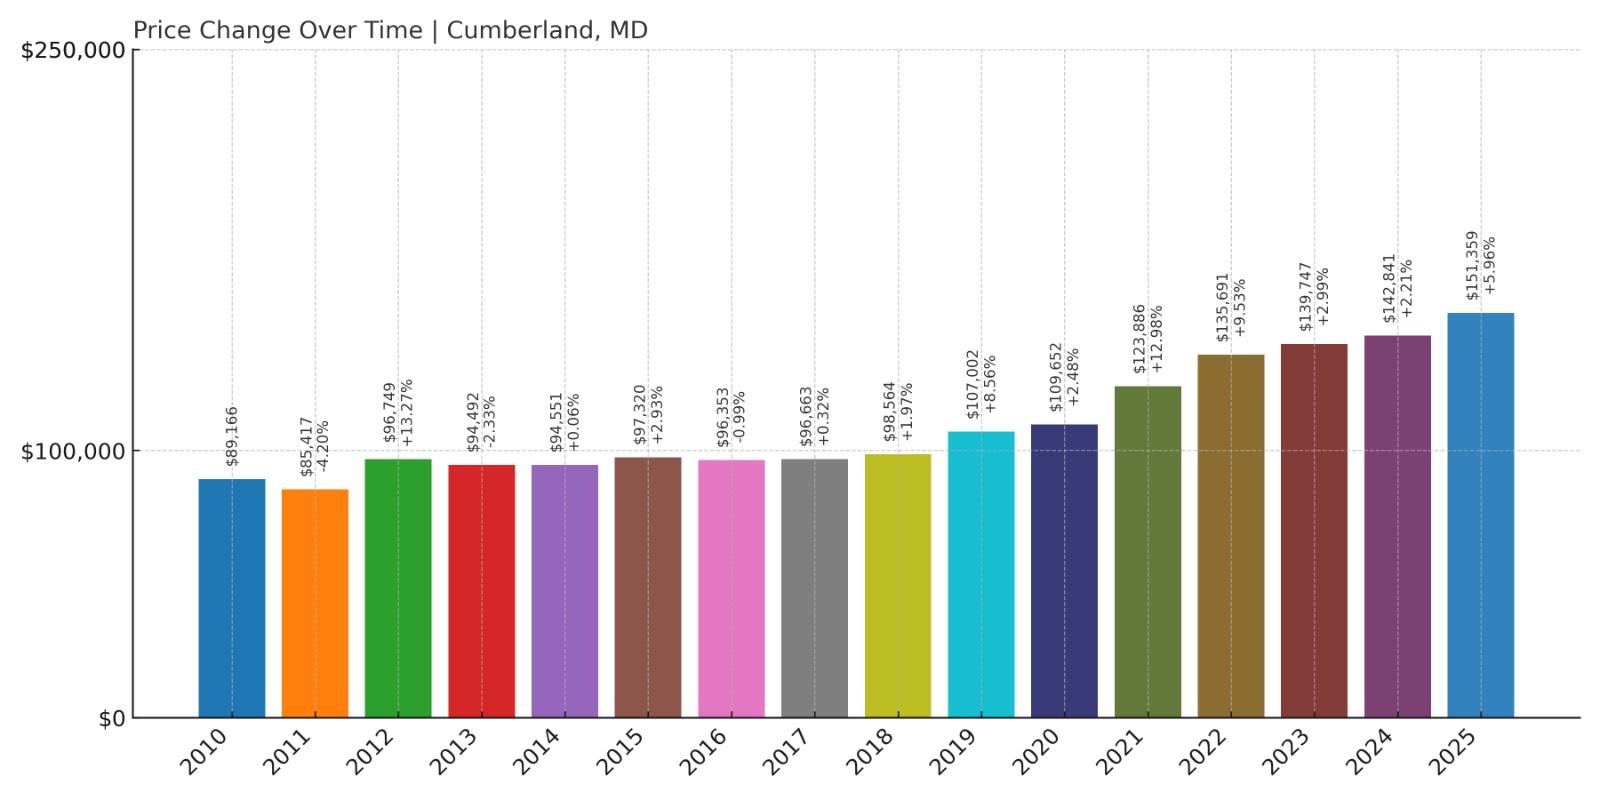
12. Cumberland – 70% Home Price Increase Since 2010
Would you like to save this?
- 2010: $89,166
- 2011: $85,417 (-$3,749, -4.20% from previous year)
- 2012: $96,749 (+$11,332, +13.27% from previous year)
- 2013: $94,492 (-$2,257, -2.33% from previous year)
- 2014: $94,551 (+$58, +0.06% from previous year)
- 2015: $97,320 (+$2,770, +2.93% from previous year)
- 2016: $96,353 (-$967, -0.99% from previous year)
- 2017: $96,663 (+$310, +0.32% from previous year)
- 2018: $98,564 (+$1,901, +1.97% from previous year)
- 2019: $107,002 (+$8,438, +8.56% from previous year)
- 2020: $109,652 (+$2,650, +2.48% from previous year)
- 2021: $123,886 (+$14,234, +12.98% from previous year)
- 2022: $135,691 (+$11,805, +9.53% from previous year)
- 2023: $139,747 (+$4,057, +2.99% from previous year)
- 2024: $142,841 (+$3,094, +2.21% from previous year)
- 2025: $151,359 (+$8,518, +5.96% from previous year)
Cumberland’s home prices have climbed 70% since 2010, rising from under $90,000 to more than $151,000 in 2025. While growth was modest during the early 2010s, appreciation accelerated starting in 2019, with consistent gains each year since. The city remains one of Maryland’s most affordable urban areas.
Cumberland – Historic Charm and Budget-Friendly Homes
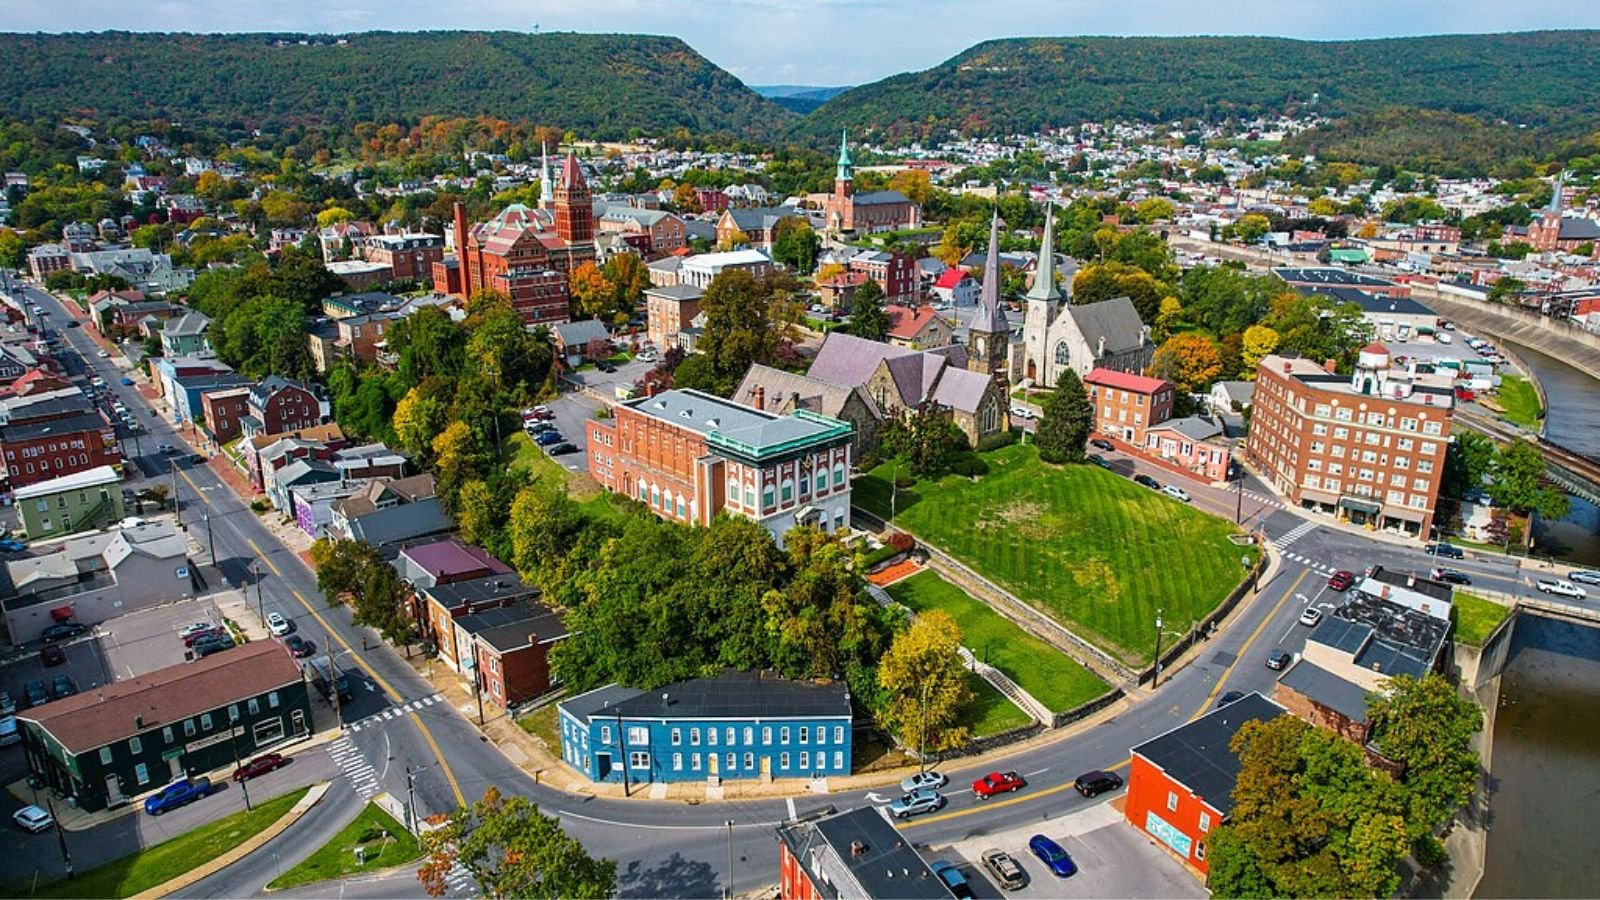
Located in the western mountains of Maryland near the West Virginia border, Cumberland has a long history as a transportation hub and gateway to the Appalachian region. Its downtown features historic architecture, and the surrounding hills offer hiking, biking, and scenic drives — all of which add to its appeal.
While job growth has been slow, the town’s affordability and setting have drawn buyers looking for lower-cost alternatives to metro Maryland. Cumberland’s steady home price increases over the past few years suggest renewed confidence in this small city’s future, especially among remote workers and retirees.
11. Wingate – 1% Home Price Increase Since 2022

- 2010: N/A
- 2011: N/A
- 2012: N/A
- 2013: N/A
- 2014: N/A
- 2015: N/A
- 2016: N/A
- 2017: N/A
- 2018: N/A
- 2019: N/A
- 2020: N/A
- 2021: N/A
- 2022: $126,688
- 2023: $123,273 (-$3,415, -2.70% from previous year)
- 2024: $128,572 (+$5,299, +4.30% from previous year)
- 2025: $127,799 (-$774, -0.60% from previous year)
Wingate’s prices have remained relatively flat since 2022, gaining just 1% overall. While values dipped slightly in 2023 and again in 2025, 2024 saw a brief upswing. With a current home value just under $128,000, Wingate stays solidly in Maryland’s affordable tier.
Wingate – Remote, Rural, and Under the Radar
Wingate is a tiny, unincorporated community in Dorchester County, nestled deep in the wetlands of Maryland’s Eastern Shore. Its rural setting, far from commercial centers, makes it one of the most secluded places in the state — and one of the cheapest for buyers seeking solitude.
Given its geography and small housing stock, the local real estate market tends to be quiet. That’s reflected in the minimal price changes year-over-year. For those comfortable with isolation and drawn to nature — including proximity to Blackwater National Wildlife Refuge — Wingate offers unmatched privacy at a low price.
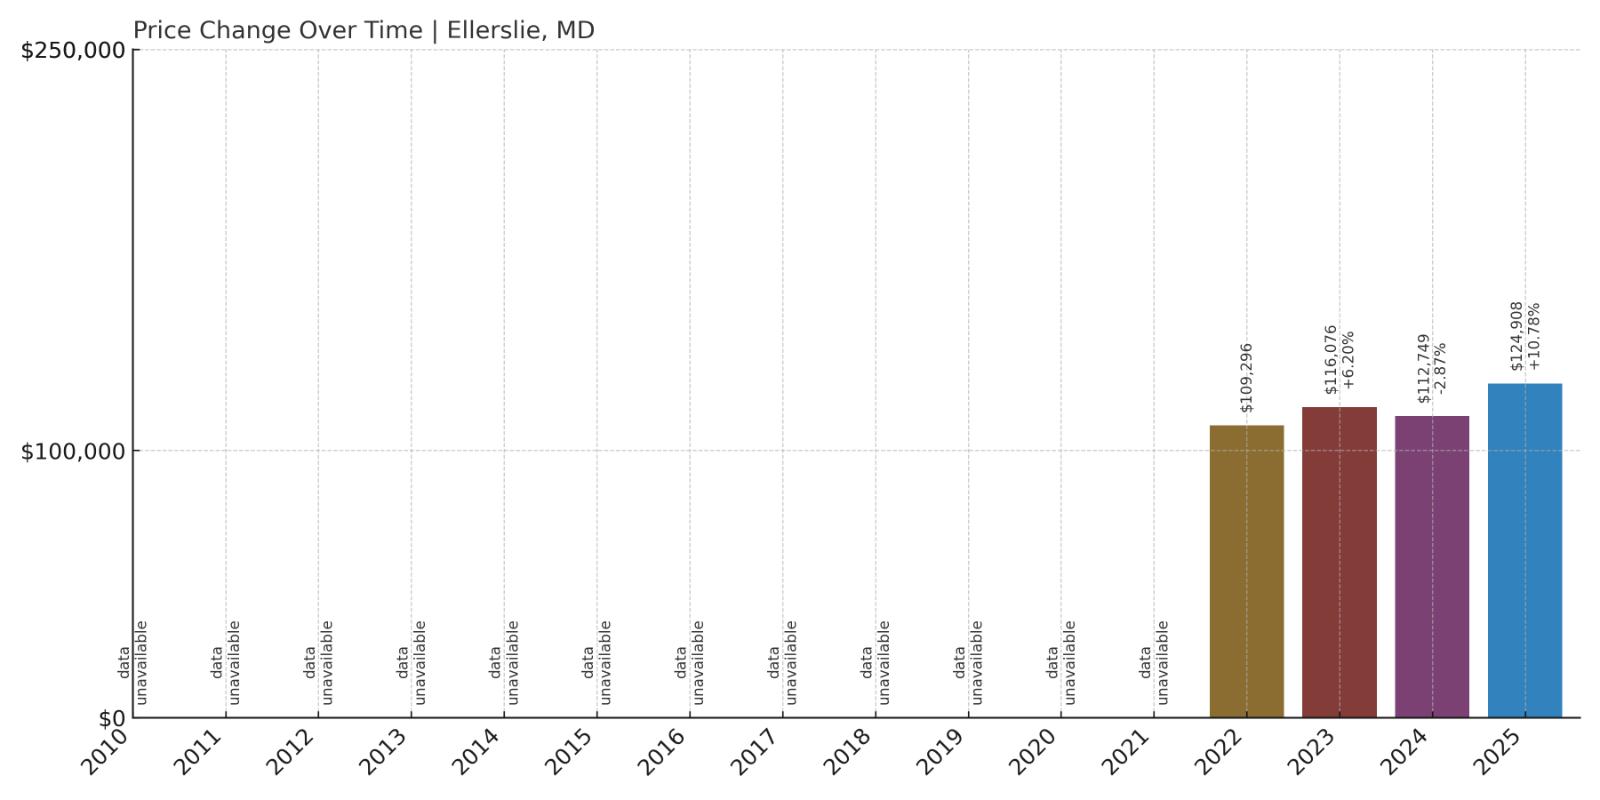
10. Ellerslie – 14% Home Price Increase Since 2022
- 2010: N/A
- 2011: N/A
- 2012: N/A
- 2013: N/A
- 2014: N/A
- 2015: N/A
- 2016: N/A
- 2017: N/A
- 2018: N/A
- 2019: N/A
- 2020: N/A
- 2021: N/A
- 2022: $109,296
- 2023: $116,076 (+$6,779, +6.20% from previous year)
- 2024: $112,749 (-$3,327, -2.87% from previous year)
- 2025: $124,908 (+$12,159, +10.78% from previous year)
Though only three years of data are available, Ellerslie shows a net increase of 14% in home prices since 2022. After a dip in 2024, prices bounced back sharply in 2025, pushing the typical home value to nearly $125,000 — still one of the lowest in the state.
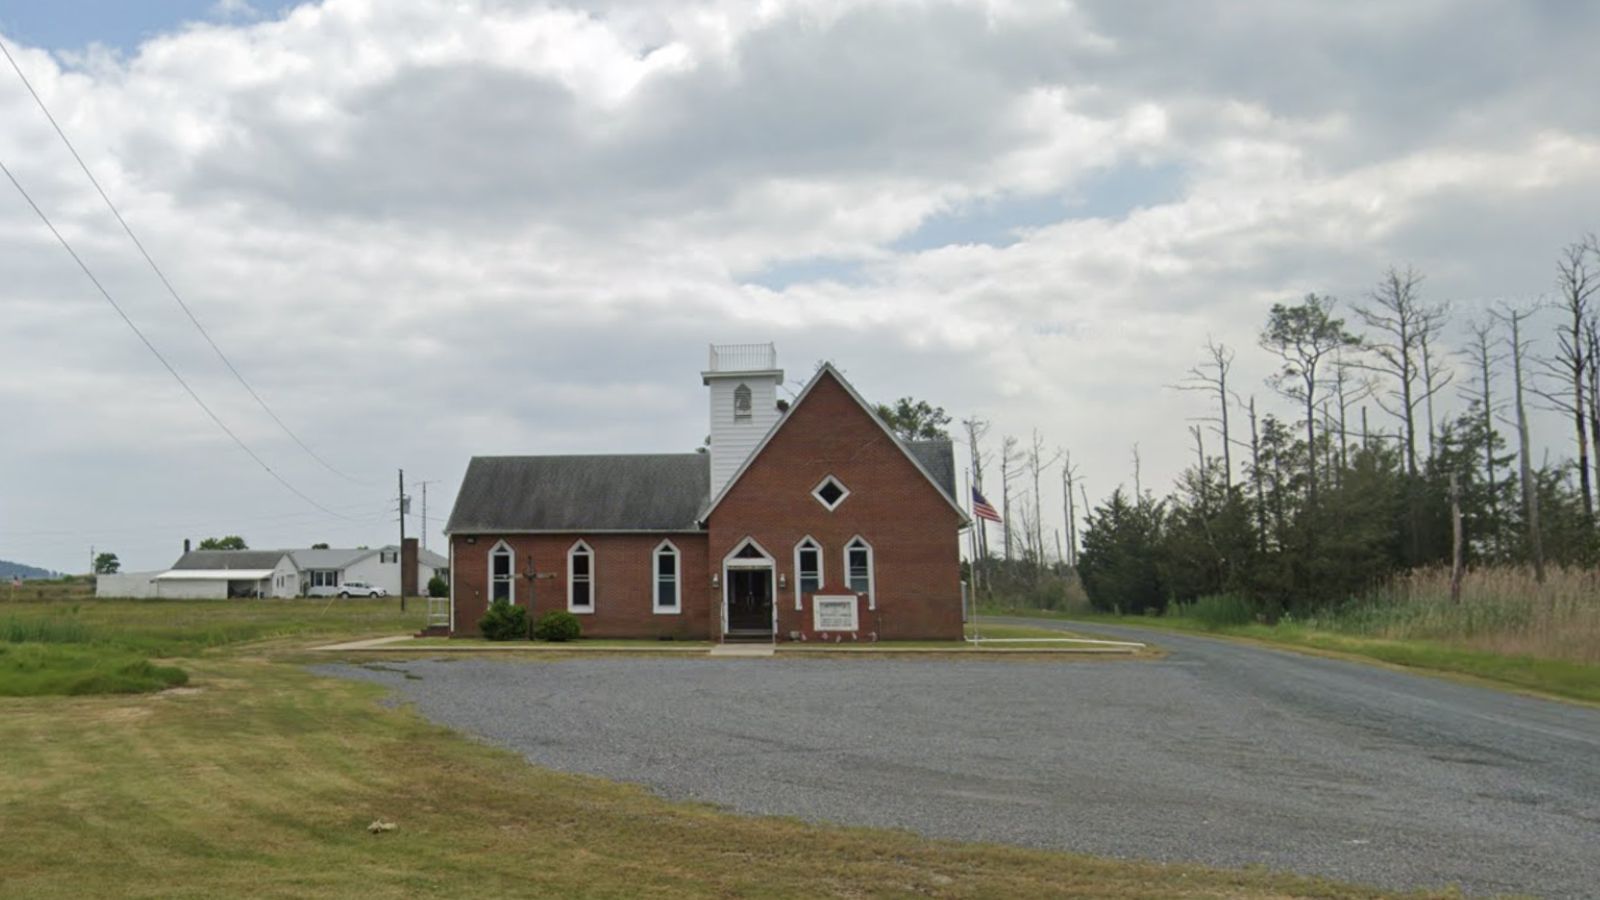
Ellerslie – Quiet Value Along the Pennsylvania Line
Ellerslie is a small community in Allegany County located right on the border with Pennsylvania. With a limited housing supply and minimal development pressure, prices here have remained extremely low, even as nearby towns have crept upward.
The 2025 price jump could indicate a shift in demand or simply reflect a few higher-value sales in a small market. Either way, the town remains affordable and quiet, with access to nearby Cumberland just a few minutes away. It’s a solid choice for buyers seeking affordability and access to scenic mountain landscapes.
9. Midland – 15% Home Price Increase Since 2022

- 2010: N/A
- 2011: N/A
- 2012: N/A
- 2013: N/A
- 2014: N/A
- 2015: N/A
- 2016: N/A
- 2017: N/A
- 2018: N/A
- 2019: N/A
- 2020: N/A
- 2021: N/A
- 2022: $107,351
- 2023: $112,842 (+$5,492, +5.12% from previous year)
- 2024: $121,946 (+$9,104, +8.07% from previous year)
- 2025: $122,938 (+$992, +0.81% from previous year)
Midland’s home values have increased 15% since 2022, rising steadily each year. Although 2025’s growth was minor, the trend remains positive overall, with the current average price reaching just under $123,000.
Midland – Small-Town Living in the Mountains
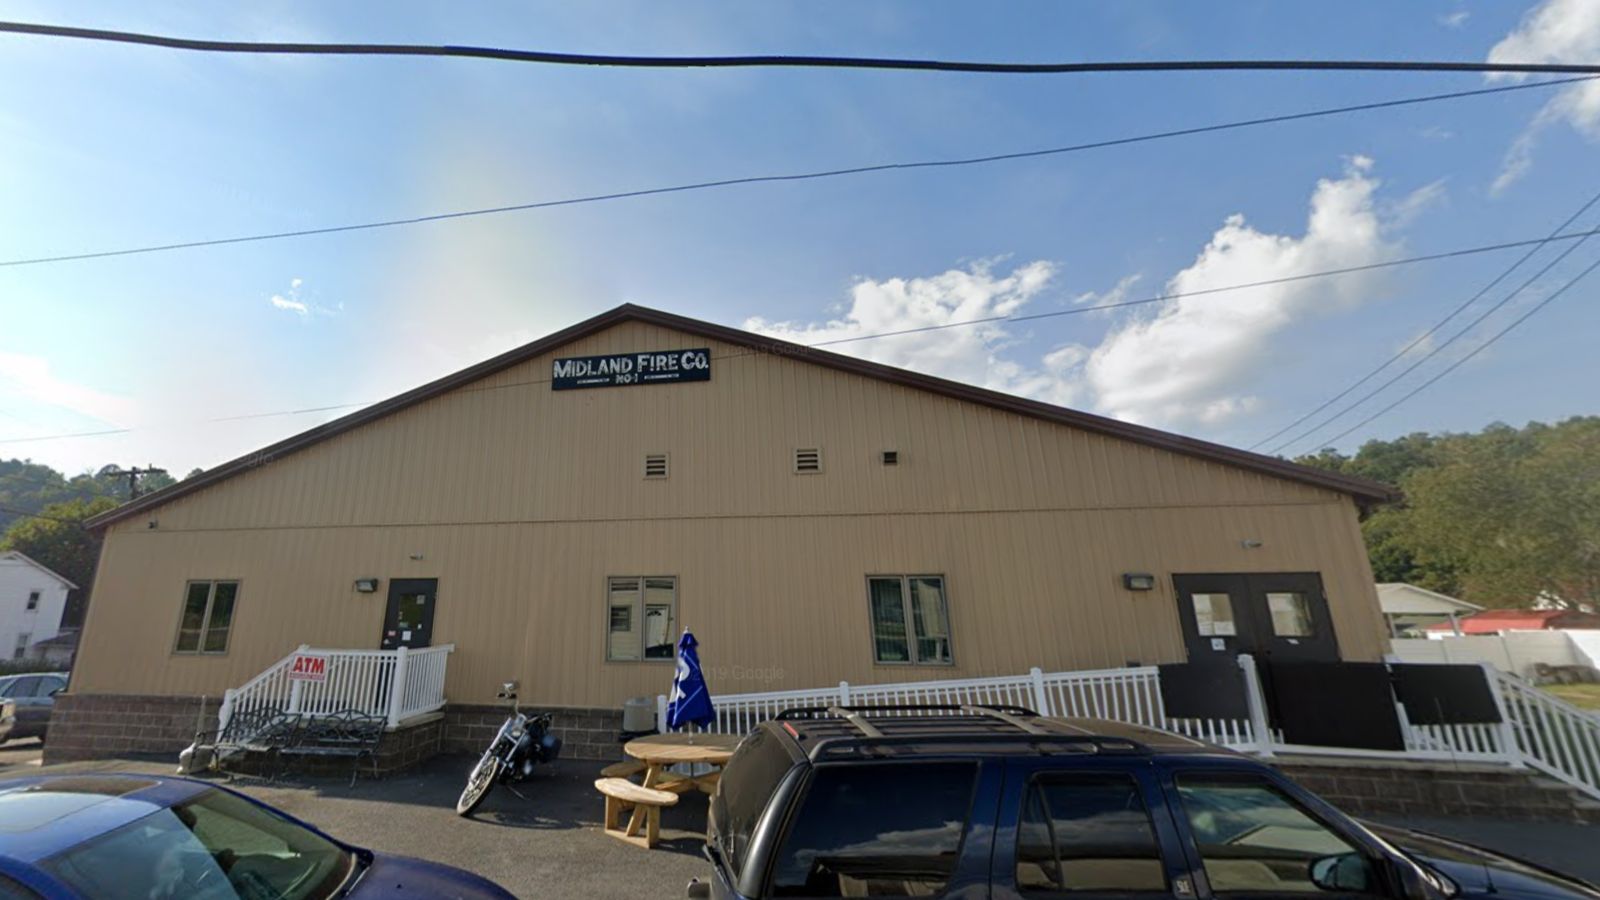
Midland is a former coal town tucked into the Georges Creek Valley of Allegany County. It’s surrounded by hills and close to other affordable communities like Lonaconing and Frostburg. Its roots in mining and blue-collar industry are still visible, but its quiet streets and modest homes appeal to today’s value-focused buyers.
Like many of its neighbors, Midland hasn’t seen rapid growth, but its affordability and stability are a draw. It remains well below state median prices and offers a chance to buy a home in a scenic part of western Maryland without overextending financially.
8. Lonaconing – 8% Home Price Increase Since 2022
- 2010: N/A
- 2011: N/A
- 2012: N/A
- 2013: N/A
- 2014: N/A
- 2015: N/A
- 2016: N/A
- 2017: N/A
- 2018: N/A
- 2019: N/A
- 2020: N/A
- 2021: N/A
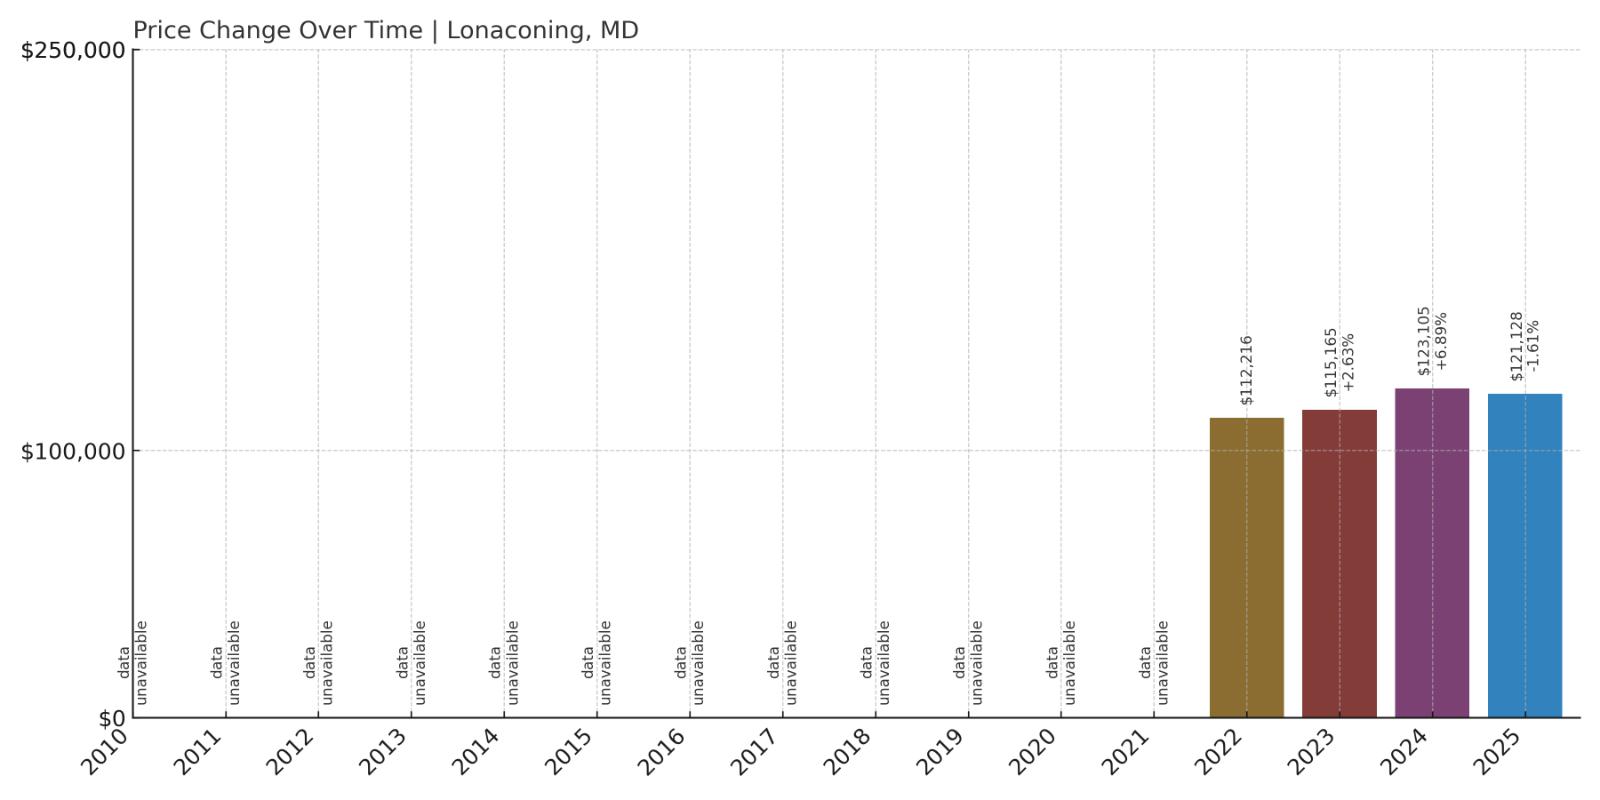
- 2022: $112,216
- 2023: $115,165 (+$2,949, +2.63% from previous year)
- 2024: $123,105 (+$7,940, +6.89% from previous year)
- 2025: $121,128 (-$1,977, -1.61% from previous year)
Since 2022, home prices in Lonaconing have gone up about 8%, despite a small decline in 2025. Most of the growth occurred in 2023 and 2024, when values climbed by nearly 10% combined. Prices now hover just above $121,000.
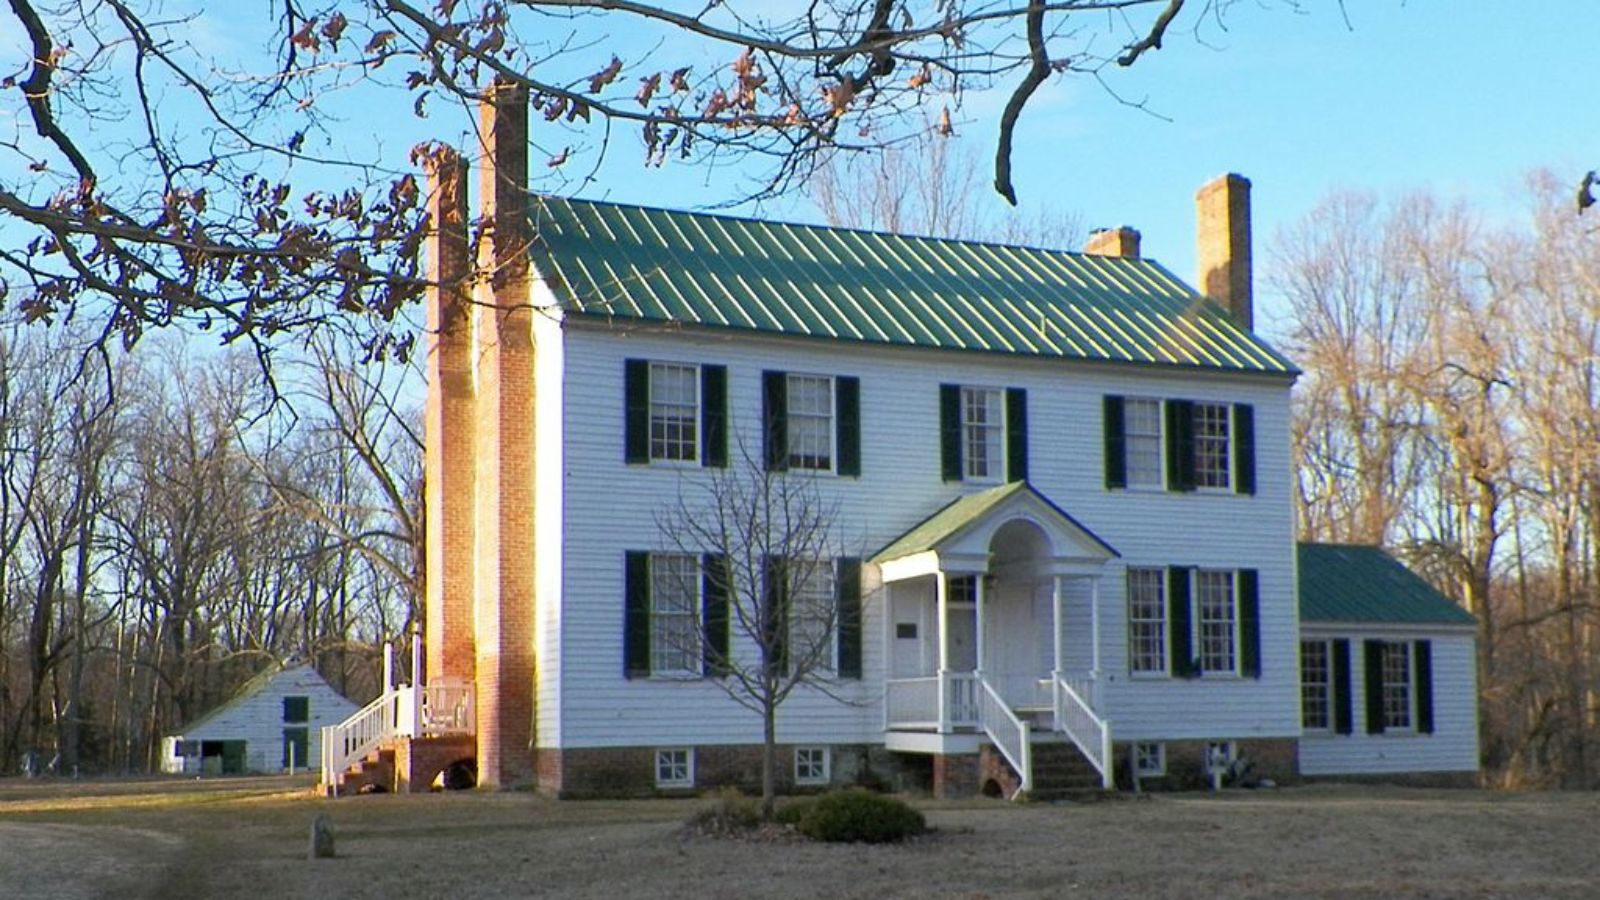
Lonaconing – Affordable and Historic in Western Maryland
Lonaconing is another town in the Georges Creek area, rich in history from its days as a coal mining hub. It retains a historic character, with narrow streets, older homes, and a close-knit feel. Though jobs in the area are limited, its affordability makes it attractive to budget-conscious buyers and investors alike.
Recent gains suggest demand is picking up — likely from buyers priced out of Cumberland and Frostburg. Still, Lonaconing remains firmly among the cheapest places to buy in the state, especially for those willing to invest in a town with deep roots and potential for growth.
7. Mount Savage – 75% Home Price Increase Since 2010
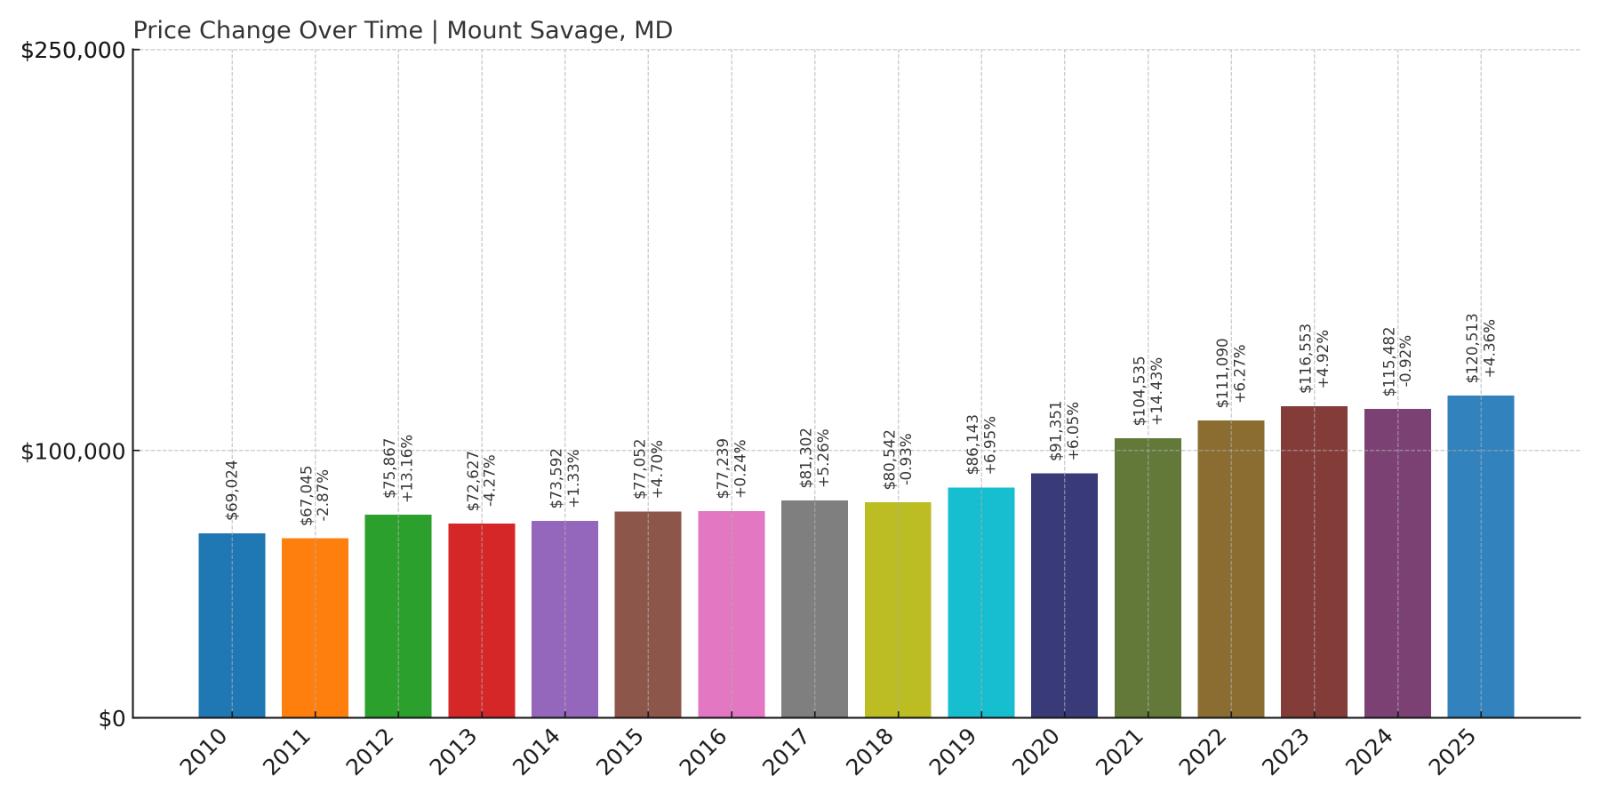
- 2010: $69,024
- 2011: $67,045 (-$1,978, -2.87% from previous year)
- 2012: $75,867 (+$8,822, +13.16% from previous year)
- 2013: $72,627 (-$3,240, -4.27% from previous year)
- 2014: $73,592 (+$965, +1.33% from previous year)
- 2015: $77,052 (+$3,461, +4.70% from previous year)
- 2016: $77,239 (+$187, +0.24% from previous year)
- 2017: $81,302 (+$4,063, +5.26% from previous year)
- 2018: $80,542 (-$760, -0.94% from previous year)
- 2019: $86,143 (+$5,601, +6.95% from previous year)
- 2020: $91,351 (+$5,209, +6.05% from previous year)
- 2021: $104,535 (+$13,184, +14.43% from previous year)
- 2022: $111,090 (+$6,555, +6.27% from previous year)
- 2023: $116,553 (+$5,463, +4.92% from previous year)
- 2024: $115,482 (-$1,071, -0.92% from previous year)
- 2025: $120,513 (+$5,030, +4.36% from previous year)
Home prices in Mount Savage have climbed more than 75% since 2010, with a particularly strong surge from 2019 through 2022. While there was a brief drop in 2024, prices rebounded in 2025, pushing the median to just over $120,000. Despite the gains, this remains one of the most affordable mountain towns in the state.
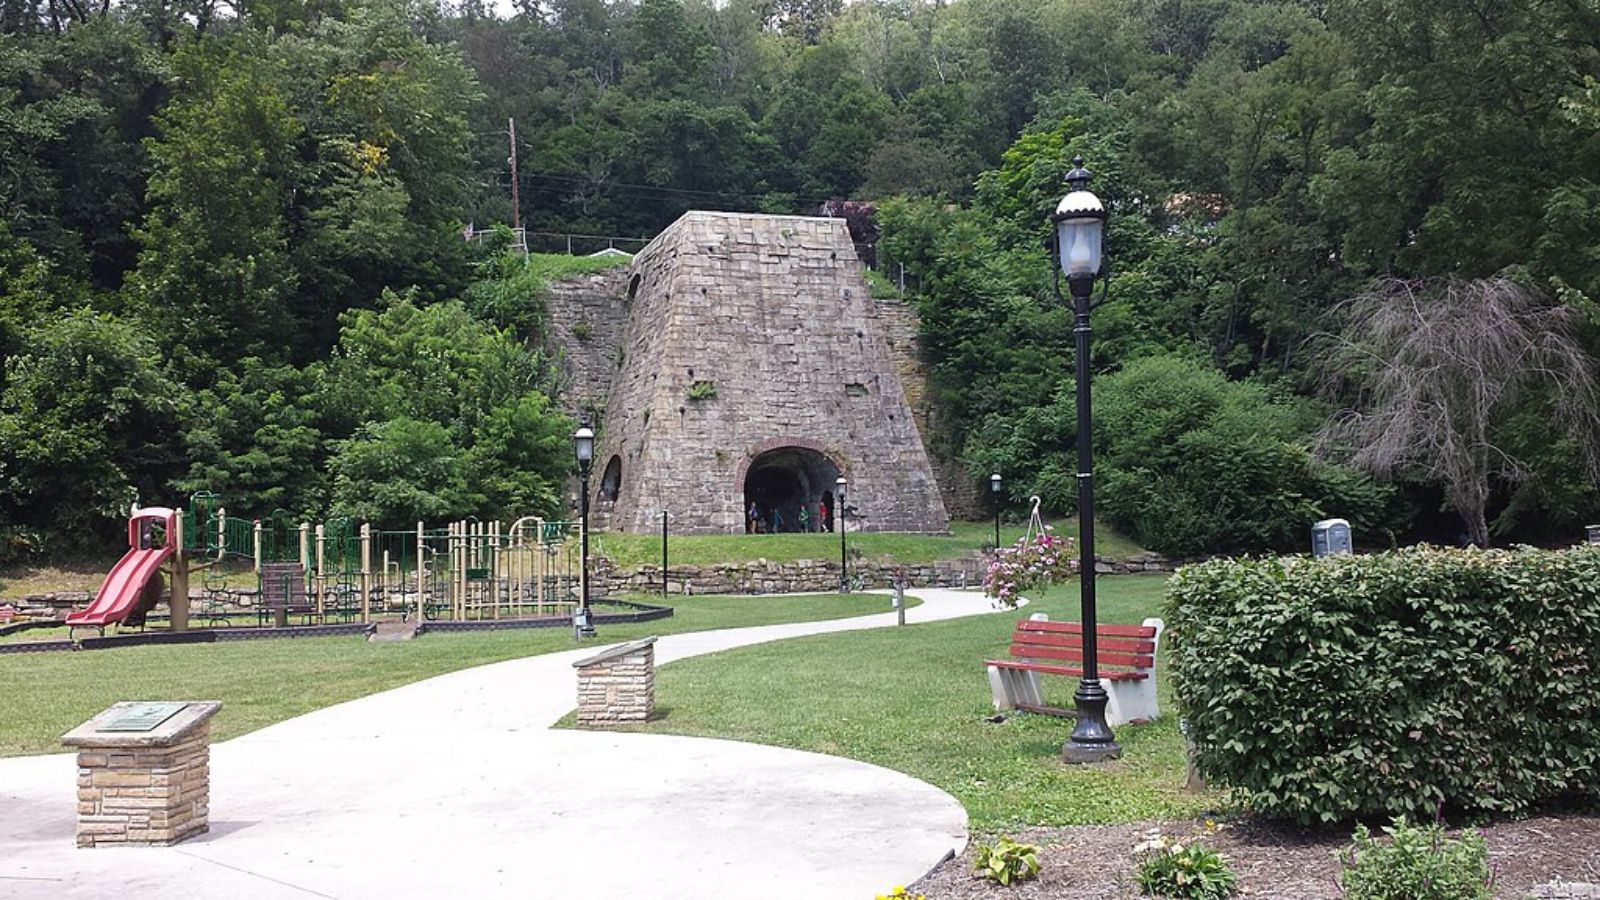
Mount Savage – Railroad History and Rising Value
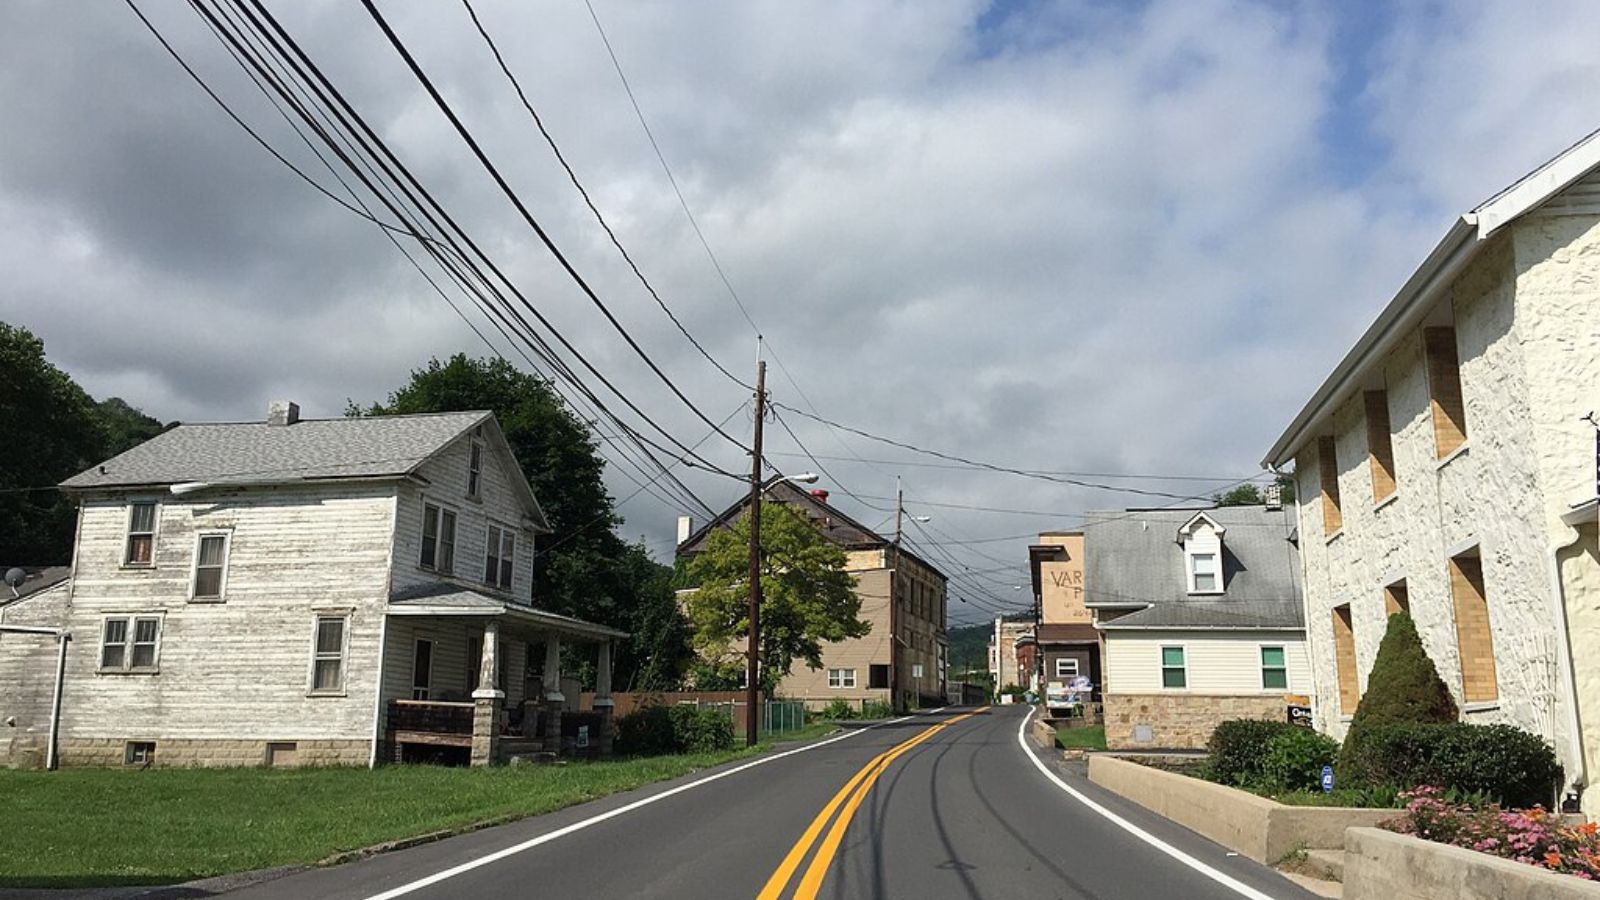
Mount Savage, located in Allegany County, was once a center of iron and rail manufacturing. Its historic downtown and early industrial architecture still reflect that legacy. Tucked between Cumberland and Frostburg, it offers a quiet lifestyle with easy access to both towns and nearby parks and trails.
The housing market has grown steadily, especially in recent years. Mount Savage saw a big jump in values during the early pandemic years and has maintained that momentum. The town’s combination of affordability, history, and location make it attractive to buyers seeking both charm and budget-conscious options.
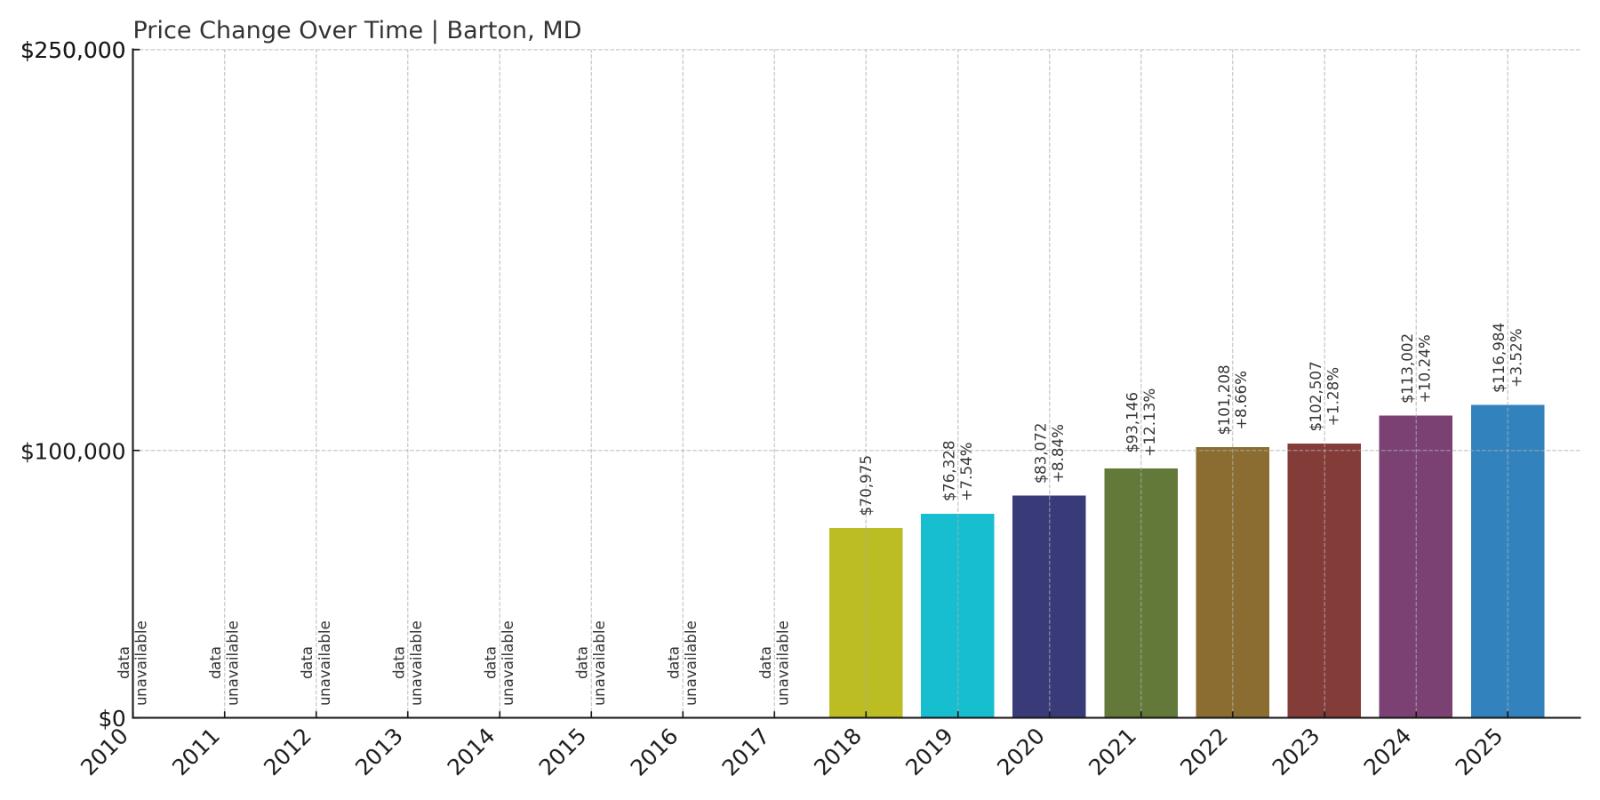
6. Barton – 65% Home Price Increase Since 2018
- 2010: N/A
- 2011: N/A
- 2012: N/A
- 2013: N/A
- 2014: N/A
- 2015: N/A
- 2016: N/A
- 2017: N/A
- 2018: $70,975
- 2019: $76,328 (+$5,353, +7.54% from previous year)
- 2020: $83,072 (+$6,744, +8.84% from previous year)
- 2021: $93,146 (+$10,074, +12.13% from previous year)
- 2022: $101,208 (+$8,062, +8.66% from previous year)
- 2023: $102,507 (+$1,299, +1.28% from previous year)
- 2024: $113,002 (+$10,495, +10.24% from previous year)
- 2025: $116,984 (+$3,982, +3.52% from previous year)
Barton’s home values have risen 65% since 2018, with several years of strong appreciation. From a starting point just over $70,000, prices have grown steadily year after year, reaching nearly $117,000 in 2025. Barton continues to offer some of the best home prices in the state.
Barton – Stability and Growth in a Former Mining Town
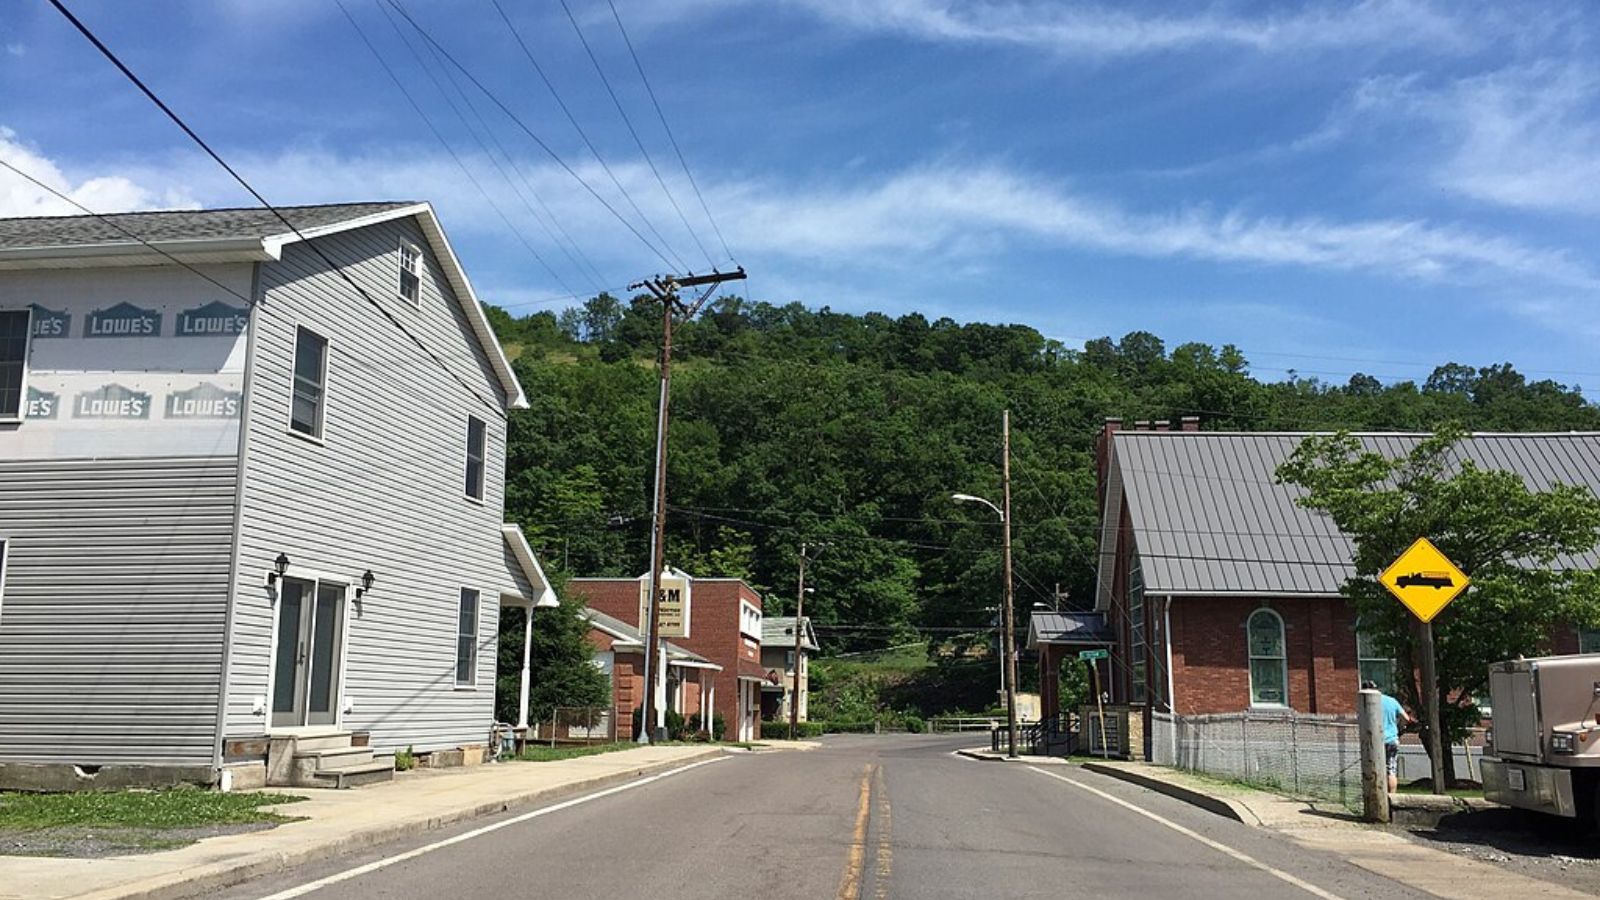
Barton is a small community in Allegany County located along Georges Creek. Its roots are in coal mining, but today it’s a quiet residential area surrounded by rolling hills and wooded land. With no major development, prices have remained accessible — but that hasn’t stopped the steady growth.
The consistent gains suggest a strong market for the area. While still off the radar for most buyers, Barton’s blend of affordability, stability, and small-town feel makes it one of western Maryland’s most quietly appealing options for long-term value.
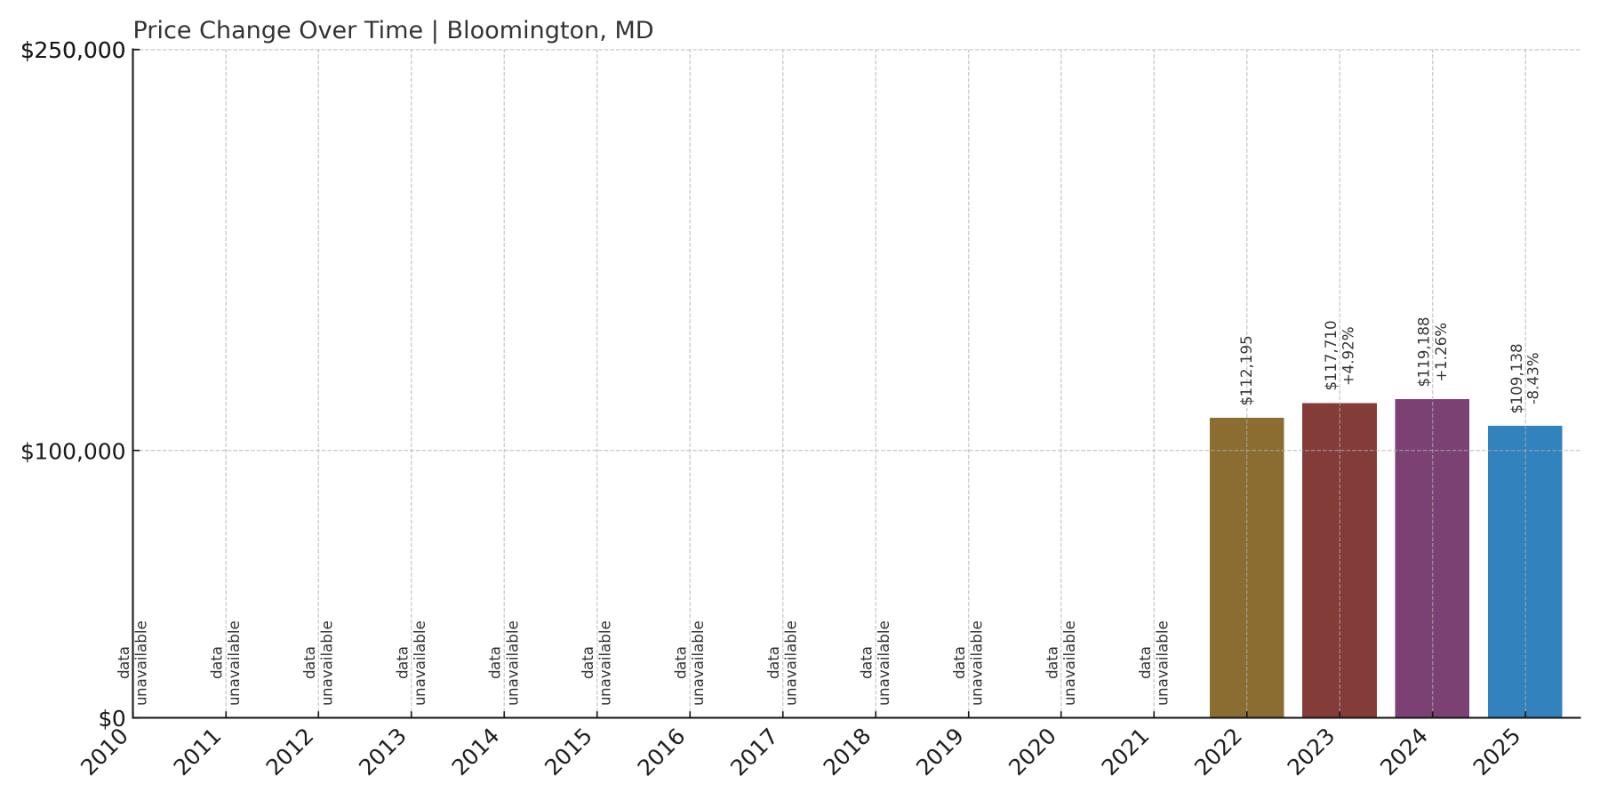
5. Bloomington – 2% Home Price Decrease Since 2022
- 2010: N/A
- 2011: N/A
- 2012: N/A
- 2013: N/A
- 2014: N/A
- 2015: N/A
- 2016: N/A
- 2017: N/A
- 2018: N/A
- 2019: N/A
- 2020: N/A
- 2021: N/A
- 2022: $112,195
- 2023: $117,710 (+$5,515, +4.92% from previous year)
- 2024: $119,188 (+$1,478, +1.26% from previous year)
- 2025: $109,138 (-$10,050, -8.43% from previous year)
Home values in Bloomington fell slightly overall since 2022, with a sharp decline in 2025 erasing prior gains. Despite a high in 2024, the current median home price sits just above $109,000 — making it one of the most affordable places in Maryland.
Bloomington – Scenic, Secluded, and Still Inexpensive
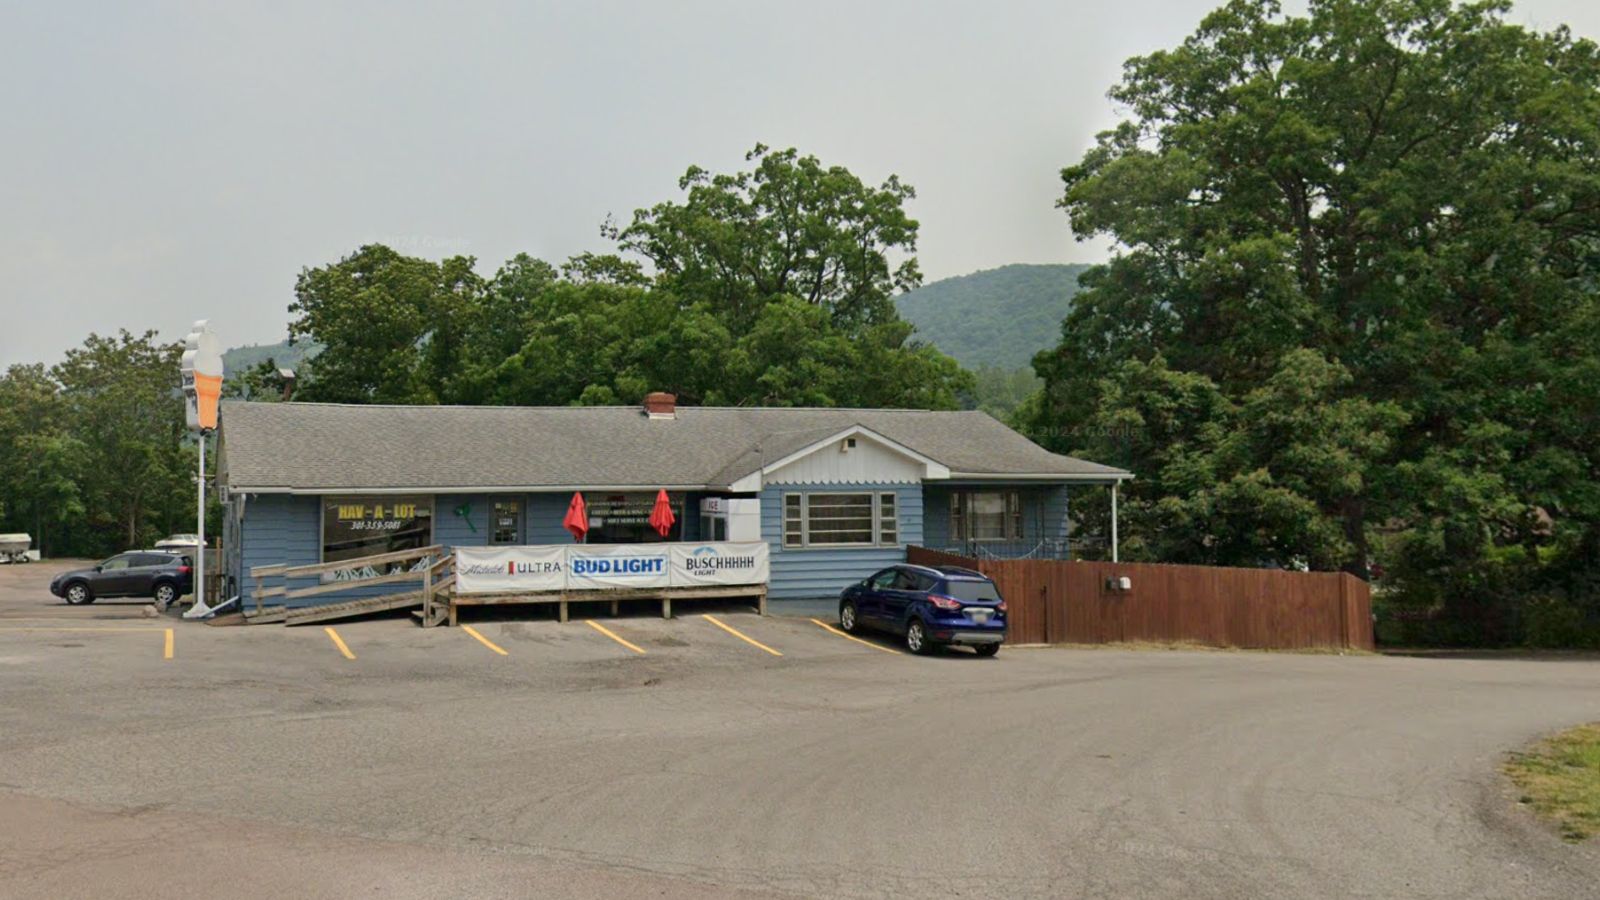
Located on the southern tip of Garrett County along the Potomac River, Bloomington is a remote, wooded community near Jennings Randolph Lake. It’s a tranquil setting with limited development and few services, which helps explain the low property values.
While the price drop in 2025 may concern some, it could also present an opportunity for buyers looking for land or vacation properties at a steep discount. Bloomington offers peace, space, and deep affordability — with potential upside for long-term buyers who don’t need proximity to jobs or cities.
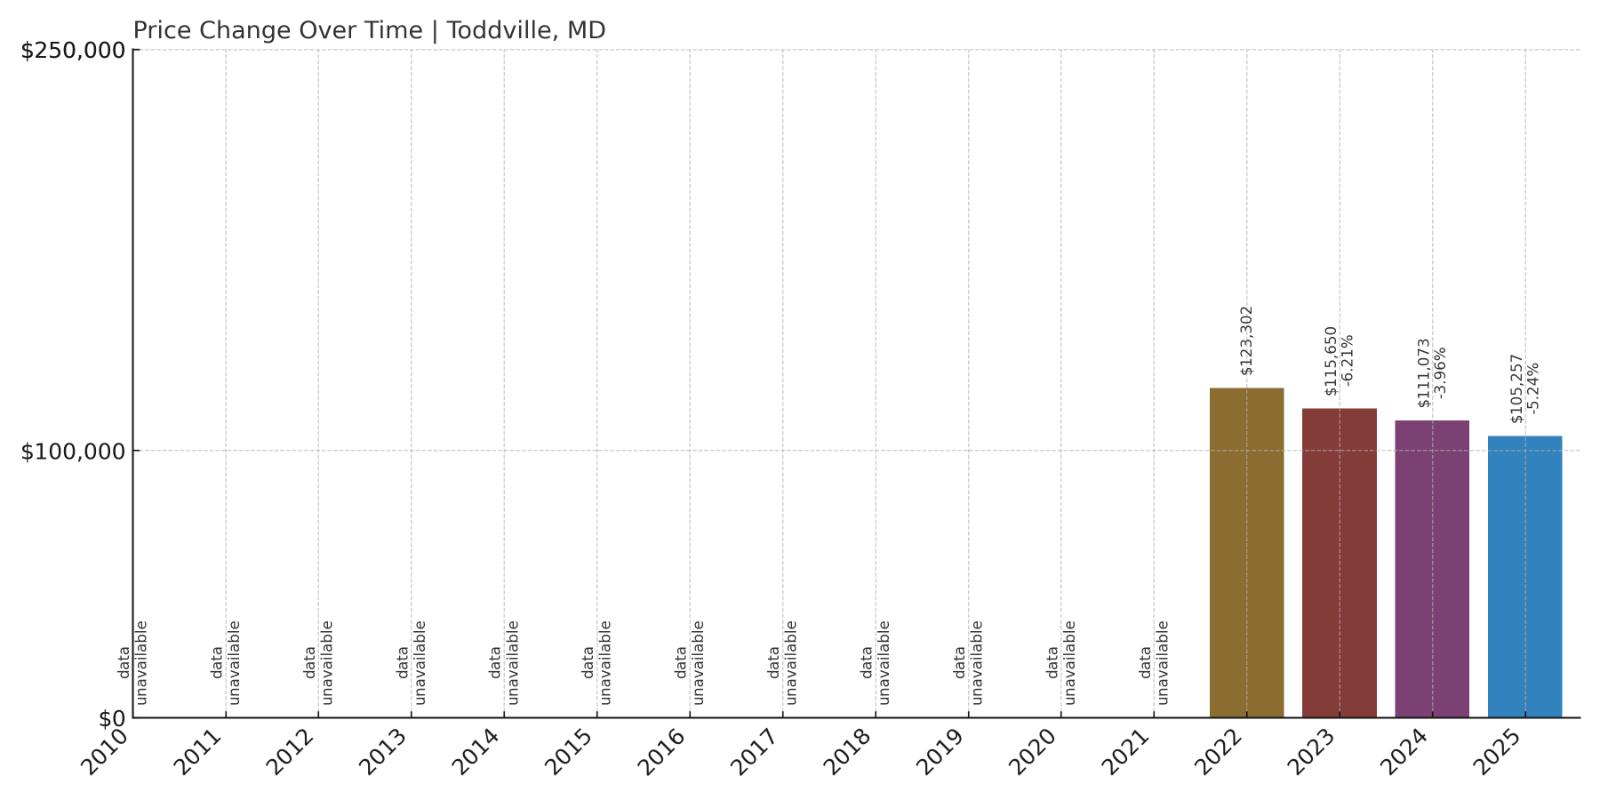
4. Toddville – 15% Home Price Decrease Since 2022
- 2010: N/A
- 2011: N/A
- 2012: N/A
- 2013: N/A
- 2014: N/A
- 2015: N/A
- 2016: N/A
- 2017: N/A
- 2018: N/A
- 2019: N/A
- 2020: N/A
- 2021: N/A
- 2022: $123,302
- 2023: $115,650 (-$7,652, -6.21% from previous year)
- 2024: $111,073 (-$4,577, -3.96% from previous year)
- 2025: $105,257 (-$5,816, -5.24% from previous year)
Toddville has experienced a steady decline in home values since 2022, falling by nearly 15% overall. The median home price now sits just above $105,000, putting it among the lowest in the state. Prices have dropped each year since peaking in 2022.
Toddville – Eastern Shore Solitude at a Low Price
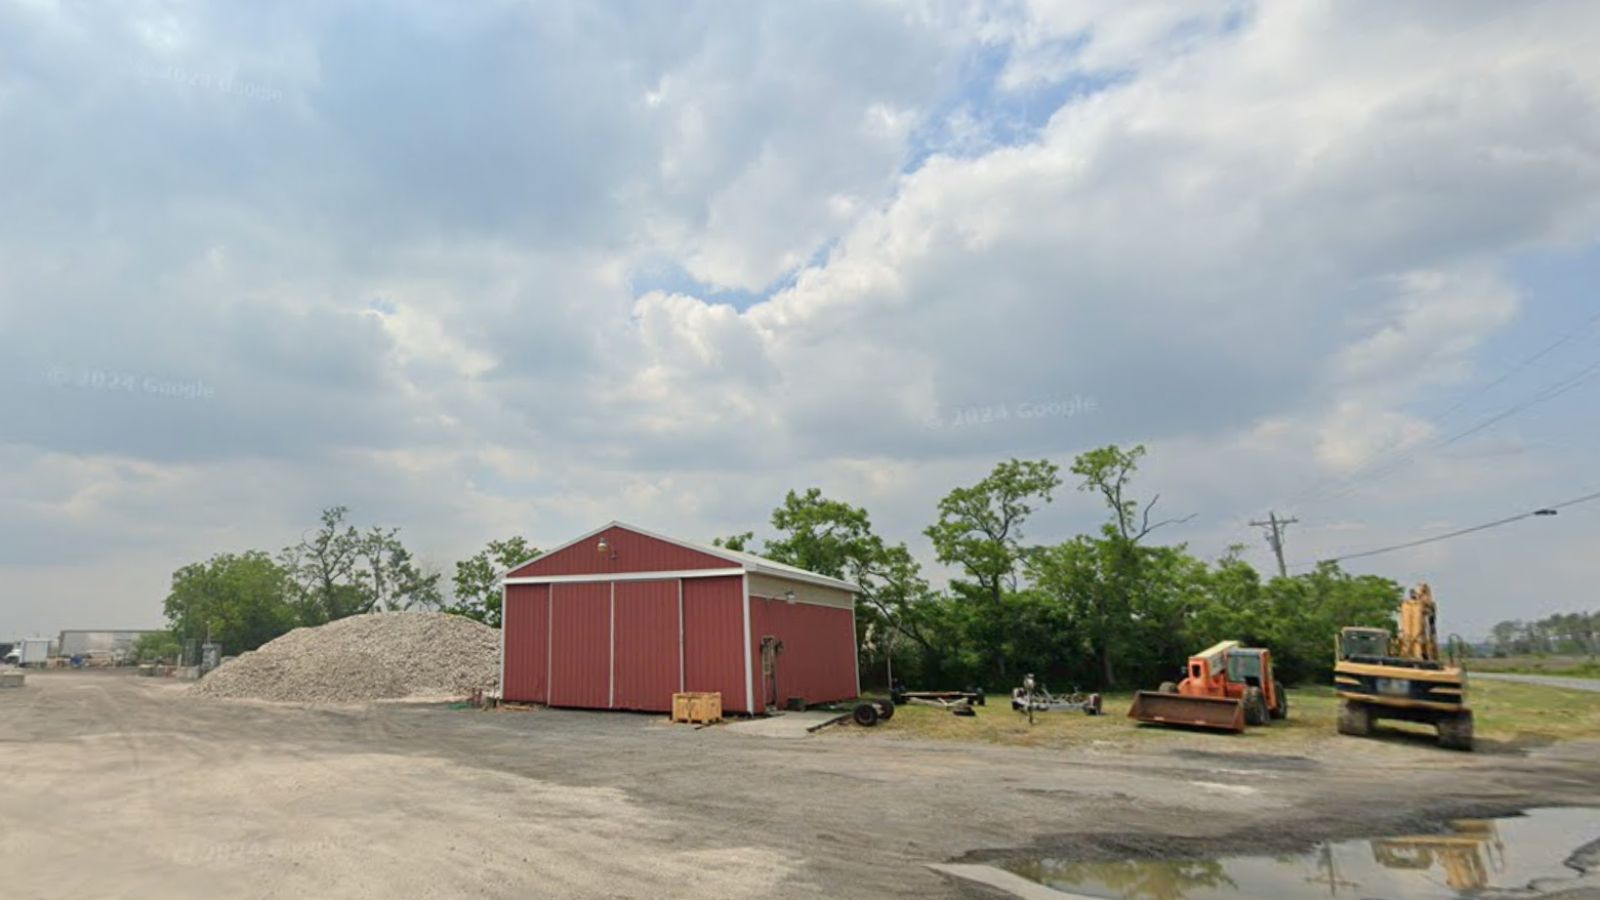
Toddville is an isolated hamlet in Dorchester County, surrounded by marshland and Chesapeake Bay inlets. The town is extremely rural, with little infrastructure and a small population. Its low housing prices reflect that remote setting — and likely, flood risk concerns as well.
While declining values might deter some buyers, others may see opportunity. Toddville is one of the last places in Maryland where waterfront-adjacent property remains deeply discounted. For the right buyer, it could offer a peaceful, off-grid lifestyle at a fraction of coastal prices elsewhere.
3. Ewell – 0.4% Home Price Increase Since 2022
Would you like to save this?
- 2010: N/A
- 2011: N/A
- 2012: N/A
- 2013: N/A
- 2014: N/A
- 2015: N/A
- 2016: N/A
- 2017: N/A
- 2018: N/A
- 2019: N/A
- 2020: N/A
- 2021: N/A
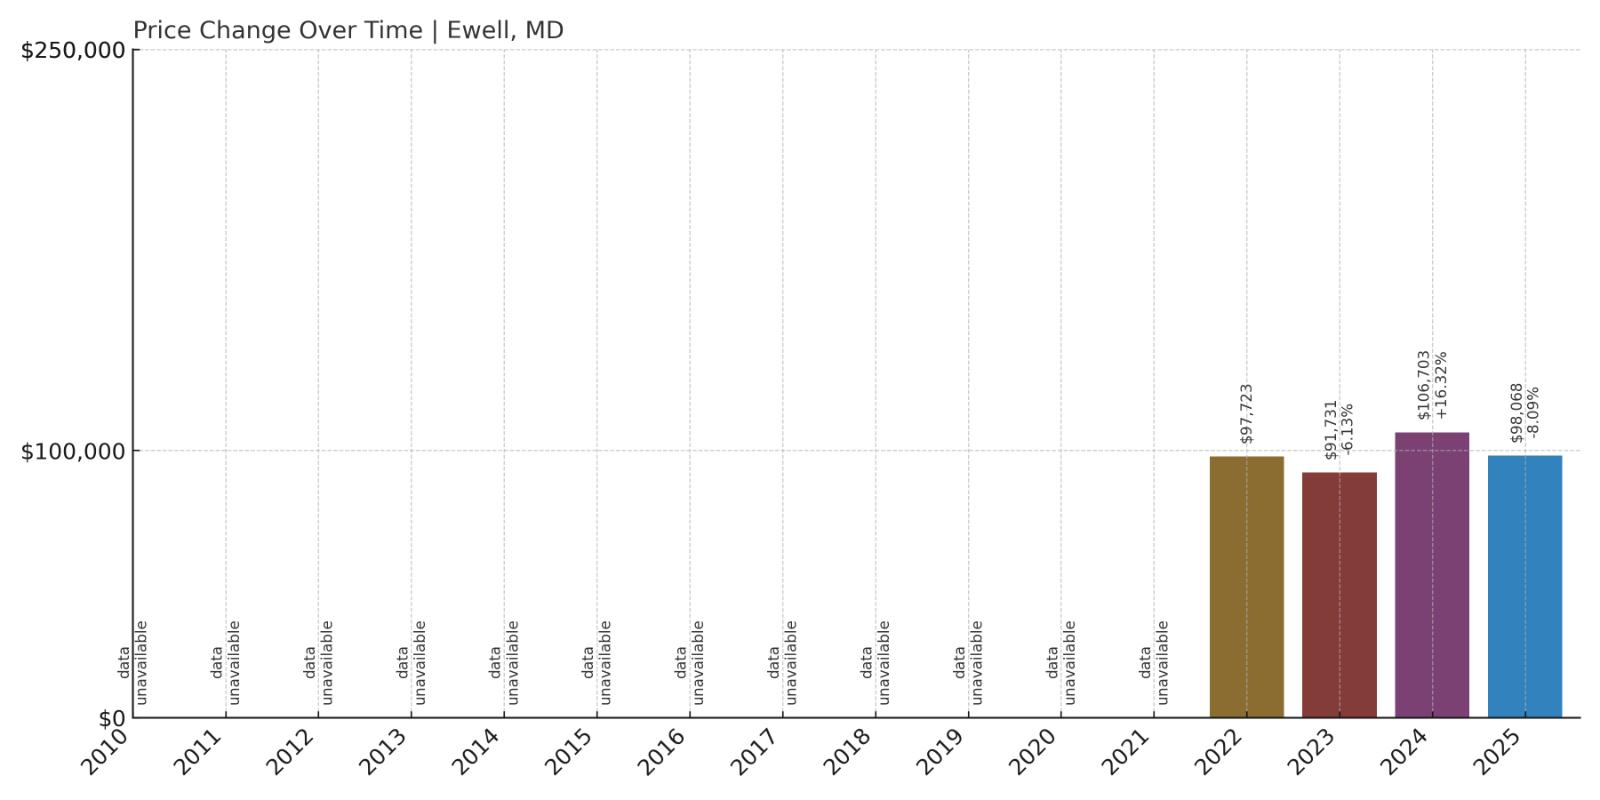
- 2022: $97,723
- 2023: $91,731 (-$5,992, -6.13% from previous year)
- 2024: $106,703 (+$14,972, +16.32% from previous year)
- 2025: $98,068 (-$8,635, -8.09% from previous year)
Home values in Ewell have fluctuated widely since 2022, but the overall change is minimal — less than half a percent increase. Prices dipped in 2023, spiked in 2024, and then declined again in 2025. The median now sits just over $98,000.
Ewell – One of Maryland’s Most Isolated and Affordable Communities
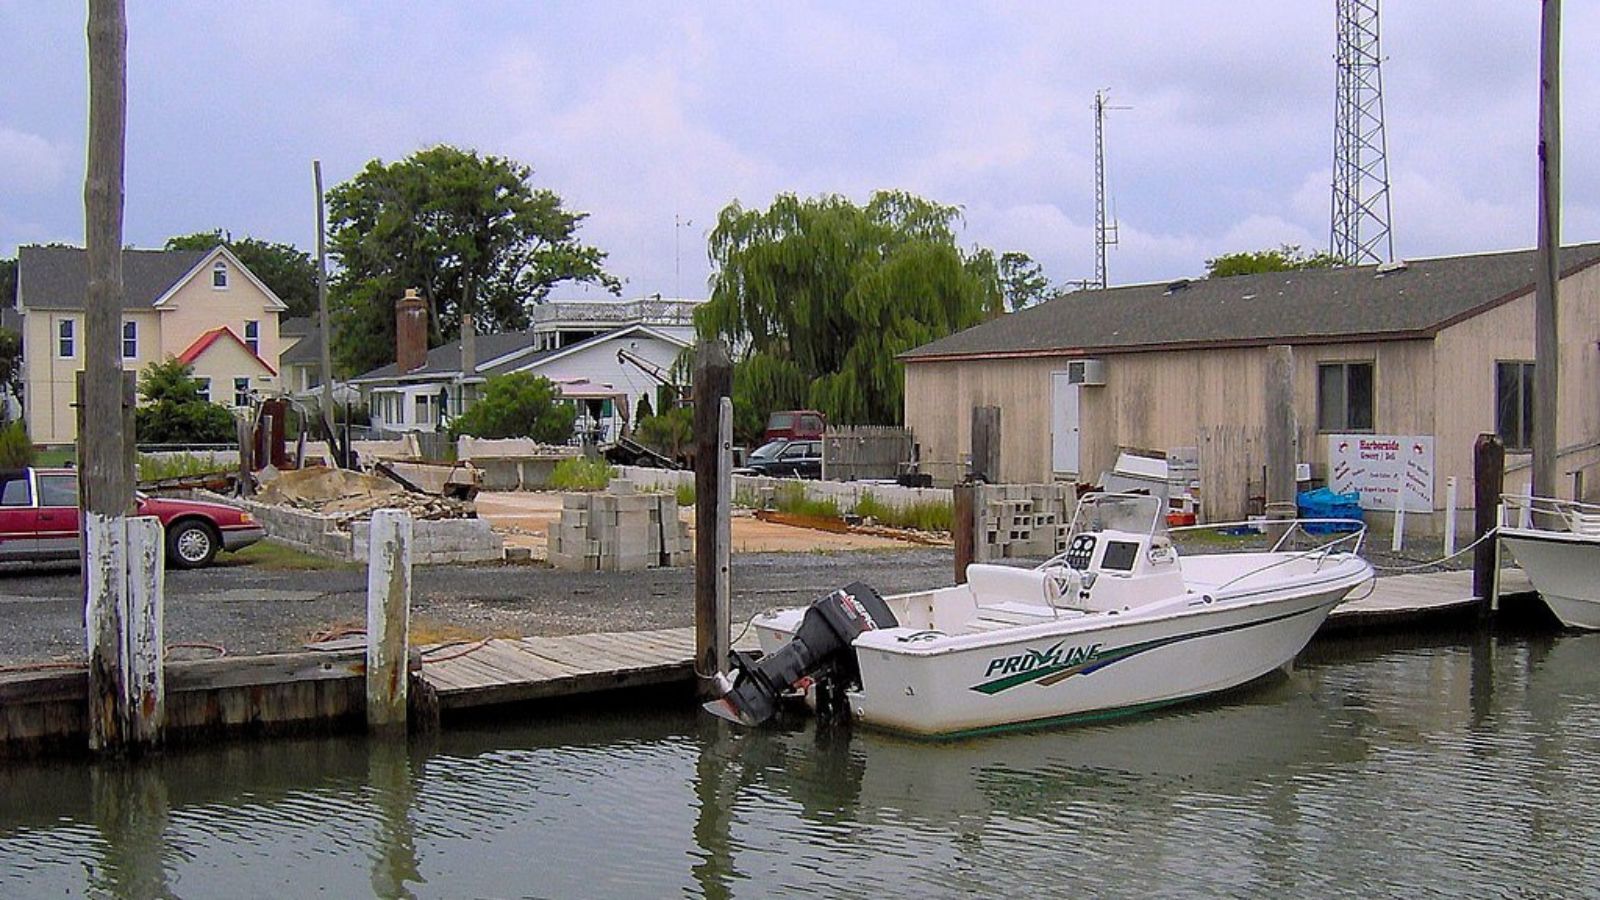
Ewell is located on Smith Island in the Chesapeake Bay, accessible only by ferry. Its isolation makes it unique — and extremely affordable. The town has a small population and limited housing inventory, with a way of life that hasn’t changed much in decades.
Home values here swing more due to the tiny number of sales than market fundamentals. Still, for those seeking waterfront views and a truly unplugged lifestyle, Ewell is unmatched. Just be ready for remoteness — and occasional price volatility.
2. Westernport – 87% Home Price Increase Since 2010
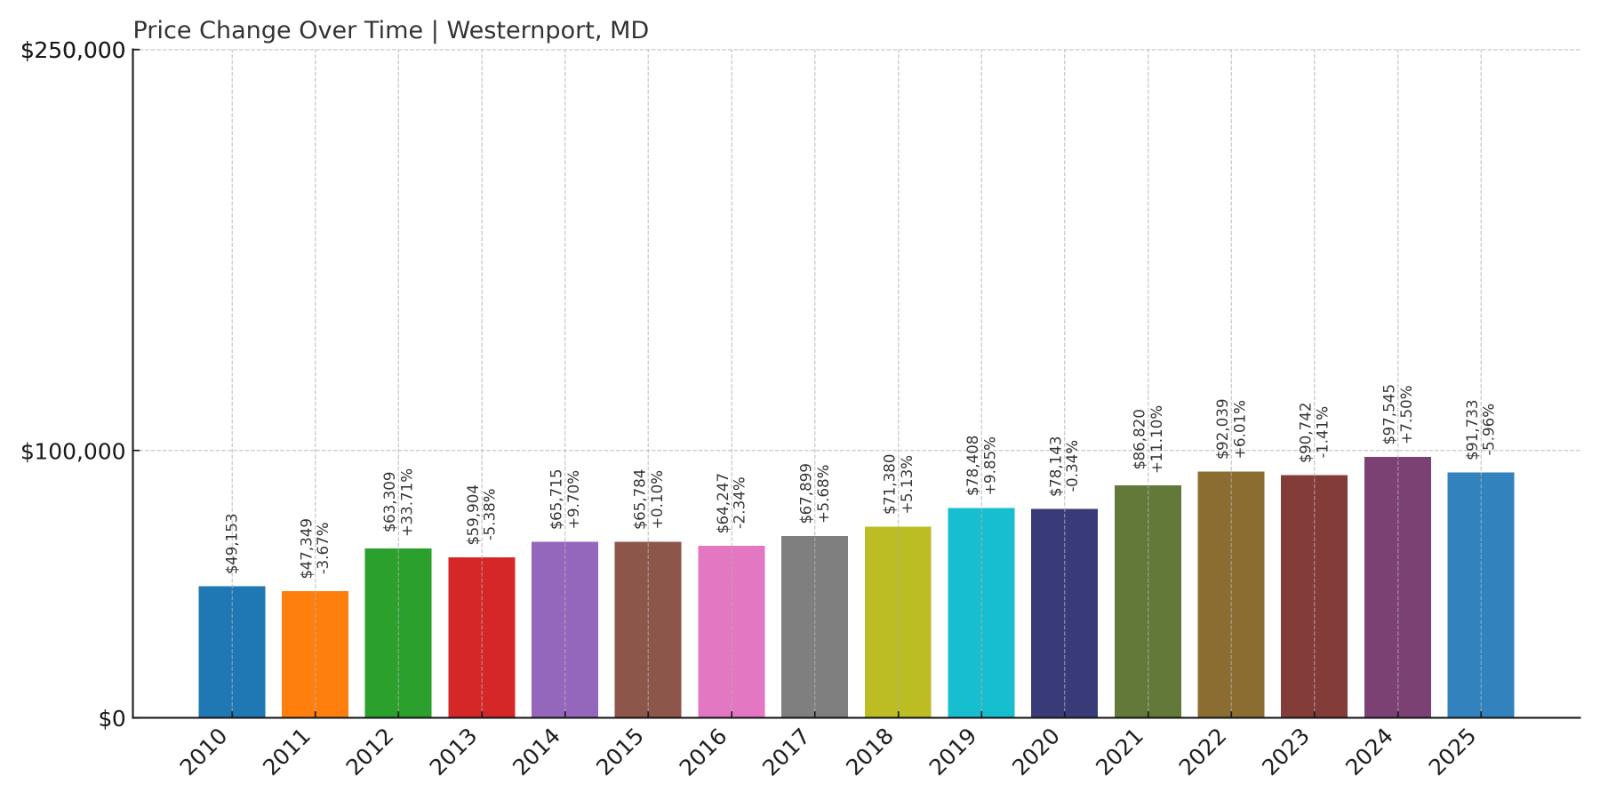
- 2010: $49,153
- 2011: $47,349 (-$1,805, -3.67% from previous year)
- 2012: $63,309 (+$15,960, +33.71% from previous year)
- 2013: $59,904 (-$3,405, -5.38% from previous year)
- 2014: $65,715 (+$5,811, +9.70% from previous year)
- 2015: $65,784 (+$69, +0.10% from previous year)
- 2016: $64,247 (-$1,537, -2.34% from previous year)
- 2017: $67,899 (+$3,652, +5.68% from previous year)
- 2018: $71,380 (+$3,481, +5.13% from previous year)
- 2019: $78,408 (+$7,028, +9.85% from previous year)
- 2020: $78,143 (-$265, -0.34% from previous year)
- 2021: $86,820 (+$8,677, +11.10% from previous year)
- 2022: $92,039 (+$5,219, +6.01% from previous year)
- 2023: $90,742 (-$1,297, -1.41% from previous year)
- 2024: $97,545 (+$6,803, +7.50% from previous year)
- 2025: $91,733 (-$5,812, -5.96% from previous year)
Westernport’s home prices are up nearly 87% since 2010, though recent volatility has brought values down from a peak in 2024. Prices have fluctuated in recent years, but the long-term trend is upward, with 2025’s median at just over $91,000.
Westernport – Blue Collar Roots and Bargain Prices
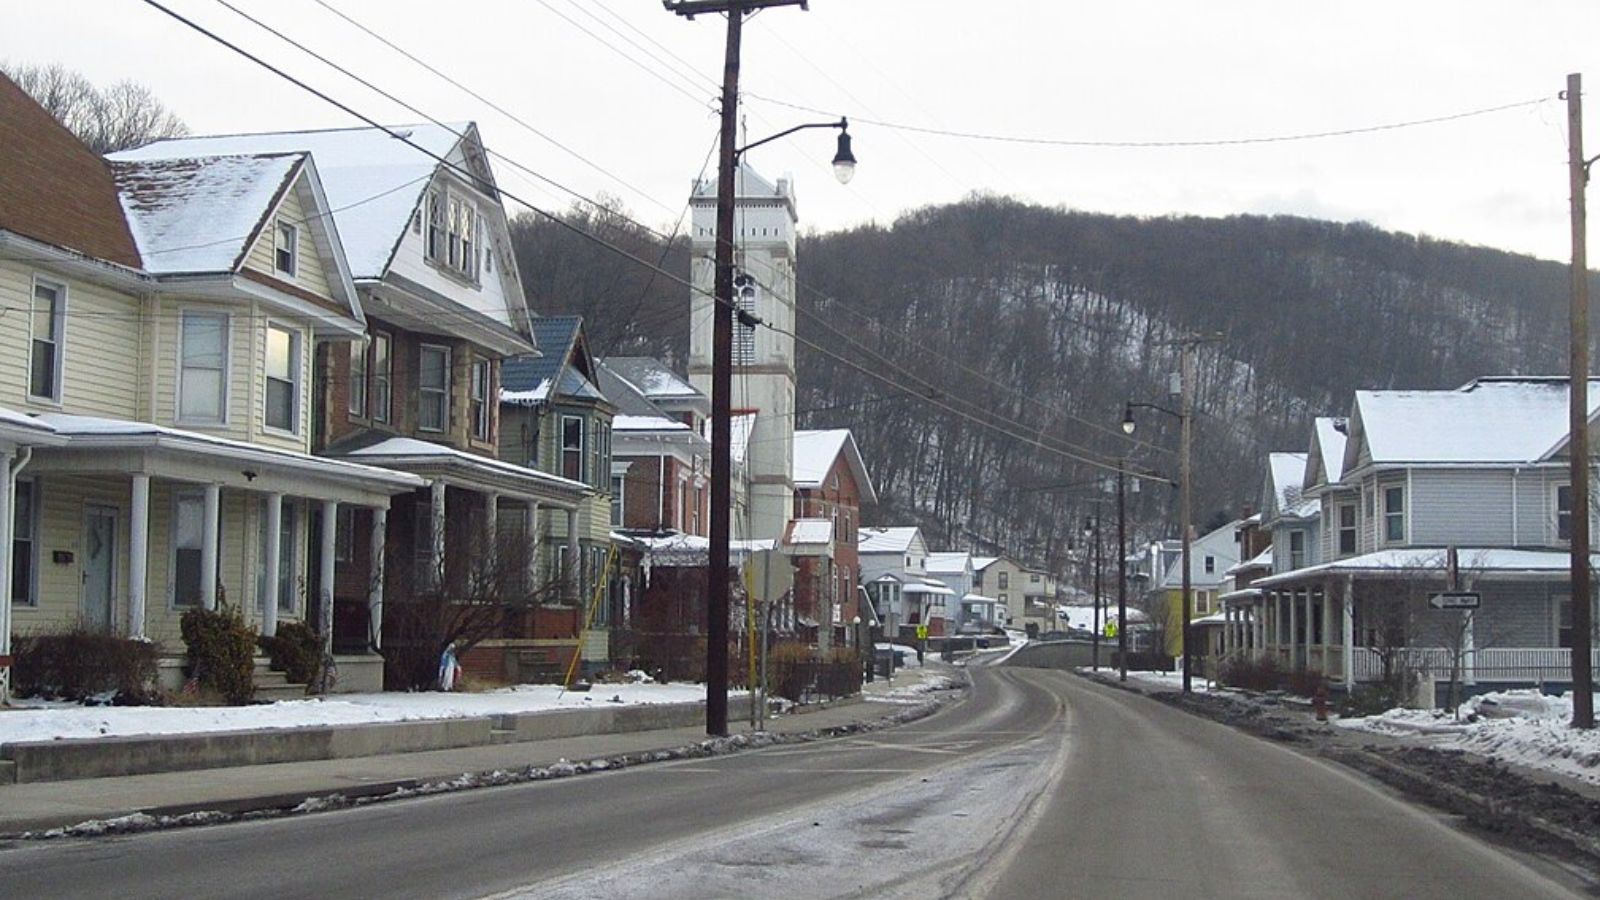
Westernport sits at the far western edge of Maryland in Allegany County, bordered by the Potomac River and West Virginia. Once a manufacturing and rail hub, the town has transitioned into a quiet, working-class community with low home prices and few frills.
The recent price swings likely reflect a small and reactive market. Still, over the long run, Westernport has gained in value while remaining extremely affordable. For buyers looking for the lowest home prices in the state, this former industrial town still tops the list.
1. Kitzmiller – 9% Home Price Decrease Since 2022
- 2010: N/A
- 2011: N/A
- 2012: N/A
- 2013: N/A
- 2014: N/A
- 2015: N/A
- 2016: N/A
- 2017: N/A
- 2018: N/A
- 2019: N/A
- 2020: N/A
- 2021: N/A
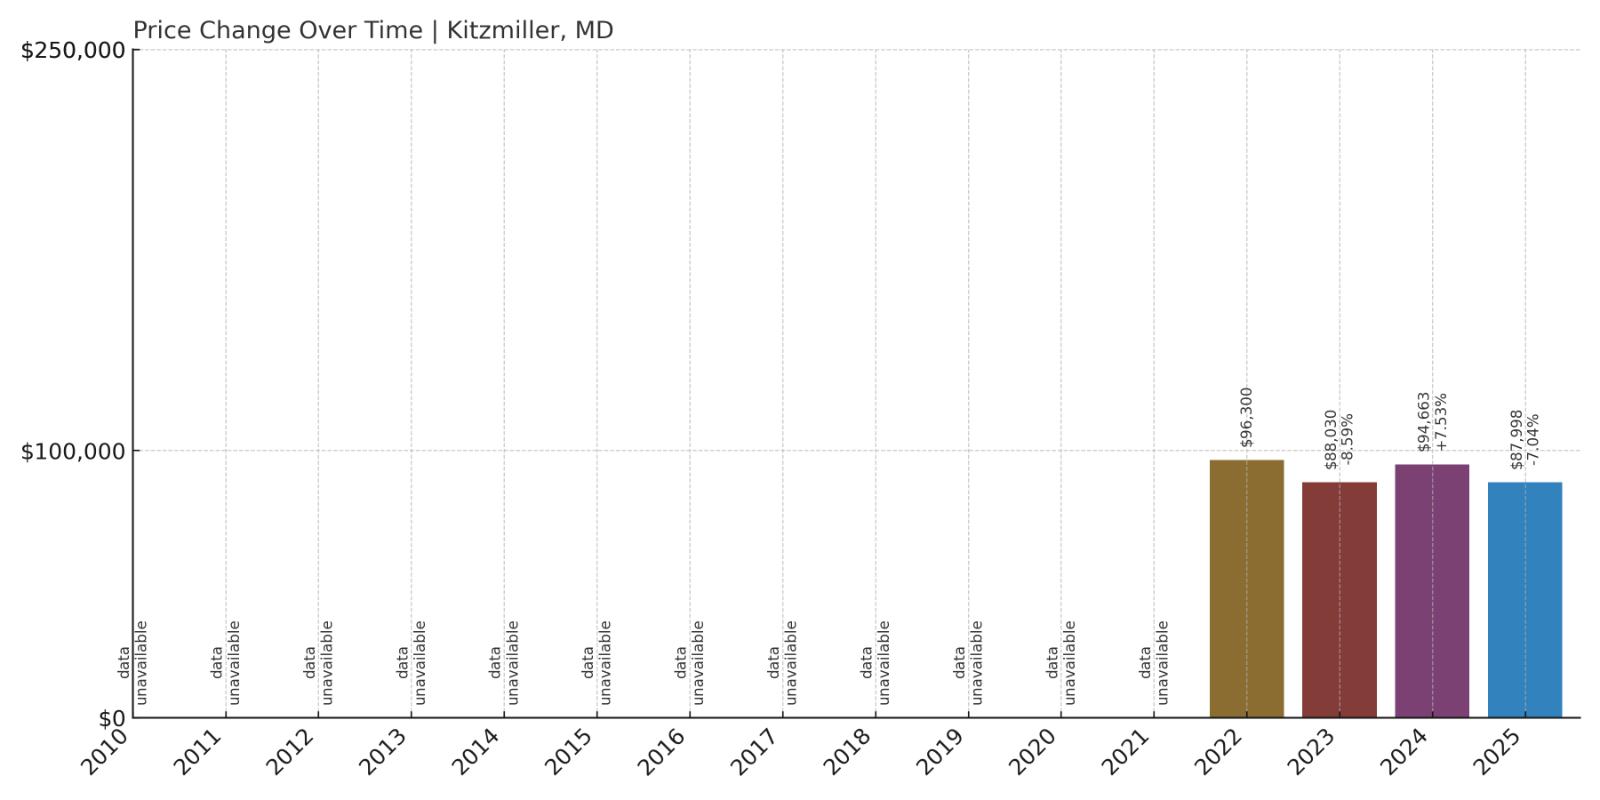
- 2022: $96,300
- 2023: $88,030 (-$8,270, -8.59% from previous year)
- 2024: $94,663 (+$6,634, +7.54% from previous year)
- 2025: $87,998 (-$6,665, -7.04% from previous year)
Kitzmiller has seen home values decline by roughly 9% since 2022. The market dipped in 2023, recovered slightly in 2024, then dropped again in 2025. At just under $88,000, Kitzmiller is the most affordable town in Maryland this year.
Kitzmiller – Maryland’s Cheapest Market in 2025
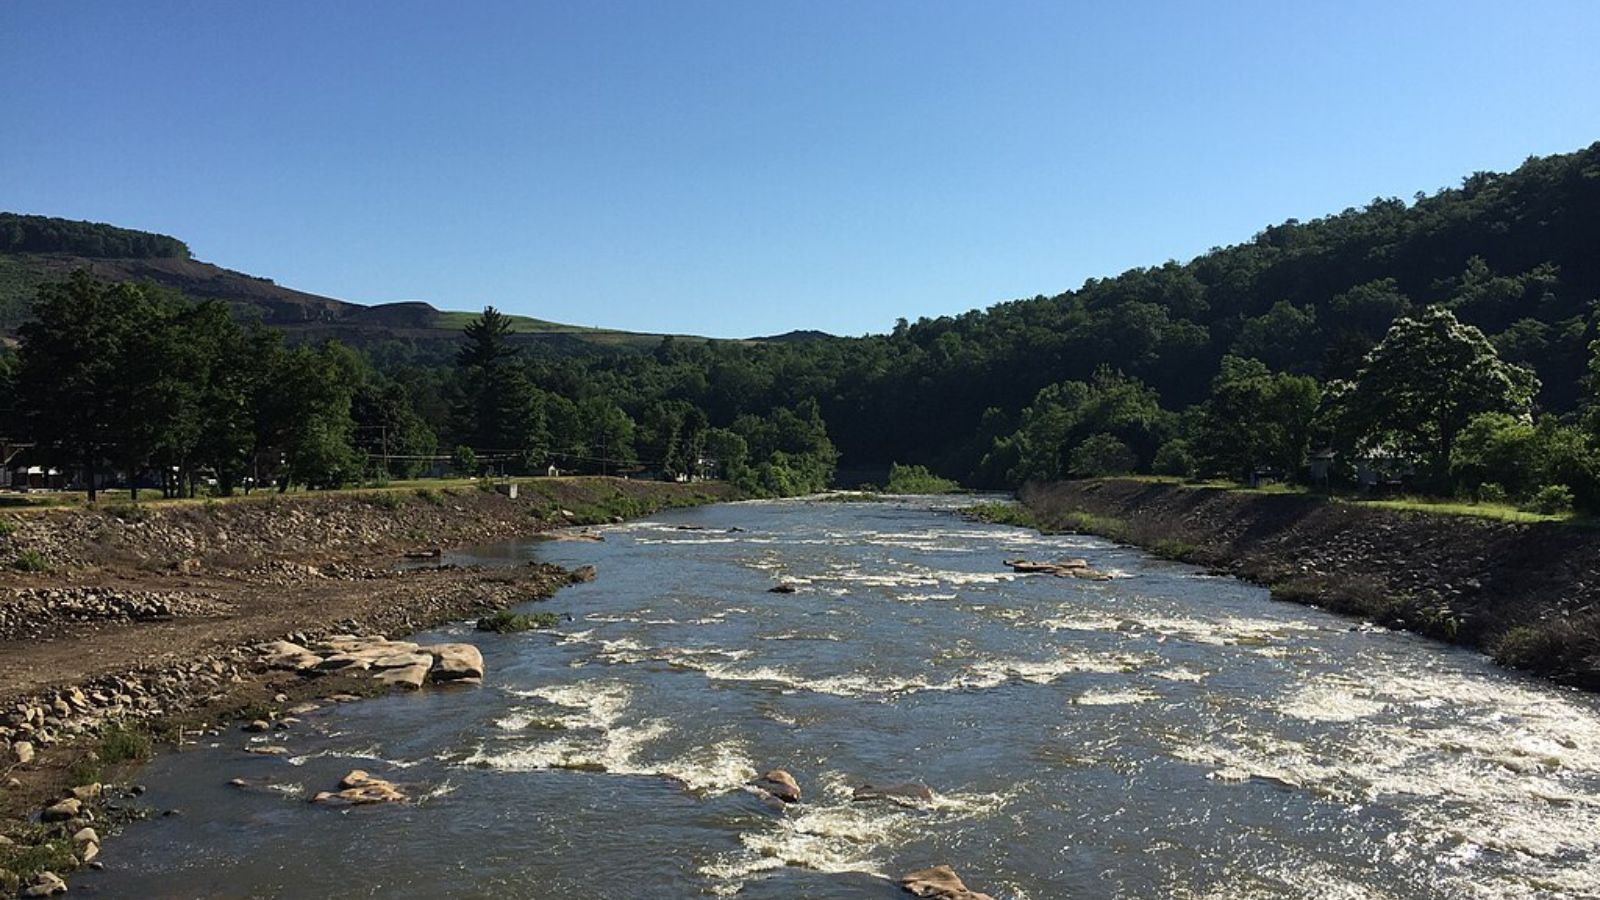
Kitzmiller is a remote town near the West Virginia line in Garrett County, tucked into the Appalachian foothills. It’s small, quiet, and far from the urban centers that drive most of the state’s real estate activity. That distance helps explain its incredibly low home prices.
With few sales and limited data, price movements here can be erratic. Still, Kitzmiller consistently ranks at the bottom of Maryland’s housing cost list — making it an option for buyers who care more about affordability than access to amenities or services.