🔥 Would you like to save this?
The Zillow Home Value Index has spoken—and in these 15 Illinois towns, the prices are almost too low to believe. While much of the state has marched steadily into higher price brackets, these spots have stayed surprisingly affordable, with typical home values lagging well behind the statewide average. Some haven’t even hit $100K. Whether it’s due to slower growth, shrinking populations, or just being overlooked, these towns offer rare buying power in a market that’s anything but cheap.
15. Fairmont City – 18.0% Home Price Increase Since 2017

- 2010: $N/A
- 2011: $N/A
- 2012: $N/A
- 2013: $N/A
- 2014: $N/A
- 2015: $N/A
- 2016: $N/A
- 2017: $56,758
- 2018: $62,663 (+$5,905.0, +10.4% from previous year)
- 2019: $69,075 (+$6,412.0, +10.23% from previous year)
- 2020: $N/A
- 2021: $80,683
- 2022: $71,192 (-$9,491.0, -11.76% from previous year)
- 2023: $70,933 (-$259.0, -0.36% from previous year)
- 2024: $74,426 (+$3,493.0, +4.92% from previous year)
- 2025: $67,014 (-$7,412.0, -9.96% from previous year)
Fairmont City saw its home prices rise from $56,758 in 2017 to $67,014 in 2025—a modest but notable 18% increase. That growth came with some bumps along the way, including a dip of nearly 10% in the most recent year. Despite these fluctuations, values remain low relative to much of Illinois, making it a price-conscious option for buyers today.
In order to come up with the very specific design ideas, we create most designs with the assistance of state-of-the-art AI interior design software.
Fairmont City – Border Town with Affordability Still in Reach

Located just east of St. Louis, Fairmont City sits along the Illinois-Missouri border, a short drive from downtown. Its proximity to major roadways and metro access hasn’t yet translated into surging home prices, and that could be an opportunity for buyers looking to stay near the city without big-city costs. The town has historically been working-class with deep industrial roots, which helps explain the slower housing market compared to urban neighbors.
Even with some growth from 2017 to 2019, prices have cooled considerably since 2022, dropping by nearly $7,500 over the past year. Whether this signals long-term affordability or just a temporary correction remains to be seen—but for now, Fairmont City continues to offer below-average prices in a metro-adjacent location.
14. Meredosia – 46.1% Home Price Increase Since 2010
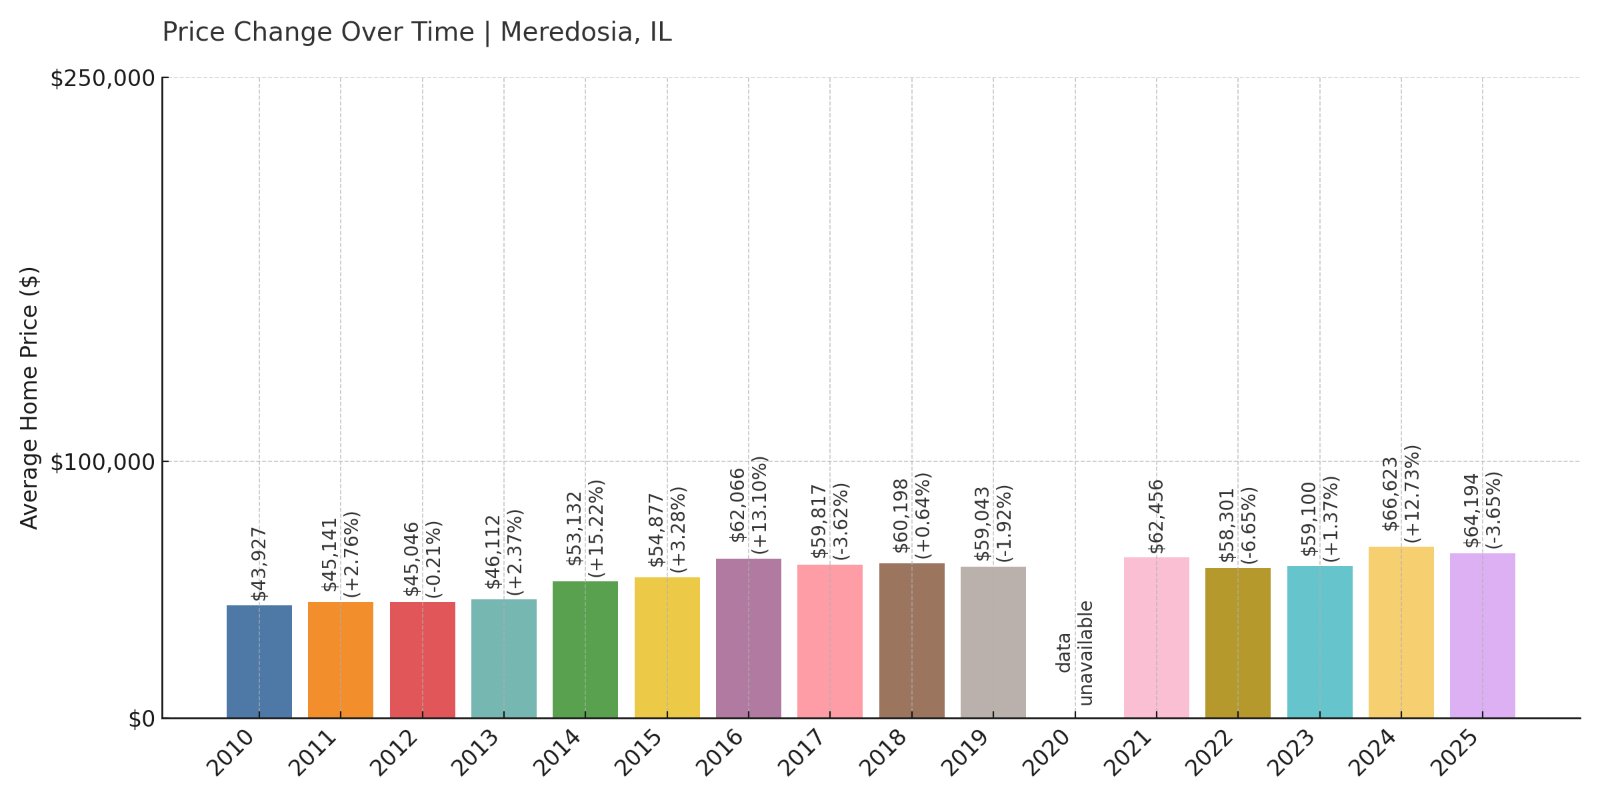
- 2010: $43,927
- 2011: $45,141 (+$1,214.0, +2.76% from previous year)
- 2012: $45,046 (-$95.0, -0.21% from previous year)
- 2013: $46,112 (+$1,066.0, +2.37% from previous year)
- 2014: $53,132 (+$7,020.0, +15.22% from previous year)
- 2015: $54,877 (+$1,745.0, +3.28% from previous year)
- 2016: $62,066 (+$7,188.0, +13.1% from previous year)
- 2017: $59,817 (-$2,249.0, -3.62% from previous year)
- 2018: $60,198 (+$381.0, +0.64% from previous year)
- 2019: $59,043 (-$1,155.0, -1.92% from previous year)
- 2020: $N/A
- 2021: $62,456
- 2022: $58,301 (-$4,154.0, -6.65% from previous year)
- 2023: $59,100 (+$799.0, +1.37% from previous year)
- 2024: $66,623 (+$7,523.0, +12.73% from previous year)
- 2025: $64,194 (-$2,429.0, -3.65% from previous year)
Meredosia’s home prices have climbed from $43,927 in 2010 to $64,194 in 2025—a 46% jump over 15 years. While values have fluctuated since 2021, the long-term trend remains upward. It’s one of the few towns in this list where home prices have maintained some momentum despite a rural location.
Meredosia – Affordable Living Along the Illinois River
Nestled along the Illinois River, Meredosia is a small town with big price stability. Its affordability may come in part from its distance to urban job centers, yet it’s held steady thanks to local industry and longstanding housing demand. The town’s strong pricing in 2024, when values jumped over 12%, shows that demand hasn’t completely faded.
While 2025 saw a modest decline, the broader picture reflects growth, especially considering prices stayed in the $40K–$60K range for over a decade. It’s an attractive option for buyers seeking scenic rural living without sacrificing long-term value.
13. Central City – -13.6% Home Price Change Since 2021

- 2010: $N/A
- 2011: $N/A
- 2012: $N/A
- 2013: $N/A
- 2014: $N/A
- 2015: $N/A
- 2016: $N/A
- 2017: $N/A
- 2018: $N/A
- 2019: $N/A
- 2020: $N/A
- 2021: $73,204
- 2022: $75,436 (+$2,232.0, +3.05% from previous year)
- 2023: $73,122 (-$2,313.0, -3.07% from previous year)
- 2024: $61,125 (-$11,997.0, -16.41% from previous year)
- 2025: $63,293 (+$2,168.0, +3.55% from previous year)
Central City has dropped 13.6% in home value since 2021, going from $73,204 to $63,293 in 2025. After peaking in 2022, the market cooled sharply before a modest recovery. This trend could signal opportunity for buyers entering at the new lower pricing tier.
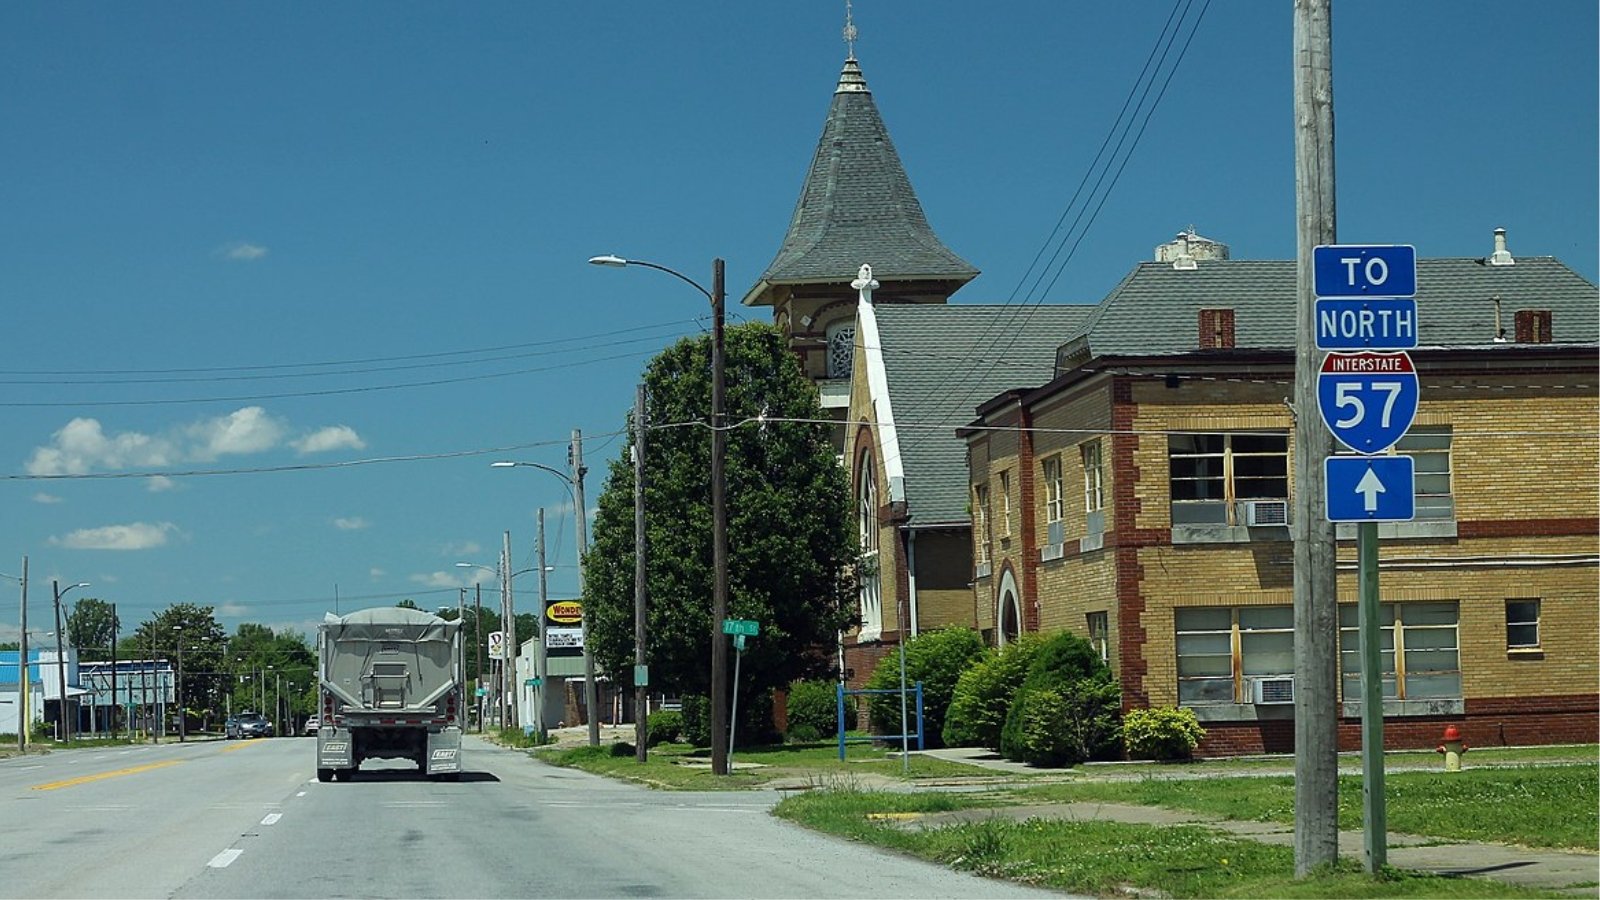
Central City – Modest Homes and Market Adjustments

Central City, located in Marion County, is a small residential town just north of Centralia. The area’s affordability is one of its key draws, especially with the recent market drop from a 2022 high. Although the value drop of over $11,000 in 2024 raises questions, the small uptick in 2025 may show the beginning of price stabilization.
Its quiet neighborhoods, modest housing stock, and relatively close proximity to Interstate 57 help it stay connected without city-level prices. It’s a good example of a place where the market may be correcting itself after overreaching during the boom years.
12. East Cape Girardeau – -12.1% Home Price Change Since 2021

- 2010: $N/A
- 2011: $N/A
- 2012: $N/A
- 2013: $N/A
- 2014: $N/A
- 2015: $N/A
- 2016: $N/A
- 2017: $N/A
- 2018: $N/A
- 2019: $N/A
- 2020: $N/A
- 2021: $71,237
- 2022: $64,181 (-$7,056.0, -9.9% from previous year)
- 2023: $60,750 (-$3,431.0, -5.35% from previous year)
- 2024: $59,446 (-$1,304.0, -2.15% from previous year)
- 2025: $62,640 (+$3,195.0, +5.37% from previous year)
East Cape Girardeau’s home values have dropped 12.1% since 2021, though the latest data shows a modest rebound. Despite the overall decline, prices remain higher than average for this list, with 2025 values at $62,640.
East Cape Girardeau – River Views at a Discount
Across the Mississippi River from Cape Girardeau, Missouri, this small village offers riverfront living without Missouri’s price tag. East Cape Girardeau has always been affordable, and that trend continues into 2025—even with the slight recent bounce in prices.
Its location near Southern Illinois University and Cape Girardeau’s commercial center keeps it loosely tethered to a larger economy, but it remains rooted in small-town life. Housing here is generally modest, which has helped prices stay well below national and statewide medians.
11. Zeigler – 1.7% Home Price Increase Since 2015
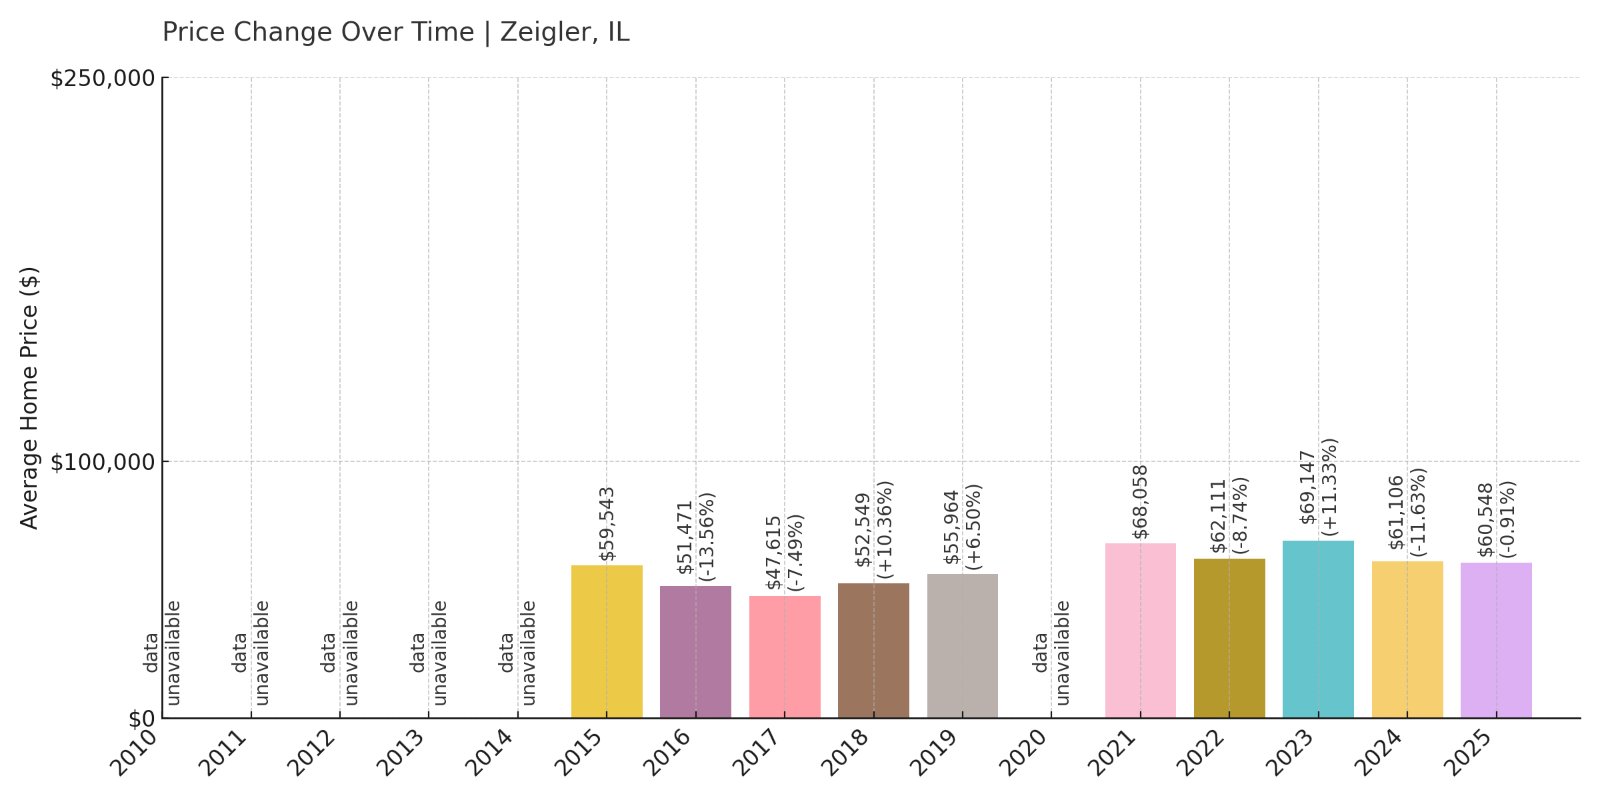
- 2010: $N/A
- 2011: $N/A
- 2012: $N/A
- 2013: $N/A
- 2014: $N/A
- 2015: $59,543
- 2016: $51,471 (-$8,071.0, -13.55% from previous year)
- 2017: $47,615 (-$3,856.0, -7.49% from previous year)
- 2018: $52,549 (+$4,934.0, +10.36% from previous year)
- 2019: $55,964 (+$3,415.0, +6.5% from previous year)
- 2020: $N/A
- 2021: $68,058
- 2022: $62,111 (-$5,946.0, -8.74% from previous year)
- 2023: $69,147 (+$7,036.0, +11.33% from previous year)
- 2024: $61,106 (-$8,041.0, -11.63% from previous year)
- 2025: $60,548 (-$558.0, -0.91% from previous year)
Zeigler’s home prices in 2025 sit just 1.7% above where they were a decade ago in 2015. That slow overall growth includes a rollercoaster of dips and spikes—particularly a sharp rise in 2021 followed by uneven performance afterward.
Zeigler – A Market of Ups and Downs

Zeigler is a small Franklin County community in Southern Illinois, and its home prices reflect a history of economic ebbs and flows. After plummeting in 2016 and 2017, the town bounced back strongly in 2021—but couldn’t hold onto those gains. By 2025, prices have nearly returned to their 2015 levels.
With coal mining roots and a quiet rural character, Zeigler remains an accessible housing market. The volatile pricing may discourage some investors but could benefit long-term residents or buyers entering at today’s lower valuations.
10. Sheldon – 5.2% Home Price Increase Since 2022

- 2010: $N/A
- 2011: $N/A
- 2012: $N/A
- 2013: $N/A
- 2014: $N/A
- 2015: $N/A
- 2016: $N/A
- 2017: $N/A
- 2018: $N/A
- 2019: $N/A
- 2020: $N/A
- 2021: $N/A
- 2022: $56,073
- 2023: $56,852 (+$780.0, +1.39% from previous year)
- 2024: $53,998 (-$2,855.0, -5.02% from previous year)
- 2025: $59,005 (+$5,007.0, +9.27% from previous year)
Since 2022, Sheldon’s home values have grown by just over 5%, going from $56,073 to $59,005. Prices dipped slightly in 2024 but recovered in 2025 with one of the sharper year-over-year jumps on this list. Overall, it remains one of the more affordable options in rural Illinois.
Sheldon – Quiet Country Town with Steady Demand

Sheldon is a small village in Iroquois County, tucked along the eastern edge of Illinois near the Indiana border. It’s surrounded by farmland and operates at a rural pace, but it hasn’t been immune to broader real estate pressures. After a modest decline in 2024, 2025 saw prices bounce back by more than $5,000—suggesting local demand still exists, even in remote corners of the state.
With prices hovering under $60,000, Sheldon offers one of the lowest-cost housing markets in the region. Its appeal lies in simplicity: quiet living, wide open spaces, and a low barrier to entry for prospective homeowners.
9. Cahokia – 25.2% Home Price Increase Since 2016

🔥 Would you like to save this?
- 2010: $N/A
- 2011: $N/A
- 2012: $N/A
- 2013: $N/A
- 2014: $N/A
- 2015: $N/A
- 2016: $43,402
- 2017: $38,819 (-$4,583.0, -10.56% from previous year)
- 2018: $45,138 (+$6,319.0, +16.28% from previous year)
- 2019: $47,179 (+$2,040.0, +4.52% from previous year)
- 2020: $N/A
- 2021: $52,422
- 2022: $56,189 (+$3,766.0, +7.18% from previous year)
- 2023: $52,503 (-$3,685.0, -6.56% from previous year)
- 2024: $53,393 (+$890.0, +1.7% from previous year)
- 2025: $54,338 (+$945.0, +1.77% from previous year)
Cahokia’s home values have climbed by about 25% since 2016, rising from $43,402 to $54,338 in 2025. While there have been minor dips, the general trend has been steady upward movement, keeping this Metro East community firmly in the affordable tier.
Cahokia – Historic Significance Meets Housing Bargains
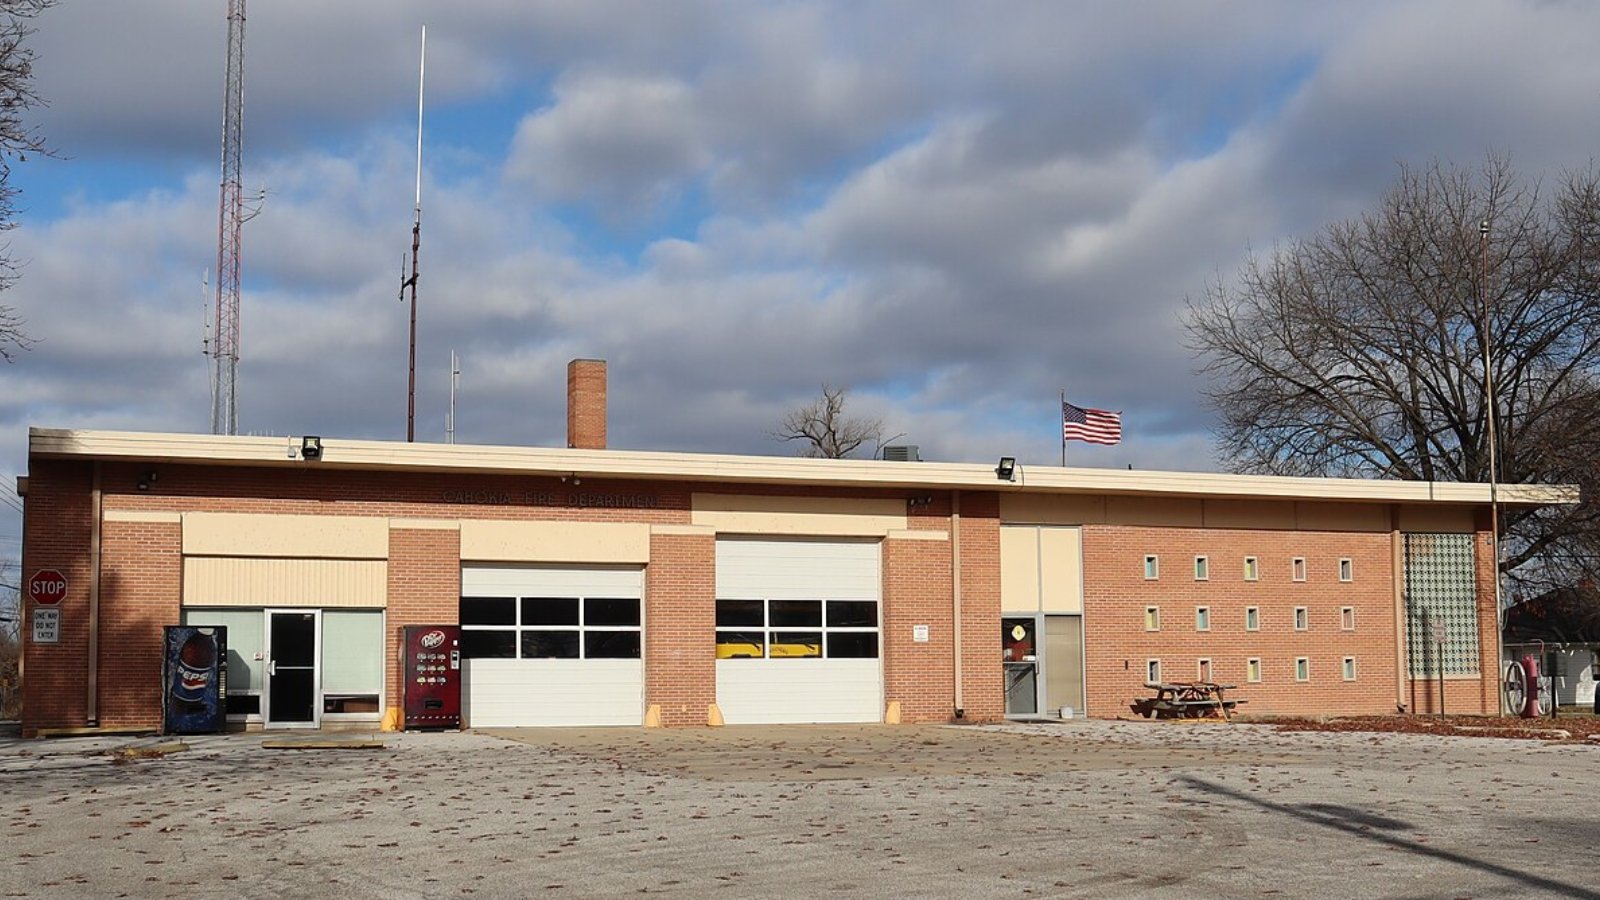
Cahokia, now part of the newly formed Cahokia Heights, sits in the Metro East region just across the river from St. Louis. Known for its ancient mounds and archaeological sites, the town carries historic weight—but its housing remains among the most affordable in the metro area. The post-2020 rebound has kept values above $50K, though year-to-year fluctuations show an unsettled market.
What stands out is the community’s resilience. Despite infrastructure challenges and population shifts, home prices have generally increased since 2016. For buyers willing to look beyond image and into long-term potential, Cahokia offers an affordable entry point near a major city.
8. Madison – 80.5% Home Price Increase Since 2010

- 2010: $28,805
- 2011: $28,182 (-$623.0, -2.16% from previous year)
- 2012: $24,680 (-$3,502.0, -12.43% from previous year)
- 2013: $24,301 (-$379.0, -1.54% from previous year)
- 2014: $22,711 (-$1,590.0, -6.54% from previous year)
- 2015: $25,358 (+$2,647.0, +11.66% from previous year)
- 2016: $26,901 (+$1,543.0, +6.08% from previous year)
- 2017: $25,065 (-$1,836.0, -6.83% from previous year)
- 2018: $29,891 (+$4,826.0, +19.25% from previous year)
- 2019: $32,623 (+$2,732.0, +9.14% from previous year)
- 2020: $N/A
- 2021: $41,894
- 2022: $44,094 (+$2,200.0, +5.25% from previous year)
- 2023: $42,438 (-$1,656.0, -3.76% from previous year)
- 2024: $49,719 (+$7,281.0, +17.16% from previous year)
- 2025: $52,008 (+$2,289.0, +4.6% from previous year)
Madison has seen a significant long-term gain, with home values rising more than 80% since 2010. Prices dipped early in the decade but have surged since 2018. In 2025, homes are priced at $52,008—still well below national averages, yet up sharply from where they began.
Madison – Comeback Driven by Location and Momentum

Sitting along the Mississippi River just north of East St. Louis, Madison benefits from its strategic location without carrying the same price tag. Despite early setbacks in the 2010s, its housing market has bounced back strongly over the past few years. Recent gains in 2024 and 2025 suggest increasing confidence in the area.
Its close proximity to major transport routes and industry likely plays a role in rising demand. With housing still averaging below $55K, Madison may be turning a corner—though it remains accessible for buyers hoping to catch a market on the upswing.
7. Sorento – 17.9% Home Price Decrease Since 2021

- 2010: $N/A
- 2011: $N/A
- 2012: $N/A
- 2013: $N/A
- 2014: $N/A
- 2015: $N/A
- 2016: $N/A
- 2017: $N/A
- 2018: $N/A
- 2019: $N/A
- 2020: $N/A
- 2021: $57,995
- 2022: $57,851 (-$145.0, -0.25% from previous year)
- 2023: $51,933 (-$5,918.0, -10.23% from previous year)
- 2024: $55,228 (+$3,295.0, +6.34% from previous year)
- 2025: $47,605 (-$7,622.0, -13.8% from previous year)
Sorento’s home prices have dropped nearly 18% since 2021. After a small rebound in 2024, 2025 saw another major dip, bringing values down to $47,605. For prospective buyers, this could present a chance to enter the market well below peak pricing.
Sorento – Price Slides in a Rural Setting

Located in Bond County, Sorento is a rural community with a population under 500. Its small size has helped keep prices low, but also makes the housing market sensitive to even small changes. The 2025 drop wiped out the prior year’s recovery, suggesting either weak demand or economic headwinds locally.
Despite the volatility, prices are still low by state standards. The market’s downward trend may reflect declining local employment or shrinking population—but for a buyer looking to invest long-term or secure a budget-friendly rural home, Sorento could be worth a closer look.
6. Centreville – 11.2% Home Price Decrease Since 2016

- 2010: $N/A
- 2011: $N/A
- 2012: $N/A
- 2013: $N/A
- 2014: $N/A
- 2015: $N/A
- 2016: $48,765
- 2017: $41,596 (-$7,169.0, -14.7% from previous year)
- 2018: $42,865 (+$1,268.0, +3.05% from previous year)
- 2019: $45,184 (+$2,319.0, +5.41% from previous year)
- 2020: $N/A
- 2021: $53,738
- 2022: $50,843 (-$2,895.0, -5.39% from previous year)
- 2023: $48,965 (-$1,878.0, -3.69% from previous year)
- 2024: $45,921 (-$3,043.0, -6.21% from previous year)
- 2025: $43,318 (-$2,604.0, -5.67% from previous year)
Centreville’s home values have declined by about 11% since 2016, sliding from $48,765 to $43,318 in 2025. Several years of steady losses have pushed this Metro East town into deeper affordability territory.
Centreville – Stuck in Decline, But Prices Stay Low
Centreville is now part of Cahokia Heights, following a municipal merger aimed at addressing long-standing issues with infrastructure and services. Located near East St. Louis, the town has faced persistent economic challenges, and the housing market reflects that struggle.
Despite a brief lift in 2021, the downward trend has resumed, with prices falling every year since. For buyers willing to invest in a community mid-recovery, Centreville presents one of the lowest entry points in the state. But like other towns on this list, it’s affordability with caution attached.
5. Wamac – 14.3% Home Price Decrease Since 2021

- 2010: $N/A
- 2011: $N/A
- 2012: $N/A
- 2013: $N/A
- 2014: $N/A
- 2015: $N/A
- 2016: $N/A
- 2017: $N/A
- 2018: $N/A
- 2019: $N/A
- 2020: $N/A
- 2021: $49,511
- 2022: $46,197 (-$3,313.0, -6.69% from previous year)
- 2023: $40,639 (-$5,558.0, -12.03% from previous year)
- 2024: $43,629 (+$2,990.0, +7.36% from previous year)
- 2025: $42,429 (-$1,200.0, -2.75% from previous year)
Wamac’s home prices have declined 14.3% since 2021, falling from $49,511 to $42,429. After a sharp drop in 2023, the market recovered slightly in 2024, only to soften again in 2025. Despite the swings, Wamac remains among the most affordable markets in Illinois.
Wamac – Sharp Price Drops Create Entry Points

Wamac sits at the intersection of Clinton, Marion, and Washington counties in Southern Illinois. It’s a modest residential community near Centralia, and its housing market reflects the region’s broader economic transitions. The post-pandemic years hit Wamac’s housing values hard, with a steep decline in 2023 that has yet to fully rebound.
Even after a short-lived price recovery in 2024, values are now below $43,000. That positions Wamac as a potential opportunity for buyers willing to invest in a fluctuating market. While volatility is a factor, current prices are some of the lowest available in the state.
4. East Saint Louis – 6.99% Home Price Increase Since 2015

- 2010: $N/A
- 2011: $N/A
- 2012: $N/A
- 2013: $N/A
- 2014: $N/A
- 2015: $35,326
- 2016: $38,990 (+$3,664.0, +10.37% from previous year)
- 2017: $35,083 (-$3,907.0, -10.02% from previous year)
- 2018: $36,795 (+$1,712.0, +4.88% from previous year)
- 2019: $38,601 (+$1,806.0, +4.91% from previous year)
- 2020: $N/A
- 2021: $44,516
- 2022: $42,780 (-$1,737.0, -3.9% from previous year)
- 2023: $43,293 (+$513.0, +1.2% from previous year)
- 2024: $38,949 (-$4,344.0, -10.03% from previous year)
- 2025: $37,795 (-$1,153.0, -2.96% from previous year)
From $35,326 in 2015 to $37,795 in 2025, East Saint Louis has seen a modest 7% increase over the past decade. But that topline number masks a series of ups and downs. After peaking in 2021, the market declined for three consecutive years.
East Saint Louis – Historic Struggles and Real Estate Stagnation

East Saint Louis has long been known for its economic challenges, and that legacy shows in the housing numbers. Even with some price growth between 2015 and 2021, home values have slipped again more recently. By 2025, prices sit just under $38,000, reflecting decades of disinvestment and infrastructure decline.
Yet for some, this presents a rare opening—especially given its location across the river from downtown St. Louis. The affordability here is extreme, but buyers should weigh those savings against broader challenges facing the area.
3. Cairo – 25.3% Home Price Decrease Since 2021

🔥 Would you like to save this?
- 2010: $N/A
- 2011: $N/A
- 2012: $N/A
- 2013: $N/A
- 2014: $N/A
- 2015: $N/A
- 2016: $N/A
- 2017: $N/A
- 2018: $N/A
- 2019: $N/A
- 2020: $N/A
- 2021: $49,521
- 2022: $47,974 (-$1,547.0, -3.12% from previous year)
- 2023: $36,595 (-$11,380.0, -23.72% from previous year)
- 2024: $35,274 (-$1,321.0, -3.61% from previous year)
- 2025: $36,979 (+$1,706.0, +4.84% from previous year)
Cairo has experienced a 25.3% decline in home prices since 2021, falling from $49,521 to $36,979. After a sharp crash in 2023, prices have stabilized somewhat, but the market remains one of the weakest in the state.
Cairo – Southernmost Prices, Southernmost Struggles
Located at the confluence of the Ohio and Mississippi Rivers, Cairo is Illinois’ southernmost town. It once held strategic importance, but decades of population decline and shuttered industry have taken a toll. Real estate values reflect that legacy, with one of the sharpest three-year drops in the state.
Still, 2025 shows signs of leveling off. Whether that small gain turns into a broader trend remains to be seen. But in terms of affordability, Cairo now ranks near the bottom statewide—a reflection of both opportunity and challenge.
2. Washington Park – 6.4% Home Price Decrease Since 2016

- 2010: $N/A
- 2011: $N/A
- 2012: $N/A
- 2013: $N/A
- 2014: $N/A
- 2015: $N/A
- 2016: $36,925
- 2017: $34,371 (-$2,554.0, -6.92% from previous year)
- 2018: $36,077 (+$1,706.0, +4.96% from previous year)
- 2019: $39,616 (+$3,539.0, +9.81% from previous year)
- 2020: $N/A
- 2021: $48,662
- 2022: $42,807 (-$5,855.0, -12.03% from previous year)
- 2023: $37,675 (-$5,132.0, -11.99% from previous year)
- 2024: $34,800 (-$2,875.0, -7.63% from previous year)
- 2025: $34,558 (-$242.0, -0.7% from previous year)
Washington Park’s home prices have dropped 6.4% since 2016. After peaking in 2021, prices tumbled year after year, with 2025 values down nearly 30% from that short-lived high.
Washington Park – Gradual Declines Near the Metro Core

Just east of downtown St. Louis, Washington Park was once a prime corridor for rail and road traffic. Today, the town faces many of the same issues as nearby East Saint Louis—depopulation, reduced services, and slow investment. Home prices have followed suit, falling sharply since 2021.
Still, the housing market hasn’t collapsed completely. The current average price sits at $34,558, offering one of the cheapest entry points within reach of a major metro area. That proximity might one day offer a rebound, but for now, prices remain at a multiyear low.
1. Venice – 37.0% Home Price Increase Since 2016
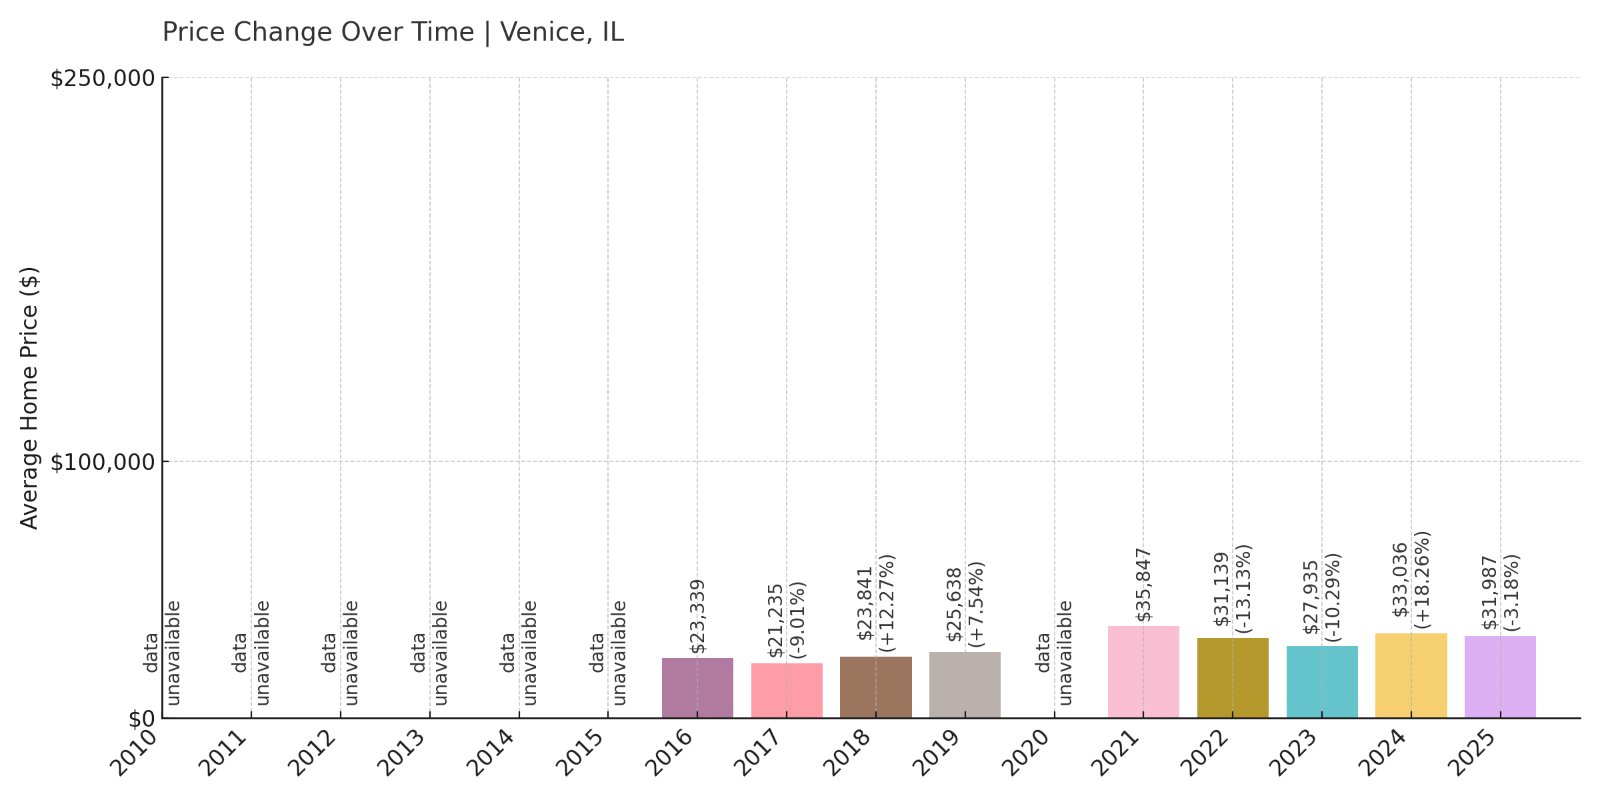
- 2010: $N/A
- 2011: $N/A
- 2012: $N/A
- 2013: $N/A
- 2014: $N/A
- 2015: $N/A
- 2016: $23,339
- 2017: $21,235 (-$2,104.0, -9.01% from previous year)
- 2018: $23,841 (+$2,606.0, +12.27% from previous year)
- 2019: $25,638 (+$1,797.0, +7.54% from previous year)
- 2020: $N/A
- 2021: $35,847
- 2022: $31,139 (-$4,708.0, -13.13% from previous year)
- 2023: $27,935 (-$3,204.0, -10.29% from previous year)
- 2024: $33,036 (+$5,101.0, +18.26% from previous year)
- 2025: $31,987 (-$1,049.0, -3.18% from previous year)
Venice’s home values have increased by 37% since 2016, jumping from $23,339 to $31,987. That growth includes a steep rise before 2021, followed by uneven but still relatively high prices for the region.
Venice – Riverfront Recovery, But Cautiously

Venice sits directly across the Mississippi River from downtown St. Louis. Like many towns in the Metro East region, it has seen decades of population loss, but its riverfront location remains valuable. Housing prices nearly doubled by 2021, though recent years have been marked by retreats and rebounds.
With 2025 values still higher than where they started, Venice stands out as one of the rare affordable towns that has experienced real growth over the long term. At under $32,000, homes here are still inexpensive—especially given the view across the river.