🔥 Would you like to save this?
Even with Delaware’s rising home values, not every town has priced out the average buyer. The Zillow Home Value Index reveals which places still offer real breathing room when it comes to affordability. From quiet rural corners to underrated suburbs, these 15 towns have kept prices surprisingly low—even as the rest of the market took off. Whether you’re searching for a place to settle or just watching the trends, this list shows where your dollar still goes a long way in Delaware.
15. Ellendale – 132% Home Price Increase Since 2013
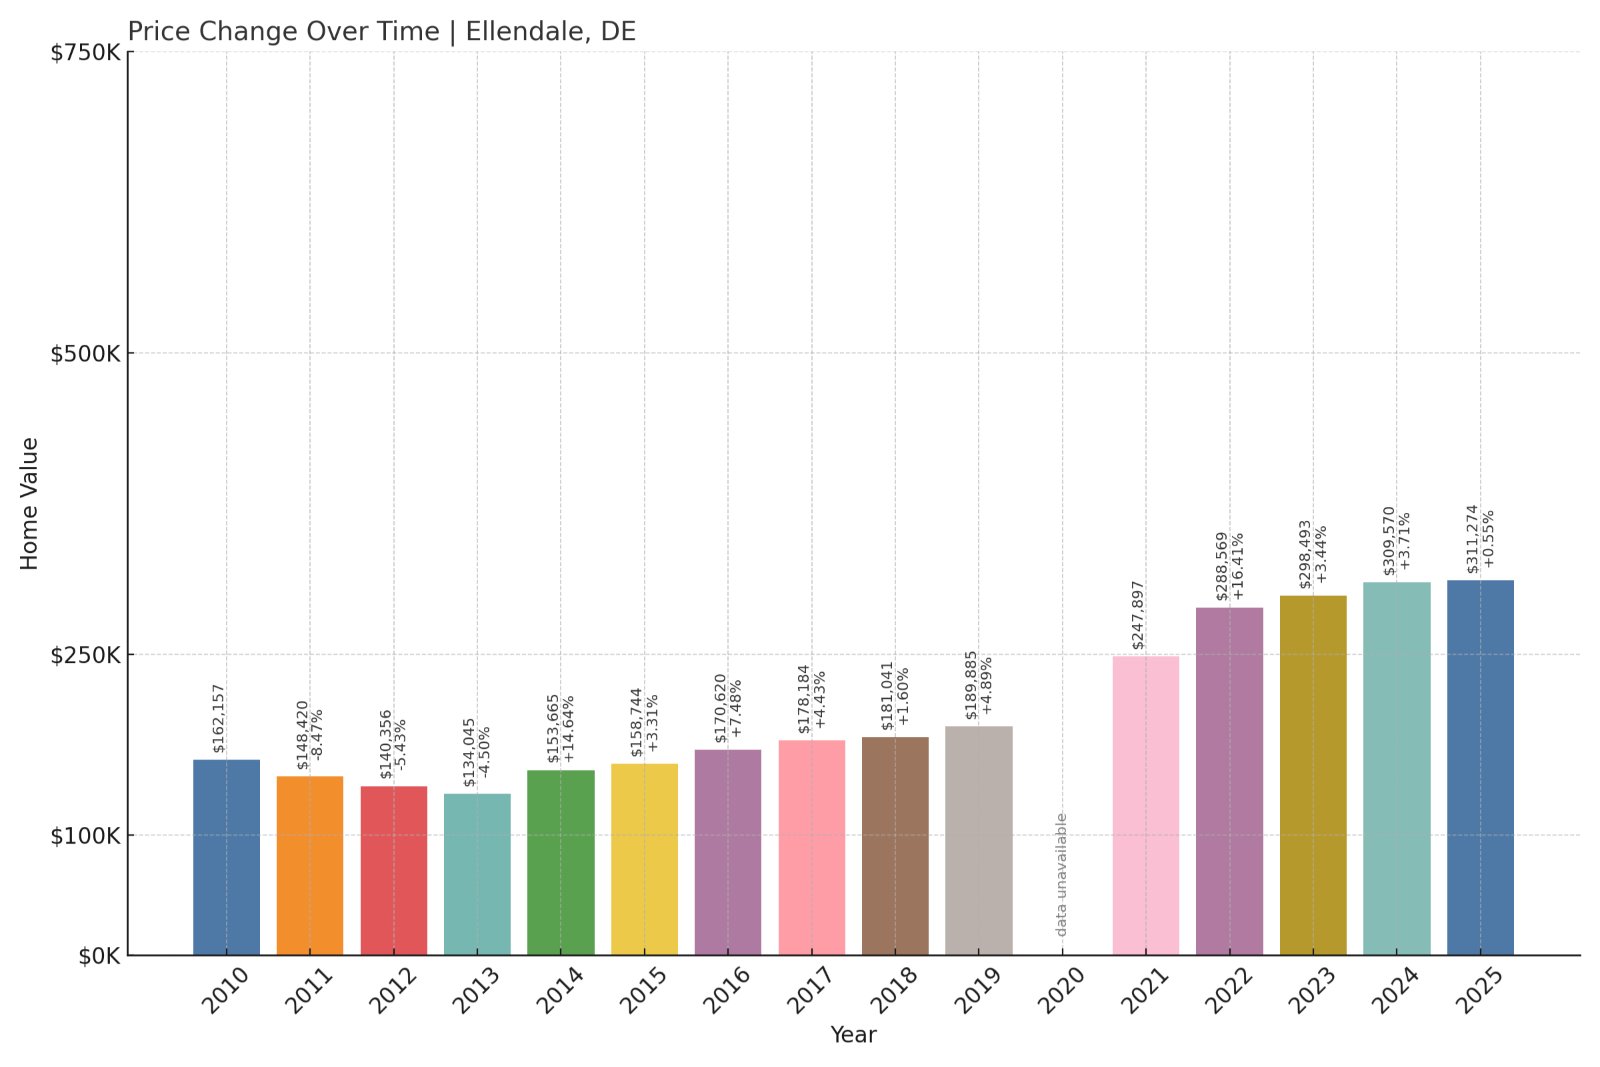
- 2010: $162,157
- 2011: $148,420 (-$13,737, -8.47% from previous year)
- 2012: $140,356 (-$8,064, -5.43% from previous year)
- 2013: $134,045 (-$6,310, -4.50% from previous year)
- 2014: $153,665 (+$19,619, +14.64% from previous year)
- 2015: $158,744 (+$5,079, +3.31% from previous year)
- 2016: $170,620 (+$11,876, +7.48% from previous year)
- 2017: $178,184 (+$7,564, +4.43% from previous year)
- 2018: $181,041 (+$2,857, +1.60% from previous year)
- 2019: $189,885 (+$8,844, +4.89% from previous year)
- 2020: N/A
- 2021: $247,897
- 2022: $288,569 (+$40,672, +16.41% from previous year)
- 2023: $298,493 (+$9,924, +3.44% from previous year)
- 2024: $309,570 (+$11,077, +3.71% from previous year)
- 2025: $311,274 (+$1,704, +0.55% from previous year)
Ellendale’s home prices have more than doubled since 2013, when the median was just over $134,000. While the town saw a slow climb through the mid-2010s, values jumped sharply after 2020, with a particularly strong gain in 2022. Even with a slight tapering in 2025, prices have remained steady, ending at around $311,000—still below many other Delaware markets, which helps keep Ellendale on the list of the state’s most affordable towns.
In order to come up with the very specific design ideas, we create most designs with the assistance of state-of-the-art AI interior design software.
Ellendale – Steady Growth and Rural Appeal

Ellendale is located in Sussex County, in the south-central part of Delaware, surrounded by farmland, forest, and small-town charm. It’s often considered a gateway to the coastal resorts while offering a much quieter and less expensive lifestyle. The town lacks the high tourist traffic of beach towns, which likely contributes to its relatively modest home values.
The rise in prices over the past few years could be tied to broader demand for affordable homes within commuting distance to larger cities like Dover. While the town has limited commercial development, it’s appealing to buyers seeking space, simplicity, and rural charm. With infrastructure improvements and increasing interest in southern Delaware, Ellendale may not remain as affordable in the long run—but for now, it continues to offer some of the best value in the state.
14. Claymont – 58% Home Price Increase Since 2013
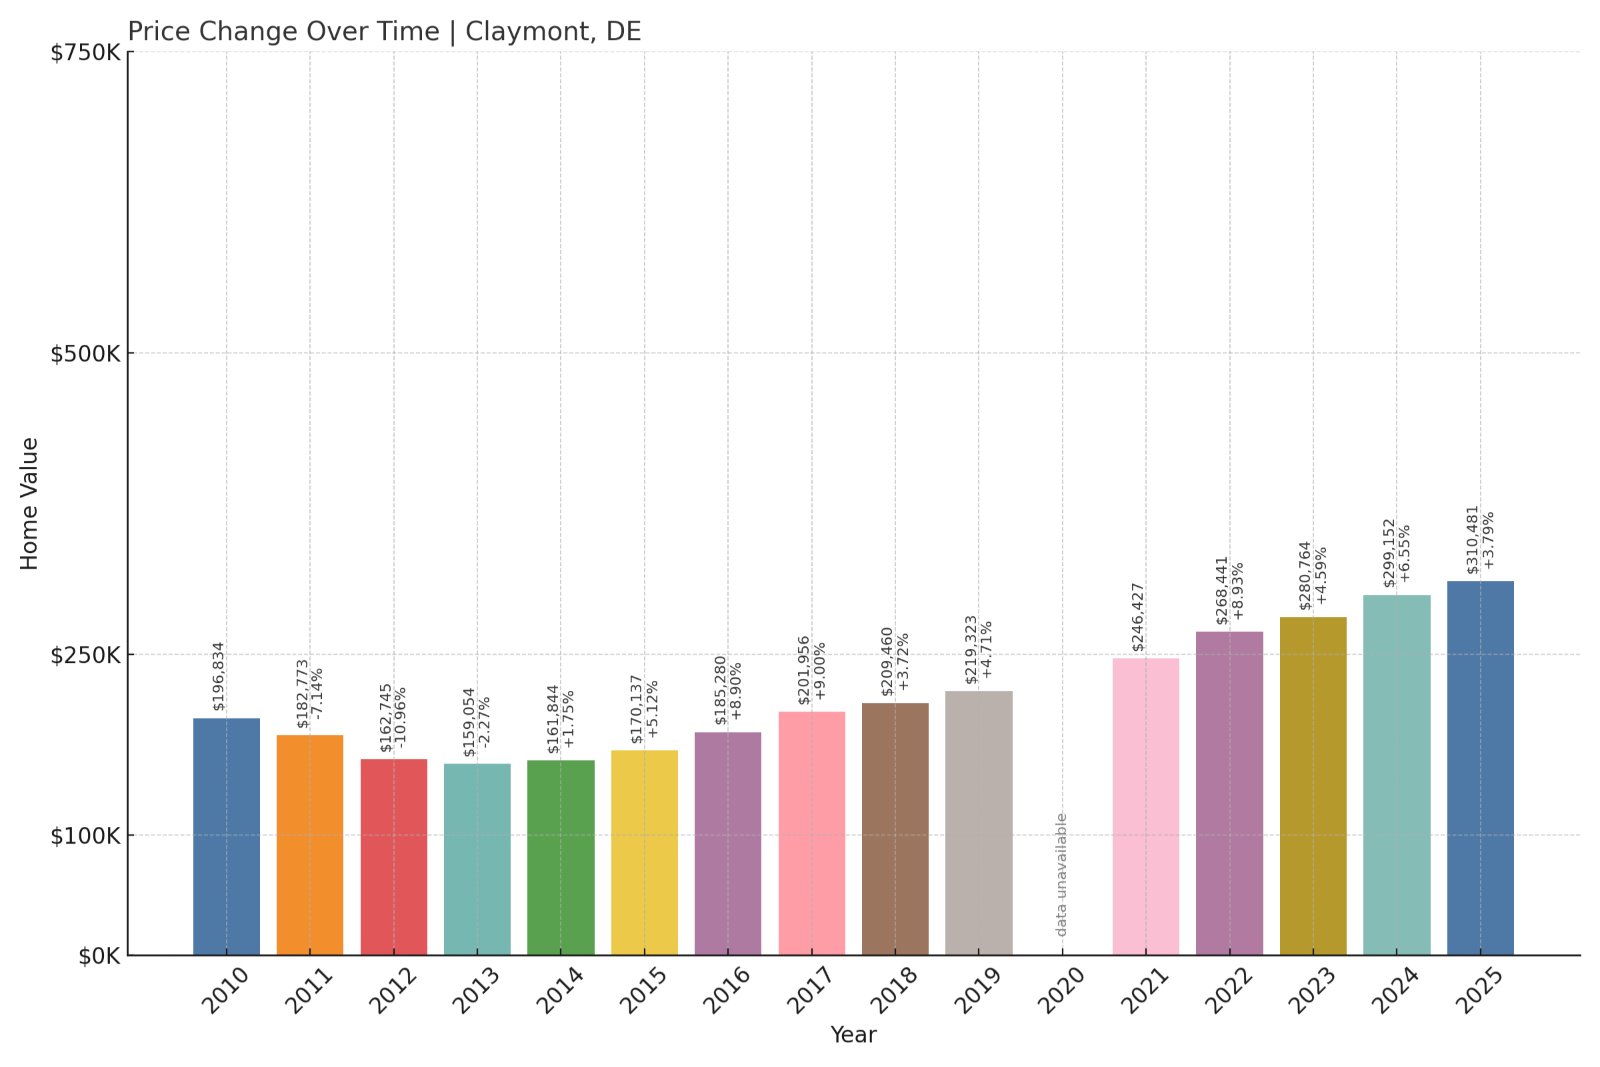
- 2010: $196,834
- 2011: $182,773 (-$14,061, -7.14% from previous year)
- 2012: $162,745 (-$20,028, -10.96% from previous year)
- 2013: $159,054 (-$3,691, -2.27% from previous year)
- 2014: $161,844 (+$2,791, +1.75% from previous year)
- 2015: $170,137 (+$8,293, +5.12% from previous year)
- 2016: $185,280 (+$15,143, +8.90% from previous year)
- 2017: $201,956 (+$16,675, +9.00% from previous year)
- 2018: $209,460 (+$7,505, +3.72% from previous year)
- 2019: $219,323 (+$9,862, +4.71% from previous year)
- 2020: N/A
- 2021: $246,427
- 2022: $268,441 (+$22,014, +8.93% from previous year)
- 2023: $280,764 (+$12,323, +4.59% from previous year)
- 2024: $299,152 (+$18,387, +6.55% from previous year)
- 2025: $310,481 (+$11,329, +3.79% from previous year)
Claymont’s housing market has moved steadily upward since bottoming out in 2013. With home values climbing from just under $160,000 that year to over $310,000 by 2025, it’s seen an increase of nearly 58%. Despite this growth, Claymont remains one of Delaware’s more affordable options—particularly for those seeking proximity to Wilmington and the Philadelphia metro area.
Claymont – Affordable Access to the Urban Core

Claymont sits at the northern tip of Delaware, just a short drive from downtown Wilmington and right across the Pennsylvania border. This location makes it ideal for commuters, especially with easy access to I-95 and SEPTA rail service. As nearby urban areas have become less affordable, Claymont’s appeal as a lower-cost alternative has grown.
The community has seen targeted revitalization efforts, including mixed-use development projects and investments in public spaces. These changes, along with regional housing demand, have driven the uptick in home values. Still, with a median price just over $310,000, Claymont remains attainable compared to many other towns along the Northeast Corridor.
13. Seaford – 108% Home Price Increase Since 2013
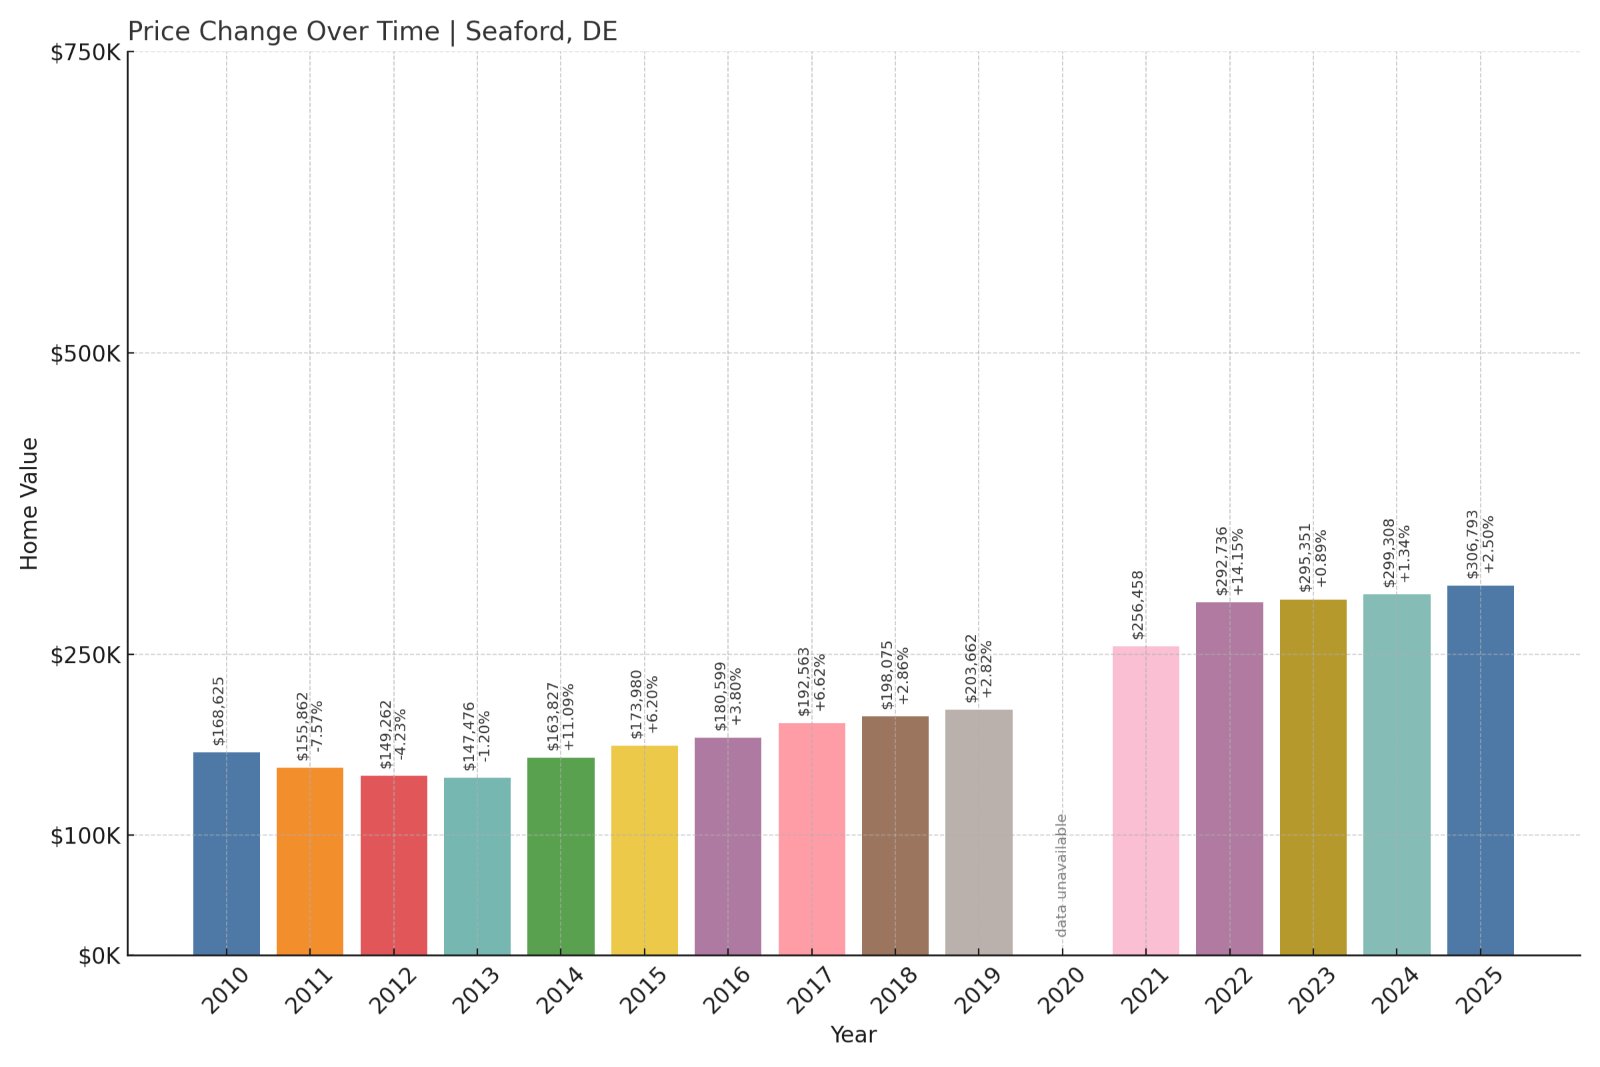
- 2010: $168,625
- 2011: $155,862 (-$12,763, -7.57% from previous year)
- 2012: $149,262 (-$6,600, -4.23% from previous year)
- 2013: $147,476 (-$1,786, -1.20% from previous year)
- 2014: $163,827 (+$16,351, +11.09% from previous year)
- 2015: $173,980 (+$10,153, +6.20% from previous year)
- 2016: $180,599 (+$6,619, +3.80% from previous year)
- 2017: $192,563 (+$11,964, +6.62% from previous year)
- 2018: $198,075 (+$5,513, +2.86% from previous year)
- 2019: $203,662 (+$5,587, +2.82% from previous year)
- 2020: N/A
- 2021: $256,458
- 2022: $292,736 (+$36,278, +14.15% from previous year)
- 2023: $295,351 (+$2,616, +0.89% from previous year)
- 2024: $299,308 (+$3,957, +1.34% from previous year)
- 2025: $306,793 (+$7,485, +2.50% from previous year)
Home values in Seaford have surged more than 100% since 2013, rising from just under $148,000 to nearly $307,000. Price gains were steady throughout the 2010s and spiked in 2021 and 2022. Even after cooling slightly in recent years, Seaford’s prices have held strong, keeping it affordable relative to other parts of Delaware.
Seaford – Rising Prices in a Small City
Located along the Nanticoke River in western Sussex County, Seaford is one of Delaware’s few inland cities. Once an agricultural and canning hub, it has evolved into a quiet residential center with proximity to the beaches and nearby Maryland towns. A modest downtown and several parks make it a livable and appealing option for families.
Housing prices here reflect increased demand for more space at lower costs, especially post-2020. Seaford’s accessibility, availability of older homes, and regional job growth have all contributed to its upward trend. But with home values still under $310,000, it remains a bargain by state standards.
12. Laurel – 111% Home Price Increase Since 2013

- 2010: $171,934
- 2011: $160,984 (-$10,950, -6.37% from previous year)
- 2012: $149,707 (-$11,277, -7.00% from previous year)
- 2013: $145,187 (-$4,520, -3.02% from previous year)
- 2014: $163,165 (+$17,978, +12.38% from previous year)
- 2015: $171,580 (+$8,415, +5.16% from previous year)
- 2016: $177,556 (+$5,975, +3.48% from previous year)
- 2017: $189,329 (+$11,773, +6.63% from previous year)
- 2018: $194,833 (+$5,504, +2.91% from previous year)
- 2019: $199,732 (+$4,899, +2.51% from previous year)
- 2020: N/A
- 2021: $253,204
- 2022: $294,194 (+$40,989, +16.19% from previous year)
- 2023: $299,870 (+$5,676, +1.93% from previous year)
- 2024: $295,528 (-$4,341, -1.45% from previous year)
- 2025: $305,608 (+$10,080, +3.41% from previous year)
Laurel’s market has climbed significantly since 2013, with a total price increase of over 111%. The largest jump came between 2021 and 2022, followed by modest fluctuations. In 2025, prices are holding near $305,000, keeping Laurel among Delaware’s more affordable towns despite the sustained upward trajectory.
Laurel – Historic Charm with Accessible Prices
Nestled in western Sussex County, Laurel is one of Delaware’s oldest towns, with origins dating back to the 18th century. Its historic district, tree-lined streets, and old-world architecture give it a distinct personality. But despite the charm, Laurel has remained relatively affordable.
Its location—near Route 13 and within easy reach of Salisbury, Maryland—makes it a viable option for cross-border commuters. With modest new development and a continued emphasis on preserving its historic appeal, Laurel attracts buyers seeking value without sacrificing small-town ambiance.
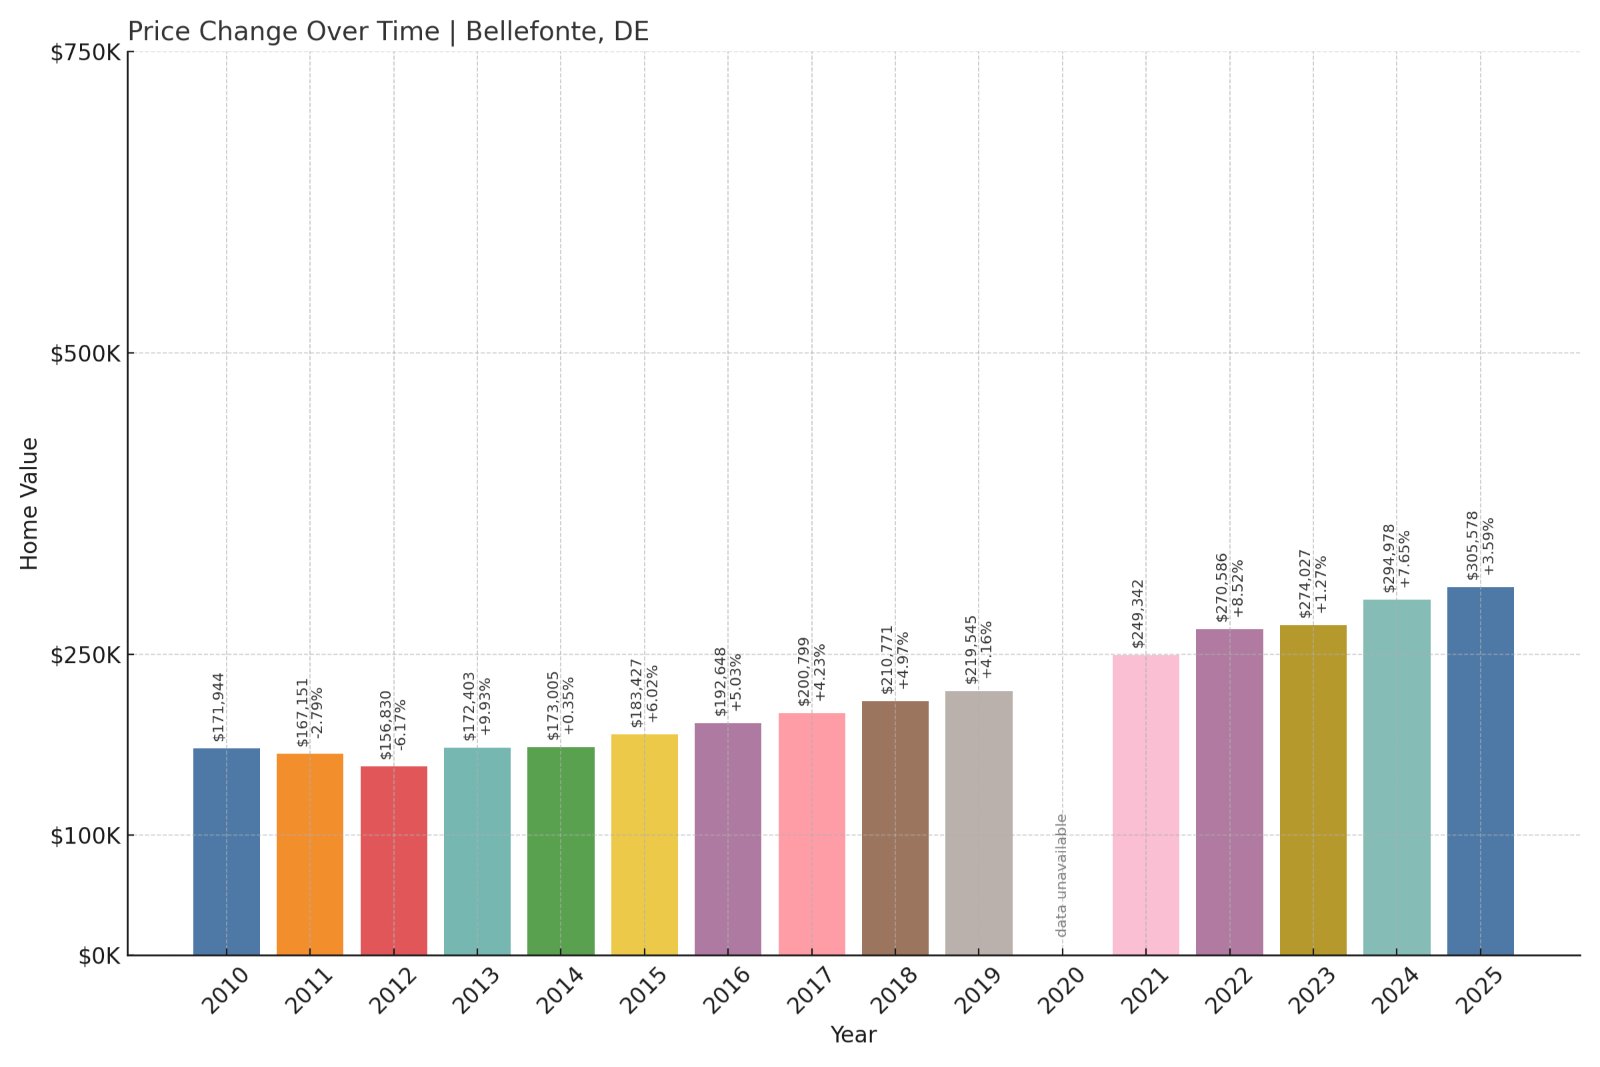
11. Bellefonte – 77% Home Price Increase Since 2013
- 2010: $171,944
- 2011: $167,151 (-$4,793, -2.79% from previous year)
- 2012: $156,830 (-$10,321, -6.17% from previous year)
- 2013: $172,403 (+$15,573, +9.93% from previous year)
- 2014: $173,005 (+$601, +0.35% from previous year)
- 2015: $183,427 (+$10,422, +6.02% from previous year)
- 2016: $192,648 (+$9,221, +5.03% from previous year)
- 2017: $200,799 (+$8,151, +4.23% from previous year)
- 2018: $210,771 (+$9,972, +4.97% from previous year)
- 2019: $219,545 (+$8,774, +4.16% from previous year)
- 2020: N/A
- 2021: $249,342
- 2022: $270,586 (+$21,244, +8.52% from previous year)
- 2023: $274,027 (+$3,441, +1.27% from previous year)
- 2024: $294,978 (+$20,951, +7.65% from previous year)
- 2025: $305,578 (+$10,600, +3.59% from previous year)
Since 2013, Bellefonte’s home values have grown 77%, climbing from just over $172,000 to more than $305,000 in 2025. Though it’s on the higher end of this list, it remains one of the most affordable towns in New Castle County—particularly for those who want a balance between price and proximity to major job hubs.
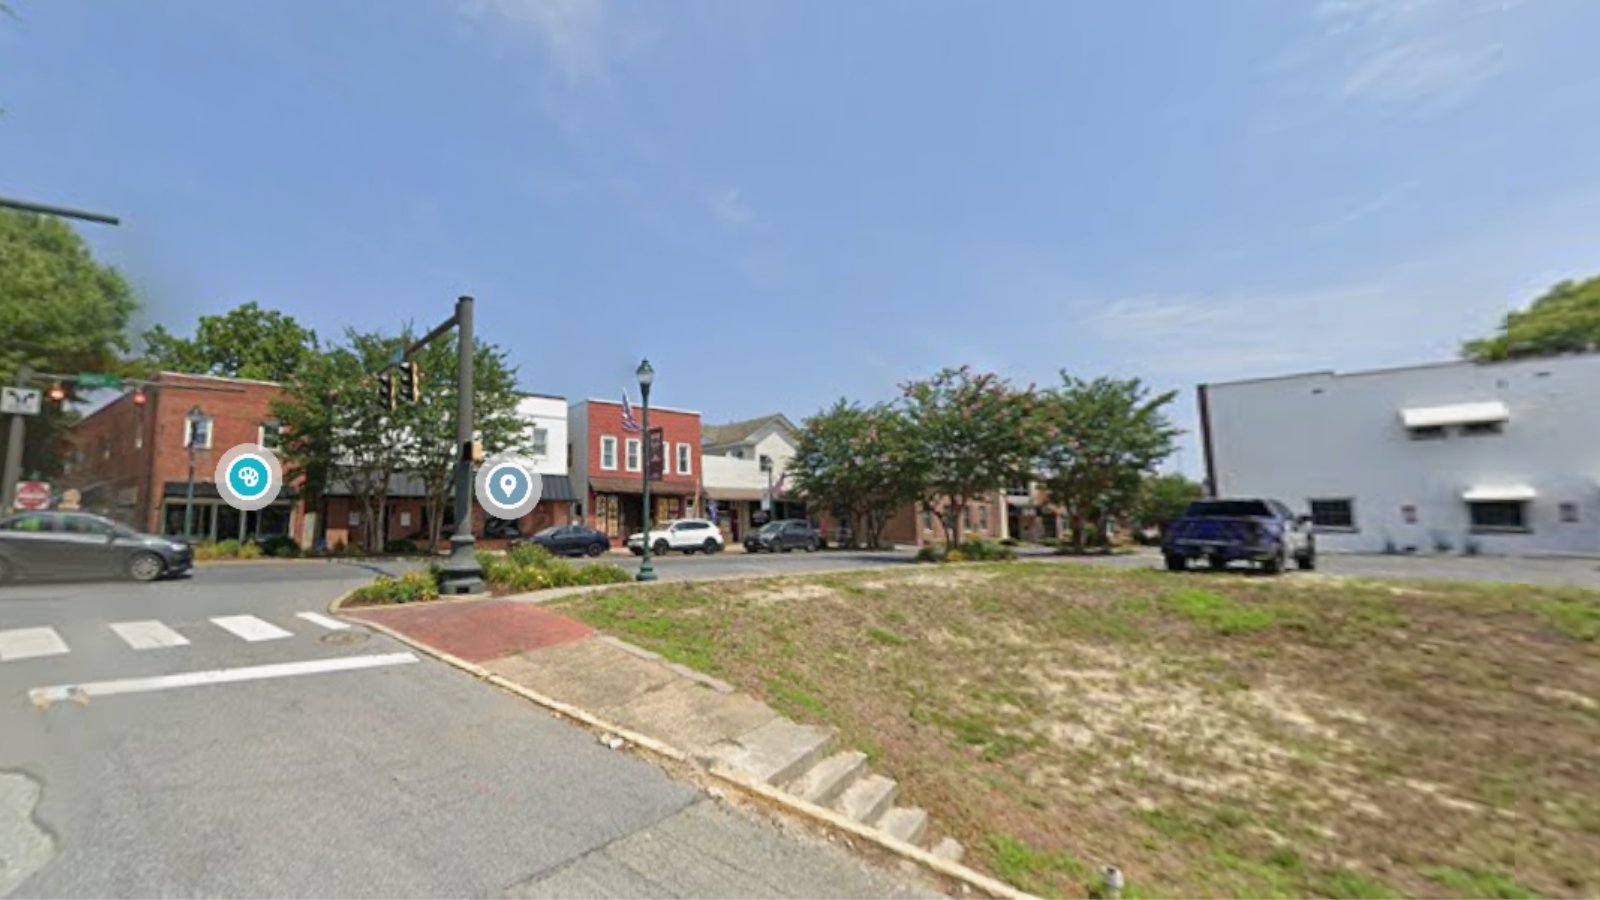
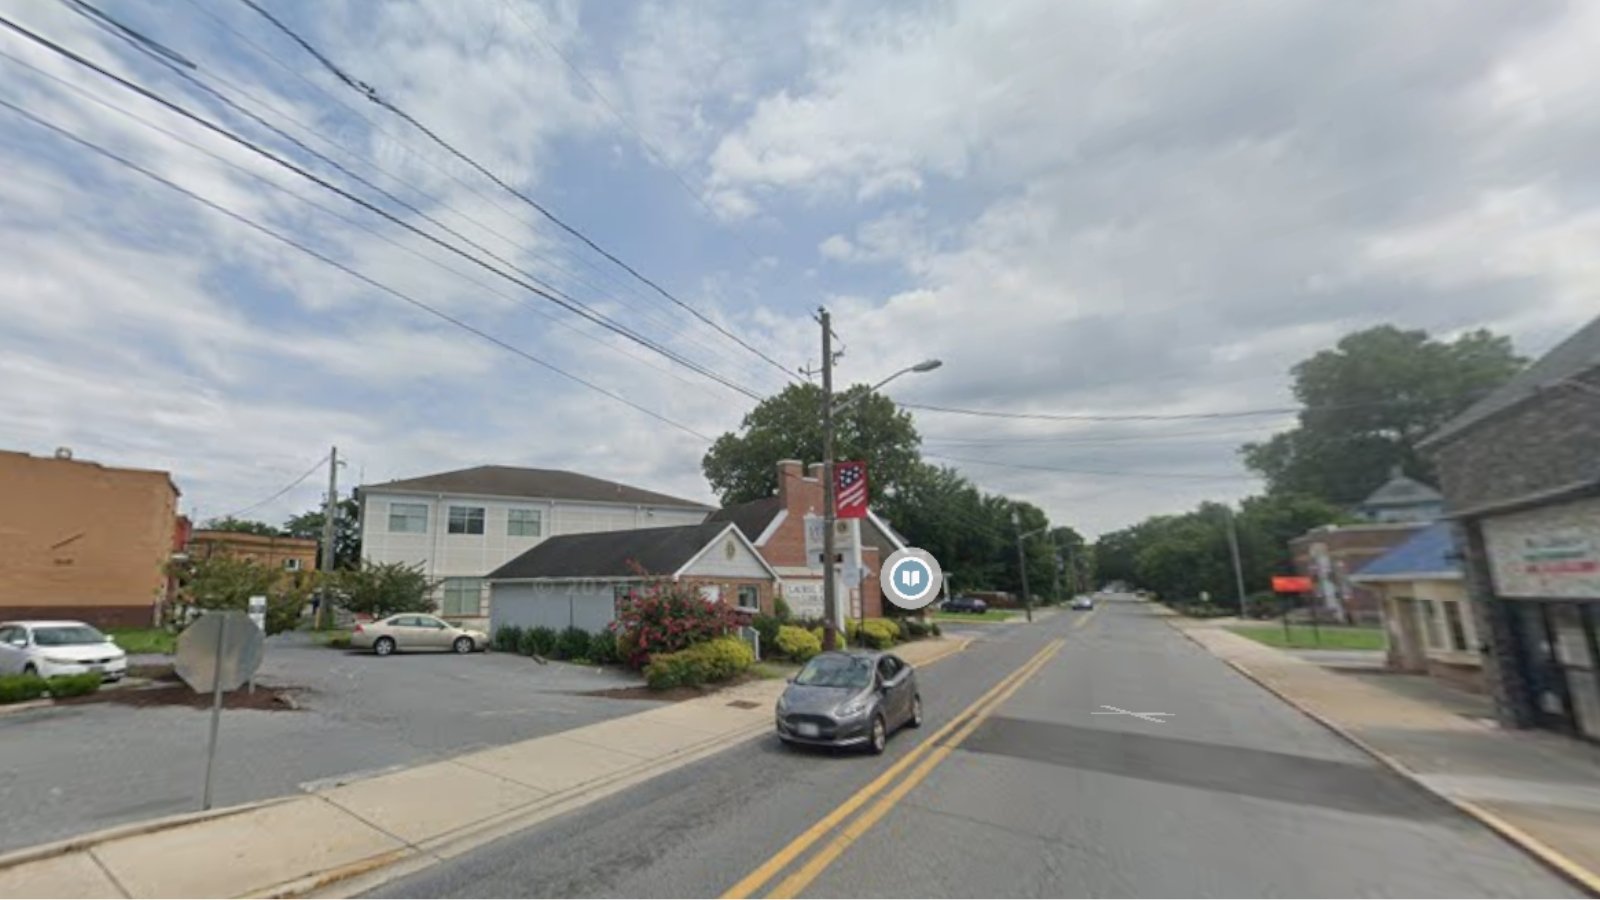
Bellefonte – Affordable Living Near Wilmington

Bellefonte is a small, incorporated town just outside Wilmington. Known for its older housing stock and walkable streets, it offers an alternative to more expensive neighborhoods in the metro area. Despite its close proximity to the city, Bellefonte has retained a village-like feel.
Residents are drawn to its artsy vibe, independent shops, and small-scale charm. The town’s consistent but moderate home price growth suggests strong demand, but without the overheating seen in other suburbs. With Wilmington just minutes away, Bellefonte remains a practical choice for buyers priced out of the larger city.
10. Wyoming – 114% Home Price Increase Since 2013

- 2010: $159,365
- 2011: $150,485 (-$8,880, -5.57% from previous year)
- 2012: $140,777 (-$9,708, -6.45% from previous year)
- 2013: $142,632 (+$1,855, +1.32% from previous year)
- 2014: $149,398 (+$6,766, +4.74% from previous year)
- 2015: $152,988 (+$3,590, +2.40% from previous year)
- 2016: $157,770 (+$4,782, +3.13% from previous year)
- 2017: $168,792 (+$11,023, +6.99% from previous year)
- 2018: $171,946 (+$3,154, +1.87% from previous year)
- 2019: $185,888 (+$13,942, +8.11% from previous year)
- 2020: N/A
- 2021: $221,973
- 2022: $262,623 (+$40,650, +18.31% from previous year)
- 2023: $280,256 (+$17,633, +6.71% from previous year)
- 2024: $295,461 (+$15,205, +5.43% from previous year)
- 2025: $304,430 (+$8,969, +3.04% from previous year)
Wyoming, Delaware has experienced a strong and steady climb in home prices over the past decade. From just under $143,000 in 2013 to over $304,000 by 2025, values have jumped by more than 100%, with sharp increases especially noticeable after 2020. Despite this growth, the town remains more affordable than many of its suburban peers.
Wyoming – Small-Town Feel Near Dover

Located just southwest of Dover, Wyoming is a quiet residential town known for its small-town vibe and close-knit community. Its central location and access to nearby amenities in the state capital make it a convenient place to live for families and professionals alike.
Home prices have risen in tandem with growing interest in the greater Dover area. The town’s historic charm, good schools, and safe neighborhoods help keep demand up, while its modest size limits supply. These dynamics have driven prices upward, but Wyoming still provides good value compared to the northern part of the state.
9. Bowers – 140% Home Price Increase Since 2013

🔥 Would you like to save this?
- 2010: $141,413
- 2011: $134,478 (-$6,936, -4.90% from previous year)
- 2012: $139,069 (+$4,591, +3.41% from previous year)
- 2013: $124,664 (-$14,405, -10.36% from previous year)
- 2014: $129,024 (+$4,360, +3.50% from previous year)
- 2015: $149,180 (+$20,155, +15.62% from previous year)
- 2016: $161,252 (+$12,073, +8.09% from previous year)
- 2017: $163,320 (+$2,067, +1.28% from previous year)
- 2018: $175,684 (+$12,364, +7.57% from previous year)
- 2019: $181,733 (+$6,049, +3.44% from previous year)
- 2020: N/A
- 2021: $226,552
- 2022: $243,305 (+$16,753, +7.39% from previous year)
- 2023: $268,269 (+$24,964, +10.26% from previous year)
- 2024: $288,482 (+$20,213, +7.53% from previous year)
- 2025: $299,758 (+$11,276, +3.91% from previous year)
Bowers’ housing market has more than doubled in value since hitting a low in 2013. In that year, prices dropped to roughly $125,000—but they’ve since risen by 140%, ending at nearly $300,000 in 2025. That growth is substantial, yet Bowers remains a relatively low-cost coastal town in the state.
Bowers – Coastal Living at a Lower Price

Bowers Beach is a small town on the Delaware Bay, known for its fishing piers, beach access, and tight-knit community. Unlike the state’s more popular oceanfront areas, Bowers has retained a down-to-earth, quieter character that appeals to longtime locals and retirees alike.
The town’s recent price gains reflect increasing interest in Delaware’s coastal real estate, driven by both second-home buyers and primary residents seeking waterfront access. Still, Bowers remains notably more affordable than towns like Rehoboth Beach or Bethany, making it a unique opportunity for those who want bayfront living without the hefty price tag.
8. Delaware City – 103% Home Price Increase Since 2013

- 2010: $163,061
- 2011: $149,105 (-$13,956, -8.56% from previous year)
- 2012: $140,566 (-$8,539, -5.73% from previous year)
- 2013: $142,304 (+$1,738, +1.24% from previous year)
- 2014: $155,948 (+$13,644, +9.59% from previous year)
- 2015: $167,052 (+$11,104, +7.12% from previous year)
- 2016: $176,506 (+$9,454, +5.66% from previous year)
- 2017: $191,998 (+$15,492, +8.78% from previous year)
- 2018: $194,018 (+$2,019, +1.05% from previous year)
- 2019: $204,276 (+$10,258, +5.29% from previous year)
- 2020: N/A
- 2021: $230,883
- 2022: $254,433 (+$23,550, +10.20% from previous year)
- 2023: $265,923 (+$11,490, +4.52% from previous year)
- 2024: $279,690 (+$13,767, +5.18% from previous year)
- 2025: $288,475 (+$8,784, +3.14% from previous year)
Delaware City’s home prices have climbed steadily since 2013, gaining more than 100% in value over that time. From around $142,000 that year to nearly $290,000 in 2025, the growth has been persistent but not erratic. Its affordability—particularly for a waterfront community—remains one of its standout features.
Delaware City – Historic Riverfront with Low Prices

Delaware City sits on the banks of the Delaware River and offers a quaint, walkable downtown steeped in history. It’s home to Fort Delaware State Park, accessible by ferry, and a growing trail network that connects to larger statewide greenways.
The town’s location makes it appealing for those who want a scenic view without the traffic of coastal hotspots. Though its small size limits inventory, housing demand has kept values moving upward. Its relatively low starting point, however, has helped it stay within reach of first-time buyers and retirees.
7. New Castle – 108% Home Price Increase Since 2013

- 2010: $168,898
- 2011: $155,045 (-$13,853, -8.20% from previous year)
- 2012: $143,436 (-$11,609, -7.49% from previous year)
- 2013: $134,328 (-$9,108, -6.35% from previous year)
- 2014: $142,452 (+$8,124, +6.05% from previous year)
- 2015: $150,128 (+$7,676, +5.39% from previous year)
- 2016: $162,823 (+$12,695, +8.46% from previous year)
- 2017: $179,057 (+$16,234, +9.97% from previous year)
- 2018: $187,433 (+$8,376, +4.68% from previous year)
- 2019: $198,033 (+$10,600, +5.66% from previous year)
- 2020: N/A
- 2021: $226,067
- 2022: $242,802 (+$16,735, +7.40% from previous year)
- 2023: $254,348 (+$11,545, +4.76% from previous year)
- 2024: $271,888 (+$17,540, +6.90% from previous year)
- 2025: $279,163 (+$7,275, +2.68% from previous year)
New Castle’s housing market has grown by more than 100% since 2013, climbing from just over $134,000 to more than $279,000 in 2025. Steady year-over-year increases and a strong post-2020 surge have helped this historic town stay relatively affordable while growing in popularity.
New Castle – Colonial History Meets Affordable Housing

New Castle is one of Delaware’s most historically significant towns, with cobblestone streets and architecture dating back to the 1600s. Located along the Delaware River, it’s often visited for its colonial landmarks and scenic greenways.
Despite its charm and proximity to Wilmington, New Castle’s home prices remain lower than many northern Delaware communities. Its affordability likely stems from older housing stock and modest lot sizes. Still, the town’s strong community feel and historic appeal make it a desirable option for budget-conscious buyers looking for character and convenience.
6. Greenwood – 97% Home Price Increase Since 2013

- 2010: $169,007
- 2011: $159,777 (-$9,230, -5.46% from previous year)
- 2012: $155,618 (-$4,160, -2.60% from previous year)
- 2013: $154,121 (-$1,496, -0.96% from previous year)
- 2014: $168,716 (+$14,594, +9.47% from previous year)
- 2015: $166,977 (-$1,738, -1.03% from previous year)
- 2016: $181,720 (+$14,742, +8.83% from previous year)
- 2017: $187,443 (+$5,724, +3.15% from previous year)
- 2018: $195,053 (+$7,610, +4.06% from previous year)
- 2019: $199,649 (+$4,596, +2.36% from previous year)
- 2020: N/A
- 2021: $223,996
- 2022: $246,490 (+$22,494, +10.04% from previous year)
- 2023: $250,402 (+$3,912, +1.59% from previous year)
- 2024: $263,448 (+$13,046, +5.21% from previous year)
- 2025: $277,553 (+$14,106, +5.35% from previous year)
Home values in Greenwood have risen by nearly 100% since 2013, with prices climbing from around $154,000 to over $277,000 by 2025. The growth has been fairly consistent, with notable boosts in 2016 and 2022. Even so, Greenwood remains one of the most budget-friendly options in Sussex County.
Greenwood – A Rural Market on the Rise

Greenwood sits in central Sussex County and is known for its quiet, rural character. It’s surrounded by farmland and small communities, yet offers convenient access to larger towns like Milford and Seaford. This makes it appealing to those seeking affordability without being completely off the grid.
Its housing market has benefited from low base prices and an influx of buyers seeking simpler lifestyles. There’s limited development pressure here, which helps keep home values in check. But as interest continues to grow in inland Delaware, Greenwood’s affordability may not last forever.
5. Harrington – 136% Home Price Increase Since 2013

- 2010: $140,374
- 2011: $126,365 (-$14,008, -9.98% from previous year)
- 2012: $116,801 (-$9,565, -7.57% from previous year)
- 2013: $114,472 (-$2,329, -1.99% from previous year)
- 2014: $123,265 (+$8,794, +7.68% from previous year)
- 2015: $122,382 (-$884, -0.72% from previous year)
- 2016: $133,278 (+$10,896, +8.90% from previous year)
- 2017: $138,353 (+$5,075, +3.81% from previous year)
- 2018: $151,245 (+$12,893, +9.32% from previous year)
- 2019: $167,564 (+$16,319, +10.79% from previous year)
- 2020: N/A
- 2021: $200,547
- 2022: $227,225 (+$26,678, +13.30% from previous year)
- 2023: $243,915 (+$16,690, +7.35% from previous year)
- 2024: $261,903 (+$17,988, +7.37% from previous year)
- 2025: $270,541 (+$8,638, +3.30% from previous year)
Harrington’s home values have more than doubled since 2013, increasing by 136% to reach nearly $271,000 in 2025. The town has experienced a consistent surge, especially in the early 2020s, making it a standout in Kent County for both growth and value.
Harrington – Affordability Along the Rail Line

Harrington lies along U.S. Route 13 and the Delmarva Central Railroad in southern Kent County. It’s best known for the Delaware State Fairgrounds, which hosts major events and brings a lively spirit to the area each summer. Outside of that, Harrington remains a relatively quiet town with a residential core.
Affordable land and older homes have helped keep prices accessible here, even amid growth. As central Delaware becomes more attractive for buyers priced out of the north or the coast, Harrington has quietly become one of the most affordable yet upward-trending towns in the state.
4. Newport – 99% Home Price Increase Since 2013

- 2010: $161,204
- 2011: $151,848 (-$9,356, -5.80% from previous year)
- 2012: $135,617 (-$16,231, -10.69% from previous year)
- 2013: $133,615 (-$2,002, -1.48% from previous year)
- 2014: $137,863 (+$4,248, +3.18% from previous year)
- 2015: $148,391 (+$10,528, +7.64% from previous year)
- 2016: $156,787 (+$8,396, +5.66% from previous year)
- 2017: $170,760 (+$13,974, +8.91% from previous year)
- 2018: $175,536 (+$4,776, +2.80% from previous year)
- 2019: $182,833 (+$7,297, +4.16% from previous year)
- 2020: N/A
- 2021: $204,906
- 2022: $221,474 (+$16,568, +8.09% from previous year)
- 2023: $235,717 (+$14,243, +6.43% from previous year)
- 2024: $257,146 (+$21,429, +9.09% from previous year)
- 2025: $266,999 (+$9,853, +3.83% from previous year)
Newport’s housing market nearly doubled in value since 2013, with home prices rising from just over $133,000 to nearly $267,000 by 2025. The gains were especially strong after 2020, helping this small New Castle County town retain its position as one of Delaware’s most affordable options near major roadways.
Newport – Small Size, Big Convenience

Newport is a compact town nestled just outside of Wilmington along the Christina River. Though tiny in area, its strategic location near I-95, Route 141, and commuter rail lines makes it a surprisingly convenient place to live for those working in Wilmington, Newark, or even Philadelphia.
The housing stock includes many older homes on small lots, which has helped maintain affordability. Prices have climbed steadily as proximity to job centers and transportation routes continues to attract buyers. Despite its upward trend, Newport remains one of the most budget-friendly spots in northern Delaware.
3. Rodney Village – 133% Home Price Increase Since 2013

🔥 Would you like to save this?
- 2010: N/A
- 2011: N/A
- 2012: $105,369
- 2013: $104,654 (-$715, -0.68% from previous year)
- 2014: $110,898 (+$6,244, +5.97% from previous year)
- 2015: $115,114 (+$4,216, +3.80% from previous year)
- 2016: $116,971 (+$1,857, +1.61% from previous year)
- 2017: $126,363 (+$9,392, +8.03% from previous year)
- 2018: $134,543 (+$8,180, +6.47% from previous year)
- 2019: $145,896 (+$11,352, +8.44% from previous year)
- 2020: N/A
- 2021: $180,297
- 2022: $201,842 (+$21,545, +11.95% from previous year)
- 2023: $219,664 (+$17,823, +8.83% from previous year)
- 2024: $233,193 (+$13,528, +6.16% from previous year)
- 2025: $244,994 (+$11,801, +5.06% from previous year)
Rodney Village’s home values have more than doubled since 2013, when prices hovered around $105,000. Now approaching $245,000 in 2025, the town has seen consistent year-over-year growth, particularly since 2020. Despite this increase, it’s still one of the lowest-cost communities in central Delaware.
Rodney Village – Affordable Living Near the Capital

Located just outside Dover, Rodney Village is a small census-designated place that benefits from its close proximity to shopping centers, schools, and state government offices. Though small in size, the community offers suburban living with urban access, making it a practical spot for first-time buyers and state employees.
The housing stock includes mostly modest, mid-century homes, many on quiet, tree-lined streets. Price growth has been solid but not excessive, making Rodney Village a great example of affordability paired with convenience in Delaware’s capital region.
2. Elsmere – 108% Home Price Increase Since 2013

- 2010: $146,497
- 2011: $133,465 (-$13,032, -8.90% from previous year)
- 2012: $120,253 (-$13,212, -9.90% from previous year)
- 2013: $114,232 (-$6,020, -5.01% from previous year)
- 2014: $123,123 (+$8,891, +7.78% from previous year)
- 2015: $125,495 (+$2,372, +1.93% from previous year)
- 2016: $133,049 (+$7,554, +6.02% from previous year)
- 2017: $147,038 (+$13,989, +10.51% from previous year)
- 2018: $150,790 (+$3,752, +2.55% from previous year)
- 2019: $157,443 (+$6,652, +4.41% from previous year)
- 2020: N/A
- 2021: $178,756
- 2022: $194,990 (+$16,233, +9.08% from previous year)
- 2023: $207,701 (+$12,712, +6.52% from previous year)
- 2024: $227,053 (+$19,351, +9.32% from previous year)
- 2025: $237,098 (+$10,046, +4.42% from previous year)
Elsmere has seen more than a 100% gain in home values since 2013, with prices climbing from $114,000 to over $237,000 in 2025. The growth has been steady and accelerated in recent years, yet Elsmere continues to be one of the most accessible housing markets in New Castle County.
Elsmere – An Underrated Wilmington Neighbor

Elsmere is a close suburb of Wilmington, offering quick access to city jobs, shopping, and transit options. Its residential blocks feature a mix of rowhouses and single-family homes, many of which date back to the early 20th century. Despite its age, the housing stock remains well-kept and attractively priced.
The town’s affordability, location, and stability make it an appealing option for both new buyers and longtime residents. Unlike more rapidly gentrifying neighborhoods in Wilmington proper, Elsmere has retained its middle-class character—though rising prices suggest that may be shifting.
1. Blades – 108% Home Price Increase Since 2013

- 2010: N/A
- 2011: N/A
- 2012: N/A
- 2013: $111,488
- 2014: $127,637 (+$16,149, +14.48% from previous year)
- 2015: $136,672 (+$9,035, +7.08% from previous year)
- 2016: $135,396 (-$1,276, -0.93% from previous year)
- 2017: $149,125 (+$13,728, +10.14% from previous year)
- 2018: $155,663 (+$6,539, +4.38% from previous year)
- 2019: $173,761 (+$18,098, +11.63% from previous year)
- 2020: N/A
- 2021: $224,603
- 2022: $250,368 (+$25,764, +11.47% from previous year)
- 2023: $261,734 (+$11,367, +4.54% from previous year)
- 2024: $245,694 (-$16,040, -6.13% from previous year)
- 2025: $231,897 (-$13,798, -5.62% from previous year)
Blades tops this list with a 108% home price increase since 2013—despite experiencing back-to-back annual declines in 2024 and 2025. Home values peaked at $261,000 in 2023 before dipping to just under $232,000. Even with the recent cooling, Blades remains one of Delaware’s most affordable towns.
Blades – Strong Long-Term Growth, Recent Slowdown

Blades is a small town in Sussex County, just across the Nanticoke River from Seaford. It shares many of Seaford’s amenities but retains a smaller population and quieter pace. Proximity to riverfront recreation and highway access have made it appealing to both locals and out-of-state buyers.
The recent decline in prices may be a market correction after several years of steep gains. But Blades’ long-term trend remains positive, with prices still more than doubling over the past decade. For buyers seeking value in southern Delaware, it continues to be a town worth watching.


