🔥 Would you like to save this?
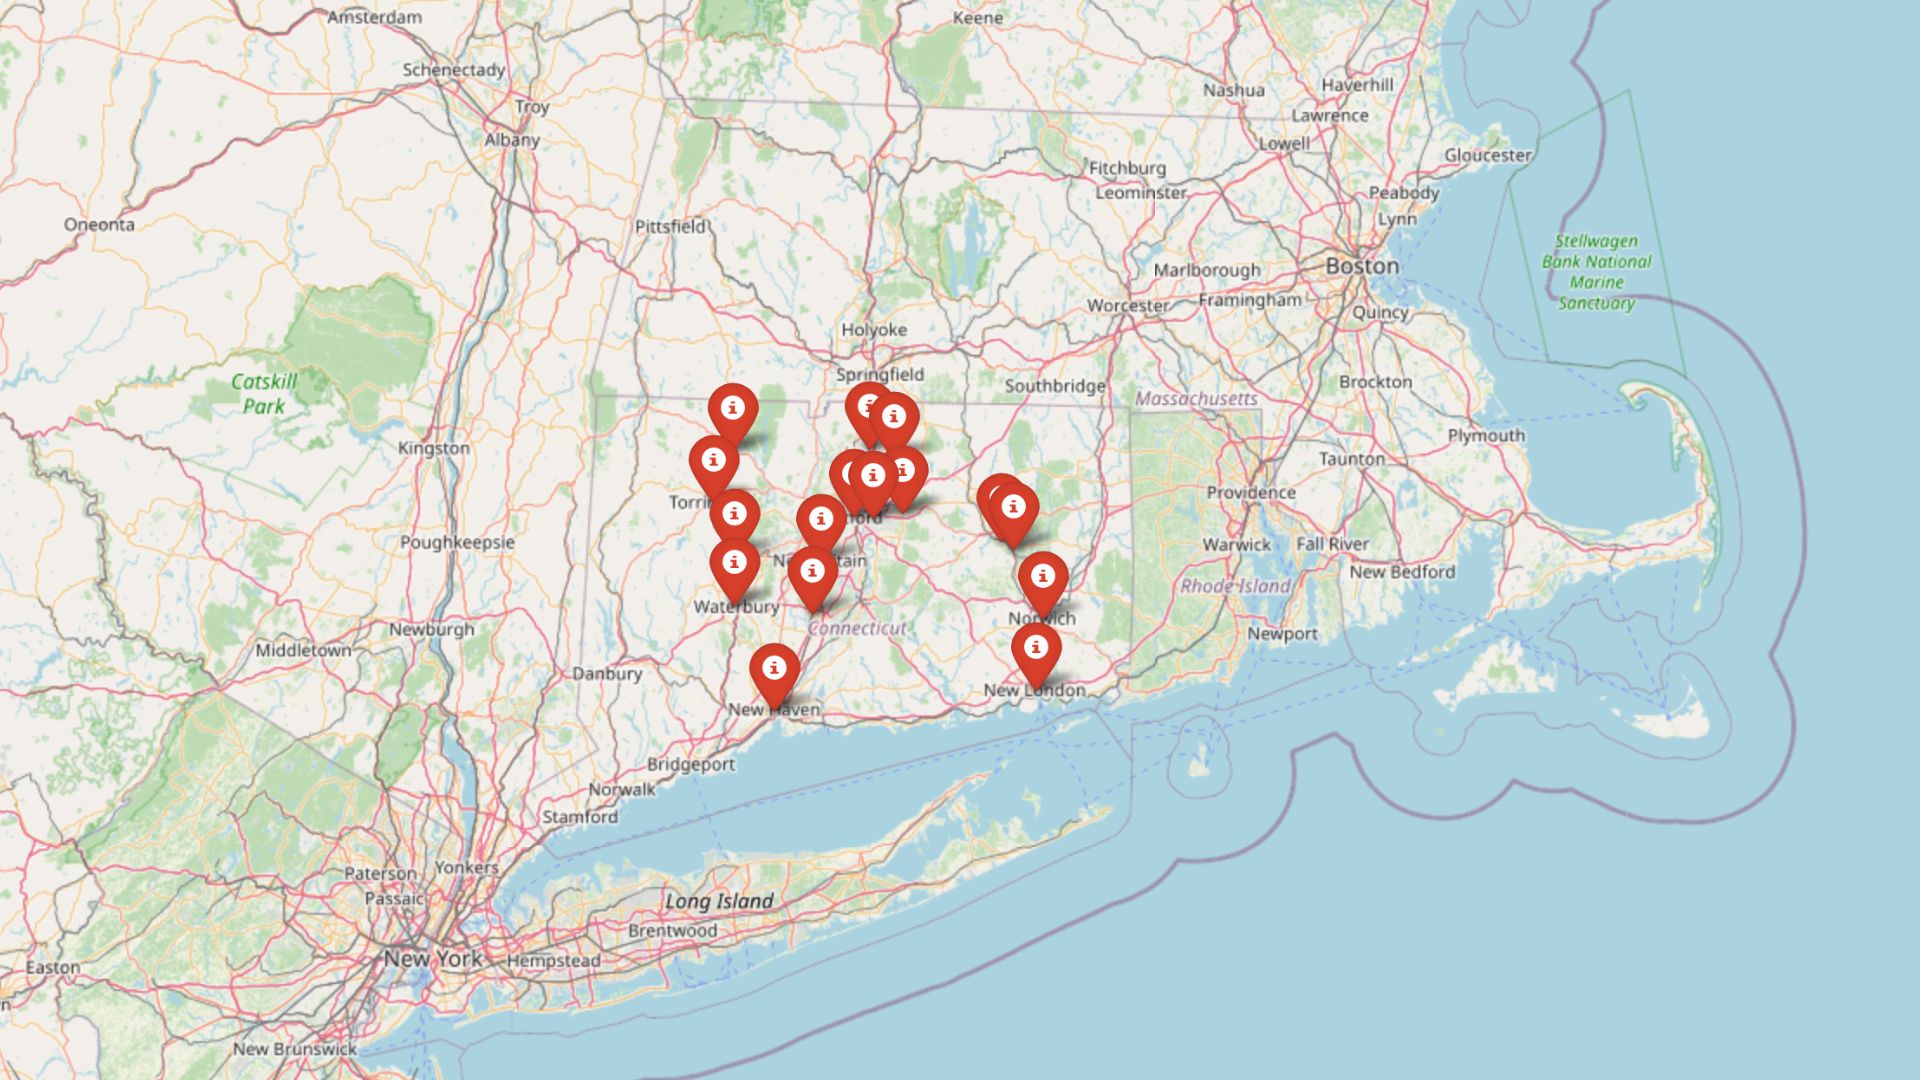
Home prices might be spiking across Connecticut, but Zillow’s Home Value Index shows there are still towns where buyers don’t need a trust fund to get a key. These 16 spots offer rare relief in 2025—pockets of affordability tucked between pricey shorelines and fast-growing suburbs. Some are old mill towns getting a second act, others are sleepy countryside escapes that haven’t hit the radar yet. What they share is simple: charm, potential, and price tags that haven’t gone full Connecticut (yet).
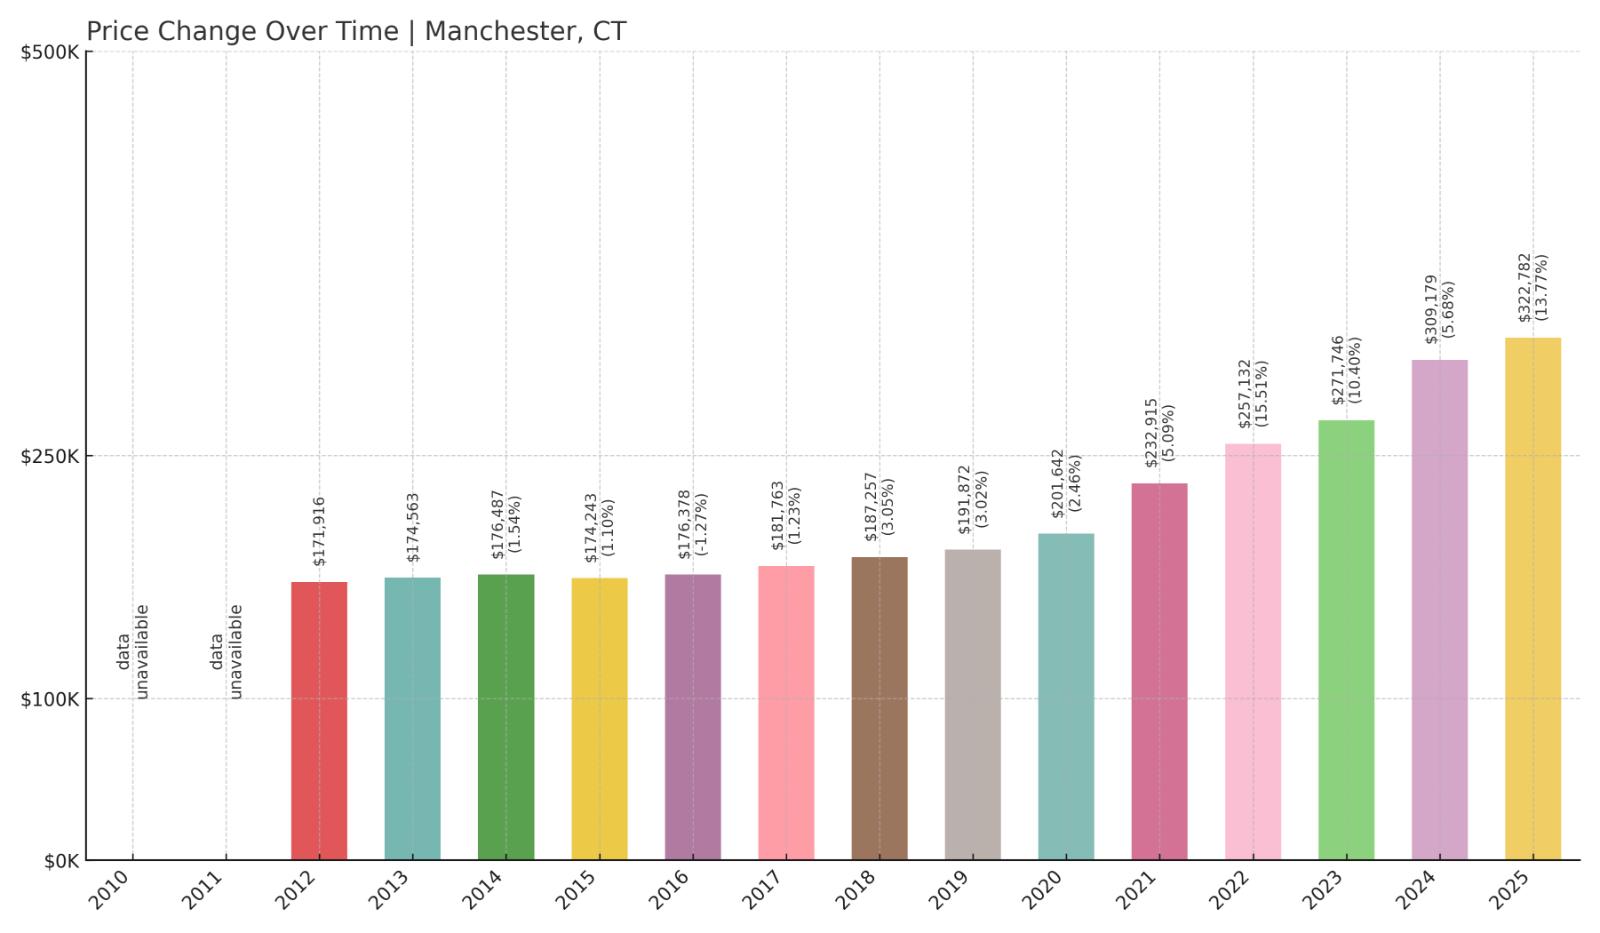
16. Manchester – 88% Home Price Increase Since 2012
- 2010: N/A
- 2011: N/A
- 2012: $171,916
- 2013: $174,563 (+$2,646, +1.54% from previous year)
- 2014: $176,487 (+$1,924, +1.10% from previous year)
- 2015: $174,243 (-$2,243, -1.27% from previous year)
- 2016: $176,378 (+$2,135, +1.23% from previous year)
- 2017: $181,763 (+$5,385, +3.05% from previous year)
- 2018: $187,257 (+$5,493, +3.02% from previous year)
- 2019: $191,872 (+$4,615, +2.46% from previous year)
- 2020: $201,642 (+$9,770, +5.09% from previous year)
- 2021: $232,915 (+$31,273, +15.51% from previous year)
- 2022: $257,132 (+$24,218, +10.40% from previous year)
- 2023: $271,746 (+$14,614, +5.68% from previous year)
- 2024: $309,179 (+$37,433, +13.77% from previous year)
- 2025: $322,782 (+$13,603, +4.40% from previous year)
Home prices in Manchester have grown steadily over the years, increasing 88% since 2012. While early gains were modest, values surged after 2020, with 2021 and 2024 marking particularly sharp jumps. Even with its strong recent growth, the town remains one of the more affordable places to buy a home in the state, with 2025 values still well below the Connecticut average.
In order to come up with the very specific design ideas, we create most designs with the assistance of state-of-the-art AI interior design software.
Manchester – Accessible Living With Strong Amenities

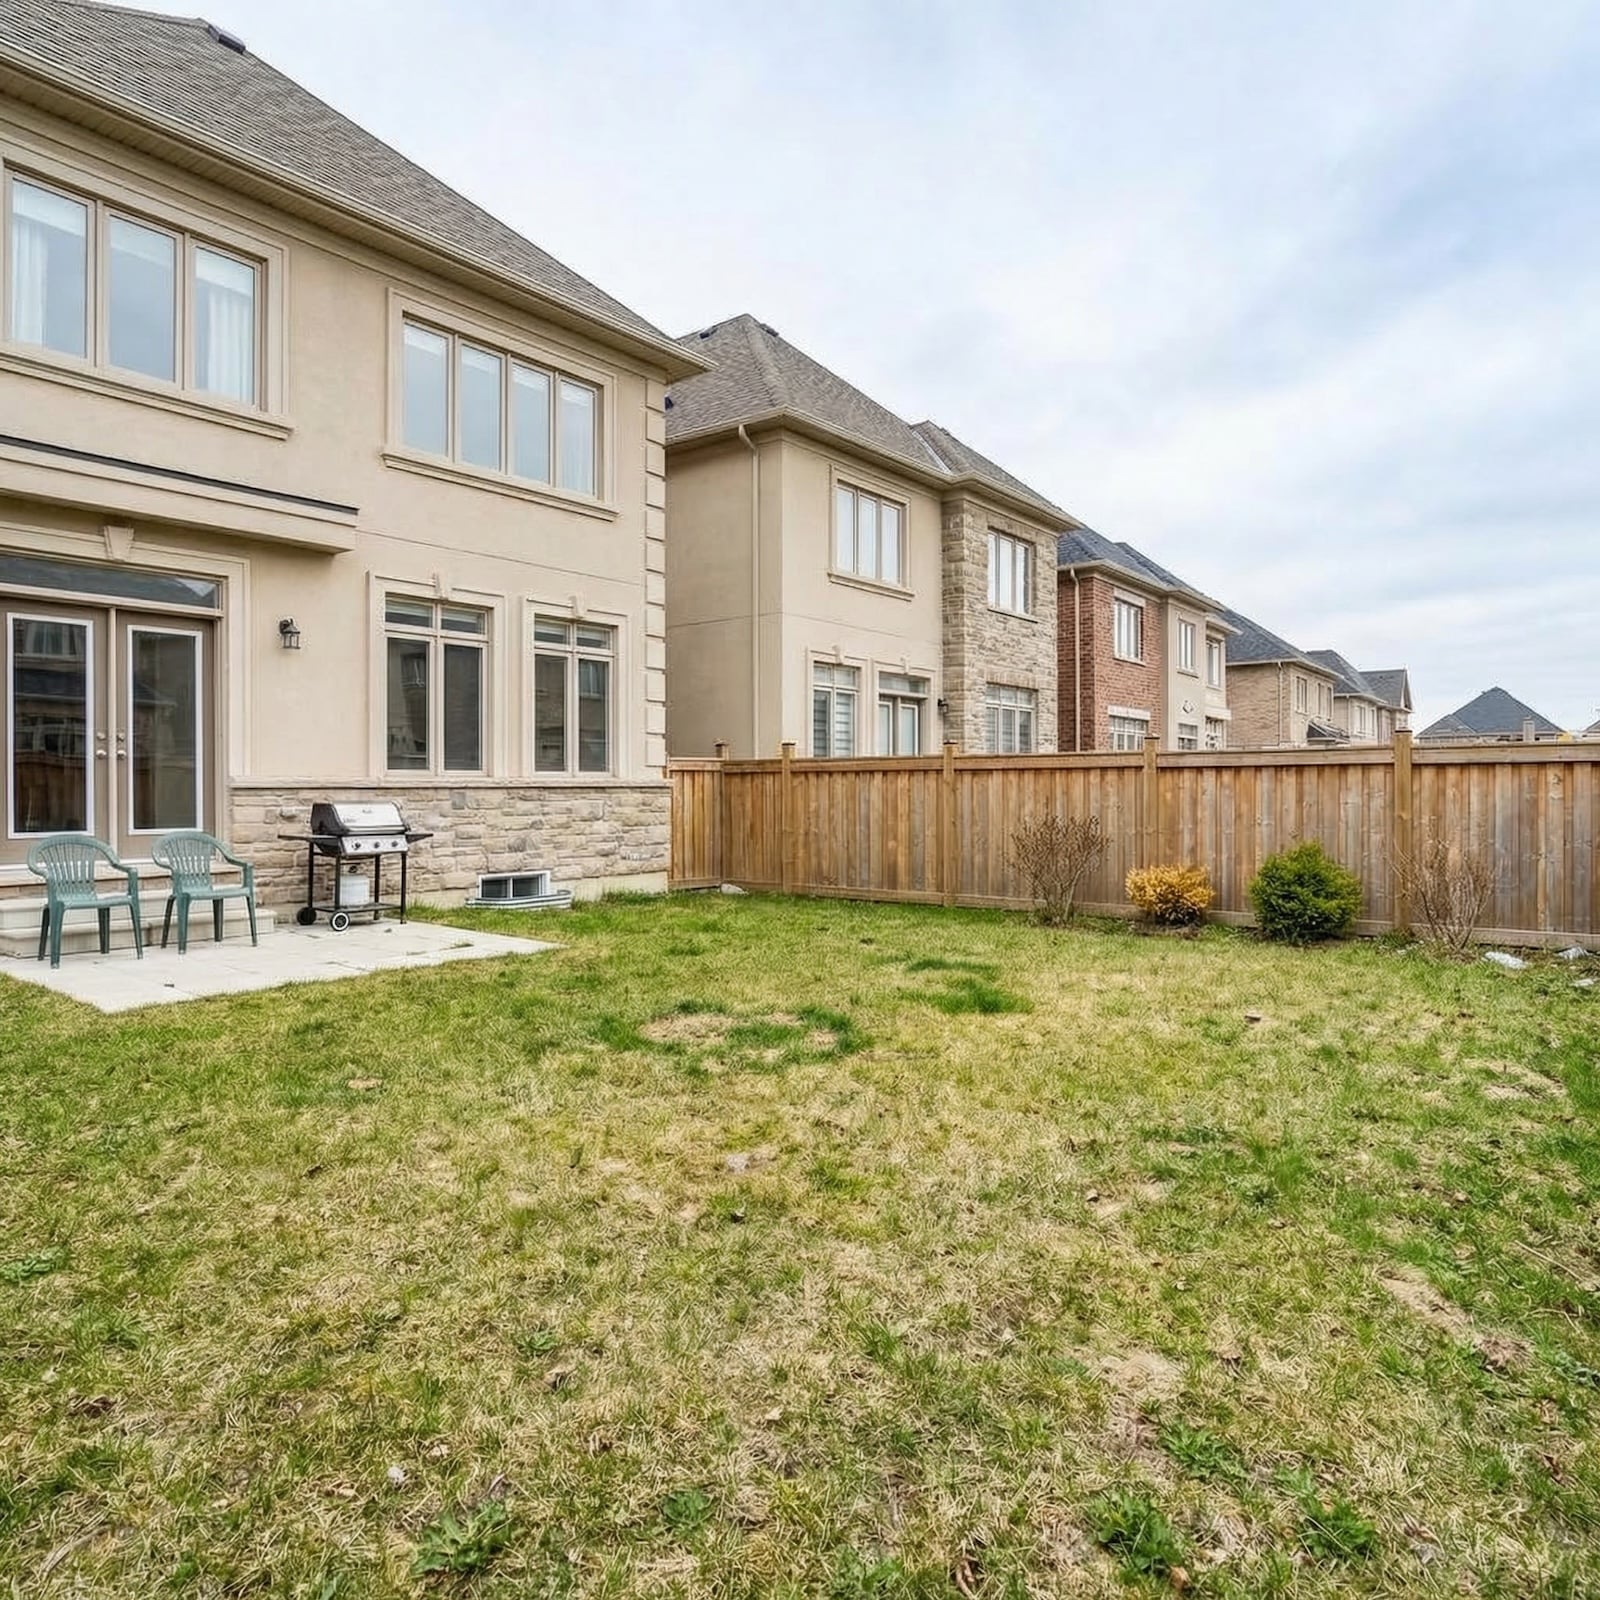
Located just east of Hartford, Manchester blends suburban convenience with urban proximity. The town has long been popular for its walkable downtown, ample parks, and community-focused events like the Manchester Road Race. With a 2025 median home value of just over $322,000, it’s an affordable alternative to pricier Hartford County suburbs.
Manchester’s appeal may also lie in its balance of affordability and infrastructure. It hosts shopping centers, a local community college, and easy access to I-84, making it ideal for commuters and families alike. Home prices have climbed in response to these strengths, yet the town continues to attract buyers looking for value without sacrificing amenities.
15. New Haven – 75% Home Price Increase Since 2012

- 2010: $182,739
- 2011: $172,528 (-$10,211, -5.59% from previous year)
- 2012: $161,276 (-$11,252, -6.52% from previous year)
- 2013: $158,847 (-$2,430, -1.51% from previous year)
- 2014: $168,160 (+$9,314, +5.86% from previous year)
- 2015: $167,950 (-$211, -0.13% from previous year)
- 2016: $173,553 (+$5,604, +3.34% from previous year)
- 2017: $178,228 (+$4,674, +2.69% from previous year)
- 2018: $184,144 (+$5,916, +3.32% from previous year)
- 2019: $191,418 (+$7,274, +3.95% from previous year)
- 2020: $207,071 (+$15,652, +8.18% from previous year)
- 2021: $239,776 (+$32,706, +15.79% from previous year)
- 2022: $268,937 (+$29,160, +12.16% from previous year)
- 2023: $279,705 (+$10,768, +4.00% from previous year)
- 2024: $306,553 (+$26,849, +9.60% from previous year)
- 2025: $320,020 (+$13,467, +4.39% from previous year)
New Haven home prices dropped significantly early in the last decade but began to rebound after 2014. Since then, the city has seen steady growth, with home values climbing 75% from 2012 to 2025. Even with that uptick, prices remain relatively low for a city with world-class institutions and waterfront charm.
New Haven – Academic Hub With Affordable Prices
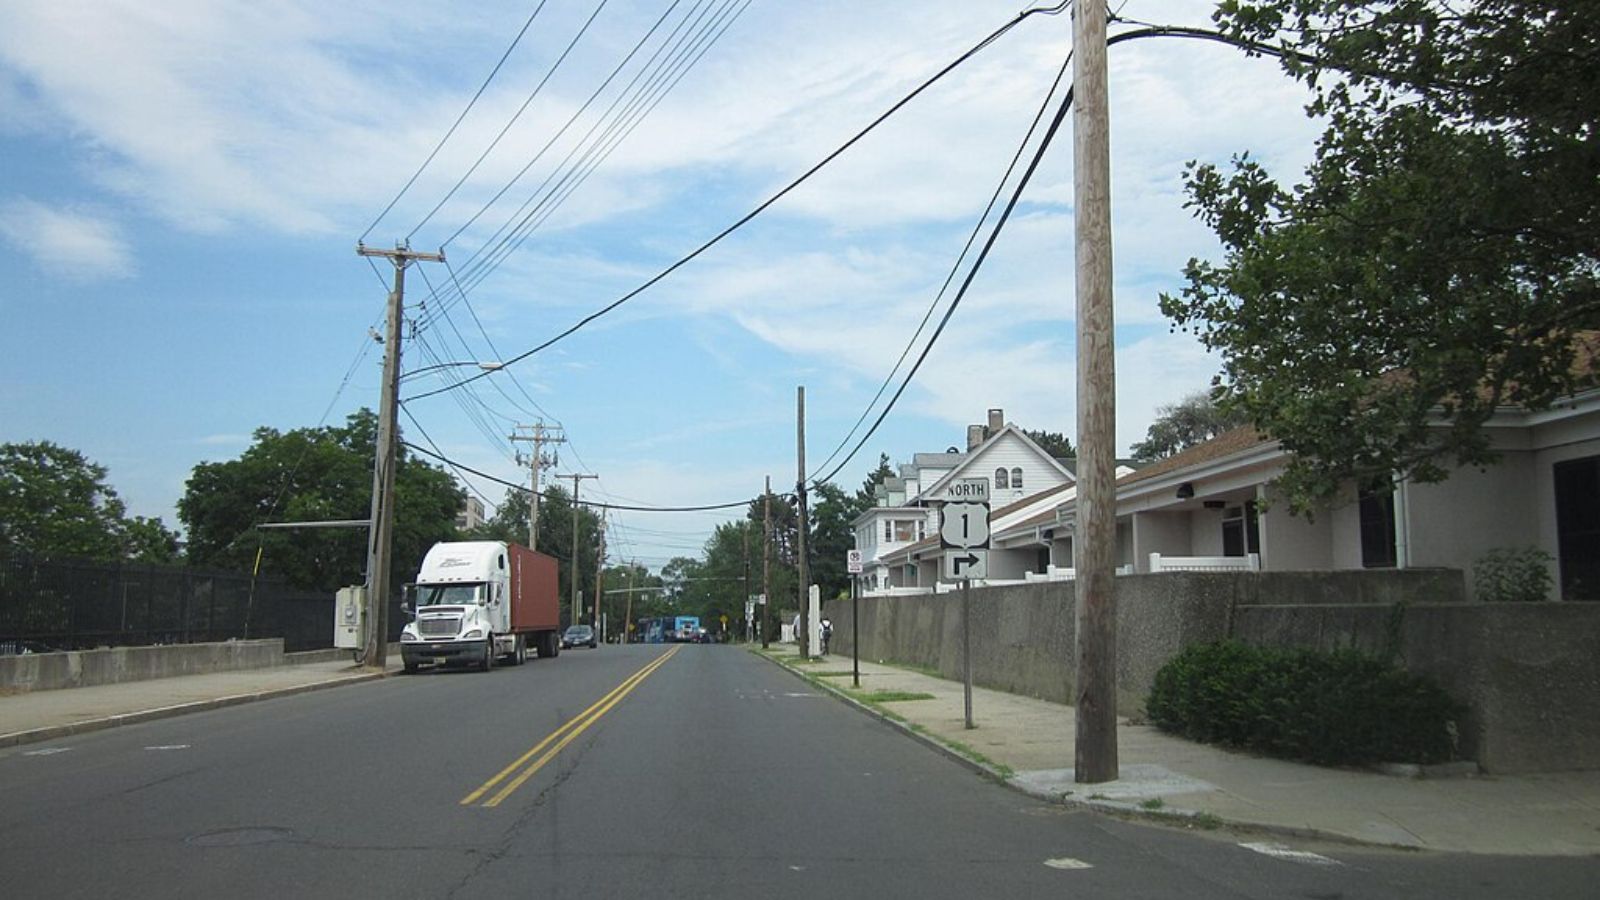
Home to Yale University and a dynamic cultural scene, New Haven is one of Connecticut’s most recognizable cities. Despite its global reputation, the cost of homeownership remains manageable compared to other cities of similar stature. As of 2025, the median home price remains just over $320,000, making it a rare mix of prestige and accessibility.
New Haven’s appeal extends beyond the university. The city has invested in downtown redevelopment and public transportation, while still offering historic architecture and a vibrant culinary scene. These features, combined with a relatively modest housing market, have helped drive steady price increases without pricing out new buyers.
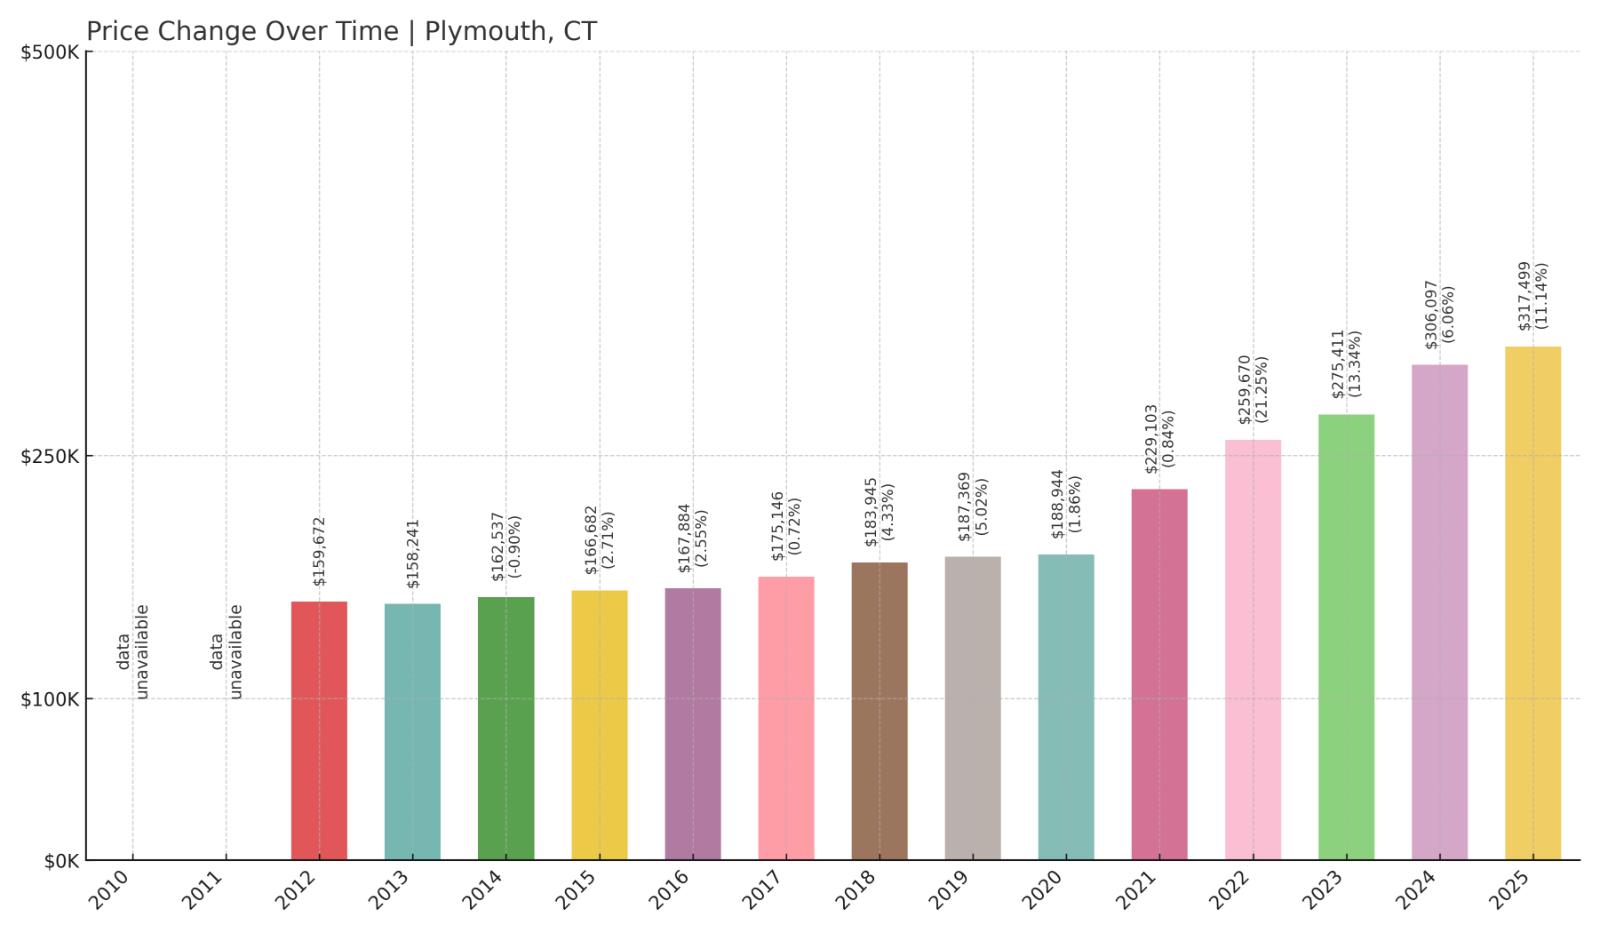
14. Plymouth – 99% Home Price Increase Since 2012
- 2010: N/A
- 2011: N/A
- 2012: $159,672
- 2013: $158,241 (-$1,431, -0.90% from previous year)
- 2014: $162,537 (+$4,296, +2.71% from previous year)
- 2015: $166,682 (+$4,145, +2.55% from previous year)
- 2016: $167,884 (+$1,202, +0.72% from previous year)
- 2017: $175,146 (+$7,262, +4.33% from previous year)
- 2018: $183,945 (+$8,799, +5.02% from previous year)
- 2019: $187,369 (+$3,423, +1.86% from previous year)
- 2020: $188,944 (+$1,576, +0.84% from previous year)
- 2021: $229,103 (+$40,159, +21.25% from previous year)
- 2022: $259,670 (+$30,567, +13.34% from previous year)
- 2023: $275,411 (+$15,741, +6.06% from previous year)
- 2024: $306,097 (+$30,686, +11.14% from previous year)
- 2025: $317,499 (+$11,401, +3.72% from previous year)
Plymouth’s housing market has nearly doubled in value since 2012, with a 99% increase over that period. Much of the growth came after 2020, particularly in 2021, which posted a more than 20% jump. Despite those increases, it still offers lower prices than much of Litchfield County.
Plymouth – Small-Town Feel With Steady Growth
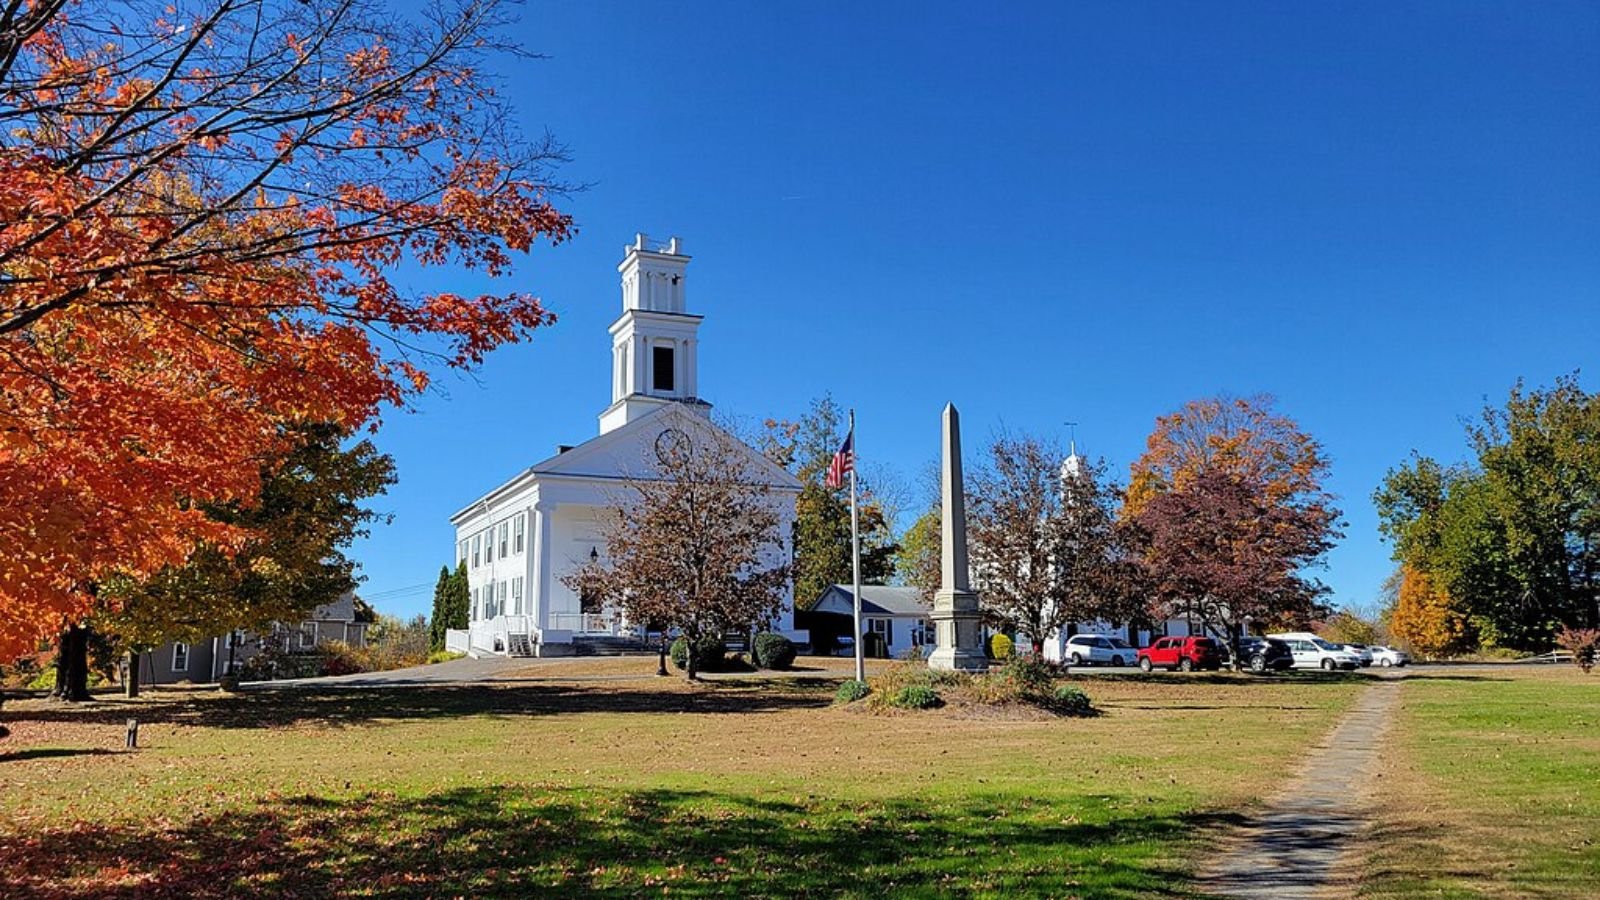
Plymouth is tucked into the western part of the state, offering scenic surroundings and a close-knit community. While not far from Bristol and Waterbury, it maintains a distinctly quiet, residential feel. The town’s appeal lies in its slower pace and relatively low cost of living, which has attracted steady interest from homebuyers.
With a median home price of just over $317,000 in 2025, Plymouth continues to be one of the more affordable towns in the area. Its combination of accessible real estate and traditional New England charm has helped support consistent, long-term growth without overheating the market.
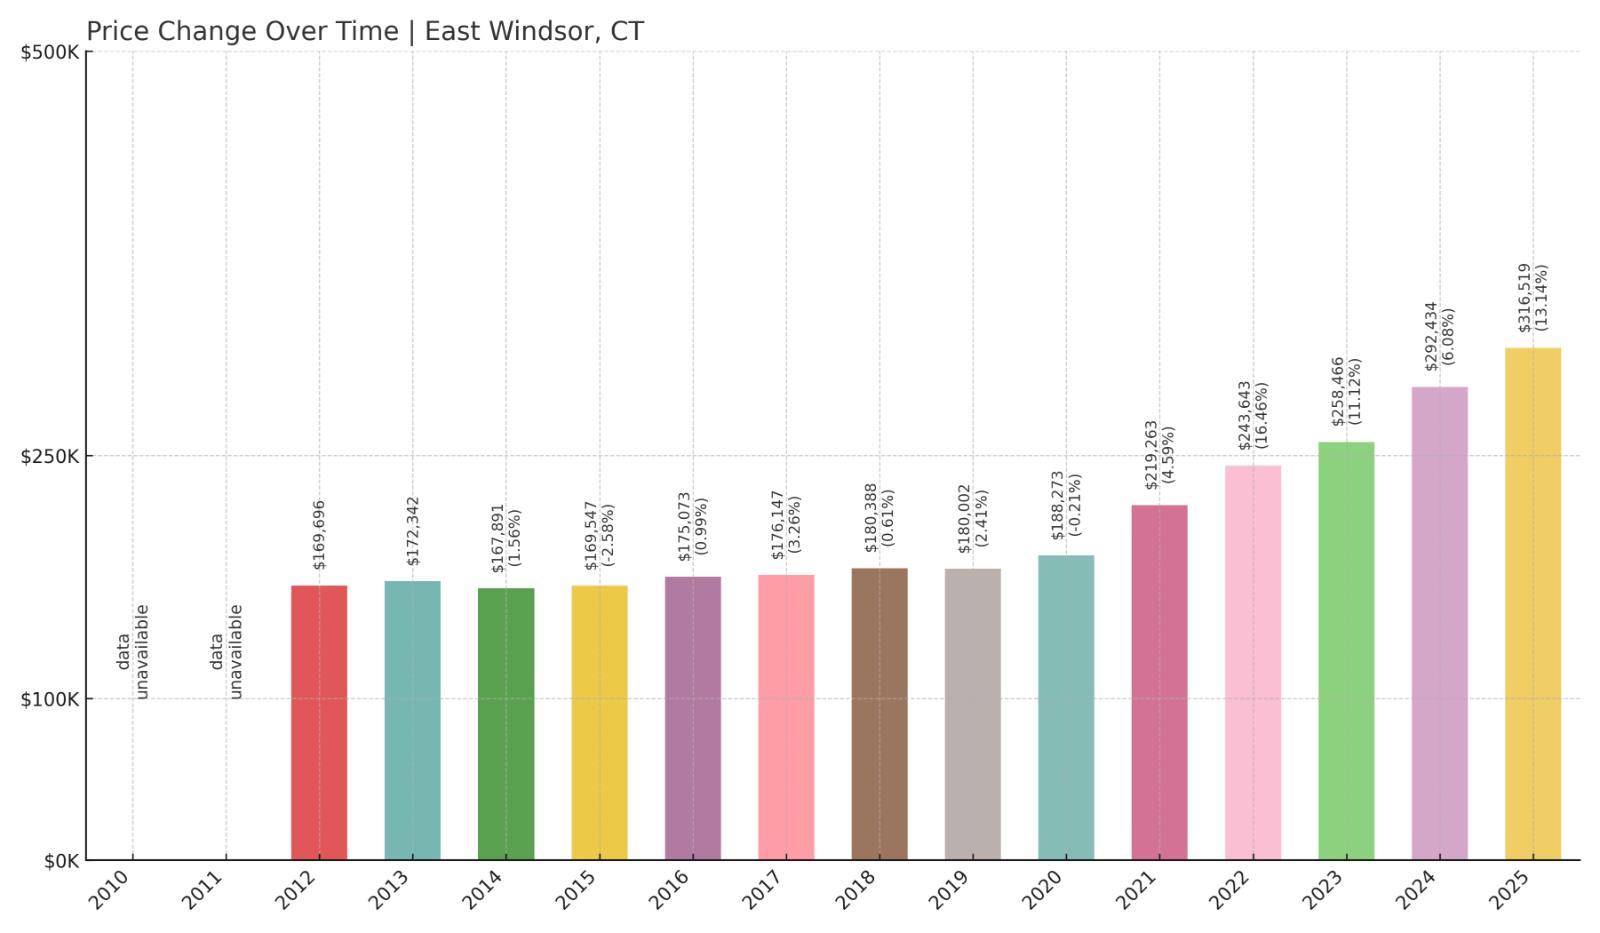
13. East Windsor – 87% Home Price Increase Since 2012
- 2010: N/A
- 2011: N/A
- 2012: $169,696
- 2013: $172,342 (+$2,646, +1.56% from previous year)
- 2014: $167,891 (-$4,451, -2.58% from previous year)
- 2015: $169,547 (+$1,656, +0.99% from previous year)
- 2016: $175,073 (+$5,526, +3.26% from previous year)
- 2017: $176,147 (+$1,074, +0.61% from previous year)
- 2018: $180,388 (+$4,241, +2.41% from previous year)
- 2019: $180,002 (-$387, -0.21% from previous year)
- 2020: $188,273 (+$8,271, +4.60% from previous year)
- 2021: $219,263 (+$30,990, +16.46% from previous year)
- 2022: $243,643 (+$24,380, +11.12% from previous year)
- 2023: $258,466 (+$14,823, +6.08% from previous year)
- 2024: $292,434 (+$33,968, +13.14% from previous year)
- 2025: $316,519 (+$24,085, +8.24% from previous year)
East Windsor has enjoyed a steady climb in home values since 2012, with especially strong gains in the last five years. Prices rose 87% during that period, with consistent double-digit growth in 2021, 2022, and 2024. The market’s strength signals growing demand while maintaining affordability relative to surrounding towns.
East Windsor – Rural Setting With Regional Access
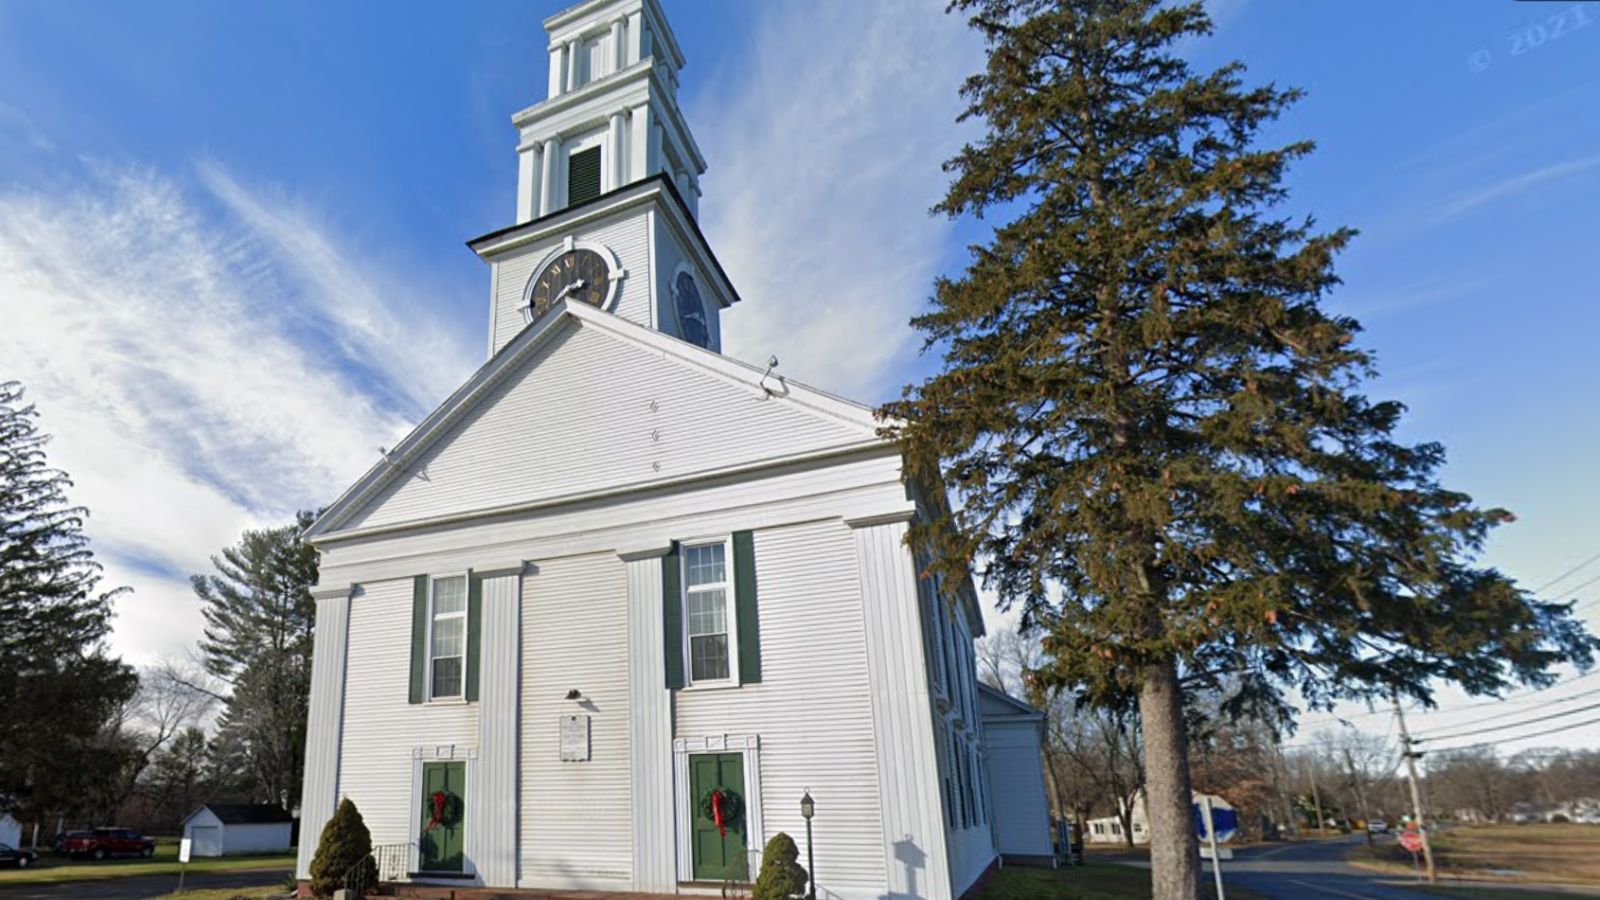
Positioned along the Connecticut River north of Hartford, East Windsor is known for its agricultural roots and open space. It offers easy access to I-91 and Bradley International Airport, making it a practical choice for commuters seeking rural living without long travel times.
Despite its proximity to employment centers, East Windsor has retained low home prices. In 2025, the median value is still under $317,000. That balance of affordability and convenience has helped drive buyer interest and support long-term price growth.
12. New London – 116% Home Price Increase Since 2012
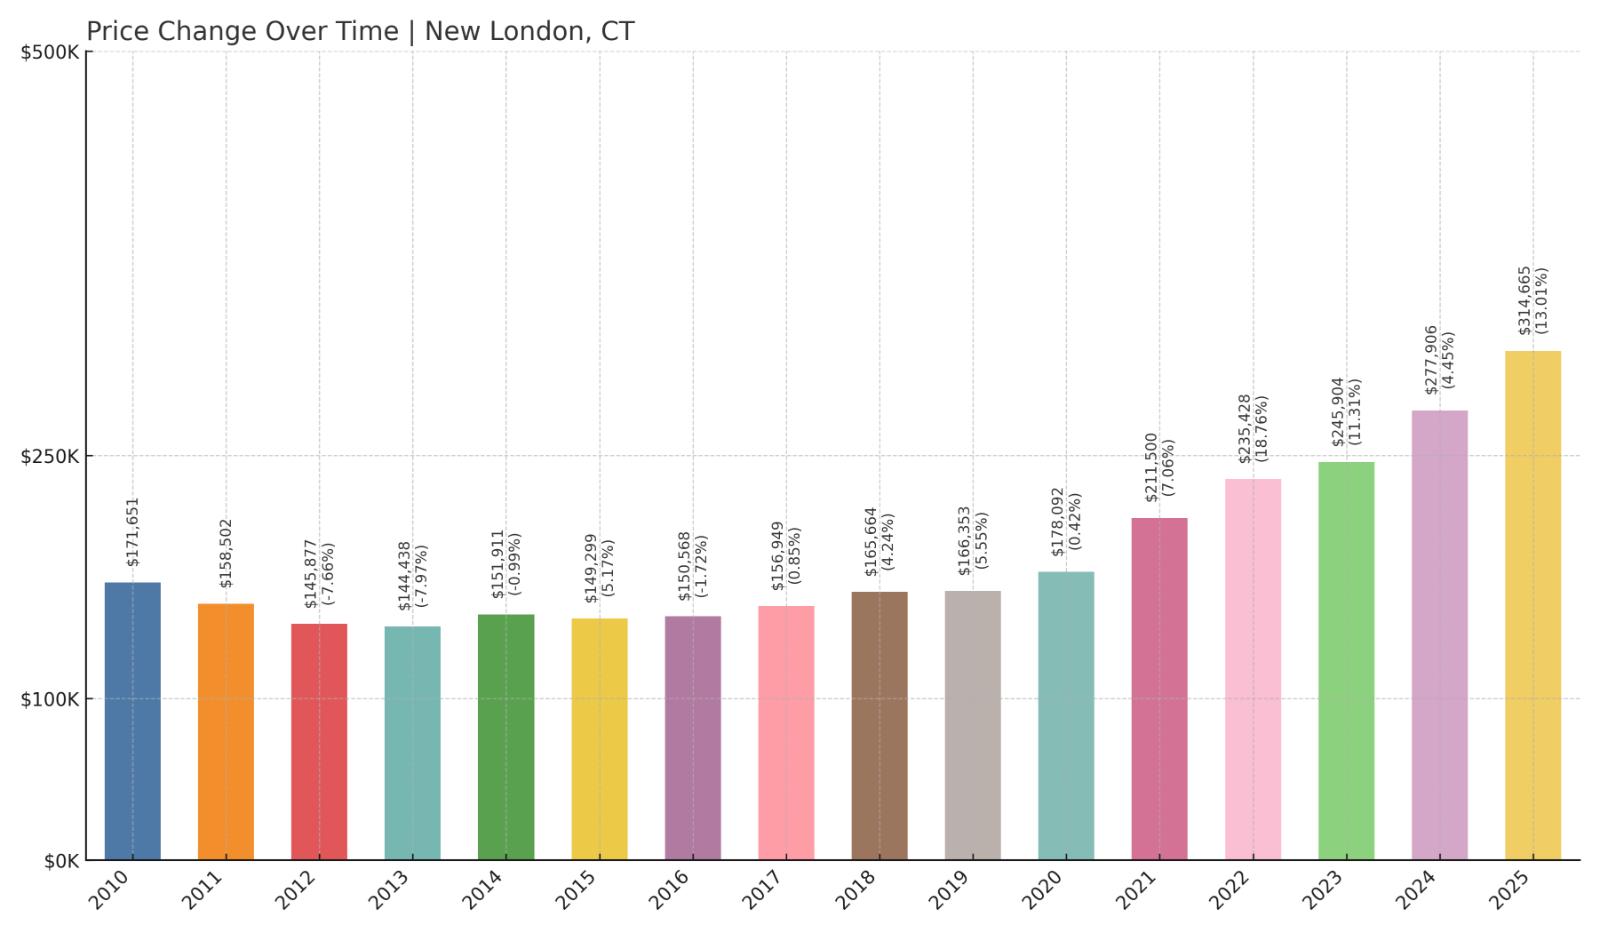
- 2010: $171,651
- 2011: $158,502 (-$13,150, -7.66% from previous year)
- 2012: $145,877 (-$12,625, -7.97% from previous year)
- 2013: $144,438 (-$1,439, -0.99% from previous year)
- 2014: $151,911 (+$7,473, +5.17% from previous year)
- 2015: $149,299 (-$2,612, -1.72% from previous year)
- 2016: $150,568 (+$1,269, +0.85% from previous year)
- 2017: $156,949 (+$6,381, +4.24% from previous year)
- 2018: $165,664 (+$8,715, +5.55% from previous year)
- 2019: $166,353 (+$690, +0.42% from previous year)
- 2020: $178,092 (+$11,739, +7.06% from previous year)
- 2021: $211,500 (+$33,407, +18.76% from previous year)
- 2022: $235,428 (+$23,929, +11.31% from previous year)
- 2023: $245,904 (+$10,476, +4.45% from previous year)
- 2024: $277,906 (+$32,002, +13.01% from previous year)
- 2025: $314,665 (+$36,759, +13.23% from previous year)
New London has experienced one of the highest growth rates on this list, with a 116% increase in home prices since 2012. After years of sluggish performance, the town’s real estate market has boomed post-2020, with double-digit gains continuing through 2025. Despite this surge, it remains one of Connecticut’s more affordable coastal towns.
New London – Coastal City With Revitalized Appeal
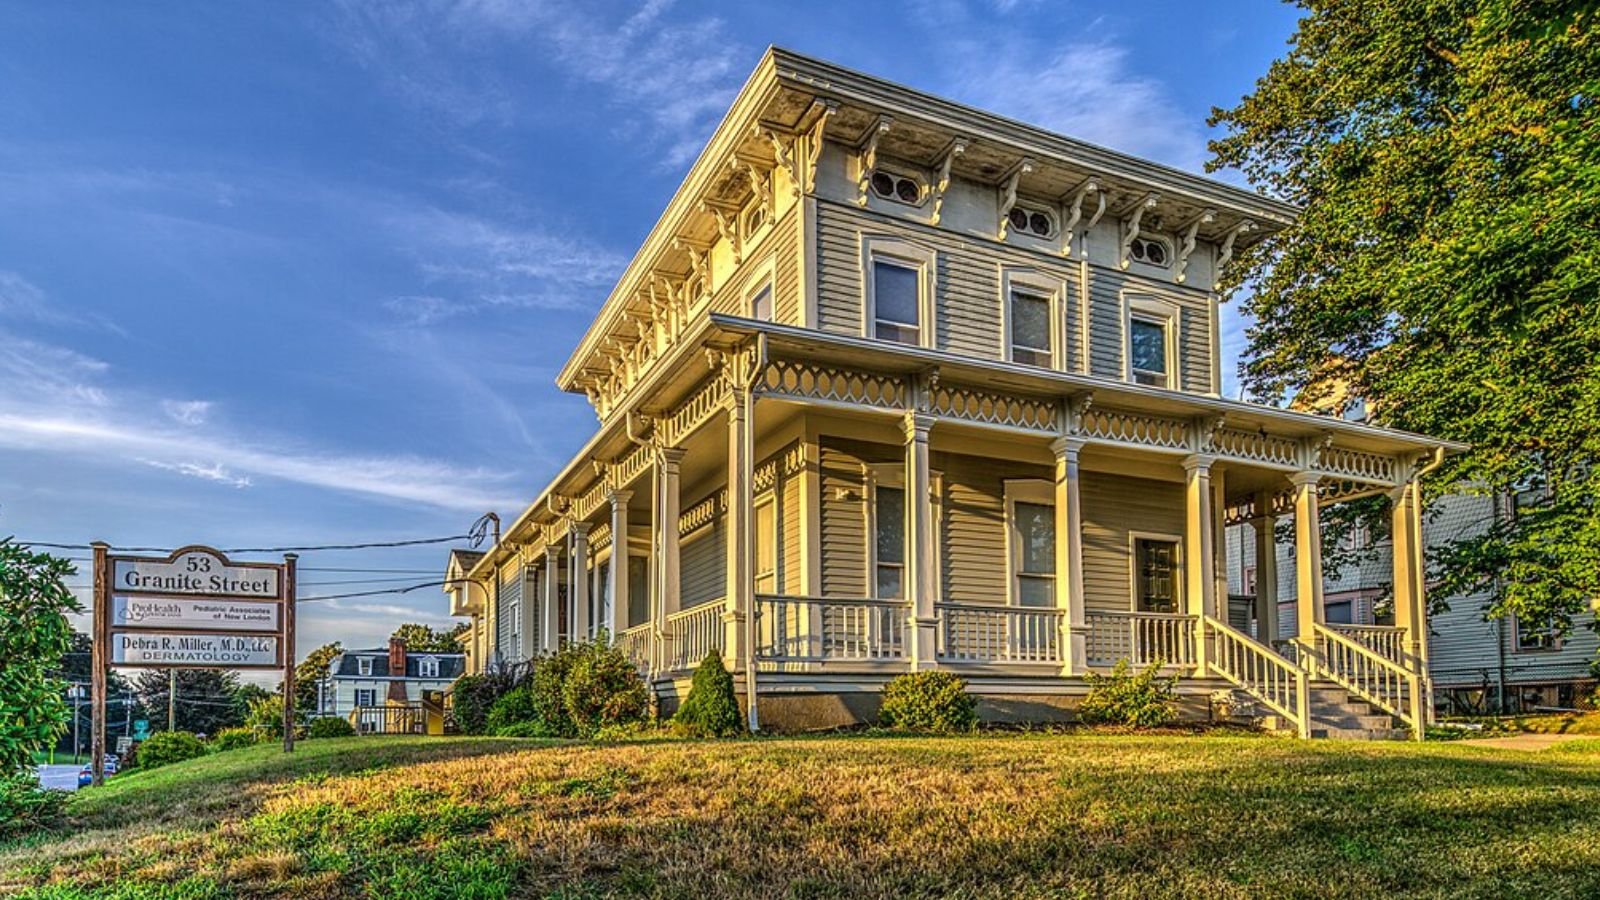
Situated on Long Island Sound, New London offers maritime charm, historic neighborhoods, and direct Amtrak service to New York and Boston. Once overshadowed by larger cities, it’s seen renewed interest thanks to waterfront development and an expanding arts and cultural scene.
The median home price remains under $315,000 in 2025, making it unusually affordable for a seaside community. Its strong gains in recent years suggest that New London’s combination of location and livability is finally being recognized in the housing market.
11. Meriden – 93% Home Price Increase Since 2012
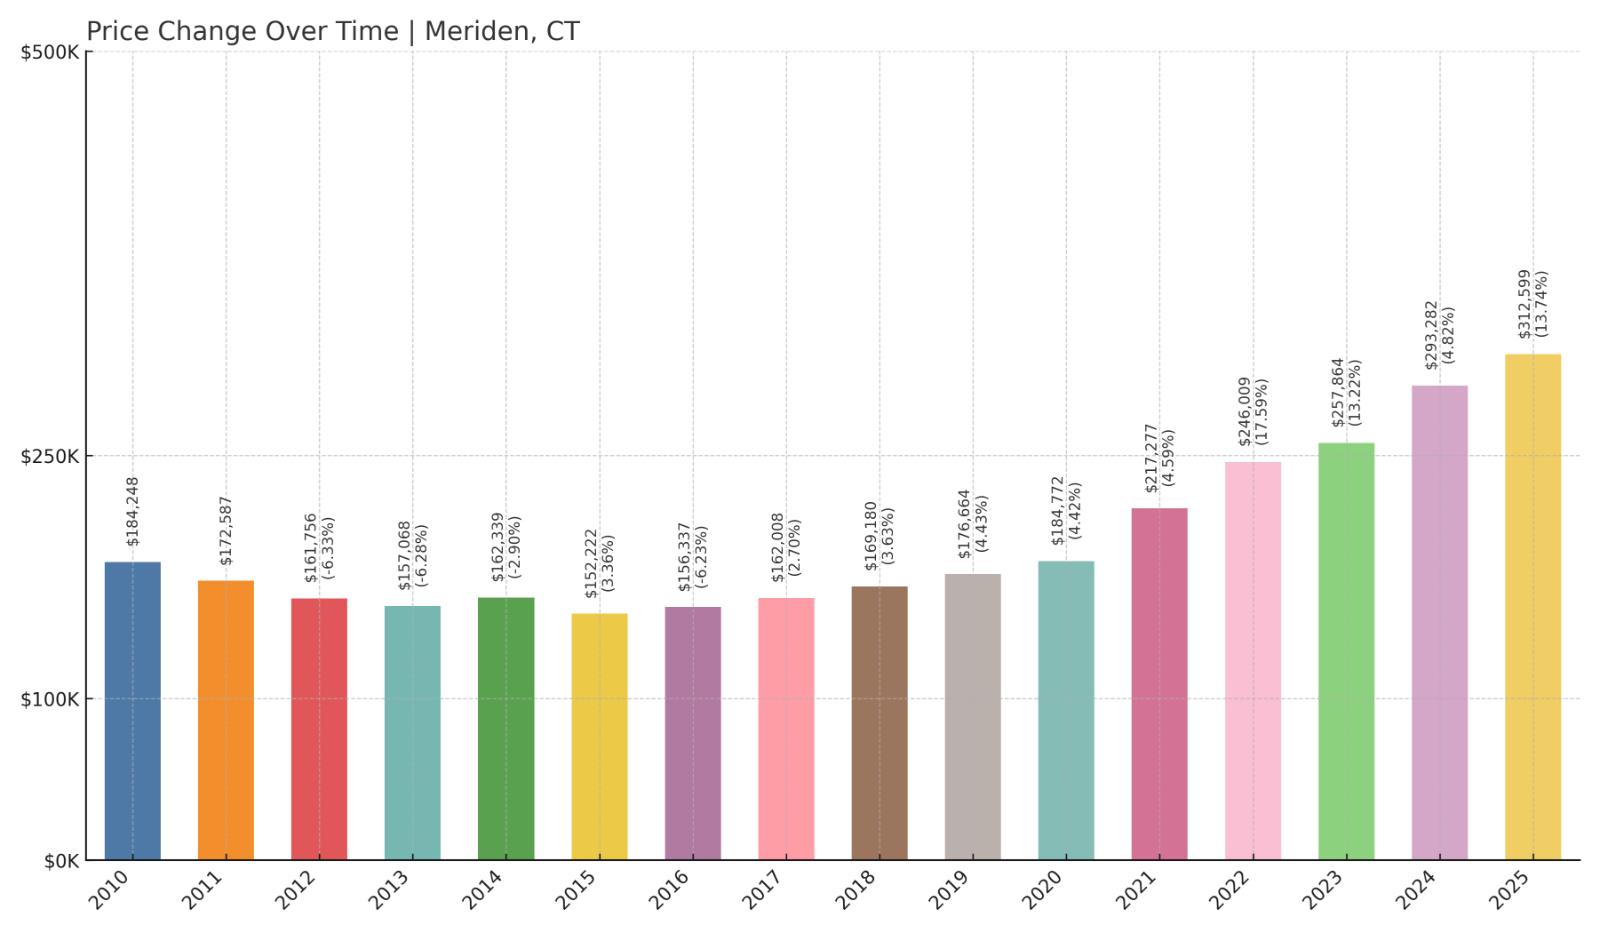
- 2010: $184,248
- 2011: $172,587 (-$11,661, -6.33% from previous year)
- 2012: $161,756 (-$10,831, -6.28% from previous year)
- 2013: $157,068 (-$4,688, -2.90% from previous year)
- 2014: $162,339 (+$5,271, +3.36% from previous year)
- 2015: $152,222 (-$10,117, -6.23% from previous year)
- 2016: $156,337 (+$4,115, +2.70% from previous year)
- 2017: $162,008 (+$5,671, +3.63% from previous year)
- 2018: $169,180 (+$7,172, +4.43% from previous year)
- 2019: $176,664 (+$7,484, +4.42% from previous year)
- 2020: $184,772 (+$8,109, +4.59% from previous year)
- 2021: $217,277 (+$32,505, +17.59% from previous year)
- 2022: $246,009 (+$28,732, +13.22% from previous year)
- 2023: $257,864 (+$11,854, +4.82% from previous year)
- 2024: $293,282 (+$35,418, +13.74% from previous year)
- 2025: $312,599 (+$19,317, +6.59% from previous year)
Meriden’s home values have climbed nearly 93% since 2012, with the most significant growth occurring after 2020. The sharp rise in 2021 was followed by continued double-digit increases in 2022 and 2024. Despite this momentum, Meriden remains one of the more affordable cities in Connecticut.
Meriden – Affordability With Central Location
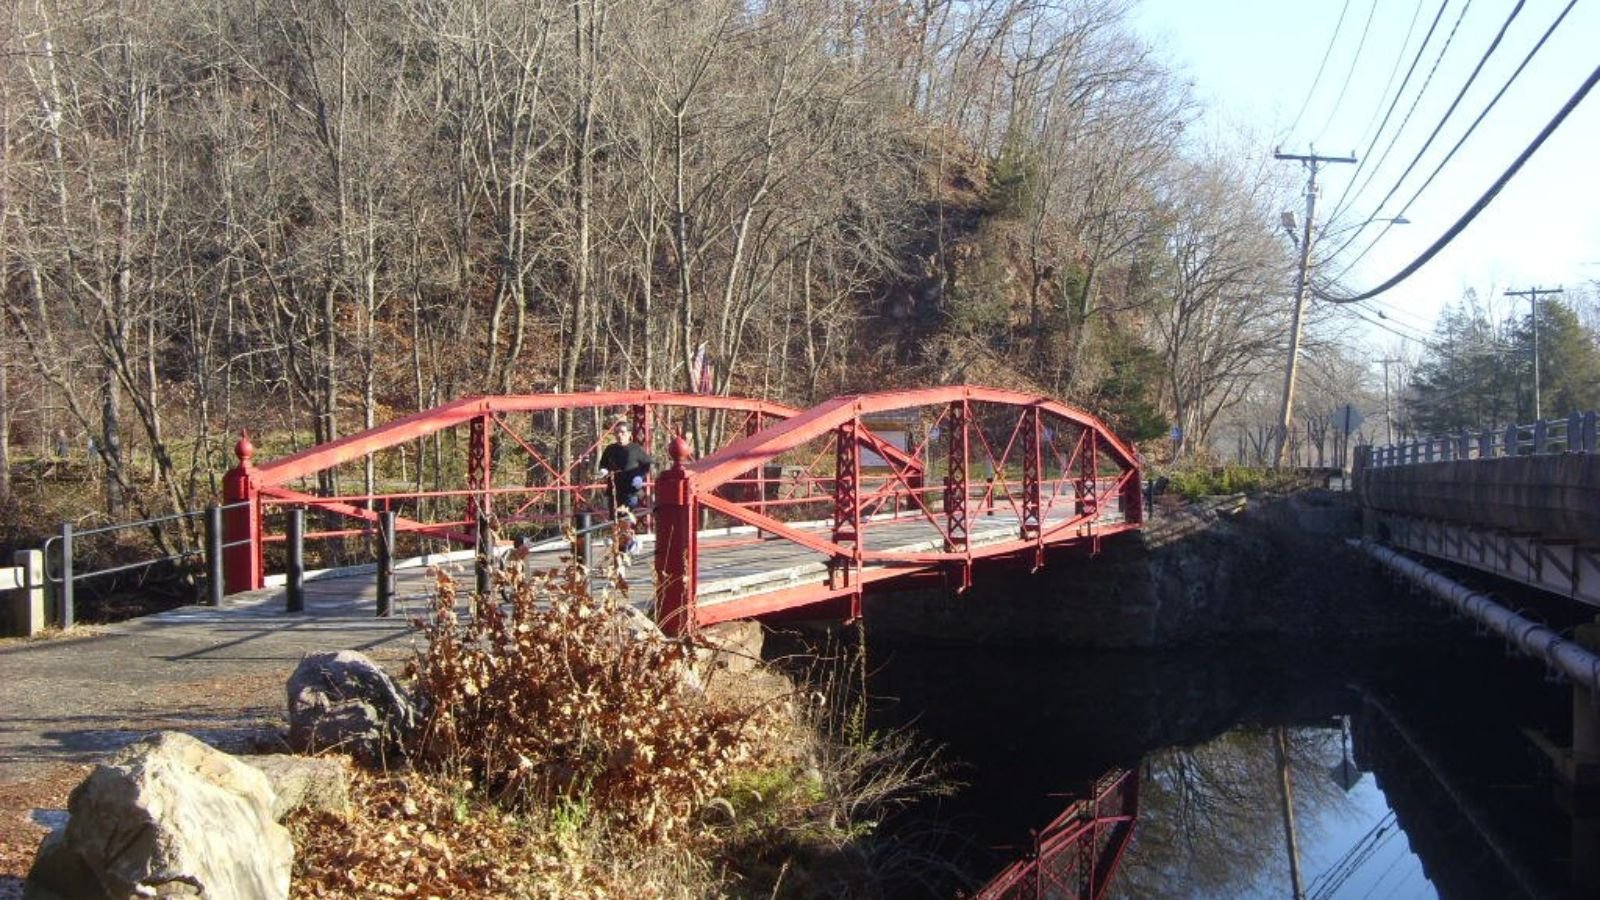
Meriden sits at the geographic center of Connecticut, offering residents convenient access to both Hartford and New Haven. This strategic location, along with reliable public transportation and highway connections, makes it attractive to commuters and families alike.
With a 2025 median home value just over $312,000, Meriden provides a cost-effective option in an increasingly expensive market. Parks like Hubbard Park and Castle Craig add to the area’s appeal, offering natural beauty alongside urban convenience. Its affordability continues to draw interest from buyers priced out of neighboring towns.
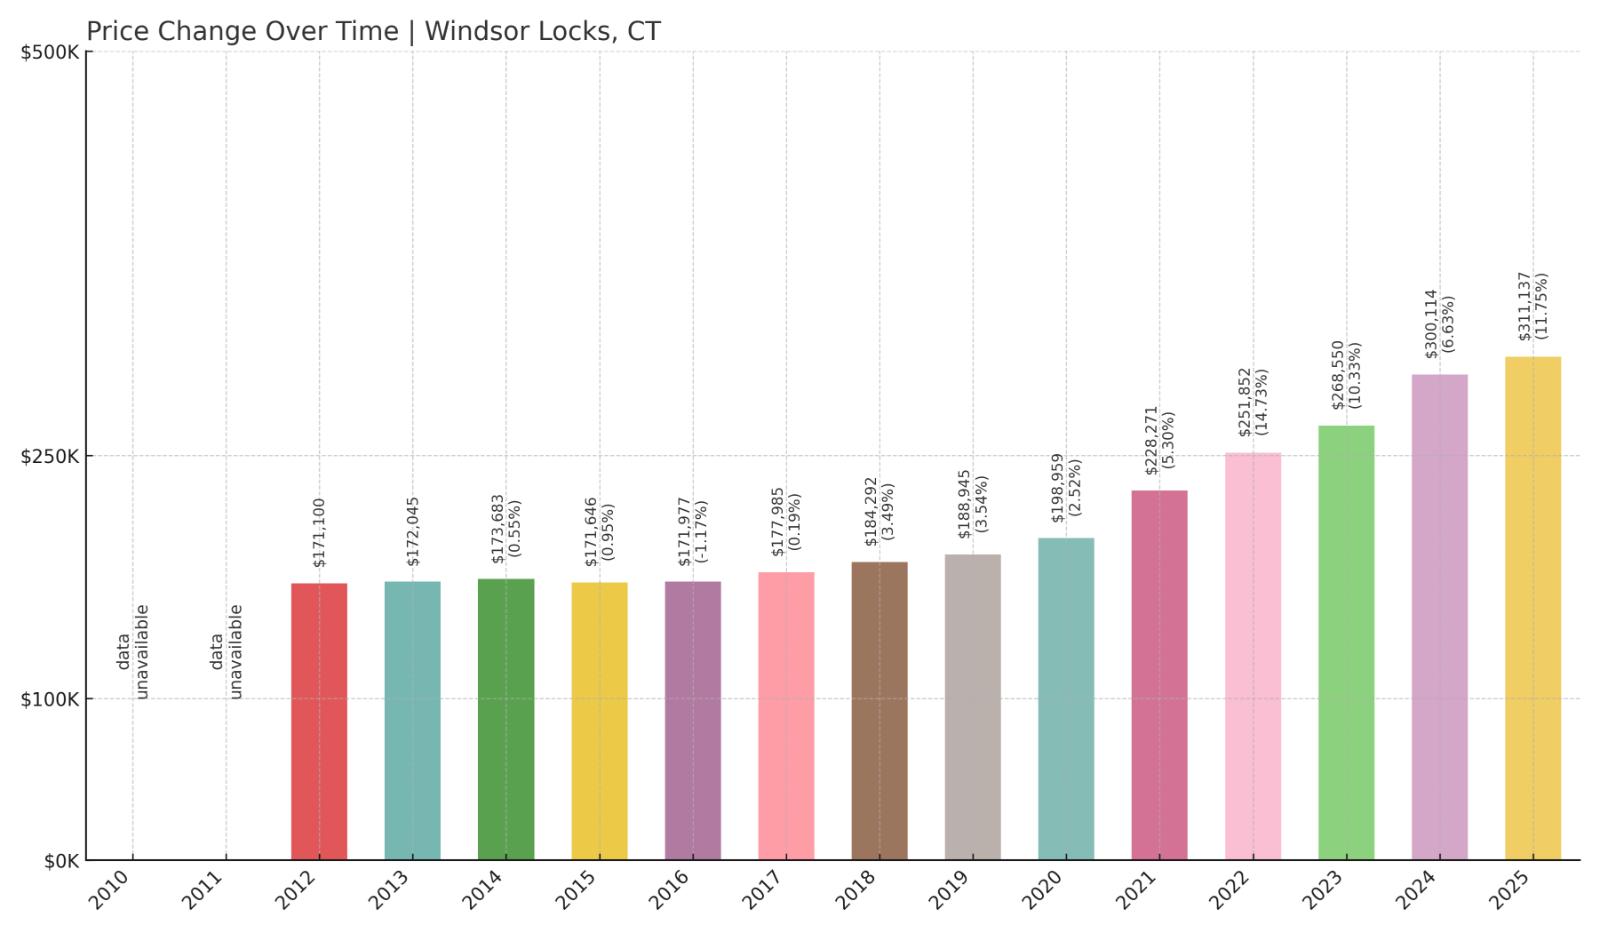
10. Windsor Locks – 82% Home Price Increase Since 2012
🔥 Would you like to save this?
- 2010: N/A
- 2011: N/A
- 2012: $171,100
- 2013: $172,045 (+$945, +0.55% from previous year)
- 2014: $173,683 (+$1,638, +0.95% from previous year)
- 2015: $171,646 (-$2,036, -1.17% from previous year)
- 2016: $171,977 (+$331, +0.19% from previous year)
- 2017: $177,985 (+$6,008, +3.49% from previous year)
- 2018: $184,292 (+$6,308, +3.54% from previous year)
- 2019: $188,945 (+$4,653, +2.52% from previous year)
- 2020: $198,959 (+$10,014, +5.30% from previous year)
- 2021: $228,271 (+$29,312, +14.73% from previous year)
- 2022: $251,852 (+$23,581, +10.33% from previous year)
- 2023: $268,550 (+$16,698, +6.63% from previous year)
- 2024: $300,114 (+$31,563, +11.75% from previous year)
- 2025: $311,137 (+$11,023, +3.67% from previous year)
Windsor Locks has posted a solid 82% increase in home values since 2012, with especially strong appreciation beginning in 2020. Like other towns on this list, price gains have accelerated in recent years while the town has retained relative affordability compared to the broader region.
Windsor Locks – Airport Proximity With Small-Town Vibe
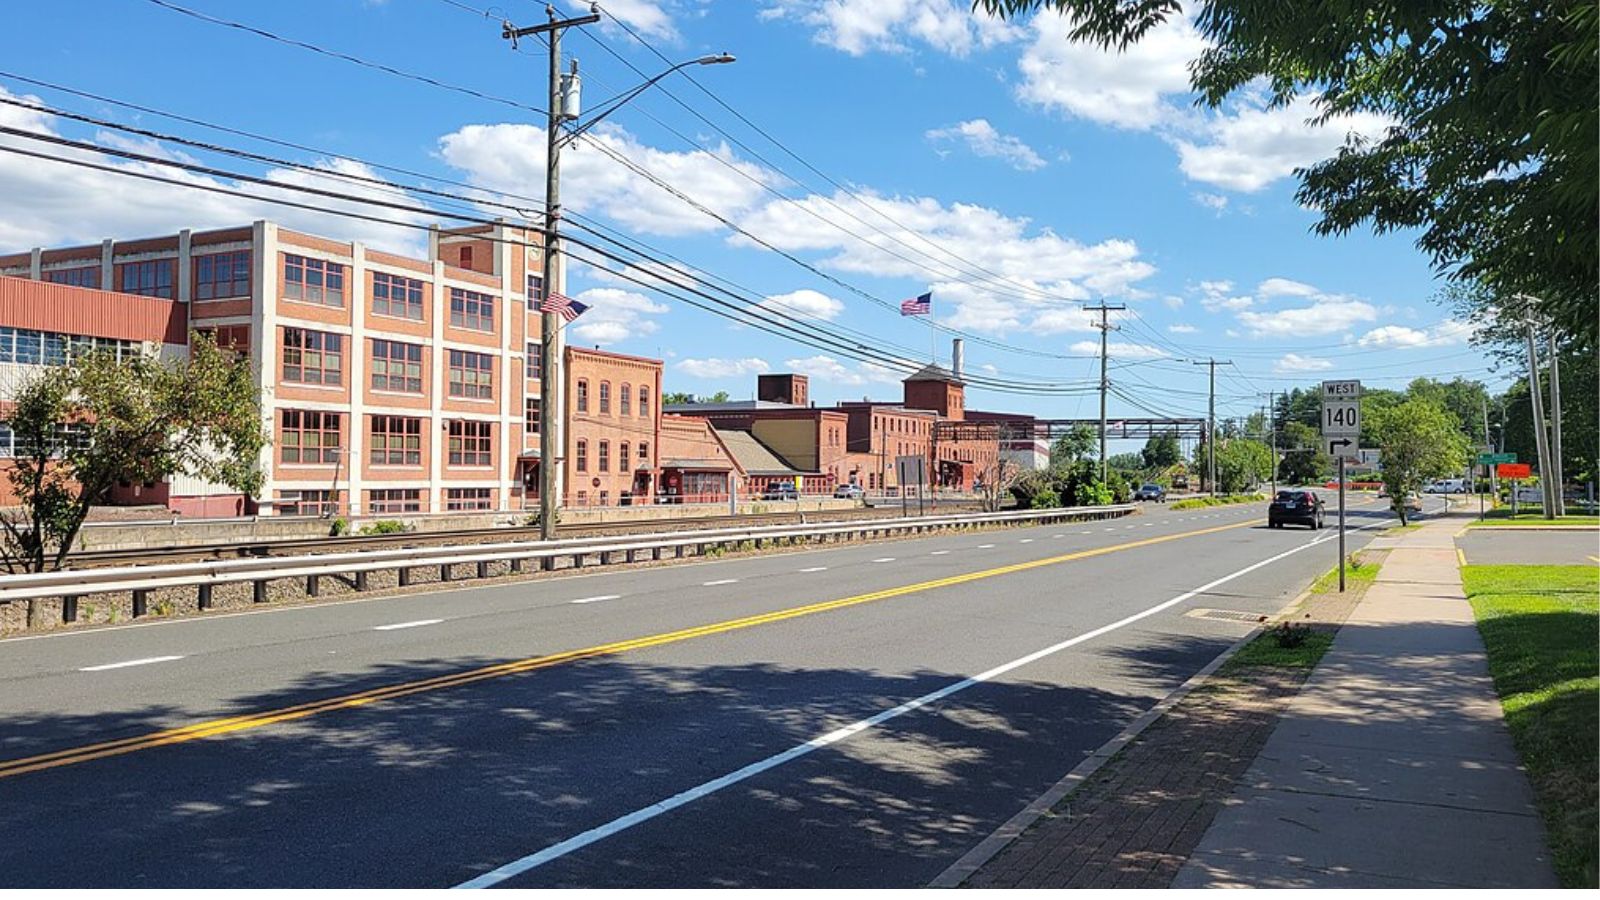
Known as the home of Bradley International Airport, Windsor Locks sits along the Connecticut River in Hartford County. While air travel plays a role in the local economy, the town also boasts historic sites like the New England Air Museum and peaceful residential neighborhoods.
With a 2025 home value just over $311,000, Windsor Locks offers an affordable entry point for buyers seeking a quieter environment with excellent regional access. Its slow and steady growth in home values reflects both stability and increasing demand.
9. East Hartford – 78% Home Price Increase Since 2010

- 2010: $169,115
- 2011: $157,744 (-$11,371, -6.72% from previous year)
- 2012: $147,357 (-$10,388, -6.59% from previous year)
- 2013: $143,501 (-$3,856, -2.62% from previous year)
- 2014: $145,561 (+$2,060, +1.44% from previous year)
- 2015: $144,056 (-$1,505, -1.03% from previous year)
- 2016: $150,320 (+$6,264, +4.35% from previous year)
- 2017: $157,788 (+$7,468, +4.97% from previous year)
- 2018: $164,073 (+$6,285, +3.98% from previous year)
- 2019: $169,830 (+$5,757, +3.51% from previous year)
- 2020: $177,776 (+$7,946, +4.68% from previous year)
- 2021: $210,147 (+$32,372, +18.21% from previous year)
- 2022: $235,821 (+$25,674, +12.22% from previous year)
- 2023: $250,994 (+$15,173, +6.43% from previous year)
- 2024: $287,951 (+$36,957, +14.72% from previous year)
- 2025: $301,344 (+$13,393, +4.65% from previous year)
East Hartford’s home prices have increased by 78% since 2010. After a few years of decline through 2013, the market began a gradual turnaround and gained serious momentum starting in 2020. The standout years were 2021 and 2024, both of which saw double-digit price jumps, reflecting renewed interest in this well-located town.
East Hartford – Affordable Option Near the Capital
East Hartford lies directly across the Connecticut River from the state capital and has long served as a residential base for Hartford-area workers. With employers like Pratt & Whitney headquartered nearby and quick access to I-84, Route 2, and CTfastrak service, the town remains well-connected and practical for commuters.
Despite its location and improving housing stock, East Hartford’s median home price is still just over $301,000 in 2025. That’s significantly lower than the statewide average. Its combination of accessibility, community services, and affordability has made it one of the more attractive markets for buyers looking for long-term value close to Hartford.
8. New Britain – 138% Home Price Increase Since 2010
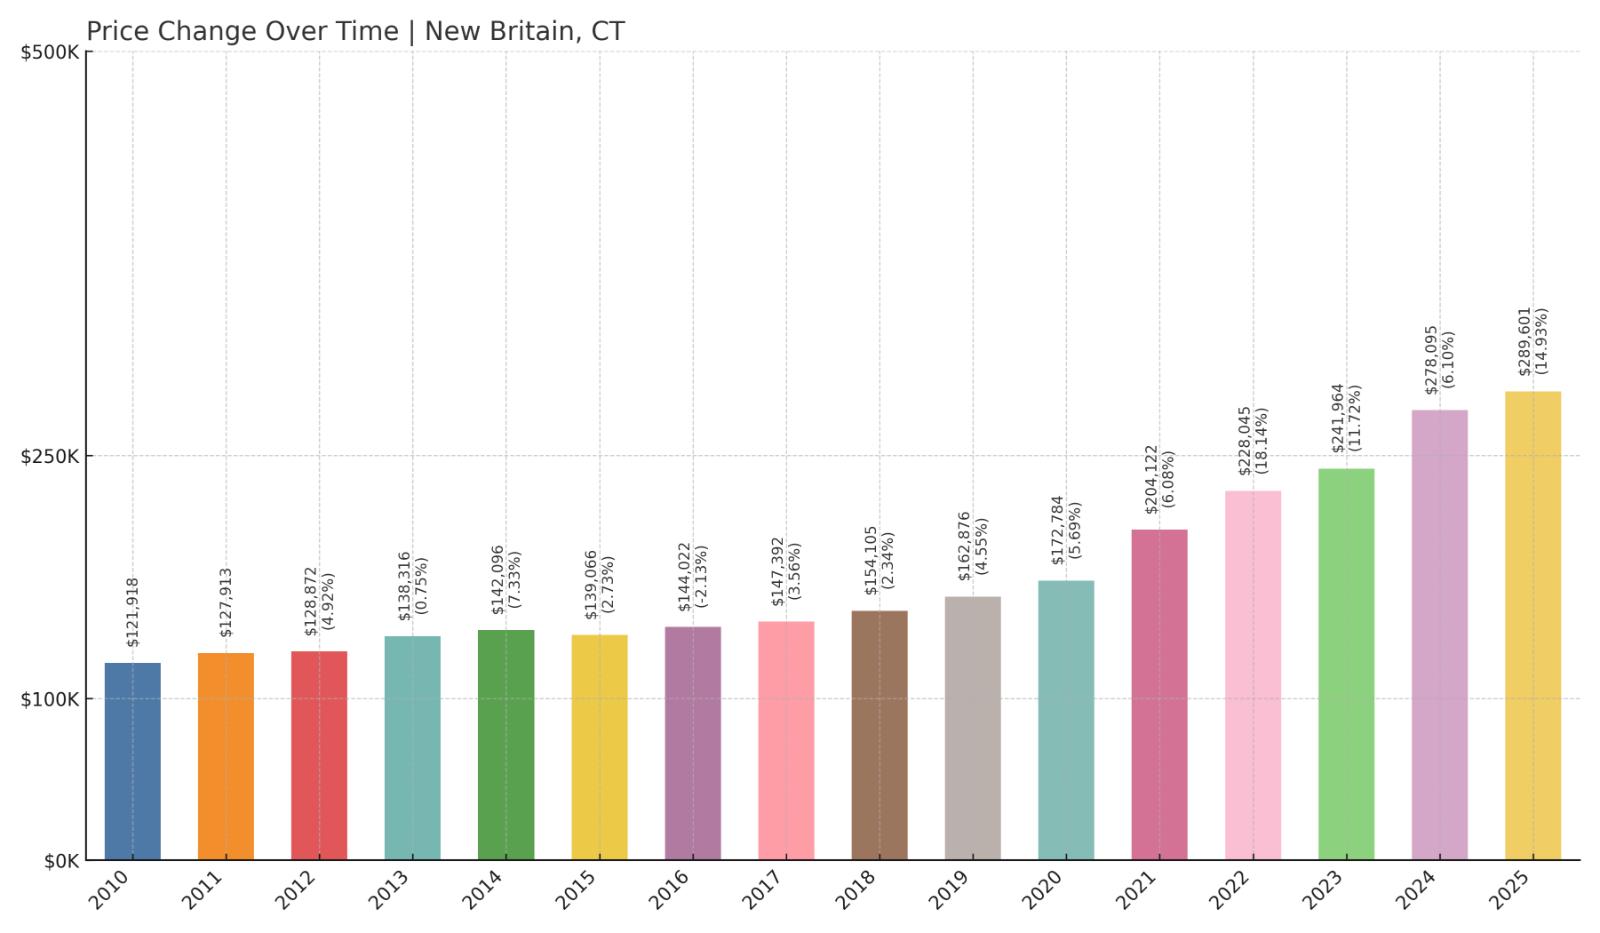
- 2010: $121,918
- 2011: $127,913 (+$5,996, +4.92% from previous year)
- 2012: $128,872 (+$959, +0.75% from previous year)
- 2013: $138,316 (+$9,444, +7.33% from previous year)
- 2014: $142,096 (+$3,780, +2.73% from previous year)
- 2015: $139,066 (-$3,030, -2.13% from previous year)
- 2016: $144,022 (+$4,956, +3.56% from previous year)
- 2017: $147,392 (+$3,370, +2.34% from previous year)
- 2018: $154,105 (+$6,713, +4.55% from previous year)
- 2019: $162,876 (+$8,771, +5.69% from previous year)
- 2020: $172,784 (+$9,908, +6.08% from previous year)
- 2021: $204,122 (+$31,338, +18.14% from previous year)
- 2022: $228,045 (+$23,923, +11.72% from previous year)
- 2023: $241,964 (+$13,919, +6.10% from previous year)
- 2024: $278,095 (+$36,131, +14.93% from previous year)
- 2025: $289,601 (+$11,506, +4.14% from previous year)
Home values in New Britain have risen an impressive 138% since 2010. While gains were moderate in the early years, the market began surging after 2020, particularly in 2021 and 2024. Even with these sharp increases, the city remains one of the most affordable in the region.
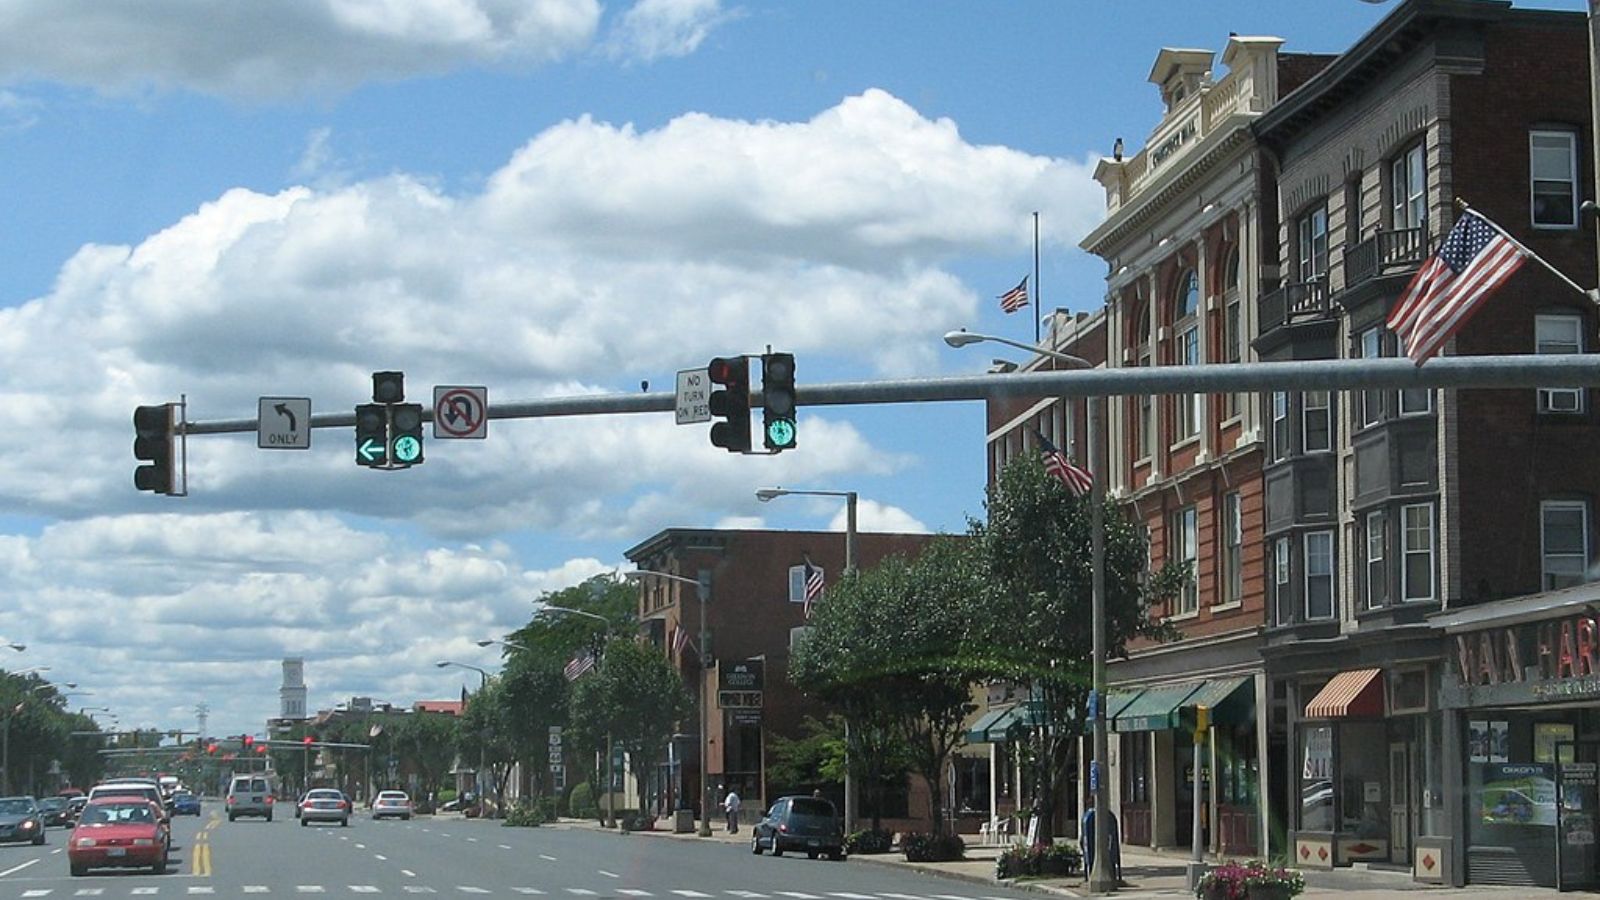
New Britain – Historic City With Value Appeal
New Britain has long been a working-class city with deep industrial roots. It’s now gaining renewed attention for its improving amenities, public transportation options, and proximity to Hartford and New Haven via major highways. The downtown continues to benefit from investment and revitalization.
Despite the rising prices, the 2025 median home value remains under $290,000, well below the state average. That affordability, paired with culture and infrastructure, has helped drive steady demand among first-time buyers and investors alike.
7. Norwich – 69% Home Price Increase Since 2010
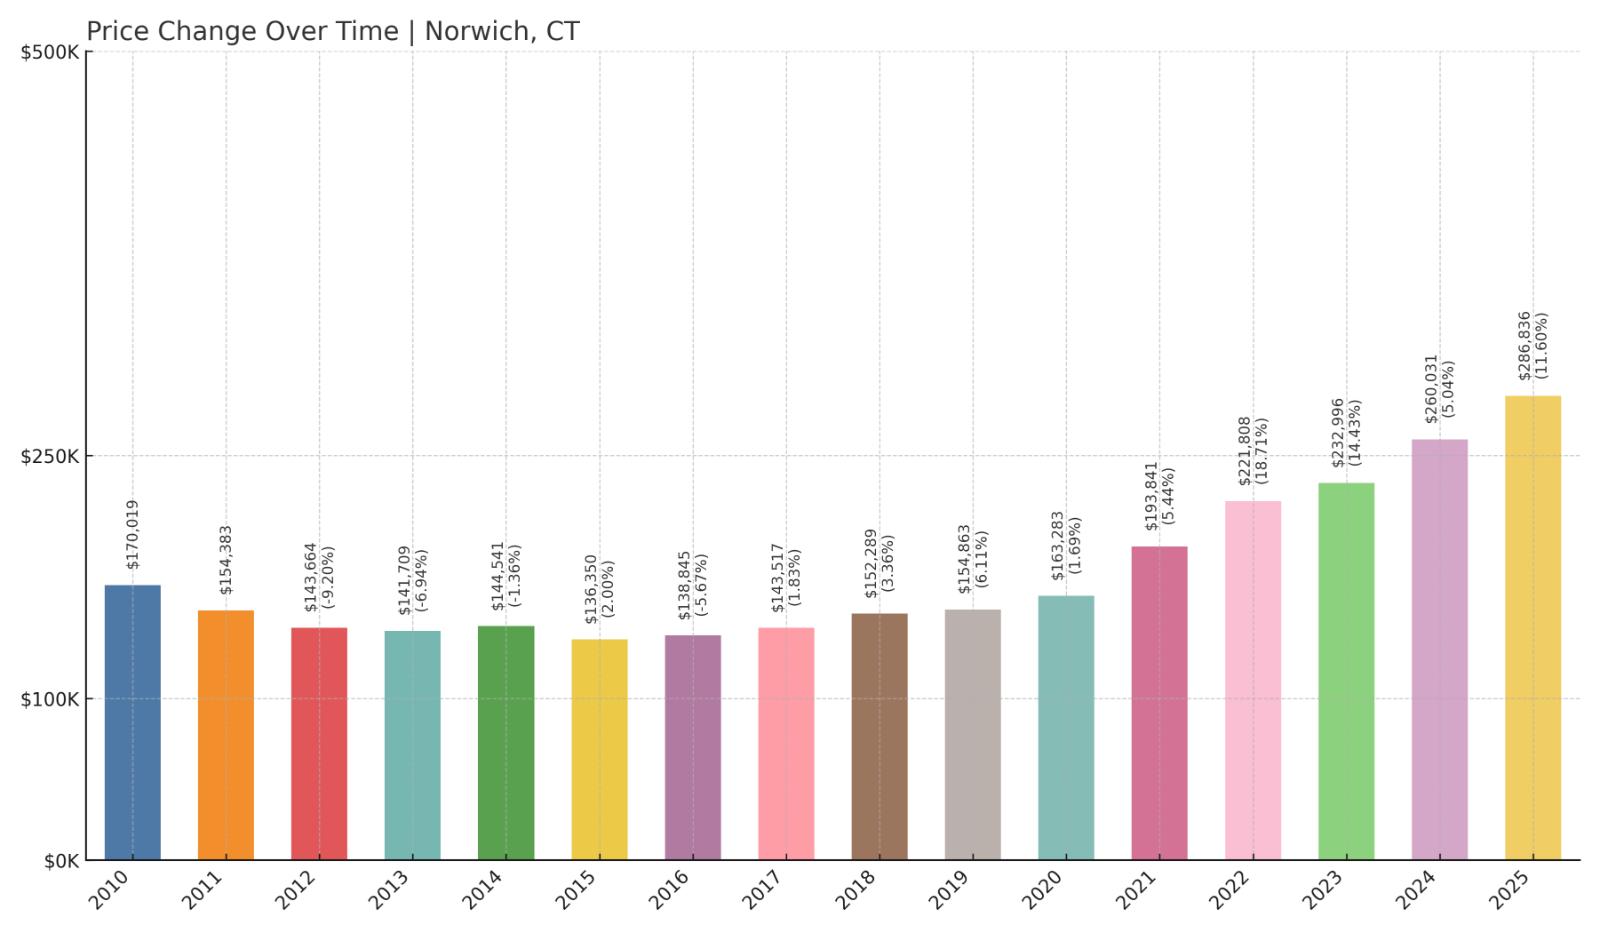
- 2010: $170,019
- 2011: $154,383 (-$15,637, -9.20% from previous year)
- 2012: $143,664 (-$10,719, -6.94% from previous year)
- 2013: $141,709 (-$1,954, -1.36% from previous year)
- 2014: $144,541 (+$2,832, +2.00% from previous year)
- 2015: $136,350 (-$8,191, -5.67% from previous year)
- 2016: $138,845 (+$2,496, +1.83% from previous year)
- 2017: $143,517 (+$4,672, +3.36% from previous year)
- 2018: $152,289 (+$8,772, +6.11% from previous year)
- 2019: $154,863 (+$2,575, +1.69% from previous year)
- 2020: $163,283 (+$8,419, +5.44% from previous year)
- 2021: $193,841 (+$30,558, +18.71% from previous year)
- 2022: $221,808 (+$27,967, +14.43% from previous year)
- 2023: $232,996 (+$11,188, +5.04% from previous year)
- 2024: $260,031 (+$27,035, +11.60% from previous year)
- 2025: $286,836 (+$26,805, +10.31% from previous year)
Since 2010, Norwich home prices have increased by nearly 69%. After a slow start to the decade with multiple years of decline, the town’s real estate market began to recover and has grown consistently since 2016, especially post-2020.
Norwich – Revitalizing History With Room to Grow
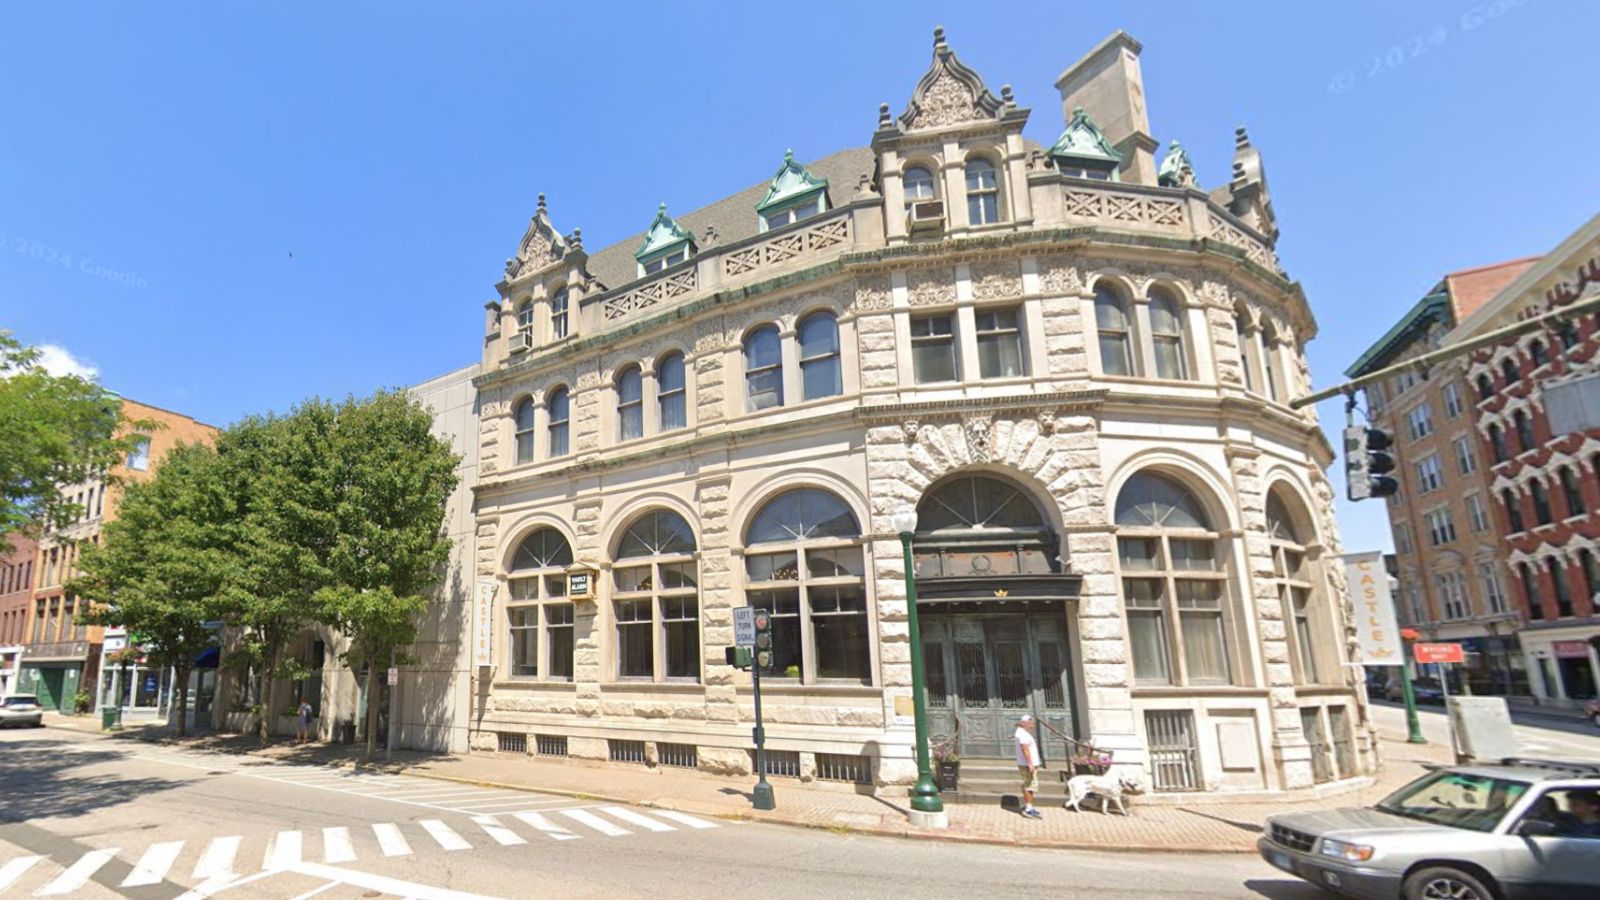
Norwich, located in southeastern Connecticut, offers a mix of colonial architecture, riverfront views, and quick access to I-395. The city has benefited from increased investment and spillover demand from pricier areas along the coast and casino corridor.
With a 2025 median home price just under $287,000, Norwich remains more affordable than much of the shoreline. Continued interest from buyers priced out of Mystic, New London, and other coastal communities has helped drive the city’s steady climb in value.
6. South Windham – 108% Home Price Increase Since 2010
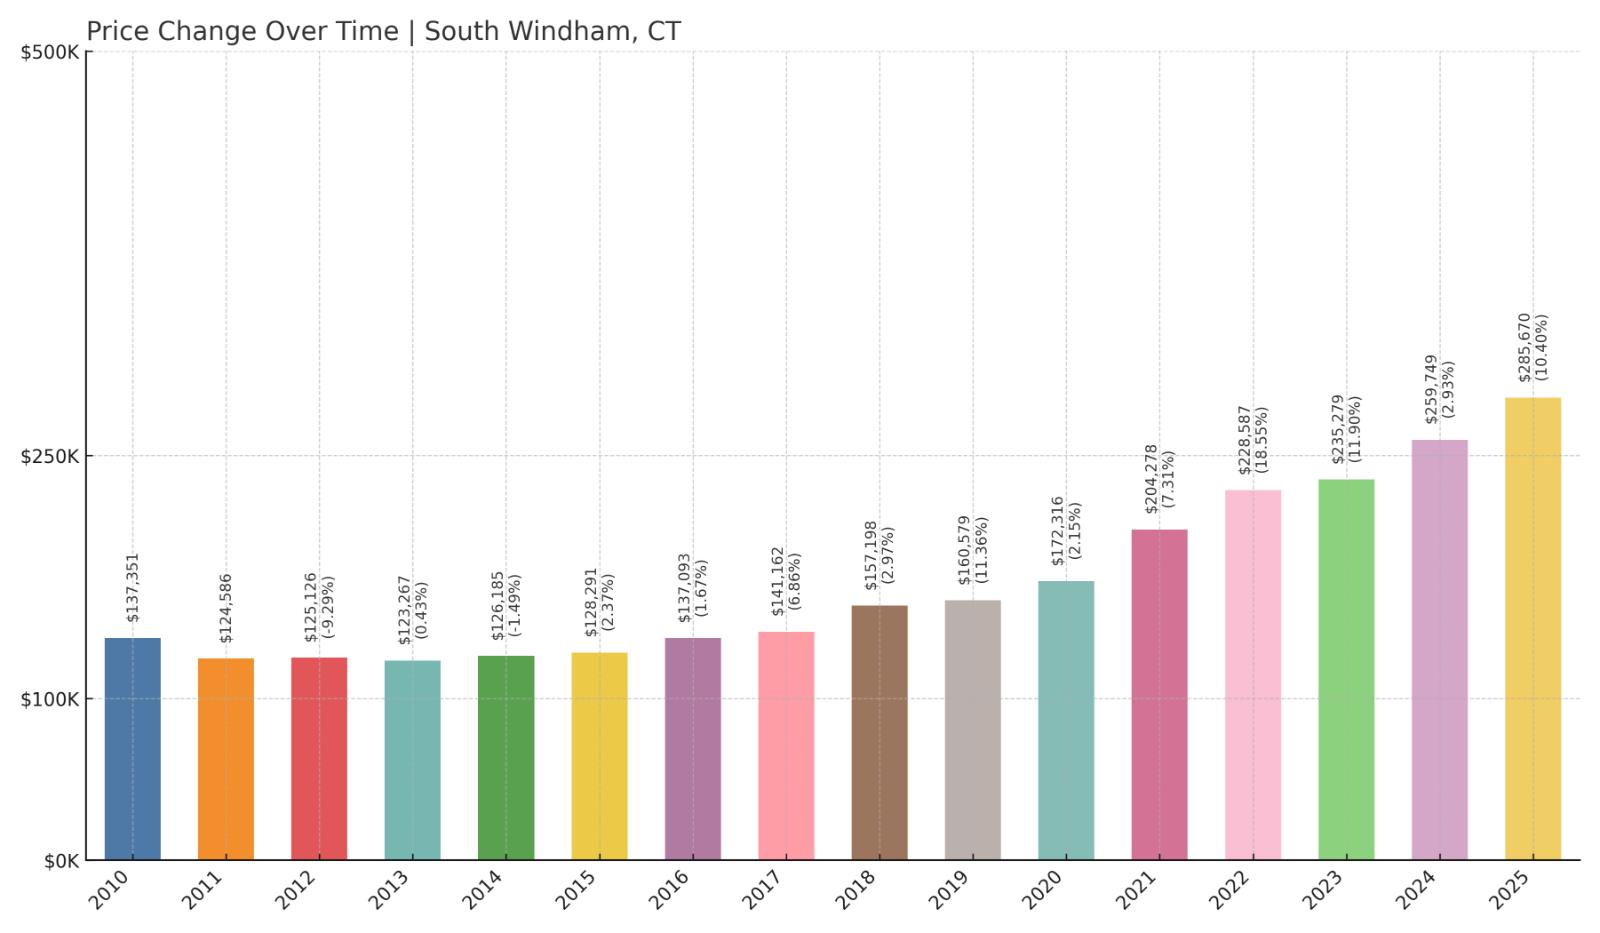
- 2010: $137,351
- 2011: $124,586 (-$12,765, -9.29% from previous year)
- 2012: $125,126 (+$540, +0.43% from previous year)
- 2013: $123,267 (-$1,859, -1.49% from previous year)
- 2014: $126,185 (+$2,918, +2.37% from previous year)
- 2015: $128,291 (+$2,106, +1.67% from previous year)
- 2016: $137,093 (+$8,802, +6.86% from previous year)
- 2017: $141,162 (+$4,070, +2.97% from previous year)
- 2018: $157,198 (+$16,035, +11.36% from previous year)
- 2019: $160,579 (+$3,382, +2.15% from previous year)
- 2020: $172,316 (+$11,736, +7.31% from previous year)
- 2021: $204,278 (+$31,962, +18.55% from previous year)
- 2022: $228,587 (+$24,309, +11.90% from previous year)
- 2023: $235,279 (+$6,691, +2.93% from previous year)
- 2024: $259,749 (+$24,471, +10.40% from previous year)
- 2025: $285,670 (+$25,920, +9.98% from previous year)
South Windham has more than doubled in home value since 2010, up 108%. Modest appreciation early in the decade was followed by sharp gains beginning in 2020, with four straight years of double-digit growth.
South Windham – Quiet Village With Surging Appeal
Located within the town of Windham, South Windham is a small community with a semi-rural character. Its proximity to Willimantic and ECSU makes it accessible, while its quiet streets and scenic surroundings make it attractive to buyers seeking calm and affordability.
With a 2025 median home value under $286,000, South Windham still offers tremendous value. Demand has grown steadily as buyers discover its mix of privacy, access, and lower housing costs compared to larger towns nearby.
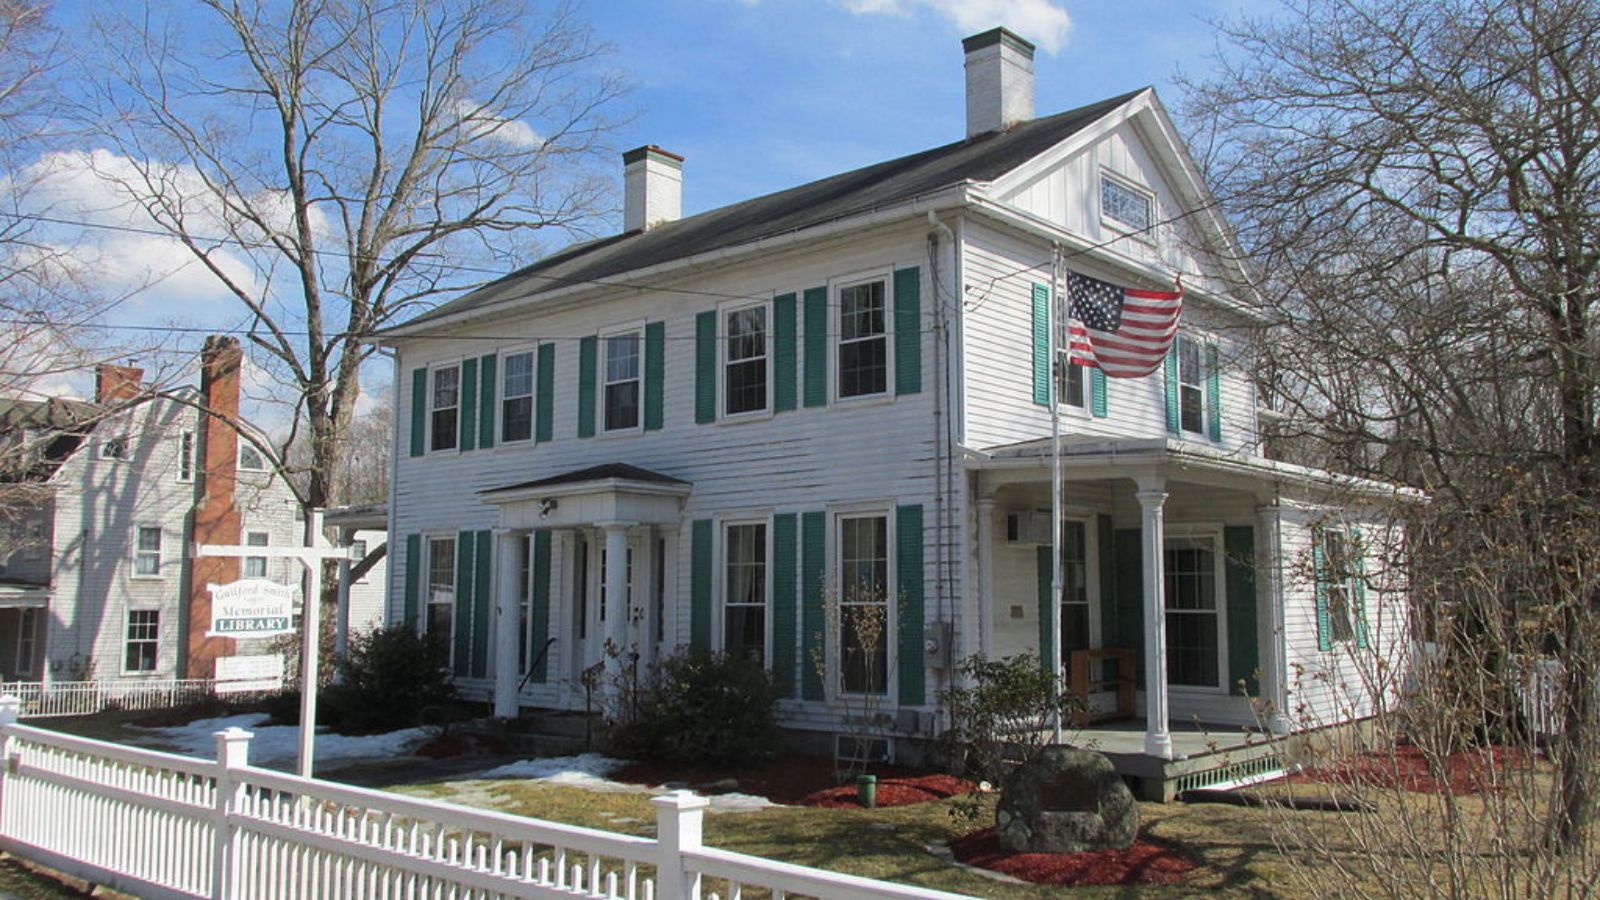
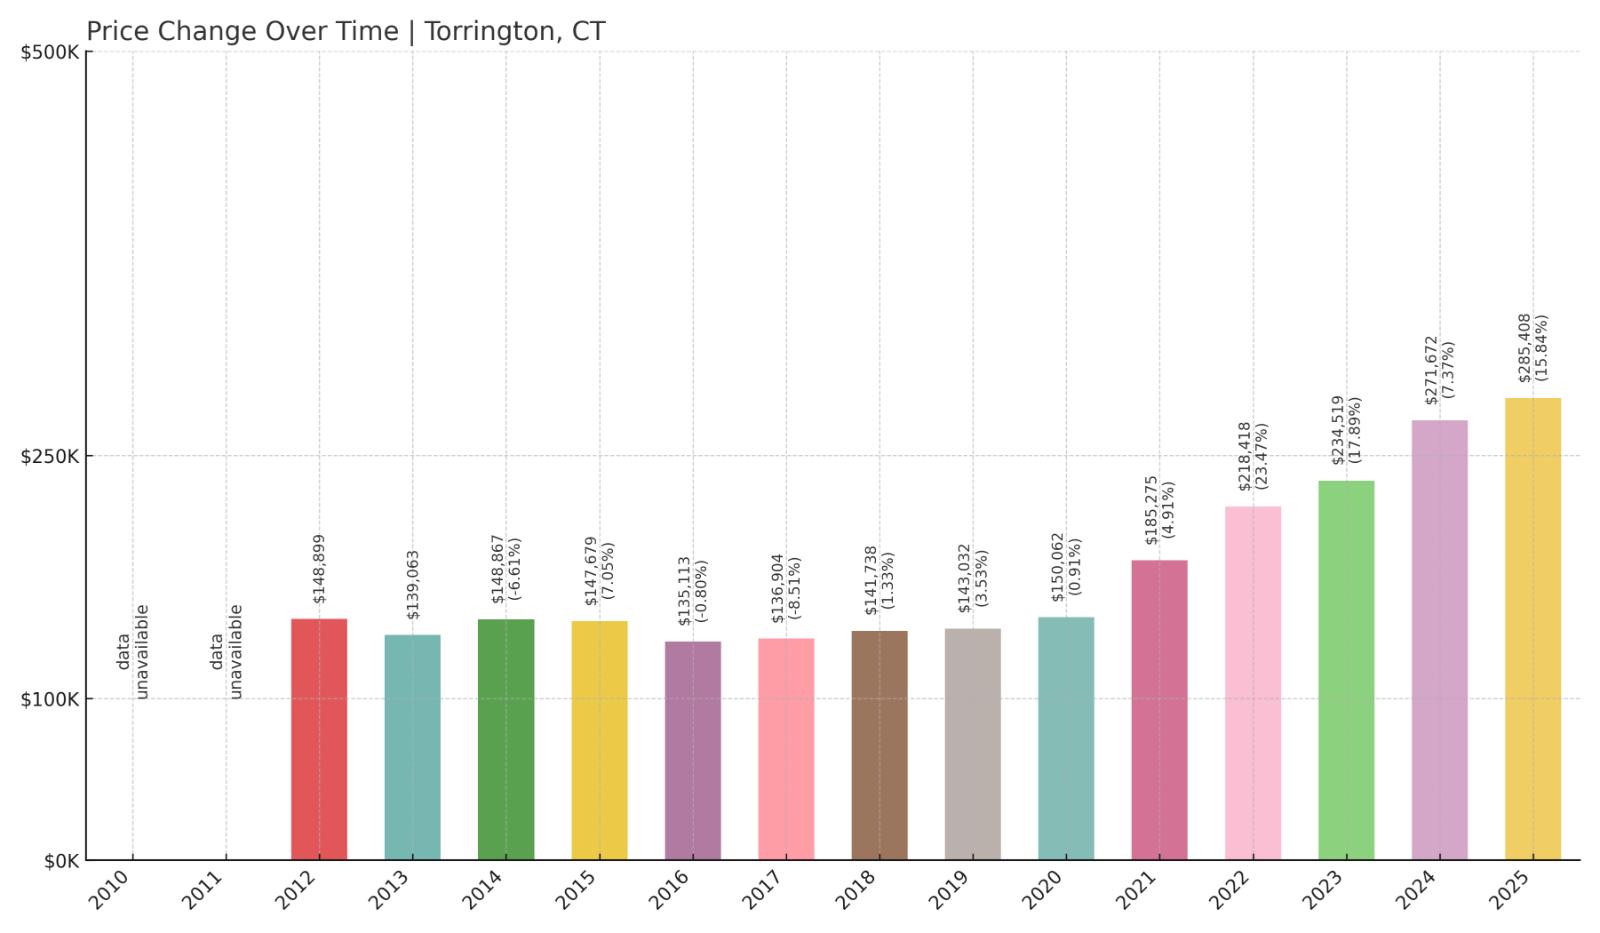
5. Torrington – 92% Home Price Increase Since 2012
- 2010: N/A
- 2011: N/A
- 2012: $148,899
- 2013: $139,063 (-$9,836, -6.61% from previous year)
- 2014: $148,867 (+$9,804, +7.05% from previous year)
- 2015: $147,679 (-$1,188, -0.80% from previous year)
- 2016: $135,113 (-$12,566, -8.51% from previous year)
- 2017: $136,904 (+$1,791, +1.33% from previous year)
- 2018: $141,738 (+$4,834, +3.53% from previous year)
- 2019: $143,032 (+$1,294, +0.91% from previous year)
- 2020: $150,062 (+$7,030, +4.92% from previous year)
- 2021: $185,275 (+$35,213, +23.47% from previous year)
- 2022: $218,418 (+$33,143, +17.89% from previous year)
- 2023: $234,519 (+$16,101, +7.37% from previous year)
- 2024: $271,672 (+$37,153, +15.84% from previous year)
- 2025: $285,408 (+$13,736, +5.06% from previous year)
Torrington home prices have increased by 92% since 2012. While the market was flat in the first half of the decade, it picked up steam after 2020. Strong double-digit growth from 2021 to 2024 helped push values to over $285,000 in 2025.
Torrington – Affordable Hub in the Northwest Hills
Torrington is the largest city in Litchfield County and serves as a commercial center for the surrounding rural towns. It blends historic architecture, cultural institutions, and access to nature, making it popular with both longtime residents and newer buyers seeking space and value.
Despite the growth, Torrington’s home prices remain well below those in nearby towns like Litchfield and New Hartford. Its affordability, combined with amenities and improving housing stock, continues to draw interest from across the region.
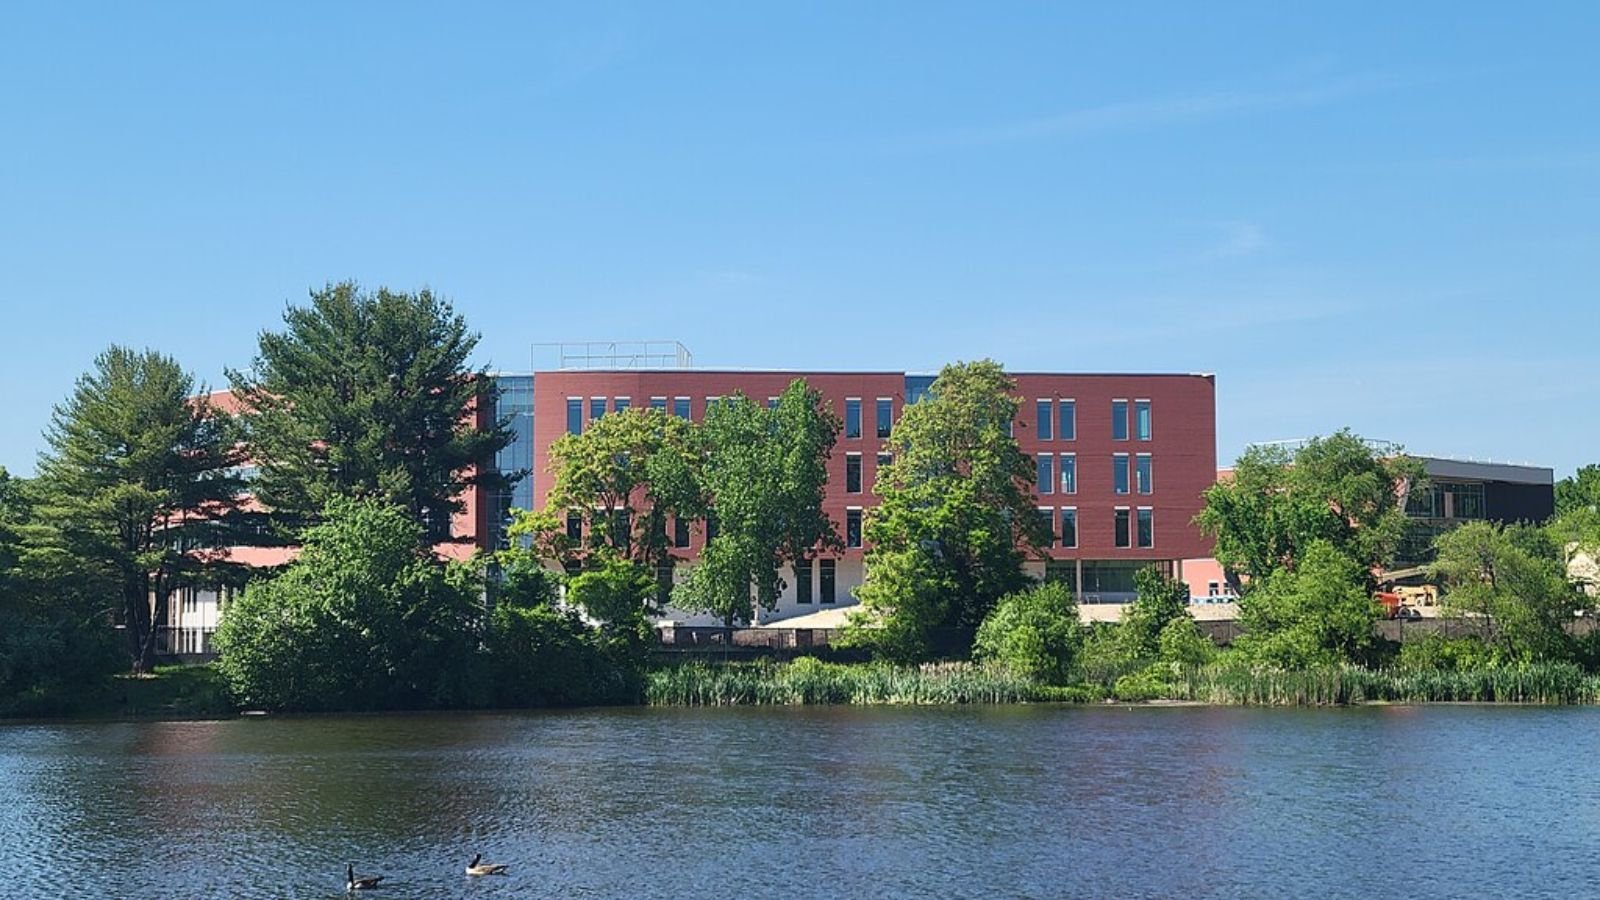
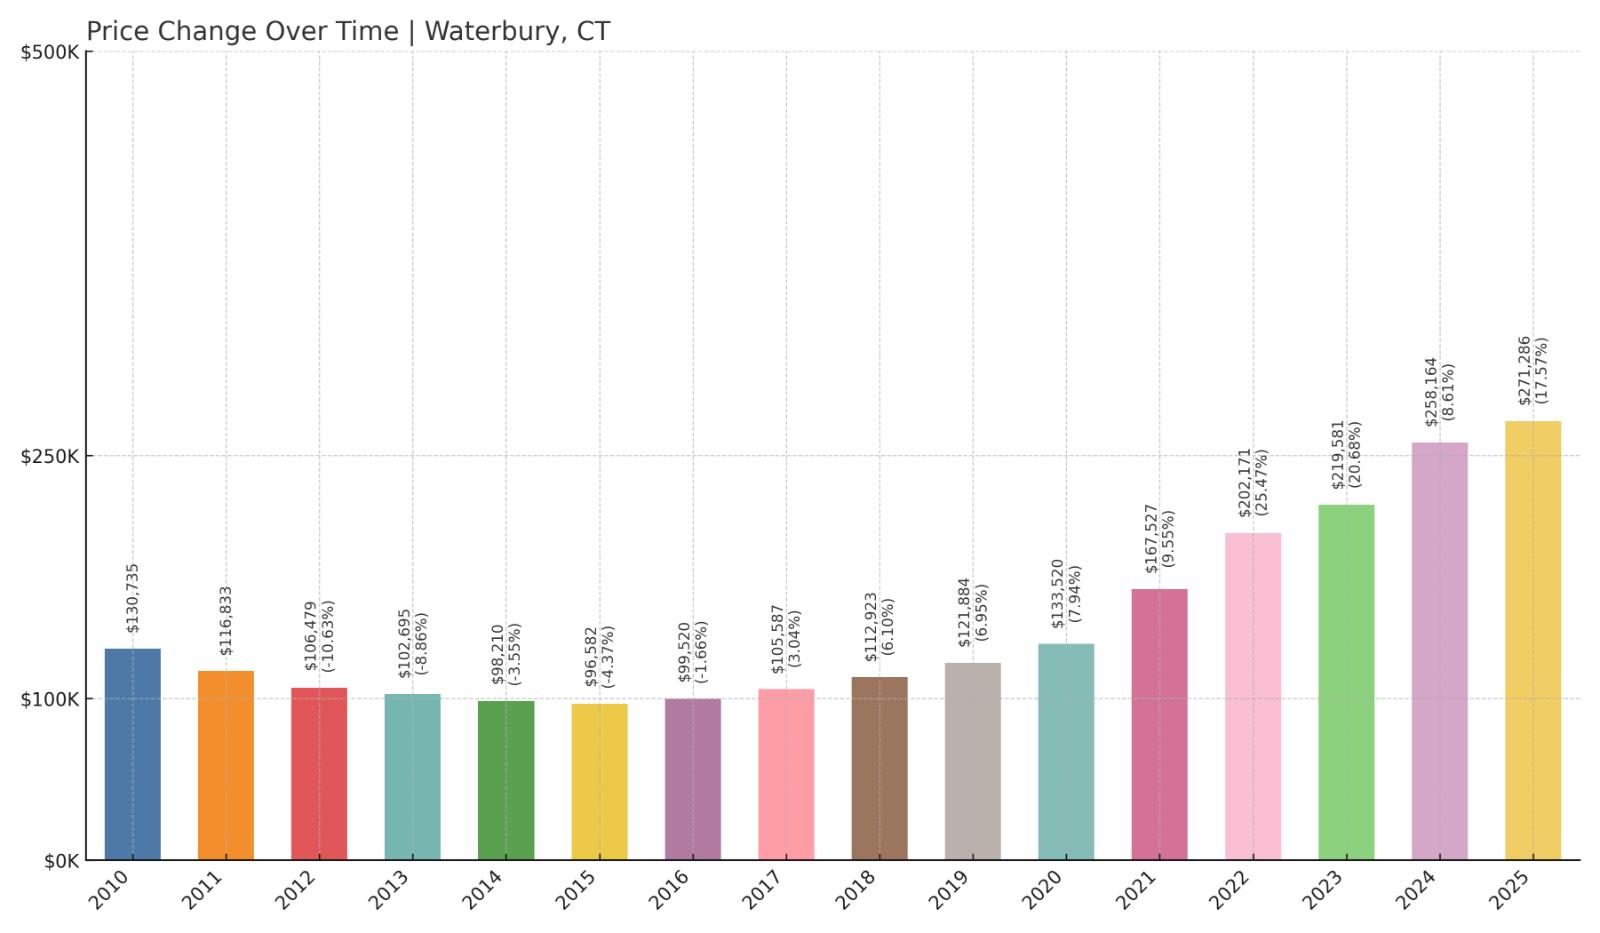
4. Waterbury – 108% Home Price Increase Since 2010
🔥 Would you like to save this?
- 2010: $130,735
- 2011: $116,833 (-$13,902, -10.63% from previous year)
- 2012: $106,479 (-$10,354, -8.86% from previous year)
- 2013: $102,695 (-$3,784, -3.55% from previous year)
- 2014: $98,210 (-$4,485, -4.37% from previous year)
- 2015: $96,582 (-$1,628, -1.66% from previous year)
- 2016: $99,520 (+$2,938, +3.04% from previous year)
- 2017: $105,587 (+$6,067, +6.10% from previous year)
- 2018: $112,923 (+$7,336, +6.95% from previous year)
- 2019: $121,884 (+$8,962, +7.94% from previous year)
- 2020: $133,520 (+$11,636, +9.55% from previous year)
- 2021: $167,527 (+$34,006, +25.47% from previous year)
- 2022: $202,171 (+$34,645, +20.68% from previous year)
- 2023: $219,581 (+$17,410, +8.61% from previous year)
- 2024: $258,164 (+$38,584, +17.57% from previous year)
- 2025: $271,286 (+$13,121, +5.08% from previous year)
Waterbury’s home prices have surged 108% since 2010. After bottoming out mid-decade, the city’s market took off around 2020. A massive 25% increase in 2021 was followed by two more years of double-digit growth.
Waterbury – Revival in a Historic Manufacturing City
Once a hub of brass manufacturing, Waterbury has spent the last decade reinventing itself. It offers some of the most affordable housing stock in Connecticut, while being well-connected to major cities via I-84 and Metro-North rail service.
In 2025, homes in Waterbury are still priced below $275,000 on average. Its affordability, combined with infrastructure investments and proximity to employment hubs, has made it increasingly attractive to buyers priced out of more expensive markets.
3. Winsted – 78% Home Price Increase Since 2010
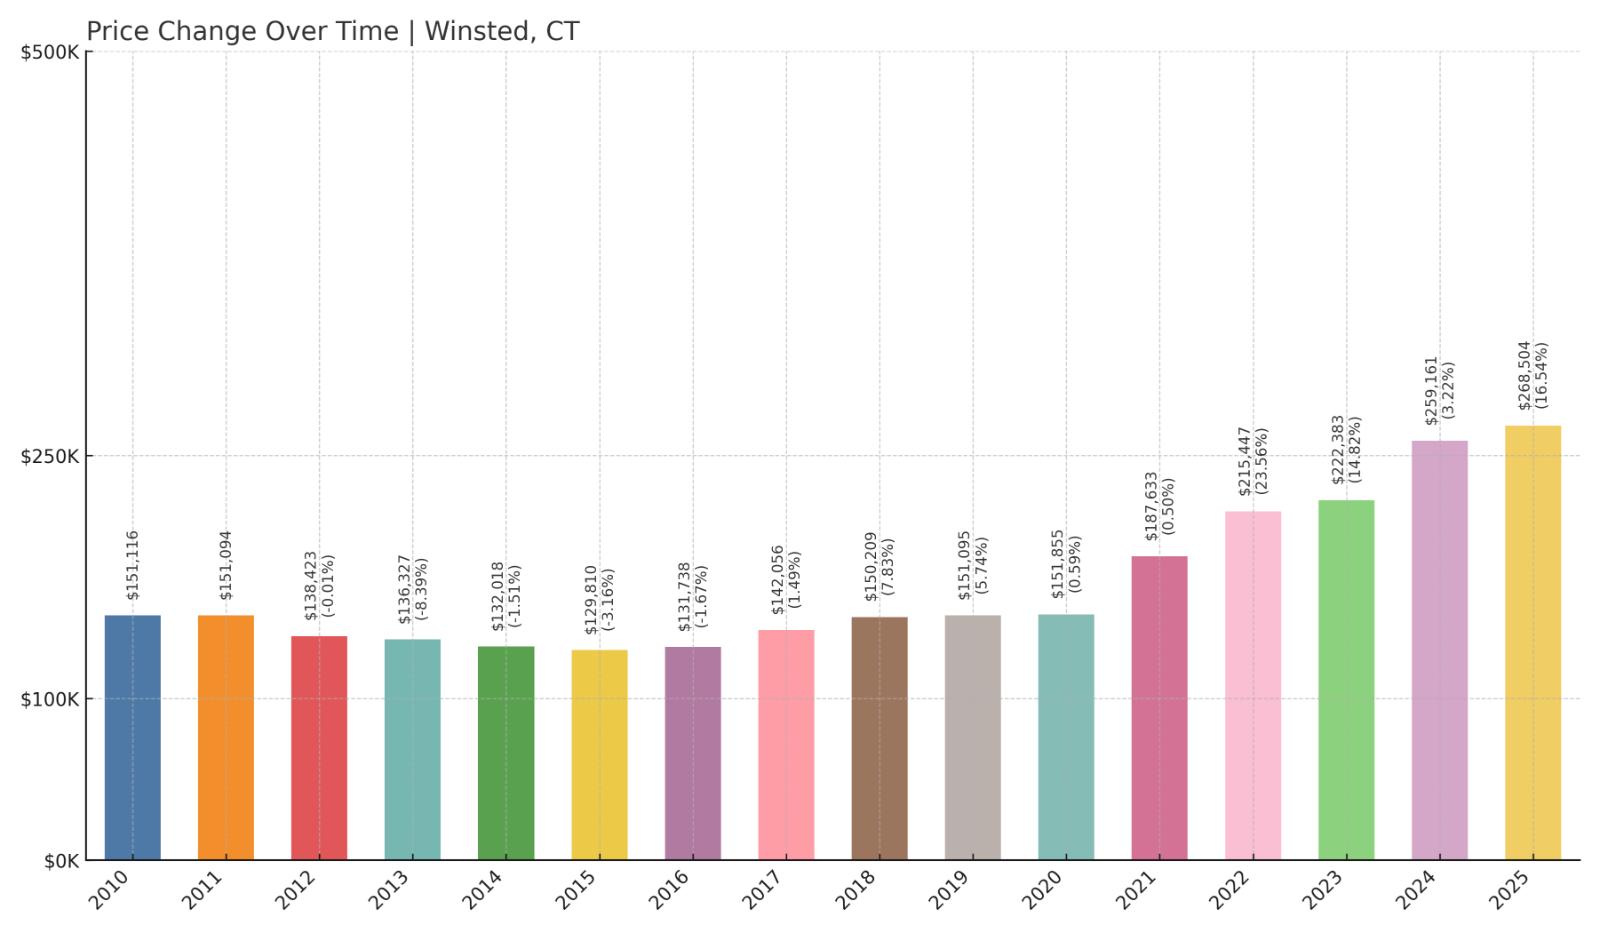
- 2010: $151,116
- 2011: $151,094 (-$23, -0.02% from previous year)
- 2012: $138,423 (-$12,671, -8.39% from previous year)
- 2013: $136,327 (-$2,095, -1.51% from previous year)
- 2014: $132,018 (-$4,309, -3.16% from previous year)
- 2015: $129,810 (-$2,208, -1.67% from previous year)
- 2016: $131,738 (+$1,928, +1.49% from previous year)
- 2017: $142,056 (+$10,318, +7.83% from previous year)
- 2018: $150,209 (+$8,152, +5.74% from previous year)
- 2019: $151,095 (+$886, +0.59% from previous year)
- 2020: $151,855 (+$760, +0.50% from previous year)
- 2021: $187,633 (+$35,779, +23.56% from previous year)
- 2022: $215,447 (+$27,813, +14.82% from previous year)
- 2023: $222,383 (+$6,936, +3.22% from previous year)
- 2024: $259,161 (+$36,778, +16.54% from previous year)
- 2025: $268,504 (+$9,343, +3.61% from previous year)
Winsted home prices have climbed 78% since 2010. After several stagnant years, the market began turning around in the late 2010s, with prices accelerating rapidly post-2020. The strongest growth came between 2021 and 2024.
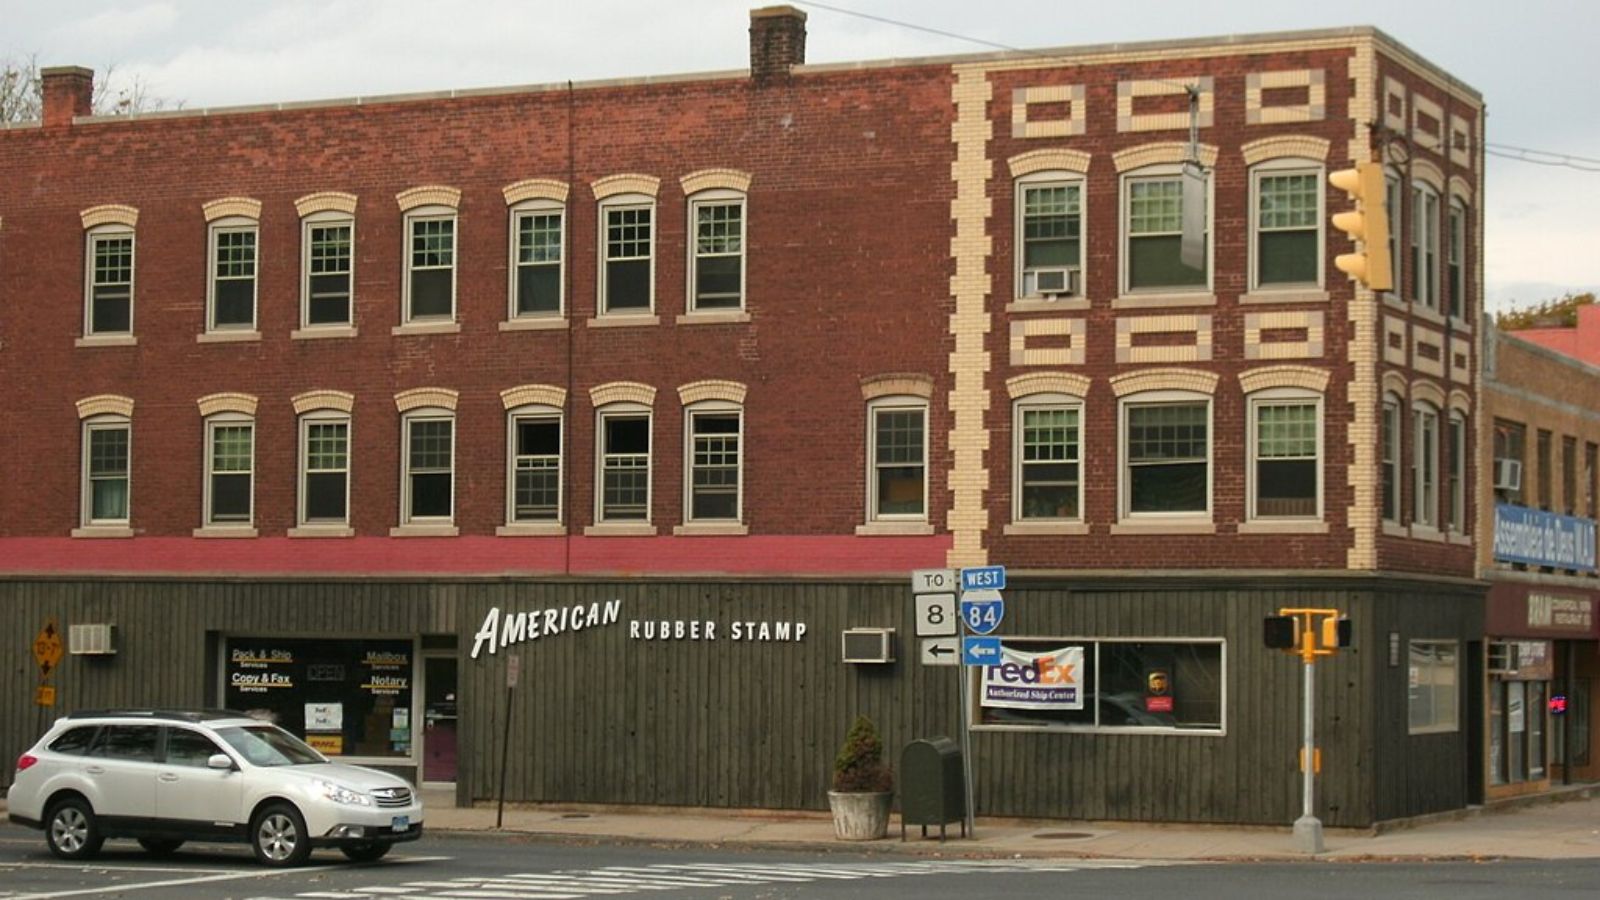
Winsted – Quiet, Affordable Corner of the Northwest
Winsted is part of the town of Winchester and sits in the northwest corner of Connecticut. The area is known for its small-town charm, natural scenery, and affordability. It’s also home to Northwestern Connecticut Community College and local arts programs.
In 2025, the average home still costs under $270,000. That’s a big draw for buyers who want proximity to the Berkshires, lake access, and a slower pace of life—without paying the premiums found in Litchfield or Kent.
2. Willimantic – 93% Home Price Increase Since 2010
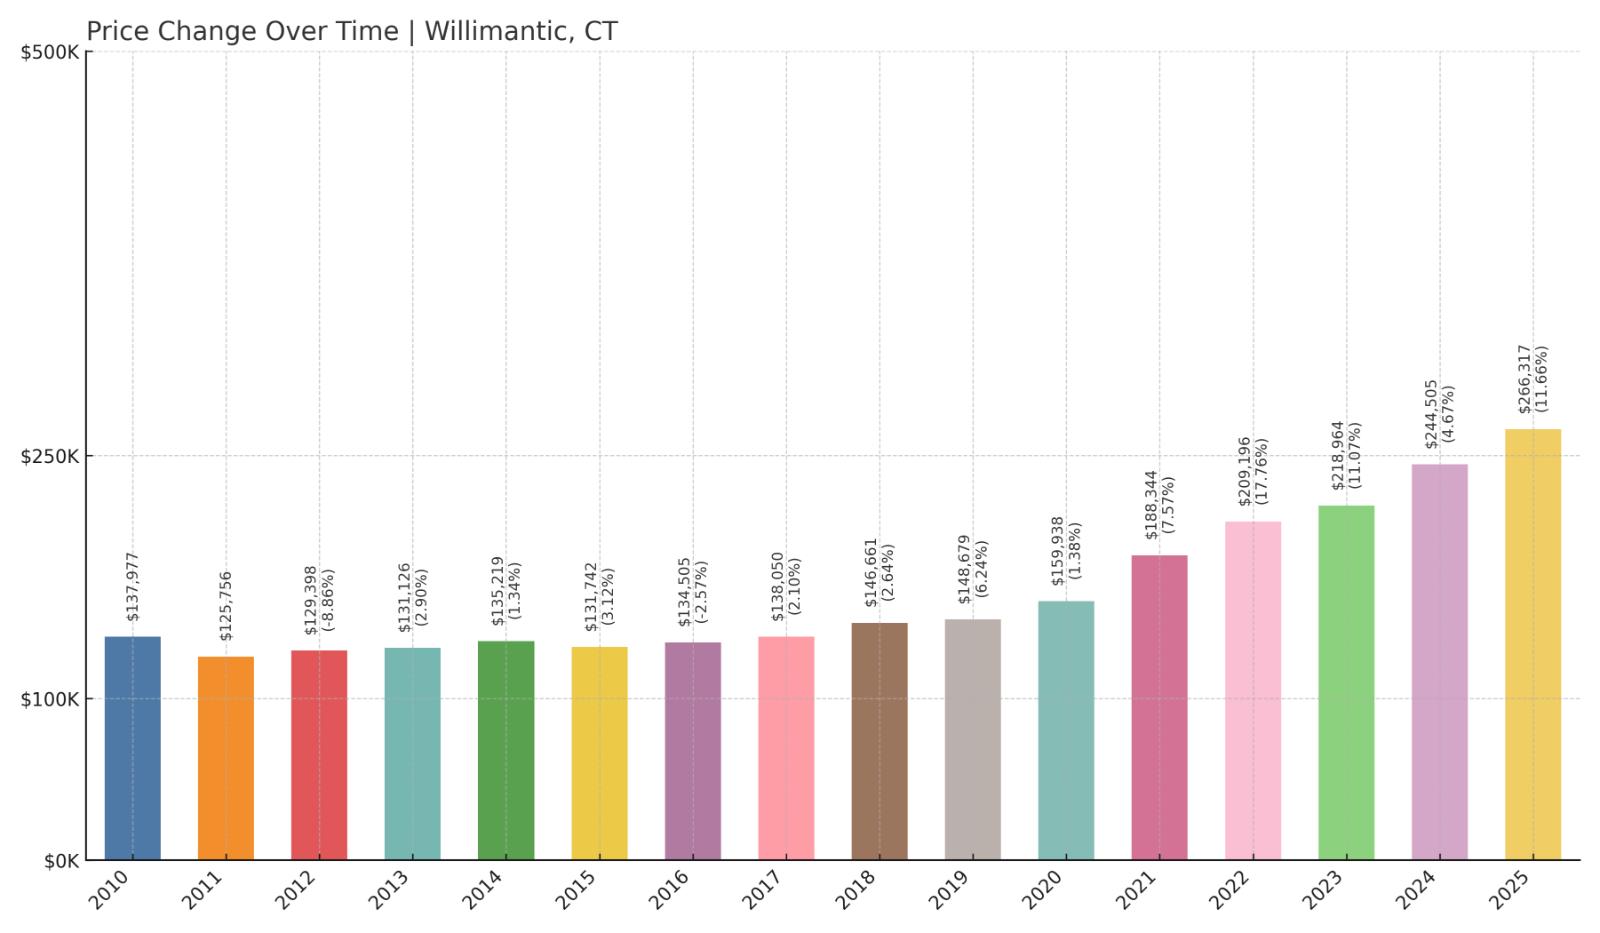
- 2010: $137,977
- 2011: $125,756 (-$12,221, -8.86% from previous year)
- 2012: $129,398 (+$3,642, +2.90% from previous year)
- 2013: $131,126 (+$1,728, +1.34% from previous year)
- 2014: $135,219 (+$4,093, +3.12% from previous year)
- 2015: $131,742 (-$3,477, -2.57% from previous year)
- 2016: $134,505 (+$2,763, +2.10% from previous year)
- 2017: $138,050 (+$3,545, +2.64% from previous year)
- 2018: $146,661 (+$8,610, +6.24% from previous year)
- 2019: $148,679 (+$2,018, +1.38% from previous year)
- 2020: $159,938 (+$11,259, +7.57% from previous year)
- 2021: $188,344 (+$28,406, +17.76% from previous year)
- 2022: $209,196 (+$20,852, +11.07% from previous year)
- 2023: $218,964 (+$9,768, +4.67% from previous year)
- 2024: $244,505 (+$25,541, +11.66% from previous year)
- 2025: $266,317 (+$21,812, +8.92% from previous year)
Willimantic home prices have risen 93% since 2010, driven by strong post-pandemic demand. Annual gains in 2021, 2022, and 2024 helped push prices near $270,000 by 2025—still a bargain for a city with amenities and a university presence.
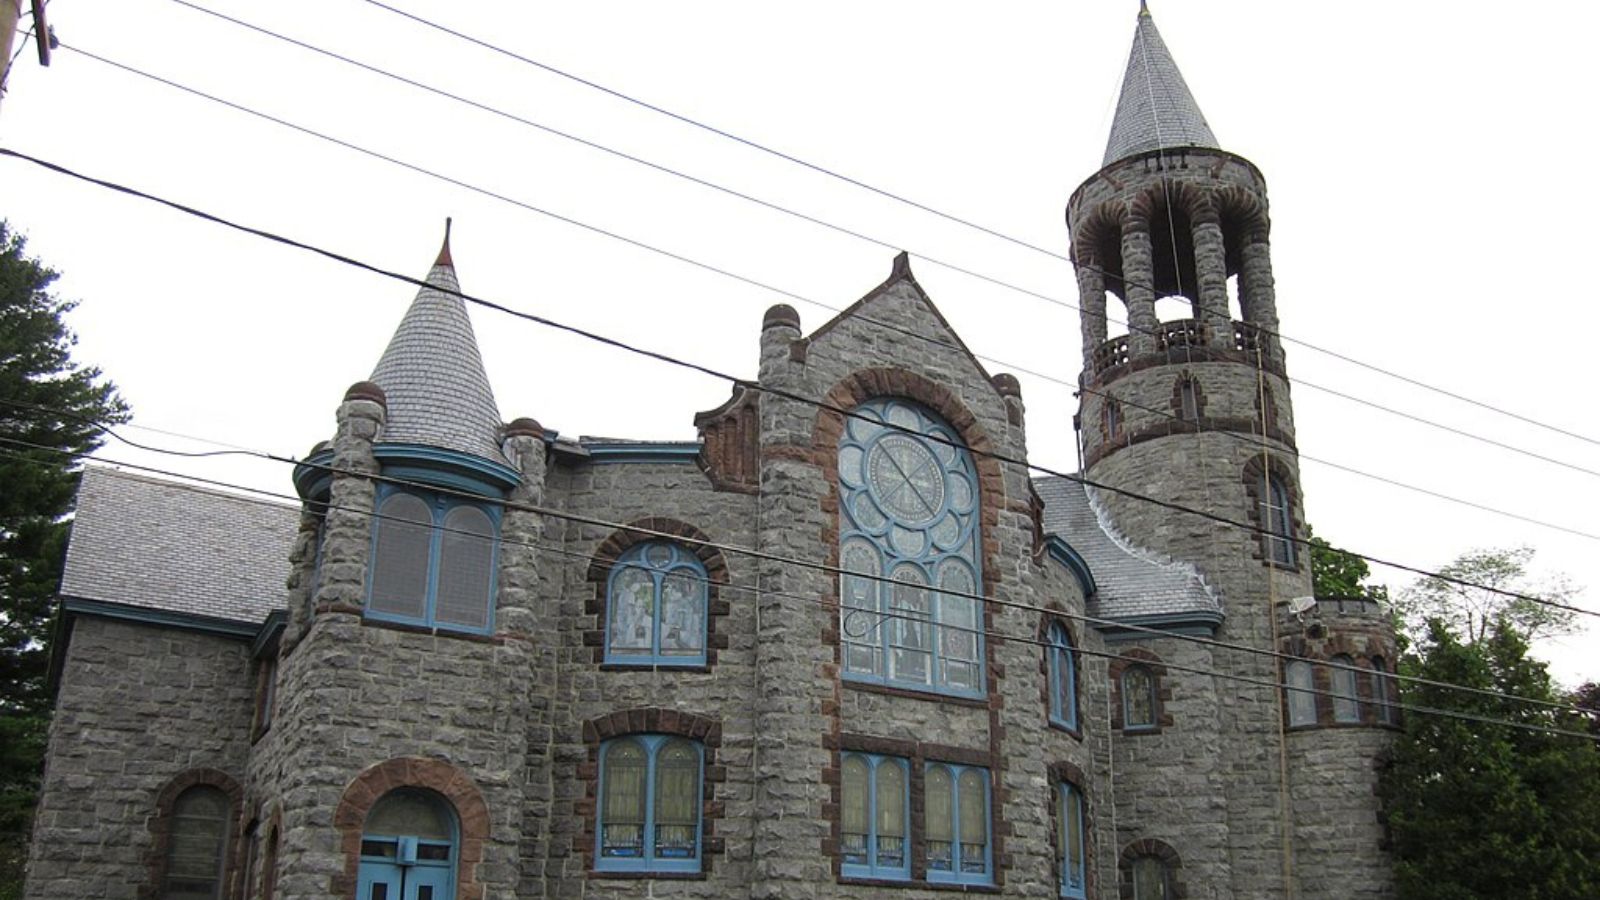
Willimantic – Mill Town Reinventing Itself

Willimantic is the largest section of Windham and a former textile center. Its compact downtown, access to ECSU, and growing arts and restaurant scene are all helping attract new buyers. Despite rising prices, it remains a very affordable college town by regional standards.
The mix of historic housing, rental conversions, and modest single-family homes keeps values low, even with high recent growth. For buyers seeking walkability and community on a budget, Willimantic continues to stand out.
1. Hartford – 73% Home Price Increase Since 2010
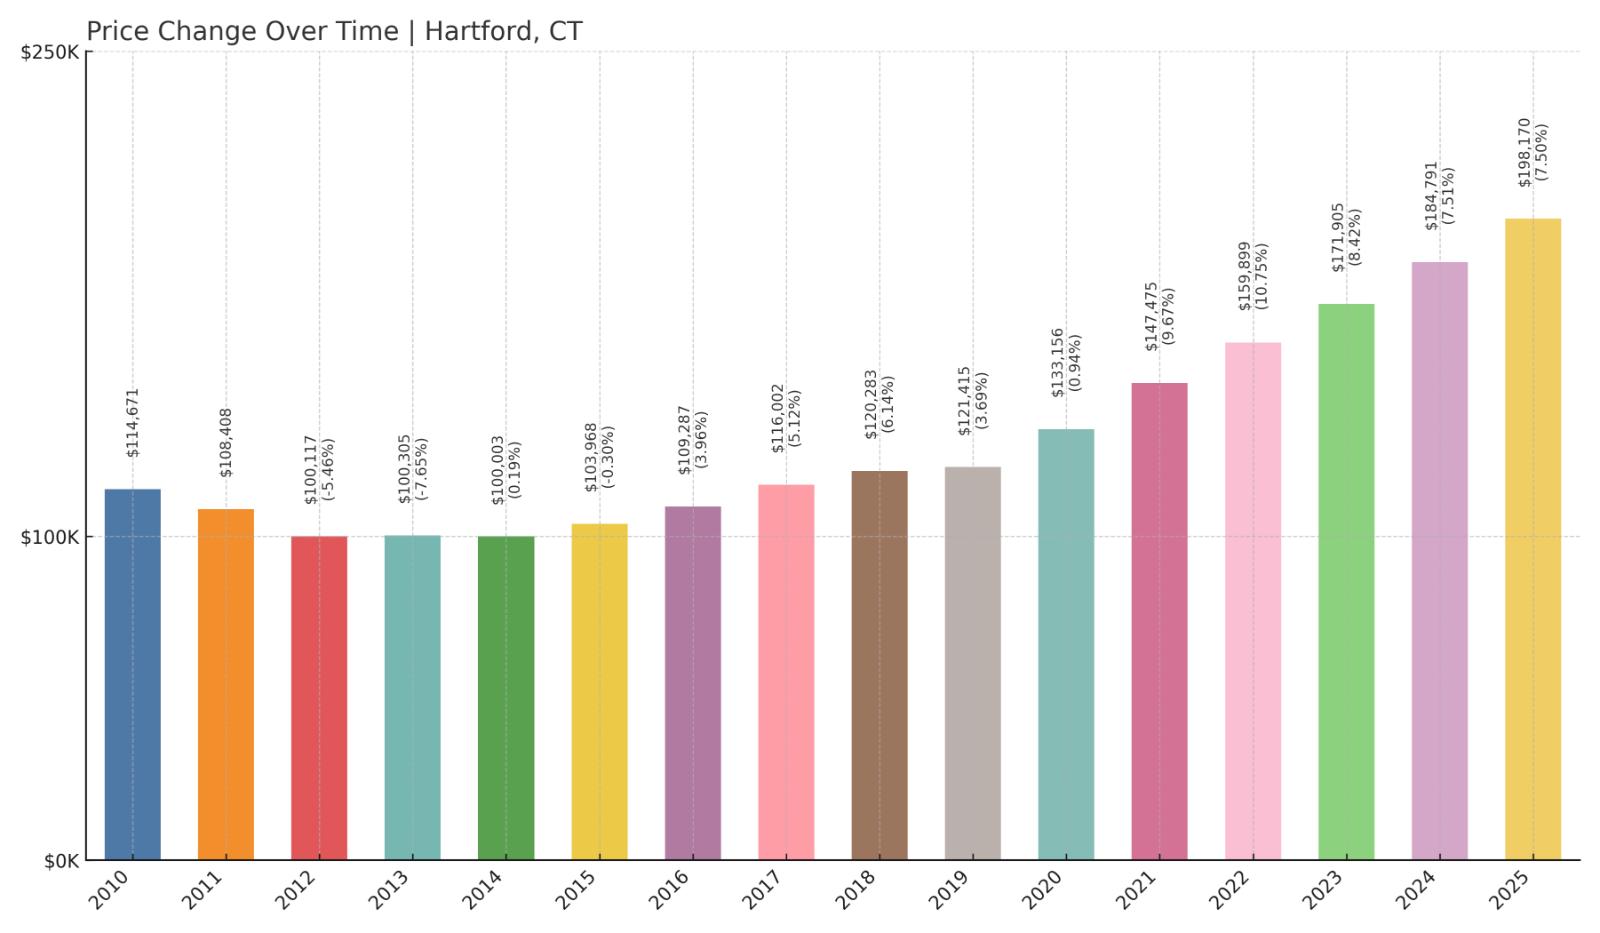
- 2010: $114,671
- 2011: $108,408 (-$6,263, -5.46% from previous year)
- 2012: $100,117 (-$8,291, -7.65% from previous year)
- 2013: $100,305 (+$187, +0.19% from previous year)
- 2014: $100,003 (-$302, -0.30% from previous year)
- 2015: $103,968 (+$3,965, +3.97% from previous year)
- 2016: $109,287 (+$5,319, +5.12% from previous year)
- 2017: $116,002 (+$6,715, +6.14% from previous year)
- 2018: $120,283 (+$4,281, +3.69% from previous year)
- 2019: $121,415 (+$1,132, +0.94% from previous year)
- 2020: $133,156 (+$11,742, +9.67% from previous year)
- 2021: $147,475 (+$14,319, +10.75% from previous year)
- 2022: $159,899 (+$12,424, +8.42% from previous year)
- 2023: $171,905 (+$12,006, +7.51% from previous year)
- 2024: $184,791 (+$12,886, +7.50% from previous year)
- 2025: $198,170 (+$13,379, +7.24% from previous year)
Hartford has seen a 73% increase in home values since 2010. Price growth has been steady and consistent, especially since 2016. Despite this appreciation, it remains Connecticut’s most affordable market by a wide margin.
Hartford – Connecticut’s Capital, Still a Bargain

As the state capital, Hartford offers major employers, historic neighborhoods, museums, and riverfront parks. But unlike many capitals, it still has some of the lowest home prices in the region. In 2025, the median value remains under $200,000.
That low base has made Hartford increasingly attractive to both investors and first-time buyers. With consistent gains and continued redevelopment efforts, Hartford could be poised for even more growth in the years ahead.